the Creative Commons Attribution 4.0 License.
the Creative Commons Attribution 4.0 License.
 | 19 Mar 2018
Global drought and severe drought-affected populations in 1.5 and 2 °C warmer worlds
Wenbin Liu
Fubao Sun
Wee Ho Lim
Jie Zhang
Hong Wang
Hideo Shiogama
Yuqing Zhang
The 2015 Paris Agreement proposed a more ambitious climate change mitigation target on limiting global warming to 1.5 ∘C instead of 2 ∘C above preindustrial levels. Scientific investigations on environmental risks associated with these warming targets are necessary to inform climate policymaking. Based on the Coupled Model Intercomparison Project phase 5 (CMIP5) climate models, we present the first risk-based assessment of changes in global drought and the impact of severe drought on populations from additional 1.5 and 2 ∘C warming conditions. Our results highlight the risk of drought on a global scale and in several hotspot regions such as the Amazon, northeastern Brazil, southern Africa and Central Europe at both 1.5 and 2 ∘C global warming relative to the historical period, showing increases in drought durations from 2.9 to 3.2 months. Correspondingly, more total and urban populations would be exposed to severe droughts globally (+132.5 ± 216.2 million and +194.5 ± 276.5 million total population and +350.2 ± 158.8 million and +410.7 ± 213.5 million urban populations in 1.5 and 2 ∘C warmer worlds) and regionally (e.g., East Africa, West Africa and South Asia). Less rural populations (−217.7 ± 79.2 million and −216.2 ± 82.4 million rural populations in 1.5 and 2 ∘C warmer worlds) would be exposed to severe drought globally under climate warming, population growth and especially the urbanization-induced population migration. By keeping global warming at 1.5 ∘C above the preindustrial levels instead of 2 ∘C, there is a decrease in drought risks (i.e., less drought duration, less drought intensity and severity but relatively more frequent drought) and the affected total, urban and rural populations would decrease globally and in most regions. While challenging for both East Africa and South Asia, the benefits of limiting warming to below 1.5 ∘C in terms of global drought risk and impact reduction are significant.
- Article
(7352 KB) - Full-text XML
- BibTeX
- EndNote


Drought could bring adverse consequences to water supply, food production and the environment as a whole (Wang et al., 2011; Sheffield et al., 2012). Because of these serious consequences, severe droughts in the recent past have gained wide attention. These droughts include the Millennium drought in Southeast Australia (Van Dijk et al., 2013; Kiem et al., 2016), the once-in-a-century droughts in Southwest China (Qiu, 2010; Zuo et al., 2015), the Horn of Africa drought (Masih et al., 2014; Lyon, 2014) and the most recent California drought (Aghakouchak et al., 2015; Cheng et al., 2016). In the context of climate change, drought risks involving duration and intensity are likely to increase in many historical drought-prone regions with global warming (Dai, 2012; Fu and Feng, 2014; Kelley et al., 2015; Ault et al., 2016). A better understanding of changes in global drought characteristics and their socioeconomic impacts in the 21st century should feed into long-term climate adaptation and mitigation plans.
The United Nations Framework Convention on Climate Change (UNFCCC) agreed to establish a long-term temperature goal for climate projection in the 2015 Paris Agreement to “pursue efforts to limit the temperature increase to 1.5 ∘C above preindustrial levels, recognizing that this would significantly reduce the risks and impacts of climate change” (UNFCCC Conference of the Parties, 2015) and invited the Intergovernmental Panel on Climate Change (IPCC) to announce a special report on the impacts of global warming with 1.5 ∘C above preindustrial levels and related greenhouse gas emission pathways for 2018 (Mitchell et al., 2016). Regardless of the socioeconomic and political achievability of these goals (Sanderson et al., 2017), there is a lack of scientific knowledge about the relative risks (e.g., drought risks and their potential impacts) associated with the implications of 1.5 and 2 ∘C warming. This has naturally attracted contributions from the scientific community (Hulme, 2016; Schleussner et al., 2016; Peters, 2016; King et al., 2017).
To target the impact assessments of 1.5 and 2 ∘C warming, there are currently several approaches (James et al., 2017). One way is to enable impact assessments at a near-equilibrium warmer world climate of 1.5 or 2 ∘C designed specifically using a set of ensemble simulations produced by a coupled climate model (e.g., Community Earth System Model, CESM) (Sanderson et al., 2017; Wang et al., 2017). Although similar results of drought response to warming were obtained as those found using CMIP5-style experiments (Taylor et al., 2012), the structural uncertainty and robustness of change in droughts among different climate models cannot be fully evaluated in this kind of single model study (Lehner et al., 2017). A second approach extends the former idea to multiple climate models. For instance, the HAPPI (half a degree additional warming, projections, prognosis and impacts) model intercomparison project provided a new assessment framework and a dataset with experiments designed to explicitly target 1.5 and 2 ∘C above the preindustrial levels (Mitchell et al., 2017). However, the analysis and calculation of drought characteristics need data from a long-term period of typically > 20 consecutive years (McKee et al., 1993). The 10-year period HAPPI dataset (2005–2016 for the historical period and 2105–2116 for the 1.5 and 2 ∘C warmer worlds) is relatively short and consecutive samples are too short for calculating a drought index, such as the Palmer Drought Severity Index (PDSI) (Palmer, 1965) for an index-based drought assessment. A third approach utilizes the outputs of CMIP5 climate models under the Representative Concentration Pathway 2.6 (RCP2.6) scenarios for these kinds of “risk assessment-style” studies, but only a handful of general circulation model (GCM) simulations end up showing 1.5 ∘C global warming by the end of the 21st century. Alternatively, transient simulations from multiple CMIP5 GCMs at higher greenhouse emissions (e.g, RCP4.5 and RCP8.5) (Schleussner et al., 2016; King et al., 2017) could be analyzed in order to evaluate the potential risks of drought under different warming targets, although the long-duration drought years might be underestimated due to insufficient sampling of extended drought events (Lehner et al., 2017).
Here, we quantify the changes in global and sub-continental drought characteristics (e.g., drought duration, intensity and severity) at 1.5 and 2 ∘C above the preindustrial levels and find out whether there are significant differences between them. We perform this analysis using a drought index (PDSI) forced by the latest CMIP5 GCMs. To evaluate the societal impacts, we incorporate the Shared Socioeconomic Pathway scenario 1 (SSP1) spatial explicit global population scenario and examine the exposure of population (including rural, urban and total populations) to severe droughts. This paper is organized as follows: Sect. 2 introduces the CMIP5 GCM output and SSP1 population data applied to this study. We define the baseline and the 1.5 and 2 ∘C warmer worlds and describe the calculation of PDSI-based drought characteristics and population exposure under severe droughts in this section. Section 3 shows the results (e.g., hotspots and risks) of changes in drought characteristics and the impacts of severe drought on people under these warming targets. We perform detailed discussions in Sect. 4 and conclude our findings in Sect. 5.
2.1 Data
In this study, we use the CMIP5 GCM output including the monthly outputs of surface mean air temperature, surface minimum air temperature, surface maximum air temperature, air pressure, precipitation, relative humidity, surface downwelling longwave flux, surface downwelling shortwave flux, surface upwelling longwave flux, surface upwelling shortwave flux and the daily outputs of the surface zonal velocity component (uwnd) and the meridional velocity component (vwnd), which is archived at the Earth System Grid Federation (ESGF) node at the German Climate Computing Center (DKRZ) (https://esgf-data.dkrz.de/projects/esgf-dkrz/) covering the period 1850–2100. In the CMIP5 archive, the monthly uwnd and vwnd were computed as the means of their daily values with the plus-minus sign and the calculated wind speed from the monthly uwnd and vwnd would be equal to or, in most cases, less than that computed from the daily values (Liu and Sun, 2016, 2017). To get the monthly wind speed, we average the daily values () over a month.
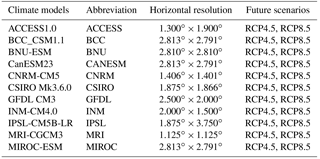
Recent studies have confirmed that the impacts of similar global mean surface temperatures (1.5 and 2 ∘C warmer worlds) among the RCPs are quite similar, implying that the global and regional responses to temperature are independent of the RCPs (Hu et al., 2017; King et al., 2017). Following this idea, we settled on using 11 CMIP5 models (Table 1) which satisfied the data requirement of the PDSI calculation (see section above) under RCP4.5 and RCP8.5. Following Wang et al. (2017) and King et al. (2017), we use the ensemble mean of these CMIP5 models and climate scenarios (RCP4.5 and RCP8.5) to composite the warming scenarios (1.5 and 2 ∘C warmer worlds).
Table 2Definition of regions in this study, after IPCC (2012).
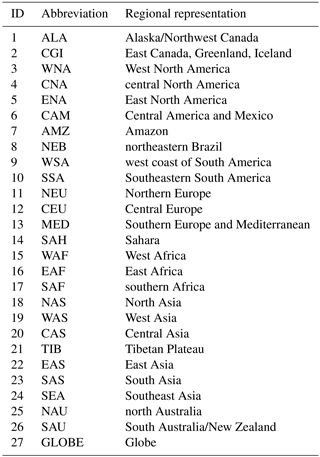
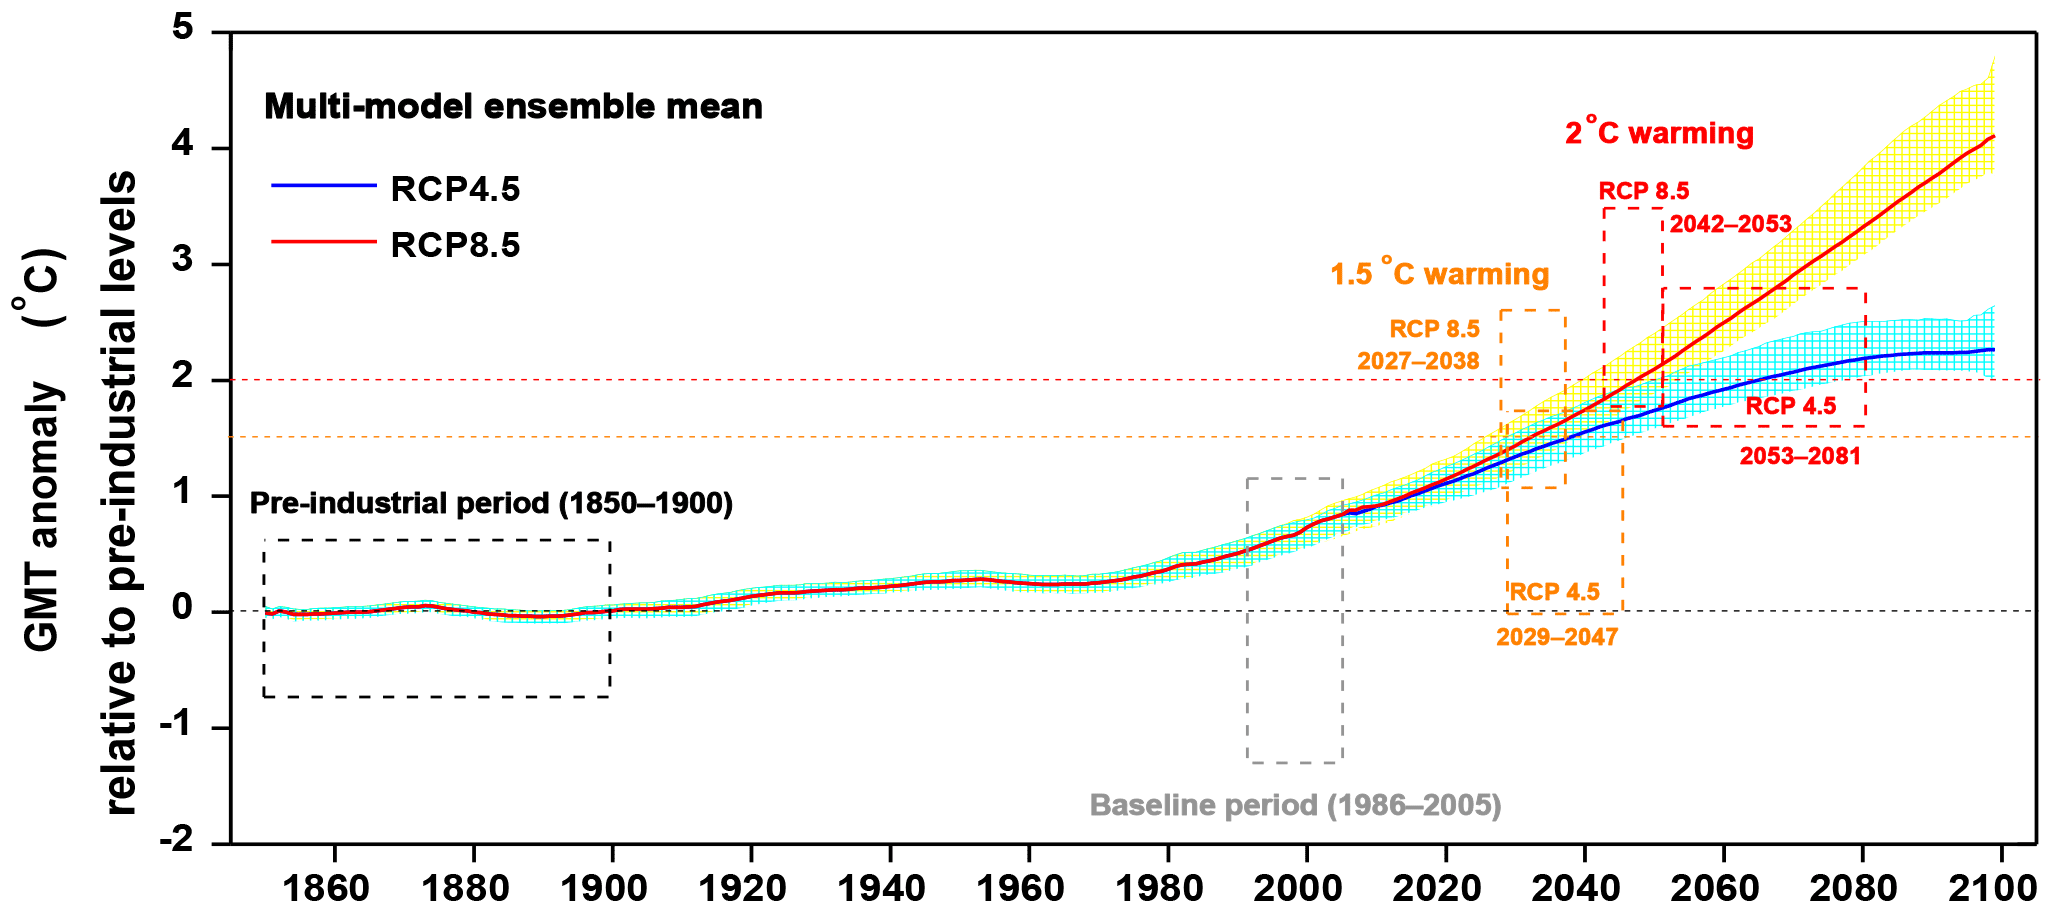
Figure 1Definition of the baseline period and the 1.5 and 2 ∘C warmer worlds based on CMIP5 GCM-simulated changes in global mean temperature (GMT) relative to the preindustrial levels from 1850 to 1900. The dark blue and dark yellow shadows indicate the 25th and 75th percentiles of multi-model simulated GMT for RCP4.5 and RCP8.5 scenarios, respectively. Both the multi-model ensemble mean and percentiles shown in the figure are smoothed using a moving average approach in a 20-year window.
To consider the people affected by severe drought events, we use the spatial explicit global population scenarios developed by researchers from the Integrated Assessment Modeling (IAM) group of National Center for Atmospheric Research (NCAR) and the City University of New York Institute for Demographic Research (Jones and O'Neil, 2016). They include the gridded population data for the baseline year (2000) and for the period 2010–2100 in 10-year steps at a spatial resolution of 0.125∘, which is consistent with the new (SSPs). We apply the population data of the SSP1 scenario, which describes a future pathway with sustainable development and low challenges for adaptation and mitigation. We upscale this product to a spatial resolution of 0.5∘ × 0.5∘. For the global and sub-continental scales analysis, we use the global land mass between 66∘ N and 66∘ S (Fischer et al., 2013; Schleussner et al., 2016) and 26 sub-continental regions (as used in IPCC, 2012, see Table 2 for details).
2.2 Definition of a baseline and the 1.5 and 2 ∘C warmer worlds
To define a baseline and the 1.5 and 2 ∘C warmer worlds, we first calculate the global mean surface air temperature for each climate model and emission scenario over the period 1850–2100. We weigh the surface air temperature field by the square root of cosine (latitude) to consider the dependence of grid density on latitude (Liu et al., 2016). We compute and smooth the multi-model ensemble mean (MEM) GMT using a 20-year moving average filter for the RCP4.5 and RCP8.5, respectively. This study applied continuous time series for identification of drought duration, intensity and severity. From the climate model projections, we noticed that interannual variation of global mean air temperatures is common and its magnitude differs with different climate models. To account for it, we first select a baseline period of 1986–2005 (Wang et al. 2017) for which the observed GMT was approximately 0.6 ∘C warmer (the MEM GMT was 0.4–0.8 ∘C warmer during this period in 11 climate models used) than the preindustrial levels (1850–1900, IPCC, 2013). This is also a common reference period for climate impact assessment (e.g., Schleussner et al., 2016). Next, for each emissions scenario (RCP4.5 or RCP8.5), we define the periods (Fig. 1) during which the 20-year smoothed GMT increases of 1.3–1.7 ∘C (2027–2038 under the RCP4.5 and 2029–2047 under the RCP 8.5) and 1.8–2.2 ∘C (2053–2081 under the RCP4.5 and 2042–2053 under the RCP 8.5) above the preindustrial period as the 1.5 and 2 ∘C warmer worlds, respectively (King et al., 2017). To reduce the projection uncertainty inherited from different emissions scenarios, we combine (by averaging) the results of drought characteristics and population exposures calculated for selected periods under RCP4.5 and RCP8.5, to represent the ensemble means of drought risk in the 1.5 or 2 ∘C warmer worlds. In the 1.5 and 2 ∘C warmer worlds, we get 372 and 492 monthly data points, respectively.
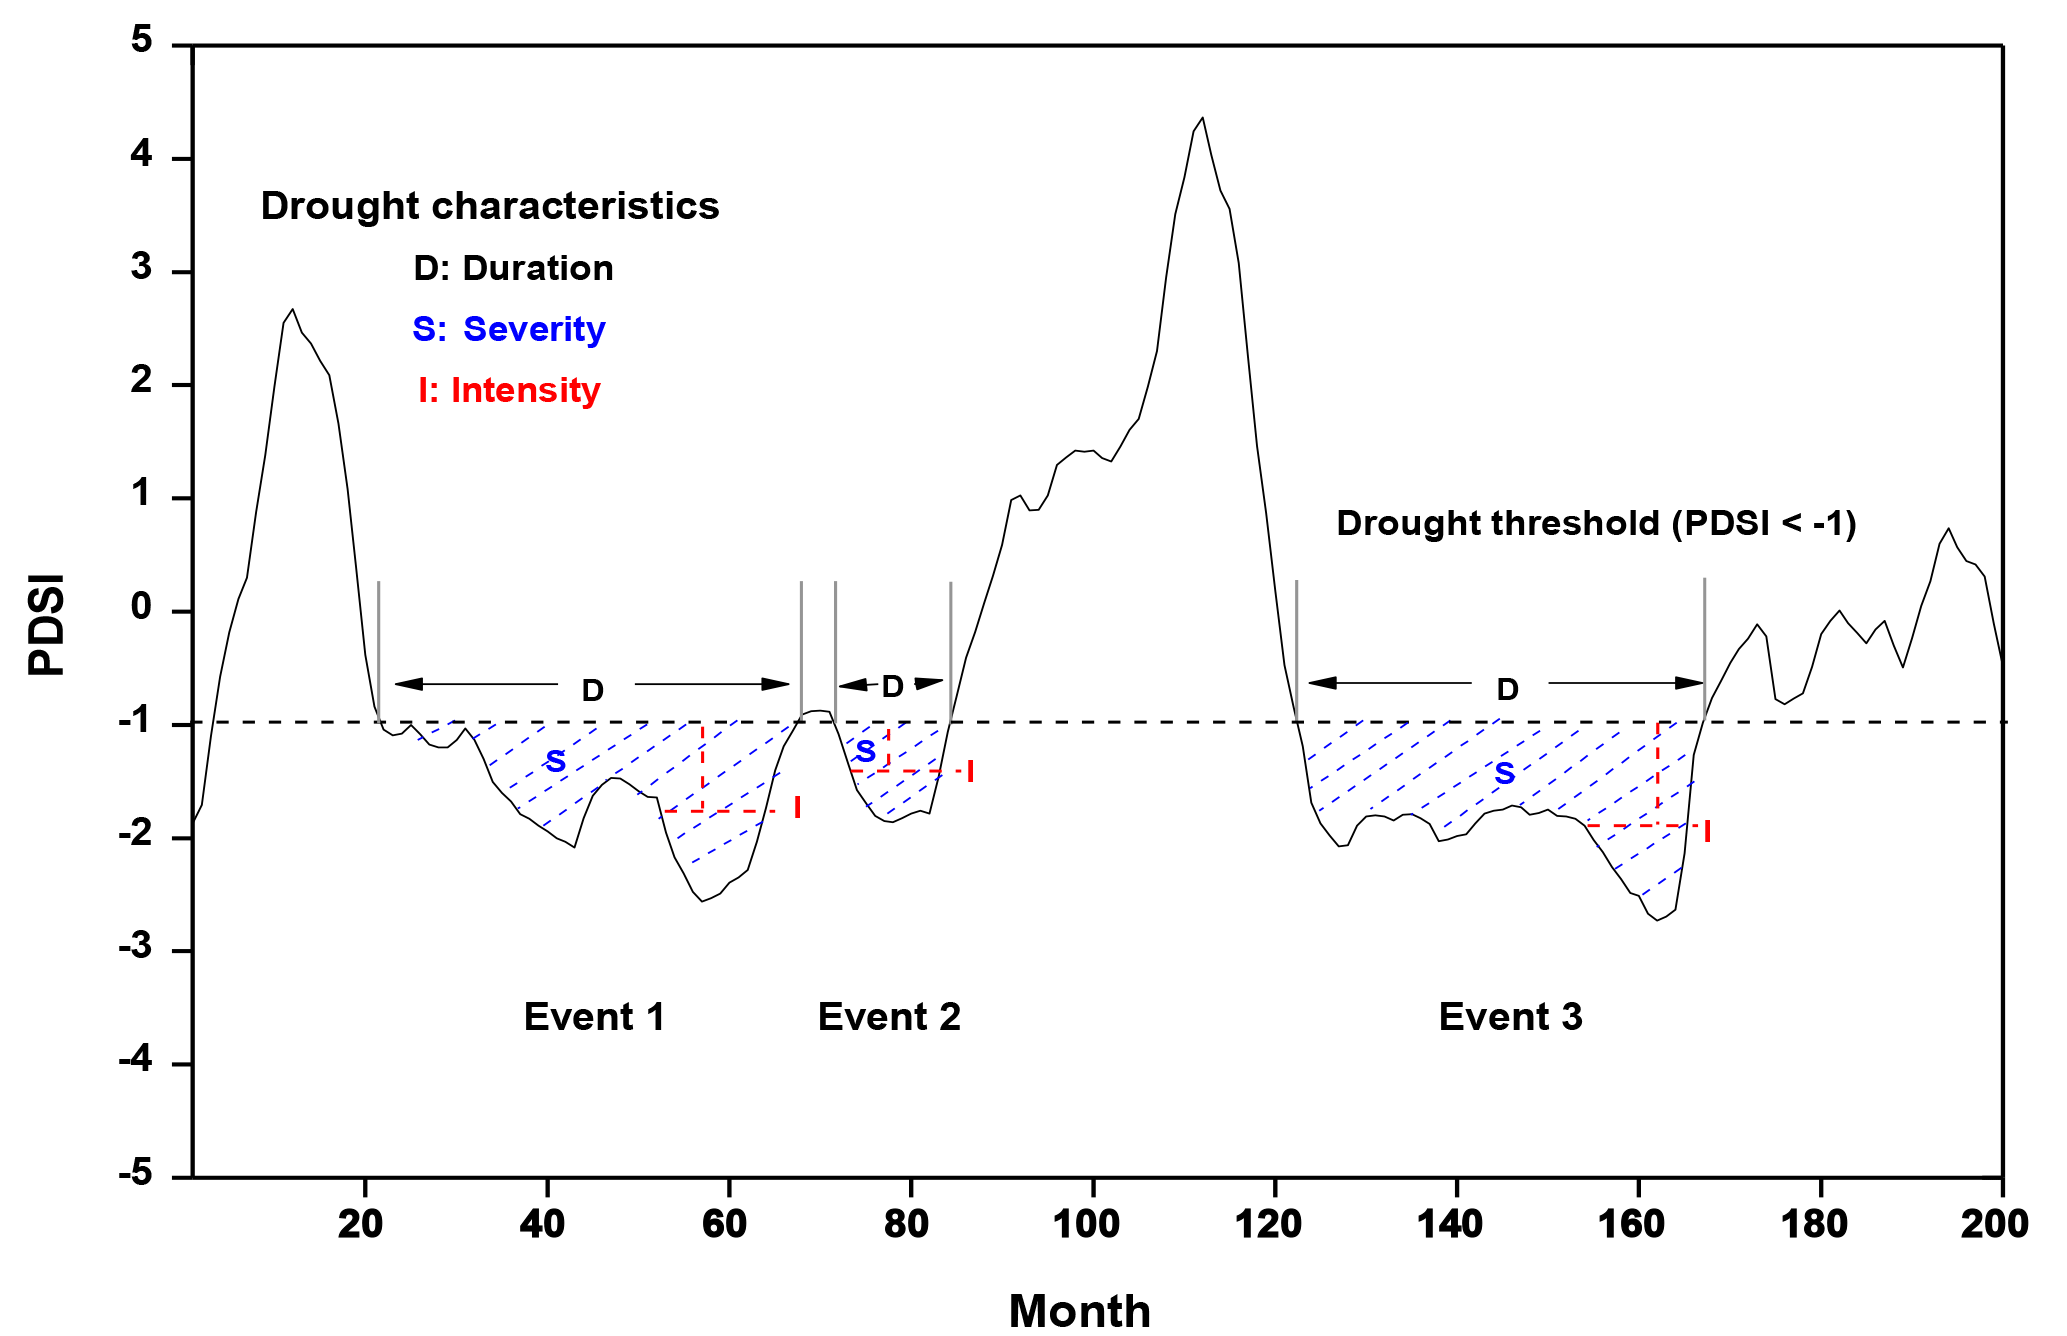
Figure 2The Palmer Drought Severity Index (PDSI)-based drought characteristics definition through the run theory.
2.3 Characterize global drought using the PDSI
To quantify the changes in drought characteristics, we adopt the PDSI, which describes the balance between water supply (precipitation) and atmospheric evaporative demand required “precipitation” estimated under CAFEC (climatically appropriate for existing conditions), at the monthly scale (Wells et al., 2004; Zhang et al., 2016). For a multiyear time series, this index is commonly applied as an indication of a meteorological drought and, to a lesser extent, a hydrological drought (Heim Jr., 2002; Zargar et al., 2011; Hao et al., 2018). It incorporates antecedent precipitation, potential evaporation and the local available water content (AWC, links: https://daac.ornl.gov/cgi-bin/dsviewer.pl?ds_id=548) of the soil in the hydrological accounting system. It measures the cumulative departure relative to the local mean conditions in atmospheric moisture supply and demand on land surface. In the PDSI model, five surface water fluxes, namely, precipitation (P), recharge to soil (R), actual evapotranspiration (E), runoff (RO) and water loss to the soil layers (L) and their potential values , PR, PE, PRO and PL are considered. All values in the model can be computed under CAFEC values using the precipitation, potential evaporation and AWC inputs. For example, the CAFEC precipitation () is defined as (Dai, 2011)
In Eq. (1), the overbar indicates averaging of a parameter over the calibration period. The moisture anomaly index (Z index) is derived as the product of the monthly moisture departure (P − ) and the climate characteristics coefficient K. The Z index is then applied to calculate the PDSI value for time t(Xt) as
where Xt−1 is the PDSI of the previous month and p and q are duration factors. The calculated PDSI ranges −10 (dry) to 10 (wet). The parameters (e.g., the duration factor) in the PDSI model are calibrated using the period 1850–2000 (see Sect. 2.2).
As part of the PDSI calculation, we quantify the potential evaporation (PET) using the Food and Agricultural Organization (FAO) Penman–Monteith equation (Allen et al., 1998), as
where Δ is the slope of the vapor pressure curve, U2 is the wind speed at 2 m height, G is the soil heat flux, RH is the relative humidity, γ is the psychometric constant, es is the saturation vapor pressure at a given air temperature (T) and Rn is the net radiation which can be calculated using the surface downwelling and upwelling shortwave and longwave radiations. We estimate all other parameters in the FAO Penman–Monteith equation using the GCM outputs through the standard algorithm as recommended by the FAO (Allen et al., 1998). In this study, we perform this calculation for each GCM over the period 1850–2100 using the tool for calculating the PDSI with the original MATLAB codes modified for this case, developed by Jacobi et al. (2013).
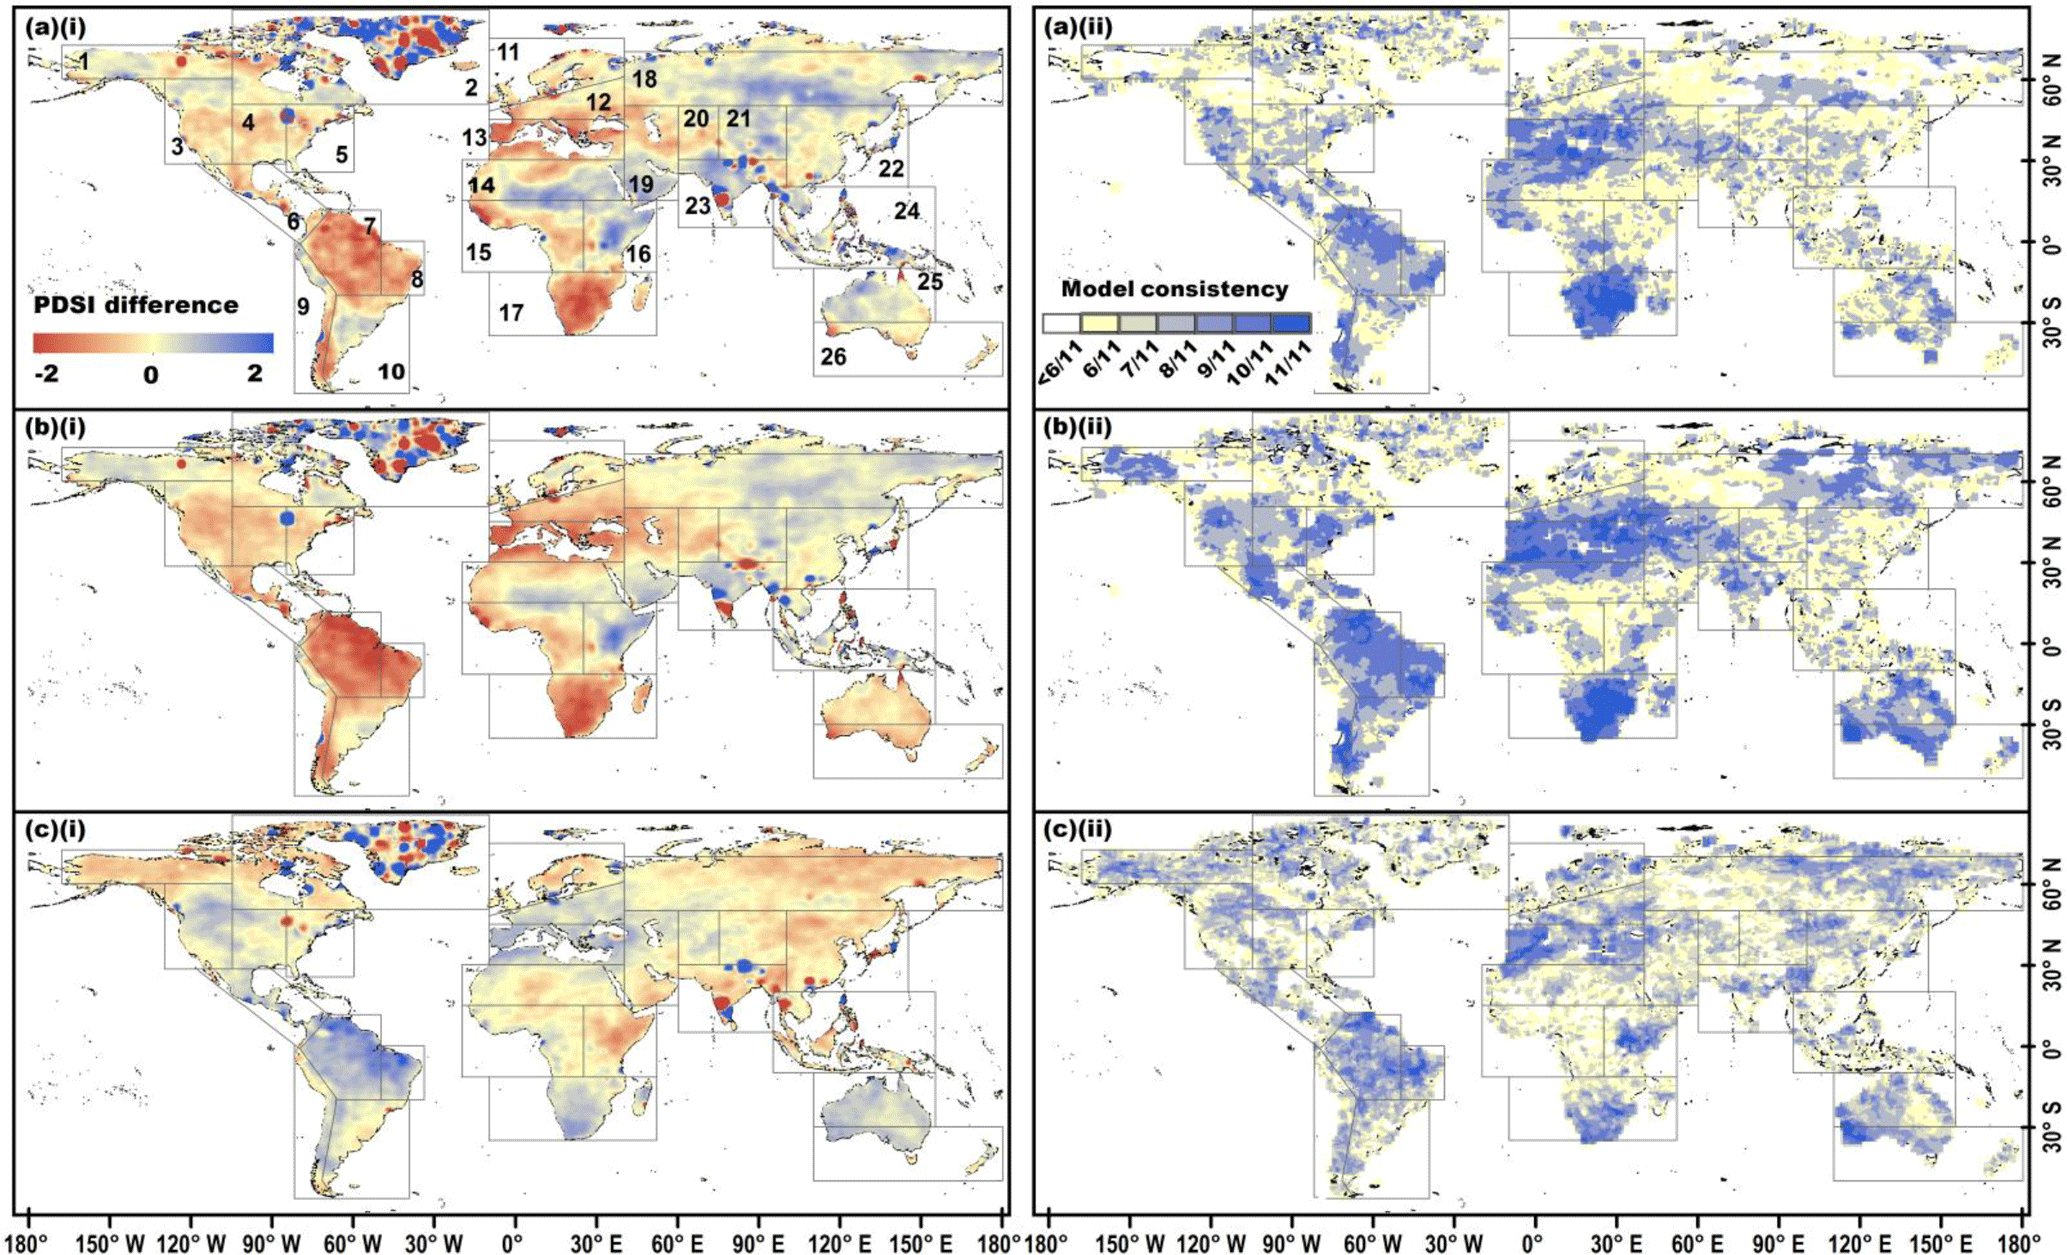
Figure 3Changes in multi-model ensemble mean PDSI (i) and model consistency (ii) on a spatial resolution of 0.5∘ × 0.5∘. Panel (a) is from the baseline period to the 1.5 ∘C warmer world, panel (b) is from the baseline period to the 2 ∘C warmer world and panel (c) is (a)–(b). Robustness of projections increases with a higher model consistency and vice versa. The gray boxes show the world regions adopted by IPCC (2012), which are labeled in (a)(i) using the ID numbers defined in Table 2. The legend in (a)(i) applies to (b)(i) and (c)(i) and the legend in (a)(ii) applies to (b)(ii) and (c)(ii).
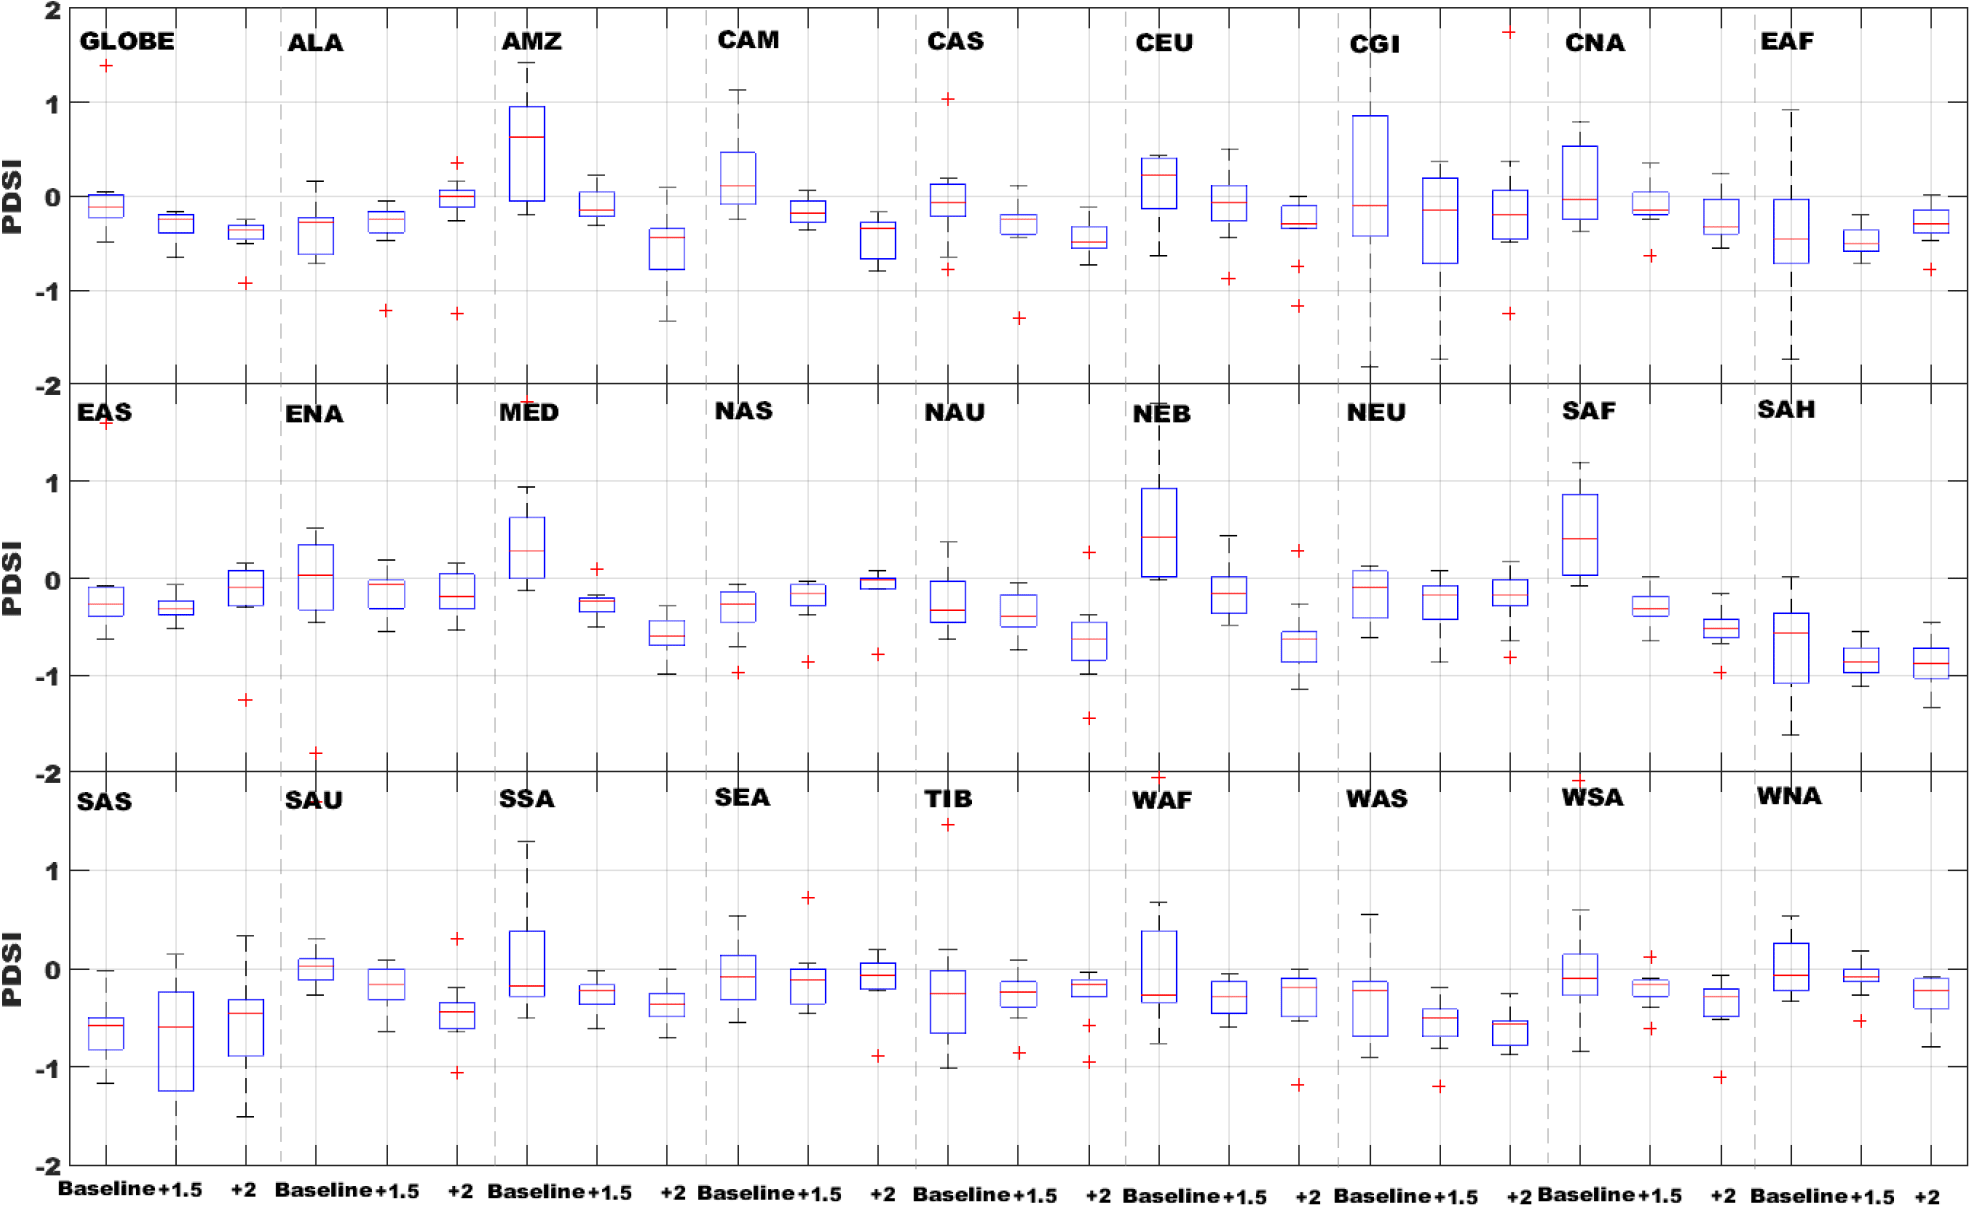
Figure 4A multi-model projected PDSI globally (66∘ N–66∘ S) and in 27 world regions for the baseline period and the 1.5 and 2 ∘C warmer worlds. The projected uncertainty of multiple climate models is shown through box plots for each region and for each period.

Figure 5Changes in multi-model ensemble mean drought duration in months (i) and model consistency (ii), on a spatial resolution of 0.5∘ × 0.5∘. Panel (a) is from the baseline period to the 1.5 ∘C warmer world, panel (b) is from the baseline period to the 2 ∘C warmer world and panel (c) is (a)–(b). The gray boxes show the regions adopted by IPCC (2012), which are labeled in (a)(i) using the ID numbers defined in Table 2. The legend in (a)(i) applies to (b)(i) and (c)(i) and the legend in (a)(ii) applies to (b)(ii) and (c)(ii).

Figure 6Multi-model projected drought duration (in months) globally (66∘ N–66∘ S) and in 27 world regions from the baseline period to the 1.5 and 2 ∘C warmer worlds. The projected uncertainty of multiple climate models is shown through box plots for each region and for each period.
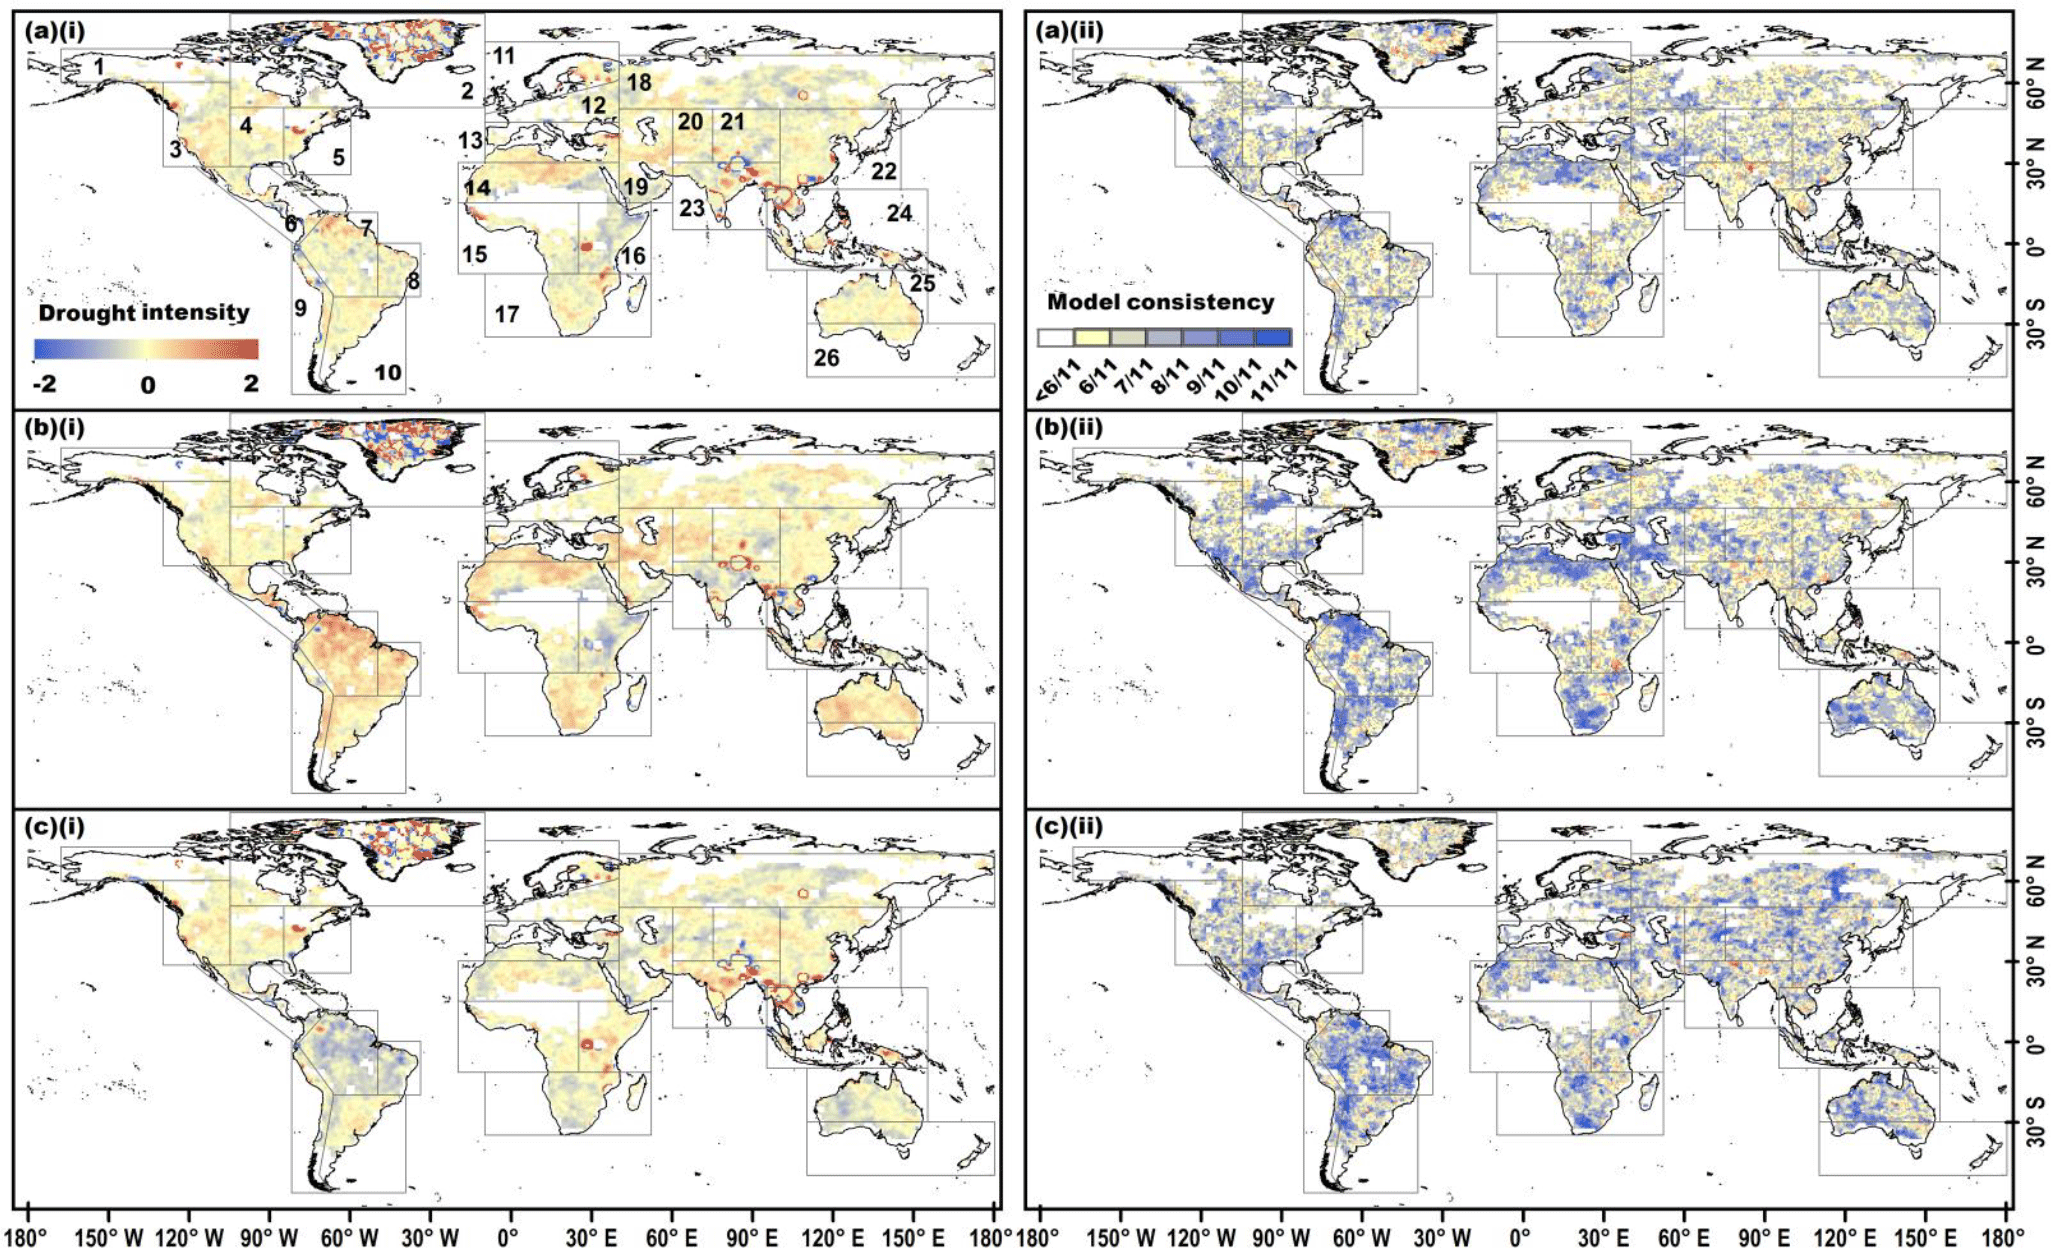
Figure 7Changes in multi-model ensemble mean drought intensity (dimensionless) (i) and model consistency (ii) on a spatial resolution of 0.5∘ × 0.5∘. Panel (a) is from the baseline period to the 1.5 ∘C warmer world, panel (b) is from the baseline period to the 2 ∘C warmer world and panel (c) is (a)–(b). The gray boxes show the regions adopted by IPCC (2012), which are labeled in (a)(i) using the ID numbers defined in Table 2. The legend in (a)(i) applies to (b)(i) and (c)(i) and the legend in (a)(ii) applies to (b)(ii) and (c)(ii).
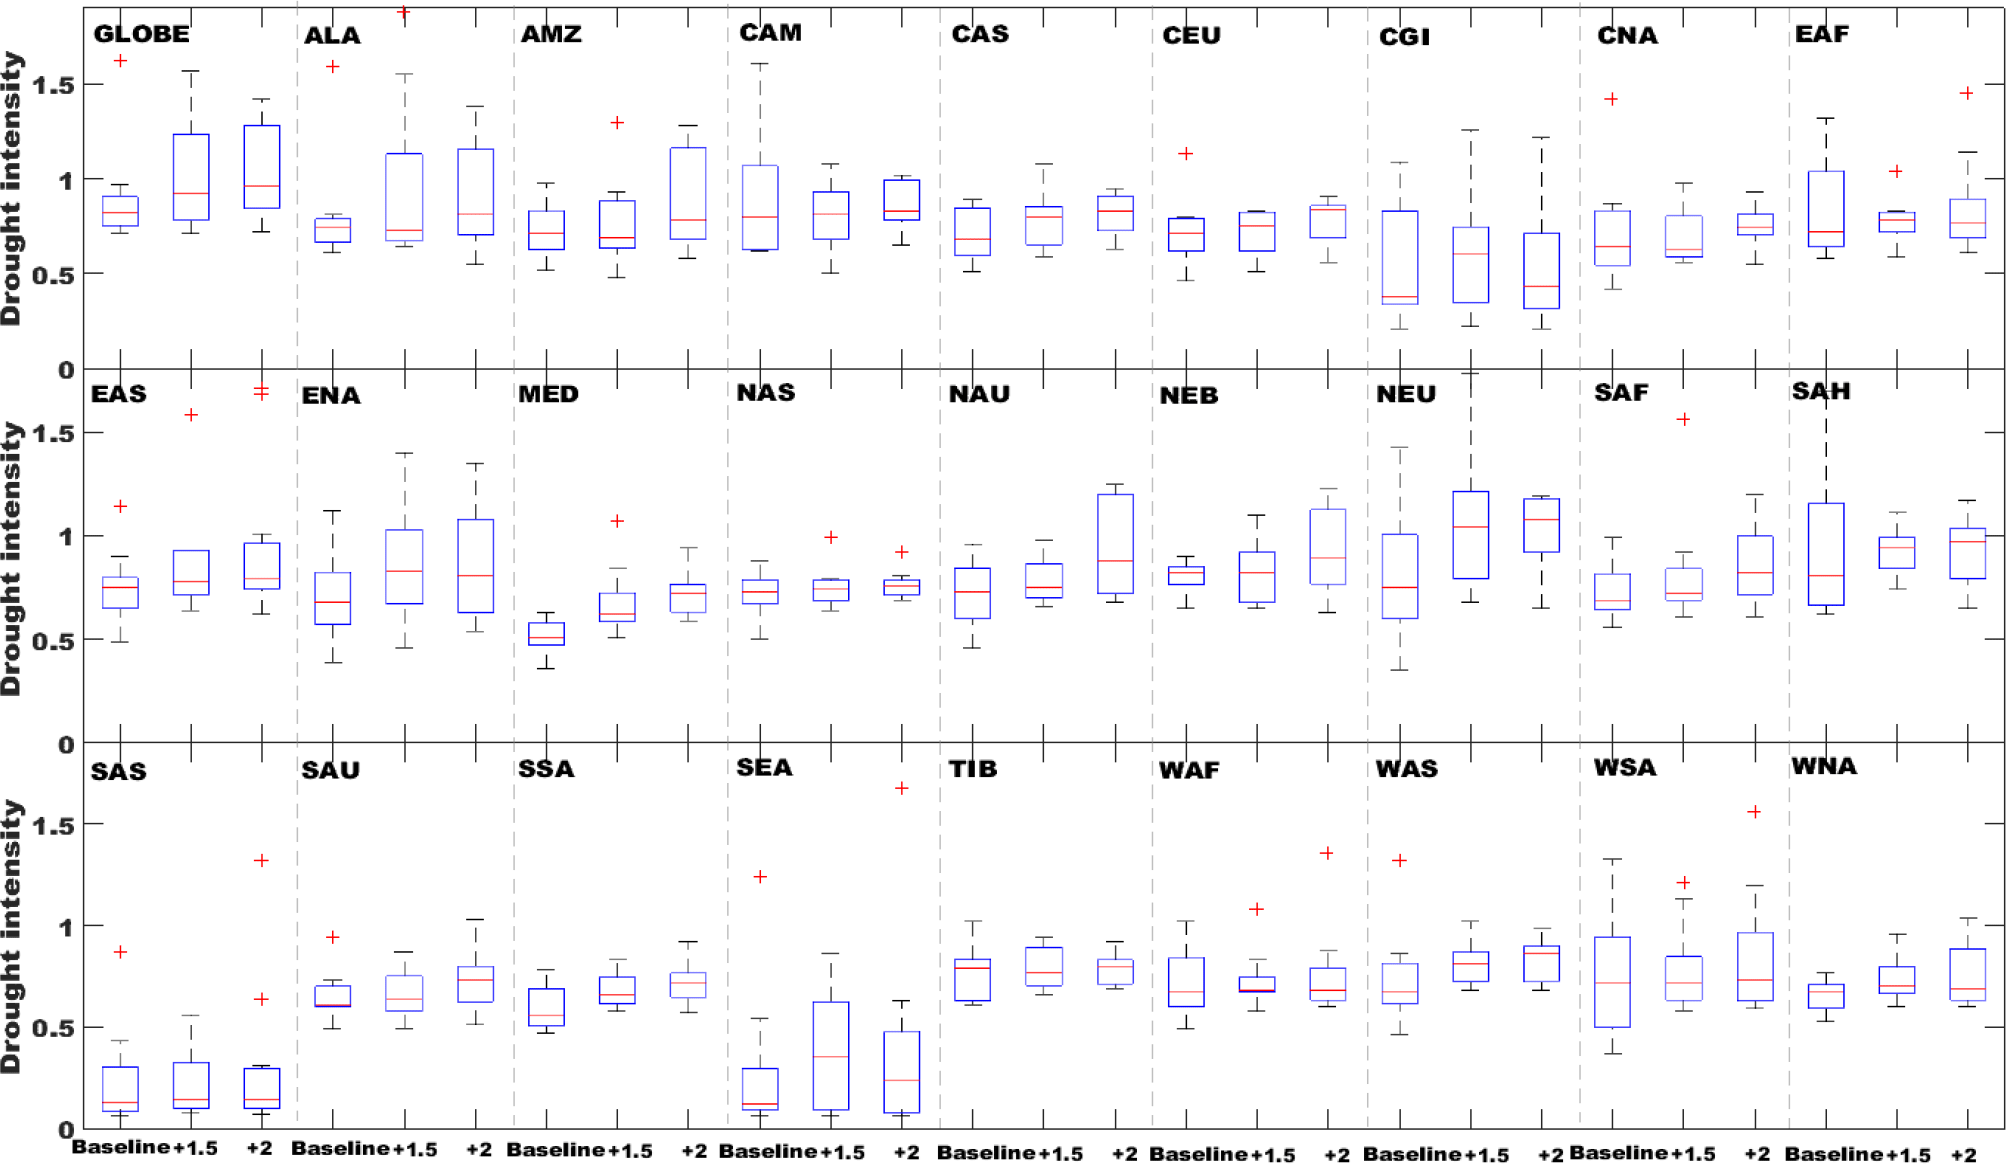
Figure 8Multi-model projected drought intensity (dimensionless) globally (66∘ N–66∘ S) and in 27 world regions for the baseline period and the 1.5 and 2 ∘C warmer worlds. The projected uncertainty of multiple climate models is shown through box plots for each region and for each period.
Based on the calculated global PDSI, we derive the drought characteristics (e.g., drought duration, intensity and severity) using the run theory for the baseline and the 1.5 and 2 ∘C warmer worlds, respectively. Briefly, the concept of the run theory is proposed by Yevjevich and Ingenieur (1967). The run characterizes the statistical properties of sequences in both time and space. It is useful for defining drought in an objective manner. In the run theory, a run represents a portion of time series Xi, where all values are either below or above a specified threshold (we set the threshold PDSI to < −1 in this study) (Ayantobo et al., 2017). We define a run with values that continuously stay below that threshold (e.g., a negative run) as a drought event, which generally includes the following characteristics: drought duration, intensity and severity (see Fig. 2 for a better illustration). We define the drought duration (months in this study) as a period (years, months or weeks) when the PDSI stays below a specific threshold (PDSI < −1). Drought severity (dimensionless) indicates a cumulative deficiency of a drought event below the threshold (PDSI < −1), while drought intensity (dimensionless) is the average value of a drought event below this threshold (Mishra and Singh, 2010). For each GCM, we calculate the medians of drought duration, intensity and severity at each grid cell across all drought events for each selected period (e.g, the baseline and the 1.5 and 2 ∘C warmer worlds). It should be noted that the global PDSI and related drought characteristics were first calculated using GCM outputs with their original spatial resolution. The obtained results were then rescaled to a common spatial resolution of 0.5∘ × 0.5∘ using the bilinear interpolation, in order to show them with a finer resolution uniformly and accommodate their spatial resolution to that of a SSP1 population (0.5∘ × 0.5∘). The original resolution of a SSP1 population is 0.125∘. We thus use a 0.5∘ resolution to avoid effectively making up data of the finer resolution in SSP1 data. We synthesize the results by evaluating the ensemble mean and model consistency/inter-model variance across all climate models.
2.4 Calculation of population exposure under severe droughts
Following Wells et al. (2004), when the monthly PDSI is < −3, we assume a severe drought event took place. If a severe drought occurred for at least a month in a year, we would take that year as a severe drought year. For each GCM per period (e.g., baseline and the 1.5 and 2 ∘C warmer worlds), we quantify the populations (including urban, rural and total populations) affected by severe drought per grid-cell as (population × annual frequency of severe drought). We first compute the affected population for the baseline period (1985–2005) using the SSP1 base year (2000). We repeat this estimation using the constant SSP1 population data in 2100 for the 1.5 and 2 ∘C warmer worlds, which is consistent with the original proposal of the Paris Agreement on stabilizing global warming for the specified targets by end of the 21st century. We used SSP1 scenario because it describes the storyline of a green growth paradigm with sustainable development and low challenges for adaptation and mitigation (Jones and O'Niell, 2016). The 1.5 and 2 ∘C warmer worlds clearly fit in this description and are thus considered under the 2015 Paris Agreement (UNFCCC Conference of the Parties, 2015; O'Niell et al., 2016). In this pathway, the world population would peak at around 2050s and then decline (Van Vuuren et al., 2017). The environmentally friendly living arrangements and human settlement design in this scenario would lead to fast urbanization in all countries. More in-migrants from rural areas would be attracted to cities due to more adequate infrastructure, employment opportunities and convenient services for their residents (Cuaresma, 2012). The world urban populations would gradually increase while rural populations would correspondingly decline in the future under the SSP1 scenario.
3.1 Changes in the PDSI and drought characteristics
We present the changes in the multi-model ensemble mean PDSI from the baseline period (1986–2005) to each of the 1.5 and 2 ∘C warmer worlds and model consistency in Fig. 3. For the 1.5 ∘C warmer world, the PDSI would decrease (more drought-prone) with relatively high model consistency (6–11 out of 11 GCMs) in some regions, for example, the Amazon (0.7 ± 0.8 → −0.1 ± 0.2), Northeastern Brazil (0.5 ± 0.6 → −0.1 ± 0.3), Southern Europe and the Mediterranean (0.4 ± 0.6 → −0.3 ± 0.2), Central America and Mexico (0.2 ± 0.4 → −0.2 ± 0.1), Central Europe (0.3 ± 1.0 → −0.1 ± 0.4) and southern Africa (0.5 ± 0.5 → −0.3 ± 0.2) and slightly increase (less drought-prone) in Alaska/Northwest Canada (−0.01 ± 0.5 → −0.3 ± 0.2) and North Asia (−0.1 ± 1.0 → −0.2 ± 0.2) but with relatively low model consistency. The geographic pattern of changes in the PDSI for the 2 ∘C warmer world is quite similar to that of 1.5 ∘C warmer world, but the magnitude of change would intensify in both directions in East Canada, Greenland, Iceland (−0.3 ± 0.2 → −0.4 ± 0.2), East Africa (−0.5 ± 0.2 → −0.3 ± 0.2), Northern Europe (−0.3 ± 0.3 → −0.2 ± 0.3), East Asia (−0.3 ± 0.1 → −0.2 ± 0.4), South Asia (−1.0 ± 1.2 → −0.8 ± 0.3) and West Africa (−0.3 ± 0.2 → −0.3 ± 0.3). When global warming is capped at 1.5 ∘C instead of 2 ∘C above the preindustrial levels, the PDSI value would elevate globally (66∘ N–66∘ S, −0.4 ± 0.2 → −0.3 ± 0.2) and in most regions (Alaska/Northwest Canada, East Africa, West Africa, Tibetan Plateau, North Asia, East Asia, South Asia and Southeast Asia) (Fig. 4).
We analyze the changes in drought characteristics such as its duration, severity and intensity in 1.5 and 2 ∘C warmer worlds. In terms of the drought duration (Figs. 5 and 6), we find robust large-scale features. For example, the drought duration would generally increase globally (2.9 ± 0.5 → 3.1 ± 0.4 months and 2.9 ± 0.5 → 3.2 ± 0.5 months from the baseline period to the 1.5 and 2 ∘C warmer worlds) and in most regions (especially for the Amazon, Sahara, Northeastern Brazil and north Australia) except for North Asia (2.7 ± 0.6 → 2.6 ± 0.5 months and 2.7 ± 0.6 → 2.5 ± 0.4 months) in both the 1.5 and 2∘C warmer worlds. The high model consistency in most regions (e.g., the Amazon, Sahara and Northeastern Brazil) for both warming targets gives us more confidence on these projections. Relative to the 2 ∘C warming target, a 1.5 ∘C warming target is more likely to reduce drought duration at both global and regional scales (except for Alaska/Northwest Canada, East Africa, Sahara, North Europe, North Asia, South Asia, Southeast Asia, Tibetan Plateau and West Africa).
Drought intensity and drought severity are commonly used for quantifying the extent of water availability drops significantly below normal conditions in a region. In this study, the drought intensity is projected to increase globally (0.9 ± 0.3 → 1.1 ± 0.3 and 0.9 ± 0.3 → 1.0 ± 0.2 from the baseline period to the 1.5 and 2 ∘C warmer worlds) and in most of the regions except for North Asia, Southeast Asia and West Africa in 1.5 and 2 ∘C warmer worlds (Figs. 7 and 8). Compared to the 2 ∘C warmer world, the drought intensity in the 1.5oC warmer world would obviously reduce at global and sub-continental scales except for East Canada, Greenland, Iceland (1.0 ± 0.6 → 0.8 ± 0.5) and West North America (0.9 ± 0.3 → 0.8 ± 0.2). In addition, the projected drought severity would also increase in these warmer worlds globally (3.0 ± 1.9 → 4.5 ± 3.0 and 3.0 ± 1.9 → 3.8 ± 2.0 from the baseline period to the 1.5 and 2 ∘C warmer worlds) and in most regions except for North Asia (1.8 ± 0.6 → 1.8 ± 0.7 and 1.8 ± 0.6 → 1.5 ± 0.3) (Figs. 9 and 10). When global warming is maintained at 1.5 ∘C instead of 2 ∘C above the preindustrial levels, the drought severity would weaken in most regions except for Sahara (3.1 ± 0.9 → 3.5 ± 1.3), North Asia (1.5 ± 0.3 → 1.8 ± 0.8), Southeast Asia (17.2 ± 20.1 → 35.8 ± 57.2) and West North America (2.4 ± 1.7 → 2.5 ± 1.4). The projected uncertainties are relatively low (6–11 out of 11 GCMs) for the changes of each drought characteristic in these warming scenarios all over the world, except for some parts of Alaska/Northwest Canada, East Canada, Greenland, Iceland, West North America, central North America, East North America, Sahara, West Africa, East Africa and North Asia.
3.2 Impact of severe drought on populations
To understand the societal influences of severe drought, we combine the drought projection with SSP1 population information and estimate the total, urban and rural populations affected by severe drought in the baseline period and the 1.5 and 2 ∘C warmer worlds (Figs. 11–13). Compared to the baseline period, the frequency of severe drought (PDSI < −3), the drought-affected total and urban populations would increase in most of the regions in the 1.5 and 2 ∘C warmer worlds. Globally, we estimate that 132.5 ± 216.2 million (350.2 ± 158.8 million urban population and −217.7 ± 79.2 million rural population) and 194.5 ± 276.5 million (410.7 ± 213.5 million urban population and −216.2 ± 82.4 million rural population) additional people would be exposed solely to severe droughts in the 1.5 and 2 ∘C warmer worlds, respectively. The severe drought-affected total population would increase under these warming targets in most regions, except for East Asia, North Asia, South Asia, Southeast Asia, Tibetan Plateau and the west coast of South America.
The severe drought-affected populations would increase in urban areas and decrease in rural areas in all global regions in 1.5 and 2 ∘C warmer worlds. For example, the projections suggest that more urban populations would be exposed to severe drought in Central Europe (10.9 ± 7.7 million), Southern Europe and the Mediterranean (14.0 ± 4.6 million), West Africa (65.3 ± 34.1 million), East Asia (16.1 ± 16.0 million), West Asia (16.2 ± 7.4 million) and Southeast Asia (24.4 ± 19.7 million) in 1.5 ∘C warmer world relative to the baseline period. We also find that the number of affected people would escalate further in these regions in 2 ∘C warmer world. In terms of the rural populations, less people in Central Asia (−4.1 ± 4.7 million and −3.3 ± 4.1 million for the 1.5 and 2 ∘C warmer worlds), central North America (−0.5 ± 1.1 million and −0.4 ± 0.9 million), Southern Europe and the Mediterranean (−3.6 ± 3.2 million and −2.9 ± 3.8 million), southern Africa (−3.3 ± 1.5 million and −2.9 ± 1.8 million), Sahara (−1.0 ± 2.5 million and −0.9 ± 2.9 million), South Asia (−70.2 ± 29.7 million and −72.9 ± 30.0 million), Tibetan Plateau (−2.3 ± 1.8 million and −2.1 ± 1.9 million) and West North America (−1.7 ± 1.0 million and −1.6 ± 1.1 million) would be exposed to the severe drought in the 1.5 and 2 ∘C warmer worlds relative to the baseline period. The distinct influences of severe drought on urban and rural populations are driven by both climate warming and population growth, especially by the urbanization-induced population migration.
When global warming approaches 1.5 ∘C (instead of 2 ∘C) above the preindustrial levels, relatively less total, urban and rural populations (except for East Africa and South Asia) would be affected despite more frequent severe drought in most regions such as East Asia, Southern Europe and the Mediterranean, Central Europe and the Amazon. This implies that the benefit of holding global warming at 1.5 ∘C instead of 2 ∘C is apparent to the severe drought-affected total, urban and rural populations in most regions, but challenges remain in East Africa and South Asia.
The changes in the PDSI, drought duration, intensity and severity with climate warming through the 1.5 and 2 ∘C warmer worlds projected in this study are in general agreement with the changes found by the IPCC (2013) despite regional variation. For example, as revealed in this study, the gradual decline of the PDSI (drought-prone) in American Southwest and Central Plains was also projected using an empirical drought reconstruction and soil moisture metrics from 17 state-of-the-art GCMs in the 21st century (Cook et al., 2015). The ascending risk of drought in the Sahara, north Australia and southern Africa coincided with Huang et al. (2017), which projected that global drylands would degrade in the 2 ∘C warmer world. Moreover, the increases in drought duration, intensity and severity in Central America, the Amazon, southern Africa and the Mediterranean are in agreement with the extension of dry spell length and less water availability in these regions under the 1.5 and/or 2 ∘C warming scenarios (Schleussner et al., 2016; Lehner et al., 2017). In addition, we find that the affected populations attribute more (50–75 %) to the population growth rather than the climate change-driven severe drought in the 1.5 and 2 ∘C warmer worlds. This number is perhaps greater than that concluded by Smirnov et al. (2016), due to different study periods, population data, drought index and warming scenarios used.
Projections presented in the current study inherited several sources of uncertainty. Firstly, there are considerable uncertainties in the numerical projections from different climate models under varied greenhouse gas emission scenarios, especially on a regional scale (e.g., Sahara, Alaska/Northwest Canada and North Asia). However, the utility of multiple GCMs and emission scenarios should allow us to synthesize future projections better than single model or scenario analysis (Schleussner et al., 2016; Wang et al., 2017; Lehner et al., 2017). On top of that, we performed uncertainty analysis such as understanding the model consistency (e.g., increases and decreases) and inter-model variance (for magnitude changes). These enable us to characterize regional and global projections which could vary due to different model structures of GCMs and how they behave under different RCP scenarios. Moreover, the global and regional responses (e.g., warming and precipitation patterns) to varied warming scenarios (e.g., 1.5 and 2 ∘C warmer worlds) showed little dependences on RCP scenarios (King et al., 2017; Hu et al., 2017). Therefore, the uncertainty caused by the choice of RCP scenarios might be small. Secondly, there are various ways of picking the 1.5 or 2 ∘C warming signals (King et al., 2017). The current study considered both the influences of multi-model and multi-scenario processes for each warming scenario using the 20-year smoothed multi-model ensemble mean GMT. The selected periods of 1.5 and 2.0 ∘C warmer worlds are close to that of King et al. (2017). Finally, the SSP1 population data and the single drought index used might introduce uncertainties. Despite these sources of uncertainty, these projections are quite robust with high model consistency across most regions.
This analysis evaluated the risk of droughts in terms of how they would change in the future period (1.5 or 2 ∘C warmer worlds) relative to the baseline period and the difference between the two warmer worlds. From this perspective, uncertainty arises from climate model bias between two periods, more or less canceling each other out. Studies by Sun et al. (2011) and Maraun (2016) demonstrated that bias corrections do not yield much difference in such circumstances. In addition, the methodology here requires the meteorological information with physical meaning (see Sect. 2.1) that is consistent with the energy balance of the climate model (Eq. 3 in Sect. 2.3), hence existing bias correction measures (with known weakness in maintaining the physical aspect of bias-corrected output) appear less feasible. (Future innovation which accounts for both statistics and energy balance of climate model output in new bias correction methodology for handling the highly non-linear outcomes should be a subject of scientific interest.) The rationale of using model consistency (Figs. 3, 5, 7 and 9) as a form of “confidence index” here emerges from the idea that, while model validation in historical periods is helpful, it does not necessarily reveal the ability of each climate model in projection of risk change. Thus this kind of confidence index is informative for synthesizing multi-model projections and probably explains why it is still common in many global studies involving multi-model ensembles (e.g., Hirabayashi et al., 2013; Koirala et al., 2014).
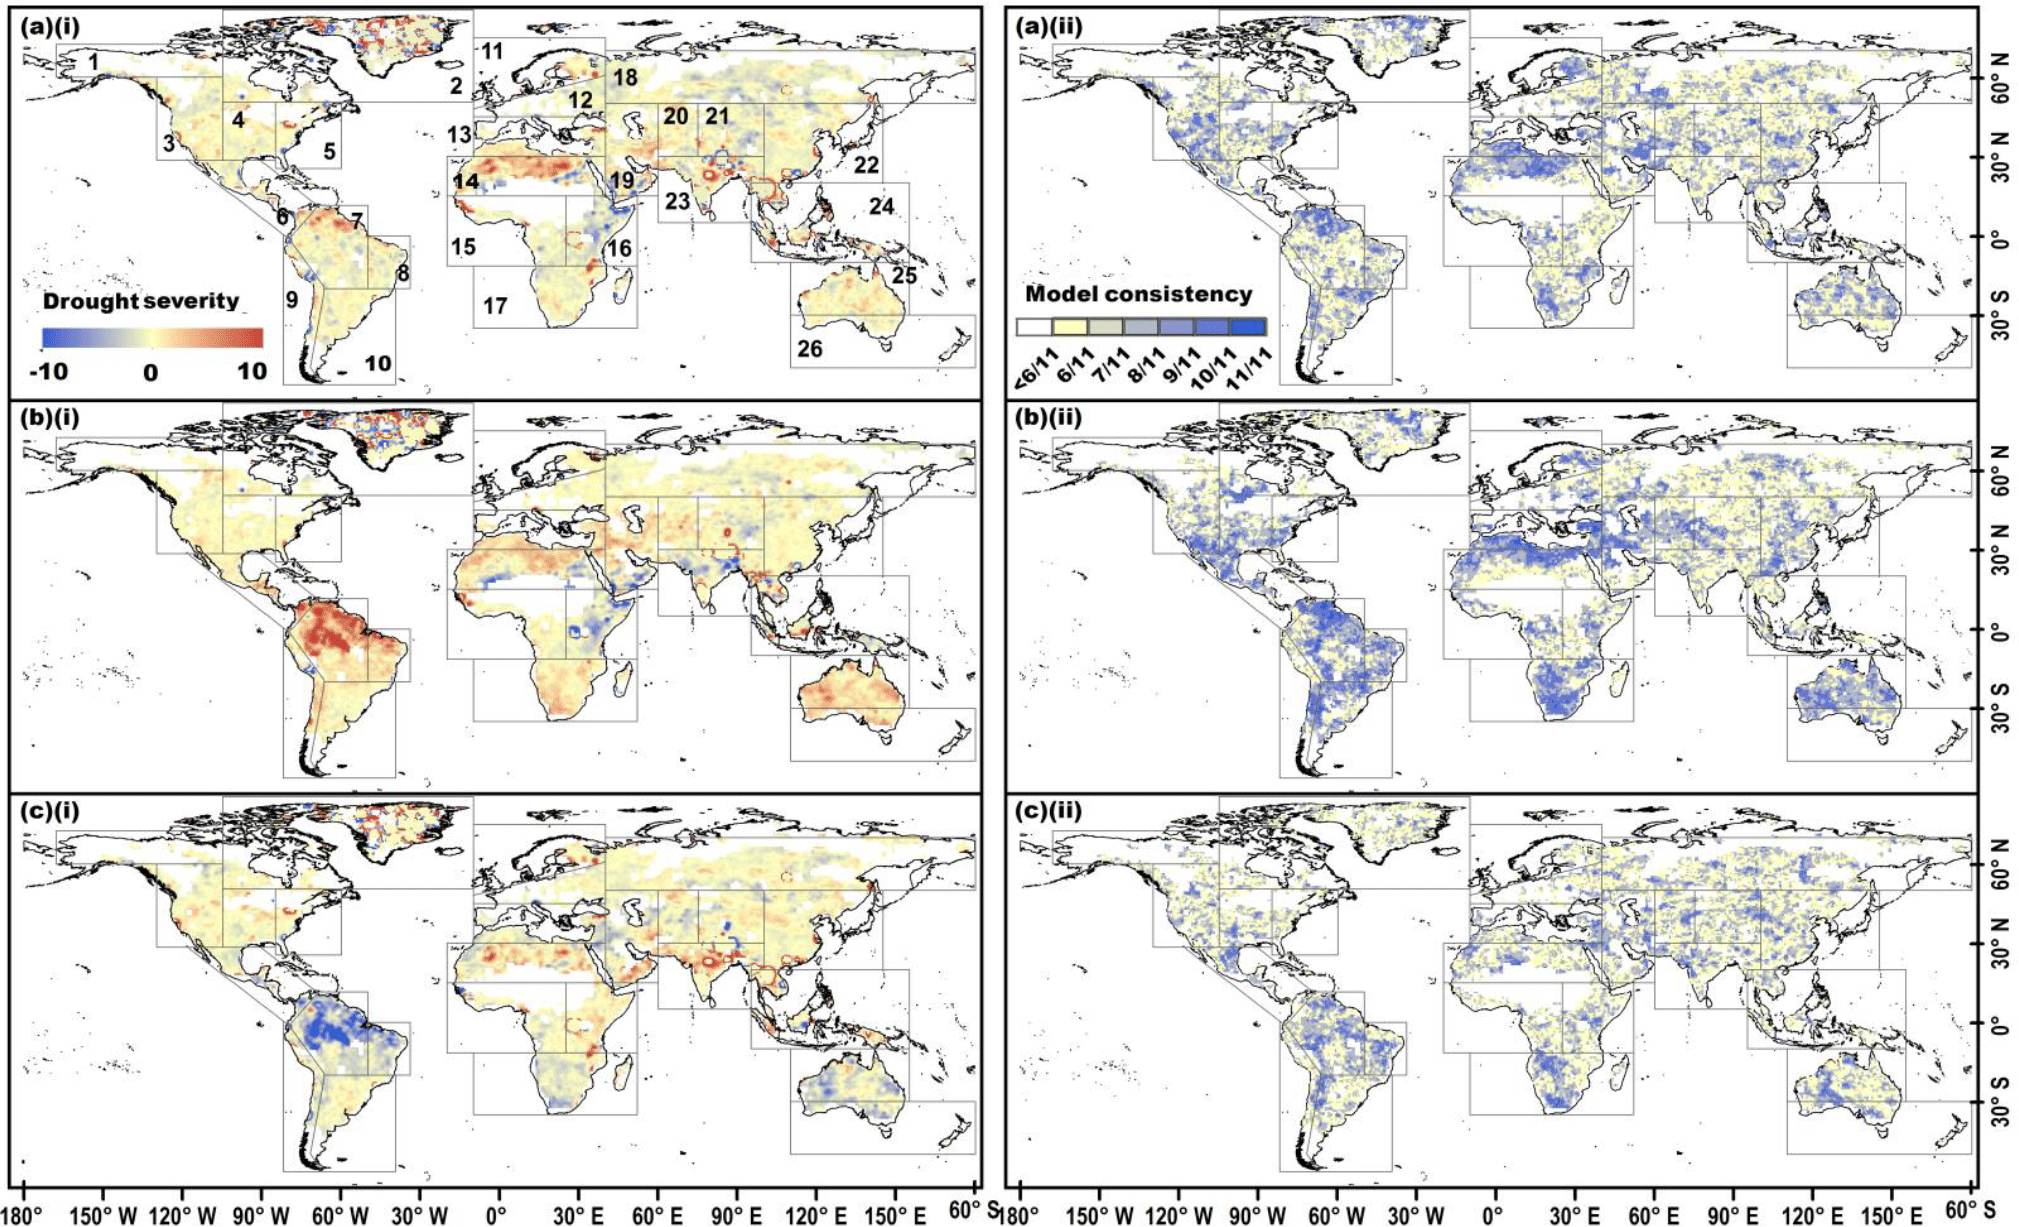
Figure 9Changes in multi-model ensemble mean drought severity (dimensionless) (i) and model consistency (ii) on a spatial resolution of 0.5∘ × 0.5∘. Panel (a) is from the baseline period to the 1.5 ∘C warmer world, panel (b) is from the baseline period to the 2 ∘C warmer world and panel (c) is (a)–(b). The gray boxes show the regions adopted by IPCC (2012), which are labeled in (a)(i) using the ID numbers defined in Table 2. The legend in (a)(i) applies to (b)(i) and (c)(i) and the legend in (a)(ii) applies to (b)(ii) and (c)(ii).
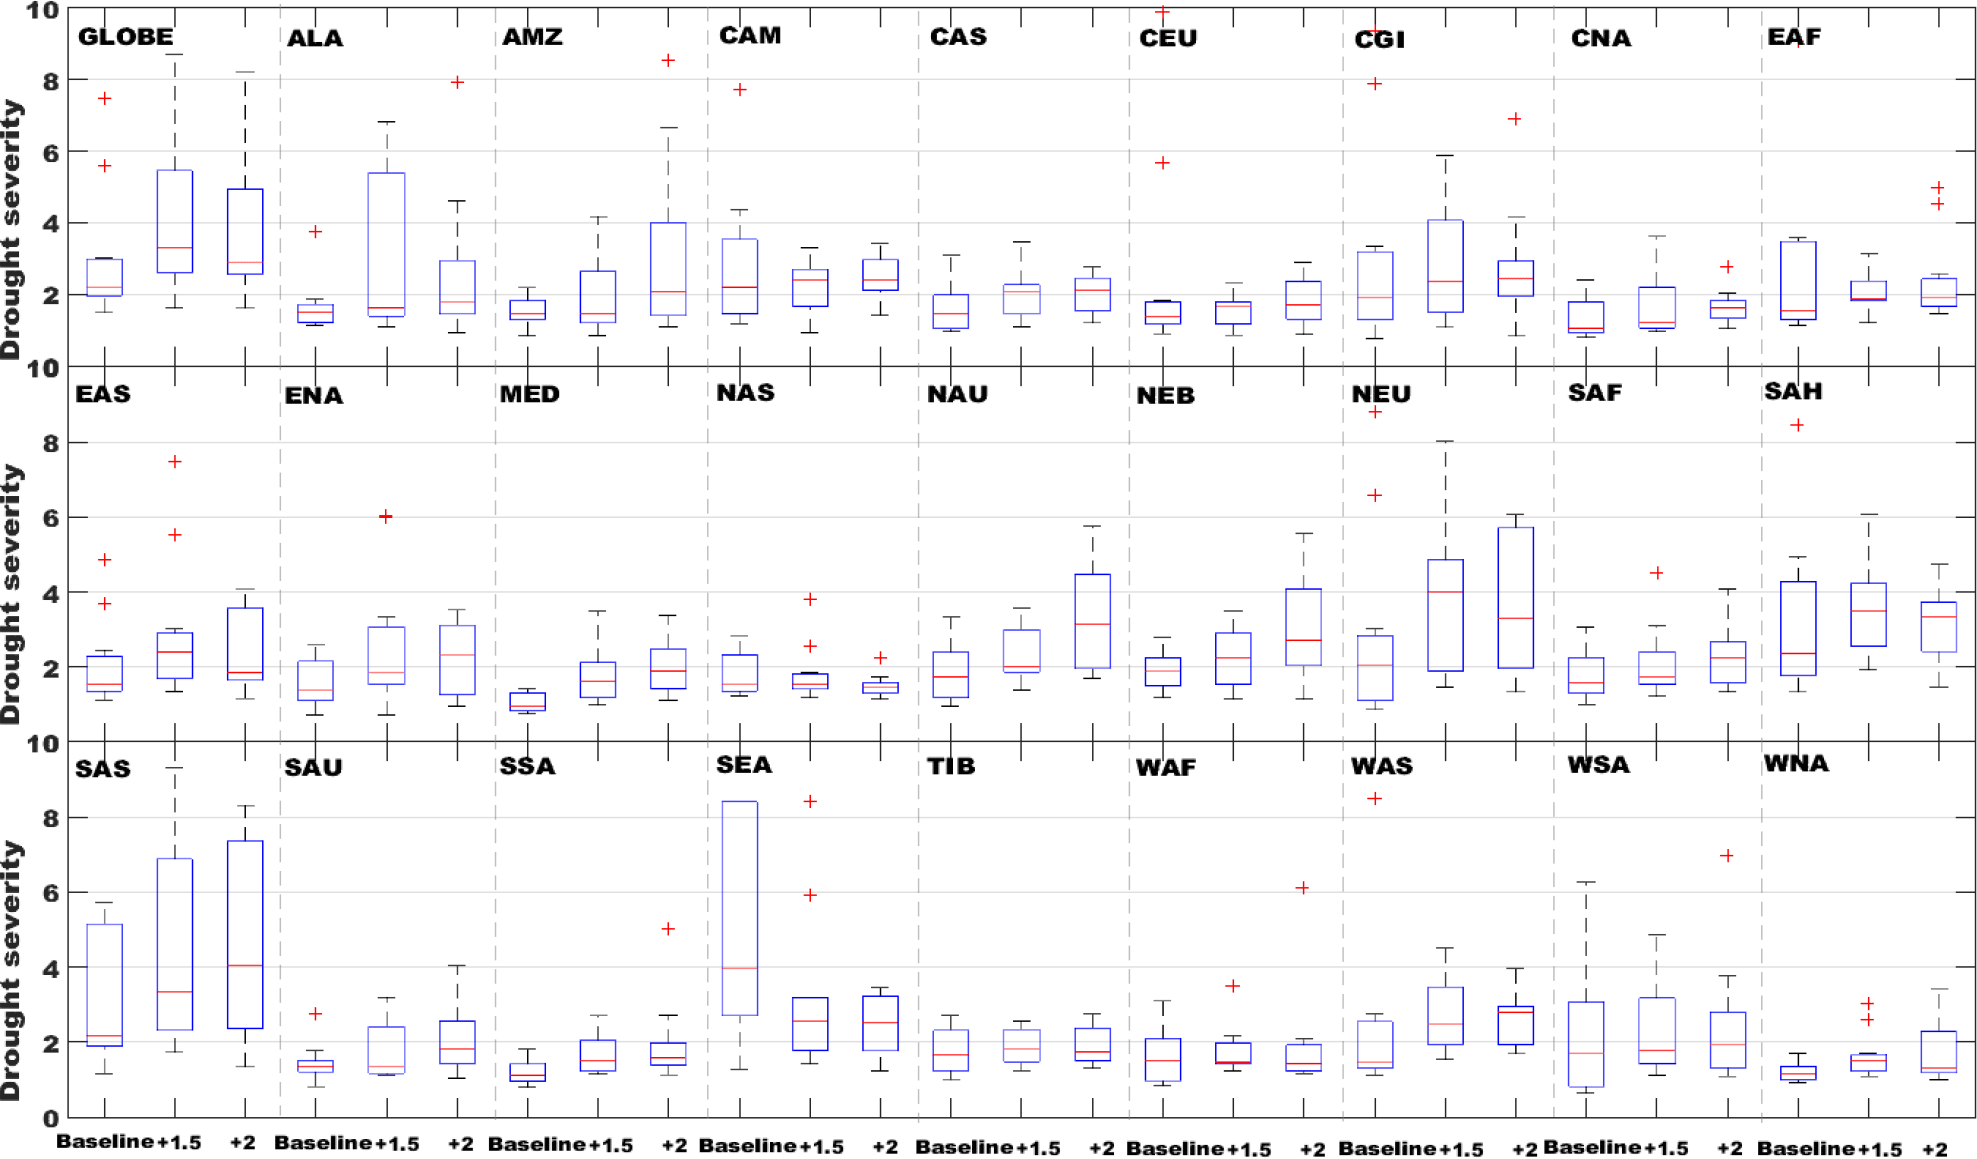
Figure 10Multi-model projected drought severity (dimensionless) globally (66∘ N–66∘ S) and in 27 world regions for the baseline period and the 1.5 and 2 ∘C warmer worlds. The projected uncertainty of multiple climate models is shown through box plots for each region and for each period.
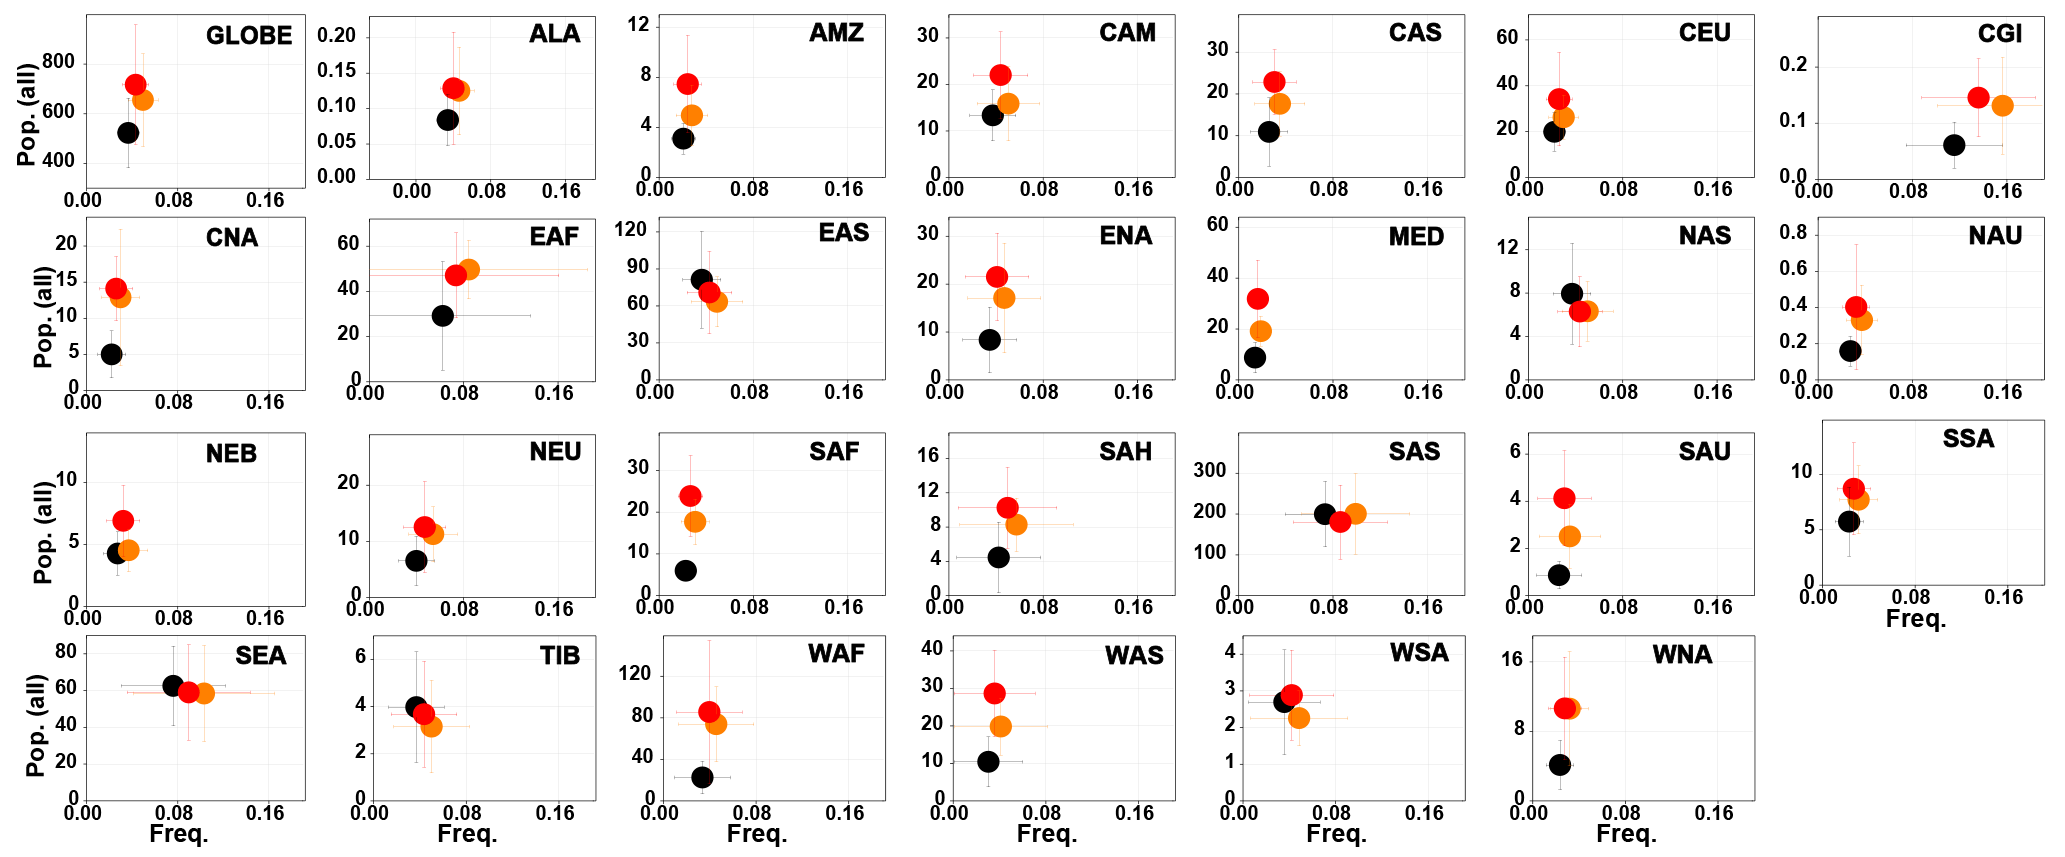
Figure 11Multi-model projected frequency (Freq.) and affected total population (Pop., in millions) by severe drought (PDSI < −3) globally and in 27 world regions for the baseline period (black, fixed SSP1 2000 population) and the 1.5 ∘C (orange, fixed SSP1 2100 population) and 2 ∘C (red, fixed SSP1 2100 population) warmer worlds. The projected uncertainties (standard deviation of multiple-model results) of multiple climate models are shown by error bars (horizontal and vertical).

Figure 12Multi-model projected frequency (Freq.) and affected urban population (Pop., in millions) by severe drought (PDSI < −3) globally and in 27 regions for the baseline period (black, fixed SSP1 2000 population) and the 1.5 ∘C (orange, fixed SSP1 2100 population) and 2 ∘C (red, fixed SSP1 2100 population) warmer worlds. The projected uncertainties (standard deviation of multiple-model results) of multiple climate models are shown by error bars (horizontal and vertical).
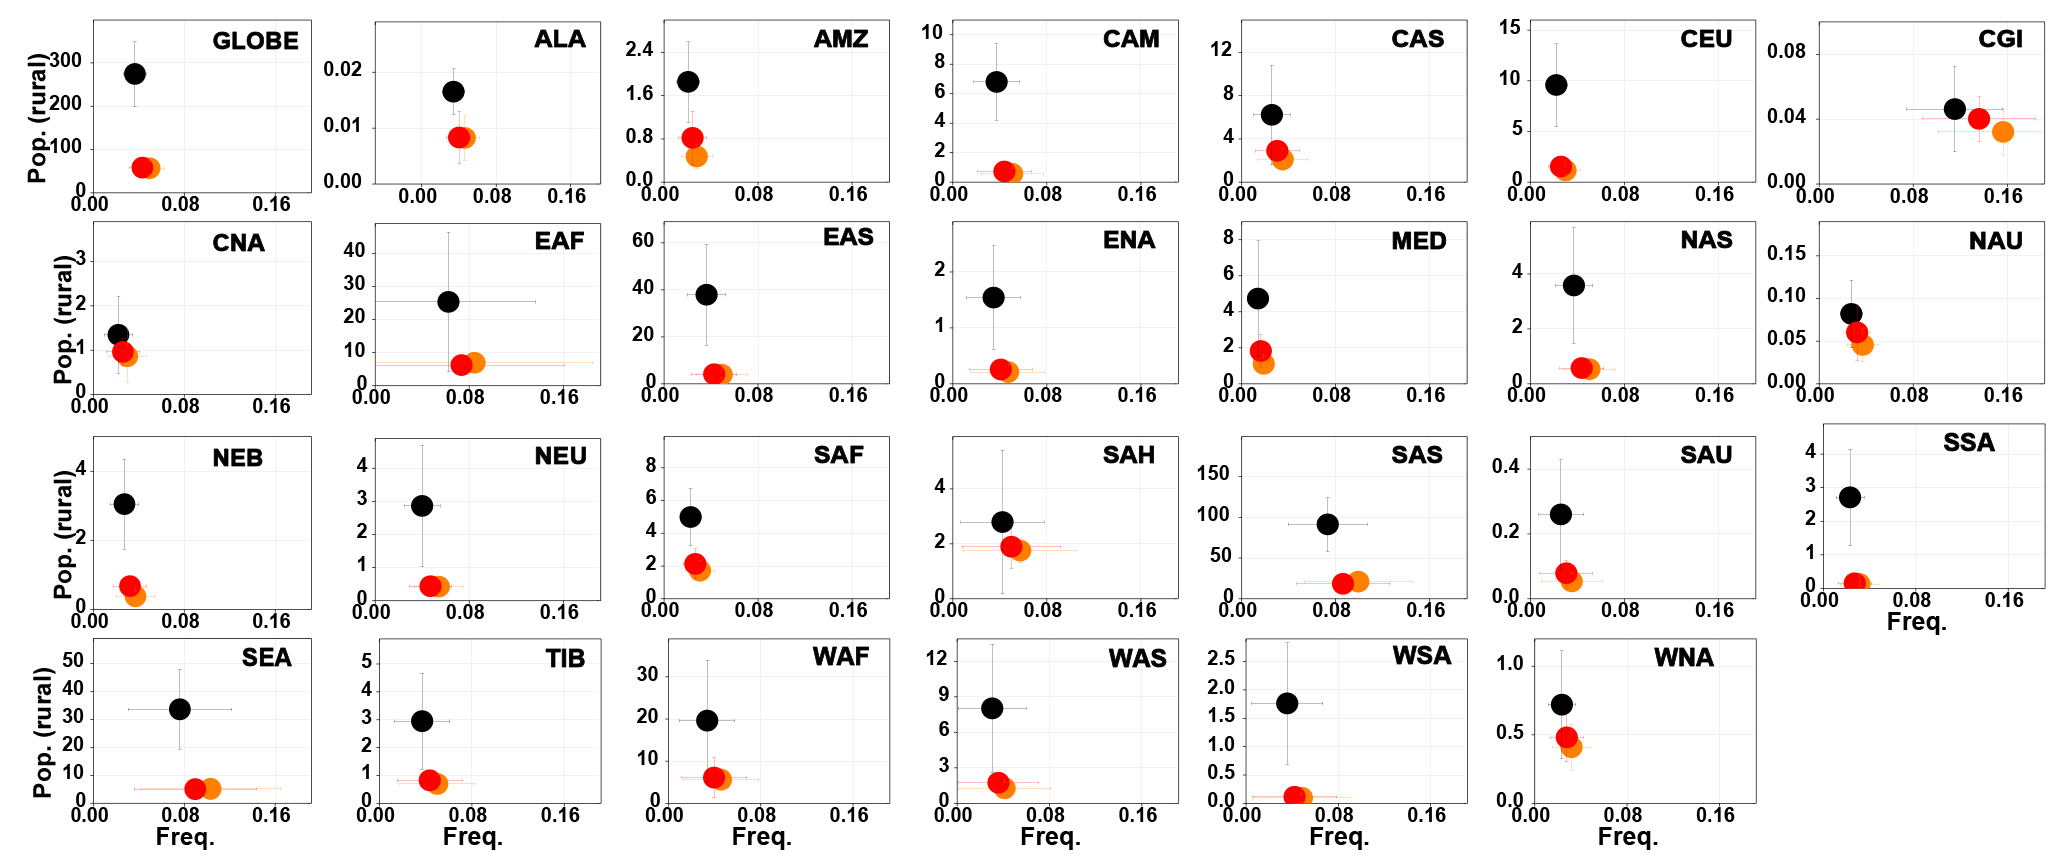
Figure 13Multi-model projected frequency (Freq.) and affected rural population (Pop., in millions) by severe drought (PDSI < −3) globally and in 27 regions for the baseline period (black, fixed SSP1 2000 population) and the 1.5 ∘C (orange, fixed SSP1 2100 population) and 2 ∘C (red, fixed SSP1 2100 population) warmer worlds. The projected uncertainties (standard deviation of multiple-model results) of multiple climate models are shown by error bars (horizontal and vertical).
Motivated by the 2015 Paris Agreement proposal, we analyzed the CMIP5 GCM output and presented the first comprehensive assessment of changes in drought characteristics and the potential impacts of severe drought on populations (total, urban and rural) in the 1.5 and 2 ∘C warmer worlds. We found that the risk of drought would increase (decrease in the PDSI, increase in drought duration, intensity and severity) globally and in most regions such as the Amazon, Northeastern Brazil and Central Europe in the 1.5 and 2 ∘C warmer worlds relative to the baseline period (1986–2005). However, the amplitudes of change in drought characteristics vary among the regions. Relative to the 2 ∘C warming target, a 1.5 ∘C warming target is more likely to reduce drought risk (less drought duration, intensity and severity but relatively more frequent severe drought) significantly on both global and regional scales. The high model consistency (6–11 out of 11 GCMs) across most regions (especially the Amazon, Sahara and Northeastern Brazil) gives us more confidence in these projections.
Despite the uncertainties inherited from the GCMs, population data used and the definition of the 1.5 and 2 ∘C periods, we found significant changes of drought characteristics under both warming scenarios and societal impacts of severe drought by limiting the temperature target to 1.5 ∘C instead of 2 ∘C in several hotspot regions. More total (+132.5 ± 216.2 million and +194.5 ± 276.5 million globally) and urban (+350.2 ± 158.8 million and +410.7 ± 213.5 million globally) populations would be exposed to severe drought in most regions (especially East Africa, West Africa and South Asia) in 1.5 and 2 ∘C warmer worlds, particularly for the latter case.
Meanwhile, less rural populations (−217.7 ± 79.2 million and −216.2 ± 82.4 million globally), for example, in Central Asia, East Canada, Greenland, Iceland, central North America, Southern Europe and the Mediterranean, north Australia, southern Africa, Sahara, South Asia, Tibetan Plateau and West North America would be affected. When the GMT increased by 1.5 ∘C instead of 2 ∘C above the preindustrial level, the total, urban and rural populations affected by severe drought would decline in most regions except for East Africa and South Asia.
In general, this comprehensive global drought risk assessment should provide useful insights for international decision makers to develop informed climate policy within the framework of the 2015 Paris Agreement. While most regions would benefit from reduced societal impacts in the 1.5 ∘C warmer world, local governments in East Africa and South Asia should be prepared to deal with drought-driven challenges (see paragraph above). Future studies on understanding the causes of changes in global and regional droughts (e.g., changing pattern and duration of precipitation and evaporative demand) with respect to these warming targets should assist drought risk adaptation and mitigation planning.
The datasets applied in this study are available at the following locations: CMIP5 model experiments (Taylor et al., 2012), https://esgf-data.dkrz.de/projects/esgf-dkrz/, Spatial population scenarios (Shared Socioeconomic Pathway 1, SSP1, Jones and O'Niell, 2016), https://www2.cgd.ucar.edu/sections/tss/iam/spatial-population-scenarios.
The authors declare that they have no conflict of interest.
This article is part of the special issue “The Earth system at a global warming of 1.5 ∘C and 2.0 ∘C. It does not belong to a conference.
This study was financially supported by the National Research and Development
Program of China (nos. 2016YFA0602402 and 2016YFC0401401), the Key Research Program
of the Chinese Academy of Sciences (no. ZDRW-ZS-2017-3-1), the CAS Pioneer Hundred
Talents Program (Fubao Sun) and the CAS President's International Fellowship
Initiative (Wee Ho Lim, no. 2017PC0068). We thank the editor (Michel Crucifix),
Dimitri Defrance and an anonymous reviewer for their helpful comments.
Edited by: Michel Crucifix
Reviewed by: Dimitri Defrance and one anonymous referee
Aghakouchat, A., Cheng L., Mazdiyasni, O., and Farahmand, A.: Global warming and changes in risk of concurrent climate extremes: insights from the 2014 California drought, Geophys. Res. Lett., 41, 8847–8852, https://doi.org/10.1002/2014GL062308, 2015.
Allen, R., Pereira, L. S., Raes, D., and Smith, M.: Crop evapotranspiration guidelines for computing crop water requirements-FAO Irrigation and drainage paper 56, FAO – Food and Agriculture Organization of the United Nations, Rome, 1998.
Ault, T. R., Mankin, J. S., Cook, B. I., and Smerdon, J. E.: Relative impacts of mitigation, temperature, and precipitation on 21st-century megadrought risk in the American Southwest, Sci. Adv., 2, 1–9, https://doi.org/10.1126/sciadv.1600873, 2016.
Ayantobo, O. O., Li, Y., Song, S. B., and Yao, N.: Spatial comparability of drought characteristics and related return periods in mainland China over 1961–2013, J. Hydrol., 550, 549–567, https://doi.org/10.1016/j.jhydrol.2017.05.019, 2017.
Cheng, L., Hoerling, M., Aghakouchak, A., Livneh, B., Quan, X. W., and Eischeid, J.: How has human-induced climate change affected California drought risk?, J. Climate, 29, 111–120, https://doi.org/10.1175/JCLI-D-15-0260.1, 2016.
Cook, B. I., Ault, T. R., and Smerdon, J. E.: Unprecedented 21st century drought risk in the American Southwest and Central Plains, Sci. Adv., 1, e1400082, https://doi.org/10.1126/sciadv.1400082, 2015.
Cuaresma, J.: SSP economic growth projections: IIASA model, in: Supplementary note for the SSP data sets, https://tntcat.iiasa.ac.at/SspDb/static/download/ssp_suplementary text.pdf (last access: 16 March 2018), 2012.
Dai, A. G.: Characteristics and trends in various forms of the Palmer drought severity index during 1900–2008, J. Geophys. Res., 116, D12115, https://doi.org/10.1029/2010JD015541, 2011.
Dai, A. G.: Increasing drought under global warming in observations and models, Nat. Clim. Change, 3, 52–58, https://doi.org/10.1038/NCLIMATE1633, 2012.
Fischer, E. M., Beyerle, U., and Knutti, R.: Robust spatially aggregated projections of climate extremes, Nat. Clim. Change, 2, 1033–1038, https://doi.org/10.1038/nclimate2051, 2013.
Fu, Q. and Feng, S.: Responses of terrestrial aridity to global warming, J. Geophys. Res., 119, 7863–7875, https://doi.org/10.1002/2014JD021608, 2014.
Hao, Z. C., Singh, V. P., and Xia, Y. L.: Seasonal drought prediction: advances, challenges, and future prospects, Rev. Geophys., 56, 1–34, https://doi.org/10.1002/2016RG000549, 2018.
Heim Jr., R. R.: A review of twentieth-century drought indices used in the United States, B. Am. Meteorol. Soc., 83, 1149–1165, https://doi.org/10.1175/1520-0477-83.8.1149, 2002.
Hirabayashi, Y., Mahendran, R., Korala, S., Konoshima, L., Yamazaki, D., Watanabe, S., Kim, H., and Kanae, S.: Global flood risk under climate change, Nat. Clim. Change, 3, 816–821, https://doi.org/10.1038/nclimate1911, 2013.
Hu, T., Sun, Y., and Zhang, X. B.: Temperature and precipitation projection at 1.5 and 2 ∘C increase in global mean temperature, Chinese Sci. Bull., 62, 3098–3111, https://doi.org/10.1360/N972016-01234, 2017.
Huang, J. P., Yu, H. P., Dai, A. G., Wei, Y., and Kang, L. T.: Drylands face potential threat under 2 ∘C global warming target, Nat. Clim. Change, 7, 417–422, https://doi.org/10.1038/nclimate3275, 2017.
Hulme, M.: 1.5 ∘C and climate research after the Paris Agreement, Nat. Clim. Change, 6, 222–224, https://doi.org/10.1038/nclimate2939, 2016.
IPCC: Managing the Risks of Extreme Events and Disasters to Advance Climate Change Adaptation, in: A Special Report of Working Group I and II of the Intergovernmental Panel on Climate Change, edited by: Field, C. B., Barros, V., Stocker, T. F., Qin, D., Dokken, D. J., Ebi, K. L., Mastrandrea, M. D., Mach, K. J., Plattner, G.-K., Allen, S. K., Tignor, M., and Midgley, P. M., Cambridge University Press, Cambridge, UK and New York, NY, USA, 582 pp., 2012.
IPCC: Summary for Policymakers, in: Climate Change 2013: The Physical Science Basis, Contribution of Working Group I to the Fifth Assessment Report of the Intergovernmental Panel on Climate Change, edited by: Stocker, T., Qin, D., Plattner, G.-K., Tignor, M., Allen, S., Boschung, J., Nauels, A., Xia, Y., Bex, V., and Midgley, P., IPCC AR WGI, Cambridge University Press, Cambridge, UK and New York, NY, USA, 1–100, 2013.
Jacobi, J., Perrone, D., Duncan, L. L., and Hornberger, G.: A tool for calculating the Palmer drought indices, Water Resour. Res., 49, 6086–6089, https://doi.org/10.1002/wrcr.20342, 2013.
James, R., Washington, R., Schleussner, C.-F., Rogelj, J., and Conway, D.: Characterizing half-a-degree difference: a review of methods for identifying regional climate responses to global warming target, WIREs Clim. Change, 8, e457, https://doi.org/10.1002/wcc.457, 2017.
Jones, B. and O'Neill, B. C.: Spatially explicit global population scenarios consistent with the Shared Socioeconomic Pathways, Environ. Res. Lett., 11, 084003, https://doi.org/10.1088/1748-9326/11/8/084003, 2016.
Kelley, C. P., Mohtadi, S., Cane, M. A., Seager, R., and Kushnir, Y.: Climate change in the Fertile Crescent and implications of the recent Syrian drought, P. Natl. Acad. Sci. USA, 112, 3241–3246, https://doi.org/10.1073/pnas.1421533112, 2015.
Kiem, A. S., Johnson, F., Westra, S., van Dijk, A., Evans, J. P., O'Donnell, A., Rouillard, A., Barr, C., Tyler, J., Thyer, M., Jakob, D., Woldemeskel, F., Sivakumar, B., and Mehrotra, R.: Nature harzards in Australia: drought, Climatic Change, 139, 37–54, https://doi.org/10.1007/s10584-016-1798-7, 2016.
King, A. D., Karoly, D. J., and Henley, B. J.: Australian climate extremes at 1.5 ∘C and 2 ∘C of global warming, Nat. Clim. Change, 7, 412–416, https://doi.org/10.1038/nclimate3296, 2017.
Koirala, S., Hirabayashi, Y., Mahendran, R., and Kanae, S,: Global assessment of agreement among streamflow projections using CMIP5 model outputs, Environ. Res. Lett., 9, 064017, https://doi.org/10.1088/1748-9326/9/6/064017, 2014.
Lehner, F., Coats, S., Stocker, T. F., Pendergrass, A. G., Sanderson, B. M., Paible, C. C., and Smerdon, J. E.: Projected drought risk in 1.5 ∘C and 2 ∘C warmer climates, Geophys. Res. Lett., 44, 7419–7428, https://doi.org/10.1002/2017GL074117, 2017.
Liu, W. B. and Sun, F. B.: Assessing estimates of evaporative demand in climate models using observed pan evaporation over China, J. Geophys. Res.-Atmos., 121, 8329–8349, https://doi.org/10.1002/2016JD025166, 2016.
Liu, W. B. and Sun, F. B.: Projecting and attributing future changes of evaporative demand over China in CMIP5 climate models, J. Hydrometeorol., 18, 977–991, https://doi.org/10.1175/JHM-D-16-0204.1, 2017.
Liu, W. B., Wang, L., Chen, D. L., Tu, K., Ruan, C. Q., and Hu, Z. Y.: Large-scale circulation classification and its links to observed precipitation in the eastern and central Tibetan Plateau, Clim. Dynam., 46, 3481–3497, https://doi.org/10.1007/s00382-015-2782-z, 2016.
Lyon, B.: Seasonal drought in the Greater Horn of Africa and its recent increase during the march-may long rains, J. Climate, 27, 7953–7975, https://doi.org/10.1175/JCLI-D-13-00459.1, 2014.
Maraun, D.: Bias correcting climate change simulations – a critical review, Curr. Clim. Change Rep., 2, 211–220, 2016.
Masih, I., Maskey, S., Mussá, F. E. F., and Trambauer, P.: A review of droughts on the African continent: a geospatial and long-term perspective, Hydrol. Earth Syst. Sci., 18, 3635–3649, https://doi.org/10.5194/hess-18-3635-2014, 2014.
McKee, T. B., Doesken, N. J., and Kleist, J.: The relationship of drought frequency and duration of time scales, in: Eighth Conference on Applied Climatology, American Meteorological Society, 17–23 January 1993, Anaheim, CA, 179–186, 1993.
Mishra, A. K. and Singh, V. P.: A review of drought concepts, J. Hydrol., 291, 201–216, https://doi.org/10.1016/j.jhydrol.2010.07.012, 2010.
Mitchell, D., James, R., Forster, P. M., Betts, R. A., Shiogama, H., and Allen, M.: Realizing the impacts of a 1.5 ∘C warmer world, Nat. Clim. Change, 6, 735–737, https://doi.org/10.1038/nclimate3055, 2016.
Mitchell, D., AchutaRao, K., Allen, M., Bethke, I., Beyerle, U., Ciavarella, A., Forster, P. M., Fuglestvedt, J., Gillett, N., Haustein, K., Ingram, W., Iversen, T., Kharin, V., Klingaman, N., Massey, N., Fischer, E., Schleussner, C.-F., Scinocca, J., Seland, Ø., Shiogama, H., Shuckburgh, E., Sparrow, S., Stone, D., Uhe, P., Wallom, D., Wehner, M., and Zaaboul, R.: Half a degree additional warming, prognosis and projected impacts (HAPPI): background and experimental design, Geosci. Model Dev., 10, 571–583, https://doi.org/10.5194/gmd-10-571-2017, 2017.
O'Niell, B. C., Tebaldi, C., van Vuuren, D. P., Eyring, C., Friedlingstein, P., Hurtt, G., Knutti, R., Kriegler, E., Lamarque, J.-F., Lowe, J., Meehl, G. A., Moss, R., Riahi, K., and Sanderson, B. M.: The Scenario Model Intercomparison Project (ScenarioMIP) for CMIP6, Geosci. Model Dev., 9, 3461–3482, https://doi.org/10.5194/gmd-9-3461-2016, 2016.
Palmer, W. C.: Meteorological drought, Research Paper No. 45, US Department of Commerce Weather Bureau, Washington, D.C., 58 pp., 1965.
Peters, G. P.: The “best available science” to inform 1.5 ∘C policy choice, Nat. Clim. Change, 6, 646–649, https://doi.org/10.1038/nclimate3000, 2016.
Qiu, J.: China drought highlights future climate threats, Nature, 465, 142–143, https://doi.org/10.1038/465142a, 2010.
Sanderson, B. M., Xu, Y., Tebaldi, C., Wehner, M., O'Neill, B., Jahn, A., Pendergrass, A. G., Lehner, F., Strand, W. G., Lin, L., Knutti, R., and Lamarque, J. F.: Community climate simulations to assess avoided impacts in 1.5 and 2 ∘C futures, Earth Syst. Dynam., 8, 827–847, https://doi.org/10.5194/esd-8-827-2017, 2017.
Schleussner, C., Lissner, T.K., Fischer, E.M., Wohland, J., Perrette, M., Golly, A., Rogelj, J., Childers, K., Schewe, J., Frieler, K., Mengel, M., Hare, W., and Schaeffer, M.: Differential climate impacts for policy-relevant limits to global warming: the case of 1.5 ∘C and 2 ∘C, Earth Syst. Dynam., 7, 327–351, https://doi.org/10.5194/esd-7-327-2016, 2016.
Sheffield, J., Wood, E. F., and Roderick, M. L.: Little change in global drought over the past 60 years, Nature, 491, 435–439, https://doi.org/10.1038/nature11575, 2012.
Smirnov, O., Zhang, M. H., Xiao, T. Y., Orbell, J., Lobben, A., and Gordon, J.: The relative importance of climate change and population growth for exposure to future extreme droughts, Climatic Change, 138, 41–53, https://doi.org/10.1007/s10584-016-1716-z, 2016.
Sun, F., Roderick, M. L., Lim, W. H., and Farquhar, G. D.: Hydroclimatic projections for the Murray-Darling Basin based on an ensemble derived from Intergovernmental Panel on Climate Change AR4 climate models, Water Resour. Res., 47, W00G02, https://doi.org/10.1029/2010WR009829, 2011.
Taylor, L. E., Stouffer, R. J., and Meehl, G. A.: An Overview of CMIP5 and the Experiment Design, B. Am. Meteorol. Soc., 93, 485–498, https://doi.org/10.1175/BAMS-D-11-00094.1, 2012.
UNFCCC Conference of the Parties: Adoption of the Paris Agreement, FCCC/CP/2015/10Add.1, Paris, France, 1–32, 2015.
Van Dijk, A. I. J. M., Beck, H. E., Crosbie, R. S., de Jeu, A. M., Liu, Y. Y., Podger, G. M., Timbal, B., and Viney, N. R.: The Millennium Drought in southeast Australia (2001–2009): Natural and human causes and implications for water resources, ecosystems, economy, and society, Water Resour. Res., 49, 1040–1057, https://doi.org/10.1002/wrcr.20123, 2013.
Van Vuuren, D. P., Stehfest, E., Gernaat, D. E. H. J., Doelman, J. C., van den Berg, M., Harmsen, M., de Boer, H. S., Bouwman, L. F., Daioglou, V., Edelenbosch, O. Y., Girod, B., Kram, T., Lassaletta, L., Lucas, P. L., van Meijl, H., Müller, C., van Ruijven, B. J., van der Sluis, S., and Tabeau, A.: Energy, land-use and greenhouse gas emissions trajectories under a green growth paradigm, Global Environ. Change, 42, 237–250, https://doi.org/10.1016/j.gloenvcha.2016.05.008, 2017.
Wang, A. H., Lettenmaier, D. P., and Sheffield, J.: Soil moisture drought in China, 1950–2006, J. Climate, 24, 3257–3271, https://doi.org/10.1175/2011JCLI3733.1, 2011.
Wang, Z. L., Lin, L., Zhang, X. Y., Zhang, H., Liu, L. K., and Xu, Y. Y.: Scenario dependence of future changes in climate extremes under 1.5 ∘C and 2 ∘C global warming, Sci. Rep., 7, 46432, https://doi.org/10.1038/srep46432, 2017.
Wells, N., Goddard, S., and Hayes, M. J.: A self-calibrating palmer drought severity index, J. Climate, 17, 2335–2351, 2004.
Yevjevich, V. and Ingenieur, J.: An objective approach to definitions and investigations of continental hydrological drought, Water Resource Publ., Fort Collins, 1967.
Zargar, A., Sadiq, R., Naser, B., and Khan, F. I.: A review of drought indices, Environ. Rev., 19, 333–349, 2011.
Zhang, J., Sun, F. B., Xu, J. J., Chen, Y. N., Sang, Y.-F., and Liu, C. M.: Dependence of trends in and sensitivity of drought over China (1961–2013) on potential evaporation model, Geophys. Res. Lett., 43, 206–213, https://doi.org/10.1002/2015GL067473, 2016.
Zuo, D. D., Hou, W., and Wang, W. X.: Sensitivity analysis of sample number of the drought descriptive model built by Copula function in southwest China, Acta Phys. Sin., 64, 100203, https://doi.org/10.7498/aps.64.100203, 2015.