
the Creative Commons Attribution 4.0 License.
the Creative Commons Attribution 4.0 License.
 | 02 Oct 2026
Decadal predictions of wind, solar and compound power indicators to support the European renewable energy sector

Carlos Delgado-Torres
Matías Olmo
Sushovan Ghosh
Verónica Torralba
Albert Soret
Renewable energy production is strongly influenced by climate variability and change, making the energy sector sensitive to fluctuations on decadal timescales. Decadal climate predictions, which aim to forecast climate variability over the next few years, therefore offer potential value for anticipating near-term changes in wind and solar resources and supporting climate-informed energy planning. However, the predictive skill of decadal forecasts for energy-relevant indicators remains poorly quantified, which is crucial to know the potential usability of any forecast product.
This study evaluates the skill of decadal climate predictions over Europe for forecast years 1–3 using a multi-model ensemble from the Coupled Model Intercomparison Project Phase 6 (CMIP6) Decadal Climate Prediction Project (DCPP). We assess three energy-relevant indicators: photovoltaic potential (PVpot), wind capacity factor (WCF), and a compound indicator describing the number of energy drought days (NED), defined as days with inefficient production from both wind and solar resources. The skill is evaluated against the ERA5 reanalysis, and the added value of the model initialization is estimated by comparing the decadal predictions against the non-initialized historical forcing simulations. PVpot exhibits the highest and most spatially homogeneous skill for annual, spring and summer aggregations, closely reflecting the high predictability of surface solar radiation. WCF shows low and spatially heterogeneous skill, consistent with the high intrinsic variability of wind. The compound NED indicator displays strong seasonal dependence: its predictability is largely controlled by solar conditions in high-radiation seasons and by wind in winter and autumn. Model initialization generally provides added value where historical simulations already show some skill, especially for PVpot, while its impact is lower for WCF. This work shows the specific seasons, regions and energy indicators for which decadal predictions can provide actionable climate information to support renewable energy applications.
- Article
(8683 KB) - Full-text XML
-
Supplement
(17889 KB) - BibTeX
- EndNote


The renewable energy sector has gained increasing importance in Europe in recent years, with wind and solar representing a growing fraction of total electricity generation (European Environment Agency, 2022). Continued policy support and decarbonisation targets are expected to further accelerate this expansion in the coming decades (International Energy Agency, 2024). Renewable energy production depends strongly on variations in key climate variables such as near-surface air temperature, solar radiation or surface wind speed (Solomon, 2007), and ambitious deployment targets across Europe further highlight the need for climate-informed planning in the energy sector (e.g., Ely et al., 2013; Gonzalez et al., 2019). While long-term climate projections are essential for strategic planning, and short-term forecasts support daily operations, the intermediate horizon of the next few years remains comparatively underexploited (Smith et al., 2019). Decadal climate predictions, which bridge the gap between seasonal forecasts and long-term projections, are emerging as a valuable tool for sectors that must adapt to both climate variability and climate change (Meehl et al., 2009; Boer et al., 2016). In the energy sector, such information could support infrastructure development, system resilience, and risk management decisions (European Commission, 2020). Despite this potential, the explicit integration of decadal climate information into wind and solar energy assessments remains limited, highlighting a gap between advances in decadal prediction science and their application in the renewable energy sector.
Previous studies have evaluated the forecast skill of decadal prediction systems for essential climate variables and extreme indices (Delgado-Torres et al., 2022, 2023; World Meteorological Organization, 2024), and have also explored the role of statistical downscaling in improving regional skill (Moreno-Montes et al., 2026). In parallel, decadal forecasts have been applied to sector-specific climate services, including agriculture (Solaraju-Murali et al., 2022; Delgado-Torres et al., 2025), water management (Paxian et al., 2022), marine fisheries (Payne et al., 2022), and hydropower (Tsartsali et al., 2023), as well as multi-sector studies demonstrating the application of decadal predictions (Dunstone et al., 2022; Done et al., 2021). However, research on decadal climate services explicitly focused on the energy sector remains limited. Early assessments have reported regionally dependent skill for decadal predictions of wind-related variables, including near-surface wind speed and wind energy output, with skill often enhanced through downscaling approaches (Haas et al., 2015; Moemken et al., 2016). More recent work has highlighted relatively high skill for surface solar radiation, while wind speed skill remains generally low over Europe (Hutchins et al., 2025). By comparison, climate services for the energy sector have been more extensively explored at sub-seasonal to seasonal timescales (Clark et al., 2017; Torralba et al., 2017b; Bloomfield et al., 2021; Bett et al., 2022; Cionni et al., 2022; Lledó et al., 2022; Soret et al., 2026) and with long-term climate projections (Carvalho et al., 2021; Hou et al., 2021).
In this study, we assess the skill of decadal predictions for energy-relevant indicators derived separately for solar and wind energy over forecast years 1–3, and we further explore compound indicators that combine information from both sources. This 3-year forecast period is particularly relevant for short- to medium-term energy planning applications, including maintenance scheduling, estimation of expected renewable energy production, and management of seasonal energy mixes. Both annual and seasonal indicators are considered: annual means highlight low-frequency signals relevant for year-ahead planning, while seasonal means allow the identification of season-dependent predictability. Analyzing each energy source independently allows us to characterize source-specific predictability, while the combined indicators capture the co-variability of wind and solar resources and its implications for energy system operations. Compound events are particularly relevant because simultaneous deficits in multiple energy resources can exacerbate the risk of energy shortages and stress the energy system (Zscheischler et al., 2018; Otero et al., 2022). Previous studies have shown that combining wind and solar resources can enhance system robustness through their temporal and spatial complementarity (Heide et al., 2010; Monforti et al., 2014; Jerez et al., 2019; Kapica et al., 2024). Decadal predictions of compound hot-dry extreme events have recently been explored by Aranyossy et al. (2025). However, to the best of our knowledge, an assessment of the forecast quality of decadal predictions for compound power indicators remains lacking, limiting the understanding of their utility for energy system planning and risk management over multi-year timescales.
This study is organized as follows. Section 2 describes the datasets used to compute the indicators including observation-based reference datasets, decadal predictions and historical simulations. Section 3 presents the methodology to compute the solar- and wind-based indicators, and compound indicators. Section 4 presents the results together with the discussion and a comparison with previous studies. Finally, Sect. 5 summarizes the main findings, discussing their implications and suggesting directions for future research.
In this study, five different decadal forecast systems contributing to the Decadal Climate Prediction Project (DCPP; Boer et al., 2016) of the Coupled Model Intercomparison Project Phase 6 (CMIP6; Eyring et al., 2016), are used. These forecast systems are the EC-Earth3 (with three different initialization strategies), IPSL-CM6A-LR and MPI-ESM1.2-HR. In addition, to analyze the impact of initialization, the indicators are computed for the three corresponding CMIP6 non-initialized historical forcing simulation models (7 EC-Earth3 members, 11 IPSL-CM6A-LR members, and 2 MPI-ESM1.2-HR members). The main characteristics of the DCPP forecast systems and the historical simulation models, including ensemble size, spatial resolutions, initialization months (for the DCPP-A), and references, are detailed in Table S1 of the Supplementary Material. Additionally, the ERA5 reanalysis (Hersbach et al., 2020) dataset is used as the observation-based reference. This observational reference has been selected taking into account its temporal and spatial coverage and because it is widely used by the energy community (Ramon et al., 2024).
Depending on the energy source, different temporal resolutions and variables are used. For solar energy indicators, daily values of surface downwelling shortwave radiation (RSDS), near-surface air temperature (TAS), and surface wind speed (SFCWIND) are employed. For wind energy indicators, instantaneous 6-hourly surface wind (6 h-SFCWIND) data are used. As sub-daily data are required to compute the wind indicators (Lledó et al., 2022), the number of available models is reduced.
Start dates from 1960–2016 are used for decadal predictions, focusing the analysis on forecast years 1–3. Therefore, to match the period, we use the ERA5 data, as well as the historical forcing simulations concatenated with the scenario ssp245 (O'Neill et al., 2016), during 1961–2019. Historical simulations provide data until 2014, and ssp245 is used for the rest of the years (2015–2019).
The analysis focuses on Europe, defined by the spatial domain spanning longitudes 30° W–12° E and latitudes 35–65° N.
To provide information at a spatial scale relevant for regional applications, a statistical downscaling approach is applied to model simulations to increase the horizontal resolution, bringing them to the ERA5 grid (0.25°). This downscaling procedure consists of a combination of spatial interpolation and calibration using Empirical Quantile Mapping (EQM), described below. This method is adopted, as previous studies have shown that more complex downscaling techniques often provide limited added value in terms of predictive skill compared to simpler approaches (e.g., Manzanas et al., 2018; Gutiérrez et al., 2019; Moreno-Montes et al., 2026), while minimising the risk of introducing artificial skill. To assess the sensitivity of the results to the spatial resolution used for the analysis, all indicators and skill metrics are additionally computed on the native spatial resolution of the coarsest prediction system considered (IPSL-CM6A-LR: 2.5°×1.25°).
After interpolation and before calibration, wind energy indicators are derived from 6 h-SFCWIND data converted to wind speeds at 100 m (6-hWIND). A representative hub height of 100 m is assumed for modern wind turbines (Wiser et al., 2023). To estimate hub-height winds from surface winds, a power law is applied (Brower, 2012), using a shear exponent of α=0.143 (Touma, 1977) over land and α=0.11 over water (Hsu et al., 1994), under the assumption of neutral atmospheric stability.
In addition, ERA5 wind speeds are adjusted using the Global Wind Atlas (GWA) to better represent long-term mean conditions at hub height. Figure S1 shows the climatological ratio between ERA5 and GWA mean 6-hWIND over 1961–2019, which is applied as a multiplicative pointwise correction factor (GWA/ERA5) to adjust the mean wind speed while preserving the temporal variability of the ERA5 data (Lledó et al., 2022).
Once wind-specific corrections have been applied, model outputs are adjusted to the observed climatology by removing the model mean and replacing it with the corresponding observed mean. These climatologies are computed over a common reference period (1963–2017), defined by the availability of all forecast years included in this study (i.e. 1–3) across the selected start dates (1960–2016). This adjustment reduces the impact of model drift while preserving the temporal variability of the simulations (Boer et al., 2016).
The adjusted decadal predictions and historical simulations are then calibrated against ERA5 using EQM (Panofsky and Brier, 1958). By adjusting empirical quantiles at 1 % intervals (from the 1st to the 99th percentile), EQM corrects the distribution of the variable, including the mean, variance, and higher-order moments. Calibration is performed independently at each grid point, per forecast year and member for decadal predictions, and per calendar year and member for historical simulations. In both cases, empirical distributions are estimated using a 30 d moving window centered on the target date to preserve seasonality while ensuring a sufficient sample size. Both the climatological adjustment and EQM calibration are performed within a leave-one-year-out cross-validation framework. For each target year, the climatological means and EQM transfer function are estimated using all other years in the calibration period. This prevents information from the target year from being used in the calibration and avoids artificial skill inflation (Elsner and Schmertmann, 1994). For 6 hWIND, the calibration is performed separately for each time of the day, since wind distributions differ markedly across the diurnal cycle (Kalverla et al., 2019; Weide Luiz and Fiedler, 2022).
The calibrated climate variables are then used to compute the energy indicators. All indicators are calculated separately for each climatological season and for the whole year. We define three indicators: photovoltaic potential (PVpot) for solar energy, capacity factor for wind energy (WCF), and the Number of Energy Droughts (NED). The intermediate metric Number of Effective days (Neff) is first computed for each resource and subsequently combined to derive NED. Indicators are computed for each forecast system and for the ERA5 reanalysis, which we use as a reference to assess predictive performance. Results for wind-related indicators are analyzed over land and over sea-adjacent regions, as both onshore and offshore wind resources are of practical interest for current and future wind energy deployment.
Following previous studies (Mavromatakis et al., 2010; Jerez et al., 2015), PVpot is computed as a dimensionless metric that combines RSDS, TAS and SFCWIND to represent the performance of photovoltaic cells under ambient environment. PV power generation at a specific location is determined by multiplying PVpot with the nominal installed capacity of that location. The PVpot is mainly driven by RSDS, with adjustments for TAS, which lowers module efficiency at higher temperatures (Radziemska, 2003), and SFCWIND, which can partially offset thermal losses through convective cooling. Although Eq. (S1) provides PVpot as a unitless quantity, in this study it is converted to percentage values to facilitate visual interpretation. Even though daily inputs are less precise than hourly due to aggregation, they keep seasonal and annual errors small and avoid the much larger biases seen with monthly data (Müller et al., 2019; Bett and Thornton, 2016).
WCF is defined as the ratio between the energy actually produced and the energy that would be generated if the turbine operated continuously at its rated power. WCF depends on the turbine’s power curve, which varies by turbine type and site conditions; the standard power curves defined by the International Electrotechnical Commission (IEC) 61400-1 are shown in Fig. S2. In this study, an IEC Class I turbine is adopted as a common reference, as a sensitivity analysis presented no notable differences among the skill performance of the different turbines (not shown). Given the high temporal resolution of turbine power curves and their strong nonlinearity, the use of 6-hourly wind data reduces aggregation bias. Although daily means are often adequate (MacLeod et al., 2018), sub-daily data better preserve variability and yield more accurate WCF estimates (Lledó et al., 2022). WCF is derived using the R-based CSIndicators package (Pérez-Zanón et al., 2023).
PVpot and WCF are defined differently, so their absolute values should not be compared across energy sources. To enable a meaningful cross-resource comparison, Neff is defined as the number of days meeting efficiency-related thresholds, providing a common performance indicator with direct operational relevance.
For solar energy production, Neff efficiency thresholds are defined using a minimum RSDS and a maximum cell temperature (Tcell: Chenni et al., 2007). The RSDS threshold is based on the concept of peak sun hours (PSH), defined as the equivalent number of hours per day with an irradiance of 1000 W m−2 (Duffie and Beckman, 1980). A commonly used lower limit for meaningful PV generation is 5 PSH d−1, which corresponds to a daily mean RSDS of 208 W m−2 (Ghosh et al., 2022). Since higher TAS increases Tcell and reduces PVpot, an upper operating threshold of Tcell = 45 °C is applied (see Eq. S2), at which the PV module works at 90 % of its rated efficiency, with PV generation progressively declining above this threshold (Ghosh et al., 2024).
For wind energy, Neff is defined using both operational and performance criteria. Although IEC Class I turbines operate between cut-in (2 m s−1) and cut-out (25 m s−1) wind speeds, winds just above cut-in typically yield little energy production. Therefore, effectiveness is defined using a minimum threshold of WCF ≥ 25 %, which excludes periods of low-efficiency production and can be associated with economically relevant wind power generation (Boccard, 2009; Kealy et al., 2015). This threshold is translated into an equivalent minimum wind speed using the turbine power curve, and effective time steps are counted when wind speeds exceed this value while remaining below cut-out. To ensure consistency with solar indicators, 6-hourly wind data are aggregated to daily values, defining a day as effective when at least 3 of 4 time steps meet the threshold (Fig. S3).
Based on the effective number of days in which any energy source can operate efficiently, we define the combined indicator NED, which corresponds to the number of days when neither source produces efficiently. In addition, Neff is calculated separately for each energy source (solar-Neff and wind-Neff).
Once the corresponding indicators are calculated for each forecast year, the forecast years 1–3 are averaged in order to obtain a mean value over the entire forecast period for each forecast system. To ensure a consistent comparison with decadal predictions, a rolling mean with a window length equal to the number of forecast years (3) is applied to the historical simulations and ERA5 time series. Subsequently, multi-model ensembles are constructed for decadal predictions (DCPP) and historical simulations (HIST) following the multi-model mean approach (Delgado-Torres et al., 2022).
The performance of the DCPP is evaluated against the ERA5 reanalysis using the Anomaly Correlation Coefficient (ACC; Wilks, 2011). ACC ranges from −1 (perfect inverse correlation) to 1 (perfect correlation). A one-sided t-test is applied to determine if ACC values differ significantly from zero (Wilks, 2011). Following Storch and Zwiers (1999), the effective number of degrees of freedom is used to account for autocorrelation in the time series. To assess the impact of initialization, the residual correlation (ResCorr; Smith et al., 2019) between the DCPP and ERA5 is calculated relative to the HIST. ResCorr is calculated by linearly removing the variability associated with HIST from both DCPP and ERA5 and correlating the resulting residuals. Its significance is assessed using a two-sided t-test with effective degrees of freedom to account for temporal autocorrelation. Positive values of ResCorr indicate that decadal predictions can capture more observed variability that is not already captured by the historical simulations.
Since the DCPP and HIST ensembles have different numbers of members, we perform an additional sensitivity analysis to assess the impact of ensemble size on the estimated added value of initialization. The analysis is applied to the multi-model mean used throughout the study; therefore, ensemble-size adjustments are performed independently for each model before constructing the multi-model average. For each forecast system, the same number of DCPP and HIST members are selected, corresponding to the minimum ensemble size available in both systems (7 for EC-Earth3, 10 for IPSL-CM6A-LR, and 2 for MPI-ESM1.2-HR). For this analysis, the 7 EC-Earth3 decadal prediction members are taken from the three different initializations for their comparison with the non-initialized EC-Earth3 historical simulations. For each resampling, an equal-member multi-model ensemble is constructed and used to estimate ResCorr. The procedure is repeated 5000 times, and the sensitivity to ensemble size is quantified as the difference in residual correlation:
The median of the resulting ΔResCorr distribution is used as the central estimate at each grid point, while the 2.5th and 97.5th percentiles define a 95 % bootstrap interval. Regions where this interval does not include zero are considered robustly sensitive to ensemble size.
Additionally, we assess the positive bias in ResCorr associated with the finite size of the HIST ensembles, following Smith et al. (2019). Since the multi-model mean is constructed by averaging each prediction system independently, the HIST ensemble of each model is randomly divided into two equal subsets (3+3 members for EC-Earth3, 5+5 for IPSL-CM6A-LR, and 1+1 for MPI-ESM1.2-HR). For EC-Earth3 and IPSL-CM6A-LR, which have 7 and 11 HIST members, respectively, one member is randomly excluded in each repetition. The corresponding subsets are then averaged across prediction systems to construct two independent multi-model HIST estimates (A and B). For each repetition, a biased ResCorr estimate is calculated using HIST A as the reference for both DCPP and ERA5. An unbiased ResCorr estimate is then calculated using the two independent HIST estimates, with HIST A used as the reference for DCPP and HIST B for ERA5. The finite-ensemble bias is estimated as the difference between these two ResCorr values. The procedure is repeated 5000 times, and the median estimated bias is subtracted from the original ResCorr. The uncertainty associated with the ensemble partitioning is quantified as the standard deviation of the bias estimates across the 5000 repetitions.
Finally, after computing the indicators for each grid point, a regionalization is applied to analyze trends and correlations at the regional scale. For each sub-region, indicators are first spatially area-weighted averaged to obtain a single representative time series, from which regional trends, correlations and ResCorr are calculated. This step is motivated by the known contribution of externally forced trends and low-frequency variability to decadal prediction skill in some variables (e.g. van Oldenborgh et al., 2012), and allows us to assess how long-term changes influence the estimated predictability. Trends are estimated using a linear fit, while statistical significance is assessed independently using a modified Mann-Kendall test that accounts for temporal autocorrelation following Hamed and Rao (1998). Europe is divided in seven sub-regions (Fig. S4), following the regionalization of Priestley et al. (2024): Iberia, Western Europe, Mediterranean, Central Europe, Eastern Europe, Scandinavia, Great Britain and Ireland.
The results are presented in three separate sections for each indicator: PVpot, WCF, and NED. The ACC of the indicator between DCPP and ERA5, the ACC between HIST and ERA5, and the ResCorr between DCPP and ERA5 relative to HIST are shown for the annual mean and individual seasons. Equivalent results obtained on the native resolution of the coarsest prediction system are shown in Figs. S5, S10 and S13. For each indicator, the climatology and multiannual standard deviation are presented to provide context on the mean state and variability of the indicator (Figs. S6, S11 and S15). Additionally, regional trends, correlations and ResCorr for each indicator are shown in Figs. 2, 4 and 6. The ACC maps of the underlying variables (RSDS, TAS and SFCWIND) are shown in Fig. S7, while their regional trends are presented in Fig. S9. Finally, the robustness of the ResCorr results is further assessed by examining both the sensitivity to differences in ensemble size between DCPP and HIST and the positive bias associated with the finite size of the HIST ensembles, following the procedures described in Sect. 3. The corresponding results, including the sensitivity to equal-member resampling, the bias-corrected ResCorr, and the uncertainty associated with the finite-ensemble correction, are presented in Figs. S8, S12 and S17.
4.1 Photovoltaic potential (PVpot)
Figure 1a–e shows the ACC between DCPP and ERA5 of PVpot for the annual mean and each season. The annual mean (Fig. 1a) and JJA (Fig. 1d) show the highest fractions of significant area, with positive skill over most of the region, except in parts of the UK, southern Europe and Scandinavia. In MAM (Fig. 1c), the ACC is not significantly positive in northern Europe and Iberia and the percentage of significant area is lower than in the annual mean and JJA, although the skill patterns are similar. On the other hand, DJF (Fig. 1b) shows the lowest fraction of significant points, with significant skill only over parts of Iberia and Italy. ACC values during SON (Fig. 1e) are significant in regions along the Atlantic coast and parts of Poland and the Baltic countries. Across all seasons, skill tends to be lower in mountainous regions, particularly over the Alps. Similar skill patterns are obtained at the coarser resolution (Fig. S5a–e), indicating that the main results are robust to spatial resolution.
The climatology of PVpot (Fig. S6a–e) shows higher values over southern Europe than at higher latitudes, reflecting the meridional gradient in solar irradiance, in line with previous studies (e.g. Šúri et al., 2007; Castillo et al., 2016). The associated multiannual standard deviation is low across the domain (Fig. S6f–j), indicating that PVpot variability is small and largely controlled by mean climatological conditions.
Although the percentage of significant grid points is slightly lower for PVpot than for its main driver RSDS (Fig. S7a–e), both variables show very similar spatial skill patterns. The reduction in PVpot skill relative to RSDS is more noticeable over southern Europe in the annual mean (Figs. S7a and 1a), over parts of central Europe in MAM (Figs. S7c and 1c), and over Iberia in SON (Figs. S7e and 1e). This loss of skill reflects the fact that PVpot is not only driven by RSDS but is also modulated by TAS and, with a smaller contribution, by SFCWIND. While TAS generally shows high and spatially homogeneous skill across most seasons (except in DJF; Fig. S7g), and SFCWIND exhibits weaker and more heterogeneous skill (Fig. S7k–o), their combined effect slightly decreases the overall PVpot predictability compared to RSDS alone.
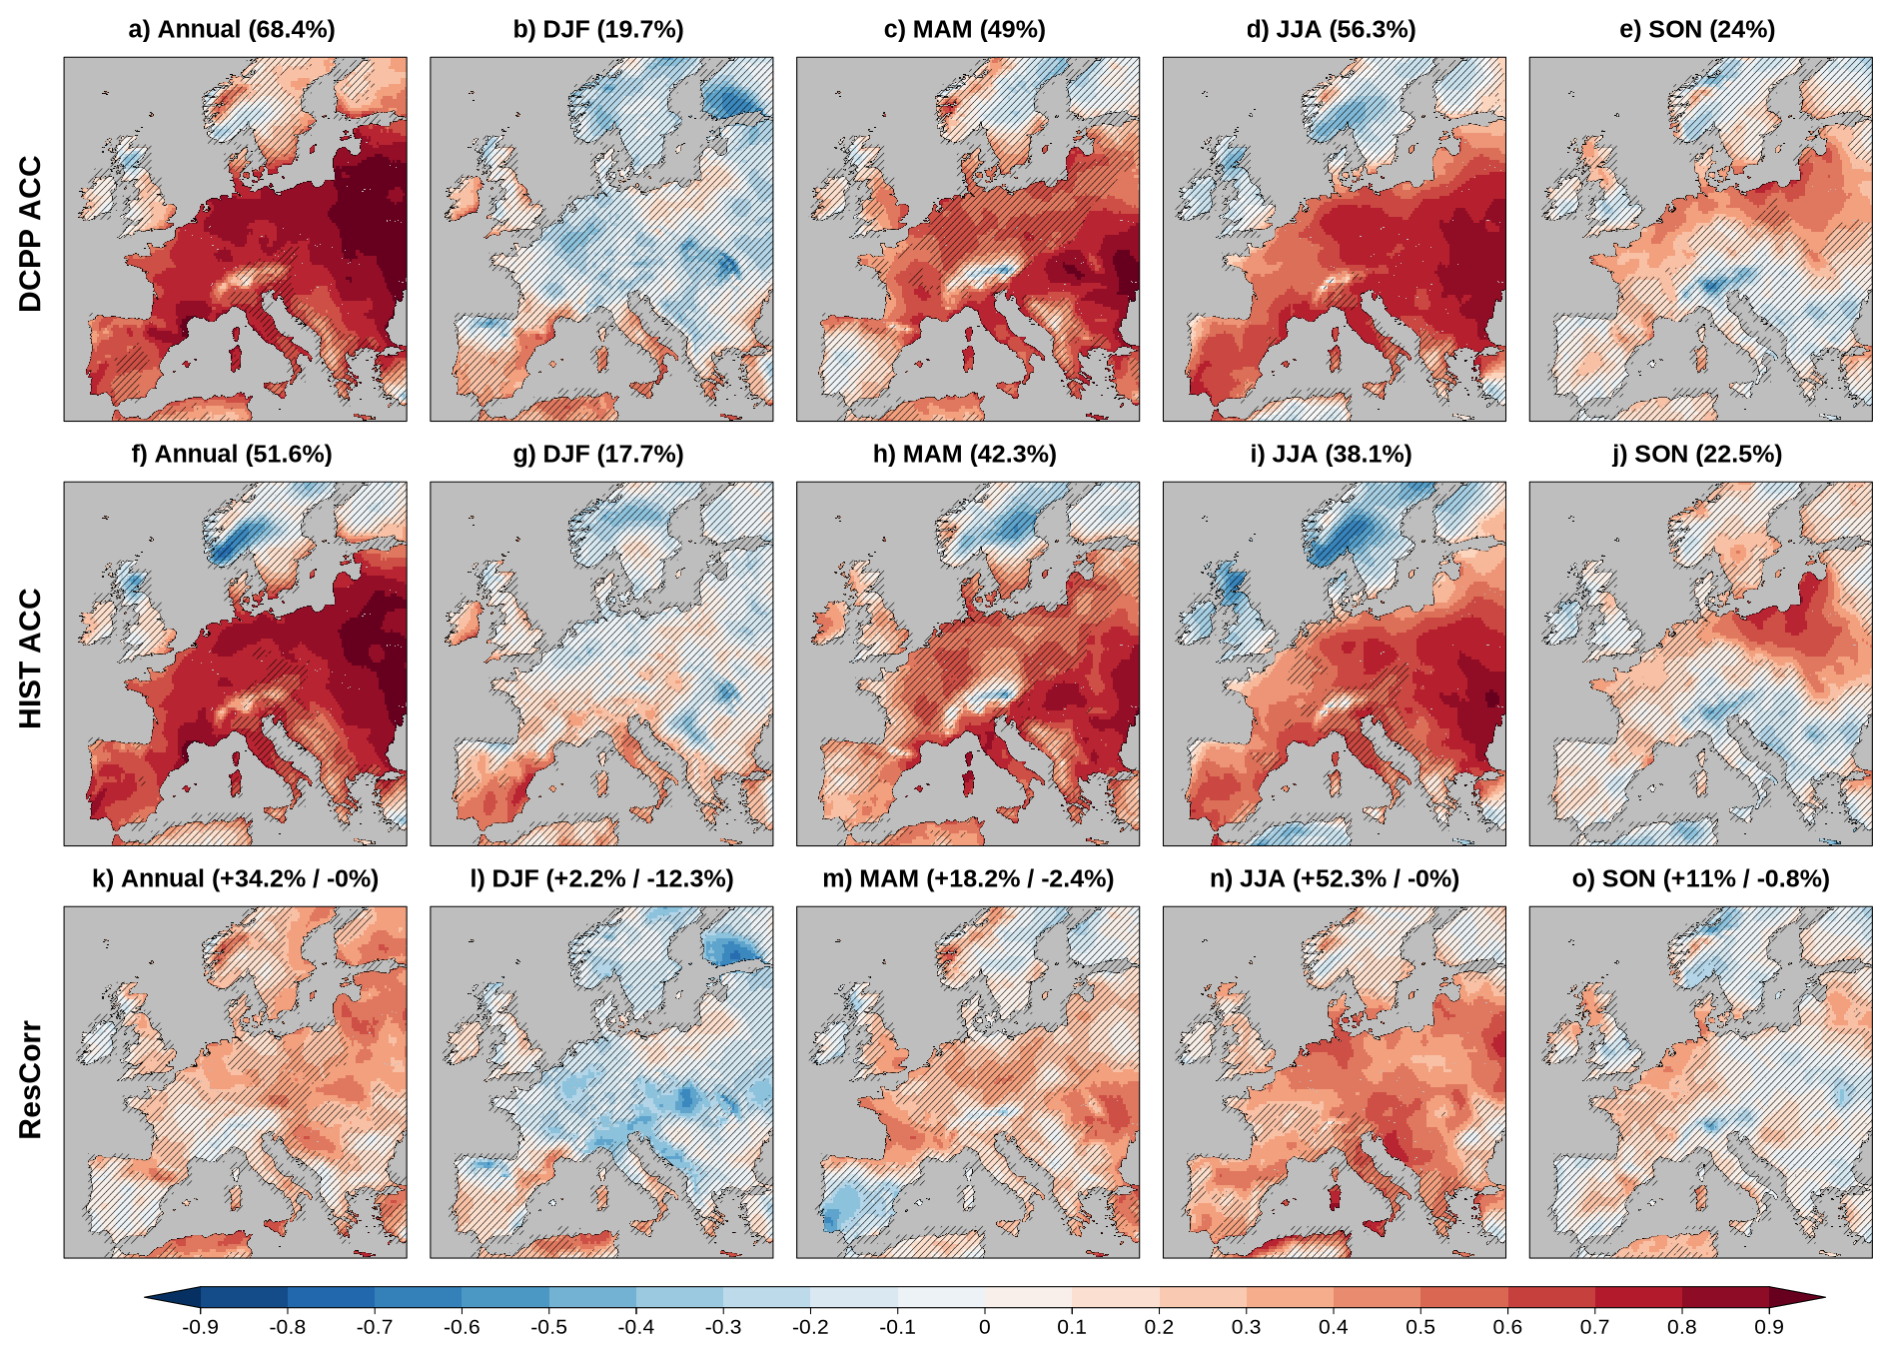
Figure 1First row: ACC between DCPP and ERA5 for PVpot for the annual mean (a) and seasonal means (b–e) for forecast years 1–3. Second row: ACC between HIST and ERA5 for the annual mean (f) and seasonal means (g–j). The percentages of significant grid points are indicated in brackets, and hatched regions denote non-significant correlations. Third row: ResCorr between DCPP and ERA5 relative to HIST for the annual mean (k) and seasonal means (l–o). Percentages indicate the fractions of significantly positive (red) and significantly negative (blue) values. Positive (negative) ResCorr indicates higher (lower) skill for DCPP compared to HIST. Correlations are computed against ERA5 during the 1961–2019 period. ACC significance is assessed using a one-sided t-test at the 95 % confidence level, accounting for time-series autocorrelation, while ResCorr significance is assessed using a two-sided t-test with effective degrees of freedom to account for temporal autocorrelation.
The seasonal contrast in skill suggests a link with large-scale atmospheric conditions. Skill is higher in JJA and MAM, when more persistent radiative conditions typically dominate, and lower in DJF and in mountainous regions, when variability is stronger. However, these relationships are not spatially uniform and should be interpreted cautiously. Besides, the similarity between the annual and JJA skill patterns reflects the dominant contribution of high-radiation seasons to the annual PVpot signal. Since PVpot is strongly controlled by RSDS, and solar irradiance peaks during spring and summer, the annual mean largely integrates the predictability of these seasons. In addition, annual averaging reduces short-term variability and increases signal-to-noise ratios, resulting in higher predictability and thus higher skill values.
Few studies have assessed decadal predictability for solar-energy indicators. Hutchins et al. (2025) have reported high summer skill for RSDS over southern and central Europe, broadly consistent with our results. They have also identified additional winter predictability using a NAO-based approach, which is not captured when evaluating PVpot from the multi-model ensemble. Focusing on seasonal predictions, Bett et al. (2022) have found higher predictability for RSDS in summer and lower in winter, in line with the seasonal contrast observed here for decadal predictions.
The ACC between HIST and ERA5 is shown in Fig. 1f–j and the added value of the DCPP relative to HIST assessed using the ResCorr is shown in Fig. 1k–o. HIST reproduces the main spatial patterns identified in DCPP, although with a lower fraction of significant area, particularly in the annual mean (Fig. 1f) and JJA (Fig. 1i). In DJF, DCPP skill (Fig. 1b) is lower than HIST skill (Fig. 1g) in areas such as southern Iberia. In the annual mean (Fig. 1k) and JJA (Fig. 1n), ResCorr is significantly positive over large parts of the domain, indicating that model initialization enhances PVpot skill relative to historical simulations. During MAM and SON (Fig. 1m, o), positive ResCorr values are restricted to specific regions, mainly over eastern Europe and parts of the Atlantic coast in MAM and over parts of northwestern Europe in SON. Similar conclusions are obtained at the native resolution of the coarsest prediction system (Fig. S5f–o), where both the ACC of HIST and the ResCorr show broadly consistent patterns. Figure S8 shows that the median ResCorr differences obtained when subsampling the ensembles are generally close to zero and non-significant across Europe. This indicates that the added value of initialization identified in Fig. 1k–o is largely insensitive to the unequal ensemble sizes of the prediction systems. However, accounting for the positive bias associated with the finite size of the HIST ensembles substantially reduces ResCorr, particularly for the annual mean, MAM and JJA (Fig. S8f–j), indicating that the standard ResCorr may overestimate the added value of initialization. Nevertheless, the bias-corrected ResCorr is also subject to considerable uncertainty. The correction requires splitting the already small HIST ensembles into two independent subsets, including only one member per subset (1+1) for MPI-ESM1.2-HR. The relatively large standard deviation (Fig. S8k–o), particularly in MAM and JJA, reflects this uncertainty. Therefore, both the standard and bias-corrected ResCorr estimates should be interpreted with caution.
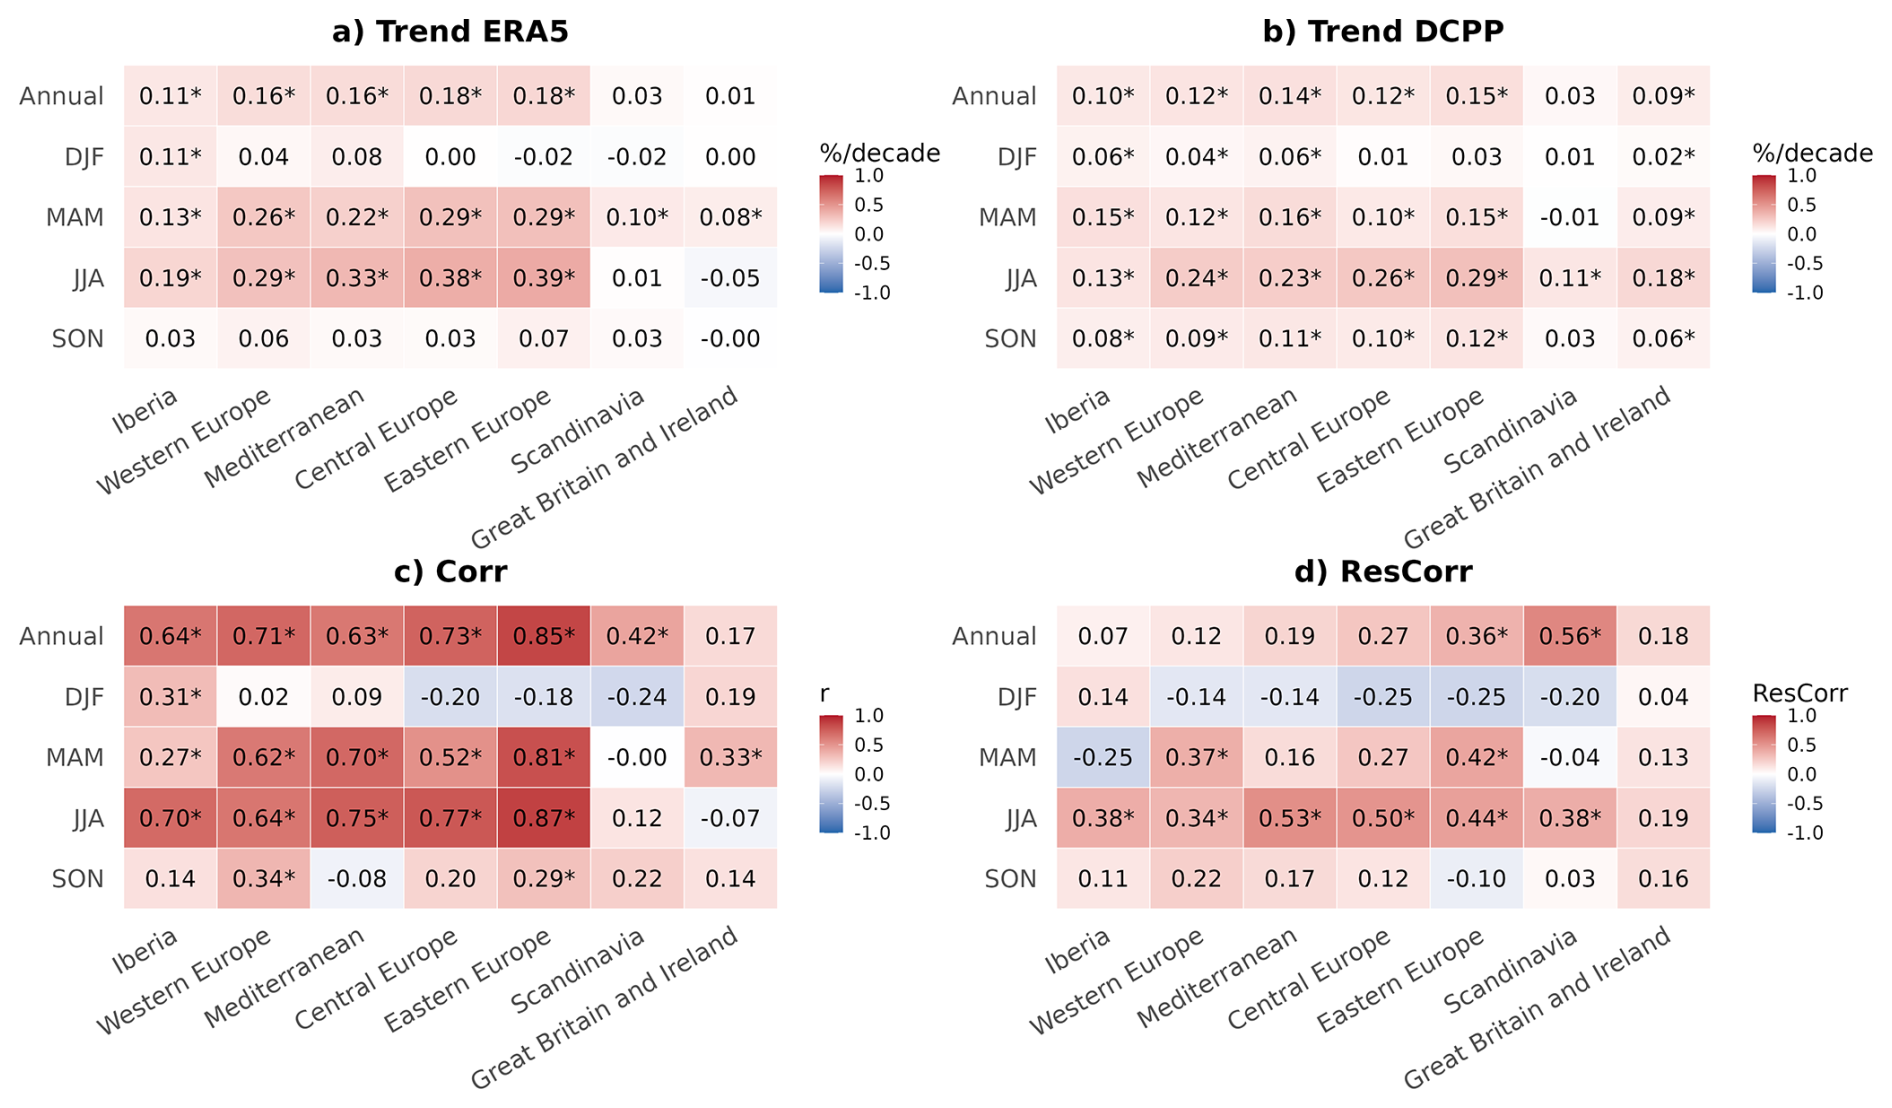
Figure 2PVpot trends derived from ERA5 for 1961–2019 using a three-year rolling mean (a) and from DCPP for the start dates 1960–2016 over forecast years 1–3 (b), the correlation between ERA5 and DCPP (c), and the ResCorr between DCPP and ERA5 relative to HIST (d), shown for the annual mean and each season across the seven European sub-regions (Fig. S4). Statistically significant trends, correlations and ResCorr values at the 95 % confidence level are marked with an asterisk.
Figure 2 summarizes the regional behaviour of PVpot long-term trends across the seven European sub-regions (Fig. S4), showing ERA5 trends (a), DCPP trends (b), their correlations (c), and their ResCorr relative to HIST (d) for the annual mean and each season. For Iberia, Western Europe, the Mediterranean, Central Europe and Eastern Europe, ERA5 and DCPP generally show positive significant trends in the annual mean, MAM and JJA, resulting in significant positive correlations. In contrast, correlations are mostly weak and non-significant in DJF and SON, when observed trends are small or absent. Scandinavia and Great Britain and Ireland exhibit little skill overall, with significant correlations only in a few cases. ResCorr values are generally positive where correlations are significant, particularly in JJA and over Western and Eastern Europe during MAM, and in Eastern Europe and Scandinavia during annual mean, indicating that initialization contributes additional skill beyond the common trend signal. Overall, PVpot skill is closely linked to the ability of DCPP to reproduce the observed long-term trends.
PVpot trends follow similar patterns to those from RSDS (Fig. S9a–b) for both ERA5 and DCPP, showing again that the variable is the main driver of the indicator. TAS trends (Fig. S9c–d) are significantly positive in all the seasons and regions for both datasets, but these trends are not aligned with the PVpot trends.
The strong contribution of long-term trends to significant skill has been identified in several studies for decadal predictions (Meehl et al., 2009; Suckling et al., 2017) and historical simulations (Donat et al., 2023). Some studies have applied approaches to reduce model drift or systematic errors (Kharin et al., 2012), and others have shown that the skill of TAS is substantially reduced after removing the forced trend, whereas precipitation skill is less affected (Bellucci et al., 2015; Delgado-Torres et al., 2022). However, removing the trend may also influence forecast reliability and modify the balance between externally forced and internally driven variability (Corti et al., 2012; Smith et al., 2012). Rather than adopting a single approach, we explicitly present both perspectives. The ACC quantifies the total predictive skill, including the contribution from externally forced trends, which are themselves relevant for decision-making in a climate services context (Donat et al., 2023; Vaughan and Dessai, 2014; Delgado-Torres et al., 2025). The ResCorr isolates the added value of initialization beyond the historical simulations, providing insight into climate variations not captured by the historical simulations. Together, these two metrics offer a more complete assessment of decadal prediction performance for energy-relevant indicators.
The predominantly positive PVpot trends over southern and central Europe are consistent with recent historical analyses. Segado-Moreno et al. (2026) have reported weak to positive RSDS trends over southern and central Europe when comparing observations from 1994–2004 and 2004–2023, in line with the patterns found here for the longer period 1961–2019. By contrast, studies focusing on future climate change suggest different responses, with projected decreases over northern Europe and weaker or near-neutral changes in the south (Jerez et al., 2015; Hou et al., 2021). Although these future-oriented results are not directly comparable to the present analysis, they provide context suggesting that the positive PVpot trends identified here over southern Europe are consistent with behaviours projected to strengthen in the future, whereas the future negative signals over northern Europe are not yet clearly expressed in the historical record.
4.2 Wind energy capacity factor (WCF)
Figure 3a–e shows the ACC of WCF between DCPP and ERA5 for the annual mean and each season. Overall, the percentage of grid points with significant skill is low across Europe, with the highest values in JJA (Fig. 3d), followed by the annual mean (Fig. 3a) and MAM (Fig. 3c). Eastern Europe consistently exhibits high skill, although the spatial patterns vary seasonally. In the annual mean, DJF and MAM (Fig. 3a–c), significant positive skill is present over parts of southern France, and over Iberia in DJF. In MAM, northern Germany and northern Poland also show areas of significant skill. In JJA, skill extends across much of central Europe, whereas in SON (Fig. 3e) it is limited to parts of Poland and the Baltics. These regions of significant skill are also present in the coarsest-resolution results (Fig. S10a–e).
Figure S11 shows the climatology (Fig. S11a–e) and multiannual standard deviation (Fig. S11f–j) of WCF for the annual and seasonal means. The climatological patterns reflect the distribution of wind resources over Europe, with higher WCF values over northern Europe and lower values over southern and Mediterranean regions, together with a clear seasonal cycle (Bett and Thornton, 2016) and higher values offshore than onshore. Unlike PVpot, WCF exhibits a non-negligible multiannual standard deviation, with the largest values (up to 5–6 percentage points) occurring mainly in DJF and over northern Europe, reflecting stronger year-to-year wind variability. This reflects the intrinsically high variability of wind and the non-linear turbine power curve, which translates wind fluctuations into larger variations in WCF.
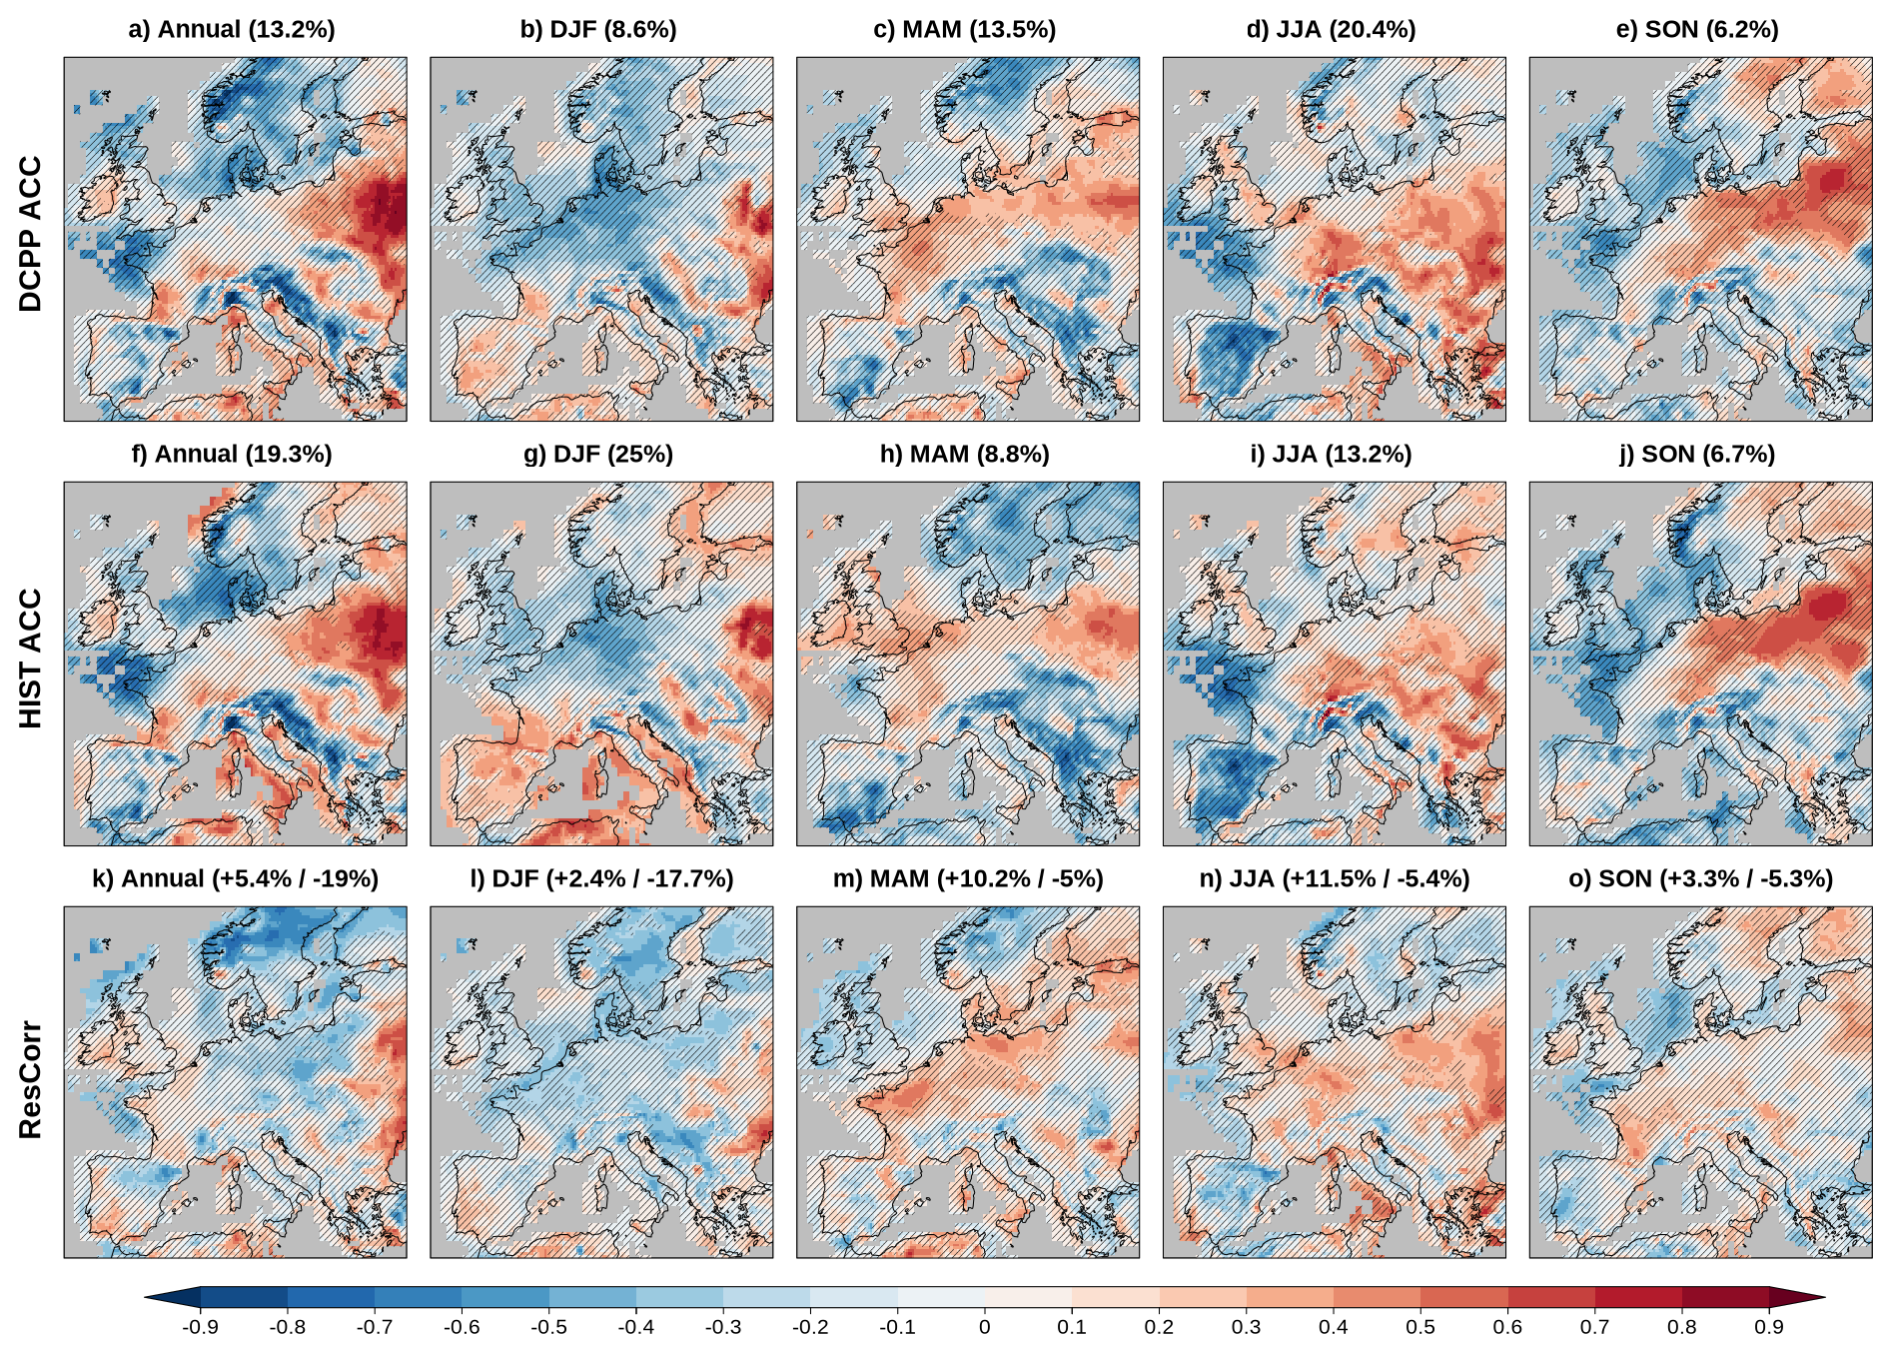
Figure 3First row: ACC between DCPP and ERA5 for WCF for the annual mean (a) and seasonal means (b–e) for forecast years 1–3. Second row: ACC between HIST and ERA5 for the annual mean (f) and seasonal means (g–j). The percentages of significant grid points are indicated in brackets, and hatched regions denote non-significant correlations. Third row: ResCorr between DCPP and ERA5 relative to HIST for the annual mean (k) and seasonal means (l–o). Percentages indicate the fractions of significantly positive (red) and significantly negative (blue) values. Positive (negative) ResCorr indicates higher (lower) skill for DCPP compared to HIST. Correlations are computed against ERA5 during the 1961–2019 period. ACC significance is assessed using a one-sided t-test at the 95 % confidence level, accounting for time-series autocorrelation, while ResCorr significance is assessed using a two-sided t-test with effective degrees of freedom to account for temporal autocorrelation.
The spatial distribution and the percentage of significant grid points for WCF closely resemble those obtained for SFCWIND (Fig. S7k–o), with only minor higher values for WCF. This similarity is expected as wind speed is the main driver of WCF.
Low predictive skill for wind-related variables is physically expected given the intrinsic characteristics of atmospheric circulation. Climate predictability partly depends on the nature and variability of the variable considered (Alizadeh, 2022). Variables that are strongly constrained by large-scale energy balances and evolve more slowly, such as TAS and RSDS, tend to be more predictable (Trenberth et al., 2009). In contrast, variables with higher variability and stronger dependence on regional and synoptic processes, such as SFCWIND or precipitation (PR), generally exhibit larger uncertainty (Gettelman and Rood, 2016; Slingo and Palmer, 2011). This behaviour is consistent with previous studies showing comparatively higher skill for decadal predictions for TAS than for PR (e.g. Smith et al., 2019; Delgado-Torres et al., 2022; Moreno-Montes et al., 2026).
Previous studies have examined the predictability of wind-related indicators for decadal predictions over Europe. Haas et al. (2015) and Moemken et al. (2016) have reported significant skill for regional peak winds and wind energy output (Eout) over central Europe, particularly for annual means and short lead times, using a statistical–dynamical downscaling approach applied to a single model. However, these results are not directly comparable to the present assessment of WCF, which relies on a simpler statistical downscaling approach based on interpolation and calibration, and on a different wind-energy metric. More recently, Hutchins et al. (2025) have reported limited and spatially heterogeneous skill for surface wind over Europe, with significant predictability mainly confined to parts of central and eastern Europe, consistent with the patterns identified here.
The ACC between HIST and ERA5 is shown in Fig. 3f–j, while the impact of initialization is assessed through the ResCorr in Fig. 3k–o. HIST exhibits a higher percentage of significantly positive grid points than DCPP in DJF (Fig. 3g), particularly over Mediterranean regions. In contrast, the percentage of significantly positive grid points is slightly lower for HIST than for DCPP in MAM and JJA (Fig. 3h–i). The ResCorr indicates that initialization enhances skill over eastern Europe in the annual mean (Fig. 3k), over northern Germany and western France in MAM (Fig. 3m), and over eastern Europe in JJA (Fig. 3n). Outside these regions, ResCorr values are generally weak and spatially incoherent. Similar conclusions are obtained at the native resolution of the coarsest prediction system (Fig. S10f–o), which shows the same large-scale patterns, supporting the robustness of these results. Figure S12 further shows that the ResCorr patterns are largely insensitive to ensemble size, with generally small and non-significant differences across Europe. Accounting for the finite size of the HIST ensembles modifies ResCorr locally but generally preserves its weak and spatially heterogeneous character (Fig. S12f–j).
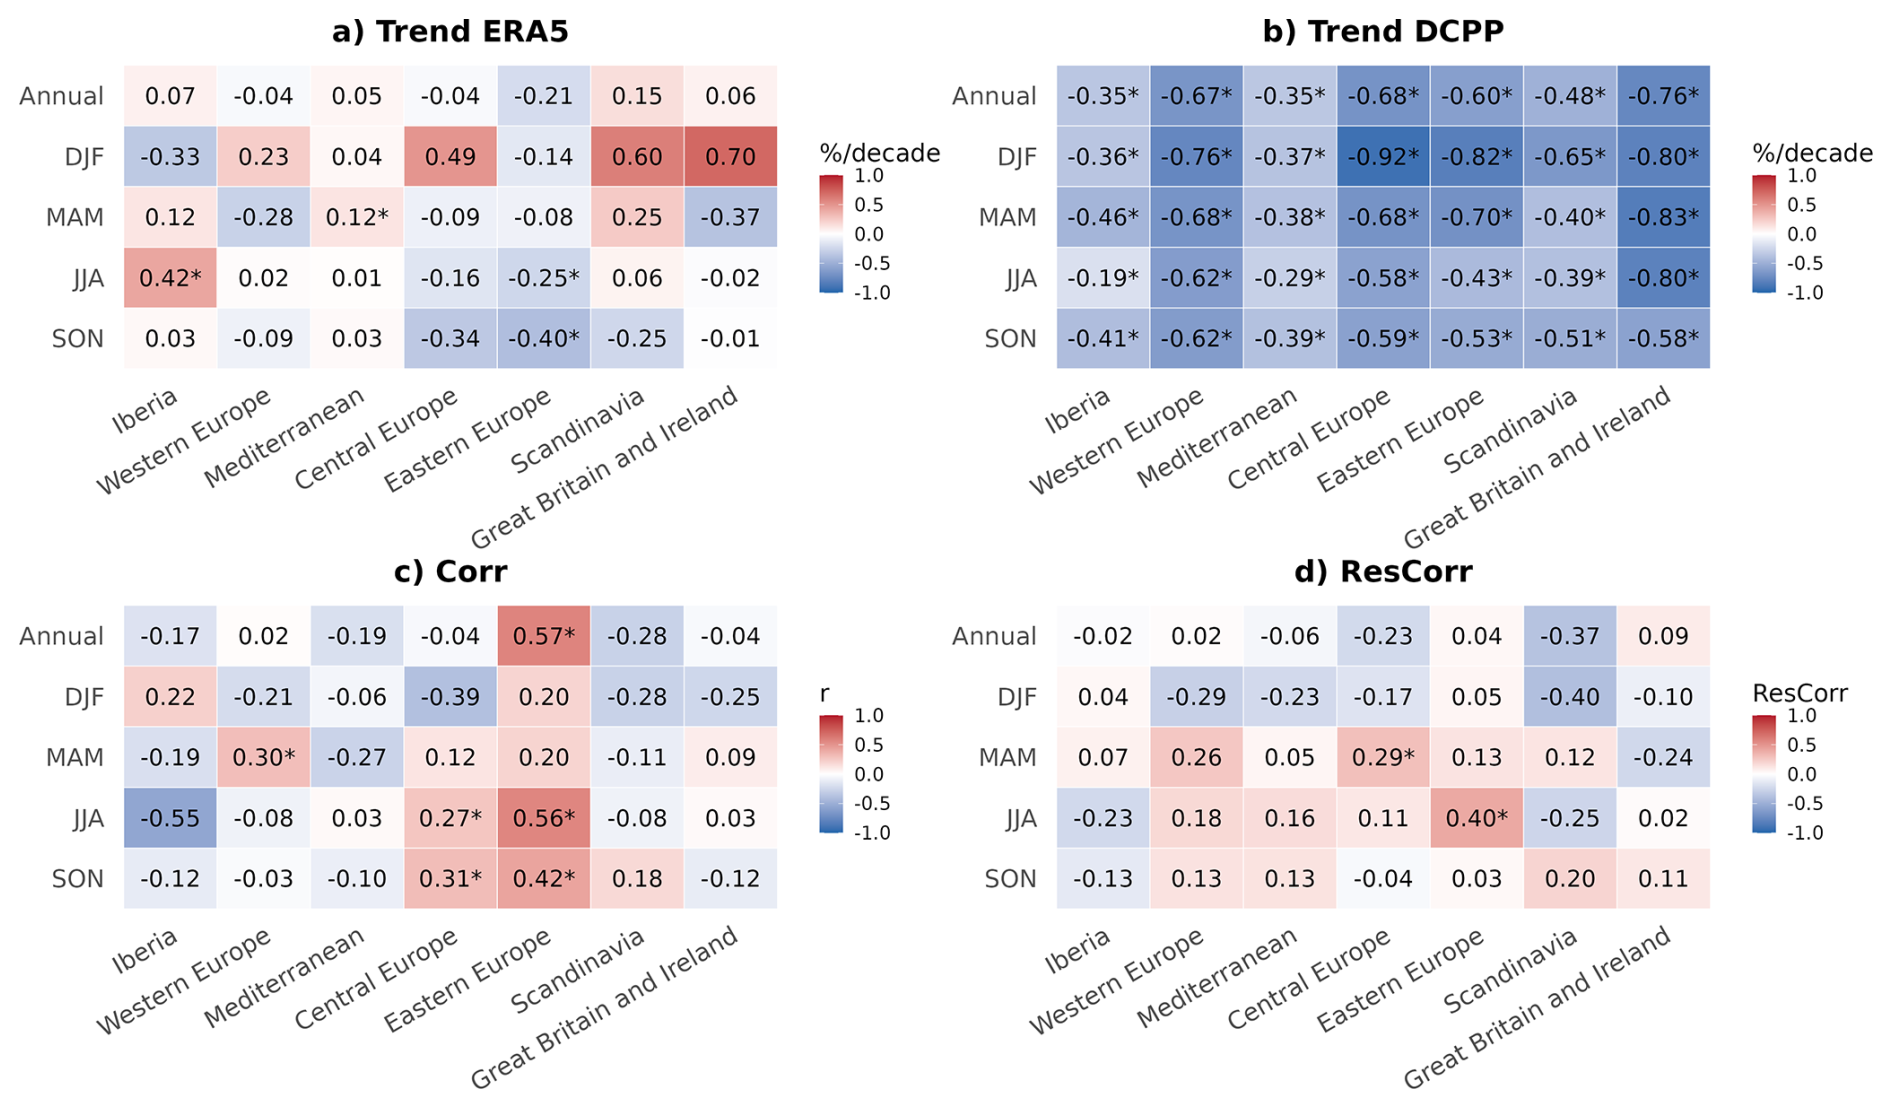
Figure 4WCF trends derived from ERA5 for 1961–2019 using a three-year rolling mean (a) and from DCPP for the start dates 1960–2016 over forecast years 1–3 (b), the correlation between ERA5 and DCPP (c), and the ResCorr between DCPP and ERA5 relative to HIST (d), shown for the annual mean and each season across the seven European sub-regions (Fig. S4). Statistically significant trends, correlations and ResCorr values at the 95 % confidence level are marked with an asterisk.
Applying the same regionalization used for PVpot, regional trends of WCF differ markedly between ERA5 and the DCPP (Fig. 4a–b). ERA5 shows no uniform behaviour, with both significantly positive and negative trends depending on region and season, whereas the DCPP exhibits predominantly significant negative trends across all regions and seasons. WCF trends follow similar patterns to those of SFCWIND (Fig. S9e–f) for both ERA5 and the DCPP.
Consequently, regional correlations between ERA5 and the DCPP (Fig. 4c) are significantly positive mainly where both datasets display coherent negative trends. This is most evident in Eastern Europe, with significant correlations for the annual mean, JJA and SON, and weaker agreement in DJF and MAM, consistent with the regions showing skill in Fig. 3. Similar behaviour appears in Central Europe in JJA and SON, with additional agreement in Western Europe in MAM and weaker in Iberia in DJF. Elsewhere, differences in trend sign or magnitude lead to weak or negative correlations. Overall, these results emphasize the key role of trend consistency in explaining regional skill.
ResCorr regional values (Fig. 4d) are generally non-significant, with a few isolated exceptions. A significantly positive ResCorr appears in Eastern Europe in JJA, aligned with the agreement in negative trends between ERA5 and the DCPP (Fig. 4a–b) and the significantly positive correlation in Fig. 4c. In addition, ResCorr is significantly positive in Central Europe in MAM; however, this signal is driven by localized positive values (Fig. 3h) and may be influenced by sampling variability. Other regions show non-significant but positive ResCorr values, suggesting local improvements due to initialization. In regions with weak or negative correlations, however, they mainly reflect a reduction in negative skill rather than a transition to meaningful predictive skill.
The WCF trends found are consistent with signals reported in previous studies. Using CMIP6 historical simulations, Miao et al. (2023) identified negative historical wind speed trends over Europe across a broad CMIP6 ensemble, including the three CMIP6 models analysed in the present study. Similarly, Pryor and Barthelmie (2010), analysing future climate scenarios, reported a projected weakening of near-surface winds over Europe, particularly towards the late 21st century. Although these projections are not directly comparable with the present analysis, they point to a tendency towards declining wind resources that may already be weakly emerging in current conditions. Observational and reanalysis-based studies (e.g. Vautard et al., 2010; Torralba et al., 2017a) have reported spatially heterogeneous near-surface wind trends across Europe. Our results are broadly consistent in showing negative trends over central and eastern Europe and weak signals over southern regions. However, differences remain over northern Europe and the British Isles, where these previous studies reported neutral or negative trends while positive trends are found here, likely due to differences in datasets, periods and methodologies. Together, these studies, based on different datasets and periods, indicate that declining wind signals have been reported in both modelling and observational contexts, while also highlighting the substantial uncertainty in the magnitude and spatial structure of historical wind changes.
4.3 Number of energy droughts (NED)
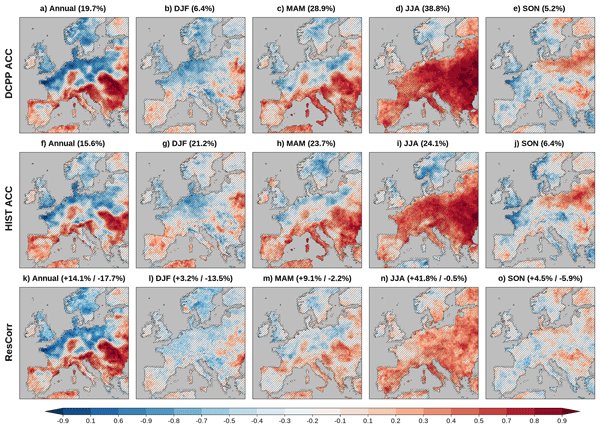
Figure 5a–e shows the ACC between DCPP and ERA5 of NED. The highest fraction of significant ACC values occurs in JJA (Fig. 5d), when most of eastern Europe and parts of central Europe and Iberia exhibit significant skill. The annual mean (Fig. 5a) and MAM (Fig. 5c) also show significant values over parts of eastern Europe and Iberia. In SON (Fig. 5e), skill is generally weak and confined to parts of eastern Europe and the Baltics. Overall, the skill patterns are broadly consistent with those obtained at the coarsest resolution (Fig. S13a–e).
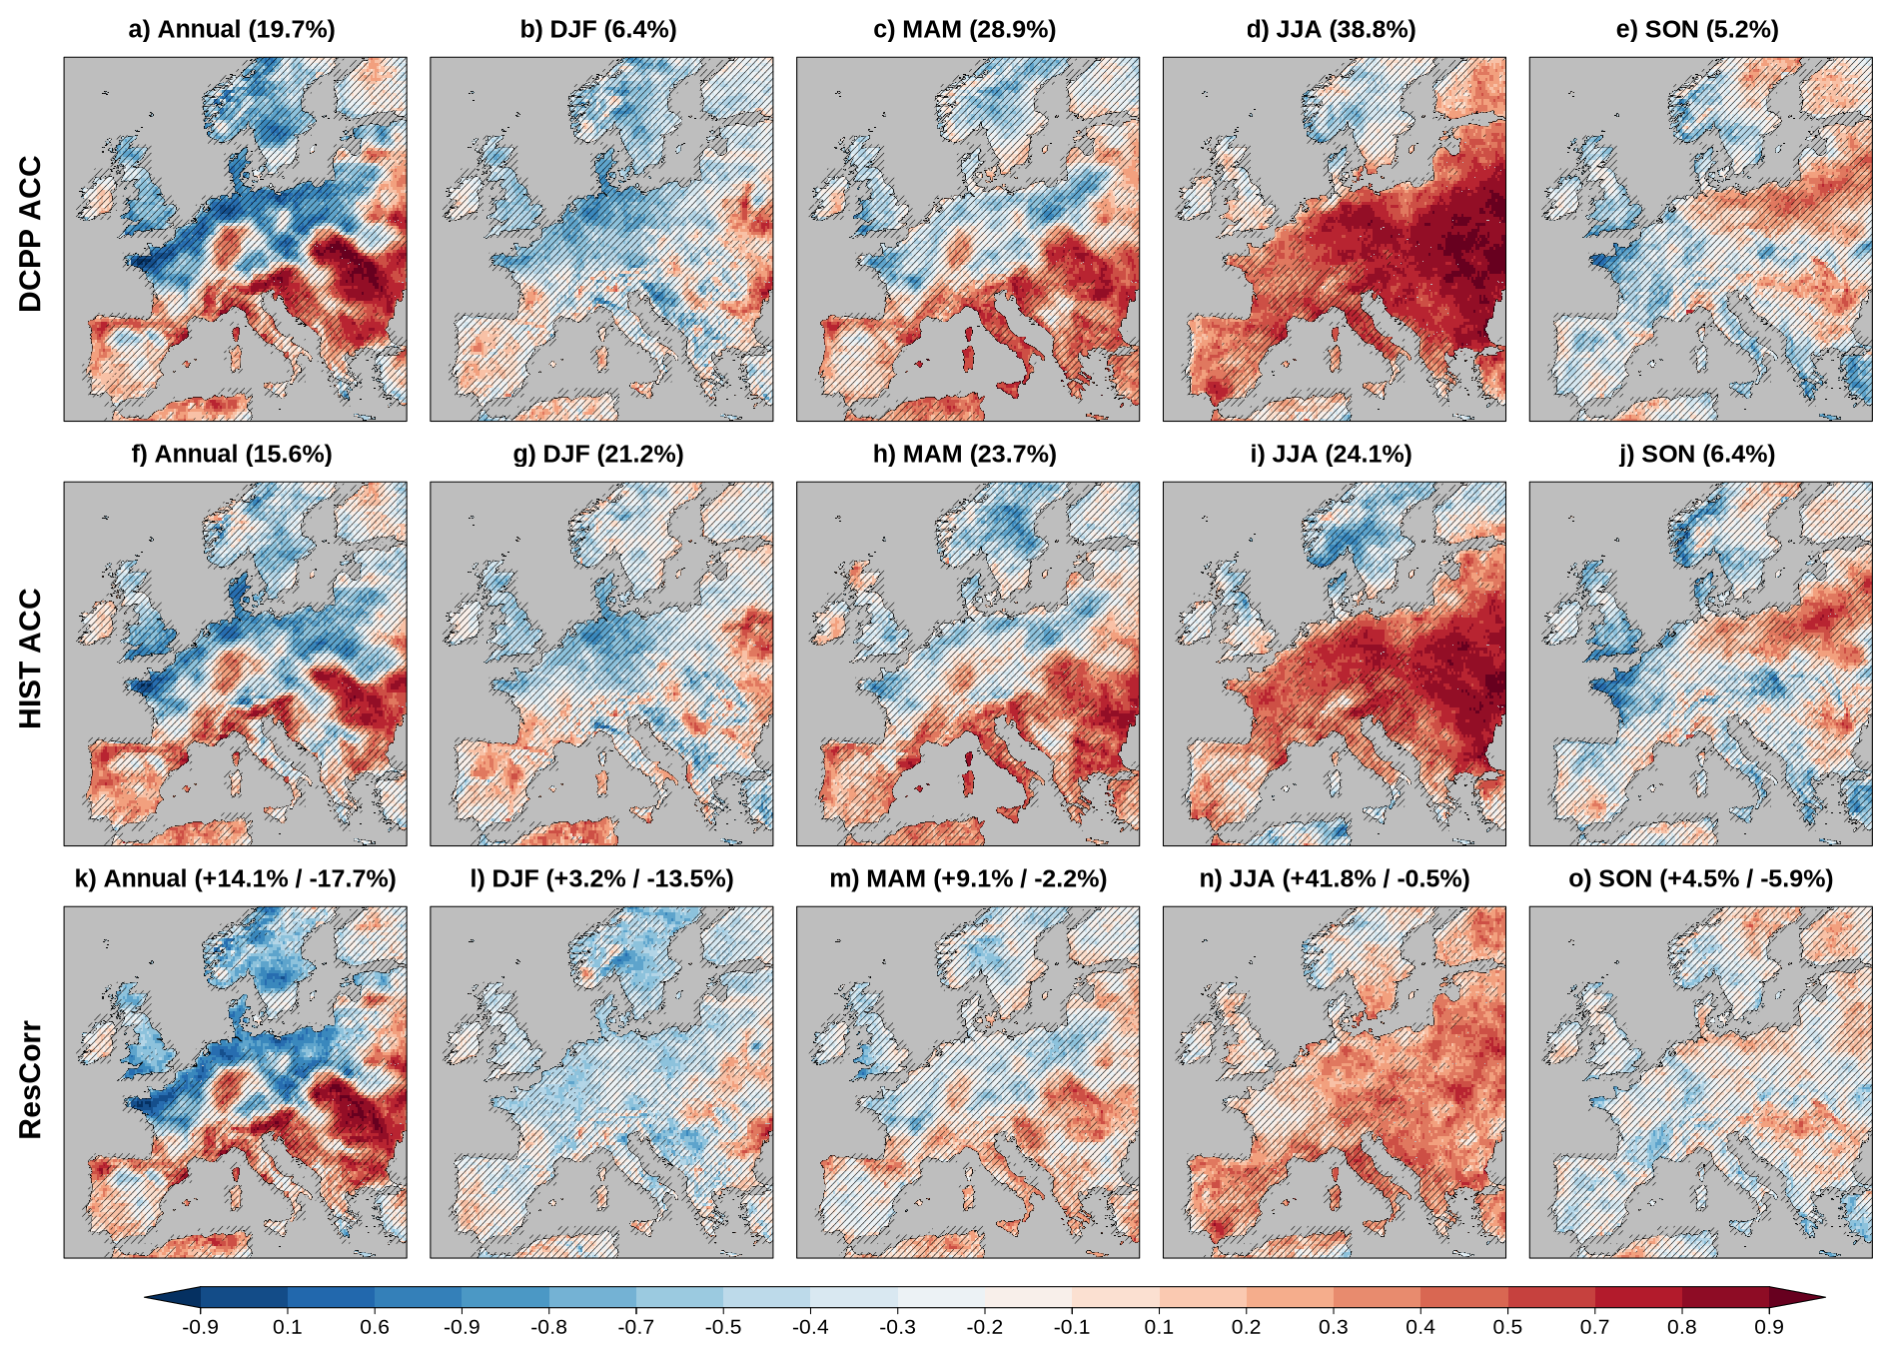
Figure 5First row: ACC between DCPP and ERA5 for NED for the annual mean (a) and seasonal means (b–e) for forecast years 1–3. Second row: ACC between HIST and ERA5 for the annual mean (f) and seasonal means (g–j). The percentages of significant grid points are indicated in brackets, and hatched regions denote non-significant correlations. Third row: ResCorr between DCPP and ERA5 relative to HIST for the annual mean (k) and seasonal means (l–o). Percentages indicate the fractions of significantly positive (red) and significantly negative (blue) values. Positive (negative) ResCorr indicates higher (lower) skill for DCPP compared to HIST. Correlations are computed against ERA5 during the 1961–2019 period. ACC significance is assessed using a one-sided t-test at the 95 % confidence level, accounting for time-series autocorrelation, while ResCorr significance is assessed using a two-sided t-test with effective degrees of freedom to account for temporal autocorrelation.
Figure S14 presents the corresponding ACC for solar-Neff (Fig. S14a–e) and wind-Neff (Fig. S14f–j). The skill patterns of solar-Neff closely resemble those of PVpot (Fig. 1a–e), while wind-Neff shows patterns similar to those of WCF (Fig. 3a–e). Consequently, the spatial distribution of NED skill reflects the seasonally varying contribution of solar- and wind-related conditions. For the annual mean (Fig. 5a), significant NED skill over parts of eastern Europe and Iberia broadly coincides with regions where both solar-Neff (Fig. S14a) and wind-Neff (Fig. S14f) show positive skill. Over parts of southeastern Europe, including the Carpathian region and Greece, localized NED skill is more consistent with solar-Neff than with wind-Neff. In MAM (Fig. 5c), NED skill over southern Europe generally follows the solar-Neff signal, although NED remains non-significant in several regions where solar-Neff shows skill. During JJA (Fig. 5d), the widespread NED skill closely resembles the solar-Neff pattern, with lower values over parts of western Europe. Over most of Europe in DJF and in northern regions in SON, as solar-Neff remains close to zero (Fig. S16b, e), ACC cannot be computed (Fig. S14b, e) and NED ACC is primarily determined by wind-Neff (Fig. S14g, j). In SON, outside these regions, the weak NED skill is more consistent with wind-Neff (Fig. S14j), although some contribution from solar-Neff (Fig. S14e) is also apparent.
To provide context for these skill patterns, Fig. S15 shows the climatology and multiannual standard deviation of NED, while Fig. S16 shows the climatology of solar-Neff (Fig. S16a–e) and wind-Neff (Fig. S16f–j). NED is generally highest in DJF (Fig. S15b) and SON (Fig. S15e) and lowest in JJA (Fig. S15d), reflecting the strong seasonal cycle of solar-Neff (Fig. S16b, d, e). Spatially, higher NED values are found in mountainous regions and, during summer, over northern Europe. Wind-Neff is consistently low over mountainous areas and largely explains several regional NED features, while solar-Neff mainly follows a latitudinal gradient. The largest NED variability occurs in DJF (Fig. S15g), in central and eastern Europe in JJA (Fig. S15i) and in some regions of northern Europe in SON (Fig. S15j).
The relatively high climatological values of the NED indicator mainly reflect the use of fixed, efficiency-based thresholds to define effective energy production. Previous studies have analyzed compound energy droughts using percentile-based metrics (e.g. Otero et al., 2022), which characterise relative extremes within each region. Despite these different definitions, the main seasonal patterns they report of higher drought frequencies in winter over southern Europe and in summer over northern regions are broadly consistent with our results. Here, fixed thresholds motivated by operational efficiency are adopted, an approach used in previous studies like Richardson et al. (2023). In our case, the prior calibration of all climate variables against ERA5 reduces systematic biases relative to the observational reference, including biases in mean values and variability. This helps avoid artificial shifts in the frequency of threshold exceedances caused by biases in the raw model data.
The ACC obtained with HIST is shown in Fig. 5f–j, while the impact of initialization is assessed through ResCorr (Fig. 5k–o). Overall, HIST reproduces the main spatial patterns found in DCPP, although the relative skill varies by season. HIST shows a slightly lower percentage of significantly positive grid points than DCPP in MAM (Fig. 5h) and particularly in JJA (Fig. 5i), whereas this percentage is higher for HIST in DJF (Fig. 5g). JJA (Fig. 5n) exhibits widespread positive ResCorr values across central, southern and eastern Europe, consistent with the substantially larger fraction of significant ACC values in DCPP (38.8 %) than in HIST (24.1 %). ResCorr values are generally weak and spatially heterogeneous in the rest of the seasons. Similar conclusions are obtained at the native resolution of the coarsest prediction system (Fig. S13f–o), with broadly consistent HIST ACC and ResCorr patterns. The main exception is DJF (Fig. S13g), where HIST exhibits substantially fewer significant ACC values at the coarser resolution. This suggests that part of the additional skill identified in the high-resolution results during this season may reflect spatial noise rather than robust large-scale predictability. Figure S17 shows that the ResCorr differences obtained when subsampling the ensembles are generally close to zero and non-significant across Europe, indicating that the NED results are largely insensitive to the unequal ensemble sizes of the prediction systems. Accounting for the finite size of the HIST ensembles substantially reduces some of the strongest ResCorr patterns, particularly for JJA (Fig. S17i). The uncertainty of this correction is also relatively high (Fig. S17n), indicating that the magnitude of the finite-ensemble correction should be interpreted with caution.
Figure 6 shows the regional trends of NED for ERA5 (a), for the DCPP (b), the corresponding correlations (c), and the ResCorr (d) across the seven sub-regions defined above. In some regions and seasons, ERA5 and DCPP exhibit similar trends, while in others they show opposite signs. In JJA, Iberia, Western Europe, Mediterranean, Central and Eastern Europe display significant negative trends in both datasets, which results in significantly positive correlations (Fig. 6c). A similar behaviour is found for the annual mean and MAM in Iberia, Western Europe and Mediterranean. In the remaining regions and seasons, ERA5 and DCPP trends generally differ in sign, typically negative in ERA5 and positive in the DCPP, resulting in correlations that are weak or negative.
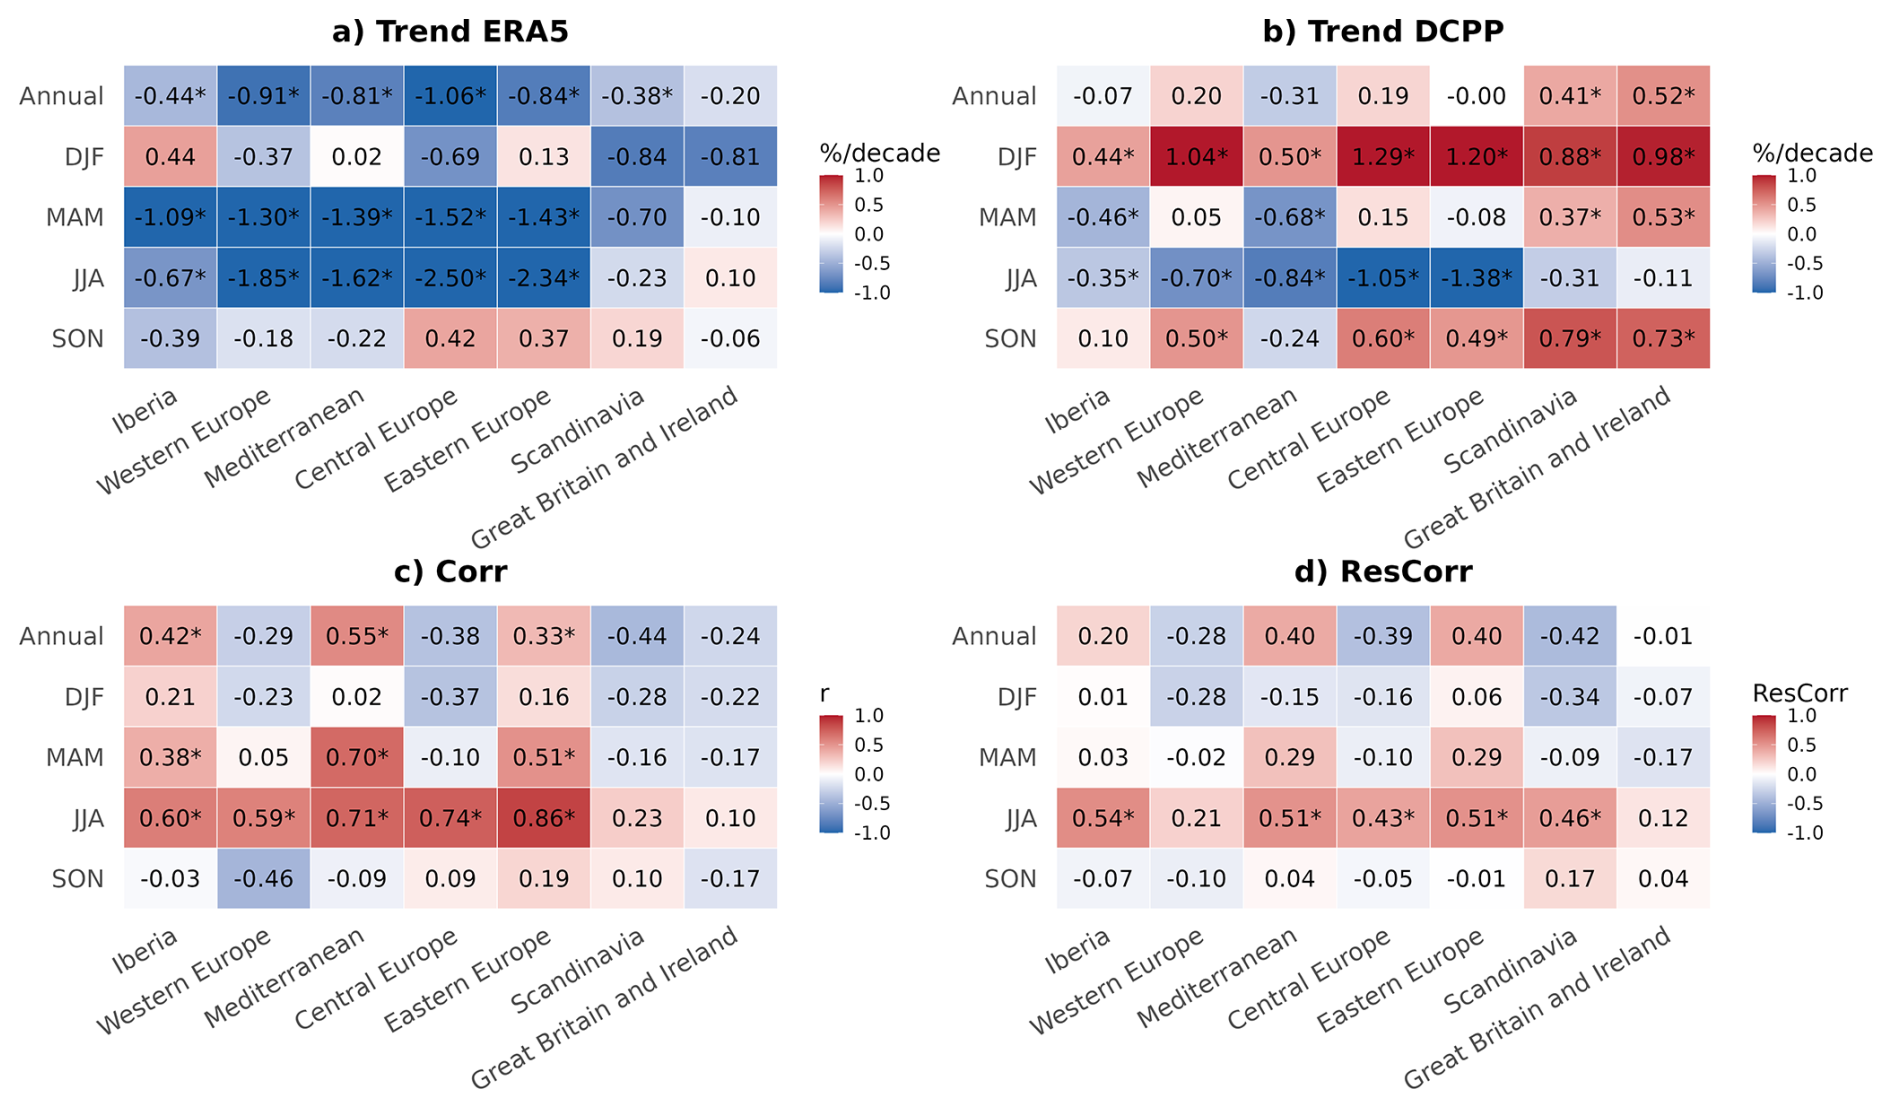
Figure 6NED trends derived from ERA5 for 1961–2019 using a three-year rolling mean (a) and from DCPP for the start dates 1960–2016 over forecast years 1–3 (b), the correlation between ERA5 and DCPP (c), and the ResCorr between DCPP and ERA5 relative to HIST (d), shown for the annual mean and each season across the seven European sub-regions (Fig. S4). Statistically significant trends, correlations and ResCorr values at the 95 % confidence level are marked with an asterisk.
ResCorr (Fig. 6d) partly mirrors the correlation patterns shown in Fig. 6c. Regions and seasons with significantly positive ResCorr values (notably Iberia, Mediterranean, Central and Eastern Europe in JJA) or high but not significant ones (Mediterranean and Eastern Europe in the annual mean) generally correspond to cases where correlations are also significantly positive. This indicates that, in these cases, initialization enhances skill beyond the externally forced signal already contributing to the correlation. However, there are also cases with significantly positive correlations but low or negative ResCorr values (e.g. Iberia in MAM and the annual mean). In these situations, the agreement in trends between ERA5 and the DCPP explains most of the skill, while initialization adds little or even decreases predictive value.
To better understand the contribution of solar-Neff and wind-Neff to NED variability and trends, solar-Neff and wind-Neff trends are analysed separately (Fig. S18). The results show a clear seasonal dependence. In JJA, the strong negative NED trends in both ERA5 and DCPP are primarily associated with marked increases in solar-Neff (Fig. S18a–b), while wind-Neff changes are weaker (Fig. S18c–d). In MAM, solar-Neff also drives NED trends in ERA5, although with smaller magnitude, whereas in DCPP this signal is less clear due to strong negative trends in wind-Neff. In DJF, solar-Neff shows negligible variability over most regions, and NED trends are therefore directly anticorrelated with wind-Neff. In SON, both components exhibit mixed signals in ERA5, while in DCPP negative wind-Neff trends tend to dominate, leading to positive NED trends. In the annual means, the strong negative trends in NED in ERA5 seem to be dominated by positive solar-Neff trends, while the mixed DCPP signals are influenced by both energy sources.
The negative NED trends identified in ERA5 for the recent past are consistent with the ERA5-based analysis of Meng et al. (2025), who have reported a decrease in the frequency of renewable energy droughts under present-day conditions, despite differences in indicator definition. Additionally, DCPP trends show some qualitative similarities with the future evolution of energy droughts projected by Kapica et al. (2024), particularly in MAM and over parts of northern and eastern Europe in DJF. However, Kapica et al. (2024) have used a percentile-based definition of droughts, whereas the NED metric employed here is based on fixed physically motivated thresholds. The comparison is therefore limited to broad spatial patterns, and important regional differences remain, particularly in SON.
The renewable energy sector is strongly influenced by variability and long-term changes in key climate variables such as temperature, solar radiation and wind speed. However, the intermediate timescale of the coming years remains comparatively underexplored, and there is a clear need for tailored climate information to bridge the gap between decadal prediction advances and their application in renewable energy planning.
This study evaluates the predictive skill of a multi-model ensemble of decadal predictions (DCPP) for energy-relevant indicators over Europe, focusing on photovoltaic potential (PVpot), wind capacity factor (WCF), and the compound indicator number of energy droughts (NED) for forecast years 1–3. Skill is assessed using the ACC between the DCPP and ERA5, and the impact of model initialization is estimated with the ResCorr relative to historical simulations. In addition to grid-point analyses, sub-regional mean trends and correlations are examined to explore the relationship between long-term changes and predictive skill.
PVpot shows the highest and most spatially coherent skill among the indicators analyzed. Skill is significantly positive over large parts of the region at the annual scale and during MAM and JJA, while it is weaker and more spatially limited in DJF and SON. The spatial and seasonal patterns of PVpot skill closely follow those of surface downwelling shortwave radiation (RSDS), its main driver. PVpot skill is slightly lower than RSDS skill because the indicator is also modulated by near-surface air temperature (TAS) and surface wind speed (SFCWIND), which act as secondary constraints on predictability.
Initialization enhances PVpot skill in the annual mean and particularly in JJA, mainly by strengthening regions that already exhibit skill in the multi-model ensemble of historical simulations (HIST). In DJF and SON, the added value of initialization is limited and spatially heterogeneous, with localized improvements and degradations.
WCF exhibits lower and more spatially heterogeneous skill than PVpot, reflecting the higher intrinsic variability of wind and its strong sensitivity to synoptic-scale circulation. Significant skill is consistently found over parts of eastern Europe across seasons, while other regions show weaker and more seasonally dependent skill, including central Europe in JJA and northern Europe in MAM and SON. The spatial distribution of WCF skill closely mirrors that of SFCWIND, confirming wind variability as the primary control on WCF predictability.
The impact of initialization is regionally dependent and generally limited. The clearest skill enhancements are found in JJA over parts of eastern Europe, while in other seasons the impact of initialization is weaker and spatially heterogeneous. As for PVpot, initialization mainly improves skill where historical simulations already show some skill. The generally low WCF skill is consistent with the weak agreement between ERA5 and DCPP trends in many regions and seasons, together with the high intrinsic variability of wind.
The compound indicator NED displays predictability characteristics that reflect the combined influence of solar and wind resources. NED skill is highest in JJA, followed by the annual mean and MAM, and is generally limited in DJF and SON. NED predictability does not require simultaneous skill in both components: in some regions it emerges where both solar-Neff and wind-Neff are predictable, while in others it is dominated by a single source. This highlights the importance of considering the relative contribution of both resources when assessing compound energy drought predictability.
Seasonal differences in NED skill reflect the relative contribution of wind and solar components. In JJA, NED predictability is mainly driven by solar-Neff. In DJF, variability over much of Europe is largely driven by wind conditions, while in MAM and SON the relative contribution of both components varies regionally. As a result, the impact of initialization on NED is also seasonally dependent, enhancing skill when the dominant energy source is predictable, while providing little added value otherwise. This is consistent with the broader finding that initialization generally enhances existing predictability rather than creating skill where historical simulations show none. These results demonstrate the potential of decadal predictions to provide actionable information for anticipating energy droughts, although forecast quality remains strongly dependent on season and region.
By evaluating compound energy indicators, explicitly separating total skill from the added value of initialization, and analysing results at the regional scale, this study advances beyond variable-based assessments and provides a more application-oriented understanding of decadal predictability for renewable energy. These findings highlight both the potential and the limitations of decadal predictions for energy-related applications and underscore the need to clearly communicate where and when such information is reliable. In addition, the main conclusions were robust across spatial resolutions, and the ResCorr results were largely insensitive to differences in ensemble size between DCPP and HIST. However, the finite size of the HIST ensembles represents an additional source of uncertainty in ResCorr. Accounting for this finite-ensemble bias generally reduces positive ResCorr values, indicating that the standard estimate may overestimate the added value of initialization in some regions. Nevertheless, the bias correction itself is uncertain due to the small number of members available in each ensemble partition, as reflected by the relatively large standard deviation across partitions. Therefore, the standard and bias-corrected ResCorr estimates should be interpreted with caution.
Several limitations should be noted. ERA5 is the only reference dataset used, and reanalysis uncertainties, especially for wind, may affect skill estimates. However, ERA5 has been identified as one of the most reliable reanalysis datasets for near-surface wind variability, particularly in terms of correlation with observations and representation of temporal variability at turbine-relevant heights (Ramon et al., 2019), and the Global Wind Atlas has been used to correct it for a more accurate representation. Secondly, the higher resolution obtained through statistical downscaling does not necessarily imply additional local-scale predictability, particularly where relevant processes are not resolved by the original models, such as wind variability in regions with complex orography. This limitation should be considered when interpreting downscaled information for local-scale energy applications. Thirdly, fixed, efficiency-based thresholds, although operationally motivated, may limit sensitivity and transferability across regions or technologies. Moreover, temporal aggregation choices influence the indicators, particularly for wind, given the finer temporal resolution of turbine power curves. In addition, the power-law extrapolation used to estimate 100 m wind speeds assumes neutral stability and may be less representative under non-neutral atmospheric conditions, which could affect the reliability of local-scale decadal predictions. Finally, the ACC and ResCorr metrics capture correlation-based skill but do not fully describe other aspects relevant for operational decision-making, such as reliability or the representation of extreme events. Other metrics might be selected depending on the climate forecast products required by the energy users.
Future work could assess how sensitive the indicators are to the choice of thresholds (e.g. different RSDS or WCF limits), and compare results using alternative reanalyses or observation-based datasets. The framework could also be extended to include electricity demand, which would allow a more comprehensive assessment of supply–demand imbalances and increase the relevance of the indicators for system operators and energy planners. Furthermore, as decadal prediction systems are known to be affected by signal-to-noise problems (Scaife and Smith, 2018), future studies could further investigate the impact of signal-to-noise characteristics of the calibrated ensemble or apply correction methods such as the NAO-matching proposed by Smith et al. (2020).
We acknowledge the use of the startR, s2dv, CSTools, multiApply, and CSIndicators R-language-based software packages, all of them available on the Comprehensive R Archive Network (CRAN; https://cran.r-project.org/, last access: 2 March 2026). The code used during the study is available from the corresponding author on reasonable request.
All datasets used in the study are publicly available. ERA5 hourly data on single levels, from which the daily data used in this study were derived, are available from the Copernicus Climate Change Service (C3S) Climate Data Store (CDS; https://doi.org/10.24381/cds.adbb2d47, Hersbach et al., 2023). The CMIP6 decadal predictions, historical simulations, and SSP2-4.5 climate projections used in this study are available through the Earth System Grid Federation (ESGF). The corresponding dataset references and DOIs for EC-Earth3 (https://doi.org/10.22033/ESGF/CMIP6.4880, https://doi.org/10.22033/ESGF/CMIP6.4553, https://doi.org/10.22033/ESGF/CMIP6.4700, EC-Earth, 2019a, b, c), IPSL-CM6A-LR (https://doi.org/10.22033/ESGF/CMIP6.5195, https://doi.org/10.22033/ESGF/CMIP6.5264, https://doi.org/10.22033/ESGF/CMIP6.5137, Boucher et al., 2018, 2019, 2020), and MPI-ESM1.2-HR (https://doi.org/10.22033/ESGF/CMIP6.6490, Pohlmann et al., 2019; https://doi.org/10.22033/ESGF/CMIP6.6594, Jungclaus et al., 2019; https://doi.org/10.22033/ESGF/CMIP6.4398, Schupfner et al., 2019) are provided in the reference list (last access: 2 March 2026).
The supplement related to this article is available online at https://doi.org/10.5194/esd-17-1435-2026-supplement.
SMM and CDT designed the study. SMM carried out the analysis and wrote the first draft. All authors contributed equally to the interpretation of results and writing thereafter.
The contact author has declared that none of the authors has any competing interests.
Publisher's note: Copernicus Publications remains neutral with regard to jurisdictional claims made in the text, published maps, institutional affiliations, or any other geographical representation in this paper. The authors bear the ultimate responsibility for providing appropriate place names. Views expressed in the text are those of the authors and do not necessarily reflect the views of the publisher.
The authors thank all the modeling groups for making the simulations available through the ESGF. The authors also thank two anonymous reviewers for their valuable comments and suggestions, which improved the manuscript.
This study has been supported by the European Union's Horizon Europe ASPECT project (grant agreement no. 101081460) and the Spanish national project BOREAS (PID2022-140673OA-I00) funded by MICIU/AEI/10.13039/501100011033 and by ERDF, EU. SMM gratefully acknowledges financial support from the Spanish Ministry for Science and Innovation (FPI PREP2022-000684, funded by MCIN/AEI/10.13039/501100011033). MEO is funded by the AI4Science PN070500 fellowship within the “Generación D” initiative, Red.es, Ministerio para la Transformación Digital y de la Función Pública, for talent attraction (C005/24-ED CV1). Funded by the European Union NextGenerationEU funds, through PRTR. VT has received funding from the EU Horizon 2020 Marie Skłodowska-Curie grant 101152499 (SINFONIA).
This paper was edited by Karin van der Wiel and reviewed by two anonymous referees.
Alizadeh, O.: Advances and challenges in climate modeling, Climatic Change, 170, 18, https://doi.org/10.1007/s10584-021-03298-4, 2022. a
Aranyossy, A., De Luca, P., Delgado-Torres, C., Solaraju-Murali, B., Samso Cabre, M., and Donat, M. G.: Multi-annual predictions of hot, dry and hot-dry compound extremes, Earth Syst. Dynam., 16, 2225–2251, https://doi.org/10.5194/esd-16-2225-2025, 2025. a
Bellucci, A., Haarsma, R., Gualdi, S., Athanasiadis, P. J., Caian, M., Cassou, C., Fernandez, E., Germe, A., Jungclaus, J., Kröger, J., Matei, D., Müller, W., Pohlmann, H., Salas y Melia, D., Sanchez, E., Smith, D., Terray, L., Wyser, K., and Yang, S.: An assessment of a multi-model ensemble of decadal climate predictions, Clim. Dynam., 44, 2787–2806, 2015. a
Bett, P. E. and Thornton, H. E.: The climatological relationships between wind and solar energy supply in Britain, Renew. Energ., 87, 96–110, https://doi.org/10.1016/j.renene.2015.10.006, 2016. a, b
Bett, P. E., Thornton, H. E., Troccoli, A., De Felice, M., Suckling, E., Dubus, L., Saint-Drenan, Y.-M., and Brayshaw, D. J.: A simplified seasonal forecasting strategy, applied to wind and solar power in Europe, Climate Services, 27, 100318, https://doi.org/10.1016/j.cliser.2022.100318, 2022. a, b
Bloomfield, H. C., Brayshaw, D. J., Gonzalez, P. L. M., and Charlton-Perez, A.: Sub-seasonal forecasts of demand and wind power and solar power generation for 28 European countries, Earth Syst. Sci. Data, 13, 2259–2274, https://doi.org/10.5194/essd-13-2259-2021, 2021. a
Boccard, N.: Capacity factor of wind power realized values vs. estimates, Energ. Policy, 37, 2679–2688, https://doi.org/10.1016/j.enpol.2009.02.046, 2009. a
Boer, G. J., Smith, D. M., Cassou, C., Doblas-Reyes, F., Danabasoglu, G., Kirtman, B., Kushnir, Y., Kimoto, M., Meehl, G. A., Msadek, R., Mueller, W. A., Taylor, K. E., Zwiers, F., Rixen, M., Ruprich-Robert, Y., and Eade, R.: The Decadal Climate Prediction Project (DCPP) contribution to CMIP6, Geosci. Model Dev., 9, 3751–3777, https://doi.org/10.5194/gmd-9-3751-2016, 2016. a, b, c
Boucher, O., Denvil, S., Levavasseur, G., Cozic, A., Caubel, A., Foujols, M.-A., Meurdesoif, Y., Cadule, P., Devilliers, M., Ghattas, J., Lebas, N., Lurton, T., Mellul, L., Musat, I., Mignot, J., and Cheruy, F.: IPSL IPSL-CM6A-LR model output prepared for CMIP6 CMIP historical, Earth System Grid Federation [data set], https://doi.org/10.22033/ESGF/CMIP6.5195, 2018. a
Boucher, O., Denvil, S., Levavasseur, G., Cozic, A., Caubel, A., Foujols, M.-A., Meurdesoif, Y., Cadule, P., Devilliers, M., Dupont, E., and Lurton, T.: IPSL IPSL-CM6A-LR model output prepared for CMIP6 ScenarioMIP ssp245, Earth System Grid Federation [data set], https://doi.org/10.22033/ESGF/CMIP6.5264, 2019. a
Boucher, O., Denvil, S., Levavasseur, G., Cozic, A., Caubel, A., Foujols, M.-A., Meurdesoif, Y., Devilliers, M., Flavoni, S., Gastineau, G., Mignot, J., and Swingedouw, D.: IPSL IPSL-CM6A-LR model output prepared for CMIP6 DCPP dcppA-hindcast, Earth System Grid Federation [data set], https://doi.org/10.22033/ESGF/CMIP6.5137, 2020. a
Brower, M.: Wind resource assessment: a practical guide to developing a wind project, John Wiley & Sons, ISBN 978-1-118-02232-0, 2012. a
Carvalho, D., Rocha, A., Costoya, X., DeCastro, M., and Gómez-Gesteira, M.: Wind energy resource over Europe under CMIP6 future climate projections: What changes from CMIP5 to CMIP6, Renew. Sustain. Energ. Rev., 151, 111594, https://doi.org/10.1016/j.rser.2021.111594, 2021. a
Castillo, C. P., e Silva, F. B., and Lavalle, C.: An assessment of the regional potential for solar power generation in EU-28, Energ. Policy, 88, 86–99, https://doi.org/10.1016/j.enpol.2015.10.004, 2016. a
Chenni, R., Makhlouf, M., Kerbache, T., and Bouzid, A.: A detailed modeling method for photovoltaic cells, Energy, 32, 1724–1730, https://doi.org/10.1016/j.energy.2006.12.006, 2007. a
Cionni, I., Lledo, L., Torralba, V., and Dell’Aquila, A.: Seasonal predictions of energy-relevant climate variables through Euro-Atlantic Teleconnections, Climate Services, 26, 100294, https://doi.org/10.1016/j.cliser.2022.100294, 2022. a
Clark, R. T., Bett, P. E., Thornton, H. E., and Scaife, A. A.: Skilful seasonal predictions for the European energy industry, Environ. Res. Lett., 12, 024002, https://doi.org/10.1088/1748-9326/aa57ab, 2017. a
Corti, S., Weisheimer, A., Palmer, T., Doblas-Reyes, F., and Magnusson, L.: Reliability of decadal predictions, Geophys. Res. Lett., 39, https://doi.org/10.1029/2012GL053354, 2012. a
Delgado-Torres, C., Donat, M. G., Gonzalez-Reviriego, N., Caron, L.-P., Athanasiadis, P. J., Bretonnière, P.-A., Dunstone, N. J., Ho, A.-C., Nicoli, D., Pankatz, K., Paxian, A., Pérez-Zanón, N., Samsó Cabré, M., Solaraju-Murali, B., Soret, A., and Doblas-Reyes, F. J.: Multi-model forecast quality assessment of CMIP6 decadal predictions, J. Clim., 35, 4363–4382, https://doi.org/10.1175/JCLI-D-21-0811.1, 2022. a, b, c, d
Delgado-Torres, C., Donat, M. G., Soret, A., González-Reviriego, N., Bretonnière, P.-A., Ho, A.-C., Pérez-Zanón, N., Samso Cabre, M., and Doblas-Reyes, F. J.: Multi-annual predictions of the frequency and intensity of daily temperature and precipitation extremes, Environ. Res. Lett., 18, 034031, https://doi.org/10.1088/1748-9326/acbbe1, 2023. a
Delgado-Torres, C., Octenjak, S., Marcos-Matamoros, R., Pérez-Zanón, N., Baulenas, E., Doblas-Reyes, F. J., Donat, M. G., Lwiza, L. M., Milders, N., Soret, A., Whittlesey, S., and Bojovic, D.: Supporting food security with multi-annual climate information: Co-production of climate services for the Southern African Development Community, Sci. Total Environ., 975, 179259, https://doi.org/10.1016/j.scitotenv.2025.179259, 2025. a, b
Donat, M. G., Delgado-Torres, C., De Luca, P., Mahmood, R., Ortega, P., and Doblas-Reyes, F. J.: How credibly do CMIP6 simulations capture historical mean and extreme precipitation changes?, Geophys. Res. Lett., 50, e2022GL102466, https://doi.org/10.1029/2022GL102466, 2023. a, b
Done, J. M., Morss, R. E., Lazrus, H., Towler, E., Tye, M. R., Ge, M., Das, T., Munévar, A., Hewitt, J., and Hoeting, J. A.: Toward usable predictive climate information at decadal timescales, One Earth, 4, 1297–1309, https://doi.org/10.1016/j.oneear.2021.08.013, 2021. a
Duffie, J. A. and Beckman, W. A.: Solar engineering of thermal processes, Wiley New York, https://doi.org/10.1002/9781118671603, 1980. a
Dunstone, N., Lockwood, J., Solaraju-Murali, B., Reinhardt, K., Tsartsali, E. E., Athanasiadis, P. J., Bellucci, A., Brookshaw, A., Caron, L.-P., Doblas-Reyes, F. J., Früh, B., González-Reviriego, N., Gualdi, S., Hermanson, L., Materia, S., Nicodemou, A., Nicolì, D., Pankatz, K., Paxian, A., Scaife, A., Smith, D., and Thornton, H. E.: Towards useful decadal climate services, Bull. Am. Meteorol. Soc., 103, E1705–E1719, https://doi.org/10.1175/BAMS-D-21-0190.1, 2022. a
EC-Earth Consortium (EC-Earth): EC-Earth-Consortium EC-Earth3 model output prepared for CMIP6 ScenarioMIP ssp245, Earth System Grid Federation [data set], https://doi.org/10.22033/ESGF/CMIP6.4880, 2019a. a
EC-Earth Consortium (EC-Earth): EC-Earth-Consortium EC-Earth3 model output prepared for CMIP6 DCPP dcppA-hindcast, Earth System Grid Federation [data set], https://doi.org/10.22033/ESGF/CMIP6.4553, 2019b. a
EC-Earth Consortium (EC-Earth): EC-Earth-Consortium EC-Earth3 model output prepared for CMIP6 CMIP historical, Earth System Grid Federation [data set], https://doi.org/10.22033/ESGF/CMIP6.4700, 2019c. a
Elsner, J. B. and Schmertmann, C.: Assessing forecast skill through cross validation, Weather and Forecast., 9, 619–624, https://doi.org/10.1175/1520-0434(1994)009<0619:AFSTCV>2.0.CO;2, 1994. a
Ely, C. R., Brayshaw, D. J., Methven, J., Cox, J., and Pearce, O.: Implications of the North Atlantic Oscillation for a UK–Norway renewable power system, Energ. Policy, 62, 1420–1427, https://doi.org/10.1016/j.enpol.2013.06.037, 2013. a
European Commission: Powering a climate-neutral economy: An EU strategy for energy system integration, https://eur-lex.europa.eu/legal-content/EN/TXT/?uri=CELEX:52020DC0299 (last access: 16 July 2026), 2020. a
European Environment Agency: Share of energy consumption from renewable sources in Europe, https://climate-energy.eea.europa.eu/topics/energy-2/renewable-energy/indicators/share-of-energy-consumption-from-renewable-sources-in-europe (last access: 2 March 2026), 2022. a
Eyring, V., Bony, S., Meehl, G. A., Senior, C. A., Stevens, B., Stouffer, R. J., and Taylor, K. E.: Overview of the Coupled Model Intercomparison Project Phase 6 (CMIP6) experimental design and organization, Geosci. Model Dev., 9, 1937–1958, https://doi.org/10.5194/gmd-9-1937-2016, 2016. a
Gettelman, A. and Rood, R. B.: Demystifying climate models: A users guide to earth system models, Springer, https://doi.org/10.1007/978-3-662-48959-8, 2016. a
Ghosh, S., Dey, S., Ganguly, D., Baidya Roy, S., and Bali, K.: Cleaner air would enhance India’s annual solar energy production by 6–28 TWh, Environ. Res. Lett., 17, 054007, https://doi.org/10.1088/1748-9326/ac5d9a, 2022. a
Ghosh, S., Ganguly, D., Dey, S., and Chowdhury, S. G.: Future photovoltaic potential in India: navigating the interplay between air pollution control and climate change mitigation, Enviro. Res. Lett., 19, 124030, https://doi.org/10.1088/1748-9326/ad8c68, 2024. a
Gonzalez, P. L., Brayshaw, D. J., and Zappa, G.: The contribution of North Atlantic atmospheric circulation shifts to future wind speed projections for wind power over Europe, Clim. Dynam., 53, 4095–4113, https://doi.org/10.1007/s00382-019-04776-3, 2019. a
Gutiérrez, J. M., Maraun, D., Widmann, M., Huth, R., Hertig, E., Benestad, R., Roessler, O., Wibig, J., Wilcke, R., Kotlarski, S., San Martín, D., Herrera, S., Bedia, J., Casanueva, A., Manzanas, R., Iturbide, M., Vrac, M., Dubrovsky, M., Ribalaygua, J., Pórtoles, J., Räty, O., Räisänen, J., Hingray, B., Raynaud, D., Casado, M. J., Ramos, P., Zerenner, T., Turco, M., Bosshard, T., Štĕpánek, P., Bartholy, J., Pongracz, R., Keller, D. E., Fischer, A. M., Cardoso, R. M., Soares, P. M. M., Czernecki, B., and Pagé, C.: An intercomparison of a large ensemble of statistical downscaling methods over Europe: Results from the VALUE perfect predictor cross-validation experiment, Int. J. Climatol., 39, 3750–3785, 2019. a
Haas, R., Reyers, M., and Pinto, J. G.: Decadal predictability of regional-scale peak winds over Europe using the Earth System Model of the Max-Planck-Institute for Meteorology, Meteorol. Z, 25, 739–752, https://doi.org/10.1127/metz/2015/0583, 2015. a, b
Hamed, K. H. and Rao, A. R.: A modified Mann-Kendall trend test for autocorrelated data, J. Hydrol., 204, 182–196, https://doi.org/10.1016/S0022-1694(97)00125-X, 1998. a
Heide, D., Von Bremen, L., Greiner, M., Hoffmann, C., Speckmann, M., and Bofinger, S.: Seasonal optimal mix of wind and solar power in a future, highly renewable Europe, Renew. Energ., 35, 2483–2489, https://doi.org/10.1016/j.renene.2010.03.012, 2010. a
Hersbach, H., Bell, B., Berrisford, P., Hirahara, S., Horányi, A., Muñoz-Sabater, J., Nicolas, J., Peubey, C., Radu, R., Schepers, D., Simmons, A., Soci, C., Abdalla, S., Abellan, X., Balsamo, G., Bechtold, P., Biavati, G., Bidlot, J., Bonavita, M., De Chiara, G., Dahlgren, P., Dee, D., Diamantakis, M., Dragani, R., Flemming, J., Forbes, R., Fuentes, M., Geer, A., Haimberger, L., Healy, S., Hogan, R. J., Hólm, E., Janisková, M., Keeley, S., Laloyaux, P., Lopez, P., Lupu, C., Radnoti, G., de Rosnay, P., Rozum, I., Vamborg, F., Villaume, S., and Thépaut, J.-N.: The ERA5 global reanalysis, quarterly journal of the royal meteorological society, Q. J. Roy. Meteorol. Soc., https://doi.org/10.1002/qj.3803, 2020. a
Hersbach, H., Bell, B., Berrisford, P., Biavati, G., Horányi, A., Muñoz Sabater, J., Nicolas, J., Peubey, C., Radu, R., Rozum, I., Schepers, D., Simmons, A., Soci, C., Dee, D., and Thépaut, J.-N.: ERA5 hourly data on single levels from 1940 to present, Copernicus Climate Change Service (C3S) Climate Data Store (CDS) [data set], https://doi.org/10.24381/cds.adbb2d47, 2023. a
Hou, X., Wild, M., Folini, D., Kazadzis, S., and Wohland, J.: Climate change impacts on solar power generation and its spatial variability in Europe based on CMIP6, Earth Syst. Dynam., 12, 1099–1113, https://doi.org/10.5194/esd-12-1099-2021, 2021. a, b
Hsu, S., Meindl, E. A., and Gilhousen, D. B.: Determining the power-law wind-profile exponent under near-neutral stability conditions at sea, J. Appl. Meteorol., 33, 757–765, https://doi.org/10.1175/1520-0450(1994)033<0757:DTPLWP>2.0.CO;2, 1994. a
Hutchins, B. W., Brayshaw, D. J., Shaffrey, L. C., Thornton, H. E., and Smith, D. M.: Decadal prediction for the European energy sector, Meteorol. Appl., 32, e70054, https://doi.org/10.1002/met.70054, 2025. a, b, c
International Energy Agency: Renewables 2023, https://www.iea.org/reports/renewables-2024 (last access: 28 February 2026), 2024. a
Jerez, S., Tobin, I., Vautard, R., Montávez, J. P., López-Romero, J. M., Thais, F., Bartok, B., Christensen, O. B., Colette, A., Déqué, M., Nikulin, G., Kotlarski, S., van Meijgaard, E., Teichmann, C., and Wild, M.: The impact of climate change on photovoltaic power generation in Europe, Nat. Commun., 6, 10014, https://doi.org/10.1038/ncomms10014, 2015. a, b
Jerez, S., Tobin, I., Turco, M., Jiménez-Guerrero, P., Vautard, R., and Montávez, J. P.: Future changes, or lack thereof, in the temporal variability of the combined wind-plus-solar power production in Europe, Renew. Energ., 139, 251–260, https://doi.org/10.1016/j.renene.2019.02.060, 2019. a
Jungclaus, J., Bittner, M., Wieners, K.-H., Wachsmann, F., Schupfner, M., Legutke, S., Giorgetta, M., Reick, C., Gayler, V., Haak, H., de Vrese, P., Raddatz, T., Esch, M., Mauritsen, T., von Storch, J.-S., Behrens, J., Brovkin, V., Claussen, M., Crueger, T., Fast, I., Fiedler, S., Hagemann, S., Hohenegger, C., Jahns, T., Kloster, S., Kinne, S., Lasslop, G., Kornblueh, L., Marotzke, J., Matei, D., Meraner, K., Mikolajewicz, U., Modali, K., Müller, W., Nabel, J., Notz, D., Peters, K., Pincus, R., Pohlmann, H., Pongratz, J., Rast, S., Schmidt, H., Schnur, R., Schulzweida, U., Six, K., Stevens, B., Voigt, A., and Roeckner, E.: MPI-M MPI-ESM1.2-HR model output prepared for CMIP6 CMIP historical, Earth System Grid Federation [data set], https://doi.org/10.22033/ESGF/CMIP6.6594, 2019. a
Kalverla, P. C., Duncan Jr., J. B., Steeneveld, G.-J., and Holtslag, A. A. M.: Low-level jets over the North Sea based on ERA5 and observations: together they do better, Wind Energ. Sci., 4, 193–209, https://doi.org/10.5194/wes-4-193-2019, 2019. a
Kapica, J., Jurasz, J., Canales, F. A., Bloomfield, H., Guezgouz, M., De Felice, M., and Kobus, Z.: The potential impact of climate change on European renewable energy droughts, Renew. Sustain. Energ. Rev., 189, 114011, https://doi.org/10.1016/j.rser.2023.114011, 2024. a, b, c
Kealy, T., Barrett, M., and Kearney, D.: How profitable are wind turbine projects? An empirical analysis of a 3.5 MW wind farm in Ireland, International journal on recent technologies in mechanical and electrical engineering, https://doi.org/10.21427/D7KP71, 2015. a
Kharin, V., Boer, G., Merryfield, W., Scinocca, J., and Lee, W.-S.: Statistical adjustment of decadal predictions in a changing climate, Geophys. Res. Lett., 39, https://doi.org/10.1029/2012GL052647, 2012. a
Lledó, L., Ramon, J., Soret, A., and Doblas-Reyes, F.-J.: Seasonal prediction of renewable energy generation in Europe based on four teleconnection indices, Renew. Energ., 186, 420–430, https://doi.org/10.1016/j.renene.2021.12.130, 2022. a, b, c, d
MacLeod, D., Torralba, V., Davis, M., and Doblas-Reyes, F.: Transforming climate model output to forecasts of wind power production: how much resolution is enough?, Meteorol. Appl., 25, 1–10, https://doi.org/10.1002/met.1660, 2018. a
Manzanas, R., Gutiérrez, J., Fernández, J., van Meijgaard, E., Calmanti, S., Magariño, M., Cofiño, A., and Herrera, S.: Dynamical and statistical downscaling of seasonal temperature forecasts in Europe: Added value for user applications, https://doi.org/10.1016/j.cliser.2017.06.004, 2018. a
Mavromatakis, F., Makrides, G., Georghiou, G., Pothrakis, A., Franghiadakis, Y., Drakakis, E., and Koudoumas, E.: Modeling the photovoltaic potential of a site, Renew. Energ., 35, 1387–1390, https://doi.org/10.1016/j.renene.2009.11.010, 2010. a
Meehl, G. A., Goddard, L. M., Murphy, J., Stouffer, R. J., Boer, G., Danabasoglu, G., Dixon, K., Giorgetta, M. A., Greene, A. M., Hawkins, E., Hegerl, G., Karoly, D., Keenlyside, N., Kimoto, M., Kirtman, B., Navarra, A., Pulwarty, R., Smith, D., Stammer, D., and Stockdale, T.: Decadal prediction: can it be skillful?, Bull. Am. Meteorol. Soc., 90, 1467–1486, https://doi.org/10.1175/2009BAMS2778.1, 2009. a, b
Meng, Y., Schmidt, J., Zscheischler, J., and Bevacqua, E.: Climate-driven compounding effects and historical trends in renewable electricity droughts in Europe, Appl. Energ., 401, 126623, https://doi.org/10.1016/j.apenergy.2025.126623, 2025. a
Miao, H., Xu, H., Huang, G., and Yang, K.: Evaluation and future projections of wind energy resources over the Northern Hemisphere in CMIP5 and CMIP6 models, Renew. Energ., 211, 809–821, https://doi.org/10.1016/j.renene.2023.05.007, 2023. a
Moemken, J., Reyers, M., Buldmann, B., and Pinto, J. G.: Decadal predictability of regional scale wind speed and wind energy potentials over Central Europe, Tellus A, 68, 29199, https://doi.org/10.3402/tellusa.v68.29199 2016. a, b
Monforti, F., Huld, T., Bódis, K., Vitali, L., D'isidoro, M., and Lacal-Arántegui, R.: Assessing complementarity of wind and solar resources for energy production in Italy. A Monte Carlo approach, Renew. Energ., 63, 576–586, https://doi.org/10.1016/j.renene.2013.10.028, 2014. a
Moreno-Montes, S., Delgado-Torres, C., Duzenli, E., Pérez-Zanón, N., Marcos-Matamoros, R., and Soret, A.: Comparative analysis of statistical downscaling methods for multi-model decadal climate predictions over Western Europe, Climate Services, 42, 100639, https://doi.org/10.1016/j.cliser.2026.100639, 2026. a, b, c
Müller, J., Folini, D., Wild, M., and Pfenninger, S.: CMIP-5 models project photovoltaics are a no-regrets investment in Europe irrespective of climate change, Energy, 171, 135–148, https://doi.org/10.1016/j.energy.2018.12.139, 2019. a
O'Neill, B. C., Tebaldi, C., van Vuuren, D. P., Eyring, V., Friedlingstein, P., Hurtt, G., Knutti, R., Kriegler, E., Lamarque, J.-F., Lowe, J., Meehl, G. A., Moss, R., Riahi, K., and Sanderson, B. M.: The Scenario Model Intercomparison Project (ScenarioMIP) for CMIP6, Geosci. Model Dev., 9, 3461–3482, https://doi.org/10.5194/gmd-9-3461-2016, 2016. a
Otero, N., Martius, O., Allen, S., Bloomfield, H., and Schaefli, B.: A copula-based assessment of renewable energy droughts across Europe, Renew. Energ., 201, 667–677, https://doi.org/10.1016/j.renene.2022.10.091, 2022. a, b
Panofsky, H. A. and Brier, G. W.: Some Applications of Statistics to Meteorology, Mineral Industries Extension Services, College of Mineral Industries, Pennsylvania State University, University Park, PA, 224 pp., 1958. a
Paxian, A., Reinhardt, K., Pankatz, K., Pasternack, A., Lorza-Villegas, M. P., Scheibel, M., Hoff, A., Mannig, B., Lorenz, P., and Früh, B.: High-resolution decadal drought predictions for German water boards: a case study for the Wupper catchment, Front. Clim., 4, 867814, https://doi.org/10.3389/fclim.2022.867814 2022. a
Payne, M. R., Danabasoglu, G., Keenlyside, N., Matei, D., Miesner, A. K., Yang, S., and Yeager, S. G.: Skilful decadal-scale prediction of fish habitat and distribution shifts, Nat. Commun., 13, 2660, https://doi.org/10.1038/s41467-022-30280-0 2022. a
Pérez-Zanón, N., Ho, A.-C., Chou, C., Lledó, L., Marcos-Matamoros, R., Rifà, E., and González-Reviriego, N.: CSIndicators: Get tailored climate indicators for applications in your sector, https://doi.org/10.1016/j.cliser.2023.100393, 2023. a
Pohlmann, H., Müller, W., Modali, K., Pankatz, K., Bittner, M., Früh, B., Ilyina, T., Kröger, J., Kadow, C., Li, H., Vamborg, F., Marotzke, J., Wieners, K.-H., Hettrich, S., Schupfner, M., Wachsmann, F., Steger, C., Jungclaus, J., Giorgetta, M., Reick, C., Legutke, S., Esch, M., Gayler, V., Haak, H., de Vrese, P., Raddatz, T., Mauritsen, T., von Storch, J.-S., Behrens, J., Brovkin, V., Claussen, M., Crueger, T., Fast, I., Fiedler, S., Hagemann, S., Hohenegger, C., Jahns, T., Kloster, S., Kinne, S., Lasslop, G., Kornblueh, L., Matei, D., Meraner, K., Mikolajewicz, U., Nabel, J., Notz, D., Peters, K., Pincus, R., Pongratz, J., Rast, S., Schmidt, H., Schnur, R., Schulzweida, U., Six, K., Stevens, B., Voigt, A., and Roeckner, E.: MPI-M MPI-ESM1.2-HR model output prepared for CMIP6 DCPP dcppA-hindcast, Earth System Grid Federation [data set], https://doi.org/10.22033/ESGF/CMIP6.6490, 2019. a
Priestley, M. D., Stephenson, D. B., Scaife, A. A., Bannister, D., Allen, C. J., and Wilkie, D.: Forced trends and internal variability in climate change projections of extreme European windstorm frequency and severity, Q. J. Roy. Meteorol. Soc., 150, 4933–4950, https://doi.org/10.1002/qj.4849, 2024. a
Pryor, S. C. and Barthelmie, R. J.: Climate change impacts on wind energy: A review, Renew. Sustain. Energ. Rev., 14, 430–437, https://doi.org/10.1016/j.rser.2009.07.028, 2010. a
Radziemska, E.: The effect of temperature on the power drop in crystalline silicon solar cells, Renew. Energ., 28, 1–12, https://doi.org/10.1016/S0960-1481(02)00015-0, 2003. a
Ramon, J., Lledó, L., Torralba, V., Soret, A., and Doblas-Reyes, F. J.: What global reanalysis best represents near-surface winds?, Q. J. Roy. Meteorol. Soc., 145, 3236–3251, https://doi.org/10.1002/qj.3616, 2019. a
Ramon, J., Lledó, L., Ferro, C. A., and Doblas-Reyes, F. J.: Uncertainties in the observational reference: Implications in skill assessment and model ranking of seasonal predictions, Q. J. Roy. Meteorol. Soc., 150, 897–910, https://doi.org/10.1002/qj.4628, 2024. a
Richardson, D., Pitman, A., and Ridder, N.: Climate influence on compound solar and wind droughts in Australia, npj Clim. Atmos. Sci., 6, 184, https://doi.org/10.1038/s41612-023-00507-y, 2023. a
Scaife, A. A. and Smith, D.: A signal-to-noise paradox in climate science, npj Clim. Atmos. Sci., 1, 28, https://doi.org/10.1038/s41612-018-0038-4, 2018. a
Schupfner, M., Wieners, K.-H., Wachsmann, F., Steger, C., Bittner, M., Jungclaus, J., Früh, B., Pankatz, K., Giorgetta, M., Reick, C., Legutke,755 S., Esch, M., Gayler, V., Haak, H., de Vrese, P., Raddatz, T., Mauritsen, T., von Storch, J.-S., Behrens, J., Brovkin, V., Claussen, M., Crueger, T., Fast, I., Fiedler, S., Hagemann, S., Hohenegger, C., Jahns, T., Kloster, S., Kinne, S., Lasslop, G., Kornblueh, L., Marotzke, J., Matei, D., Meraner, K., Mikolajewicz, U., Modali, K., Müller, W., Nabel, J., Notz, D., Peters, K., Pincus, R., Pohlmann, H., Pongratz, J., Rast, S., Schmidt, H., Schnur, R., Schulzweida, U., Six, K., Stevens, B., Voigt, A., and Roeckner, E.: DKRZ MPI-ESM1.2-HR model output prepared for CMIP6 ScenarioMIP ssp245, Earth System Grid Federation [data set], https://doi.org/10.22033/ESGF/CMIP6.4398, 2019. a
Segado-Moreno, L. C., Ruiz-Arias, J. A., Montávez, J. P., and Betak, J.: Past, current and future solar radiation trends in Europe: Multi-source assessment of the role of clouds and aerosols, Remote Sens. Environ., 333, 115122, https://doi.org/10.1016/j.rse.2025.115122, 2026. a
Slingo, J. and Palmer, T.: Uncertainty in weather and climate prediction, Philos. T. R. Soc. A, 369, 4751–4767, https://doi.org/10.1098/rsta.2011.0161, 2011. a
Smith, D. M., Eade, R., Scaife, A. A., Caron, L.-P., Danabasoglu, G., DelSole, T. M., Delworth, T., Doblas-Reyes, F. J., Dunstone, N. J., Hermanson, L., Kharin, V., Kimoto, M., Merryfield, W. J., Mochizuki, T., Müller, W. A., Pohlmann, H., Yeager, S., and Yang, X.: Robust skill of decadal climate predictions, Npj Clim. Atmos. Sci., 2, 13, https://doi.org/10.1038/s41612-019-0071-y, 2019. a, b, c, d
Smith, D. M., Scaife, A. A., and Kirtman, B. P.: What is the current state of scientific knowledge with regard to seasonal and decadal forecasting?, Environ. Res. Lett., 7, 015602, https://doi.org/10.1088/1748-9326/7/1/015602, 2012. a
Smith, D. M., Scaife, A. A., Eade, R., Athanasiadis, P., Bellucci, A., Bethke, I., Bilbao, R., Borchert, L. F., Caron, L.-P., Counillon, F., Danabasoglu, G., Delworth, T., Doblas-Reyes, F. J., Dunstone, N. J., Estella-Perez, V., Flavoni, S., Hermanson, L., Keenlyside, N., Kharin, V., Kimoto, M., Merryfield, W. J., Mignot, J., Mochizuki, T., Modali, K., Monerie, P.-A., Müller, W. A., Nicolí, D., Ortega, P., Pankatz, K., Pohlmann, H., Robson, J., Ruggieri, P., Sospedra-Alfonso, R., Swingedouw, D., Wang, Y., Wild, S., Yeager, S., Yang, X., and Zhang, L.: North Atlantic climate far more predictable than models imply, Nature, 583, 796–800, https://doi.org/10.1038/s41586-020-2525-0, 2020. a
Solaraju-Murali, B., Bojovic, D., Gonzalez-Reviriego, N., Nicodemou, A., Terrado, M., Caron, L.-P., and Doblas-Reyes, F. J.: How decadal predictions entered the climate services arena: an example from the agriculture sector, Climate Services, 27, 100303, https://doi.org/10.1016/j.cliser.2022.100303 2022. a
Solomon, S.: Climate change 2007-the physical science basis: Working group I contribution to the fourth assessment report of the IPCC, Vol. 4, Cambridge University Press, ISBN 9291691216, 2007. a
Soret, A., Gonzalez, P., Bloomfield, H., Masato, G., Goutham, N., Plougonven, R., and Torralba, V.: Subseasonal-to-seasonal climate predictions for energy, in: Sub-seasonal to Seasonal Prediction, 779–807, Elsevier, https://doi.org/10.1016/B978-0-443-31538-1.00023-3, 2026. a
Storch, H. v. and Zwiers, F. W.: Statistical Analysis in Climate Research, Cambridge University Press, https://doi.org/10.1017/CBO9780511612336, 1999. a
Suckling, E. B., van Oldenborgh, G. J., Eden, J. M., and Hawkins, E.: An empirical model for probabilistic decadal prediction: global attribution and regional hindcasts, Clim. Dynam., 48, 3115–3138, https://doi.org/10.1007/s00382-016-3255-8, 2017. a
Šúri, M., Huld, T. A., Dunlop, E. D., and Ossenbrink, H. A.: Potential of solar electricity generation in the European Union member states and candidate countries, Sol. Energy, 81, 1295–1305, https://doi.org/10.1016/j.solener.2006.12.007, 2007. a
Torralba, V., Doblas-Reyes, F. J., and Gonzalez-Reviriego, N.: Uncertainty in recent near-surface wind speed trends: a global reanalysis intercomparison, Environ. Res. Lett., 12, 114019, https://doi.org/10.1088/1748-9326/aa8a58, 2017a. a
Torralba, V., Doblas-Reyes, F. J., MacLeod, D., Christel, I., and Davis, M.: Seasonal climate prediction: a new source of information for the management of wind energy resources, J. Appl. Meteorol. Climatol., 56, 1231–1247, https://doi.org/10.1175/JAMC-D-16-0204.1, 2017b. a
Touma, J. S.: Dependence of the wind profile power law on stability for various locations, J. Air Pollut. Control Assoc., 27, 863–866, https://doi.org/10.1080/00022470.1977.10470503, 1977. a
Trenberth, K. E., Fasullo, J. T., and Kiehl, J.: Earth's global energy budget, Bull. Am. Meteorol. Soc., 90, 311–324, https://doi.org/10.1175/2008BAMS2634.1, 2009. a
Tsartsali, E., Athanasiadis, P., Materia, S., Bellucci, A., Nicolì, D., and Gualdi, S.: Predicting precipitation on the decadal timescale: A prototype climate service for the hydropower sector, Climate Services, 32, 100422, https://doi.org/10.1016/j.cliser.2023.100422, 2023. a
van Oldenborgh, G. J., Doblas-Reyes, F. J., Wouters, B., and Hazeleger, W.: Decadal prediction skill in a multi-model ensemble, Clim. Dynam., 38, 1263–1280, https://doi.org/10.1007/s00382-012-1313-4, 2012. a
Vaughan, C. and Dessai, S.: Climate services for society: origins, institutional arrangements, and design elements for an evaluation framework, WIRES Clim. Change, 5, 587–603, https://doi.org/10.1002/wcc.290, 2014. a
Vautard, R., Cattiaux, J., Yiou, P., Thépaut, J.-N., and Ciais, P.: Northern Hemisphere atmospheric stilling partly attributed to an increase in surface roughness, Nat. Geosci., 3, 756–761, https://doi.org/10.1038/ngeo979, 2010. a
Weide Luiz, E. and Fiedler, S.: Spatiotemporal observations of nocturnal low-level jets and impacts on wind power production, Wind Energ. Sci., 7, 1575–1591, https://doi.org/10.5194/wes-7-1575-2022, 2022. a
Wilks, D. S.: Forecast verification, in: International geophysics, Vol. 100, 301–394, Elsevier, https://doi.org/10.1016/B978-0-12-385022-5.00008-7, 2011. a, b
Wiser, R., Bolinger, M., Hoen, B., Millstein, D., Rand, J., Barbose, G., Darghouth, N., Gorman, W., Jeong, S., O'Shaughnessy, E., and Paulos, B.: Land-Based Wind Market Report: 2023 Edition, Tech. Rep. OSTI ID: 1996790, Lawrence Berkeley National Laboratory, https://escholarship.org/uc/item/51c9d2vt (last access: 28 February 2026), 2023. a
World Meteorological Organization: WMO Global Annual to Decadal Climate Update, 2024–2028, Tech. Rep., World Meteorological Organization, Geneva, Switzerland, https://wmo.int/publication-series/wmo-global-annual-decadal-climate-update-2024-2028 (last access: 20 February 2026), 2024. a
Zscheischler, J., Westra, S., van den Hurk, B. J. J. M., Seneviratne, S. I., Ward, P. J., Pitman, A., AghaKouchak, A., Bresch, D. N., Leonard, M., Wahl, T., and Zhang, X.: Future climate risk from compound events, Nat. Clim. Change, 8, 469–477, https://doi.org/10.1038/s41558-018-0156-3, 2018. a