the Creative Commons Attribution 4.0 License.
the Creative Commons Attribution 4.0 License.
 | 17 Nov 2022
El Niño–Southern Oscillation (ENSO) predictability in equilibrated warmer climates
Yiyu Zheng
Maria Rugenstein
Patrick Pieper
Goratz Beobide-Arsuaga
Johanna Baehr
Responses of El Niño–Southern Oscillation (ENSO) to global warming remain uncertain, which challenges ENSO forecasts in a warming climate. We investigate changes in ENSO characteristics and predictability in idealized simulations with quadrupled CO2 forcing from seven general circulation models. Comparing the warmer climate to control simulations, ENSO variability weakens, with the neutral state lasting longer, while active ENSO states last shorter and skew to favor the La Niña state. The 6-month persistence-assessed ENSO predictability slightly reduces in five models and increases in two models under the warming condition. While the overall changes in ENSO predictability are insignificant, we find significant relationships between changes in predictability and intensity, duration, and skewness of the three individual ENSO states. The maximal contribution to changes in the predictability of El Niño, La Niña and neutral states stems from changes in skewness and events' duration. Our findings show that a robust and significant decrease in ENSO characteristics does not imply a similar change in ENSO predictability in a warmer climate. This could be due to model deficiencies in ENSO dynamics and limitations in the persistence model when predicting ENSO.
- Article
(3101 KB) - Full-text XML
- BibTeX
- EndNote


Improving El Niño–Southern Oscillation (ENSO) predictions is crucial to project large-scale climate variability, which is of great scientific interest and societal need (Timmermann et al., 2018; Christensen et al., 2013; L'Heureux et al., 2020). Tremendous research efforts have improved the understanding of ENSO variability (e.g., Wang, 2018) and developed reliable ENSO predictions at 6–12 lead months in the present climate (e.g., Cane et al., 1986; Chen et al., 1997; Chapman et al., 2015; Tang et al., 2018; Ham et al., 2019). Anthropogenic climate change could alter ENSO characteristics in the future. Many studies have analyzed the impacts of climate change on ENSO characteristics in different warming scenarios with various models, but the impacts of climate change on ENSO predictability have not been investigated with similar rigor, due to large uncertainties in the simulated ENSO response.
The climate model deficiencies, the short observational record and the internal variability have prevented us from drawing robust conclusions about likely changes in ENSO characteristics in the future (e.g., Beobide-Arsuaga et al., 2021; Zhu, 2021; Stevenson et al., 2010; Maher et al., 2018; Zheng et al., 2018). Studies have reviewed ENSO response to external CO2 forcing in models from the Couple Model Intercomparison Project phase 3 and 5 (CMIP3 and CMIP5), and the results show that changes in ENSO amplitude and frequency under the forcings are model-dependent (Guilyardi, 2006; Guilyardi et al., 2012). Recent studies suggest that improved climate simulations reduce the model spread of ENSO responses to climate change. For example, Fredriksen et al. (2020) showed that CMIP6 models simulate ENSO spectra, amplitude and teleconnection in warming scenarios in higher agreement than models in CMIP phase 5 and 3. In addition to model development, longer simulations, especially those longer than 300 years, are shown to reduce uncertainties in ENSO simulation by stabilizing the internal variability (e.g., Sun et al., 2018; An et al., 2008; Knutson et al., 1997). Callahan et al. (2021) used millennium-length simulations from the Long Run Model Intercomparison Project (LongRunMIP) to show that ENSO amplitude and frequency changes were stronger and more consistent across models when the climate system equilibrated a CO2 forcing than during the transient climate state. Building on this finding, we ask if a robust change in ENSO characteristics will lead to a robust change in ENSO predictability.
ENSO predictability in the present climate is related to ENSO characteristics. Jin et al. (2008) investigated the skill of 6-month ENSO predictions in the hindcasts of 10 coupled general circulation models (GCMs) and showed that the larger the ENSO intensity, the easier the predictions and that El Niño and La Niña states are more predictable than the neutral state. Liu et al. (2022) studied retrospective ENSO forecasts in an ensemble prediction system in the Community Earth System Model (CESM) and confirmed that stronger ENSO events exhibit higher predictability.
The relationship between ENSO predictability and characteristics has also been investigated in a warmer future. DelSole et al. (2014) ascribed a decreased seasonal ENSO predictability to a decreased ENSO variance under a fixed 2095 climate forcing in the Community Climate System Model, version 4. Contractively, Berner et al. (2020) showed an increased seasonal to interannual predictability in a strong warming scenario in CESM, which was attributed to an increased ENSO amplitude and frequency. However, previous studies have neither provided a model intercomparison of ENSO predictability change in a warmer climate nor an investigation of predictability changes in El Niño, La Niña and neutral states separately.
In this paper, we compare changes in ENSO predictability in a quasi-equilibrated warmer climate across seven models. We analyze ENSO predictions using a persistence model, and we investigate predictability of the time series of the Niño index and its decomposition into the three ENSO phases. Based on the robust decrease in ENSO characteristics in an equilibrium climate (in 8 out of 10 models as shown in Callahan et al., 2021) in combination with the inherent relationship between ENSO characteristics and predictability, we could expect that ENSO predictability decreases robustly in a quasi-equilibrated warming climate or at the very least that the ENSO characteristics–predictability relationship sustains in such a climate.
This study is organized as follows: in Sect. 2, we introduce the data and method. In Sect. 3, we analyze changes in ENSO characteristics and predictability in response to CO2 forcing, and we regress changes in ENSO predictability onto changes in ENSO characteristics to determine the relationship. In Sect. 4, we discuss implications of these findings and summarize the results.
We analyze model outputs from the LongRunMIP archive, a large set of simulations from atmosphere–ocean general circulation models that last at least 1000 years (Rugenstein et al., 2019). This archive includes 15 models, each containing a pre-industrial control simulation of constant 1850 forcing and at least one forced simulation, ranging from instantaneous steps of 2, 4, 8 or 16 times the pre-industrial CO2 level to realistic Representative Concentration Pathway (RCP) scenarios with constant forcing beyond the year 2300. We select seven models from the archive with simulations of abruptly quadrupling CO2 (hereinafter referred to as abrupt4xCO2) and compare them with their pre-industrial control simulations (hereinafter referred to as the control). This forcing level is chosen because it shows a better signal-to-noise ratio than the doubling of CO2. The spatial resolution of these seven models ranges from 3.75∘ in both the atmosphere and ocean to 1.4∘ in the atmosphere and 0.5∘ in the ocean (Table 1). Though models with different resolutions might show different ENSO dynamics, our results on ENSO response are robust among the models. We treat the period between the year 150 and the end of the simulation as quasi-equilibrated (Callahan et al., 2021). Our results are not sensitive to this cut of time. In model simulations, we analyze monthly surface air temperature (TAS; Fig. 1) instead of sea surface temperature (see Rugenstein et al., 2019, for data availability). For the observational record, we analyze TAS by using the Goddard Institute for Space Studies Surface Temperature product version 4 (GISTEMP v4) (GISTEMP Team, 2022; Lenssen et al., 2019). We compare changes in the relationship between ENSO characteristics and predictability calculated from the GISTEMPv4 to that calculated from the control. In comparison to the relatively short observational record that shows only 65 El Niño and La Niña events from 1880 to present, we detect over 300 occurrences for both El Niño and La Niña events per model in the control, accentuating the increased statistical robustness and reliability of our analysis by using millennium-length simulations.
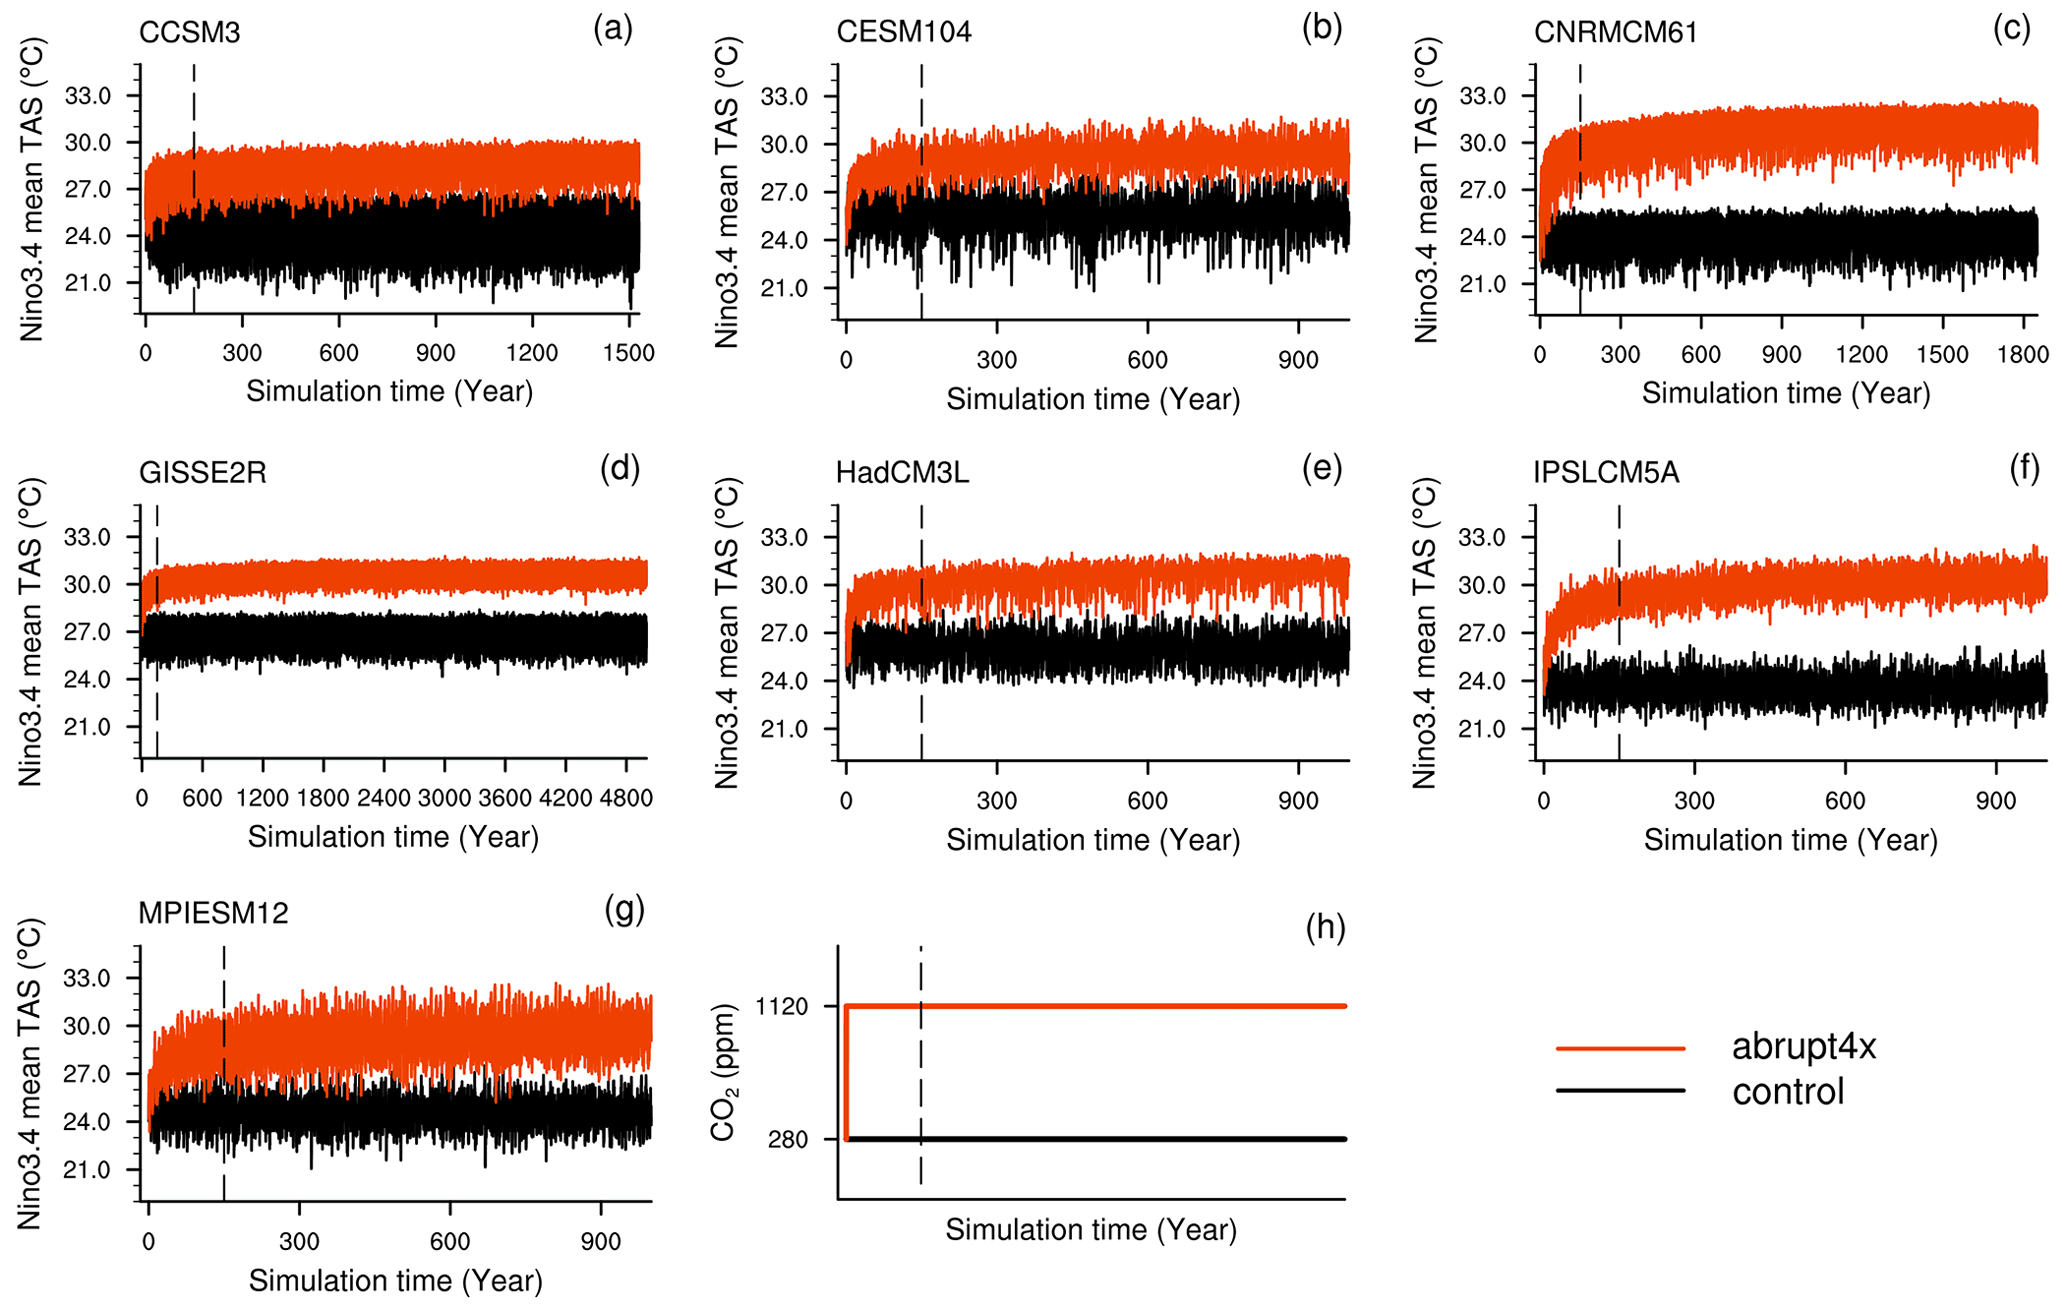
Figure 1(a–h) Time series of Niño3.4 mean TAS and (g) CO2 concentrations in the control and abrupt4xCO2 simulations. The dashed lines mark the year 150, the period after which we assume a quasi-equilibrium.
Table 1Overview of model simulations. The bold text represents the short name of the models.
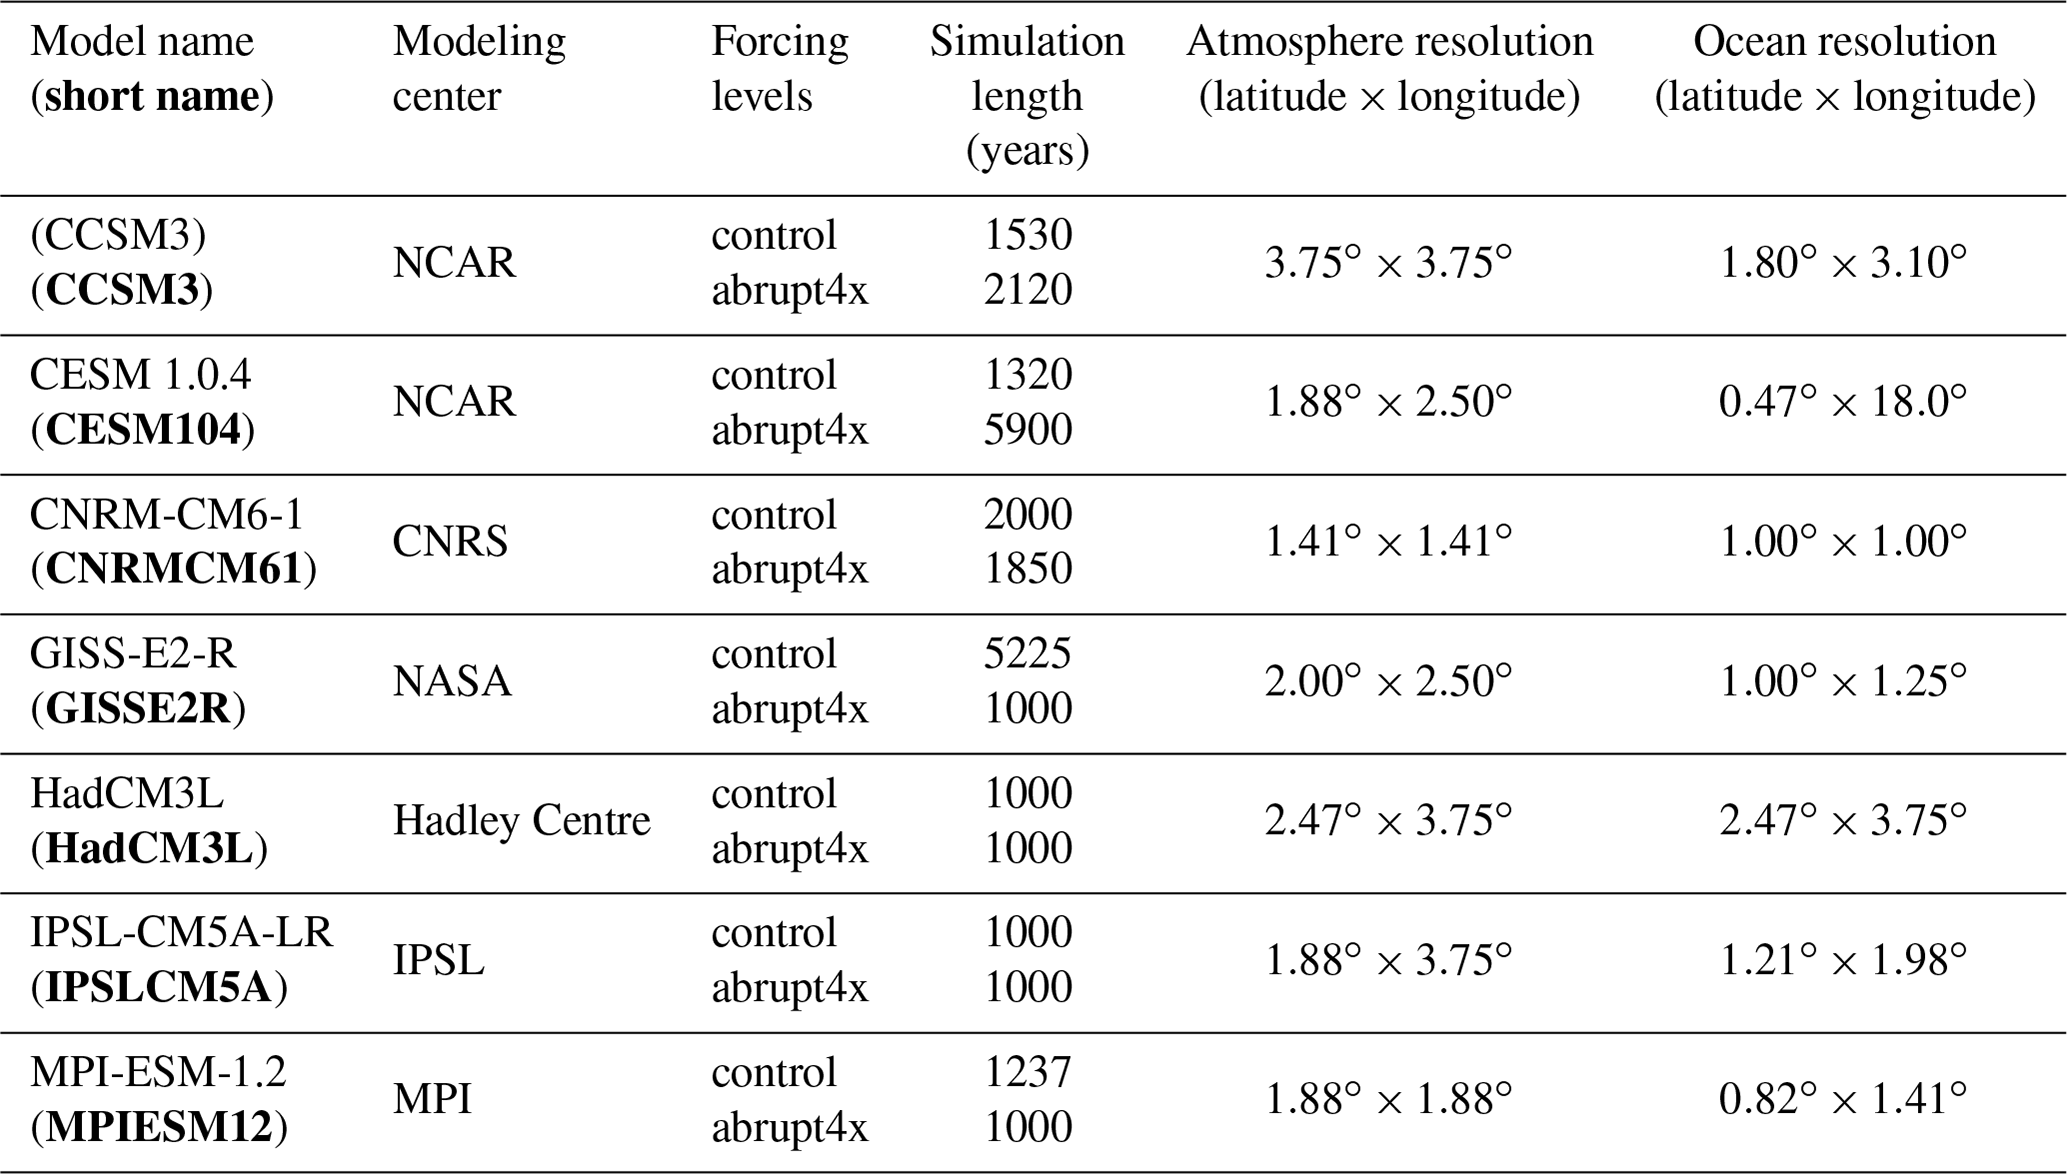
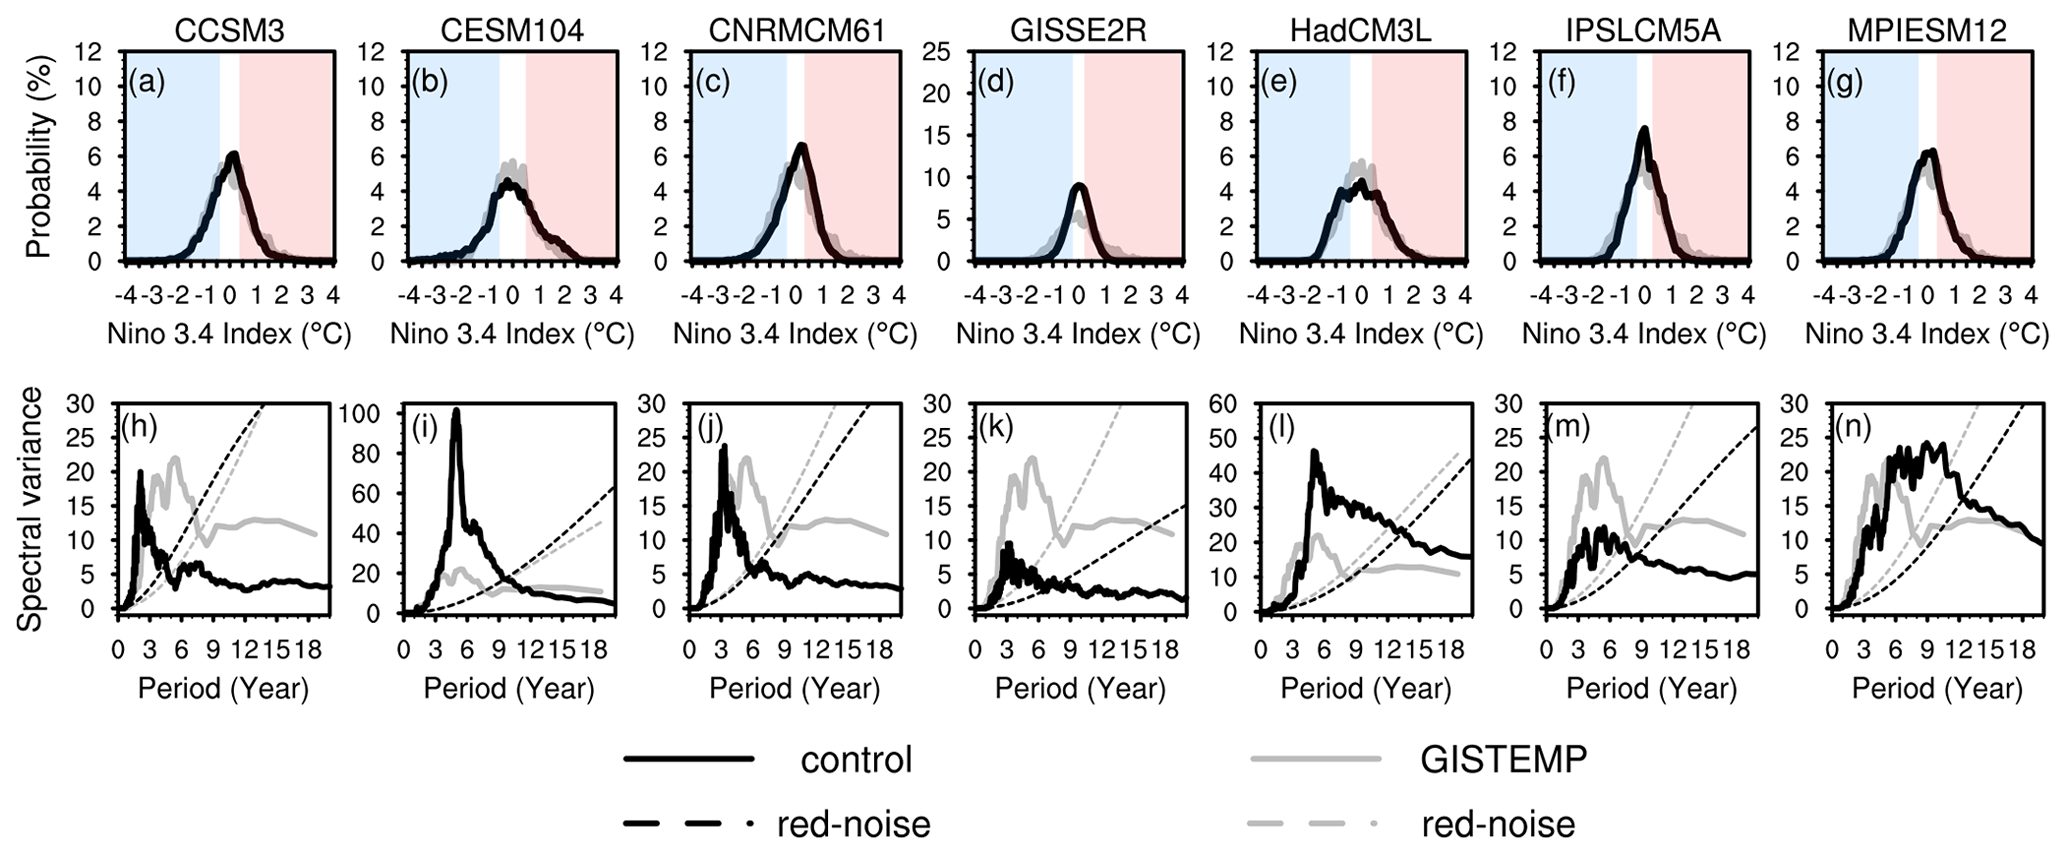
Figure 2(a–g) Histograms and (h–n) power spectra of the Niño3.4 index in the observations and the control. The blue and red shades in the upper panels represent La Niña and El Niño events, respectively. The dashed lines in the bottom panels represent the 0.95 confidence bound of the Markov red noise spectrum in the observations (gray) and the control (black).
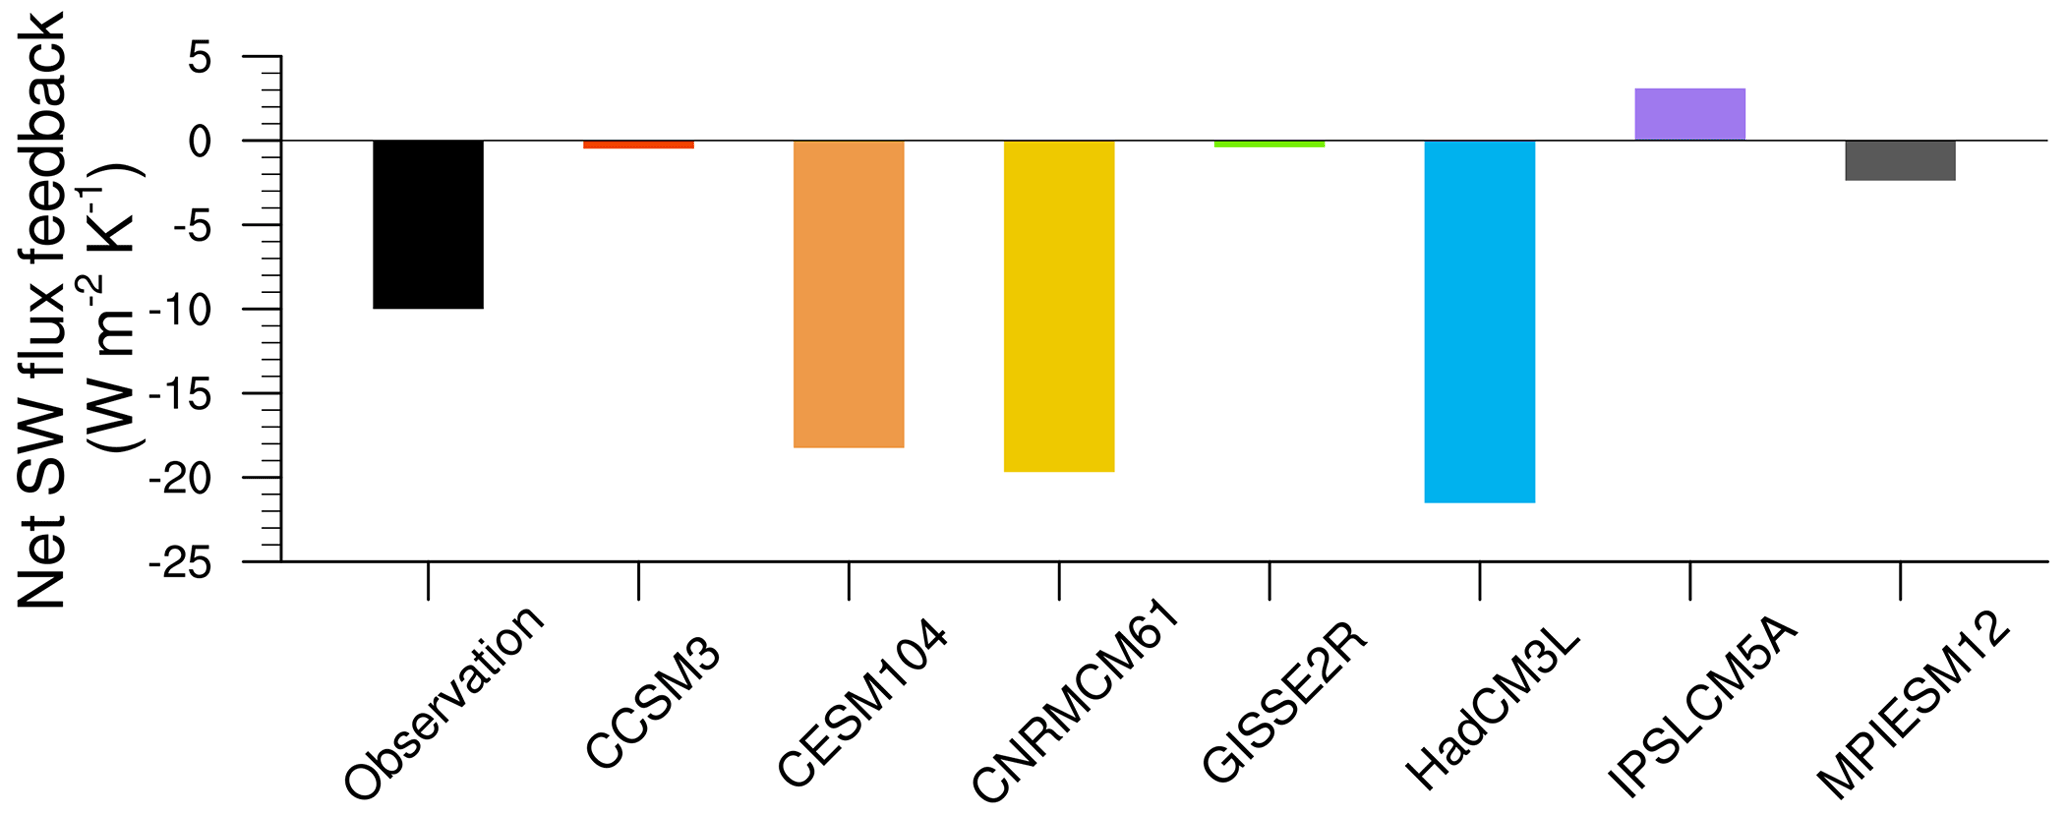
To evaluate ENSO simulations in the control, we calculate the Niño3.4 index by computing time series of TAS anomalies averaged over the Niño3.4 region (5∘ N–5∘ S, 170–120∘ W) with centered 30-year-based periods that update every 5 years (Lindsey, 2013). The control shows fair distributions of the Nino3.4 index compared to the observational record (Fig. 2a–g), except for GISSE2R, which simulates too many neutral states and too few and weak active ENSO states (Fig. 2d). The power spectra of the Niño3.4 index is model-dependent in the control in terms of the dominant frequency. Three models agree with the observations that ENSO occurs every 3 to 7 years (Fig. 2i, l and m), three models simulate a more frequent occurrence (Fig. 2h, j and k), and one model simulates a less frequent occurrence (Fig. 2n). To analyze model biases in ENSO dynamics, there are generally two most important atmospheric feedbacks that dominate ENSO dynamics: the negative net heat flux feedback and the positive Bjerknes feedback (e.g., Lloyd et al., 2009). Due to data availability, we only compute the net shortwave heat flux feedback, regressing TAS anomalies in the Niño3.4 region onto the net shortwave heat flux anomalies in the combined Niño3 and Niño4 region (5∘ N–5∘ S, 160∘ E–90∘ W; Bayr et al. (2019)). Six models simulate the observed negative feedback parameter, albeit with too-low or too-high magnitudes (Fig. 3). IPSLCM5A simulates an erroneously positive feedback, indicating that the IPSLCM5A mistakenly simulates ENSO events to be shortwave-driven (Bayr et al., 2019).
To separate ENSO responses to CO2 forcing into the three ENSO states, we define El Niño and La Niña events as exceedance of half a standard deviation of the Niño3.4 index for at least 6 consecutive months (Fig. 4a–g; Bellenger et al., 2014). Our results are not sensitive to the choice of different exceedance thresholds. In addition, we define “quasi El Niño” and “quasi La Niña” events as exceeding the threshold but not lasting long enough to be classified as an active event. We then investigate the time series of the Niño3.4 index (hereinafter referred to as “mean”), as well as neutral, El Niño and La Niña composites (hereinafter referred to as “states” collectively and as “active ENSO states” when exempting the neutral state).
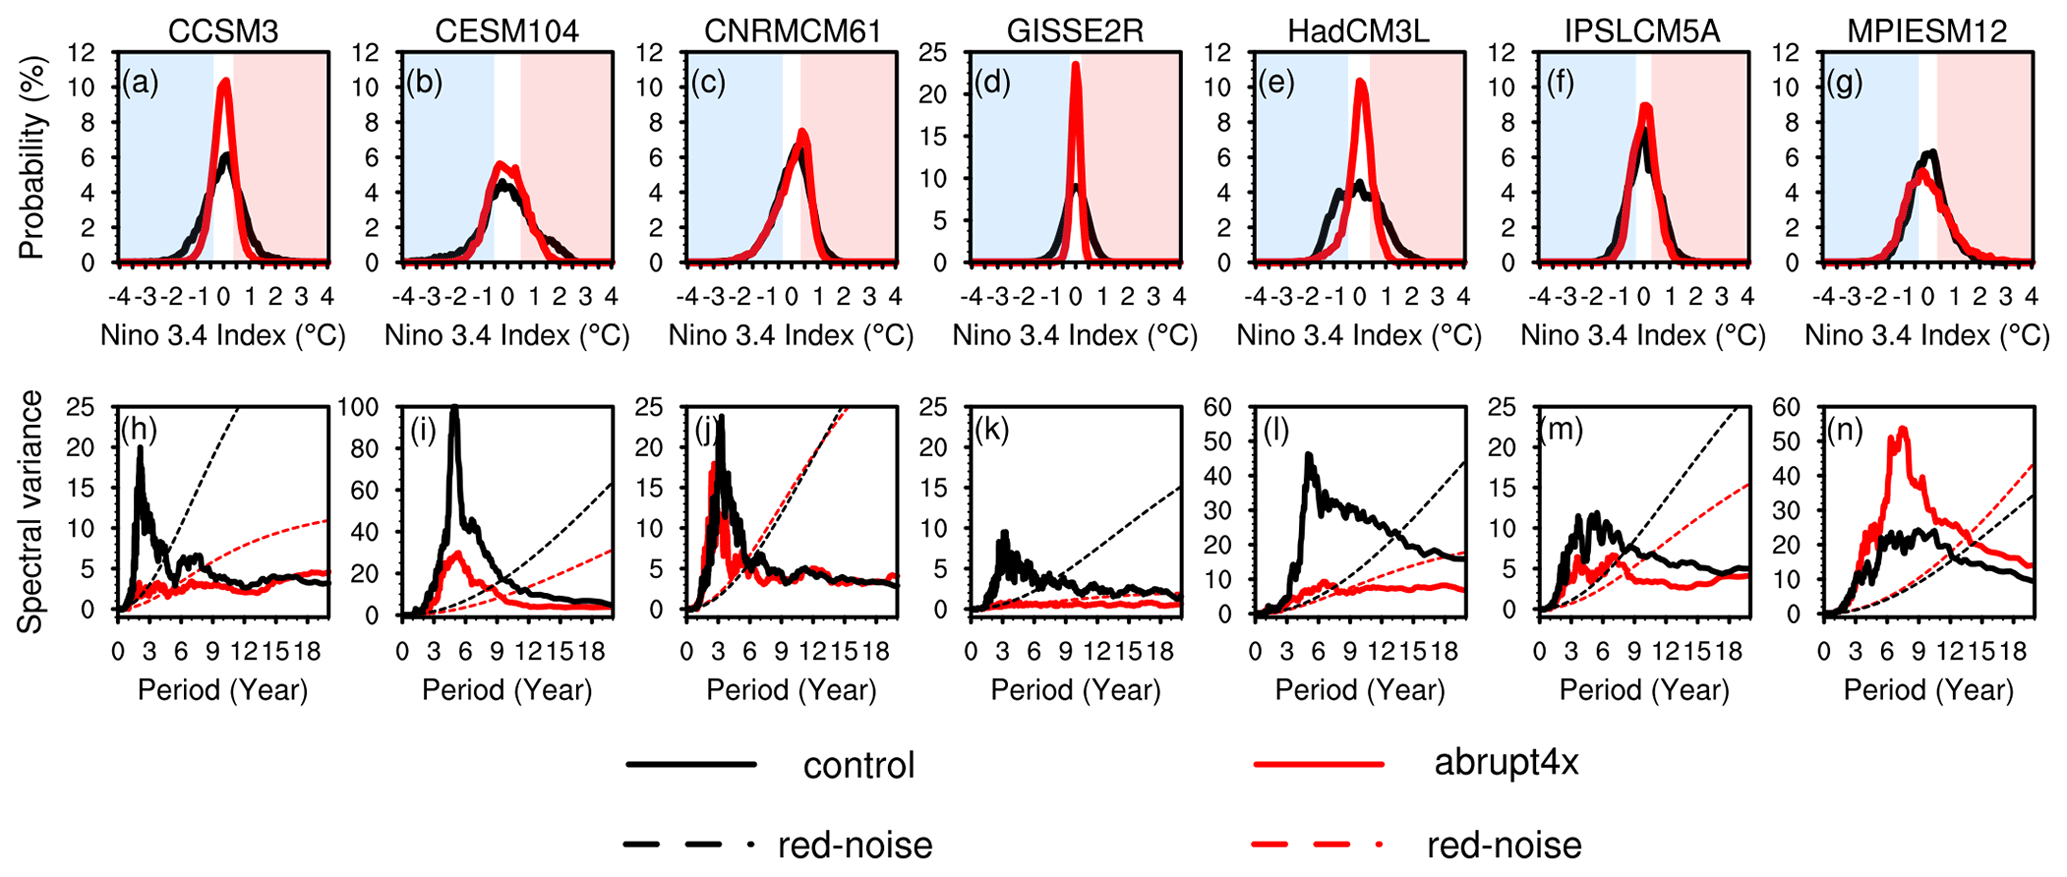
Figure 4(a–g) Histograms and (h–n) power spectra of the Niño3.4 index in the control and abrupt4xCO2. The blue and red shades in the upper panels represent La Niña and El Niño events, respectively. The dashed lines in the bottom panels represent the 0.95 confidence bound of the Markov red noise spectrum in the control and abrupt4xCO2.
For ENSO mean characteristics, we define the ENSO amplitude as the standard deviation of the Niño3.4 index and the frequency as the area of the Niño3.4 spectrum that lies above the Markov red-noise spectra (Wilks, 2011; Fig. 4h–n). For the characteristics of each ENSO state (excluding quasi-events), we define the events' intensity as the average peak of the Niño3.4 index of the El Niño and La Niña event and the events' duration as the average count of months of the El Niño, La Niña or neutral event. To measure the magnitude of ENSO asymmetry, we compute the skewness of the Niño3.4 index distribution (Kohyama et al., 2018).
To compute ENSO predictability in the control and abrupt4xCO2, we generate a persistence forecast of the Niño3.4 index. This persistence forecast uses a first-order auto-regressive model initialized in November, which produces the highest skill in short lead times (Knaff and Landsea, 1997; Jin et al., 2008) and allows us to investigate the sensitivity of the spring predictability barrier to global warming. We measure the predictive skill by a categorical metric, the accuracy, which is obtained from a contingency table by calculating the proportion of correct predictions for each ENSO state relative to the sum of all predictions (Wilks, 2011):
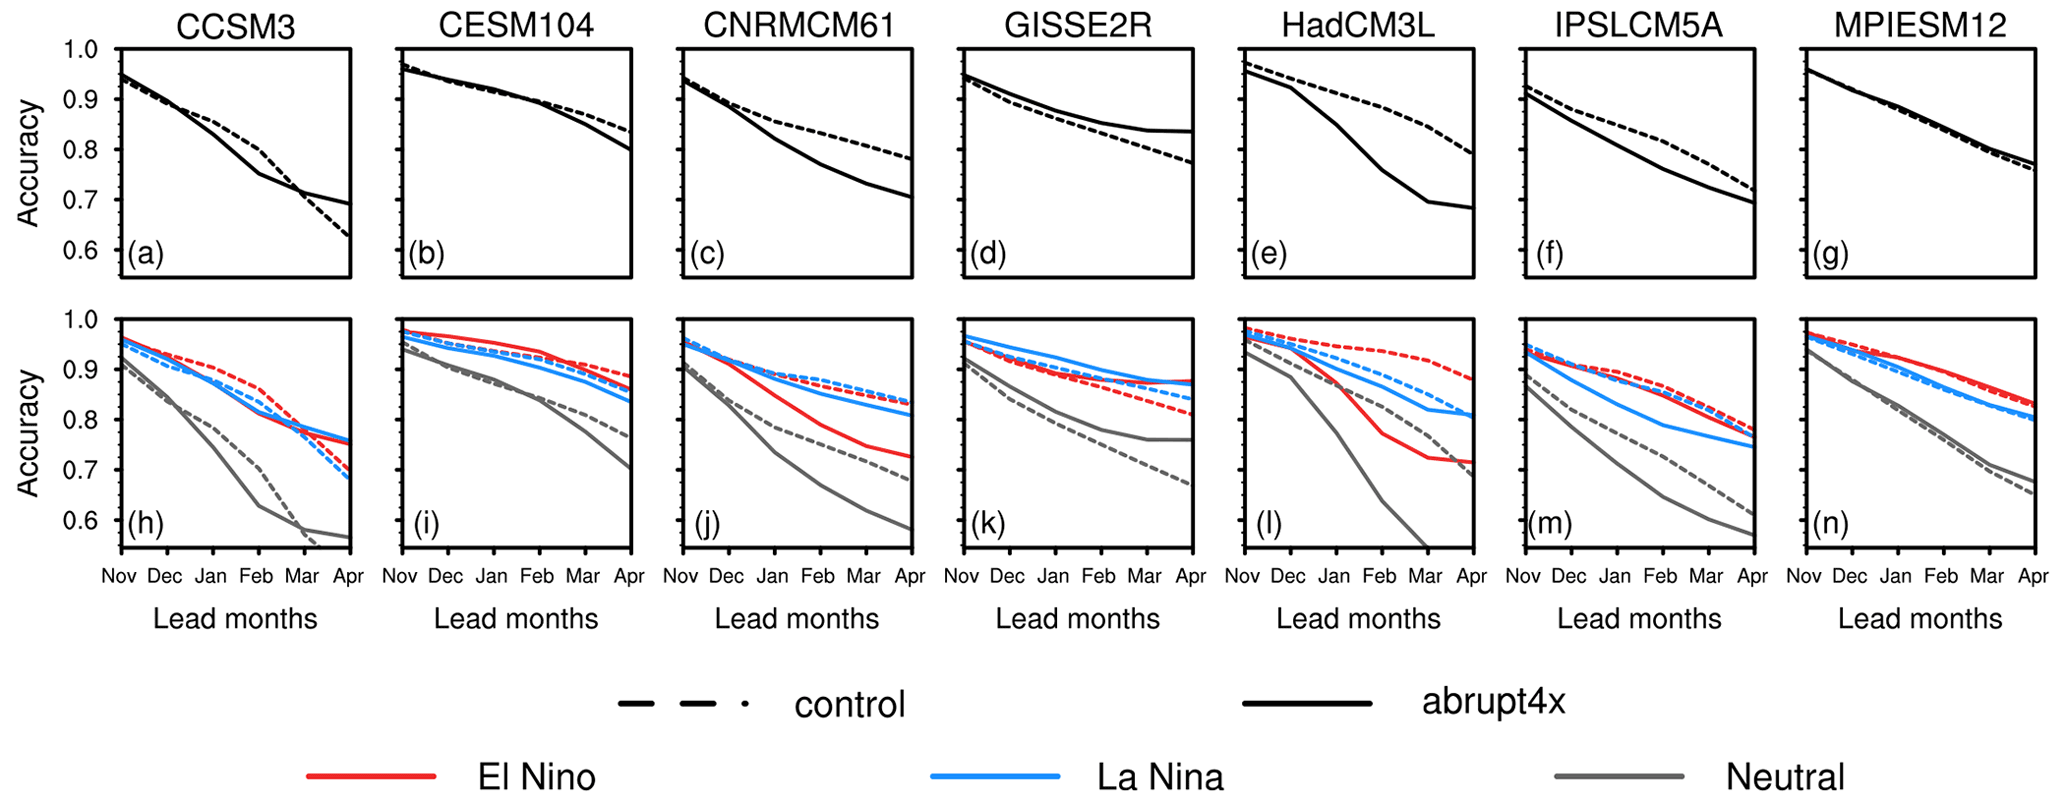
Figure 5(a–g) Accuracy of persistence predictions of the mean ENSO state in the control and abrupt4xCO2. (h–n) Accuracy of persistence predictions of the El Niño, La Niña and neutral state in the control and abrupt4xCO2.
The hits are predictions for which a state that is forecasted to occur does occur; the correct negatives are the number of states forecasted to not occur and that do not occur. The total represents all states, which is the sum of hits, correct negatives, misses and false alarms. The misses are states forecasted to not occur but that occur, and the false alarms are states forecasted to occur but that do not occur. We calculate the accuracy of ENSO states for the first 6 lead months (as shown in Fig. 5), which is hereafter referred to as November to April. Predictability is defined as the area under the skill curves across the 6 lead months.
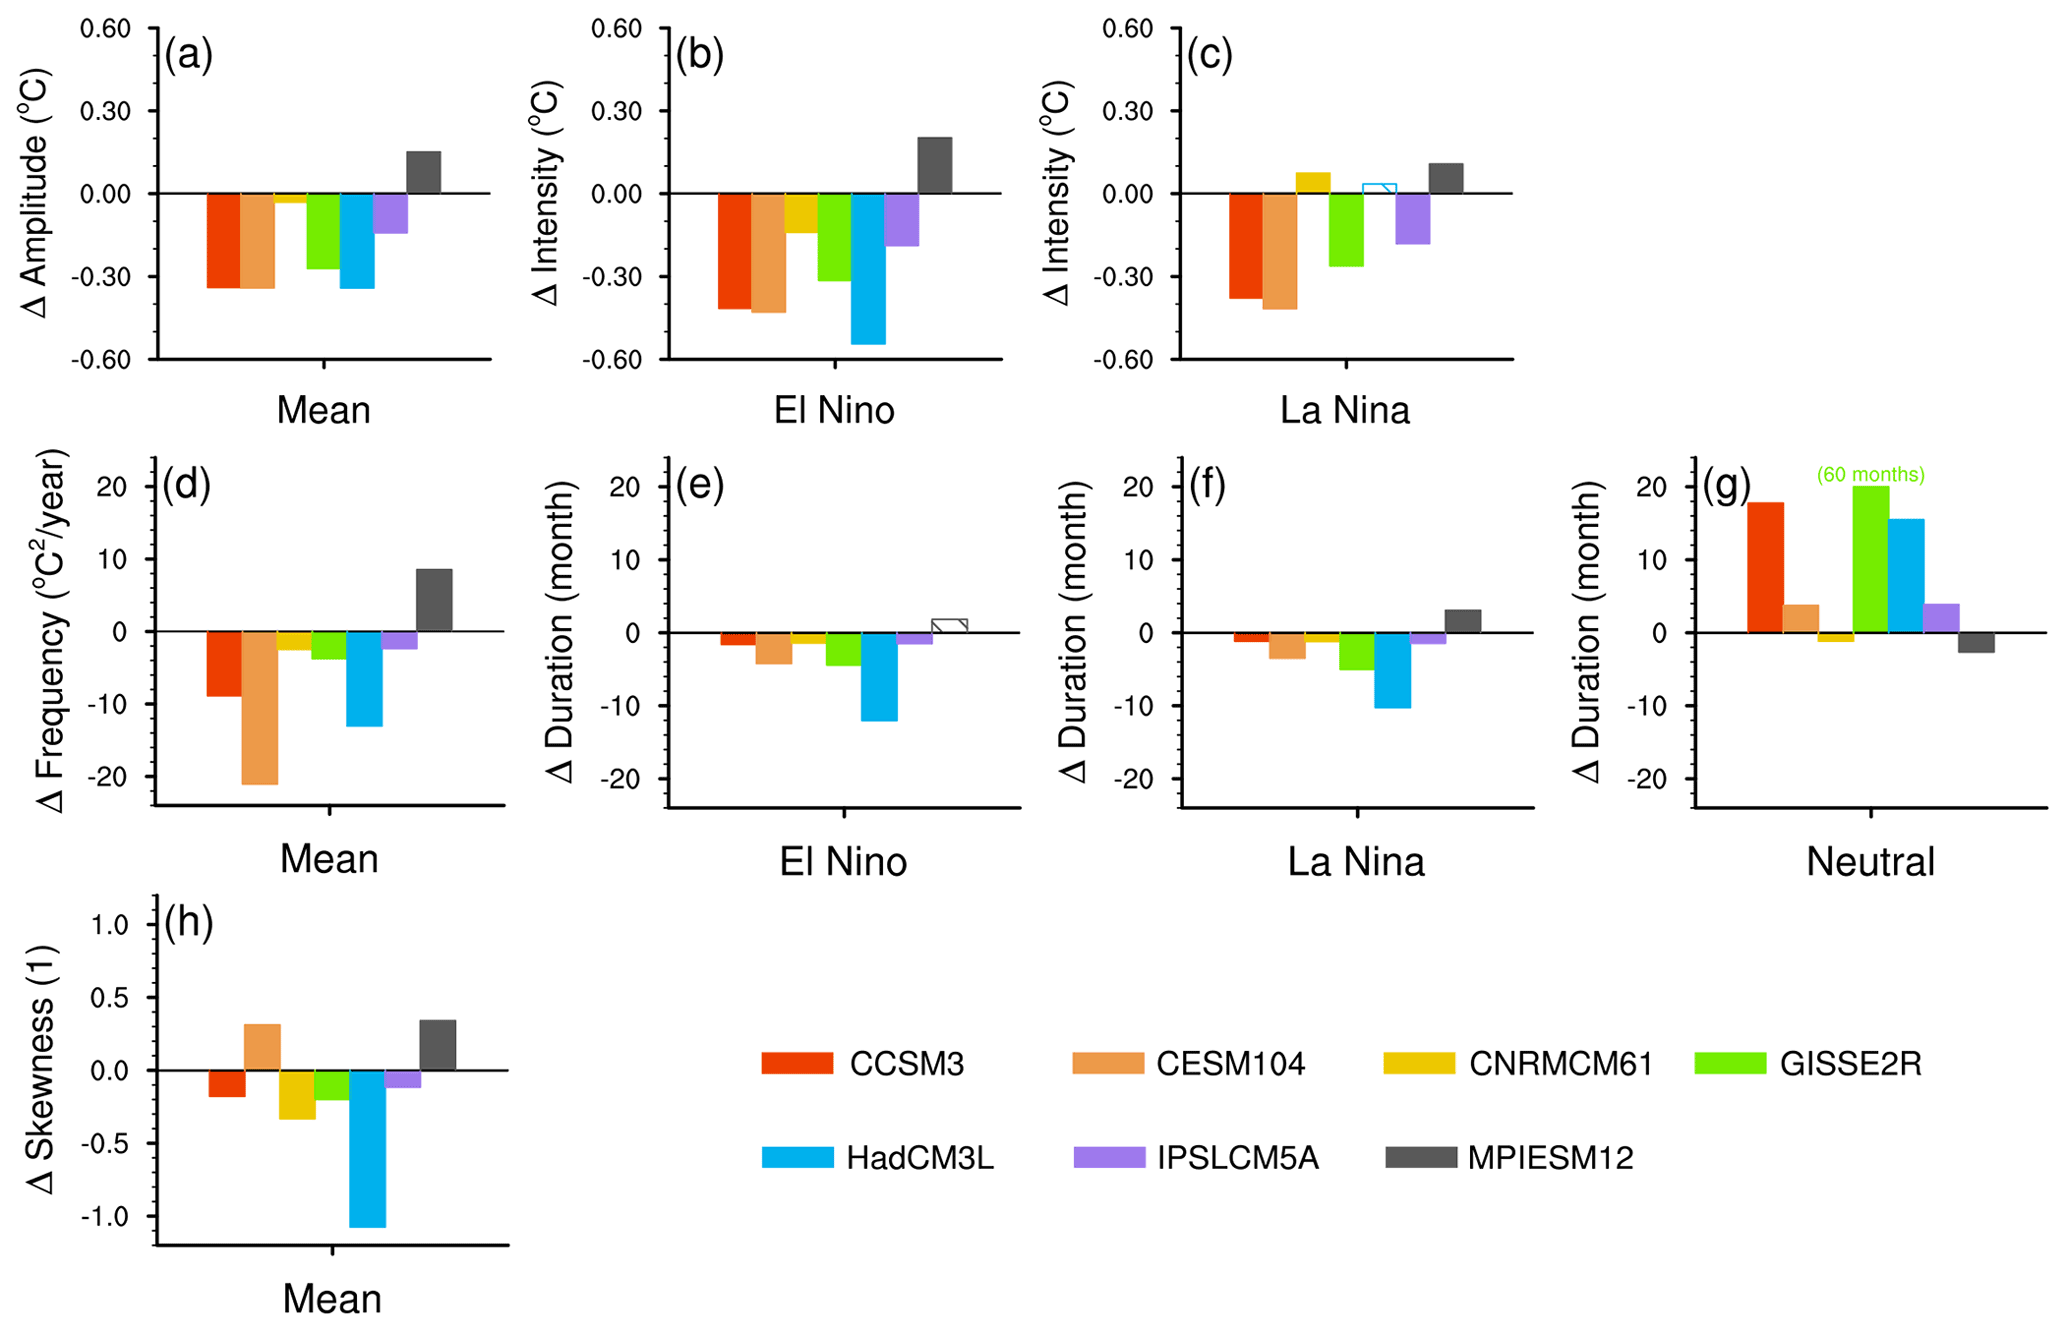
Figure 6(a–c) Changes in abrupt4xCO2 relative to the control in ENSO amplitude and in intensity of El Niño and La Niña states. (d–g) Changes in abrupt4xCO2 relative to the control in ENSO frequency and in duration of El Niño, La Niña and neutral states. (h) Changes in the skewness of the Niño3.4 index distribution. Solid bars represent changes that are significant at the 5 % level of a bootstrap test; hatched bars represent changes that are insignificant.
Throughout the paper, we focus on the change in ENSO characteristics and predictability in response to a warmer climate. The change is computed by subtracting the averaged control from every time step in abrupt4xCO2. We test the significance of changes by one-sided bootstrapping, of which the null hypothesis (changes are not significant) will be rejected at the 5 % significance level. For changes in the mean characteristic, we bootstrap the Niño3.4 index in the control and abrupt4xCO2; for changes in states' characteristic, we bootstrap the intensities or durations of each ENSO state. For changes in ENSO predictability, we convert contingency tables into arrays, and we bootstrap these arrays at the 5 % significance level. For example, we assign four letters to represent each constituent (“a” for hits, “b” for correct negatives, “c” for misses and “d” for false alarms), and we assume a contingency table in the control that has one hit (a), two correct negatives (b, b), three misses (c, c, c) and four false alarms (d, d, d, d). We convert the contingency table into an array ([a, b, b, c, c, c, d, d, d, d]) and bootstrap the array with a replacement 5000 times. We now obtain 5000 values of accuracy for each control and repeat this process for abrupt4xCO2. For each lead month, we repeat this bootstrap procedure and calculate changes in accuracy. At last, we test if our original predictability change is statistically significantly positive or negative.
To investigate relationships between changes in ENSO predictability and characteristics (hereinafter referred to as “ENSO characteristics–predictability relationship”), we employ a linear regression analysis. We break the time series of the Niño3.4 index into running 30-year windows that update every 5 years, calculate the mean and the states’ predictability and characteristics for each 30-year period, and regress the changes in ENSO predictability onto changes in ENSO characteristics. We test whether the regression slopes significantly differ from zero by bootstrapping the dependent and independent variables in the linear equations. In addition, we calculate R2 values to determine the contribution of ENSO characteristic changes to ENSO predictability changes.
3.1 Changes in ENSO characteristics
ENSO weakens and reddens in abrupt4xCO2 compared to the control in most of the models (Figs. 4a–g and 6a, d). Distributions of the Niño3.4 index narrow in six out of seven models, and their central peaks intensify (Fig. 4a–g), reflecting a decrease in ENSO amplitude. Six models show significantly decreased ENSO amplitudes in abrupt4xCO2 between −0.03 and −0.34 ∘C (4 % to 61 % compared to their control values; Fig. 6a). They also show a reddening of high frequency in abrupt4xCO2 (Fig. 4h–n) accompanied by a significant decrease in the power of high frequencies (−2.35 to −21.0 ∘C yr−1, which is 24 % to 92 % of the values in the control; Fig. 6d). MPIESM12, being the only exception, shows an increase in ENSO amplitude of 0.15 ∘C (21 %) and an increase in ENSO frequency of 8.53 ∘C yr−1 (85 %).
Both the El Niño and La Niña states become weaker and shorter (Fig. 6). The El Niño state significantly decreases its intensity in six out of seven models (−0.14 to −0.54 ∘C, 14 % to 44 % relative to the control; Fig. 6b) and significantly decreases its duration in the same six models (−1.49 to −12.0 months, 11 % to 59 % relative to the control; Fig. 6e). Similarly, the La Niña state significantly decreases its intensity in four models (−0.18 to −0.42 ∘C, 19 % to 36 % relative to the control; Fig. 6c) and significantly decreases its duration in six models (−1.16 to −10.3 months, 10 % to 52 % relative to the control; Fig. 6f).
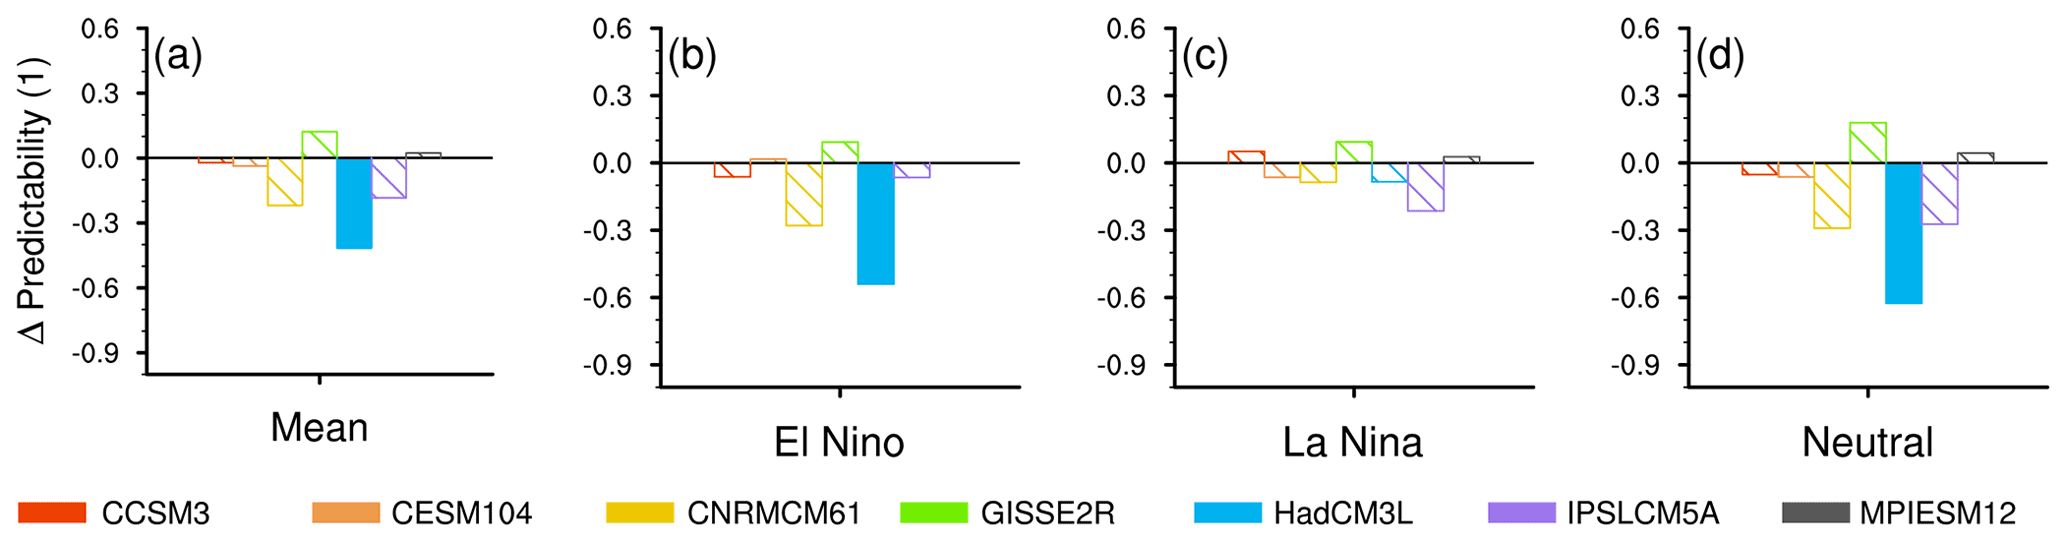
Figure 7Changes in ENSO predictability in the mean state and in El Niño, La Niña and neutral states. Solid bars represent changes that are significant at the 5 % level of a bootstrap test, while hatched bars represent changes that are insignificant.
The decreased durations of both active states are accompanied by an increased duration of the neutral state. Five models simulate a significantly longer neutral state in abrupt4xCO2 (3.73 to 60.2 months, 28 % to 60.5 % relative to the control; Fig. 6g).
The difference in duration changes in both active states suggests changes in the ENSO nonlinearity. To exemplify changes in the asymmetry in Niño3.4 distributions, we scrutinize HadCM3L (Fig. 4e). In the control, the right-side tail of the histogram of HadCM3L extends further than the left-side tail, denoting more extreme El Niño than La Niña events. In addition, the histogram peaks around the threshold that differentiates the neutral from the La Niña state, leading to more quasi La Niña than quasi El Niño events. In abrupt4xCO2, the right tail becomes shorter, while the left tail remains, resulting in fewer extreme El Niño events. Additionally, the peak of the distribution moves to the right, resulting in more quasi El Niño events relative to the control. Four models simulate a significantly decreased skewness of the Niño3.4 distribution (−0.12 to −1.07; Fig. 6h), in accordance with Fig. 4a–g, which shows that quasi El Niño increases more than quasi La Nina events, while extreme El Niño decreases more than extreme La Niña events in abrupt4xCO2.
3.2 Changes in ENSO predictability
ENSO becomes less predictable in five out of seven models, although the changes are mostly insignificant according to our bootstrap test (Figs. 5a–g and 7a). In the control, the mean persistence skill starts at around 0.95 in all seven models, denoting that the persistence model is able to correctly predict 95 % of ENSO states in November. From December onward, the skill drops to around 0.72 for April, denoting that 72 % of ENSO states are correctly predicted after 6 months. In abrupt4xCO2, all models first show equivalent skills from November to January as in the control. Then, five models show a decrease in skills, with around 70 % of correct predictions of ENSO states for April, while GISSE2R and MPIESM12 show a small increase in skill. We quantify changes in the area under the skill curve as the change in predictability, with only HadCM3L showing a significant decrease in the mean predictability in abrupt4xCO2 (−0.42, 9 % relative to the control; Fig. 7a).
The predictability of the El Niño state decreases similarly to the mean predictability, while the predictability of the La Niña state shows no significant change (Figs. 5h–n and 7b, c). In the control, the persistence skills of active states reduce from 0.95 to 0.8 from November to April in all seven models, being indistinguishable from the mean persistence skill. In abrupt4xCO2, the skill of predicting the El Niño state decreases similarly to that in the control from November to January then changes sharply and model-dependently from February onward. In comparison, between November and April, the skill of the La Niña state changes less than the skill of the El Niño state. Four models show a decrease in the predictability of the El Niño state, with HadCM3L being again the only model that exhibits a significant change (−0.54, 11 % relative to the control; Fig. 7b). Five models agree on a decrease in the predictability of the La Niña state, while none of the changes are significant (Fig. 7c).
The neutral state in both the control and abrupt4xCO2 is harder to predict than the mean and the active states, and its change in predictability exhibits the largest magnitude (Figs. 5h–n and 7d). In the control, the skill of the neutral state begins at 0.9 in November and decreases to around 0.65 in April. In abrupt4xCO2, the skill decreases similarly to the control in the first 3 lead months and changes sharply and model-dependently afterward. Five models simulate a decrease in the predictability of the neutral state, with HadCM3L showing the only significant change (−0.63, 15 % relative to the control; Fig. 7d). In summary, ENSO mean predictability decreases in abrupt4xCO2, mainly caused by predictability changes in neutral and El Niño states. However, contradictory to our expectations, changes in predictability are neither as robust across models nor as significant as changes in ENSO characteristics. Therefore, we test if the ENSO characteristics–predictability relationship sustains in the warmer climate.
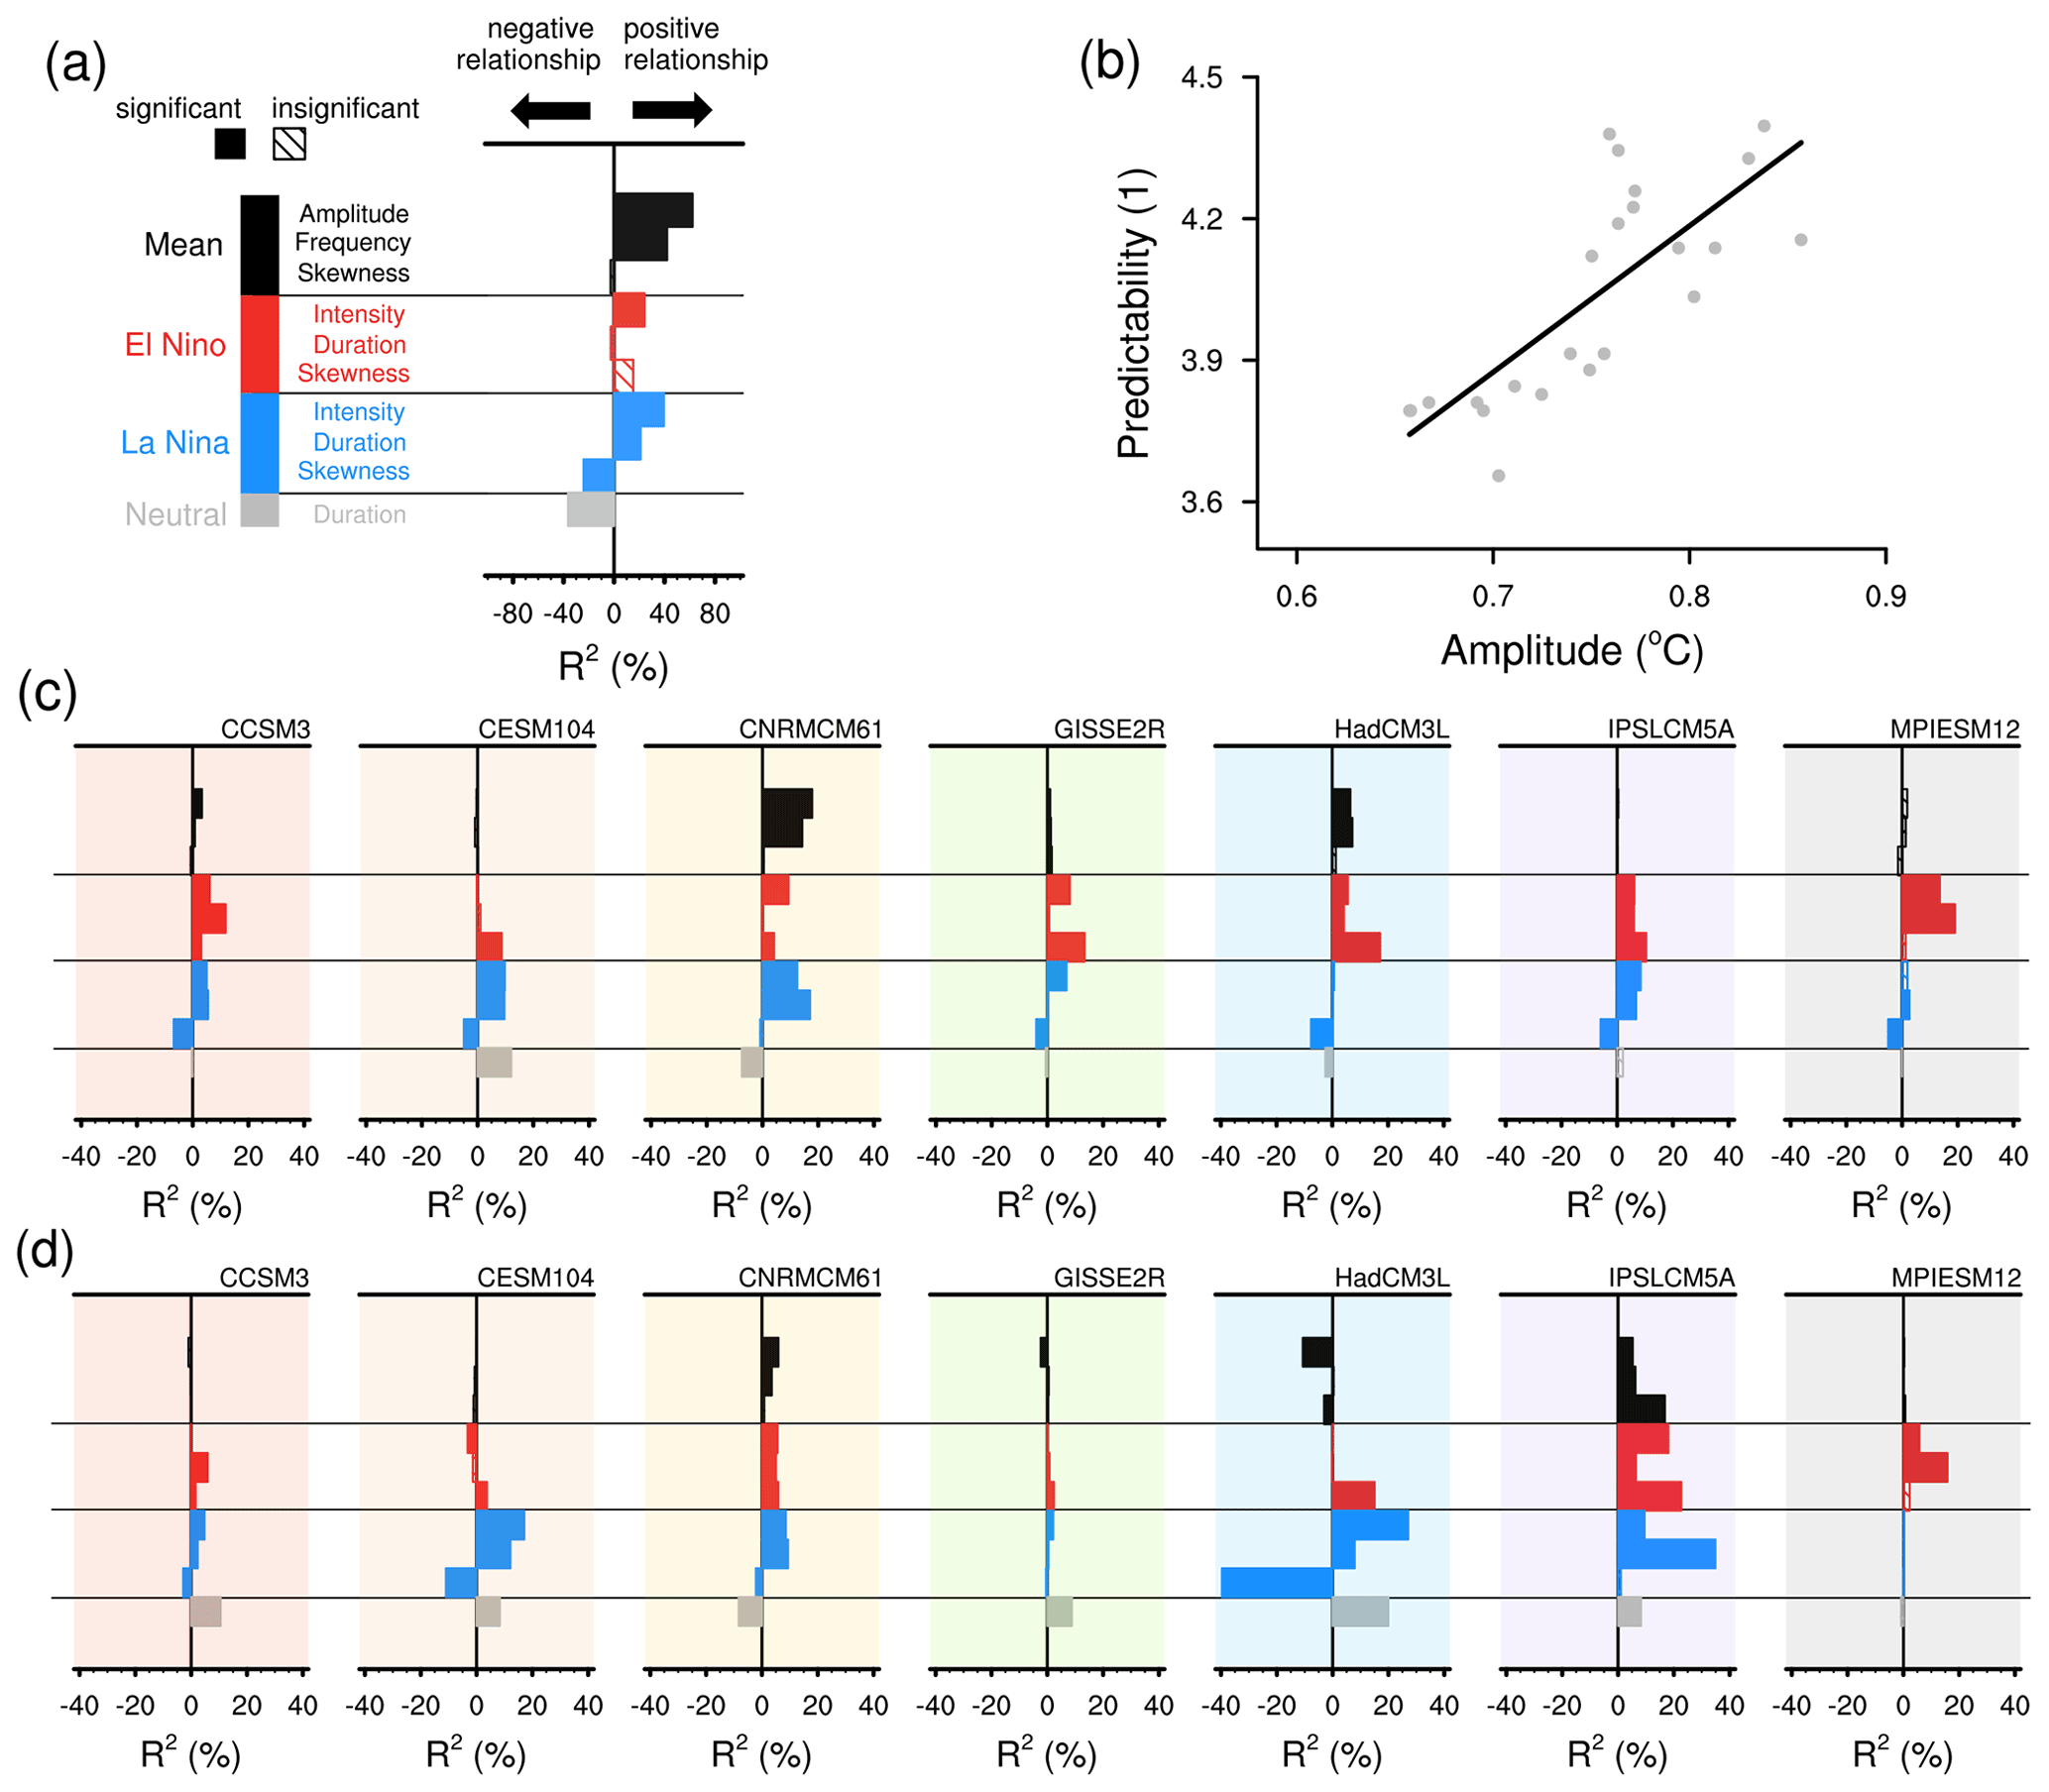
Figure 8(a) R2 values in the observations, which are calculated from regression analyses between 10 ENSO metrics and predictability as shown in the label bar. (b) Example plot of the regression analysis that represents the uppermost bar in (a). The small gray dots are 30-year chunks from the time series, and the line shows the regression slope. (c) Similar to (a) but for the control. (d) Similar to (a) and (c) with regression analyses between changes in ENSO characteristics and predictability. The sign of the bars represents the sign of the regression slopes. The solid (hatched) bars represent regression slopes that significantly (insignificantly) differ from zero.
3.3 Changes in ENSO characteristics–predictability relationship
3.3.1 The relationship in the observations
In the observations, the characteristics–predictability relationship is principally significant for most of the analyzed characteristics for all states (Fig. 8a). The ENSO mean predictability increases when ENSO in general is stronger (R2=62 %) and less red (R2=42 %). La Niña's predictability is higher when the events are stronger (R2=39 %) and longer-lasting (R2=21 %) and the Niño3.4 distribution more skewed to favor the La Niña state (R2=24 %). Similarly, the neutral state is more predictable when the events are shorter (R2=36 %). As for El Niño's predictability, it only significantly relates to the intensity of El Niño events (R2=24 %). In summary, in the observations, ENSO predictability is affected by ENSO amplitude, which is attributed from the intensity of both El Niño and La Niña states.
3.3.2 The relationship in the control
In the control, signs and significance of the characteristics–predictability relationship are model-dependent; the overall contribution of ENSO characteristics to ENSO predictability is lower than in the observations. For the mean, the relationship between ENSO predictability and ENSO amplitude is significant across four models (Fig. 8c). Looking at individual models, CNRMCM61 shows the largest R2 value in relationships of the mean predictability to ENSO amplitude (18 %) and frequency (14 %), while GISSE2R is the only model that shows significance in all three relationships but demonstrates extremely small R2 values (1 % for amplitude, 1 % for frequency and 2 % for skewness).
For active ENSO states, the relationships between El Niño's predictability and its characteristics are significant across at least five models (Fig. 8c). Looking at individual models, MPIESM12 shows the largest R2 values in relationships of the predictability to El Niño's intensity (14 %) and duration (19 %), but the smallest R2 value in the skewness–predictability relationship. Similarly, the characteristics–predictability relationships of the La Niña state are significant in at least five models. CNRMCM61 shows the largest R2 values in relationships of the predictability to La Niña's intensity (13 %) and duration (17 %).
For the neutral state, the relationship between its duration and predictability is significant for four models, while the sign of the relationship is model-dependent. CESM104 shows the largest R2 value (12 %) in such a relationship, while CNRMCM61 shows the second-largest R2 (7 %) but matches the sign of the relationship apparent in the observations (Fig. 8a).
In summary, the ENSO characteristics–predictability relationship is overall lower in the models in the control than in the observations. In the control, ENSO predictability is mainly affected by states' intensity and duration, counter to ENSO mean characteristics, which dominate in the observations.
3.3.3 The relationship in the changes
Moving from the relationship in the observations and the control, we regress changes in ENSO predictability onto changes in ENSO characteristics, for which the change is the difference between the control and abrupt4xCO2. Similar to the relationship in the control, the sign and significance of relationships of changes are model-dependent. The contribution of changes in ENSO characteristics to predictability becomes more divergent across models but overall even lower than in the control. The amplitude–predictability relationship is significant across four models (Fig. 8d). Among models that show significant results, HadCM3L has the largest R2 value in the amplitude–predictability relationship (11 %), and IPSLCM5A has the largest R2 in the skewness–predictability relationships (17 %). However, models with the strongest relationships between changes in predictability and changes in amplitude and skewness exhibit erroneous signs of the respective relationships compared to the observations.
For active ENSO states, on the one hand, the relationships between changes in El Niño's predictability and its characteristics are significant across four models (Fig. 8d). Among models which show significant results, IPSLCM5A has the largest R2 in the relationships of changes in predictability to changes in El Niño's intensity (18 %) and the skewness (23 %); MPIESM12 has the largest R2 in the duration–predictability relationship (16 %). On the other hand, the characteristics–predictability relationships of changes in the La Niña state are significant in four of seven models (Fig. 8d). Among models which show significant results, HadCM3L has the largest R2 in the relationships of changes in predictability to changes in La Niña's intensity (27 %) and the skewness (40 %), and IPSLCM5A has the largest R2 in the duration–predictability relationship (35 %). Four out of seven models in the control agree with the observations that El Niño and La Niña states typically end in spring (March–May; figure not shown). In abrupt4xCO2, active states end around 1 to 3 months earlier than in the control, which shortens their decaying phase and advances the transition to the neutral state. The persistence model fails to predict such a transition correctly, explaining the sharp decrease in the persistence skills from February onward (Fig. 5) and leading to the decreased predictability (Fig. 6e and f).
For the neutral state, the relationship between changes in its duration and predictability is significant in five out of seven models, with four models showing a positive and one model showing a negative relationship (Fig. 8d). CNRMCM61 is the only model that shows a significant and negative duration–predictability relationship (8 %), agreeing with the observations, while four models show a positive relationship with the mean R2 value at 14 %. For these four models, we find that the increased duration of the neutral state exercises two effects on its predictability. On the one hand, an increased duration of neutral states decreases the duration of active states. The decreased duration of active states fastens their transitions to the neutral state, which decreases the predictability of the neutral state, as its earlier occurrence cannot be predicted by the November initialization of the persistence model. On the other hand, the pronounced increase in the neutral state causes each neutral event to last on average 13 months longer in abrupt4xCO2 than in the control (Fig. 6g). This cross-year duration increases the persistence of the neutral state and improves its predictability. Overall, because the predictability of the neutral state in these four models decreases (Fig. 7d), we deduce that the effect of early occurrence of the neutral state during the spring overcompensates the effect of its cross-year duration on the predictability change.
We find that the relationships of ENSO states are more significant and have higher R2 values than relationships of the mean. The characteristics we analyze are not independent, as they may offset each other's contributions or have two competing effects on the predictability change. Thus, we suspect that the mean characteristics (amplitude, frequency and skewness) may be too aggregated to be as clearly related to the mean predictability change as the states' characteristics (intensity and duration). Furthermore, given that ENSO is a highly nonlinear process, it is likely that the three ENSO states respond to external forcings differently (e.g., Cai et al., 2015). This highlights the importance of decomposing different ENSO states from the mean ENSO behavior in order to study ENSO response to an external forcing.
In summary, R2 values are relatively large in the observations, lower in the control, more divergent, and even lower in changes between abrupt4xCO2 and the control. We suspect that it might be attributed to model parameterizations and tuning processes that models simulate ENSO events for wrong reasons (e.g., Bayr et al., 2019; Dommenget et al., 2014). However, the difference between the magnitudes of the feedback (Fig. 3) seems to be unrelated to magnitudes of the R2 values between changes in ENSO characteristics and predictability.
We study the equilibrated ENSO response to abruptly quadrupled CO2 forcing in seven models from the LongRunMIP archive. We analyze changes in the whole time series of the Niño3.4 index, as well as separate El Niño, La Niña and neutral states. Our results show the following.
- 1.
ENSO mean characteristics significantly change in a warmer climate. The ENSO amplitude and the skewness of the Niño3.4 index distribution decrease, agreeing with findings in Callahan et al. (2021) and Kohyama et al. (2018). The ENSO frequency decreases, which is different from the transient ENSO response analyzed in Berner et al. (2020).
- 2.
ENSO states' characteristics significantly change in a warmer climate. The decreased intensity of El Niño and La Niña states is different from the transient ENSO response shown in other studies (e.g., Cai et al., 2021).
The weakening in ENSO characteristics can be seen in both ultra-high-resolution models and proxy records. Wengel et al. (2021) showed a decreased ENSO amplitude in a model with 0.25∘ resolution in the atmosphere and 0.1∘ in the ocean, which is both qualitatively and quantitatively consistent with our results (compare their Fig. 4a with our Fig. 6a). White and Ravelo (2020) showed a reduced El Niño amplitude during the early Pliocene, during which the climate closely resembles the one projected in the RCP4.5 scenario (Burke et al., 2018).
From the robust response of ENSO characteristics under abrupt4xCO2 forcing, we would expect ENSO predictability to change similarly (e.g., Jin et al., 2008; Liu et al., 2022).
- 3.
We find that ENSO predictability reduces for the mean and the three ENSO states in five out of seven models. However, the changes are small and statistically insignificant.
We find a relationship between ENSO characteristics and predictability in the observational record and test whether models reproduce that relationship with and without forcing. We find the following.
- 4.
In the observations, this relationship is strong. The mean ENSO characteristics and La Niña state's characteristics explain more than 60 % of the variance in ENSO predictability.
- 5.
In the control, this relationship is weaker. Although the regression slopes significantly differ from zero, the ENSO characteristics only explain 20 % of variance in ENSO predictability.
- 6.
In changes between the control and abrupt4xCO2, the regression slopes are significant. The decreased ENSO mean characteristics correlate to the decreased ENSO predictability, consistent with previous studies (e.g., DelSole et al., 2014; Berner et al., 2020; Tang et al., 2008). The decreased intensity of active ENSO states correlates with the decreased predictability, consistent with results from Jin et al. (2008), and with the decreased duration, which reduces the persistence skills mainly in spring. While the slopes are significant, the explained variance of changes in ENSO predictability by ENSO characteristics is overall small, though some models show R2 values being around 40 %. This reduction in explained variances probably contributes to changes in ENSO predictability being insignificant.
Dommenget and Vijayeta (2019) studied the inconsistent change between ENSO characteristics and predictability under RCP8.5 scenarios relative to the historical simulation, which can be attributed to compensating effects of changes in the growth rate of the thermocline depth and sea surface temperature. While this might explain our results as well, we cannot verify this hypothesis, due to the lack of monthly ocean data in LongRunMIP. Aside from changes in ENSO characteristics studied here, other factors influence ENSO predictability: ENSO phase-locking (e.g., Jin and Kinter, 2009), the Atlantic Niño (e.g., Martín-Rey et al., 2015), the Pacific Decadal Oscillation (e.g., Kumar et al., 2013) and volcanic eruptions (e.g., Khodri et al., 2017; Singh et al., 2020). However, given our findings that changes in the persistence-assessed predictability are very small, we suspect changes in these factors barely contribute to predictability changes or offset each other. Instead of the persistence forecast, other dynamical prediction models could be used to analyze whether ENSO predictability in warmer climates is indeed unchanged or, if a significant change is detected, whether its relationship to previously revealed ENSO characteristics sustains. In addition, ENSO predictability is also affected by model development such as improved physical parameterizations, refined spatial and temporal resolutions, and reduced biases in air–sea interaction (e.g., Chen and Cane, 2008; Tang et al., 2018; Guilyardi et al., 2020; Lu et al., 2020; Fredriksen et al., 2020).
To conclude, if our set of simulations were representative of possible real-world changes, we do not find robust reasons to expect global warming to substantially alter 6-lead-month ENSO predictability. Yet, given the large range suggested by the different models, further analysis and deeper understanding of unforced control states and the expected changes under global warming as well as their implications are necessary to be able to reduce the large uncertainties in the present assessment.
Data sets are available at https://mountainscholar.org/handle/10217/234545 (Zheng et al., 2022).
YZ and MR formulated research questions and goals. MR provided the LongRunMIP simulations. YZ, PP and GB conducted statistical analyses on the data. MR and JB supervised the research. YZ produced figures and prepared the manuscript with contributions from all co-authors.
The contact author has declared that none of the authors has any competing interests.
Publisher's note: Copernicus Publications remains neutral with regard to jurisdictional claims in published maps and institutional affiliations.
We thank the two anonymous referees for their constructive comments in the interactive discussion. This work used the resource of the Deutsche Klimarechenzentrum (DKRZ). More information on LongRunMIP can be found under http://ww.longrunmip.org (last access: 29 July 2021).
The work of Yiyu Zheng, Patrick Pieper and Johanna Baehr was funded by the Deutsche Forschungsgemeinschaft (DFG, German Research Foundation) under Germany’s Excellence Strategy – EXC 2037 “CLICCS – Climate, Climatic 15 Change, and Society” – project number 390683824, a contribution to the Center for Earth System Research and Sustainability (CEN) of Universität Hamburg.
This paper was edited by Anders Levermann and reviewed by two anonymous referees.
An, S.-I., Kug, J.-S., Ham, Y.-G., and Kang, I.-S.: Successive modulation of ENSO to the future greenhouse warming, J. Climate, 21, 3–21, 2008. a
Bayr, T., Wengel, C., Latif, M., Dommenget, D., Lübbecke, J., and Park, W.: Error compensation of ENSO atmospheric feedbacks in climate models and its influence on simulated ENSO dynamics, Clim. Dynam., 53, 155–172, 2019. a, b, c
Bellenger, H., Guilyardi, É., Leloup, J., Lengaigne, M., and Vialard, J.: ENSO representation in climate models: From CMIP3 to CMIP5, Clim. Dynam., 42, 1999–2018, 2014. a
Beobide-Arsuaga, G., Bayr, T., Reintges, A., and Latif, M.: Uncertainty of ENSO-amplitude projections in CMIP5 and CMIP6 models, Clim. Dynam., 56, 3875–3888, 2021. a
Berner, J., Christensen, H. M., and Sardeshmukh, P. D.: Does ENSO regularity increase in a warming climate?, J. Climate, 33, 1247–1259, 2020. a, b, c
Burke, K. D., Williams, J. W., Chandler, M. A., Haywood, A. M., Lunt, D. J., and Otto-Bliesner, B. L.: Pliocene and Eocene provide best analogs for near-future climates, P. Natl. Acad. Sci. USA, 115, 13288–13293, https://doi.org/10.1073/pnas.1809600115, 2018. a
Cai, W., Santoso, A., Wang, G., Yeh, S.-W., An, S.-I., Cobb, K. M., Collins, M., Guilyardi, E., Jin, F.-F., Kug, J.-S., Lengaigne, M., McPhaden, M. J., Takahashi, K., Timmermann, A., Vecchi, G., Watanabe, M., and Wu, L.: ENSO and greenhouse warming, Nat. Clim. Change, 5, 849–859, 2015. a
Cai, W., Santoso, A., Collins, M., Dewitte, B., Karamperidou, C., Kug, J.-S., Lengaigne, M., McPhaden, M. J., Stuecker, M. F., Taschetto, A. S., Timmermann, A., Wu, L., Yeh, S.-W., Wang, G., Ng, B., Jia, F., Yang, Y., Ying, J., Zheng, X.-T., Bayr, T., Brown, J. R., Capotondi, A., Cobb, K. M., Gan, B., Geng, T., Ham, Y.-G., Jin, F.-F., Jo, H.-S., Li, X., Lin, X., McGregor, S., Park, J.-H., Stein, K., Yang, K., Zhang, L., and Zhong, W.: Changing El Niño–Southern Oscillation in a warming climate, Nat. Rev. Earth Environ., 2, 628–644, 2021. a
Callahan, C. W., Chen, C., Rugenstein, M., Bloch-Johnson, J., Yang, S., and Moyer, E. J.: Robust decrease in El Niño/Southern Oscillation amplitude under long-term warming, Nat. Clim. Change, 11, 752–757, 2021. a, b, c, d
Cane, M. A., Zebiak, S. E., and Dolan, S. C.: Experimental forecasts of El Niño, Nature, 321, 827–832, 1986. a
Chapman, D., Cane, M. A., Henderson, N., Lee, D. E., and Chen, C.: A vector autoregressive ENSO prediction model, J. Climate, 28, 8511–8520, 2015. a
Chen, D. and Cane, M. A.: El Niño prediction and predictability, J. Comput. Phys., 227, 3625–3640, 2008. a
Chen, D., Zebiak, S. E., Cane, M. A., and Busalacchi, A. J.: Initialization and predictability of a coupled ENSO forecast model, Mon. Weather Rev., 125, 773–788, 1997. a
Christensen, J. H., Kanikicharla, K. K., Aldrian, E., An, S. I., Cavalcanti, I. F. A., de Castro, M., Dong, W., Goswami, P., Hall, A., Kanyanga, J. K., Kitoh, A., Kossin, J., Lau, N.-C., Renwick, J., Stephenson, D. B., Xie, S.-P., and Zhou, T.: Climate phenomena and their relevance for future regional climate change, in: Climate change 2013 the physical science basis: Working group I contribution to the fifth assessment report of the intergovernmental panel on climate change, Cambridge University Press, 1217–1308, https://doi.org/10.1017/CBO9781107415324.028, 2013. a
DelSole, T., Yan, X., Dirmeyer, P. A., Fennessy, M., and Altshuler, E.: Changes in seasonal predictability due to global warming, J. Climate, 27, 300–311, 2014. a, b
Dommenget, D. and Vijayeta, A.: Simulated future changes in ENSO dynamics in the framework of the linear recharge oscillator model, Clim. Dynam., 53, 4233–4248, 2019. a
Dommenget, D., Haase, S., Bayr, T., and Frauen, C.: Analysis of the Slab Ocean El Nino atmospheric feedbacks in observed and simulated ENSO dynamics, Clim. Dynam., 42, 3187–3205, 2014. a
Fredriksen, H.-B., Berner, J., Subramanian, A. C., and Capotondi, A.: How Does El Niño–Southern Oscillation Change Under Global Warming – A First Look at CMIP6, Geophys. Res. Lett., 47, e2020GL090640, https://doi.org/10.1029/2020GL090640, 2020. a, b
GISTEMP Team: GISS Surface Temperature Analysis, Tech. Rep. Version 4, NASA Goddard Institute for Space Studies, https://data.giss.nasa.gov/gistemp/, last access: 6 March 2022. a
Guilyardi, E.: El Niño–mean state–seasonal cycle interactions in a multi-model ensemble, Clim. Dynam., 26, 329–348, 2006. a
Guilyardi, E., Bellenger, H., Collins, M., Ferrett, S., Cai, W., and Wittenberg, A.: A first look at ENSO in CMIP5, Clivar Exchanges, 17, 29–32, 2012. a
Guilyardi, E., Capotondi, A., Lengaigne, M., Thual, S., and Wittenberg, A. T.: ENSO Modeling, in: chap. 9, AGU – American Geophysical Union, 199–226, https://doi.org/10.1002/9781119548164.ch9, 2020. a
Ham, Y.-G., Kim, J.-H., and Luo, J.-J.: Deep learning for multi-year ENSO forecasts, Nature, 573, 568–572, 2019. a
Jin, E. K. and Kinter III, J. L.: Characteristics of tropical Pacific SST predictability in coupled GCM forecasts using the NCEP CFS, Clim. Dynam., 32, 675–691, 2009. a
Jin, E. K., Kinter, J. L., Wang, B., Park, C.-K., Kang, I.-S., Kirtman, B., Kug, J.-S., Kumar, A., Luo, J.-J., Schemm, J., Shukla, J., and Yamagata, T.: Current status of ENSO prediction skill in coupled ocean–atmosphere models, Clim. Dynam., 31, 647–664, 2008. a, b, c, d
Khodri, M., Izumo, T., Vialard, J., Janicot, S., Cassou, C., Lengaigne, M., Mignot, J., Gastineau, G., Guilyardi, E., Lebas, N., Robock, A., and McPhaden, M. J.: Tropical explosive volcanic eruptions can trigger El Niño by cooling tropical Africa, Nat. Commun., 8, 1–13, 2017. a
Knaff, J. A. and Landsea, C. W.: An El Niño–Southern Oscillation climatology and persistence (CLIPER) forecasting scheme, Weather Forecast., 12, 633–652, 1997. a
Knutson, T. R., Manabe, S., and Gu, D.: Simulated ENSO in a global coupled ocean–atmosphere model: Multidecadal amplitude modulation and CO2 sensitivity, J. Climate, 10, 138–161, 1997. a
Kohyama, T., Hartmann, D. L., and Battisti, D. S.: Weakening of nonlinear ENSO under global warming, Geophys. Res. Lett., 45, 8557–8567, 2018. a, b
Kumar, A., Wang, H., Wang, W., Xue, Y., and Hu, Z.-Z.: Does knowing the oceanic PDO phase help predict the atmospheric anomalies in subsequent months?, J. Climate, 26, 1268–1285, 2013. a
Lenssen, N. J. L., Schmidt, G. A., Hansen, J. E., Menne, M. J., Persin, A., Ruedy, R., and Zyss, D.: Improvements in the GISTEMP Uncertainty Model, J. Geophys. Res.-Atmos., 124, 6307–6326, https://doi.org/10.1029/2018JD029522, 2019. a
L'Heureux, M. L., Levine, A. F. Z., Newman, M., Ganter, C., Luo, J.-J., Tippett, M. K., and Stockdale, T. N.: ENSO Prediction, in: chap. 10, AGU – American Geophysical Union, 227–246, https://doi.org/10.1002/9781119548164.ch10, 2020. a
Lindsey, R.: In watching for El Niño and La Niña, NOAA adapts to global warming, Climate Watch, https://www.climate.gov/news-features/understanding-climate/watching-el-nino-and-la-nina-noaa-adapts-global-warming (last access: 8 November 2022), 2013. a
Liu, T., Song, X., Tang, Y., Shen, Z., and Tan, X.: ENSO Predictability over the Past 137 Years Based on a CESM Ensemble Prediction System, J. Climate, 35, 763–777, 2022. a, b
Lloyd, J., Guilyardi, E., Weller, H., and Slingo, J.: The role of atmosphere feedbacks during ENSO in the CMIP3 models, Atmos. Sci. Lett., 10, 170–176, 2009. a
Lu, F., Harrison, M. J., Rosati, A., Delworth, T. L., Yang, X., Cooke, W. F., Jia, L., McHugh, C., Johnson, N. C., Bushuk, M., Zhang, Y., and Adcroft, A.: GFDL's SPEAR seasonal prediction system: Initialization and ocean tendency adjustment (OTA) for coupled model predictions, J. Adv. Model. Earth Syst., 12, e2020MS002149, https://doi.org/10.1029/2020MS002149, 2020. a
Maher, N., Matei, D., Milinski, S., and Marotzke, J.: ENSO change in climate projections: Forced response or internal variability?, Geophys. Res. Lett., 45, 11–390, 2018. a
Martín-Rey, M., Rodríguez-Fonseca, B., and Polo, I.: Atlantic opportunities for ENSO prediction, Geophys. Res. Lett., 42, 6802–6810, 2015. a
Rugenstein, M., Bloch-Johnson, J., Abe-Ouchi, A., Andrews, T., Beyerle, U., Cao, L., Chadha, T., Danabasoglu, G., Dufresne, J.-L., and Duan, L.: LongRunMIP: Motivation and design for a large collection of millennial-length AOGCM simulations, B. Am. Meteorol. Soc., 100, 2551–2570, 2019. a, b
Singh, M., Krishnan, R., Goswami, B., Choudhury, A. D., Swapna, P., Vellore, R., Prajeesh, A., Sandeep, N., Venkataraman, C., Donner, R. V., Marwan, N., and Kurths, J.: Fingerprint of volcanic forcing on the ENSO–Indian monsoon coupling, Sci. Adv., 6, eaba8164, https://doi.org/10.1126/sciadv.aba8164, 2020. a
Stevenson, S., Fox-Kemper, B., Jochum, M., Rajagopalan, B., and Yeager, S. G.: ENSO model validation using wavelet probability analysis, J. Climate, 23, 5540–5547, 2010. a
Sun, C., Liu, L., Li, L.-J., Wang, B., Zhang, C., Liu, Q., and Li, R.-Z.: Uncertainties in simulated El Niño–Southern Oscillation arising from internal climate variability, Atmos. Sci. Lett., 19, e805, https://doi.org/10.1002/asl.805, 2018. a
Tang, Y., Deng, Z., Zhou, X., Cheng, Y., and Chen, D.: Interdecadal variation of ENSO predictability in multiple models, J. Climate, 21, 4811–4833, 2008. a
Tang, Y., Zhang, R.-H., Liu, T., Duan, W., Yang, D., Zheng, F., Ren, H., Lian, T., Gao, C., Chen, D., and Mu, M.: Progress in ENSO prediction and predictability study, Nat. Sci. Rev., 5, 826–839, 2018. a, b
Timmermann, A., An, S.-I., Kug, J.-S., Jin, F.-F., Cai, W., Capotondi, A., Cobb, K. M., Lengaigne, M., McPhaden, M. J., Stuecker, M. F., Stein, K., Wittenberg, A. T., Yun, K.-S., Bayr, T., Chen, H.-Ch., Chikamoto, Y., Dewitte, B., Dommenget, D., Grothe, P., Guilyardi, E., Ham, Y.-G., Hayashi, M., Ineson, S., Kang, D., Kim, S., Kim, W., Lee, J.-Y., Li, T., Luo, J.-J., McGregor, S., Planton, Y., Power, S., Rashid, H., Ren, H.-L., Santoso, A., Takahashi, K., Todd, A., Wang, G., Wang, G., Xie, R., Yang, W.-H., Yeh, S.-W., Yoon, J., Zeller, E., and Zhang, X.: El Niño–southern oscillation complexity, Nature, 559, 535–545, 2018. a
Wang, C.: A review of ENSO theories, Nat. Sci. Rev., 5, 813–825, 2018. a
Wengel, C., Lee, S.-S., Stuecker, M. F., Timmermann, A., Chu, J.-E., and Schloesser, F.: Future high-resolution El Niño/Southern Oscillation dynamics, Nat. Clim. Change, 11, 758–765, 2021. a
White, S. M. and Ravelo, A. C.: Dampened El Niño in the Early Pliocene Warm Period, Geophys. Res. Lett., 47, e2019GL085504, https://doi.org/10.1029/2019GL085504, 2020. a
Wilks, D. S.: Statistical Methods in the Atmospheric Sciences, in: vol. 100, Academic Press, ISBN 978-0-12-385022-5, 2011. a, b
Zheng, X.-T., Hui, C., and Yeh, S.-W.: Response of ENSO amplitude to global warming in CESM large ensemble: uncertainty due to internal variability, Clim. Dynam., 50, 4019–4035, 2018. a
Zheng, Y., Rugenstein, M., Pieper, P., Beobide-Arsuaga, G., and Baehr, J.: Dataset associated with “ENSO predictability in equilibrated warmer climates”, Colorado State University [data set], https://mountainscholar.org/handle/10217/234545, last access: 11 November 2022. a
Zhu, X.: A missing source of uncertainty: forcing-dependent model parameter sensitivity, Environ. Res. Commun., 3, 051006, https://doi.org/10.1088/2515-7620/abfe18, 2021. a