the Creative Commons Attribution 4.0 License.
the Creative Commons Attribution 4.0 License.
 | 20 Feb 2018
Projected changes in crop yield mean and variability over West Africa in a world 1.5 K warmer than the pre-industrial era
Ben Parkes
Dimitri Defrance
Benjamin Sultan
Philippe Ciais
Xuhui Wang
The ability of a region to feed itself in the upcoming decades is an important issue. The West African population is expected to increase significantly in the next 30 years. The responses of crops to short-term climate change is critical to the population and the decision makers tasked with food security. This leads to three questions: how will crop yields change in the near future? What influence will climate change have on crop failures? Which adaptation methods should be employed to ameliorate undesirable changes?
An ensemble of near-term climate projections are used to simulate maize, millet and sorghum in West Africa in the recent historic period (1986–2005) and a near-term future when global temperatures are 1.5 K above pre-industrial levels to assess the change in yield, yield variability and crop failure rate. Four crop models were used to simulate maize, millet and sorghum in West Africa in the historic and future climates.
Across the majority of West Africa the maize, millet and sorghum yields are shown to fall. In the regions where yields increase, the variability also increases. This increase in variability increases the likelihood of crop failures, which are defined as yield negative anomalies beyond 1 standard deviation during the historic period. The increasing variability increases the frequency of crop failures across West Africa. The return time of crop failures falls from 8.8, 9.7 and 10.1 years to 5.2, 6.3 and 5.8 years for maize, millet and sorghum respectively.
The adoption of heat-resistant cultivars and the use of captured rainwater have been investigated using one crop model as an idealized sensitivity test. The generalized doption of a cultivar resistant to high-temperature stress during flowering is shown to be more beneficial than using rainwater harvesting.
- Article
(2030 KB) - Full-text XML
-
Supplement
(236 KB) - BibTeX
- EndNote


The densely populated region of West Africa has been identified as a region vulnerable to climate change impacts, from shifts in the monsoon system to desertification. The global climate is projected to pass 1.5 K above the pre-industrial control in the coming decades (Kirtman et al., 2013). To maintain current levels of food intake the crop yields in West Africa will need to increase in step with the increasing population. All countries within West Africa are currently net importers of cereals, indicating that their current production is insufficient to meet demand (FAOSTAT, 2014). The existing trends in African agriculture are not sufficient to provide this yield increase and shortages are therefore expected without the adverse effects of climate change (Gerland et al., 2014; Ray et al., 2013).
The changes to the global climate will have local implications on the growing conditions for crops. The primary source of water for West African crops is the West African monsoon. Studies have shown that the monsoon may start later in the year in West Africa under climate change; this in turn exposes the crops to the summer months when temperatures are higher (Biasutti and Sobel, 2009; Sultan et al., 2014).
Temperatures and rainfall are not the only drivers of crop yield that are expected to change; there are also possible changes in fertilizer deployment and thus nutrient availability (Lassaletta et al., 2014) as well as farmers' adaptation, e.g. through irrigation (Rockström and Falkenmark, 2000) or planting heat- and drought-resistant varieties in the case of dryer and warmer conditions (Guan et al., 2017).
A factor is the increase in ambient carbon dioxide concentrations and therefore the potential carbon dioxide fertilization of yields (Berg et al., 2013). This is primarily for C3 plants; the carboxylation of C4 plants is insensitive to carbon dioxide but carbon dioxide impacts maize development through stomatal closure and soil moisture conservation (Leakey, 2009).
There have been multiple studies investigating the future of maize, millet and sorghum yields in West Africa. A meta-analysis of 52 studies for several crops without adaptation show reductions in African yield by the 2050s of 5, 10 and 15 % for maize, millet and sorghum respectively (Knox et al., 2012).
The reduction in yields in Africa under climate change is further supported by the meta-analysis in Roudier et al. (2011) in which multiple crops were shown to experience decreases in yield. The meta-analysis in Roudier et al. (2011) used a number of climate scenarios including A1B, A2 and B1 from CMIP3 (Meehl et al., 2007) with time horizons varying from 2025 to 2085; the majority of the publications analysed did not study adaptation methods. The results in Roudier et al. (2011) investigate the importance of the carbon dioxide fertilization effect, which was found the ameliorate some of the yield losses attributed to climate change. However, it has also been shown that the nutritional quality of the resultant crops is lower than in an atmosphere with current carbon dioxide concentrations (Roudier et al., 2011). Much of the area currently used to grow maize in West Africa is also projected to be unsuitable in the long term. With a future climate based on RCP8.5, only 59.8 % of the currently cultivated area is predicted to be viable in 2100 (Rippke et al., 2016). Of the lost cultivated area, 40 % can be used to grow sorghum or millet, which are hardier to heat and drought stresses; however, the remaining 60 % has no suitable alternative (Rippke et al., 2016). The millet and sorghum growing areas, however, are not predicted to suffer as much as maize. Many of the above-mentioned studies use climate projections that find high warming levels at the end of the century.
The expected change in yield for maize was also calculated as part of a meta-analysis in which the response of maize to increasing temperatures with and without adaptation methods was investigated. The temperature changes were locally analysed and grouped independent of carbon dioxide fertilization of global climate conditions. Tropical maize was found to experience a decline in yields as temperatures increase for both studies with and without adaptation (Challinor et al., 2014). There are multiple potential adaptation methods to ameliorate the impacts of climate change, a non-exhaustive list contains intercropping, changing the variety or species grown, and use of fertilizers and crop rotation to replenish nutrients in the soil.
Several adaptation methods for sorghum were investigated in Guan et al. (2017) using two crop models for a future climate period of 2031–2060 under a RCP8.5 climate. The proposed adaptation methods included changing the planting date, rainwater capture and re-use, and increasing resilience to high-temperature stress during flowering, amongst others. The results in Guan et al. (2017) show that growing varieties with high temperature stress resistance during flowering is of more benefit in the future climate than rainwater harvesting. Sorghum yields are expected to decrease with climate change based on simulations using data from RCP8.5 and between 2031 and 2060; while carbon dioxide fertilization will ameliorate some of the losses, it will not eliminate them (Sultan et al., 2014). Lastly, for millet a model analysis produced an expected reduction in yields of 6 % by 2070–2099 when compared with 1970–1999 across the A1B and A2 scenarios from CMIP3 (Berg et al., 2013).
In this paper we use four crop models simulating three crops and driven by meteorological outputs from several regional climate models. Three C4 crops have been selected for this analysis: maize, sorghum and millet. They are staple foods over much of West Africa and important sources of many nutrients. The aim of this paper is to produce probabilistic projections of West African crop yields as the global climate passes 1.5 K above the pre-industrial control. This study makes use of newly available input data from CORDEX-Africa to differentiate from previous works. There are several possible responses to the increasing temperatures and altered precipitation regimes: these include modifying the planting window, using a new variety of a crop or changing the crop entirely. Two adaptation methods to mitigate the impacts of climate change have been investigated. These methods include an idealized crop that is resistant to heat stress during flowering and rainwater harvesting. A global temperature increase of 1.5 K is drawing closer, with annual average carbon dioxide levels above 400 ppm in 2016.
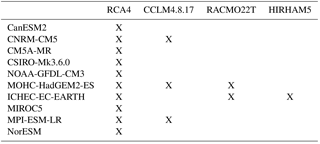
Table 1GCMs and RCMs, where X indicates a RCM–GCM combination used in this study. The RCM description papers are as follows: RCA4 (Chylek et al., 2011), RACMO22T (van Meijgaard et al., 2008), HIRHAM5 (Christensen et al., 2006). The GCM description papers are as follows: CNRM-CM5 (Voldoire et al., 2013), CM5A-MR (Dufresne et al., 2013), CSIRO-Mk3.6.0 (Rotstayn et al., 2012), NOAA-GFDL-CM3 (Griffies et al., 2011), MOHC-HadGEM2-ES (Jones et al., 2011), ICHEC-EC-EARTH (Hazeleger et al., 2012), MIROC5 (Watanabe et al., 2010), MPI-ESM-LR (Raddatz et al., 2007), NorESM (Bentsen et al., 2013).
2.1 Meteorological data
The input data for the crop models in this study were provided as part of the CORDEX-Africa project (Nikulin et al., 2012). CORDEX-Africa uses a selection of CMIP5 global climate models (GCMs) to drive a number of regional climate models (RCMs). The simulations used in this study are based on CMIP5 simulations of a high emission, low adaptation future climate in which the radiative forcing at the end of the 21st century is +8.5 W m−2, (RCP8.5) (Meinshausen et al., 2011; Taylor et al., 2011). The outputs from CORDEX-Africa were bias corrected as part of the HELIX project using multisegmental statistical bias correction (Grillakis et al., 2013; Papadimitriou et al., 2015). The observations used to bias correct the CORDEX-Africa simulations came from the WATCH-Forcing-Data-ERA-Interim: WFDEI (Weedon et al., 2014) record. The bias-corrected CORDEX-Africa data were provided at a horizontal resolution of 0.44∘ and at a temporal resolution of 1 day. The multisegmental approach of the bias correction adjusts the simulated variability to closely match the observed variability and in doing so removes a number of drizzle events from the record and increases the intensity of wetter events to match the observations (Papadimitriou et al., 2015).
The CORDEX-Africa simulations were found to perform well at replicating the large-scale features of the West African climate, including the inter-annual variability (IAV) in precipitation (Diaconescu et al., 2015). The precipitation in West Africa is primarily driven by the north–south motion of the monsoon (Nikulin et al., 2012). The CORDEX-Africa models were found to contain biases despite their good performance and therefore bias-corrected model outputs were selected for further analysis (Gbobaniyi et al., 2014).
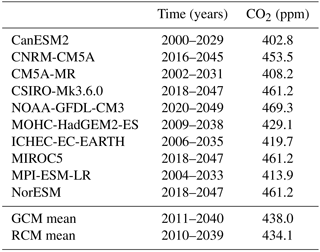
An ensemble of 10 GCMs and four RCMs was used as input to crop models and a total of 16 GCM–RCM combinations were utilized. None of the GCMs were used to drive the RCMs and of the RCMs, only RCA4 was used with every GCM. The GCM–RCM combinations used is shown in Table 1. The control time slice for the experiment was 1986–2005, corresponding to the final 20 years of the CMIP5 historic simulations. The future time slice was taken as the 30-year period when the global average temperature was closest to 1.5 K above the pre-industrial control of 1870–1899. The time slices used for this experiment and the mean time slices weighted by both GCMs and RCMs are shown in Table 2. The GCM and RCM weighted mean time slices are within a year of each other at 2011–2040 and 2010–2039 respectively. The crop models that simulate carbon dioxide fertilization also use the carbon dioxide concentrations as inputs for the future climate scenarios reached by each GCM when warming reaches 1.5 K. Thus, because of different transient climate responses of the GCMs, the crop models are exposed to different carbon dioxide concentrations for each GCM climate forcing. Our choice of not normalizing the carbon dioxide levels for simulating crop yields is justified because we want to capture the full uncertainty of West African yield responses to both regional climate and global carbon dioxide conditions in a 1.5 K warmer world.
Table 2GCM time slices at +1.5 K and their corresponding carbon dioxide concentrations.
2.2 Crop models
Four different crop models were used in this study: the Global Large Area Model for annual crops (GLAM) (Challinor et al., 2004); ORCHIDEE-CROP (Wu et al., 2016), which is the crop-specific version of the ORganizing Carbon and Hydrology in Dynamic EcosystEms (ORCHIDEE) land surface model (Krinner et al., 2005); System of Agroclimatological Regional Risk Analysis Version H (SARRA-H) (Kouressy et al., 2008) and a series of generalized linear models (Lobell and Burke, 2010). The planting and harvest dates for the crop models were determined using data generated as part of the Global Gridded Crop Model Intercomparison project (Elliott et al., 2015).
2.2.1 GLAM
GLAM is a process-based crop model that simulates the growth of a crop on the scale of grid cells used in climate models (Challinor et al., 2004; Parkes et al., 2015). GLAM uses four meteorological inputs: maximum and minimum daily temperatures and downwelling shortwave radiation and precipitation, all at the surface. GLAM used the maize yield data along with soil quantities taken from the Digital Soil Map of the World as input using the approach described in Vermeulen et al. (2013). GLAM uses an intelligent planting system to wait for soil moisture to reach a predefined limit before planting occurs. The parameter set for maize used in this study is based on the one used in Vermeulen et al. (2013). The routine for high-temperature stress at flowering was enabled: if the maximum daily temperature is above 37 ∘C the yield is reduced; above 45 ∘C the yield is set to zero (Challinor et al., 2005, 2015). To test the importance of high-temperature stress during flowering, this routine is disabled. The rainwater-harvesting routine used in GLAM stores any run-off from the top layer of the soil in a reservoir; the reservoir is tapped when the soil moisture falls below the wilting limit. The amount of water released from the reservoir is enough to bring the soil up to 80 % of the drained upper limit or the totality of the water stored. GLAM does not have a parameter set for sorghum or millet and therefore was not used to simulate those crops. The carbon dioxide fertilization effect is simulated by increasing the transpiration efficiency of the crop; this is based on the mean carbon dioxide concentration for the simulated time period.
2.2.2 ORCHIDEE-CROP
ORCHIDEE-CROP is a land surface crop model based on the generic vegetation model ORCHIDEE (Krinner et al., 2005), simulating carbon, water, and energy fluxes (e.g. photosynthesis, respiration and evapotranspiration) and modules specifically designed to represent crop processes. The version of ORCHIDEE-CROP used in this study includes a crop phenology module (Wu et al., 2016) and crop management modules (Wang, 2016), and has also submitted results for global gridded crop model intercomparison (Müller et al., 2017). ORCHIDEE-CROP calculates thermal unit accumulation, photosynthesis and energy exchange on a half-hourly time step, while leaf area dynamics, carbon allocation, and biomass and soil organic carbon change are simulated on a daily time step. The daily climate variables driving the model include maximum and minimum daily temperatures, downwelling shortwave and longwave radiation, surface pressure, wind speed, and precipitation. The parameter set of maize was tested against a field experiment site in Ghana (Larvor, 2016). ORCHIDEE-CROP like GLAM does not have a parameter set for sorghum or millet and was therefore not used to simulate those crops.
2.2.3 SARRA-H
SARRA-H is a simple deterministic crop model for cereals operating at daily time steps (Baron et al., 2005; Dingkuhn et al., 2003; Kouressy et al., 2008) that simulates the growth of a crop on an adaptive scale of grid cells depending on the input data for sorghum (90 or 120 days or photoperiodic), millet (90 or 120 days or photoperiodic) and maize (90 or 120 days). The performance in the analysis of climate impacts on tropical cereals is good (Mishra et al., 2008; Oettli et al., 2011). The yields are simulated under water-limited conditions by simulating the soil water balance, potential and actual evapotranspiration, phenology, potential and water-limited carbon assimilation, and biomass partitioning (see Kouressy et al., 2008, for a detailed review of model concepts). The carbon dioxide fertilization effect is not yet simulated. The optimum temperature is between 34 and 36 ∘C and the limit temperature is between 44 and 46 ∘C following the crop spices. The SARRA-H model does not explicitly simulate the effects of fertilizer, manure application or residue on crop yields but reproduces different levels of fertility (F1 F4). The ratio between F1 and F4 rate is calibrated with a field survey in Burkina Faso. Sowing starts when plant-available soil moisture is greater than 8 mm at the end of the day and after the date determined by kriged field farmers survey. The establishment of the crop is monitored during the following 20 days and if the condition is not correct during this period, the juvenile crop died and a re-sowing was automatically carried out. SARRA-H (Sultan et al., 2014) uses five daily meteorological inputs: maximum and minimum temperatures, downwelling shortwave radiation, precipitation, and potential evapotranspiration (Hargreaves formula), all at the surface. Other inputs are also used: soil depth and soil water holding capacity and sowing density and depth.
2.2.4 Linear models
The linear models use a design that has been used in several previous studies (Estes et al., 2013; Lobell and Burke, 2010; Parkes et al., 2017; Wang et al., 2016). The models in this study use the robust linear fitting tools in MATLAB (Holland and Welsch, 1977) that are less sensitive to outliers than least-squares fitting. The input data for the model have been polynomially detrended before fitting and the log of the yield was taken; this means the models produce relative changes in yield instead of absolute ones. The polynomial detrending used in the models is a two-degree polynomial solved for each grid cell. The models solve the equation shown in Eq. (1), where a, b and c are constants for each grid cell and T and P are the seasonal mean temperature and total precipitation respectively.
2.2.5 Differences in the crop models
Both GLAM and ORCHIDEE-CROP were used to simulate maize; SARRA-H and the generalized linear models were used to simulate maize, sorghum and millet. GLAM and ORCHIDEE-CROP both respond to carbon dioxide fertilization and ORCHIDEE-CROP has nitrogen fertilizer inputs as part of the simulated crop growth. The crop models all simulate crops based on a single planting and harvest without multicropping. GLAM and the linear models use observational yield as an input; in both cases the input yield is detrended using a two-degree polynomial before use. This detrending removes consistent trends such as management changes and technological improvements. GLAM, unlike the other models, was calibrated specifically for these simulations whereas ORCHIDEE-CROP and SARRA-H used pre-defined parameter sets. The SARRA-H parameters were based on a study area in Burkina Faso. The process-based models are time dependent and respond to the arrival of the monsoon. The linear models, however, only use the seasonal total precipitation. Linear models suffer with reduced accuracy outside the parameter space used to train them. In the short term, linear models are not notably worse than process-based models (Lobell and Asseng, 2017).
2.3 Agronomic data
The crop model's outputs were all analysed against their ability to reproduce observed crop yields and variability. The gridded input crop data for maize were taken from a dataset built from satellite observations combined with yields reported by the Food and Agriculture Organization of the United Nations (FAO) (FAOSTAT, 2014; Iizumi and Ramankutty, 2016; Iizumi et al., 2014). The millet and sorghum data were country level data from the FAO (FAOSTAT, 2014). The cultivated areas for maize, millet and sorghum were defined by regridding the results from Monfreda et al. (2008) on the meteorological grid. To prevent the results being swamped by signals from grid cells with low cultivated area (Challinor et al., 2015), any grid cell with less than 1 % coverage of each crop type of interest was eliminated.
3.1 Crop model results
The four crop models were driven using the outputs of the four bias-corrected CORDEX-Africa RCM simulations as listed in Table 1. The CORDEX-Africa simulations were driven by 10 GCMs as part of CMIP5. We present the first use of these data for a specific warming level of 1.5 K above the pre-industrial control. An annotated map of the analysed area is shown in Fig. S1 in the Supplement.
Table 3Simulated maize yields (kg ha−1) in West Africa for observations and four crop models for the historic time period and at 1.5 K. The first uncertainty value is the inter-annual variability and the second is the spread across the RCM–GCM ensemble.
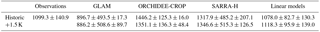
Table 4Simulated millet yields (kg ha−1) in West Africa for observations and four crop models for the historic time period and at 1.5 K. The first uncertainty value is the inter-annual variability and the second is the spread across the RCM–GCM ensemble.
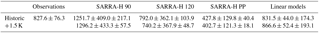
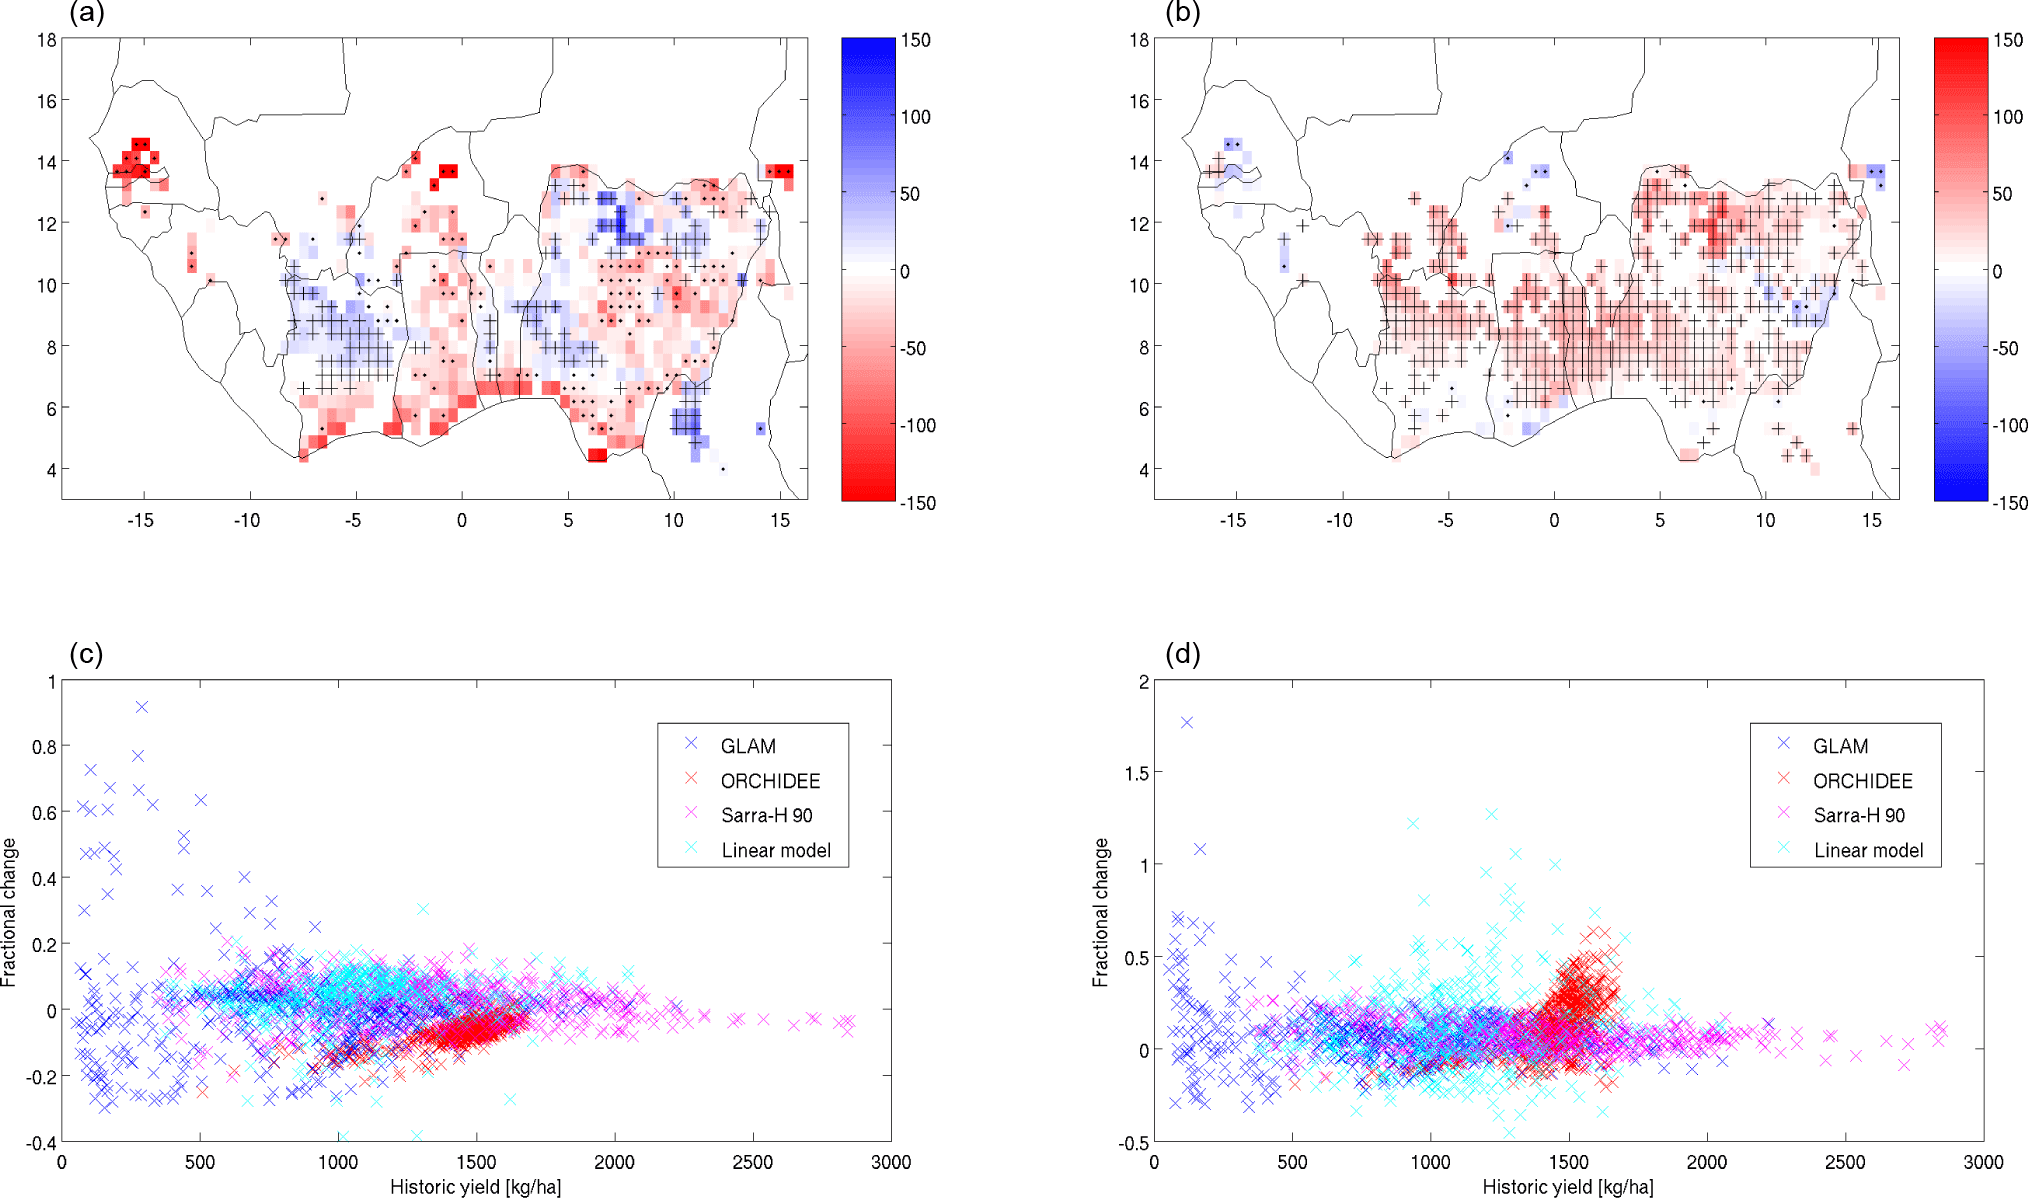
Figure 1Change in maize yield and yield IAV between the historic and future climates. Panel (a) shows the change in yield, where + indicates that in three crop models the change will be positive and ⋅ indicates that in three crop models the change will be negative. Panel (b) is the same as (a) except for IAV instead of yield. The units of the colour bar in the top plots is kilograms per hectare. Panel (c) shows the fractional change in yield against yield for all analysed grid cells. Panel (d) shows the fractional change in yield IAV against yield for all analysed grid cells.
The results in Fig. 1 show the multi-model mean maize yield and yield IAV. The + and ⋅ symbols show grid cells in which three of the four crop models agree with the sign of the response for the multi-model GCM–RCM mean, where + shows an increase and ⋅ shows a decrease. The model agreement is high in Côte d'Ivoire and Ghana but there is a spread of positive and negative impacts across Nigeria. The potential increases in yield in Côte d'Ivoire and Nigeria are also associated with increases in IAV. The millet results are shown in Fig. 2, in which a dipole can be seen in the yield response. The yield increases in northern Nigeria and southern Niger; however, to the west in Burkina Faso and Mali there is a decrease in yields. The dipole is not as significant in the IAV results, with increases in IAV in Niger, Nigeria and Burkina Faso. The IAV along with the yield in Mali is reduced. The stippled Sorghum results (Fig. 3) present a smaller dipole effect that shows a positive yield change in Niger and a negative yield change over much of West Africa. Where the yield increases in Niger, the IAV also increases, which is expected to cause problems for food security.
The multi-model ensemble mean yields for the control and future time slices are calculated for each crop model and shown in Tables 3–5. For each yield value, the results are shown with the IAV in the yield as the first uncertainty and the model spread as the second uncertainty. The observations are shown with a single uncertainty as they have no model spread. The results in Tables 3–5 show that the IAV is larger than the model spread for all crop models except the linear models. The ratio for the IAV in GLAM is much larger than for all other models; this is due to the simulations for the historical period in GLAM being calibrated on a per model basis and therefore having a very low model spread.
For maize (Table 3), of the process-based models GLAM and SARRA-H are closest to the observed yields whereas ORCHIDEE-CROP is further away. The linear models by design match the observed yields. The future climate responses for GLAM and SARRA-H are limited; however, ORCHIDEE-CROP shows a strong reduction in yields. SARRA-H and the linear models show an increase in yields at +1.5 K. The control simulation has temperatures that are 0.7 K above the pre-industrial control; therefore the temperature difference experienced by the crops is 0.8 K. The maize yield reductions are less than 10 ± 709 ± 91 kg ha−1 for GLAM and 95 ± 185 ± 51 kg ha−1 for ORCHIDEE-CROP, whereas SARRA-H increases by around 28 ± 708 ± 243 kg ha−1 and the linear models increase by 40 ± 127 ± 191 kg ha−1. In percentage terms these changes are less than 1.5 % for GLAM, 6.6 % for ORCHIDEE-CROP, 2.2 % for SARRA-H and 3.8 % for the linear models.
Table 5Simulated sorghum yields (kg ha−1) in West Africa for observations and four crop models for the historic time period and at 1.5 K. The first uncertainty value is the inter-annual variability and the second is the spread across the RCM–GCM ensemble.
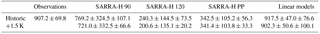

Figure 2Change in millet yield and yield IAV between the historic and future climates. Panel (a) shows the change in yield where + indicates that in three crop models the change will be positive and ⋅ indicates that in three crop models the change will be negative. Panel (b) is the same as (a) except for IAV instead of yield. The units of the colour bar in the top plots is kilograms per hectare. Panel (c) shows the fractional change in yield against yield for all analysed grid cells. Panel (d) shows the fractional change in yield IAV against yield for all analysed grid cells.
ORCHIDEE-CROP and GLAM simulate responses to carbon dioxide fertilization. Both models project a small reduction in yield in future climates, the magnitude of which has been reduced by the increase in yield from carbon dioxide fertilization. Carbon dioxide fertilization increases the yield when the crop is limited by carbon dioxide. If the crop is water limited then the carbon dioxide fertilization will have a smaller effect on yield. The yield losses in GLAM and ORCHIDEE-CROP are smaller than the mean reported in the meta-analysis by Knox et al. (2012). The Knox et al. (2012) results are for crops in the 2050s and therefore our results are expected to be smaller as they are for a closer time horizon. A second meta-analysis by Challinor et al. (2014) presents results by temperature change; our results at 1.5 K are within the range of results found in their analysis.
The multi-model ensemble yield results contain two sources of uncertainty, the IAV and the variability across the meteorological input datasets. The results in Table 3 show that ORCHIDEE-CROP has the most skill in reproducing the observed IAV followed by the linear models. Both GLAM and SARRA-H overestimate the IAV for maize. Despite these differences, the IAV increases for all models in the future climate scenario. For the process-based models the IAV is significantly larger than the variability, resulting from differences in input meteorological data. Both GLAM and ORCHIDEE-CROP show little variability across the input data in the control scenario. For ORCHIDEE-CROP, GLAM and the linear models the variability increases in the future climate; this is in contrast to the results in SARRA-H.
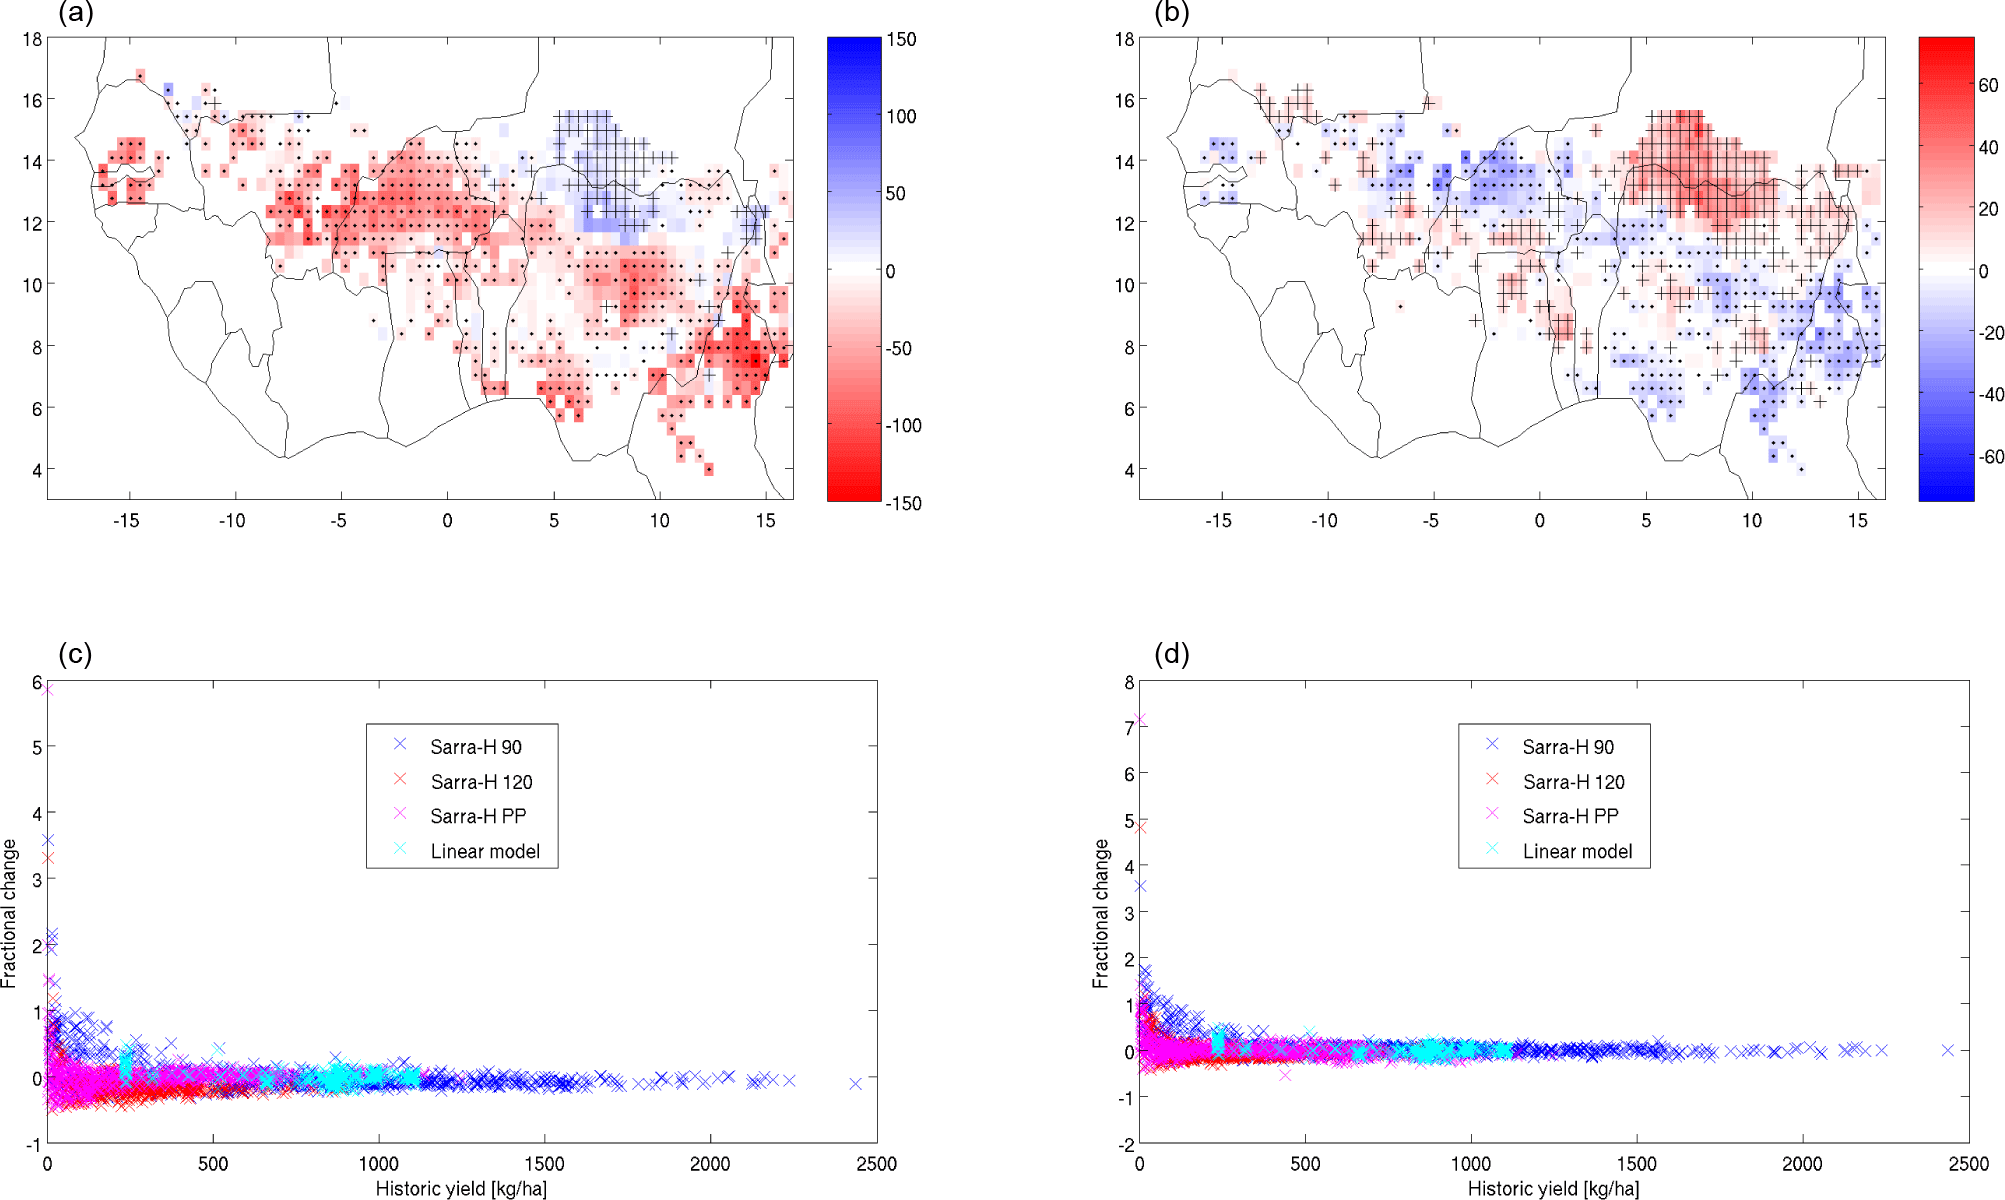
Figure 3Change in sorghum yield and yield IAV between the historic and future climates. Panel (a) shows the change in yield where + indicates that in three crop models the change will be positive and ⋅ indicates that in three crop models the change will be negative. Panel (b) is the same as (a) except for IAV instead of yield. The units of the colour bar in the top plots is kilograms per hectare. Panel (c) shows the fractional change in yield against yield for all analysed grid cells. Panel (d) shows the fractional change in yield IAV against yield for all analysed grid cells.
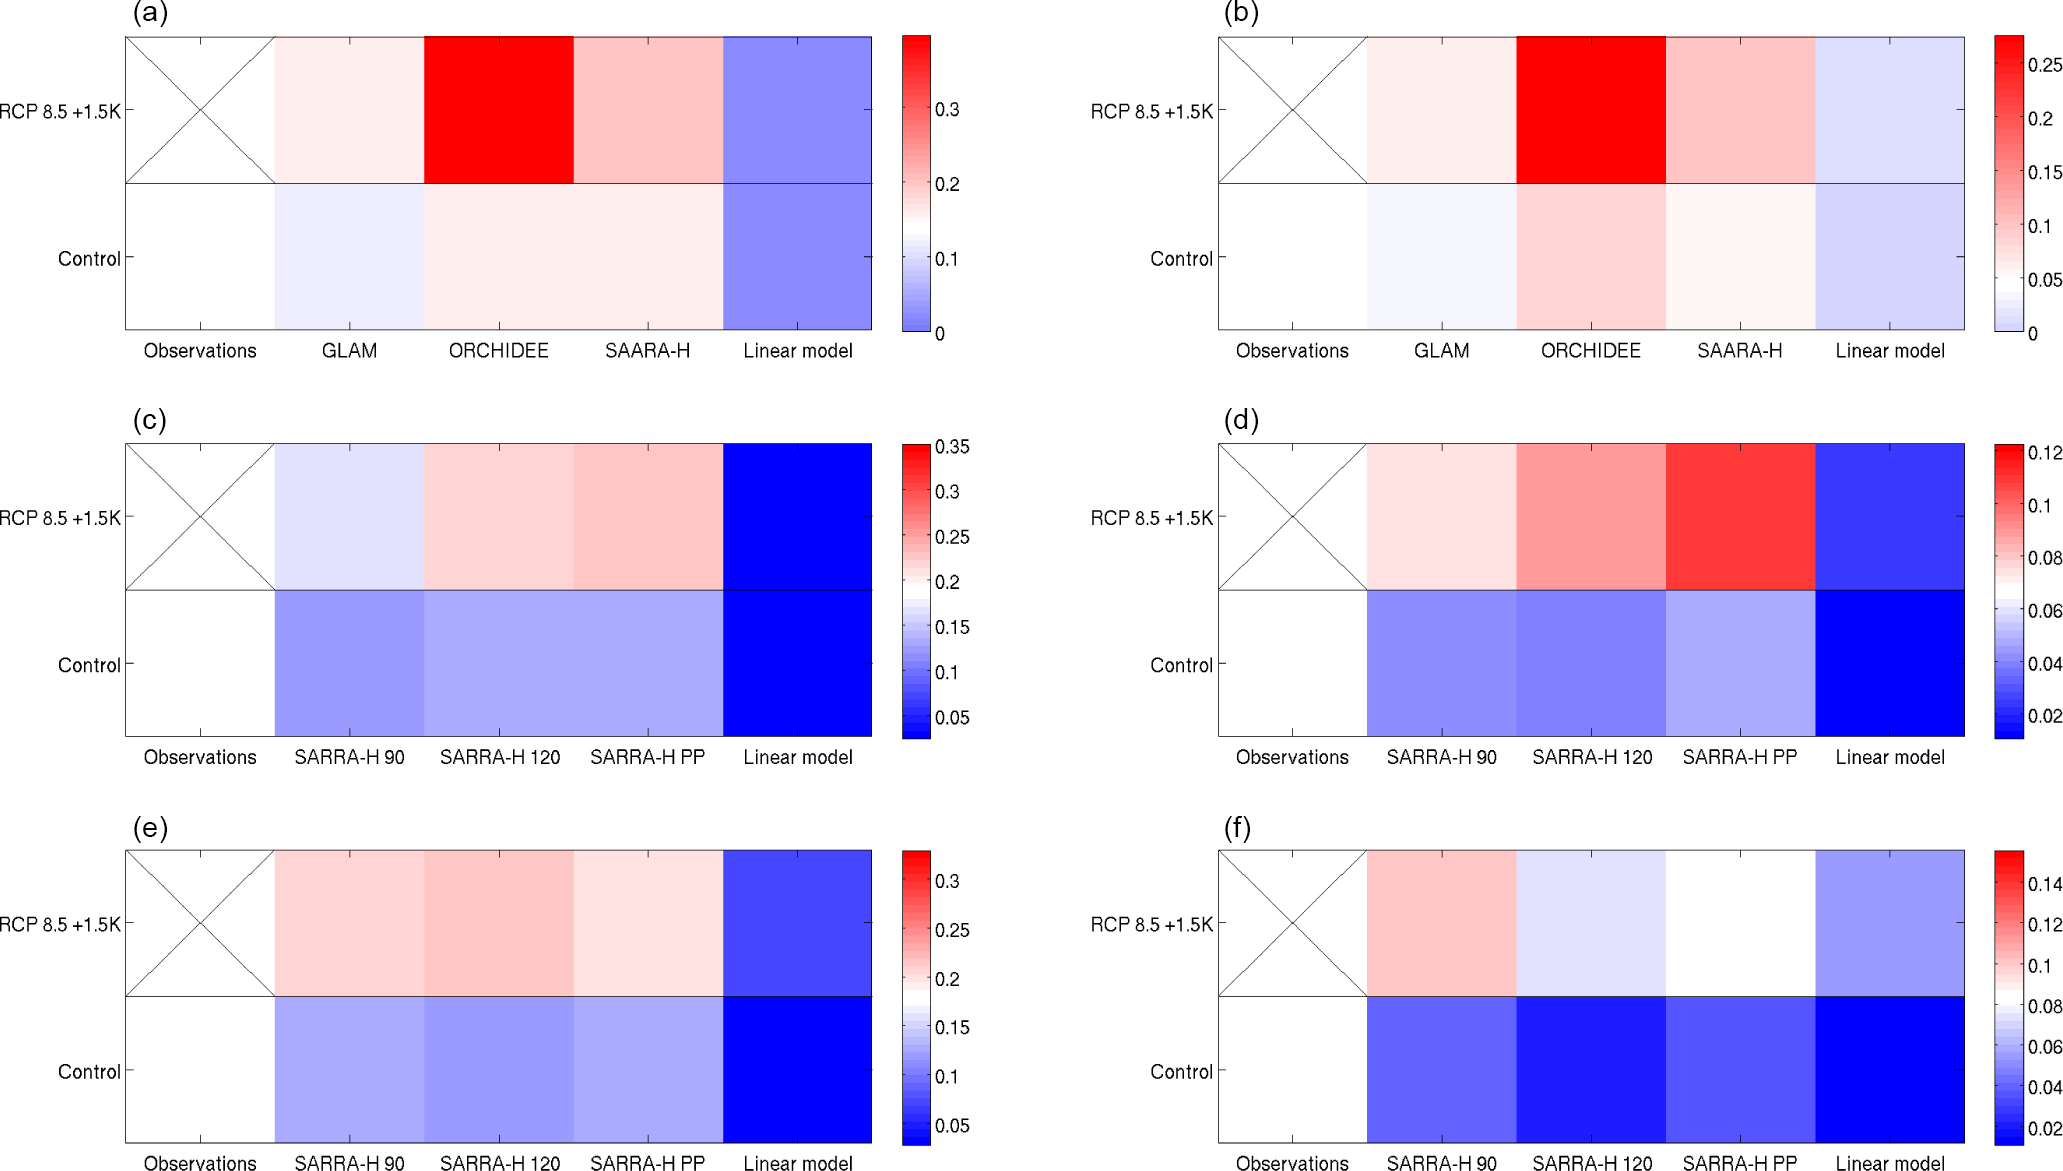
Figure 4Heat maps of mild (a, c, e) and severe (b, d, f) crop failures for maize (a, b), millet (c, d) and sorghum (e, f) in West Africa.
Table 6Percentage maize yield change by country. The number of grid cell analysed is in brackets and countries where fewer than 10 grid cells were analysed have been omitted. The production change is shown in the rightmost column in tonnes.
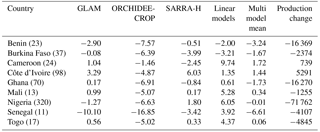
Figure 4 shows the mild and severe crop failure rate for maize in the control (20 years) and future (30 years) climate scenarios. A mild crop failure is 1 standard deviation below the observed yield for that grid cell; a severe crop failure is 1.5 SD (standard deviations) below the simulated yield for that grid cell in the historic simulation. The historic simulation is used to prevent model bias in yield from dominating the variability signal (Parkes et al., 2015). The number of crop failures is recorded for each grid cell and the total across the domain is calculated. The total number of simulations for a crop model is the number of analysed grid cells multiplied by the number of years of simulation. The total number of crop failures is divided by the total number of simulations to give a fractional number of crop failures; this is the crop failure rate with units of failures per grid cell per year. The inverse of the crop failure rate is the mean return time for a crop failure. GLAM slightly underestimates the mild crop failure rate, whereas ORCHIDEE-CROP and SARRA-H overestimate slightly. The differences, however, are minor in comparison to those found in the linear models. The severity of the change in mild crop failure rate varies across the process-based models but the signal is consistent; at 1.5 K above pre-industrial temperatures there is an expectation of more crop failures. ORCHIDEE-CROP is particularly pessimistic with the return time between crop failures falling from 6.1 to 2.5 years per grid cell. For severe crop failures the process-based models are again more realistic than the linear models. The future climate results show an increase in severe crop failures, with ORCHIDEE-CROP again showing the strongest response.
Table 7Percentage millet yield change by country. The number of grid cell analysed is in brackets and countries where fewer than 10 grid cells were analysed have been omitted. The production change is shown in the rightmost column in tonnes.
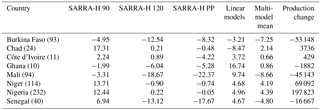
Table 8Percentage sorghum yield change by country. The number of grid cell analysed is in brackets and countries where fewer than 10 grid cells were analysed have been omitted. The production change is shown in the rightmost column in tonnes.
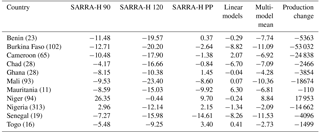
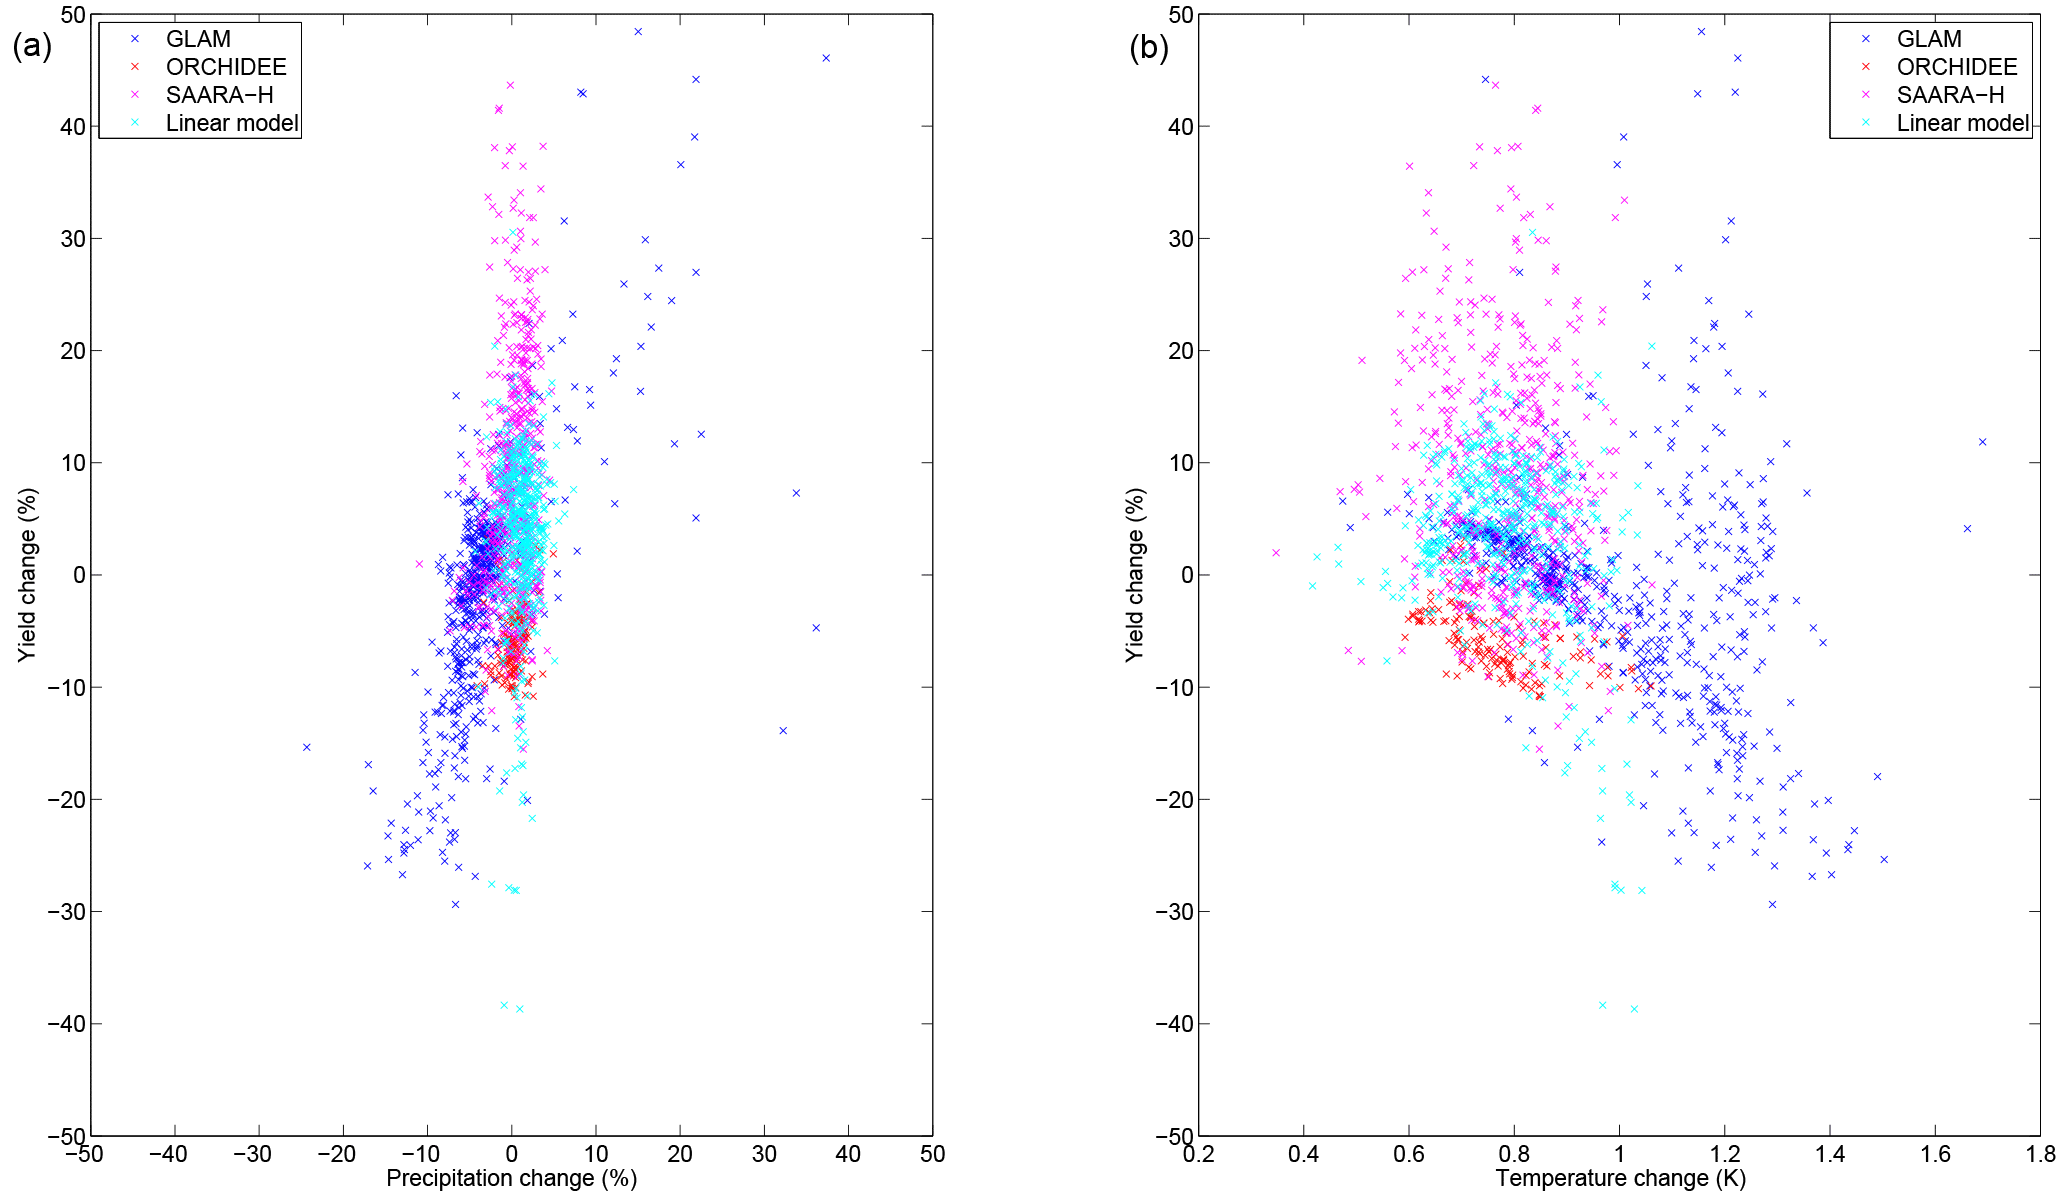
Figure 5Percentage maize yield change against precipitation (a) and temperature (b) for four crop models. This figure has a restricted x axis in the precipitation plot to enhance the clarity of the results and a full version is shown in Fig. S2.
The millet and sorghum analyses for three varieties simulated by the SARRA-H model and the linear models. The linear models are more able to predict the observed yield and IAV than SARRA-H for millet and sorghum (Tables 4 and 5). In the millet simulations the linear models are close to the observed yield whereas the SARRA-H varieties are spread above and below the observations. The yield changes are negative for the linear models and the SARRA-H 90-day variety. The three variants of SARRA-H, like the linear models, underestimate the frequency of crop failures in the control (Fig. 4); this is most likely a result of overestimating the IAV and therefore giving a too low limit for crop failure. The expected return time for a crop failure in the observations is 5.3 years, which is shorter than the 8.0, 7.4 and 7.8 years from SARRA-H varieties (90 day, 120 day, photoperiod sensitive) and drastically different from the 41.1 years in the linear models. For severe crop failures the models perform worse and the return time of 15 years is increased to 21 in the SARRA-H photoperiodic day variety, which is the best of the models. The future crop failure return time is consistently shorter than the historic, indicating more frequent crop failures.
For Sorghum, the SARRA-H 90-day cultivar is most capable of reproducing the observed yield; however, the yields are still about 15 % too low. The response of the 90-day cultivar to the future climate is consistent with the simulations in Sultan et al. (2014). As SARRA-H was used for both millet and sorghum, the results are similar to the overestimate of the IAV, causing an underestimate of the crop failure rate. The return time of a crop failure is 5.6 years in the observations but the SARRA-H varieties (90 day, 120 day, photoperiodic sensitive) find 7.8, 8.6, and 7.9 years and the linear models produce a return time of 35.5 years. The same features are found for the severe crop failures for which the return time is overestimated in all models.
The results in Tables 6–8 show the change in national yields for each model and the multi-model mean. The per-model production changes are averaged and shown in the rightmost columns of the tables. Countries with fewer than 10 grid cells analysed have been omitted from the tables. The results for maize show a spread in expected yield changes by nation, with Cameroon and Côte d'Ivoire experiencing an increase in yield. There are yield reductions in Benin, Burkina Faso, Ghana, Mali and Senegal, with limited changes in Nigeria and Togo. ORCHIDEE-CROP dominates the production change with a large negative change to highly productive nations including Ghana and Nigeria. Only Benin, Burkina Faso and Senegal are projected to suffer yield reductions in all four crop models for maize. In the future climate simulations at the 1.5 K warming level, Burkina Faso and Mali suffer a loss of more than 5 % in millet yields while Niger and Nigeria are projected to experience an increase of 4.2 and 4.2 %. These yield changes result in an increase in production that is dominated by Nigeria; however, production falls significantly for Burkina Faso, Mali and Senegal. The sorghum results (Table 8) nearly always show a yield reduction with climate change, with the exception of Niger, which has a yield increase. The sorghum results show a 10 % yield reduction for Burkina Faso, Mali and Senegal. The negative trends in the yields are also present in the production of sorghum in West Africa, with Niger being the only exception.
The results in Fig. 5 show the responses of the maize yield to changes in precipitation and temperature change for four crop models. To highlight the responses of precipitation changes between −50 and +50 % the x axis of the left figure is truncated, a full version of the figure is shown in Fig. S2. The maize yields in all models show an increase in yield with increasing precipitation. A negative trend is also present with increasing temperatures. The differences between the crop models can be seen in these figures. The results in ORCHIDEE-CROP show less variability than SARRA-H, GLAM or the linear models and have a strong negative yield response for a limited temperature change. The temperature change experienced by the crops simulated in GLAM covers a larger range than the other models and the positive relationship between precipitation and yield is also shown. Water scarcity has a smaller impact on SARRA-H and the linear models than in GLAM or ORCHIDEE-CROP, and the SARRA-H results do not show a strong negative response to higher temperatures.
3.2 Adaptation results
In one of the four crop models (GLAM), simulations of two idealized adaptation methods were performed. There were three experiments: crops with a resistance to high-temperature stress during flowering, crops grown with rainwater harvesting and crops resistant to high-temperature stress with rainwater harvesting deployed. To simulate a crop resistant to high-temperature stress GLAM is rerun with the high-temperature stress routine disabled; a description of high-temperature stress in flowering is found in Challinor et al. (2005). Disabling the high-temperature stress routine produces an unphysical crop and is used to give guidance on the importance of high-temperature stress. The rainwater harvesting system collects run-off from the crop and stores it with 50 % efficiency; the water is deployed if the soil moisture falls below the wilting limit for the crop. The adaptation methods are simulated in both the control climate and the future climate.
The adaptation results for GLAM (Fig. 6) show that rainwater harvesting provides a smaller increase in yields in the global 1.5 K warmer climate than in the historic climate. The results for the return time between crop failures show an improvement in the control climate that is greater than in the future climate. In contrast the crops resistant to high-temperature stress show a benefit in both cases and a larger benefit in future climates. The return time between crop failures also increases more in future climates. However, when combined with rainwater harvesting, high-temperature stress resistance has a smaller relative improvement than when it is deployed in isolation. The maize results from GLAM presented here show similar responses to the sorghum results in Guan et al. (2017) in which high-temperature stress resistance is more important than rainwater harvesting. This result needs to be considered alongside the results in Fig. 5, which show a strong negative precipitation response in GLAM, indicating that the rainwater harvesting routine, while providing some extra water does not provide enough to counteract the precipitation changes in the future simulations.
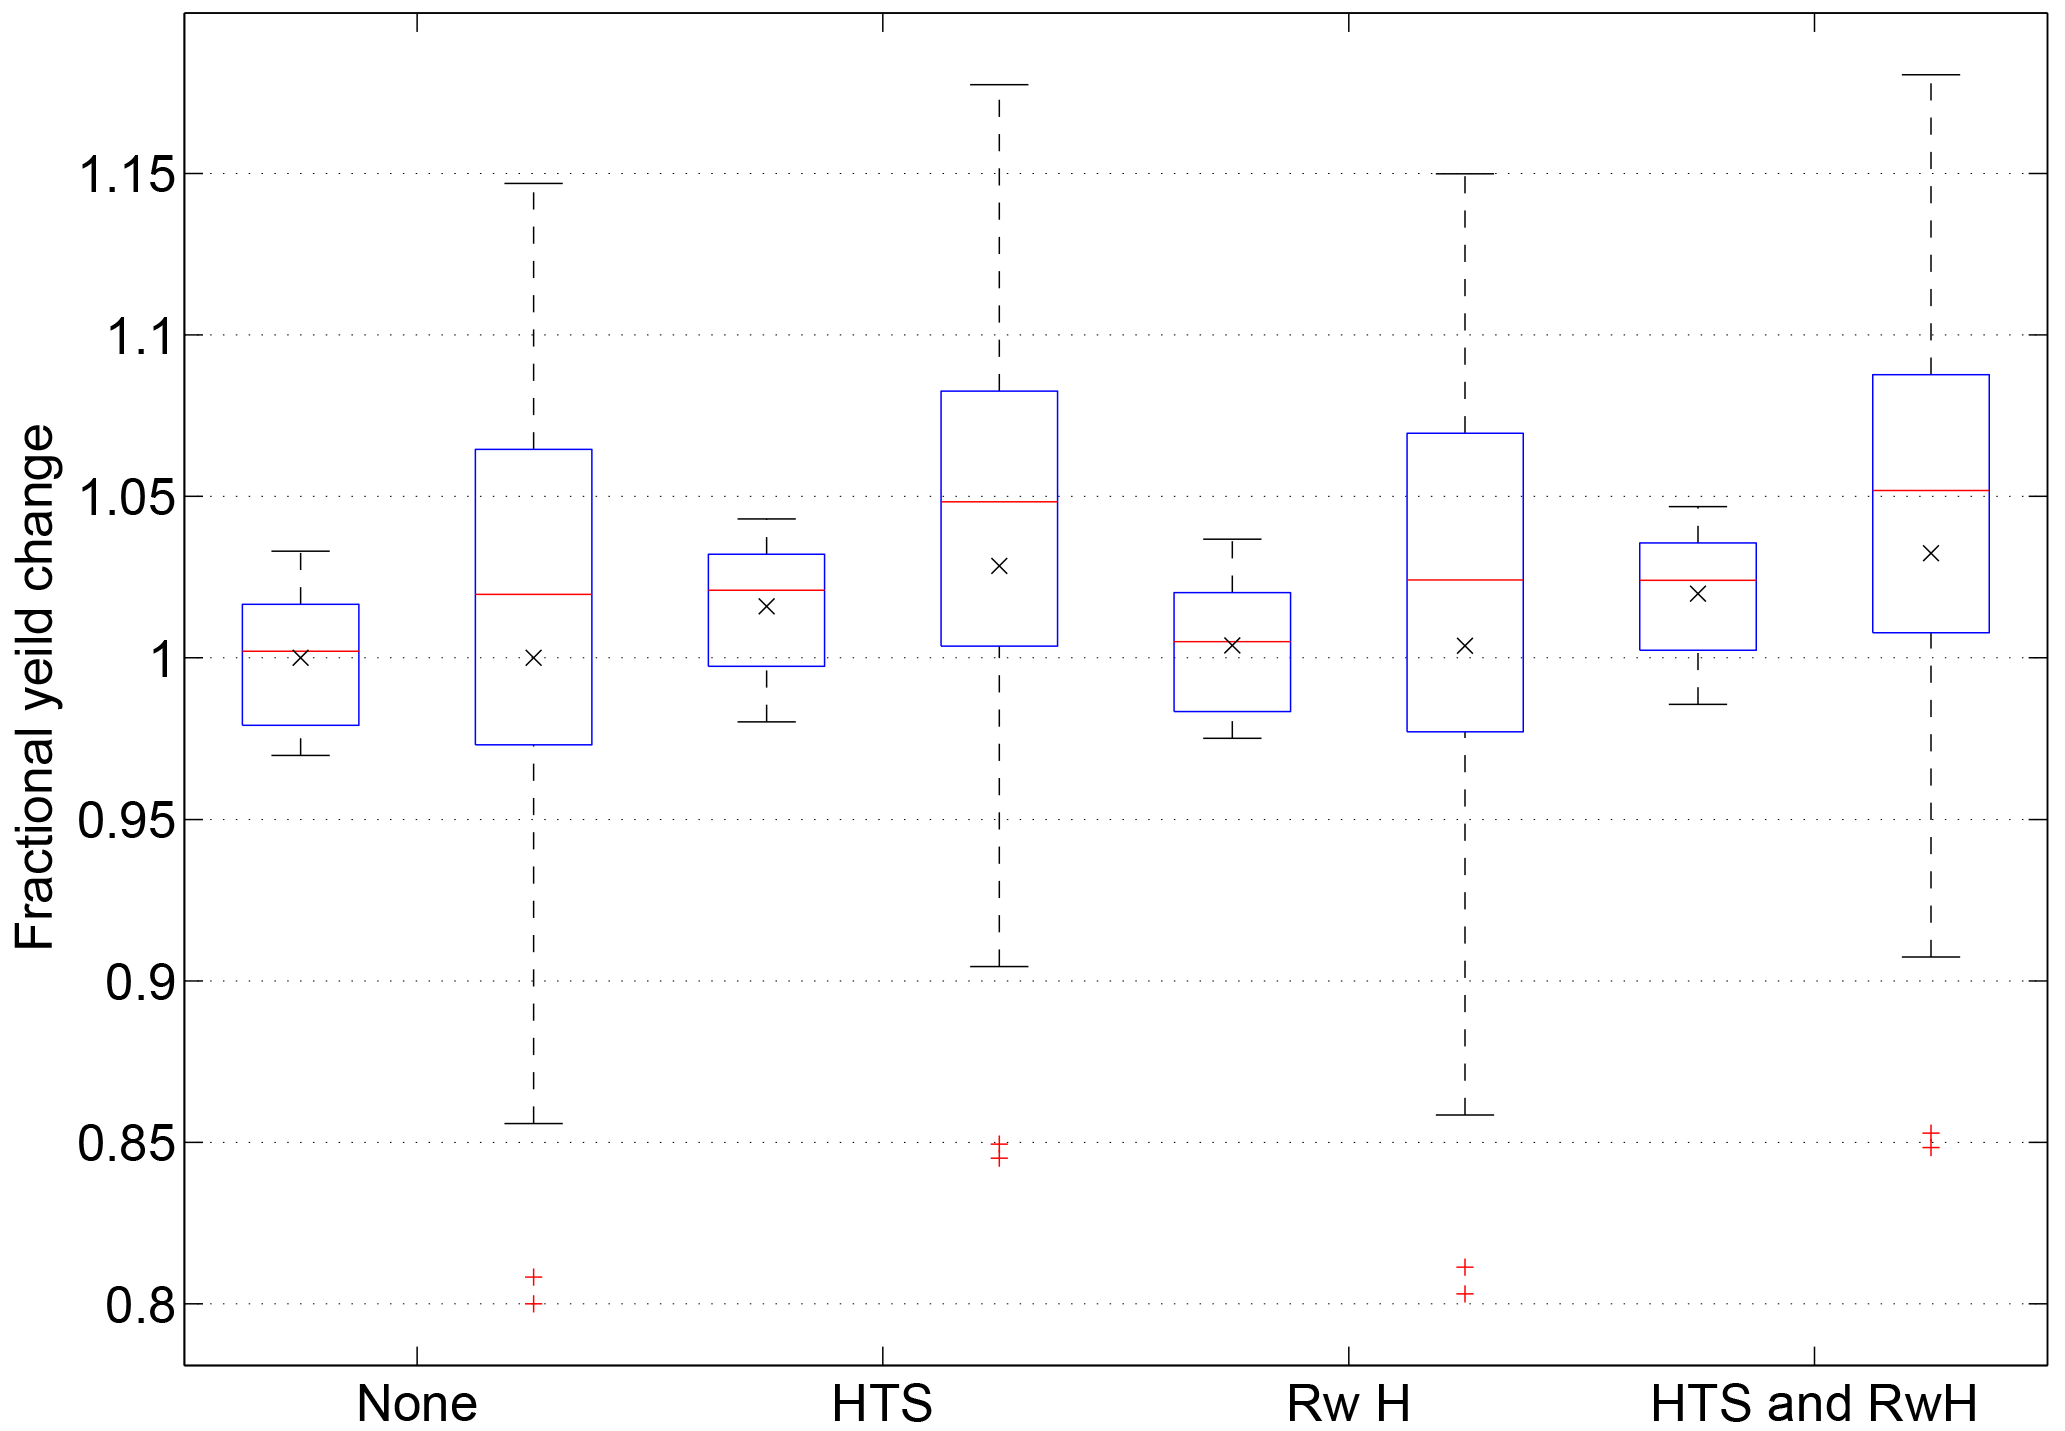
Figure 6Efficacy of adaptation methods for maize in GLAM. HTS is crops adapted to high-temperature stress, Rw H shows crops with rainwater harvesting, and HTS and Rw H shows both adaptation methods in use. Each box shows the fractional yield change relative to the unadapted crop with the box plots showing the range across the six-member GCM–RCM ensemble. The pairs of boxes show the relative change in yield for the adaptation method in the historic climate (left) and the future climate (right).
The results in Figs. 1–3 show that as the global climate warms through 1.5 K the yield response is uncertain. For maize, GLAM and ORCHIDEE-CROP simulate a reduction in yields. Across all crops and models the largest reduction is 16.5 % for SARRA-H 90-day sorghum. The largest increase is found for the linear models and is 4.2 % for millet. This range of results is within the range found for tropical maize in Challinor et al. (2014).
ORCHIDEE-CROP replicates the observed IAV, in contrast with the other process-based models, GLAM and SARRA-H. The mean yields, however, do show a significant bias. The ORCHIDEE-CROP results show the greatest increase in crop failure rate with crop failures occurring once every 2.5 years in the future climate scenarios. The crop failure rates for GLAM and SARRA-H are similar, with future failures happening every 6 and 5 years respectively. The linear models consistently underestimate the crop failure rate and this is one of their weaknesses. The results in Fig. 4 show consistency across all three process-based models and should therefore be treated with confidence.
The varieties of SARRA-H are unable to replicate the observed yields for the millet and sorghum analyses and misestimate the yield by several hundred kilograms per hectare (Figs. 2 and 3). The crop failure rate is defined by the model yield and the SARRA-H simulations all underestimate the crop failure rate. They do however all find a relative increase in crop failure rate in future climates for both millet and sorghum.
The differences in the crop models and inputs have an influence on the results. From Fig. 1 GLAM shows a greater spread of yield change with climate change than the other models whereas ORCHIDEE-CROP and SARRA-H are more consistent under climate change. The yield changes in ORCHIDEE-CROP and GLAM are also influenced by the carbon dioxide fertilization effect and in its absence the projected yields are expected to be lower. The IAV results show greater spread in the linear models than the process-based models; this is a result of the simple parameters in the linear models. The results in Fig. 5 show that GLAM has a stronger negative response to precipitation loss than the other models. The temperature results for all models show a downward trend in yield with increasing temperatures. The lack of variability in the linear models is shown in Fig. 4 in which they consistently underestimate crop failure rates. ORCHIDEE-CROP has a smaller IAV than the other process-based models, which means the crop failure limit is much higher than in the other models. This results in ORCHIDEE-CROP finding a significant increase in the number of crop failures. As the ORCHIDEE-CROP IAV is closest to the observed IAV (Table 3), this indicates that GLAM and SARRA-H are likely to underestimate the number of future crop failures. For Figs. 2 and 3 the country-scale yields in the historic inputs can be clearly seen in the linear models as opposed to the spread of yield values in SARRA-H. As with SARRA-H, GLAM and the linear models in maize, the SARRA-H varieties and the linear models underestimate the variability and therefore the crop failure rate for both millet and sorghum.
The adaptation methods tested in GLAM for maize are shown in Fig. 6 and show that rainwater harvesting is not an effective adaptation method. The higher rainfall in future climates reduces the likelihood of water limiting the crop growth. The high-temperature stress adaptation is a more efficient adaptation and provides a benefit in the future climate. The crop that is adapted to both high-temperature stress resistance and rainwater harvesting is less of an adaptation than the crop that is solely high-temperature stress resistant. Therefore, in the case of limited resources it is a better decision to explore high-temperature stress resistance than building systems to capture run-off, especially as the systems require substantial investment to construct and maintain.
The changes in national yields are a cause for concern as it is well documented that populations in West Africa are expected to increase quickly in the 21st century. Crop yields need to double by 2050 to feed the population (Ray et al., 2013), whereas the largest increase found in this study is sorghum in Niger at +8.84 %, which if replicated across the entire region would be sufficient; however, it is in contrast to the falling yields found instead. The production changes show the importance of different growing areas, and the lack of strong positive changes in yield across sub-Saharan West Africa is a concern. The mean yield changes are not the only message. In many cases in which the mean yield increases there is an accompanying increase in IAV. The increase in IAV means that yields are more uncertain and there is an increasingly likelihood of crop failures. The reductions in yields on national levels indicate a need for new breeds of crop or changing species entirely; however, the rate of deployment of new breeds in Africa is slow (Challinor et al., 2016).
Four crop models of varying design and complexity have been used to project crop yields across West Africa for three crops as global temperatures reach 1.5 K above the pre-industrial levels. The crop models were driven by the outputs of four RCMs, which were in turn driven by 10 GCMs. The crop models show differing levels of skill at reproducing the yield and variability found in the observed record. The process-based models are able to predict the crop failure rate for maize with moderate skill. The varieties of crop simulated by SARRA-H for millet and sorghum are less able to replicate observations than the linear models, but they are more capable for the crop failures. This study is limited by the number of crop models used, in particular only one process-based model was used for millet and sorghum. The use of bias-corrected RCMs to provide input data removes some of the problems associated with GCM data. The large size of the grid (50 km) prevents the formation of true convective storms and therefore the intensity of the weather is likely to be underestimated (Garcia-Carreras et al., 2015).
The crop yields and percentage changes in yield were calculated for several West African countries. The yield changes are not consistent across national borders and some nations are expected to lose more than others. The yield gains predicted herein need to be considered as part of longer-term trends that show severe yield reductions as the 21st century progresses (Challinor et al., 2014; Knox et al., 2012). As global temperatures approach 1.5 K above the pre-industrial levels, the knowledge of the most effective adaptation methods becomes critical and therefore it is of high importance to develop models capable of simulating them.
The results from this study show that for several crops the mean yield may not change much; however, the increase in variability is likely to result in an increase in crop failures. The average crop yield responses are sometimes negative and none are positive enough to increase yields sufficiently to prevent food shortages.
The input data for the crop models are part of the HELIX project and are currently under embargo. Upon the expiration of the embargo the data will be made available by the HELIX project. Contact information is at https://www.helixclimate.eu/contact/. The yield data output for the crop models can be found at https://doi.pangaea.de/10.1594/PANGAEA.876579.
BP acquired the data and performed the simulations in GLAM, ORCHIDEE-CROP and the linear models. DD ran the SARRA-H simulations. XW provided technical support for ORCHIDEE-CROP. All authors contributed to the paper.
The authors declare that they have no conflict of interest.
This article is part of the special issue “The Earth system at a global warming of 1.5 ∘C and 2.0 ∘C”. It is not associated with a conference.
This work received support from the European Commission's 7th Framework
Programme (EU/FP7) under grant agreement 603864 (HELIX).
Edited by: Zhenghui Xie
Reviewed by: Nir Krakauer and two anonymous referees
Baron, C., Sultan, B., Balme, M., Sarr, B., Traore, S., Lebel, T., Janicot, S., and Dingkuhn, M.: From GCM grid cell to agricultural plot: scale issues affecting modelling of climate impact, Philos. T. Roy. Soc. Lond. B, 360, 2095–2108, https://doi.org/10.1098/rstb.2005.1741, 2005. a
Bentsen, M., Bethke, I., Debernard, J. B., Iversen, T., Kirkevåg, A., Seland, Ø., Drange, H., Roelandt, C., Seierstad, I. A., Hoose, C., and Kristjánsson, J. E.: The Norwegian Earth System Model, NorESM1-M – Part 1: Description and basic evaluation of the physical climate, Geosci. Model Dev., 6, 687–720, https://doi.org/10.5194/gmd-6-687-2013, 2013. a
Berg, A., de Noblet-Ducoudré, N., Sultan, B., Lengaigne, M., and Guimberteau, M.: Projections of climate change impacts on potential {C4} crop productivity over tropical regions, Agr. Forest Meteorol., 170, 89–102, https://doi.org/10.1016/j.agrformet.2011.12.003, 2013. a, b
Biasutti, M. and Sobel, A. H.: Delayed Sahel rainfall and global seasonal cycle in a warmer climate, Geophys. Res. Lett., 36, l23707, https://doi.org/10.1029/2009GL041303, 2009. a
Challinor, A. J., Wheeler, T., Craufurd, P., Slingo, J., and Grimes, D.: Design and optimisation of a large-area process-based model for annual crops, Agr. Forest Meteorol., 124, 99–120, https://doi.org/10.1016/j.agrformet.2004.01.002, 2004. a, b
Challinor, A. J., Wheeler, T., Craufurd, P., and Slingo, J.: Simulation of the impact of high temperature stress on annual crop yields, Agr. Forest Meteorol., 135, 180–189, https://doi.org/10.1016/j.agrformet.2005.11.015, 2005. a, b
Challinor, A. J., Watson, J., Lobell, D. B., Howden, S. M., Smith, D. R., and Chhetri, N.: A meta-analysis of crop yield under climate change and adaptation, Nat. Clim. Change, 4, 287–291, 2014. a, b, c, d
Challinor, A. J., Parkes, B., and Ramirez-Villegas, J.: Crop yield response to climate change varies with cropping intensity, Global Change Biol., 21, 1679–1688, https://doi.org/10.1111/gcb.12808, 2015. a, b
Challinor, A. J., Koehler, A.-K., Ramirez-Villegas, J., Whitfield, S., and Das, B.: Current warming will reduce yields unless maize breeding and seed systems adapt immediately, Nat. Clim. Change, 6, 954–958, https://doi.org/10.1038/nclimate3061, 2016. a
Christensen, O. B., Drews, M., Christensen, J. H., Dethloff, K., Ketelsen, K., Hebestadt, I., and Rinke, A.: The HIRHAM Regional Climate Model Version 5 (ß), Tech. rep., Danish Meteorological Institute, Copenhagen, 2006. a
Chylek, P., Li, J., Dubey, M. K., Wang, M., and Lesins, G.: Observed and model simulated 20th century Arctic temperature variability: Canadian Earth System Model CanESM2, Atmos. Chem. Phys. Discuss., https://doi.org/10.5194/acpd-11-22893-2011, 2011. a
Diaconescu, E. P., Gachon, P., Scinocca, J., and Laprise, R.: Evaluation of daily precipitation statistics and monsoon onset/retreat over western Sahel in multiple data sets, Clim. Dynam., 45, 1325–1354, https://doi.org/10.1007/s00382-014-2383-2, 2015. a
Dingkuhn, M., Baron, C., Bonnal, V., Maraux, F., Sarr, B., Clopes, A., and Forest, F.: Decision support tools for rainfed crops in the Sahel at the plot and regional scales, in: Decision support tools for smallholder agriculture in Sub-Saharan Africa: A practical guide, edited by: Struif, B. T. and Wopereis, M., IFDC, Muscle Shoals, États-Unis, 127–139, http://agritrop.cirad.fr/522837/ (last access: 3 February 2017), 2003. a
Dufresne, J.-L., Foujols, M.-A., Denvil, S., Caubel, A., Marti, O., Aumont, O., Balkanski, Y., Bekki, S., Bellenger, H., Benshila, R., Bony, S., Bopp, L., Braconnot, P., Brockmann, P., Cadule, P., Cheruy, F., Codron, F., Cozic, A., Cugnet, D., de Noblet, N., Duvel, J.-P., Ethé, C., Fairhead, L., Fichefet, T., Flavoni, S., Friedlingstein, P., Grandpeix, J.-Y., Guez, L., Guilyardi, E., Hauglustaine, D., Hourdin, F., Idelkadi, A., Ghattas, J., Joussaume, S., Kageyama, M., Krinner, G., Labetoulle, S., Lahellec, A., Lefebvre, M.-P., Lefevre, F., Levy, C., Li, Z., Lloyd, J., Lott, F., Madec, G., Mancip, M., Marchand, M., Masson, S., Meurdesoif, Y., Mignot, J., Musat, I., Parouty, S., Polcher, J., Rio, C., Schulz, M., Swingedouw, D., Szopa, S., Talandier, C., Terray, P., Viovy, N., and Vuichard, N.: Climate change projections using the IPSL-CM5 Earth System Model: from CMIP3 to CMIP5, Clim. Dynam., 40, 2123–2165, https://doi.org/10.1007/s00382-012-1636-1, 2013. a
Elliott, J., Müller, C., Deryng, D., Chryssanthacopoulos, J., Boote, K. J., Büchner, M., Foster, I., Glotter, M., Heinke, J., Iizumi, T., Izaurralde, R. C., Mueller, N. D., Ray, D. K., Rosenzweig, C., Ruane, A. C., and Sheffield, J.: The Global Gridded Crop Model Intercomparison: data and modeling protocols for Phase 1 (v1.0), Geosci. Model Dev., 8, 261–277, https://doi.org/10.5194/gmd-8-261-2015, 2015. a
Estes, L. D., Beukes, H., Bradley, B. A., Debats, S. R., Oppenheimer, M., Ruane, A. C., Schulze, R., and Tadross, M.: Projected climate impacts to South African maize and wheat production in 2055: a comparison of empirical and mechanistic modeling approaches, Global Change Biol., 19, 3762–3774, https://doi.org/10.1111/gcb.12325, 2013. a
FAOSTAT: Food and Agriculture Organization of the United Nations: FAOSTAT Database, http://data.fao.org/database?entryId=262b79ca-279c-4517-93de-ee3b7c7cb553, latest update: 7 March 2014. a, b, c
Garcia-Carreras, L., Challinor, A. J., Parkes, B. J., Birch, C. E., Nicklin, K. J., and Parker, D. J.: The Impact of Parameterized Convection on the Simulation of Crop Processes, J. Appl. Meteorol. Clim., 54, 1283–1296, https://doi.org/10.1175/JAMC-D-14-0226.1, 2015. a
Gbobaniyi, E., Sarr, A., Sylla, M. B., Diallo, I., Lennard, C., Dosio, A., Dhiédiou, A., Kamga, A., Klutse, N. A. B., Hewitson, B., Nikulin, G., and Lamptey, B.: Climatology, annual cycle and interannual variability of precipitation and temperature in CORDEX simulations over West Africa, Int. J. Climatol., 34, 2241–2257, https://doi.org/10.1002/joc.3834, 2014. a
Gerland, P., Raftery, A. E., Ševčíková, H., Li, N., Gu, D., Spoorenberg, T., Alkema, L., Fosdick, B. K., Chunn, J., Lalic, N., Bay, G., Buettner, T., Heilig, G. K., and Wilmoth, J.: World population stabilization unlikely this century, Science, 346, 234–237, https://doi.org/10.1126/science.1257469, 2014. a
Griffies, S. M., Winton, M., Donner, L. J., Horowitz, L. W., Downes, S. M., Farneti, R., Gnanadesikan, A., Hurlin, W. J., Lee, H.-C., Liang, Z., Palter, J. B., Samuels, B. L., Wittenberg, A. T., Wyman, B. L., Yin, J., and Zadeh, N.: The GFDL CM3 Coupled Climate Model: Characteristics of the Ocean and Sea Ice Simulations, J. Climate, 24, 3520–3544, https://doi.org/10.1175/2011JCLI3964.1, 2011. a
Grillakis, M. G., Koutroulis, A. G., and Tsanis, I. K.: Multisegment statistical bias correction of daily GCM precipitation output, J. Geophys. Res.-Atmos., 118, 3150–3162, https://doi.org/10.1002/jgrd.50323, 2013. a
Guan, K., Sultan, B., Biasutti, M., Baron, C., and Lobell, D. B.: Assessing climate adaptation options and uncertainties for cereal systems in West Africa, Agr. Forest Meteorol., 232, 291–305, https://doi.org/10.1016/j.agrformet.2016.07.021, 2017. a, b, c, d
Hazeleger, W., Wang, X., Severijns, C., Ştefănescu, S., Bintanja, R., Sterl, A., Wyser, K., Semmler, T., Yang, S., van den Hurk, B., vanNoije, T., van der Linden, E., and van der Wiel, K.: EC-Earth V2.2: description and validation of a new seamless earth system prediction model, Clim. Dynam., 39, 2611–2629, https://doi.org/10.1007/s00382-011-1228-5, 2012. a
Holland, P. W. and Welsch, R. E.: Robust regression using iteratively reweighted least-squares, Commun. Stat. – Theory Meth., 6, 813–827, https://doi.org/10.1080/03610927708827533, 1977. a
Iizumi, T. and Ramankutty, N.: Changes in yield variability of major crops for 1981–2010 explained by climate change, Environ. Res. Lett., 11, 034003, https://doi.org/10.1088/1748-9326/11/3/034003, 2016. a
Iizumi, T., Yokozawa, M., Sakurai, G., Travasso, M. I., Romanenkov, V., Oettli, P., Newby, T., Ishigooka, Y., and Furuya, J.: Historical changes in global yields: major cereal and legume crops from 1982 to 2006, Global Ecol. Biogeogr., 23, 346–357, https://doi.org/10.1111/geb.12120, 2014. a
Jones, C. D., Hughes, J. K., Bellouin, N., Hardiman, S. C., Jones, G. S., Knight, J., Liddicoat, S., O'Connor, F. M., Andres, R. J., Bell, C., Boo, K.-O., Bozzo, A., Butchart, N., Cadule, P., Corbin, K. D., Doutriaux-Boucher, M., Friedlingstein, P., Gornall, J., Gray, L., Halloran, P. R., Hurtt, G., Ingram, W. J., Lamarque, J.-F., Law, R. M., Meinshausen, M., Osprey, S., Palin, E. J., Parsons Chini, L., Raddatz, T., Sanderson, M. G., Sellar, A. A., Schurer, A., Valdes, P., Wood, N., Woodward, S., Yoshioka, M., and Zerroukat, M.: The HadGEM2-ES implementation of CMIP5 centennial simulations, Geosci. Model Dev., 4, 543–570, https://doi.org/10.5194/gmd-4-543-2011, 2011. a
Kirtman, B., Power, S., Adedoyin, J., Boer, G., Bojariu, R., Camilloni, I., Doblas-Reyes, F., Fiore, A., Kimoto, M., Meehl, G., Prather, M., Sarr, A., Schär, C., Sutton, R., van Oldenborgh, G., Vecchi, G., and Wang, H.: Near-term Climate Change: Projections and Predictability, in: book section 11, Cambridge University Press, Cambridge, UK and New York, NY, USA, 953–1028, https://doi.org/10.1017/CBO9781107415324.023, 2013. a
Knox, J., Hess, T., Daccache, A., and Wheeler, T.: Climate change impacts on crop productivity in Africa and South Asia, Environ. Res. Lett., 7, 034032, https://doi.org/10.1088/1748-9326/7/3/034032, 2012. a, b, c, d
Kouressy, M., Dingkuhn, M., Vaksmann, M., and Heinemann, A. B.: Adaptation to diverse semi-arid environments of sorghum genotypes having different plant type and sensitivity to photoperiod, Agr. Forest Meteorol., 148, 357–371, https://doi.org/10.1016/j.agrformet.2007.09.009, 2008. a, b, c
Krinner, G., Viovy, N., de Noblet-Ducoudré, N., Ogée, J., Polcher, J., Friedlingstein, P., Ciais, P., Sitch, S., and Prentice, I. C.: A dynamic global vegetation model for studies of the coupled atmosphere–biosphere system, Global Biogeochem. Cy., 19, gB1015, https://doi.org/10.1029/2003GB002199, 2005. a, b
Larvor, G.: Prise en main d'un modèle d'agriculture pour le développement d'un nouveau service orienté changement climatique, MS thesis, Laboratoire des sciences du climat et de l'environnement, LSCE, Saint-Aubin, France, 2016. a
Lassaletta, L., Billen, G., Grizzetti, B., Anglade, J., and Garnier, J.: 50 year trends in nitrogen use efficiency of world cropping systems: the relationship between yield and nitrogen input to cropland, Environ. Res. Lett., 9, 105011, https://doi.org/10.1088/1748-9326/9/10/105011, 2014. a
Leakey, A. D.: Rising atmospheric carbon dioxide concentration and the future of C4 crops for food and fuel, P. Roy. Soc. Lond. B, 276, 2333–2343, https://doi.org/10.1098/rspb.2008.1517, 2009. a
Lobell, D. B. and Asseng, S.: Comparing estimates of climate change impacts from process-based and statistical crop models, Environ. Res. Lett., 12, 015001, https://doi.org/10.1088/1748-9326/aa518a, 2017. a
Lobell, D. B. and Burke, M. B.: On the use of statistical models to predict crop yield responses to climate change, Agr. Forest Meteorol., 150, 1443–1452, https://doi.org/10.1016/j.agrformet.2010.07.008, 2010. a, b
Meehl, G. A., Covey, C., Taylor, K. E., Delworth, T., Stouffer, R. J., Latif, M., McAvaney, B., and Mitchell, J. F. B.: THE WCRP CMIP3 Multimodel Dataset: A New Era in Climate Change Research, B. Am. Meteorol. Soc., 88, 1383–1394, https://doi.org/10.1175/BAMS-88-9-1383, 2007. a
Meinshausen, M., Smith, S., Calvin, K., Daniel, J., Kainuma, M., Lamarque, J.-F., Matsumoto, K., Montzka, S., Raper, S., Riahi, K., Thomson, A., Velders, G., and Vuuren, D.: The RCP greenhouse gas concentrations and their extensions from 1765 to 2300, Climatic Change, 109, 213–241, https://doi.org/10.1007/s10584-011-0156-z, 2011. a
Mishra, A., Hansen, J. W., Dingkuhn, M., Baron, C., Traoré, S. B., Ndiaye, O., and Ward, M. N.: Sorghum yield prediction from seasonal rainfall forecasts in Burkina Faso, Agr. Forest Meteorol., 148, 1798–1814, https://doi.org/10.1016/j.agrformet.2008.06.007, 2008. a
Monfreda, C., Ramankutty, N., and Foley, J. A.: Farming the planet: 2. Geographic distribution of crop areas, yields, physiological types, and net primary production in the year 2000, Global Biogeochem. Cy., 22, gB1022, https://doi.org/10.1029/2007GB002947, 2008. a
Müller, C., Elliott, J., Chryssanthacopoulos, J., Arneth, A., Balkovic, J., Ciais, P., Deryng, D., Folberth, C., Glotter, M., Hoek, S., Iizumi, T., Izaurralde, R. C., Jones, C., Khabarov, N., Lawrence, P., Liu, W., Olin, S., Pugh, T. A. M., Ray, D. K., Reddy, A., Rosenzweig, C., Ruane, A. C., Sakurai, G., Schmid, E., Skalsky, R., Song, C. X., Wang, X., de Wit, A., and Yang, H.: Global gridded crop model evaluation: benchmarking, skills, deficiencies and implications, Geosci. Model Dev., 10, 1403–1422, https://doi.org/10.5194/gmd-10-1403-2017, 2017. a
Nikulin, G., Jones, C., Giorgi, F., Asrar, G., Büchner, M., Cerezo-Mota, R., Christensen, O. B., Déqué, M., Fernandez, J., Hänsler, A., van Meijgaard, E., Samuelsson, P., Sylla, M. B., and Sushama, L.: Precipitation Climatology in an Ensemble of CORDEX-Africa Regional Climate Simulations, J. Climate, 25, 6057–6078, https://doi.org/10.1175/JCLI-D-11-00375.1, 2012. a, b
Oettli, P., Sultan, B., Baron, C., and Vrac, M.: Are regional climate models relevant for crop yield prediction in West Africa?, Environ. Res. Lett., 6, 014008, https://doi.org/10.1088/1748-9326/6/1/014008, 2011. a
Papadimitriou, L. V., Koutroulis, A. G., Grillakis, M. G., and Tsanis, I. K.: High-end climate change impact on European water availability and stress: exploring the presence of biases, Hydrol. Earth Syst. Sci. Discuss., 12, 7267–7325, https://doi.org/10.5194/hessd-12-7267-2015, 2015. a, b
Parkes, B., Challinor, A., and Nicklin, K.: Crop failure rates in a geoengineered climate: impact of climate change and marine cloud brightening, Environ. Res. Lett., 10, 084003, https://doi.org/10.1088/1748-9326/10/8/084003, 2015. a, b
Parkes, B., Sultan, B., Ciais, P., and Wang, X.: Modelling fertiliser significance in three major crops, Eur. J. Agron., 90, 1–11, https://doi.org/10.1016/j.eja.2017.06.012, 2017. a
Raddatz, T., Reick, C., Knorr, W., Kattge, J., Roeckner, E., Schnur, R., Schnitzler, K.-G., Wetzel, P., and Jungclaus, J.: Will the tropical land biosphere dominate the climate-carbon cycle feedback during the twenty-first century?, Clim. Dynam., 29, 565–574, https://doi.org/10.1007/s00382-007-0247-8, 2007. a
Ray, D. K., Mueller, N. D., West, P. C., and Foley, J. A.: Yield Trends Are Insufficient to Double Global Crop Production by 2050, PLoS ONE, 8, 1–8, https://doi.org/10.1371/journal.pone.0066428, 2013. a, b
Rippke, U., Ramirez-Villegas, J., Jarvis, A., Vermeulen, S. J., Parker, L., Mer, F., Diekkruger, B., Challinor, A. J., and Howden, M.: Timescales of transformational climate change adaptation in sub-Saharan African agriculture, Nat. Clim. Change, 6, 605–609, https://doi.org/10.1038/nclimate2947, 2016. a, b
Rockström, J. and Falkenmark, M.: Semiarid Crop Production from a Hydrological Perspective: Gap between Potential and Actual Yields, Crit. Rev. Plant Sci., 19, 319–346, https://doi.org/10.1080/07352680091139259, 2000. a
Rotstayn, L. D., Jeffrey, S. J., Collier, M. A., Dravitzki, S. M., Hirst, A. C., Syktus, J. I., and Wong, K. K.: Aerosol- and greenhouse gas-induced changes in summer rainfall and circulation in the Australasian region: a study using single-forcing climate simulations, Atmos. Chem. Phys., 12, 6377–6404, https://doi.org/10.5194/acp-12-6377-2012, 2012. a
Roudier, P., Sultan, B., Quirion, P., and Berg, A.: The impact of future climate change on West African crop yields: What does the recent literature say?, Global Environ. Change, 21, 1073–1083, https://doi.org/10.1016/j.gloenvcha.2011.04.007, 2011. a, b, c, d
Sultan, B., Guan, K., Kouressy, M., Biasutti, M., Piani, C., Hammer, G. L., McLean, G., and Lobell, D. B.: Robust features of future climate change impacts on sorghum yields in West Africa, Environ. Res. Lett., 9, 104006, https://doi.org/10.1088/1748-9326/9/10/104006, 2014. a, b, c, d
Taylor, K. E., Stouffer, R. J., and Meehl, G. A.: An Overview of CMIP5 and the Experiment Design, B. Am. Meteor. Soc., 93, 485–498, https://doi.org/10.1175/BAMS-D-11-00094.1, 2011. a
van Meijgaard, E., van Ulft, L., van de Berg, W., Bosveld, F. C., van den Hurk, B., Lenderink, G., and Siebesma, A.: The KNMI regional atmospheric climate model RACMO version 2.1. KNMI TR-302, Tech. rep., Koninklijk Nederlands Meteorologisch Instituut (KNMI), De Bilt, the Netherlands, 43 pp., 2008. a
Vermeulen, S. J., Challinor, A. J., Thornton, P. K., Campbell, B. M., Eriyagama, N., Vervoort, J. M., Kinyangi, J., Jarvis, A., Läderach, P., Ramirez-Villegas, J., Nicklin, K. J., Hawkins, E., and Smith, D. R.: Addressing uncertainty in adaptation planning for agriculture, P. Natl. Acad. Sci. USA, 110, 8357–8362, https://doi.org/10.1073/pnas.1219441110, 2013. a, b
Voldoire, A., Sanchez-Gomez, E., Salas y Mélia, D., Decharme, B., Cassou, C., Sénési, S., Valcke, S., Beau, I., Alias, A., Chevallier, M., Déqué, M., Deshayes, J., Douville, H., Fernandez, E., Madec, G., Maisonnave, E., Moine, M.-P., Planton, S., Saint-Martin, D., Szopa, S., Tyteca, S., Alkama, R., Belamari, S., Braun, A., Coquart, L., and Chauvin, F.: The CNRM-CM5.1 global climate model: description and basic evaluation, Clim. Dynam., 40, 2091–2121, https://doi.org/10.1007/s00382-011-1259-y, 2013. a
Wang, X.: Impacts of environmental change on rice ecosystems in China: development, optimization and application of ORCHIDEE-crop model, PhD Thesis, Peking University, Peking, 2016. a
Wang, Z., Ye, T., Wang, J., Cheng, Z., and Shi, P.: Contribution of climatic and technological factors to crop yield: empirical evidence from late paddy rice in Hunan Province, China, Stoch. Environ. Res. Risk Assess., 30, 2019–2030, https://doi.org/10.1007/s00477-016-1215-9, 2016. a
Watanabe, M., Suzuki, T., O'ishi, R., Komuro, Y., Watanabe, S., Emori, S., Takemura, T., Chikira, M., Ogura, T., Sekiguchi, M., Takata, K., Yamazaki, D., Yokohata, T., Nozawa, T., Hasumi, H., Tatebe, H., and Kimoto, M.: Improved Climate Simulation by MIROC5: Mean States, Variability, and Climate Sensitivity, J. Climate, 23, 6312–6335, https://doi.org/10.1175/2010JCLI3679.1, 2010. a
Weedon, G. P., Balsamo, G., Bellouin, N., Gomes, S., Best, M. J., and Viterbo, P.: The WFDEI meteorological forcing data set: WATCH Forcing Data methodology applied to ERA-Interim reanalysis data, Water Res. Res., 50, 7505–7514, https://doi.org/10.1002/2014WR015638, 2014. a
Wu, X., Vuichard, N., Ciais, P., Viovy, N., de Noblet-Ducoudré, N., Wang, X., Magliulo, V., Wattenbach, M., Vitale, L., Di Tommasi, P., Moors, E. J., Jans, W., Elbers, J., Ceschia, E., Tallec, T., Bernhofer, C., Grünwald, T., Moureaux, C., Manise, T., Ligne, A., Cellier, P., Loubet, B., Larmanou, E., and Ripoche, D.: ORCHIDEE-CROP (v0), a new process-based agro-land surface model: model description and evaluation over Europe, Geosci. Model Dev., 9, 857–873, https://doi.org/10.5194/gmd-9-857-2016, 2016. a, b