the Creative Commons Attribution 4.0 License.
the Creative Commons Attribution 4.0 License.
 | 04 Feb 2026
Extreme events in the Amazon after deforestation
Cathy Hohenegger
Jiawei Bao
Lukas Brunner
Potential self-perpetuating dieback of the Amazon rain forest has been a topic of concern. The concern is that initial deforestation could critically impair the forest’s water recycling capacities, further harming the remaining forest through reduced annual precipitation. Many studies have focused on annual mean precipitation changes, due to its widespread perception as a central control on the Amazon rain forest’s stability. However, the impact of deforestation goes beyond changes in the annual mean precipitation. Yet, global coarse-resolution climate models are not well suited to investigate changes in short-duration and localized events due to their coarse resolution. Here, we circumvent these issues by analyzing a full-deforestation scenario simulated by a global storm-resolving model. We focus on changes in the tail of the hourly distribution of precipitation, temperature, and wind. Hourly precipitation becomes more extreme in the absence of the forest than in an intact forest, with an increased occurrence of both no rain and intense rainfall. These changes are driven by enhanced moisture convergence that strengthens vertical velocity. On average, the near-surface temperature rises significantly by about 3.84 °C, and the daily minimum temperature after deforestation becomes similar to the daily maximum temperature before deforestation. Except for wet-bulb temperature, human heat stress indicators shift to more severe levels, with implications for health and a significant reduction in work productivity. Finally, the mean 10 m wind speed intensifies by a factor of four, with the 99th percentile wind speed doubling. To summarize, our findings, while based on an idealized case, provide a stark warning of the effects of continuing deforestation of the Amazon.
- Article
(2019 KB) - Full-text XML
- BibTeX
- EndNote


The Amazon is home to unparalleled biodiversity and a major carbon sink, making its preservation vital. However, more than 20 % of the Amazon forest has already been cleared, and 6 % has degraded, with further deforestation expected (RAISG, 2022). As forests shape the local energy balance, the water cycle, and the atmospheric dynamics (Bonan, 2008), their removal will change environmental conditions, potentially in a way that is unfavorable for forest regrowth. Among environmental conditions, precipitation has been a primary focus. Annual mean precipitation, the most broadly used indicator, is indeed a useful metric for assessing ecosystem structure. For instance, Malhi et al. (2009) used annual precipitation and dry season intensity to classify vegetation types and identify climatic thresholds for vegetation transitions. However, annual mean precipitation can obscure important details about short-duration precipitation events. In fact, extreme precipitation is often more influential on ecosystem processes than mean conditions (Heisler-White et al., 2009; Smith, 2011; Thompson et al., 2013). Beyond ecological impacts, intense precipitation also poses significant challenges to infrastructure and agriculture (Wang et al., 2013; Gao et al., 2018; Guerreiro et al., 2024; Brown et al., 2020; Fowler et al., 2021). Moreover, forest loss often entails elevated heat stress, and intense winds can damage the forest and alter forest regrowth (Quine and Gardiner, 2007; Zhan et al., 2017; Kotz et al., 2021). In our previous study, we investigated the mean annual precipitation response to full Amazon deforestation in a storm-resolving global climate model (Yoon and Hohenegger, 2025). Unlike previous studies, we found that annual mean precipitation remains almost unchanged under the deforestation scenario. These findings contradict the classification of the Amazon rainforest as a climate tipping element. However, the impacts of deforestation go well beyond changes in the annual mean. Thus, the goal of this study is to investigate changes in extreme precipitation, temperature extremes, and gust winds following complete Amazon deforestation using the same simulations of Yoon and Hohenegger (2025).
Past studies using coarse-resolution global and regional models, with parameterized convection, have found a reduction in mean precipitation following deforestation (Nobre et al., 1991; Lejeune et al., 2015; Spracklen and Garcia-Carreras, 2015; Llopart et al., 2018). To the best of our knowledge, no study has so far investigated the impact of full Amazon deforestation on precipitation extremes. Extreme precipitation is generated by two essential factors (Johns and Doswell, 1992; O'Gorman and Schneider, 2009; Muller et al., 2011; Schumacher and Rasmussen, 2020): the availability of atmospheric moisture (Trenberth et al., 2003; Lenderink and Attema, 2015), supplied by evapotranspiration and moisture convergence, and the strength of updrafts (Trenberth et al., 2003; Emori and Brown, 2005; Brown et al., 2020; Loriaux et al., 2017). Regarding the first factor, there is strong agreement among previous studies that evapotranspiration uniformly decreases after complete deforestation, leading to a reduction in mean precipitable water (Gedney and Valdes, 2000; Medvigy et al., 2011; Hirota et al., 2011; Pires and Costa, 2013). However, past studies inconsistently reported both increases and decreases in mean moisture convergence.
Concerning the second factor, strong updrafts, the amount of convective available potential energy (CAPE) is often used as a proxy for it. Some studies have shown that CAPE decreases after deforestation (Wang et al., 2009; Swann et al., 2015; Lemes et al., 2023), although none of the studies focused on hourly precipitation. In addition to CAPE, the vertical uplifts over the Amazon basin are predominantly observed in conjunction with moisture convergence, as indicated by observational data (Viscardi et al., 2024). Therefore, moisture convergence constitutes a second proxy candidate for the identification of enhanced updrafts and convection (Crook and Moncrieff, 1988; Tiedtke, 1989; Schaefer and Doswell III, 1980; Davies et al., 2013; King et al., 2022).
Besides precipitation, forests interact with multiple environmental variables in complex ways. Temperature is one of them, particularly in tropical forests. Tropical species are adapted to stable climate conditions within a narrow temperature range (Janzen, 1967; Wright et al., 2009; Perez et al., 2016), making them particularly vulnerable not only to an increase in mean temperature but also to greater variability. There is a strong consensus that deforestation increases the mean temperature due to biophysical changes. Although pasture has a higher albedo than forest, which reduces net surface radiation, deforestation shifts the energy partitioning toward sensible heat at the cost of evapotranspiration (Perugini et al., 2017; Duveiller et al., 2018; Butt et al., 2023). The shift in Bowen ratio outweighs the reduction from increased albedo, leading to higher sensible heat flux and higher near-surface temperature. The reduced roughness length of the pasture weakens turbulence heat transport, further contributing to near-surface heat accumulation (Baldocchi and Ma, 2013; Winckler et al., 2019). Some studies reported that deforestation shifts the daily maximum distribution toward higher values (Bottino et al., 2024) and the daily minimum toward lower values, increasing overall variability (Voldoire and Royer, 2004). To further quantify the effect of temperature changes, especially on humans, heat stress indicators can be used, derived from meteorological variables (e.g., Morabito et al., 2014; Spangler et al., 2022; Wang et al., 2009). For instance, Alves de Oliveira et al. (2021) have reported that complete deforestation can cause the same level of heat stress as several degrees of global warming. Their investigation was based on the wet-bulb globe temperature index, which is used in military training, work safety, and outdoor activities.
The wind is another representative cause of disturbance after deforestation. Frequent damaging winds can prevent a full regrowth of the forest, as young trees with shallow roots and fragile stems that regrow after deforestation may be more vulnerable to stronger winds. Deforestation is expected to increase surface winds by lowering roughness length (Lawrence and Vandecar, 2015; Sampaio et al., 2007; Spracklen and Garcia-Carreras, 2015; Lejeune et al., 2015) and increasing near-surface wind due to enhanced land and ocean temperature gradient (Good et al., 2008; Llopart et al., 2018; Mu et al., 2023). Moreover, potentially stronger downdrafts from convective storms may pose a further threat. However, studies have focused on averaged features, not on the distribution of changes in hourly wind speed, including changes in downdraft, after deforestation.
Beyond the fact that only a handful of studies have investigated changes in short-duration precipitation, temperature, and wind events after deforestation over the Amazon, the models used were coarse resolution. Their coarse resolution and their use of convective parameterizations make them unsuitable to represent fast processes and small scales. Therefore, we use the same simulations as Yoon and Hohenegger (2025), who used a global storm-resolving model with a 5 km horizontal resolution, and investigate changes in hourly rainfall, diurnal and seasonal temperature, hourly surface wind speed, and heat stress after deforestation.
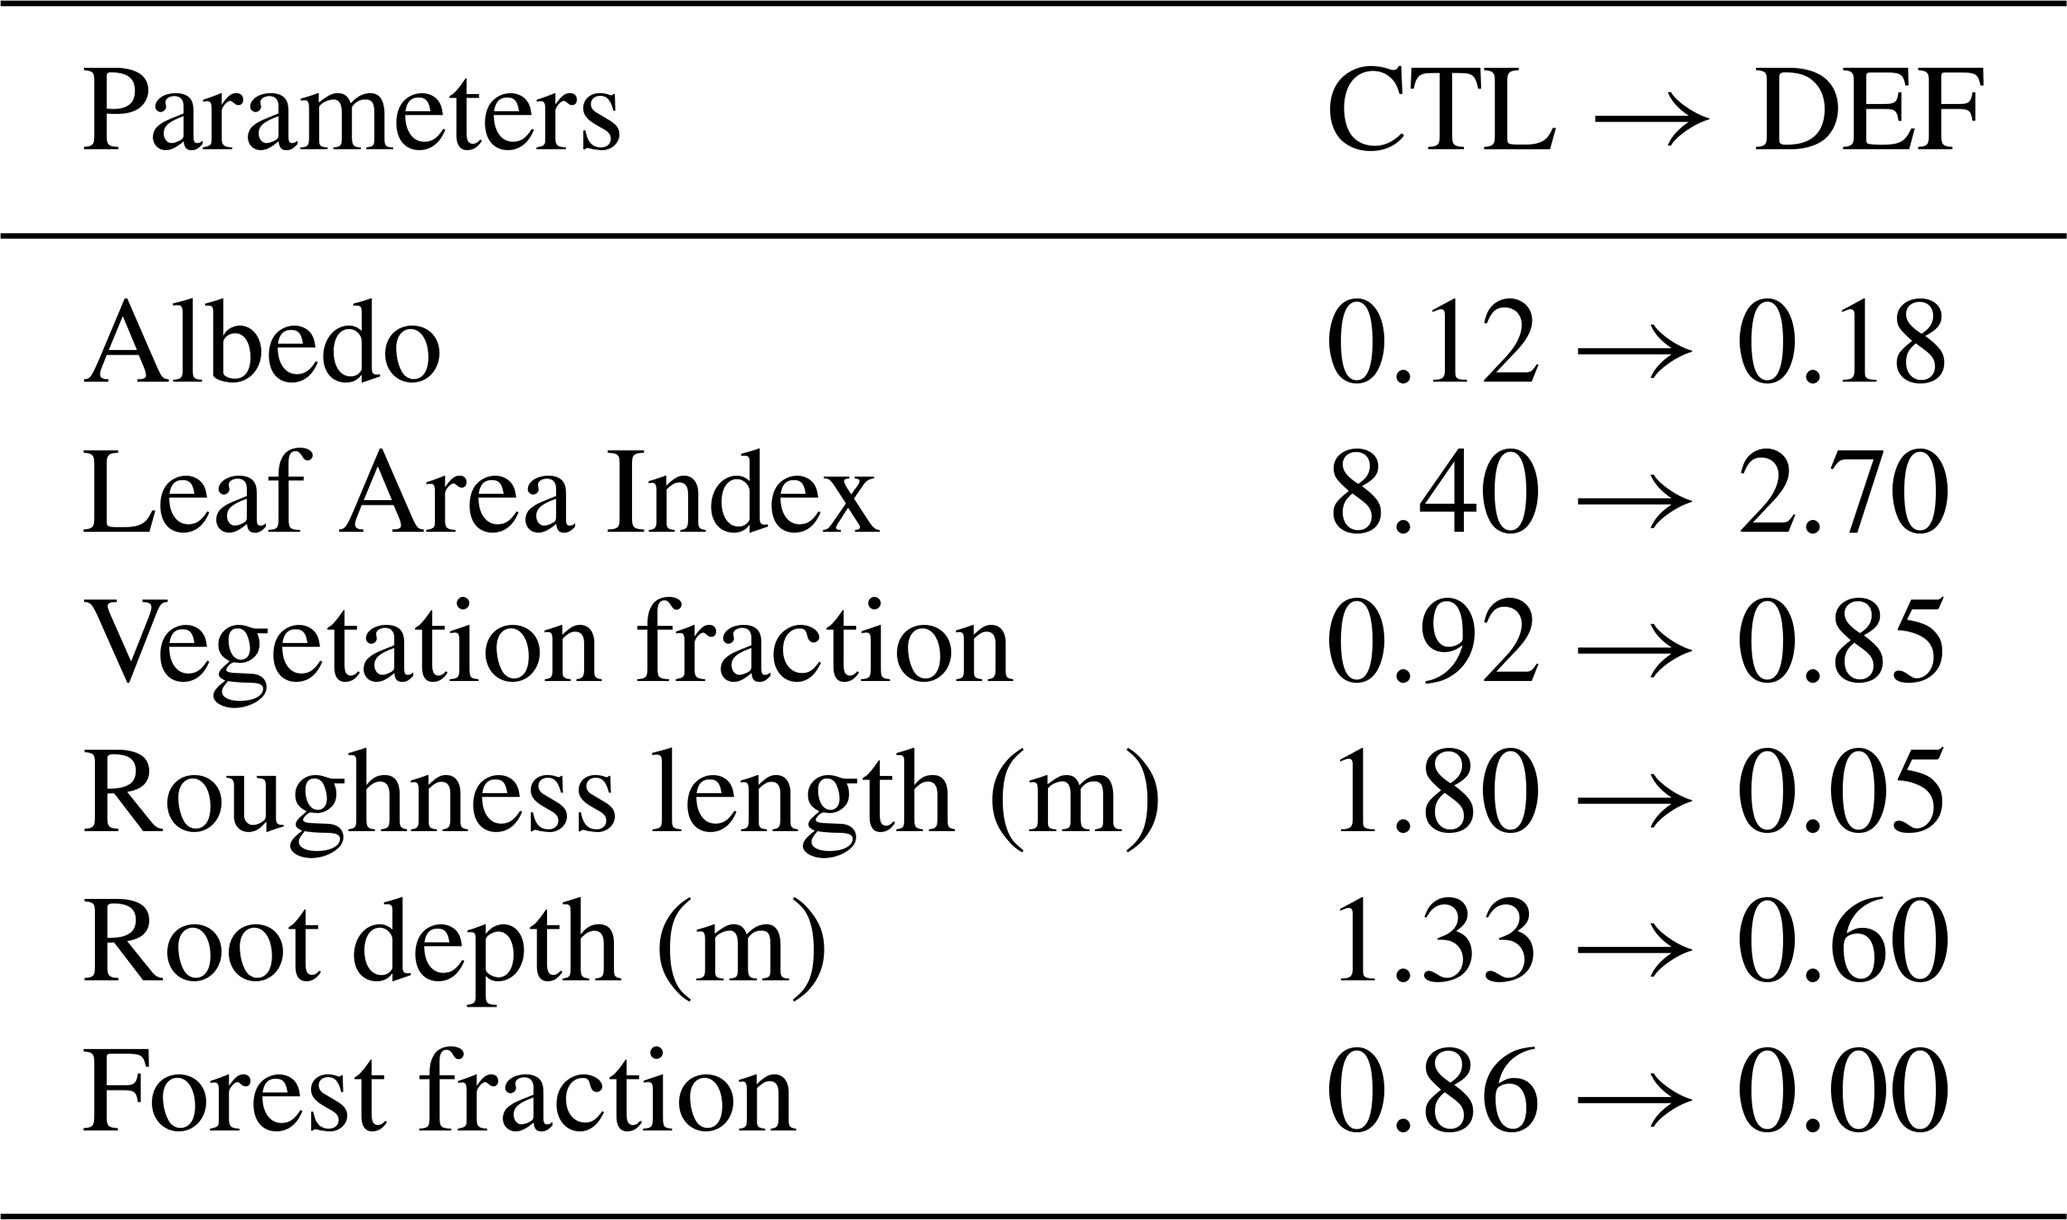
We used the ICON-Sapphire simulation presented in Yoon and Hohenegger (2025). The horizontal resolution is 5 km with a convective parameterization switched off, and a 75 km model top with 90 height levels. The domain is global, and simulations are run for 3 years. The consistent responses across years demonstrate that the simulation period is sufficient for our analysis. Moreover, the initial 11 d spin-up allows soil moisture to equilibrate over the Amazon region in both CTL and DEF (see Fig. S1 in Yoon and Hohenegger (2025)). Two simulations are conducted with and without the Amazon forest, prescribing different biophysical parameters in the land surface model (Table 1). The two simulations are named CTL (without deforestation) and DEF (with complete deforestation). The CTL simulation reproduces the observed precipitation patterns and the seasonal migration of the rainbelt extremely well (see Figs. S2 and S3 in Yoon and Hohenegger (2025)). Regarding hourly precipitation and compared with the satellite-based IMERG dataset, ICON overestimates the frequency of hourly precipitation rates between 10 and 120 mm h−1 with a frequency of occurrence of 0.76 % versus 0.46 % in IMERG. Yet, ICON can capture the tail of the precipitation distribution and reproduce observed precipitation rates up to 156 mm h−1, and only misses very seldomly observed precipitation rates up to 182 mm h−1. As a comparison, it is well known that models with convective parameterizations strongly underestimate extreme precipitation (Kendon et al., 2017; Prein et al., 2015). For the Amazon region, Paccini and Stevens (2023) found a clear underestimation of daily precipitation rates larger than 20 mm h−1 in a low-resolution version of ICON with parameterized convection (see their Fig. 2), which are much better represented in the high-resolution ICON simulation. In terms of temperature, ICON exhibits a spatially consistent and uniform cold bias over the Amazon compared to ERA5 and two FluxNet tower observations located in the region. This cold bias of about 2 K has been found in other configurations of the ICON-Sapphire model (Hohenegger et al., 2023). As the bias is spatially uniform and we are interested in the response to deforestation, we do not expect a strong effect of this bias on this response. However, it could mean that the absolute values of the computed heat stress indices could be even higher. Finally, near-surface wind speeds are slightly stronger in CTL than in ERA5, with a mean root mean square difference of 1.68 m s−1. However, ERA5 has been reported to underestimate the surface wind by 1 m s−1 relative to tower measurements over the Amazon region (Schmitt et al., 2023). Hence, overall, we conclude that CTL satisfactorily represents the three main climate variables that we are interested in looking at.
Table 1The values for CTL are an average of the grid point values from JSBACH over the Amazon, and the values for DEF are taken from and justified in Yoon and Hohenegger (2025).
For the analysis presented here, precipitation, temperature, and surface wind are hourly averaged, and we focus on the Amazon basin (see black contour in Fig. 7a). The moisture convergence is computed from the residuals of the moisture balance equation, including the time tendency of total column water vapor (TCW, ). This is done because the direct calculation of moisture convergence is too inaccurate with the available output frequency. 3D instantaneous data are saved in 6-hourly intervals.
For the analysis, Convective Available Potential Energy (CAPE) and Convective Inhibition (CIN) were computed based on outputs using the MetPy v1.3.1 Python package (May et al., 2022). Parcel ascent was modeled with dry adiabatic lifting to the level of free convection and pseudo-adiabatic moist ascent thereafter, following the approximations of Bolton (1980). CAPE and CIN are calculated at pressure levels using hourly air temperature and dewpoint temperature starting from the surface.
Daily temperature variability is quantified using day-to-day temperature variation (DTDT) index (Karl et al., 1995), defined as the mean absolute difference in daily mean temperature between successive days () within a given period (Eq. 1 in Ge et al., 2022).
n: Total days
To diagnose the impact of deforestation on human discomfort due to changes in temperature and humidity, we use seven heat stress indices as described by Schwingshackl et al. (2021): apparent temperature (AT), NOAA heat index (HI), humidex (Hu), simplified wet-bulb globe temperature (), indoor wet-bulb globe temperature (TWBG), wet-bulb temperature (TWB), universal thermal climate index (UTCI). These indices serve different purposes, leading to a wide range of formulations, with no single index universally regarded as superior (Barnett et al., 2010; Burkart et al., 2011; Schwingshackl et al., 2021). Therefore, to better estimate the impact of deforestation on heat stress, it is required to analyze the overall characteristics of these indices.
HI and Hu are primarily used as heat warning indices. HI, widely applied for assessing heat stress based on temperature and relative humidity, categorizes heat risk into four levels: caution (27 °C, fatigue possible), extreme caution (32 °C, heat stroke, cramps, or exhaustion possible), danger (41 °C, heat stroke, cramps, or exhaustion likely), and extreme danger (54 °C, heat stroke, cramps, or exhaustion highly likely). Hu, developed in Canada, combines temperature and vapor pressure to evaluate thermal discomfort, with threshold indicating some discomfort (30 °C), great discomfort (40 °C), dangerous heat stroke (45 °C), and imminent heat stroke (54 °C). TWB is a physiologically relevant heat stress index that defines the adaptability limits to extreme heat. It represents the lowest temperature an air parcel can reach through evaporative cooling, incorporating temperature, humidity, and pressure. A threshold of 35 °C is considered intolerable for humans and likely lethal. TWBG and are widely used for occupational health assessments, as they account for heat stress levels at different work intensities and rest/work ratios for acclimatized workers. TWBG is a weighted combination of TWB and air temperature, while provides a computationally efficient alternative of TWBG using a linear combination of temperature and vapor pressure. Both indices have the same thresholds, where increasing heat stress requires 25 %, 50 %, and 75 % rest per hour for levels 1 (29 °C), 2 (30.5 °C), and 3 (32 °C), respectively, while level 4 (37 °C) indicates conditions where no work is permitted. UTCI and AT are indices designed to assess thermal comfort. UTCI, a model-based index incorporating air temperature, radiant temperature, wind speed, and humidity, is commonly used in studies evaluating heat-related mortality. Here we use the polynomial approximation based on temperature and vapor pressure introduced by Bröde et al. (2012). Its thresholds classify conditions as moderate (26 °C), strong (32 °C), very strong (38 °C), and extreme heat stress (46 °C). AT, derived from temperature and vapor pressure, is commonly used in epidemiological studies to assess heat-related health risks. Its severity levels range from slight discomfort (28 °C) to moderate (32 °C), strong (35 °C), and extreme discomfort (40 °C). A detailed description of the heat stress levels associated with these indices is summarized in Tables S1 and S2 of Schwingshackl et al. (2021).
3.1 Violent Rain
We start by investigating the intensity of hourly precipitation after deforestation. Figure 1a shows the distribution of hourly precipitation in the Amazon basin for both CTL and DEF. Across all three simulation years, the probability of intense hourly precipitation is consistently higher after deforestation, as indicated by the lighter color lines (Fig. 1a). To better visualize changes, the hourly precipitation rates are categorized into five intensity levels based on the WMO classification (2018): “No rain”, “light” rain (< 0–2.5 mm h−1), “moderate” rain (2.5–10 mm h−1), “heavy” rain (10–50 mm h−1), and “violent” rain (more than 50 mm h−1). Figure 1b illustrates the percentage changes in each category after deforestation. Importantly, the two extreme categories – no rain and violent rain – exhibit a substantial relative increase in frequency after deforestation. No rain almost triples, and violent rain increases by a factor of 1.5. In contrast, light to heavy rainfall remains largely stable, and because light rainfall dominates the frequency of events, the overall mean precipitation remains unchanged as found in Yoon and Hohenegger (2025).
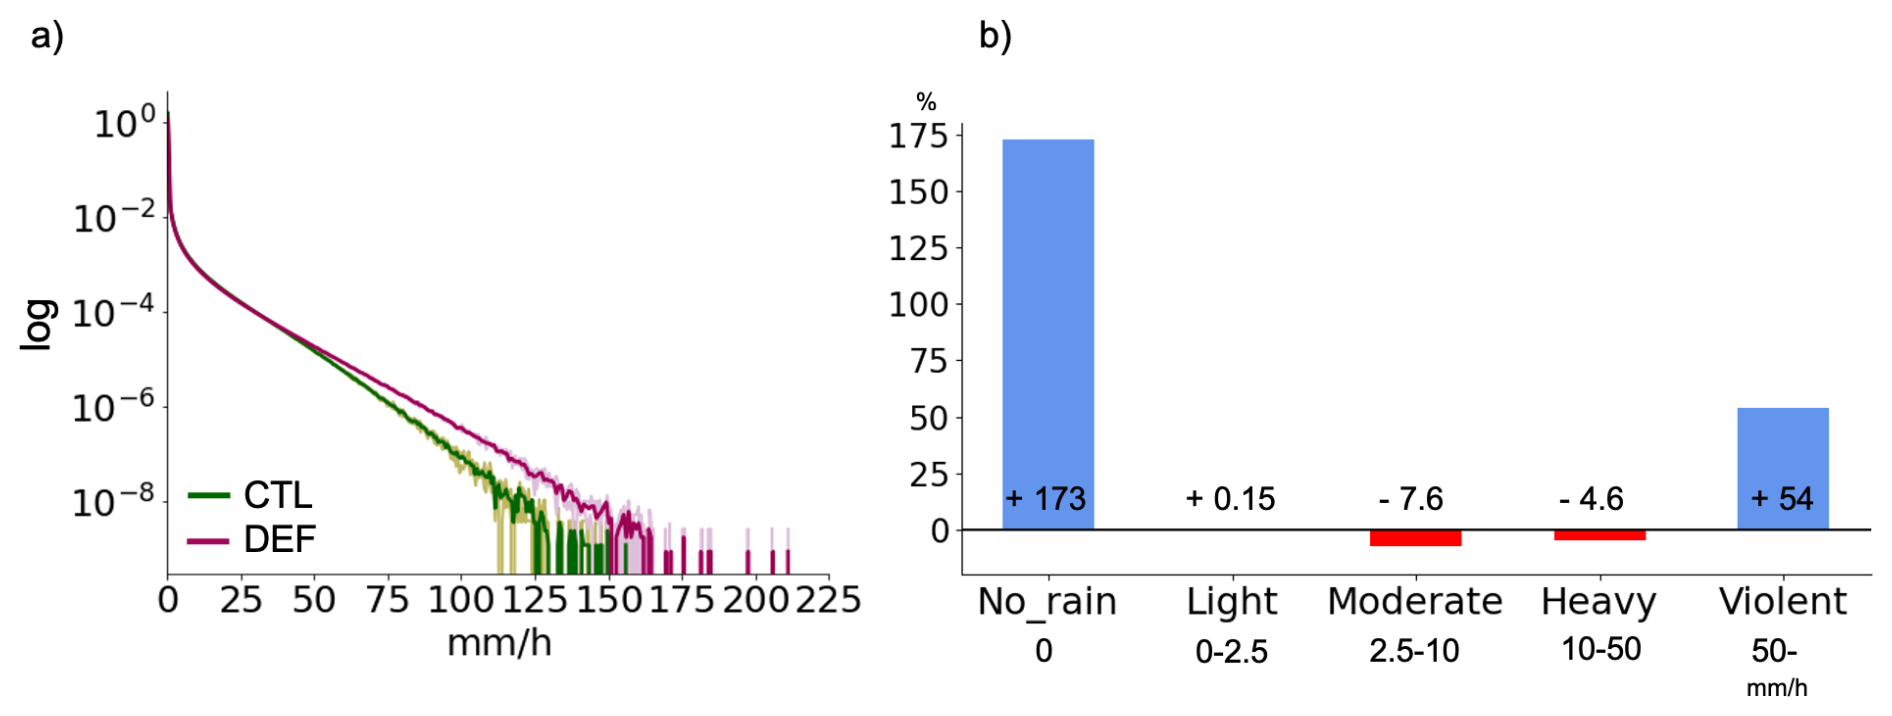
Figure 1Distribution of hourly precipitation [mm h−1] over the Amazon basin before and after deforestation. (a) The logarithmic probability density function of hourly precipitation rates across all Amazonian grid points. Dark green and dark magenta for CTL and DEF, respectively, using all three years (2020–2022), lighter colors for each year separately. (b) Percentage change (written in numbers, %) in frequency for different intensity categories.
We hypothesize that the changes in the tails of the precipitation distribution can be attributed to the fact that it is more difficult to trigger convection in DEF, leading to more violent outbursts when convection does happen. To confirm this, we first examine the mechanisms leading to increased violent rain: the availability of atmospheric moisture and strong updrafts (Trenberth, 1999; O'Gorman and Schneider, 2009; Allan and Soden, 2008; Lenderink and Van Meijgaard, 2008; Liu et al., 2009; Muller et al., 2011). Figure 2 shows the intensity of hourly violent precipitation, binned by Total Column Water vapor (TCW) and vertical velocity at 500 hPa (w500). Not surprisingly, Figure 2 shows that the intensity of violent rain is stronger with higher TCW and/or stronger w500 in both simulations. These links become more pronounced after deforestation, and more violent rains are simulated in DEF together with higher w500 and TCW (Fig. 2b). However, the overall relation between precipitation intensity, TCW and w500 remains largely unchanged. More importantly, Figure 2c indicates that the increase in the frequency of violent rain after deforestation comes from a shift towards stronger w500, whereas TCW remains in the same range of 50 to 60 mm. Hence, the increase in violent rain is primarily driven by stronger updrafts and not by enhanced TCW (Fig. 2c).
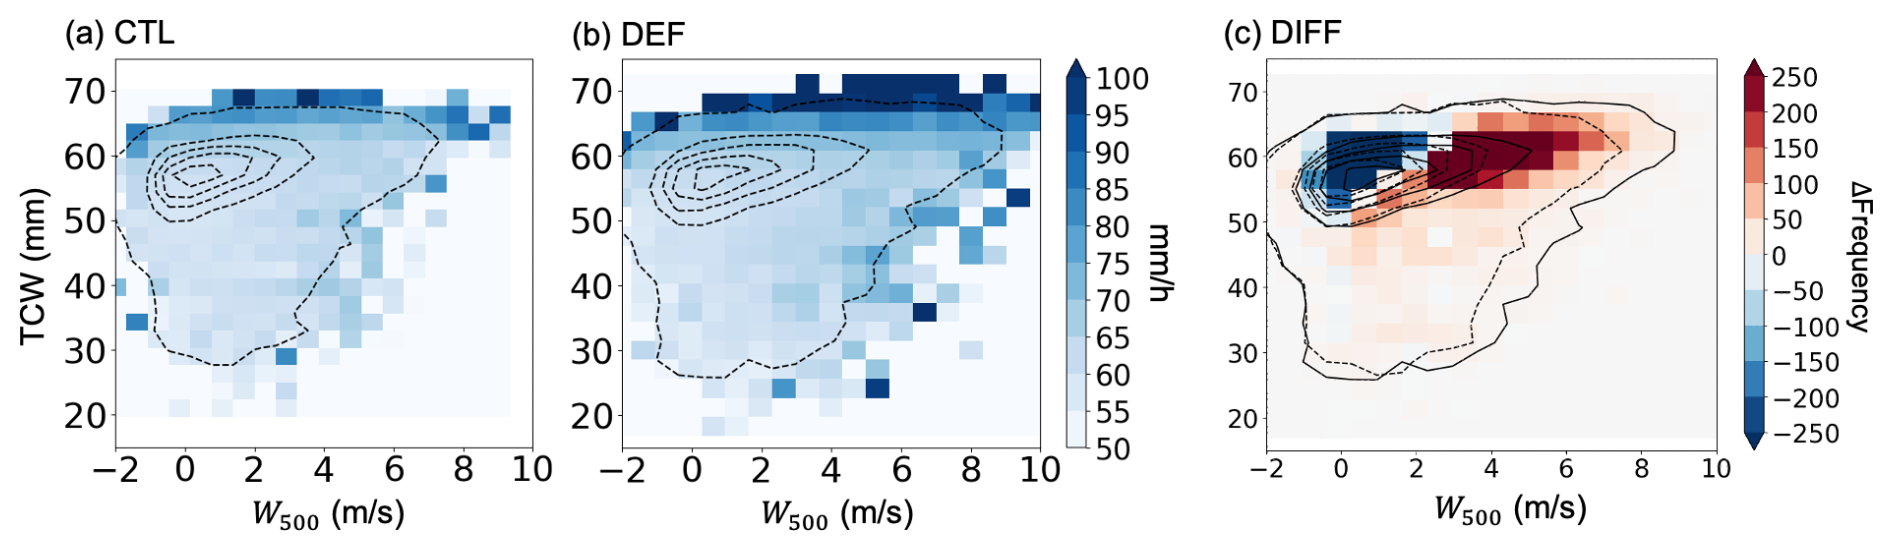
Figure 2The mean intensity of hourly precipitation [mm h−1] only in violent events, averaged within each bin (shaded) ordered by Total Column Water (TCW) and vertical velocity at 500 hPa (w500) for (a) CTL and (b) DEF. Dashed contours represent the frequency of TCW and w500 occurrences, with contour levels at 100, 500, 1000, 1500, and 2000; the innermost contour corresponds to the highest frequency. (c) Shading shows the difference in frequency (DEF minus CTL) for TCW and w500 within each bin. Dashed (CTL) and solid (DEF) lines indicate the frequency distributions already shown in (a) and (b), overlaid for comparison.
Having established that the increase in violent rainfall is mainly due to stronger updrafts, we now investigate the factors responsible for the updraft enhancement. Updraft strength is related to local atmospheric instability and convergence that forces ascent (Davies et al., 2013; Loriaux et al., 2017). Early studies consider moisture convergence as a dynamic variable determined by the circulation (Dai and Trenberth, 2004; Back and Bretherton, 2009). Although moisture convergence mixes the TCW signal, we use it as a proxy for convergence, given that TCW remains unaffected for violent rains after deforestation (Fig. 2c).
First, atmospheric instability is assessed using Convective Available Potential Energy (CAPE). We calculate CAPE one hour prior to the violent rain events in order to relate it to the prerequisites for strong updrafts (Figs. 3). The probability distribution of CAPE values shifts toward lower values after deforestation. The 99th percentile decreases from 3148 to 2138 J kg−1 (Fig. 3a), and mean CAPE values decrease from 1950 to 1058 J kg−1. This reduction suggests that the increase in updraft strength is not driven by an increase in local atmospheric instability, as measured by CAPE. Similar results are obtained when using a longer elapsed time of 2 or 3 h between CAPE and the violent rain events, but we prefer 1 h as the most conservative representation of the pre-storm environment, and given the fast development of convective cells. To understand why CAPE decreases under deforested conditions, we examine its dependence on near-surface temperature and humidity, as CAPE is directly influenced by both factors (Fig. 3b–c). We take both values from the lowest atmospheric layer to calculate CAPE. While higher temperatures generally increase CAPE, this effect is restricted by the availability of atmospheric moisture. Before deforestation, the highest occurrence of near-surface temperature and humidity is within 24–26 °C and 16–19 g kg−1, respectively, where CAPE values range from 1500 to 3000 J kg−1. After deforestation, this distribution shifts in the range of 27–30 °C and below 15 g kg−1, leading to mean CAPE values around 1000 J kg−1. The increase in drier near-surface conditions is a direct consequence of the decrease in evapotranspiration following deforestation, whereas the reduction in CAPE follows from the raised lifting condensation level and level of free convection. In line with our findings, Abramian et al. (2023) also indicated that CAPE is not a good predictor of the strength of updrafts in their study of squall lines. Hence, increased instability cannot explain the stronger updrafts observed after deforestation.

Figure 3CAPE [J kg−1] one hour before violent precipitation over the Amazon. (a) The logarithmic probability density function of CAPE is represented with the mean (solid vertical lines) and the 99th percentile (dashed vertical lines). The PDF is derived from all grid cells and all time steps. CTL is in dark green, and DEF is in dark magenta. CAPE intensity one hour before intense precipitation, binned by near-surface temperature and near-surface specific humidity for (b) CTL and (c) DEF. Colors indicate the average CAPE in each bin. Dashed lines show the frequency of near-surface temperature and specific humidity at levels 100, 500, 1000, 1500, and 2000 times (from white to black). Panel (d) shows the change in the frequency of near-surface temperature and humidity in shading. Dashed (CTL) and solid (DEF) lines indicate the frequency distribution (i.e., the same lines as in b and c).
We now attribute the increase in updraft strength to enhanced moisture convergence. How does moisture convergence change after deforestation, and how does it relate to the occurrence of violent rain events? Figure 4a shows the probability distribution function of moisture convergence strength one hour before violent precipitation in both CTL and DEF. The tails of the convergence distribution are heavier after deforestation, aligning with the simulated increase in violent precipitation. Now, to answer whether violent rain occurs preferentially in regions with stronger moisture convergence, we examine the spatial patterns of these two variables, separately for dry (July–September) and wet (December–February) seasons, given the distinct seasonal circulation patterns in the Amazon region (Marengo, 1992; Leite-Filho et al., 2020; Reboita et al., 2019; Yoon and Hohenegger, 2025). Figures 4b and c depict regions of stronger moisture convergence in the DEF simulation than in CTL (blue contours in Fig. 4b, c). The frequency change in violent rain is defined as the difference in the number of violent rain occurrences between DEF and CTL for each grid point (shading in Fig. 4b, c). Notably, regions with enhanced convergence largely overlap with those experiencing more violent rains, supporting the hypothesis that enhanced convergence leads to stronger updrafts and, consequently, more violent precipitation. These results are similar to an observation-based study by Davies et al. (2013), which showed a strong correlation between mechanical updraft and violent precipitation due to moisture convergence rather than CAPE in their study of convective precipitation over the tropical region at Darwin, Australia. Additionally, given that the spatial pattern of stronger moisture convergence aligns with the location of the rainbelt in the corresponding season, violent precipitation appears to be more closely linked to large-scale moisture convergence.
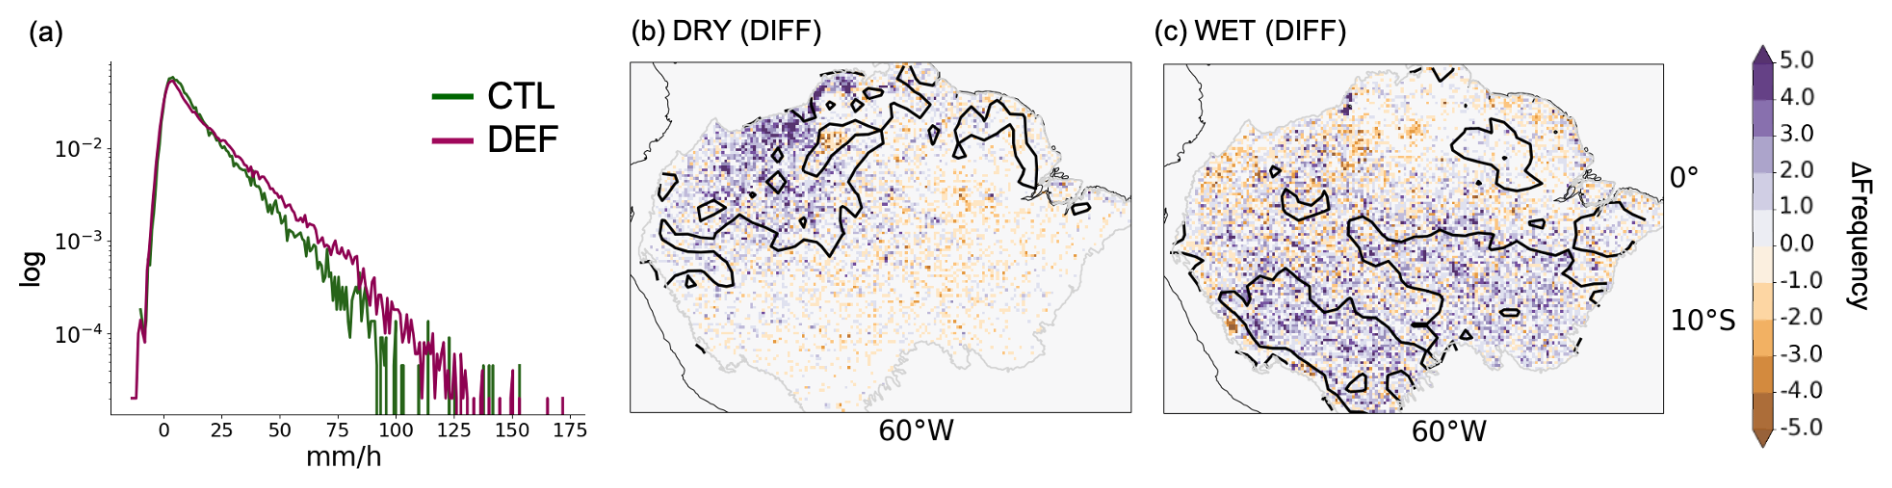
Figure 4(a) Logarithmic probability density function of moisture convergence one hour before violent precipitation events over the Amazon, shown for CTL (dark green) and DEF (dark magenta). (b, c) Differences in the frequency of violent precipitation events between DEF and CTL (DEF minus CTL) at each grid point (shading). The area with a positive anomaly of convergence is defined as the grid points where moisture convergence exceeds the same threshold, 90th percentile of CTL values, and shows a positive anomaly in DEF (blue contour lines) in (b) the dry season and (c) the wet season.
While our results suggest that violent rains can be attributed to increased updrafts through convergence, one might wonder why we see more no-rain events. Alongside the decrease in CAPE, Convective Inhibition (CIN) increases, with the mean value rising from 27 to 111 J kg−1 (Fig. 5a). The environment is more inhibited for convection, and this explains why more no-rain events appear. After all, the environment, in general, becomes less favorable to convect thermodynamically, requiring a stronger dynamical driver to precipitate.

3.2 Heat Stress
The mean 2 m temperature increases by 3.84 °C in the annual mean averaged over the Amazon region. Looking at the diurnal cycle (Fig. 6a), we can see warm temperatures at all times and an increased diurnal temperature range. The nighttime minimum temperature after deforestation is as large as the daytime maximum temperatures before deforestation. The temperature changes are significant in the sense that the difference between DEF and CTL is larger than the interannual variability in temperature in CTL. The temperature distribution of daily mean, daily minimum, and maximum constantly shifts to higher values after deforestation (Fig. 6b).

Figure 6Changes in 2 m temperature [K] over the Amazon region after deforestation. (a) The mean diurnal cycle of 2 m temperature in CTL (dark green) and DEF (dark magenta) with the vertical black lines representing internal variability. The internal variability is computed from the standard deviations of 2 m temperature from a 30 year CTL simulation conducted with a 10 km grid spacing. (b) Temperature distributions of the daily mean (thick solid), daily maximum (thin solid), and daily minimum (thin dashed) temperatures for every grid point in the Amazon.
To understand the temperature changes, we analyze the surface energy budget. The total net surface shortwave radiation increases due to an increase in downwelling shortwave radiation by 30.93 W m−2, which results from reduced overall cloud cover in DEF. However, the higher albedo partly offsets this increase, reducing it by 16.48 W m−2. On the other hand, surface energy loss by longwave radiation increases from 29.25 to 61.84 W m−2 due to both enhanced upwelling longwave radiation by warmer surface temperature and reduced downwelling longwave radiation at the surface. Although the combined effects of shortwave and longwave radiation lead to a net surface radiation decrease of 18.14 W m−2, the redistribution of energy favors sensible heat flux (+38.21 W m−2) over latent heat flux (−59.37 W m−2), resulting in higher 2 m mean temperature. This also explains the larger daytime temperature. At night, the temperature in DEF is still higher than the temperature in CTL. This occurs because daytime heating sets a warmer initial condition at the start of nighttime cooling. Although nighttime surface longwave cooling is stronger in DEF, the nighttime period is too short for radiative cooling in DEF to fully offset the temperature difference with CTL. As a result, before DEF can cool to the same extent as CTL, the warming resumes at sunrise, maintaining a consistently higher 2 m temperature throughout the diurnal cycle. This is consistent with studies that have shown that in the tropical region, open lands tend to be still warmer than forests at night, unlike in boreal regions (Schultz et al., 2017).
We further examine day-to-day variability to understand how temperature fluctuates between days. We use the day-to-day temperature variation (DTDT), which measures the absolute difference in daily mean temperature between consecutive days within a given period (see Methods). Following deforestation, the mean DTDT increases across the Amazon by, on average, 0.4 °C (Fig. 7a), indicating higher day-to-day temperature variability in the deforested case. In Fig. 7b, we look at the full distribution of daily δT between successive days (), not just the absolute value between consecutive days (Fig. 7b). The distribution broadens, both on the positive and negative sides. The increase is slightly stronger on the positive side. We find a fourfold increase in the probability of having between −3 and −1 °C changes in temperature between days and an eightfold increase in the probability of having between 1 and 3 °C changes between days. Together with the documented increase in the diurnal temperature cycle and day-to-day variability, seasonality also increases after deforestation: the range between the yearly maximum and minimum changes from 11.98 to 12.27 °C.
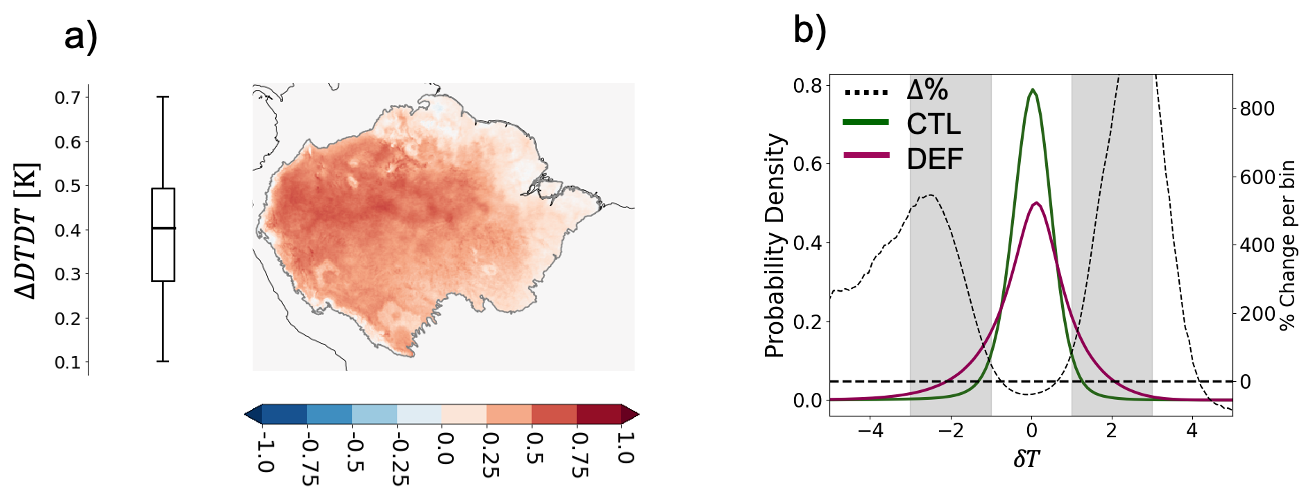
Figure 7(a) Differences in day-to-day temperature variability (DTDT) over the Amazon basin, assessed over the 3-year simulation period. The box-and-whisker plot shows the interquartile range (25th–75th percentiles) as the box, with the horizontal line inside the box indicating the mean. The whiskers extend to the 10th and 90th percentiles. (b) The probability density function of δT in CTL (dark green) and DEF (dark magenta) is shown on the left y-axis. Percentage changes between CTL and DEF are represented by the black dashed line on the right y-axis. The grey range is for temperature changes between (−3, −1 K) to (1, 3 K).
Given these changes, we assess their impact on human thermal stress using seven heat stress indices (see Methods for index explanation). We calculate indices from the full spatio-temporally pooled distribution and show the distribution through the box and whisker plot (Fig. 8). Each index has four heat stress thresholds, represented by color-shading in Fig. 8, except TWB, which has a single threshold. Although each index categorizes thermal stress levels differently based on its intended application, we standardized the descriptions for AT, HI, Hu, and UTCI as follows: “level1: slight discomfort”, “level2: moderate discomfort”, “level3: strong discomfort”, and “level4: extreme discomfort”. For and TWBG, which are used in occupational health assessments, the levels are defined as “level1: 25 %rest/hour”, “level2: 50 %rest/hour”, “level3: 75 %rest/hour”, and “level4: 100 %rest/hour”. All indices, except TWB, consistently indicate a shift toward higher stress levels (Fig. 8). The median AT increases from slight discomfort to strong discomfort. Similarly, the median HI, Hu, and UTCI shift from moderate discomfort to strong discomfort. The suggests that required rest periods increase from 50 %rest/hour to 75 %rest/hour, indicating a substantial decline in work capacity. Moreover, the number of stressed days increases. In the DEF, 70 % of days exceed level 2 across all indices, compared to only 10 %–30 % in CTL. Notably, for level 3, shows a sharp increase, with 63 % of days exceeding this threshold in DEF compared to just 13.2 % in CTL. In contrast, only TWB exhibits a slight reduction after deforestation, as the decrease in humidity offsets the temperature increase. To further examine the role of temperature and humidity in TWB compared to other heat stress indices, we compared heat stress indices by (i) fixing humidity at the CTL values while allowing temperature to change due to deforestation, and (ii) fixing temperature at the CTL values while allowing humidity to change. The results show that the strongly increased temperature after deforestation leads to high heat stress in all indices, whereas the decreased humidity after deforestation reduces heat stress. However, TWB is the only one where the humidity reduction (−1.88 °C) manages to compensate for the increase in temperature (+1.64 °C). Hence, the insignificant change in TWB reflects its high sensitivity to humidity and highlights the importance of using multiple indices to more comprehensively assess heat stress changes. Also, we note that indoor TWBG increases but does not yet show any days above level 2 after deforestation, which is not surprising as it is a weighted mean of TWB and near-surface air temperature.

Figure 8Box-and-whisker plots of heat stress indices (HSI), showing the mean, interquartile range (25th–75th percentiles), and whiskers (10th–90th percentiles): AT, HI, Hu, , TWBG, TWB, UTCI. The background colors show the range of discomfort for each level following Table S1 from Schwingshackl et al. (2021). Yellow shows the range between levels 1 and 2, orange is between 2 and 3, red shows between 3 and 4, and grey is above level 4. Descriptions of indices and levels are given in the Method section.
3.3 Damaging Winds
Lastly, we investigate how near-surface wind changes after deforestation. The 10 m wind speed increases from a mean value of 0.93 to 3.12 m s−1, and in particular the 99th percentile rises from 3.36 to 8.45 m s−1 (shading in Fig. 9). Previous studies have shown that the increase in mean wind speed is a direct result of the decrease in roughness length (Sud et al., 1988) and an intensification of the large-scale circulation after deforestation (Yoon and Hohenegger, 2025). However, beyond that, the increase in hourly precipitation, identified in Sect. 3.1, opens up the possibility of having additional strong winds due to the downdrafts associated with violent rain (Garstang et al., 1998; Windmiller et al., 2023).
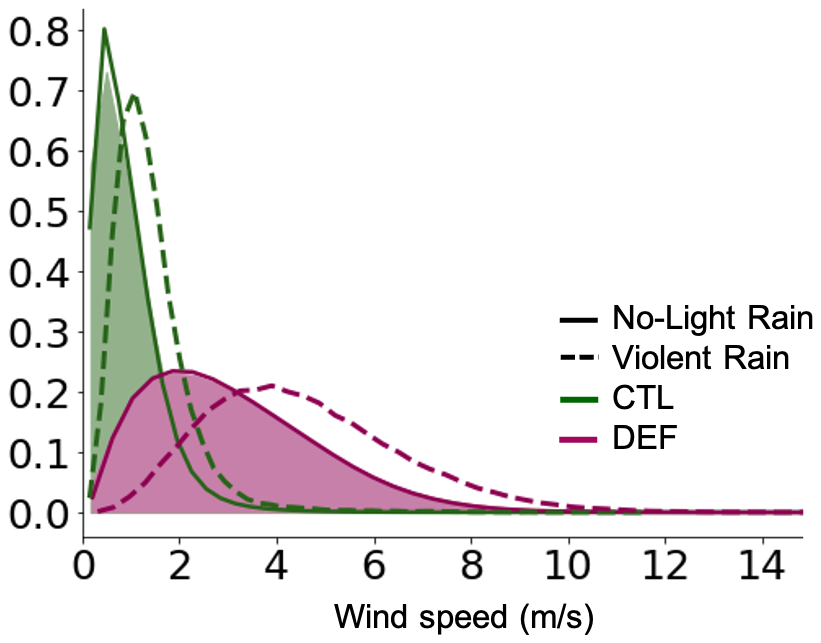
Figure 9Normalized probability density function of 10 m wind speed. Hourly winds from all cases are shaded, with solid lines representing no-light rain cases and dashed lines representing violent rain cases. Wind speeds are collected from all grid cells within the Amazon basin at any time when no-light/violent rain occurs, and then pooled to construct the probability density function.
Table 2The categories of simulations and rain types to disentangle the impact of Roughness length/background Circulation (), Downdraft (D), and its synergy impact ( and D) on windspeed in response to deforestation compared to CTL. The impact of each component is represented with f(0): CTL, : roughness length/background circulation, f(D): downdraft, and : synergy between and D. Values are in units of m s−1. O: included/X: not included
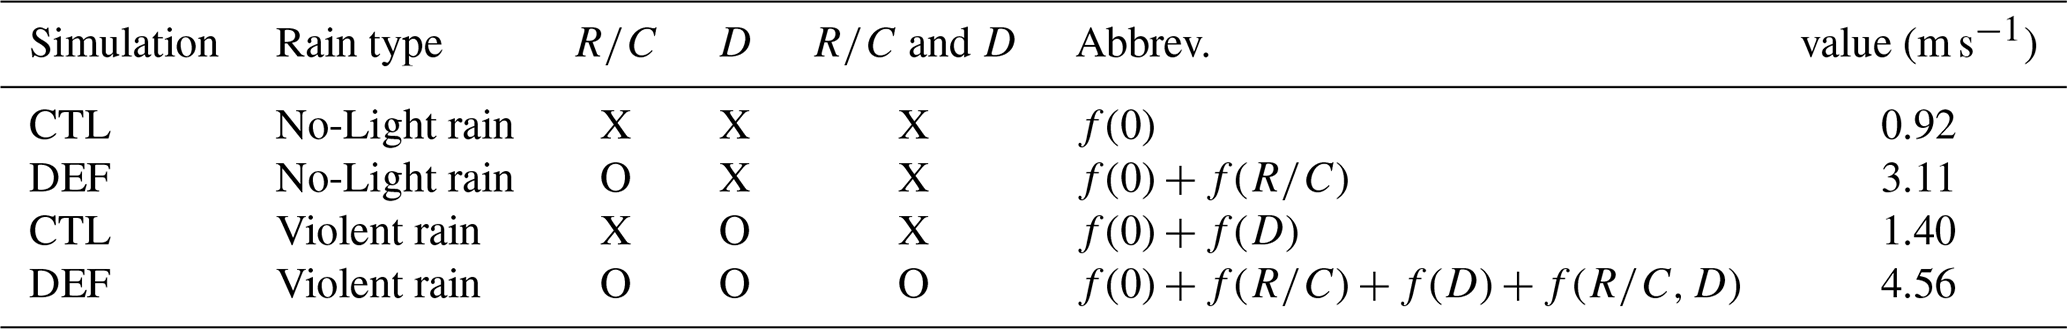
We aim to quantify the additional increase in 10 m wind speeds after deforestation that is due to downdrafts associated with violent rain, separating this effect from changes caused by surface roughness and background circulation. To achieve this, we use the Alpert-Stein factor separation method (Stein and Alpert, 1993). We cannot distinguish between the effect of surface roughness and of background circulation, as we do not have simulations with unchanged roughness at hand. We refer to this factor as and to the downdraft effect as D. We categorize cases into “no-light rain” (including no rain and light rain) and “violent rain” in both the CTL and DEF simulations (Table 2). The mean wind during no-light rain in CTL is the baseline case. We then assume that wind changes between no-light rain and violent rain in CTL are due to D. Wind changes in the no-light rain events between CTL and DEF primarily reflect the influence of , whereas wind changes in violent rain events in DEF compared to no-light rain in CTL entail the three components: , D, and synergy between and D.
In CTL, the mean wind speed during no-light rain is 0.92 m s−1 (see value in Table 2). For the violent rain, it is 1.40 m s−1. This is an increase of 0.48 m s−1, which we attribute to the effect of D alone. By contrast, the mean wind speed for no-light rain in DEF is 3.11 m s−1, giving an increase of 2.19 m s−1. Hence, the effect of is much larger ( m s−1) compared with D (f(D)=0.48 m s−1), showing that dominates the response. In DEF, the mean wind speed during violent rain rises to 4.56 m s−1. Compared to the no-light rain in CTL, this is an increase of 3.64 m s−1 (4.56–0.92). Given the contributions of 2.19 m s−1 for and of 0.48 m s−1 for D, their synergy account for 0.97 m s−1. Expressed in percentage, this gives a contribution of 60 % , 13 % D, and 27 % from their synergy. This indicates that deforestation amplifies wind speed not only by modifying surface roughness and circulation but also by strengthening the contribution of downdrafts during violent rain events. Note that the time resolution of outputs, hourly average value, may fail to capture downdrafts, which last for less than 30 min (Windmiller et al., 2023).
In this study, we investigated the effect of Amazon deforestation on short-duration events by looking at changes in hourly precipitation, temperature, and winds. We are particularly interested in the changes in the tails of the distributions, given the threats they pose. To do so, we use global simulations of Amazon deforestation conducted with a grid spacing of 5 km and explicit convection. In contrast to coarse-resolution simulations, such simulations are better suited to investigate changes in extremes.
The main findings are:
-
From the five categories of rain events, major changes are only in the tails of the distributions: Violent rain increases by 54 % and no-rain by 174 %.
-
daily minimum and maximum temperatures increase by 2.7 and 5.4 °C. Day-to-day temperature becomes more variable, and all heat stress indicators, except for the wet-bulb temperature, point toward higher heat stress.
-
the 99th percentile wind values more than doubled.
The increase in violent rains is due to stronger moisture convergence, not stronger CAPE and not stronger TCW, while the increase in no-rain results from increased CIN. The strong warming directly reflects the decrease in evapotranspiration following deforestation, whereas the increase in TWB is mitigated by a strong decrease in near-surface humidity. Finally, we attributed the increase in mean wind speed during violent rain events to changes in roughness length and circulation (60 %), downdraft intensification (13 %), and synergistic interactions among the two factors (27 %). The documented changes would have impacts on human and forest regrowth. Increased diurnal and seasonal temperature variability will exacerbate the vulnerability of tropical trees, slowing their regeneration. Likewise, the elevated surface wind speeds are expected to create unfavorable conditions for forest regrowth and agriculture. In conclusion, we show that even if annual mean precipitation may remain stable after deforestation, the tail of temperature, precipitation, and wind distribution broadens, making conditions more unfavorable.
The source code of the ICON model is freely available at http://icon-model.org (last access: May 2022). The simulations were done with the ICON branch nextgems_cycle2. The IMERG data was downloaded from the Integrated Climate Data Center website (https://www.cen.uni-hamburg.de/en/icdc/data/atmosphere/imerg-precipitation-amount.html, last access: March 2025). The scripts used to process data and plot the figures in this paper are available in the repository via https://doi.org/10.17617/3.NYLGAN (Yoon, 2025).
AY: conceptualization; data curation; formal analysis; investigation; methodology; software; visualization; writing – original draft; writing – review and editing. CH: conceptualization; funding acquisition; investigation; project administration; resources; supervision; review and editing, JB: investigation; review and editing, LB: visualization; review and editing
The contact author has declared that none of the authors has any competing interests.
Publisher's note: Copernicus Publications remains neutral with regard to jurisdictional claims made in the text, published maps, institutional affiliations, or any other geographical representation in this paper. The authors bear the ultimate responsibility for providing appropriate place names. Views expressed in the text are those of the authors and do not necessarily reflect the views of the publisher.
AY acknowledges funding by the CLICCS centre of excellence subproject A3 funded by DFG. We thank the German Climate Computing Center DKRZ for providing computing resources and the Integrated Climate Data Center (ICDC), the Center for Earth System Research and Sustainability (CEN), University of Hamburg, for supporting the IMERG data. In addition, we would like to thank Jana Sillmann for suggesting the analysis of heat stress indices and Keno Riechers for providing a thorough internal review of the initial manuscript at the Max Planck Institute for Meteorology. Open Access funding is enabled and organized by Projekt DEAL.
This research has been supported by the Deutsche Forschungsgemeinschaft (grant no. CLICCS 390683824 (A3)).
The article processing charges for this open-access publication were covered by the Max Planck Society.
This paper was edited by Somnath Baidya Roy and reviewed by two anonymous referees.
Abramian, S., Muller, C., and Risi, C.: Extreme precipitation in tropical squall lines, Journal of Advances in Modeling Earth Systems, 15, e2022MS003477, https://doi.org/10.1029/2022MS003477, 2023. a
Allan, R. P. and Soden, B. J.: Atmospheric warming and the amplification of precipitation extremes, Science, 321, 1481–1484, 2008. a
Alves de Oliveira, B. F., Bottino, M. J., Nobre, P., and Nobre, C. A.: Deforestation and climate change are projected to increase heat stress risk in the Brazilian Amazon, Communications Earth & Environment, 2, 207, https://doi.org/10.1038/s43247-021-00275-8, 2021. a
Back, L. E. and Bretherton, C. S.: On the relationship between SST gradients, boundary layer winds, and convergence over the tropical oceans, Journal of Climate, 22, 4182–4196, 2009. a
Baldocchi, D. and Ma, S.: How will land use affect air temperature in the surface boundary layer? Lessons learned from a comparative study on the energy balance of an oak savanna and annual grassland in California, USA, Tellus B: Chemical and Physical Meteorology, 65, 19994, https://doi.org/10.3402/tellusb.v65i0.19994, 2013. a
Barnett, A., Tong, S., and Clements, A. C.: What measure of temperature is the best predictor of mortality?, Environmental Research, 110, 604–611, 2010. a
Bolton, D.: The computation of equivalent potential temperature, Monthly Weather Review, 108, 1046–1053, 1980. a
Bonan, G. B.: Forests and climate change: forcings, feedbacks, and the climate benefits of forests, Science, 320, 1444–1449, 2008. a
Bottino, M. J., Nobre, P., Giarolla, E., da Silva Junior, M. B., Capistrano, V. B., Malagutti, M., Tamaoki, J. N., De Oliveira, B. F. A., and Nobre, C. A.: Amazon savannization and climate change are projected to increase dry season length and temperature extremes over Brazil, Scientific Reports, 14, 5131, https://doi.org/10.1038/s41598-024-55176-5, 2024. a
Bröde, P., Fiala, D., Błażejczyk, K., Holmér, I., Jendritzky, G., Kampmann, B., Tinz, B., and Havenith, G.: Deriving the operational procedure for the Universal Thermal Climate Index (UTCI), International Journal of Biometeorology, 56, 481–494, 2012. a
Brown, V. M., Keim, B. D., and Black, A. W.: Trend analysis of multiple extreme hourly precipitation time series in the southeastern United States, Journal of Applied Meteorology and Climatology, 59, 427–442, 2020. a, b
Burkart, K., Schneider, A., Breitner, S., Khan, M. H., Krämer, A., and Endlicher, W.: The effect of atmospheric thermal conditions and urban thermal pollution on all-cause and cardiovascular mortality in Bangladesh, Environmental Pollution, 159, 2035–2043, 2011. a
Butt, E. W., Baker, J. C., Bezerra, F. G. S., von Randow, C., Aguiar, A. P., and Spracklen, D. V.: Amazon deforestation causes strong regional warming, Proceedings of the National Academy of Sciences, 120, e2309123120, https://doi.org/10.1073/pnas.2309123120, 2023. a
Crook, N. A. and Moncrieff, M. W.: The effect of large-scale convergence on the generation and maintenance of deep moist convection, Journal of the Atmospheric Sciences, 45, 3606–3624, 1988. a
Dai, A. and Trenberth, K. E.: The diurnal cycle and its depiction in the Community Climate System Model, Journal of Climate, 17, 930–951, 2004. a
Davies, L., Jakob, C., May, P., Kumar, V., and Xie, S.: Relationships between the large-scale atmosphere and the small-scale convective state for Darwin, Australia, Journal of Geophysical Research: Atmospheres, 118, 11534–11545, https://doi.org/10.1002/jgrd.50645, 2013. a, b, c
Duveiller, G., Hooker, J., and Cescatti, A.: The mark of vegetation change on Earth’s surface energy balance, Nature Communications, 9, 679, https://doi.org/10.1038/s41467-017-02810-8, 2018. a
Emori, S. and Brown, S.: Dynamic and thermodynamic changes in mean and extreme precipitation under changed climate, Geophysical Research Letters, 32, https://doi.org/10.1029/2005GL023272, 2005. a
Fowler, H. J., Ali, H., Allan, R. P., Ban, N., Barbero, R., Berg, P., Blenkinsop, S., Cabi, N. S., Chan, S., Dale, M., and Dunn, R. J.: Towards advancing scientific knowledge of climate change impacts on short-duration rainfall extremes, Philosophical Transactions of the Royal Society A, 379, 20190542, https://doi.org/10.1098/rsta.2019.0542, 2021. a
Gao, L., Huang, J., Chen, X., Chen, Y., and Liu, M.: Contributions of natural climate changes and human activities to the trend of extreme precipitation, Atmospheric Research, 205, 60–69, 2018. a
Garstang, M., White, S., Shugart, H., and Halverson, J.: Convective cloud downdrafts as the cause of large blowdowns in the Amazon rainforest, Meteorology and Atmospheric Physics, 67, 199–212, 1998. a
Ge, J., Liu, Q., Zan, B., Lin, Z., Lu, S., Qiu, B., and Guo, W.: Deforestation intensifies daily temperature variability in the northern extratropics, Nature Communications, 13, 5955, https://doi.org/10.1038/s41467-022-33622-0, 2022. a
Gedney, N. and Valdes, P. J.: The effect of Amazonian deforestation on the northern hemisphere circulation and climate, Geophysical Research Letters, 27, 3053–3056, 2000. a
Good, P., Lowe, J. A., Collins, M., and Moufouma-Okia, W.: An objective tropical Atlantic sea surface temperature gradient index for studies of south Amazon dry-season climate variability and change, Philosophical Transactions of the Royal Society B: Biological Sciences, 363, 1761–1766, 2008. a
Guerreiro, S. B., Blenkinsop, S., Lewis, E., Pritchard, D., Green, A., and Fowler, H. J.: Unravelling the complex interplay between daily and sub-daily rainfall extremes in different climates, Weather and Climate Extremes, 100735, https://doi.org/10.1016/j.wace.2024.100735, 2024. a
Heisler-White, J. L., Blair, J. M., Kelly, E. F., Harmoney, K., and Knapp, A. K.: Contingent productivity responses to more extreme rainfall regimes across a grassland biome, Global Change Biology, 15, 2894–2904, 2009. a
Hirota, M., Oyama, M. D., and Nobre, C.: Concurrent climate impacts of tropical South America land-cover change, Atmospheric Science Letters, 12, 261–267, 2011. a
Hohenegger, C., Korn, P., Linardakis, L., Redler, R., Schnur, R., Adamidis, P., Bao, J., Bastin, S., Behravesh, M., Bergemann, M., Biercamp, J., Bockelmann, H., Brokopf, R., Brüggemann, N., Casaroli, L., Chegini, F., Datseris, G., Esch, M., George, G., Giorgetta, M., Gutjahr, O., Haak, H., Hanke, M., Ilyina, T., Jahns, T., Jungclaus, J., Kern, M., Klocke, D., Kluft, L., Kölling, T., Kornblueh, L., Kosukhin, S., Kroll, C., Lee, J., Mauritsen, T., Mehlmann, C., Mieslinger, T., Naumann, A. K., Paccini, L., Peinado, A., Praturi, D. S., Putrasahan, D., Rast, S., Riddick, T., Roeber, N., Schmidt, H., Schulzweida, U., Schütte, F., Segura, H., Shevchenko, R., Singh, V., Specht, M., Stephan, C. C., von Storch, J.-S., Vogel, R., Wengel, C., Winkler, M., Ziemen, F., Marotzke, J., and Stevens, B.: ICON-Sapphire: simulating the components of the Earth system and their interactions at kilometer and subkilometer scales, Geoscientific Model Development, 16, 779–811, https://doi.org/10.5194/gmd-16-779-2023, 2023. a
Janzen, D. H.: Why mountain passes are higher in the tropics, the American Naturalist, 101, 233–249, 1967. a
Johns, R. H. and Doswell III, C. A.: Severe local storms forecasting, Weather and Forecasting, 7, 588–612, 1992. a
Karl, T. R., Knight, R. W., and Plummer, N.: Trends in high-frequency climate variability in the twentieth century, Nature, 377, 217–220, 1995. a
Kendon, E. J., Ban, N., Roberts, N. M., Fowler, H. J., Roberts, M. J., Chan, S. C., Evans, J. P., Fosser, G., and Wilkinson, J. M.: Do convection-permitting regional climate models improve projections of future precipitation change?, Bulletin of the American Meteorological Society, 98, 79–93, 2017. a
King, G. P., Portabella, M., Lin, W., and Stoffelen, A.: Correlating extremes in wind divergence with extremes in rain over the tropical Atlantic, Remote Sensing, 14, 1147, https://doi.org/10.3390/rs14051147, 2022. a
Kotz, M., Wenz, L., Stechemesser, A., Kalkuhl, M., and Levermann, A.: Day-to-day temperature variability reduces economic growth, Nature Climate Change, 11, 319–325, 2021. a
Lawrence, D. and Vandecar, K.: Effects of tropical deforestation on climate and agriculture, Nature Climate Change, 5, 27–36, 2015. a
Leite-Filho, A. T., Costa, M. H., and Fu, R.: The southern Amazon rainy season: the role of deforestation and its interactions with large-scale mechanisms, International Journal of Climatology, 40, 2328–2341, 2020. a
Lejeune, Q., Davin, E. L., Guillod, B. P., and Seneviratne, S. I.: Influence of Amazonian deforestation on the future evolution of regional surface fluxes, circulation, surface temperature and precipitation, Climate Dynamics, 44, 2769–2786, 2015. a, b
Lemes, M. R., Sampaio, G., Garcia-Carreras, L., Fisch, G., Alves, L. M., Bassett, R., Betts, R., Maksic, J., Shimizu, M. H., Torres, R. R., and Guatura, M.: Impacts on South America moisture transport under Amazon deforestation and 2 °C global warming, Science of the Total Environment, 905, 167407, https://doi.org/10.1016/j.scitotenv.2023.167407, 2023. a
Lenderink, G. and Attema, J.: A simple scaling approach to produce climate scenarios of local precipitation extremes for the Netherlands, Environmental Research Letters, 10, 085001, https://doi.org/10.1088/1748-9326/10/8/085001, 2015. a
Lenderink, G. and Van Meijgaard, E.: Increase in hourly precipitation extremes beyond expectations from temperature changes, Nature Geoscience, 1, 511–514, 2008. a
Liu, S. C., Fu, C., Shiu, C.-J., Chen, J.-P., and Wu, F.: Temperature dependence of global precipitation extremes, Geophysical Research Letters, 36, https://doi.org/10.1029/2009GL040218, 2009. a
Llopart, M., Reboita, M. S., Coppola, E., Giorgi, F., Da Rocha, R. P., and De Souza, D. O.: Land use change over the Amazon Forest and its impact on the local climate, Water, 10, 149, https://doi.org/10.3390/w10020149, 2018. a, b
Loriaux, J. M., Lenderink, G., and Siebesma, A. P.: Large-scale controls on extreme precipitation, Journal of Climate, 30, 955–968, 2017. a, b
Malhi, Y., Aragão, L. E., Galbraith, D., Huntingford, C., Fisher, R., Zelazowski, P., Sitch, S., McSweeney, C., and Meir, P.: Exploring the likelihood and mechanism of a climate-change-induced dieback of the Amazon rainforest, Proceedings of the National Academy of Sciences, 106, 20610–20615, 2009. a
Marengo, J. A.: Interannual variability of surface climate in the Amazon basin, International Journal of Climatology, 12, 853–863, 1992. a
May, R. M., Goebbert, K. H., Thielen, J. E., Leeman, J. R., Camron, M. D., Bruick, Z., Bruning, E. C., Manser, R. P., Arms, S. C., and Marsh, P. T.: MetPy: A meteorological Python library for data analysis and visualization, Bulletin of the American Meteorological Society, 103, E2273–E2284, 2022. a
Medvigy, D., Walko, R. L., and Avissar, R.: Effects of deforestation on spatiotemporal distributions of precipitation in South America, Journal of Climate, 24, 2147–2163, 2011. a
Morabito, M., Crisci, A., Messeri, A., Capecchi, V., Modesti, P. A., Gensini, G. F., and Orlandini, S.: Environmental temperature and thermal indices: What is the most effective predictor of heat-related mortality in different geographical contexts?, the Scientific World Journal, 2014, 961750, https://doi.org/10.1155/2014/961750, 2014. a
Mu, Y., Biggs, T. W., and Jones, C.: Importance in shifting circulation patterns for dry season moisture sources in the Brazilian Amazon, Geophysical Research Letters, 50, e2023GL103167, https://doi.org/10.1029/2023GL103167, 2023. a
Muller, C. J., O’Gorman, P. A., and Back, L. E.: Intensification of precipitation extremes with warming in a cloud-resolving model, Journal of Climate, 24, 2784–2800, 2011. a, b
Nobre, C. A., Sellers, P. J., and Shukla, J.: Amazonian deforestation and regional climate change, Journal of Climate, 4, 957–988, 1991. a
O'Gorman, P. A. and Schneider, T.: Scaling of precipitation extremes over a wide range of climates simulated with an idealized GCM, Journal of Climate, 22, 5676–5685, 2009. a, b
Paccini, L. and Stevens, B.: Assessing precipitation over the Amazon basin as simulated by a storm-resolving model, Journal of Geophysical Research: Atmospheres, 128, e2022JD037436, https://doi.org/10.1029/2022JD037436, 2023. a
Perez, T. M., Stroud, J. T., and Feeley, K. J.: Thermal trouble in the tropics, Science, 351, 1392–1393, 2016. a
Perugini, L., Caporaso, L., Marconi, S., Cescatti, A., Quesada, B., de Noblet-Ducoudré, N., House, J. I., and Arneth, A.: Biophysical effects on temperature and precipitation due to land cover change, Environmental Research Letters, 12, 053002, https://doi.org/10.1088/1748-9326/aa6b3f, 2017. a
Pires, G. F. and Costa, M. H.: Deforestation causes different subregional effects on the Amazon bioclimatic equilibrium, Geophysical Research Letters, 40, 3618–3623, 2013. a
Prein, A. F., Langhans, W., Fosser, G., Ferrone, A., Ban, N., Goergen, K., Keller, M., Tölle, M., Gutjahr, O., Feser, F., and Brisson, E.: A review on regional convection-permitting climate modeling: Demonstrations, prospects, and challenges, Reviews of Geophysics, 53, 323–361, 2015. a
Quine, C. P. and Gardiner, B. A.: Understanding how the interaction of wind and trees results in windthrow, stem breakage, and canopy gap formation, The process and the response, 103–155, 2007. a
RAISG: Deforestación total RAISG, https://apublica.org/wp-content/uploads/2022/09/amazonia-contra-o-relogio-um-diagnostico-regional-sobre-onde-e-como-proteger-80-ate-2025.pdf (last access: 19 August 2025), 2022. a
Reboita, M. S., Ambrizzi, T., Silva, B. A., Pinheiro, R. F., and Da Rocha, R. P.: The South Atlantic subtropical anticyclone: present and future climate, Frontiers in Earth Science, 7, 8, https://doi.org/10.3389/feart.2019.00008, 2019. a
Sampaio, G., Nobre, C., Costa, M. H., Satyamurty, P., Soares-Filho, B. S., and Cardoso, M.: Regional climate change over eastern Amazonia caused by pasture and soybean cropland expansion, Geophysical Research Letters, 34, https://doi.org/10.1029/2007GL030612, 2007. a
Schaefer, J. and Doswell III, C.: The theory and practical application of antitriptic balance, Monthly Weather Review, 108, 746–756, 1980. a
Schmitt, A. U., Ament, F., de Araújo, A. C., Sá, M., and Teixeira, P.: Modeling atmosphere–land interactions at a rainforest site – a case study using Amazon Tall Tower Observatory (ATTO) measurements and reanalysis data, Atmospheric Chemistry and Physics, 23, 9323–9346, https://doi.org/10.5194/acp-23-9323-2023, 2023. a
Schultz, N. M., Lawrence, P. J., and Lee, X.: Global satellite data highlights the diurnal asymmetry of the surface temperature response to deforestation, Journal of Geophysical Research: Biogeosciences, 122, 903–917, 2017. a
Schumacher, R. S. and Rasmussen, K. L.: The formation, character and changing nature of mesoscale convective systems, Nature Reviews Earth & Environment, 1, 300–314, 2020. a
Schwingshackl, C., Sillmann, J., Vicedo-Cabrera, A. M., Sandstad, M., and Aunan, K.: Heat stress indicators in CMIP6: estimating future trends and exceedances of impact-relevant thresholds, Earth's Future, 9, e2020EF001885, https://doi.org/10.1029/2020EF001885, 2021. a, b, c, d
Smith, M. D.: An ecological perspective on extreme climatic events: a synthetic definition and framework to guide future research, Journal of Ecology, 99, 656–663, 2011. a
Spangler, K. R., Liang, S., and Wellenius, G. A.: Wet-bulb globe temperature, universal thermal climate index, and other heat metrics for US Counties, 2000–2020, Scientific Data, 9, 326, https://doi.org/10.1038/s41597-022-01405-3, 2022. a
Spracklen, D. and Garcia-Carreras, L.: The impact of Amazonian deforestation on Amazon basin rainfall, Geophysical Research Letters, 42, 9546–9552, 2015. a, b
Stein, U. and Alpert, P.: Factor separation in numerical simulations, Journal of Atmospheric Sciences, 50, 2107–2115, 1993. a
Sud, Y., Shukla, J., and Mintz, Y.: Influence of land surface roughness on atmospheric circulation and precipitation: A sensitivity study with a general circulation model, Journal of Applied Meteorology, 27, 1036–1054, 1988. a
Swann, A. L., Longo, M., Knox, R. G., Lee, E., and Moorcroft, P. R.: Future deforestation in the Amazon and consequences for South American climate, Agricultural and Forest Meteorology, 214, 12–24, 2015. a
Thompson, R. M., Beardall, J., Beringer, J., Grace, M., and Sardina, P.: Means and extremes: building variability into community-level climate change experiments, Ecology Letters, 16, 799–806, 2013. a
Tiedtke, M.: A comprehensive mass flux scheme for cumulus parameterization in large-scale models, Monthly Weather Review, 117, 1779–1800, 1989. a
Trenberth, K. E.: Conceptual framework for changes of extremes of the hydrological cycle with climate change, Climatic Change, 42, 327–339, 1999. a
Trenberth, K. E., Dai, A., Rasmussen, R. M., and Parsons, D. B.: The changing character of precipitation, Bulletin of the American Meteorological Society, 84, 1205–1218, 2003. a, b
Viscardi, L. A. M., Torri, G., Adams, D. K., and Barbosa, H. D. M. J.: Environmental controls on isolated convection during the Amazonian wet season, Atmospheric Chemistry and Physics, 24, 8529–8548, https://doi.org/10.5194/acp-24-8529-2024, 2024. a
Voldoire, A. and Royer, J.: Tropical deforestation and climate variability, Climate Dynamics, 22, 857–874, 2004. a
Wang, J., Chagnon, F. J., Williams, E. R., Betts, A. K., Renno, N. O., Machado, L. A., Bisht, G., Knox, R., and Bras, R. L.: Impact of deforestation in the Amazon basin on cloud climatology, Proceedings of the National Academy of Sciences, 106, 3670–3674, 2009. a, b
Wang, K., Wang, L., Wei, Y.-M., and Ye, M.: Beijing storm of July 21, 2012: observations and reflections, Natural Hazards, 67, 969–974, 2013. a
Winckler, J., Reick, C. H., Bright, R. M., and Pongratz, J.: Importance of surface roughness for the local biogeophysical effects of deforestation, Journal of Geophysical Research: Atmospheres, 124, 8605–8618, 2019. a
Windmiller, J., Bao, J., Sherwood, S., Schanzer, T., and Fuchs, D.: Predicting convective downdrafts from updrafts and environmental conditions in a global storm resolving simulation, Journal of Advances in Modeling Earth Systems, 15, e2022MS003048, https://doi.org/10.1029/2022MS003048, 2023. a, b
Wright, S. J., MULLER-LANDAU, H. C., and Schipper, J.: The future of tropical species on a warmer planet, Conservation Biology, 23, 1418–1426, 2009. a
Yoon, A. and Hohenegger, C.: Muted amazon rainfall response to deforestation in a global storm-resolving model, Geophysical Research Letters, 52, e2024GL110503, https://doi.org/10.1029/2024GL110503, 2025. a, b, c, d, e, f, g, h, i, j
Yoon, A.: Scripts for processing data and plotting figures for “Extreme events in the Amazon after deforestation”, Edmond Open Research Data Repository [data set], https://doi.org/10.17617/3.NYLGAN, 2025. a
Zhan, Z., Zhao, Y., Pang, S., Zhong, X., Wu, C., and Ding, Z.: Temperature change between neighboring days and mortality in United States: a nationwide study, Science of the Total Environment, 584, 1152–1161, 2017. a