
the Creative Commons Attribution 4.0 License.
the Creative Commons Attribution 4.0 License.
 | 28 Sep 2026
Regional contrasts of ecosystem productivity sensitivity to atmospheric CO2 growth across East Asia
Yun-Soo Na
Sang-Wook Yeh

Jong-Seong Kug
Young-Min Yang
Elevated global atmospheric CO2 intensifies the complexity of climate variability and ecosystem productivity, and its impact on the terrestrial carbon cycle remains unclear. Using twelve Dynamic Global Vegetation Models (DGVMs) in Trends in land carbon cycle datasets and Global Carbon Budget dataset, we quantified the sensitivity of ecosystem productivity-defined as the rate of change in productivity with global atmospheric CO2 growth rate-in East Asia from 1959 to 2023. Most DGVMs showed net ecosystem production sensitivity as negative, implying an intensification of the inverse relationship with atmospheric CO2 growth. By separating East Asia into the monsoon and non-monsoon regions, we examined the temporal changes in gross primary productivity sensitivity, which has been decreasing in both regions since the late 1990s. These productivity responses were primarily controlled by soil moisture sensitivity in the non-monsoon region, whereas photosynthetically active radiation emerged as the key factor in the monsoon region. Furthermore, differences in vegetation structure between the monsoon and non-monsoon regions may contribute to regional differences in the mechanisms associated with vegetation productivity responses to atmospheric CO2 growth. By considering regional climate systems and vegetation characteristics, this study highlights that environmental and structural differences influence the ecosystem response to atmospheric CO2 growth. Ultimately, our findings suggest that considering regionally distinct climate-vegetation feedbacks is essential for improving the accuracy of global carbon cycle projections under future climate change.
- Article
(3119 KB) - Full-text XML
- BibTeX
- EndNote


Assessing the response of terrestrial ecosystems to rising atmospheric CO2 is crucial for understanding future vegetation-carbon-climate feedback. Terrestrial ecosystems act as a major carbon sink, with vegetation absorbing 112–169 Pg C yr−1 through photosynthesis (Penuelas, 2023; Baldocchi et al., 2016). The carbon absorption through photosynthesis of such vegetation varies by region and seasonality (Na and Yeh, 2025; Bi et al., 2022; Ueyama et al., 2024). While ecosystem productivity can be enhanced by the CO2 fertilization effect as atmospheric CO2 increases in response to climate change, it can also be weakened by climate variability such as temperature and respiration (Yun et al., 2022). In particular, East Asia exhibits contrasting precipitation patterns and vegetation characteristics across the region (Fu, 2003; He et al., 2022b; Kim and Park, 2016), where a greater diversity of factors interact to regulate ecosystem carbon exchange.
Numerous studies have analyzed regional and temporal variations in gross primary productivity (GPP), i.e., the carbon uptake by vegetation through photosynthesis in terrestrial ecosystems. While increases in atmospheric CO2 generally enhance vegetation productivity through photosynthesis, this effect has been weakening in recent decades (Wang et al., 2020) despite that the atmospheric CO2 growth rate (ACGR, hereafter), which is defined as the year-to-year increase in global atmospheric CO2 concentration, has rapidly increased (Canadell et al., 2007; Friedlingstein et al., 2025). In addition, the positive contribution of CO2 to GPP trends has diminished to nearly half since the 2000s, with the extent of this reduction varying across climate zones (Wang et al., 2024). Another study analyzing decadal-scale changes in factors affecting global GPP and vegetation activity found that GPP showed the strongest correlations with photosynthetically active radiation (PAR), temperature, and vapor pressure deficit over time, revealing temporal variability in these relationships (Shin et al., 2025; Madani et al., 2020).
In East Asia, links between the East Asian Summer Monsoon and GPP have also been suggested. For example, changes in the atmospheric circulation field, precipitation, and downward solar radiation associated with the East Asian summer monsoon result in regional differences in GPP within China (Han et al., 2024). However, research comparing the key environmental factors influencing GPP sensitivity-defined as the ACGR-associated variation in vegetation productivity-between the monsoon and other regions is not well organized. Building upon these findings, this study investigates the primary drivers of changes in ACGR-associated GPP sensitivity in East Asia.
We provide the sensitivity of terrestrial ecosystem productivity in East Asia to global ACGR using Dynamic Global Vegetation Models (DGVMs) in Trends in land carbon cycle (TRENDY) datasets and Global Carbon Budget dataset. By contrasting GPP changes in the monsoon and non-monsoon regions in East Asia and examining relevant environmental factors such as soil moisture (SM) and PAR, we aim to identify mechanisms explaining regional differences in the sensitivity of terrestrial ecosystem productivity to global ACGR in East Asia. Understanding these regional differences can improve the projection of future vegetation-carbon-climate feedback in East Asia.
2.1 Atmospheric CO2 growth rate
We used global ACGR from 1959 to 2023 from the Global Carbon Budget 2024, provided by the US National Oceanic and Atmospheric Administration Global Monitoring Laboratory (Lan et al., 2025). Data from 1959 to 1979 are observed by the Scripps Institution of Oceanography, based on the average atmospheric CO2 concentration measured at Mauna Loa and South Pole stations (Keeling et al., 1976). Data from 1980 to 2023 are estimated from global averages of multiple stations (Global Carbon Project, 2024). The ACGR was derived from atmospheric CO2 concentration measurements and expressed as the annual change in atmospheric CO2 burden [Gt C yr−1], defined as the year-to-year difference (Global Carbon Project, 2024; Friedlingstein et al., 2025).
2.2 Trends in land carbon cycle datasets (TRENDY) models
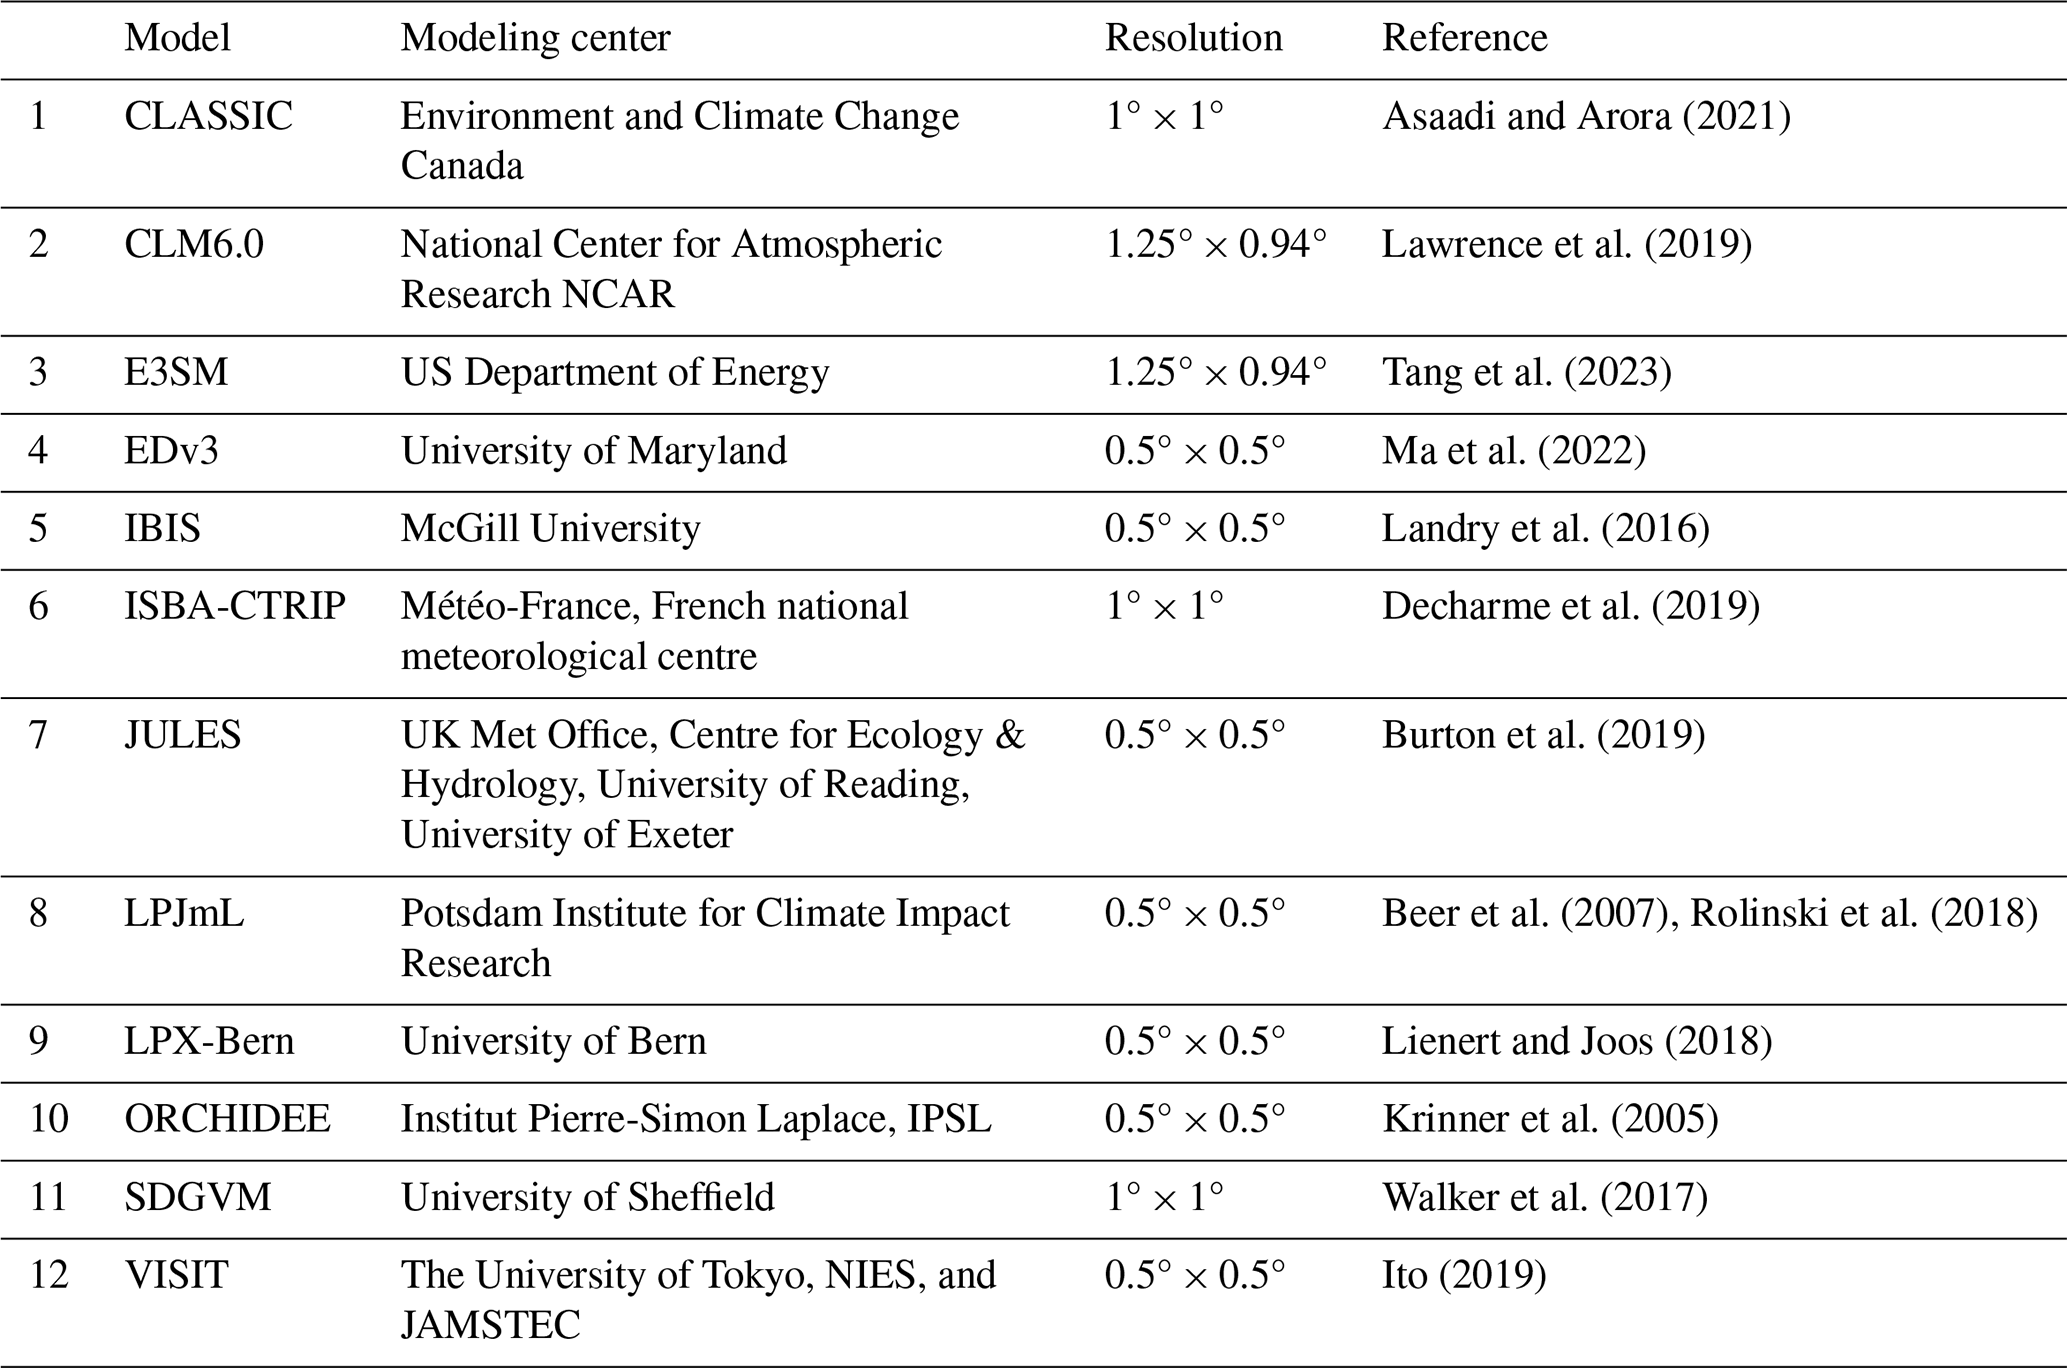
The TRENDY dataset, an ensemble of DGVMs, provides estimates of terrestrial carbon sinks and sources (Sitch et al., 2024; Friedlingstein et al., 2025). We analyzed TRENDY outputs to identify changes in carbon flux sensitivity within East Asia, using 12 DGVMs included in the TRENDY version 13 ensemble (TRENDY v13) (Table 1) conducted for the Global Carbon Budget 2024 (Friedlingstein et al., 2025). We examined six ecosystem variables from TRENDY under the S3 scenario for 1959 to 2023, which considers changes of CO2, Climate, Land Use and Land Cover Change (Sitch et al., 2024). These variables include CO2 fluxes (for example, GPP, autotrophic respiration (Ra), heterotrophic respiration (Rh)), water fluxes (for example, SM, transpiration), and radiation including PAR. On the other hand, NEP is an important indicator of the carbon sequestration capacity of terrestrial ecosystems (Yuan et al., 2023; Zhang et al., 2023) and was defined as GPP minus Ra and Rh [g m−2 d−1].
SM is expressed in [kg m−2], while transpiration was converted from [kg m−2 s−1] to [mm d−1] by multiplying by 86 400. PAR was estimated as 0.5 of surface downwelling shortwave radiation, and values in W m−2 were converted to using the relationship 1 J = 4.6 µmol of PAR (Li et al., 2018). All datasets were regridded to a 1.0° × 1.0° spatial resolution using bilinear interpolation with the Climate Data Operator.
Table 1Information on the TRENDY v13 model list used in this study.
2.3 Land cover data
The Moderate Resolution Imaging Spectroradiometer land cover type product is used to describe an annual global land cover map at a 500 m spatial resolution (He et al., 2022a; Friedl and Sulla-Menashe, 2022). The dataset classifies each grid cell into 17 land cover classes based on the International Geosphere-Biosphere Program schemes (Loveland and Belward, 1997; Zhang and Roy, 2017). We analyzed the mean land cover map for 2001 to 2023. If several land cover types appear with the same frequency within a grid cell, the type from the most recent year was used. The dataset was regridded to a 1.0° × 1.0° spatial resolution. Specifically, the most frequently occurring land cover type within each grid cell was defined as the representative land cover type; no cases were found where the frequency of multiple land cover types was identical. This regridding procedure was used solely to describe regional land cover characteristics and therefore had no impact on the sensitivity estimates.
2.4 Definition of sensitivity of ecosystem variables to Atmospheric CO2 growth rate
Using the Global Carbon Budget 2024 and TRENDY v13, we focused on assessing the sensitivity of ecosystem variables to ACGR from 1959 to 2023, over East Asia (10–50° N, 90–150° E). We adopted the methodology to define the sensitivity of GPP to global ACGR following Li et al. (2024). The methods are as follows: First, the long-term trends of annual GPP and ACGR were removed to produce detrended time series (Fig. 1a, b). We used the LOWESS method to remove a trend. This method differs from conventional linear trend removal and it captures nonlinear variations by fitting a smoothing curve through locally weighted regressions (smoothing span (f) = 0.25, robustness iterations = 3). The LOWESS smoothing span determined the level of smoothing used to remove the trend from the entire time-series, while the moving window length determines the period used in the subsequent sensitivity regression analysis. Sensitivity analysis using f=0.2 and 0.3 with robustness iterations fixed at 3, and using 2 and 4 robustness iterations with f fixed at 0.25, produced consistent temporal patterns, indicating that the main results are not sensitive to variations in the LOWESS parameters. A linear regression was then performed using a 20-year moving window, with the slope of each regression defined as the sensitivity of GPP to ACGR [g m−2 d−1 (Gt C yr−1)−1] (Fig. 1c). As the 20-year moving window does not contain a single central year that is an integer, each sensitivity is represented by the later of the two central years in that window. Accordingly, windows calculated for the entire 1959–2023 period are shown as 1969–2014. Specifically, linear regression was performed between detrended variables, defined as follows:
where Y′ represents detrended ecosystem variables (e.g., GPP), X′ represents detrended ACGR, and β indicates the regression slope; the slope β is defined as sensitivity. The calculation for the slope β is as follows:
where and denote the mean values of variable X and Y, respectively. We apply the same method to calculate the GPP sensitivity to obtain the sensitivities of NEP, Ra, SM and transpiration in response to changes in ACGR. Note the sensitivity units of [g m−2 d−1 (Gt C yr−1)−1] for NEP and Ra, [kg m−2 (Gt C yr−1)−1] for SM, and [mm d−1 (Gt C yr−1)−1] for transpiration, respectively. This represents the change in GPP in response to changes in ACGR, and a positive sensitivity indicates that GPP increases with an increase of ACGR and vice versa. In contrast, a negative sensitivity indicates either a decrease of GPP with an increase of ACGR or an increase of GPP with a decrease of ACGR. A value close to zero indicates a minimal or no response. The sensitivity defined in this study does not aim to isolate the direct effects of CO2 only. Instead, we quantify the relationship between ecosystem productivity and the ACGR within the Earth system. In this context, the calculated sensitivity represents the combined ecosystem response to the coupled interactions of CO2, climate variability, and land-use change.
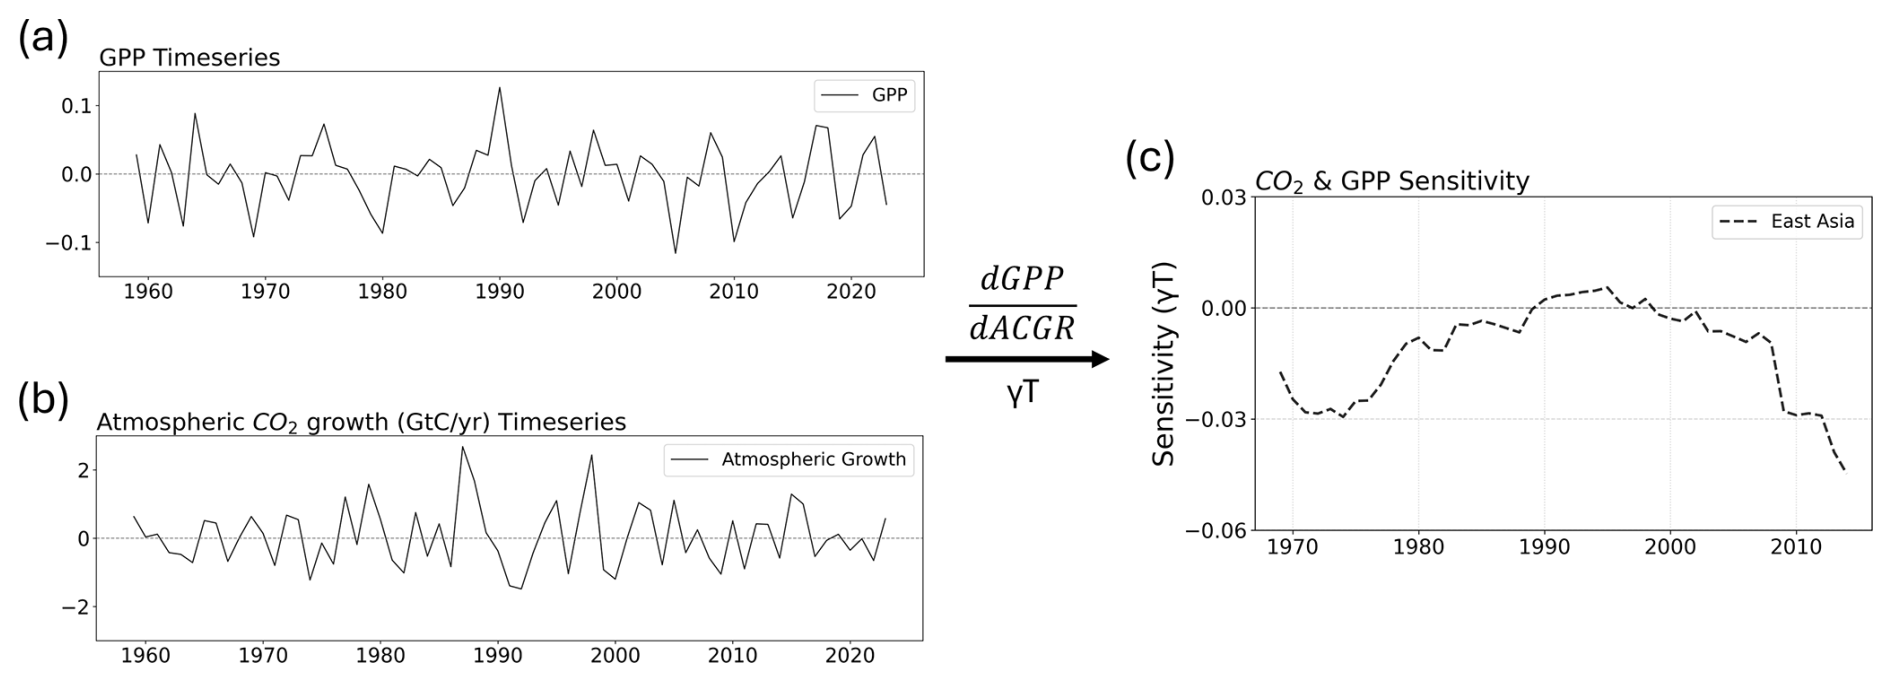
Figure 1Methodological procedure for ecosystem productivity sensitivity to atmospheric CO2 growth. (a) Detrended time series of GPP over East Asia from nine TRENDY v13 models. (b) Detrended atmospheric CO2 growth from the Global Carbon Budget 2024. (c) Sensitivity of atmospheric CO2 growth and GPP over 20-year moving windows for the entire 1959–2023 period. For all panels, see Data and Methods for details.
Although statistical significance was assessed for each moving window, it was determined that summing or averaging the p-values calculated from different windows to represent a single index would not provide a statistically meaningful analysis. Consequently, the significance analysis was performed on a single window basis. The most recent 20-year period (2004–2023) was selected as the base window to reflect current climate conditions and ecosystem responses; this represented a methodological simplification for model selection. It is noted that NEP was used as a criterion for model selection in this study because it reflects the overall carbon balance by integrating carbon uptake and loss through respiration. In contrast, GPP was used for regional classification and mechanism analysis. Since NEP is an indicator that reflects multiple ecosystem processes in carbon uptake and release; however, as it involves intricate and mutually offsetting reactions, interpreting the mechanisms related to productivity is complicated. Therefore, GPP, which directly represents photosynthetic carbon uptake, provides a more appropriate indicator for examining the impact of environmental factors on the sensitivity of ecosystem productivity. Also, PAR is an essential energy source for vegetation photosynthesis (Ren et al., 2018; Kalaji et al., 2014), and because it is not directly controlled by atmospheric CO2, it can be considered an independent environmental variable.
3.1 East Asian GPP and NEP relationship with ACGR
We first analyzed the sensitivity of NEP using each of the 12 DGVMs (Fig. 2a). The value for each model in Fig. 2a represents the temporal mean of the 20-year moving window NEP sensitivities calculated over the period of 1959–2023. All models except LPX-Bern simulated negative NEP sensitivities, indicating an inverse relationship between ACGR and NEP in East Asia, which may reflect changes in ecosystem carbon uptake ability. Note that, because p values cannot be meaningfully averaged into a single value, the statistical significance of NEP sensitivity was assessed using a simplified method involving the last 20-year (2004–2023) moving window to reflect ecosystem changes in recent decades. With these criteria applied, three models showed statistically insignificant relationships (p>0.05) or inconsistent signs; consequently, in subsequent analysis, only the nine models simulated as significant were used. The model selection was based on NEP sensitivity, as NEP is an integrated indicator accounting for both carbon uptake through photosynthesis and carbon release through respiration. Note that the overall results in the present study show little change when all 12 DGVMs are used.
Following this selection, we analyzed the spatial distribution of GPP sensitivity in East Asia (Fig. 2b). Within East Asia, GPP sensitivity displays a distinct spatial contrast between central-eastern China, Korea, and Japan (Fig. 2b). This suggests that the ACGR-associated ecosystem productivity response (i.e., GPP sensitivity) is not spatially consistent in East Asia and is influenced by regional environmental factors. Therefore, we separated East Asia into two regions to investigate the regional heterogeneity of ecosystem responses, one is the East Asian monsoon region (10–40° N, 110–140° E) (Li and Zeng, 2002; Jianping and Qingcun, 2003) and the other is the non-monsoon region – consisting of northern (41–50° N, 90–150° E) and western (10–40° N, 90–110° E) areas. Although the GPP sensitivity patterns do not perfectly align with the East Asian monsoon boundary, the monsoon region generally covers areas where positive sensitivity predominates, whereas the non-monsoon region includes areas with distinctly negative sensitivity. These regional distinctions, related to the monsoon system, provide a basis for understanding regional differences in ecosystem responses, reflecting the climatic influences of East Asia, and should be interpreted as a simplified framework representing regional-scale hydroclimatic conditions rather than exact spatial boundaries. Although the spatial pattern shown in Fig. 2b represents the average GPP sensitivity over the entire period, some grid cells showed temporal variations in sign and spatial distribution (figure not shown). Nevertheless, the overall spatial pattern was used for regional classification. These temporal patterns and regional differences can be identified through time-series analysis.
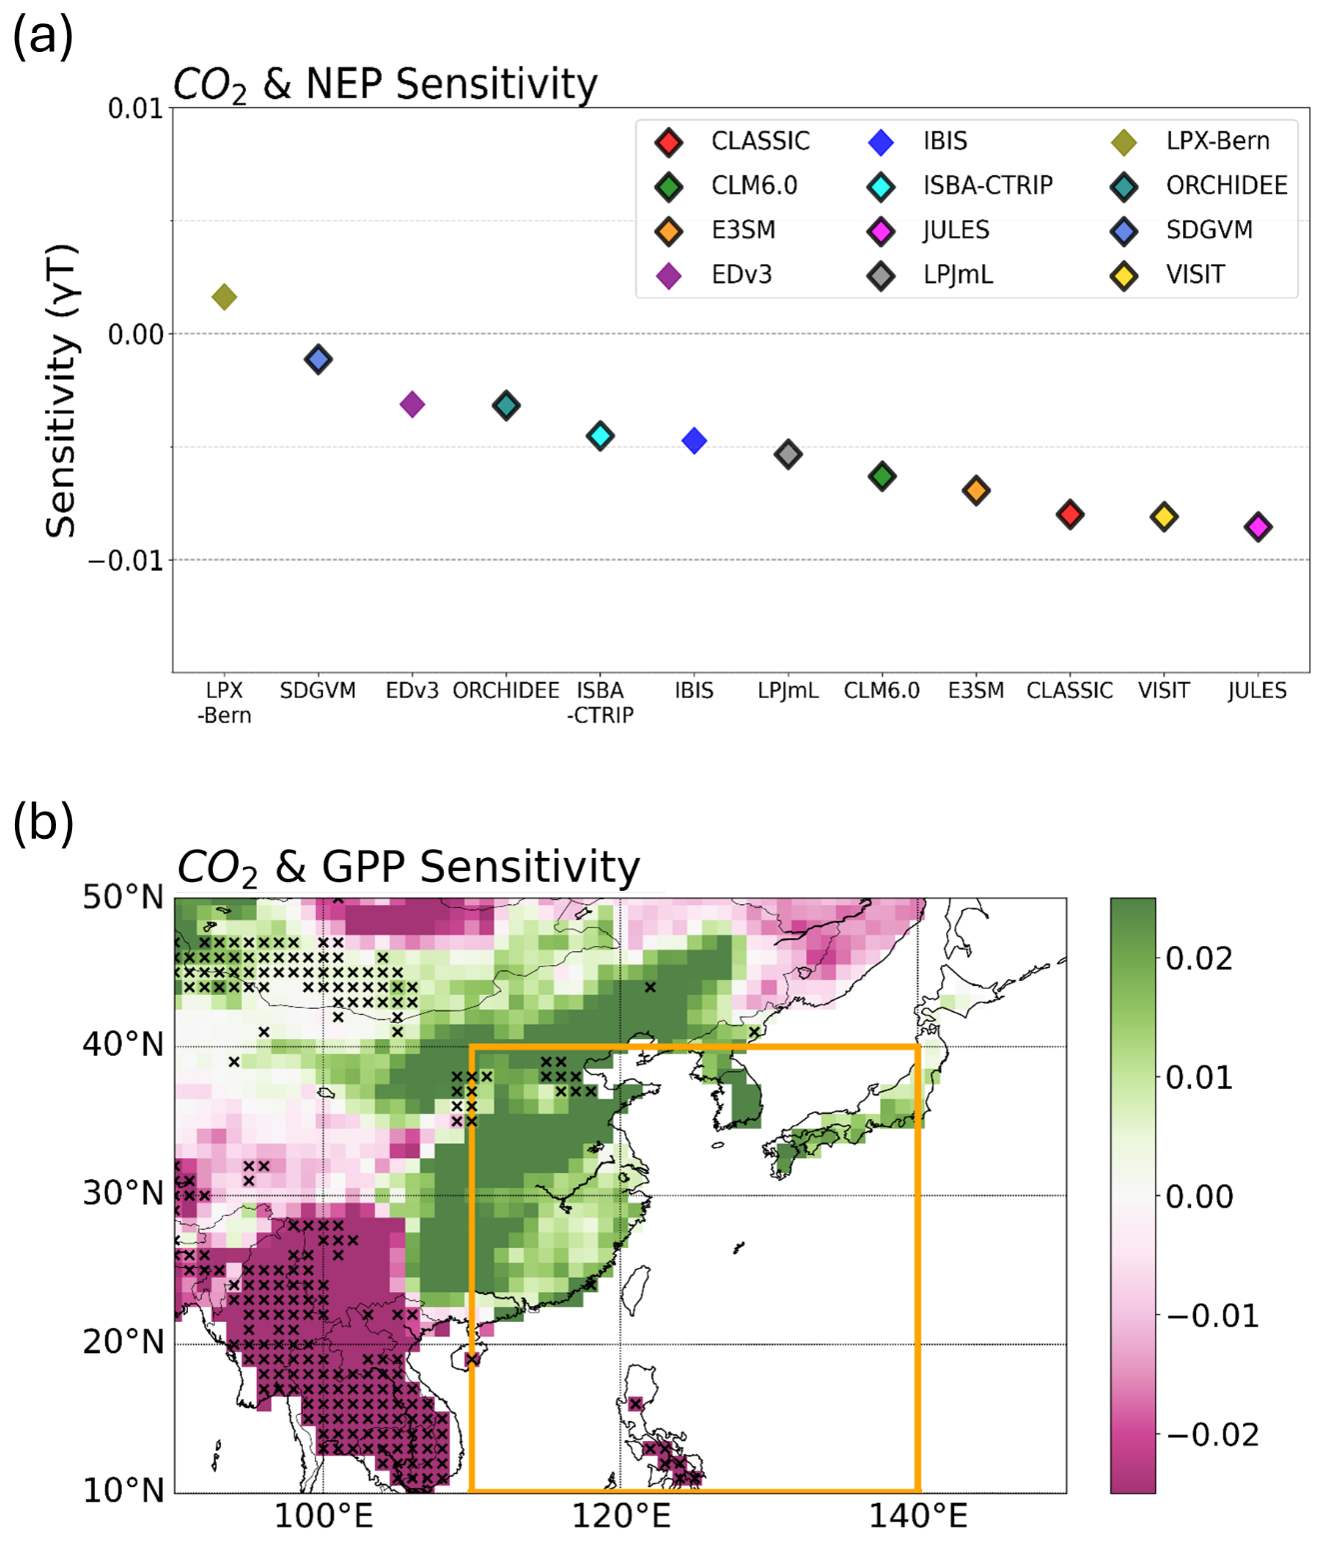
Figure 2(a) Scatter plot of the sensitivity between atmospheric CO2 growth and NEP over the 1959-2023 period, based on 12 models from TRENDY v13. Each scatter represents atmospheric CO2 growth and NEP sensitivity of an individual model. Models with statistically significant relationships at the 95 % confidence level (from the last 20-year window) are outlined in black. (b) Spatial patterns of the sensitivity to atmospheric CO2 growth and GPP over East Asia, based on the ensemble mean of nine TRENDY models during 1959–2023. An x mark denotes statistically significant relationships at the 90 % confidence level evaluated from the last 20-year window.
In Fig. 3a, the sensitivity of NEP in the non-monsoon region remained negative throughout the entire period. It gradually approached zero by the late 1990s before shifting toward more negative values. In contrast, the monsoon region showed weakly positive NEP sensitivity, which gradually decreased and became negative around the 1990s (Fig. 3a). Consequently, both regions exhibited a trend toward more negative NEP sensitivity, suggesting a strengthening inverse relationship between ACGR and ecosystem carbon uptake (i.e., increased ACGR corresponds to reduced carbon uptake capacity, and vice versa) in East Asia after the late 1990s, although the statistical significance varied among moving windows.
Similarly, the GPP sensitivity broadly revealed a similar pattern to NEP sensitivity, though with greater amplitude, indicating a stronger ACGR-associated ecosystem response (Fig. 3b). In the non-monsoon region, GPP sensitivity remained negative for most of the period, briefly approaching zero and becoming slightly positive during the 1990s, before subsequently shifting back to negative values (Fig. 3b). By contrast, the monsoon region showed positive GPP sensitivity that gradually weakened and turned negative in the late 2000s (Fig. 3b). The convergence of GPP sensitivity toward more negative values over time indicates an intensifying inverse relationship between ACGR and GPP. This suggests that higher ACGR is increasingly associated with reduced photosynthetic carbon uptake, and vice versa; however, this pattern should be interpreted mainly as a temporal tendency rather than a consistently significant response across all moving windows.
Furthermore, Ra sensitivity exhibited a pattern generally consistent with GPP sensitivity, as Ra is closely related to photosynthetic activity (Fig. 3c). Regarding this relationship, Ra sensitivity showed a decreasing pattern similar to that of GPP, reflecting that Ra showed a similar association with variations in ACGR. However, because statistical significance was not maintained across all moving windows, these results should be interpreted as a general temporal trend rather than a strictly significant one.
In addition, to examine whether the sensitivity pattern is influenced by the length of the moving window, 10, 15, 25 and 30-year moving windows were applied (figure not shown). The shorter the moving window, the greater the short-term variability, while the longer the window, the more gradual the temporal variation; however, the overall temporal patterns and trends were generally consistent with the results observed using a 20-year moving window. Therefore, the main interpretation of this study is not significantly dependent on the length of the moving window and is considered to be relatively robust.
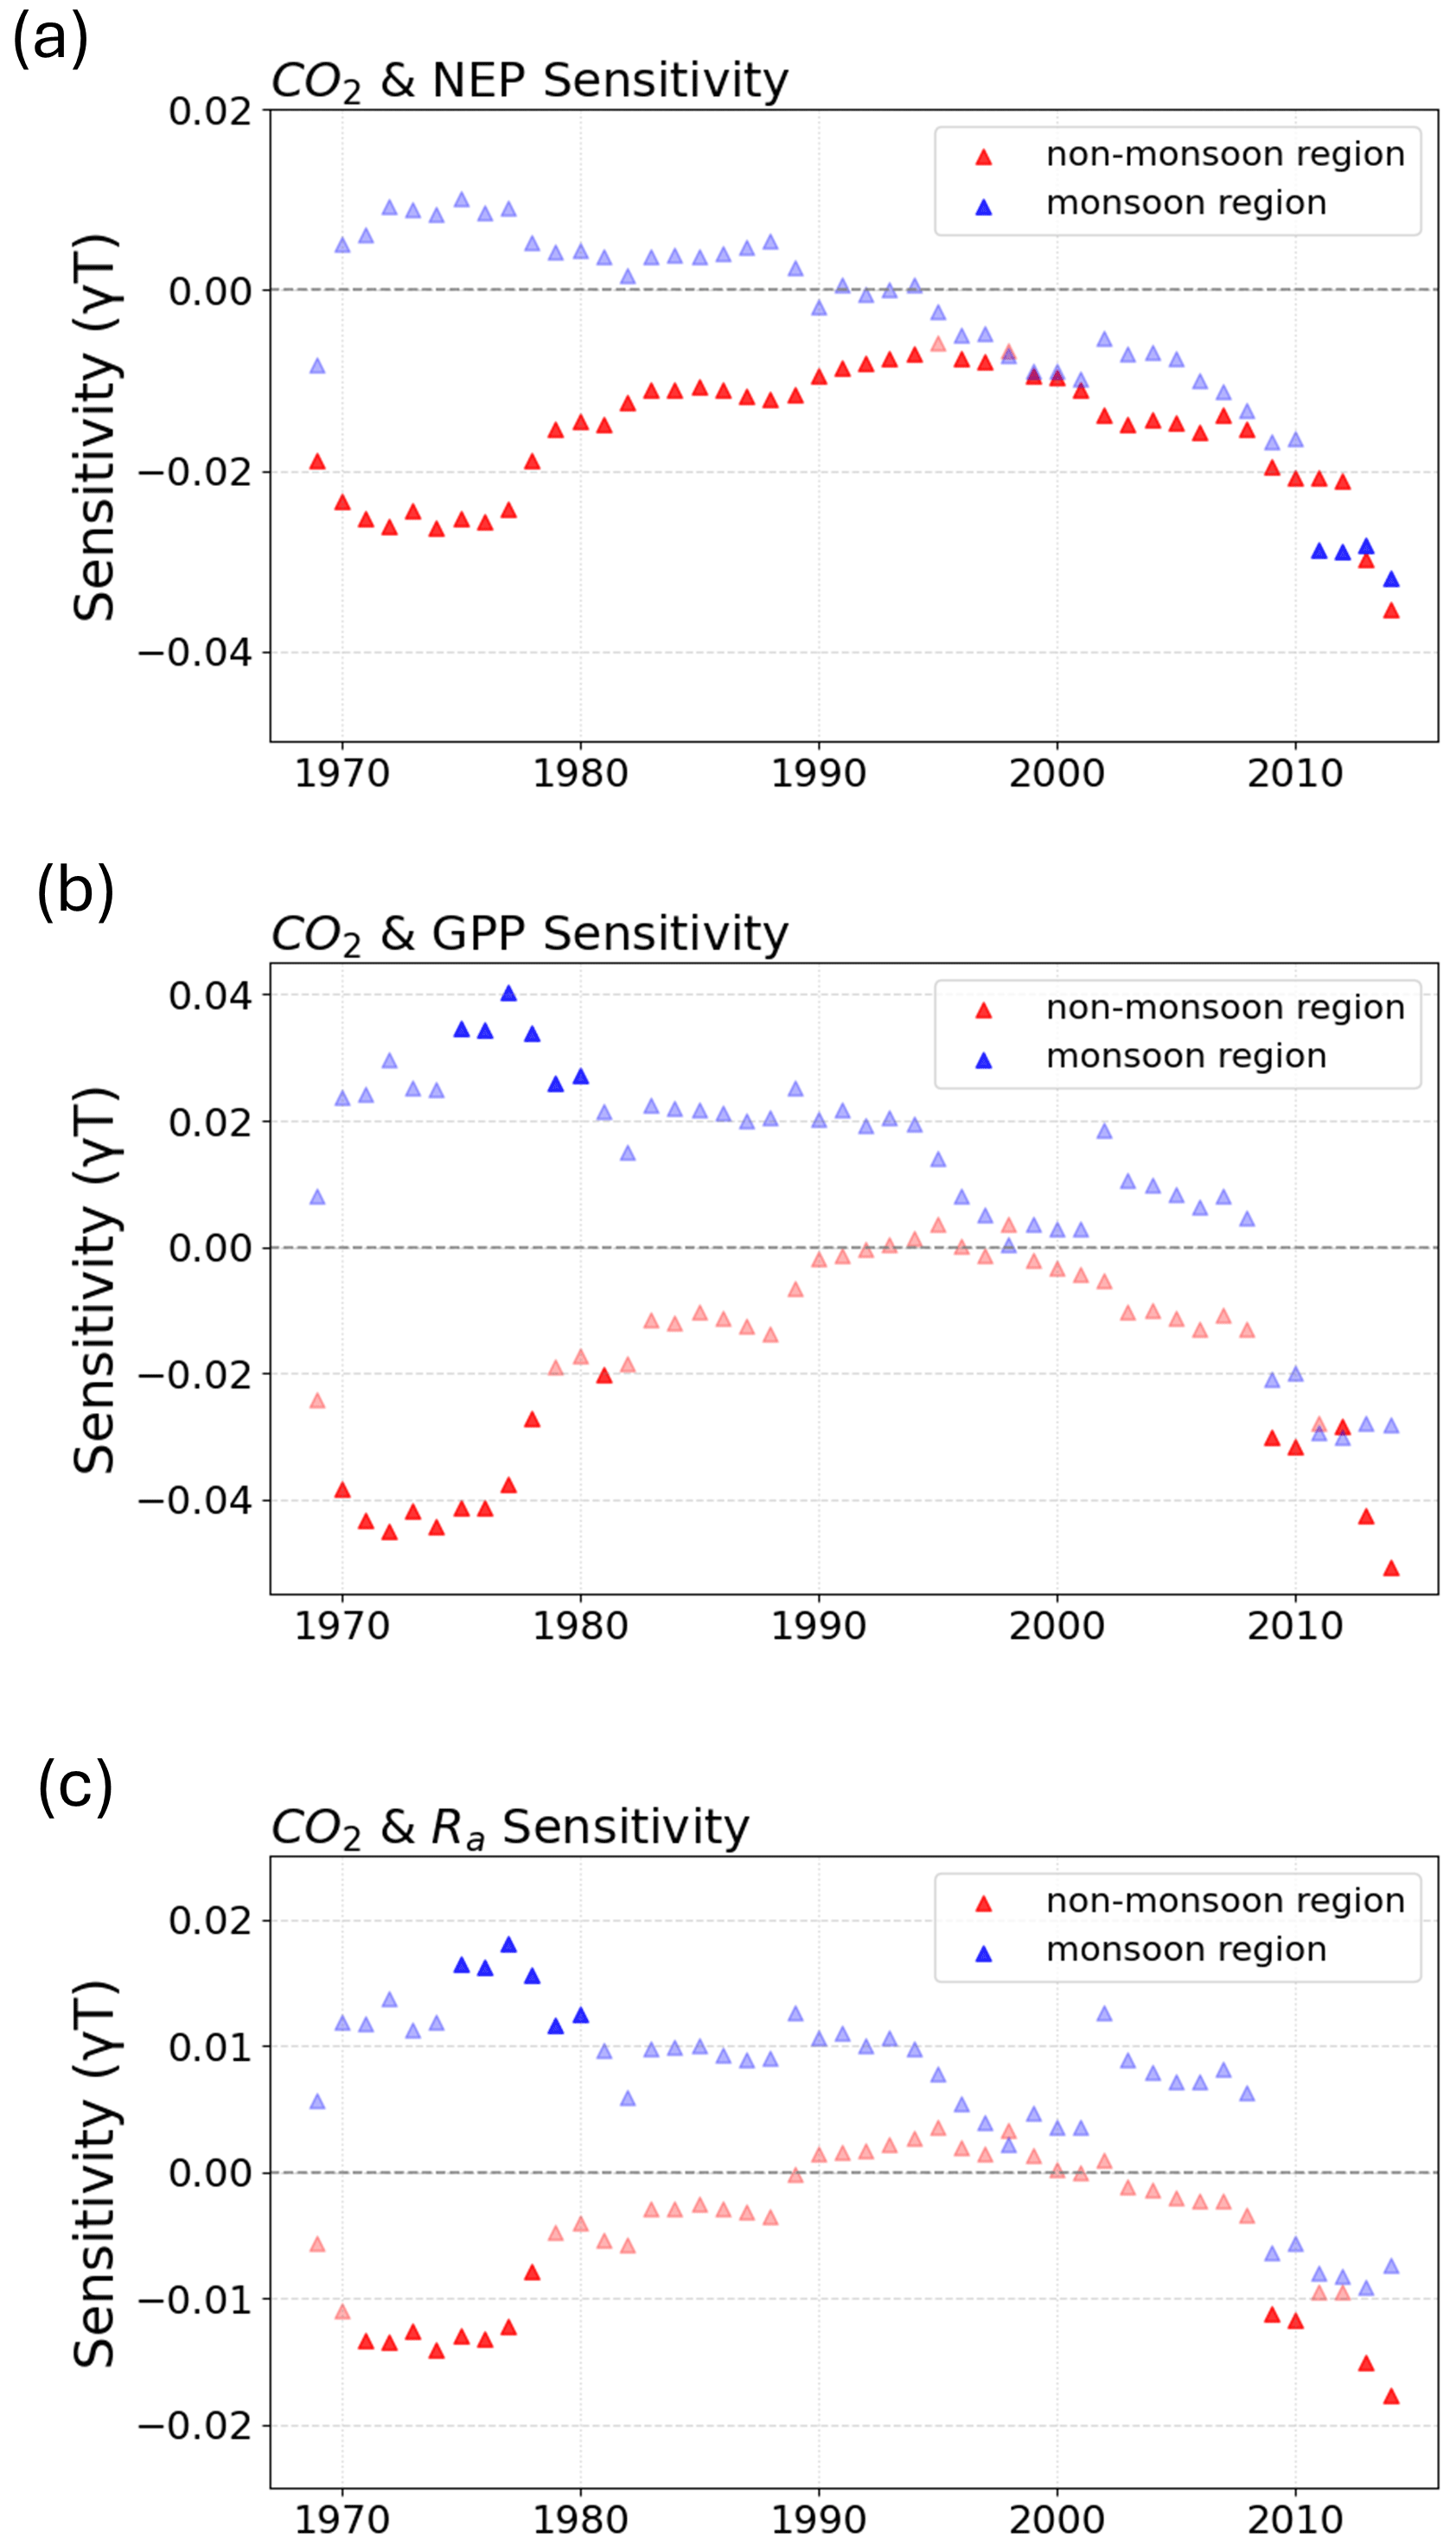
Figure 3Time series of the sensitivity between atmospheric CO2 growth and (a) NEP, (b) GPP and (c) Ra using 20-year moving windows over the entire period from 1959 to 2023 (see Data and Methods for details). Markers show the ensemble mean of nine TRENDY models for the non-monsoon (red) and monsoon (blue) regions. Dark markers indicate statistically significant regression slopes within each moving window, whereas faded markers indicate non-significant slope; p>0.1 was considered statistically non-significant.
3.2 Regional and structural drivers of GPP sensitivity
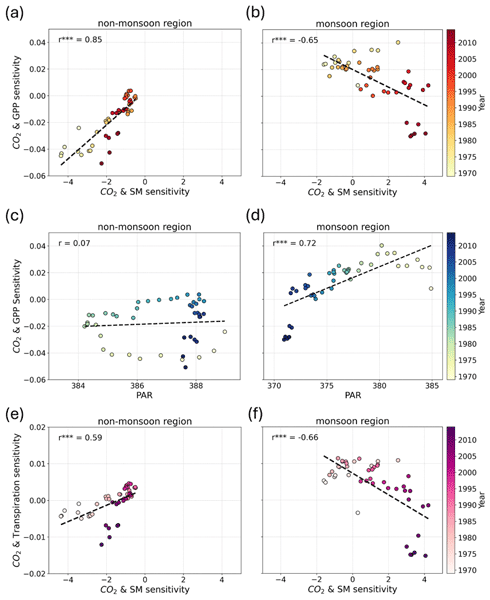
Following the model selection based on NEP sensitivity, we analyzed GPP sensitivity to elucidate the underlying mechanisms governing ecosystem productivity responses. The differences in GPP sensitivity between the monsoon and non-monsoon regions are likely attributable to differences in ecosystem structure, such as climate and hydrological conditions. To identify how these structural differences influence ecosystem productivities, we examined the relationships between GPP sensitivity and key environmental factors in each region using Pearson correlation analysis (Fig. 4).
In the non-monsoon region, GPP sensitivity exhibited a strong positive correlation (; Fig. 4a) with SM sensitivity. Both GPP and SM sensitivities showed an increase followed by a decline over the period, yet remained within the negative sensitivity range for most of the period (Fig. 4a). This indicates that the sensitivities of both variables vary in the same direction over time. Additionally, the strong positive correlation suggests that the decline in SM sensitivity reflects reduced water availability that may limit vegetation activity, ultimately accompanying a decrease in GPP sensitivity. Conversely, an increase in sensitivity would also correspond to an increase in GPP sensitivity. However, the monsoon region shows a contrasting pattern, resulting in a significant negative correlation (; Fig. 4b). In this region, SM sensitivity increased over time from negative to positive, while GPP sensitivity decreased from positive to negative (Fig. 4b). Although SM sensitivity is generally associated with water availability and stomatal regulation, SM and GPP sensitivities show different temporal patterns. This suggests that in the monsoon region, where water availability is relatively high, increases in SM sensitivity play a less dominant role in modulating the ACGR-associated GPP response. Consistent with this interpretation, the explanatory power of the relationship between SM and GPP sensitivities was remarkably lower in the monsoon region (r2=0.42) than in the non-monsoon region (r2=0.72), indicating the compounding influence of other environmental factors.
To evaluate this possibility, we analyzed light, a crucial factor for photosynthesis. Unlike other variables shown as sensitivities to ACGR, PAR has no direct relationship with ACGR; therefore, actual PAR values are used to indicate radiation conditions that can influence ecosystem responses. In the non-monsoon region, no meaningful relationship was observed between PAR and GPP sensitivity (r=0.07, p>0.1; Fig. 4c), consistent with the fact that PAR showed only minimal temporal variations, explaining no influence on GPP sensitivity (r2=0.01; Fig. 4c). In the monsoon region, GPP sensitivity decreased from positive to negative, and PAR also showed a distinct decreasing trend (Fig. 4d); a significant positive correlation was shown (; Fig. 4d). As sufficient radiation is required for vegetation to respond to ACGR, reduced PAR likely contributed to the weakening of GPP sensitivity, explained by high explanatory power (r2=0.52; Fig. 4d). These results demonstrate that in the monsoon region, where moisture is relatively abundant, radiation limitation-rather than changes in SM sensitivity-plays a primary role in driving the reduction in GPP sensitivity.
In the non-monsoon region, a significant positive correlation (; Fig. 4e) was observed between transpiration sensitivity and SM sensitivity. Transpiration sensitivity increased from negative to a slightly positive value before declining again, while SM sensitivity exhibited a similar increase-decrease pattern, but remained negative (Fig. 4e). This indicates that although the ACGR-associated reduction in stomatal conductance is accompanied by reduced transpiration, such a change does not translate into substantial SM accumulation in this comparatively dry region. Limited improvement in water availability, combined with reduced stomatal conductance, constrains photosynthetic activity, and contributes to the weakening of GPP sensitivity. In contrast, the monsoon region showed increasing SM sensitivity from negative to positive, whereas transpiration sensitivity exhibited a decreasing trend from positive to negative (; Fig. 4f). These opposing trends suggest that the ACGR related responses of transpiration and SM move in opposite directions and are closely linked. The decrease in stomatal conductance may be related to SM accumulation; conversely, changes in transpiration responses can also influence water availability conditions through changes in stomatal regulation. However, the increase in SM sensitivity coincided with a decrease in transpiration sensitivity, showing that improved moisture conditions do not necessarily correspond to increased vegetation productivity. Consequently, GPP sensitivity in the monsoon region is influenced more strongly by PAR, while the inverse relationship between SM and transpiration sensitivities may partly contribute to changes in vegetation productivity.
Additionally, the relationships presented in Fig. 4 were reanalyzed using a 15-year moving window (figure not shown), and the main results were generally consistent with the results obtained using a 20-year moving window. This implies that the key finding of this study-that the regional factors contributing to GPP sensitivity vary by region-is not strongly dependent on the length of the moving window. In addition, Spearman rank correlation analysis was performed to complement the linear correlation analysis of the relationships shown in Fig. 4. The Spearman correlation results were generally consistent with the direction and significance observed in Fig. 4, suggesting that the identified relationships were not solely dependent on linear correlation (results not shown). However, these results should still be interpreted as statistical associations, because correlation analysis alone cannot fully establish causality.
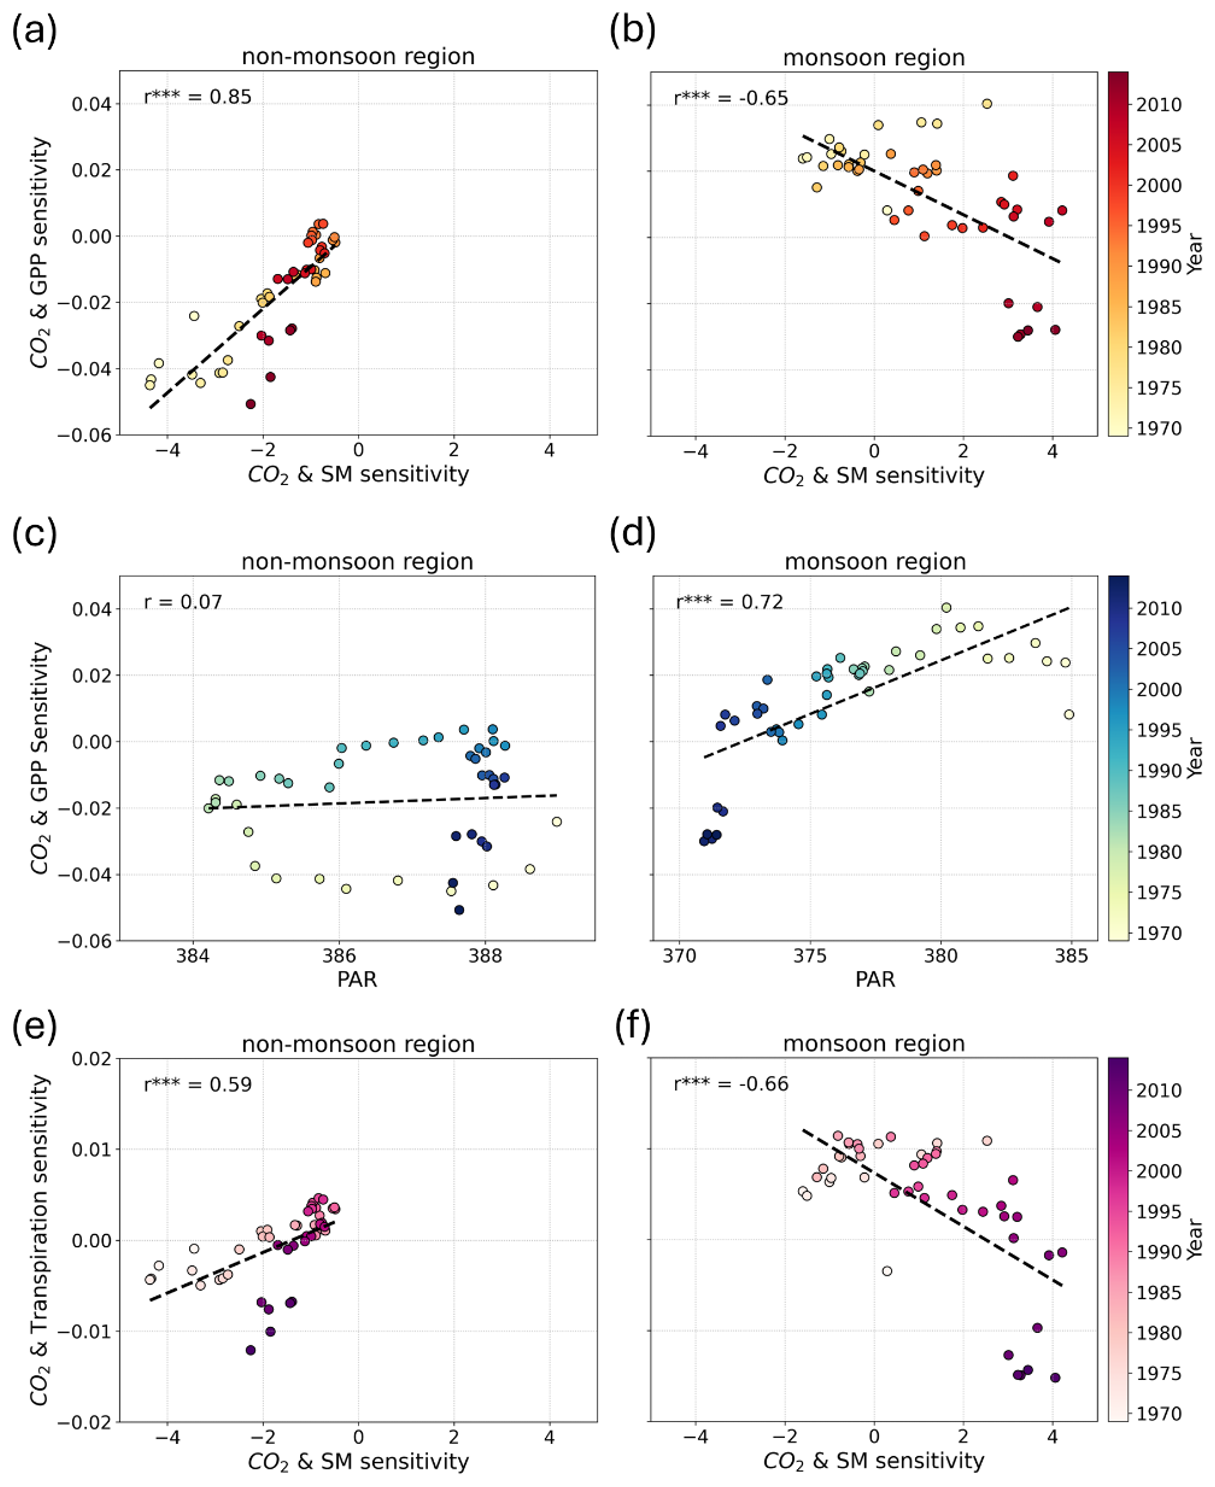
Figure 4Correlation between (a, b) CO2&GPP sensitivity (y axis) and CO2 & SM sensitivity (x axis), (c, d) CO2 & GPP sensitivity (y axis) and PAR (x axis), and (e, f) CO2 & transpiration sensitivity (y axis) and CO2 & SM sensitivity (x axis) for the non-monsoon (left) and monsoon (right) regions over the entire period from 1959 to 2023. Each scatter represents a 20-year moving window, with color changes representing the time period. Asterisks (*) indicate statistical significance levels where applicable: *** p<0.01; ** p<0.05; * p<0.1; not significant, p>0.1.
3.3 Temporal change of environmental controls on GPP sensitivity
As shown in Fig. 3b, the GPP sensitivity in the non-monsoon region showed a reversal pattern, increasing until 1998 before decreasing. To better understand this pattern, the relationship between GPP sensitivity and environmental factors was reanalyzed for two periods, i.e., 1959–1998 and 1999–2023 (Figs. 5, 6), using the same approach as in Fig. 4.
In the non-monsoon region, the correlation between GPP sensitivity and SM sensitivity exhibited a strong positive correlation in both periods ( for the early period; for the late period), with high explanatory power (r2=0.85 and r2=0.76, respectively; Fig. 5a, b). This follows the same pattern as the relationship between GPP sensitivity and SM sensitivity observed in the entire period, suggesting that SM sensitivity remained the key factor regulating the ACGR-associated GPP response throughout the study period. Conversely, the role of radiation showed temporal shifts. During the early period, GPP sensitivity showed no correlation with PAR (r=0.09, p>0.1; Fig. 5c), consistent with the full period analysis. However, in the late period, a positive correlation emerged ( and r2=0.35; Fig. 5d), with both PAR and GPP sensitivity decreasing, and GPP sensitivity having a negative value. This reveals that while SM remained the main factor, the increased coefficient of determination in the later period implies that radiation limitation influences the ACGR-associated vegetation productivity response as a regulating factor. In addition, the relationship between transpiration sensitivity and SM sensitivity also remained consistently a positive correlation in both periods ( for the early period; for the late period), with consistently high coefficients of determination (r2=0.80 and r2=0.73, respectively; Fig. 5e, f). Both sensitivities increased during the initial period before decreasing later on, reflecting the same mechanism identified in the analysis of the overall period. That is, the reduction in the ACGR-associated stomatal conductance response is accompanied by reduced transpiration but does not lead to a substantial increase in SM under relatively dry conditions. Simultaneously, it limits vegetation CO2 uptake, resulting in a weakening of GPP sensitivity.
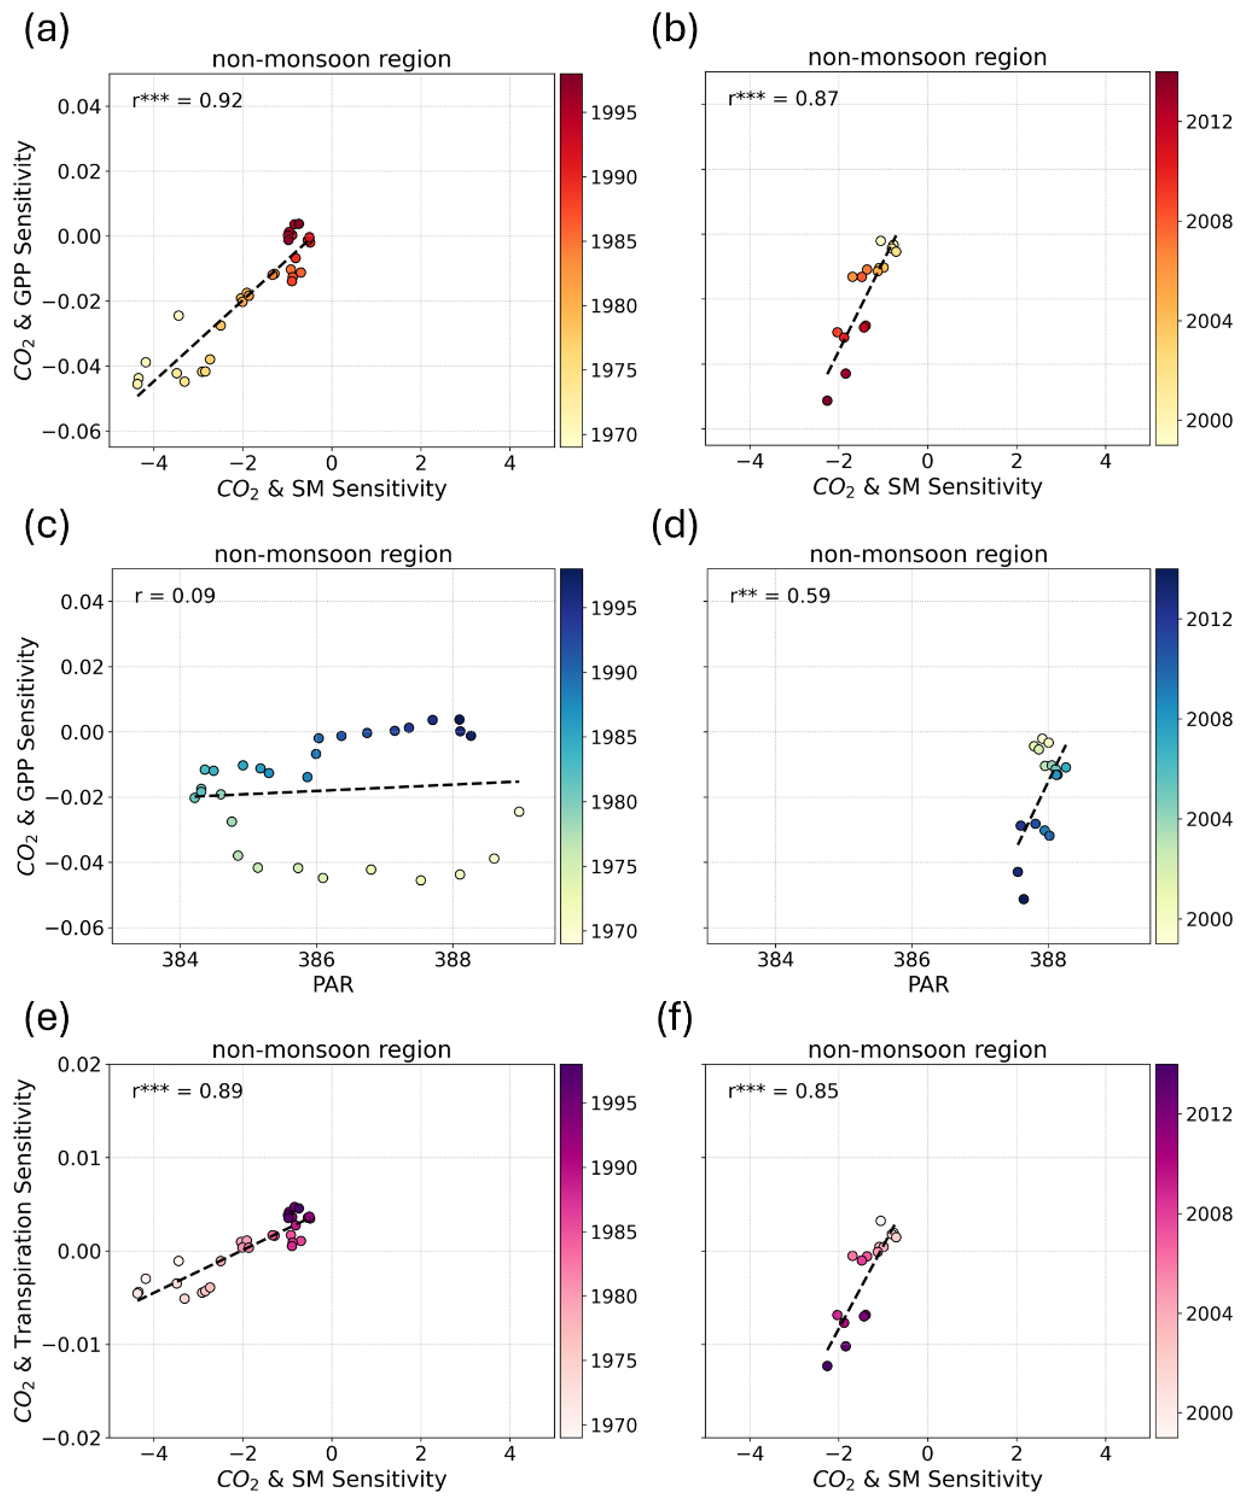
Figure 5Correlation between (a, b) CO2&GPP sensitivity (y axis) and CO2 & SM sensitivity (x axis), (c, d) CO2 & GPP sensitivity (y axis) and PAR (x axis), and (e, f) CO2 & transpiration sensitivity (y axis) and CO2 & SM sensitivity (x axis) for the non-monsoon region. The left and right panels correspond to moving window years of 1969–1998 and 1999–2014, respectively. Each scatter represents a 20-year moving window, with color changes representing the time period. Asterisks (*) indicate statistical significance levels where applicable: *** p<0.01; ** p<0.05; * p<0.1; not significant, p>0.1.
In the monsoon region, the correlation between GPP sensitivity and SM sensitivity became slightly stronger during the late period, though it remains statistically insignificant in both periods (r=0.01, p>0.1 for the early period; , p>0.1 for the late period; Fig. 6a, b). Compared to the analysis across the entire period, most environmental relationships showed weaker correlations when analyzed by separated periods, with the exception of the relationship between GPP sensitivity and PAR. The relationship between GPP sensitivity and PAR exhibited a significant positive correlation in both periods ( for the early period; for the late period), and its coefficients of determination strengthened over time (r2=0.21 and r2=0.59, respectively; Fig. 6c, d), emphasizing that the role of PAR in explaining GPP sensitivity enhanced during the later period. In conclusion, the coefficient of determination for the entire period suggests that reductions in PAR are strongly associated with the weakening of GPP sensitivity. The relationship between transpiration sensitivity and SM sensitivity showed an insignificant correlation during the early period (r=0.13, p>0.1; Fig. 6e), but became significantly negatively correlated during the later period ( and r2=0.25; Fig. 6f), highlighting a pattern consistent with the full period analysis, in which changes in transpiration sensitivity are inversely associated with changes in SM sensitivity under ACGR related responses. Moreover, although no clear relationship emerged during the early period, the later period showed that improved moisture conditions do not necessarily correspond to increased vegetation productivity, which may partly explain the reduced sensitivity of GPP.
In addition, Spearman rank correlation was also conducted for both regions during the early and late periods. Overall, the direction and statistical significance of the principal relationships were generally consistent with the Pearson correlation results. However, in the non-monsoon region, the correlation between PAR and GPP sensitivity during the late period was not statistically significant in the Spearman analysis. In the monsoon region, consistent with Pearson results, the relationship between GPP sensitivity and PAR maintained a significant positive correlation in both periods; however, the increase in the correlation over time observed in Pearson correlation was not shown in the Spearman analysis. These results show that, while the primary correlations were generally robust across both analysis methods, certain temporal changes differed depending on the method used.
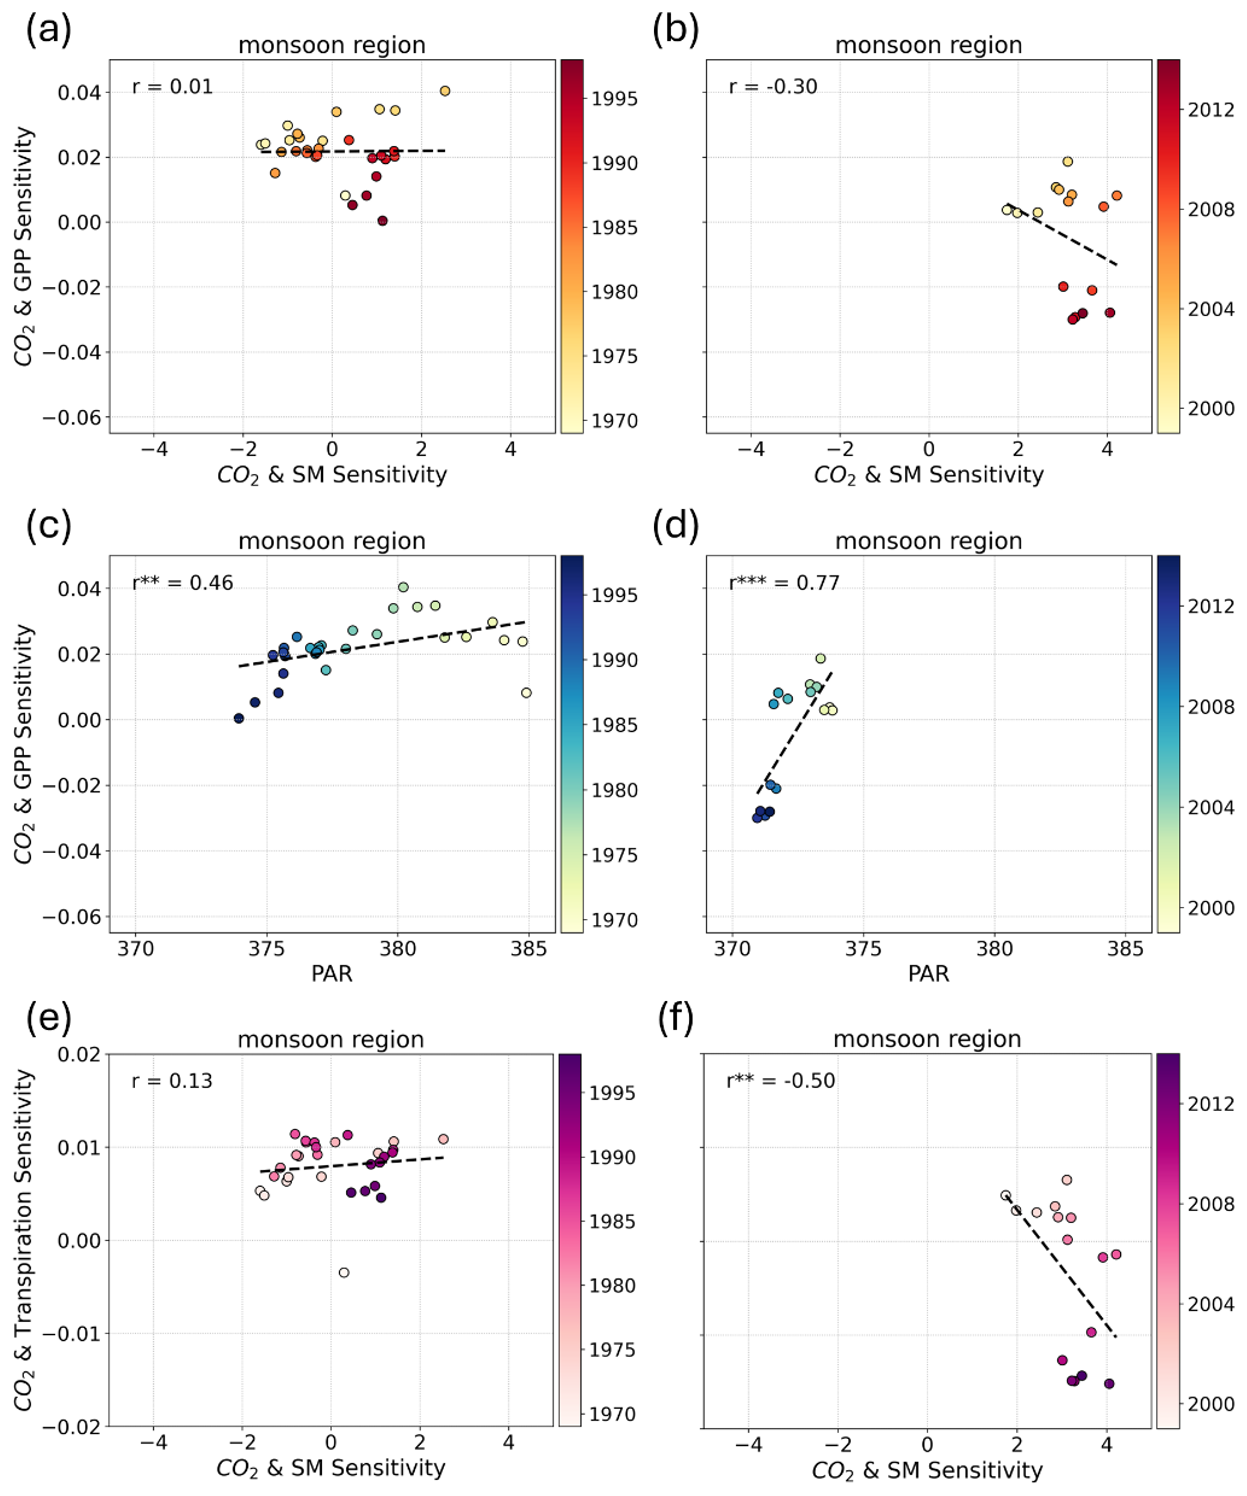
Figure 6Correlation between (a, b) CO2 & GPP sensitivity (y axis) and CO2 & SM sensitivity (x axis), (c, d) CO2 & GPP sensitivity (y axis) and PAR (x axis), and (e, f) CO2 & transpiration sensitivity (y axis) and CO2 & SM sensitivity (x axis) for the monsoon region. The left and right panels correspond to moving window years of 1969–1998 and 1999–2014, respectively. Each scatter represents a 20-year moving window, with color changes representing the time period. Asterisks (*) indicate statistical significance levels where applicable: *** p<0.01; ** p<0.05; * p<0.1; not significant, p>0.1.
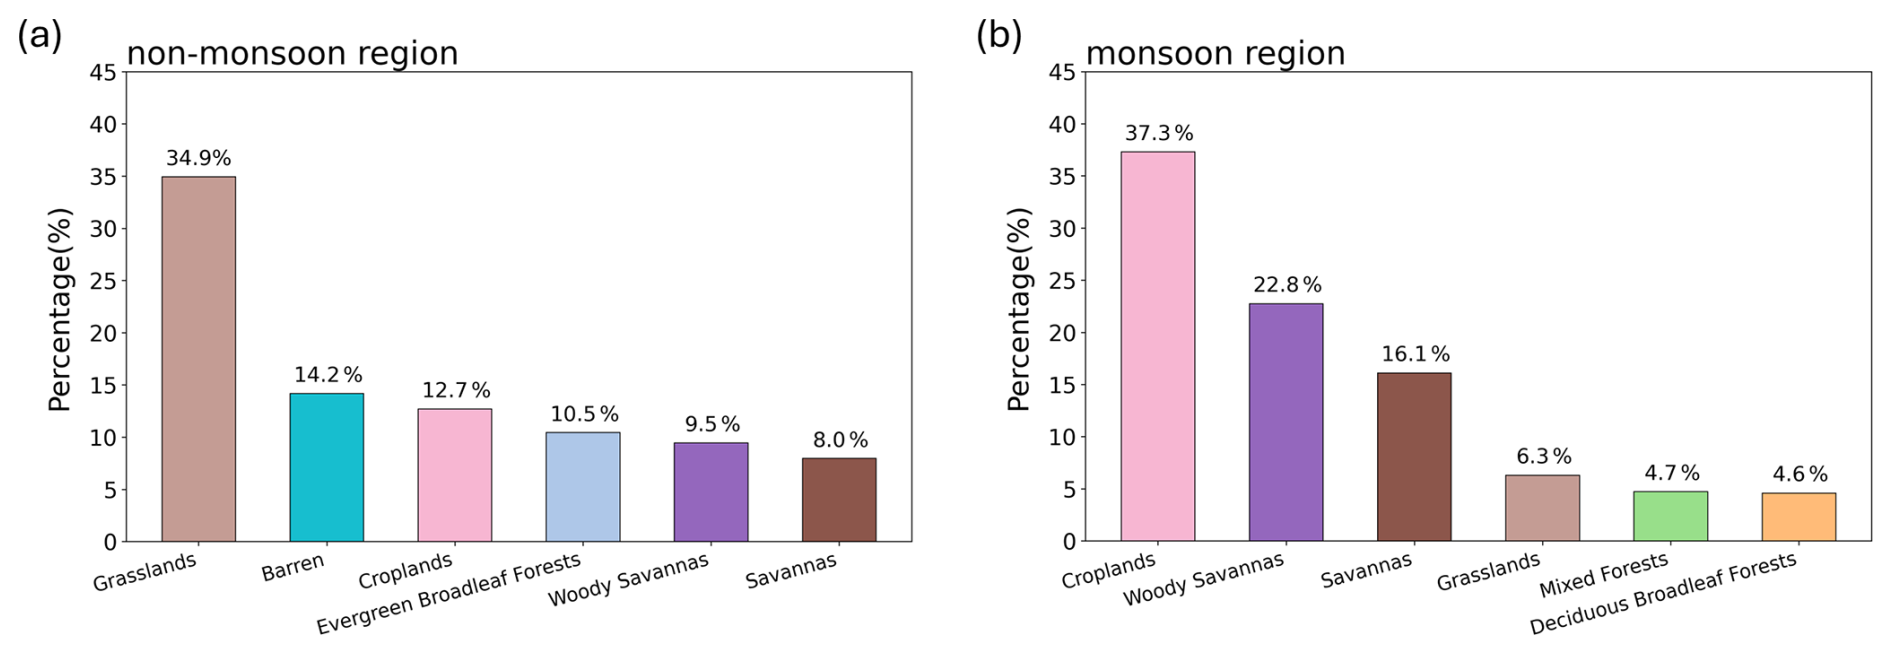
Figure 7East Asian land cover distribution based on IGBP classification. MODIS land cover averaged during 2001-2023, regridded to 1.0° × 1.0° spatial resolution, showing the percentage distribution of land cover types in the (a) non-monsoon and (b) monsoon region. For all panels, see Data and Methods for details.
Vegetation composition in East Asia exhibits distinct spatial heterogeneity even within the non-monsoon and monsoon regions, which contributes to structural and functional characteristics of terrestrial ecosystems. As ecosystem productivity is affected by vegetation type, understanding the mechanisms underlying regional differences in the relationship between ACGR and GPP is essential. Therefore, we examined East Asian land cover based on the MODIS dataset. Our analysis revealed that the non-monsoon region is dominated by grasslands and barren, while the monsoon region predominantly features croplands and woody savannas (Fig. 7). Generally, ecosystems dominated by croplands and woody savannas maintain higher vegetation productivity compared with grasslands and barren areas. These differences in vegetation structure may suggest that the fundamental productivity and carbon sequestration potential of the two regions differ, and they can be viewed as an important structural background for interpreting regional variations in GPP sensitivity. Consequently, these variations imply different ecosystem functions and vegetation-moisture mechanisms across regions, emphasizing that regional environmental conditions control ACGR-associated ecosystem productivity responses.
The contrasting relationships between GPP sensitivity and environmental factors observed in this study indicate that the ACGR-associated ecosystem productivity response in East Asia is regulated by distinct regional limiting factors. In the non-monsoon region, the positive correlation between GPP and SM sensitivities demonstrates that soil water availability closely modulates variations in the ACGR-associated vegetation productivity response. Ultimately, these findings suggest that the ACGR-associated ecosystem productivity response in the non-monsoon region is closely linked to water availability. By contrast, in the monsoon region, the phases of GPP sensitivity and SM sensitivity shifted to a contrasting relationship. This pattern suggests that changes in SM sensitivity do not directly lead to corresponding changes in GPP sensitivity. Although improved soil water availability generally supports vegetation productivity, the contrasting patterns between the two sensitivities indicate that soil water conditions alone are insufficient to explain the temporal variations in GPP sensitivity. Instead, the positive correlation between GPP sensitivity and PAR suggests that changes in radiation can be associated with the response of GPP sensitivity even under relatively favorable moisture conditions. Therefore, the ACGR-associated ecosystem productivity response in the monsoon region appears to be regulated primarily by PAR, with radiation limitations contributing to variations in GPP sensitivity.
Taken together, the regional differences in sensitivity identified in this study are driven by a complex interplay of environmental factors, including hydrometeorological conditions, available solar radiation, and land surface characteristics. In conclusion, our findings demonstrate that ecosystem responses to ACGR reflect the compounding influences of atmospheric CO2, interannual climate variability, and land-use change. Although ecosystem evolutionary processes were not explicitly assessed in this study, the use of TRENDY S3 simulations partially accounts for changes in ecosystem conditions through changes in CO2, climate and land use.
In the analysis of land cover types using MODIS, on the other hand, a comparison at a higher resolution (0.5° × 0.5°) revealed that, although some differences are observed in minor vegetation types, the main vegetation patterns generally remain consistent; consequently, the overall sensitivity patterns appear robust and are not strongly influenced by such minor variations. However, as the MODIS dataset does not fully cover the longer sensitivity analysis period, careful consideration is required when analyzing long-term sensitivity patterns. A comparison of vegetation types between 2001 and 2023 reveals minor changes, but the patterns remain largely consistent. Although uncertainty exists due to this temporal mismatch, the impact on the overall analysis is expected to be limited.
We investigated the mechanisms regulating ecosystem productivity across different regions within East Asia based on the spatial pattern of GPP sensitivity. The analysis focused on moisture and light conditions, as well as stomatal responses, which can influence GPP sensitivity. These factors were interpreted considering the climatic characteristics of the monsoon and non-monsoon regions. Furthermore, based on the diverse vegetation types distributed across East Asia, the factors contributing to changes in GPP sensitivity were additionally analyzed. The main conclusions were as follows:
-
GPP sensitivity was generally negative in the non-monsoon region and positive in the monsoon region. However, both regions ultimately exhibited a declining trend, converging toward negative sensitivity over time. This downward trajectory was also observed in NEP sensitivity, indicating a strengthening inverse relationship between ACGR and both ecosystem productivity and carbon sequestration in East Asia.
-
In the non-monsoon region, SM sensitivity displayed a stronger association with GPP sensitivity, whereas in the monsoon region, reductions in PAR were more closely linked to the weakening of the GPP response. These regional differences are likely associated not only with contrasting moisture and radiation conditions, but also with differences in vegetation structure between the two regions.
-
Regional disparities in moisture regimes were also reflected in the relationship between transpiration and SM sensitivities. In the monsoon region, a negative correlation was observed between these two sensitivity metrics, suggesting that changes in transpiration responses may influence SM conditions through changes in stomatal conductance. Conversely, a positive correlation was observed in the non-monsoon region.
Our findings provide important implications for projecting the future carbon cycle under climate change. The weakening ACGR-associated sensitivity of ecosystem productivity suggests that the integrated ecosystem response associated with ACGR has weakened over time under the combined effects of CO2, climate and land use, which may affect the persistence of the terrestrial carbon sink. Therefore, future climate projections and carbon budget assessments need to explicitly account for regional climatic constraints, particularly soil moisture and radiation. Overall, these results highlight that future changes in carbon uptake across East Asia will be determined not only by rising CO2 but also by climatic factors, implying that carbon neutrality strategies should be designed with regional specificity influenced by internal climate variability.
The sensitivity analysis code of this study is available via Zenodo at https://doi.org/10.5281/zenodo.18307449 (Na and Yeh, 2026). The sensitivity calculation follows the method of Li et al. (2024), with minor modifications. Additionally, we used LOWESS-based trend removal using A. Gramfort's python package (https://gist.github.com/agramfort/850437; Gramfort, 2026). (1) The dynamic global vegetation models outputs from TRENDY v13 are available upon request. (2) The MODIS land-cover data was obtained from the MCD12Q1 version 6.1 data, available from NASA Earthdata at DOI: https://doi.org/10.5067/MODIS/MCD12Q1.061 (Friedl and Sulla-Menashe, 2022). The data was accessed via the AppEEARS.
YSN: Data analysis, Conceptualization, Writing-original draft. SWY: Supervision, Conceptualization, Writing-review and editing. JSK: Writing-review and editing. YMY: Writing-review and editing.
The contact author has declared that none of the authors has any competing interests.
Publisher's note: Copernicus Publications remains neutral with regard to jurisdictional claims made in the text, published maps, institutional affiliations, or any other geographical representation in this paper. The authors bear the ultimate responsibility for providing appropriate place names. Views expressed in the text are those of the authors and do not necessarily reflect the views of the publisher.
This work was supported by Korea Institute of Marine Science & Technology Promotion (KIMST) funded by the Ministry of Oceans and Fisheries (RS-2026-25543619). We are sincerely grateful to the TRENDY team for developing and providing the Dynamic Global Vegetation Models dataset used in this study.
This work was supported by Korea Institute of Marine Science & Technology Promotion (KIMST) funded by the Ministry of Oceans and Fisheries (grant no. RS-2026-25543619).
This paper was edited by Kira Rehfeld and reviewed by two anonymous referees.
Asaadi, A. and Arora, V. K.: Implementation of nitrogen cycle in the CLASSIC land model, Biogeosciences, 18, 669–706, https://doi.org/10.5194/bg-18-669-2021, 2021.
Baldocchi, D., Ryu, Y., and Keenan, T.: Terrestrial carbon cycle variability, F1000Research, 5, https://doi.org/10.12688/f1000research.8962.1, 2016.
Beer, C., Lucht, W., Gerten, D., Thonicke, K., and Schmullius, C.: Effects of soil freezing and thawing on vegetation carbon density in Siberia: A modeling analysis with the Lund‐Potsdam‐Jena Dynamic Global Vegetation Model (LPJ‐DGVM), Glob. Biogeochem. Cycle, 21, https://doi.org/10.1029/2006GB002760, 2007.
Bi, W., He, W., Zhou, Y., Ju, W., Liu, Y., Liu, Y., Zhang, X., Wei, X., and Cheng, N.: A global 0.05 dataset for gross primary production of sunlit and shaded vegetation canopies from 1992 to 2020, Sci. Data, 9, 213, https://doi.org/10.1038/s41597-022-01309-2, 2022.
Burton, C., Betts, R., Cardoso, M., Feldpausch, T. R., Harper, A., Jones, C. D., Kelley, D. I., Robertson, E., and Wiltshire, A.: Representation of fire, land-use change and vegetation dynamics in the Joint UK Land Environment Simulator vn4.9 (JULES), Geosci. Model Dev., 12, 179–193, https://doi.org/10.5194/gmd-12-179-2019, 2019.
Canadell, J. G., Le Quéré, C., Raupach, M. R., Field, C. B., Buitenhuis, E. T., Ciais, P., Conway, T. J., Gillett, N. P., Houghton, R., and Marland, G.: Contributions to accelerating atmospheric CO2 growth from economic activity, carbon intensity, and efficiency of natural sinks, P. Natl. Acad. Sci. USA, 104, 18866–18870, https://doi.org/10.1073/pnas.0702737104, 2007.
Decharme, B., Delire, C., Minvielle, M., Colin, J., Vergnes, J. P., Alias, A., Saint‐Martin, D., Séférian, R., Sénési, S., and Voldoire, A.: Recent changes in the ISBA‐CTRIP land surface system for use in the CNRM‐CM6 climate model and in global off‐line hydrological applications, J. Adv. Model. Earth Sy., 11, 1207–1252, https://doi.org/10.1029/2018MS001545, 2019.
Friedl, M. and Sulla-Menashe, D.: MODIS/Terra+Aqua Land Cover Type Yearly L3 Global 500m SIN Grid V061, NASA Land Processes Distributed Active Archive Center [data set], https://doi.org/10.5067/MODIS/MCD12Q1.061, 2022.
Friedlingstein, P., O'Sullivan, M., Jones, M. W., Andrew, R. M., Hauck, J., Landschützer, P., Le Quéré, C., Li, H., Luijkx, I. T., Olsen, A., Peters, G. P., Peters, W., Pongratz, J., Schwingshackl, C., Sitch, S., Canadell, J. G., Ciais, P., Jackson, R. B., Alin, S. R., Arneth, A., Arora, V., Bates, N. R., Becker, M., Bellouin, N., Berghoff, C. F., Bittig, H. C., Bopp, L., Cadule, P., Campbell, K., Chamberlain, M. A., Chandra, N., Chevallier, F., Chini, L. P., Colligan, T., Decayeux, J., Djeutchouang, L. M., Dou, X., Duran Rojas, C., Enyo, K., Evans, W., Fay, A. R., Feely, R. A., Ford, D. J., Foster, A., Gasser, T., Gehlen, M., Gkritzalis, T., Grassi, G., Gregor, L., Gruber, N., Gürses, Ö., Harris, I., Hefner, M., Heinke, J., Hurtt, G. C., Iida, Y., Ilyina, T., Jacobson, A. R., Jain, A. K., Jarníková, T., Jersild, A., Jiang, F., Jin, Z., Kato, E., Keeling, R. F., Klein Goldewijk, K., Knauer, J., Korsbakken, J. I., Lan, X., Lauvset, S. K., Lefèvre, N., Liu, Z., Liu, J., Ma, L., Maksyutov, S., Marland, G., Mayot, N., McGuire, P. C., Metzl, N., Monacci, N. M., Morgan, E. J., Nakaoka, S.-I., Neill, C., Niwa, Y., Nützel, T., Olivier, L., Ono, T., Palmer, P. I., Pierrot, D., Qin, Z., Resplandy, L., Roobaert, A., Rosan, T. M., Rödenbeck, C., Schwinger, J., Smallman, T. L., Smith, S. M., Sospedra-Alfonso, R., Steinhoff, T., Sun, Q., Sutton, A. J., Séférian, R., Takao, S., Tatebe, H., Tian, H., Tilbrook, B., Torres, O., Tourigny, E., Tsujino, H., Tubiello, F., van der Werf, G., Wanninkhof, R., Wang, X., Yang, D., Yang, X., Yu, Z., Yuan, W., Yue, X., Zaehle, S., Zeng, N., and Zeng, J.: Global Carbon Budget 2024, Earth Syst. Sci. Data, 17, 965–1039, https://doi.org/10.5194/essd-17-965-2025, 2025.
Fu, C.: Potential impacts of human-induced land cover change on East Asia monsoon, Glob. Planet. Change, 37, 219–229, https://doi.org/10.1016/S0921-8181(02)00207-2, 2003.
Global Carbon Project: Supplemental data of Global Carbon Budget 2024 (Version 1.0) (v1.0), Global Carbon Project [data set], https://doi.org/10.18160/gcp-2024, 2024.
Gramfort, A.: LOWESS: Locally weighted regression, GitHub [code], https://gist.github.com/agramfort/850437, last access: 14 September 2026.
Han, M.-Y., Zhang, Y., and Peng, J.: How the enhanced East Asian summer monsoon regulates total gross primary production in eastern China, Adv. Clim. Chang. Res., 15, 244–252, https://doi.org/10.1016/j.accre.2024.04.001, 2024.
He, S., Li, J., Wang, J., and Liu, F.: Evaluation and analysis of upscaling of different land use/land cover products (FORM-GLC30, GLC_FCS30, CCI_LC, MCD12Q1 and CNLUCC): A case study in China, Geocarto Int., 37, 17340–17360, https://doi.org/10.1080/10106049.2022.2127926, 2022a.
He, Y., Oh, J., Lee, E., and Kim, Y.: Land cover and land use mapping of the east Asian summer monsoon region from 1982 to 2015, Land, 11, 391, https://doi.org/10.3390/land11030391, 2022b.
Ito, A.: Disequilibrium of terrestrial ecosystem CO2 budget caused by disturbance-induced emissions and non-CO2 carbon export flows: a global model assessment, Earth Syst. Dynam., 10, 685–709, https://doi.org/10.5194/esd-10-685-2019, 2019.
Jianping, L. and Qingcun, Z.: A new monsoon index and the geographical distribution of the global monsoons, Adv. Atmos. Sci., 20, 299–302, https://doi.org/10.1007/s00376-003-0016-5, 2003.
Kalaji, H. M., Jajoo, A., Oukarroum, A., Brestic, M., Zivcak, M., Samborska, I. A., Cetner, M. D., Łukasik, I., Goltsev, V., and Ladle, R. J.: The use of chlorophyll fluorescence kinetics analysis to study the performance of photosynthetic machinery in plants, in: Emerging technologies and management of crop stress tolerance, edited by: Ahmad, P. and Rasool, S., Elsevier., 347–384, https://doi.org/10.1016/B978-0-12-800875-1.00015-6, 2014.
Keeling, C. D., Bacastow, R. B., Bainbridge, A. E., Ekdahl Jr, C. A., Guenther, P. R., Waterman, L. S., and Chin, J. F.: Atmospheric carbon dioxide variations at Mauna Loa observatory, Hawaii, Tellus, 28, 538–551, https://doi.org/10.3402/tellusa.v28i6.11322, 1976.
Kim, J. and Park, S. K.: Uncertainties in calculating precipitation climatology in East Asia, Hydrol. Earth Syst. Sci., 20, 651–658, https://doi.org/10.5194/hess-20-651-2016, 2016.
Krinner, G., Viovy, N., de Noblet‐Ducoudré, N., Ogée, J., Polcher, J., Friedlingstein, P., Ciais, P., Sitch, S., and Prentice, I. C.: A dynamic global vegetation model for studies of the coupled atmosphere‐biosphere system, Glob. Biogeochem. Cycle, 19, https://doi.org/10.1029/2003GB002199, 2005.
Lan, X., Tans, P., and Thoning, K. W.: Trends in globally-averaged CO2 determined from NOAA Global Monitoring Laboratory measurements (v2025-09), NOAA Global Monitoring Laboratory measurements [data set], https://doi.org/10.15138/9N0H-ZH07, 2025.
Landry, J.-S., Price, D. T., Ramankutty, N., Parrott, L., and Matthews, H. D.: Implementation of a Marauding Insect Module (MIM, version 1.0) in the Integrated BIosphere Simulator (IBIS, version 2.6b4) dynamic vegetation–land surface model, Geosci. Model Dev., 9, 1243–1261, https://doi.org/10.5194/gmd-9-1243-2016, 2016.
Lawrence, D. M., Fisher, R. A., Koven, C. D., Oleson, K. W., Swenson, S. C., Bonan, G., Collier, N., Ghimire, B., Van Kampenhout, L., and Kennedy, D.: The Community Land Model version 5: Description of new features, benchmarking, and impact of forcing uncertainty, J. Adv. Model. Earth Sy., 11, 4245–4287, https://doi.org/10.1029/2018MS001583, 2019.
Li, J. and Zeng, Q.: A unified monsoon index, Geophys. Res. Lett., 29, 115-111–115-114, https://doi.org/10.1029/2001GL013874, 2002.
Li, L., Wang, Y., Arora, V. K., Eamus, D., Shi, H., Li, J., Cheng, L., Cleverly, J., Hajima, T., and Ji, D.: Evaluating global land surface models in CMIP5: Analysis of ecosystem water-and light-use efficiencies and rainfall partitioning, J. Climate, 31, 2995–3008, https://doi.org/10.1175/JCLI-D-16-0177.1, 2018.
Li, N., Sippel, S., Linscheid, N., Rödenbeck, C., Winkler, A. J., Reichstein, M., Mahecha, M. D., and Bastos, A.: Enhanced global carbon cycle sensitivity to tropical temperature linked to internal climate variability, Sci. Adv., 10, eadl6155, https://doi.org/10.1126/sciadv.adl6155, 2024.
Lienert, S. and Joos, F.: A Bayesian ensemble data assimilation to constrain model parameters and land-use carbon emissions, Biogeosciences, 15, 2909–2930, https://doi.org/10.5194/bg-15-2909-2018, 2018.
Loveland, T. R. and Belward, A.: The IGBP-DIS global 1km land cover data set, DISCover: First results, Int. J. Remote Sens., 18, 3289–3295, https://doi.org/10.1080/014311697217099, 1997.
Ma, L., Hurtt, G., Ott, L., Sahajpal, R., Fisk, J., Lamb, R., Tang, H., Flanagan, S., Chini, L., Chatterjee, A., and Sullivan, J.: Global evaluation of the Ecosystem Demography model (ED v3.0), Geosci. Model Dev., 15, 1971–1994, https://doi.org/10.5194/gmd-15-1971-2022, 2022.
Madani, N., Parazoo, N. C., Kimball, J. S., Ballantyne, A. P., Reichle, R. H., Maneta, M., Saatchi, S., Palmer, P. I., Liu, Z., and Tagesson, T.: Recent amplified global gross primary productivity due to temperature increase is offset by reduced productivity due to water constraints, AGU Adv., 1, e2020AV000180, https://doi.org/10.1029/2020AV000180, 2020.
Na, Y.-S. and Yeh, S.-W.: Changes in vegetation-induced carbon sequestration in East Asia under global warming in CMIP6 Earth system models, Earth Syst. Environ., 1-16, https://doi.org/10.1007/s41748-025-00731-x, 2025.
Na, Y.-S. and Yeh, S.-W.: Na ecosystem-productivity-sensitivity: 2025, Zenodo [data set], https://doi.org/10.5281/zenodo.18307449, 2026.
Penuelas, J.: Decreasing efficiency and slowdown of the increase in terrestrial carbon-sink activity, One Earth, 6, 591–594, https://doi.org/10.1016/j.oneear.2023.05.013, 2023.
Ren, X., He, H., Zhang, L., and Yu, G.: Global radiation, photosynthetically active radiation, and the diffuse component dataset of China, 1981–2010, Earth Syst. Sci. Data, 10, 1217–1226, https://doi.org/10.5194/essd-10-1217-2018, 2018.
Rolinski, S., Müller, C., Heinke, J., Weindl, I., Biewald, A., Bodirsky, B. L., Bondeau, A., Boons-Prins, E. R., Bouwman, A. F., Leffelaar, P. A., te Roller, J. A., Schaphoff, S., and Thonicke, K.: Modeling vegetation and carbon dynamics of managed grasslands at the global scale with LPJmL 3.6, Geosci. Model Dev., 11, 429–451, https://doi.org/10.5194/gmd-11-429-2018, 2018.
Shin, M.-S., Yeh, S.-W., Lee, H.-J., and Park, C.-E.: Changes in the relationship between climate variables and vegetation carbon uptake in East Asia, Ecol. Inform., 91, 103375, https://doi.org/10.1016/j.ecoinf.2025.103375, 2025.
Sitch, S., O'sullivan, M., Robertson, E., Friedlingstein, P., Albergel, C., Anthoni, P., Arneth, A., Arora, V. K., Bastos, A., and Bastrikov, V.: Trends and drivers of terrestrial sources and sinks of carbon dioxide: An overview of the TRENDY project, Glob. Biogeochem. Cycle, 38, e2024GB008102, https://doi.org/10.1029/2024GB008102, 2024.
Tang, Q., Golaz, J.-C., Van Roekel, L. P., Taylor, M. A., Lin, W., Hillman, B. R., Ullrich, P. A., Bradley, A. M., Guba, O., Wolfe, J. D., Zhou, T., Zhang, K., Zheng, X., Zhang, Y., Zhang, M., Wu, M., Wang, H., Tao, C., Singh, B., Rhoades, A. M., Qin, Y., Li, H.-Y., Feng, Y., Zhang, Y., Zhang, C., Zender, C. S., Xie, S., Roesler, E. L., Roberts, A. F., Mametjanov, A., Maltrud, M. E., Keen, N. D., Jacob, R. L., Jablonowski, C., Hughes, O. K., Forsyth, R. M., Di Vittorio, A. V., Caldwell, P. M., Bisht, G., McCoy, R. B., Leung, L. R., and Bader, D. C.: The fully coupled regionally refined model of E3SM version 2: overview of the atmosphere, land, and river results, Geosci. Model Dev., 16, 3953–3995, https://doi.org/10.5194/gmd-16-3953-2023, 2023.
Ueyama, M., Iwata, H., Nagano, H., Kukuu, N., and Harazono, Y.: Anomalous wet summers and rising atmospheric CO2 concentrations increase the CO2 sink in a poorly drained forest on permafrost, P. Natl. Acad. Sci. USA, 121, e2414539121, https://doi.org/10.1073/pnas.2414539121, 2024.
Walker, A. P., Quaife, T., Van Bodegom, P. M., De Kauwe, M. G., Keenan, T. F., Joiner, J., Lomas, M. R., MacBean, N., Xu, C., and Yang, X.: The impact of alternative trait‐scaling hypotheses for the maximum photosynthetic carboxylation rate (Vcmax) on global gross primary production, New Phytol., 215, 1370–1386, https://doi.org/10.1111/nph.14623, 2017.
Wang, S., Zhang, Y., Ju, W., Chen, J. M., Ciais, P., Cescatti, A., Sardans, J., Janssens, I. A., Wu, M., and Berry, J. A.: Recent global decline of CO2 fertilization effects on vegetation photosynthesis, Science, 370, 1295–1300, https://doi.org/10.1126/science.abb7772, 2020.
Wang, Z., Peñuelas, J., Tagesson, T., Smith, W., Wu, M., He, W., Sitch, S., and Wang, S.: Evolution of Global Terrestrial Gross Primary Productivity Trend, Ecosyst. Health Sustain., 10, 0278, https://doi.org/10.34133/ehs.0278, 2024.
Yuan, Z., Jiang, Q., and Yin, J.: Impact of climate change and land use change on ecosystem net primary productivity in the Yangtze River and Yellow River Source Region, China, Watershed Ecol. Environ., 5, 125–133, https://doi.org/10.1016/j.wsee.2023.04.001, 2023.
Yun, H., Tang, J., D'Imperio, L., Wang, X., Qu, Y., Liu, L., Zhuang, Q., Zhang, W., Wu, Q., and Chen, A.: Warming and increased respiration have transformed an alpine steppe ecosystem on the Tibetan Plateau from a carbon dioxide sink into a source, J. Geophys. Res.-Biogeo., 127, e2021JG006406, https://doi.org/10.1029/2021JG006406, 2022.
Zhang, H. K. and Roy, D. P.: Using the 500 m MODIS land cover product to derive a consistent continental scale 30 m Landsat land cover classification, Remote Sens. Environ., 197, 15–34, https://doi.org/10.1016/j.rse.2017.05.024, 2017.
Zhang, X., Chen, Y., Zhang, Q., Xia, Z., Hao, H., and Xia, Q.: Potential evapotranspiration determines changes in the carbon sequestration capacity of forest and grass ecosystems in Xinjiang, Northwest China, Glob. Ecol. Conserv., 48, e02737, https://doi.org/10.1016/j.gecco.2023.e02737, 2023.