
the Creative Commons Attribution 4.0 License.
the Creative Commons Attribution 4.0 License.
 | 25 Sep 2026
Everyday weather in a warmer world

Gilbert P. Compo
Steve George
Gabriele C. Hegerl
Andrew Schurer
Theodore G. Shepherd
Laura C. Slivinski
Vikki Thompson
Ed Hawkins
How would the weather of a year from history be experienced in a warmer world? We reconstruct the weather of 1903 using a reanalysis system that assimilates only surface pressure observations (20CRv3) with observed SSTs, and then reconstruct it again with increased SSTs and atmospheric CO2 levels. By assimilating the same pressure observations, the reanalysis experiments produce the same weather patterns, and so we translate the weather of 1903 into a warmer context. We focus on changes in the everyday weather of four regions with a high density of historical pressure observations, where the circulation is constrained and differences between the experiments are due to the thermodynamic component of climate change. In these regions, nearly all days are warmer in the warmer world experiments, but the largest increases occur on cold days (below freezing) and hot days (above 20 °C). Daily rainfall becomes more variable, even in regions where total rainfall is reduced. Fewer days experience light rain while more days experience heavy rain, and rainfall only increases on less than 1 d in 10. This single year pair of reanalysis experiments also recovers common patterns of observed and projected long-term changes. For example, Western Mediterranean precipitation declines outside winter, but shows a small increase in winter in the absence of storm track shifts. By anchoring our analysis in weather patterns that have actually occurred, the reanalysis experiments point to how our day-to-day experience of the same weather patterns may change in a warmer world, even if the weather patterns themselves do not.
- Article
(5972 KB) - Full-text XML
-
Supplement
(4001 KB) - BibTeX
- EndNote


Climate change is affecting the frequency and intensity of extreme weather, with implications for infrastructure adaptation and human health (Seneviratne et al., 2021). Over the 21st century, progress has been made in attributing the influence of climate change on individual extreme weather events (Stott et al., 2004; Otto et al., 2012; Clarke et al., 2022). However, while much attention has focused on extreme weather, less focus has been given to how climate change will affect the experience of everyday, non extreme weather. Though extreme weather is impactful, and can contribute disproportionately to the mean (Pendergrass, 2018), by definition it represents weather on only a small number of days. Previous work has considered how climate change has and will affect the occurrence of mild weather (van der Wiel et al., 2017; Lin et al., 2019; Zhang et al., 2022) and the closely related concept of “outdoor days” (Choi et al., 2024a, b), defined variously as days with comfortable near-surface temperature and/or clear skies and minimal precipitation. Model projections broadly show an increase in mild conditions in the mid-high latitudes and a decrease in the tropics (van der Wiel et al., 2017; Choi et al., 2024b), albeit with substantial regional variation. However, regional projections of temperature and precipitation depend on uncertain future changes in large-scale weather patterns (Shepherd, 2014).
A different approach is to consider how the thermodynamic aspects of climate change – those related to rising temperature and humidity – will affect day-to-day weather, given no change in weather patterns. Those effects represent the most robust aspects of regional climate change. We adopt a storyline approach (Shepherd, 2016) to explore changes in the weather of a year from history. Hawkins et al. (2023a) reconstructed an extreme event from 1903, Storm Ulysses, in an atmospheric reanalysis system, and translated its impacts into a warmer world. Using the same experiments, as well as an additional novel reanalysis experiment described below, we present a broader survey of changes across the 12 months of 1903. The weather from all 12 months of 1903 is first reconstructed using an atmospheric reanalysis system that assimilates observations of atmospheric pressure (including rescued pressure observations not available in the production version of the reanalysis) and uses observed SSTs and sea ice concentrations as lower boundary conditions (Slivinski et al., 2019). Then, the model and data assimilation system are completely re-run while assimilating the same pressure observations, but altering the SST boundary conditions and atmospheric CO2 in order to translate the historical weather into a warmer world. As the same pressure observations are assimilated in each experiment, the experiments experience the same weather patterns, minimising uncertainty due to projected changes in atmospheric circulation. We then explore how the thermodynamic impacts of day-to-day weather differ in a warmer and moister atmosphere. For example, in the absence of circulation changes, how does a given ocean warming affect the distribution of daily temperature? Do cold days and hot days warm by the same amount? Does rainfall become more or less frequent, and more or less variable from day to day?
Our approach is similar to other storyline attribution methods, such as nudging experiments where the large-scale winds are relaxed towards specified values (Wehrli et al., 2020; van Garderen et al., 2021; Sánchez-Benítez et al., 2022; Feser and Shepherd, 2025), and the pseudo global warming (PGW) method, where the boundary conditions for regional climate models (RCMs) are adjusted to reflect the effects of climate change (Schär et al., 1996; Brogli et al., 2023; Lenderink et al., 2025). These adjustments, often referred to as PGW “deltas”, are chosen such that the imposed dynamical driving at the RCM boundaries is unchanged in the warmer world simulation. Similarly to the reanalysis experiments, there is no change in intraannual variability between the control and “counterfactual” (nudged or PGW) simulations, which allows robust signals to be extracted from shorter simulations than are typically required with free-running climate models (Sato et al., 2007). The main differences between these two methods are in how the circulation is constrained: in PGW, typically the 3D dynamics are imposed only at the edge of the RCM domain, while large-scale nudging can be performed globally or across a smaller regional domain in the free troposphere (Wehrli et al., 2020; van Garderen et al., 2021); in the reanalysis experiments, the synoptic circulation at the surface is constrained through the assimilation of surface pressure observations. Long historical records of surface pressure and SST observations allow the reanalysis approach to study periods that occurred before the advent of widespread upper-air observations in the mid-20th century. As in some nudged simulations, the reanalysis experiments are also global, allowing multiple locations to be studied in a single run. The reanalysis experiments in this paper thus offer an additional and computationally efficient line of evidence regarding the thermodynamic effects of warming on regional weather and climate.
We begin by describing the reanalysis system and assimilated pressure data before presenting a global overview of changes in the warmer world experiments. The available pressure observations from 1903 are not distributed evenly in space, which restricts the regions we can study in detail using this approach for this particular year. We therefore focus on four regions with a high density of pressure observations in 1903. Our results are summarised in the final section.
We reconstruct the weather of 1903 using the NOAA-CIRES-DOE 20th Century Reanalysis version 3 data assimilation system (20CRv3, Slivinski et al., 2019). Using an Ensemble Kalman Filter, 20CRv3 assimilates observed pressure values with a NOAA atmospheric model to provide a best estimate of the atmospheric state at each point in time. The atmospheric model used is the NOAA GFS v14.0.1. The atmospheric model is coupled to the Noah land surface model, which incorporates a 4-layer soil model and dynamic fractional snow cover (Ek et al., 2003). An 80-member ensemble of 3-hourly atmospheric fields is produced on a 0.7° Gaussian grid. SSTs and sea ice concentrations are prescribed from observed values. The system assimilates pressure observations taken over land and ocean as well as tropical cyclone central pressures from best-track datasets (see Slivinski et al., 2019, for details of the boundary conditions and pressure observations).
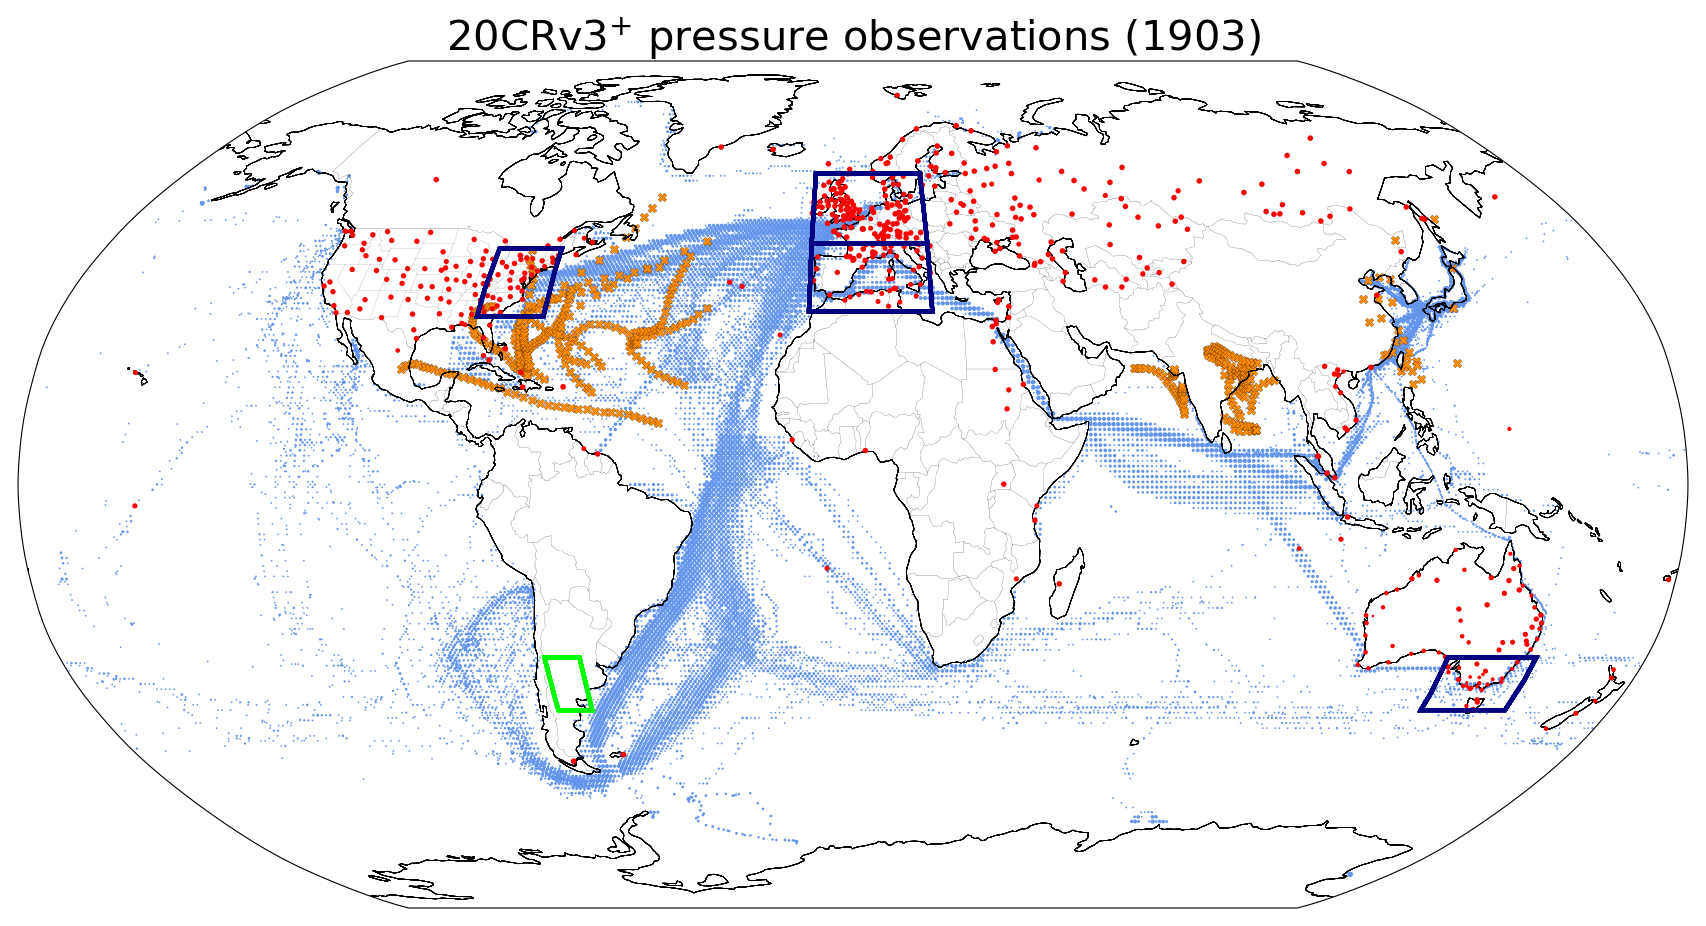
Figure 1Available pressure observations for the 1903 reanalysis experiments. Red circles denote land stations, blue dots denote pressure observations from ships, and orange crosses denote tropical cyclone best-track pressures. Blue boxes show well-observed regions used for analysis in later sections. 97.1 % of all pressure observations in 1903 were successfully assimilated in the 20CRv3+ experiment. Note that some land stations have multiple observations per day and some have fewer.
We present results from three reanalysis experiments. The first experiment, denoted 20CRv3+, is identical to the improved reanalysis in Hawkins et al. (2023a). It consists of a reconstruction of 1903 using the same SST and radiative forcings as in the production version of 20CRv3, with two further changes: a refinement of the data assimilation scheme, and the inclusion of many additional rescued pressure observations over Europe. These changes sharpen features of the weather fields and improve the utility of the reconstructions; see the appendices of Hawkins et al. (2023a) for details. Figure 1 shows the pressure observations used in the 20CRv3+ experiment. Some regions are much richer in historical pressure observations than others. We expect the atmospheric circulation to be better constrained in these regions than in regions with fewer pressure observations, and so we focus most of our analysis on four regions with a high density of observations in 1903, shown by the blue boxes in Fig. 1. These regions cover northwestern Europe (NW_Europe), the western Mediterranean (Western_Med), the East Coast of the US (US_East_Coast), and Southeastern Australia (SE_Aus).
In addition to 20CRv3+, two further experiments are performed to translate the weather of 1903 into a warmer world. The first, denoted +2 K, is as in Hawkins et al. (2023b): a uniform +2 K perturbation is added to the SSTs, with radiative forcings kept at 1903 values. In the second, denoted +2 K + CO2, in addition to the +2 K SST perturbation, global atmospheric CO2 concentration is increased to 530 ppm. Differences between the two warmer world experiments therefore indicate the direct role of the CO2 radiative forcing. Sea ice boundary conditions are unchanged in the warmer world experiments compared to 20CRv3+. Sensitivity tests suggest that this can cause spurious signals near the ice edge, but these effects do not extend far from the ice edge due to the strong constraint of prescribed SSTs and the assimilation of pressure observations (not shown). The SST, CO2, and sea ice conditions are idealised and do not reflect observed or projected patterns of change – they are chosen to illustrate the role of ocean warming and atmospheric composition on the weather of 1903 in a simple way. In both experiments, the same pressure observations are assimilated as in 20CRv3+, so that the atmospheric flow is similarly constrained in all three experiments; we thus isolate the thermodynamic impacts of the perturbations on the reconstructed weather of 1903. We analyse 12 months of data (from January to December 1903) in each experiment. Each warmer world experiment is spun up for 6 months prior to January 1903 to allow the atmosphere to adjust to the perturbed boundary conditions. The 20CRv3+ and +2 K experiments are as in Hawkins et al. (2023a) and Hawkins et al. (2023b), while the +2 K + CO2 experiment is novel.
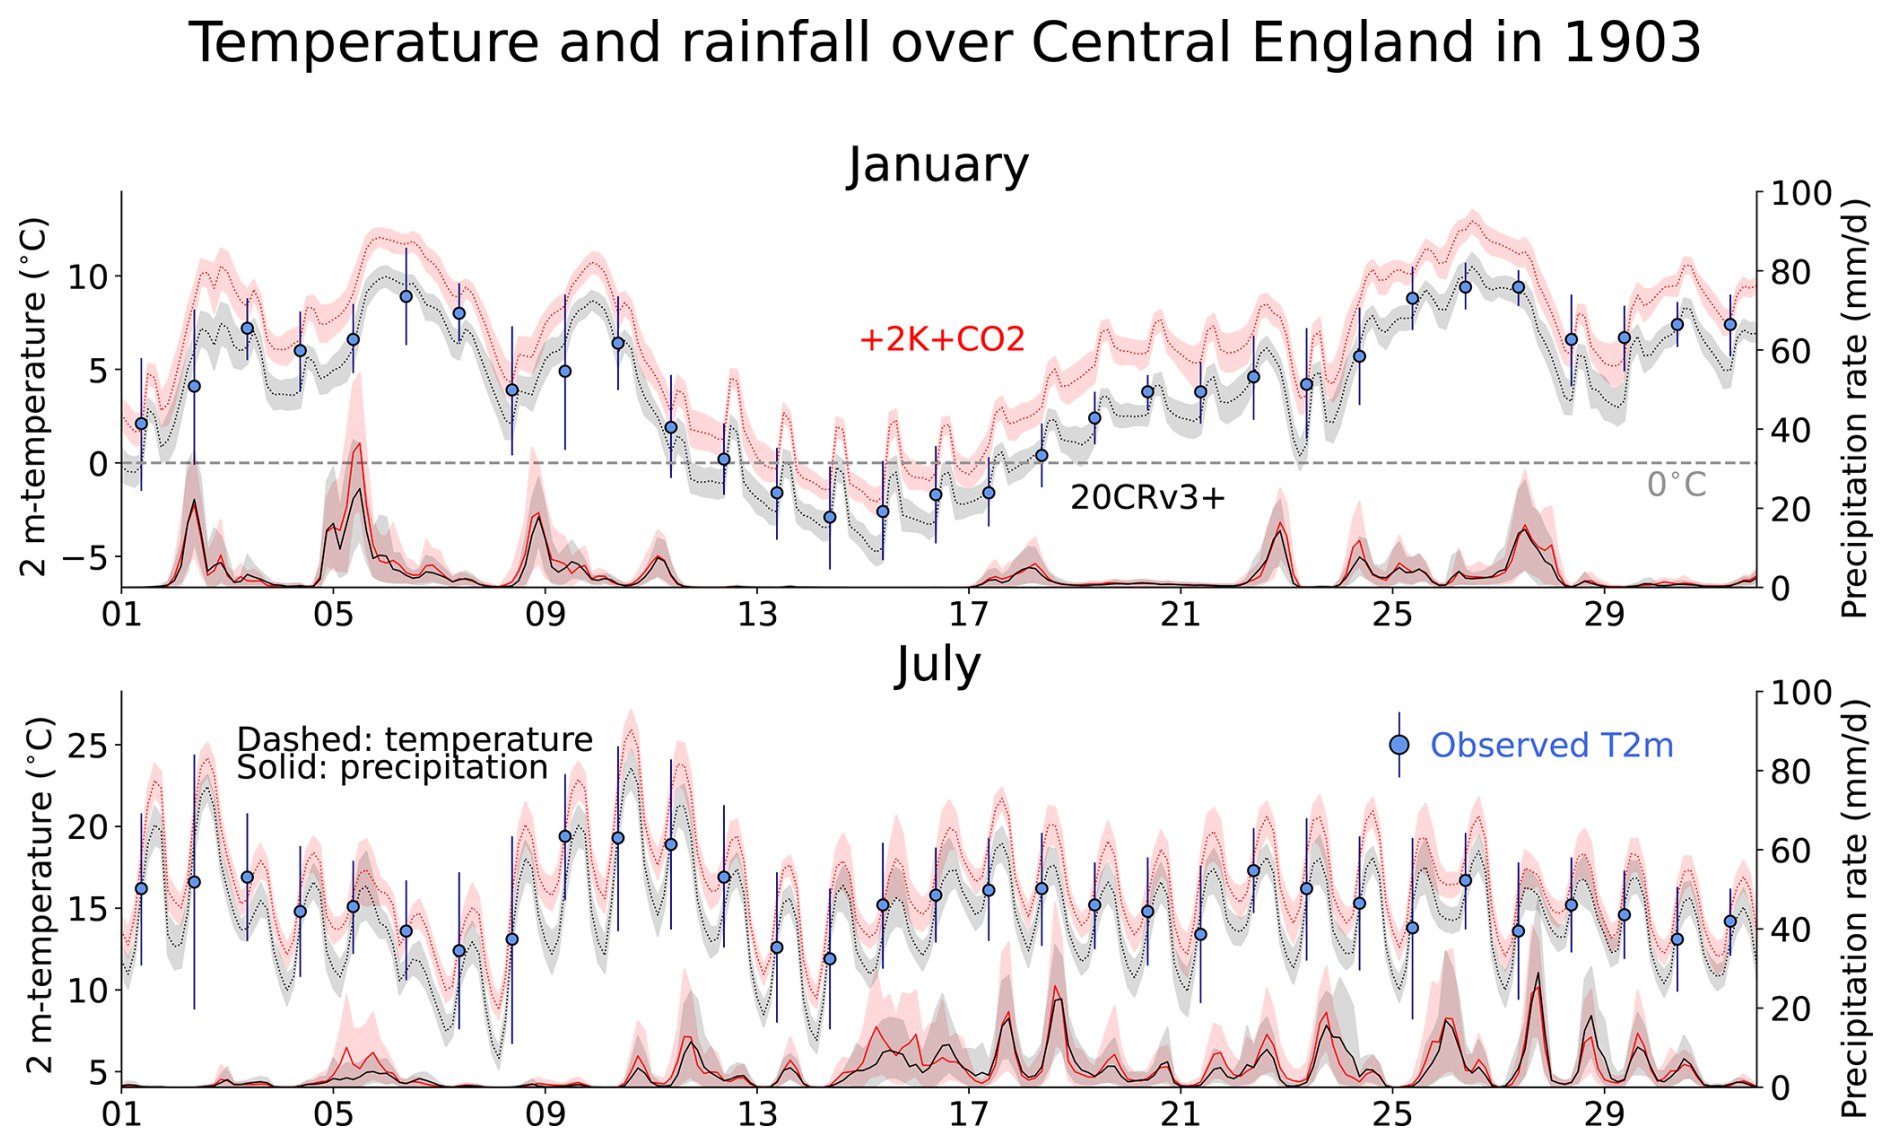
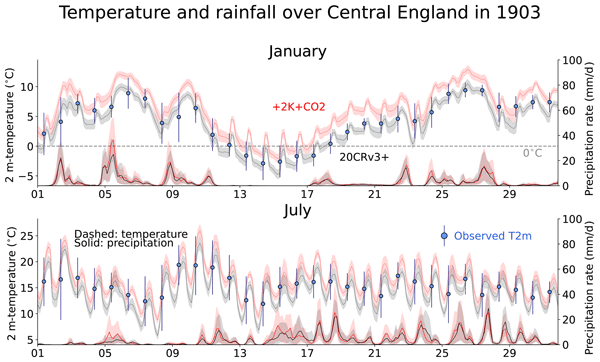
Figure 2Time series of 3-hourly 2 m-temperature (dotted line) and precipitation rate (solid line) averaged over central England (3–0° W, 51.5–54.0° N, see boxed region in Fig. 8). The 20CRv3+ experiment is in black and the +2 K + CO2 experiment is in red (see Fig. S1 in the Supplement for the +2 K experiment). Lines show the ensemble-means and shading denotes the 10 %–90 % range across the ensemble. Blue markers show daily-mean temperatures from the Central England Temperature (CET) series (Legg et al., 2025), plotted at 09:00 UTC each day. Vertical bars on each marker indicate the CET daily maximum and minimum temperatures. The grey dashed line in the top panel indicates the air frost threshold (0 °C).
An example of everyday weather in a well-observed region is shown in Fig. 2, which shows 3-hourly time series of 2 m-temperature and precipitation in 20CRv3+ and the +2 K + CO2 experiment averaged over Central England (the boxed area in Fig. 8b–d) for January and July 1903. The equivalent plots for the +2 K experiment are shown in Fig. S1 in the Supplement. Temperatures in 20CRv3+ are in good agreement with observed daily values from the Central England Temperature series (CET) (Legg et al., 2025), which represents observed average temperatures over a similar region. As no temperature observations are assimilated, this comparison provides an independent verification of the reanalysis skill in reproducing observed weather in this region. The warmer world simulations show day-to-day fluctuations in temperature and precipitation in phase with those of 20CRv3+, which indicates that the synoptic circulation is well constrained by the assimilated observations (the experiments experience the “same” weather). Temperatures in the warmer world experiments are consistently warmer than in 20CRv3+, with little overlap between the 20CRv3+ and warmer world ensemble shading, especially in January. The grey dashed line in the top panel indicates the air frost threshold (0 °C). Eight nights in the 20CRv3+ ensemble-mean dip below this threshold, while only five do in the +2 K + CO2 experiment – a reduction of 60 % in this small sample. For comparison, the annual number of air frost days in the UK has declined by around a quarter since the 1980s (Kendon et al., 2025). Precipitation peaks in the warmer world experiments generally line up with those in 20CRv3+, though rainfall is less well constrained by the assimilated pressure observations than is near-surface temperature.
In addition to Central England, we also show a version of Fig. 2 for a region over northern Patagonia with far fewer nearby land-based pressure stations (Fig. S2, the green boxed region in Fig. 1). Day-to-day variations in temperature and precipitation are surprisingly similar in both experiments, despite the much weaker observational constraint than over Central England (Fig. 1). Although we restrict most of the later analysis to well-observed regions, Fig. S2 suggests that even a small number of nearby observations (from ships in this case) can constrain the circulation relatively well in the reanalysis system. This is particularly noteworthy given that the markers in Fig. 1 represent observations across all of 1903; within a single assimilation window, the density of ship-based observations will be much lower than that shown in Fig. 1.
Focusing on the year 1903 allows us to exploit the existing reanalysis experiments of Hawkins et al. (2023b). Globally, 1903 was a cold year: it is the 3rd coldest in the 175-year HadCRUT5.1 dataset (Morice et al., 2021, Fig. S3a), and it is in at least the coldest third of years in each of the four well-observed regions we analyse in later sections (the lowest rank is 57th/175 in NW_Europe, i.e. 32nd percentile; Fig. S3b–e). The eruption of the Santa Maria volcano in October 1902 – one of the largest tropical volcanic eruptions of the century (Robock, 2000) – presumably contributed to the generally cool conditions (Self et al., 1981). Note that the volcanic aerosol forcing is identical in all of our experiments. The cold baseline conditions in 1903 mean that the perturbed climates in the warmer world experiments are not much warmer than some of the later years in the original 20CRv3 dataset, for which the system's performance has been validated. This builds confidence in the ability of the reanalysis system to plausibly represent the warmer world climates in our experiments.
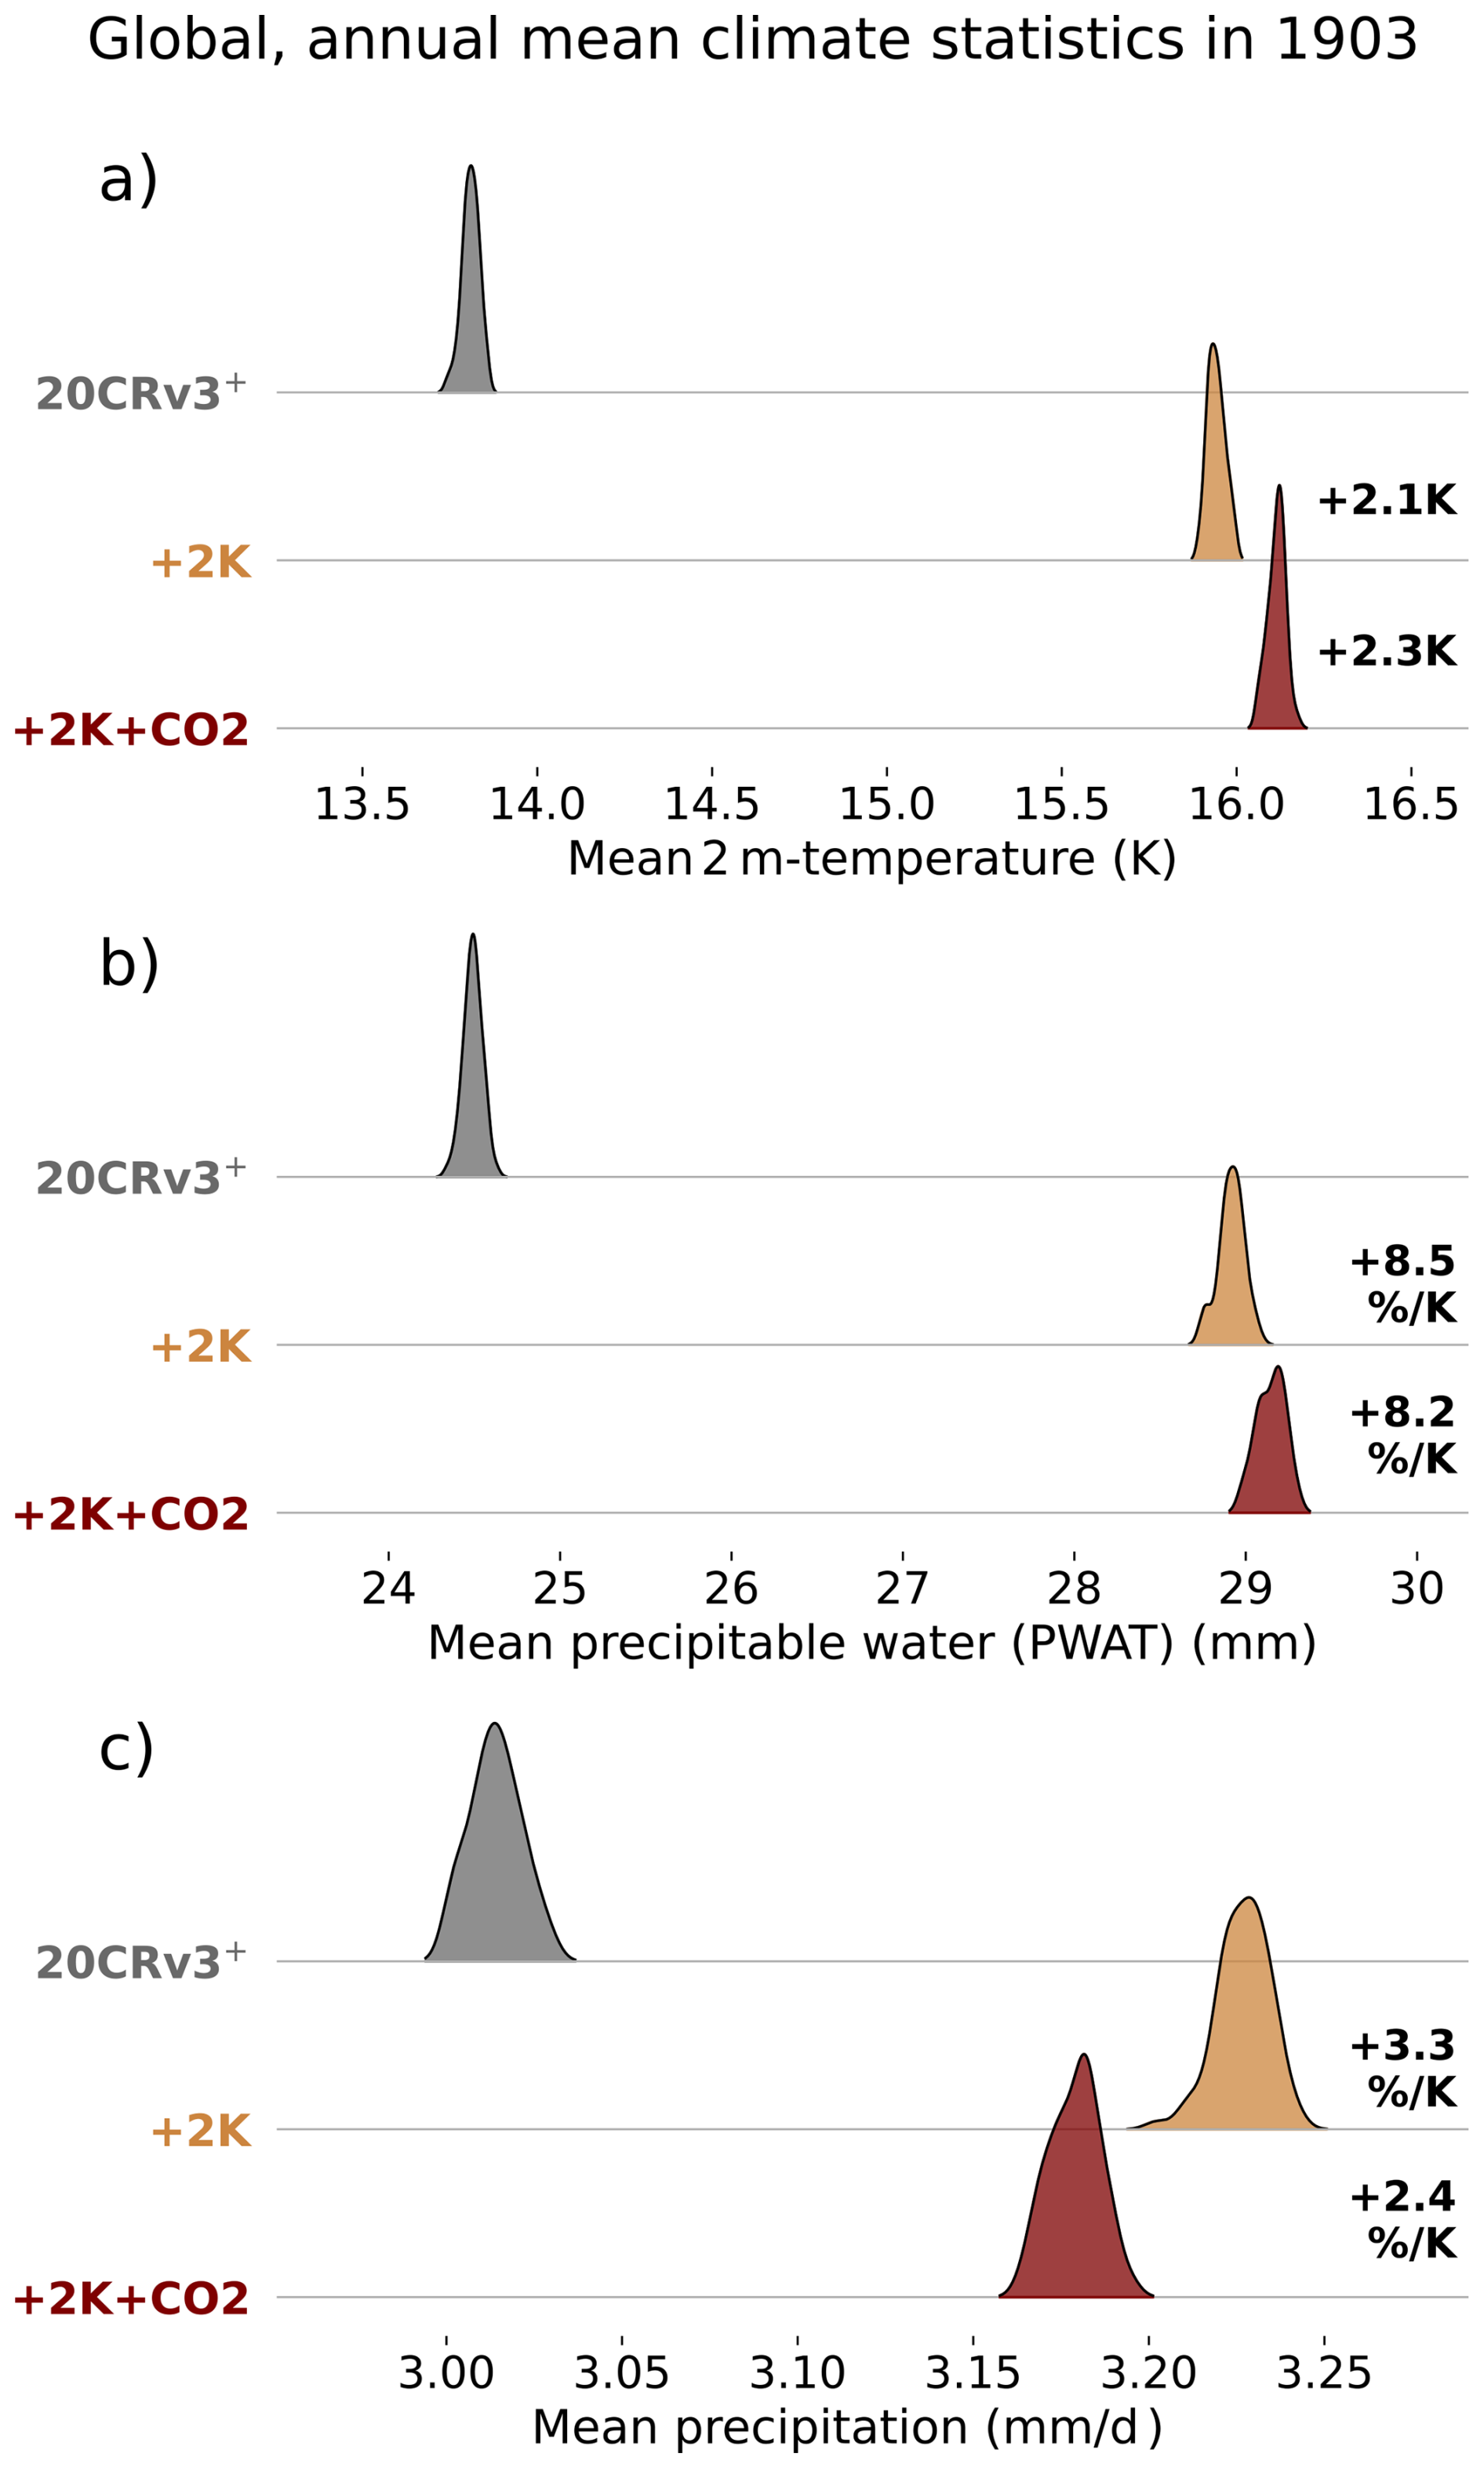
Figure 3Globally and annually averaged 2 m-temperature (a), total-column precipitable water (PWAT) (b), and precipitation rate (c) in the reanalysis experiments. Curves show the density of values across the 80 ensemble members in each experiment.
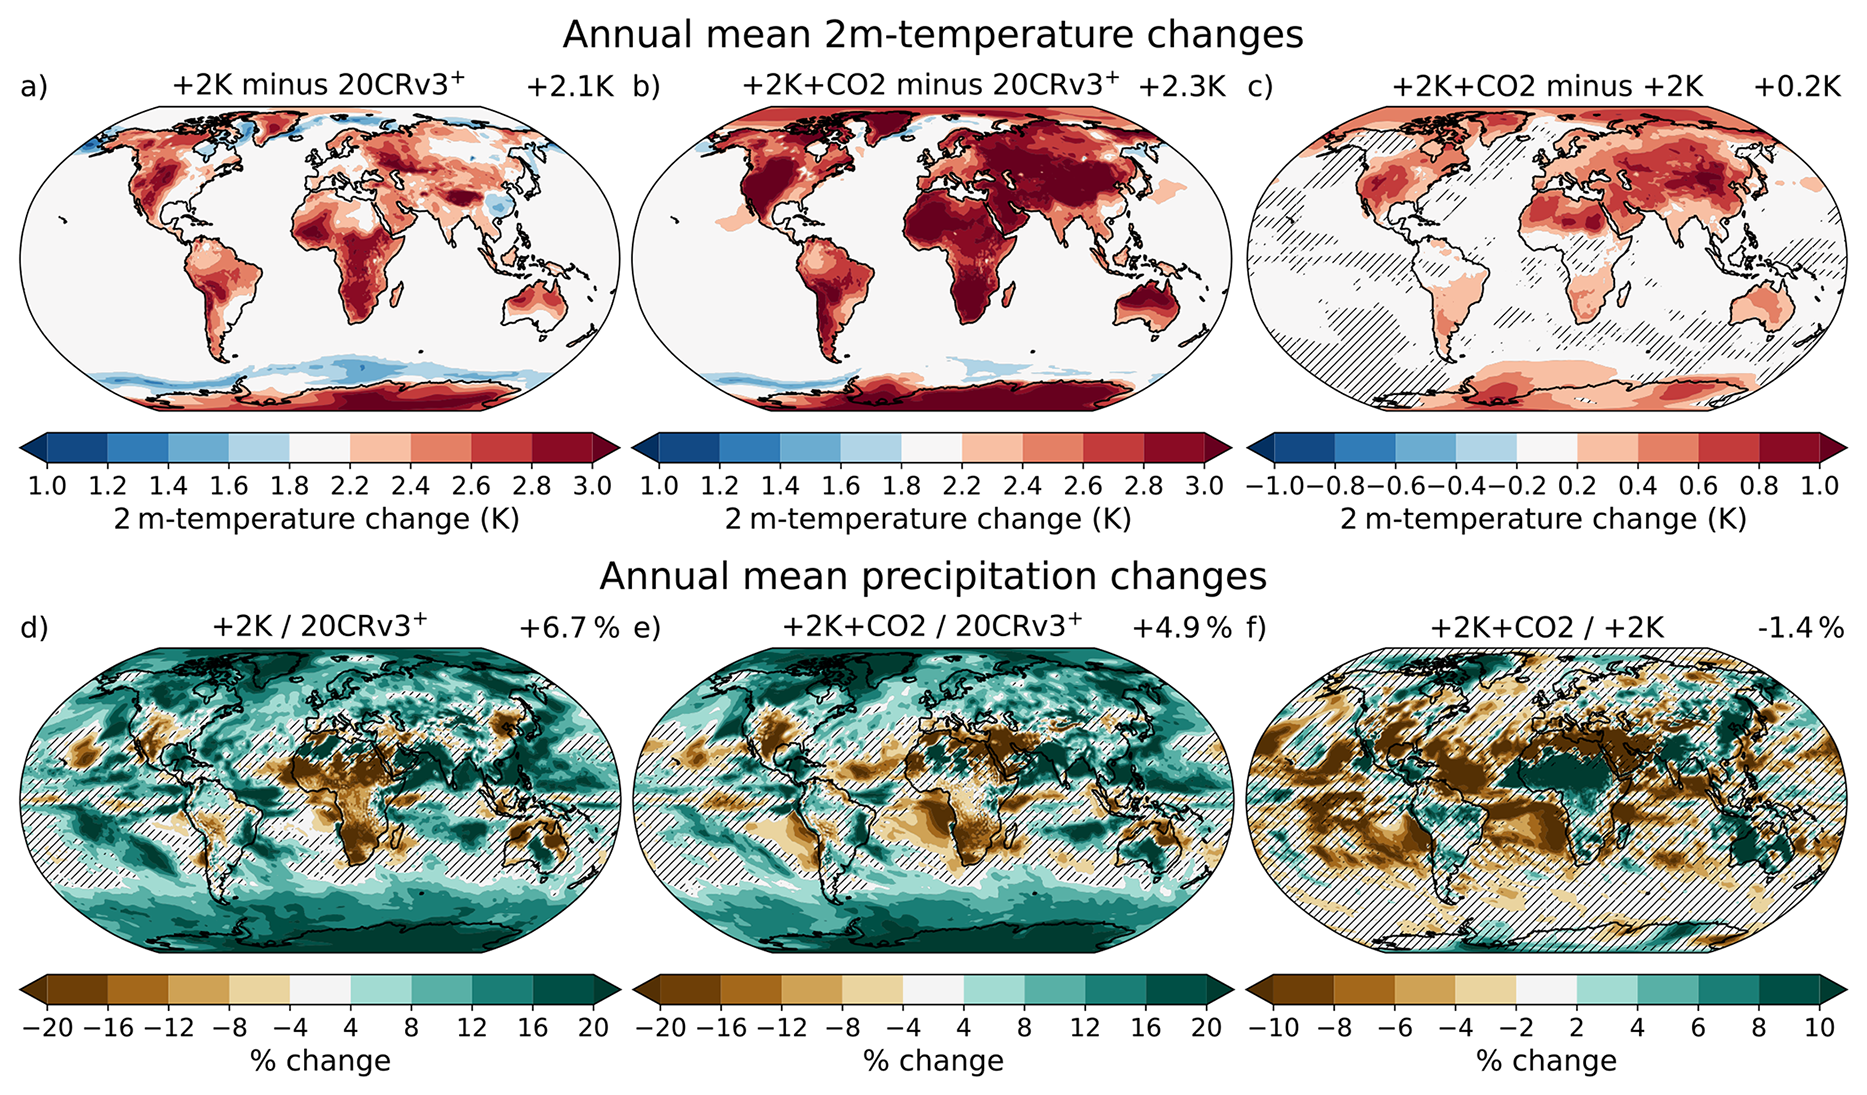
Figure 4Annual-mean changes in 2 m-temperature (a–c) and precipitation (d–f) between the reanalysis experiments. Changes are shown as differences between experiments for temperature, and as percentage changes between experiments for precipitation. The value at the top right of each plot is the global (area-weighted) average of the changes at each gridpoint (note that this is different to the changes in the global-mean shown in Fig. 3). Hatching obscures non-significant changes at the 5 % level using a two-tailed Student's t test. The colour bar in panels (a)–(b) is centred on a change of +2 K as this is the perturbation applied to the SSTs.
Before focusing on regional aspects, we first present a global overview of changes in the warmer world experiments. Figure 3 shows globally and annually averaged 2 m-temperature, precipitable water (PWAT) and precipitation rate in each experiment. The distributions show the spread of values across the 80 ensemble members. The spatial patterns of the ensemble-mean temperature and precipitation changes are shown in Fig. 4. As seen in Fig. 3a, globally, the +2 K experiments are 2.1 K warmer than 20CRv3+ in the ensemble-mean, with the additional 0.1 K of warming arising due to enhanced warming over land (Fig. 4a). This highlights the prominent role of oceanic warming in driving continental temperatures, even in the absence of changes in CO2 forcing, such as through the moistening of continental air and hence enhanced downwelling longwave (LW) radiation over land (Compo and Sardeshmukh, 2009). Interestingly, however, we also find an important role for direct CO2-induced warming, with a further 0.2 K of global warming in the +2 K + CO2 experiment due to additional enhanced warming over extratropical land (Fig. 4b). This corresponds to a larger global land/ocean warming ratio (1.35 in +2 K + CO2, compared to 1.21 in +2 K). Both warming ratio values are notably smaller in the warmer world experiments than in climate models and observations (e.g. Sutton et al., 2007; Compo and Sardeshmukh, 2009; Byrne and O’Gorman, 2018); the warmer world experiments are idealised and differ from observed climate change in several ways, including the uniform SST increase and the lack of changes in other forcing agents such as tropospheric aerosols (which are constant at modern day levels in 20CRv3), so we would not expect the ratios to match the real world values precisely. Another idealised design choice is the unchanged sea ice fields in the warmer world experiments, which is likely the reason for the weak Arctic warming in Fig. 4a. Keeping sea ice fixed in the warmer world experiments will result in a smaller increase in global-mean temperatures than if more plausible reductions in sea ice concentration had been specified (Fig. 3a). Enhanced warming also occurs over regions of high elevation including the Andes and Himalayas (Fig. 4a–b), consistent with thermodynamic mechanisms such as a reduction in snow albedo and Planck feedbacks (Pepin et al., 2015). The direct CO2-induced warming is small over tropical land (Fig. 4b–c), likely due to masking of its radiative forcing by high clouds and upper-tropospheric water vapour (Merlis, 2015). It has a larger warming effect in the extratropics, particularly over arid regions such as the Sahara and the Western US. In the latter region, additional warming of 0.6 K or more is seen due to the higher CO2 levels, which is around a fifth of the total warming in the +2 K + CO2 runs. This is likely to be a purely radiative consequence of the CO2 forcing, as the high density of pressure observations in the Western US will strongly constrain the circulation in each experiment (Fig. 1). Thus, even in the absence of circulation changes, the direct warming effect of atmospheric CO2 varies regionally and can be large in the extratropics.
Higher surface temperatures are associated with increased atmospheric moisture content in the warmer world experiments, as seen in globally averaged precipitable water (PWAT, Fig. 3b). The PWAT increases follow the same ordering as the temperature distributions. Accounting for the additional warming in the +2 K + CO2 runs, the relative increase in PWAT is similar in both experiments and is broadly in line with Clausius-Clapeyron scaling at 8.5 % K−1 and 8.2 % K−1 respectively (Trenberth et al., 2005; O'Gorman and Muller, 2010; Wan et al., 2024).
Global precipitation also increases in the warmer world simulations (Fig. 3c), but more slowly than atmospheric moisture. Latent heating from precipitation is balanced globally by LW cooling of the atmosphere, which increases as the surface and atmosphere warm. This explains why a smaller precipitation increase is seen in the +2 K + CO2 experiment than in +2 K, despite a larger increase in atmospheric moisture: additional CO2 reduces LW emission to space and thus a smaller increase in precipitation is required to balance it. Hence, in isolation, the higher CO2 concentration acts to blunt the precipitation increase that arises due to surface warming (Allen and Ingram, 2002; Pendergrass and Hartmann, 2014a). The increase of 2.4 % K−1 in the +2 K + CO2 experiment is notably similar to values seen in climate model experiments (Allen and Ingram, 2002), despite the lack of strict energy conservation in the reanalysis system due to the inclusion of analysis increments.
The spatial pattern of precipitation change is shown in Fig. 4d–e. In many respects, the pattern of change in the warmer world simulations resembles the canonical projected response to greenhouse warming in comprehensive climate models (Semenov and Bengtsson, 2002; Lee et al., 2021), despite the specificity of the 1903 SST boundary conditions and atmospheric circulation. Precipitation increases over much of the extratropics, while drying is seen over the Mediterranean and subtropical ocean basins. Precipitation intensity over land increases everywhere, but land areas including Africa, the western US, and Mediterranean experience fewer wet days (Fig. S4). Much of the drying over subtropical oceans is due to the inclusion of CO2 (Fig. 4f), which may reflect a shift of convection from ocean to land in association with the enhanced land warming driven by increased CO2 (He and Soden, 2017). The sparse observations over much of the tropics mean that the atmospheric circulation is less constrained in these regions; in the following sections, we therefore focus on changes in the four well-observed regions identified in Fig. 1.
4.1 Temperature changes
Annual-mean temperatures in the warmer world experiments are consistently higher than in 20CRv3+. But do cool and warm days change by the same amount? Figure 5 shows the pairwise change in near-surface temperature in the warmer world experiments compared to 20CRv3+, as a function of the 20CRv3+ daily-mean temperature, for the four well-observed regions indicated in Fig. 1.
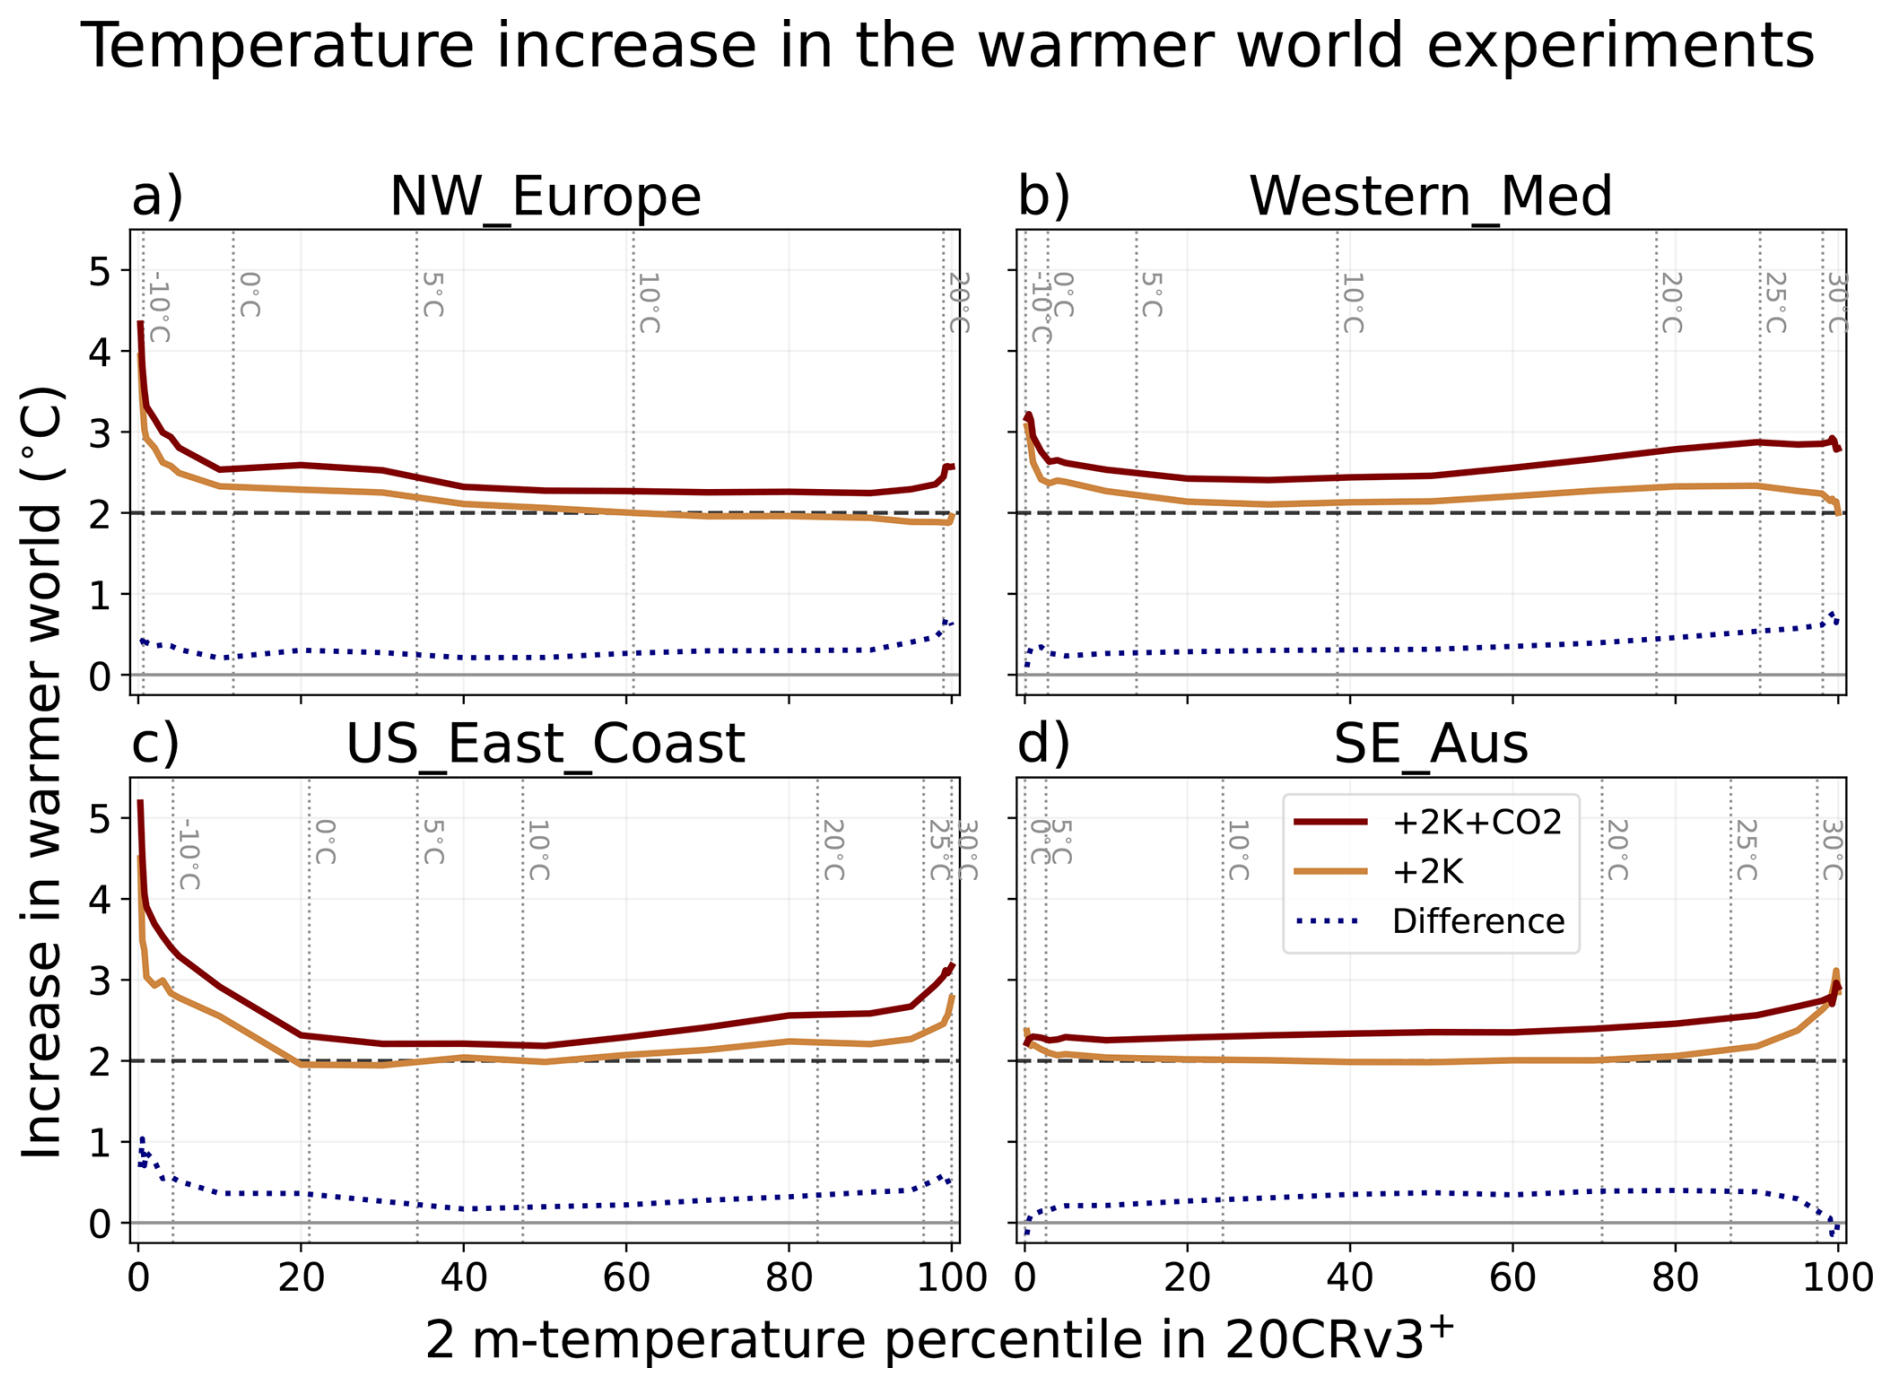
Figure 5Change in ensemble-mean, daily-mean 2 m-temperature in the warmer world experiments versus 20CRv3+, as a function of temperature percentile in 20CRv3+. The pairwise difference between experiments is calculated for every (lat, lon, day) pair and is then binned according to the temperature value of that (lat, lon, day) in 20CRv3+. Solid lines show the mean difference in each bin. The blue dotted line shows the pairwise difference between the +2 K + CO2 and +2 K experiments (again binned according to 20CRv3+ temperature). Only land gridcells are used. The horizontal dashed line indicates a change of +2 °C and the vertical dotted lines show absolute temperatures in 20CRv3+.
Fewer than 1 % of points in each bin become cooler in the +2 K or +2 K + CO2 experiments compared to 20CRv3+ (not shown). In the +2 K experiment, temperatures increase by 2–2.5 °C on what could be considered typical days in each region (between the 20th and 80th percentiles of daily temperature in 20CRv3+). Higher CO2 in the +2 K + CO2 experiment leads to a roughly constant additional warming of 0.2–0.4 °C on these days. However, three of the four regions show much larger temperature increases on cold days (particularly days below freezing; Fig. 5a–c) in both the +2 K and +2 K + CO2 experiments. Analysis of the surface heat budget reveals a reduction in the fraction of solar radiation that is reflected by the land surface on days below 5 °C in these regions (Fig. S5), likely due to reduced snow cover. Thus, in the warmer world simulations, proportionally less sunlight is reflected by snow and more is absorbed by the darker land surface, leading to amplified warming of cold days. The lack of cold-day amplification in SE_Aus (Fig. 5d) is consistent with the low occurrence of freezing temperatures.
Amplified warming is also seen for the hottest days in the Western_Med, US_East_Coast, and SE_Aus regions, with increases of 3 °C or more on days above 30 °C (Fig. 5b–d). In all regions, an increase in evaporative cooling is seen in the +2 K experiment for days below the 70th percentile (Fig. S5); however, for the hottest days, the evaporative cooling increase is smaller. In the US East Coast region, the sign reverses, with a sharp reduction in evaporative cooling seen in the +2 K experiment for days above the 97th percentile of temperature (Fig. S5c). Negative soil moisture anomalies can amplify heat waves, as the land surface is less able to lose heat through evaporation (Seneviratne et al., 2006; Fischer et al., 2007). This suggests that the hottest days in the US_East_Coast region are days with low soil moisture and thus reduced ability for the land surface to cool evaporatively, leading to larger increases in near-surface air temperature. In the Western_Med, evaporative cooling is also reduced on days above approximately the 70th percentile of temperature, but not on the very hottest days (matching the weaker amplification of warming in the +2 K experiment on these days). Changes in latent heat flux contribute less to amplified warming of hot extremes in NW_Europe – perhaps indicating that the hottest days are less limited by soil moisture – and in SE_Aus, where the amplification of hot extremes appears related to reduced cloud cover and increased warming from incident solar radiation (Compo and Sardeshmukh, 2009).
Heat waves and cold spells as experienced in nature often coincide with particular atmospheric circulation patterns, such as the well-known relationship between cold air outbreaks over Northern Europe and the negative phase of the North Atlantic Oscillation (Sui et al., 2020). Long-lived anticyclones in the summer months can similarly lead to heat waves in the extratropics (Pfahl and Wernli, 2012; Wehrli et al., 2019). Feedbacks between the atmospheric circulation and land surface can also precondition the land surface in ways that amplify hot extremes, such as by reducing soil moisture in the months prior to a heatwave (Fischer et al., 2007). Changes in the number of hot and cold days can, in general, be due to changes in the occurrence of such persistent weather patterns, in addition to the direct thermodynamic effects of increased radiative forcing. The reanalysis experiments suggest that, even if large-scale weather patterns remain unchanged, daily cold and hot extremes will experience amplified warming in a warmer world. This highlights the role of land surface feedbacks in addition to the atmospheric circulation in amplifying extreme heat events (Wehrli et al., 2019).
4.2 Precipitation changes
Next we analyse how the global precipitation changes in Figs. 3 and 4 compare to changes in the well-observed regions. Additionally, are changes in mean precipitation accompanied by changes in variability? Figure 6a–d show the change in mean precipitation and daily precipitation variability in +2 K + CO2 compared to 20CRv3+ for our selected regions. The global increase in annual-mean precipitation is also seen in the NW_Europe, US_East_Coast, and SE_Aus regions. The distribution spread is notably wider in SE_Aus than in the other regions, which may reflect the lower observation density (Fig. 1) and hence more weakly constrained circulation.
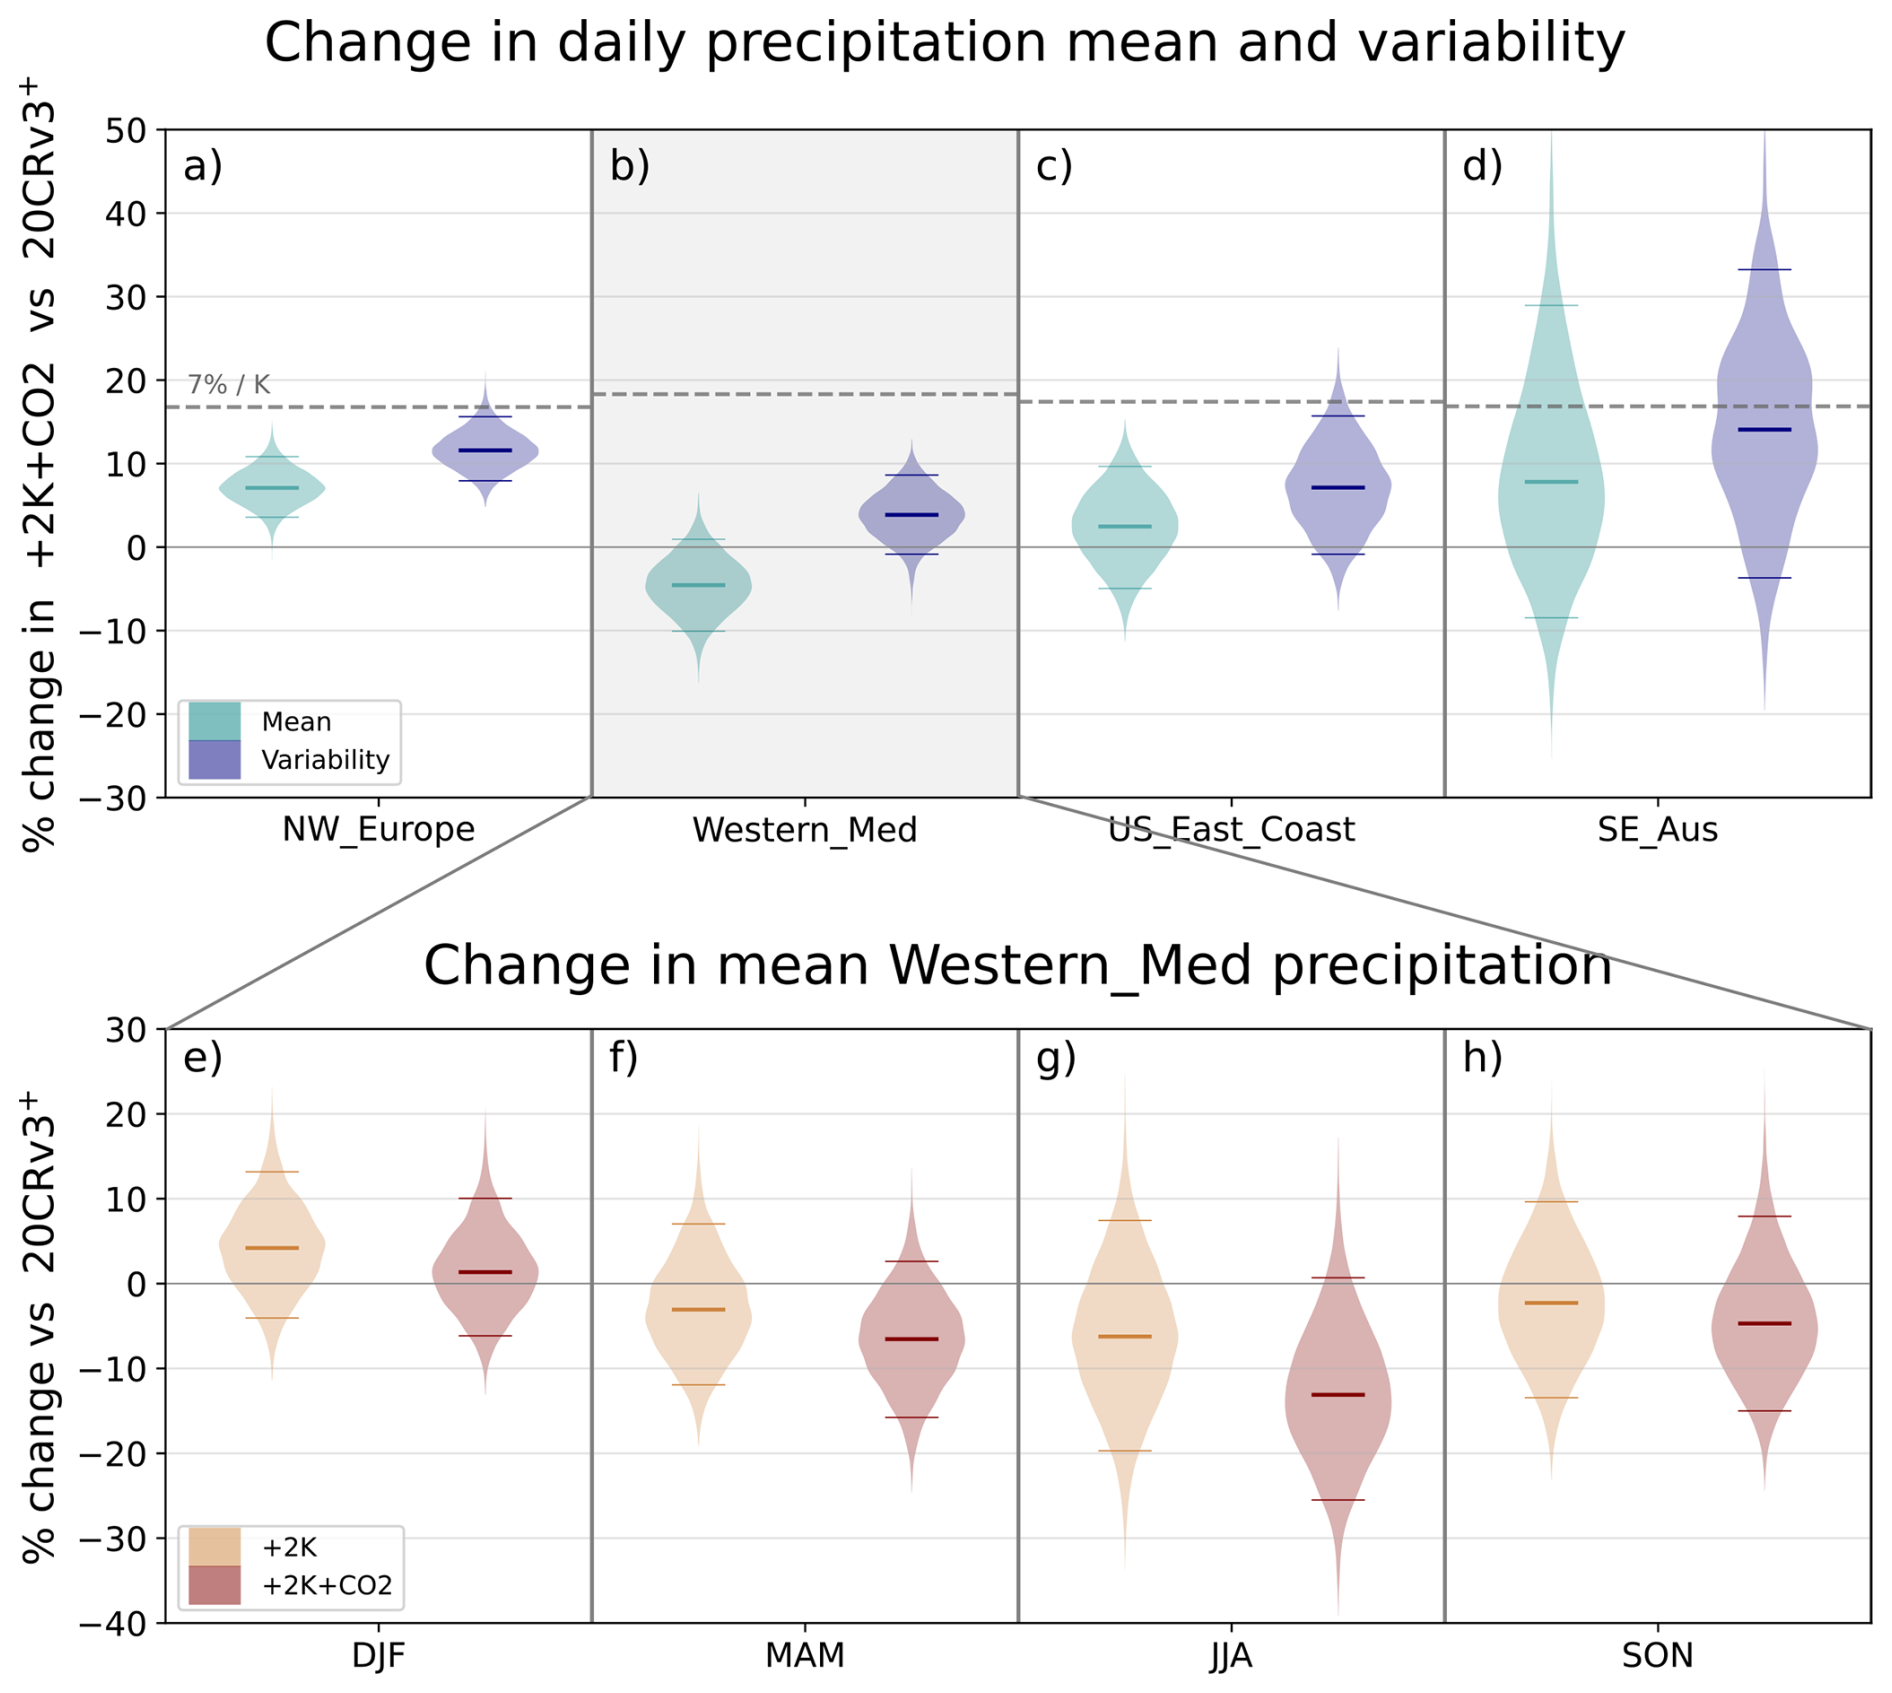
Figure 6(a–d) percentage changes in mean and variability of daily precipitation in the +2 K + CO2 experiment compared to 20CRv3+ across the whole year. Variability is calculated as the standard deviation of daily precipitation. The dashed grey lines indicate the local Clausius-Clapeyron scaling at 7 % K−1. (e–h) Changes in mean Western_Med precipitation in each season compared to 20CRv3+. Each quantity is calculated at each grid cell before being averaged over the region, using all 12 months in each experiment. Only land grid cells are used. The violin bodies show the range of changes possible by resampling the 80 ensemble members in each experiment, and the horizontal violin bars indicate the median, 5th and 95th percentiles.
In contrast to the other regions, mean precipitation declines in Western_Med. This is consistent with climate model experiments which show a reduction in Mediterranean precipitation in response to anthropogenic forcing. Observations also show a decline in Mediterranean precipitation, although at present the forced signal may be difficult to distinguish from multidecadal variability (Vicente-Serrano et al., 2025). In models, precipitation reduction is often associated with poleward expansion of the subtropical dry zones leading to fewer Mediterranean cyclones (Zappa et al., 2015b, a), which is not represented in our experiments. Changes in large-scale circulation are more important in winter (Brogli et al., 2019), whereas the summer precipitation response is due mainly to thermodynamic factors such as changes in humidity and the land/sea warming contrast (Brogli et al., 2019; Barcikowska et al., 2020). We find that the annual-mean change in Fig. 6b is due to reduced rainfall outside winter (Fig. 6f–h), with little change in DJF (Fig. 6e). The reanalysis experiments therefore suggest that local thermodynamic factors can drive a reduction in annual-mean precipitation over the Western Mediterranean, even in the absence of large-scale circulation changes. Figure 6e–h also show that, while the SST warming causes a small increase in winter rainfall but a decrease in the other seasons, the additional CO2 in the +2 K + CO2 experiments always reduces rainfall in our experiments regardless of season. As the SSTs are the same in both warmer world experiments, the main effect of the CO2 is to enhance land warming at the expense of the ocean, potentially leading to reduced relative humidity over land and reduced precipitation.
Despite a decline in total precipitation, daily precipitation variability increases in Western_Med as well as in all other regions, meaning the warmer world experiences larger swings in rainfall from day to day (Fig. 6a–d). An increase in precipitation variability is consistent with modelling and theory (Pendergrass et al., 2017; Zhang et al., 2021) and with trends emerging in observations (Zhang et al., 2024). Variability increases more than the mean in each region, but by less than the availability of moisture as defined by the local Clausius-Clapeyron scaling (grey dashed lines in Fig. 6a–d). Precipitation is proportional to the product of moisture and vertical motion (Sardeshmukh et al., 2015) and so, for fixed vertical motion, precipitation variability scales with moisture availability (Pendergrass et al., 2017). Thus, the lower rate of increase in the warmer world experiment indicates a change in the distribution of vertical motion (Pendergrass and Gerber, 2016). This suggests that, although the synoptic circulation in the reanalysis experiments is constrained by the pressure assimilation, there is some flexibility for the statistics of vertical velocity to change, which may explain why the precipitation amplification in Fig. 2 is less robust than the temperature response.
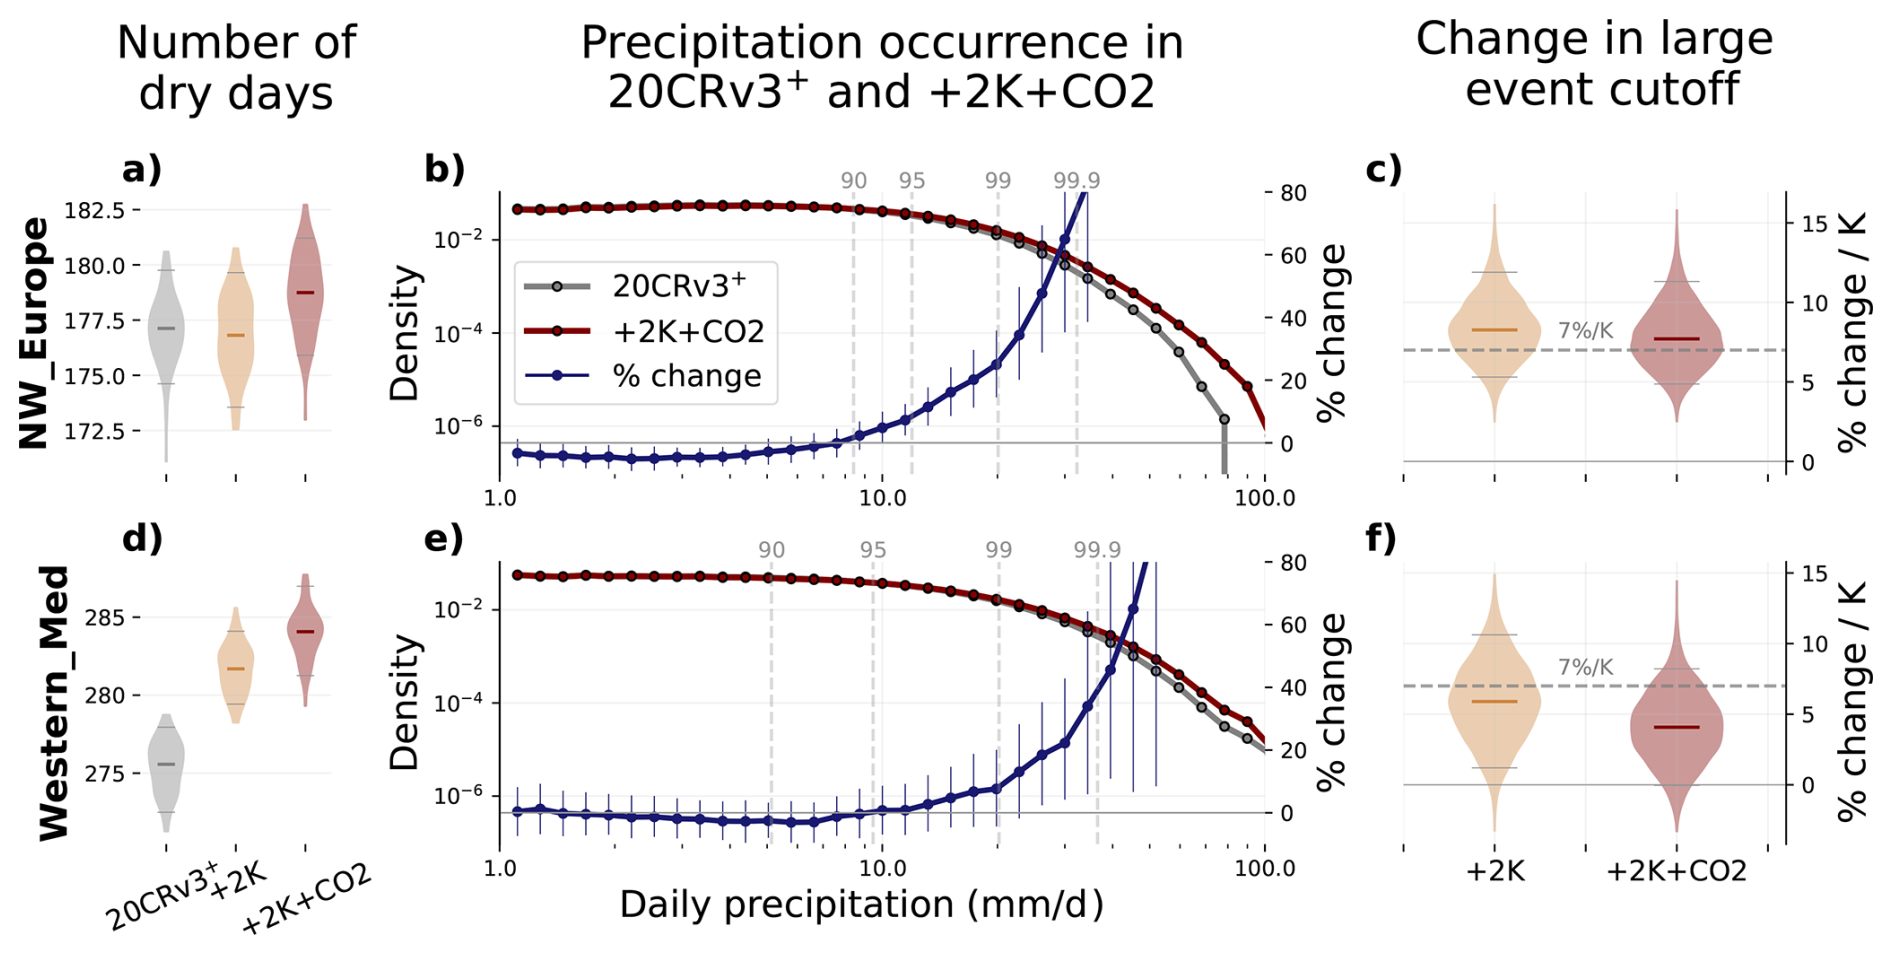
Figure 7Precipitation characteristics of the NW_Europe (a–c) and Western_Med (d–f) regions. (a, d) Number of dry days, defined as days experiencing less than 1 mm of rain (here 1.04 mm due to numerical rounding). The median is shown by the horizontal line and the violin shows the distribution of ensemble members. (b, e) Daily precipitation occurrence in 20CRv3+ and +2 K + CO2. The blue line shows the percentage change in each bin in +2 K + CO2. Error bars show the 10 %–90 % range through sampling all combinations of ensemble members, and vertical dashed lines show percentiles of the precipitation distribution in 20CRv3+. (c, f) Ratio of large event cutoff sL in +2 K + CO2 vs 20CRv3+ (see text). Only land gridcells are used for all calculations. Bins in (b) and (e) are logarithmically distributed with the smallest nonzero bin centred at 1.11 mm d−1 and successive bin widths increasing by 14.7 %.
Daily precipitation densities in the 20CRv3+ and +2 K + CO2 experiments are shown by the grey and red points, respectively, in Fig. 7b and e. The curves follow a similar shape in both NW_Europe and Western_Med (the other regions are shown in Fig. S6), which approximately follow a gamma distribution (Martinez-Villalobos and Neelin, 2018):
where s is daily precipitation size, τ is a power law exponent, and sL is a cutoff scale beyond which occurrence falls exponentially. Warming leads to an increase in sL and therefore larger relative increases in the occurrence of heavier precipitation (Neelin et al., 2017; Martinez-Villalobos and Neelin, 2018). We find sL increases approximately in line with Clausius-Clapeyron scaling in our regions (Figs. 7c and f, and S3c and f). However, this does not mean that the number of days with heavy precipitation also increases by 7 % K−1: instead, the increase is exponential with precipitation rate, as can be seen from the blue curves in Fig. 7b and e which show the percentage change for each precipitation bin. The number of days with moderate to heavy rainfall – above the 90–95th percentile of all days in 20CRv3+ – increases exponentially with precipitation rate in the warmer world.
On the other hand, the number of days with light to moderate rainfall (below the 90–95th percentile in 20CRv3+) decreases slightly in the +2 K + CO2 experiment. The magnitude of these changes is smaller than at heavy rain rates and the sign of change is more uncertain, however the ensemble-mean values show similar characteristics in all four regions (see also Fig. S6b and e). This highlights the counterintuitive point, made previously by Allen and Ingram (2002), that the time-mean precipitation increases seen in previous figures (Figs. 3, 4, 6) occur only on less than 1 d in 10, with most wet days actually becoming drier in the warmer world experiments.
The number of dry days in each experiment is shown in Figs. 7a, d, S4a and d, defined as days experiencing less than 1 mm of rain as in previous studies (here 1.04 mm due to numerical rounding; Polade et al., 2014; Douville et al., 2023). The number of dry days also increases in three of the four regions in +2 K + CO2, with the exception of SE_Australia. The additional CO2 appears to be an important factor for dry days over NW_Europe and Western_Med, but not over US_East_Coast and SE_Australia. Previous studies have also found an increase in the number of dry days in warmer world experiments (Polade et al., 2014), as is also seen on the global scale in the reanalysis experiments (Fig. S4a–c). One possible mechanism for this is a reduction in relative humidity over land leading to increased convective inhibition (CIN) and hence longer intervals between convective events (Dai et al., 2020; Chadwick et al., 2022), although convective precipitation is likely to be less well constrained by the assimilated pressure observations than rain associated with frontal systems.
An advantage of the counterfactual reanalysis experiments is the ability to look at changes in climate impacts over a variety of timescales, as the assimilation process means weather patterns in the warmer world counterfactuals remain close to the original (factual) reanalysis. While short, intense weather events can lead to acute damages, extreme months or seasons, or even sequences of seasons, can also be significant for sectors such as agriculture (Noone et al., 2025). Here we present an example of an event falling between the annual timescales discussed in previous sections and the synoptic timescales that are typically the subject of storyline attribution studies.
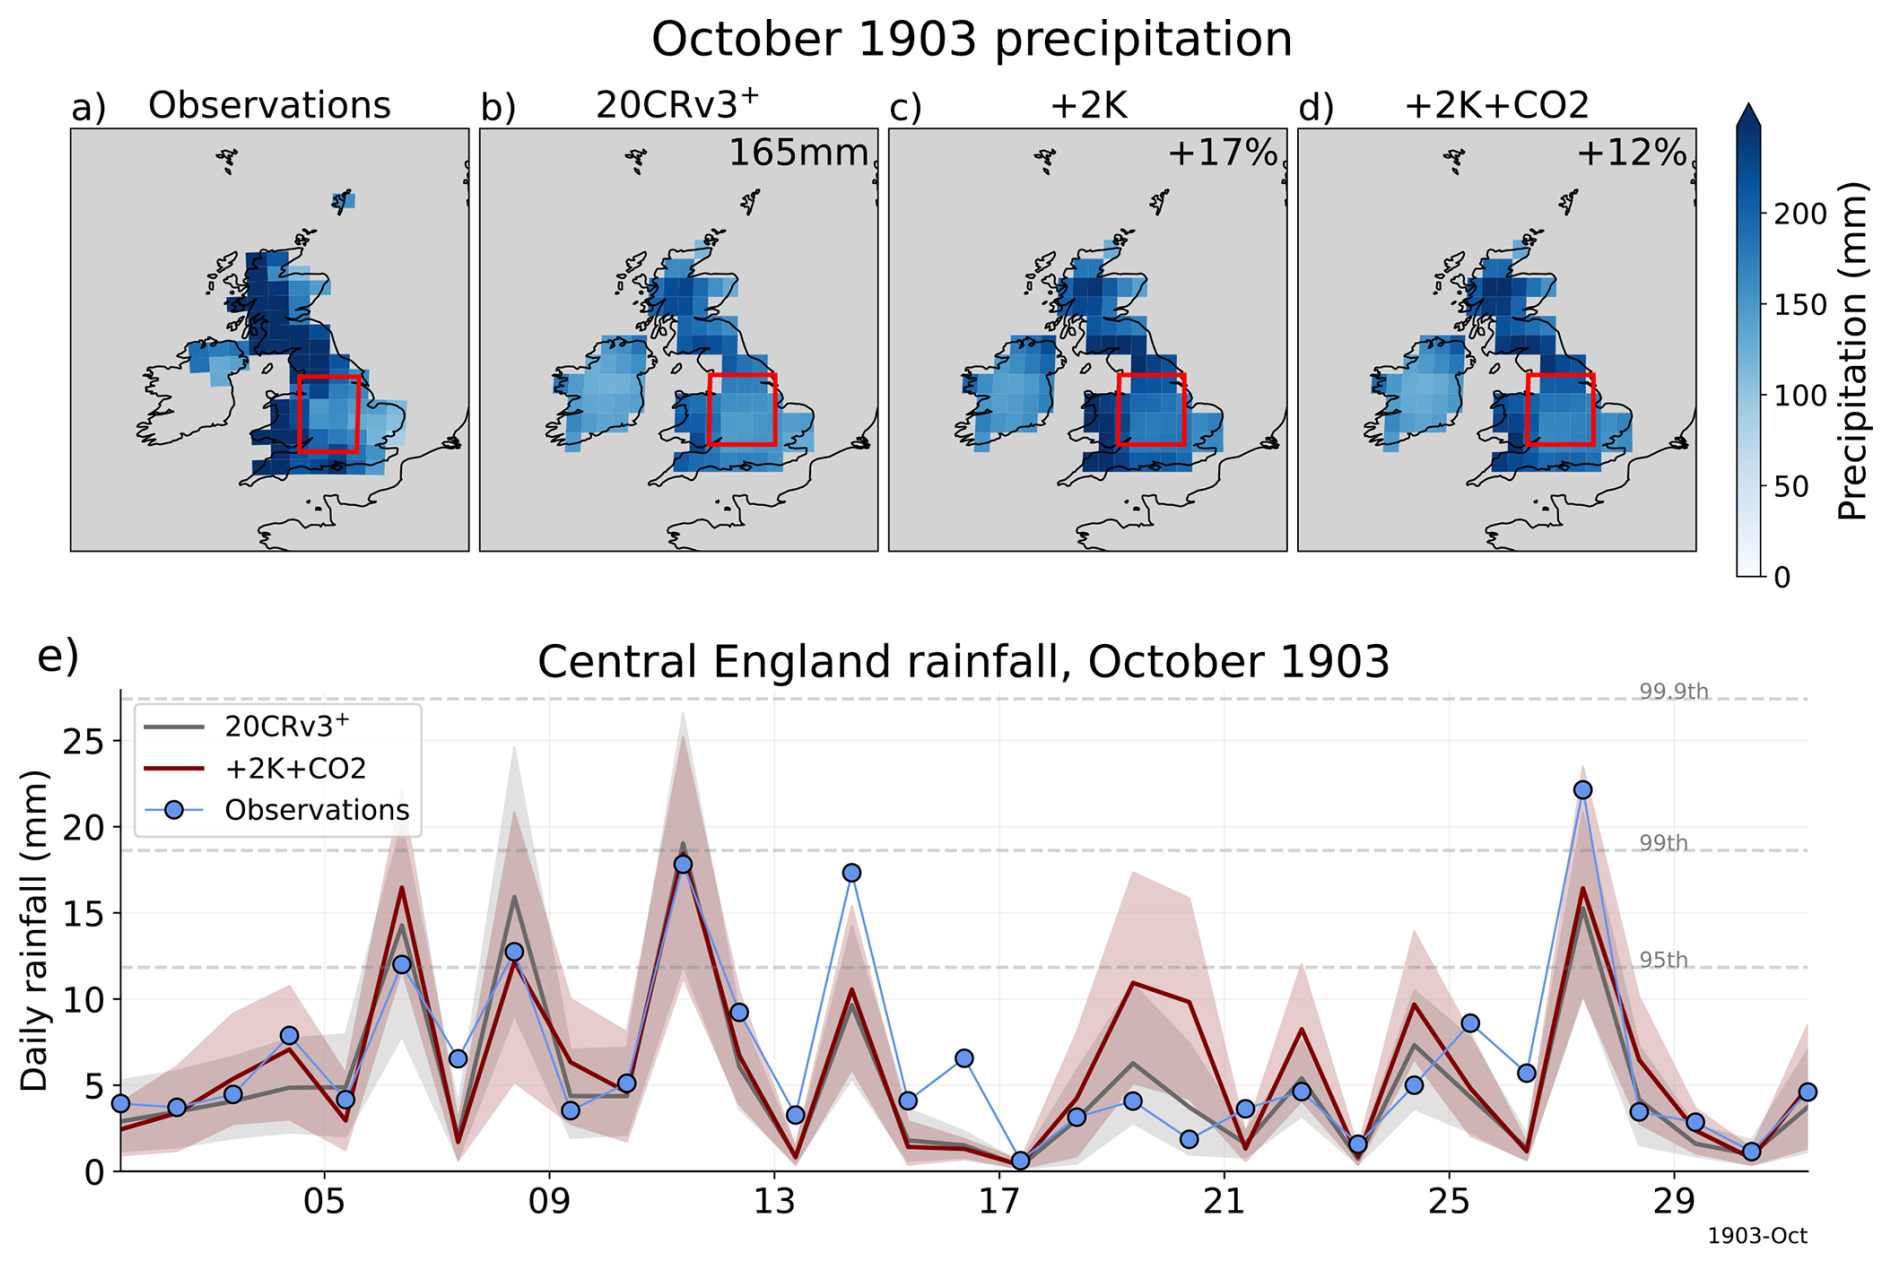
Figure 8October rainfall in (a) observations (HadUKGrid at 60km resolution (Hollis et al., 2019)) and (b–d) the reanalysis experiments. The value in the top right of panel (b) is the average rainfall over the UK and Ireland in 20CRv3+. The corresponding increase compared to 20CRv3+ is shown in the top right of panels (c) and (d). Panel (e) shows daily rainfall over Central England (the red boxed region, also used in Fig. 2; using reanalysis data from 09:00–09:00 UTC to match the observational definition). Shading shows the 10 %–90 % range across the ensemble and grey dashed lines indicate all-year daily rainfall percentiles in 20CRv3+ for 1903. Note that the boxes used to define the Central England region differ by a small amount in the observations compared to the reanalyses due to differences in the grids used (cf. the boxes in panels a and b).
October 1903 is the wettest recorded calendar month for the UK (220.0 mm, in a series back to 1836; Hollis et al., 2019) and in the longer England and Wales Precipitation series (218.1 mm, in a series back to 1766 (Alexander and Jones, 2000)). Figure 8a shows the October 1903 rainfall total in a gridded observational product that interpolates between in-situ measurements (Hollis et al., 2019). Large parts of Wales, Southwest England, and western Scotland recorded rainfall totals exceeding 200 mm. These regions also receive the most rain in 20CRv3+ (Fig. 8b), though the magnitude is smaller in the reanalysis than in the observations. We would not expect perfect quantitative agreement with the observations as the reanalysis grid is too coarse to fully resolve the orography in these regions; similar underestimates are seen over western regions of Great Britain in the case of Storm Ulysses earlier in 1903 (Hawkins et al., 2023a). Output from the reanalysis could be downscaled using regional atmospheric models to better represent rainfall over mountainous regions if desired. Historical daily gridded rainfall observations are rarer outside the UK, so we also validate 20CRv3+ rainfall against station observations from each of the well-observed regions in the Supplement (see Sect. S2 in the Supplement).
Over flatter terrain, the reanalysis is in better agreement with the observations, such as over a less mountainous region in Central England (Fig. 8e). As no rainfall data is assimilated, this represents an additional independent verification of the reanalysis. Daily rainfall is shown in Fig. 8e for comparison with the observations, but the higher frequency rainfall data in the reanalysis reveals several intense, sub-daily rainfall events during October that are obscured in the daily-mean (e.g. the 3 h-rain rate centred at 6 October, 15:00 UTC is 44 mm d−1 in 20CRv3+, Fig. S10).
Both warmer world experiments see increased rainfall over the UK and Ireland (Fig. 8c and d). The increase of 17 % in the +2 K experiment is equivalent to 8.8 % per K of local warming, while the increase of 12 % in +2 K + CO2 is somewhat smaller (equivalent to 6.0 % K−1). These values are substantially larger than the increase in annual-mean precipitation of 3.0 % K−1 over the larger NW_Europe region in the +2 K + CO2 experiment (not shown). The increase in October rainfall over the UK and Ireland is closer to, or even above, the Clausius-Clapeyron scaling seen in extreme daily rainfall events (Fig. 7c). This likely reflects the unusually high occurrence of heavy rainfall events in this month, with 5 distinct events above the all-year 95th percentile of daily precipitation in 20CRv3+ (Fig. 8e). Rainfall totals in extreme months or seasons may therefore scale much more rapidly with warming than the annual-mean.
On sub-daily time scales, the largest changes in October rainfall occur on wet days, whereas rain rates on drier days are comparable in both experiments (Fig. S10). This supports the finding in the previous section that substantial increases in time-mean rainfall can result from increased rainfall in a small number of heavy events. Notably, the warmer world rainfall rate at 6 October, 15:00 UTC is 58 mm d−1, an increase of 31 % over the value in 20CRv3+ or around 15 % K−1 – much greater than Clausius-Clapeyron scaling, as has previously been found for sub-daily rainfall extremes (Lenderink and van Meijgaard, 2008; Guerreiro et al., 2018).
How would the everyday weather of a year from history be experienced in a warmer world? The reanalysis experiments in this paper share the same weather patterns, but by perturbing the SSTs and atmospheric CO2 we can explore how the weather of 1903 would be experienced in a warmer world by residents of four well-observed regions (the boxed regions in Fig. 1). We focus on changes in two key meteorological variables which affect day-to-day perception of the weather: temperature and rainfall. Residents of these regions would experience warmer near-surface temperatures nearly every day, with 99 % of days becoming warmer than in the 20CRv3+ reconstruction of 1903. On a typical day, land areas would be warmer by around 2–2.5 °C for a 2 K ocean surface warming. However, increases of 2.5–3 °C are seen on hot days (temperatures around 20 °C or above), and larger increases of 4–5 °C on days below freezing. The cold day response appears to be due to enhanced absorption of solar radiation by the land surface due to a reduction in snow cover; the warmer world version of 1903 would also be one with substantially less snow and ice. Mechanisms for the hot day response are mixed: in the US_East_Coast region it is linked to reduced evaporative cooling on the hottest days, while changes in cloud cover appear to be more important in the SE_Aus region.
The everyday experience of rainfall would also be different in the warmer world. Even without substantial changes in large-scale weather patterns, annual rainfall would increase in NW_Europe and SE_Australia, decrease in Western_Med, and show little change in US_East_Coast – but in each region, daily rainfall would become more variable, meaning larger rainfall swings from day to day, with implications for infrastructure and adaptation. Even in regions where the total annual rainfall increases, the increase would occur on roughly 1 d in every 10 (that is, on days above the 90th percentile of rainfall). Instead, there would be fewer drizzly days, and in three of the four regions an overall reduction in the number of rainy days when the additional CO2 is included. Conversely, the number of days in the heavier rainfall bins grows exponentially with increasing rain rate.
We find that the October 1903 rainfall total over the UK and Ireland, already the wettest month on record in England and Wales, would be 12 %–17 % higher in a +2 K warmer world. The reanalysis experiments presented here are idealised experiments rather than best estimates of the current climate, however they can give an indication of how much more rain the weather conditions of October 1903 might produce today. If we assume that global temperatures have warmed by 1.5 °C since 1903 (as compared to 2.3 °C in the +2 K + CO2 experiment, Fig. 3a) then we estimate that the weather conditions of October 1903 would produce an extreme UK average rainfall of around 240 mm in the current climate. The next wettest observed month is December 2015 at 216.3 mm (Hollis et al., 2019). Future planned work using patterned SST perturbations and consistent CO2 concentrations will provide better estimates of how the impacts of historical extreme weather events would be different in the current climate. We will also perform additional experiments to translate events into a warmer future climate to inform adaptation planning.
We also find evidence of a direct CO2 effect on everyday weather. Higher atmospheric CO2 leads to enhanced warming of extratropical land than from SST warming alone, contributing 19 % of the total warming over the Western US in the +2 K + CO2 experiment. Higher CO2 levels act to suppress global precipitation and reduce the number of rainy days over NW_Europe, Western_Med, and US_East_Coast.
Our approach shares some of the limitations of other storyline attribution methods. The method in this paper makes two implicit assumptions: (1) that the weather patterns that occurred in 1903 could in principle occur in a world that is 2 K warmer; and (2) that assimilating the 1903 pressure observations with the 20CRv3 system does not lead to inconsistencies when the system's boundary conditions (SST, sea ice, and CO2 levels) are perturbed. We can gain insight into both by comparing the reanalysis assimilation statistics from the 20CRv3+ and +2 K + CO2 experiments. We find that the innovation (i.e. observed value minus first guess) and localisation length scales do not change substantially in the +2 K + CO2 experiment (Figs. S11a–d and S12a–b). However, the assimilation system does reject more pressure observations in +2 K + CO2 than in 20CRv3+ (Figs. S11e–f and S12c). The relative increase is largest in NW_Europe, the region with proportionally the fewest rejections in 20CRv3+, and smallest in SE_Aus. An increase in the number of rejected observations may indicate that the model’s response to the warming causes some inconsistencies with the pressure observations, particularly where the density of observations is high and hence the observational constraint is strongest, as in NW_Europe. Note that tropical cyclone central pressures are assimilated without opportunity for rejection in both experiments.
However, the increased number of rejected observations does not in itself mean that the simulated weather events are necessarily implausible in a warmer world, even if they become slightly less compatible with the model’s own forced circulation response. The atmospheric circulation response to warming is both uncertain theoretically and variable among climate models (Shepherd, 2014), which suggests caution regarding how much weight we assign to the dynamical response in 20CRv3. Even if the particular weather patterns of 1903 were to become less likely in a warmer world, it is difficult to argue that they would be impossible a priori, notwithstanding certain features of the 1903 climate (e.g. the eruption of the Santa Maria volcano in 1902, Fig. S3).
If changes in the atmospheric circulation do occur in future, they could lead to much larger changes in extreme temperature and precipitation, for example if persistent weather patterns were to occur more frequently (Petoukhov et al., 2013; Mann et al., 2017). The reanalysis experiments can thus be considered a strongly conditioned form of attribution, as we consider only the effects of warming that are not related to changes in the large-scale circulation (Thompson et al., 2026). This also means that feedbacks from the warming onto the large-scale circulation are neglected. For example, some studies have suggested that in heat waves arising due to a persistent atmospheric block, soil moisture anomalies can, in certain circumstances, feed back onto the atmospheric circulation pattern itself (Fischer et al., 2007; Merrifield et al., 2019). Temperature increases on the hottest days may thus be higher than estimated in Fig. 5 if the circulation were allowed to respond. On the other hand, assimilating observed surface pressure does not constrain the atmospheric circulation entirely at all time and length scales – for example, the super-CC scaling of short-duration rainfall extremes in October 1903 (Fig. S10) indicate that sub-daily updraft velocities can show large changes, even in well-observed regions. Changes in vertical motion will also affect cloud behaviour, and may contribute to the cloud-mediated amplification of hot days in the SE_Aus region (Fig. S5d). Future work will compare where and how strongly the circulation is constrained in the reanalysis experiments versus other established methods such as spectral nudging (Feser and Shepherd, 2025).
In reality, the dynamics and thermodynamics of the system cannot be cleanly separated, but in studies like ours it allows us to focus our investigation on processes that we think are better represented by the current generation of climate models (thermodynamic effects) than others (such as persistent weather regimes). This can offer insight into the robust physical processes behind regional climate signals. For example, Mediterranean precipitation declines in spring, summer, and autumn in the warmer world experiments, but increases in winter, presumably due to local changes in atmospheric stability and humidity. We also find that, in the absence of shifts in the Mediterranean storm track, seasonality in the Mediterranean precipitation response is driven entirely by SST warming, as the direct effect of increased atmospheric CO2 is to reduce Mediterranean rainfall regardless of season. Other Mediterranean climates are also projected to dry, with atmospheric circulation contributing to the recent Chilean “megadrought” (Garreaud et al., 2017, 2020). Forthcoming experiments will consider the modern period where there are more pressure observations over Chile and other Mediterranean-like climates outside Europe.
This study has presented an exploration of a single year's weather. Our conclusions are restricted to regions with a high density of historical pressure observations, and some may be sensitive to the reanalysis system used – for example, there are longstanding problems in the simulation of light rainfall in numerical models (Chen et al., 2021), which limits confidence in the reduction of light rainfall and overall rainfall occurrence seen in the warmer world experiments. However, it is notable that even in a single year, the reanalysis experiments support changes in rainfall characteristics that have been seen in multiple generations of coupled models (Hennessy et al., 1997; Lau et al., 2013; Pendergrass and Hartmann, 2014b).
Ensemble-means and ensemble-standard deviations for 2 m-temperature and precipitation rate are available for each of the three experiments at https://doi.org/10.5281/zenodo.19949356 (Thomas, 2026). The repository also includes the pressure observation text files used to generate Fig. 1. Individual ensemble members can be provided upon request.
The supplement related to this article is available online at https://doi.org/10.5194/esd-17-1365-2026-supplement.
GPC, SG, and LCS assisted with the design and running of the reanalysis experiments. EH and RT ran the reanalysis experiments. RT analysed the experiments and prepared the paper, with contributions from all co-authors. EH conceived and supervised the project.
The contact author has declared that none of the authors has any competing interests.
Publisher's note: Copernicus Publications remains neutral with regard to jurisdictional claims made in the text, published maps, institutional affiliations, or any other geographical representation in this paper. The authors bear the ultimate responsibility for providing appropriate place names. Views expressed in the text are those of the authors and do not necessarily reflect the views of the publisher.
The authors would like to thank Manoj Joshi for comments on an earlier draft of this work and two anonymous reviewers for their feedback. This work was supported by the UK National Centre for Atmospheric Science. Author GPC was supported in part by the NOAA Physical Sciences Laboratory. Author LS was supported by the NOAA Physical Sciences Laboratory. This work used JASMIN, the UK's collaborative data analysis environment (https://www.jasmin.ac.uk, last access: 16 September 2026; Lawrence et al., 2013), and the ARCHER2 UK National Supercomputing Service (https://www.archer2.ac.uk, last access: 16 September 2026; Beckett et al., 2024).
This research has been funded by the Natural Environment Research Council (grant no. NE/Z000203/1), a Co-Centre award from Research Ireland, Northern Ireland's Department of Agriculture, Environment and Rural Affairs (DAERA) and UK Research and Innovation (UKRI) (grant no. 22/CC/11103), the National Oceanic and Atmospheric Administration (grant no. NA22OAR4320151), and the Cooperative Institute for Earth System Research and Data Science.
This paper was edited by Olivia Martius and reviewed by two anonymous referees.
Alexander, L. V. and Jones, P. D.: Updated precipitation series for the U.K. and discussion of recent extremes, Atmos. Sci. Lett., 1, 142–150, https://doi.org/10.1006/asle.2000.0016, 2000. a
Allen, M. R. and Ingram, W. J.: Constraints on future changes in climate and the hydrologic cycle, Nature, 419, 224–232, https://doi.org/10.1038/nature01092, 2002. a, b, c
Barcikowska, M. J., Kapnick, S. B., Krishnamurty, L., Russo, S., Cherchi, A., and Folland, C. K.: Changes in the future summer Mediterranean climate: contribution of teleconnections and local factors, Earth Syst. Dynam., 11, 161–181, https://doi.org/10.5194/esd-11-161-2020, 2020. a
Beckett, G., Beech-Brandt, J., Leach, K., Payne, Z., Simpson, A., Smith, L., Turner, A., and Whiting, A.: ARCHER2 Service Description, Zenodo [report], https://doi.org/10.5281/zenodo.14507040, 2024. a
Brogli, R., Sørland, S. L., Kröner, N., and Schär, C.: Causes of future Mediterranean precipitation decline depend on the season, Environ. Res. Lett., 14, 114017, https://doi.org/10.1088/1748-9326/ab4438, 2019. a, b
Brogli, R., Heim, C., Mensch, J., Sørland, S. L., and Schär, C.: The pseudo-global-warming (PGW) approach: methodology, software package PGW4ERA5 v1.1, validation, and sensitivity analyses, Geosci. Model Dev., 16, 907–926, https://doi.org/10.5194/gmd-16-907-2023, 2023. a
Byrne, M. P. and O’Gorman, P. A.: Trends in continental temperature and humidity directly linked to ocean warming, P. Natl. Acad. Sci. USA, 115, 4863–4868, https://doi.org/10.1073/pnas.1722312115, 2018. a
Chadwick, R., Pendergrass, A. G., Alves, L. M., and Moise, A.: How Do Regional Distributions of Daily Precipitation Change under Warming?, J. Climate, 35, 3243–3260, https://doi.org/10.1175/JCLI-D-20-0864.1, 2022. a
Chen, D., Dai, A., and Hall, A.: The Convective-To-Total Precipitation Ratio and the “Drizzling” Bias in Climate Models, J. Geophys. Res.-Atmos., 126, e2020JD034198, https://doi.org/10.1029/2020JD034198, 2021. a
Choi, Y.-W., Khalifa, M., and Eltahir, E. A. B.: Climate Change Impact on “Outdoor Days” Over the United States, Geophys. Res. Lett., 51, e2024GL111607, https://doi.org/10.1029/2024GL111607, 2024a. a
Choi, Y.-W., Khalifa, M., and Eltahir, E. A. B.: North–South Disparity in Impact of Climate Change on “Outdoor Days”, J. Climate, 37, 3269–3282, https://doi.org/10.1175/JCLI-D-23-0346.1, 2024b. a, b
Clarke, B., Otto, F., Stuart-Smith, R., and Harrington, L.: Extreme weather impacts of climate change: an attribution perspective, Environ. Res.: Climate, 1, 012001, https://doi.org/10.1088/2752-5295/ac6e7d, 2022. a
Compo, G. P. and Sardeshmukh, P. D.: Oceanic influences on recent continental warming, Clim. Dynam., 32, 333–342, https://doi.org/10.1007/s00382-008-0448-9, 2009. a, b, c
Dai, A., Rasmussen, R. M., Liu, C., Ikeda, K., and Prein, A. F.: A new mechanism for warm-season precipitation response to globalwarming based on convection-permitting simulations, Clim. Dynam., 55, 343–368, https://doi.org/10.1007/s00382-017-3787-6, 2020. a
Douville, H., Chadwick, R., Saint-Lu, M., and Medeiros, B.: Drivers of Dry Day Sensitivity to Increased CO2, Geophys. Res. Lett., 50, e2023GL103200, https://doi.org/10.1029/2023GL103200, 2023. a
Ek, M. B., Mitchell, K. E., Lin, Y., Rogers, E., Grunmann, P., Koren, V., Gayno, G., and Tarpley, J. D.: Implementation of Noah land surface model advances in the National Centers for Environmental Prediction operational mesoscale Eta model, J. Geophys. Res.-Atmos., 108, https://doi.org/10.1029/2002JD003296, 2003. a
Feser, F. and Shepherd, T. G.: The concept of spectrally nudged storylines for extreme event attribution, Commun. Earth Environ., 6, 677, https://doi.org/10.1038/s43247-025-02659-6, 2025. a, b
Fischer, E. M., Seneviratne, S. I., Vidale, P. L., Lüthi, D., and Schär, C.: Soil Moisture–Atmosphere Interactions during the 2003 European Summer Heat Wave, J. Climate, 20, 5081–5099, https://doi.org/10.1175/JCLI4288.1, 2007. a, b, c
Garreaud, R. D., Alvarez-Garreton, C., Barichivich, J., Boisier, J. P., Christie, D., Galleguillos, M., LeQuesne, C., McPhee, J., and Zambrano-Bigiarini, M.: The 2010–2015 megadrought in central Chile: impacts on regional hydroclimate and vegetation, Hydrol. Earth Syst. Sci., 21, 6307–6327, https://doi.org/10.5194/hess-21-6307-2017, 2017. a
Garreaud, R. D., Boisier, J. P., Rondanelli, R., Montecinos, A., Sepúlveda, H. H., and Veloso-Aguila, D.: The Central Chile Mega Drought (2010–2018): A climate dynamics perspective, Int. J. Climatol., 40, 421–439, https://doi.org/10.1002/JOC.6219, 2020. a
Guerreiro, S. B., Fowler, H. J., Barbero, R., Westra, S., Lenderink, G., Blenkinsop, S., Lewis, E., and Li, X.-F.: Detection of continental-scale intensification of hourly rainfall extremes, Nat. Clim. Change, 8, 803–807, https://doi.org/10.1038/s41558-018-0245-3, 2018. a
Hawkins, E., Brohan, P., Burgess, S. N., Burt, S., Compo, G. P., Gray, S. L., Haigh, I. D., Hersbach, H., Kuijjer, K., Martínez-Alvarado, O., McColl, C., Schurer, A. P., Slivinski, L., and Williams, J.: Rescuing historical weather observations improves quantification of severe windstorm risks, Nat. Hazards Earth Syst. Sci., 23, 1465–1482, https://doi.org/10.5194/nhess-23-1465-2023, 2023a. a, b, c, d, e
Hawkins, E., Compo, G. P., and Sardeshmukh, P. D.: ESD Ideas: Translating historical extreme weather events into a warmer world, Earth Syst. Dynam., 14, 1081–1084, https://doi.org/10.5194/esd-14-1081-2023, 2023b. a, b, c
He, J. and Soden, B. J.: A re-examination of the projected subtropical precipitation decline, Nat. Clim. Change, 7, 53–57, https://doi.org/10.1038/nclimate3157, 2017. a
Hennessy, K. J., Gregory, J. M., and Mitchell, J. F. B.: Changes in daily precipitation under enhanced greenhouse conditions, Clim. Dynam., 13, 667–680, https://doi.org/10.1007/s003820050189, 1997. a
Hollis, D., McCarthy, M., Kendon, M., Legg, T., and Simpson, I.: HadUK-Grid – A new UK dataset of gridded climate observations, Geosci. Data J., 6, 151–159, https://doi.org/10.1002/gdj3.78, 2019. a, b, c, d
Kendon, M., Doherty, A., Hollis, D., Carlisle, E., Packman, S., Jevrejeva, S., Matthews, A., Williams, J., Garforth, J., and Sparks, T.: State of the UK Climate in 2024, Int. J. Climatol., 45, e70010, https://doi.org/10.1002/joc.70010, 2025. a
Lau, W. K.-M., Wu, H.-T., and Kim, K.-M.: A canonical response of precipitation characteristics to global warming from CMIP5 models, Geophys. Res. Lett., 40, 3163–3169, https://doi.org/10.1002/grl.50420, 2013. a
Lawrence, B. N., Bennett, V. L., Churchill, J., Juckes, M., Kershaw, P., Pascoe, S., Pepler, S., Pritchard, M., and Stephens, A.: Storing and manipulating environmental big data with JASMIN, in: 2013 IEEE International Conference on Big Data, 68–75, https://doi.org/10.1109/BigData.2013.6691556, 2013. a
Lee, J.-Y., Marotzke, J., Bala, G., Cao, L., Corti, S., Dunne, J., Engelbrecht, F., Fischer, E., Fyfe, J., Jones, C., Maycock, A., Mutemi, J., Ndiaye, O., Panickal, S., and Zhou, T.: Future Global Climate: Scenario-Based Projections and Near-Term Information, in: Climate Change 2021: The Physical Science Basis. Contribution of Working Group I to the Sixth Assessment Report of the Intergovernmental Panel on Climate Change, edited by: Masson-Delmotte, V., Zhai, P., Pirani, A., Connors, S. L., Péan, C., Berger, S., Caud, N., Chen, Y., Goldfarb, L., Gomis, M. I., Huang, M., Leitzell, K., Lonnoy, E., Matthews, J. B. R., Maycock, T. K., Waterfield, T., Yelekçi, O., Yu, R., and Zhou, B., 553–672, Cambridge University Press, https://doi.org/10.1017/9781009157896.006, 2021. a
Legg, T., Packman, S., Caton Harrison, T., and McCarthy, M.: An Update to the Central England Temperature Series – HadCET v2.1, Geosci. Data J., 12, e284, https://doi.org/10.1002/gdj3.284, 2025. a, b
Lenderink, G. and van Meijgaard, E.: Increase in hourly precipitation extremes beyond expectations from temperature changes, Nat. Geosci., 1, 511–514, https://doi.org/10.1038/ngeo262, 2008. a
Lenderink, G., de Vries, H., van Meijgaard, E., de Rooy, W., van Ulft, L., Thompson, V., Qiu, X., and Fowler, H. J.: A pseudo global warming based system to study how climate change affects high impact rainfall events, Weather and Climate Extremes, 49, 100781, https://doi.org/10.1016/j.wace.2025.100781, 2025. a
Lin, L., Ge, E., Chen, C., and Luo, M.: Mild weather changes over China during 1971–2014: Climatology, trends, and interannual variability, Sci. Rep., 9, 2419, https://doi.org/10.1038/s41598-019-38845-8, 2019. a
Mann, M. E., Rahmstorf, S., Kornhuber, K., Steinman, B. A., Miller, S. K., and Coumou, D.: Influence of Anthropogenic Climate Change on Planetary Wave Resonance and Extreme Weather Events, Sci. Rep., 7, 45242, https://doi.org/10.1038/srep45242, 2017. a
Martinez-Villalobos, C. and Neelin, J. D.: Shifts in Precipitation Accumulation Extremes During the Warm Season Over the United States, Geophys. Res. Lett., 45, 8586–8595, https://doi.org/10.1029/2018GL078465, 2018. a, b
Merlis, T. M.: Direct weakening of tropical circulations from masked CO2 radiative forcing, P. Natl. Acad. Sci. USA, 112, 13167–13171, https://doi.org/10.1073/pnas.1508268112, 2015. a
Merrifield, A. L., Simpson, I. R., McKinnon, K. A., Sippel, S., Xie, S.-P., and Deser, C.: Local and Nonlocal Land Surface Influence in European Heatwave Initial Condition Ensembles, Geophys. Res. Lett., 46, 14082–14092, https://doi.org/10.1029/2019GL083945, 2019. a
Morice, C. P., Kennedy, J. J., Rayner, N. A., Winn, J. P., Hogan, E., Killick, R. E., Dunn, R. J. H., Osborn, T. J., Jones, P. D., and Simpson, I. R.: An Updated Assessment of Near-Surface Temperature Change From 1850: The HadCRUT5 Data Set, J. Geophys. Res.-Atmos., 126, e2019JD032361, https://doi.org/10.1029/2019JD032361, 2021. a
Neelin, J. D., Sahany, S., Stechmann, S. N., and Bernstein, D. N.: Global warming precipitation accumulation increases above the current-climate cutoff scale, P. Natl. Acad. Sci. USA, 114, 1258–1263, https://doi.org/10.1073/pnas.1615333114, 2017. a
Noone, C., Noone, S., McClean, D., and Thorne, P.: The Beast from the East and drought of summer 2018: an example of compound event impacts upon Ireland's agricultural sector, Weather, 80, 56–61, https://doi.org/10.1002/wea.4586, 2025. a
Otto, F. E. L., Massey, N., van Oldenborgh, G. J., Jones, R. G., and Allen, M. R.: Reconciling two approaches to attribution of the 2010 Russian heat wave, Geophys. Res. Lett., 39, https://doi.org/10.1029/2011GL050422, 2012. a
O'Gorman, P. A. and Muller, C. J.: How closely do changes in surface and column water vapor follow Clausius–Clapeyron scaling in climate change simulations?, Environ. Res. Lett., 5, 025207, https://doi.org/10.1088/1748-9326/5/2/025207, 2010. a
Pendergrass, A. G.: What precipitation is extreme?, Science, 360, 1072–1073, https://doi.org/10.1126/science.aat1871, 2018. a
Pendergrass, A. G. and Gerber, E. P.: The Rain Is Askew: Two Idealized Models Relating Vertical Velocity and Precipitation Distributions in a Warming World, J. Climate, 29, 6445–6462, https://doi.org/10.1175/JCLI-D-16-0097.1, 2016. a
Pendergrass, A. G. and Hartmann, D. L.: The Atmospheric Energy Constraint on Global-Mean Precipitation Change, J. Climate, 27, 757–768, https://doi.org/10.1175/JCLI-D-13-00163.1, 2014a. a
Pendergrass, A. G. and Hartmann, D. L.: Changes in the Distribution of Rain Frequency and Intensity in Response to Global Warming, J. Climate, 27, 8372–8383, https://doi.org/10.1175/JCLI-D-14-00183.1, 2014b. a
Pendergrass, A. G., Knutti, R., Lehner, F., Deser, C., and Sanderson, B. M.: Precipitation variability increases in a warmer climate, Sci. Rep., 7, 17966, https://doi.org/10.1038/s41598-017-17966-y, 2017. a, b
Pepin, N., Bradley, R. S., Diaz, H. F., Baraer, M., Caceres, E. B., Forsythe, N., Fowler, H., Greenwood, G., Hashmi, M. Z., Liu, X. D., Miller, J. R., Ning, L., Ohmura, A., Palazzi, E., Rangwala, I., Schöner, W., Severskiy, I., Shahgedanova, M., Wang, M. B., Williamson, S. N., Yang, D. Q., and Mountain Research Initiative EDW Working Group: Elevation-dependent warming in mountain regions of the world, Nat. Clim. Change, 5, 424–430, https://doi.org/10.1038/nclimate2563, 2015. a
Petoukhov, V., Rahmstorf, S., Petri, S., and Schellnhuber, H. J.: Quasiresonant amplification of planetary waves and recent Northern Hemisphere weather extremes, P. Natl. Acad. Sci. USA, 110, 5336–5341, https://doi.org/10.1073/pnas.1222000110, 2013. a
Pfahl, S. and Wernli, H.: Quantifying the relevance of atmospheric blocking for co-located temperature extremes in the Northern Hemisphere on (sub-)daily time scales, Geophys. Res. Lett., 39, https://doi.org/10.1029/2012GL052261, 2012. a
Polade, S. D., Pierce, D. W., Cayan, D. R., Gershunov, A., and Dettinger, M. D.: The key role of dry days in changing regional climate and precipitation regimes, Sci. Rep., 4, 4364, https://doi.org/10.1038/srep04364, 2014. a, b
Robock, A.: Volcanic eruptions and climate, Rev. Geophys., 38, 191–219, https://doi.org/10.1029/1998RG000054, 2000. a
Sánchez-Benítez, A., Goessling, H., Pithan, F., Semmler, T., and Jung, T.: The July 2019 European Heat Wave in a Warmer Climate: Storyline Scenarios with a Coupled Model Using Spectral Nudging, J. Climate, 35, 2373–2390, https://doi.org/10.1175/JCLI-D-21-0573.1, 2022. a
Sardeshmukh, P. D., Compo, G. P., and Penland, C.: Need for Caution in Interpreting Extreme Weather Statistics, J. Climate, 28, 9166–9187, https://doi.org/10.1175/JCLI-D-15-0020.1, 2015. a
Sato, T., Kimura, F., and Kitoh, A.: Projection of global warming onto regional precipitation over Mongolia using a regional climate model, J. Hydrol., 333, 144–154, https://doi.org/10.1016/j.jhydrol.2006.07.023, 2007. a
Schär, C., Frei, C., Lüthi, D., and Davies, H. C.: Surrogate climate-change scenarios for regional climate models, Geophys. Res. Lett., 23, 669–672, https://doi.org/10.1029/96GL00265, 1996. a
Self, S., Rampino, M. R., and Barbera, J. J.: The possible effects of large 19th and 20th century volcanic eruptions on zonal and hemispheric surface temperatures, J. Volcanol. Geoth. Res., 11, 41–60, https://doi.org/10.1016/0377-0273(81)90074-3, 1981. a
Semenov, V. and Bengtsson, L.: Secular trends in daily precipitation characteristics: greenhouse gas simulation with a coupled AOGCM, Clim. Dynam., 19, 123–140, https://doi.org/10.1007/s00382-001-0218-4, 2002. a
Seneviratne, S., Zhang, X., Adnan, M., Badi, W., Dereczynski, C., Di Luca, A., Ghosh, S., Iskandar, I., Kossin, J., Lewis, S., Otto, F., Pinto, I., Satoh, M., Vicente-Serrano, S., Wehner, M., and Zhou, B.: Weather and Climate Extreme Events in a Changing Climate, in: Climate Change 2021: The Physical Science Basis. Contribution of Working Group I to the Sixth Assessment Report of the Intergovernmental Panel on Climate Change, 1513–1766, Cambridge University Press, Cambridge, United Kingdom and New York, NY, USA, https://doi.org/10.1017/9781009157896.013, 2021. a
Seneviratne, S. I., Lüthi, D., Litschi, M., and Schär, C.: Land–atmosphere coupling and climate change in Europe, Nature, 443, 205–209, https://doi.org/10.1038/nature05095, 2006. a
Shepherd, T. G.: Atmospheric circulation as a source of uncertainty in climate change projections, Nat. Geosci., 7, 703–708, https://doi.org/10.1038/ngeo2253, 2014. a, b
Shepherd, T. G.: A Common Framework for Approaches to Extreme Event Attribution, Current Climate Change Reports, 2, 28–38, https://doi.org/10.1007/s40641-016-0033-y, 2016. a
Slivinski, L. C., Compo, G. P., Whitaker, J. S., Sardeshmukh, P. D., Giese, B. S., McColl, C., Allan, R., Yin, X., Vose, R., Titchner, H., Kennedy, J., Spencer, L. J., Ashcroft, L., Brönnimann, S., Brunet, M., Camuffo, D., Cornes, R., Cram, T. A., Crouthamel, R., Domínguez-Castro, F., Freeman, J. E., Gergis, J., Hawkins, E., Jones, P. D., Jourdain, S., Kaplan, A., Kubota, H., Blancq, F. L., Lee, T.-C., Lorrey, A., Luterbacher, J., Maugeri, M., Mock, C. J., Moore, G. K., Przybylak, R., Pudmenzky, C., Reason, C., Slonosky, V. C., Smith, C. A., Tinz, B., Trewin, B., Valente, M. A., Wang, X. L., Wilkinson, C., Wood, K., and Wyszyński, P.: Towards a more reliable historical reanalysis: Improvements for version 3 of the Twentieth Century Reanalysis system, Q. J. Roy. Meteor. Soc., 145, 2876–2908, https://doi.org/10.1002/qj.3598, 2019. a, b, c
Stott, P. A., Stone, D. A., and Allen, M. R.: Human contribution to the European heatwave of 2003, Nature, 432, 610–614, https://doi.org/10.1038/nature03089, 2004. a
Sui, C., Yu, L., and Vihma, T.: Occurrence and drivers of wintertime temperature extremes in Northern Europe during 1979–2016, Tellus A, 72, 1–19, https://doi.org/10.1080/16000870.2020.1788368, 2020. a
Sutton, R. T., Dong, B., and Gregory, J. M.: Land/sea warming ratio in response to climate change: IPCC AR4 model results and comparison with observations, Geophys. Res. Lett., 34, https://doi.org/10.1029/2006GL028164, 2007. a
Thomas, R. H.: Reanalysis data for Thomas et al., “Everyday weather in a warmer world”, Zenodo [data set], https://doi.org/10.5281/zenodo.19949356, 2026. a
Thompson, V., Ermis, S., and Athanase, M.: The need for multi-method extreme event attribution, Weather, 81, 40–45, https://doi.org/10.1002/wea.7779, 2026. a
Trenberth, K. E., Fasullo, J., and Smith, L.: Trends and variability in column-integrated atmospheric water vapor, Clim. Dynam., 24, 741–758, https://doi.org/10.1007/s00382-005-0017-4, 2005. a
van der Wiel, K., Kapnick, S. B., and Vecchi, G. A.: Shifting patterns of mild weather in response to projected radiative forcing, Clim. Change, 140, 649–658, https://doi.org/10.1007/s10584-016-1885-9, 2017. a, b
van Garderen, L., Feser, F., and Shepherd, T. G.: A methodology for attributing the role of climate change in extreme events: a global spectrally nudged storyline, Nat. Hazards Earth Syst. Sci., 21, 171–186, https://doi.org/10.5194/nhess-21-171-2021, 2021. a, b
Vicente-Serrano, S. M., Tramblay, Y., Reig, F., González-Hidalgo, J. C., Beguería, S., Brunetti, M., Kalin, K. C., Patalen, L., Kržič, A., Lionello, P., Lima, M. M., Trigo, R. M., El-Kenawy, A. M., Eddenjal, A., Türkes, M., Koutroulis, A., Manara, V., Maugeri, M., Badi, W., Mathbout, S., Bertalanič, R., Bocheva, L., Dabanli, I., Dumitrescu, A., Dubuisson, B., Sahabi-Abed, S., Abdulla, F., Fayad, A., Hodzic, S., Ivanov, M., Radevski, I., Peña-Angulo, D., Lorenzo-Lacruz, J., Domínguez-Castro, F., Gimeno-Sotelo, L., García-Herrera, R., Franquesa, M., Halifa-Marín, A., Adell-Michavila, M., Noguera, I., Barriopedro, D., Garrido-Perez, J. M., Azorin-Molina, C., Andres-Martin, M., Gimeno, L., Nieto, R., Llasat, M. C., Markonis, Y., Selmi, R., Ben Rached, S., Radovanović, S., Soubeyroux, J.-M., Ribes, A., Saidi, M. E., Bataineh, S., El Khalki, E. M., Robaa, S., Boucetta, A., Alsafadi, K., Mamassis, N., Mohammed, S., Fernández-Duque, B., Cheval, S., Moutia, S., Stevkov, A., Stevkova, S., Luna, M. Y., and Potopová, V.: High temporal variability not trend dominates Mediterranean precipitation, Nature, 639, 658–666, https://doi.org/10.1038/s41586-024-08576-6, 2025. a
Wan, N., Lin, X., Pielke Sr., R. A., Zeng, X., and Nelson, A. M.: Global total precipitable water variations and trends over the period 1958–2021, Hydrol. Earth Syst. Sci., 28, 2123–2137, https://doi.org/10.5194/hess-28-2123-2024, 2024. a
Wehrli, K., Guillod, B. P., Hauser, M., Leclair, M., and Seneviratne, S. I.: Identifying Key Driving Processes of Major Recent Heat Waves, J. Geophys. Res.-Atmos., 124, 11746–11765, https://doi.org/10.1029/2019JD030635, 2019. a, b
Wehrli, K., Hauser, M., and Seneviratne, S. I.: Storylines of the 2018 Northern Hemisphere heatwave at pre-industrial and higher global warming levels, Earth Syst. Dynam., 11, 855–873, https://doi.org/10.5194/esd-11-855-2020, 2020. a, b
Zappa, G., Hawcroft, M. K., Shaffrey, L., Black, E., and Brayshaw, D. J.: Extratropical cyclones and the projected decline of winter Mediterranean precipitation in the CMIP5 models, Clim. Dynam., 45, 1727–1738, https://doi.org/10.1007/s00382-014-2426-8, 2015a. a
Zappa, G., Hoskins, B. J., and Shepherd, T. G.: The dependence of wintertime Mediterranean precipitation on the atmospheric circulation response to climate change, Environ. Res. Lett., 10, 104012, https://doi.org/10.1088/1748-9326/10/10/104012, 2015b. a
Zhang, J., You, Q., Ren, G., and Ullah, S.: Projected changes in mild weather frequency over China under a warmer climate, Environ. Res. Lett., 17, 114042, https://doi.org/10.1088/1748-9326/ac9c70, 2022. a
Zhang, W., Furtado, K., Wu, P., Zhou, T., Chadwick, R., Marzin, C., Rostron, J., and Sexton, D.: Increasing precipitation variability on daily-to-multiyear time scales in a warmer world, Sci. Adv., 7, eabf8021, https://doi.org/10.1126/sciadv.abf8021, 2021. a
Zhang, W., Zhou, T., and Wu, P.: Anthropogenic amplification of precipitation variability over the past century, Science, 385, 427–432, https://doi.org/10.1126/science.adp0212, 2024. a
- Abstract
- Introduction
- Reanalysis experiments
- Overview of global changes
- Regional changes in everyday weather
- October 1903: an extreme month
- Discussion and conclusions
- Data availability
- Author contributions
- Competing interests
- Disclaimer
- Acknowledgements
- Financial support
- Review statement
- References
- Supplement
- Abstract
- Introduction
- Reanalysis experiments
- Overview of global changes
- Regional changes in everyday weather
- October 1903: an extreme month
- Discussion and conclusions
- Data availability
- Author contributions
- Competing interests
- Disclaimer
- Acknowledgements
- Financial support
- Review statement
- References
- Supplement