
Articles | Volume 17, issue 5
https://doi.org/10.5194/esd-17-1365-2026
© Author(s) 2026. This work is distributed under
the Creative Commons Attribution 4.0 License.
the Creative Commons Attribution 4.0 License.
https://doi.org/10.5194/esd-17-1365-2026
© Author(s) 2026. This work is distributed under
the Creative Commons Attribution 4.0 License.
the Creative Commons Attribution 4.0 License.
Research article
| 
25 Sep 2026
Research article |
| 25 Sep 2026
| 25 Sep 2026
Everyday weather in a warmer world

National Centre for Atmospheric Science, Department of Meteorology, University of Reading, Reading, UK
Gilbert P. Compo
Cooperative Institute for Research in Environmental Sciences, University of Colorado at Boulder, Boulder, CO, USA
NOAA Physical Sciences Laboratory, Boulder, CO, USA
Steve George
National Centre for Atmospheric Science, Department of Meteorology, University of Reading, Reading, UK
Gabriele C. Hegerl
School of GeoSciences, University of Edinburgh, Edinburgh, UK
Andrew Schurer
School of GeoSciences, University of Edinburgh, Edinburgh, UK
Theodore G. Shepherd
Department of Meteorology, University of Reading, Reading, UK
Laura C. Slivinski
NOAA Physical Sciences Laboratory, Boulder, CO, USA
Vikki Thompson
School of GeoSciences, University of Edinburgh, Edinburgh, UK
Ed Hawkins
National Centre for Atmospheric Science, Department of Meteorology, University of Reading, Reading, UK
Related authors
No articles found.
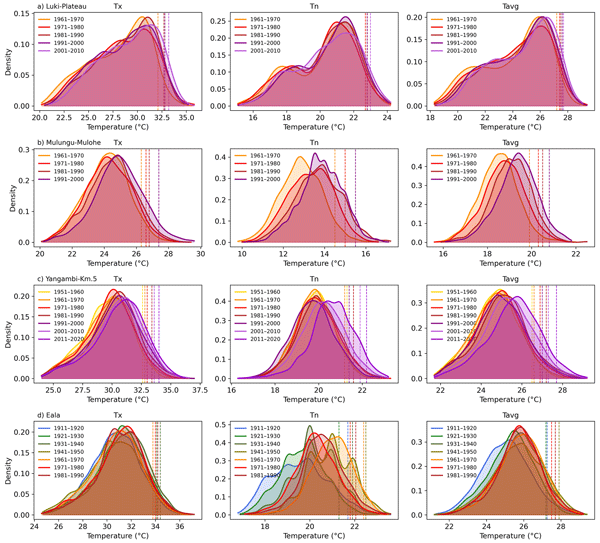
Derrick Muheki, Koen Hufkens, Kim Jacobsen, Hans Verbeeck, Pascal Boeckx, Dominique Kankonde Ntumba, Olivier Kapalay Moulasa, Bas Vercruysse, Julie M. Birkholz, Christophe Verbruggen, Ed Hawkins, Seppe Lampe, Emmanuel Kasongo Yakusu, Fils Makanzu Imwangana, José Mbifo, Théophile Besango Likwela, Félicien Meunier, Olivier Dewitte, Peter Thorne, and Wim Thiery
Earth Syst. Dynam., 17, 1455–1511, https://doi.org/10.5194/esd-17-1455-2026, https://doi.org/10.5194/esd-17-1455-2026, 2026
Short summary
Short summary
The Congo Basin is one of the least studied regions for climate change due to limited accessible data, despite large volumes of historical records stored on paper in archives. In this study, we digitised over 9000 sheets from 37 stations in the Democratic Republic of the Congo, producing more than one million daily weather observations. The results show clear warming since the 1960s, with more hot days and fewer cold days, highlighting the importance of data rescue in data-sparse regions.
Dalena León-FonFay, Theodore G. Shepherd, Linda van Garderen, and Frauke Feser
EGUsphere, https://doi.org/10.5194/egusphere-2026-5459, https://doi.org/10.5194/egusphere-2026-5459, 2026
This preprint is open for discussion and under review for Weather and Climate Dynamics (WCD).
Short summary
Short summary
With a growing interest in using long-term storyline simulations for climate change attribution, we argue that this is not just a longer of storyline analysis, but a new conceptual object placed between a conventional free-running climate model and an event-based storyline. Therefore, we revisit conceptual interpretation of multi-year storyline simulations, examine the implications of viewing them as conditional climate trajectories, and suggest potential applications of this emerging object.
Reinhard K. H. Schiemann, Grenville Lister, Rosalyn Hatcher, Dan Hodson, Bryan Lawrence, Len Shaffrey, Jeff Cole, Andrea Dittus, Jenny Mecking, Jon Robson, Simon Wilson, Yevgeny Aksenov, Adam T. Blaker, Ben Harvey, Oscar Martínez-Alvarado, Annette Osprey, Stephanie Rynders, Sharar Ahmadi, Jake Aylmer, Laura Baker, David Case, Emanuele Silvio Gentile, Steve George, Kevin Hodges, Eliza Karlowska, Charlotte Lang, Hua Lu, Niamh O'Callaghan, Weronika Osmolska, Scott Osprey, Tony Phillips, David Schröder, Robin Smith, Andrew G. Turner, Steve Woolnough, Martin Andrews, Andrew Coward, Steven Hardiman, James Harle, John W. Rostron, David M. H. Sexton, Bablu Sinha, Jonny Williams, and Chris Wilson
EGUsphere, https://doi.org/10.5194/egusphere-2026-2281, https://doi.org/10.5194/egusphere-2026-2281, 2026
This preprint is open for discussion and under review for Geoscientific Model Development (GMD).
Short summary
Short summary
This paper presents a new large ensemble of climate model simulations: The CANARI HadGEM3 Large Ensemble (CANARI LE). The CANARI LE has a comparatively high resolution, provides sub-daily output on atmospheric pressure levels, and boundary conditions for driving regional model simulations. The CANARI LE is thus a community resource that lends itself for the study of physical coupled climate processes, weather systems, and impacts in a changing climate.
Vikki Thompson, Erin Coughlan de Perez, Dorothy Heinrich, Karin van der Wiel, Ed Hawkins, and Andrew Schurer
EGUsphere, https://doi.org/10.5194/egusphere-2026-4100, https://doi.org/10.5194/egusphere-2026-4100, 2026
Short summary
Short summary
Extreme rainfall often cause severe impacts to society including loss of life and damage to property. Places with more recent extreme events or more extreme records may be better prepared for extreme rainfall. Assessing daily rainfall records across Europe, we show where may be better prepared and highlight cities that may be less ready. Sofia, Barcelona, Munich, and Amsterdam are highlighted as at risk. Tailored adaptation policies can ensure readiness for the next extreme rainfall events.
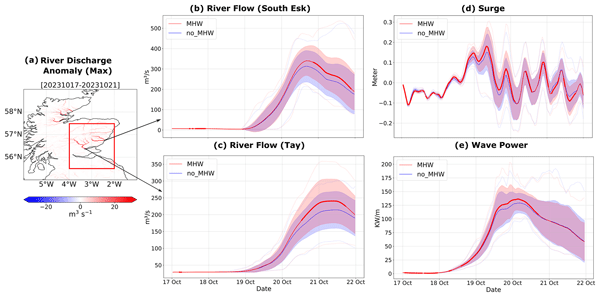
Piyali Goswami, Ségolène Berthou, Theodore G. Shepherd, Ambrogio Volonté, Sana Mahmood, Juan Manuel Castillo, Anne-Christine Péquignet, Yong-June Park, Mark Worsfold, Regina Rodrigues, and Magdalena A. Balmaseda
Nat. Hazards Earth Syst. Sci., 26, 3213–3230, https://doi.org/10.5194/nhess-26-3213-2026, https://doi.org/10.5194/nhess-26-3213-2026, 2026
Short summary
Short summary
We examined how a marine heatwave - period of unusually warm ocean conditions - affected flooding and coastal erosion during a storm in northwest Europe. Using a state-of-the-art regional coupled model at km-scale, we compared simulations with and without the marine heatwave to isolate its effects on the storm hazards. Warmer shallow seas intensified rainfall, winds and surface depression of the storm, which integrated into larger increases of surge, wave power and river flows.
Dorothy Heinrich, Erin Coughlan de Perez, Leanne Archer, Nadia Bloemendaal, Kevin I. Hodges, Helen Hooker, Theodore G. Shepherd, Nathan Sparks, Ralf Toumi, and Elisabeth Stephens
EGUsphere, https://doi.org/10.5194/egusphere-2026-2758, https://doi.org/10.5194/egusphere-2026-2758, 2026
Short summary
Short summary
An unprecedented tropical cyclone (TC) can turn into a disaster if it is unforeseen. In this work, we explore different TC datasets to identify simulated events that could be unprecedented. We look at whether these scenarios could be considered be plausible and how different these would be from past records, and illustrate with examples. We highlight that there is a wealth of scenarios that could be used by disaster managers to imagine and prepare for unprecedented events.
Andrea Rivosecchi, Andrea Dittus, Ed Hawkins, Reinhard Schiemann, and Erich Fischer
EGUsphere, https://doi.org/10.5194/egusphere-2026-1733, https://doi.org/10.5194/egusphere-2026-1733, 2026
Short summary
Short summary
We analysed 250-year global temperature trends under zero CO2 emissions in the UK Earth System Model. Stopping emissions while global temperatures remain below +2 °C limits the post-net-zero mean surface warming. Annual hot extremes cool regionally after zero emissions in the midlatitudes, due to the expansion of evergreen vegetation. However, in this framework vegetation change is largely unconstrained by modern land-use changes, highlighting a potential limitation of idealised model protocols.
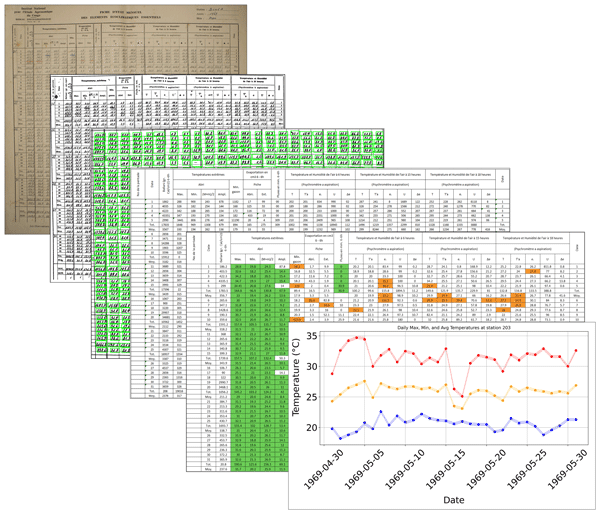
Derrick Muheki, Bas Vercruysse, Krishna Kumar Thirukokaranam Chandrasekar, Christophe Verbruggen, Julie M. Birkholz, Koen Hufkens, Hans Verbeeck, Pascal Boeckx, Seppe Lampe, Ed Hawkins, Peter Thorne, Dominique Kankonde Ntumba, Olivier Kapalay Moulasa, and Wim Thiery
Geosci. Model Dev., 19, 3213–3255, https://doi.org/10.5194/gmd-19-3213-2026, https://doi.org/10.5194/gmd-19-3213-2026, 2026
Short summary
Short summary
Archives worldwide host vast records of observed weather data crucial for understanding climate variability. However, most of these records are still in paper form, limiting their use. To address this, we developed MeteoSaver, an open-source tool, to transcribe these records to machine-readable format. Applied to ten handwritten temperature sheets, it achieved a median accuracy of 74 %. This tool offers a promising solution to preserve records from archives and unlock historical weather insights.
Yongyao Liang, Ed Hawkins, Gerard McCarthy, and Peter Thorne
EGUsphere, https://doi.org/10.5194/egusphere-2026-699, https://doi.org/10.5194/egusphere-2026-699, 2026
Short summary
Short summary
Using novel climate simulations and historical temperature estimates, we separated natural climate fluctuations from externally driven influences. We find that the timing of long-term temperature swings since the mid-nineteenth century is mainly controlled by external factors, while natural variability mostly affects their strength. We also show that biases in early temperature estimates can complicate interpretation of Atlantic Multidecadal Variability.
Peter W. Thorne, John M. Nicklas, John J. Kennedy, Bruce Calvert, Baylor Fox-Kemper, Mark T. Richardson, Adrian Simmons, Ed Hawkins, Robert Rhode, Kathryn Cowtan, Nerilie J. Abram, Axel Andersson, Simon Noone, Phillipe Marbaix, Nathan Lenssen, Dirk Olonscheck, Tristram Walsh, Stephen Outten, Ingo Bethke, Bjorn H. Samset, Chris Smith, Anna Pirani, Jan Fuglestvedt, Lavanya Rajamani, Richard A. Betts, Elizabeth C. Kent, Blair Trewin, Colin Morice, Tim Osborn, Samantha N. Burgess, Oliver Geden, Andrew Parnell, Piers M. Forster, Chris Hewitt, Zeke Hausfather, Valerie Masson-Delmotte, Jochem Marotzke, Nathan Gillett, Sonia I. Seneviratne, Gavin A. Schmidt, Duo Chan, Stefan Brönnimann, Andy Reisinger, Matthew Menne, Maisa Rojas Corradi, Christopher Kadow, Peter Huybers, David B. Stephenson, Emily Wallis, Joeri Rogelj, Andrew Schurer, Karen McKinnon, Panmao Zhai, Fatima Driouech, Wilfran Moufouma Okia, Saeed Vazifehkhah, Sophie Szopa, Christopher J. Merchant, Shoji Hirahara, Masayoshi Ishii, Francois A. Engelbrecht, Qingxiang Li, June-Yi Lee, Alex J. Cannon, Christophe Cassou, Karina von Schuckmann, Amir H. Delju, and Ellie Murtagh
Earth Syst. Sci. Data Discuss., https://doi.org/10.5194/essd-2025-825, https://doi.org/10.5194/essd-2025-825, 2026
Preprint under review for ESSD
Short summary
Short summary
We reassess the basis for determining the present level of long-term global warming. Unbiased estimates of both realised warming and anthropogenic warming are possible that approximate a 20-year retrospective mean. Our resulting estimates of 1.40 [1.23–1.58] °C (realised) and 1.34 [1.18–1.50] °C (anthropogenic) as at end of 2024 highlight the urgency of immediate, far-reaching and sustained climate mitigation actions if we are to meet the long term temperature goal of the Paris Agreement.
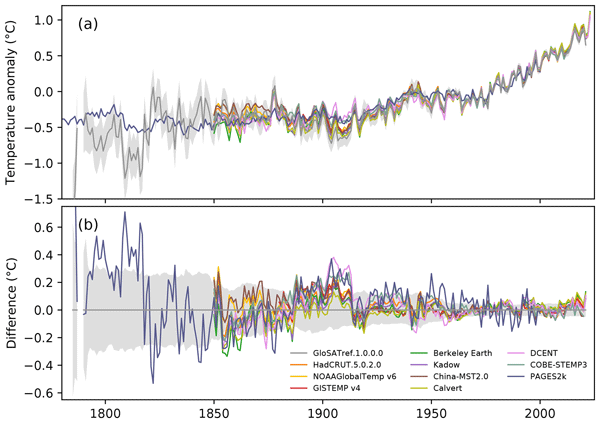
Colin P. Morice, David I. Berry, Richard C. Cornes, Kathryn Cowtan, Thomas Cropper, Ed Hawkins, John J. Kennedy, Timothy J. Osborn, Nick A. Rayner, Beatriz Recinos Rivas, Andrew P. Schurer, Michael Taylor, Praveen R. Teleti, Emily J. Wallis, Jonathan Winn, and Elizabeth C. Kent
Earth Syst. Sci. Data, 17, 7079–7100, https://doi.org/10.5194/essd-17-7079-2025, https://doi.org/10.5194/essd-17-7079-2025, 2025
Short summary
Short summary
We present a new data set of global gridded surface air temperature change extending back to the 1780s. This is achieved using marine air temperature observations with newly available estimates of diurnal-heating biases together with an updated land station database that includes bias adjustments for early thermometer enclosures. These developments allow the data set to extend further into the past than current data sets that use sea surface temperature rather than marine air temperature data.
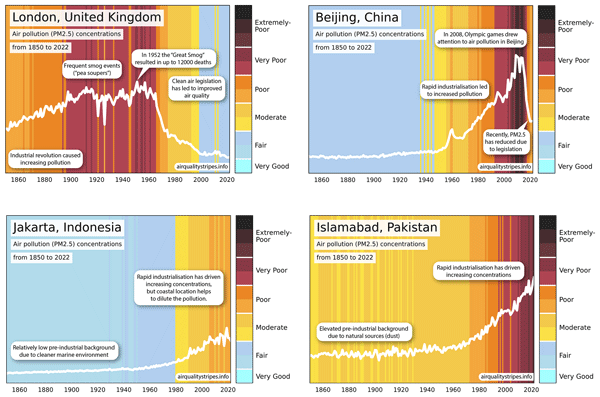
Kirsty J. Pringle, Richard Rigby, Steven T. Turnock, Carly L. Reddington, Meruyert Shayakhmetova, Malcolm Illingworth, Denis Barclay, Neil Chue Hong, Ed Hawkins, Douglas S. Hamilton, Ethan Brain, and James B. McQuaid
Geosci. Commun., 8, 229–236, https://doi.org/10.5194/gc-8-229-2025, https://doi.org/10.5194/gc-8-229-2025, 2025
Short summary
Short summary
The Air Quality Stripes images visualise historical changes in particulate matter air pollution in over 150 cities worldwide. The project celebrates significant improvements in air quality in regions like Europe, North America, and China while highlighting the urgent need for action in areas such as central Asia. Designed to raise awareness, the images aim to inspire discussions about the critical impact of air pollution and the global inequalities it causes.
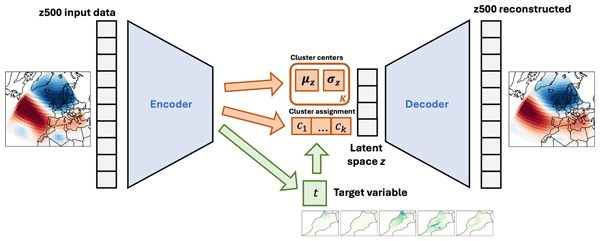
Fiona R. Spuler, Marlene Kretschmer, Magdalena Alonso Balmaseda, Yevgeniya Kovalchuk, and Theodore G. Shepherd
Weather Clim. Dynam., 6, 995–1014, https://doi.org/10.5194/wcd-6-995-2025, https://doi.org/10.5194/wcd-6-995-2025, 2025
Short summary
Short summary
Large-scale atmospheric dynamics modulate the occurrence of extreme events and can improve their prediction. We present a generative machine learning method to identify key dynamical drivers of an impact variable in the form of targeted circulation regimes. Applied to extreme precipitation in Morocco, we show that these targeted regimes are more predictive of the impact while preserving their own predictability and physical consistency.
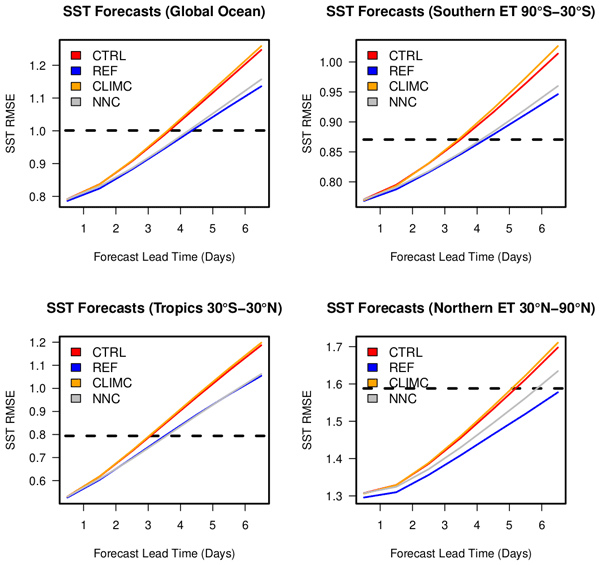
Andrea Storto, Sergey Frolov, Laura Slivinski, and Chunxue Yang
Geosci. Model Dev., 18, 4789–4804, https://doi.org/10.5194/gmd-18-4789-2025, https://doi.org/10.5194/gmd-18-4789-2025, 2025
Short summary
Short summary
Inaccuracies in air–sea heat fluxes severely degrade the accuracy of ocean numerical simulations. Here, we use artificial neural networks to correct air–sea heat fluxes as a function of oceanic and atmospheric state predictors. The correction successfully improves surface and subsurface ocean temperatures beyond the training period and in prediction experiments.
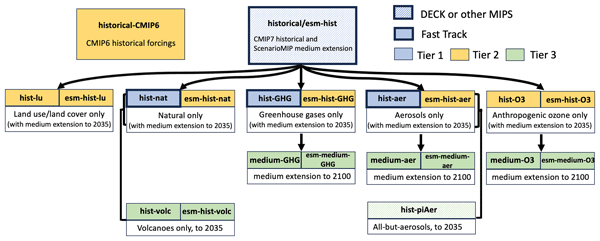
Nathan P. Gillett, Isla R. Simpson, Gabi Hegerl, Reto Knutti, Dann Mitchell, Aurélien Ribes, Hideo Shiogama, Dáithí Stone, Claudia Tebaldi, Piotr Wolski, Wenxia Zhang, and Vivek K. Arora
Geosci. Model Dev., 18, 4399–4416, https://doi.org/10.5194/gmd-18-4399-2025, https://doi.org/10.5194/gmd-18-4399-2025, 2025
Short summary
Short summary
Climate model simulations of the response to human and natural influences together, natural climate influences alone and greenhouse gases alone are key to quantifying human influence on the climate. The last set of such coordinated simulations underpinned key findings in the last Intergovernmental Panel on Climate Change (IPCC) report. Here we propose a new set of such simulations to be used in the next generation of attribution studies and to underpin the next IPCC report.
Ricarda Winkelmann, Donovan P. Dennis, Jonathan F. Donges, Sina Loriani, Ann Kristin Klose, Jesse F. Abrams, Jorge Alvarez-Solas, Torsten Albrecht, David Armstrong McKay, Sebastian Bathiany, Javier Blasco Navarro, Victor Brovkin, Eleanor Burke, Gokhan Danabasoglu, Reik V. Donner, Markus Drüke, Goran Georgievski, Heiko Goelzer, Anna B. Harper, Gabriele Hegerl, Marina Hirota, Aixue Hu, Laura C. Jackson, Colin Jones, Hyungjun Kim, Torben Koenigk, Peter Lawrence, Timothy M. Lenton, Hannah Liddy, José Licón-Saláiz, Maxence Menthon, Marisa Montoya, Jan Nitzbon, Sophie Nowicki, Bette Otto-Bliesner, Francesco Pausata, Stefan Rahmstorf, Karoline Ramin, Alexander Robinson, Johan Rockström, Anastasia Romanou, Boris Sakschewski, Christina Schädel, Steven Sherwood, Robin S. Smith, Norman J. Steinert, Didier Swingedouw, Matteo Willeit, Wilbert Weijer, Richard Wood, Klaus Wyser, and Shuting Yang
EGUsphere, https://doi.org/10.5194/egusphere-2025-1899, https://doi.org/10.5194/egusphere-2025-1899, 2025
Short summary
Short summary
The Tipping Points Modelling Intercomparison Project (TIPMIP) is an international collaborative effort to systematically assess tipping point risks in the Earth system using state-of-the-art coupled and stand-alone domain models. TIPMIP will provide a first global atlas of potential tipping dynamics, respective critical thresholds and key uncertainties, generating an important building block towards a comprehensive scientific basis for policy- and decision-making.
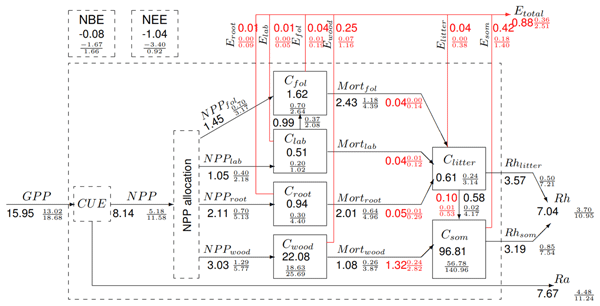
Mathew Williams, David T. Milodowski, T. Luke Smallman, Kyle G. Dexter, Gabi C. Hegerl, Iain M. McNicol, Michael O'Sullivan, Carla M. Roesch, Casey M. Ryan, Stephen Sitch, and Aude Valade
Biogeosciences, 22, 1597–1614, https://doi.org/10.5194/bg-22-1597-2025, https://doi.org/10.5194/bg-22-1597-2025, 2025
Short summary
Short summary
Southern African woodlands are important in both regional and global carbon cycles. A new carbon analysis created by combining satellite data with ecosystem modelling shows that the region has a neutral C balance overall but with important spatial variations. Patterns of biomass and C balance across the region are the outcome of climate controls on production and vegetation–fire interactions, which determine the mortality of vegetation and spatial variations in vegetation function.

Lauren R. Marshall, Anja Schmidt, Andrew P. Schurer, Nathan Luke Abraham, Lucie J. Lücke, Rob Wilson, Kevin J. Anchukaitis, Gabriele C. Hegerl, Ben Johnson, Bette L. Otto-Bliesner, Esther C. Brady, Myriam Khodri, and Kohei Yoshida
Clim. Past, 21, 161–184, https://doi.org/10.5194/cp-21-161-2025, https://doi.org/10.5194/cp-21-161-2025, 2025
Short summary
Short summary
Large volcanic eruptions have caused temperature deviations over the past 1000 years; however, climate model results and reconstructions of surface cooling using tree rings do not match. We explore this mismatch using the latest models and find a better match to tree-ring reconstructions for some eruptions. Our results show that the way in which eruptions are simulated in models matters for the comparison to tree-rings, particularly regarding the spatial spread of volcanic aerosol.
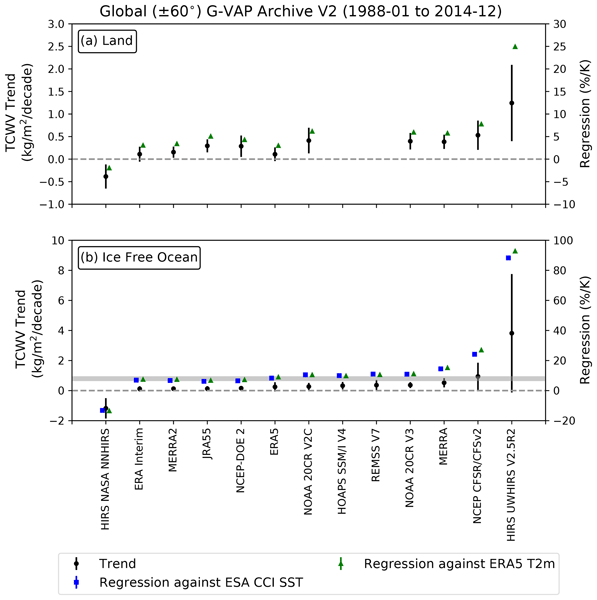
Tim Trent, Marc Schröder, Shu-Peng Ho, Steffen Beirle, Ralf Bennartz, Eva Borbas, Christian Borger, Helene Brogniez, Xavier Calbet, Elisa Castelli, Gilbert P. Compo, Wesley Ebisuzaki, Ulrike Falk, Frank Fell, John Forsythe, Hans Hersbach, Misako Kachi, Shinya Kobayashi, Robert E. Kursinski, Diego Loyola, Zhengzao Luo, Johannes K. Nielsen, Enzo Papandrea, Laurence Picon, Rene Preusker, Anthony Reale, Lei Shi, Laura Slivinski, Joao Teixeira, Tom Vonder Haar, and Thomas Wagner
Atmos. Chem. Phys., 24, 9667–9695, https://doi.org/10.5194/acp-24-9667-2024, https://doi.org/10.5194/acp-24-9667-2024, 2024
Short summary
Short summary
In a warmer future, water vapour will spend more time in the atmosphere, changing global rainfall patterns. In this study, we analysed the performance of 28 water vapour records between 1988 and 2014. We find sensitivity to surface warming generally outside expected ranges, attributed to breakpoints in individual record trends and differing representations of climate variability. The implication is that longer records are required for high confidence in assessing climate trends.
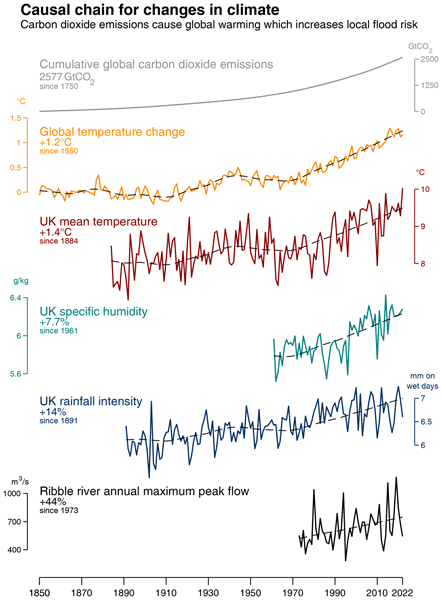
Ed Hawkins, Nigel Arnell, Jamie Hannaford, and Rowan Sutton
Geosci. Commun., 7, 161–165, https://doi.org/10.5194/gc-7-161-2024, https://doi.org/10.5194/gc-7-161-2024, 2024
Short summary
Short summary
Climate change can often seem rather remote, especially when the discussion is about global averages which appear to have little relevance to local experiences. But those global changes are already affecting people, even if they do not fully realise it, and effective communication of this issue is critical. We use long observations and well-understood physical principles to visually highlight how global emissions influence local flood risk in one river basin in the UK.
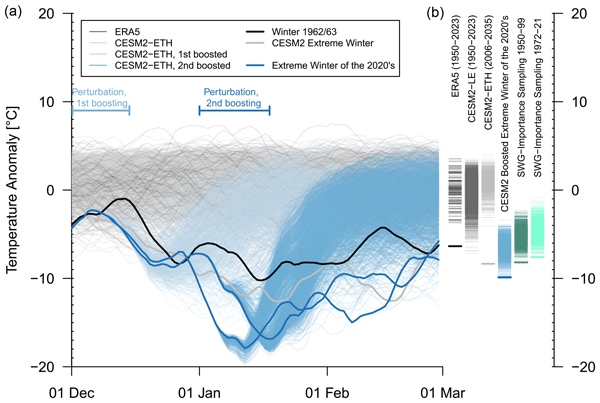
Sebastian Sippel, Clair Barnes, Camille Cadiou, Erich Fischer, Sarah Kew, Marlene Kretschmer, Sjoukje Philip, Theodore G. Shepherd, Jitendra Singh, Robert Vautard, and Pascal Yiou
Weather Clim. Dynam., 5, 943–957, https://doi.org/10.5194/wcd-5-943-2024, https://doi.org/10.5194/wcd-5-943-2024, 2024
Short summary
Short summary
Winter temperatures in central Europe have increased. But cold winters can still cause problems for energy systems, infrastructure, or human health. Here we tested whether a record-cold winter, such as the one observed in 1963 over central Europe, could still occur despite climate change. The answer is yes: it is possible, but it is very unlikely. Our results rely on climate model simulations and statistical rare event analysis. In conclusion, society must be prepared for such cold winters.
Omar V. Müller, Patrick C. McGuire, Pier Luigi Vidale, and Ed Hawkins
Hydrol. Earth Syst. Sci., 28, 2179–2201, https://doi.org/10.5194/hess-28-2179-2024, https://doi.org/10.5194/hess-28-2179-2024, 2024
Short summary
Short summary
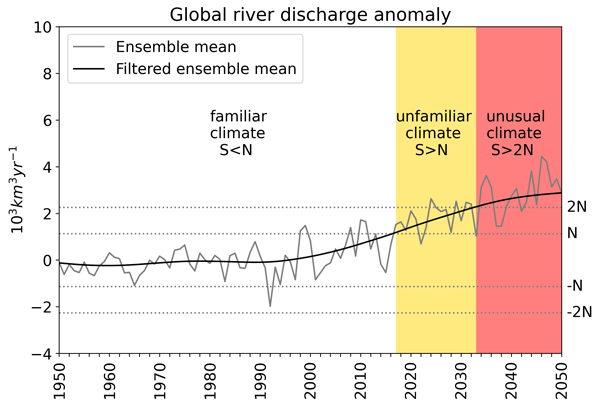
This work evaluates how rivers are projected to change in the near future compared to the recent past in the context of a warming world. We show that important rivers of the world will notably change their flows, mainly during peaks, exceeding the variations that rivers used to exhibit. Such large changes may produce more frequent floods, alter hydropower generation, and potentially affect the ocean's circulation.
Wilson C. H. Chan, Nigel W. Arnell, Geoff Darch, Katie Facer-Childs, Theodore G. Shepherd, and Maliko Tanguy
Nat. Hazards Earth Syst. Sci., 24, 1065–1078, https://doi.org/10.5194/nhess-24-1065-2024, https://doi.org/10.5194/nhess-24-1065-2024, 2024
Short summary
Short summary
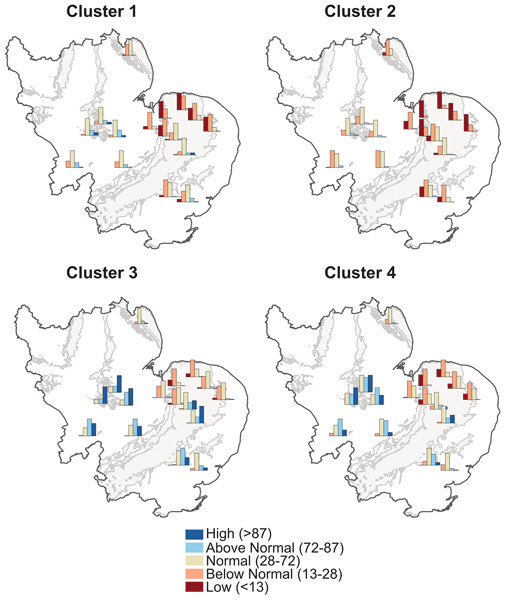
The most recent drought in the UK was declared in summer 2022. We pooled a large sample of plausible winters from seasonal hindcasts and grouped them into four clusters based on their atmospheric circulation configurations. Drought storylines representative of what the drought could have looked like if winter 2022/23 resembled each winter circulation storyline were created to explore counterfactuals of how bad the 2022 drought could have been over winter 2022/23 and beyond.
Ed Hawkins, Gilbert P. Compo, and Prashant D. Sardeshmukh
Earth Syst. Dynam., 14, 1081–1084, https://doi.org/10.5194/esd-14-1081-2023, https://doi.org/10.5194/esd-14-1081-2023, 2023
Short summary
Short summary
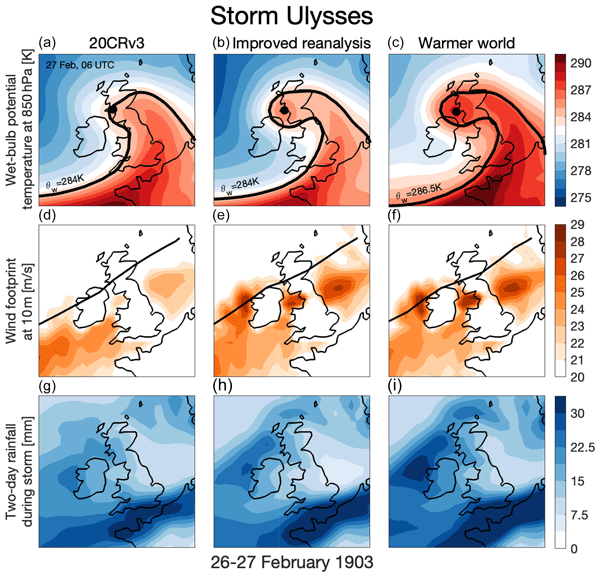
Adapting to climate change requires an understanding of how extreme weather events are changing. We propose a new approach to examine how the consequences of a particular weather pattern have been made worse by climate change, using an example of a severe windstorm that occurred in 1903. When this storm is translated into a warmer world, it produces higher wind speeds and increased rainfall, suggesting that this storm would be more damaging if it occurred today rather than 120 years ago.

Graeme Auld, Gabriele C. Hegerl, and Ioannis Papastathopoulos
Adv. Stat. Clim. Meteorol. Oceanogr., 9, 45–66, https://doi.org/10.5194/ascmo-9-45-2023, https://doi.org/10.5194/ascmo-9-45-2023, 2023
Short summary
Short summary
In this paper we consider the problem of detecting changes in the distribution of the annual maximum temperature, during the years 1950–2018, across Europe.
We find that, on average, the temperature that would be expected to be exceeded
approximately once every 100 years in the 1950 climate is expected to be exceeded once every 6 years in the 2018 climate. This is of concern due to the devastating effects on humans and natural systems that are caused by extreme temperatures.
Lucie J. Lücke, Andrew P. Schurer, Matthew Toohey, Lauren R. Marshall, and Gabriele C. Hegerl
Clim. Past, 19, 959–978, https://doi.org/10.5194/cp-19-959-2023, https://doi.org/10.5194/cp-19-959-2023, 2023
Short summary
Short summary
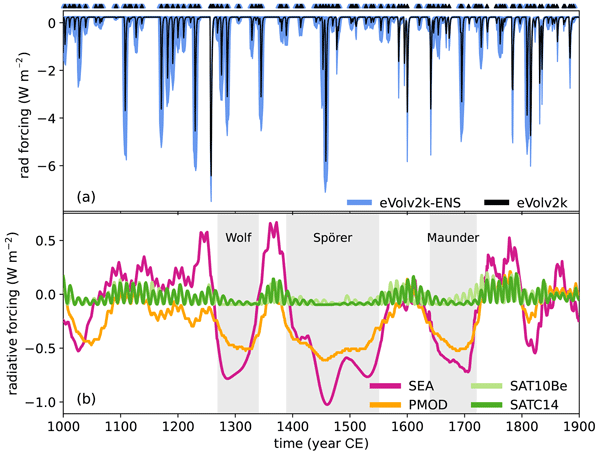
Evidence from tree rings and ice cores provides incomplete information about past volcanic eruptions and the Sun's activity. We model past climate with varying solar and volcanic scenarios and compare it to reconstructed temperature. We confirm that the Sun's influence was small and that uncertain volcanic activity can strongly influence temperature shortly after the eruption. On long timescales, independent data sources closely agree, increasing our confidence in understanding of past climate.

Andrew P. Schurer, Gabriele C. Hegerl, Hugues Goosse, Massimo A. Bollasina, Matthew H. England, Michael J. Mineter, Doug M. Smith, and Simon F. B. Tett
Clim. Past, 19, 943–957, https://doi.org/10.5194/cp-19-943-2023, https://doi.org/10.5194/cp-19-943-2023, 2023
Short summary
Short summary
We adopt an existing data assimilation technique to constrain a model simulation to follow three important modes of variability, the North Atlantic Oscillation, El Niño–Southern Oscillation and the Southern Annular Mode. How it compares to the observed climate is evaluated, with improvements over simulations without data assimilation found over many regions, particularly the tropics, the North Atlantic and Europe, and discrepancies with global cooling following volcanic eruptions are reconciled.
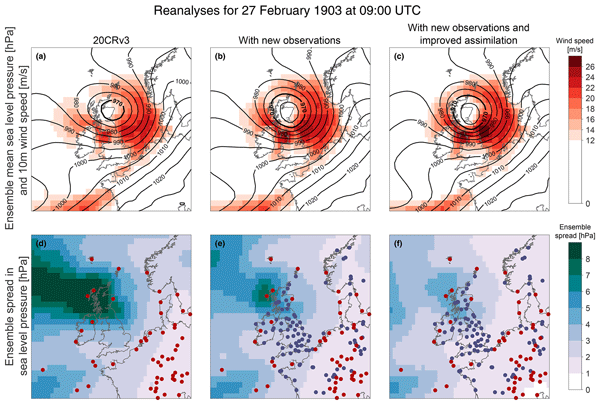
Ed Hawkins, Philip Brohan, Samantha N. Burgess, Stephen Burt, Gilbert P. Compo, Suzanne L. Gray, Ivan D. Haigh, Hans Hersbach, Kiki Kuijjer, Oscar Martínez-Alvarado, Chesley McColl, Andrew P. Schurer, Laura Slivinski, and Joanne Williams
Nat. Hazards Earth Syst. Sci., 23, 1465–1482, https://doi.org/10.5194/nhess-23-1465-2023, https://doi.org/10.5194/nhess-23-1465-2023, 2023
Short summary
Short summary
We examine a severe windstorm that occurred in February 1903 and caused significant damage in the UK and Ireland. Using newly digitized weather observations from the time of the storm, combined with a modern weather forecast model, allows us to determine why this storm caused so much damage. We demonstrate that the event is one of the most severe windstorms to affect this region since detailed records began. The approach establishes a new tool to improve assessments of risk from extreme weather.
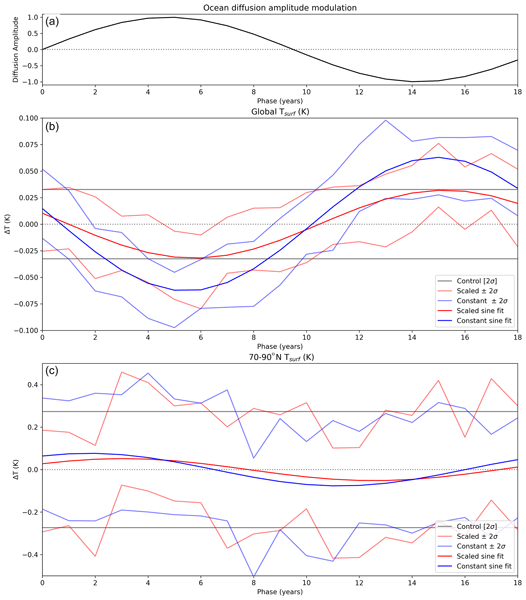
Manoj Joshi, Robert A. Hall, David P. Stevens, and Ed Hawkins
Earth Syst. Dynam., 14, 443–455, https://doi.org/10.5194/esd-14-443-2023, https://doi.org/10.5194/esd-14-443-2023, 2023
Short summary
Short summary
The 18.6-year lunar nodal cycle arises from variations in the angle of the Moon's orbital plane and affects ocean tides. In this work we use a climate model to examine the effect of this cycle on the ocean, surface, and atmosphere. The timing of anomalies is consistent with the so-called slowdown in global warming and has implications for when global temperatures will exceed 1.5 ℃ above pre-industrial levels. Regional anomalies have implications for seasonal climate areas such as Europe.
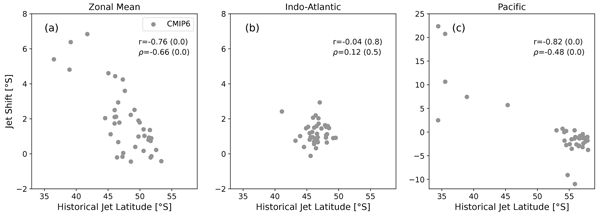
Philipp Breul, Paulo Ceppi, and Theodore G. Shepherd
Weather Clim. Dynam., 4, 39–47, https://doi.org/10.5194/wcd-4-39-2023, https://doi.org/10.5194/wcd-4-39-2023, 2023
Short summary
Short summary
Accurately predicting the response of the midlatitude jet stream to climate change is very important, but models show a variety of possible scenarios. Previous work identified a relationship between climatological jet latitude and future jet shift in the southern hemispheric winter. We show that the relationship does not hold in separate sectors and propose that zonal asymmetries are the ultimate cause in the zonal mean. This questions the usefulness of the relationship.

Jörg Franke, Michael N. Evans, Andrew Schurer, and Gabriele C. Hegerl
Clim. Past, 18, 2583–2597, https://doi.org/10.5194/cp-18-2583-2022, https://doi.org/10.5194/cp-18-2583-2022, 2022
Short summary
Short summary
Detection and attribution is a statistical method to evaluate if external factors or random variability have caused climatic changes. We use for the first time a comparison of simulated and observed tree-ring width that circumvents many limitations of previous studies relying on climate reconstructions. We attribute variability in temperature-limited trees to strong volcanic eruptions and for the first time detect a spatial pattern in the growth of moisture-sensitive trees after eruptions.
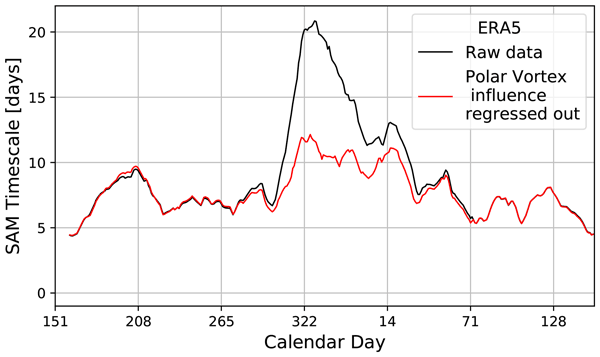
Philipp Breul, Paulo Ceppi, and Theodore G. Shepherd
Weather Clim. Dynam., 3, 645–658, https://doi.org/10.5194/wcd-3-645-2022, https://doi.org/10.5194/wcd-3-645-2022, 2022
Short summary
Short summary
Understanding how the mid-latitude jet stream will respond to a changing climate is highly important. Unfortunately, climate models predict a wide variety of possible responses. Theoretical frameworks can link an internal jet variability timescale to its response. However, we show that stratospheric influence approximately doubles the internal timescale, inflating predicted responses. We demonstrate an approach to account for the stratospheric influence and recover correct response predictions.
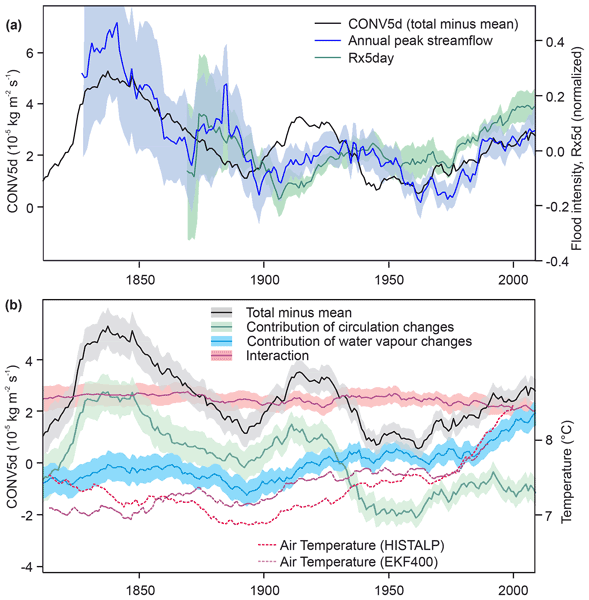
Stefan Brönnimann, Peter Stucki, Jörg Franke, Veronika Valler, Yuri Brugnara, Ralf Hand, Laura C. Slivinski, Gilbert P. Compo, Prashant D. Sardeshmukh, Michel Lang, and Bettina Schaefli
Clim. Past, 18, 919–933, https://doi.org/10.5194/cp-18-919-2022, https://doi.org/10.5194/cp-18-919-2022, 2022
Short summary
Short summary
Floods in Europe vary on time scales of several decades. Flood-rich and flood-poor periods alternate. Recently floods have again become more frequent. Long time series of peak stream flow, precipitation, and atmospheric variables reveal that until around 1980, these changes were mostly due to changes in atmospheric circulation. However, in recent decades the role of increasing atmospheric moisture due to climate warming has become more important and is now the main driver of flood changes.
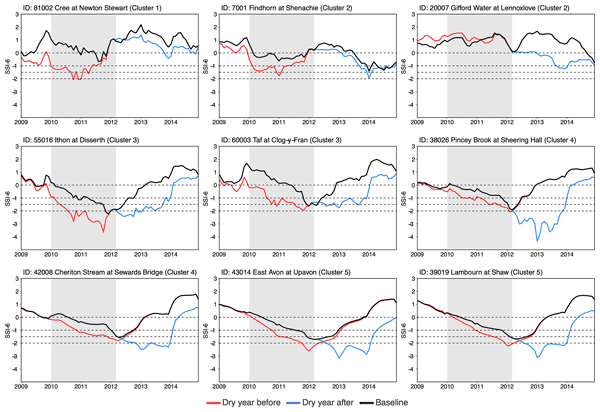
Wilson C. H. Chan, Theodore G. Shepherd, Katie Facer-Childs, Geoff Darch, and Nigel W. Arnell
Hydrol. Earth Syst. Sci., 26, 1755–1777, https://doi.org/10.5194/hess-26-1755-2022, https://doi.org/10.5194/hess-26-1755-2022, 2022
Short summary
Short summary
We select the 2010–2012 UK drought and investigate an alternative unfolding of the drought from changes to its attributes. We created storylines of drier preconditions, alternative seasonal contributions, a third dry winter, and climate change. Storylines of the 2010–2012 drought show alternative situations that could have resulted in worse conditions than observed. Event-based storylines exploring plausible situations are used that may lead to high impacts and help stress test existing systems.

Beatriz M. Monge-Sanz, Alessio Bozzo, Nicholas Byrne, Martyn P. Chipperfield, Michail Diamantakis, Johannes Flemming, Lesley J. Gray, Robin J. Hogan, Luke Jones, Linus Magnusson, Inna Polichtchouk, Theodore G. Shepherd, Nils Wedi, and Antje Weisheimer
Atmos. Chem. Phys., 22, 4277–4302, https://doi.org/10.5194/acp-22-4277-2022, https://doi.org/10.5194/acp-22-4277-2022, 2022
Short summary
Short summary
The stratosphere is emerging as one of the keys to improve tropospheric weather and climate predictions. This study provides evidence of the role the stratospheric ozone layer plays in improving weather predictions at different timescales. Using a new ozone modelling approach suitable for high-resolution global models that provide operational forecasts from days to seasons, we find significant improvements in stratospheric meteorological fields and stratosphere–troposphere coupling.
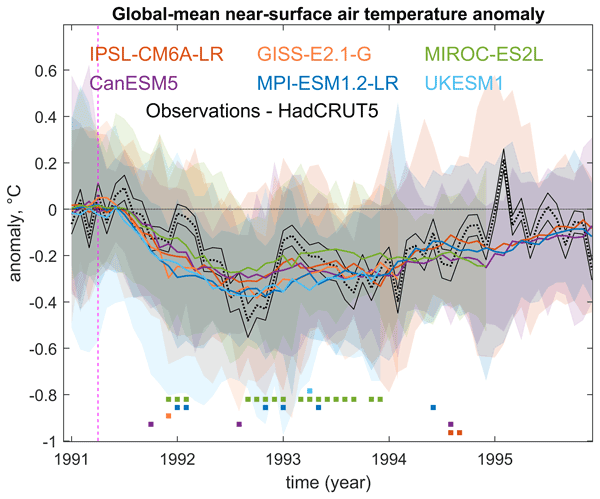
Davide Zanchettin, Claudia Timmreck, Myriam Khodri, Anja Schmidt, Matthew Toohey, Manabu Abe, Slimane Bekki, Jason Cole, Shih-Wei Fang, Wuhu Feng, Gabriele Hegerl, Ben Johnson, Nicolas Lebas, Allegra N. LeGrande, Graham W. Mann, Lauren Marshall, Landon Rieger, Alan Robock, Sara Rubinetti, Kostas Tsigaridis, and Helen Weierbach
Geosci. Model Dev., 15, 2265–2292, https://doi.org/10.5194/gmd-15-2265-2022, https://doi.org/10.5194/gmd-15-2265-2022, 2022
Short summary
Short summary
This paper provides metadata and first analyses of the volc-pinatubo-full experiment of CMIP6-VolMIP. Results from six Earth system models reveal significant differences in radiative flux anomalies that trace back to different implementations of volcanic forcing. Surface responses are in contrast overall consistent across models, reflecting the large spread due to internal variability. A second phase of VolMIP shall consider both aspects toward improved protocol for volc-pinatubo-full.
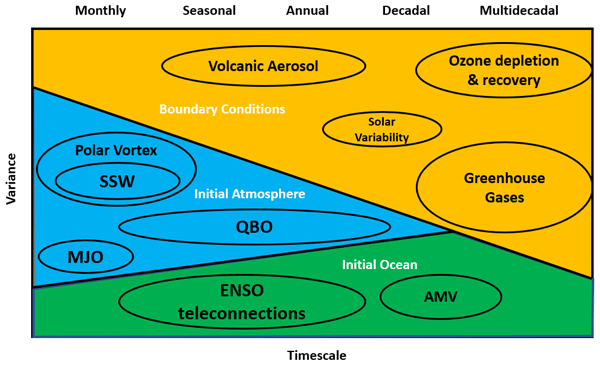
Adam A. Scaife, Mark P. Baldwin, Amy H. Butler, Andrew J. Charlton-Perez, Daniela I. V. Domeisen, Chaim I. Garfinkel, Steven C. Hardiman, Peter Haynes, Alexey Yu Karpechko, Eun-Pa Lim, Shunsuke Noguchi, Judith Perlwitz, Lorenzo Polvani, Jadwiga H. Richter, John Scinocca, Michael Sigmond, Theodore G. Shepherd, Seok-Woo Son, and David W. J. Thompson
Atmos. Chem. Phys., 22, 2601–2623, https://doi.org/10.5194/acp-22-2601-2022, https://doi.org/10.5194/acp-22-2601-2022, 2022
Short summary
Short summary
Great progress has been made in computer modelling and simulation of the whole climate system, including the stratosphere. Since the late 20th century we also gained a much clearer understanding of how the stratosphere interacts with the lower atmosphere. The latest generation of numerical prediction systems now explicitly represents the stratosphere and its interaction with surface climate, and here we review its role in long-range predictions and projections from weeks to decades ahead.
Cited articles
Alexander, L. V. and Jones, P. D.: Updated precipitation series for the U.K. and discussion of recent extremes, Atmos. Sci. Lett., 1, 142–150, https://doi.org/10.1006/asle.2000.0016, 2000. a
Allen, M. R. and Ingram, W. J.: Constraints on future changes in climate and the hydrologic cycle, Nature, 419, 224–232, https://doi.org/10.1038/nature01092, 2002. a, b, c
Barcikowska, M. J., Kapnick, S. B., Krishnamurty, L., Russo, S., Cherchi, A., and Folland, C. K.: Changes in the future summer Mediterranean climate: contribution of teleconnections and local factors, Earth Syst. Dynam., 11, 161–181, https://doi.org/10.5194/esd-11-161-2020, 2020. a
Beckett, G., Beech-Brandt, J., Leach, K., Payne, Z., Simpson, A., Smith, L., Turner, A., and Whiting, A.: ARCHER2 Service Description, Zenodo [report], https://doi.org/10.5281/zenodo.14507040, 2024. a
Brogli, R., Sørland, S. L., Kröner, N., and Schär, C.: Causes of future Mediterranean precipitation decline depend on the season, Environ. Res. Lett., 14, 114017, https://doi.org/10.1088/1748-9326/ab4438, 2019. a, b
Brogli, R., Heim, C., Mensch, J., Sørland, S. L., and Schär, C.: The pseudo-global-warming (PGW) approach: methodology, software package PGW4ERA5 v1.1, validation, and sensitivity analyses, Geosci. Model Dev., 16, 907–926, https://doi.org/10.5194/gmd-16-907-2023, 2023. a
Byrne, M. P. and O’Gorman, P. A.: Trends in continental temperature and humidity directly linked to ocean warming, P. Natl. Acad. Sci. USA, 115, 4863–4868, https://doi.org/10.1073/pnas.1722312115, 2018. a
Chadwick, R., Pendergrass, A. G., Alves, L. M., and Moise, A.: How Do Regional Distributions of Daily Precipitation Change under Warming?, J. Climate, 35, 3243–3260, https://doi.org/10.1175/JCLI-D-20-0864.1, 2022. a
Chen, D., Dai, A., and Hall, A.: The Convective-To-Total Precipitation Ratio and the “Drizzling” Bias in Climate Models, J. Geophys. Res.-Atmos., 126, e2020JD034198, https://doi.org/10.1029/2020JD034198, 2021. a
Choi, Y.-W., Khalifa, M., and Eltahir, E. A. B.: Climate Change Impact on “Outdoor Days” Over the United States, Geophys. Res. Lett., 51, e2024GL111607, https://doi.org/10.1029/2024GL111607, 2024a. a
Choi, Y.-W., Khalifa, M., and Eltahir, E. A. B.: North–South Disparity in Impact of Climate Change on “Outdoor Days”, J. Climate, 37, 3269–3282, https://doi.org/10.1175/JCLI-D-23-0346.1, 2024b. a, b
Clarke, B., Otto, F., Stuart-Smith, R., and Harrington, L.: Extreme weather impacts of climate change: an attribution perspective, Environ. Res.: Climate, 1, 012001, https://doi.org/10.1088/2752-5295/ac6e7d, 2022. a
Compo, G. P. and Sardeshmukh, P. D.: Oceanic influences on recent continental warming, Clim. Dynam., 32, 333–342, https://doi.org/10.1007/s00382-008-0448-9, 2009. a, b, c
Dai, A., Rasmussen, R. M., Liu, C., Ikeda, K., and Prein, A. F.: A new mechanism for warm-season precipitation response to globalwarming based on convection-permitting simulations, Clim. Dynam., 55, 343–368, https://doi.org/10.1007/s00382-017-3787-6, 2020. a
Douville, H., Chadwick, R., Saint-Lu, M., and Medeiros, B.: Drivers of Dry Day Sensitivity to Increased CO2, Geophys. Res. Lett., 50, e2023GL103200, https://doi.org/10.1029/2023GL103200, 2023. a
Ek, M. B., Mitchell, K. E., Lin, Y., Rogers, E., Grunmann, P., Koren, V., Gayno, G., and Tarpley, J. D.: Implementation of Noah land surface model advances in the National Centers for Environmental Prediction operational mesoscale Eta model, J. Geophys. Res.-Atmos., 108, https://doi.org/10.1029/2002JD003296, 2003. a
Feser, F. and Shepherd, T. G.: The concept of spectrally nudged storylines for extreme event attribution, Commun. Earth Environ., 6, 677, https://doi.org/10.1038/s43247-025-02659-6, 2025. a, b
Fischer, E. M., Seneviratne, S. I., Vidale, P. L., Lüthi, D., and Schär, C.: Soil Moisture–Atmosphere Interactions during the 2003 European Summer Heat Wave, J. Climate, 20, 5081–5099, https://doi.org/10.1175/JCLI4288.1, 2007. a, b, c
Garreaud, R. D., Alvarez-Garreton, C., Barichivich, J., Boisier, J. P., Christie, D., Galleguillos, M., LeQuesne, C., McPhee, J., and Zambrano-Bigiarini, M.: The 2010–2015 megadrought in central Chile: impacts on regional hydroclimate and vegetation, Hydrol. Earth Syst. Sci., 21, 6307–6327, https://doi.org/10.5194/hess-21-6307-2017, 2017. a
Garreaud, R. D., Boisier, J. P., Rondanelli, R., Montecinos, A., Sepúlveda, H. H., and Veloso-Aguila, D.: The Central Chile Mega Drought (2010–2018): A climate dynamics perspective, Int. J. Climatol., 40, 421–439, https://doi.org/10.1002/JOC.6219, 2020. a
Guerreiro, S. B., Fowler, H. J., Barbero, R., Westra, S., Lenderink, G., Blenkinsop, S., Lewis, E., and Li, X.-F.: Detection of continental-scale intensification of hourly rainfall extremes, Nat. Clim. Change, 8, 803–807, https://doi.org/10.1038/s41558-018-0245-3, 2018. a
Hawkins, E., Brohan, P., Burgess, S. N., Burt, S., Compo, G. P., Gray, S. L., Haigh, I. D., Hersbach, H., Kuijjer, K., Martínez-Alvarado, O., McColl, C., Schurer, A. P., Slivinski, L., and Williams, J.: Rescuing historical weather observations improves quantification of severe windstorm risks, Nat. Hazards Earth Syst. Sci., 23, 1465–1482, https://doi.org/10.5194/nhess-23-1465-2023, 2023a. a, b, c, d, e
Hawkins, E., Compo, G. P., and Sardeshmukh, P. D.: ESD Ideas: Translating historical extreme weather events into a warmer world, Earth Syst. Dynam., 14, 1081–1084, https://doi.org/10.5194/esd-14-1081-2023, 2023b. a, b, c
He, J. and Soden, B. J.: A re-examination of the projected subtropical precipitation decline, Nat. Clim. Change, 7, 53–57, https://doi.org/10.1038/nclimate3157, 2017. a
Hennessy, K. J., Gregory, J. M., and Mitchell, J. F. B.: Changes in daily precipitation under enhanced greenhouse conditions, Clim. Dynam., 13, 667–680, https://doi.org/10.1007/s003820050189, 1997. a
Hollis, D., McCarthy, M., Kendon, M., Legg, T., and Simpson, I.: HadUK-Grid – A new UK dataset of gridded climate observations, Geosci. Data J., 6, 151–159, https://doi.org/10.1002/gdj3.78, 2019. a, b, c, d
Kendon, M., Doherty, A., Hollis, D., Carlisle, E., Packman, S., Jevrejeva, S., Matthews, A., Williams, J., Garforth, J., and Sparks, T.: State of the UK Climate in 2024, Int. J. Climatol., 45, e70010, https://doi.org/10.1002/joc.70010, 2025. a
Lau, W. K.-M., Wu, H.-T., and Kim, K.-M.: A canonical response of precipitation characteristics to global warming from CMIP5 models, Geophys. Res. Lett., 40, 3163–3169, https://doi.org/10.1002/grl.50420, 2013. a
Lawrence, B. N., Bennett, V. L., Churchill, J., Juckes, M., Kershaw, P., Pascoe, S., Pepler, S., Pritchard, M., and Stephens, A.: Storing and manipulating environmental big data with JASMIN, in: 2013 IEEE International Conference on Big Data, 68–75, https://doi.org/10.1109/BigData.2013.6691556, 2013. a
Lee, J.-Y., Marotzke, J., Bala, G., Cao, L., Corti, S., Dunne, J., Engelbrecht, F., Fischer, E., Fyfe, J., Jones, C., Maycock, A., Mutemi, J., Ndiaye, O., Panickal, S., and Zhou, T.: Future Global Climate: Scenario-Based Projections and Near-Term Information, in: Climate Change 2021: The Physical Science Basis. Contribution of Working Group I to the Sixth Assessment Report of the Intergovernmental Panel on Climate Change, edited by: Masson-Delmotte, V., Zhai, P., Pirani, A., Connors, S. L., Péan, C., Berger, S., Caud, N., Chen, Y., Goldfarb, L., Gomis, M. I., Huang, M., Leitzell, K., Lonnoy, E., Matthews, J. B. R., Maycock, T. K., Waterfield, T., Yelekçi, O., Yu, R., and Zhou, B., 553–672, Cambridge University Press, https://doi.org/10.1017/9781009157896.006, 2021. a
Legg, T., Packman, S., Caton Harrison, T., and McCarthy, M.: An Update to the Central England Temperature Series – HadCET v2.1, Geosci. Data J., 12, e284, https://doi.org/10.1002/gdj3.284, 2025. a, b
Lenderink, G. and van Meijgaard, E.: Increase in hourly precipitation extremes beyond expectations from temperature changes, Nat. Geosci., 1, 511–514, https://doi.org/10.1038/ngeo262, 2008. a
Lenderink, G., de Vries, H., van Meijgaard, E., de Rooy, W., van Ulft, L., Thompson, V., Qiu, X., and Fowler, H. J.: A pseudo global warming based system to study how climate change affects high impact rainfall events, Weather and Climate Extremes, 49, 100781, https://doi.org/10.1016/j.wace.2025.100781, 2025. a
Lin, L., Ge, E., Chen, C., and Luo, M.: Mild weather changes over China during 1971–2014: Climatology, trends, and interannual variability, Sci. Rep., 9, 2419, https://doi.org/10.1038/s41598-019-38845-8, 2019. a
Mann, M. E., Rahmstorf, S., Kornhuber, K., Steinman, B. A., Miller, S. K., and Coumou, D.: Influence of Anthropogenic Climate Change on Planetary Wave Resonance and Extreme Weather Events, Sci. Rep., 7, 45242, https://doi.org/10.1038/srep45242, 2017. a
Martinez-Villalobos, C. and Neelin, J. D.: Shifts in Precipitation Accumulation Extremes During the Warm Season Over the United States, Geophys. Res. Lett., 45, 8586–8595, https://doi.org/10.1029/2018GL078465, 2018. a, b
Merlis, T. M.: Direct weakening of tropical circulations from masked CO2 radiative forcing, P. Natl. Acad. Sci. USA, 112, 13167–13171, https://doi.org/10.1073/pnas.1508268112, 2015. a
Merrifield, A. L., Simpson, I. R., McKinnon, K. A., Sippel, S., Xie, S.-P., and Deser, C.: Local and Nonlocal Land Surface Influence in European Heatwave Initial Condition Ensembles, Geophys. Res. Lett., 46, 14082–14092, https://doi.org/10.1029/2019GL083945, 2019. a
Morice, C. P., Kennedy, J. J., Rayner, N. A., Winn, J. P., Hogan, E., Killick, R. E., Dunn, R. J. H., Osborn, T. J., Jones, P. D., and Simpson, I. R.: An Updated Assessment of Near-Surface Temperature Change From 1850: The HadCRUT5 Data Set, J. Geophys. Res.-Atmos., 126, e2019JD032361, https://doi.org/10.1029/2019JD032361, 2021. a
Neelin, J. D., Sahany, S., Stechmann, S. N., and Bernstein, D. N.: Global warming precipitation accumulation increases above the current-climate cutoff scale, P. Natl. Acad. Sci. USA, 114, 1258–1263, https://doi.org/10.1073/pnas.1615333114, 2017. a
Noone, C., Noone, S., McClean, D., and Thorne, P.: The Beast from the East and drought of summer 2018: an example of compound event impacts upon Ireland's agricultural sector, Weather, 80, 56–61, https://doi.org/10.1002/wea.4586, 2025. a
Otto, F. E. L., Massey, N., van Oldenborgh, G. J., Jones, R. G., and Allen, M. R.: Reconciling two approaches to attribution of the 2010 Russian heat wave, Geophys. Res. Lett., 39, https://doi.org/10.1029/2011GL050422, 2012. a
O'Gorman, P. A. and Muller, C. J.: How closely do changes in surface and column water vapor follow Clausius–Clapeyron scaling in climate change simulations?, Environ. Res. Lett., 5, 025207, https://doi.org/10.1088/1748-9326/5/2/025207, 2010. a
Pendergrass, A. G.: What precipitation is extreme?, Science, 360, 1072–1073, https://doi.org/10.1126/science.aat1871, 2018. a
Pendergrass, A. G. and Gerber, E. P.: The Rain Is Askew: Two Idealized Models Relating Vertical Velocity and Precipitation Distributions in a Warming World, J. Climate, 29, 6445–6462, https://doi.org/10.1175/JCLI-D-16-0097.1, 2016. a
Pendergrass, A. G. and Hartmann, D. L.: The Atmospheric Energy Constraint on Global-Mean Precipitation Change, J. Climate, 27, 757–768, https://doi.org/10.1175/JCLI-D-13-00163.1, 2014a. a
Pendergrass, A. G. and Hartmann, D. L.: Changes in the Distribution of Rain Frequency and Intensity in Response to Global Warming, J. Climate, 27, 8372–8383, https://doi.org/10.1175/JCLI-D-14-00183.1, 2014b. a
Pendergrass, A. G., Knutti, R., Lehner, F., Deser, C., and Sanderson, B. M.: Precipitation variability increases in a warmer climate, Sci. Rep., 7, 17966, https://doi.org/10.1038/s41598-017-17966-y, 2017. a, b
Pepin, N., Bradley, R. S., Diaz, H. F., Baraer, M., Caceres, E. B., Forsythe, N., Fowler, H., Greenwood, G., Hashmi, M. Z., Liu, X. D., Miller, J. R., Ning, L., Ohmura, A., Palazzi, E., Rangwala, I., Schöner, W., Severskiy, I., Shahgedanova, M., Wang, M. B., Williamson, S. N., Yang, D. Q., and Mountain Research Initiative EDW Working Group: Elevation-dependent warming in mountain regions of the world, Nat. Clim. Change, 5, 424–430, https://doi.org/10.1038/nclimate2563, 2015. a
Petoukhov, V., Rahmstorf, S., Petri, S., and Schellnhuber, H. J.: Quasiresonant amplification of planetary waves and recent Northern Hemisphere weather extremes, P. Natl. Acad. Sci. USA, 110, 5336–5341, https://doi.org/10.1073/pnas.1222000110, 2013. a
Pfahl, S. and Wernli, H.: Quantifying the relevance of atmospheric blocking for co-located temperature extremes in the Northern Hemisphere on (sub-)daily time scales, Geophys. Res. Lett., 39, https://doi.org/10.1029/2012GL052261, 2012. a
Polade, S. D., Pierce, D. W., Cayan, D. R., Gershunov, A., and Dettinger, M. D.: The key role of dry days in changing regional climate and precipitation regimes, Sci. Rep., 4, 4364, https://doi.org/10.1038/srep04364, 2014. a, b
Robock, A.: Volcanic eruptions and climate, Rev. Geophys., 38, 191–219, https://doi.org/10.1029/1998RG000054, 2000. a
Sánchez-Benítez, A., Goessling, H., Pithan, F., Semmler, T., and Jung, T.: The July 2019 European Heat Wave in a Warmer Climate: Storyline Scenarios with a Coupled Model Using Spectral Nudging, J. Climate, 35, 2373–2390, https://doi.org/10.1175/JCLI-D-21-0573.1, 2022. a
Sardeshmukh, P. D., Compo, G. P., and Penland, C.: Need for Caution in Interpreting Extreme Weather Statistics, J. Climate, 28, 9166–9187, https://doi.org/10.1175/JCLI-D-15-0020.1, 2015. a
Sato, T., Kimura, F., and Kitoh, A.: Projection of global warming onto regional precipitation over Mongolia using a regional climate model, J. Hydrol., 333, 144–154, https://doi.org/10.1016/j.jhydrol.2006.07.023, 2007. a
Schär, C., Frei, C., Lüthi, D., and Davies, H. C.: Surrogate climate-change scenarios for regional climate models, Geophys. Res. Lett., 23, 669–672, https://doi.org/10.1029/96GL00265, 1996. a
Self, S., Rampino, M. R., and Barbera, J. J.: The possible effects of large 19th and 20th century volcanic eruptions on zonal and hemispheric surface temperatures, J. Volcanol. Geoth. Res., 11, 41–60, https://doi.org/10.1016/0377-0273(81)90074-3, 1981. a
Semenov, V. and Bengtsson, L.: Secular trends in daily precipitation characteristics: greenhouse gas simulation with a coupled AOGCM, Clim. Dynam., 19, 123–140, https://doi.org/10.1007/s00382-001-0218-4, 2002. a
Seneviratne, S., Zhang, X., Adnan, M., Badi, W., Dereczynski, C., Di Luca, A., Ghosh, S., Iskandar, I., Kossin, J., Lewis, S., Otto, F., Pinto, I., Satoh, M., Vicente-Serrano, S., Wehner, M., and Zhou, B.: Weather and Climate Extreme Events in a Changing Climate, in: Climate Change 2021: The Physical Science Basis. Contribution of Working Group I to the Sixth Assessment Report of the Intergovernmental Panel on Climate Change, 1513–1766, Cambridge University Press, Cambridge, United Kingdom and New York, NY, USA, https://doi.org/10.1017/9781009157896.013, 2021. a
Seneviratne, S. I., Lüthi, D., Litschi, M., and Schär, C.: Land–atmosphere coupling and climate change in Europe, Nature, 443, 205–209, https://doi.org/10.1038/nature05095, 2006. a
Shepherd, T. G.: Atmospheric circulation as a source of uncertainty in climate change projections, Nat. Geosci., 7, 703–708, https://doi.org/10.1038/ngeo2253, 2014. a, b
Shepherd, T. G.: A Common Framework for Approaches to Extreme Event Attribution, Current Climate Change Reports, 2, 28–38, https://doi.org/10.1007/s40641-016-0033-y, 2016. a
Slivinski, L. C., Compo, G. P., Whitaker, J. S., Sardeshmukh, P. D., Giese, B. S., McColl, C., Allan, R., Yin, X., Vose, R., Titchner, H., Kennedy, J., Spencer, L. J., Ashcroft, L., Brönnimann, S., Brunet, M., Camuffo, D., Cornes, R., Cram, T. A., Crouthamel, R., Domínguez-Castro, F., Freeman, J. E., Gergis, J., Hawkins, E., Jones, P. D., Jourdain, S., Kaplan, A., Kubota, H., Blancq, F. L., Lee, T.-C., Lorrey, A., Luterbacher, J., Maugeri, M., Mock, C. J., Moore, G. K., Przybylak, R., Pudmenzky, C., Reason, C., Slonosky, V. C., Smith, C. A., Tinz, B., Trewin, B., Valente, M. A., Wang, X. L., Wilkinson, C., Wood, K., and Wyszyński, P.: Towards a more reliable historical reanalysis: Improvements for version 3 of the Twentieth Century Reanalysis system, Q. J. Roy. Meteor. Soc., 145, 2876–2908, https://doi.org/10.1002/qj.3598, 2019. a, b, c
Stott, P. A., Stone, D. A., and Allen, M. R.: Human contribution to the European heatwave of 2003, Nature, 432, 610–614, https://doi.org/10.1038/nature03089, 2004. a
Sui, C., Yu, L., and Vihma, T.: Occurrence and drivers of wintertime temperature extremes in Northern Europe during 1979–2016, Tellus A, 72, 1–19, https://doi.org/10.1080/16000870.2020.1788368, 2020. a
Sutton, R. T., Dong, B., and Gregory, J. M.: Land/sea warming ratio in response to climate change: IPCC AR4 model results and comparison with observations, Geophys. Res. Lett., 34, https://doi.org/10.1029/2006GL028164, 2007. a
Thomas, R. H.: Reanalysis data for Thomas et al., “Everyday weather in a warmer world”, Zenodo [data set], https://doi.org/10.5281/zenodo.19949356, 2026. a
Thompson, V., Ermis, S., and Athanase, M.: The need for multi-method extreme event attribution, Weather, 81, 40–45, https://doi.org/10.1002/wea.7779, 2026. a
Trenberth, K. E., Fasullo, J., and Smith, L.: Trends and variability in column-integrated atmospheric water vapor, Clim. Dynam., 24, 741–758, https://doi.org/10.1007/s00382-005-0017-4, 2005. a
van der Wiel, K., Kapnick, S. B., and Vecchi, G. A.: Shifting patterns of mild weather in response to projected radiative forcing, Clim. Change, 140, 649–658, https://doi.org/10.1007/s10584-016-1885-9, 2017. a, b
van Garderen, L., Feser, F., and Shepherd, T. G.: A methodology for attributing the role of climate change in extreme events: a global spectrally nudged storyline, Nat. Hazards Earth Syst. Sci., 21, 171–186, https://doi.org/10.5194/nhess-21-171-2021, 2021. a, b
Vicente-Serrano, S. M., Tramblay, Y., Reig, F., González-Hidalgo, J. C., Beguería, S., Brunetti, M., Kalin, K. C., Patalen, L., Kržič, A., Lionello, P., Lima, M. M., Trigo, R. M., El-Kenawy, A. M., Eddenjal, A., Türkes, M., Koutroulis, A., Manara, V., Maugeri, M., Badi, W., Mathbout, S., Bertalanič, R., Bocheva, L., Dabanli, I., Dumitrescu, A., Dubuisson, B., Sahabi-Abed, S., Abdulla, F., Fayad, A., Hodzic, S., Ivanov, M., Radevski, I., Peña-Angulo, D., Lorenzo-Lacruz, J., Domínguez-Castro, F., Gimeno-Sotelo, L., García-Herrera, R., Franquesa, M., Halifa-Marín, A., Adell-Michavila, M., Noguera, I., Barriopedro, D., Garrido-Perez, J. M., Azorin-Molina, C., Andres-Martin, M., Gimeno, L., Nieto, R., Llasat, M. C., Markonis, Y., Selmi, R., Ben Rached, S., Radovanović, S., Soubeyroux, J.-M., Ribes, A., Saidi, M. E., Bataineh, S., El Khalki, E. M., Robaa, S., Boucetta, A., Alsafadi, K., Mamassis, N., Mohammed, S., Fernández-Duque, B., Cheval, S., Moutia, S., Stevkov, A., Stevkova, S., Luna, M. Y., and Potopová, V.: High temporal variability not trend dominates Mediterranean precipitation, Nature, 639, 658–666, https://doi.org/10.1038/s41586-024-08576-6, 2025. a
Wan, N., Lin, X., Pielke Sr., R. A., Zeng, X., and Nelson, A. M.: Global total precipitable water variations and trends over the period 1958–2021, Hydrol. Earth Syst. Sci., 28, 2123–2137, https://doi.org/10.5194/hess-28-2123-2024, 2024. a
Wehrli, K., Guillod, B. P., Hauser, M., Leclair, M., and Seneviratne, S. I.: Identifying Key Driving Processes of Major Recent Heat Waves, J. Geophys. Res.-Atmos., 124, 11746–11765, https://doi.org/10.1029/2019JD030635, 2019. a, b
Wehrli, K., Hauser, M., and Seneviratne, S. I.: Storylines of the 2018 Northern Hemisphere heatwave at pre-industrial and higher global warming levels, Earth Syst. Dynam., 11, 855–873, https://doi.org/10.5194/esd-11-855-2020, 2020. a, b
Zappa, G., Hawcroft, M. K., Shaffrey, L., Black, E., and Brayshaw, D. J.: Extratropical cyclones and the projected decline of winter Mediterranean precipitation in the CMIP5 models, Clim. Dynam., 45, 1727–1738, https://doi.org/10.1007/s00382-014-2426-8, 2015a. a
Zappa, G., Hoskins, B. J., and Shepherd, T. G.: The dependence of wintertime Mediterranean precipitation on the atmospheric circulation response to climate change, Environ. Res. Lett., 10, 104012, https://doi.org/10.1088/1748-9326/10/10/104012, 2015b. a
Zhang, J., You, Q., Ren, G., and Ullah, S.: Projected changes in mild weather frequency over China under a warmer climate, Environ. Res. Lett., 17, 114042, https://doi.org/10.1088/1748-9326/ac9c70, 2022. a
Zhang, W., Furtado, K., Wu, P., Zhou, T., Chadwick, R., Marzin, C., Rostron, J., and Sexton, D.: Increasing precipitation variability on daily-to-multiyear time scales in a warmer world, Sci. Adv., 7, eabf8021, https://doi.org/10.1126/sciadv.abf8021, 2021. a
Zhang, W., Zhou, T., and Wu, P.: Anthropogenic amplification of precipitation variability over the past century, Science, 385, 427–432, https://doi.org/10.1126/science.adp0212, 2024. a
Short summary
We explore how our day-to-day experience of the weather may change in a warmer world. We compare weather model experiments that share the same weather patterns, but have different levels of CO2 and ocean surface warming. In the warmer experiments, the biggest temperature changes occur on the coldest and hottest days. Daily swings in rainfall become larger, and we see fewer drizzly days and more days with heavy rain. This illustrates the impact of climate change on our day-to-day weather.
We explore how our day-to-day experience of the weather may change in a warmer world. We compare...


Altmetrics
Final-revised paper
Preprint