the Creative Commons Attribution 4.0 License.
the Creative Commons Attribution 4.0 License.
 | 14 Nov 2023
ESD Ideas: Arctic amplification's contribution to breaches of the Paris Agreement
Alistair Duffey
Robbie Mallett
Peter J. Irvine
Michel Tsamados
Julienne Stroeve
The Arctic is warming at almost 4 times the global average rate. Here we reframe this amplified Arctic warming in terms of global climate ambition to show that without Arctic amplification, the world would breach the Paris Agreement's 1.5 and 2 ∘C limits 5 and 8 years later, respectively. We also find the Arctic to be a disproportionate contributor to uncertainty in the timing of breaches. The outsized influence of Arctic warming on global climate targets highlights the need for better modelling and monitoring of Arctic change.
- Article
(862 KB) - Full-text XML
- BibTeX
- EndNote


The phenomenon of Arctic amplification is causing the Arctic (north of 66∘ N) to warm at almost 4 times the global average rate (Rantanen et al., 2022). However, this statistic is of limited direct relevance to policy-makers because it is not framed in terms of the central metric of climate policy: global mean temperature change. Here we use the latest generation of climate model outputs to reframe Arctic amplification in terms of the direct contribution of faster temperature rises in the Arctic to global warming. Specifically, we characterise the influence of Arctic amplification on the timing of breaches of the 1.5 and 2 ∘C warming levels identified in the Paris Agreement, with the aim of providing a more intuitive quantification of the significance of amplified Arctic warming. Arctic amplification is strongest in the winter months and is driven by positive feedbacks involving the vertical structure of the lower atmosphere, changing cloud cover, temperature-dependent increases in thermal radiation to space, and the retreat of sea ice and snow cover (Previdi et al., 2021; Goosse et al., 2018). The 2.7 ∘C Arctic warming since the pre-industrial has contributed around 10 % of Earth's globally averaged warming to date (Rohde and Hausfather, 2020), despite the region occupying only 4 % of the Earth's surface.
To characterise future global and Arctic warming, we analyse surface air temperature data from the Coupled Model Intercomparison Project Phase 6 (CMIP6; Eyring et al., 2016). We focus here on future temperature change under the Shared Socioeconomic Pathway 2-4.5 (SSP2-4.5) but also report results for a low- (SSP1-2.6) and a high-emissions (SSP3-7.0) pathway. The SSP2-4.5 pathway is a plausible intermediate scenario of future greenhouse gas emissions, which would likely meet neither of the Paris temperature goals (Pielke et al., 2022; Hausfather and Peters, 2020). Our analysis compares the year in which global average temperatures breach the two Paris targets in this dataset with the year in which those targets are breached in a modified version of the dataset which excludes the area north of 66∘ N. Crucially, the latter case is equivalent to an alternative world in which the Arctic warms at the global mean rate. The difference between the two timings therefore represents the time contribution of Arctic amplification to breaches of the Paris Agreement's temperature thresholds. Our definition of Arctic amplification differs from some analyses (e.g. Pithan and Mauritsen, 2014) which use the tropics as the baseline region, rather than the world outside the Arctic.
Our method does not simulate a world without Arctic amplification. Such a world would be radically different to ours since the phenomenon is in large part driven by the Arctic being colder than the rest of the planet (Pithan and Mauritsen, 2014). Neither do we quantify the impacts of Arctic change on temperature rise outside the region, such as via the albedo feedback from loss of snow and ice (Pistone et al., 2014), greenhouse gas emissions from permafrost thaw (MacDougall et al., 2015), and altered atmospheric and oceanic circulation (Liu et al., 2020). Instead, we quantify the rate of local Arctic warming in terms of its direct contribution to global mean temperature change. We also note that our analysis does not imply any change from current estimates in the expected timing of breaching Paris limits, which refer explicitly and only to global mean temperature (UNFCCC, 2015).
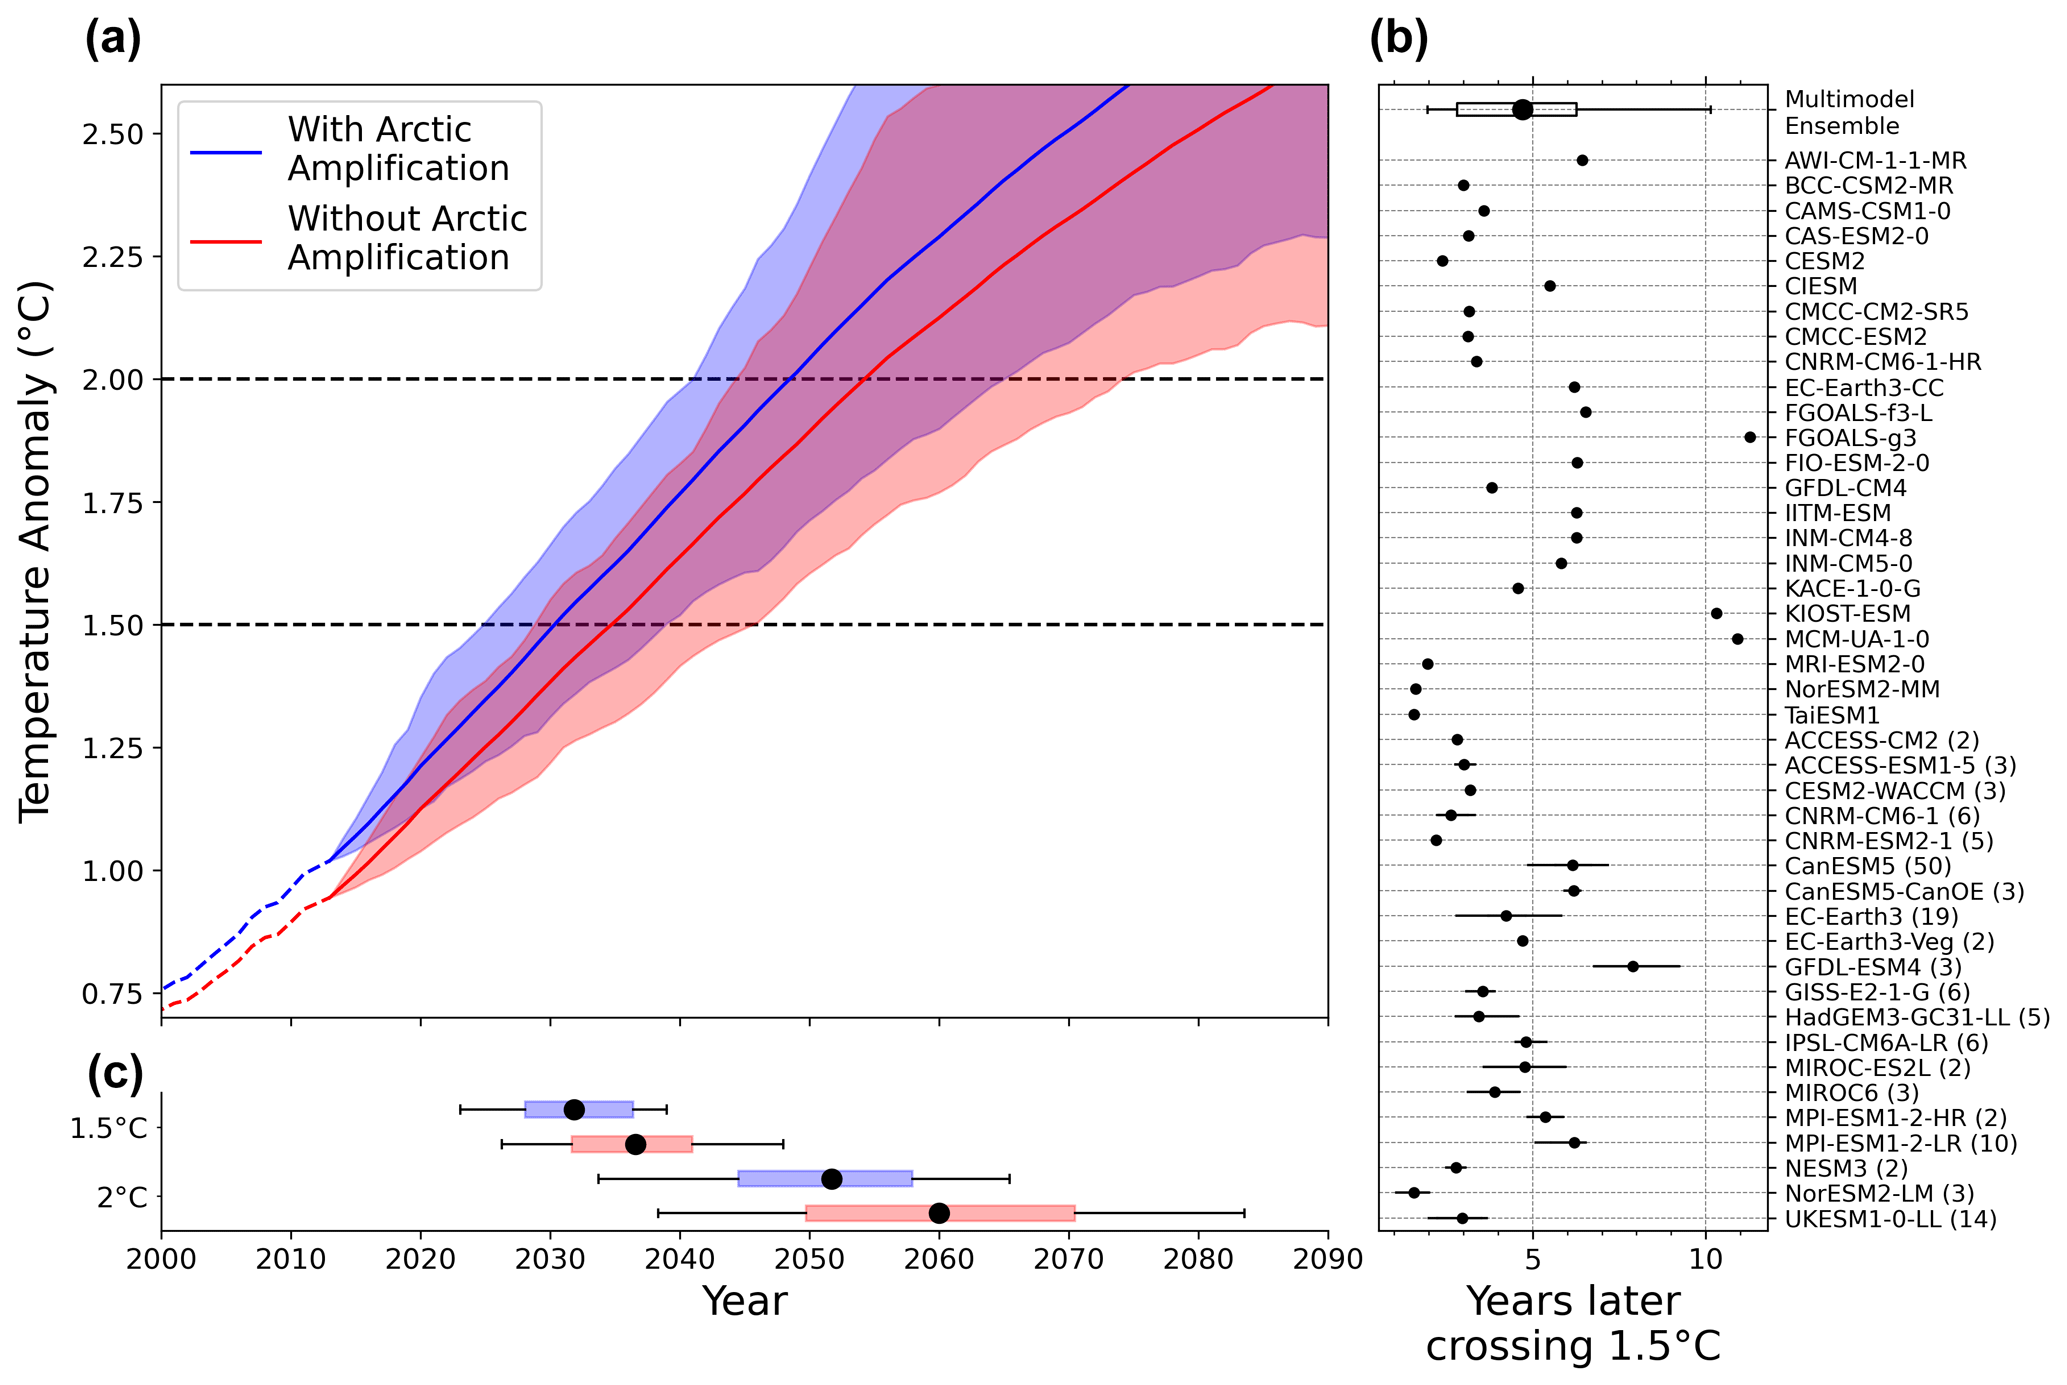
Figure 1Effect of Arctic amplification on temperature rises above the Paris limits in CMIP6 models. (a) Observed and projected global mean temperature anomalies relative to the pre-industrial with and without Arctic amplification. The CMIP6 projections are constructed from the first ensemble member of each model's SSP2-4.5 scenario, scaled to the observed present-day anomaly. All temperatures anomalies are 20-year, centred, rolling means. Central lines indicate multi-model means; shaded regions represent the spread between the 10 % and 90 % intervals. (b) Number of years later when each CMIP6 model breaches the 1.5 ∘C temperature threshold without Arctic amplification. Error bars show the range of this value across ensemble members, dots show the ensemble mean, and numbers in brackets following the model names indicate the number of ensemble members. For the multi-model ensemble, the box shows the 25th-to-75th percentile range, and whiskers show the 5th-to-95th percentile range. (c) Distributions of crossing years in the multi-model ensemble for the two temperature thresholds with and without Arctic amplification. The box plots are defined as in (b).
The Paris Agreement is not breached when just 1 year is warmer than the target temperature (Smith et al., 2018). Instead a multi-decadal average must be used to minimise the effect of internal variability (Rogelj et al., 2017). We therefore define breaches of a temperature threshold as the fractional year when the 20-year running-average temperature crosses that threshold. Many climate models significantly over- or underestimate the warming to date since the pre-industrial. To account for this, we scale the modelled temperature anomalies from the pre-industrial baseline to match the observed present-day temperature anomaly. Our results are qualitatively insensitive to the choice of bias correction method (see Methods).
Figure 1 shows that under the SSP2-4.5 emissions pathway, the 1.5 ∘C temperature threshold would be breached 4.7 (± 0.4) years later in the absence of Arctic amplification. Across the ensemble of models, the 1.5 ∘C threshold is exceeded in the year 2031.8 (± 0.9), whereas without Arctic amplification, this scenario breaches the 1.5 ∘C threshold in 2036.6 (± 1.1). Measuring from 2023, the world would therefore breach the 1.5 ∘C threshold 53 % later without amplified warming in the Arctic. The uncertainty value of the difference in crossing years represents the standard error of the bias-corrected multi-model ensemble. The 2 ∘C threshold is passed 8.3 (± 1.0) years later without Arctic amplification, in 2060.0 (± 2.6) rather than 2051.7 (± 1.8), 29 % later. Under a plausible high-emissions scenario (SSP3-7.0, not shown) without Arctic amplification, the 1.5 ∘C temperature threshold would be breached 3.7 (± 0.2) years (48 %) later, moving the date from 2030.8 (± 0.7) to 2034.5 (± 0.8). Under a low-emissions pathway (SSP1-2.6), without Arctic amplification the passing of the 1.5 ∘C threshold is delayed by 6.6 (± 1.4) years (81 %). These results demonstrate the key impact of Arctic warming on the central metric of climate policy: the global mean temperature. Amplified Arctic warming reduces the expected time to crossing the 1.5 ∘C threshold by 4–7 years relative to a world without such amplification.
Our approach also allows assessment of how uncertainty in Arctic warming over the coming decades contributes to uncertainty in the crossing year for the 1.5 ∘C threshold. In the multi-model ensemble, the 10th-to-90th percentile range in 1.5 ∘C crossing year is 13.9 years. To quantify the impact of near-term Arctic warming on this uncertainty, it is necessary to account for the strong correlation (r=0.53) between Arctic warming and the warming south of 66∘ N across the multi-model ensemble. We therefore calculate a partial correlation coefficient between the rate of Arctic warming and the crossing year across the multi-model ensemble, controlling for warming outside the Arctic. This partial correlation coefficient is equal to −0.39 (significant at 95 % confidence). The square of this coefficient, 15 %, gives the variance in crossing year for the 1.5 ∘C threshold explained by the near-term Arctic warming rate under the SSP2-4.5 scenario. We find that while occupying only 4 % of the global surface area, variability in near-term Arctic warming contributes 15 % of the inter-model uncertainty in the crossing year. Despite this, Fig. 1c shows a larger spread in crossing year for the case without Arctic amplification. The reason for the apparent discrepancy is that the warming to date for the CMIP6 model ensemble, which we adjust to match present-day observations, is smaller in the case without Arctic amplification, so there is more time for models to diverge before crossing the temperature thresholds.
We can also assess how the year in which the 1.5 ∘C limit is exceeded varies between low and high scenarios for Arctic amplification influence. To do this we perform a multiple linear regression on the crossing year using two variables: Arctic warming and warming outside of the Arctic (see Methods). Holding the warming outside of the Arctic constant at its multi-model mean of 0.26 ∘C per decade, our regression model predicts that the 10th and 90th percentiles of near-term Arctic warming are represented by crossing years of 2033.2 and 2030.4, respectively, a difference of 2.9 years. We note that this difference in crossing year associated with the lower and upper bounds on projected Arctic warming is larger than the 1.6 year difference between the mean crossing years for the low- and high-emissions scenarios assessed here (2032.4 and 2030.8, respectively).
While we focus here only on the direct impact of Arctic warming on global temperature change, the local impacts should not be overlooked. Under 2 ∘C of global warming, Arctic temperatures are expected to rise by 4 ∘C in the annual mean and 7 ∘C in winter, with profound consequences for local people and ecosystems (Post et al., 2019). Additionally, amplified Arctic warming contributes to the global challenges that motivated the 1.5 ∘C target, such as sea level rise and permafrost thaw. These local and global impacts are a primary motivation for improving the representation of the Arctic in Earth system models and for accurate observational monitoring in the region. Our findings offer additional motivation for such work – that Arctic warming has an outsized influence on both the timing of and uncertainty in projected breaches of the Paris Agreement's temperature targets.
The CMIP6 analysis includes output of all models and ensemble members for which both the historical and SSP scenarios were available on the United Kingdom's Centre for Environmental Data Analysis (CEDA) data archive (43 CMIP6 models and 172 individual ensemble members). To make reasonable near-term warming projections we adjust model temperatures to match present-day observations. We scale model projections by the ratio of their present-day warming anomaly from the pre-industrial to that value in observations. “Present day” here refers to 2013 because taking a 20-year centred rolling mean introduces a 9-year delay. Scaling is carried out independently for global temperature projections and temperature projections without Arctic amplification. This multiplicative correction has been used in various studies bias-correcting global climate models (Watanabe et al., 2012; Graham et al., 2007; Melia et al., 2015). Our results are qualitatively insensitive to the choice of bias correction method because the observed warming sits close to the median model, such that roughly the same number of model first ensemble members have their global temperature anomaly adjusted upwards (22 models) as downwards (21 models). With an alternative bias correction method, in which model anomalies from observations are subtracted as a constant offset, we find that the 2 ∘C threshold is passed 5.8 (± 0.5) years later without Arctic amplification, as compared to 8.3 years earlier with our preferred scaling method.
The temperature observations used are the HadCRUT5 dataset (Morice et al., 2021), interpolated onto a 0.5∘ latitude grid. The observational temperature data use a blend of sea surface temperature over the open ocean and near-surface air temperature over land and sea ice. This blended global temperature metric is not well suited for making temperature projections using the CMIP6 ensemble because the fraction of open ocean changes with sea ice coverage and is thus not constant between models and ensemble members or over time (Tokarska et al., 2019). As such we follow the recommendation of Tokarska et al. (2019) in using a hybrid temperature metric for our analysis, consisting of blended sea surface temperature and near-surface air temperatures for observations to present day and of global near-surface air temperature as directly outputted as a model field for future CMIP6-based projections.
The fractional year in which a temperature threshold is crossed is calculated by linearly interpolating the rolling mean temperature. For the SSP2-4.5 scenario, two models (FGOALS-g3 and KIOST-ESM) do not cross 2 ∘C by 2100, when the simulation ends. In these cases, we extrapolate the crossing year based on the 2080–2100 trend. For the low-emissions SSP1-2.6 pathway, we only performed our analysis for the 1.5 ∘C threshold, as a majority of models do not exceed 2 ∘C under that scenario. It should be noted that the mean crossing year of a set of trajectories is not in general equal to the crossing year of the mean trajectory, and for this reason the multi-model mean lines in Fig. 1a do not align with the crossing year distributions in Fig. 1c. All results quoted in this study refer to the mean crossing year of the individual trajectories.
To estimate the contribution of Arctic warming to uncertainty in the crossing year we calculate an ordinary least squares multiple linear regression for the 1.5 ∘C threshold crossing year in terms of two variables: (i) the linearised warming north of 66∘ N over the 30-year period 2013–2044 and (ii) the linearised warming south of 66∘ N over the same period. This model predicts sensitivities of the crossing year of −6.0 and −49.7 yr ∘C−1 warming inside and outside the Arctic, respectively. The partial correlation coefficient is also calculated over the same 30-year period of 2013–2044.
All code required to reproduce our analysis is available at https://github.com/alistairduffey/AA_contrib_to_GMST and is permanently archived on Zenodo at https://doi.org/10.5281/zenodo.8386907 (Duffey and Mallett, 2023).
All data used in this work are publicly available. The CMIP6 climate model simulations can be downloaded from the Earth System Grid Federation CMIP6 archive (https://esgf-index1.ceda.ac.uk/search/cmip6-ceda/). The HadCRUT5 observational data can be downloaded via the UK Met Office (https://www.metoffice.gov.uk/hadobs/hadcrut5/, Morice et al., 2021).
AD carried out the CMIP6 data analysis. RM conceived the study. AD and RM jointly wrote the manuscript. PJI, MT and JS provided critical feedback, which shaped the analysis, presentation and manuscript.
The contact author has declared that none of the authors has any competing interests.
Publisher’s note: Copernicus Publications remains neutral with regard to jurisdictional claims made in the text, published maps, institutional affiliations, or any other geographical representation in this paper. While Copernicus Publications makes every effort to include appropriate place names, the final responsibility lies with the authors.
Robbie Mallett would like to thank the International Cryosphere Climate Initiative for valuable discussions which led to this study. We thank Alek Petty and two anonymous reviewers for their comments which improved the paper. This research used computational resources from the UK's data analysis facility for environmental science, JASMIN. Julienne Stroeve acknowledges support from the Canada 150 Research Chairs Program, and Robbie Mallett acknowledges support from the same programme via Julienne Stroeve.
Alistair Duffey's contribution was funded by the London Natural Environment Research Council (NERC) Doctoral Training Partnership (DTP) (grant no. NE/S007229/1). Michel Tsamados received support from European Space Agency (ESA) (grant nos. ESA/AO/1-9132/17/NL/MP and ESA/AO/1-10061/19/I-EF) and National Environmental Research Council (NERC) (grant nos. NE/T000546/1 and NE/X004643/1).
This paper was edited by Gabriele Messori and reviewed by two anonymous referees.
Duffey, A. and Mallett, R.: alistairduffey/AA_contrib_to_GMST: v1.1 (v1.1), Zenodo [code], https://doi.org/10.5281/zenodo.8386907, 2023. a
Eyring, V., Bony, S., Meehl, G. A., Senior, C. A., Stevens, B., Stouffer, R. J., and Taylor, K. E.: Overview of the Coupled Model Intercomparison Project Phase 6 (CMIP6) experimental design and organization, Geosci. Model Dev., 9, 1937–1958, https://doi.org/10.5194/GMD-9-1937-2016, 2016. a
Goosse, H., Kay, J. E., Armour, K. C., Bodas-Salcedo, A., Chepfer, H., Docquier, D., Jonko, A., Kushner, P. J., Lecomte, O., Massonnet, F., Park, H. S., Pithan, F., Svensson, G., and Vancoppenolle, M.: Quantifying climate feedbacks in polar regions, Nat. Commun., 9, 1–13, https://doi.org/10.1038/s41467-018-04173-0, 2018. a
Graham, L. P., Andréasson, J., and Carlsson, B.: Assessing climate change impacts on hydrology from an ensemble of regional climate models, model scales and linking methods – a case study on the Lule River basin, Climatic Change, 81, 293–307, https://doi.org/10.1007/s10584-006-9215-2, 2007. a
Hausfather, Z. and Peters, G. P.: RCP8.5 is a problematic scenario for near-term emissions, P. Natl. Acad. Sci. USA, 117, 27791–27792, 2020. a
Liu, W., Fedorov, A. V., Xie, S.-P., and Hu, S.: Climate impacts of a weakened Atlantic Meridional Overturning Circulation in a warming climate, Sci. Adv.s, 6, eaaz4876, https://doi.org/10.1126/sciadv.aaz4876, 2020. a
MacDougall, A. H., Zickfeld, K., Knutti, R., and Matthews, H. D.: Sensitivity of carbon budgets to permafrost carbon feedbacks and non-CO2 forcings, Environ. Res. Lett., 10, 125003, https://doi.org/10.1088/1748-9326/10/12/125003, 2015. a
Melia, N., Haines, K., and Hawkins, E.: Improved Arctic sea ice thickness projections using bias-corrected CMIP5 simulations, The Cryosphere, 9, 2237–2251, https://doi.org/10.5194/tc-9-2237-2015, 2015. a
Morice, C. P., Kennedy, J. J., Rayner, N. A., Winn, J. P., Hogan, E., Killick, R. E., Dunn, R. J. H., Osborn, T. J., Jones, P. D., and Simpson, I. R.: An Updated Assessment of Near-Surface Temperature Change From 1850: The HadCRUT5 Data Set, J. Geophys. Res.-Atmos., 126, e2019JD032361, https://doi.org/10.1029/2019JD032361, 2021 (data available at https://www.metoffice.gov.uk/hadobs/hadcrut5/, last access: 29 December 2022). a, b
Pielke Jr., R., Burgess, M. G., and Ritchie, J.: Plausible 2005–2050 emissions scenarios project between 2 ∘C and 3 ∘C of warming by 2100, Environ. Res. Lett., 17, 024027, https://doi.org/10.1088/1748-9326/AC4EBF, 2022. a
Pistone, K., Eisenman, I., and Ramanathan, V.: Observational determination of albedo decrease caused by vanishing Arctic sea ice, P. Natl. Acad. Sci. USA, 111, 3322–3326, 2014. a
Pithan, F. and Mauritsen, T.: Arctic amplification dominated by temperature feedbacks in contemporary climate models, Nat. Geosci., 7, 181–184, https://doi.org/10.1038/ngeo2071, 2014. a, b
Post, E., Alley, R. B., Christensen, T. R., Macias-Fauria, M., Forbes, B. C., Gooseff, M. N., Iler, A., Kerby, J. T., Laidre, K. L., Mann, M. E., Olofsson, J., Stroeve, J. C., Ulmer, F., Virginia, R. A., and Wang, M.: The polar regions in a 2 ∘C warmer world, Sci. Adv., 5, eaaw9883, https://doi.org/10.1126/sciadv.aaw9883, 2019. a
Previdi, M., Smith, K. L., and Polvani, L. M.: Arctic amplification of climate change: a review of underlying mechanisms, Environ. Res. Lett., 16, 093003, https://doi.org/10.1088/1748-9326/AC1C29, 2021. a
Rantanen, M., Karpechko, A. Y., Lipponen, A., Nordling, K., Hyvärinen, O., Ruosteenoja, K., Vihma, T., and Laaksonen, A.: The Arctic has warmed nearly four times faster than the globe since 1979, Commun. Earth Environ., 3, 1–10, https://doi.org/10.1038/s43247-022-00498-3, 2022. a
Rogelj, J., Schleussner, C.-F., and Hare, W.: Getting It Right Matters: Temperature Goal Interpretations in Geoscience Research, Geophys. Res. Lett., 44, 10662–10665, https://doi.org/10.1002/2017GL075612, 2017. a
Rohde, R. A. and Hausfather, Z.: The Berkeley Earth Land/Ocean Temperature Record, Earth Syst. Sci. Data, 12, 3469–3479, https://doi.org/10.5194/essd-12-3469-2020, 2020. a
Smith, D. M., Scaife, A. A., Hawkins, E., Bilbao, R., Boer, G. J., Caian, M., Caron, L. P., Danabasoglu, G., Delworth, T., Doblas-Reyes, F. J., Doescher, R., Dunstone, N. J., Eade, R., Hermanson, L., Ishii, M., Kharin, V., Kimoto, M., Koenigk, T., Kushnir, Y., Matei, D., Meehl, G. A., Menegoz, M., Merryfield, W. J., Mochizuki, T., Müller, W. A., Pohlmann, H., Power, S., Rixen, M., Sospedra-Alfonso, R., Tuma, M., Wyser, K., Yang, X., and Yeager, S.: Predicted Chance That Global Warming Will Temporarily Exceed 1.5 ∘C, Geophys. Res. Lett., 45, 895–11, https://doi.org/10.1029/2018GL079362, 2018. a
Tokarska, K. B., Schleussner, C.-F., Rogelj, J., Stolpe, M. B., Matthews, H. D., Pfleiderer, P., and Gillett, N. P.: Recommended temperature metrics for carbon budget estimates, model evaluation and climate policy, Nat. Geosci., 12, 964–971, https://doi.org/10.1038/s41561-019-0493-5, 2019. a, b
UNFCCC: Conference of the Parties (COP): Adoption of the Paris Agreement, http://unfccc.int/resource/docs/2015/cop21/eng/l09r01.pdf (last access: 14 July 2023), 2015. a
Watanabe, S., Kanae, S., Seto, S., Yeh, P. J.-F., Hirabayashi, Y., and Oki, T.: Intercomparison of bias-correction methods for monthly temperature and precipitation simulated by multiple climate models, J. Geophys. Res.-Atmos., 117, D23114, https://doi.org/10.1029/2012JD018192, 2012. a