the Creative Commons Attribution 4.0 License.
the Creative Commons Attribution 4.0 License.
 | 28 Jul 2022
Contrasting projections of the ENSO-driven CO2 flux variability in the equatorial Pacific under high-warming scenario
Pradeebane Vaittinada Ayar
Laurent Bopp
Jim R. Christian
Tatiana Ilyina
John P. Krasting
Roland Séférian
Hiroyuki Tsujino
Michio Watanabe
Andrew Yool
Jerry Tjiputra
The El Niño–Southern Oscillation (ENSO) widely modulates the global carbon cycle. More specifically, it alters the net uptake of carbon in the tropical ocean. Indeed, over the tropical Pacific less carbon is released by oceans during El Niño, while the opposite is the case for La Niña. Here, the skill of Earth system models (ESMs) from the latest Coupled Model Intercomparison Project (CMIP6) to simulate the observed tropical Pacific CO2 flux variability in response to ENSO is assessed. The temporal amplitude and spatial extent of CO2 flux anomalies vary considerably among models, while the surface temperature signals of El Niño and La Niña phases are generally well represented. Under historical conditions followed by the high-warming Shared Socio-economic Pathway (SSP5-8.5) scenarios, about half the ESMs simulate a reversal in ENSO–CO2 flux relationship. This gradual shift, which occurs as early as the first half of the 21st century, is associated with a high CO2-induced increase in the Revelle factor that leads to stronger sensitivity of partial pressure of CO2 (pCO2) to changes in surface temperature between ENSO phases. At the same time, uptake of anthropogenic CO2 substantially increases upper-ocean dissolved inorganic carbon (DIC) concentrations (reducing its vertical gradient in the thermocline) and weakens the ENSO-modulated surface DIC variability. The response of the ENSO–CO2 flux relationship to future climate change is sensitive to the contemporary mean state of the carbonate ion concentration in the tropics. We present an emergent constraint between the simulated contemporary carbonate concentration with the projected cumulated CO2 fluxes. Models that simulate shifts in the ENSO–CO2 flux relationship simulate positive bias in surface carbonate concentrations.
- Article
(11160 KB) - Full-text XML
-
Supplement
(21731 KB) - BibTeX
- EndNote


Since the beginning of the industrial era, human activities such as fossil fuel combustion, land-use changes, and cement production have released huge amounts of greenhouse gases (predominantly CO2), leading to the ongoing planetary-scale climate change. This excess CO2 in the atmosphere is partly absorbed by the ocean and terrestrial biosphere, buffering the rate of warming (Doney et al., 2014; Le Quéré et al., 2016). Over 2010–2019, approximately 3.4±0.9 and 2.5±0.6 Pg C yr−1 are absorbed by the land and ocean, respectively, with substantial interannual variability (Friedlingstein et al., 2020). Due to its strong feedback on climate, improved understanding of this variability, its governing mechanisms, and how these mechanisms may evolve in the future are required to constrain future climate change projections.
Due to its vast area, the tropical Pacific is the most important CO2 outgassing region in the world oceans today (Takahashi et al., 2009), representing more than 17 % of the global ocean CO2 uptake (0.44±0.41 Pg C per year for 1990–2009 and 18∘ S–18∘ N; Ishii et al., 2014), and it is projected to be the region with the second highest amount (after the Southern Ocean) of area-integrated anthropogenic carbon uptake in the 21st century under a high CO2 scenario (Tjiputra et al., 2010; Roy et al., 2011). In terms of interannual variability, the equatorial Pacific CO2 flux represents the dominant mode of variability of the global oceanic CO2 flux variations (Wetzel et al., 2005; Resplandy et al., 2015; Landschützer et al., 2016). Some Earth system models (ESMs) also show the CO2 flux in the Southern Ocean as the dominant mode (Resplandy et al., 2015). In this region, the mechanistic driver is associated with the El Niño–Southern Oscillation (ENSO), which has been well established and thoroughly documented in many previous observational and modelling studies. For instance, Feely et al. (2006) showed strong negative correlation between CO2 fluxes and ENSO over the equatorial Pacific using observations from 1981 to 2004. Using ocean biogeochemical general circulation models forced with atmospheric reanalysis, similar regional CO2 flux fluctuations in response to ENSO have been simulated (Winguth et al., 1994; Bousquet et al., 2000; Valsala et al., 2014; Wang et al., 2015).
The biogeochemical processes constraining the CO2 fluxes in the equatorial Pacific are strongly influenced by the ENSO-induced physical processes. These processes can be formulated as follows: during El Niño events, warmer sea surface temperature reduces the CO2 solubility, which increases seawater partial pressure of CO2 (pCO2, Le Borgne et al., 2002; Patra et al., 2005; Ishii et al., 2014). In parallel, during those events, weaker upwelling of nutrient-rich and dissolved-inorganic-carbon-rich subsurface water acts to reduce the surface seawater pCO2 (Feely et al., 2006; Long et al., 2013; Wang et al., 2015). The opposite happens during the La Niña phase. Among these competing processes, the ENSO-driven interannual variability of CO2 flux is presumably dominated by the modulation of dissolved inorganic carbon (DIC) concentrations by the upwelling process (McKinley et al., 2004; Li and Xu, 2013; Jin et al., 2017). Therefore, it is the change in thermocline depth and upwelling strength during the ENSO phase that mainly governs the tropical Pacific CO2 flux anomalies by constraining surface DIC concentration (e.g. Doney et al., 2009). In addition, CO2 flux anomaly variability in the tropical Pacific is also related to the poleward Ekman transport driven by the easterly trade winds (Liao et al., 2020).
While models simulating only the ocean are able to simulate the relationship between CO2 and ENSO (e.g. McKinley et al., 2004; Wetzel et al., 2005; Li and Xu, 2013), this is not always the case for fully coupled Earth system models (ESMs). Indeed, based on ESM simulations from the Coupled Model Intercomparison Project 5 (CMIP5, Taylor et al., 2012), Dong et al. (2017) showed that over the historical period some models underestimate the observed surface DIC variability and consequently the CO2 flux anomalies. They attributed this to a weak relationship between the simulated upwelling variations and the respective ENSO phases. Jin et al. (2019) showed that some ESMs poorly simulate the spatial pattern of the tropical Pacific CO2 fluxes in response to ENSO over the historical period. They attributed this to the weak surface DIC-induced CO2 flux variability during ENSO; e.g. the anomalously low DIC signals associated with ENSO are insufficient to counteract the solubility effects induced by sea surface temperature (SST).
The main focus of this paper is to determine how the ENSO-induced variability of sea–air CO2 fluxes may be altered in the high-CO2 future in ESM projections. In this study, the capability of the latest ESM collection from Coupled Model Intercomparison Project 6 (CMIP6) (Eyring et al., 2016) to reproduce the observed ENSO–CO2 flux relationship over the contemporary period is first evaluated. Next, we analyse how this relationship evolves in future projection run under a high-warming scenario. Given the importance of carbon cycle climate feedback on future projections (e.g. Arora et al., 2020) and the large-scale impact of ENSO on the global climate, such evaluation is timely and necessary. In particular, the aim is to identify and elucidate emerging consistent patterns among the ESMs to better constrain future changes in ENSO-induced variability in the equatorial Pacific. Studying the future evolution of ENSO-related CO2 flux variations is also crucial because ENSO, the most dominant mode of global climate variability, and its extremes are projected to become more frequent, more intense, and more extended in spatial impact (Cai et al., 2015).
The paper is organized as follows. Section 2 introduces the observational and model datasets, the study area, and the methods used to analyse the relationship between ENSO and sea–air CO2 fluxes. Results of the contemporary ENSO-related spatial patterns and ENSO–CO2 flux relationship reversal and variability drivers are presented in Sect. 3, while Sects. 4 and 5 provide the discussion and summary of this study.
2.1 Observational and CMIP6 datasets
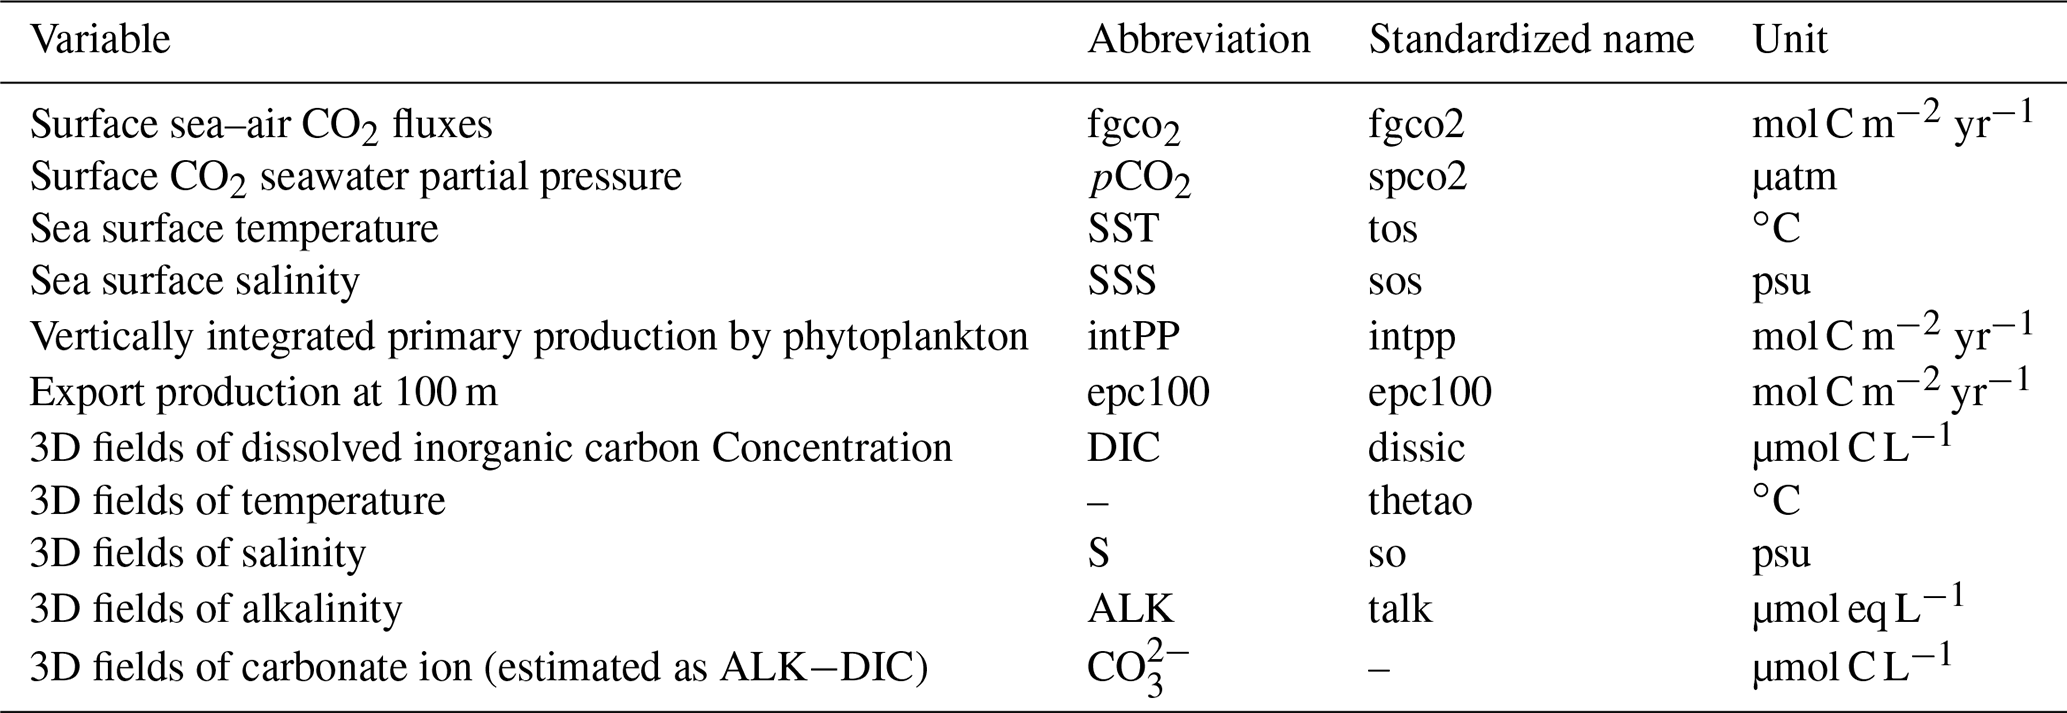
The ocean variables analysed in this study are listed in Table 1. These variables are extracted from different observational and simulation products at monthly temporal resolution. For observation-based fgco2, the monthly reconstruction values from 1982 to 2015 based on a two-step neural network data interpolation (MPI-SOM-FFN) is used (Landschützer et al., 2016). Gridded monthly SST observations are taken from the Japanese 55-year reanalysis data (JRA-55) from 1958 to 2019 (Kobayashi et al., 2015; Harada et al., 2016). The subsurface temperature profiles over the 1985–2014 period are computed from the ORAS5 reanalyses (Zuo et al., 2019). Total alkalinity average estimates, including measurements between 1972 and 2013, have been retrieved from the GLODAP version 2 data product (Lauvset et al., 2016). Finally, the observed DIC climatology over the 2004–2017 period is extracted from the Keppler et al. (2020) dataset. All variables are given at a regular 1×1∘ spatial horizontal resolution.
Table 1Ocean variables used in this study. The full name, the abbreviation, standardized CMIP6 name, and the unit of each variable are all also given.
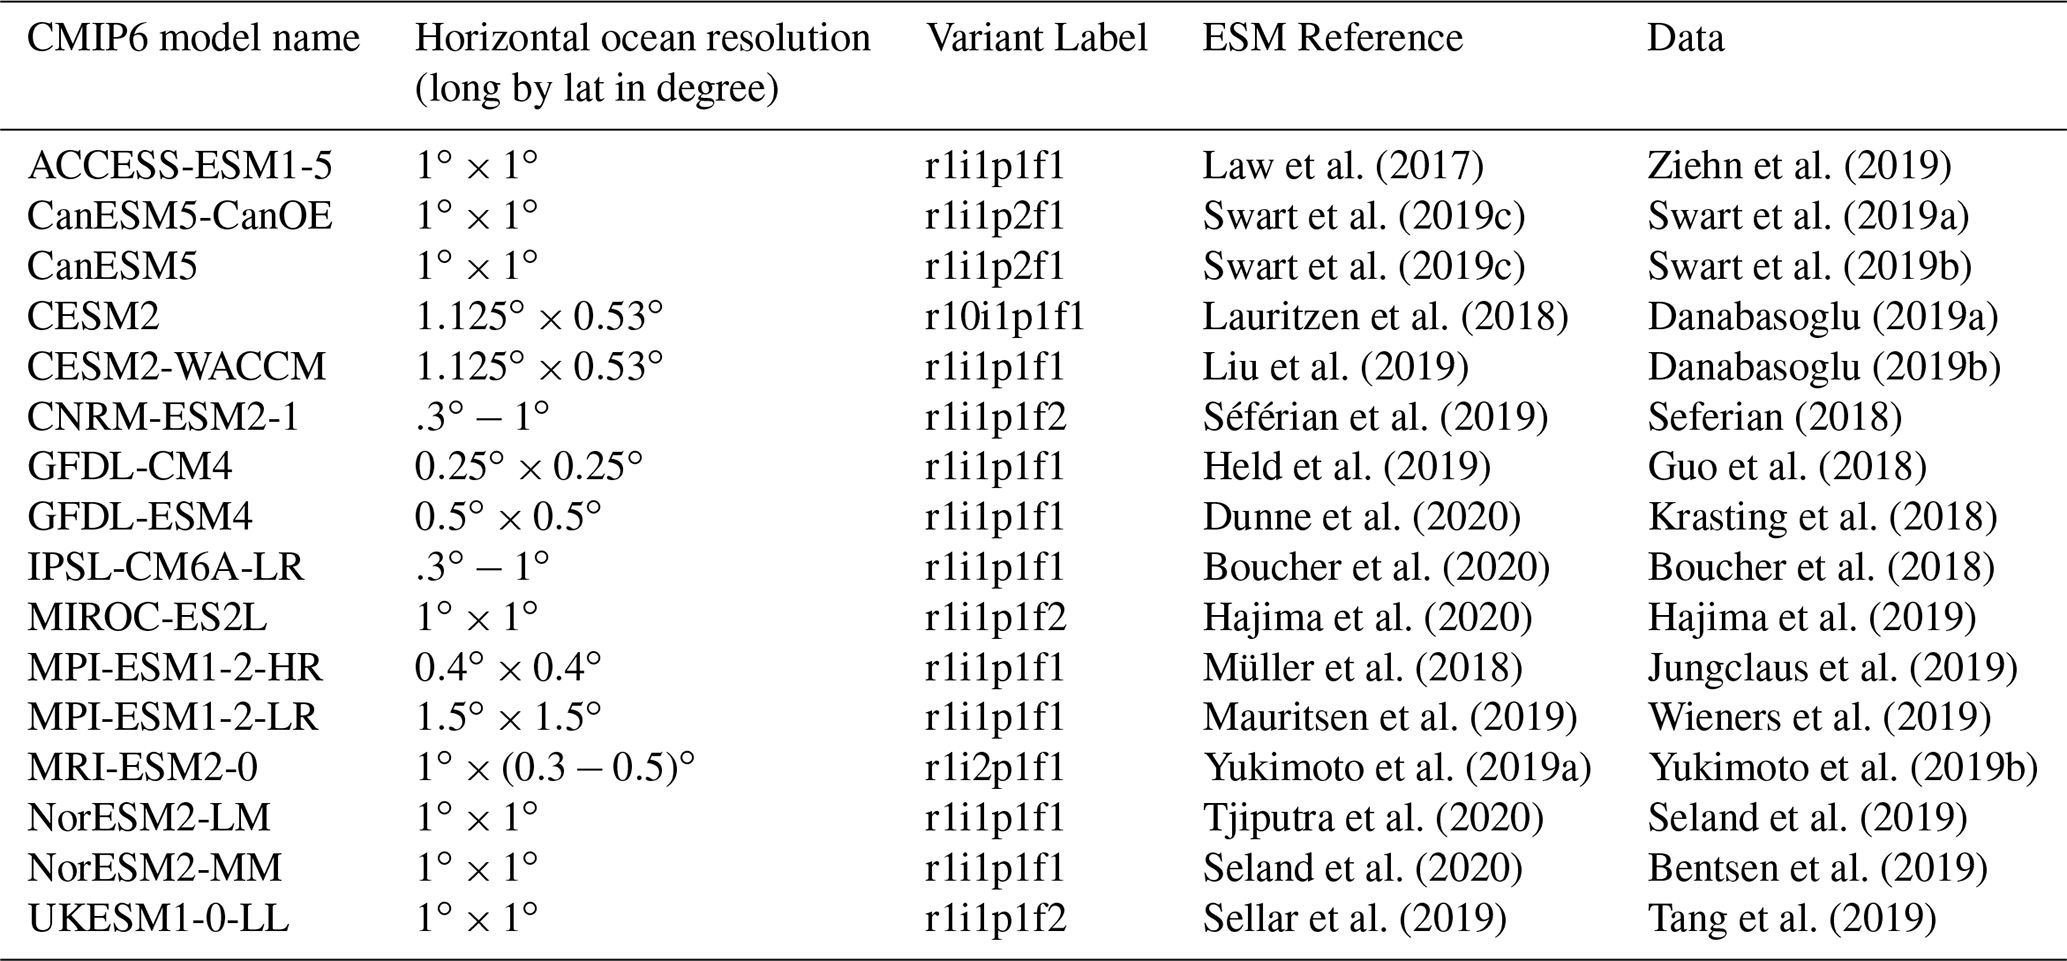
For the Earth system model simulations, the monthly output fields of surface fgco2; pCO2; SST; sea surface salinity (SSS); alkalinity (ALK); integrated primary production (intPP); and 3D temperature, DIC, and alkalinity concentrations are taken from the Coupled Model Intercomparison Project phase 6 (CMIP6, Eyring et al., 2016) database. At the time of study initiation, 16 ESMs provided the variables required for the analysis (see Table 2). The simulation variant for each model is chosen according the availability of the variables shown in Table 1. Given the variety of (irregular) grids among the models, the model datasets are spatially regridded into a regular grid using bilinear interpolation provided by climate data operators (CDOs). The vertical resolutions of 3D temperature and DIC are linearly interpolated at 20 m resolution from the surface down to 1000 m depth.
In this study, analyses are conducted over the same contemporary reference period 1985–2014, the end of the century future period (2071–2100) under the high CO2 Shared Socio-economic Pathway scenario (SSP5-8.5, O'Neill et al., 2016), and the whole 1850–2100 period, combining both historical and SSP5-8.5 concentration-driven experiments. This high-warming scenario has been chosen in order to use a clear signal with a high signal to noise ratio. Indeed, using a high-emission end member scenario gives us the best chance to actually see a change in the strong relationship between ENSO and CO2 fluxes. The model simulation outputs are first evaluated against the observations for the reference period, followed by analysis of future evolution and changes with respect to the reference period.
Law et al. (2017)Ziehn et al. (2019)Swart et al. (2019c)Swart et al. (2019a)Swart et al. (2019c)Swart et al. (2019b)Lauritzen et al. (2018)Danabasoglu (2019a)Liu et al. (2019)Danabasoglu (2019b)Séférian et al. (2019)Seferian (2018)Held et al. (2019)Guo et al. (2018)Dunne et al. (2020)Krasting et al. (2018)Boucher et al. (2020)Boucher et al. (2018)Hajima et al. (2020)Hajima et al. (2019)Müller et al. (2018)Jungclaus et al. (2019)Mauritsen et al. (2019)Wieners et al. (2019)Yukimoto et al. (2019a)Yukimoto et al. (2019b)Tjiputra et al. (2020)Seland et al. (2019)Seland et al. (2020)Bentsen et al. (2019)Sellar et al. (2019)Tang et al. (2019)Table 2List of the 16 CMIP6 models used in this study with the horizontal resolution of the ocean component, variant label, model, and data references all given. Note that most of the models have irregular grids and the resolutions quoted in the table are approximate.
2.2 Variable anomalies, Niño34 index, and thermocline depth computation
The analysis focuses on the correlation between CO2 flux anomalies and Niño34 index. First, the monthly anomalies of sea–air CO2 fluxes at each grid point are computed by detrending each calendar month separately using a cubic smoothing spline (implemented by the function smooth.spline in R software; R Core Team, 2016) over the period 1850–2100. For instance, the non-linear trend for January at a given grid point is removed from the respective time series comprising all January values. The SST and pCO2 anomalies used in the analyses are also computed in the same manner. The degree of freedom of the spline is set to get a good compromise between the smoothness (smoothing parameter above 0.8) and the number of parameters (knots) of the spline used to estimate the trend over to whole equatorial Pacific (Hastie and Tibshirani, 1990, chap. 10). The degree of freedom is set to 5 for SST and fgco2. A degree of freedom of 12 is needed for pCO2 given its steeper increase.
The Niño34 index corresponds to the standardized area-weighted mean SST anomalies over the Niño34 region: 5∘ S–5∘ N, 190∘ E–240∘ E. These anomalies are computed relative to the 1981–2010 climatology. For the CMIP6 model outputs, the SST values are first detrended over the 1850–2100 period using a cubic spline. Following this, a model-specific Niño34 index is computed relative to the 1981–2010 climatology. Hereafter, the regimes referred to as El Niño (or La Niña) are defined from the respective Niño34 indices (specific for observations and each model). Months with a Niño34 index above 1 standard deviation (SD) of each dataset are categorized as El Niño regimes; those that are below −1 SD are classified as La Niña regimes.
The thermocline is a transition layer where the temperature decreases rapidly with depth from the warm surface mixed layer to the cold deep-water layer, where the temperature is relatively uniform. A deeper thermocline (e.g. during El Niño) limits the amount of interior DIC brought to shallower depths by upwelling. This indicator is used in this study to assess the changes in the mechanisms linking ENSO and CO2 fluxes in the present day and in the future projections. The thermocline depth is typically defined as the depth with the maximum vertical temperature gradient (Zhu et al., 2021, and references therein). In this paper, the gradient is computed every month as the vertical difference within each 20 m layer (after the vertical interpolation), and the thermocline depth is the average depth of the layer with the highest gradient.
2.3 Thermal and non-thermal contributions to surface pCO2
In order to differentiate the thermal (th, driven by SST) and non-thermal (nt, driven by other factors, such as DIC, alkalinity, and salinity) contributions, the temporal variations of surface ocean pCO2 is decomposed into the two terms following Takahashi et al. (1993, 2002). Seawater pCO2 is thermodynamically dependent on temperature and is computed from the temperature sensitivity of CO2 γT (4.23 % ∘C−1). This sensitivity has experimentally been determined and is associated with very little error (Takahashi et al., 1993), which is not further considered. The thermal pCO2 component is computed as follows:
In Eq. (1), the annual pCO2 average, , is perturbed with temperature anomalies computed as the difference between the detrended SST, dSST (done with a cubic spline), and the long-term mean dSST, . The non-thermal component (), which reflects the effect of biophysical processes, is computed by normalizing the pCO2 to (Takahashi et al., 2002):
In Eq. (2), the exponential term removes the SST-associated pCO2 variation. This decomposition is well known and extensively used at regional and global scale (e.g. Landschützer et al., 2018; Jiménez-López et al., 2019; Ko et al., 2021).
2.4 Biological contribution to surface pCO2
The buffering capacity of the ocean is a measure of the ability of the ocean to take up carbon and is quantified by the Revelle factor, (Revelle and Suess, 1957). The Revelle factor R is the ratio of the relative change of seawater pCO2 (or aqueous CO2 concentration, CO2(aq)) to the relative change of dissolved inorganic carbon (, Egleston et al., 2010; Hauck and Völker, 2015). The sensitivity of pCO2 to DIC perturbations can be estimated using the buffer factor γDIC that is related to the Revelle factor as and can be explicitly retrieved from the carbonate system parameters (Egleston et al., 2010). To summarize, the higher the Revelle factor, the lower the buffer capacity (or the buffer factor γDIC) of the ocean and its CO2 uptake capacity. The annual evolution of surface Revelle factor and buffer factor γDIC for CMIP6 models over the 1850–2100 period in the equatorial Pacific (defined below) are given in Fig. 1. Using this relationship, the reduction in pCO2 can be quantified as a result of reduction in DIC concentration, e.g. associated with biological carbon absorption:
where ΔDICbio is the mean reduction in surface DIC concentration due to biological production (estimated from the monthly intPP in [mol C m−2 per month] divided by the euphotic layer depth, here assumed to be 100 m). A similar approach has been used in Hauck and Völker (2015) to determine the impact of biological activity on surface pCO2 in the Southern Ocean. The ΔpCO2bio is relevant to evaluate the biological contributions during El Niño and La Niña to pCO2 variations. This quantity non-linearly increases with ΔDICbio; i.e. biological contributions to pCO2 variations increase as the buffering capacity decreases.
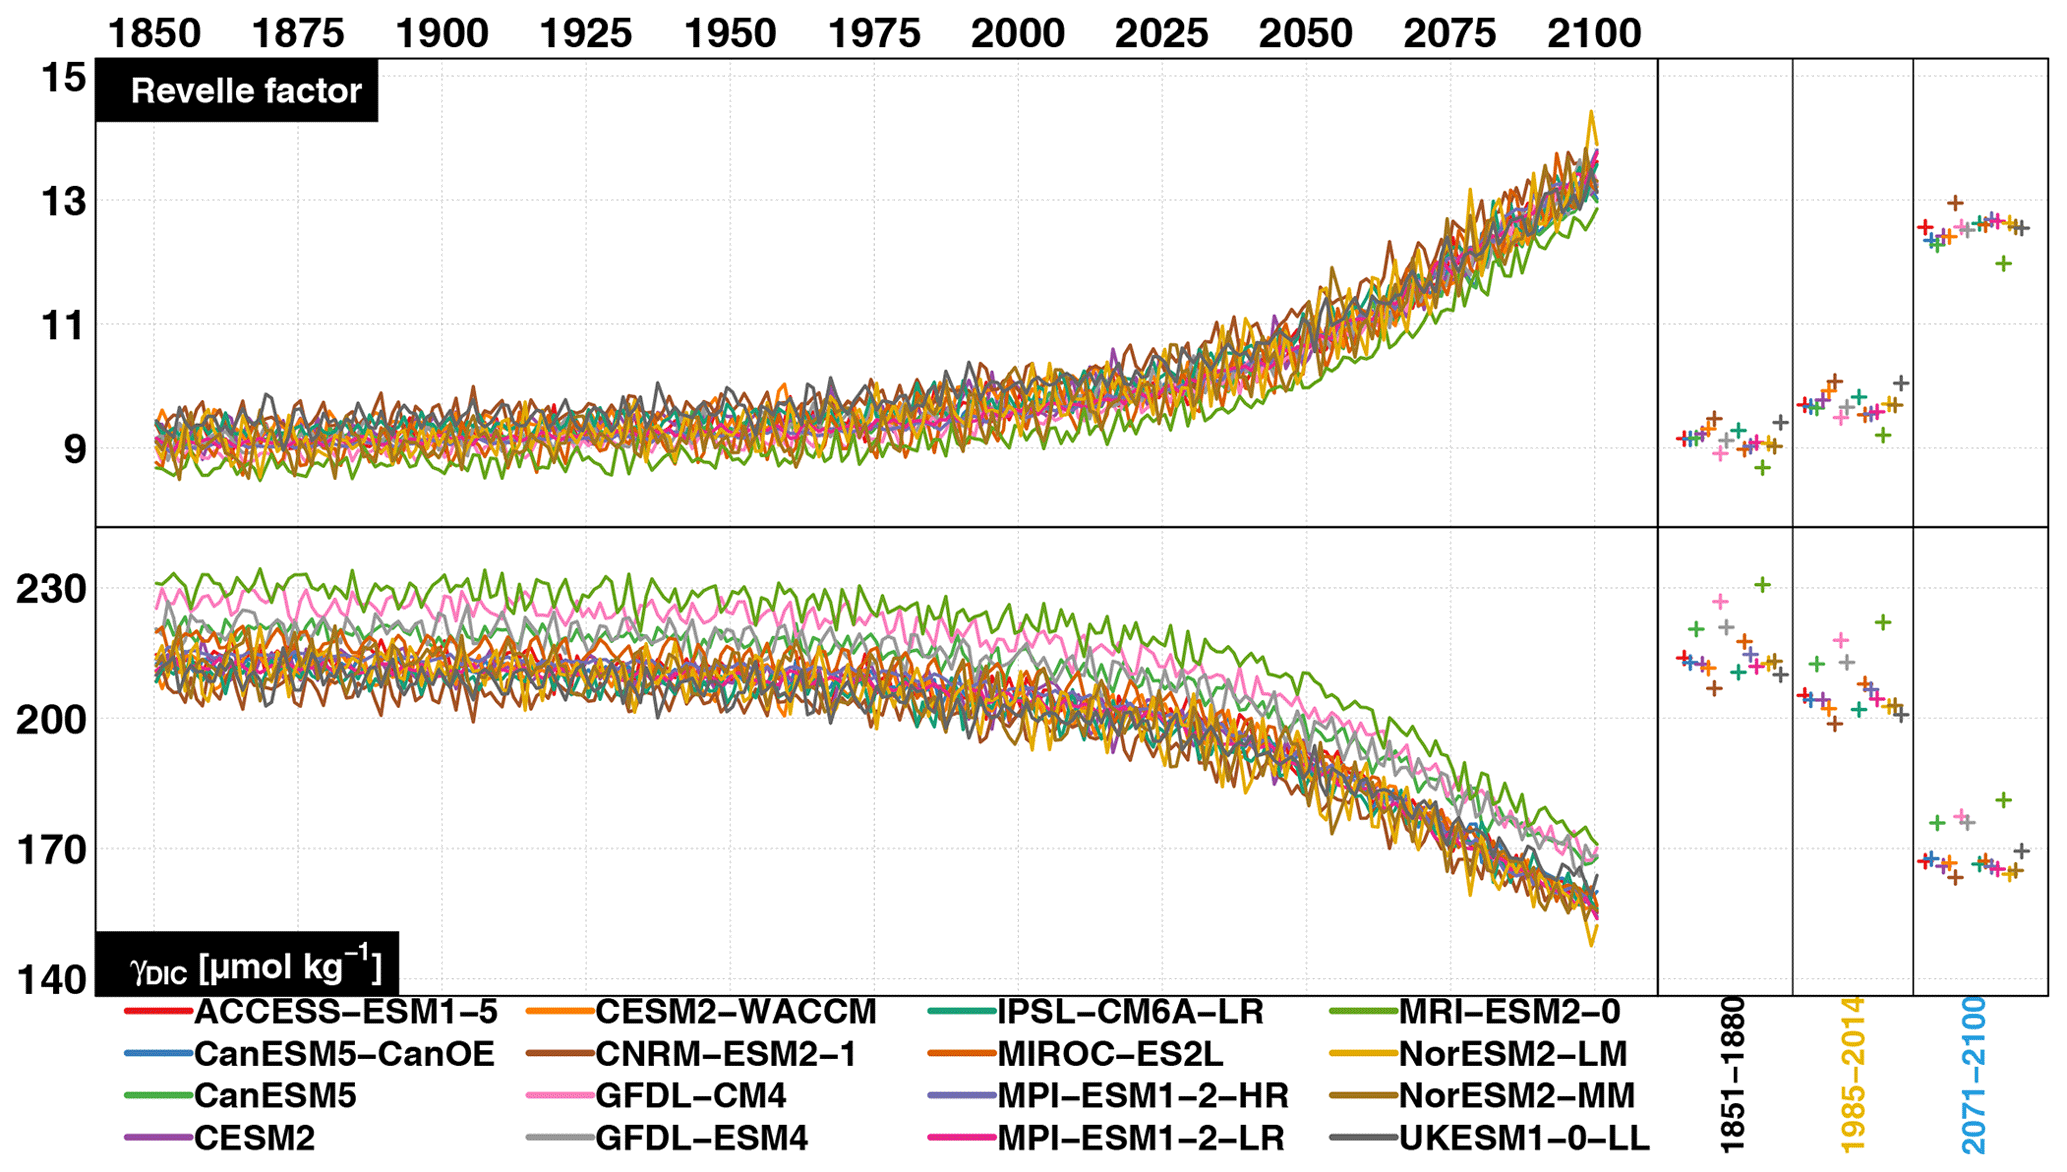
Figure 1Annual Revelle factor and γDIC (in µmol kg−1) for CMIP6 models. Average Revelle factor for each ESM over the early historical (1851–1880), contemporary (1985–2014), and future (2071–2100) periods are given on the right-hand side of the figure..
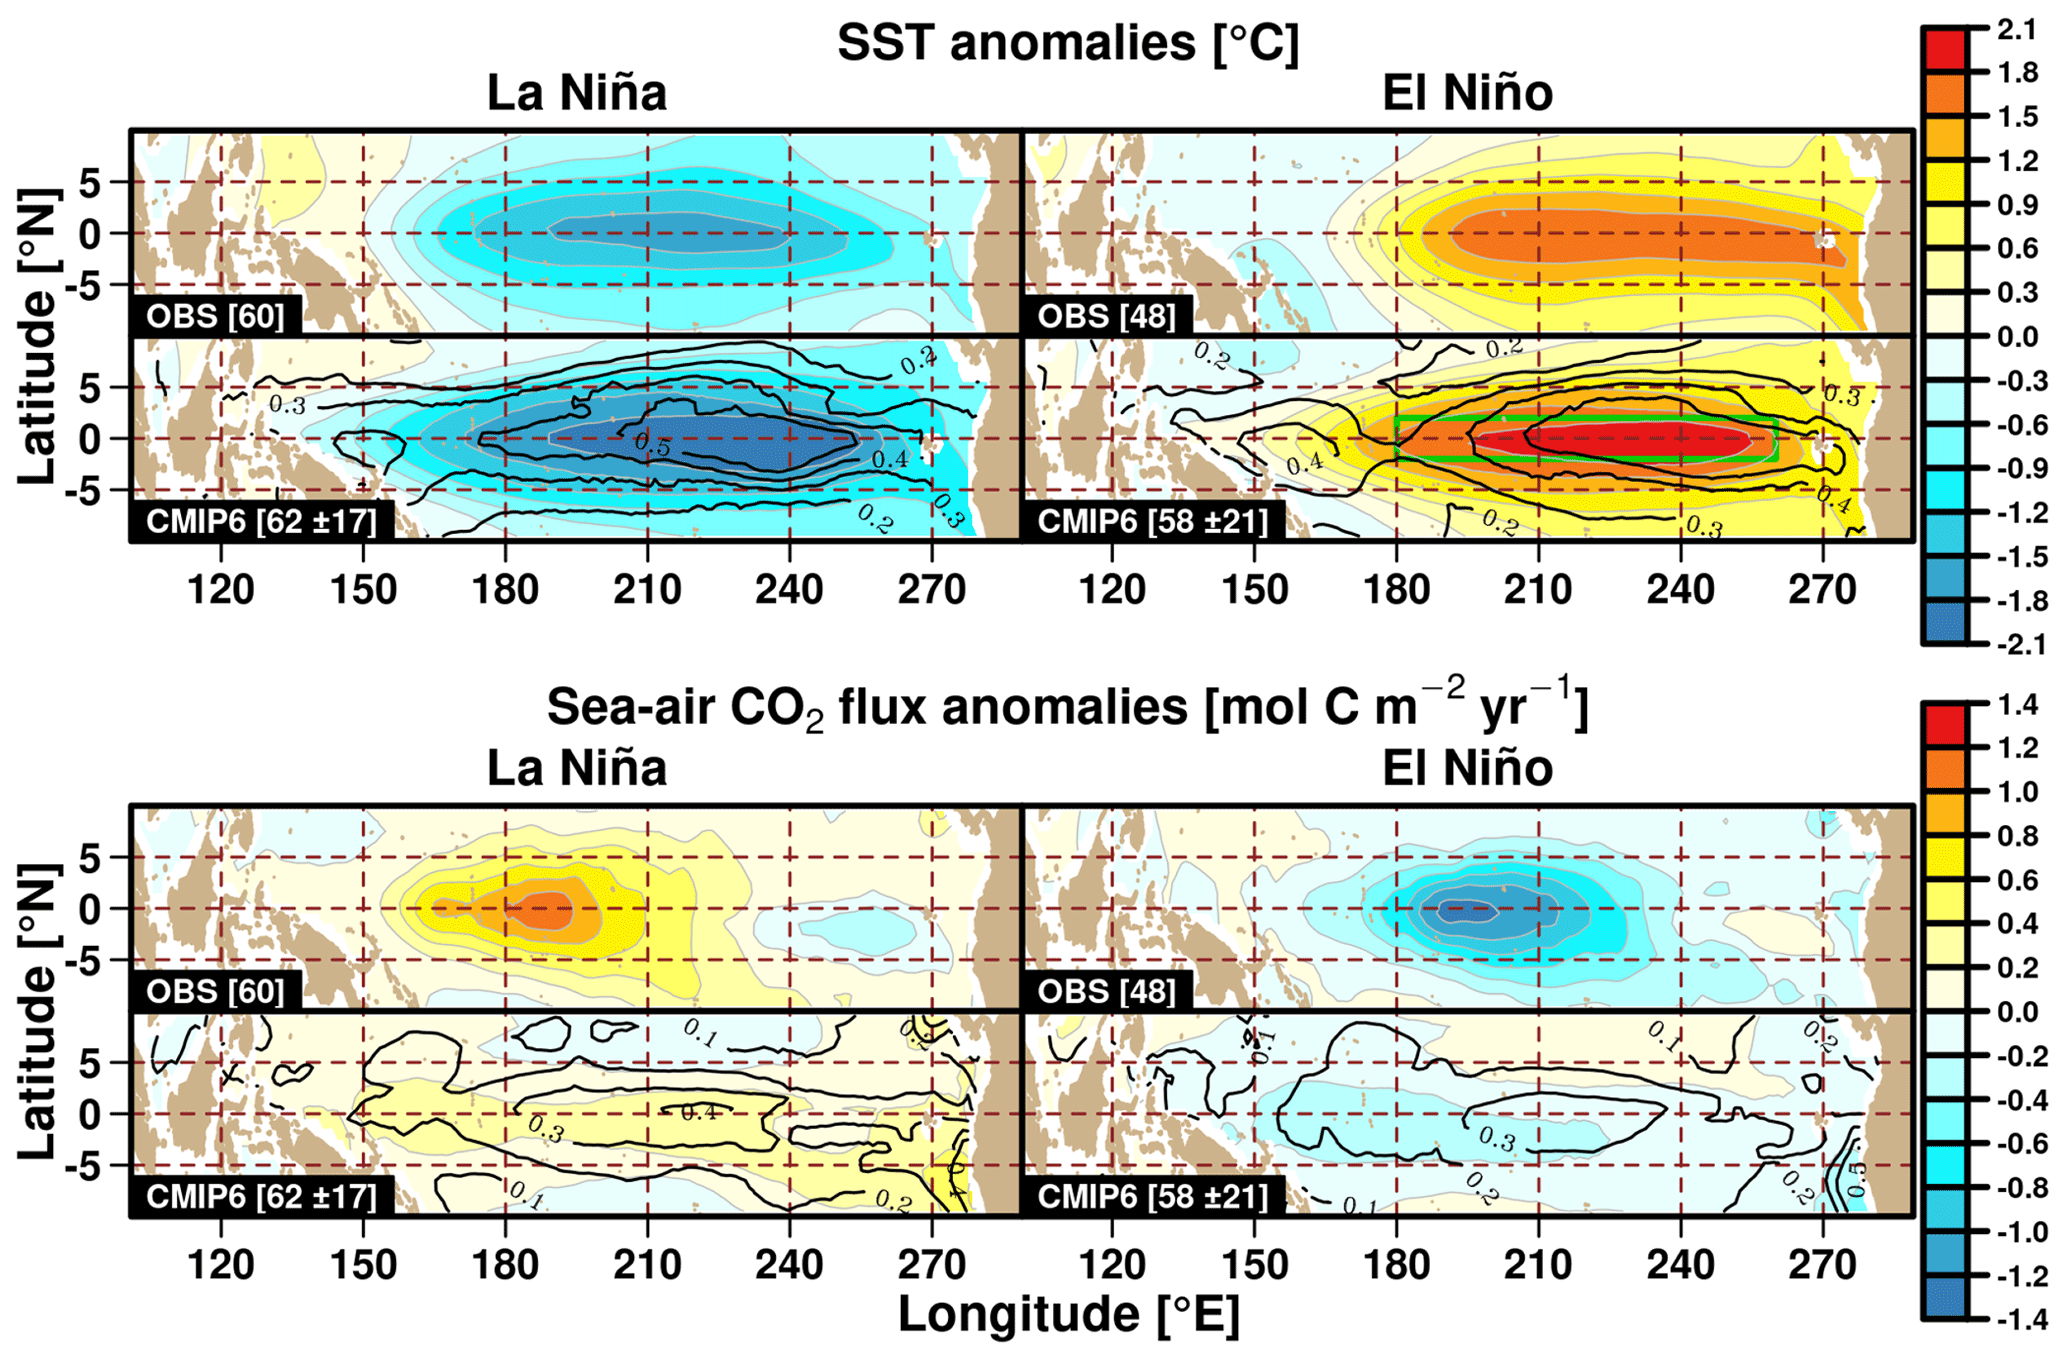
Figure 2Observed JRA-55 and mean CMIP6 SST (in ∘C, top) and observed MPI-SOM-FFN and mean CMIP6 sea–air CO2 fluxes (in mol C m−2 yr−1, bottom), shown as average anomalies over the 1985–2014 contemporary period for the La Niña (left) and El Niño (right) regimes. The number of months in each regime for the observations and the mean number with 1 standard deviation for the CMIP6 ensemble are both given in square brackets. Black contours represent the CMIP6 inter-model ensemble anomaly standard deviation during each ENSO phase. The green box in the lower-right SST panel illustrates the EP (equatorial Pacific) area.
2.5 Study area
For analysis of integrated surface properties, the focus on evaluating the anomalies over the equatorial Pacific is given within the 2∘ S–2∘ N and 180∘ E–260∘ E domain (hereafter referred to as the equatorial Pacific or simply EP). The EP area is indicated by the green box in the bottom-right SST panel of Fig. 2. This region is identified as the common domain where the models and observation show the largest change in SST between ENSO phases. The same domain is also considered for subsurface analysis conducted in this study, namely the changes in the vertical DIC, carbonate ion concentration, and temperature profiles between the contemporary and future periods.
3.1 Contemporary (1985–2014) ENSO-related patterns
Figure 2 depicts the average tropical Pacific SST and sea–air CO2 flux anomalies for La Niña and El Niño regimes over the contemporary period from observations and the CMIP6 multi-model mean. The corresponding values for each model are given in Figs. S1 and S2 in the Supplement. For surface temperature anomalies, some models clearly simulate too strong and too broad SST anomalies (Fig. S1), but the CMIP6 multi-model ensemble mean values show a strong resemblance with the observations, albeit with slightly too strong anomalies in the central equatorial Pacific. However, the warm anomalies observed over the coast of Peru during El Niño are slightly weaker in the model simulations. In these two regions, the inter-model variability is also large (contour lines in Fig. 2). For the sea–air CO2 flux anomalies, the simulated spatial extent are less in agreement with the observational estimates. The spatial distribution of CO2 flux anomalies is also different from one model to another, and none of the models simulate a spatial correlation with observations of more than 0.8 according the regime, with negative correlation even present (see Fig. S3 in the Supplement). The co-location of spatial distribution of the temperature and CO2 flux anomalies during the ENSO phase is quite straightforward in the observations while it seems less obvious in the models. This suggests that some of the observed mechanisms governing the ENSO-related variability of CO2 flux are not well reproduced by the models. Most models simulate weaker CO2 flux anomalies compared to the observations, which is consistent with the CMIP5 model results (Dong et al., 2017). Nevertheless, the multi-model mean reproduces the observed outgassing anomaly signals over most of the tropical Pacific during La Niña (and vice versa for El Niño). The same results are obtained when looking for more extreme El Niño and La Niña regimes (for months with a Niño34 index above 1.5 and below −1.5 SD, respectively, not shown).
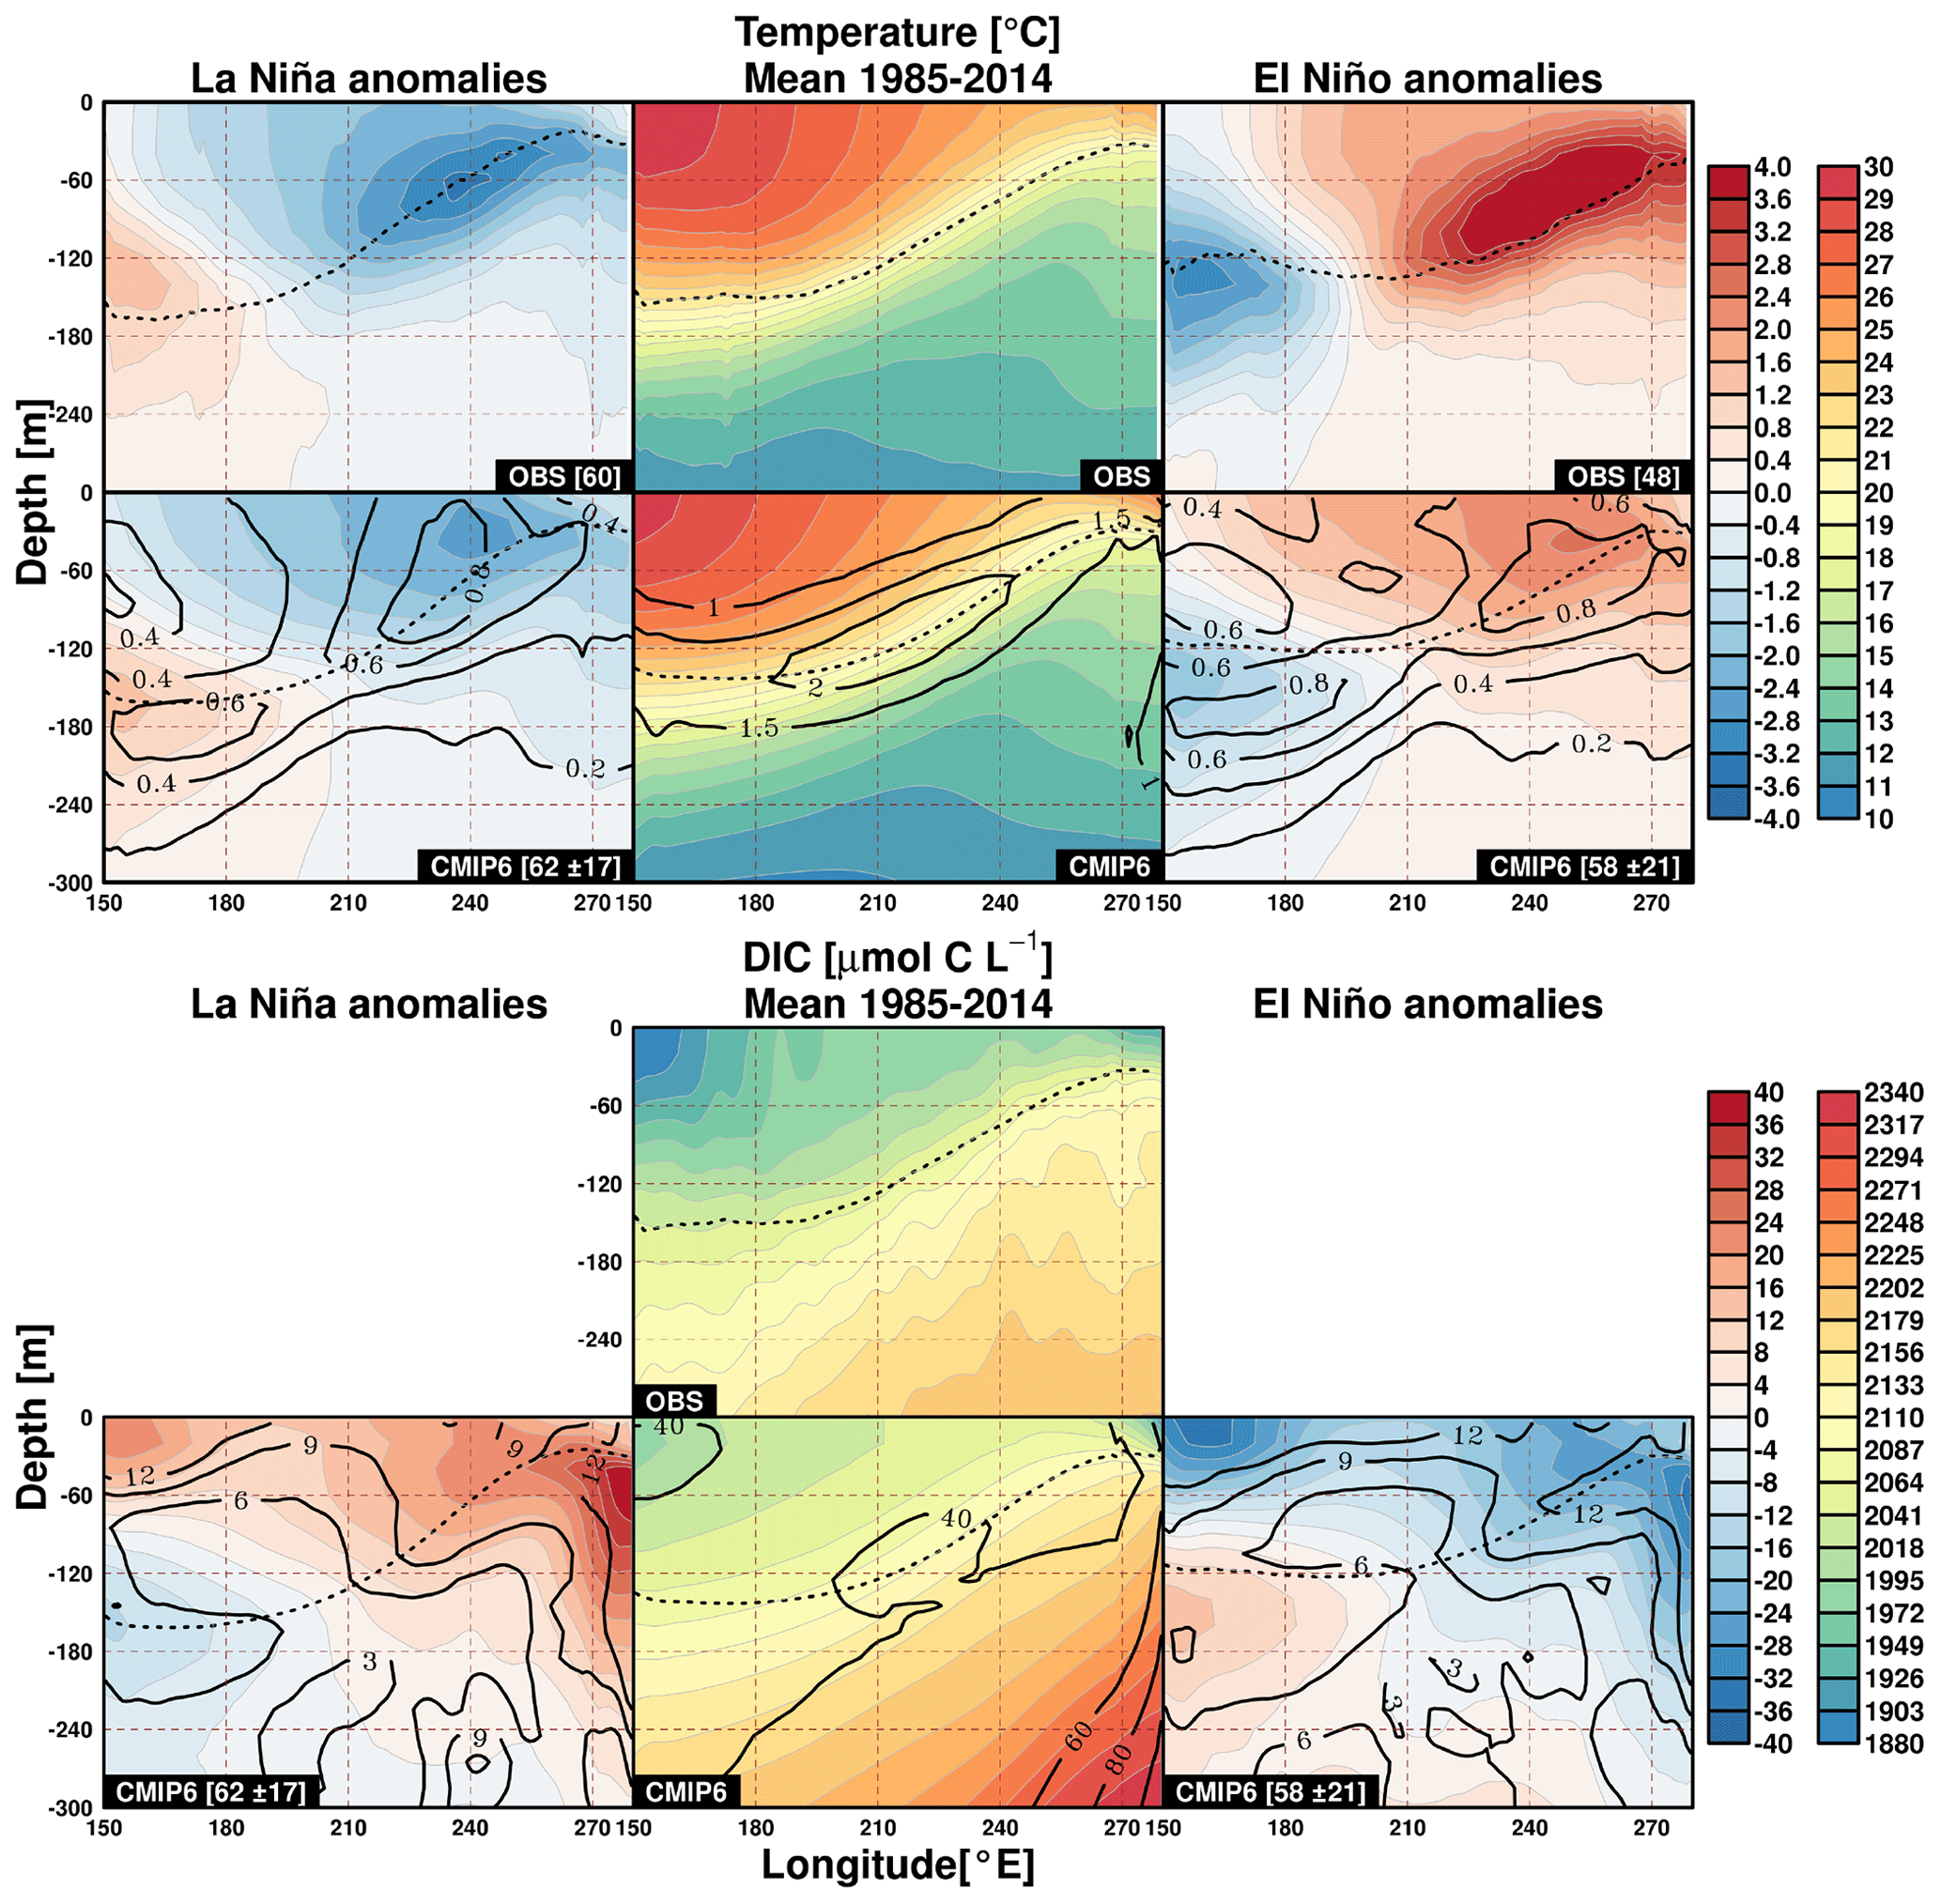
Figure 3Observed and mean CMIP6 vertical sections of temperature (in ∘C, top) and DIC (in µmol C L−1, bottom) as a zonal (between 2∘ N and 2∘ S) average over the 1985–2014 contemporary period (middle column). The average anomalies (differences) relative to contemporary mean are given for the La Niña (left) and El Niño (right) regimes. Note that the observed DIC average represents the climatology over the 2004–2017 period. Dotted lines indicate the average thermocline depth. In square brackets, the number of months in each regime is given for the observations and the mean number (with 1 SD) is given for the CMIP6 ensemble. Black contours represent the standard deviation of the CMIP6 inter-model ensemble anomalies during each ENSO phase.
Figure 3 shows the zonal average of temperature and DIC vertical sections over the contemporary period and its anomalies during the La Niña and El Niño regimes from the observations and the CMIP6 ensemble mean (for DIC, only the mean values is shown for observations). During El Niño events, the observations depict a clear warming signal in the eastern part of the tropical Pacific extending throughout the upper ocean with a maximum warming around 70 m depth. A cool anomaly can be seen in the western part of the domain at approximately 150 m depth. The opposite anomaly patterns can be seen during La Niña. The observed and simulated long-term mean temperature patterns are quite similar, whereas the magnitude of the anomalies is weaker in the CMIP6 multi-model mean. The contemporary DIC average concentration is generally higher in the models than in the observations. Note that the observed average is the result of the climatology over the 2004–2017 period, whereas the average for CMIP6 is computed over 30 years (1985–2014). The subsurface DIC signals of anomalies contrasting La Niña and El Niño regimes are pronounced in the upper layer and to the east of 240∘ E down to 300 m, with positive (negative) anomalies during La Niña and El Niño associated with changes in the upwelling dynamics. This area also presents the largest inter-model variability. Consequently, this DIC anomaly determines the CO2 flux anomaly at the surface. An opposite DIC anomaly signal is simulated in the western part of the section below 100 m depth. The zonal average of temperature and DIC along the vertical sections and their anomalies in each individual model are given in Figs. S4 and S5 in the Supplement.
3.2 Transient changes in ENSO–CO2 flux relationship
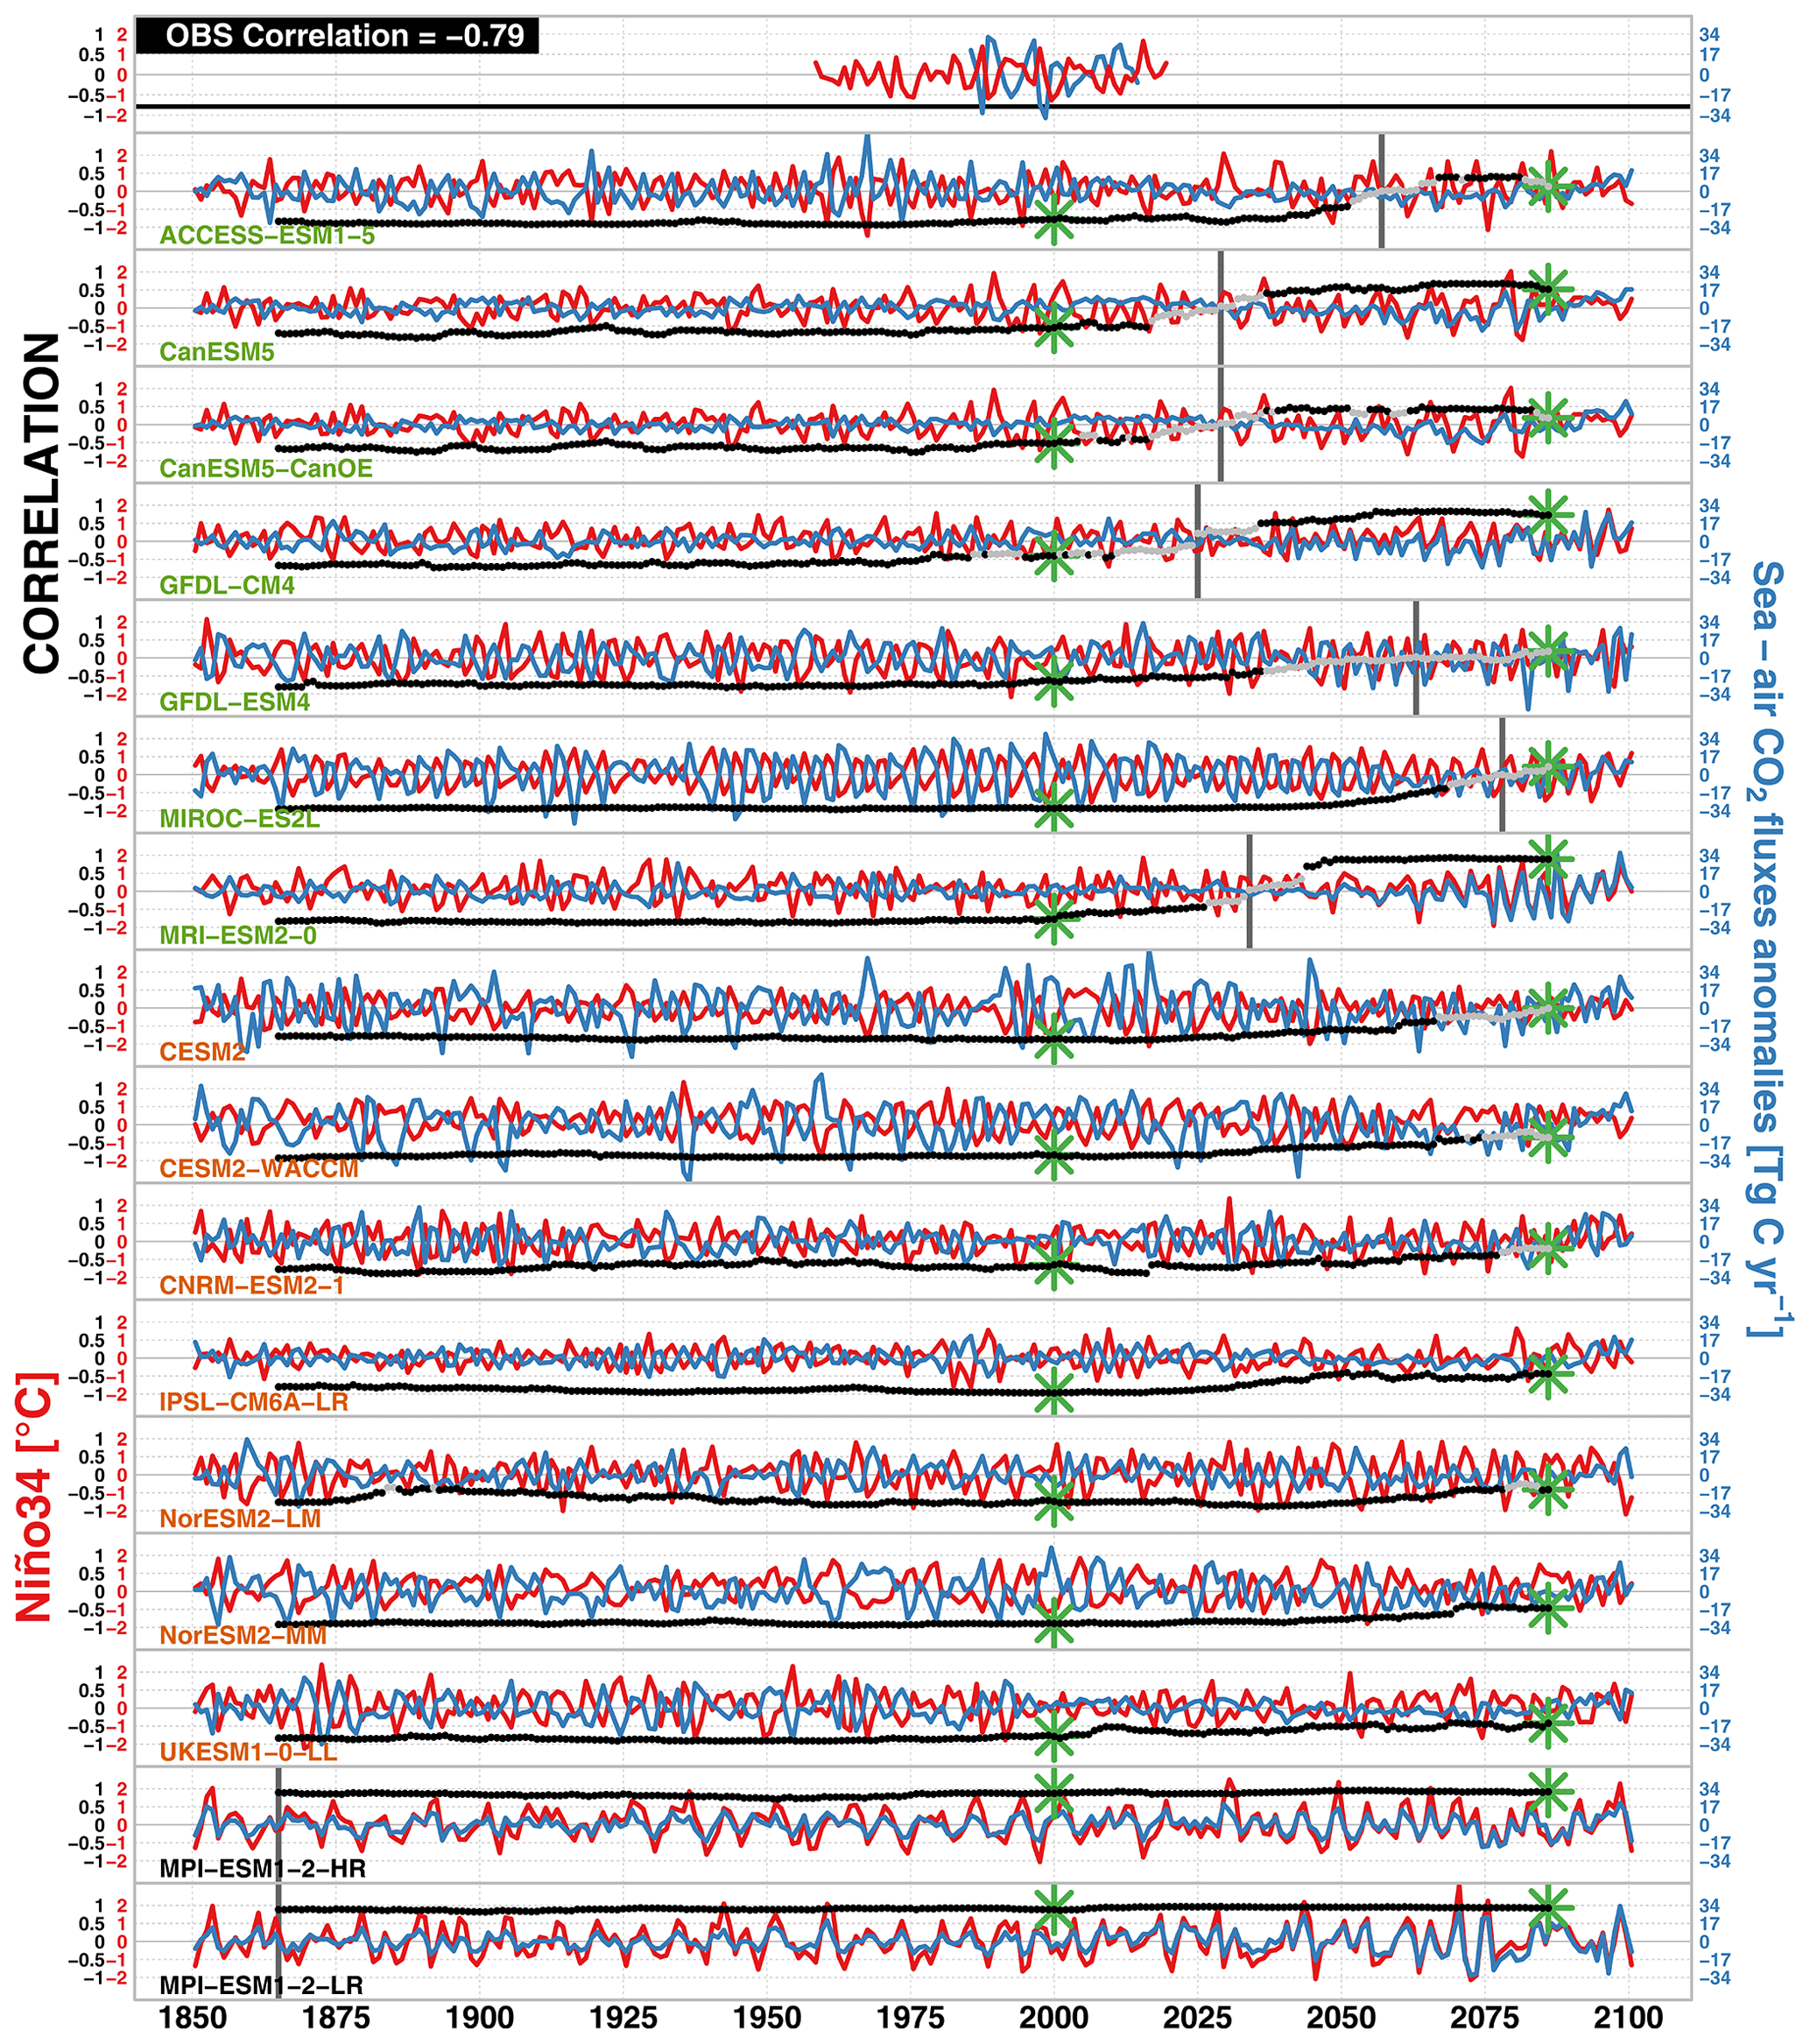
Figure 4CMIP6 model ensemble annual time series of the Niño34 index (in ∘C, red lines), the average CO2 flux anomalies over the EP area (in Tg C yr−1, blue lines), and the correlation for each 30-year moving window (significant correlations are indicated by black dots, and the non-significant ones are shown in grey). The vertical bars indicate the centre 30-year period with the first positive correlation. The first row shows the observed time series of the Niño34 index and average CO2 fluxes anomalies over the 1985–2014. The green asterisks indicate the correlation of the models over the observed and 2071–2100 periods. Model names are given in green for the models with a shifting correlation sign, those maintaining the negative correlation are shown in orange, and those simulating positive correlation already in 1850 are shown in black.
In this section, the characteristics of sea–air CO2 flux variability associated with ENSO are investigated over the EP area. Figure 4 represents the annual Niño34 index and the annual average CO2 flux anomalies from observations and 16 CMIP6 models. A correlation analysis between CO2 flux anomaly and ENSO index is performed to study the strength and direction of the linear relationship between these two variables. The statistical significance of these correlations is assessed by testing if the correlation follows a Student's t distribution (with N-2 degrees of freedom, N being the number of years) at the 95 % significance level. The correlation between the annual CO2 flux anomaly and annual ENSO index is given for the models for each 30-year sliding window (30 years is a typical climatological window used in numerous studies) over the 1850–2100 period. The observed correlation over 1985–2014 is significantly negative (), which is also the case for all the models at the beginning of the 1850–2100 period (except for the two MPI models). Among these models, seven maintain a negative correlation throughout the future period, while seven display a shift toward a positive correlation that occurs as early as 2025. The CMIP6 model correlations over the observational period and the 2071–2100 period are indicated by the green asterisks in Fig. 4 and reported in Table 3. Figure S9 in the Supplement is the same as Fig. 4 but zoomed over the contemporary period.
Table 3Standard deviations of sea–air CO2 fluxes (); in Tg C m−2 yr−1) and the Niño34 index (σNiño34); in ∘C and their annual correlation coefficients ρ over the 1985–2014 period. In brackets are the standard deviation and correlation over the 2071–2100 period. The average Revelle factors for each model and both periods are also given. Models in bold have significant correlation for both periods and are the ones selected for the “reversed” and “preserved” groups.
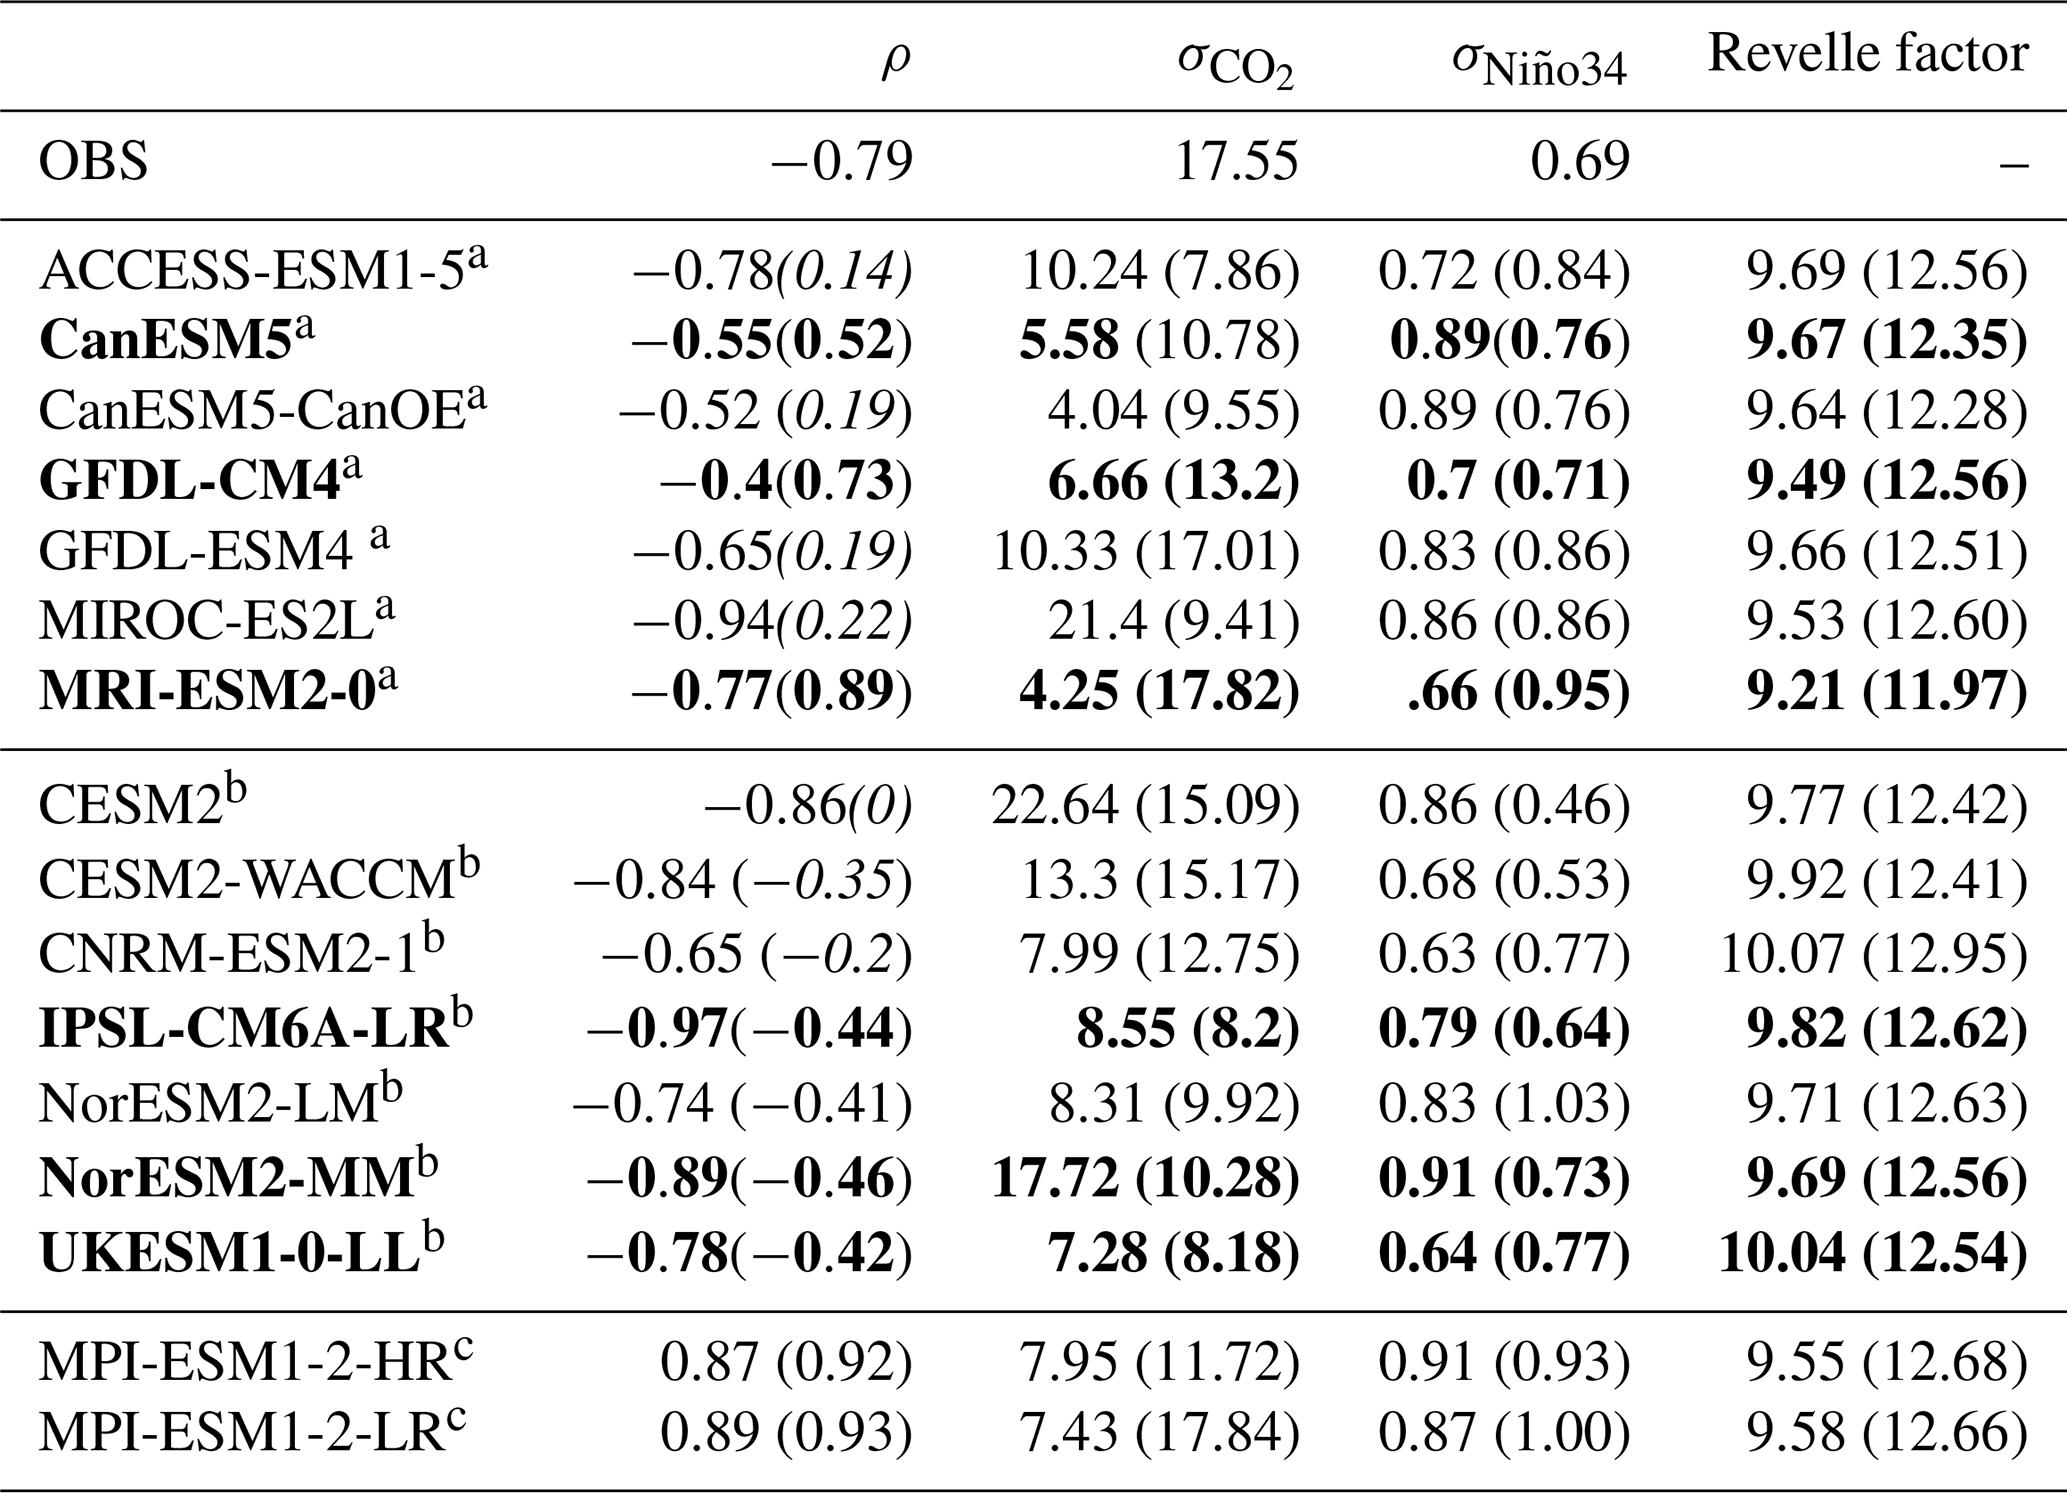
a The models with shifting towards a positive correlation. b The models maintaining negative correlation. c The models starting with positive correlation. Non-significant correlations are given in italic.
Figure 4 also shows that the amplitude of CO2 flux anomalies and their covariance with the Niño34 index are not uniform across the models. The correlation between sea–air CO2 flux anomalies and Niño34 are given in Table 3 along with their respective standard deviations and . The contemporary variability of CO2 flux anomaly is underestimated by most of the models (see Table 3) and increases or decreases in the future according the models. Six models, given in bold in Table 3, are selected to illustrate the shifting and non-shifting CO2 flux anomaly responses to ENSO variability in their future projections. These are the models that are selected because they best reproduce the observed Niño index and CO2 flux anomaly correlations in the contemporary period while the correlation is significant over contemporary and future periods.
The monthly Niño34 index of the six selected models is presented against the CO2 fluxes anomalies in Fig. 5 for both the contemporary (1985–2014) and future (2071–2100) periods. Values from present-day observations are also depicted. The models in the first row (CanESM5, GFDL-CM4, MRI-ESM2-0) show a change in the Niño34-CO2 flux correlation, while the models in the second row (IPSL-CM6A-LR, NorESM2-MM, UKESM1-0-LL) maintain the sign of the correlation between 1850 and 2100. This reversal is thus independent of the model's ability to reproduce the observed correlation over the contemporary period, though the models in the first row tend to simulate lower than observed CO2 flux anomaly variability. Hereafter, these first row models that simulate a reversal in ENSO–CO2 flux relationship are referred to as “reversed” ESMs, while the other three ESMs that maintain the contemporary relationship are referred to as “preserved” ESMs. These two groups of models are confronted in further analysis.
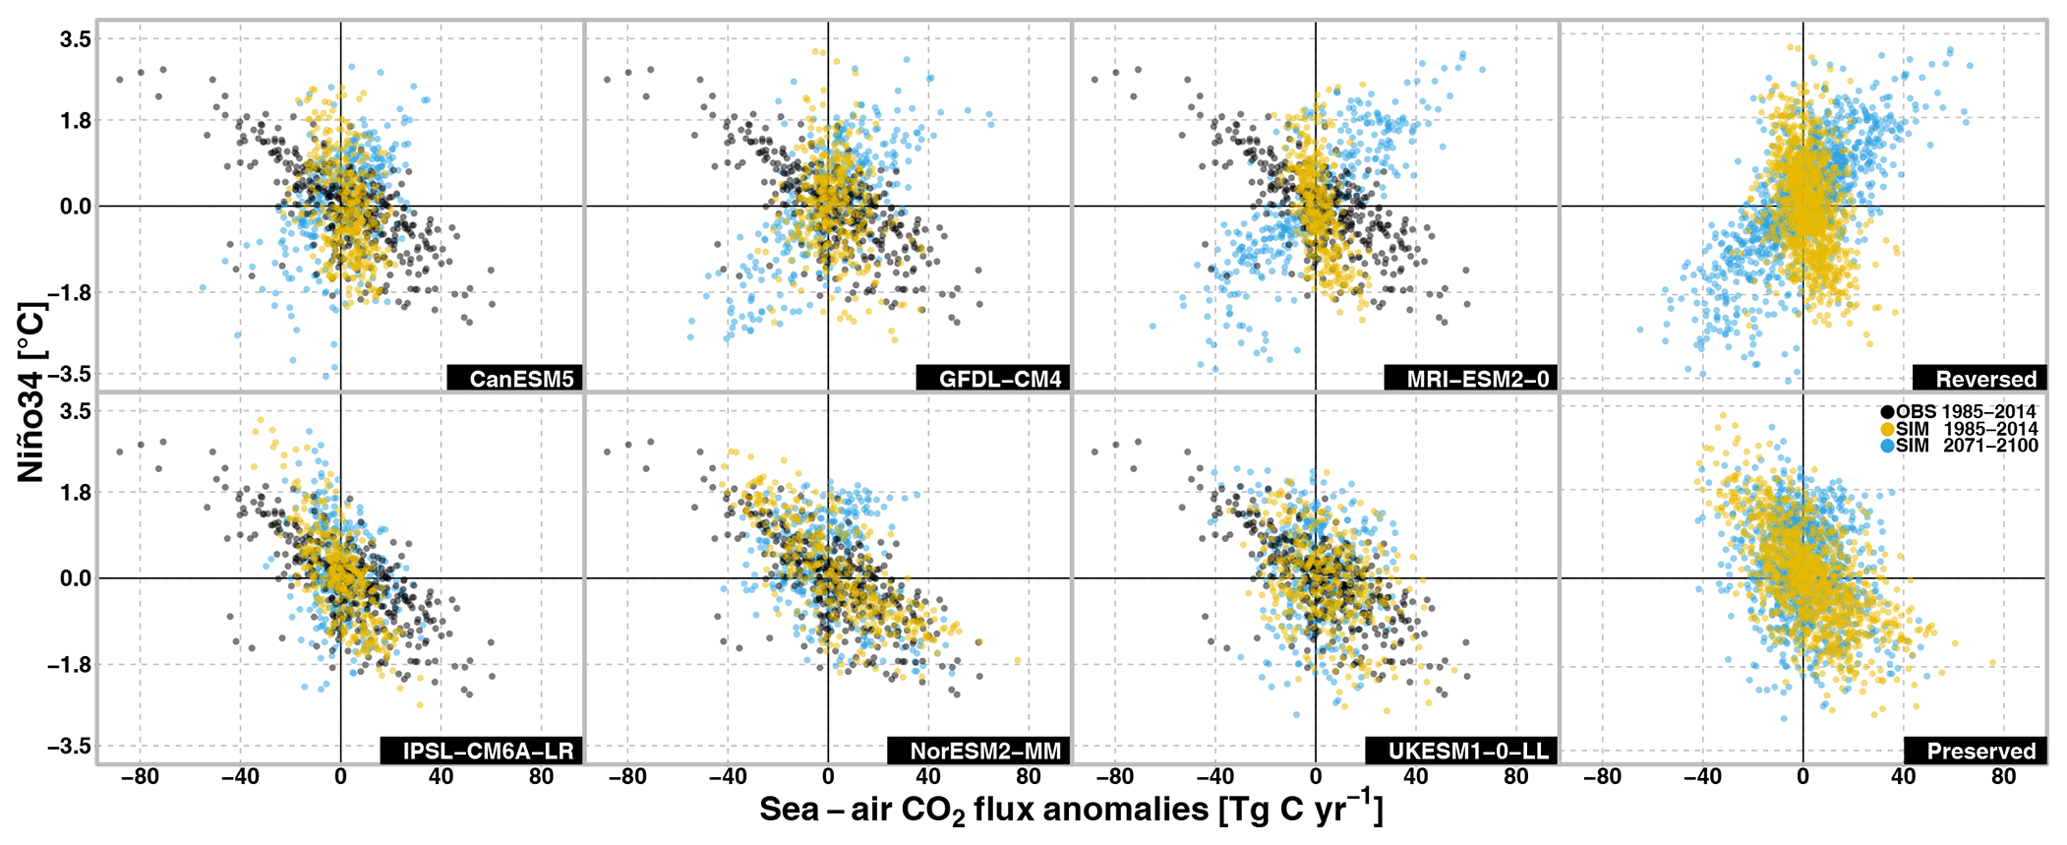
Figure 5Scatter plots for the six selected models of the monthly Niño34 index (in ∘C) against the monthly CO2 flux anomalies (in Tg C yr−1) averaged over the EP domain in the 1985–2014 contemporary period (in yellow) and the 2071–2100 period (in blue). The observed scatter plot is given in black. The top panels show CanESM5, GFDL-CM4, MRI-ESM2-0, and all reversed ESMs. The bottom panels are for IPSL-CM6A-LR, NorESM2-MM, UKESM1-0-LL, and all preserved ESMs.
3.3 Drivers of ENSO–CO2 flux variability
In order to elucidate the drivers of the modified relationship in the reversed ESMs, the thermal and non-thermal contributions to pCO2 are investigated. Figure 6 represents the average El Niño and La Niña of the pCO2 anomaly means for the reversed and preserved ESMs over the early historical (1851–1880), contemporary, and future periods. As expected, the pCO2 thermal (non-thermal) component always induces positive (negative) anomalies during El Niño, while the opposite is true during La Niña. The non-thermal component is rather dominant (non-thermal/thermal ratios >100 %) during the early historical period (1851–1880) and even more dominant during La Niña (bigger ratios). This explains the total pCO2 positive anomalies during La Niña (consistent with enhanced CO2 outgassing; Fig. 2) and the negative anomalies during El Niño (consistent with weakened CO2 outgassing) for both groups of ESMs over the early historical and contemporary periods. Over the future period, the dominance of the non-thermal component is even enhanced for preserved ESMs, which maintain the same CO2 flux–ENSO relationship. However, for the reversed ESMs the thermal component becomes dominant by the end of the 21st century (ratio <100 %), inducing total pCO2 negative anomalies during La Niña and positive anomalies during El Niño. The dominance of the thermal component explains the reversal in the ENSO–CO2 flux relationship highlighted in Figs. 4 and 5.
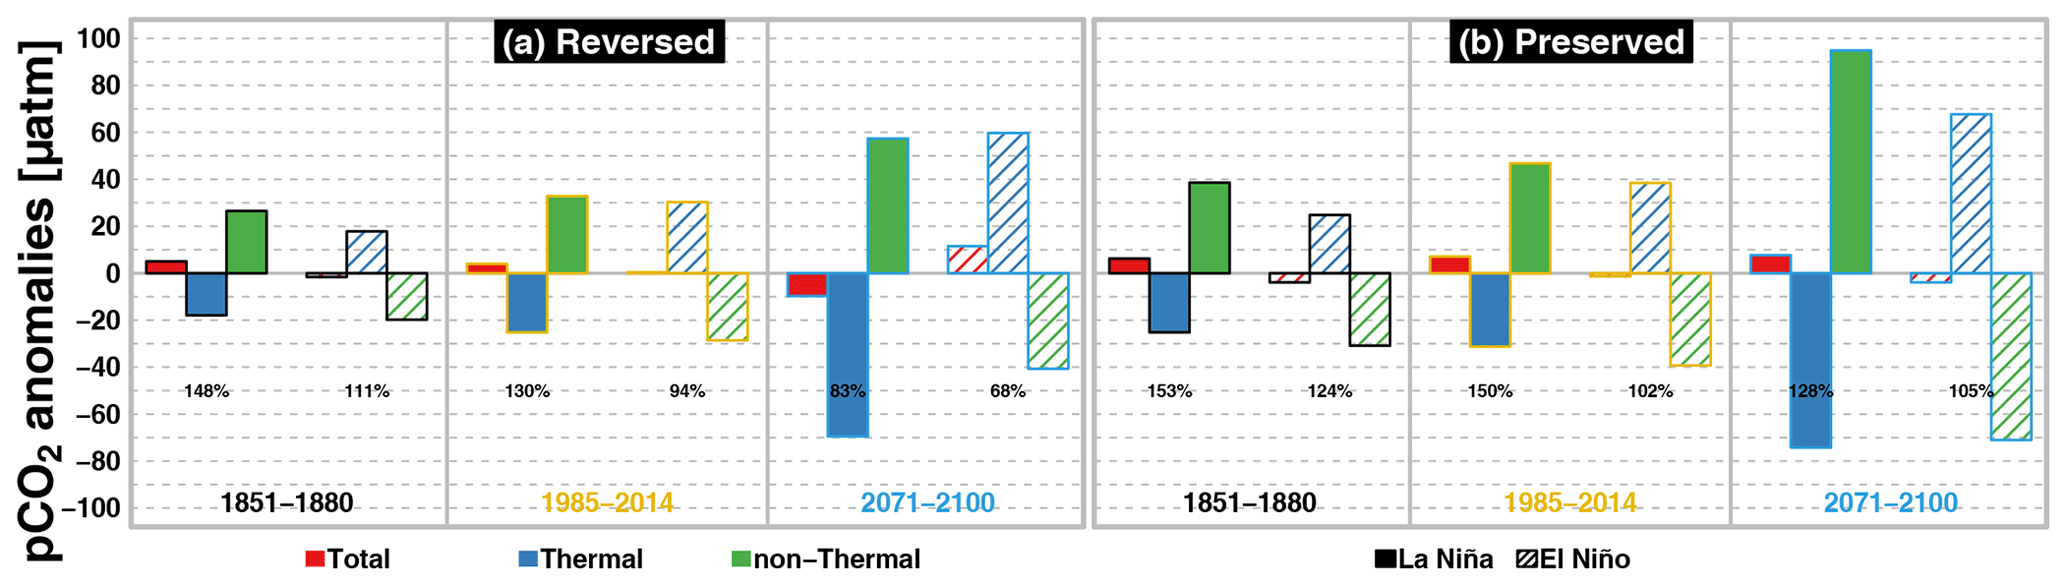
Figure 6El Niño and La Niña average of total (in red), thermal (in blue), and non-thermal (in green) pCO2 mean anomalies (in µatm) for the reversed (a) and preserved (b) ESMs over the early historical (1851–1880), contemporary (1985–2014), and future (2071–2100) periods in the EP domain. The absolute ratio between the non-thermal and thermal components is given (in %) for each period, group, and ENSO phase.
In a high CO2 future, it is expected that the pCO2 will be more sensitive to SST and surface DIC modulations due to lower buffering capacity (Fig. 1; see also Gallego et al., 2020). It is therefore useful to determine whether or not the reversal in the ENSO–pCO2 response can solely be attributed to the background atmospheric CO2 increase. Indeed, the non-thermal component is already dominant and will become more dominant as CO2 rises. In order to test this hypothesis, the anomaly estimates of the thermal and non-thermal components of early historical ENSO pCO2 signals are scaled to higher background pCO2, namely the contemporary and future periods. This enables us to evaluate how the non-thermal/thermal ratio varies into the future assuming no change in the biological and physical forcing (i.e. amplitude of ENSO-induced changes in SST and DIC are unchanged). This is done by keeping the dSST variable in Eqs. (1) and (2) at the values of the early historical period, while scaling up the pCO2 elements to contemporary and future values. A similar figure to Fig. 6 showing these scaled components is given in Fig. S7 in the Supplement. Following this scaling, the non-thermal component remains dominant for the three periods in both groups of models. This means that the pCO2 increase alone cannot explain the reversal behaviour in the reversed ESMs. It suggests changes in biological and physical forcing are also responsible for the thermal component becoming more dominant in this group of ESMs.
In addition to surface ocean pCO2, CO2 flux is estimated using atmospheric pCO2 and wind solubility coefficient k⋅K0 as follows:
where k represents the gas transfer velocity and K0 the solubility coefficient (cf. Wanninkhof, 2014). The anomalies of surface wind and product of k⋅K0 for each period, group of models and ENSO phase are depicted in Fig. S8 in the Supplement. The amplitude of both anomalies between ENSO phases is larger for the preserved models than the reversed ones, which partly explains the higher amplitude of CO2 flux variability variation between ENSO phases for the preserved models than the reversed models (see Table 3 and Fig. 5). However, for the respective groups the amplitudes between ENSO phases do not change between given the analysed periods. This means that the wind variability can only have a marginal contribution to CO2 flux variability and cannot explain the behaviour of the reversed models. In addition, we also note that the relatively low contemporary CO2 flux variation in the reversed models is also partly attributed to the simulated high alkalinity bias in these models (see Supplement Fig. S9), as high background alkalinity would dampen the DIC-induced pCO2 variability during the different ENSO phases.
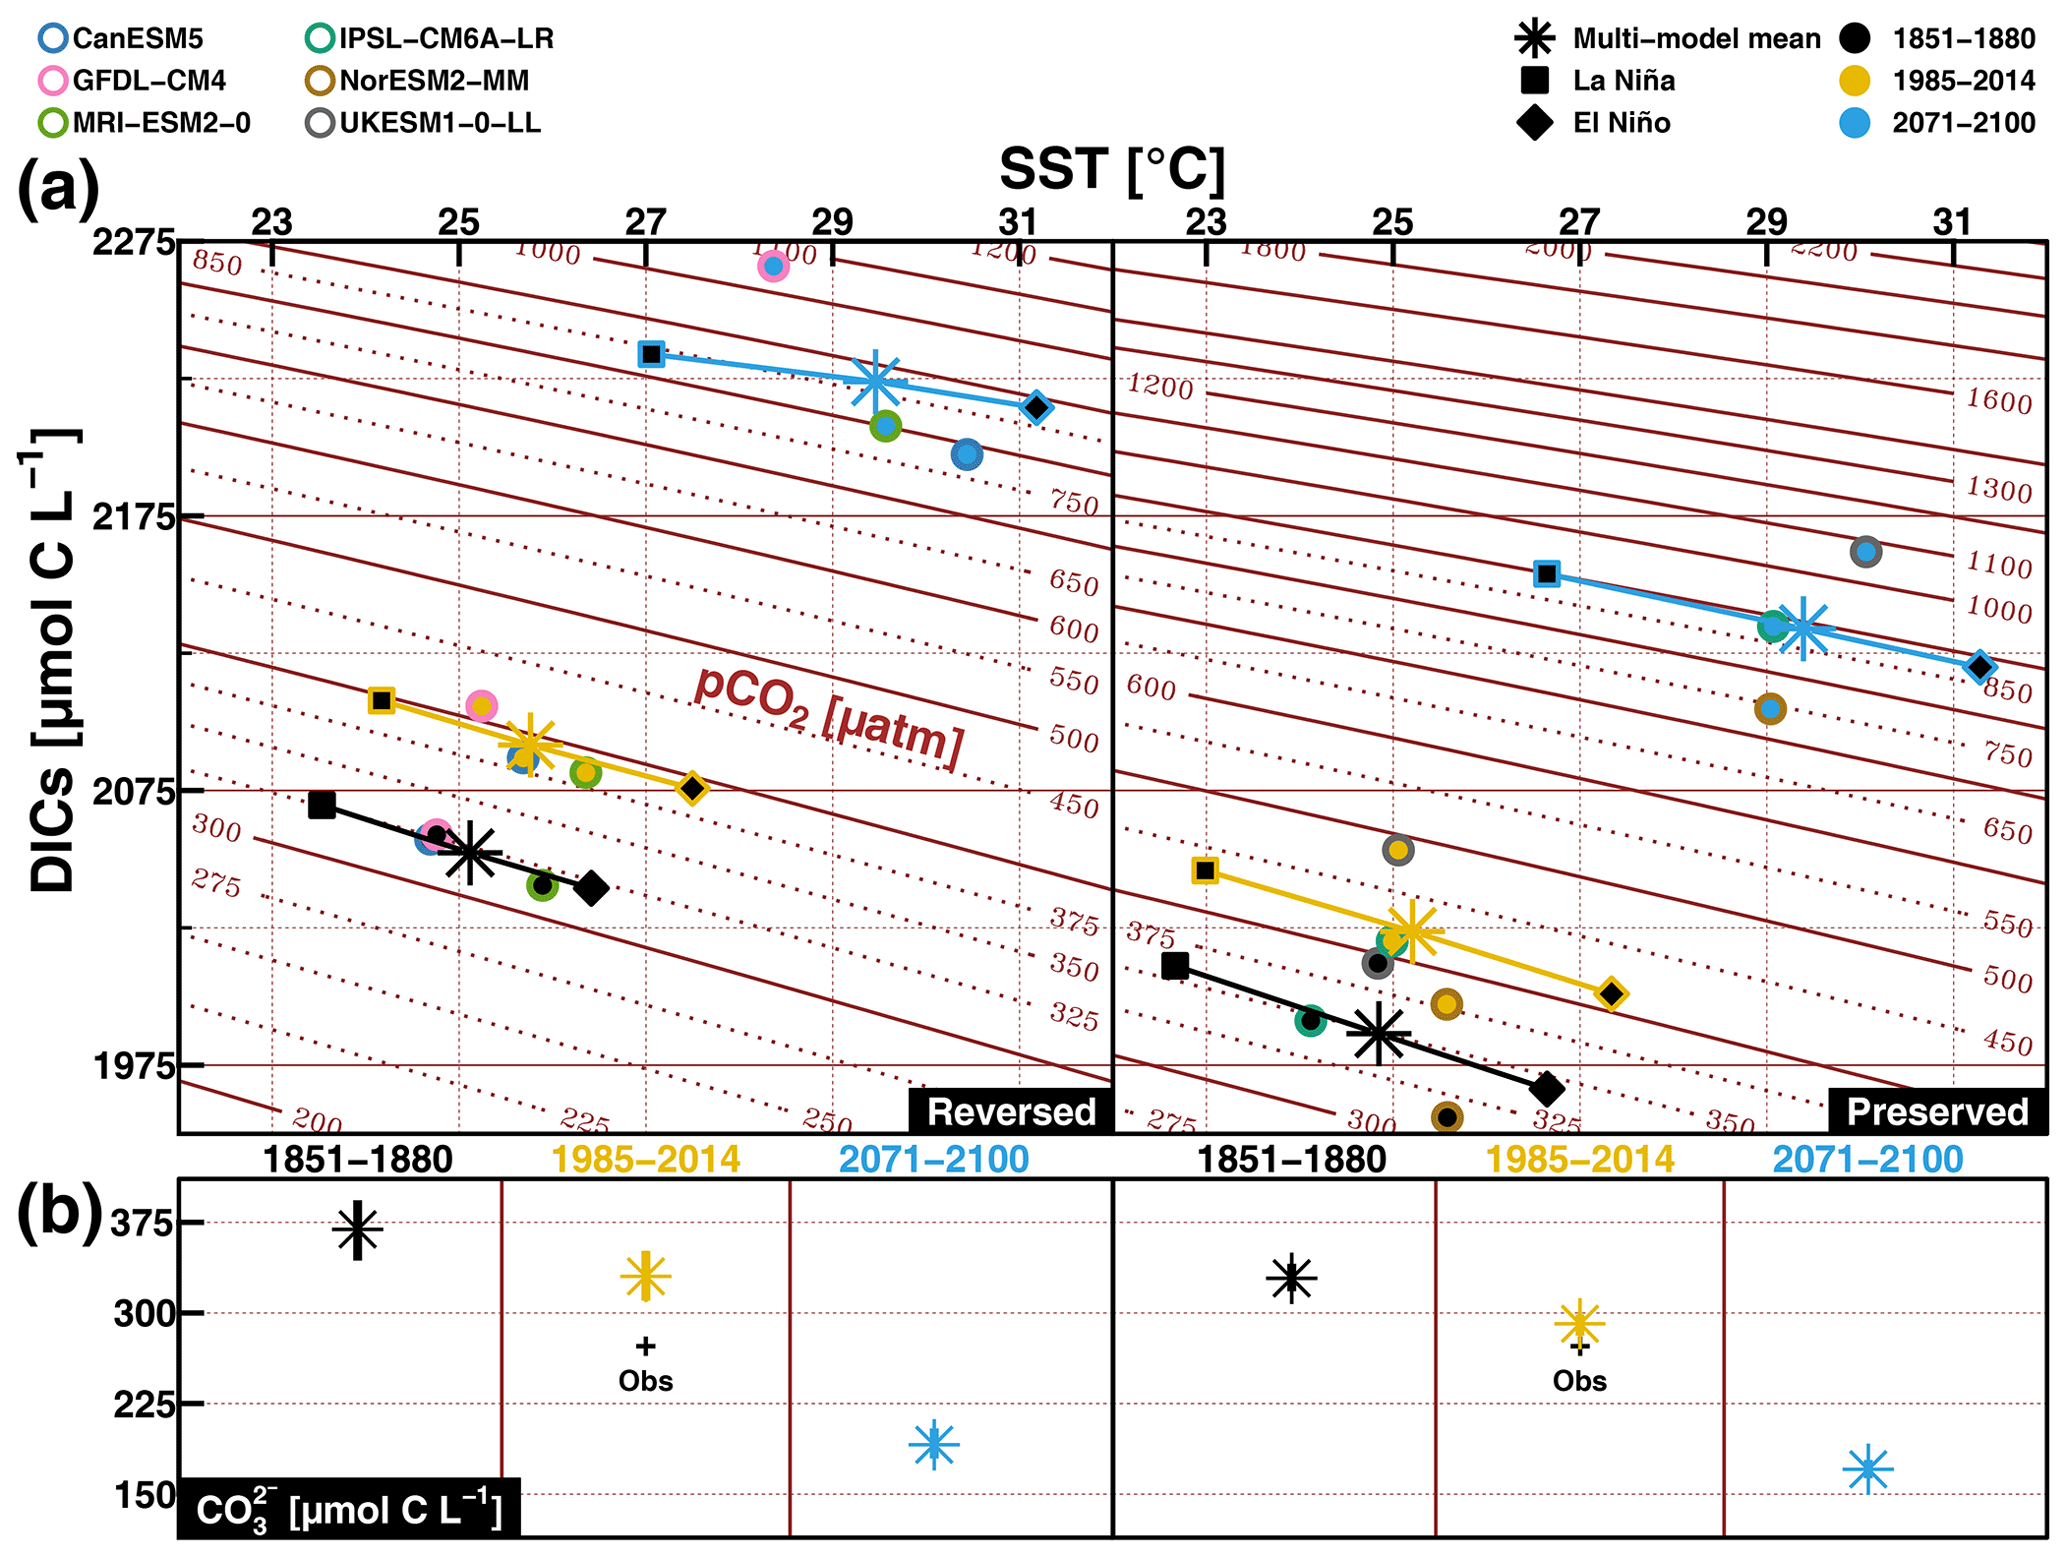
Figure 7Mean SST (in ∘C) versus mean salinity-normalized DIC (DICs, in µmol C L−1) over the early historical (1851–1880), contemporary (1985–2014), and future (2071–2100) periods in the EP domain simulated by all reversed and preserved ESMs (a, circle markers). The multi-model mean values of SST and DICs (asterisk markers) from each ESM group, together with their respective mean values during La Niña (square markers) and El Niño (diamond markers), are also depicted for the three periods. Isolevels of pCO2 for varying SST and DICs are given in the background. Panel (b) shows the multi-model range and mean of surface carbonate concentration (in µmol C L−1) for both groups and three periods.
Next, we quantify the pCO2 sensitivity to ENSO-induced temperature and DIC changes across different time periods. Figure 7 shows the mean states of SST against surface DICs (salinity-normalized DIC; DICs=DIC, with SSS0 representing the 30-year surface salinity average in a given period) for reversed and preserved ESMs over the early historical, contemporary, and future periods. The pCO2 isolevels for varying SST and DIC are computed using the carbonate system parameter codes from the R-package “seacarb” (Gattuso et al., 2020). These values have been computed using ALKs (salinity-normalized surface alkalinity) and SSS from multi-model mean state (over the 1850–2100 period) from reversed and preserved groups separately. The average has been taken over the whole simulation period and shows the small changes in ALKs and SSS from the early historical period to the future period (see Fig. S10 in the Supplement). The multi-model range and mean of average surface carbonate ion concentration is also given for both groups over the three periods.
All models show higher sensitivity of pCO2 to temperature and DICs perturbations in the future; i.e. the same variations of DIC or temperature in the future will induce a stronger change in surface pCO2. Indeed, pCO2 isolevels are getting closer as SST and DICs increase (see Fig. 7). The main difference between the two groups is that the reversed models simulate (i) a higher surface DICs increase from the early historical or contemporary period to the future period and (ii) a lower range of DICs changes during ENSO phases (from the early historical period to the future period, the absolute change of surface DICs between both ENSO phases evolves from 30.26 to 19.45 µmol C L−1 for reversed models and from 44.87 to 34.00 µmol C L−1 for preserved ones). The pCO2 level and its increase across different time periods are both very similar between the two ESM groups. The simulated temperature changes are also similar between both groups. The higher surface DIC increase in the reversed models can be explained by the higher CO ion concentration at the beginning of the transient simulation, which translates to higher carbon buffer capacity and allows these models to take up more excess carbon from the atmosphere. The lower surface DIC range (between in La Niña and El Niño regimes) in the reversed models could be associated with changes in biology- and/or upwelling-induced surface DIC fluctuations.
Takahashi et al. (1993) also mention pCO2 sensitivity to alkalinity and salinity. A similar figure as Fig. 7 but for the mean states of SSS against ALKs is given in supplementary Fig. S10. Given the important increase in temperature and DIC from the early historical to the future period (cf. Fig. 7) one panel per model group and period is produced. This figure shows higher SSS and ALKs for reversed models than the preserved ones. For both groups, the ALKs and SSS changes are very small from one period to another, indicating a limited sensitivity of pCO2 to future changes in salinity and alkalinity. Besides, the amplitude between ENSO phases is small for salinity and alkalinity (<.2 psu for SSS and <6.5 µmol eq L−1 for ALKs). Therefore, the relative contribution of ENSO-induced salinity and alkalinity changes to pCO2 is smaller than temperature and DIC changes.
Even without climate change, the influence of biological production on perturbing surface pCO2 is expected to increase with a higher Revelle factor in the future. Here, we quantify the contribution of biological production in reducing the surface pCO2 (i.e. ΔpCO2 bio) during both La Niña and El Niño phases according to Eq. (3). In the contemporary period, stronger primary productivity during La Niña attenuates the upwelling-induced pCO2 increase (and vice versa during El Niño). In addition, this anomaly pattern observed in the contemporary period is maintained into the future (see Fig. S12 in the Supplement depicting time series of the average intPP computed over the EP area). Figure 8 shows that these biological contributions significantly increase in the future, while higher ΔpCO2 bio persists during the La Niña phase. This stronger contrast in the biologically induced ΔpCO2 bio difference between La Niña and El Niño regimes is also enhanced by the increased future primary production variability simulated in the respective ESMs (Fig. S12). The projected variability in primary production between La Niña and El Niño is even bigger for the reversed ESMs than for preserved ESMs (i.e. larger by up to a factor of 5; see Fig. S12). Note that the majority of the chosen ESMs simulate a declining trend in the primary production toward the end of the 21st century. The export production at 100 m also shows similar ENSO-induced variability and evolution to the intPP (not shown).
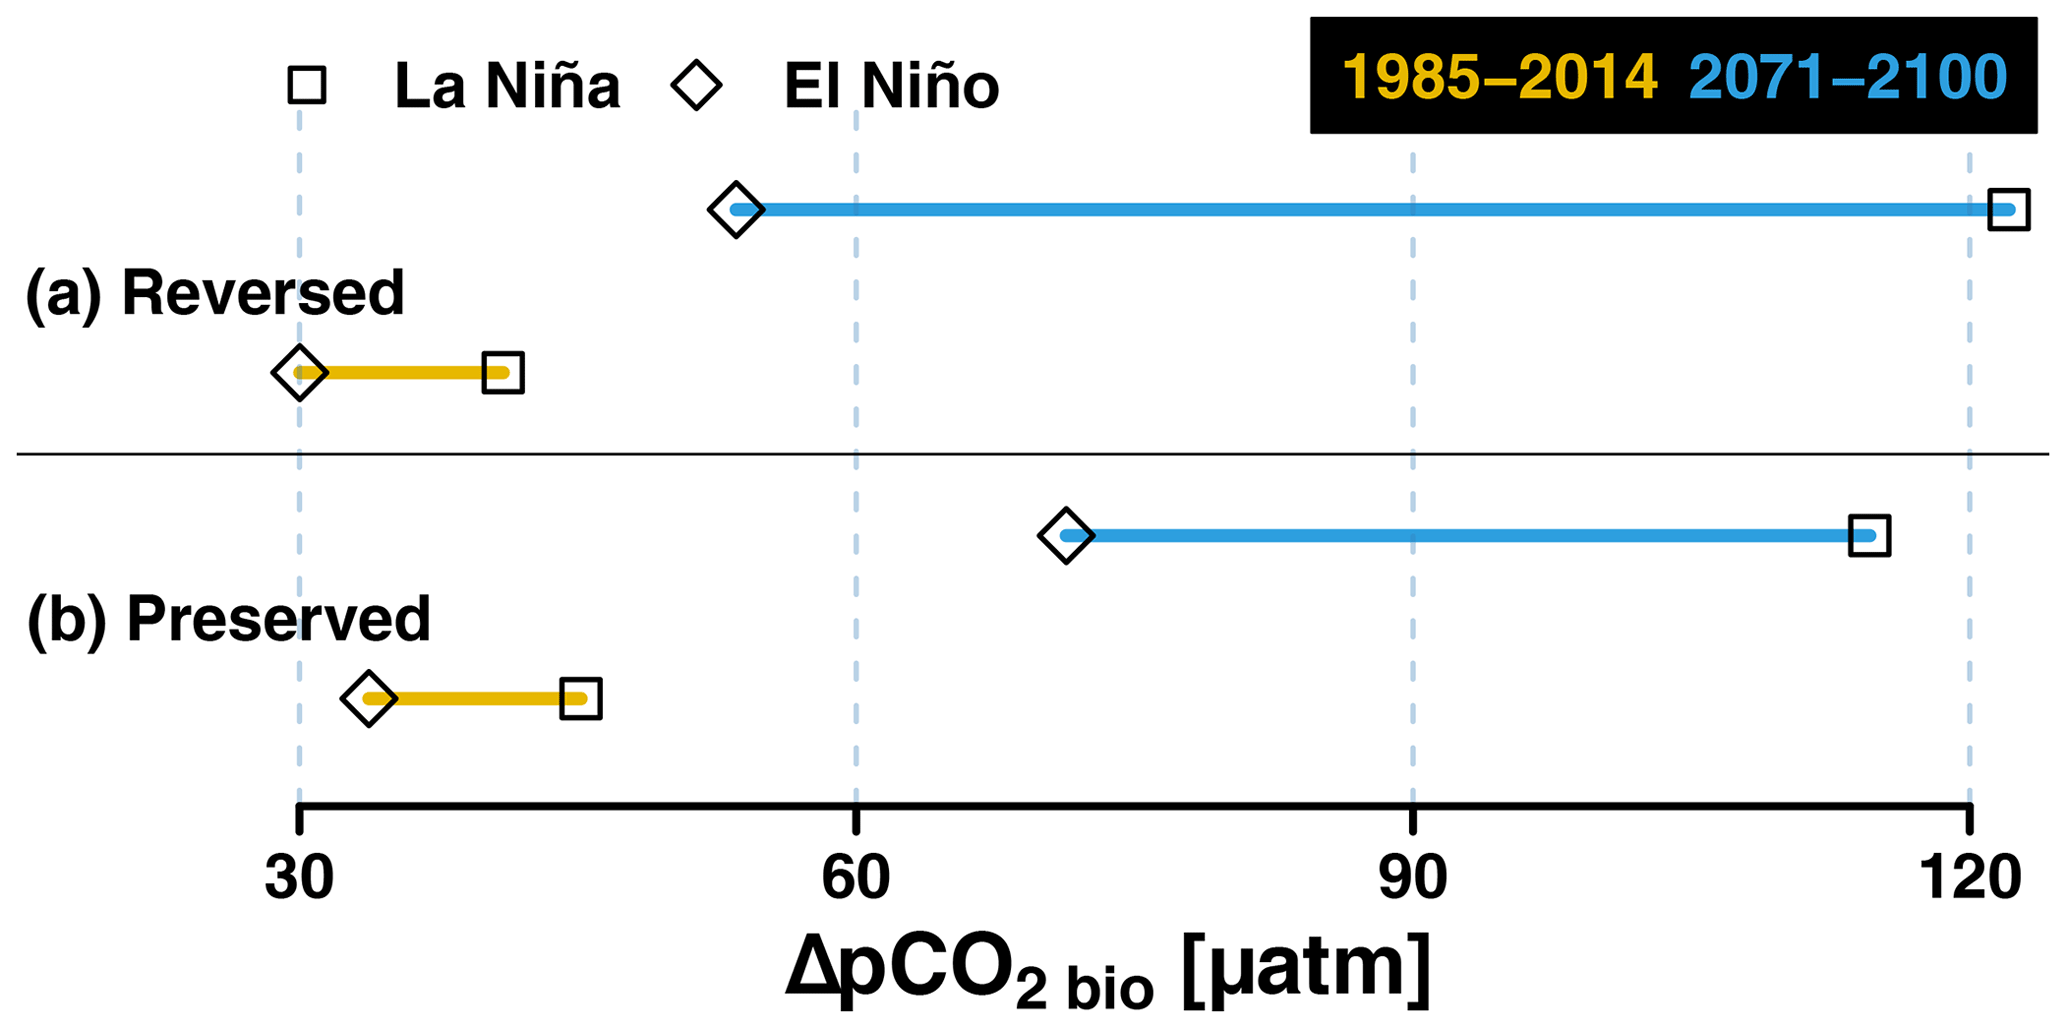
Figure 8Multi-model mean average biological contribution to the oceanic pCO2 (in µatm) deficit during La Niña and El Niño regimes for the 1985–2014 and 2071–2100 period for all reversed (a) and preserved (b) models in the EP domain.
As stated above, the primary reason for the enhanced biological contribution of ΔpCO2 bio is driven by the increasing Revelle factor with higher atmospheric CO2 concentrations in the future (see Fig. 1 and Hauck and Völker, 2015). Assuming that the upwelling-induced DIC variation stays constant in the reversed ESMs, an enhanced primary production fluctuation (higher during La Niña, lower during El Niño) in the future would decrease the ratio between non-thermal and thermal pCO2 components and could therefore contribute to the simulated reversed relationship (Fig. 6). Fig. S12 also shows that the preserved ESMs also simulate enhanced primary production variability but with a lesser magnitude than the reversed ESMs. However, the contemporary ENSO–CO2 flux relationships in this ESM group are maintained in the future, suggesting that biological contribution is too low or that other additional processes are at play.
In addition to surface biological activities, the reduction of the non-thermal contribution to the total pCO2 in the reversed ESMs can also be attributed to changes in upwelling-induced surface DIC modulation. Here, we examine the mean vertical profiles of DIC and temperature and carbonate ion in the EP domain across the two ESM groups. Figure 9 shows the average vertical profiles of DIC and temperature for the two groups of ESMs over the EP domain from the surface down to 300 m depth. Both groups consistently show DIC and temperature increase in the future, but the change varies in magnitude and vertical distribution.
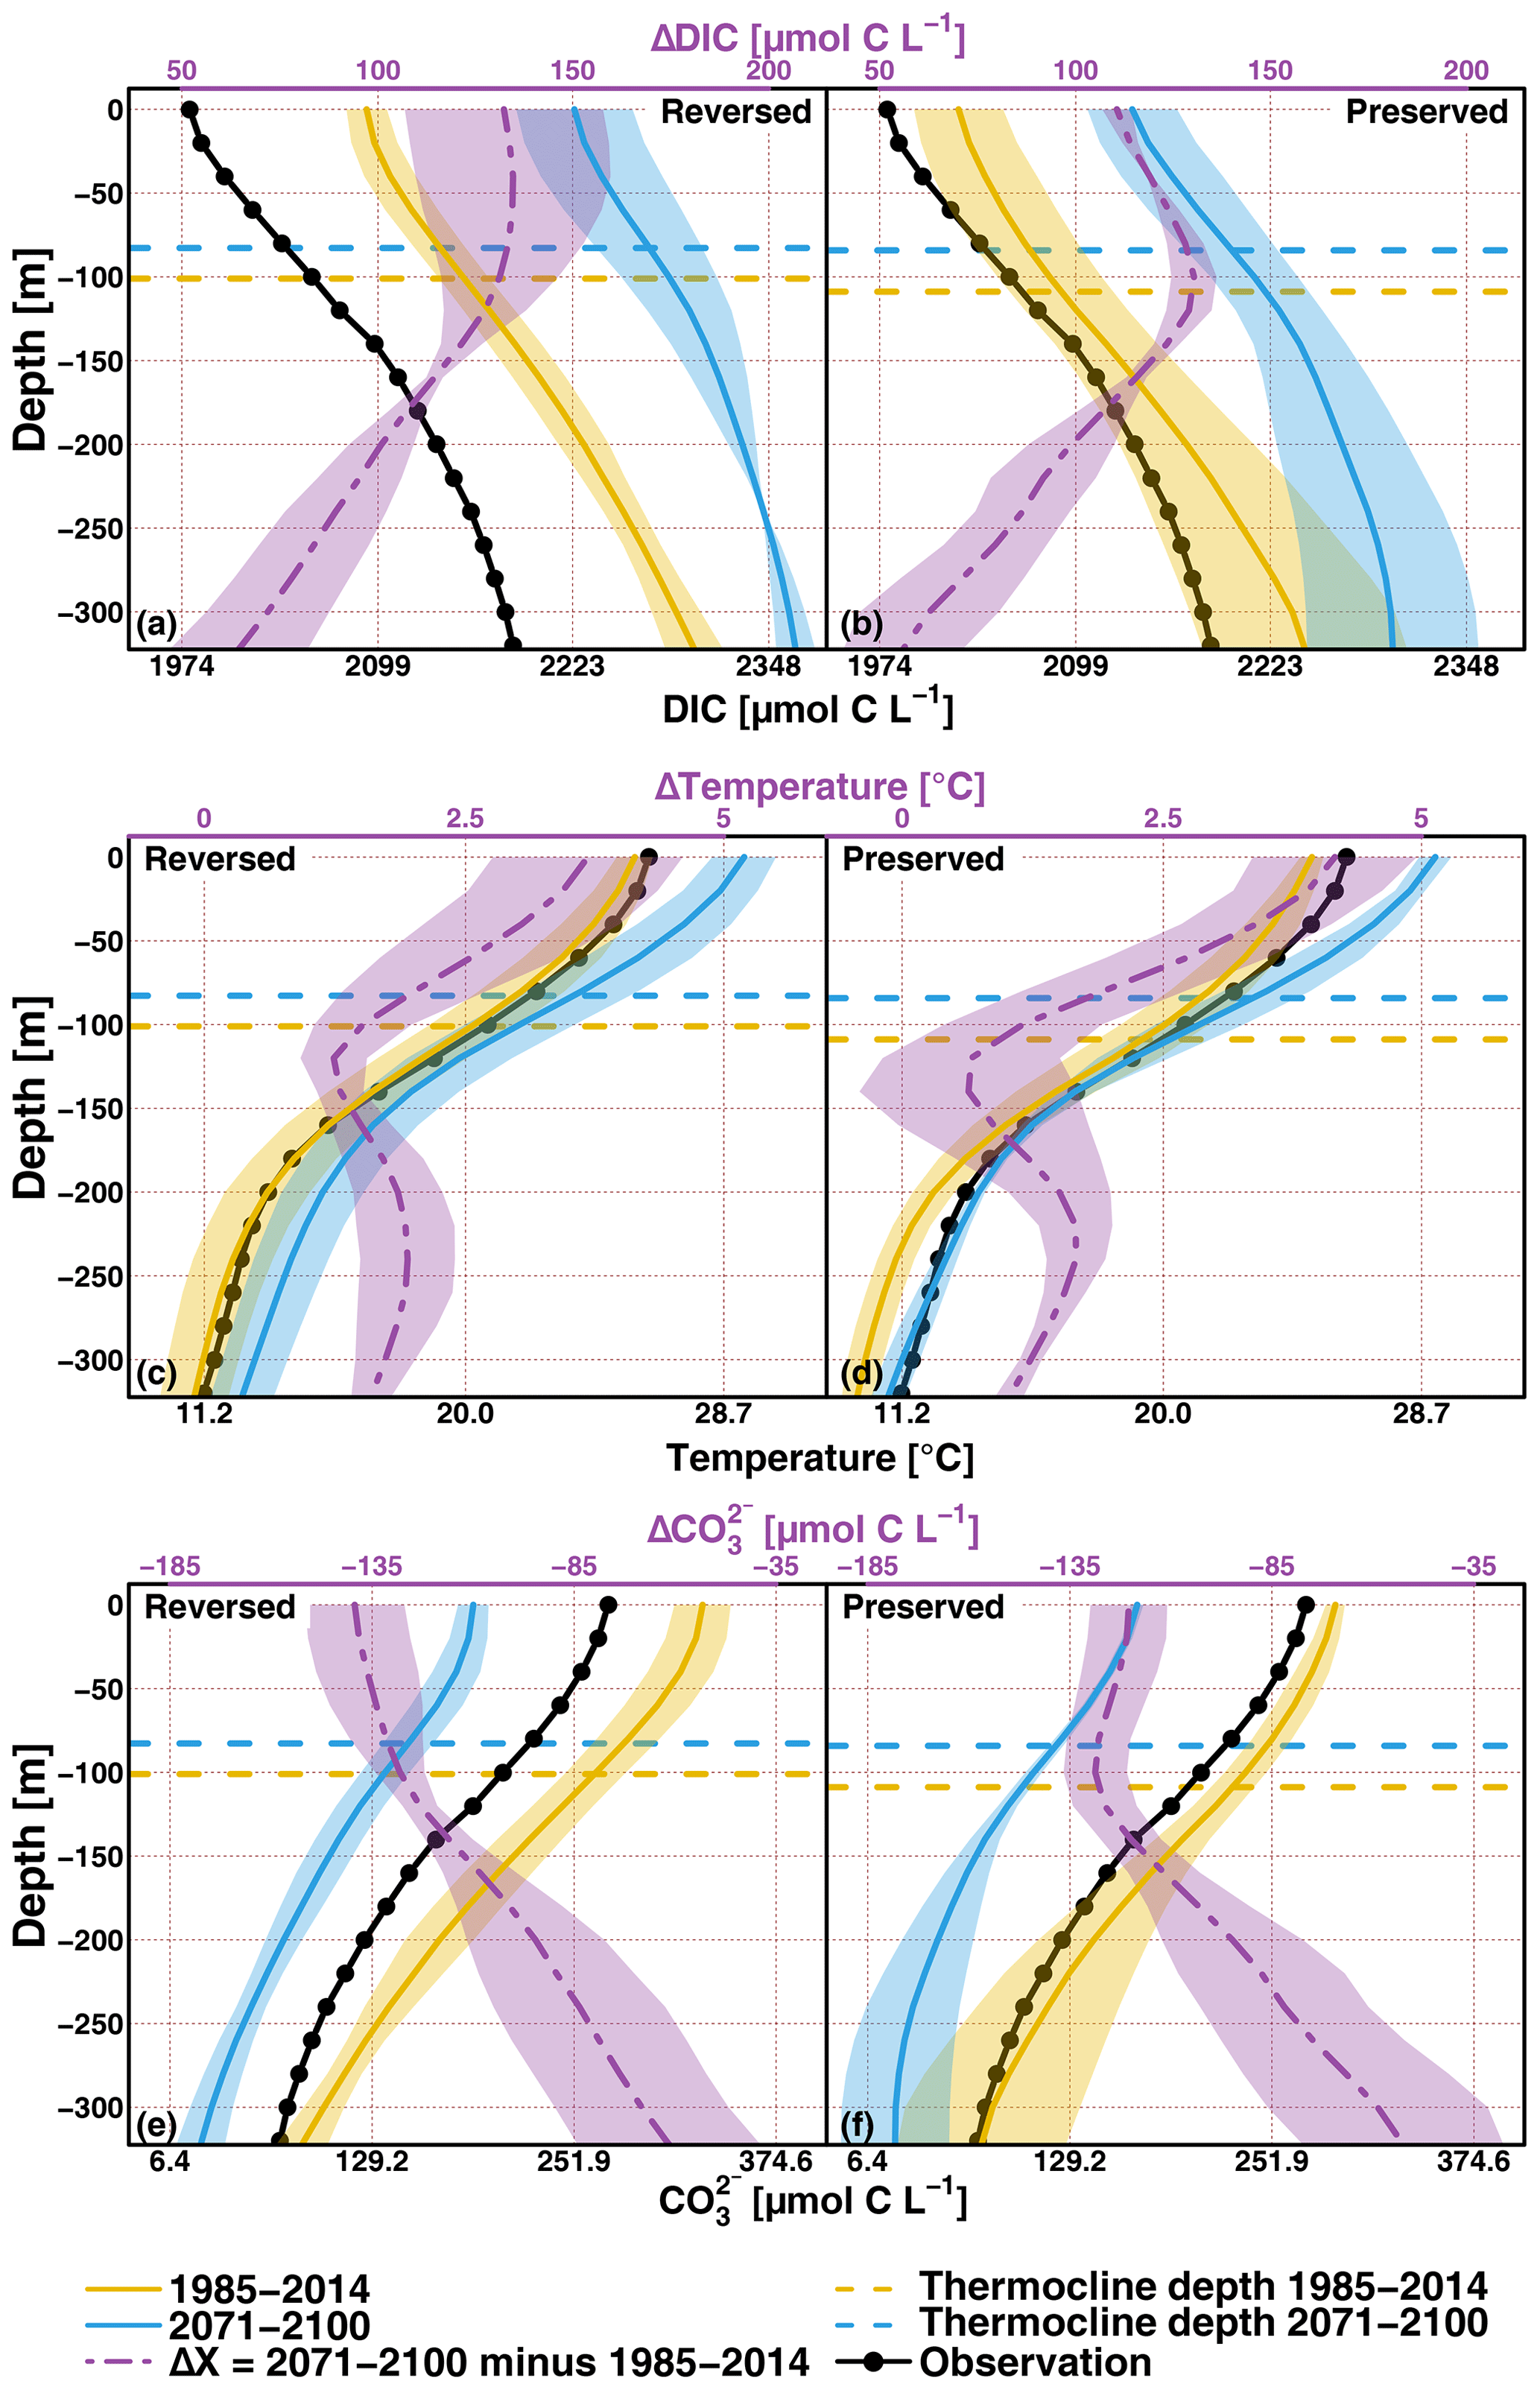
Figure 9Multi-model mean of vertical DIC (in µmol C L−1, a and b), temperature (in ∘C, c and d), and carbonate ion concentration (in µmol C L−1, e and f) profiles over the 1985–2014 (in yellow lines) and 2071–2100 (in blue lines) periods for reversed (a, c, e) and preserved (b, d, f) models. The profile difference between both period profiles (Δ) is given as purple dashed–dotted lines. The black lines with dots are the observed profile for the three variables. The dashed horizontal lines indicate the average thermocline depth for each groups and time periods. A value of 1 standard deviation is given in shaded colours.
Indeed, the vertical DIC gradient is a key factor driving ENSO-related CO2 flux variability throughout the vertical column. The reversed ESMs simulate higher historical DIC (yellow lines in the first row of Fig. 9) making them more biased than the preserved ones, but both groups have a similar vertical profile. Bias in the interior DIC may be associated with the simulated mean alkalinity state (Figs. S9 and S11 in the Supplement), which is likely associated with variation in particulate inorganic carbon formulation in ESMs. The simulated future DIC increase is similar at 100 m and deeper for both groups (dashed purple lines). However, the increase from the surface to 100 m is larger for the reversed ESMs. This leads to a stronger reduction in vertical DIC gradient, which would also contribute to less ENSO-induced surface DIC variability in the reversed ESMs. This is also consistent with the projected more dominant thermal contribution relative to the total pCO2. The future increase in the upper-ocean DIC concentration is associated with the uptake of anthropogenic carbon from the atmosphere. We note that the increase in DIC concentration at depth can also be associated with the shallow water overturning circulation, which advects southern DIC-rich (and carbonate-poor) waters into the region (Toyama et al., 2017; Rodgers et al., 2020) and can also affect the buffering capacity of upwelled water mass.
The higher surface DIC increase is also illustrated in the right panel of Fig. 10, depicting that the reversed ESMs simulate more carbon uptake (or less cumulated DIC loss because the tropical Pacific is a mean outgassing system) than the preserved models over the transient simulation period. This is attributed to the higher surface and subsurface alkalinity and CO (see Figs. S10 and S11 for ALK and the bottom row of Fig. 9 and the left panel of Fig. 10 for CO) concentration simulated by the reversed ESMs at the beginning of the transient simulation from the surface to 300 m depth. The considerably higher alkalinity (and carbonate ion) concentration in the reversed models yield a water mass with higher buffer capacity, which allows them to uptake more atmospheric carbon in the future. This is the first-order explanation for the projected higher surface CO reduction (see the bottom row of Fig. 9 and the left panel of Fig. 10). This higher buffer capacity also dampens the DIC-induced pCO2 variability during ENSO phases, which partly explains the smaller magnitude of CO2 flux variability in the reversed models that was previously mentioned.
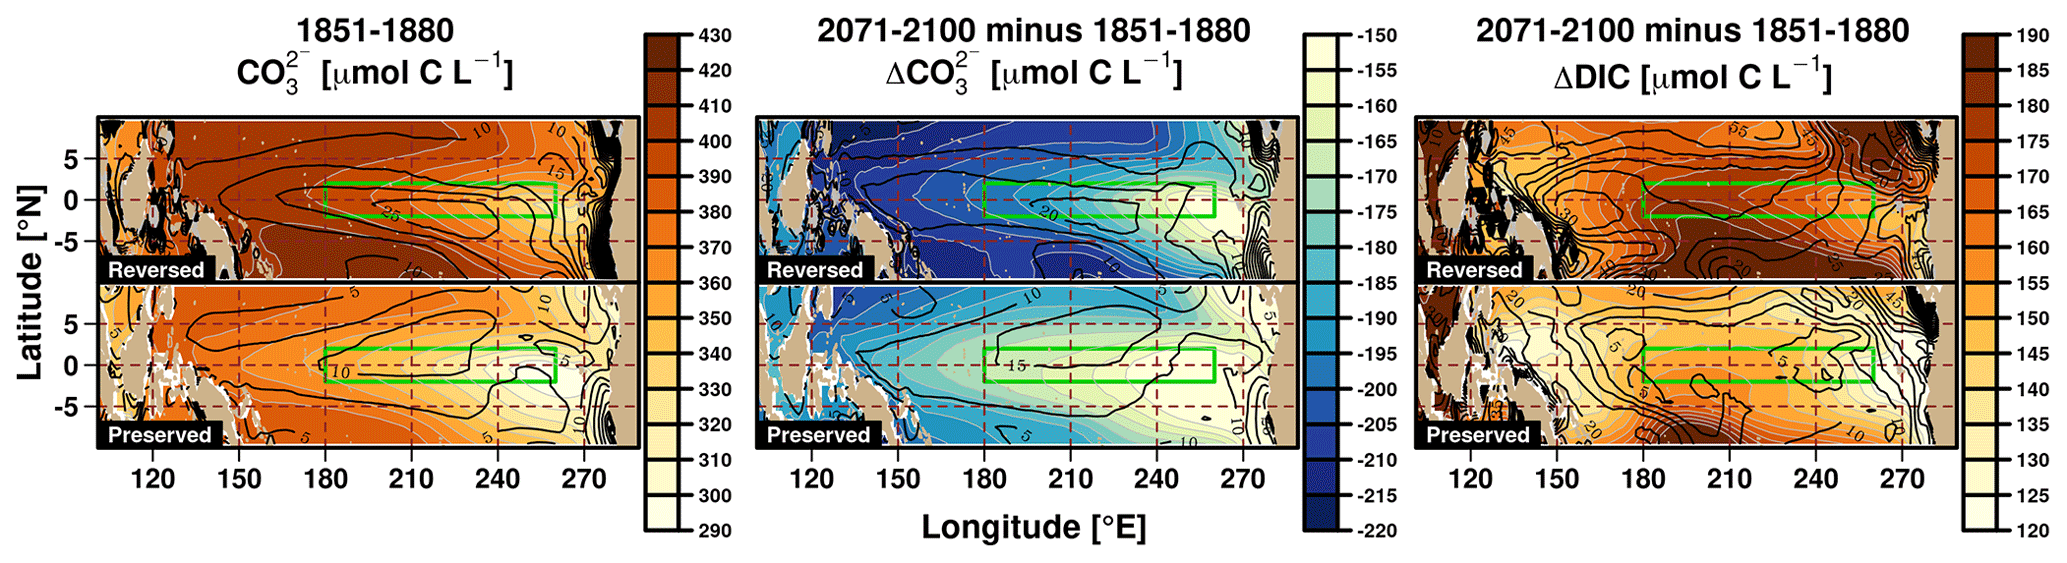
Figure 10Maps of average surface CO concentration (µmol C L−1) for the reversed and preserved ESMs for the 1851–1880 period are given in the left panel. The middle panel shows the carbonate ion concentration difference between the 2071–2100 and 1851–1880 periods. The right panel shows the surface DIC concentration difference between the 2071–2100 and 1851–1880 periods. The green boxes outline the EP region.
The relationship between historical surface carbonate concentration and CO2 uptake can be generalized for all models, providing a new emergent constraint. Figure 11 shows contemporary surface carbonate concentrations against the cumulated sea–air CO2 flux over the 1985–2014 and 1850–2100 periods over the EP for all the models except the MPI models. Correlation at 0.65 and 0.67 indicates that the carbonate concentration is a good indicator of the buffering capacity of the model: the higher the carbonate, the lower the cumulated CO2 outgassing (i.e. more carbon uptakes). The preserved ESMs are less biased in terms of carbonate concentration and cumulated CO2 flux over the contemporary period, which tends to indicate that their behaviour should be more reliable.
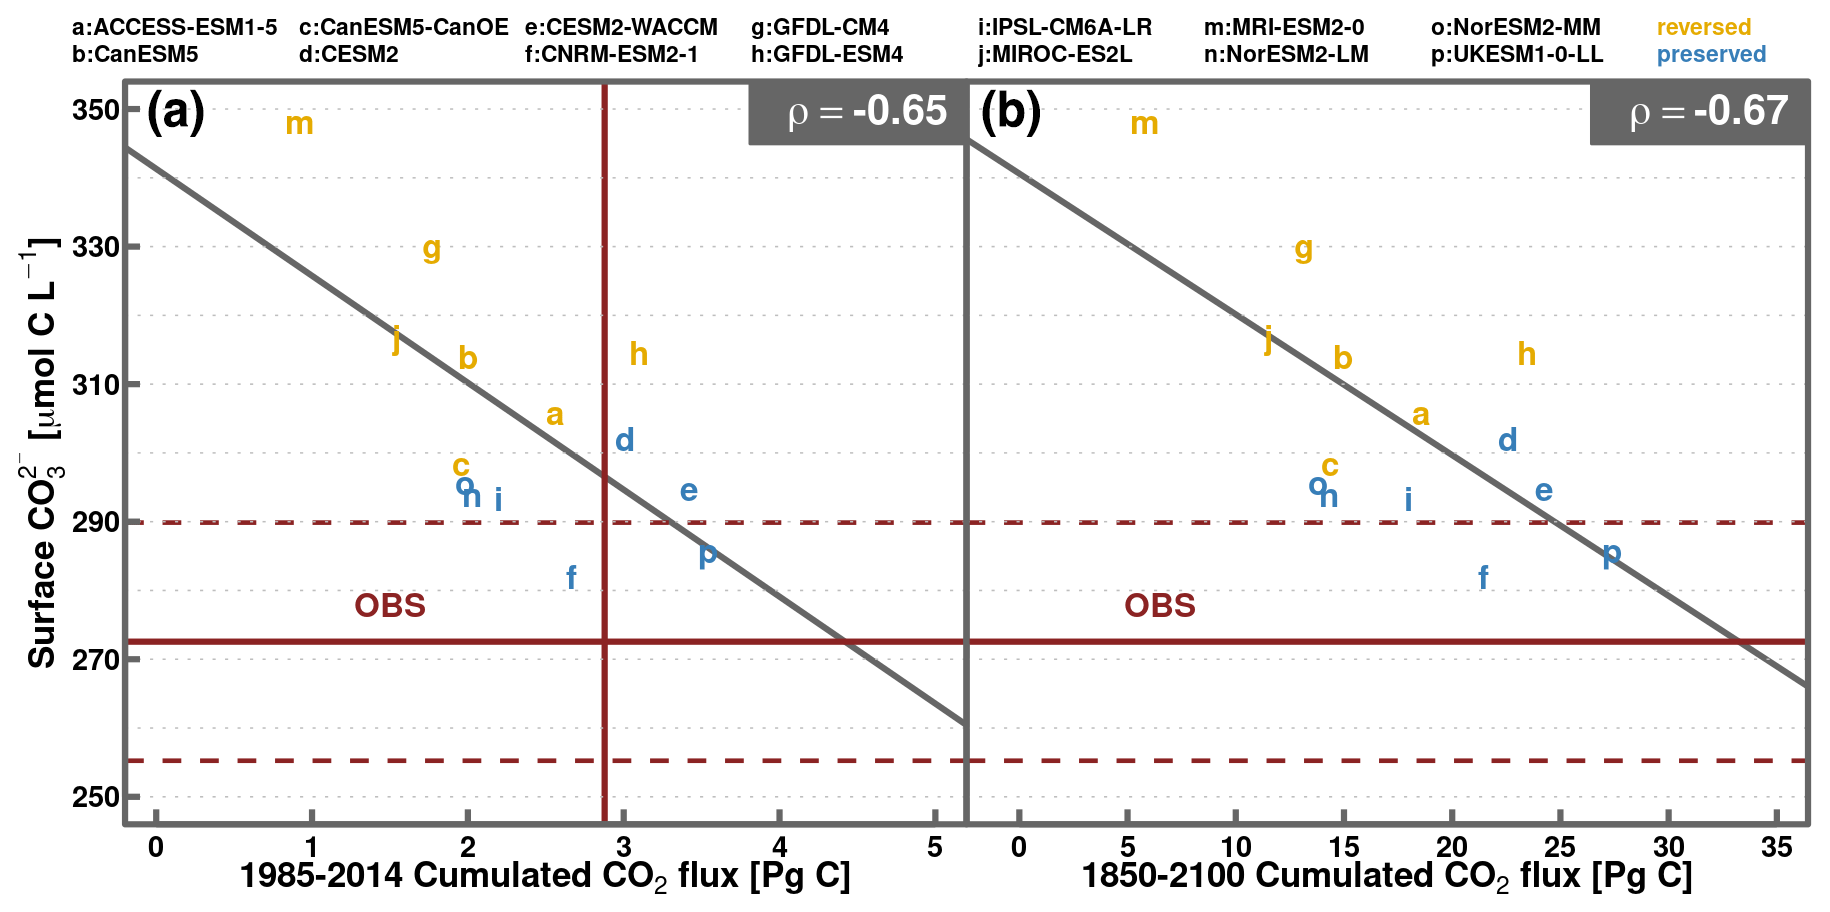
Figure 11Average contemporary surface CO concentration (in µmol C L−1) plotted against the cumulated sea–air CO2 fluxes (in Pg C) in the EP region from 1985 to 2014 (a) and 1850 to 2100 (b). ρ is the correlation, and reversed ESMs are marked in yellow, while preserved ESMs are marked in blue. The observations are given as brown lines, with dashed lines being the carbonate observation error.
The preserved ESMs simulate stronger warming at the surface (see the middle row of Fig. 9), suggesting stronger future stratification, which is consistent with the higher increase in the subsurface DIC (e.g. associated with the biological remineralization) with less upwelling. Consequently, the weaker future stratification in the reversed ESMs is also consistent with the more uniform DIC vertical profile.
ENSO-induced upwelling variability alters the surface DIC anomalies. Figure S13 in the Supplement depicts time series of the average stratification index (SI) computed over the EP domain (see the Supplement for the definition and formulation). There is no significant difference in the SI evolution between the reversed and preserved ESM groups. The SI is expected to increase toward the end of the 21st century, consistent with future warmer upper layer and weaker upwelling. In all ESMs, the stratification variation due to ENSO, i.e. higher stratification during El Niño events (indicating weaker upwelling state) and vice versa during La Niña, is maintained in the future. Despite increasing future stratification and shallowing of thermocline depth (see Fig. 9), the ENSO-driven surface DIC variation in all ESMs (anomalously lower DIC during El Niño and higher DIC during La Niña) is also maintained in the future (see Fig. S14).
In the tropical Pacific, the dominant mode of sea–air CO2 flux variability over the interannual timescale has been established to be associated with ENSO. Here, by evaluating the capacity of 16 CMIP6 ESMs to reproduce this relationship over the historical period provides a valuable means to validate their performance. As shown in Table 3, while most ESMs are able to reproduce the observed contemporary relationships (i.e. negative correlation or outgassing anomaly during La Niña and vice versa during El Niño), there are two ESMs that simulate the complete opposite relationship. Furthermore, the amplitude of the Niño34 (CO2 flux) variability also varies considerably among models over the contemporary period, from 0.91 (0.23) to 1.32 (1.29) times, as compared to the observations (Table 3). As with the previous generation of ESMs (Jin et al., 2019), considerable differences in the spatial extent of CO2 flux anomaly patterns associated with ENSO variability are also simulated in the current CMIP6 ESMs.
Model projections suggest an enhanced ENSO variability in the future associated with the intensification of upper-ocean stratification (Cai et al., 2018). Due to the climate–carbon cycle feedback, analysing how the ENSO-induced CO2 fluxes will be altered by future climate change could provide a valuable insight into the projections of long-term anthropogenic climate change (Betts et al., 2020). Among the analysed ESMs, half of models show a reversal in their ENSO–CO2 flux relationship in the equatorial Pacific (i.e. from an anomalous CO2 uptake to outgassing during El Niño and vice versa during La Niña events) under the strongest future climate change scenario SSP5-8.5. This reversed relationship, superimposed on the projected ENSO–CO2 fluxes by the land biosphere (Kim et al., 2016), suggests an even stronger increase in atmospheric CO2 growth rate during future El Niño events. Nevertheless, our assessment indicates that ESMs that simulate this reversed pattern also simulate considerable bias in the contemporary surface CO concentration; therefore, the projections from these ESMs should be considered with caution.
Readers must keep two things in mind while interpreting the results of this study. First, only the high-emission SSP5-8.5 scenario has been considered. Results may be scenario dependent, especially with respect to the future atmospheric CO2 level. Second, the models have been grouped (and averaged) into two categories to identify patterns or consistencies and to simplify the analyses. In addition, we have focused our analysis on contrasting El Niño and La Niña for a confined region in the equatorial Pacific (i.e. 2∘ S–2∘ N, 180∘ E–260∘ E). We have also applied our analysis on a slightly larger domain (5∘ N–5∘ S, 150∘W–240∘W), and the overall conclusions remain consistent (not shown).
Accurate representations of the tropical Pacific mean climate state and ENSO-related changes in models are fundamental for ENSO impact studies. For instance, ESM projections of future ENSO mode and all related statistics (e.g. Niño 3.4) depend on the mean state biases (Battisti et al., 2019). Simulating the contemporary tropical Pacific climate accurately has been a great challenge for the modelling community over the past few decades, but evidence of continuous improvements over the preceding generation of ESMs is a promising sign (e.g. IPCC, 2021; Bellenger et al., 2014).
We show that the simulated amplitude and spatial extent of physical and biogeochemical properties induced by ENSO vary considerably across ESMs. Future model development should therefore focus on capturing the observed mean state and the regional anomalies pattern during dominant climate modes, such as La Niña versus El Niño phases. To achieve these developments, long-term interior carbon chemistry observations are needed. In particular, vertical distribution of DIC, ALK, and CO3 concentrations during El Niño and La Niña would be extremely helpful for constraining the contrasting ESM projections.
The important roles of the vertical DIC gradient and biological production in the reversal of the ENSO–CO2 flux relationship are also highlighted in this study. For example, the increased primary production variability that contributes to the reversed ENSO–CO2 flux relationship can be associated with model-dependent primary production formulation (e.g. sensitivity of phytoplankton growth rate to temperature) and circulation-driven nutrient upwelling patterns (among others). We note that elucidating the drivers of enhanced primary production in each ESM is beyond the scope of this paper.
Future model developments are also necessary to ensure that ESMs are able to reliably capture multiple layers of non-linear processes that connect ENSO variability and sea–air CO2 fluxes in the equatorial Pacific. The latest generation of ESMs have progressed considerably in reproducing key climatological properties of surface ocean biogeochemistry (Séférian et al., 2020). Future advancements could focus on improving the biogeochemical representation in the interior and better understanding of the physical and biogeochemical interactions across various timescales and different regions. For instance, outside the tropical Pacific, the ocean carbon cycle is modulated by different climate modes, such as the North Atlantic Oscillation (Keller et al., 2012; Tjiputra et al., 2012) and the Southern Annular Mode (Lenton and Matear, 2007; Keppler and Landschützer, 2019). Future studies that advance our understanding of how the ocean carbon cycle in these regions might be affected by future anthropogenic climate change could be valuable to further reduce uncertainties in future climate projections.
In this paper, the ENSO-induced response of sea–air CO2 fluxes under a high CO2 future climate scenario is presented using observed data and model simulations from CMIP6 ESMs. The heart of the work was to examine the roles of two concurrent physical and biogeochemical processes driving the sea–air CO2 flux variability: (i) anomalously high (low) surface temperature that leads to low (high) CO2 solubility, which enhances (reduces) outgassing, and (ii) anomalously strong (weak) upwelling that brings more (less) DIC-rich water to the surface and enhances (reduces) outgassing. The opposing effects of these two processes is enhanced by ENSO: high sea surface temperature is associated with weaker upwelling and stronger stratification during El Niño, and the opposite occurs during La Niña.
The findings can be summarized as follows.
-
During the historical period, observational data show that sea–air CO2 flux anomalies are negatively correlated with ENSO-associated warming, and this is reproduced in the vast majority of the models (14 of 16).
-
Under the high-emission future projection (SSP5-8.5), this correlation persists in half of the examined models (7 of 14) but is projected to reverse across the other half.
-
Depending on the model, the future variability of the CO2 flux anomaly in the equatorial Pacific domain could either increase or decrease. This is consistent with the projected pCO2 variability over the same area (Gallego et al., 2020). However, using models selected based on their contemporary period performance, Liao et al. (2021) found weaker future CO2 flux anomalies during ENSO phases.
-
All the models shows a higher Revelle factor in the future, leading to a stronger pCO2 sensitivity to changes in surface temperature between ENSO phases. This result is consistent and reaffirms findings from previous studies (e.g. Liao et al., 2021; Gallego et al., 2020; Hauck and Völker, 2015);
-
In this study, the mechanisms leading to the reversal of this ENSO–CO2 flux relationship are explained by the thermal contribution to pCO2 becoming more dominant relative to the non-thermal component. This is explained by (i) the increase in the pCO2, (ii) the enhanced primary production fluctuation, and (iii) the upper-ocean DIC concentration increase (due to increasing anthropogenic CO2 uptake), which decreases the vertical gradient in the thermocline and eventually attenuates the ENSO-modulated surface DIC variability.
-
A reversing ENSO–CO2 flux relationship over the 21st century projected in some ESMs seems unlikely since it is a direct consequence of a strong bias in the mean state of carbonate ion concentration over the historical period.
The neural-network-based interpolated CO2 product used in this study is freely accessible at the National Centers for Environmental Information via https://www.ncei.noaa.gov/access/ocean-carbon-data-system/oceans/SPCO2_1982_2015_ETH_SOM_FFN.html (Landschützer et al., 2016). The Japanese 55-year reanalysis SST product used in this study is accessible from their website at https://search.diasjp.net/en/dataset/JRA55 or https://doi.org/10.5065/D60G3H5B (Japan Meteorological Agency/Japan, 2013). The vertical temperature, DIC (climatology), and ALK data are available at https://www.cen.uni-hamburg.de/icdc/data/ocean/easy-init-ocean/ecmwf-oras5.html (Zuo et al., 2019), https://www.ncei.noaa.gov/access/ocean-carbon-data-system/oceans/ndp_104/ndp104.html, and https://www.glodap.info/index.php/mapped-data-product/ (Keppler et al., 2020), respectively. The CMIP6 data used in the analysis were obtained from https://esgf-node.llnl.gov/search/cmip6 (27 July 2022; WCRP, 20x).
The supplement related to this article is available online at: https://doi.org/10.5194/esd-13-1097-2022-supplement.
PVA and JT conceived the study. PVA prepared the data and figures, conducted the analysis, and wrote the original manuscript. JT contributed to improving the methodology, the analysis, and interpretation and editing the manuscript. All authors discussed, commented on, and edited the manuscript.
At least one of the (co-)authors is a member of the editorial board of Earth System Dynamics. The peer-review process was guided by an independent editor, and the authors also have no other competing interests to declare.
Publisher's note: Copernicus Publications remains neutral with regard to jurisdictional claims in published maps and institutional affiliations.
All computations and figures are made using the free R software (R Core Team, 2016). Pradeebane Vaittinada Ayar and Jerry Tjiputra acknowledge funding from the Research Council of Norway (COLUMBIA-275268, CE2COAST-318477, and EASMO-322912). Roland Séférian acknowledges the support of the team in charge of the CNRM-CM climate model. Supercomputing time was provided by the Météo-France/DSI supercomputing centre. Simulations performed by CNRM-ESM2-1 were supported by the European Union's Horizon 2020 research and innovation programme with the H2020 project CRESCENDO under the grant agreement no. 641816 and the H2020 ESM2025 under grant agreement no. 101003536. Tatiana Ilyina was supported by the European Union's H2020 research and innovation programme under grant agreement nos. 101003536 (ESM2025), 821003 (4C), and 820989 (COMFORT), as well as by the Deutsche Forschungsgemeinschaft (DFG, German Research Foundation) under Germany's Excellence Strategy – EXC 2037 “Climate, Climatic Change, and Society” (project no. 390683824). We acknowledge the World Climate Research Programme, which, through its Working Group on Coupled Modelling, coordinated and promoted CMIP6. We thank the climate modelling groups for producing and making available their model output, the Earth System Grid Federation (ESGF) for archiving the data and providing access, and the multiple funding agencies who support CMIP6 and ESGF.
This research has been supported by the Norges Forskningsråd (grant nos. COLUMBIA-275268, CE2COAST-318477, and EASMO-322912).
This paper was edited by Gabriele Messori and reviewed by three anonymous referees.
Arora, V. K., Katavouta, A., Williams, R. G., Jones, C. D., Brovkin, V., Friedlingstein, P., Schwinger, J., Bopp, L., Boucher, O., Cadule, P., Chamberlain, M. A., Christian, J. R., Delire, C., Fisher, R. A., Hajima, T., Ilyina, T., Joetzjer, E., Kawamiya, M., Koven, C. D., Krasting, J. P., Law, R. M., Lawrence, D. M., Lenton, A., Lindsay, K., Pongratz, J., Raddatz, T., Séférian, R., Tachiiri, K., Tjiputra, J. F., Wiltshire, A., Wu, T., and Ziehn, T.: Carbon–concentration and carbon–climate feedbacks in CMIP6 models and their comparison to CMIP5 models, Biogeosciences, 17, 4173–4222, https://doi.org/10.5194/bg-17-4173-2020, 2020. a
Battisti, D. S., Vimont, D. J., and Kirtman, B. P.: 100 Years of Progress in Understanding the Dynamics of Coupled Atmosphere-Ocean Variability, Meteor. Mon., 59, 8.1–8.57, https://doi.org/10.1175/AMSMONOGRAPHS-D-18-0025.1, 2019. a
Bellenger, H., Guilyardi, É., Leloup, J., Lengaigne, M., and Vialard, J.: ENSO representation in climate models: From CMIP3 to CMIP5, Clim. Dynam., 42, 1999–2018, https://doi.org/10.1007/s00382-013-1783-z, 2014. a
Bentsen, M., Oliviè, D. J. L., Seland, y., Toniazzo, T., Gjermundsen, A., Graff, L. S., Debernard, J. B., Gupta, A. K., He, Y., Kirkevåg, A., Schwinger, J., Tjiputra, J., Aas, K. S., Bethke, I., Fan, Y., Griesfeller, J., Grini, A., Guo, C., Ilicak, M., Karset, I. H. H., Landgren, O. A., Liakka, J., Moseid, K. O., Nummelin, A., Spensberger, C., Tang, H., Zhang, Z., Heinze, C., Iversen, T., and Schulz, M.: NCC NorESM2-MM model output prepared for CMIP6 CMIP historical, https://doi.org/10.22033/ESGF/CMIP6.8040, 2019. a
Betts, R. A., Burton, C. A., Feely, R. A., Collins, M., Jones, C. D., and Wiltshire, A. J.: ENSO and the Carbon Cycle, in: El Niño Southern Oscillation in a Changing Climate, edited by: McPhaden, M. J., Santoso, A., and Cai, W., chap. 20, 453–470, https://doi.org/10.1002/9781119548164.ch20, 2020. a
Boucher, O., Denvil, S., Levavasseur, G., Cozic, A., Caubel, A., Foujols, M.-A., Meurdesoif, Y., Cadule, P., Devilliers, M., Ghattas, J., Lebas, N., Lurton, T., Mellul, L., Musat, I., Mignot, J., and Cheruy, F.: IPSL IPSL-CM6A-LR model output prepared for CMIP6 CMIP historical, https://doi.org/10.22033/ESGF/CMIP6.5195, 2018. a
Boucher, O., Servonnat, J., Albright, A. L., Aumont, O., Balkanski, Y., Bastrikov, V., Bekki, S., Bonnet, R., Bony, S., Bopp, L., Braconnot, P., Brockmann, P., Cadule, P., Caubel, A., Cheruy, F., Codron, F., Cozic, A., Cugnet, D., D'Andrea, F., Davini, P., de Lavergne, C., Denvil, S., Deshayes, J., Devilliers, M., Ducharne, A., Dufresne, J.-L., Dupont, E., éthé, C., Fairhead, L., Falletti, L., Flavoni, S., Foujols, M.-A., Gardoll, S., Gastineau, G., Ghattas, J., Grandpeix, J.-Y., Guenet, B., Guez, Lionel, E., Guilyardi, E., Guimberteau, M., Hauglustaine, D., Hourdin, F., Idelkadi, A., Joussaume, S., Kageyama, M., Khodri, M., Krinner, G., Lebas, N., Levavasseur, G., Lévy, C., Li, L., Lott, F., Lurton, T., Luyssaert, S., Madec, G., Madeleine, J.-B., Maignan, F., Marchand, M., Marti, O., Mellul, L., Meurdesoif, Y., Mignot, J., Musat, I., Ottlé, C., Peylin, P., Planton, Y., Polcher, J., Rio, C., Rochetin, N., Rousset, C., Sepulchre, P., Sima, A., Swingedouw, D., Thiéblemont, R., Traore, A. K., Vancoppenolle, M., Vial, J., Vialard, J., Viovy, N., and Vuichard, N.: Presentation and Evaluation of the IPSL-CM6A-LR Climate Model, J. Adv. Model. Earth Sy., 12, e2019MS002010, https://doi.org/10.1029/2019MS002010, 2020. a
Bousquet, P., Peylin, P., Ciais, P., Quéré, C. L., Friedlingstein, P., and Tans, P. P.: Regional Changes in Carbon Dioxide Fluxes of Land and Oceans Since 1980, Science, 290, 1342–1346, https://doi.org/10.1126/science.290.5495.1342, 2000. a
Cai, W., Santoso, A., Wang, G., Yeh, S.-W., An, S.-I., Cobb, K. M., Collins, M., Guilyardi, E., Jin, F.-F., Kug, J.-S., et al.: ENSO and greenhouse warming, Nat. Clim. Change, 5, 849–859, https://doi.org/10.1038/s41467-017-01831-7, 2015. a
Cai, W., Wang, G., Dewitte, B., Wu, L., Santoso, A., Takahashi, K., Yang, Y., Carréric, A., and McPhaden, M. J.: Increased variability of eastern Pacific El Niño under greenhouse warming, Nature, 564, 201–206, https://doi.org/10.1038/s41586-018-0776-9, 2018. a
Danabasoglu, G.: NCAR CESM2 model output prepared for CMIP6 CMIP historical, https://doi.org/10.22033/ESGF/CMIP6.7627, 2019a. a
Danabasoglu, G.: NCAR CESM2-WACCM model output prepared for CMIP6 CMIP historical, https://doi.org/10.22033/ESGF/CMIP6.10071, 2019b. a
Doney, S. C., Lima, I., Feely, R. A., Glover, D. M., Lindsay, K., Mahowald, N., Moore, J. K., and Wanninkhof, R.: Mechanisms governing interannual variability in upper-ocean inorganic carbon system and air-sea CO2 fluxes: Physical climate and atmospheric dust, surface Ocean CO2 Variability and Vulnerabilities, Deep Sea Research Part II: Topical Studies in Oceanography, 56, 640–655, https://doi.org/10.1016/j.dsr2.2008.12.006, 2009. a
Doney, S. C., Bopp, L., and Long, M. C.: Historical and Future Trends in Ocean Climate and Biogeochemistry, Oceanography, 8, 605–649, https://doi.org/10.5670/oceanog.2014.14, 2014. a
Dong, F., Li, Y., and Wang, B.: Assessment of Responses of Tropical Pacific Air-Sea CO2 Flux to ENSO in 14 CMIP5 Models, J. Climate, 30,8595–8613, https://doi.org/10.1175/JCLI-D-16-0543.1, 2017. a, b
Dunne, J. P., Horowitz, L. W., Adcroft, A. J., Ginoux, P., Held, I. M., John, J. G., Krasting, J. P., Malyshev, S., Naik, V., Paulot, F., Shevliakova, E., Stock, C. A., Zadeh, N., Balaji, V., Blanton, C., Dunne, K. A., Dupuis, C., Durachta, J., Dussin, R., Gauthier, P. P. G., Griffies, S. M., Guo, H., Hallberg, R. W., Harrison, M., He, J., Hurlin, W., McHugh, C., Menzel, R., Milly, P. C. D., Nikonov, S., Paynter, D. J., Ploshay, J., Radhakrishnan, A., Rand, K., Reichl, B. G., Robinson, T., Schwarzkopf, D. M., Sentman, L. T., Underwood, S., Vahlenkamp, H., Winton, M., Wittenberg, A. T., Wyman, B., Zeng, Y., and Zhao, M.: The GFDL Earth System Model Version 4.1 (GFDL-ESM 4.1): Overall Coupled Model Description and Simulation Characteristics, J. Adv. Model. Earth Sy., 12, e2019MS002015, https://doi.org/10.1029/2019MS002015, 2020. a
Egleston, E. S., Sabine, C. L., and Morel, F. M. M.: Revelle revisited: Buffer factors that quantify the response of ocean chemistry to changes in DIC and alkalinity, Global Biogeochem. Cy., 24, GB1002, https://doi.org/10.1029/2008GB003407, 2010. a, b
Eyring, V., Bony, S., Meehl, G. A., Senior, C. A., Stevens, B., Stouffer, R. J., and Taylor, K. E.: Overview of the Coupled Model Intercomparison Project Phase 6 (CMIP6) experimental design and organization, Geosci. Model Dev., 9, 1937–1958, https://doi.org/10.5194/gmd-9-1937-2016, 2016. a, b
Feely, R. A., Takahashi, T., Wanninkhof, R., McPhaden, M. J., Cosca, C. E., Sutherland, S. C., and Carr, M.-E.: Decadal variability of the air-sea CO2 fluxes in the equatorial Pacific Ocean, J. Geophys. Res.-Oceans, 111, C08S90, https://doi.org/10.1029/2005JC003129, 2006. a, b
Friedlingstein, P., O'Sullivan, M., Jones, M. W., Andrew, R. M., Hauck, J., Olsen, A., Peters, G. P., Peters, W., Pongratz, J., Sitch, S., Le Quéré, C., Canadell, J. G., Ciais, P., Jackson, R. B., Alin, S., Aragão, L. E. O. C., Arneth, A., Arora, V., Bates, N. R., Becker, M., Benoit-Cattin, A., Bittig, H. C., Bopp, L., Bultan, S., Chandra, N., Chevallier, F., Chini, L. P., Evans, W., Florentie, L., Forster, P. M., Gasser, T., Gehlen, M., Gilfillan, D., Gkritzalis, T., Gregor, L., Gruber, N., Harris, I., Hartung, K., Haverd, V., Houghton, R. A., Ilyina, T., Jain, A. K., Joetzjer, E., Kadono, K., Kato, E., Kitidis, V., Korsbakken, J. I., Landschützer, P., Lefèvre, N., Lenton, A., Lienert, S., Liu, Z., Lombardozzi, D., Marland, G., Metzl, N., Munro, D. R., Nabel, J. E. M. S., Nakaoka, S.-I., Niwa, Y., O'Brien, K., Ono, T., Palmer, P. I., Pierrot, D., Poulter, B., Resplandy, L., Robertson, E., Rödenbeck, C., Schwinger, J., Séférian, R., Skjelvan, I., Smith, A. J. P., Sutton, A. J., Tanhua, T., Tans, P. P., Tian, H., Tilbrook, B., van der Werf, G., Vuichard, N., Walker, A. P., Wanninkhof, R., Watson, A. J., Willis, D., Wiltshire, A. J., Yuan, W., Yue, X., and Zaehle, S.: Global Carbon Budget 2020, Earth Syst. Sci. Data, 12, 3269–3340, https://doi.org/10.5194/essd-12-3269-2020, 2020. a
Gallego, M. A., Timmermann, A., Friedrich, T., and Zeebe, R. E.: Anthropogenic Intensification of Surface Ocean Interannual pCO2 Variability, Geophys. Res. Lett., 47, e2020GL087104, https://doi.org/10.1029/2020GL087104, 2020. a, b, c
Gattuso, J.-P., Epitalon, J.-M., Lavigne, H., and Orr, J.: seacarb: Seawater Carbonate Chemistry, R package version 3.2.13, https://CRAN.R-project.org/package=seacarb (last access: 27 July 2022), 2020. a
Guo, H., John, J. G., Blanton, C., McHugh, C., Nikonov, S., Radhakrishnan, A., Rand, K., Zadeh, N. T., Balaji, V., Durachta, J., Dupuis, C., Menzel, R., Robinson, T., Underwood, S., Vahlenkamp, H., Bushuk, M., Dunne, K. A., Dussin, R., Gauthier, P. P., Ginoux, P., Griffies, S. M., Hallberg, R., Harrison, M., Hurlin, W., Lin, P., Malyshev, S., Naik, V., Paulot, F., Paynter, D. J., Ploshay, J., Reichl, B. G., Schwarzkopf, D. M., Seman, C. J., Shao, A., Silvers, L., Wyman, B., Yan, X., Zeng, Y., Adcroft, A., Dunne, J. P., Held, I. M., Krasting, J. P., Horowitz, L. W., Milly, P., Shevliakova, E., Winton, M., Zhao, M., and Zhang, R.: NOAA-GFDL GFDL-CM4 model output historical, https://doi.org/10.22033/ESGF/CMIP6.8594, 2018. a
Hajima, T., Abe, M., Arakawa, O., Suzuki, T., Komuro, Y., Ogura, T., Ogochi, K., Watanabe, M., Yamamoto, A., Tatebe, H., Noguchi, M. A., Ohgaito, R., Ito, A., Yamazaki, D., Ito, A., Takata, K., Watanabe, S., Kawamiya, M., and Tachiiri, K.: MIROC MIROC-ES2L model output prepared for CMIP6 CMIP historical, https://doi.org/10.22033/ESGF/CMIP6.5602, 2019. a
Hajima, T., Watanabe, M., Yamamoto, A., Tatebe, H., Noguchi, M. A., Abe, M., Ohgaito, R., Ito, A., Yamazaki, D., Okajima, H., Ito, A., Takata, K., Ogochi, K., Watanabe, S., and Kawamiya, M.: Development of the MIROC-ES2L Earth system model and the evaluation of biogeochemical processes and feedbacks, Geosci. Model Dev., 13, 2197–2244, https://doi.org/10.5194/gmd-13-2197-2020, 2020. a
Harada, Y., Kamahori, H., Kobayashi, C., Endo, H., Kobayashi, S., Ota, Y., Onoda, H., Onogi, K., Miyaoka, K., and Takahashi, K.: The JRA-55 Reanalysis: Representation of Atmospheric Circulation and Climate Variability, J. Meteorol. Soc. Jpn, Ser. II, 94, 269–302, https://doi.org/10.2151/jmsj.2016-015, 2016. a
Hastie, T. and Tibshirani, R.: Generalized Additive Models, Monographs on statistics and applied probability, Chapman and Hall, CRC Press, 1990, vol. 43, 352 p., http://books.google.co.uk/books?id=qa29r1Ze1coC, 1990. a
Hauck, J. and Völker, C.: Rising atmospheric CO2 leads to large impact of biology on Southern Ocean CO2 uptake via changes of the Revelle factor, Geophys. Res. Lett., 42, 1459–1464, https://doi.org/10.1002/2015GL063070, 2015. a, b, c, d
Held, I. M., Guo, H., Adcroft, A., Dunne, J. P., Horowitz, L. W., Krasting, J., Shevliakova, E., Winton, M., Zhao, M., Bushuk, M., Wittenberg, A. T., Wyman, B., Xiang, B., Zhang, R., Anderson, W., Balaji, V., Donner, L., Dunne, K., Durachta, J., Gauthier, P. P. G., Ginoux, P., Golaz, J.-C., Griffies, S. M., Hallberg, R., Harris, L., Harrison, M., Hurlin, W., John, J., Lin, P., Lin, S.-J., Malyshev, S., Menzel, R., Milly, P. C. D., Ming, Y., Naik, V., Paynter, D., Paulot, F., Rammaswamy, V., Reichl, B., Robinson, T., Rosati, A., Seman, C., Silvers, L. G., Underwood, S., and Zadeh, N.: Structure and Performance of GFDL's CM4.0 Climate Model, J. Adv. Model. Earth Sy., 11, 3691–3727, https://doi.org/10.1029/2019MS001829, 2019. a
IPCC: Climate Change 2021: The Physical Science Basis, Contribution of Working Group I to the Sixth Assessment Report of the Intergovernmental Panel on Climate Change, edited by: Masson-Delmotte, V., Zhai, P., Pirani, A., Connors, S. L., Péan, C., Berger, S., Caud, N., Chen, Y., Goldfarb, L., Gomis, M. I., Huang, M., Leitzell, K., Lonnoy, E., Matthews, J. B. R., Maycock, T. K., Waterfield, T., Yelekçi, O., Yu, R., and Zhou, B., Cambridge University Press, In Press, https://doi.org/10.1017/9781009157896, 2021. a
Ishii, M., Feely, R. A., Rodgers, K. B., Park, G.-H., Wanninkhof, R., Sasano, D., Sugimoto, H., Cosca, C. E., Nakaoka, S., Telszewski, M., Nojiri, Y., Mikaloff Fletcher, S. E., Niwa, Y., Patra, P. K., Valsala, V., Nakano, H., Lima, I., Doney, S. C., Buitenhuis, E. T., Aumont, O., Dunne, J. P., Lenton, A., and Takahashi, T.: Air-sea CO2 flux in the Pacific Ocean for the period 1990–2009, Biogeosciences, 11, 709–734, https://doi.org/10.5194/bg-11-709-2014, 2014. a, b
Japan Meteorological Agency/Japan: JRA-55: Japanese 55-year Reanalysis, Monthly Means and Variances, UCAR/NCAR – Research Data Archive [data set], https://doi.org/10.5065/D60G3H5B, 2013. a
Jiménez-López, D., Sierra, A., Ortega, T., Garrido, S., Hernández-Puyuelo, N., Sánchez-Leal, R., and Forja, J.: pCO2 variability in the surface waters of the eastern Gulf of Cádiz (SW Iberian Peninsula), Ocean Sci., 15, 1225–1245, https://doi.org/10.5194/os-15-1225-2019, 2019. a
Jin, C., Zhou, T., Chen, X., and Wu, B.: Seasonally evolving dominant interannual variability mode of air-sea CO2 flux over the western North Pacific simulated by CESM1-BGC, Sci. China-Earth Sci., 60, 1854–1865, https://doi.org/10.1007/s11430-015-9085-4, 2017. a
Jin, C., Zhou, T., and Chen, X.: Can CMIP5 Earth System Models Reproduce the Interannual Variability of Air-Sea CO2 Fluxes over the Tropical Pacific Ocean?, J. Climate, 32, 2261–2275, https://doi.org/10.1175/JCLI-D-18-0131.1, 2019. a, b
Jungclaus, J., Bittner, M., Wieners, K.-H., Wachsmann, F., Schupfner, M., Legutke, S., Giorgetta, M., Reick, C., Gayler, V., Haak, H., de Vrese, P., Raddatz, T., Esch, M., Mauritsen, T., von Storch, J.-S., Behrens, J., Brovkin, V., Claussen, M., Crueger, T., Fast, I., Fiedler, S., Hagemann, S., Hohenegger, C., Jahns, T., Kloster, S., Kinne, S., Lasslop, G., Kornblueh, L., Marotzke, J., Matei, D., Meraner, K., Mikolajewicz, U., Modali, K., Müller, W., Nabel, J., Notz, D., Peters-von Gehlen, K., Pincus, R., Pohlmann, H., Pongratz, J., Rast, S., Schmidt, H., Schnur, R., Schulzweida, U., Six, K., Stevens, B., Voigt, A., and Roeckner, E.: MPI-M MPI-ESM1.2-HR model output prepared for CMIP6 CMIP historical, Earth System Grid Federation, https://doi.org/10.22033/ESGF/CMIP6.6594, 2019. a
Keller, K. M., Joos, F., Raible, C. C., Cocco, V., Frölicher, T. L., Dunne, J. P., Gehlen, M., Bopp, L., Orr, J. C., Tjiputra, J., Heinze, C., Segschneider, J., Roy, T., and Metzl, N.: Variability of the ocean carbon cycle in response to the North Atlantic Oscillation, Tellus B, 64, 18738, https://doi.org/10.3402/tellusb.v64i0.18738, 2012. a
Keppler, L. and Landschützer, P.: Regional wind variability modulates the Southern Ocean carbon sink, Sci. Rep., 9, 7384, https://doi.org/10.1038/s41598-019-43826-y, 2019. a
Keppler, L., Landschützer, P., Gruber, N., Lauvset, S. K., and Stemmler, I.: Mapped Observation-Based Oceanic Dissolved Inorganic Carbon (DIC), monthly climatology from January to December (based on observations between 2004 and 2017), from the Max-Planck-Institute for Meteorology (MOBO-DIC_MPIM) (NCEI Accession 0221526), NOAA National Centers for Environmental Information [data set], https://doi.org/10.25921/yvzj-zx46, data available at: https://www.ncei.noaa.gov/access/ocean-carbon-data-system/oceans/ndp_104/ndp104.html (last access: 12 November 2021) and https://www.glodap.info/index.php/mapped-data-product/ (last access: 12 October 2021), 2020. a, b
Kim, J.-S., Kug, J.-S., Yoon, J.-H., and Jeong, S.-J.: Increased Atmospheric CO2 Growth Rate during El Niño Driven by Reduced Terrestrial Productivity in the CMIP5 ESMs, J. Climate, 29, 8783–8805, https://doi.org/10.1175/JCLI-D-14-00672.1, 2016. a
Ko, Y. H., Park, G.-H., Kim, D., and Kim, T.-W.: Variations in Seawater pCO2 Associated With Vertical Mixing During Tropical Cyclone Season in the Northwestern Subtropical Pacific Ocean, Frontiers in Marine Science, 8, ISSN 2296-7745, https://doi.org/10.3389/fmars.2021.679314, 2021. a
Kobayashi, S., Ota, Y., Harada, Y., Ebita, A., Moriya, M., Onoda, H., Onogi, K., Kamahori, H., Kobayashi, C., Endo, H., Miyaoka, K., and Takahashi, K.: The JRA-55 Reanalysis: General Specifications and Basic Characteristics, J. Meteorol. Soc. Jpn, Ser. II, 93, 5–48, https://doi.org/10.2151/jmsj.2015-001, 2015. a
Krasting, J. P., John, J. G., Blanton, C., McHugh, C., Nikonov, S., Radhakrishnan, A., Rand, K., Zadeh, N. T., Balaji, V., Durachta, J., Dupuis, C., Menzel, R., Robinson, T., Underwood, S., Vahlenkamp, H., Dunne, K. A., Gauthier, P. P., Ginoux, P., Griffies, S. M., Hallberg, R., Harrison, M., Hurlin, W., Malyshev, S., Naik, V., Paulot, F., Paynter, D. J., Ploshay, J., Reichl, B. G., Schwarzkopf, D. M., Seman, C. J., Silvers, L., Wyman, B., Zeng, Y., Adcroft, A., Dunne, J. P., Dussin, R., Guo, H., He, J., Held, I. M., Horowitz, L. W., Lin, P., Milly, P., Shevliakova, E., Stock, C., Winton, M., Wittenberg, A. T., Xie, Y., and Zhao, M.: NOAA-GFDL GFDL-ESM4 model output prepared for CMIP6 CMIP historical, Earth System Grid Federation, https://doi.org/10.22033/ESGF/CMIP6.8597, 2018. a
Landschützer, P., Gruber, N., and Bakker, D. C. E.: Decadal variations and trends of the global ocean carbon sink, Global Biogeochem. Cy., 30, 1396–1417, https://doi.org/10.1002/2015GB005359, data available at: https://www.ncei.noaa.gov/access/ocean-carbon-data-system/oceans/SPCO2_1982_2015_ETH_SOM_FFN.html (last access: 15 January 2021), 2016. a, b, c
Landschützer, P., Gruber, N., Bakker, D. C., Stemmler, I., and Six, K. D.: Strengthening seasonal marine CO2 variations due to increasing atmospheric CO2, Nat. Clim. Change, 8, 146–150, https://doi.org/10.1038/s41558-017-0057-x, 2018. a
Lauritzen, P. H., Nair, R. D., Herrington, A. R., Callaghan, P., Goldhaber, S., Dennis, J. M., Bacmeister, J. T., Eaton, B. E., Zarzycki, C. M., Taylor, M. A., Ullrich, P. A., Dubos, T., Gettelman, A., Neale, R. B., Dobbins, B., Reed, K. A., Hannay, C., Medeiros, B., Benedict, J. J., and Tribbia, J. J.: NCAR Release of CAM-SE in CESM2.0: A Reformulation of the Spectral Element Dynamical Core in Dry-Mass Vertical Coordinates With Comprehensive Treatment of Condensates and Energy, J. Adv. Model. Earth Sy., 10, 1537–1570, https://doi.org/10.1029/2017MS001257, 2018. a
Lauvset, S. K., Key, R. M., Olsen, A., van Heuven, S., Velo, A., Lin, X., Schirnick, C., Kozyr, A., Tanhua, T., Hoppema, M., Jutterström, S., Steinfeldt, R., Jeansson, E., Ishii, M., Perez, F. F., Suzuki, T., and Watelet, S.: A new global interior ocean mapped climatology: the GLODAP version 2, Earth Syst. Sci. Data, 8, 325–340, https://doi.org/10.5194/essd-8-325-2016, 2016. a
Law, R. M., Ziehn, T., Matear, R. J., Lenton, A., Chamberlain, M. A., Stevens, L. E., Wang, Y.-P., Srbinovsky, J., Bi, D., Yan, H., and Vohralik, P. F.: The carbon cycle in the Australian Community Climate and Earth System Simulator (ACCESS-ESM1) – Part 1: Model description and pre-industrial simulation, Geosci. Model Dev., 10, 2567–2590, https://doi.org/10.5194/gmd-10-2567-2017, 2017. a
Le Borgne, R., Feely, R. A., and Mackey, D. J.: Carbon fluxes in the equatorial Pacific: a synthesis of the JGOFS programme, Deep Sea Research Part II: Topical Studies in Oceanography, the Equatorial Pacific JGOFS Synthesis, 49, 2425–2442, https://doi.org/10.1016/S0967-0645(02)00043-7, 2002. a
Lenton, A. and Matear, R. J.: Role of the Southern Annular Mode (SAM) in Southern Ocean CO2 uptake, Global Biogeochem. Cy., 21, GB2016, https://doi.org/10.1029/2006GB002714, 2007. a
Le Quéré, C., Andrew, R. M., Canadell, J. G., Sitch, S., Korsbakken, J. I., Peters, G. P., Manning, A. C., Boden, T. A., Tans, P. P., Houghton, R. A., Keeling, R. F., Alin, S., Andrews, O. D., Anthoni, P., Barbero, L., Bopp, L., Chevallier, F., Chini, L. P., Ciais, P., Currie, K., Delire, C., Doney, S. C., Friedlingstein, P., Gkritzalis, T., Harris, I., Hauck, J., Haverd, V., Hoppema, M., Klein Goldewijk, K., Jain, A. K., Kato, E., Körtzinger, A., Landschützer, P., Lefèvre, N., Lenton, A., Lienert, S., Lombardozzi, D., Melton, J. R., Metzl, N., Millero, F., Monteiro, P. M. S., Munro, D. R., Nabel, J. E. M. S., Nakaoka, S., O'Brien, K., Olsen, A., Omar, A. M., Ono, T., Pierrot, D., Poulter, B., Rödenbeck, C., Salisbury, J., Schuster, U., Schwinger, J., Séférian, R., Skjelvan, I., Stocker, B. D., Sutton, A. J., Takahashi, T., Tian, H., Tilbrook, B., van der Laan-Luijkx, I. T., van der Werf, G. R., Viovy, N., Walker, A. P., Wiltshire, A. J., and Zaehle, S.: Global Carbon Budget 2016, Earth Syst. Sci. Data, 8, 605–649, https://doi.org/10.5194/essd-8-605-2016, 2016. a
Li, Y. and Xu, Y.: Interannual variations of the air-sea carbon dioxide exchange in the different regions of the Pacific Ocean, Acta Oceanol. Sin., 32, 71–79, https://doi.org/10.1007/s13131-013-0291-7, 2013. a, b
Liao, E., Resplandy, L., Liu, J., and Bowman, K. W.: Amplification of the Ocean Carbon Sink During El Niños: Role of Poleward Ekman Transport and Influence on Atmospheric CO2, Global Biogeochem. Cy., 34, e2020GB006574, https://doi.org/10.1029/2020GB006574, 2020. a
Liao, E., Resplandy, L., Liu, J., and Bowman, K. W.: Future Weakening of the ENSO Ocean Carbon Buffer Under Anthropogenic Forcing, Geophys. Res. Lett., 48, e2021GL094021, https://doi.org/10.1029/2021GL094021, 2021. a, b
Liu, S.-M., Chen, Y.-H., Rao, J., Cao, C., Li, S.-Y., Ma, M.-H., and Wang, Y.-B.: Parallel Comparison of Major Sudden Stratospheric Warming Events in CESM1-WACCM and CESM2-WACCM, Atmosphere, 10, 679, https://doi.org/10.3390/atmos10110679, 2019. a
Long, M. C., Lindsay, K., Peacock, S., Moore, J. K., and Doney, S. C.: Twentieth-century oceanic carbon uptake and storage in CESM1 (BGC), J. Climate, 26, 6775–6800, https://doi.org/10.1175/JCLI-D-12-00184.1, 2013. a
Mauritsen, T., Bader, J., Becker, T., Behrens, J., Bittner, M., Brokopf, R., Brovkin, V., Claussen, M., Crueger, T., Esch, M., Fast, I., Fiedler, S., Fläschner, D., Gayler, V., Giorgetta, M., Goll, D. S., Haak, H., Hagemann, S., Hedemann, C., Hohenegger, C., Ilyina, T., Jahns, T., Jimenéz-de-la Cuesta, D., Jungclaus, J., Kleinen, T., Kloster, S., Kracher, D., Kinne, S., Kleberg, D., Lasslop, G., Kornblueh, L., Marotzke, J., Matei, D., Meraner, K., Mikolajewicz, U., Modali, K., Möbis, B., Müller, W. A., Nabel, J. E. M. S., Nam, C. C. W., Notz, D., Nyawira, S.-S., Paulsen, H., Peters, K., Pincus, R., Pohlmann, H., Pongratz, J., Popp, M., Raddatz, T. J., Rast, S., Redler, R., Reick, C. H., Rohrschneider, T., Schemann, V., Schmidt, H., Schnur, R., Schulzweida, U., Six, K. D., Stein, L., Stemmler, I., Stevens, B., von Storch, J.-S., Tian, F., Voigt, A., Vrese, P., Wieners, K.-H., Wilkenskjeld, S., Winkler, A., and Roeckner, E.: Developments in the MPI-M Earth System Model version 1.2 (MPI-ESM1.2) and Its Response to Increasing CO2, J. Adv. Model. Earth Sy., 11, 998–1038, https://doi.org/10.1029/2018MS001400, 2019. a
McKinley, G. A., Follows, M. J., and Marshall, J.: Mechanisms of air-sea CO2 flux variability in the equatorial Pacific and the North Atlantic, Global Biogeochem. Cy., 18, GB2011, https://doi.org/10.1029/2003GB002179, 2004. a, b
Müller, W. A., Jungclaus, J. H., Mauritsen, T., Baehr, J., Bittner, M., Budich, R., Bunzel, F., Esch, M., Ghosh, R., Haak, H., Ilyina, T., Kleine, T., Kornblueh, L., Li, H., Modali, K., Notz, D., Pohlmann, H., Roeckner, E., Stemmler, I., Tian, F., and Marotzke, J.: A Higher-resolution Version of the Max Planck Institute Earth System Model (MPI-ESM1.2-HR), J. Adv. Model. Earth Sy., 10, 1383–1413, https://doi.org/10.1029/2017MS001217, 2018. a
O'Neill, B. C., Tebaldi, C., van Vuuren, D. P., Eyring, V., Friedlingstein, P., Hurtt, G., Knutti, R., Kriegler, E., Lamarque, J.-F., Lowe, J., Meehl, G. A., Moss, R., Riahi, K., and Sanderson, B. M.: The Scenario Model Intercomparison Project (ScenarioMIP) for CMIP6, Geosci. Model Dev., 9, 3461–3482, https://doi.org/10.5194/gmd-9-3461-2016, 2016. a
Patra, P. K., Maksyutov, S., Ishizawa, M., Nakazawa, T., Takahashi, T., and Ukita, J.: Interannual and decadal changes in the sea-air CO2 flux from atmospheric CO2 inverse modeling, Global Biogeochem. Cy., 19, GB4013, https://doi.org/10.1029/2004GB002257, 2005. a
R Core Team: R: A Language and Environment for Statistical Computing, R Foundation for Statistical Computing, Vienna, Austria, https://www.R-project.org/ (last access: 27 July 2022), 2016. a, b
Resplandy, L., Séférian, R., and Bopp, L.: Natural variability of CO2 and O2 fluxes: What can we learn from centuries-long climate models simulations?, J. Geophys. Res.-Oceans, 120, 384–404, https://doi.org/10.1002/2014JC010463, 2015. a, b
Revelle, R. and Suess, H. E.: Carbon Dioxide Exchange Between Atmosphere and Ocean and the Question of an Increase of Atmospheric CO2 during the Past Decades, Tellus A, 9, 18–27, https://doi.org/10.3402/tellusa.v9i1.9075, 1957. a
Rodgers, K. B., Ishii, M., Frölicher, T. L., Schlunegger, S., Aumont, O., Toyama, K., and Slater, R. D.: Coupling of Surface Ocean Heat and Carbon Perturbations over the Subtropical Cells under Twenty-First Century Climate Change, J. Climate, 33, 10321–10338, https://doi.org/10.1175/JCLI-D-19-1022.1, 2020. a
Roy, T., Bopp, L., Gehlen, M., Schneider, B., Cadule, P., Frölicher, T. L., Segschneider, J., Tjiputra, J., Heinze, C., and Joos, F.: Regional impacts of climate change and atmospheric CO2 on future ocean carbon uptake: A multimodel linear feedback analysis, J. Climate, 24, 2300–2318, https://doi.org/10.1175/2010JCLI3787.1, 2011. a
Seferian, R.: CNRM-CERFACS CNRM-ESM2-1 model output prepared for CMIP6 CMIP historical, Earth System Grid Federation, https://doi.org/10.22033/ESGF/CMIP6.4068, 2018. a
Séférian, R., Nabat, P., Michou, M., Saint-Martin, D., Voldoire, A., Colin, J., Decharme, B., Delire, C., Berthet, S., Chevallier, M., Sénési, S., Franchisteguy, L., Vial, J., Mallet, M., Joetzjer, E., Geoffroy, O., Guérémy, J.-F., Moine, M.-P., Msadek, R., Ribes, A., Rocher, M., Roehrig, R., Salas-y Mélia, D., Sanchez, E., Terray, L., Valcke, S., Waldman, R., Aumont, O., Bopp, L., Deshayes, J., Éthé, C., and Madec, G.: Evaluation of CNRM Earth System Model, CNRM-ESM2-1: Role of Earth System Processes in Present-Day and Future Climate, J. Adv. Model. Earth Sy., 11, 4182–4227, https://doi.org/10.1029/2019MS001791, 2019. a
Séférian, R., Berthet, S., Yool, A., Palmieri, J., Bopp, L., Tagliabue, A., Kwiatkowski, L., Aumont, O., Christian, J., Dunne, J., et al.: Tracking improvement in simulated marine biogeochemistry between CMIP5 and CMIP6, Current Climate Change Reports, 6, 95–119, https://doi.org/10.1007/s40641-020-00160-0, 2020. a
Seland, Ø., Bentsen, M., Olivié, D., Toniazzo, T., Gjermundsen, A., Graff, L. S., Debernard, J. B., Gupta, A. K., He, Y.-C., Kirkevåg, A., Schwinger, J., Tjiputra, J., Aas, K. S., Bethke, I., Fan, Y., Griesfeller, J., Grini, A., Guo, C., Ilicak, M., Karset, I. H. H., Landgren, O., Liakka, J., Moseid, K. O., Nummelin, A., Spensberger, C., Tang, H., Zhang, Z., Heinze, C., Iversen, T., and Schulz, M.: Overview of the Norwegian Earth System Model (NorESM2) and key climate response of CMIP6 DECK, historical, and scenario simulations, Geosci. Model Dev., 13, 6165–6200, https://doi.org/10.5194/gmd-13-6165-2020, 2020. a
Seland, Y., Bentsen, M., Oliviè, D. J. L., Toniazzo, T., Gjermundsen, A., Graff, L. S., Debernard, J. B., Gupta, A. K., He, Y., Kirkevåg, A., Schwinger, J., Tjiputra, J., Aas, K. S., Bethke, I., Fan, Y., Griesfeller, J., Grini, A., Guo, C., Ilicak, M., Karset, I. H. H., Landgren, O. A., Liakka, J., Moseid, K. O., Nummelin, A., Spensberger, C., Tang, H., Zhang, Z., Heinze, C., Iversen, T., and Schulz, M.: NCC NorESM2-LM model output prepared for CMIP6 CMIP historical, Earth System Grid Federation, https://doi.org/10.22033/ESGF/CMIP6.8036, 2019. a
Sellar, A. A., Jones, C. G., Mulcahy, J. P., Tang, Y., Yool, A., Wiltshire, A., O'Connor, F. M., Stringer, M., Hill, R., Palmieri, J., Woodward, S., de Mora, L., Kuhlbrodt, T., Rumbold, S. T., Kelley, D. I., Ellis, R., Johnson, C. E., Walton, J., Abraham, N. L., Andrews, M. B., Andrews, T., Archibald, A. T., Berthou, S., Burke, E., Blockley, E., Carslaw, K., Dalvi, M., Edwards, J., Folberth, G. A., Gedney, N., Griffiths, P. T., Harper, A. B., Hendry, M. A., Hewitt, A. J., Johnson, B., Jones, A., Jones, C. D., Keeble, J., Liddicoat, S., Morgenstern, O., Parker, R. J., Predoi, V., Robertson, E., Siahaan, A., Smith, R. S., Swaminathan, R., Woodhouse, M. T., Zeng, G., and Zerroukat, M.: UKESM1: Description and Evaluation of the U.K. Earth System Model, J. Adv. Model. Earth Sy., 11, 4513–4558, https://doi.org/10.1029/2019MS001739, 2019. a
Swart, N. C., Cole, J. N., Kharin, V. V., Lazare, M., Scinocca, J. F., Gillett, N. P., Anstey, J., Arora, V., Christian, J. R., Jiao, Y., Lee, W. G., Majaess, F., Saenko, O. A., Seiler, C., Seinen, C., Shao, A., Solheim, L., von Salzen, K., Yang, D., Winter, B., and Sigmond, M.: CCCma CanESM5-CanOE model output prepared for CMIP6 CMIP historical, Earth System Grid Federation, https://doi.org/10.22033/ESGF/CMIP6.10260, 2019a. a
Swart, N. C., Cole, J. N., Kharin, V. V., Lazare, M., Scinocca, J. F., Gillett, N. P., Anstey, J., Arora, V., Christian, J. R., Jiao, Y., Lee, W. G., Majaess, F., Saenko, O. A., Seiler, C., Seinen, C., Shao, A., Solheim, L., von Salzen, K., Yang, D., Winter, B., and Sigmond, M.: CCCma CanESM5 model output prepared for CMIP6 CMIP historical, Earth System Grid Federation, https://doi.org/10.22033/ESGF/CMIP6.3610, 2019b. a
Swart, N. C., Cole, J. N. S., Kharin, V. V., Lazare, M., Scinocca, J. F., Gillett, N. P., Anstey, J., Arora, V., Christian, J. R., Hanna, S., Jiao, Y., Lee, W. G., Majaess, F., Saenko, O. A., Seiler, C., Seinen, C., Shao, A., Sigmond, M., Solheim, L., von Salzen, K., Yang, D., and Winter, B.: The Canadian Earth System Model version 5 (CanESM5.0.3), Geosci. Model Dev., 12, 4823–4873, https://doi.org/10.5194/gmd-12-4823-2019, 2019c. a, b
Takahashi, T., Olafsson, J., Goddard, J. G., Chipman, D. W., and Sutherland, S. C.: Seasonal variation of CO2 and nutrients in the high-latitude surface oceans: A comparative study, Global Biogeochem. Cy., 7, 843–878, https://doi.org/10.1029/93GB02263, 1993. a, b, c
Takahashi, T., Sutherland, S. C., Sweeney, C., Poisson, A., Metzl, N., Tilbrook, B., Bates, N., Wanninkhof, R., Feely, R. A., Sabine, C., Olafsson, J., and Nojiri, Y.: Global sea-air CO2 flux based on climatological surface ocean pCO2, and seasonal biological and temperature effects, Deep Sea Research Part II: Topical Studies in Oceanography, 49, 1601–1622, https://doi.org/10.1016/S0967-0645(02)00003-6, 2002. a, b, c
Takahashi, T., Sutherland, S. C., Wanninkhof, R., Sweeney, C., Feely, R. A., Chipman, D. W., Hales, B., Friederich, G., Chavez, F., Sabine, C., Watson, A., Bakker, D. C., Schuster, U., Metzl, N., Yoshikawa-Inoue, H., Ishii, M., Midorikawa, T., Nojiri, Y., Körtzinger, A., Steinhoff, T., Hoppema, M., Olafsson, J., Arnarson, T. S., Tilbrook, B., Johannessen, T., Olsen, A., Bellerby, R., Wong, C., Delille, B., Bates, N., and de Baar, H. J.: Climatological mean and decadal change in surface ocean pCO2, and net sea-air CO2 flux over the global oceans, Deep Sea Research Part II: Topical Studies in Oceanography, 56, 554–577, https://doi.org/10.1016/j.dsr2.2008.12.009, 2009. a
Tang, Y., Rumbold, S., Ellis, R., Kelley, D., Mulcahy, J., Sellar, A., Walton, J., and Jones, C.: MOHC UKESM1.0-LL model output prepared for CMIP6 CMIP historical, Earth System Grid Federation, https://doi.org/10.22033/ESGF/CMIP6.6113, 2019. a
Taylor, K., Stouffer, R., and Meehl, G.: An overview of CMIP5 and the experiment design, Bull. Am. Meteor. Soc., 93, 485–498, https://doi.org/10.1175/BAMS-D-11-00094.1, 2012. a
Tjiputra, J. F., Assmann, K., and Heinze, C.: Anthropogenic carbon dynamics in the changing ocean, Ocean Sci., 6, 605–614, https://doi.org/10.5194/os-6-605-2010, 2010. a
Tjiputra, J. F., Olsen, A., Assmann, K., Pfeil, B., and Heinze, C.: A model study of the seasonal and long-term North Atlantic surface pCO2 variability, Biogeosciences, 9, 907–923, https://doi.org/10.5194/bg-9-907-2012, 2012. a
Tjiputra, J. F., Schwinger, J., Bentsen, M., Morée, A. L., Gao, S., Bethke, I., Heinze, C., Goris, N., Gupta, A., He, Y.-C., Olivié, D., Seland, Ø., and Schulz, M.: Ocean biogeochemistry in the Norwegian Earth System Model version 2 (NorESM2), Geosci. Model Dev., 13, 2393–2431, https://doi.org/10.5194/gmd-13-2393-2020, 2020. a
Toyama, K., Rodgers, K. B., Blanke, B., Iudicone, D., Ishii, M., Aumont, O., and Sarmiento, J. L.: Large Reemergence of Anthropogenic Carbon into the Ocean’s Surface Mixed Layer Sustained by the Ocean’s Overturning Circulation, J. Climate, 30, 8615–8631, https://doi.org/10.1175/JCLI-D-16-0725.1, 2017. a
Valsala, V. K., Roxy, M. K., Ashok, K., and Murtugudde, R.: Spatiotemporal characteristics of seasonal to multidecadal variability of pCO2 and air-sea CO2 fluxes in the equatorial Pacific Ocean, J. Geophys. Res.-Oceans, 119, 8987–9012, https://doi.org/10.1002/2014JC010212, 2014. a
Wang, X., Murtugudde, R., Hackert, E., Wang, J., and Beauchamp, J.: Seasonal to decadal variations of sea surface pCO2 and sea-air CO2 flux in the equatorial oceans over 1984–2013: A basin-scale comparison of the Pacific and Atlantic Oceans, Global Biogeochem. Cy., 29, 597–609, https://doi.org/10.1002/2014GB005031, 2015. a, b
Wanninkhof, R.: Relationship between wind speed and gas exchange over the ocean revisited, Limnol. Oceanogr.-Meth., 12, 351–362, https://doi.org/10.4319/lom.2014.12.351, 2014. a
WCRP (World Climate Research Programme): CMIP6, https://esgf-node.llnl.gov/search/cmip6, 20xx. a
Wetzel, P., Winguth, A., and Maier-Reimer, E.: Sea-to-air CO2 flux from 1948 to 2003: A model study, Global Biogeochem. Cy., 19, GB2005, https://doi.org/10.1029/2004GB002339, 2005. a, b
Wieners, K.-H., Giorgetta, M., Jungclaus, J., Reick, C., Esch, M., Bittner, M., Legutke, S., Schupfner, M., Wachsmann, F., Gayler, V., Haak, H., de Vrese, P., Raddatz, T., Mauritsen, T., von Storch, J.-S., Behrens, J., Brovkin, V., Claussen, M., Crueger, T., Fast, I., Fiedler, S., Hagemann, S., Hohenegger, C., Jahns, T., Kloster, S., Kinne, S., Lasslop, G., Kornblueh, L., Marotzke, J., Matei, D., Meraner, K., Mikolajewicz, U., Modali, K., Müller, W., Nabel, J., Notz, D., Peters-von Gehlen, K., Pincus, R., Pohlmann, H., Pongratz, J., Rast, S., Schmidt, H., Schnur, R., Schulzweida, U., Six, K., Stevens, B., Voigt, A., and Roeckner, E.: MPI-M MPI-ESM1.2-LR model output prepared for CMIP6 CMIP historical, Earth System Grid Federation, https://doi.org/10.22033/ESGF/CMIP6.6595, 2019. a
Winguth, A. M. E., Heinmann, M., Kurz, K. D., Maier-Reimer, E., Mikolajewicz, U., and Segschneider, J.: El Niño-Southern Oscillation related fluctuations of the marine carbon cycle, Global Biogeochem. Cy., 8, 39–63, https://doi.org/10.1029/93GB03134, 1994. a
Yukimoto, S., Kawai, H., Koshiro, T., Oshima, N., Yoshida, K., Urakawa, S., Tsujino, H., Deushi, M., Tanaka, T., Hosaka, M., Yabu, S., Yoshimura, H., Shindo, E., Mizuta, R., Obata, A., Adachi, Y., and Ishii, M.: The Meteorological Research Institute Earth System Model Version 2.0, MRI-ESM2.0: Description and Basic Evaluation of the Physical Component, J. Meteor. Soc. Japan, 97, 931–965, https://doi.org/10.2151/jmsj.2019-051, 2019a. a
Yukimoto, S., Koshiro, T., Kawai, H., Oshima, N., Yoshida, K., Urakawa, S., Tsujino, H., Deushi, M., Tanaka, T., Hosaka, M., Yoshimura, H., Shindo, E., Mizuta, R., Ishii, M., Obata, A., and Adachi, Y.: MRI MRI-ESM2.0 model output prepared for CMIP6 CMIP historical, Earth System Grid Federation, https://doi.org/10.22033/ESGF/CMIP6.6842, 2019b. a
Zhu, Y., Zhang, R.-H., Li, D., and Chen, D.: The Thermocline Biases in the Tropical North Pacific and Their Attributions, J. Climate, 34, 1635–1648, https://doi.org/10.1175/JCLI-D-20-0675.1, 2021. a
Ziehn, T., Chamberlain, M., Lenton, A., Law, R., Bodman, R., Dix, M., Wang, Y., Dobrohotoff, P., Srbinovsky, J., Stevens, L., Vohralik, P., Mackallah, C., Sullivan, A., O'Farrell, S., and Druken, K.: CSIRO ACCESS-ESM1.5 model output prepared for CMIP6 CMIP historical, Earth System Grid Federation, https://doi.org/10.22033/ESGF/CMIP6.4272, 2019. a
Zuo, H., Balmaseda, M. A., Tietsche, S., Mogensen, K., and Mayer, M.: The ECMWF operational ensemble reanalysis-analysis system for ocean and sea ice: a description of the system and assessment, Ocean Sci., 15, 779–808, https://doi.org/10.5194/os-15-779-2019, data available at: https://www.cen.uni-hamburg.de/icdc/data/ocean/easy-init-ocean/ecmwf-oras5.html (last access: 11 December 2021), 2019. a, b