the Creative Commons Attribution 4.0 License.
the Creative Commons Attribution 4.0 License.
 | 30 Mar 2021
Diverging land-use projections cause large variability in their impacts on ecosystems and related indicators for ecosystem services
Anita D. Bayer
Richard Fuchs
Reinhard Mey
Andreas Krause
Peter H. Verburg
Peter Anthoni
Almut Arneth
Land-use models and integrated assessment models provide scenarios of land-use and land-cover (LULC) changes following pathways or storylines related to different socioeconomic and environmental developments. The large diversity of available scenario projections leads to a recognizable variability in impacts on land ecosystems and the levels of services provided. We evaluated 16 projections of future LULC until 2040 that reflected different assumptions regarding socioeconomic demands and modeling protocols. By using these LULC projections in a state-of-the-art dynamic global vegetation model, we simulated their effect on selected ecosystem service indicators related to ecosystem productivity and carbon sequestration potential, agricultural production and the water cycle. We found that although a common trend for agricultural expansion exists across the scenarios, where and how particular LULC changes are realized differs widely across models and scenarios. They are linked to model-specific considerations of some demands over others and their respective translation into LULC changes and also reflect the simplified or missing representation of processes related to land dynamics or other influencing factors (e.g., trade, climate change). As a result, some scenarios show questionable and possibly unrealistic features in their LULC allocations, including highly regionalized LULC changes with rates of conversion that are contrary to or exceed rates observed in the past. Across the diverging LULC projections, we identified positive global trends of net primary productivity (+10.2 % ± 1.4 %), vegetation carbon (+9.2 % ± 4.1 %), crop production (+31.2 % ± 12.2 %) and water runoff (+9.3 % ± 1.7 %), and a negative trend of soil and litter carbon stocks (−0.5 % ± 0.4 %). The variability in ecosystem service indicators across scenarios was especially high for vegetation carbon stocks and crop production. Regionally, variability was highest in tropical forest regions, especially at current forest boundaries, because of intense and strongly diverging LULC change projections in combination with high vegetation productivity dampening or amplifying the effects of climatic change. Our results emphasize that information on future changes in ecosystem functioning and the related ecosystem service indicators should be seen in light of the variability originating from diverging projections of LULC. This is necessary to allow for adequate policy support towards sustainable transformations.
- Article
(7805 KB) - Full-text XML
-
Supplement
(1915 KB) - BibTeX
- EndNote


The recently presented Intergovernmental Panel on Climate Change (IPCC) Special Report on Climate Change and Land (IPCC, 2019) highlighted unprecedented rates of land and freshwater use and biodiversity loss and underpinned existing socioeconomic, ecological and climatic challenges such as increasing per capita food consumption, land degradation and an accumulation of climate extreme events. The Intergovernmental Science-Policy Platform on Biodiversity and Ecosystem Services (IPBES) global assessment report published earlier in 2019 (IPBES, 2019) also reported deteriorating levels of most ecosystem services (ESs) and natural capital due to past and current human activities. The cumulative contribution of land-use and land-cover (LULC) change to global CO2 emissions has been estimated to about one-third of total anthropogenic emissions since preindustrial times (Friedlingstein et al., 2019), and total greenhouse gas emissions from LULC in recent years are nearly 25 % of total anthropogenic emissions (IPCC, 2019). The diversity of current challenges towards a more sustainable use of land, including the maintenance of critical levels of resources and counteracting climate change, and the various options to approach these challenges create a large option space for possible future developments of LULC.
Future LULC and changes therein are modeled based on initial conditions of land use along with LULC history and different assumptions about possible socioeconomic and environmental developments regarding population growth, international cooperation, consumption preferences or technological developments. All of these are represented differently in land-use models (LUMs) or integrated assessment models (IAMs, e.g., DeFries et al., 2004; Meiyappan et al., 2014; van Vliet et al., 2016). However, these models play a central role in assessing possible climate change mitigation and adaptation or conservation strategies in terms of total land demand, investment and maintenance costs, and direct and indirect socioeconomic and ecological effects (e.g., Humpenöder et al., 2014; Popp et al., 2014; Reilly et al., 2012).
In total, the diversity of models, initial model conditions, socioeconomic pathways, climate mitigation targets, processes and process feedbacks considered in the LULC modeling procedure leads to a large number of diverging land-use projections. This reflects not only the fact that the future is unknown but also a large uncertainty introduced by the model structure itself (e.g., Alexander et al., 2017; Prestele et al., 2016; Schmitz et al., 2014; Stehfest et al., 2019; van Vliet et al., 2016). By evaluating a large set of LULC projections (75 and 43, respectively), Alexander et al. (2017) and Prestele et al. (2016) attributed a significant share of the uncertainty in global and regional LULC projections to the model initial conditions, resulting in part from different LULC definitions (especially for pastures; see also, e.g., Verburg et al., 2011), followed by the model structure, scenario storyline and other factors. Alexander et al. (2017) identified the differences in projected global LULC associated with the modeling approach to be at least as great as the differences due to scenario variations. In a regional-level analysis, Prestele et al. (2016) found the highest uncertainty in land-use projections generally at the boundaries of boreal and tropical forests. LULC projections have also been evaluated in a number of model intercomparison studies, in which models simulated the same scenario storylines based on harmonized drivers, in order to focus on the uncertainty in LULC changes resulting from structural differences between the models (e.g., Von Lampe et al., 2014; Popp et al., 2017; Schmitz et al., 2014; Stehfest et al., 2019).
The large uncertainties in LULC projections affect the confidence in projected changes in ecosystem functioning globally, which critically underpins the supply of future ESs available to human societies. In the same ways as the effects of climate change, the uncertainties arising from different LULC projections need to be identified and understood to adapt ecosystems in a sustainable way and possibly counteract critical regional trends. Studies have focused on the vulnerability of ecosystems and their services to changes in climate (e.g., Ahlström et al., 2012; Huntingford et al., 2011; Ostberg et al., 2013; Scholze et al., 2006), land use on a global or regional scale (e.g., Arora and Boer, 2010; Foley et al., 2005; Jantz et al., 2015; Krause et al., 2017; Lawler et al., 2014; Sterling et al., 2013), and a combination of climate and land-use effects (e.g., Dunford et al., 2015; Kim et al., 2018; Krause et al., 2019; Rabin et al., 2020). Moreover, uncertainties arising from different ES quantification methods were estimated (e.g., Schulp et al., 2014). These studies have already begun to document that diverging LULC projections are as important as diverging climate change scenarios with respect to the degree of impact on ecosystems.
Thus, we expand these previous studies here by bringing together a larger number of LULC scenarios and by critically examining the resulting variability in diverging LUM projections based on recent historical observations. We intend to also highlight how different LULC patterns impact ecosystems and related ES indicators. This supports the interpretation of conclusions derived from LUMs and IAMs towards policy decisions regarding factors such as intensification, conservation or climate change mitigation options. A broad range of future LULC projections from different LUMs and different socioeconomic assumptions is important, given the unknown future. Nevertheless, critically assessing the spatial pattern and rates of change can support their interpretation in terms of plausibility.
Our basis was 16 projections of future land use from five LUMs or IAMs with different modeling protocols and socioeconomic pathways. Their scenario storylines span a wide range of world views and policies, with some implemented to achieve a certain climate mitigation or conservation target while others focus only on basic demands for agricultural commodities, built-up area and so on. Models and scenarios were assessed based on their underlying demands, modeling protocols (e.g., assumptions involved, allocation strategies) and the projected spatially explicit land-use futures that they describe. We then used the 16 land-use projections as input for simulations with a state-of-the-art dynamic global vegetation model (DGVM) to analyze their effects on ecosystem functionality and six selected ES indicators linked to the productivity and carbon (C) sequestration potential of ecosystems (net primary productivity, vegetation C, soil and litter C), agricultural production (crop production) and the water cycle (evapotranspiration and annual runoff). We focused on changes until 2040, i.e., the near to medium future.
Table 1Overview of land-use models and scenarios used in this study. Main references are given for each model and the scenarios applied in this study; the reader is also referred to the references therein for further details.
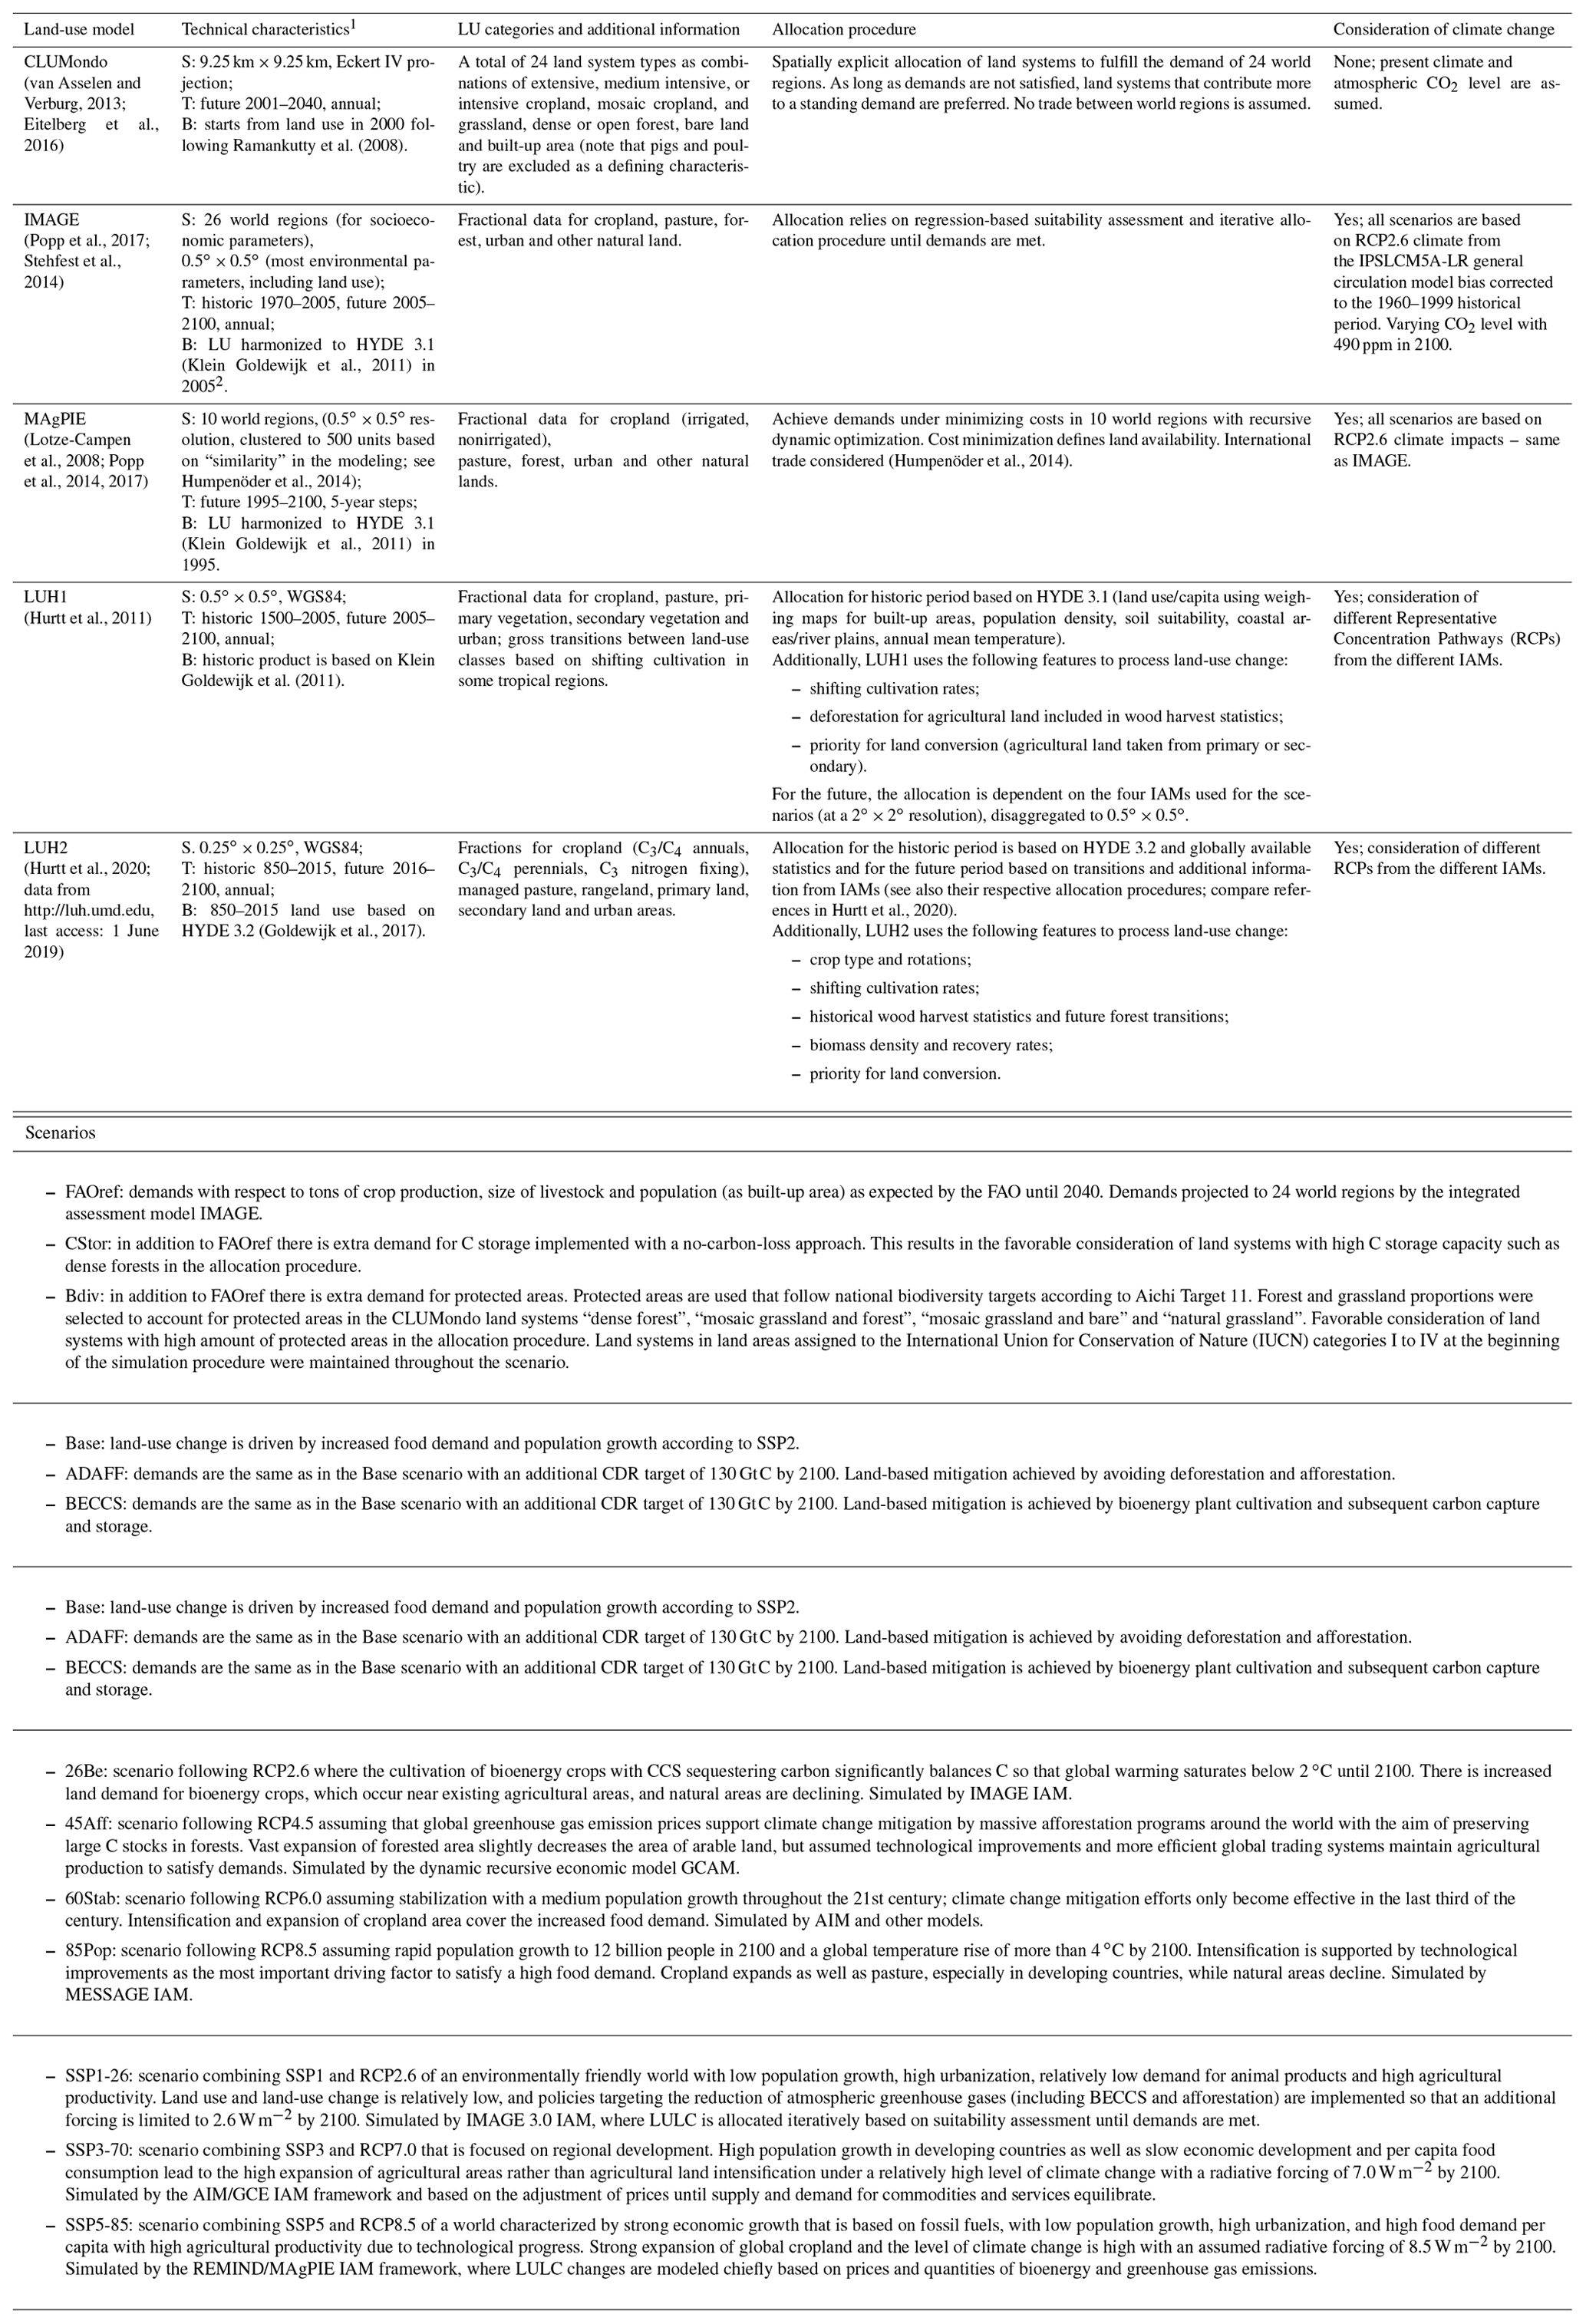
1 “S” represents spatial resolution and projection, “T” represents time horizons, and “B” represents underlying databases or the historical land-use baseline from which scenarios start. 2 Small deviations in the area of the land-cover classes between IMAGE/MAgPIE and HYDE 3.1 land use in 1995/2005 occur due to different land masks and calibration routines.
2.1 Land-use models and scenarios
We used a total set of 16 land-use scenarios originating from five different LUMs or IAMs. The models differ in their underlying demands, modeling protocols and technical aspects (e.g., number of represented land-use classes, time horizons), which are summarized in this section and in Table 1. Although some of the models considered here are IAMs including a land-use component, we refer to all models in this study as global LUMs for the remainder of this paper because their projected LULC change is the target of this analysis. This includes the two versions of the Land-Use Harmonization (LUH) project prominently applied in many studies of the last and the upcoming IPCC reports, although these land-use products are based on the outputs of several LUMs and IAMs.
The CLUMondo model (van Asselen and Verburg, 2013) applies 30 land system types to model LULC changes. Land systems define typical combinations of shares of cropland, grassland, bare land and built-up land as well as a specific management intensity (e.g., extensive cropland with few livestock). Land systems are dynamically allocated based on local suitability, spatial restrictions and the competition between land systems to fulfill demands that were created exogenously by the IMAGE model on the level of world regions. Trade between world regions is excluded in CLUMondo. Eitelberg et al. (2016) designed three CLUMondo scenarios: a reference scenario following the development of basic demands as expected by the Food and Agriculture Organization (FAO) and two scenarios that additionally included a policy target of reducing deforestation and greenhouse gas emissions with a higher ecosystem carbon storage and international policy targets for the prevention of biodiversity loss.
The Integrated Model to Assess the Global Environment (IMAGE) is an IAM framework including sub-models representing the energy system, agricultural economy, land use and the climate system (Stehfest et al., 2014). LULC allocation is done following an assessment and ranking of land's suitability to fulfill demands. From IMAGE, a LULC baseline projection following increased food demand and population growth according to the Shared Socioeconomic Pathway (SSP) 2 (O'Neill et al., 2014) is available as well as two additional scenarios involving land-based climate change mitigation, either via the conservation and expansion of global forest area (ADAFF) or bioenergy crop cultivation and subsequent carbon capture and storage (BECCS) (Krause et al., 2017).
MAgPIE is a global land-use model of the agricultural sector (Lotze-Campen et al., 2008; Popp et al., 2014). It optimizes spatially explicit land-use patterns in a recursive dynamic way to satisfy given commodity demands at minimal production costs while meeting biophysical and socioeconomic constraints. Options to fulfill increasing demands are intensification (yield-increasing technologies), cropland and pasture expansion, and international trade. Future land-use projections of the MAgPIE model follow the same storylines as described for IMAGE (Krause et al., 2017).
The Hurtt et al. (2011) modeling approach (LUH1) combines a historic land-use reconstruction with national statistics of historical wood harvest and assumptions regarding shifting cultivation in some tropical regions, and it harmonizes these data with a set of four future LULC scenarios. Each scenario was produced by a different IAM with individual demands and strategies for allocating LULC in response to the demands. The four scenarios follow very different socioeconomic storylines that are combined with the emissions and climate change assumptions of the Representative Concentration Pathways (RCPs). LUH1 scenarios are not tied to the SSPs, as those were only introduced in 2014. These scenarios have frequently been used in the modeling community, especially for the work in the IPCC AR5 (e.g., O'Neill et al., 2014; van Vuuren et al., 2014). Here, we used the version of LUH1 which had the historical dataset extended until 2014 (Le Quéré et al., 2015) as well as future trajectories following IAM implementations of RCPs 2.6, 4.5, 6.0 and 8.5.
The Land-Use Harmonization v2 (LUH2; v2.1, Hurtt et al., 2020) has been developed for the Coupled Model Intercomparison Project Phase 6 (CMIP6; Eyring et al., 2016). It follows a similar methodology as in LUH1, although on a higher spatial resolution and over a longer time domain, using updated historical land-use reconstructions along with updated models of past and future land transitions and management (e.g., wood harvest, crop rotations and shifting cultivation) and extending the number of scenarios by combining RCPs with SSPs. Similar to LUH1, future LULC transitions in LUH2 are based on land-use projections from different IAMs that each follow their own strategy for allocating LULC in response to demands. Of the eight scenarios that have been harmonized in LUH2 with historical data, three scenarios were selected (SSP1-26, SSP3-70 and SSP5-85) to span the range from low to high radiative forcing as in the LUH1 scenarios in combination with diverging land-use trends according to the SSPs.
2.2 LPJ-GUESS model
The process-based dynamic global vegetation model LPJ-GUESS simulates vegetation dynamics in response to climate, atmospheric CO2, land-use change (Lindeskog et al., 2013) and nitrogen (N) dynamics (Olin et al., 2015; Smith et al., 2014). Three distinct land-use types are represented (natural vegetation, pasture and cropland). Vegetation dynamics in natural areas are characterized by the establishment, competition and mortality of 12 plant functional types (PFTs, 10 woody and C3 and C4 grass types, as in Smith et al., 2014), which are distinguished in terms of their bioclimatic preferences, photosynthetic pathways and growth strategies. Pastures are populated with competing C3 and C4 grass PFTs, where 50 % of the aboveground biomass is removed each year as a representation of grazing (Lindeskog et al., 2013). Croplands are represented by prescribed fractions of crop functional types (CFTs, i.e., C3 crops with winter and spring sowing dates, C4 crops and rice), with crop-specific processes including dedicated carbon allocation and phenology, explicit sowing and harvest representation, irrigation, fertilization and unmanaged cover grass growing between cropping seasons (Olin et al., 2015). Crops are prescribed to be either rain-fed or irrigated (Lindeskog et al., 2013). LPJ-GUESS does not assume yield increases due to technological progress (such as advanced new varieties, management techniques, pest control), but yields respond to changes in climate, atmospheric CO2 concentration, N input (deposition and fertilizer rates) and the fraction of rain-fed vs. irrigated cropland. Adaptation to climate change is partially accounted for by a dynamic calculation of potential heat units (PHU) needed for the full development of a crop before harvest, simulating the adequate selection of suitable crop varieties under changing climate (see Lindeskog et al., 2013). Upon conversion of forested natural land for agriculture, 20 % of the woody biomass enters a product pool (turnover time of 25 years), with the rest being directly oxidized (74 %) or decomposed as litter (6 %). Following agricultural abandonment, natural vegetation recolonizes the land in a typical succession from herbaceous to woody plants, with competition for resources and light among age cohorts of woody PFTs simulated directly through forest gap dynamics. In natural ecosystems, fire is simulated explicitly as a recurring disturbance, while other episodic events (such as insect outbreaks or windthrow) are subsumed in a background disturbance that occurs with a probability of 1 % each year.
2.3 Simulation setup
LPJ-GUESS was run at a 0.5∘ × 0.5∘ resolution and forced by the monthly climate of the IPSL-CM5A-LR general circulation model (GCM). The model projects a global average surface temperature increase of about 1.3 ∘C by the end of the century relative to 1980–2009, which lies in the middle of an ensemble of a wider range of GCMs used in the Inter-Sectoral Impact Model Intercomparison Project (ISI-MIP; Warszawski et al., 2014). Climate projections and CO2 concentrations followed the RCP2.6 pathway. Large magnitudes of climate change and high atmospheric CO2 concentrations affect ES indicators notably (see, e.g., Alexander et al., 2018). As our focus here is on the impact of land-use change, we chose a climate change projection that would have relatively little additional impact over the simulation period. In a sensitivity experiment, we explore the range of variability due to different climate models using the RCP2.6 outputs from the GFDL-ESM2M, HadGEM2-ES, MIROC-ESM-CHEM and NorESM1-M models (Warszawski et al., 2014) and LULC from the four LUH1 scenarios.
We modeled the ice-free land surface and included only those grid cells in our simulations for which all LUMs provided data. Table S1 in the Supplement provides the detailed simulation setup with all forcing data for the LPJ-GUESS simulations. The differences in the modeling protocol of CLUMondo/LUH1/LUH2 and IMAGE/MAgPIE simulations will affect the base level of ES indicators in 2000–2004 to some degree, although the impacts of slightly diverging historical model periods, spin-up and historical climate would have mostly disappeared by the beginning of the 21st century (baseline period). Larger effects arise from the intrinsic differences in the individual LUMs (see also Alexander et al., 2017). In principle, differences in the baseline land-cover maps could spill over to the simulated degree of change in the future scenarios. For instance, the presence or absence of natural vegetation in the baseline maps might translate into variable degrees of future (semi)natural vegetation regrowth. However, this would only be an important consideration when comparing similar scenarios (and their underpinning storylines related to factors such as sustainability). The alternative approach of harmonizing the different projections to the same starting point of land cover would artificially mask some of the simulated differences in ES indicators which would be contrary to our objectives. Therefore, LUM data were taken as they are, with each LUM scenario providing a seamless transition from historical to future, which is needed to simulate vegetation and carbon cycle responses.
Some of the variables assessed in LPJ-GUESS would also be computed in the models that deliver the LULC change scenarios – most notably crop yields and some carbon-cycle- or water-cycle-related variables. The spatial patterns of these would differ in the LUMs and LPJ-GUESS. However, this does not affect our analysis: here we take the LULC change projections in a unidirectional approach to assess impacts on ecosystem processes; we do not compare similar ecosystem output variables across different model types.
LULC fractions were taken as net annual transitions from the LUMs and aggregated to the three land-use types – cropland, pasture and natural land – used by LPJ-GUESS (see Table S2 in the Supplement) and to the spatial resolution of 0.5∘ × 0.5∘ if needed. Cropland fractions also included bioenergy areas, and pasture fractions included degraded forests (IMAGE only), rangeland and grazing land. As LPJ-GUESS does not represent urban land, built-up areas were included in the natural land fraction. Where 0.5∘ grid cells contain substantial shares of water, this fraction was assigned to bare land, i.e., excluded from the simulation of vegetation pattern in LPJ-GUESS. In CLUMondo, LULC changes do not occur between land-cover types but between more complex land-use systems (see Sect. 2.1) that have different compositions in terms of natural, pasture and cropland area. In addition, the fractions of each land system vary regionally. In our simulations, we did not include wood harvest. In the BECCS scenarios we assumed 80 % of the harvested C from bioenergy crops to be captured and stored following Krause et al. (2017).
2.4 Simulation of ecosystem service indicators
Changes in ecosystem function and services were assessed using a suite of regulating and provisioning ES indicators: net primary productivity (NPP, foremost an indicator for ecosystem productivity and C sequestration related to global climate regulation, also used as indicator for ecosystem health), C storage (natural capital that underpins and is closely related to C sequestration and global climate regulation), crop production (contributing to food supply), annual water runoff (indicator for water availability but also related to flood regulation) and evapotranspiration (indicator for regional climate regulation). C storage was investigated for vegetation, soil and litter C as well as total C, with the latter also including carbon stored via carbon capture and storage (CCS) in BECCS scenarios. All plant and crop functional types contribute to an ecosystems' NPP. Therefore, NPP and crop production are positively correlated. All variables are direct outputs of LPJ-GUESS simulations. Baseline crop yields of each run were scaled to FAO observed yields in 1997–2003 as in Krause et al. (2017). Yields respond to changes in climate and CO2, also including some degree of adaptation, which arises from the calculation of dynamic PHU (see Sect. 2.2). Adaptation related to factors such as choosing different crop species in a grid cell was not considered here in simulations of the future period. Changes in ES indicators were analyzed for each LULC scenario as percent change in 2036–2040 relative to the base level in 2000–2004. The average of 5 years was used to reduce the influence of interannual variability. As climatic and atmospheric changes are identical across the simulations, differences in ES indicator changes across the scenarios mostly reflect the immediate and long-term effects of changes in LULC, also considering that climate change impacts might be dampened or amplified depending on the vegetation cover existing in a grid location. The evaluation of percent changes in future LULC and ES indicators relative to the baseline period in 2000–2004 partially takes account of differences in baseline LULC patterns and ES provision levels across the scenarios.

Figure 1Absolute land area of croplands, pastures and natural areas between 1850 and 2100 for 16 scenarios of five land-use models, and the detailed relative changes in LU from 2000 to 2040 analyzed in this study.
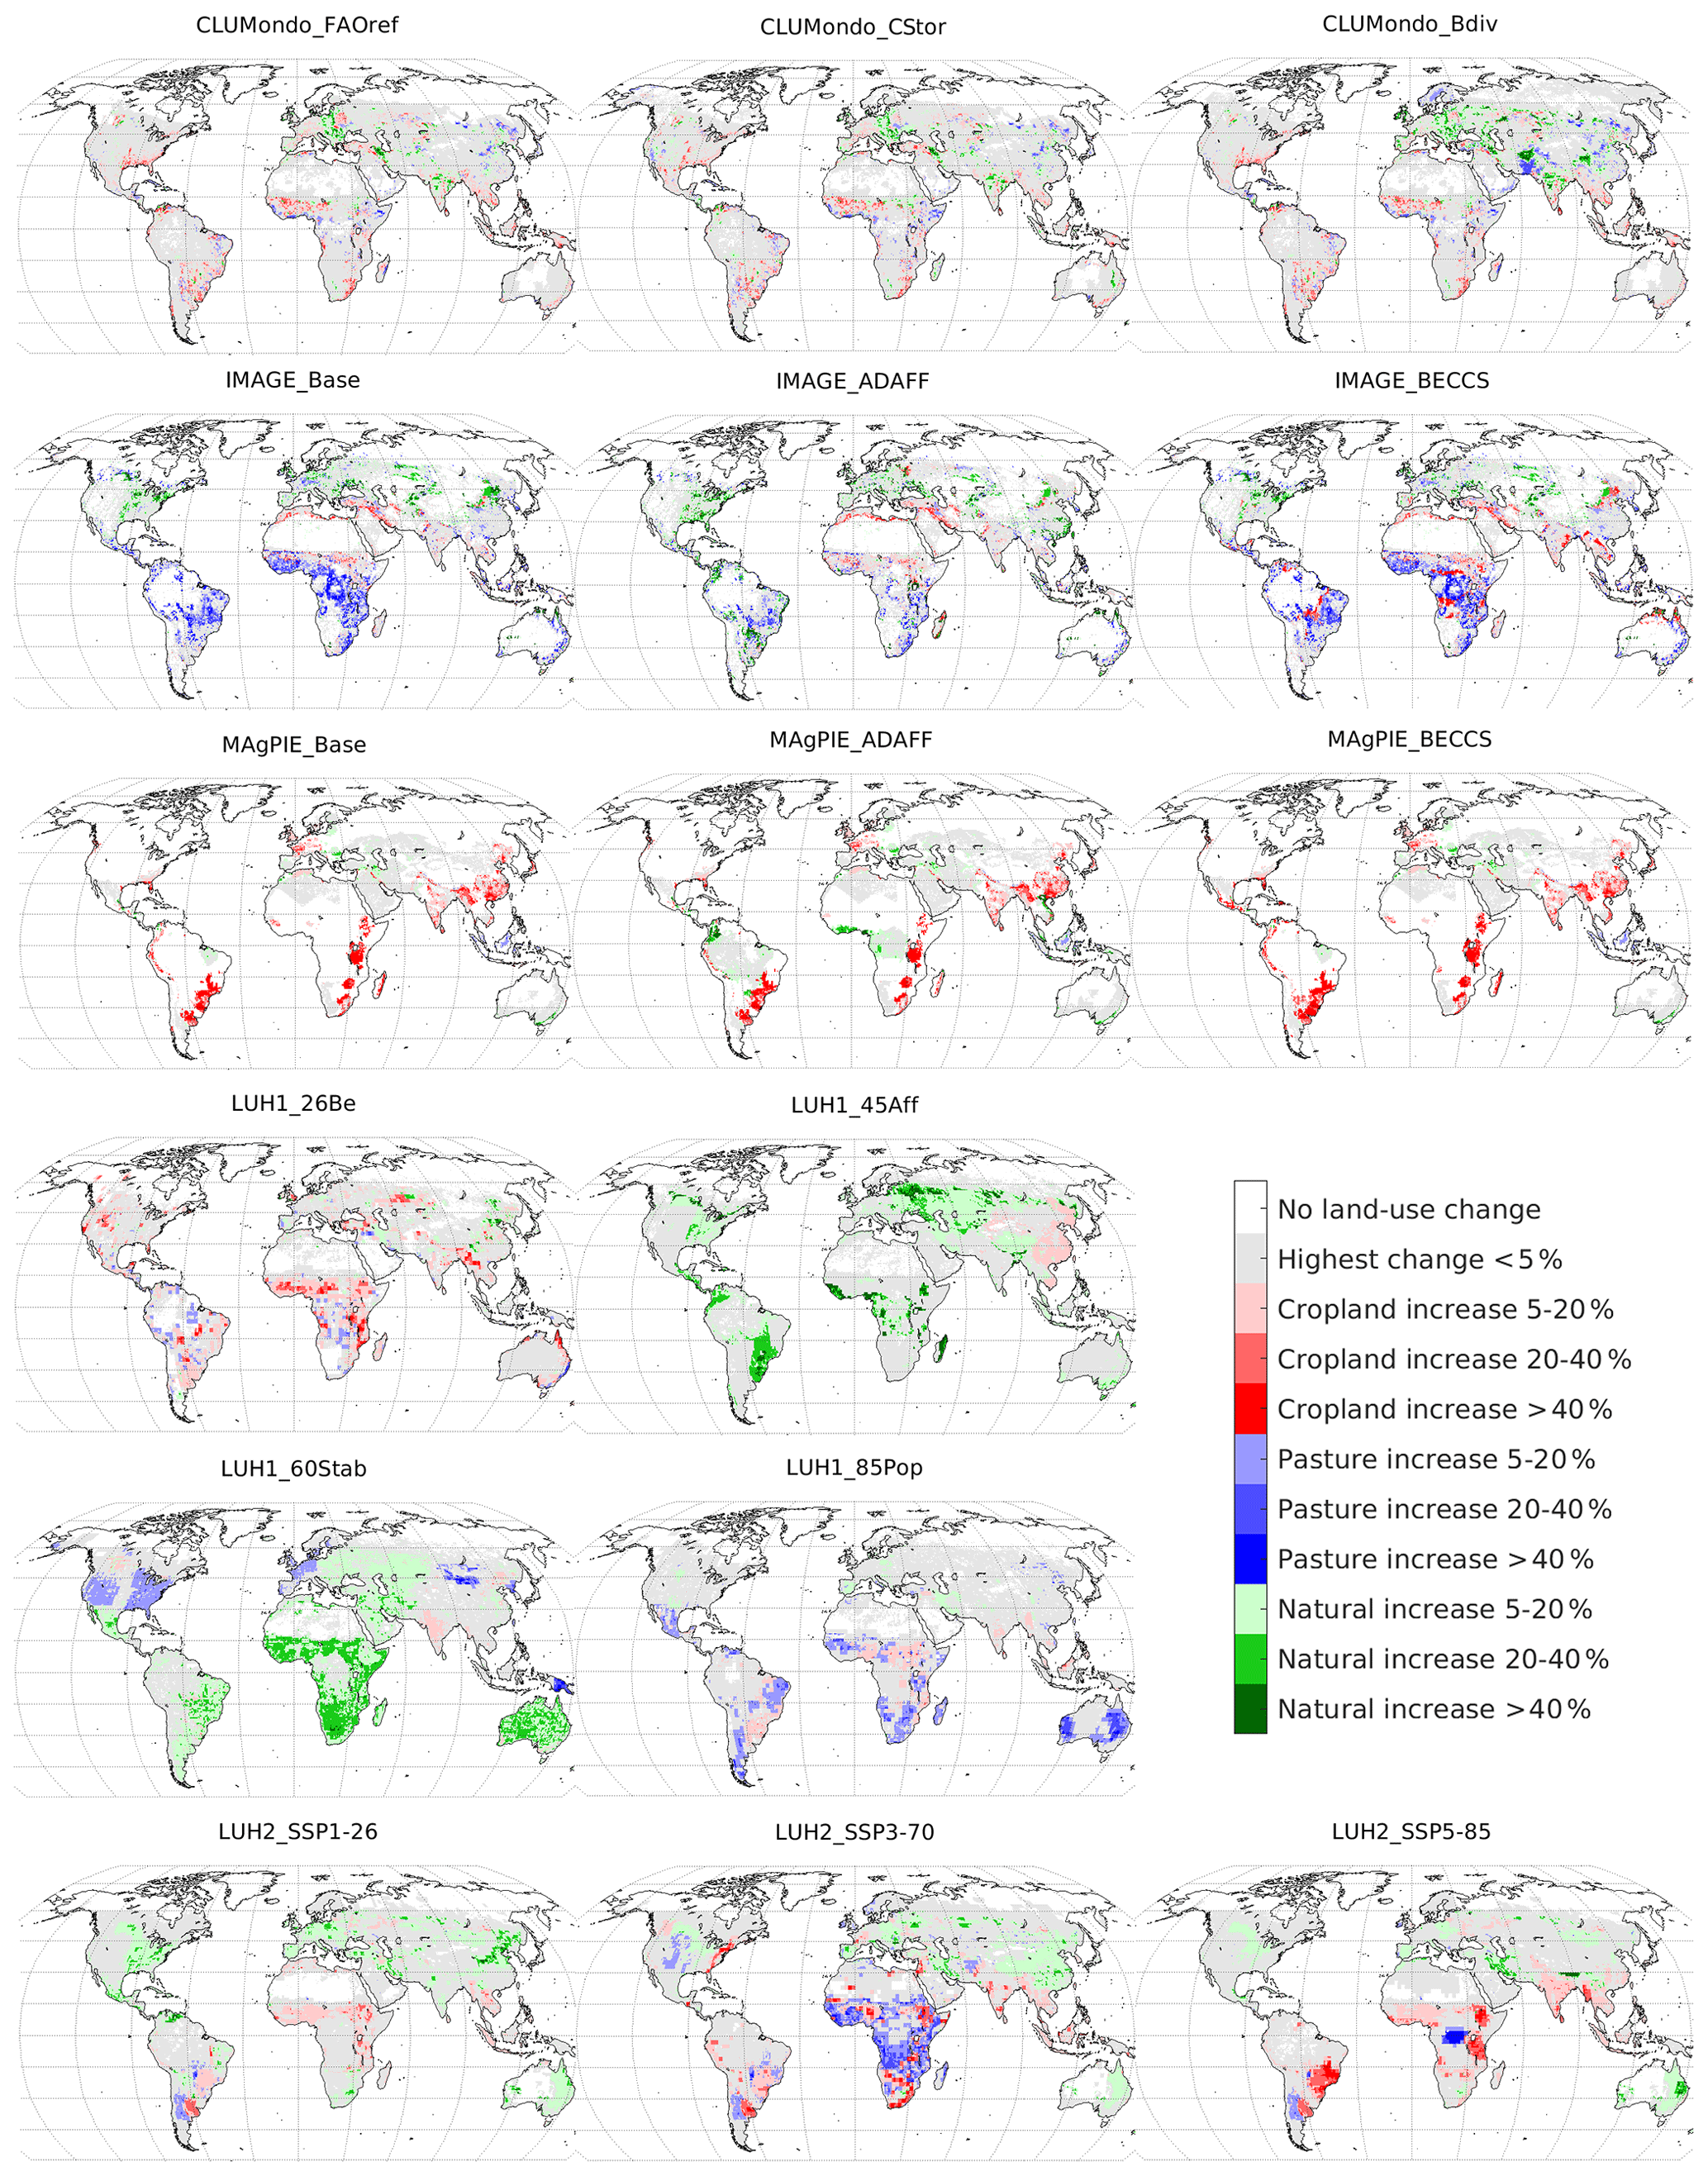
Figure 2Categories of dominant land-use change from 2000–2004 to 2036–2040 for each of 16 land-use scenarios. The legend is identical for all plots.
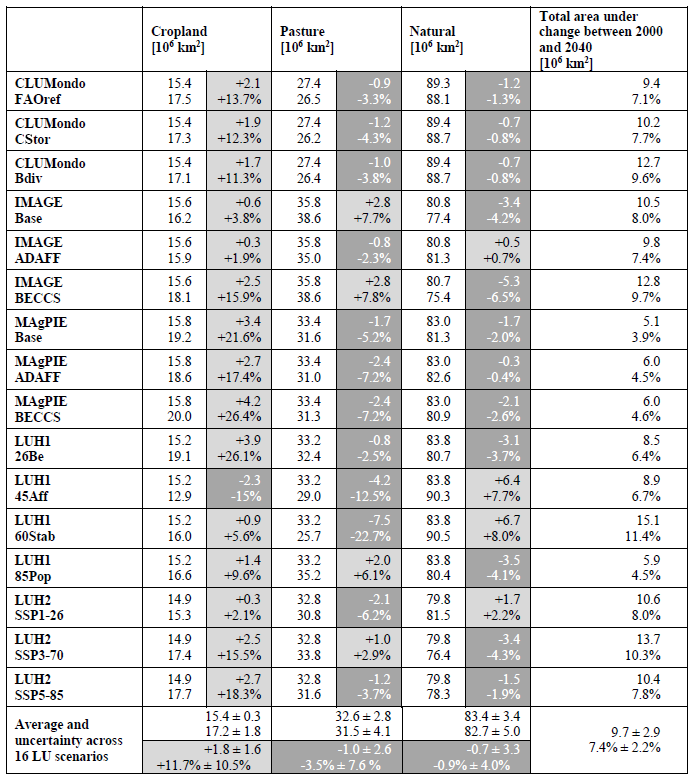
Table 2Total area of cropland, pasture and natural land as well as the change therein from 2000–2004 to 2036–2040 for 16 land-use scenarios. For each scenario, the left column gives the global total area for 2000–2004 (upper value) and 2036–2040 (lower value) and the right column gives the change from 2000–2004 to 2036–2040 in absolute terms (upper value) and as a percentage relative to the level in 2000–2004 (lower value). Gray shading indicates a positive or negative trend. Total area under change from 2000 to 2040 is given in absolute terms and as a percentage of the global ice-free land area considered in this study (see Sect. 2). Minor deviations in numbers may occur due to rounding.
3.1 Strategies of LUMs to translate demands into land-use changes
Figures 1 and 2 summarize LULC changes in the 16 projections. The scenarios projected total changes in LULC of about 4.5 % to 11.4 % of the global ice-free land surface from 2000 to 2040 (Table 2), corresponding to different transitions between crop, pasture and natural land. While different socioeconomic assumptions realized as land-use change projections by the same model led only to small variations in the outcomes in terms of absolute rates (see Fig. 1, Table 2) and spatial patterns of LULC changes (see Fig. 2), the variation in LULC change between models was much more important, including for similar socioeconomic scenarios. This highlights the importance of the differences in modeling strategies. In this regard, we realize that the outcomes as described are indicative of the models' behaviors for the particular scenarios considered in this study, which are not necessarily but very likely representative of the models' general behaviors upon projecting future LULC patterns. LUH1 and 2 are exceptions with regard to the changes in between scenarios, because individual scenario data originate from different LUMs; therefore, their data differ substantially between all scenarios.
In comparison to the other LUMs, CLUMondo shows rather small-scale LULC changes spread across large parts of the world (Fig. 2). The three scenarios have the same demands for livestock, crop production, and so on, and the additional objectives in terms of C uptake and storage or biodiversity conservation did not introduce large variations. Therefore, differences between the CLUMondo scenarios are small (see Table 2). The biodiversity scenario leads to the most land area changes due to land system classes that diverge to either system intensification in some regions or extensification in others. Demands are fulfilled by almost linear trends until 2040 based on the assumed scenario storyline and demand estimates (Fig. 1).
Land-use changes in the three IMAGE scenarios also affect most of the productive land areas globally. Compared with CLUMondo, spatial patterns are different and the spread of percentage area changes across scenarios is higher (globally 5 %–10 % difference per LULC class for IMAGE scenarios; Table 2). Global trends are not linear; some scenarios even reverse their historic trend (e.g., IMAGE_ADAFF scenario for pasture) or accelerate it (e.g., IMAGE_BECCS scenario for cropland), possibly driven by the introduction of new land-use policies. In IMAGE, food production meeting the underlying societal demand has large priority. The IMAGE_Base scenario accordingly increases pasture area at the cost of natural land (presumably to satisfy demand for animal products in the underlying “SSP2” world) while cropland increases only slightly, presumably because yield increases satisfy the increasing food demand of a growing population. The afforestation and reforestation scenario IMAGE_ADAFF partially reverses IMAGE_Base by expanding natural land at the cost of pasture land, whereas IMAGE_BECCS, in addition to pasture expansion as in IMAGE_Base, also expands cropland areas at the cost of natural land. Spatially, the distribution of land-use classes among all scenarios differs little, indicating that demands from the IMAGE_Base scenario (e.g., population growth, diets, food demand, trade) outweigh specific scenario demands.
In MAgPIE, land changes only occur in specific regions or countries, although the changes in these regions are massive (southeastern Argentina and southern Brazil, some countries in eastern Africa, and parts of southern and eastern Asia), with the dominant change by far being cropland expansion. The three MAgPIE scenarios differ relatively little in time and space: only the afforestation and reforestation scenario again shows some very local natural area expansion. Trends over time are linear. Decisions regarding where land-use change takes place to meet food and feed demand strongly depend on minimizing the costs of land conversion. Here, some countries seem to provide substantially cheaper commodity prices than others, explaining the radical changes seen in the regions as listed above (compare also Fig. 2). It is noteworthy that MAgPIE and IMAGE derive potential crop yields and ecosystem C densities from the same DGVM (LPJmL, Bondeau et al., 2007), even though internal yield scaling and forest growth curves are implemented differently. However, their spatial patterns are quite different, emphasizing the role of individual strategies to translate demands under similar biophysical constraints into LULC patterns. Furthermore, the land demand to meet the same carbon dioxide removal (CDR) target was found to be larger in IMAGE than in MAgPIE (Krause et al., 2018).
In contrast, land changes in all LUH1 scenarios are large and occur in most of the productive land areas globally, reflecting both the highly diverging socioeconomic storylines as well as their implementation by different IAMs (see Table 2). Trends over time are nonlinear but involve multiple break points or gradual slopes. Interestingly, LUH1_26Be, which was developed by the IMAGE model (Hurtt et al., 2011), focuses on a broad expansion of croplands in tropical regions, whereas IMAGE_BECCS (although most likely implementing a different degree of bioenergy growth) includes a massive relocation of pastures and croplands to tropical and subtropical areas, respectively (Fig. 2). LUH1_45Aff and even more so LUH1_60Stab focus on the massive expansion of natural areas in all global regions where forests can be sustained, whereas LUH1_85Pop expands pastures and secondarily croplands in tropical and subtropical areas. The attribution of specific spatial LULC patterns to model allocation strategies vs. scenario storylines is impossible for LUH1, and in the same way also for LUH2, because underlying IAMs and storylines differ between each scenario.
LUH2 scenarios also differ substantially, corresponding to the very different SSP storylines and RCPs combined with their origin from different IAMs. LUH2's SSP1-26 (also implemented by IMAGE but with different socioeconomic assumptions than IMAGE_BECCS and LUH1_26Be), which includes options for both bioenergy crops and forest regrowth, shows expansion of natural areas mostly in temperate (and some boreal) regions of the northern latitudes and also in Australia, some cropland expansion and a reduction in pastures (Figs. 1 and 2). LUH2_SSP3-70, in contrast, results in a massive cropland expansion in some regions, in combination with a relocation of pastures, while LUH2_SSP5-85 (implemented by REMIND/MAgPIE) shows very large and concentrated regional dynamics, with cropland expansion similar to the MAgPIE scenarios as presented above.
In summary, most scenarios only agreed on a trend for cropland expansion at the cost of natural or pasture areas in terms of total area (see also Fig. 1). Moreover, the scenarios showed very diverse patterns with respect to where and how these changes were realized. Thus, the deviation in LULC changes from 2000–2004 to 2036–2040 across the scenarios (Fig. S1 in the Supplement) showed major disagreement for cropland, pasture and natural areas. Standard deviations of changes in land area > 20 % across all scenarios were found for all three LULC classes over wide world regions, especially in southeastern South America, the entire sub-Saharan and eastern African region, and some regions in Europe and southern Asia. This partially agreed with features that were identified in earlier studies evaluating a set of multiple model LULC projections, such as in terms of global and regional trends (Schmitz et al., 2014) and the location of hotspots of uncertainty in LULC projections (Prestele et al., 2016). Given the diversity in socioeconomic storylines and LUMs, these findings are not surprising, but they highlight (1) the need to critically reflect on which of the observed LULC change patterns might be considered more or less realistic given historical regional developments in combination with environmental, economic and political constraints such as water availability, yield gaps and governance issues (see Sect. 4.1), and (2) the need to explore the existing uncertainty in terms of future LULC regarding the implications for ES indicators beyond yields (see Sect. 4.2).
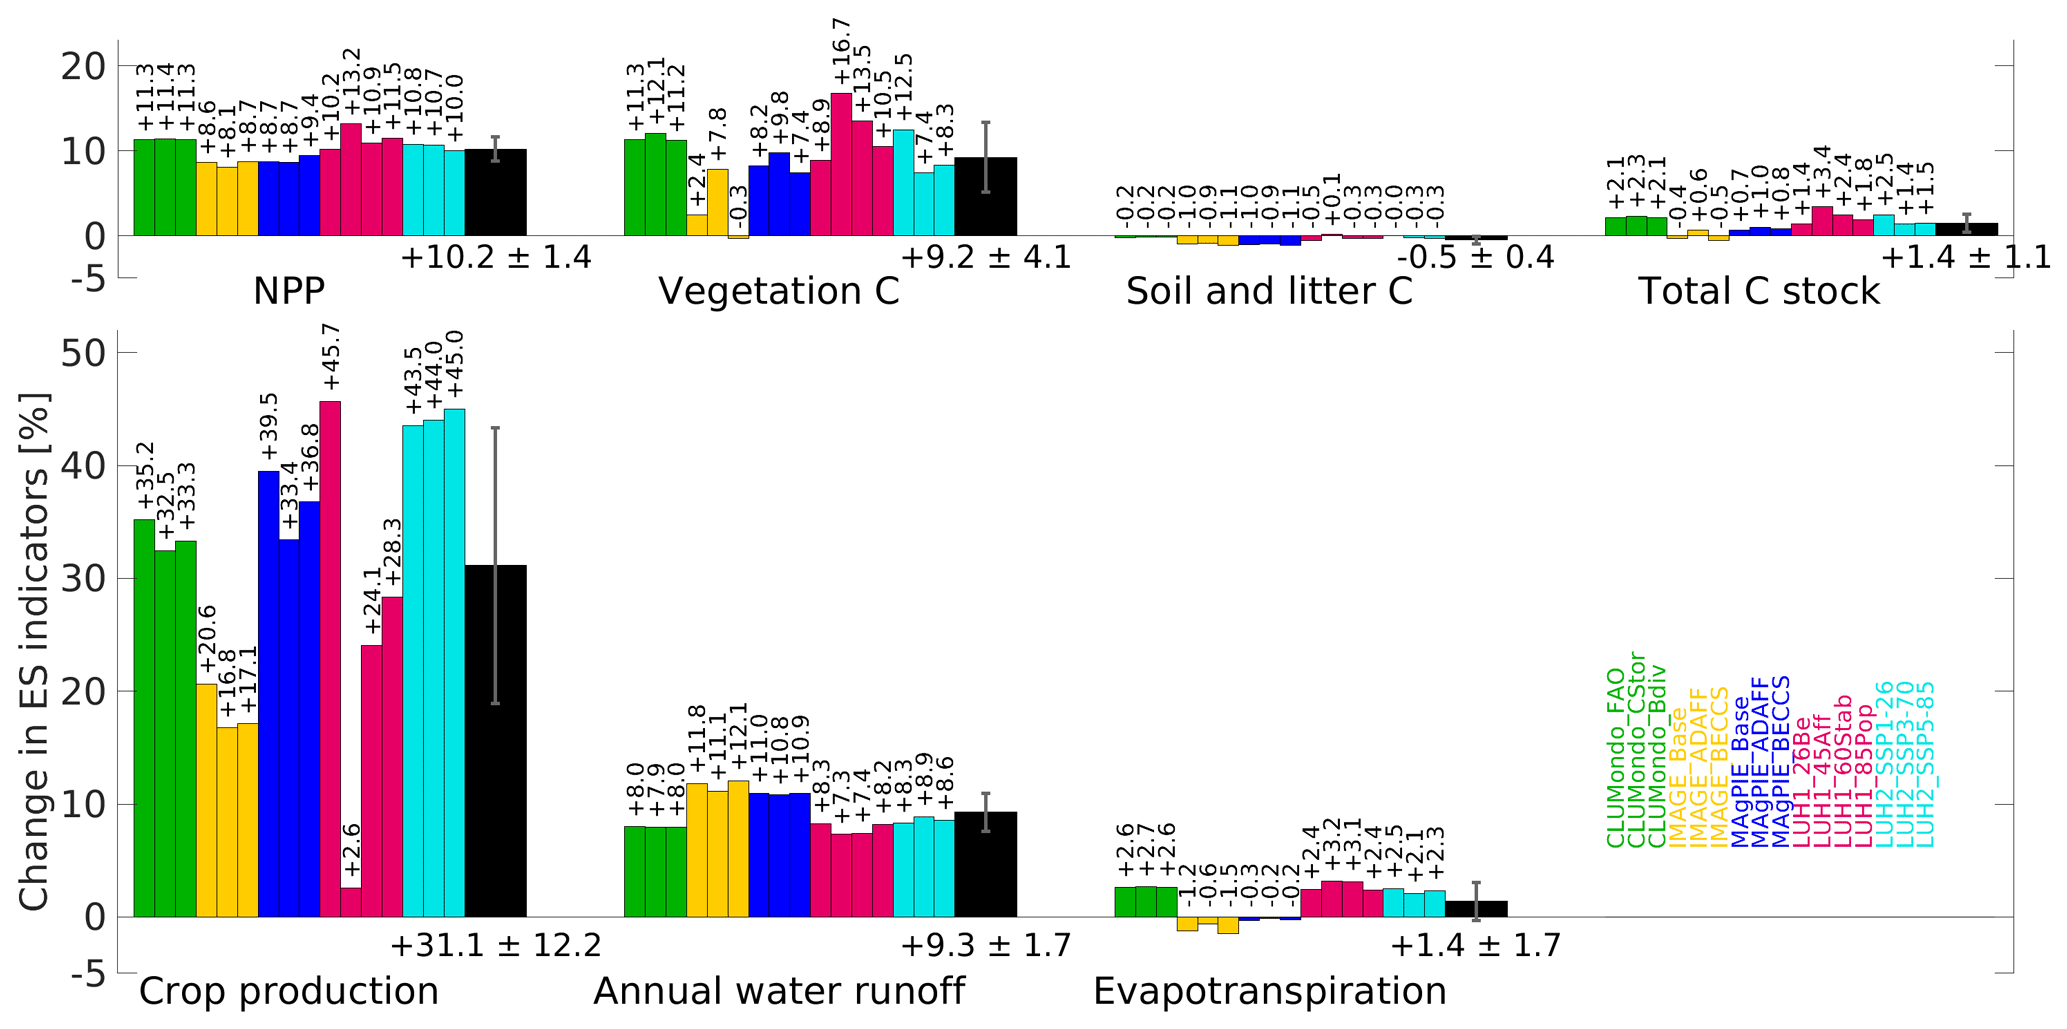
Figure 3Change and uncertainty in ES indicators from 2000–2004 to 2036–2040 as a percentage relative to the base level in 2000–2004 across 16 land-use scenarios. Black bars give the average and standard deviation of the relative changes across all scenarios. See Table S3 for absolute levels and changes for each scenario.
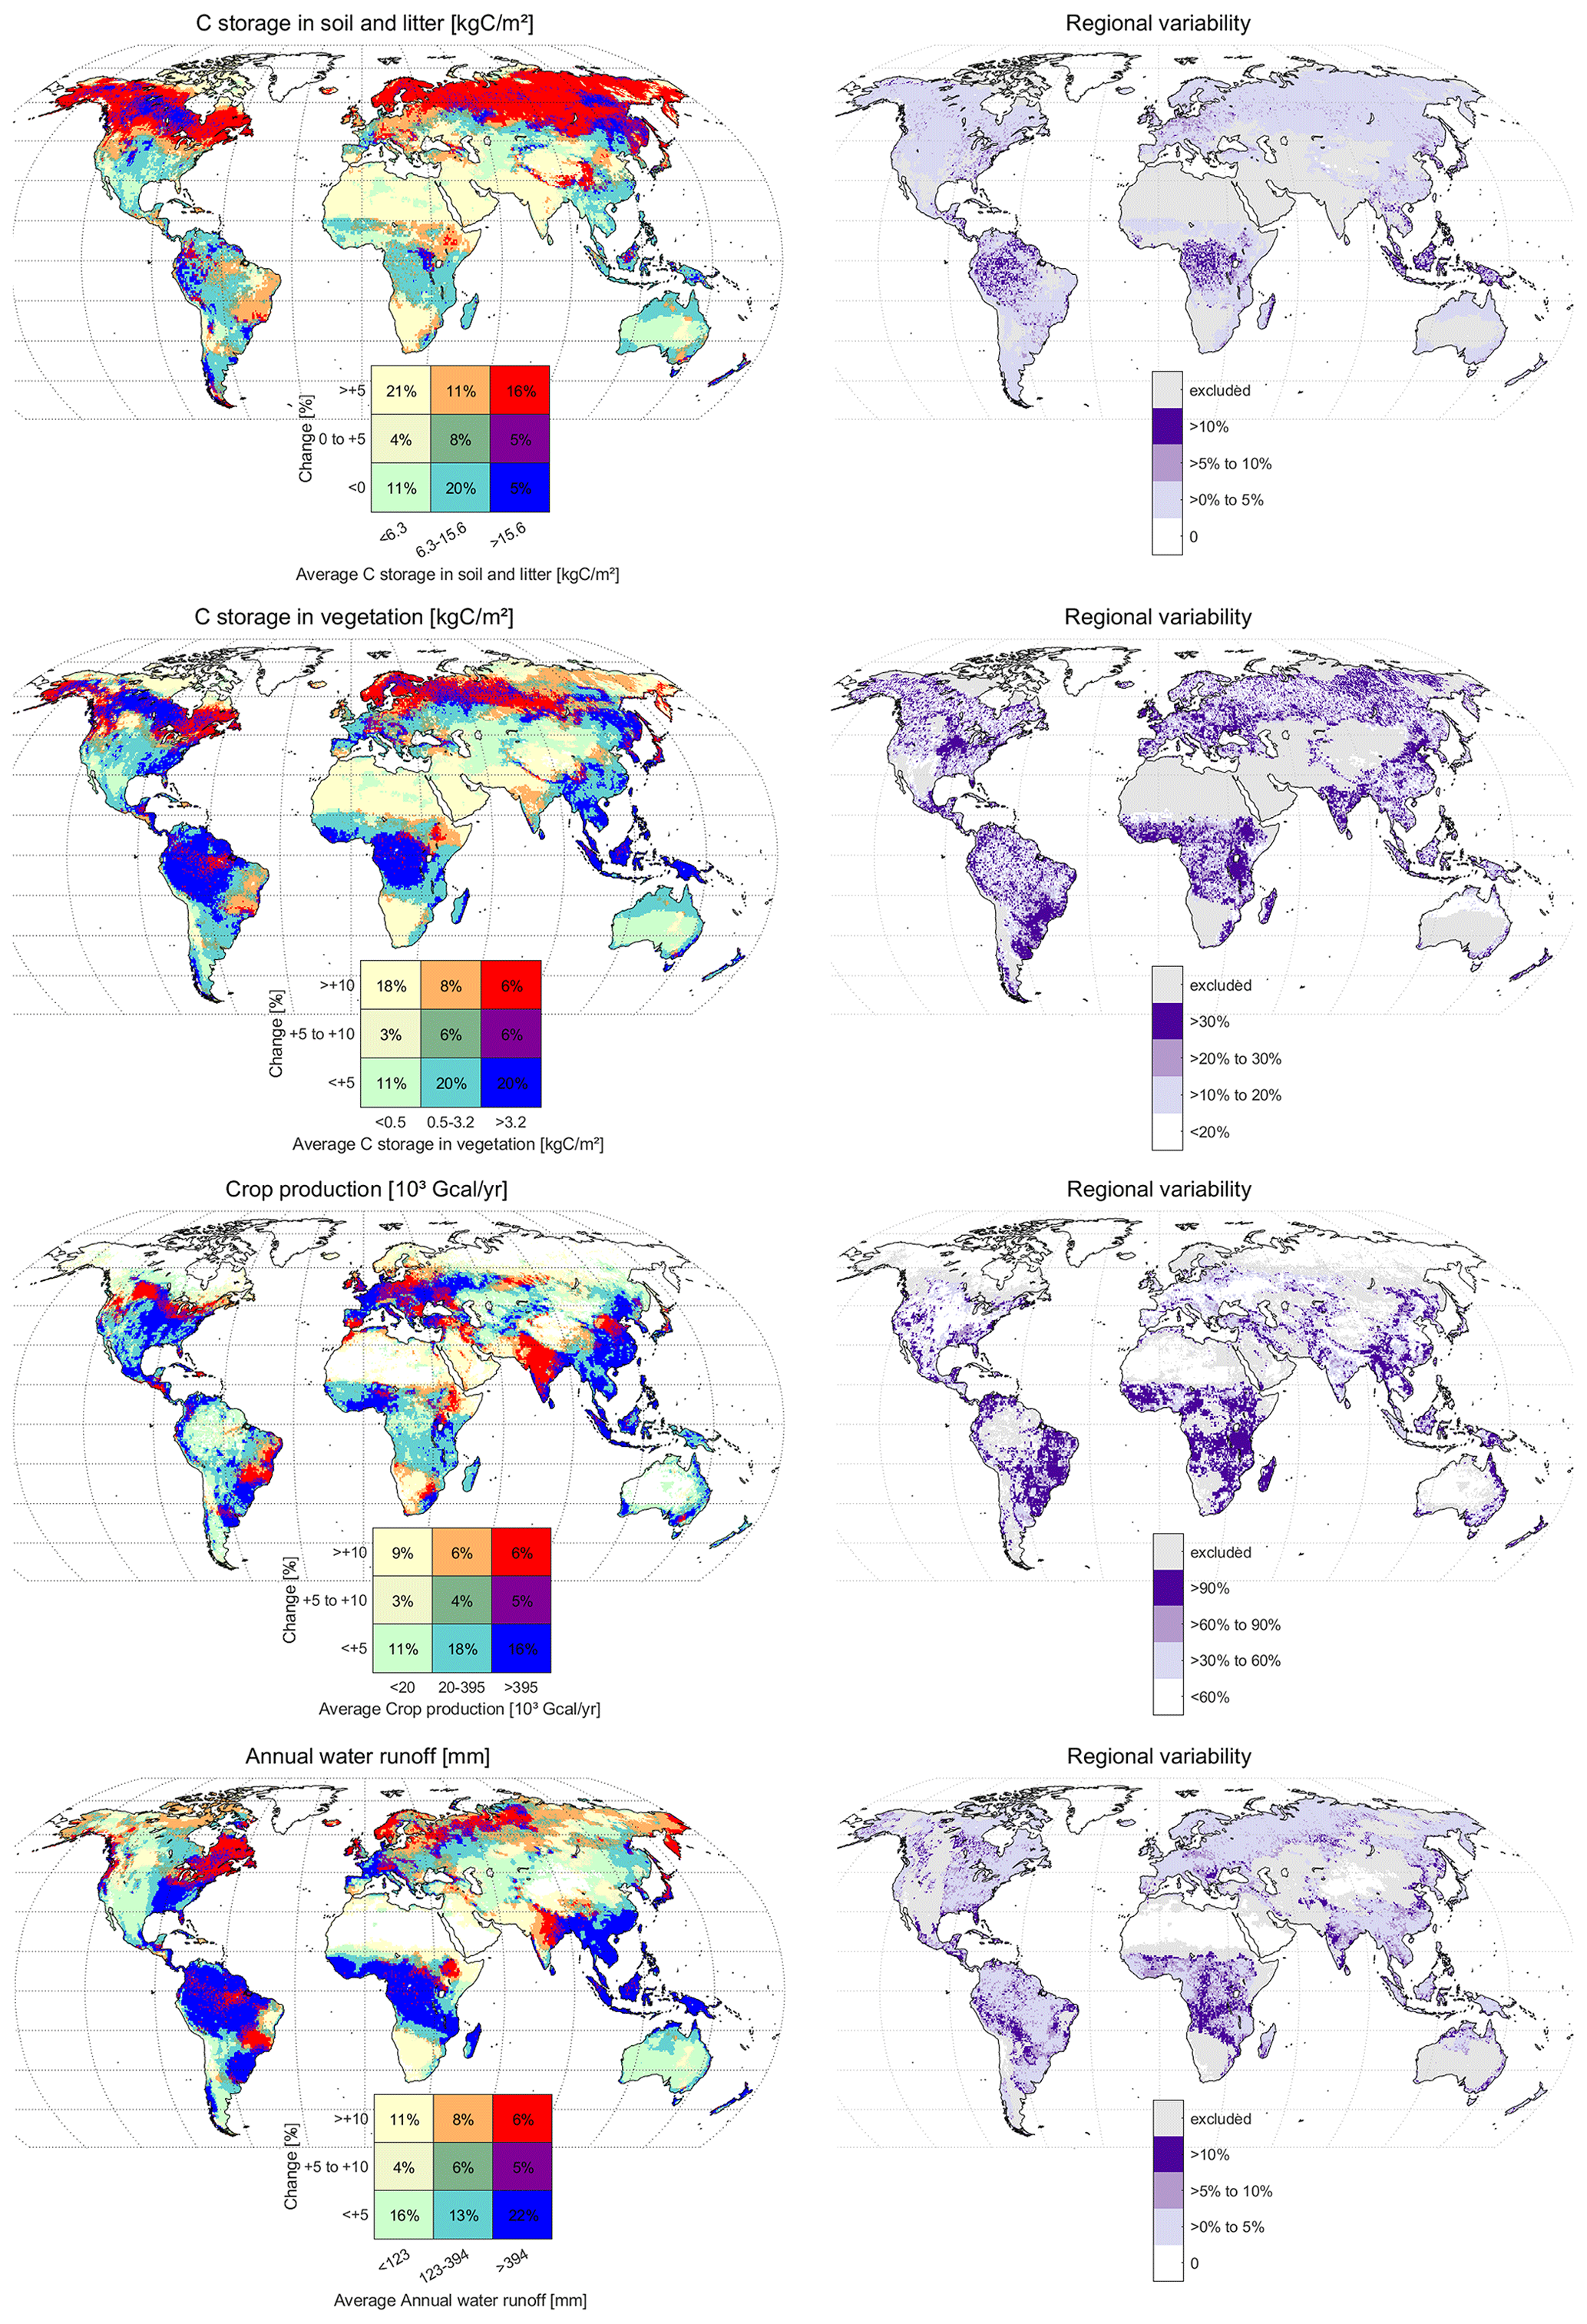
Figure 4The left column shows the categories of the average level of the provision of selected ES indicators in 2000–2004 and the relative change until 2036–2040 averaged over 16 land-use scenarios. Thresholds for categories for the average ES indicator level follow the 33rd and 67th percentiles for each ES indicator, whereas the change in indicators is given in 5 % steps for all indicators to allow for comparability. Note that for soil and litter C, the lowest category is negative. At high levels of ES indicator provision (highest 33 % of values), blue cells mark regions where little change is expected on average until 2040, and red cells mark regions where high changes are expected until 2040. The yellow category marks regions where base levels in ES provision are low; therefore, relative changes in these regions can be very high but are of minor importance. The percentage of global land area in each category is indicated. Cells where the average indicator level in 2000–2004 is zero are colored white and excluded from the statistical analysis. The right column gives the variability of the percent change in each ES indicator for each cell, which was calculated as the standard deviation of the changes in the ES indicator from 2000–2004 to 2036–2040 that was derived for each of the 16 land-use scenarios individually. Regions where the base level in 2000–2004 was below the 33rd percentile (yellow to green cells in the left column) were excluded from regional variability maps and colored gray in order to focus on cells with relevant ES indicator provision. Note that the legend scaling is different for vegetation C and crop yield production. Purple regions indicate a standard deviation in the predicted relative changes in this indicator higher than 10 % of the indicator level in 2000–2004 (30 % for vegetation C and 90 % for crop yield production). See Fig. S2 for NPP, total C storage and evapotranspiration.
3.2 ES indicators for alternative LULC scenarios
The 16 land-use scenarios resulted in very diverse levels of ES indicators in 2000–2004 and changes therein until 2036–2040 simulated with LPJ-GUESS (see Fig. 3 and Table S3 in the Supplement for all results given in the following). Figure 4 shows the spatial distribution of categories in ES indicator levels and their changes until 2036–2040, averaged across the 16 scenarios. We decided to also investigate averages in order to explore some overall emerging trends in ES indicators that result from the combined effects of climate and land-use change on ecosystem functionality. The average maps are complemented by the regional variability in ES indicators (right column in Fig. 4, see also Sect. 4.2) as a measure of the large between-scenario variability in ES indicators. Where regional variability is low, differences in LULC across scenarios are small and ES indicator changes can solely be attributed to climatic changes and/or changing CO2 concentration along with the joint trend in LULC shown by all scenarios for this location.
The declining trend in natural areas (average decline of 0.9 % ± 4.0 % by 2036–2040 across 16 scenarios) as shown by most LUMs (Table 2) is balanced by the combined positive effect of increased atmospheric CO2 concentrations, N deposition and warmer climate (especially at higher latitudes), leading to an increased global vegetation productivity (+10.2 % ± 1.4 %) and higher total C stocks (+1.4 % ± 1.1 %) overall across the scenarios. Simulated changes agreed with respect to the trend but levels were below those reported in previous studies (compare LPJ-GUESS simulations including LULC changes for the IPSL-CM5A-LR climate of Brovkin et al., 2013; Pugh et al., 2018), noting that these studies applied different LULC data and used LPJ-GUESS without C–N limitation and with differing model setups. Regionally, increases in vegetation productivity and C stocks were pronounced in boreal and temperate forests. In the tropics, the positive effects of factors such as CO2 fertilization and improved water use efficiency (see, e.g., Wårlind et al., 2014) were partially offset by cropland and pasture expansion, together with the negative effects of a warmer and drier climate. Across the 16 scenarios, the increase in NPP and C storage was generally higher in CLUMondo, LUH1 and LUH2 than in the IMAGE and MAgPIE scenarios. Increases in vegetation and total C stocks were, as expected, large in scenarios that showed significant amounts of forest regrowth (especially LUH1_45Aff, LUH1_60Stab and LUH2_SSP1-26 but also IMAGE/MAgPIE_ADAFF) and low in scenarios with agricultural expansion for food (e.g., IMAGE_Base and LUH1_85Pop) or bioenergy production (IMAGE/MAgPIE_BECCS and LUH1_26Be). The overall changes in total C stocks reflected an increase in vegetation C (+9.2 % ± 4.1 %) that was balanced to some degree by a decrease in soil and litter C stocks (−0.5 % ± 0.4 %), likely driven by enhanced respiration of organic material under warmer temperatures (see, e.g., Pugh et al., 2015), in combination with the negative effects of decreasing natural areas on soil and litter C in most scenarios. The simulated increase in vegetation C was significantly lower and the decrease in soil and litter C was larger for all IMAGE and MAgPIE scenarios because the conversion of natural land to pastures (for IMAGE) and to croplands (for MAgPIE) in these scenarios was largest among the different scenarios analyzed in this work.
Crop production was simulated to increase on average across all 16 scenarios by 31.2 % ± 12.2 %; this was partly as a result of total cropland area increasing (+11.7 % ± 10.5 %, Tables 2 and S3) for all scenarios except for LUH1_45Aff and partly due to increasing yields. Yield increases resulted from the joint effects of increased N fertilization rates, warmer temperatures in some regions and increasing atmospheric CO2 (see Fig. S4 in Krause et al., 2017). Crop production increases were found in all world regions, especially southern and eastern Asia, central and southern Africa, southeastern South America, and cropping regions in North America and Europe. Differences in crop production between scenarios were due to different absolute area and the location of cropland expansion on the globe (and differences in N fertilization rates for IMAGE and MAgPIE scenarios, see Sect. 2). For LUH1_45Aff, the simulated global total increase in crop production was only 2.6 % because of the immense amount of natural area expansion in this scenario reducing total cropland area in contrast to the other 15 scenarios. Furthermore, LUH1_60Stab and all IMAGE scenarios showed lower increases in crop production than the other scenarios due to only small cropland expansion (for LUH1_60Stab) and newly established croplands being chiefly located in low- to medium-production areas (for the IMAGE scenarios, e.g., sub-Saharan and northern Africa and the Middle East). For all LUH2 scenarios, crop production increases were high – about 44 % relative to the level in 2000–2004. Lower crop production was simulated in IMAGE and MAgPIE climate change mitigation scenarios compared with their baseline scenarios and also in CLUMondo scenarios when additional land demands had to be met compared with their FAO reference scenario. This highlights the inherent trade-off created through multiple demands. It has to be noted that IMAGE (and therefore also CLUMondo because its demands are created by IMAGE) and MAgPIE internally calculate further technology applications (e.g., improved management, enhanced fertilizer inputs, pest control and better crop varieties) to increase yields in mitigation scenarios up to the level of their baseline simulation. However, these are not fully captured by LPJ-GUESS (see Sect. 2).
Annual water runoff was simulated to increase on average by 9.3 % ± 1.7 % until 2036–2040 (ranges and average trend are similar to estimates from Elliott et al., 2014, based on 10 global hydrological models). The increase resulted from the combined effect of increasing global total precipitation (+5.1 % from 2000–2004 to 2036–2040 in the IPSL-CM5A-LR model), the increased water use efficiency under elevated CO2 levels (see, e.g., De Kauwe et al., 2013; Qiao et al., 2010) and changes in the water use of agricultural vs. forested areas that were shown in many studies (such as reduced evapotranspiration of croplands in comparison to forests, see, e.g., Farley et al., 2005; Sterling et al., 2013). Moreover, changes in irrigation patterns affect water runoff (IMAGE and MAgPIE simulations only, see Sect. 2). All of these effects are captured by LPJ-GUESS (e.g., Krause et al., 2017; Rabin et al., 2020). Increases in runoff were simulated in the temperate zone and higher northern latitudes and in smaller regions in the tropical and subtropical zone. In water-limited regions such as the subtropics, some of this water could, in principle, be available for irrigation, depending greatly on the regional annual runoff dynamics. However, it will also increase erosion of soil and nutrients (e.g., Salvati et al., 2014) and the risk for floods in some regions (see, e.g., Rabin et al., 2020), likely also intensifying regional dependencies on water availability and usage that are discussed elsewhere (see, e.g., Elliott et al., 2014; Fitton et al., 2019). Differences in runoff levels in 2000–2004 and changes until 2036–2040 were small between the 16 scenarios because the forcing climate dominates the calculated water balance, rather than LULC changes. Only for the three LUH2 scenarios, about 5 % lower absolute levels compared with the other scenarios were simulated in 2000–2004, and relative increases in runoff were about 3 % larger for IMAGE and MAgPIE scenarios than the other scenarios.
Changes in evapotranspiration are closely linked to the calculations of runoff, although their effects are opposed, with higher evapotranspiration rates contributing to reduced surface runoff (e.g., Piao et al., 2007) but also to biophysical cooling (e.g., Anderson et al., 2011) Evapotranspiration rates increased in the CLUMondo, LUH1 and LUH2 scenarios on average by 2.6 % ± 0.3 % and decreased in the IMAGE and MAgPIE scenarios on average by −0.7 % ± 0.5 %. Increases in evapotranspiration rates in nontropical regions likely reflect the expansion of forests (see, e.g., Sterling et al., 2013) and, therefore, were highest in the scenarios assuming intensive expansion of natural areas (LUH1_45Aff and LUH1_60Stab). This trend was balanced in the three IMAGE scenarios by the effects of large-area conversion of forests to pastures in tropical South America and Africa, leading to a total reduction in evapotranspiration rates. BECCS activities seem to reinforce the reduction in evapotranspiration rates, whereas the extension of natural areas counteracts it to about 50 %. In the MAgPIE scenarios, a strong increase in cropland area in southeastern South America and eastern Africa corresponded to a small overall decrease in evapotranspiration.
4.1 Projected global LULC patterns in a historical context
4.1.1 Global change rates
The 16 scenarios project total changes in LULC of between 4.5 % and 11.4 % of the global ice-free land surface from 2000 to 2040. These rates are of a magnitude comparable to those observed for the past. For instance, four historical LULC reconstructions for the 1960–2000 period estimated changes in LULC of 7.5 %–12.8 % (Hurtt et al., 2011; Klein Goldewijk, 2016; Klein Goldewijk et al., 2011; Ramankutty et al., 2008, see Table S4 in the Supplement). A more recent global historical LULC change reconstruction by Winkler et al. (2021) estimated net LULC changes of 13.8 % for 1960–2015. This reconstruction uses a data-driven approach that is strongly based on remotely sensed information and provides higher spatial, temporal and thematic resolution than previous reconstructions. For a shorter time period, Liu et al. (2018) identified 3.4 % net LULC changes for 1992–2015 based on the ESA CCI Land-cover product. The picture becomes more complex when gross transitions, rather than net transitions, are considered, as gross changes (e.g., from forest to cropland in parts of a grid location and cropland to forest in another, over one time step) can be substantially larger than the net change. For instance, the change rates of Winkler et al. (2021) are 36.4 % when gross and multiple LULC changes are being considered individually. By contrast, LUM projections have a simplified representation of these more realistic LULC dynamics, omitting short-term, two-directional or small-scale transitions (such as under shifting cultivation, e.g., Heinimann et al., 2017). The improved representation of gross land-use changes in historical and future LULC reconstructions would be an important development to better account for LULC dynamics and their impacts on ecosystems (e.g., Bayer et al., 2017). However, such efforts are still hampered by a limited process understanding and data availability at the global scale.
4.1.2 Future regional change rates in a historical context
Even given different initial states in LULC and different socioeconomic pathways of the 16 scenarios, we critically assess the spatial patterns, directions and rates of regional change based on past LULC changes. While it is not completely impossible, of course, we argue that a speed and magnitude which extremely oppose trends observed in the past seem at least questionable. Scenarios projecting future demands under reference or business-as-usual assumptions (CLUMondo_FAOref and IMAGE/MAgPIE_Base) are expected to continue recent historic LULC trends at least during the first part of the simulation period. Nevertheless, economic growth assumptions, demographic considerations and limitations with respect to land availability in the scenarios will likely cause some divergence from historical LULC trends. Historic trends are indeed continued in some of the broader regional projected trends, such as the expansion of natural areas in mid to high northern latitudes (CLUMondo_FAOref and IMAGE_Base; see Fig. 2) or the expansion of croplands in subtropical areas (CLUMondo_FAOref and to some degree also IMAGE/MAgPIE_Base) (e.g., Hansen, 2013). In contrast, some projected LULC changes have no historic precedent, such as the extensive pasture increase in tropical Africa (IMAGE_Base), the large cropland expansion in some selected African countries (MAgPIE_Base), or cropland expansion in the Mediterranean and Middle East (IMAGE_Base).
Scenarios including more drastic changes in the socioeconomic system (e.g., all LUH1 and LUH2 scenarios), including specific conservation measures or large-scale land-based climate change mitigation efforts (e.g., CLUMondo_CStor/Bdiv and IMAGE/MAgPIE_ADAFF/BECCS), affect future LULC patterns in very different ways, compared with reference or business-as-usual scenarios. Whether or not simulated abrupt LULC changes or a rapid reversion of regional historic LULC trends are realistic is difficult to judge, as analogous historical evidence is scarce or absent. Indeed, some rapid land-use changes have occurred in the past, caused by unexpected disruptions in markets or governance structures such as Brazil's soy moratorium combined with the enforcement of related policies (e.g., Nepstad et al., 2014; Gibbs et al., 2015) or the collapse of the Soviet Union (e.g. Hostert et al., 2011). However, capturing such unexpected LULC changes in global LUM projections is nearly impossible. Still, in response to most policy interventions, work has suggested that transitions in land use across regions tend to occur rather smoothly and with time lags of years to few decades (i.e., spanning a notable part of our simulation period) due to delayed policy uptake (e.g., Brown et al., 2019). In this context, large-area and relatively rapid regional change rates could be assessed critically, such as (1) forest regrowth on pasture and cropland areas with more than a 40 % area change from 2000–2004 to 2036–2040 in southeastern South America (LUH1_45Aff) or entire subtropical Africa (LUH1_60Stab); (2) massive cropland increases exceeding a 40 % total area change, e.g., in southeastern South America and eastern Africa (MAgPIE_ADAFF/BECCS and LUH2_SSP5-85); and (3) pasture expansion exceeding 20 % of the total area in tropical and subtropical Africa (e.g., IMAGE_BECCS, LUH2_SSP3-70). The first example reverses current deforestation trends (compare, e.g., Curtis et al., 2018; Hansen et al., 2013), whereas in the latter two examples, simulated rates of change are substantially larger than observed in these regions in recent decades (e.g., Hansen et al., 2013; Klein Goldewijk, 2016; compare Fig. S3 in the Supplement). LULC scenarios assuming significant amounts of forest regrowth should also be seen in light of the recent evidence provided by Holl and Brancalion (2020), pointing out manifold problems attached to tree planting and, therefore, calling for the prioritization of natural forest protection.
4.1.3 Regional LULC allocations
In general, CLUMondo and IMAGE were more capable of capturing small-scale changes within heterogeneous regions. Given the complexity in which land changes are being observed (e.g., Curtis et al., 2018; Hansen et al., 2013), the capacity to simulate changes at the small scale is likely more realistic. For instance, for a case study in Brazil, Stepanov et al. (2020) found that a spatially explicit regionally LUM creating small-scale changes simulated observed LULC patterns much better than the larger-scale changes in an economic model. By contrast, regional patterns in other LUMs tended to be fairly broad in extent or were limited to regions that were small in area. This is not consistent with what can be learned from global multi-temporal remote sensing.
When assessing the plausibility of regional LULC allocations, a good indicator is the expansion of agricultural areas (e.g., Salmon et al., 2015) based on existing yield potential (i.e., fertile areas currently not used or with a low share of croplands) or based on existing yield gaps (i.e., because of poor management or limits posed by the socioeconomic environment). We find that the LUMs use the regions with existing yield capacities in different ways for their allocation of LULC types. Cropland areas with currently relatively large yield gaps, such as in Brazil's Cerrado and west or east Africa (e.g., Mueller et al., 2012), were used by CLUMondo for further cropland expansion, which also seems plausible considering past LULC trends and continuing economic growth in response to an increasing population in these regions. In IMAGE simulations (especially IMAGE_Base/BECCS), these regions were typically converted into pastures and croplands were instead expanded in northern Africa and western Asia (especially Syria and Iraq). Besides current political turmoil in north Africa and west Asia, these allocations seem less plausible considering rather unfertile soils and existing yield gaps that are predominantly linked to low fertilizer inputs and water scarcity (e.g., Pala et al., 2011). In addition, the expansion of cropland area in IMAGE in northern Africa (especially Libya and Egypt; see Fig. 2) notably exceeds the current cropland extent (e.g., Fritz et al., 2015). It seems doubtful that this can indeed be achieved given that existing yield potential in these regions is low due to biophysical limitations during the crop-growing season which is not projected to change in the future. Other examples where LUMs diverge notably include central India, where all IMAGE scenarios used areas with large yield gaps as indicated by Mueller et al. (2012) for cropland expansion. In contrast, all CLUMondo scenarios used these croplands for forest regrowth, thereby ignoring their potential to contribute to fulfill increasing food demand. The massive (but very regional) cropland expansion of all MAgPIE scenarios and LUH2_SSP5-85 includes regions in eastern Africa, where yield gaps are high, but also regions in southeastern South America that are already under cropland usage to a high degree and attained yields are high (e.g., Fritz et al., 2015; Mueller et al., 2012). This suggests that in the MAgPIE model, economic considerations dominate the allocation of LULC classes rather than existing biophysical capacities. Only a few scenarios (e.g., LUH1_26Be, LUH2_SSP1-26 and LUH2_SSP5-85) expand cropland area in continental eastern Europe, especially along the “Chernozem Belt” into Russia, where soils are fertile and closing yield gaps would be expected to lead to large returns in terms of enhanced productivity (see Mueller et al., 2012). Other scenarios saw no potential for cropland expansion in these regions and simulated forest regrowth.
It has to be noted that in regions where attained yields are already currently relatively close to potential yields (e.g., northeastern North America, western Europe, and some parts of southern and southeastern Asia; see Mueller et al., 2012), yields may decline in the future due to climate change (e.g., Elliott et al., 2014; Funk and Brown, 2009; Lobell et al., 2009; Moore and Lobell, 2015; Pugh et al., 2016), and unless this can be counteracted by different management (e.g., increased irrigation) or different crop varieties, production may need to shift to other regions. However, the degree of climate change over our simulation period is too small to discern negative impacts on yields as well as associated climate-driven crop area changes.
Aside from biophysical considerations, LULC changes in response to changing economic conditions as projected in the scenarios require support from adequate regional policy, production and trading systems as well as appropriate technological capabilities (e.g., Lambin et al., 2003; Meyfroidt et al., 2019). Weak governance structures, for instance, would allow highly market-driven LULC changes, especially arising from changing demand elsewhere. LUM projections involving large-scale separation of LULC types across global regions (i.e., large regions of just one LULC class, e.g., IMAGE_Base/BECCS, all MAgPIE scenarios and LUH1_60Stab, LUH2_SSP5-85) could be interpreted to be detrimental to regional to national food production systems. This would include, for instance, subsistence farming systems over wide parts of Africa, which are an essential pillar of Africa's food supply and will continue to be so in the future (e.g., Sulser et al., 2015). In addition, technological capacities would have to be in place to support crop production at the projected locations, possibly including factors such as irrigation, the use of appropriate machinery and fertilization (see, e.g., Barrett and Toman, 2010; Lambin et al., 2014; Nilsson and Persson, 2012; Wang et al., 2016). At present, no global LUM is set up to consider governance aspects, such as land tenure rights or location-specific management, or transportation and trade capacities (apart from assumptions made in the economic core of LUMs that apply to large regions), which emphasizes an important need for further development.
To better understand regional LULC allocations and the related impacts on ecosystems and ES indicators, the availability of more spatial information from LUMs related to regional-scale assumptions on technological progress, flows of food import, export and local production would be useful. In this context it seems worthwhile for the land-use community to evaluate simulated future land-use changes against historic trends in spatial, temporal and thematic aspects. This may avoid some of the questionable, possibly unrealistic, land-use change effects seen in this study. However, current data products of historic land-use change are often themselves associated with high uncertainty in historic trends, due to data limitations. Improved historical products that merge multiple data sources could support the evaluation of future projected LULC changes. In addition, a clear declaration of scenarios showing potentially possible regional or global LULC pathways in comparison to those showing LULC changes going beyond historical exemplars would be desirable.
4.1.4 Impacts on ecosystems and ES indicators
It is well known that different climate trajectories (e.g., for different RCPs) will greatly affect ecosystems. Even climate change projections for a single RCP when realized with different Earth system models will result in large variability in computed ecosystem outcomes (e.g., Ahlström et al., 2012). The fact that similarly large variability can be introduced by land-use change (within or between, for example, an SSP) is less established and, as such, an important outcome of this study.
The LULC patterns observed in the 16 scenarios suggested a general prioritization of food and feed demand affecting croplands and pastures (e.g., production of crops, meat) over those related to natural land dynamics (e.g., C storage, biodiversity). This is not surprising given that aspects that could impact “non-food” demands, such as C prices, are not considered in many of the scenarios' underlying storylines. In LUMs where both a baseline scenario and scenarios with additional demands were simulated (CLUMondo, IMAGE and MAgPIE), the overall trends in LULC and ES indicator changes were chiefly determined by the demands of the baseline scenarios and their model-specific implementation. Specific additional demands, such as for land-based mitigation or conservation, mostly resulted in only small deviations of LULC patterns and ES changes from the baseline scenarios. Deviations between scenarios of different models were much larger.
Scenarios that included specific climate change mitigation targets (CLUMondo_CStor, IMAGE_ADAFF/BECCS and MAgPIE_ADAFF/BECCS) resulted in larger total C storage in LPJ-GUESS but lower crop production compared with the baseline scenarios. In LUMs, the mitigation scenarios include technology-driven yield increases, which are higher than those assumed in LPJ-GUESS (see Sect. 2). From a C storage perspective, concern about the C storage potential calculated by LUMs was raised by Krause et al. (2018), who could not reproduce the cumulative C uptake that was calculated in IMAGE and MAgPIE BECCS and ADAFF when applying their LULC change to ecosystem models. On average only 62 % of C uptake was achieved with LPJ-GUESS, and only about 55 % was achieved when three other DGVMs were used in addition. Likewise, Harper et al. (2018) also found the IMAGE C storage potential from BECCS to be achieved by less than 25 % when two IMAGE mitigation scenarios were simulated with the JULES DGVM. These discrepancies likely arise from different assumptions in LUMs and DGVMs related to growth rates and C uptake of regrowing forests and bioenergy crops, changes in soil C stocks upon LULC change, legacy effects of previous land-use changes and some further processes such as disturbances (e.g., forest fires). By contrast, when using the CLUMondo LULC patterns, all three scenarios led to an increase in total C storage in LPJ-GUESS, thereby even exceeding the no-net carbon loss target that was implemented in CLUMondo_CStor. This might be explained by the joint effects of N deposition, CO2 fertilization and climatic change that are core components of the LPJ-GUESS model but which were not implemented in similar detail in the CLUMondo calculations.
A number of studies have begun to identify in more detail how different assumptions in LUMs might affect LULC projections. Stehfest et al. (2019) recently provided a comprehensive sensitivity analysis of the socioeconomic drivers that were projected across five SSP-based storylines by six agro-economic models/IAMs and found very diverging sensitivities across models. The study highlights the existing variability in LULC modeling and emphasizes the need for more empirical research on crucial factors in the LULC modeling process such as long-term drivers of LULC change or the representation of land-use regulation and trade. The spread between LULC projections of different models could also be reduced by joint calibration and validation standards, but these do not currently exist (e.g., van Vliet et al., 2016). Reducing the spread between models, especially for similar scenario assumptions, would provide an important step forward in understanding LUMs' LULC patterns and in identifying possibly implausible allocations and would also support the assessment of calculated impacts on ecosystem functioning and ES indicators. A comprehensive comparison of the socioeconomic drivers of LUMs with the ES indicator levels simulated with DGVMs based on the LULC patterns from LUMs would be needed. This would provide deeper insights into the dependencies between drivers, modeling strategies and resulting ES provisions and would contribute to identifying the quality of the representation of interactions between socioeconomic and environmental systems including relevant feedback mechanisms.
4.2 Variability in the future of global ES indicators
Despite some very diverging features, the 16 land-use scenarios, on the level of global totals (see Fig. 3, Tables 2 and S3), resulted in a positive change in NPP, vegetation C (all except one scenario), crop production and annual water runoff, and in a negative change in soil and litter C stocks (all except one scenario) from 2000–2004 to 2036–2040 when simulated with LPJ-GUESS. Diverging trends were predicted for evapotranspiration. Emerging trends are the result of joint climate change, increasing CO2 levels (even under RCP2.6), and current and past LULC changes in ecosystem functionality. We did not quantify relative impacts of these factors separately. A sensitivity test using climate inputs from five GCMs, instead of just one, along with the four diverse scenarios from the LUH1 product in our simulation setup showed additional uncertainties of between 0.1 % and 8.6 % for the ES indicators considered here (Table S6 in the Supplement). The lowest deviation due to different GCM implementations was found for crop production and the highest for vegetation C stocks.
Regionally, large variability in ES indicators (see right column in Figs. 4 and S2 in the Supplement) reflected the diverging LULC scenarios (effects from scenario storylines and model-specific implementation) and their interactions with climatic changes. Only in areas colored white does the absence of variability in changes in ES indicators indicate dominating climate change and CO2 impacts. Variability in the predicted changes in global totals in ES indicators exceeded a low level of 1 %–2 % for vegetation C stocks (± 4.1 %) and crop production (± 12.2 %) with regional variabilities (standard deviations of relative changes across scenarios) being high for these two indicators in nearly any productive region (Fig. 4). We discuss the observed regional variability in ES indicators on the level of biomes as large regions with similar ecological constraints (see Fig. S4 in the Supplement for biome classification).
Tropical forest regions, or at least major regions therein, were identified as hotspots of variability across the LULC projections with large areas showing variability of > 10 % change across the scenarios for all ES indicators considered in this study (see Figs. 4 and S2 and Table S7 in the Supplement for biome averages of ES indicators). On the one hand, this is a result of the high vegetation productivity, large biomass and a relatively higher CO2 fertilization, on the other hand it stems from very diverging trends in the LULC changes across the 16 scenarios, especially at the borders of the currently forested tropics (see also Prestele et al., 2016). For instance, losses of soil and litter C stocks are the net effect of higher decomposition rates as a consequence of a warmer climate in combination with higher inputs under CO2-driven increased productivity. These climatic effects are strongly reinforced by the conversion of forests to croplands (LUH1_26Be) and pastures (all IMAGE scenarios, LUH2_SSP3-70 and LUH2_SSP5-85 as well as the CLUMondo scenarios to some degree), leading to even lower soil and litter C stocks. At the same time, they would be attenuated through forest regrowth (LUH1_45Aff, LUH1_60Stab and MAgPIE_ADAFF), reducing regional carbon losses or even resulting in gains in soil and litter C stocks. As is well documented, future increased use and fragmentation of tropical forest ecosystems could be a major threat to conserving tropical ecosystems and biodiversity (e.g., DeFries et al., 2005; Lewis et al., 2015; Taubert et al., 2018), and the existing protected area network is insufficient to provide the necessary protection (Laurance et al., 2012). Developing joint biodiversity and carbon storage policies might lead to possible reinforcing synergies (e.g., Strassburg et al., 2019), although appropriate governance schemes to support such attempts would still be a crucial factor.
In tropical savannas and temperate shrubland and grassland regions, the diverging LULC projections resulted in high variabilities in vegetation productivity, vegetation C storage, annual water runoff and crop production. Although 15 out of 16 land-use scenarios increase cropland area in these regions, they diverged widely with respect to the exact location of cropland expansion, resulting in these high variabilities in ES indicators. Savannas have been highlighted before as particularly vulnerable to future conversions of natural vegetation into cropland or pasture (e.g., Shin et al., 2019) because of large population growth in many savanna regions, their climatic suitability for agriculture and the relatively small effort needed for conversion considering the relatively low woody vegetation cover. Parts of these regions have already experienced intense cropland expansion in recent decades, such as South America's Cerrado and Chaco or African savannas (e.g., Aleman et al., 2016; Hansen et al., 2013; Noojipady et al., 2017). Processes affecting ecosystem functionality and services in these subtropical to semiarid regions are also particularly important in view of rapid population growth and associated demands (Alexandratos and Bruinsma, 2012) as well as their role in the global C cycle and climate dynamics (e.g., dominant role for the trend and interannual variability of the global land C sink, see Ahlström et al., 2015, with their semiarid class widely corresponding to our tropical savannas and temperate shrublands and grasslands classes). Therefore, high variability in the provision of ES indicators related to vegetation productivity, water availability and food supply may have severe consequences on ecological, economic and social systems in these regions.
In both temperate and boreal forest regions, the regional variability of vegetation productivity and vegetation C storage was high because the increased photosynthetic productivity and longer growing seasons under warmer climates in higher latitudes were either dampened or amplified by diverging LULC projections. While LULC changes dominate this combined positive effect in temperate regions, they are much smaller in boreal regions and the climatic effect dominates (see Table S5 in the Supplement, compare also high variability of changes in NPP, vegetation and soil/litter C in boreal regions for multiple DGVMs, GCMs and emission pathways in Nishina et al., 2015, under fixed LULC). Counteracting these positive trends, studies highlight new challenges for temperate and boreal forests emerging from climatic changes and anthropogenic disturbance with the capacity for severe ecosystem-level damage, such as droughts, insects, fire regimes and pathogens (e.g., de Groot et al., 2012; Millar and Stephenson, 2015; Park et al., 2014). As only fire is explicitly simulated as a disturbance process in LPJ-GUESS, whereas other forms of disturbance are subsumed in a stochastic background disturbance, this could further increase the regional variability in ES indicators (see, e.g., Pugh et al., 2019). Regional variability was also high for crop production due to diverging extensification and intensification trends across temperate and boreal regions. Land-use changes and associated regional variability in ES indicators in the cold (tundra) and warm desert regions are not significant in a global context because of the climatically constrained low productivity, although these effects are enhanced at least in tundra regions through warmer temperatures.
A direct correlation of the per grid cell changes in ES indicators with the corresponding changes in cropland, pasture and natural land fraction could reveal the sensitivity of different ES indicators to changes in LULC. Across all scenarios and for the considered biomes, these relationships suggested, for instance, an approximate 1.5 % increase in vegetation C per percent increase in natural land fraction and between a 12 % and 24 % increase in crop production per percent increase in the cropland fraction (see Table S8 in the Supplement). Emergent responses of other ES indicators to changes in LULC fractions were mostly low (slope of regression lines close to 0) across the biomes (see Table S8). None of the identified relationships provided high reliability (highest R2 was 0.32 for the change in vegetation C per change in natural land fraction in tropical forests; see Fig. S5 in the Supplement). This reflects that direct correlations of ES indicator changes with changes in LULC are difficult to establish because they are significantly impaired by factors such as overlying climate effects, different base levels in ES indicators and LULC configurations and different ecosystem responses below the level of biomes (including, e.g., legacy effects of past LULC changes).
4.3 Significance of our approach
The IPBES report on plausible futures of nature identified some general trends across their scenarios (e.g., continued increase in managed land, increases in material and decreases in regulating and nonmaterial nature's contributions to people) and rated the knowledge base and confidence in effects of interactions of future LULC and climatic changes on biodiversity and ecosystem functioning as “established but incomplete” (see Shin et al., 2019). By evaluating 16 scenarios of five structurally different LUMs, we covered a large variability existing in currently available spatially explicit projections of LULC and, therefore, contributed to extending the existing knowledge base on the variability of future ES indicators. However, conclusions drawn here with regard to projected changes in LULC and ES indicators are inherently dependent on the selected set of LUMs and scenarios, the evaluation time period and the simulation setup. In addition, we did not consider climatic variability resulting from different GCM implementations of climate under RCP2.6 nor other possible emission pathways, which both add uncertainty to future ES indicator levels. Previous studies (e.g., Friend et al., 2014; Krause et al., 2019; Nishina et al., 2015; Pugh et al., 2018) have explored the variability of using different ecosystem models with the same or multiple LULC and climate pathways, whereas Ahlström et al. (2012) and Schaphoff et al. (2006) used climate forcing data from multiple GCMs following the same emission pathway instead of only one climate model to quantify ES indicators. Our sensitivity test using climate inputs from five GCMs and the four LUH1 scenarios indicated uncertainties of between 0.1 % and 8.6 % for the ES indicators considered here (Table S6). The fact that crop type distribution and N fertilization was taken directly from the LUMs for IMAGE and MAgPIE simulations was considered as an extension of the LULC input from the LUMs and, therefore, as a part of the LULC scenarios of these models. In this study, we considered the near to medium future until 2040. Estimates of ES indicator levels and their variability for the far future until 2100 are likely different.
We conclude that LUMs and IAMs have some fundamental limitations in capturing all relevant processes related to LULC changes which in some scenarios result in questionable and potentially unrealistic features in their regional LULC allocations and their global and regional trends. More spatial information from LUMs related to regional assumptions (e.g., on technological progress, flows of food import, export and local production) in addition to LULC patterns would be helpful to better understand their regional LULC allocations. Limitations also include technical aspects of LUMs, such as adequate spatial resolution, representation of net vs. gross LULC changes and the number of LULC classes. We can only deduce a generally high influence of model-specific singularities from our findings, although we could not attribute the discrepancy in LULC patterns to the individual factors in the LULC modeling process based on the available LUM data.
The variability across the 16 LULC scenarios entails a high variability in the trends of most ES indicators investigated in this study. On a regional level, this emphasizes the role of tropical forests, especially the borders of the currently forested tropics, as regions with the most uncertain future developments that have the potential to significantly alter regional ecosystem functionality and services in a way that is substantial in a global context. Among the investigated ES indicators, the identification of crop production as the indicator that was associated with the highest uncertainties by far in terms of global totals and regional variabilities, highlights the diverging production targets as well as the different regional strategies of the investigated models to fulfill future demands for crop production.
Our results stress that information from individual LUMs or IAMs, which is used for policy support towards sustainable transformations, should be complemented by further information such as the variability of ES indicators arising through different LULC projections. This would provide a wider context that is essential with respect to policy making. For regional decision-making, this is especially important in regions with highly diverging trends in land-use scenarios and, therefore, large variability in ES indicators. The issue may become even more relevant in the second half of the century, when LULC changes for climate change mitigation and adaptation are likely to intensify. Ultimately, we need to find improved ways to achieve a better integration between models targeting the different aspects in the cycle of socioeconomic developments and their direct, indirect and cumulative implications on natural systems.
LUH2 data are available at https://www.luh.umd.edu/data.shtml (last access: 1 June 2019, Hurtt et al., 2019), and ISI-MIP climate data are available at https://doi.org/10.5880/PIK.2016.001 (Hempel et al., 2013).
The supplement related to this article is available online at: https://doi.org/10.5194/esd-12-327-2021-supplement.
ADB and AA conceived and designed the experiments. PHV and RF made CLUMondo data available and converted them for this study. PA prepared LUH2 input data for LPJ-GUESS and assisted with the LPJ-GUESS model simulations. RM, AK and ADB carried out the model simulations and led the data analysis with contributions from all authors. RF contributed to the analysis of the spatial–temporal patterns of land-use models. ADB led the writing of the paper with contributions from all authors.
The authors declare that they have no conflict of interest.
The authors thank the research groups for making climate model data (ISI-MIP) and land-use model data available to the community. We thank Karina Winkler for providing data on historical LULC changes.
This research has been supported by the European Commission's 7th Framework Programme (grant no. 308393, OPERAs, and grant no. 603542, LUC4C), and the Helmholtz Association and its ATMO research program.
The article processing charges for this open-access publication were covered by a Research Centre of the Helmholtz Association.
This paper was edited by Somnath Baidya Roy and reviewed by Edouard Davin and one anonymous referee.
Ahlström, A., Schurgers, G., Arneth, A., and Smith, B.: Robustness and uncertainty in terrestrial ecosystem carbon response to CMIP5 climate change projections, Environ. Res. Lett., 7, 044008-10, https://doi.org/10.1088/1748-9326/7/4/044008, 2012.
Ahlström, A., Raupach, M. R., Schurgers, G., Smith, B., Arneth, A., Jung, M., Reichstein, M., Canadell, J. G., Friedlingstein, P., Jain, A. K., Kato, E., Poulter, B., Sitch, S., Stocker, B. D., Viovy, N., Wang, Y. P., Wiltshire, A., Zaehle, S., and Zeng, N.: The dominant role of semi-arid ecosystems in the trend and variability of the land CO2 sink, Science, 348, 895–899, https://doi.org/10.1126/science.aaa1668, 2015.
Aleman, J. C., Blarquez, O., and Staver, C. A.: Land-use change outweighs projected effects of changing rainfall on tree cover in sub-Saharan Africa, Global Change Biol., 22, 3013–3025, https://doi.org/10.1111/gcb.13299, 2016.
Alexander, P., Prestele, R., Verburg, P. H., Arneth, A., Baranzelli, C., Batista e Silva, F., Brown, C., Butler, A., Calvin, K., Dendoncker, N., Doelman, J. C., Dunford, R., Engström, K., Eitelberg, D., Fujimori, S., Harrison, P. A., Hasegawa, T., Havlik, P., Holzhauer, S., Humpenöder, F., Jacobs-Crisioni, C., Jain, A. K., Krisztin, T., Kyle, P., Lavalle, C., Lenton, T., Liu, J., Meiyappan, P., Popp, A., Powell, T., Sands, R. D., Schaldach, R., Stehfest, E., Steinbuks, J., Tabeau, A., van Meijl, H., Wise, M. A., and Rounsevell, M. D. A.: Assessing uncertainties in land cover projections, Global Change Biol., 23, 767–781, https://doi.org/10.1111/gcb.13447, 2017.
Alexander, P., Rabin, S., Anthoni, P., Henry, R., Pugh, T. A. M., Rounsevell, M. D. A., and Arneth, A.: Adaptation of global land use and management intensity to changes in climate and atmospheric carbon dioxide, Global Change Biol., 24, 2791–2809, https://doi.org/10.1111/gcb.14110, 2018.
Alexandratos, N. and Bruinsma, J.: World Agriculture towards 2030/2050. The 2012 Revision, Food and Agriculture Organization of the United Nations, Rome, Italy, 2012.
Anderson, R. G., Canadell, J. G., Randerson, J. T., Jackson, R. B., Hungate, B. A., Baldocchi, D. D., Ban-Weiss, G. A., Bonan, G. B., Caldeira, K., Cao, L., Diffenbaugh, N. S., Gurney, K. R., Kueppers, L. M., Law, B. E., Luyssaert, S., and O'Halloran, T. L.: Biophysical considerations in forestry for climate protection, Front. Ecol. Environ., 9, 174–182, https://doi.org/10.1890/090179, 2011.
Arora, V. K. and Boer, G. J.: Uncertainties in the 20th century carbon budget associated with land use change, Global Change Biol., 16, 3327–3348, https://doi.org/10.1111/j.1365-2486.2010.02202.x, 2010.
Barrett, S. and Toman, M.: Contrasting Future Paths for an Evolving Global Climate Regime, Glob. Policy, 1, 64–74, https://doi.org/10.1111/j.1758-5899.2009.00010.x, 2010.
Bayer, A. D., Lindeskog, M., Pugh, T. A. M., Anthoni, P. M., Fuchs, R., and Arneth, A.: Uncertainties in the land-use flux resulting from land-use change reconstructions and gross land transitions, Earth Syst. Dynam., 8, 91–111, https://doi.org/10.5194/esd-8-91-2017, 2017.
Bondeau, A., Smith, P. C., Zähle, S., Schaphoff, S., Lucht, W., Cramer, W., Gerten, D., Lotze-Campen, H., Müller, C., Reichstein, M., Smith, B., Zaehle, S., Schaphoff, S., Lucht, W., Cramer, W., Gerten, D., Lotze-Campen, H., Müller, C., Reichstein, M., and Smith, B.: Modelling the role of agriculture for the 20th century global terrestrial carbon balance, Global Change Biol., 13, 679–706, https://doi.org/10.1111/j.1365-2486.2006.01305.x, 2007.
Brovkin, V., Boysen, L., Arora, V. K., Boisier, J. P., Cadule, P., Chini, L., Claussen, M., Friedlingstein, P., Gayler, V., van den Hurk, B. J. J. M., Hurtt, G. C., Jones, C. D., Kato, E., de Noblet-Ducoudré, N., Pacifico, F., Pongratz, J., and Weiss, M.: Effect of anthropogenic land-use and land-cover changes on climate and land carbon storage in CMIP5 projections for the twenty-first century, J. Climate, 26, 6859–6881, https://doi.org/10.1175/JCLI-D-12-00623.1, 2013.
Brown, C., Alexander, P., Arneth, A., Holman, I., and Rounsevell, M.: Achievement of Paris climate goals unlikely due to time lags in the land system, Nat. Clim. Change, 9, 203–208, https://doi.org/10.1038/s41558-019-0400-5, 2019.
Curtis, P. G., Slay, C. M., Harris, N. L., Tyukavina, A., and Hansen, M. C.: Classifying drivers of global forest loss, Science, 361, 1108–1111, https://doi.org/10.1126/science.aau3445, 2018.
DeFries, R., Foley, J., and Asner, G.: Land-use choices: balancing human needs and ecosystem function, Front. Ecol. Environ., 2, 249–257, 2004.
DeFries, R., Hansen, A., Newton, A. C., and Hansen, M. C.: Increasing isolation of protected areas in tropical forests over the past twenty years, Ecol. Appl., 15, 19–26, https://doi.org/10.1890/03-5258, 2005.
de Groot, R., Brander, L., van der Ploeg, S., Costanza, R., Bernard, F., Braat, L., Christie, M., Crossman, N., Ghermandi, A., Hein, L., Hussain, S., Kumar, P., McVittie, A., Portela, R., Rodriguez, L. C., ten Brink, P., and van Beukering, P.: Global estimates of the value of ecosystems and their services in monetary units, Ecosyst. Serv., 1, 50–61, https://doi.org/10.1016/j.ecoser.2012.07.005, 2012.
De Kauwe, M. G., Medlyn, B. E., Zaehle, S., Walker, A. P., Dietze, M. C., Hickler, T., Jain, A. K., Luo, Y., Parton, W. J., Prentice, I. C., Smith, B., Thornton, P. E., Wang, S., Wang, Y. P., Wårlind, D., Weng, E., Crous, K. Y., Ellsworth, D. S., Hanson, P. J., Seok Kim, H., Warren, J. M., Oren, R., and Norby, R. J.: Forest water use and water use efficiency at elevated CO2: A model-data intercomparison at two contrasting temperate forest FACE sites, Global Change Biol., 19, 1759–1779, https://doi.org/10.1111/gcb.12164, 2013.
Dunford, R. W., Smith, A. C., Harrison, P. A., and Hanganu, D.: Ecosystem service provision in a changing Europe: adapting to the impacts of combined climate and socio-economic change, Landscape Ecology, 30, 443–461, https://doi.org/10.1007/s10980-014-0148-2, 2015.
Eitelberg, D. A., van Vliet, J., Doelman, J. C., Stehfest, E., and Verburg, P. H.: Demand for biodiversity protection and carbon storage as drivers of global land change scenarios, Global Environ. Change, 40, 101–111, https://doi.org/10.1016/j.gloenvcha.2016.06.014, 2016.
Elliott, J., Deryng, D., Müller, C., Frieler, K., Konzmann, M., Gerten, D., Glotter, M., Flörke, M., Wada, Y., Best, N., Eisner, S., Fekete, B. M., Folberth, C., Foster, I., Gosling, S. N., Haddeland, I., Khabarov, N., Ludwig, F., Masaki, Y., Olin, S., Rosenzweig, C., Ruane, A. C., Satoh, Y., Schmid, E., Stacke, T., Tang, Q., and Wisser, D.: Constraints and potentials of future irrigation water availability on agricultural production under climate change, P. Natl. Acad. Sci. USA, 111, 3239–3244, https://doi.org/10.1073/pnas.1222474110, 2014.
Eyring, V., Bony, S., Meehl, G. A., Senior, C. A., Stevens, B., Stouffer, R. J., and Taylor, K. E.: Overview of the Coupled Model Intercomparison Project Phase 6 (CMIP6) experimental design and organization, Geosci. Model Dev., 9, 1937–1958, https://doi.org/10.5194/gmd-9-1937-2016, 2016.
Farley, K. A., Jobbágy, E. G., and Jackson, R. B.: Effects of afforestation on water yield: A global synthesis with implications for policy, Global Change Biol., 11, 1565–1576, https://doi.org/10.1111/j.1365-2486.2005.01011.x, 2005.
Fitton, N., Alexander, P., Arnell, N., Bajzelj, B., Calvin, K., Doelman, J., Gerber, J. S., Havlik, P., Hasegawa, T., Herrero, M., Krisztin, T., van Meijl, H., Powell, T., Sands, R., Stehfest, E., West, P. C., and Smith, P.: The vulnerabilities of agricultural land and food production to future water scarcity, Global Environ. Change, 58, 101944, https://doi.org/10.1016/j.gloenvcha.2019.101944, 2019.
Foley, J. a, DeFries, R., Asner, G. P., Barford, C., Bonan, G., Carpenter, S. R., Chapin, F. S., Coe, M. T., Daily, G. C., Gibbs, H. K. H. K., Helkowski, J. H., Holloway, T., Howard, E. A., Kucharik, C. J., Monfreda, C., Patz, J. A., Prentice, I. C., Ramankutty, N., Snyder, P. K., Chapin M. T., F. S. C., Daily, G. C., Gibbs, H. K. H. K., Helkowski, J. H., Holloway, T., Howard, E. A., Kucharik, C. J., Monfreda, C., Patz, J. A., Prentice, I. C., Ramankutty, N., and Snyder, P. K.: Global consequences of land use, Science, 309, 570–574, https://doi.org/10.1126/science.1111772, 2005.
Friedlingstein, P., Jones, M. W., O'Sullivan, M., Andrew, R. M., Hauck, J., Peters, G. P., Peters, W., Pongratz, J., Sitch, S., Le Quéré, C., Bakker, D. C. E., Canadell, J. G., Ciais, P., Jackson, R. B., Anthoni, P., Barbero, L., Bastos, A., Bastrikov, V., Becker, M., Bopp, L., Buitenhuis, E., Chandra, N., Chevallier, F., Chini, L. P., Currie, K. I., Feely, R. A., Gehlen, M., Gilfillan, D., Gkritzalis, T., Goll, D. S., Gruber, N., Gutekunst, S., Harris, I., Haverd, V., Houghton, R. A., Hurtt, G., Ilyina, T., Jain, A. K., Joetzjer, E., Kaplan, J. O., Kato, E., Klein Goldewijk, K., Korsbakken, J. I., Landschützer, P., Lauvset, S. K., Lefèvre, N., Lenton, A., Lienert, S., Lombardozzi, D., Marland, G., McGuire, P. C., Melton, J. R., Metzl, N., Munro, D. R., Nabel, J. E. M. S., Nakaoka, S.-I., Neill, C., Omar, A. M., Ono, T., Peregon, A., Pierrot, D., Poulter, B., Rehder, G., Resplandy, L., Robertson, E., Rödenbeck, C., Séférian, R., Schwinger, J., Smith, N., Tans, P. P., Tian, H., Tilbrook, B., Tubiello, F. N., van der Werf, G. R., Wiltshire, A. J., and Zaehle, S.: Global Carbon Budget 2019, Earth Syst. Sci. Data, 11, 1783–1838, https://doi.org/10.5194/essd-11-1783-2019, 2019.
Friend, A. D., Lucht, W., Rademacher, T. T., Keribin, R., Betts, R., Cadule, P., Ciais, P., Clark, D. B., Dankers, R., Falloon, P. D., Ito, A., Kahana, R., Kleidon, A., Lomas, M. R., Nishina, K., Ostberg, S., Pavlick, R., Peylin, P., Schaphoff, S., Vuichard, N., Warszawski, L., Wiltshire, A., and Woodward, F. I.: Carbon residence time dominates uncertainty in terrestrial vegetation responses to future climate and atmospheric CO2, P. Natl. Acad. Sci. USA, 111, 3280–3285, https://doi.org/10.1073/pnas.1222477110, 2014.
Fritz, S., See, L., Mccallum, I., You, L., Bun, A., Moltchanova, E., Duerauer, M., Albrecht, F., Schill, C., Perger, C., Havlik, P., Mosnier, A., Thornton, P., Wood-Sichra, U., Herrero, M., Becker-Reshef, I., Justice, C., Hansen, M., Gong, P., Abdel Aziz, S., Cipriani, A., Cumani, R., Cecchi, G., Conchedda, G., Ferreira, S., Gomez, A., Haffani, M., Kayitakire, F., Malanding, J., Mueller, R., Newby, T., Nonguierma, A., Olusegun, A., Ortner, S., Rajak, D. R., Rocha, J., Schepaschenko, D., Schepaschenko, M., Terekhov, A., Tiangwa, A., Vancutsem, C., Vintrou, E., Wenbin, W., van der Velde, M., Dunwoody, A., Kraxner, F., and Obersteiner, M.: Mapping global cropland and field size, Global Change Biol., 21, 1980–1992, https://doi.org/10.1111/gcb.12838, 2015.
Funk, C. C. and Brown, M. E.: Declining global per capita agricultural production and warming oceans threaten food security, Food Secur., 1, 271–289, https://doi.org/10.1007/s12571-009-0026-y, 2009.
Gibbs, H. K., Rausch, L., Munger, J., Schelly, I., Morton, D. C., Noojipady, P., Soares-Filho, B., Barreto, P., Micol, L., and Walker, N. F.: Brazil's Soy Moratorium, Science, 347, 377–378, https://doi.org/10.1126/science.aaa0181, 2015.
Hansen, M. C., Potapov, P. V., Moore, R., Hancher, M., Turubanova, S. A., Tyukavina, A., Thau, D., Stehman, S. V., Goetz, S. J., Loveland, T. R., Kommareddy, A., Egorov, A., Chini, L., Justice, C. O., and J. R. G.: Townshend: High-Resolution Global Maps of 21st-Century Forest Cover Change, Science, 342, 850–854, https://doi.org/10.1126/science.1244693, 2013.
Harper, A. B., Powell, T., Cox, P. M., House, J., Huntingford, C., Lenton, T. M., Sitch, S., Burke, E., Chadburn, S. E., Collins, W. J., Comyn-Platt, E., Daioglou, V., Doelman, J. C., Hayman, G., Robertson, E., van Vuuren, D., Wiltshire, A., Webber, C. P., Bastos, A., Boysen, L., Ciais, P., Devaraju, N., Jain, A. K., Krause, A., Poulter, B., and Shu, S.: Land-use emissions play a critical role in land-based mitigation for Paris climate targets, Nat. Commun., 9, 2938, https://doi.org/10.1038/s41467-018-05340-z, 2018.
Heinimann, A., Mertz, O., Frolking, S., Christensen, A. E., Hurni, K., Sedano, F., Chini, L. P., Sahajpal, R., Hansen, M., and Hurtt, G.: A global view of shifting cultivation: Recent, current, and future extent, PLoS One, 12, 1–21, https://doi.org/10.1371/journal.pone.0184479, 2017.
Hempel, S., Frieler, K., Warszawski, L., Schewe, J., and Piontek, F.: Bias corrected GCM input data for ISIMIP Fast Track, GFZ Data Services, https://doi.org/10.5880/PIK.2016.001, 2013.
Holl, K. D. and Brancalion, P. H. S.: Tree planting is not a simple solution, Science, 368, 580–581, https://doi.org/10.1126/science.aba8232, 2020.
Hostert, P., Kuemmerle, T., Prishchepov, A., Sieber, A., Lambin, E. F., and Radeloff, V. C.: Rapid land use change after socio-economic disturbances: The collapse of the SovietUnion versus Chernobyl, Environ. Res. Lett., 6, 045201, https://doi.org/10.1088/1748-9326/6/4/045201, 2011.
Humpenöder, F., Popp, A., Dietrich, J. P., Klein, D., Lotze-Campen, H., Bonsch, M., Bodirsky, B. L. B. L., Weindl, I., Stevanovic, M., Mueller, C., and Müller, C.: Investigating afforestation and bioenergy CCS as climate change mitigation strategies, Environ. Res. Lett., 9, 064029, https://doi.org/10.1088/1748-9326/9/6/064029, 2014.
Huntingford, C., Cox, P. M., Mercado, L. M., Sitch, S., Bellouin, N., Boucher, O., and Gedney, N.: Highly contrasting effects of different climate forcing agents on terrestrial ecosystem services, Philos. T. R. Soc. A, 369, 2026–2037, 2011.
Hurtt, G. C., Chini, L. P., Frolking, S., Betts, R. A., Feddema, J., Fischer, G., Fisk, J. P., Hibbard, K., Houghton, R. A., Janetos, A., Jones, C. D., Kindermann, G., Kinoshita, T., Klein Goldewijk, K., Riahi, K., Shevliakova, E., Smith, S., Stehfest, E., Thomson, A., Thornton, P., van Vuuren, D. P., and Wang, Y. P.: Harmonization of land-use scenarios for the period 1500–2100: 600 years of global gridded annual land-use transitions, wood harvest, and resulting secondary lands, Climatic Change, 109, 117–161, 2011.
Hurtt, G. C., Chini, L., Sahajpal, R., Frolking, S., Bodirsky, B. L., Calvin, K., Doelman, J. C., Fisk, J., Fujimori, S., Goldewijk, K. K., Hasegawa, T., Havlik, P., Heinimann, A., Humpenöder, F., Jungclaus, J., Kaplan , J., Kennedy, J., Kristzin, T., Lawrence, D., Lawrence, P., Ma, L., Mertz, O., Pongratz, J., Popp, A., Poulter, B., Riahi, K., Shevliakova, E., Stehfest, E., Thornton, P., Tubiello, F. N., van Vuuren, D. P., and Zhang, X.: Land-use Harmonization 2, https://www.luh.umd.edu/data.shtml, last access: 1 June 2019.
Hurtt, G. C., Chini, L., Sahajpal, R., Frolking, S., Bodirsky, B. L., Calvin, K., Doelman, J. C., Fisk, J., Fujimori, S., Klein Goldewijk, K., Hasegawa, T., Havlik, P., Heinimann, A., Humpenöder, F., Jungclaus, J., Kaplan, J. O., Kennedy, J., Krisztin, T., Lawrence, D., Lawrence, P., Ma, L., Mertz, O., Pongratz, J., Popp, A., Poulter, B., Riahi, K., Shevliakova, E., Stehfest, E., Thornton, P., Tubiello, F. N., van Vuuren, D. P., and Zhang, X.: Harmonization of global land use change and management for the period 850–2100 (LUH2) for CMIP6, Geosci. Model Dev., 13, 5425–5464, https://doi.org/10.5194/gmd-13-5425-2020, 2020.
IPBES: Summary for policymakers of the global assessment report on biodiversity and ecosystem services of the Intergovernmental Science-Policy Platform on Biodiversity and Ecosystem Services, IPBES, Bonn, Germany, 2019.
IPCC: Climate Change and Land. IPCC Special Report on climate change, desertification, land degradation, sustainable land management, food security, and greenhouse gas fluxes in terrestrial ecosystems, Intergovernmental Panel on Climate Change (IPCC), Geneva, Switzerland, 2019.
Jantz, S. M., Barker, B., Brooks, T. M., Chini, L. P., Huang, Q., Moore, R. M., Noel, J., and Hurtt, G. C.: Future habitat loss and extinctions driven by land-use change in biodiversity hotspots under four scenarios of climate-change mitigation, Conserv. Biol., 29, 1122–1131, https://doi.org/10.1111/cobi.12549, 2015.
Kim, H., Rosa, I. M. D., Alkemade, R., Leadley, P., Hurtt, G., Popp, A., van Vuuren, D. P., Anthoni, P., Arneth, A., Baisero, D., Caton, E., Chaplin-Kramer, R., Chini, L., De Palma, A., Di Fulvio, F., Di Marco, M., Espinoza, F., Ferrier, S., Fujimori, S., Gonzalez, R. E., Gueguen, M., Guerra, C., Harfoot, M., Harwood, T. D., Hasegawa, T., Haverd, V., Havlík, P., Hellweg, S., Hill, S. L. L., Hirata, A., Hoskins, A. J., Janse, J. H., Jetz, W., Johnson, J. A., Krause, A., Leclère, D., Martins, I. S., Matsui, T., Merow, C., Obersteiner, M., Ohashi, H., Poulter, B., Purvis, A., Quesada, B., Rondinini, C., Schipper, A. M., Sharp, R., Takahashi, K., Thuiller, W., Titeux, N., Visconti, P., Ware, C., Wolf, F., and Pereira, H. M.: A protocol for an intercomparison of biodiversity and ecosystem services models using harmonized land-use and climate scenarios, Geosci. Model Dev., 11, 4537–4562, https://doi.org/10.5194/gmd-11-4537-2018, 2018.
Klein Goldewijk, C. G. M.: A historical land use data set for the Holocene; HYDE 3.2, DANS, https://doi.org/10.17026/dans-znk-cfy3, 2016.
Klein Goldewijk, K., Beusen, A., Van Drecht, G., and De Vos, M.: The HYDE 3.1 spatially explicit database of human-induced global land-use change over the past 12,000 years, Global Ecol. Biogeogr., 20, 73–86, https://doi.org/10.1111/j.1466-8238.2010.00587.x, 2011.
Klein Goldewijk, K., Beusen, A., Doelman, J., and Stehfest, E.: Anthropogenic land use estimates for the Holocene – HYDE 3.2, Earth Syst. Sci. Data, 9, 927–953, https://doi.org/10.5194/essd-9-927-2017, 2017.
Krause, A., Pugh, T. A. M., Bayer, A. D., Doelman, J. C., Humpenöder, F., Anthoni, P., Olin, S., Bodirsky, B. L., Popp, A., Stehfest, E., and Arneth, A.: Global consequences of afforestation and bioenergy cultivation on ecosystem service indicators, Biogeosciences, 14, 4829–4850, https://doi.org/10.5194/bg-14-4829-2017, 2017.
Krause, A., Pugh, T. A. M., Bayer, A. D., Li, W., Leung, F., Bondeau, A., Doelman, J. C., Humpenöder, F., Anthoni, P., Bodirsky, B. L., Ciais, P., Müller, C., Murray-Tortarolo, G., Olin, S., Popp, A., Sitch, S., Stehfest, E., and Arneth, A.: Large uncertainty in carbon uptake potential of land-based climate-change mitigation efforts, Global Change Biol., 24, 3025–3038, https://doi.org/10.1111/gcb.14144, 2018.
Krause, A., Haverd, V., Poulter, B., Anthoni, P., Quesada, B., Rammig, A., and Arneth, A.: Multimodel Analysis of Future Land Use and Climate Change Impacts on Ecosystem Functioning, Earths Future, 7, 833–851, https://doi.org/10.1029/2018EF001123, 2019.
Lambin, E. F., Geist, H. J., and Lepers, E.: Dynamics of Land-Use and Land-Cover Change in Tropical Regions, Annu. Rev. Env. Resour., 28, 205–241, https://doi.org/10.1146/annurev.energy.28.050302.105459, 2003.
Lambin, E. F., Meyfroidt, P., Rueda, X., Blackman, A., Börner, J., Cerutti, P. O., Dietsch, T., Jungmann, L., Lamarque, P., Lister, J., Walker, N. F., and Wunder, S.: Effectiveness and synergies of policy instruments for land use governance in tropical regions, Global Environ. Change, 28, 129–140, https://doi.org/10.1016/j.gloenvcha.2014.06.007, 2014.
Laurance, W. F., Carolina Useche, D., Rendeiro, J., Kalka, M., Bradshaw, C. J. A., Sloan, S. P., Laurance, S. G., Campbell, M., Abernethy, K., Alvarez, P., Arroyo-Rodriguez, V., Ashton, P., Benítez-Malvido, J., Blom, A., Bobo, K. S., Cannon, C. H., Cao, M., Carroll, R., Chapman, C., Coates, R., Cords, M., Danielsen, F., De Dijn, B., Dinerstein, E., Donnelly, M. A., Edwards, D., Edwards, F., Farwig, N., Fashing, P., Forget, P. M., Foster, M., Gale, G., Harris, D., Harrison, R., Hart, J., Karpanty, S., John Kress, W., Krishnaswamy, J., Logsdon, W., Lovett, J., Magnusson, W., Maisels, F., Marshall, A. R., McClearn, D., Mudappa, D., Nielsen, M. R., Pearson, R., Pitman, N., Van Der Ploeg, J., Plumptre, A., Poulsen, J., Quesada, M., Rainey, H., Robinson, D., Roetgers, C., Rovero, F., Scatena, F., Schulze, C., Sheil, D., Struhsaker, T., Terborgh, J., Thomas, D., Timm, R., Nicolas Urbina-Cardona, J., Vasudevan, K., Joseph Wright, S., Carlos Arias-G., J., Arroyo, L., Ashton, M., Auzel, P., Babaasa, D., Babweteera, F., Baker, P., Banki, O., Bass, M., Bila-Isia, I., Blake, S., Brockelman, W., Brokaw, N., Brühl, C. A., Bunyavejchewin, S., Chao, J. T., Chave, J., Chellam, R., Clark, C. J., Clavijo, J., Congdon, R., Corlett, R., Dattaraja, H. S., Dave, C., Davies, G., De Mello Beisiegel, B., De Nazaré Paes Da Silva, R., Di Fiore, A., Diesmos, A., Dirzo, R., Doran-Sheehy, D., Eaton, M., Emmons, L., et al.: Averting biodiversity collapse in tropical forest protected areas, Nature, 489, 290–293, https://doi.org/10.1038/nature11318, 2012.
Lawler, J. J., Lewis, D. J., Nelson, E., Plantinga, A. J., Polasky, S., Withey, J. C., Helmers, D. P., Martinuzzi, S., Penningtonh, D., and Radeloff, V. C.: Projected land-use change impacts on ecosystem services in the United States, P. Natl. Acad. Sci. USA, 111, 7492–7497, https://doi.org/10.1073/pnas.1405557111, 2014.
Lewis, S. L., Edwards, D. P., and Galbraith, D.: Increasing human dominance of tropical forests, Science, 349, 827–832, 2015.
Le Quéré, C., Moriarty, R., Andrew, R. M., Peters, G. P., Ciais, P., Friedlingstein, P., Jones, S. D., Sitch, S., Tans, P., Arneth, A., Boden, T. A., Bopp, L., Bozec, Y., Canadell, J. G., Chini, L. P., Chevallier, F., Cosca, C. E., Harris, I., Hoppema, M., Houghton, R. A., House, J. I., Jain, A. K., Johannessen, T., Kato, E., Keeling, R. F., Kitidis, V., Klein Goldewijk, K., Koven, C., Landa, C. S., Landschützer, P., Lenton, A., Lima, I. D., Marland, G., Mathis, J. T., Metzl, N., Nojiri, Y., Olsen, A., Ono, T., Peng, S., Peters, W., Pfeil, B., Poulter, B., Raupach, M. R., Regnier, P., Rödenbeck, C., Saito, S., Salisbury, J. E., Schuster, U., Schwinger, J., Séférian, R., Segschneider, J., Steinhoff, T., Stocker, B. D., Sutton, A. J., Takahashi, T., Tilbrook, B., van der Werf, G. R., Viovy, N., Wang, Y.-P., Wanninkhof, R., Wiltshire, A., and Zeng, N.: Global carbon budget 2014, Earth Syst. Sci. Data, 7, 47–85, https://doi.org/10.5194/essd-7-47-2015, 2015.
Lindeskog, M., Arneth, A., Bondeau, A., Waha, K., Seaquist, J., Olin, S., and Smith, B.: Implications of accounting for land use in simulations of ecosystem carbon cycling in Africa, Earth Syst. Dynam., 4, 385–407, https://doi.org/10.5194/esd-4-385-2013, 2013.
Liu, X., Yu, L., Sia, Y., Zhang, C., Lu, H., Yu, C., and Gong, P.: Identifying patterns and hotspots of global land cover transitions using the ESA CCI land cover dataset, Remote Sens. Lett., 9, 972–981, https://doi.org/10.1080/2150704X.2018.1500070, 2018.
Lobell, D. B., Cassman, K. G., and Field, C. B.: Crop Yield Gaps: Their Importance, Magnitudes, and Causes, Annu. Rev. Env. Resour., 34, 179–204, https://doi.org/10.1146/annurev.environ.041008.093740, 2009.
Lotze-Campen, H., Müller, C., Bondeau, A., Rost, S., Popp, A., and Lucht, W.: Global food demand, productivity growth, and the scarcity of land and water resources: A spatially explicit mathematical programming approach, Agr. Econ., 39, 325–338, https://doi.org/10.1111/j.1574-0862.2008.00336.x, 2008.
Meiyappan, P., Dalton, M., O'Neill, B. C., and Jain, A. K.: Spatial modeling of agricultural land use change at global scale, Ecol. Model., 291, 152–174, https://doi.org/10.1016/j.ecolmodel.2014.07.027, 2014.
Meyfroidt, P., Abeygunawardane, D., Ramankutty, N., Thomson, A., and Zeleke, G.: Interactions between land systems and food systems, Curr. Opin. Env. Sust., 38, 60–67, https://doi.org/10.1016/j.cosust.2019.04.010, 2019.
Millar, C. I. and Stephenson, N. L.: Temperate forest health in an era of emerging megadisturbance, Science, 349, 823–826, https://doi.org/10.1126/science.aaa9933, 2015.
Moore, F. C. and Lobell, D. B.: The fingerprint of climate trends on european crop yields, P. Natl. Acad. Sci. USA, 112, 2970–2975, https://doi.org/10.1073/pnas.1409606112, 2015.
Mueller, N. D., Gerber, J. S., Johnston, M., Ray, D. K., Ramankutty, N., and Foley, J. A.: Closing yield gaps through nutrient and water management, Nature, 490, 254–257, https://doi.org/10.1038/nature11420, 2012.
Nepstad, D., Mcgrath, D., Stickler, C., Alencar, A., Azevedo, A., Swette, B., Bezerra, T., Digiano, M., Shimada, J., Seroa, R., Armijo, E., Castello, L., Brando, P., Hansen, M. C., Mcgrath-horn, M., Carvalho, O., and Hess, L.: Slowing Amazon deforestation through public policy and interventions in beef and soy supply chains, Science, 344, 1118–1123, 2014.
Nilsson, M. and Persson, Å.: Can Earth system interactions be governed? Governance functions for linking climate change mitigation with land use, freshwater and biodiversity protection, Ecol. Econ., 75, 61–71, https://doi.org/10.1016/j.ecolecon.2011.12.015, 2012.
Nishina, K., Ito, A., Falloon, P., Friend, A. D., Beerling, D. J., Ciais, P., Clark, D. B., Kahana, R., Kato, E., Lucht, W., Lomas, M., Pavlick, R., Schaphoff, S., Warszawaski, L., and Yokohata, T.: Decomposing uncertainties in the future terrestrial carbon budget associated with emission scenarios, climate projections, and ecosystem simulations using the ISI-MIP results, Earth Syst. Dynam., 6, 435–445, https://doi.org/10.5194/esd-6-435-2015, 2015.
Noojipady, P., Morton, C. D., Macedo, N. M., Victoria, C. D., Huang, C., Gibbs, K. H., and Bolfe, L. E.: Forest carbon emissions from cropland expansion in the Brazilian Cerrado biome, Environ. Res. Lett., 12, 025004, https://doi.org/10.1088/1748-9326/aa5986, 2017.
O'Neill, B. C., Kriegler, E., Riahi, K., Ebi, K. L., Hallegatte, S., Carter, T. R., Mathur, R., and van Vuuren, D. P.: A new scenario framework for climate change research: The concept of shared socioeconomic pathways, Climatic Change, 122, 387–400, https://doi.org/10.1007/s10584-013-0905-2, 2014.
Olin, S., Schurgers, G., Lindeskog, M., Wårlind, D., Smith, B., Bodin, P., Holmér, J., and Arneth, A.: Modelling the response of yields and tissue C:N to changes in atmospheric CO2 and N management in the main wheat regions of western Europe, Biogeosciences, 12, 2489–2515, https://doi.org/10.5194/bg-12-2489-2015, 2015.
Ostberg, S., Lucht, W., Schaphoff, S., and Gerten, D.: Critical impacts of global warming on land ecosystems, Earth Syst. Dynam., 4, 347–357, https://doi.org/10.5194/esd-4-347-2013, 2013.
Pala, M., Oweis, T., Benli, B., De Pauw, E., El Mourid, M., Karrou, M., Jamal, M., and Zencirci, N.: Assessment of wheat yield gap in the Mediterranean: case studies from Morocco, Syria and Turkey, International Center for Agricultural Research in the Dry Areas (ICARDA), Aleppo, Syria, 2011.
Park, A., Puettmann, K., Wilson, E., Messier, C., Kames, S., and Dhar, A.: Can Boreal and Temperate Forest Management be Adapted to the Uncertainties of 21st Century Climate Change?, Crit. Rev. Plant Sci., 33, 251–285, https://doi.org/10.1080/07352689.2014.858956, 2014.
Piao, S., Friedlingstein, P., Ciais, P., De Noblet-Ducoudré, N., Labat, D., and Zaehle, S.: Changes in climate and land use have a larger direct impact than rising CO2 on global river runoff trends, P. Natl. Acad. Sci. USA, 104, 15242–15247, https://doi.org/10.1073/pnas.0707213104, 2007.
Popp, A., Humpenöder, F., Weindl, I., Bodirsky, B. L., Bonsch, M., Lotze-Campen, H., Müller, C., Biewald, A., Rolinski, S., Stevanovic, M., and Dietrich, J. P.: Land-use protection for climate change mitigation, Nat. Clim. Change, 4, 1095–1098, https://doi.org/10.1038/nclimate2444, 2014.
Popp, A., Calvin, K., Fujimori, S., Havlik, P., Humpenöder, F., Stehfest, E., Bodirsky, B. L., Dietrich, J. P., Doelmann, J. C., Gusti, M., Hasegawa, T., Kyle, P., Obersteiner, M., Tabeau, A., Takahashi, K., Valin, H., Waldhoff, S., Weindl, I., Wise, M., Kriegler, E., Lotze-Campen, H., Fricko, O., Riahi, K., and van Vuuren, D. P.: Land-use futures in the shared socio-economic pathways, Global Environ. Change, 42, 331–345, https://doi.org/10.1016/j.gloenvcha.2016.10.002, 2017.
Prestele, R., Alexander, P., Rounsevell, M., Arneth, A., Calvin, K., Doelman, J., Eitelberg, D., Engström, K., Fujimori, S., Hasegawa, T., Havlik, P., Humpenöder, F., Jain, A., Krisztin, T., Kyle, P., Meiyappan, P., Popp, A., Sands, R., Schaldach, R., Schüngel, J., Stehfest, E., Tabeau, A., and Van Meijl, H.: Hotspots of uncertainty in land-use and land-cover change projections: a global-scale model comparison, Global Change Biol., 22, 3967–3983, https://doi.org/10.1111/gcb.13337, 2016.
Pugh, T. A. M., Arneth, A., Olin, S., Ahlström, A., Bayer, A. D., Goldewijk, K. K., Lindeskog, M., and Schurgers, G.: Simulated carbon emissions from land-use change are substantially enhanced by accounting for agricultural management, Environ. Res. Lett., 10, 124008, https://doi.org/10.1088/1748-9326/10/12/124008, 2015.
Pugh, T. A. M., Müller, C., Elliott, J., Deryng, D., Folberth, C., Olin, S., Schmid, E., and Arneth, A.: Climate analogues suggest limited potential for intensification of production on current croplands under climate change, Nat. Commun., 7, 1–8, https://doi.org/10.1038/ncomms12608, 2016.
Pugh, T. A. M., Jones, C. D., Huntingford, C., Burton, C., Arneth, A., Brovkin, V., Ciais, P., Lomas, M., Robertson, E., Piao, S. L., and Sitch, S.: A Large Committed Long-Term Sink of Carbon due to Vegetation Dynamics, Earths Future, 6, 1413–1432, https://doi.org/10.1029/2018EF000935, 2018.
Pugh, T. A. M., Arneth, A., Kautz, M., Poulter, B., and Smith, B.: Important role of forest disturbances in the global biomass turnover and carbon sinks, Nat. Geosci., 12, 730–735, https://doi.org/10.1038/s41561-019-0427-2, 2019.
Qiao, Y., Zhang, H., Dong, B., Shi, C., Li, Y., Zhai, H., and Liu, M.: Effects of elevated CO2 concentration on growth and water use efficiency of winter wheat under two soil water regimes, Agr. Water Manage, 97, 1742–1748, https://doi.org/10.1016/j.agwat.2010.06.007, 2010.
Rabin, S. S., Alexander, P., Henry, R., Anthoni, P., Pugh, T. A. M., Rounsevell, M., and Arneth, A.: Impacts of future agricultural change on ecosystem service indicators, Earth Syst. Dynam., 11, 357–376, https://doi.org/10.5194/esd-11-357-2020, 2020.
Ramankutty, N., Evan, A. T., Monfreda, C., and Foley, J. A.: Farming the planet: 1. Geographic distribution of global agricultural lands in the year 2000, Global Biogeochem. Cy., 22, 1–19, 2008.
Reilly, J., Melillo, J., Cai, Y., Kicklighter, D., Gurgel, A., Paltsev, S., Cronin, T., Sokolov, A., and Schlosser, A.: Using Land To Mitigate Climate Change: Hitting the Target, Recognizing the Trade-offs, Environ. Sci. Technol., 46, 5672–5679, https://doi.org/10.1021/es2034729, 2012.
Salmon, J. M., Friedl, M. A., Frolking, S., Wisser, D., and Douglas, E. M.: Global rain-fed, irrigated, and paddy croplands: A new high resolution map derived from remote sensing, crop inventories and climate data, Int. J. Appl. Earth Obs., 38, 321–334, https://doi.org/10.1016/j.jag.2015.01.014, 2015.
Salvati, L., Sabbi, A., Smiraglia, D., and Zitti, M.: Does forest expansion mitigate the risk of desertification? Exploring soil degradation and land-use changes in a Mediterranean country, Int. For. Rev., 16, 485–496, https://doi.org/10.1505/146554814813484149, 2014.
Schaphoff, S., Lucht, W., Gerten, D., Sitch, S., Cramer, W., and Prentice, I. C.: Terrestrial biosphere carbon storage under alternative climate projections, Climatic Change, 74, 97–122, https://doi.org/10.1007/s10584-005-9002-5, 2006.
Schmitz, C., van Meijl, H., Kyle, P., Nelson, G. C., Fujimori, S., Gurgel, A., Havlik, P., Heyhoe, E., D'Croz, D. M., Popp, A., Sands, R., Tabeau, A., van der Mensbrugghe, D., von Lampe, M., Wise, M., Blanc, E., Hasegawa, T., Kavallari, A., and Valin, H.: Land-use change trajectories up to 2050: Insights from a global agro-economic model comparison, Agr. Econ., 45, 69–84, https://doi.org/10.1111/agec.12090, 2014.
Scholze, M., Knorr, W., Arnell, N. W., and Prentice, I. C.: A climate-change risk analysis for world ecosystems., P. Natl. Acad. Sci. USA, 103, 13116–13120, https://doi.org/10.1073/pnas.0601816103, 2006.
Schulp, Burkhard, B., Maes, J., Van Vliet, J., and Verburg, P. H.: Uncertainties in ecosystem service maps: A comparison on the European scale, PLoS One, 9, https://doi.org/10.1371/journal.pone.0109643, 2014.
Shin, Y.-J., Arneth, A., Chowdhury, R. R., Guy F. Midgley, Bukvareva, E., Heinimann, A., Horcea-Milcu, A. I., Kolb, M., Leadley, P., Oberdorff, T., Madruga, R. P., Rondinini, C., Saito, O., Sathyapalan, J., Boafo, Y. A., Kindlmann, P., Yue, T., Krenova, Z., and Osano, P.: Chapter 4, Plausible futures of nature, its contributions to people and their good quality of life, in: IPBES Global Assessment on Biodiversity and Ecosystem Services, Intergovernmental Science Policy Platform on Biodiversity and Ecosystem Services, Bonn, Germany, 264 pp., 2019.
Smith, B., Wårlind, D., Arneth, A., Hickler, T., Leadley, P., Siltberg, J., and Zaehle, S.: Implications of incorporating N cycling and N limitations on primary production in an individual-based dynamic vegetation model, Biogeosciences, 11, 2027–2054, https://doi.org/10.5194/bg-11-2027-2014, 2014.
Stehfest, E., Vuuren, D. van, Kram, T., and Bouwma, L.: Integrated Assessment of Global Environmental Change with IMAGE 3.0. Model description and policy applications, PBL Netherlands Environmental Assessment Agency, The Hague, the Netherlands, 2014.
Stehfest, E., van Zeist, W. J., Valin, H., Havlik, P., Popp, A., Kyle, P., Tabeau, A., Mason-D'Croz, D., Hasegawa, T., Bodirsky, B. L., Calvin, K., Doelman, J. C., Fujimori, S., Humpenöder, F., Lotze-Campen, H., van Meijl, H., and Wiebe, K.: Key determinants of global land-use projections, Nat. Commun., 10, 1–10, https://doi.org/10.1038/s41467-019-09945-w, 2019.
Stepanov, O., Câmara, G., and Verstegen, J. A.: Quantifying the Effect of Land Use Change Model Coupling, Land, 9, 52, https://doi.org/10.3390/land9020052, 2020.
Sterling, S. M., Ducharne, A., and Polcher, J.: The impact of global land-cover change on the terrestrial water cycle, Nat. Climatic Change, 3, 385–390, https://doi.org/10.1038/nclimate1690, 2013.
Strassburg, B. B. N., Beyer, H. L., Crouzeilles, R., Iribarrem, A., Barros, F., de Siqueira, M. F., Sánchez-Tapia, A., Balmford, A., Sansevero, J. B. B., Brancalion, P. H. S., Broadbent, E. N., Chazdon, R. L., Filho, A. O., Gardner, T. A., Gordon, A., Latawiec, A., Loyola, R., Metzger, J. P., Mills, M., Possingham, H. P., Rodrigues, R. R., Scaramuzza, C. A. de M., Scarano, F. R., Tambosi, L., and Uriarte, M.: Strategic approaches to restoring ecosystems can triple conservation gains and halve costs, Nature Ecology & Evolution, 3, 62–70, https://doi.org/10.1038/s41559-018-0743-8, 2019.
Sulser, T. B., Mason-D'Croz, D., Islam, S., Robinson, S., Wiebe, K., and Rosegrant, M. W.: Beyond a middle income Africa Transforming African economies for sustained growth with rising employment and incomes, ReSAKSS Annual trends and outlook report 2014, Food Policy Research Institute (IFPRI), Washington, DC, USA, 2015.
Taubert, F., Fischer, R., Groeneveld, J., Lehmann, S., Müller, M. S., Rödig, E., Wiegand, T., and Huth, A.: Global patterns of tropical forest fragmentation, Nature, 554, 519–522, https://doi.org/10.1038/nature25508, 2018.
van Asselen, S. and Verburg, P. H.: Land cover change or land-use intensification: simulating land system change with a global-scale land change model, Global Change Biol., 19, 3648–67, https://doi.org/10.1111/gcb.12331, 2013.
van Vliet, J., Bregt, A. K., Brown, D. G., van Delden, H., Heckbert, S., and Verburg, P. H.: A review of current calibration and validation practices in land-change modeling, Environ. Modell. Softw., 82, 174–182, https://doi.org/10.1016/j.envsoft.2016.04.017, 2016.
van Vuuren, D. P., Kriegler, E., O'Neill, B. C., Ebi, K. L., Riahi, K., Carter, T. R., Edmonds, J., Hallegatte, S., Kram, T., Mathur, R., and Winkler, H.: A new scenario framework for Climate Change Research: Scenario matrix architecture, Climatic Change, 122, 373–386, https://doi.org/10.1007/s10584-013-0906-1, 2014.
Verburg, P. H., Neumann, K., and Nol, L.: Challenges in using land use and land cover data for global change studies, Global Change Biol., 17, 974–989, https://doi.org/10.1111/j.1365-2486.2010.02307.x, 2011.
Von Lampe, M., Willenbockel, D., Ahammad, H., Blanc, E., Cai, Y., Calvin, K., Fujimori, S., Hasegawa, T., Havlik, P., Heyhoe, E., Kyle, P., Lotze-Campen, H., Mason d'Croz, D., Nelson, G. C., Sands, R. D., Schmitz, C., Tabeau, A., Valin, H., van der Mensbrugghe, D., and van Meijl, H.: Why do global long-term scenarios for agriculture differ? An overview of the AgMIP global economic model intercomparison, Agr. Econ., 45, 3–20, https://doi.org/10.1111/agec.12086, 2014.
Wang, X., Biewald, A., Dietrich, J. P., Schmitz, C., Lotze-Campen, H., Humpenöder, F., Bodirsky, B. L., and Popp, A.: Taking account of governance: Implications for land-use dynamics, food prices, and trade patterns, Ecol. Econ., 122, 12–24, https://doi.org/10.1016/j.ecolecon.2015.11.018, 2016.
Wårlind, D., Smith, B., Hickler, T., and Arneth, A.: Nitrogen feedbacks increase future terrestrial ecosystem carbon uptake in an individual-based dynamic vegetation model, Biogeosciences, 11, 6131–6146, https://doi.org/10.5194/bg-11-6131-2014, 2014.
Warszawski, L., Frieler, K., Huber, V., Piontek, F., Serdeczny, O., and Schewe, J.: The Inter-Sectoral Impact Model Intercomparison Project (ISI–MIP): Project framework, P. Natl. Acad. Sci. USA, 111, 3228–3232, https://doi.org/10.1073/pnas.1312330110, 2014.
Winkler, K., Fuchs, R., Rounsevell, M., and Herold, M.: Global land use changes are four times greater than previously assumed, Nat. Commun., in review, 2021.