the Creative Commons Attribution 4.0 License.
the Creative Commons Attribution 4.0 License.
 | 17 Dec 2019
Improvement in the decadal prediction skill of the North Atlantic extratropical winter circulation through increased model resolution
Mareike Schuster
Jens Grieger
Andy Richling
Thomas Schartner
Sebastian Illing
Christopher Kadow
Wolfgang A. Müller
Holger Pohlmann
Stephan Pfahl
Uwe Ulbrich
In this study the latest version of the MiKlip decadal hindcast system is analyzed, and the effect of an increased horizontal and vertical resolution on the prediction skill of the extratropical winter circulation is assessed. Four different metrics – the storm track, blocking, cyclone and windstorm frequencies – are analyzed in the North Atlantic and European region. The model bias and the deterministic decadal hindcast skill are evaluated in ensembles of five members in a lower-resolution version (LR, atm: T63L47, ocean: 1.5∘ L40) and a higher-resolution version (HR, atm: T127L95, ocean: 0.4∘ L40) of the MiKlip system based on the Max Planck Institute Earth System model (MPI-ESM). The skill is assessed for the lead winters 2–5 in terms of the anomaly correlation of the quantities' winter averages using initializations between 1978 and 2012. The deterministic predictions are considered skillful if the anomaly correlation is positive and statistically significant. While the LR version shows common shortcomings of lower-resolution climate models, e.g., a storm track that is too zonal and southward displaced as well as a negative bias of blocking frequencies over the eastern North Atlantic and Europe, the HR version counteracts these biases. Cyclones, i.e., their frequencies and characteristics like strength and lifetime, are particularly better represented in HR. As a result, a chain of significantly improved decadal prediction skill between all four metrics is found with the increase in the spatial resolution. While the skill of the storm track is significantly improved primarily over the main source region of synoptic activity – the North Atlantic Current – the other extratropical quantities experience a significant improvement primarily downstream thereof, i.e., in regions where the synoptic systems typically intensify. Thus, the skill of the cyclone frequencies is significantly improved over the central North Atlantic and northern Europe, the skill of the blocking frequencies is significantly improved over the Mediterranean, Scandinavia and eastern Europe, and the skill of the windstorms is significantly improved over Newfoundland and central Europe. Not only is the skill improved with the increase in resolution, but the HR system itself also exhibits significant skill over large areas of the North Atlantic and European sector for all four circulation metrics. These results are particularly promising regarding the high socioeconomic impact of European winter windstorms and blocking situations.
- Article
(7565 KB) - Full-text XML
-
Supplement
(10071 KB) - BibTeX
- EndNote


The extratropical circulation plays an important role for the redistribution of energy in the atmosphere. The prevailing westerlies and the embedded cyclones and anticyclones determine the weather and climate of the midlatitudes, assisting in balancing temperature and humidity contrasts between tropical and polar regions. Natural climate variability as well as externally forced climate change determine fluctuations in the circulation and thus in the frequency of extremes, such as strong cyclones, intense windstorms or phases of blocked flow. The consequences of such features include extremes in temperature, precipitation or drought, and wind speed, often accompanied by immense damage (e.g., Leckebusch and Ulbrich, 2004; Ulbrich et al., 2009; Sillmann and Croci-Maspoli, 2009; Pfahl and Wernli, 2012; DeutscheRück, 2018). Therefore, the societal demand for reliable near-term climate predictions of such features – also to support political, economical and administrative decision-making – is perpetually growing.
Decadal climate prediction is an active research field in the climate sciences. Different research groups around the globe aim at the development of skillful prediction systems (Boer et al., 2016). Retrospective forecasts, termed hindcasts, are used to assess the ability of the model systems to predict climate variability on interannual to decadal timescales. Initialized from observation-based data and run for a period of 10–30 years, decadal climate predictions combine forecast elements from weather and seasonal forecast divisions (initial conditions) as well as from long-term climate projections (boundary conditions). To date, different designs of decadal prediction systems are prevalent. They either consist of a multi-member single-model suite, such as the UK Met Office's Decadal Prediction System, DePreSys (Smith et al., 2007), and the German Mittelfristige Klimaprognosen (MiKlip) system (Marotzke et al., 2016), or they are based upon a multi-model suite, as used, e.g., within the 5th Coupled Model Intercomparison Project (CMIP5; Taylor et al., 2012). Several multi-model studies, using the CMIP5 decadal prediction suite, come to the conclusion that there is significant prediction skill on decadal timescales (e.g., Kim et al., 2012; Doblas-Reyes et al., 2013; Meehl et al., 2014). Results from these studies have also been included in the Fifth Assessment Report (AR5) of the Intergovernmental Panel on Climate Change (IPCC; Kirtman et al., 2013). Currently, in preparation for the Sixth Assessment Report (AR6) of the IPCC and CMIP6, improved decadal prediction systems are being developed (Eyring et al., 2016; Boer et al., 2016; Kushnir et al., 2019).
With respect to atmospheric quantities, various versions of the MiKlip system based on the Max Planck Institute Earth System model (MPI-ESM) show decadal prediction skill mainly in terms of global and regional temperature indices (Müller et al., 2012; Pohlmann et al., 2013; Kröger et al., 2017). The skill for precipitation, however, due to its complex and partly small-scale nature is regionally confined and prevalently limited to lead year 1 (Kadow et al., 2016). The results of practical relevance within MiKlip show, on the one hand, skill for the prediction of 10 m wind speed and wind energy over central Europe, which exists irrespective of the ocean initialization technique (Moemken et al., 2016), and, on the other hand, skill for the prediction of wind speeds of different quantiles upward from 75 % (Haas et al., 2016).
Kruschke et al. (2014) and Kruschke et al. (2016) analyzed the forecast skill of Northern Hemisphere cyclone and windstorm frequencies in the MiKlip system, respectively. They found probabilistic decadal forecast skill for cyclone frequencies in some areas over the Northern Hemisphere ocean basins, mainly the North Sea and the central Pacific, whereupon the subsample of strong cyclones exhibits generally higher skill than the complete sample of all cyclones (Kruschke et al., 2014). Using a parametric bias adjustment approach, Kruschke et al. (2016) found windstorm frequencies for winters 2–5 and winters 2–9 to be skillful over large parts of the Northern Hemisphere when compared against climatological forecasts. Another study using the MPI-ESM decadal prediction system demonstrated that the decadal prediction skill for surface temperature and cyclone frequencies can be significantly improved by replacing each ensemble member's ocean state with the ensemble mean ocean state at regular intervals during the forecast period (Kadow et al., 2017). More studies using the MPI-ESM hindcasts are collected in a special issue of the Meteorologische Zeitschrift about the validation of the MiKlip system in its first phase (Kaspar et al., 2016).
It is well known that a coarse spatial resolution of global coupled climate models hinders the proper representation of sub-synoptic-scale systems and thus the climate mean state and variability. For example, with respect to the North Atlantic and European domain, many lower-resolution climate models exhibit a cold sea surface temperature (SST) bias south of Greenland due to a displacement of the North Atlantic Current or an overturning circulation that is too weak (Park et al., 2016; Scaife et al., 2011; Wang et al., 2014). This common bias in the North Atlantic Current is associated with a storm track that is too zonal, stronger geopotential height gradients in the midlatitudes, increased westerlies and reduced blocking frequencies over Europe (e.g., Scaife et al., 2011). It has been found in many studies that the atmospheric dynamics benefit not only from a coupling of the atmosphere and ocean but also from an increased model resolution (e.g., Shaffrey et al., 2009; Jung et al., 2012; Dawson et al., 2013; Hewitt et al., 2016). Scaife et al. (2011), for example, demonstrated that the increase in resolution in both the atmospheric and oceanic model components results in a chain of improvements, as they found a reduced SST bias in the higher-resolution model that in turn leads to a better representation of westerly winds and blocking frequencies. Similar effects can also be found in atmosphere-only models, e.g., for the blocking frequency bias in Davini et al. (2017).
With an atmospheric resolution of T63L47 (about 1.875∘ horizontal grid spacing) and an oceanic resolution of 1.5∘L40 the MPI-ESM-LR decadal prediction system applied in the first phase of MiKlip has a rather moderate spatial resolution. Meanwhile, studies using higher-resolution forecast systems are available, for instance Monerie et al. (2017) using 0.5∘ grid spacing in the atmosphere and 0.25∘ in the ocean and Robson et al. (2018) using ∼0.9∘ in the atmosphere and 0.25∘ in the ocean. They focus on oceanic parameters and find skill, e.g., for SSTs, sea ice extent and ocean heat content, respectively. However, systematic analyses of the actual effect of the increase in resolution on the hindcast performance on the decadal scale are rare. Pohlmann et al. (2013) found for the hindcasts of mixed resolution (MPI-ESM-MR) that an increase in vertical (atmosphere: T63L95) and horizontal resolution (ocean: 0.4∘L40) compared to MPI-ESM-LR improves the tropical Pacific surface temperature predictions in the lead years 2–5 and leads to a good representation of the quasi-biennial oscillation (QBO), which remains in alignment with observations well beyond the first 12 months after initialization. Apart from that, the mixed resolution shows only modest benefit for the hindcast skill (Marotzke et al., 2016).
In this study, for the first time an analysis of the direct impact of the model resolution on the skill of decadal climate predictions of dynamical variables is performed under otherwise unchanged model settings (parametrization and initialization). We evaluate the MiKlip hindcasts performed with the latest version of the Max Planck Institute Earth System Model with higher resolution (MPI-ESM-HR; Müller et al., 2018), which will contribute to CMIP6, and compare its decadal forecast skill to that of a previous lower-resolution version (MPI-ESM-LR). While many studies analyzing the skill of decadal forecast systems tend to focus on basic atmospheric variables such as the surface temperature and precipitation (e.g., Smith et al., 2007; Keenlyside et al., 2008; Goddard et al., 2013; Kadow et al., 2016; Monerie et al., 2018; Xin et al., 2018), we emphasize the role of dynamical processes and therefore analyze a set of quantities representing the extratropical winter dynamics: the storm track, blocking, cyclones and windstorms.
We introduce the MPI-ESM prediction system as well as the skill measure used to assess the hindcast quality in Sect. 2.1. In Sect. 2.2 we describe the different circulation quantities in detail and present their climatology in the ERA-Interim reanalysis with a focus on the North Atlantic and European region. The model climatologies and biases are discussed in Sect. 3.1, and the prediction skill of the winter circulation is evaluated in Sect. 3.2. In Sect. 4 we discuss and relate our findings to other studies before concluding with our results in Sect. 5.
The extratropical circulation in the Northern Hemisphere is most active during the winter season, with a stronger jet stream in the upper troposphere and numerous strong cyclones developing in the midlatitude baroclinic areas, favored by strong horizontal temperature contrasts resulting from relatively warm ocean currents near the surface and cold polar air masses. Storms that strike the European continent at this time of the year are often powerful and damaging. We will therefore focus on the winter circulation and evaluate averages of the storm track and blocking, cyclone, and windstorm frequencies from October through March. The storm track describes the variability of baroclinic waves on synoptic timescales in the extratropics. These baroclinic waves are a combination of two contributing components, i.e., anti-cyclonic and cyclonic anomalies, which we will analyze in terms of blocking frequencies on the one hand and extratropical cyclone and windstorm frequencies on the other hand.
To assess the model bias and to compute the prediction skill of the different diagnostics in the decadal hindcasts, a reference (i.e., observational) dataset is needed. However, there is no gridded observational dataset for the metrics of interest. Instead we make use of a reanalysis product and derive the circulation quantities for the winters 1979/80 to 2016/17 from the ERA-Interim reanalysis (Dee et al., 2011), created by the European Centre for Medium-Range Weather Forecasts (ECMWF), with a horizontal resolution of T255 (∼0.75∘) on 60 levels and a top of the atmosphere at 0.1 hPa.
2.1 Forecast system and skill measures
The two decadal forecast systems that we compare are both based on the Earth System Model of the Max Planck Institute for Meteorology (MPI-ESM) version 1.2, which is a coupled atmosphere–ocean model and consists of the atmospheric component ECHAM6.3 and the oceanic component MPI-OM1.6.2. The lower resolution of MiKlip's pre-operational decadal prediction system (MPI-ESM-LR, termed LR hereafter) has an atmospheric horizontal resolution of T63 (1.875∘) and 47 levels, with the top of the atmosphere at 0.01 hPa (Mauritsen et al., 2019). The ocean component is run with 1.5∘ L40. A general skill assessment of decadal predictions performed with the LR system can be found in Polkova et al. (2019). The higher-resolution version (MPI-ESM-HR, termed HR hereafter) uses T127 (0.9375∘), 95 vertical levels for the atmosphere and 0.4∘ L40 for the ocean (Müller et al., 2018). The HR version therefore has a finer grid in both the atmosphere and the ocean components. For this analysis, both systems use the CMIP5 external forcing with respect to greenhouse gases and aerosols (for details see Giorgetta et al., 2013). Both systems are full-field-initialized in the atmosphere using ERA-40 (Uppala et al., 2005) and ERA-Interim (Dee et al., 2011) as well as anomaly-initialized in the ocean using ORA-S4 (Balmaseda et al., 2013) and sea ice concentration from the National Snow and Ice Data Center (NSIDC). The initialization procedure is identical to the one used for MiKlip's Baseline1 system and is described in more detail in Pohlmann et al. (2013). The LR system consists in total of 10 ensemble members, initialized annually between 1960 and 2016, with each initialization covering 1 decade. The integration period for each of the initializations spans 10 years. However, since the HR system – with an otherwise identical hindcast setup – consists of only five members and to guarantee a fair comparison between the two forecast systems, we only evaluate the first five members of LR as well.
To derive the deterministic skill of the two forecast systems, we focus on the temporal variability and analyze the anomaly correlation for the winters 2–5 (October–March), following the Decadal Climate Prediction Project (DCPP; Boer et al., 2016) protocol. That means that we calculate lead-time-dependent anomalies of the circulation measures. This is a simple and robust approach to account for a possible lead-time-dependent mean bias, i.e., drift. Thus, for each of the initialization experiments (1978, 1979, etc.) the ensemble average (five members) of the temporal mean of the four contained lead winters is calculated per grid point. This forms a new ensemble mean time series of the lead winters 2–5. This time series serves to calculate the climatology (temporal mean) as well as the respective anomaly time series. The time series of those anomalies of the hindcasts is then correlated (Pearson) to the time series of anomalies of the reanalysis. In decadal prediction studies, this procedure is usually repeated for each lead time, e.g.. lead year 1, lead year 2–5, lead year 6–9 – it is therefore referred to as lead-time-dependent anomaly correlation. In our study we only show results for one lead time: lead winters 2–5. The initialization of the hindcasts takes place in October; this means the first full winter that we analyze is the second winter, i.e., the months 12–17 (October–March) after initialization. This evaluation procedure is part of the decadal climate prediction evaluation software that was designed within the MiKlip project (Illing et al., 2014) and is applied for this study. This open-source evaluation software follows the evaluation framework of Goddard et al. (2013), which led to the DCPP requirements.
To match the period covered by the ERA-Interim reanalysis, we do not use the full set of initializations but instead use the decadal hindcast experiments that are initialized between 1978 (winter 2: 1979/80, winter 5: 1982/83) and 2012 (winter 2: 2013/14, winter 5: 2016/17) in LR and HR. In total we therefore analyze 700 October-to-March winter seasons (5 members ×35 initializations ×4 lead winters) per forecast system. The skill of each of the forecast systems (LR, HR) is first evaluated against the reanalysis data; i.e., the anomaly correlation between the respective hindcast and ERA-Interim is determined. Then, the two systems are compared against each other; i.e., the difference of the aforementioned correlations between the two forecast systems is computed. To determine the significance of the correlation (95 % significance level), the time series of reanalysis–hindcast pairs is resampled with replacement 1000 times (block bootstrap taking auto-correlation into account), following Goddard et al. (2013).
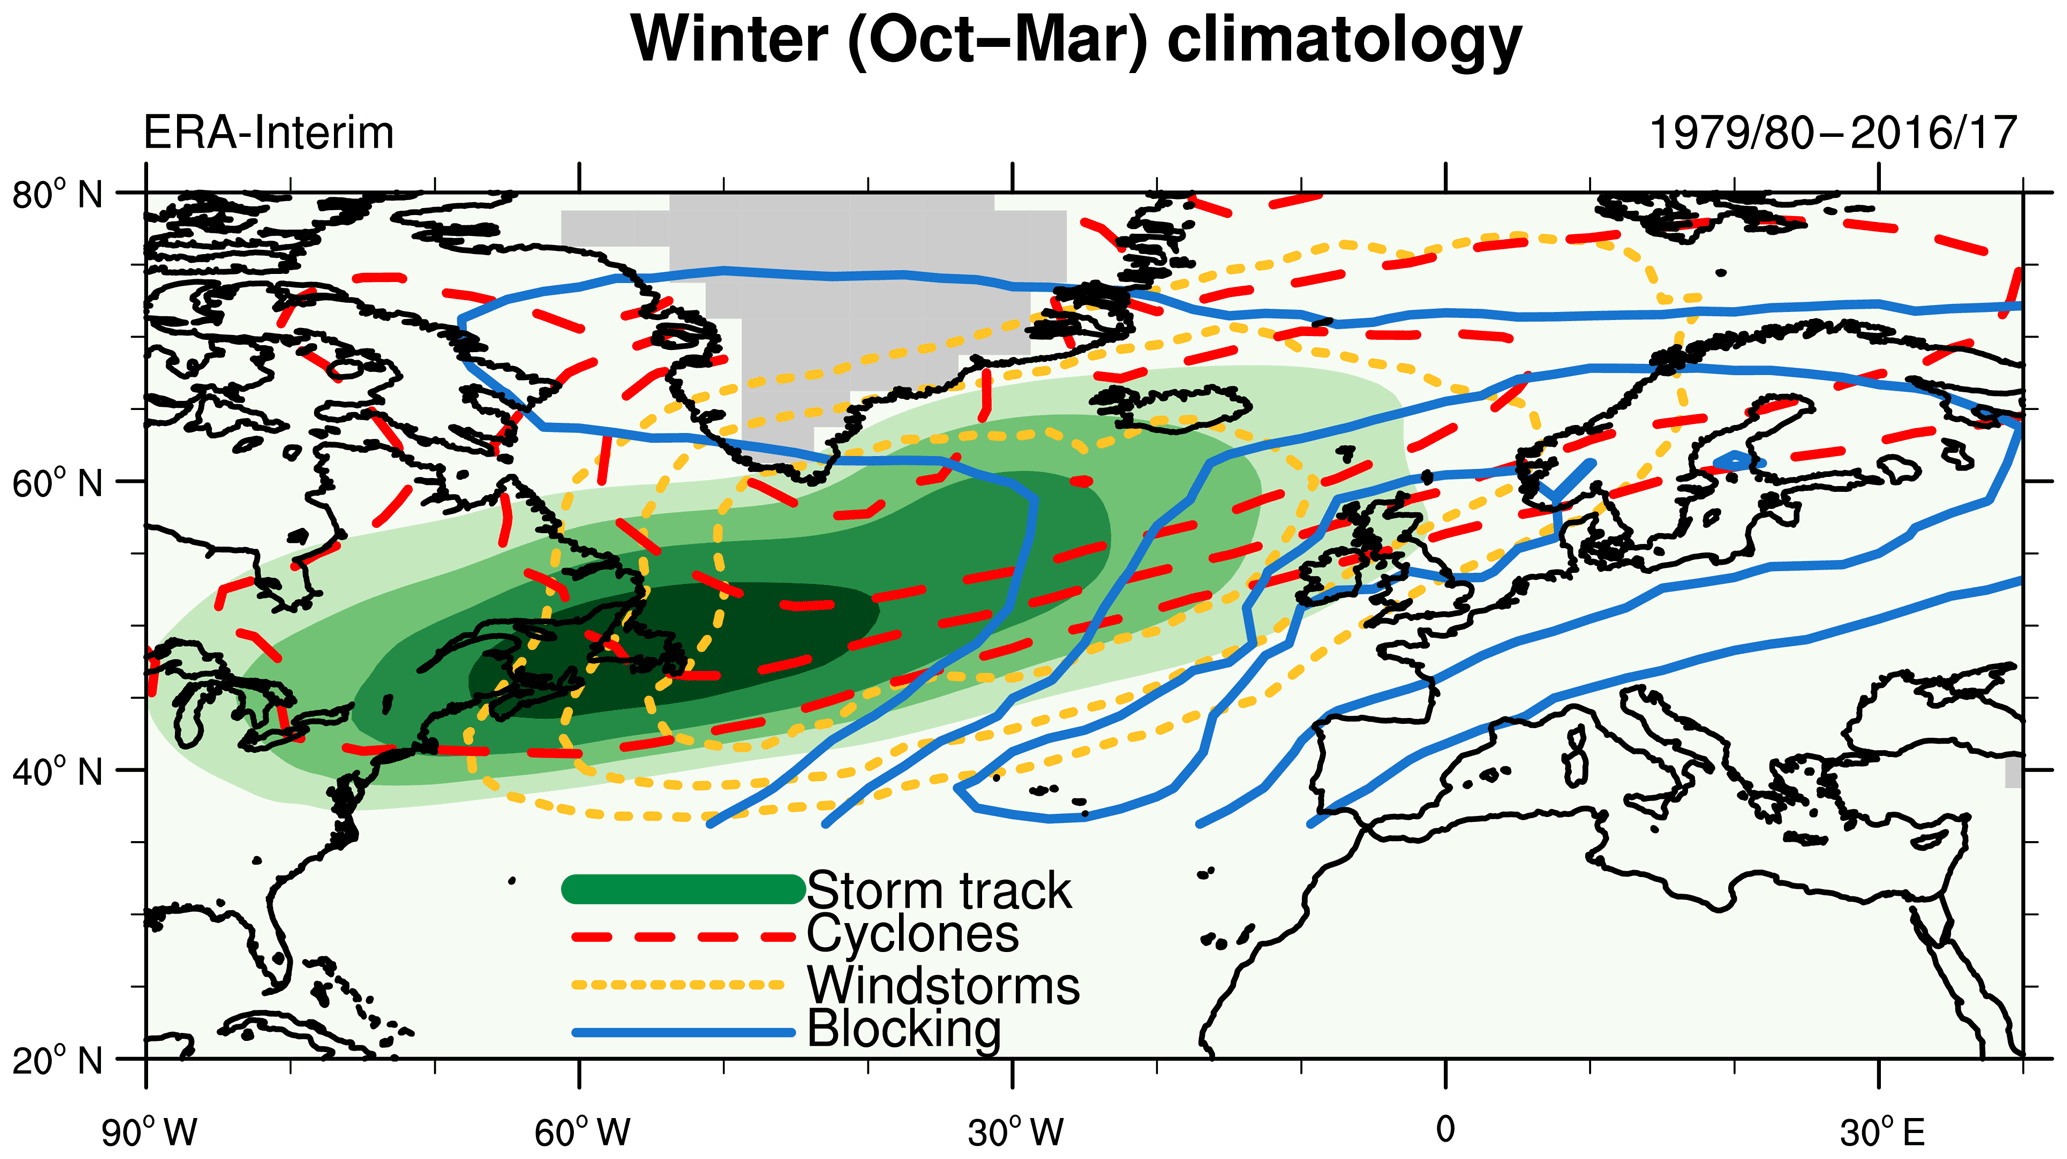
Figure 1Climatology of the winter average (October–March) of different circulation quantities in the ERA-Interim reanalysis for the period 1979/80 to 2016/17. The storm track, i.e., the standard deviation of the 500 hPa geopotential height anomaly, is shown in meters (45–60 by 5). The fraction of blocked days is shown in percent (4–8 by 2). The cyclone frequency (120–180 by 20) and windstorm frequency (25–30 by 2.5) are shown in number of tracks within a radius of 1000 km. Grey masked areas denote grid points with an orography larger than 1500 m, which have been omitted for cyclone identification.
2.2 Circulation metrics
2.2.1 Storm track
The extratropical storm track is derived from the band-pass-filtered variability of the geopotential height at 500 hPa in the window of 2.5 to 6 d, an Eulerian approach following Blackmon et al. (1976). Its long-term winter average (October through March) is displayed in Fig. 1 for the North Atlantic and European region and the period 1979/80 to 2016/17 based on the ERA-Interim reanalysis. The North Atlantic storm track is visible in green shades, with its maximum of 60 m located over the western North Atlantic and Newfoundland and a typical northeastward tilt.
2.2.2 Blocking
For atmospheric blocking a slightly modified version of the two-dimensional blocking index of Scherrer et al. (2006), based on gradients in the daily 500 hPa geopotential height field, is used to identify instantaneously blocked grid points. In contrast to Scherrer et al. (2006), wherein a blocking area is defined between the blocking high and the associated low, here the position of detected blocked grid points is shifted north by 7.5∘ to correspond better to the anticyclonic part of a blocking situation. To account for large-scale and persistent blocking anticyclones between 35 and 80∘ N, an adapted tracking algorithm for blocking regimes, similar to the approach by Barnes et al. (2012), is applied. With this tracking method, we only select contiguously blocked regions with a minimum zonal and meridional extension of ∼15∘ and an area of at least 1.5×10⁶ km2 lasting for a minimum of 4 d. A possible shifting, merging and splitting of blocking areas in time is considered by adopting a blocking overlap area criterion of 750.000 km2 between two consecutive days and a maximum distance between blocking centers of 1000 km. The climatology of the mean winter blocking frequency is displayed with blue isolines in Fig. 1. Its maximum of 8 % blocked days stretches from the Azores to Scotland. A second region of increased blocking frequencies is found between Greenland and Iceland.
2.2.3 Cyclones
To identify and track extratropical cyclones we apply an objective Lagrangian feature tracking algorithm, developed by Murray and Simmonds (1991), to 6-hourly values of the mean sea level pressure. Maxima of the Laplacian of the mean sea level pressure are identified and, if a minimum in the pressure field itself can(not) be detected in the vicinity, a closed (open) cyclone is identified. The system is then tracked in time at 6-hourly time steps. Only cyclones that live for more than 24 h, reach a Laplacian of pressure larger than 0.7 hPa ∕ (degree latitude)2 and have closed isobars at least once during their lifetime are selected for evaluation. The measure we ultimately use for our evaluation is the cyclone frequency, i.e., the number of cyclone tracks that pass within a radius of 1000 km of the respective grid point on a grid. As the extrapolation of pressure to sea level can be erroneous over high terrain, cyclones are not identified at grid points at which the orography is higher than 1500 m. The winter average of the cyclone frequency is displayed in Fig. 1 in red dashed contours. Its maximum is located at the southern tip of Greenland, with 180 cyclones, and a band of enhanced cyclone frequencies is located downstream of the storm track maximum with a similar southwest–northeast tilt.
2.2.4 Windstorms
Yet another objective Lagrangian tracking scheme is used to derive the frequency of extratropical windstorms (Leckebusch et al., 2008; Kruschke, 2014). This method is based on the exceedance of the local 98th percentile of the near-surface wind speed to define contiguous fields of strong wind. Percentiles are calculated for each model simulation (LR, HR) and the reanalysis individually using 6-hourly data for the whole year between 1981 and 2010. For the hindcasts the percentiles of the uninitialized counterparts are used as done by Kruschke et al. (2016). Windstorms are identified if the area of wind exceedance above the percentile is larger than 150.000 km2 and if the feature is trackable for at least 18 h. Tracking is done by means of a nearest-neighbor approach. The individual windstorm tracks are further used to calculate windstorm frequencies, which are computed identically to those of the cyclone frequencies. The yellow dotted contours in Fig. 1 represent the average winter windstorm frequency. Its maximum of 30 windstorms is also located downstream of the storm track maximum but slightly shifted southward compared to the cyclone frequencies. This illustrates that the corresponding windstorm field is usually located to the south of the cyclone center, where the pressure gradients and thus geostrophic wind velocities are typically largest.
The software routines that were used to compute all the extratropical circulation quantities, as well as the evaluation procedure, were implemented as separate plug-ins into the MiKlip Central Evaluation System (https://www-miklip.dkrz.de, last access: 9 December 2019) – based on the Free Evaluation System Framework (Freva; Kadow et al., 2019) – by their developers and the authors of this paper. The single plug-ins and their documentation can be found under https://www-miklip.dkrz.de/plugins, last access: 9 December 2019, plus the respective suffixes /stormtrack/detail/ (storm track), /blocking_2d/detail/ (blocking), /zykpak/detail/ (cyclones), /wtrack/detail/ (windstorms) and /murcss/detail/ (skill analysis).
3.1 Model bias
Before we analyze the decadal prediction skill, we will first evaluate the ensemble mean climatology and bias in order to assess the model's capability to represent the four atmospheric circulation features. For this, we only take into account those seasons that will be used for the skill analysis, i.e., the winters 2–5 of each of the 35 initializations (1978–2012) and 2×5 members (LR, HR). To compute the model bias, we consider the entire reanalysis dataset, i.e., winters from 1979/80 to 2016/17.
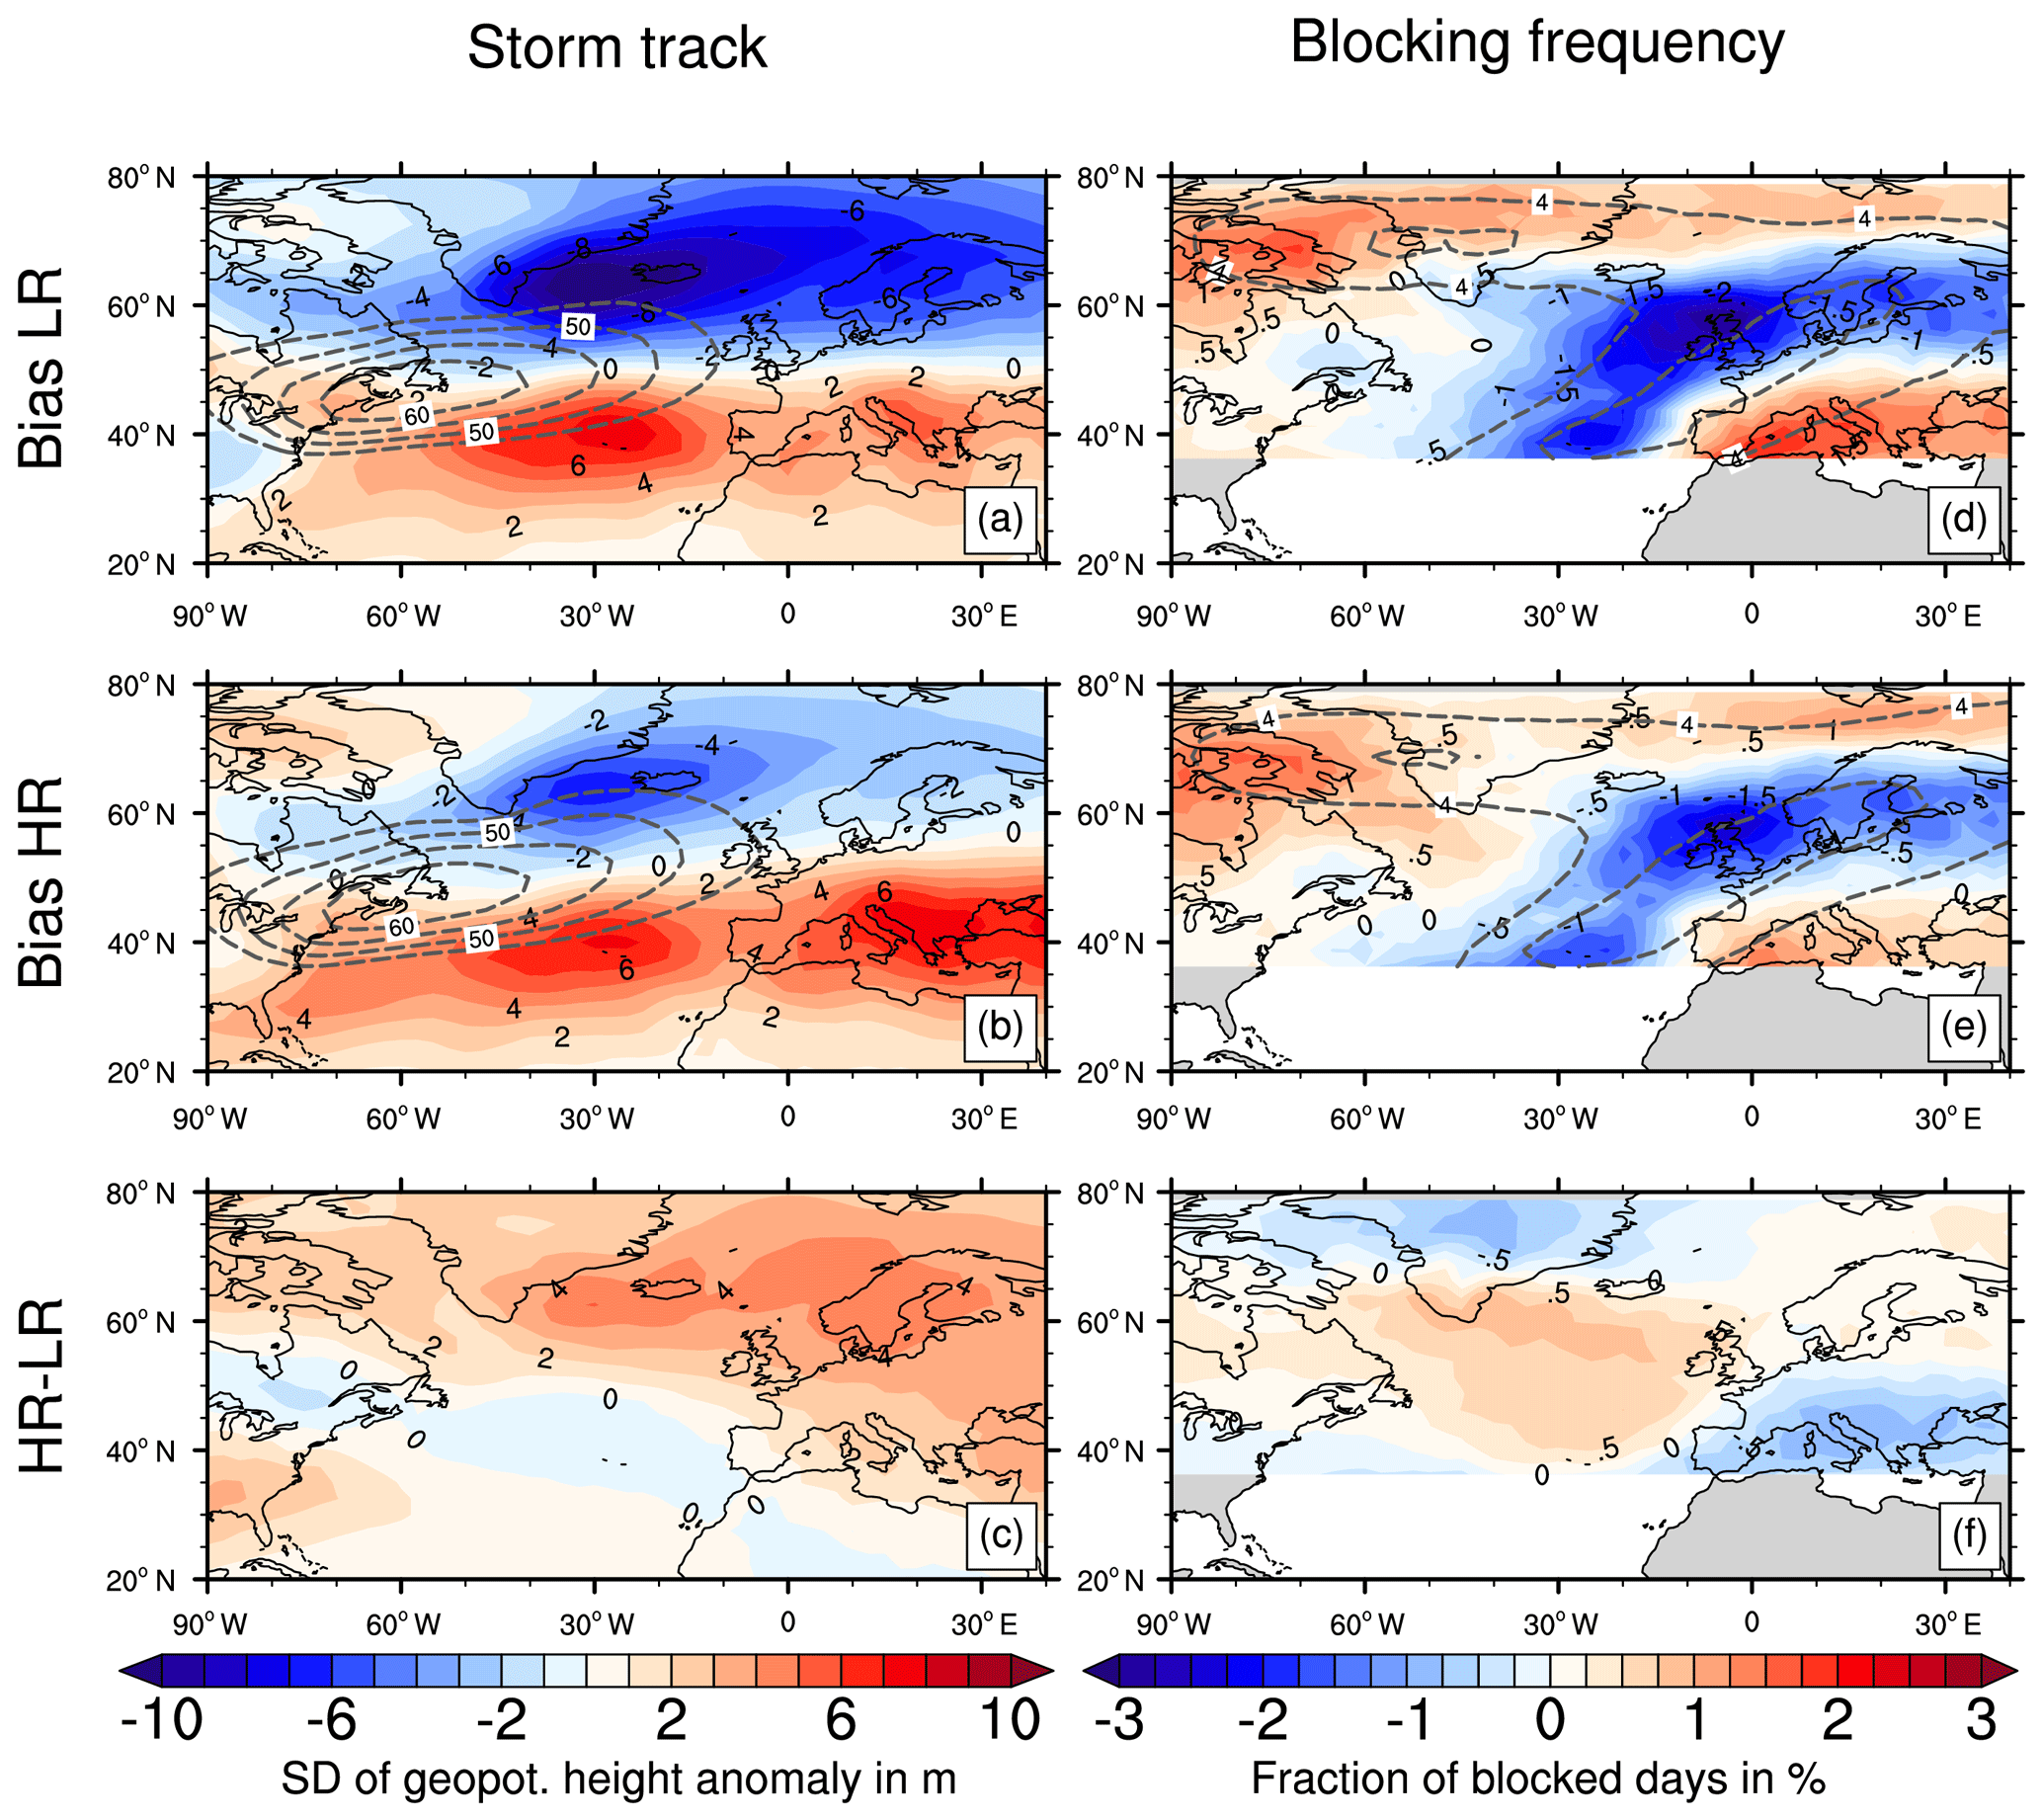
Figure 2Ensemble mean model bias relative to ERA-Interim (shading) and model climatology (dashed contours) of the respective circulation quantity in LR (a, d), HR (b, e), and the difference between HR and LR (c, f). The circulation quantities displayed are the storm track (a–c) and the blocking frequency (d–f). Initializations from the period 1978–2012 are used for five members of each LR and HR, and the ensemble mean is computed from lead time averages over the hindcast winters 2–5 (October–March). In ERA-Interim the winters between 1979/80 and 2016/17 are used. The grey contours, i.e., ensemble mean climatology, have the same levels as in Fig. 1: 45–60 by 5 m for the storm track and 4–8 by 2 % for the blocking frequency.
In Fig. 2 the model bias for the storm track and blocking frequency compared to ERA-Interim is displayed in colored shades, and the respective model climatology is shown in grey contours for both the LR and HR ensemble mean. The grey contour levels are the same as for the ERA-Interim climatology in Fig. 1. The LR system shows the typical North Atlantic storm track along 45∘ N but with a maximum over the western part of the basin rather zonally aligned and shifted southward (Fig. 2a). Since the observed storm track is tilted from the southwest to the northeast (see Fig. 1), this results in a negative bias (−10 m) at higher latitudes and a positive bias (+8 m) at lower latitudes in the LR prediction system. This bias can partly be corrected with the increase in the model resolution, as the HR system increases the storm track activity where there is a negative bias in LR and vice versa (Fig. 2c); however, this effect is strongest at the northern side of the storm track, as also seen in Müller et al. (2018). In HR the North Atlantic storm track is more tilted and therefore closer to observations (Fig. 2b). Not only does it extend further north in the higher-resolution system, but it also extends further downstream towards central and eastern Europe and therefore reduces the negative bias over the North Sea and Scandinavia that is present in LR. The bias in HR is reduced at both the northern and southern flanks of the Atlantic storm track; however, the southward shift over the central North Atlantic is still present (−7 and +7 m).
The blocking frequency shows a negative bias of the fraction of blocked days per winter (−3 %) in the LR system just north of its climatological maximum, i.e., over a band stretching from the central North Atlantic and Great Britain towards the Baltic Sea, and a positive bias (+1.5 %) over the Mediterranean (Fig. 2d). Figure 2f illustrates that again the HR prediction system counters these shortcomings of the LR system and reduces the bias in the right places, but the effect is rather marginal for this quantity. Though weaker, the bias of the blocking frequency in HR is still considerable (−2.5 % and +1 %, respectively). These findings are in line with the analysis of blocking in Müller et al. (2018).
The climatology of the cyclone frequency, with its maximum at the southern tip of Greenland as seen in Fig. 1, is also visible in LR (Fig. 3a). In contrast to the storm track and blocking frequency, the cyclone frequency in LR does not exhibit a clear southward shift compared to the reanalysis. Instead, in the low-resolution system there are overall far too many cyclones present between 30 and 70∘ N, especially over the central North Atlantic where a positive bias of up to +80 cyclones is found. Most impressively amongst all variables, this bias of the cyclone frequency is radically reduced and almost completely absent in the HR system (Fig. 3b). The numbers are reduced to a bias of −10 cyclones over the western North Atlantic and +10 cyclones over Europe. The increase in horizontal and vertical resolution evidently eliminates many cyclone tracks in the MPI-ESM (Fig. 3c) over the entire North Atlantic domain and adjacent continents. This effect is further discussed in Sect. 4. This results in cyclone climatologies very close to those in ERA-Interim in HR (Fig. 3b).
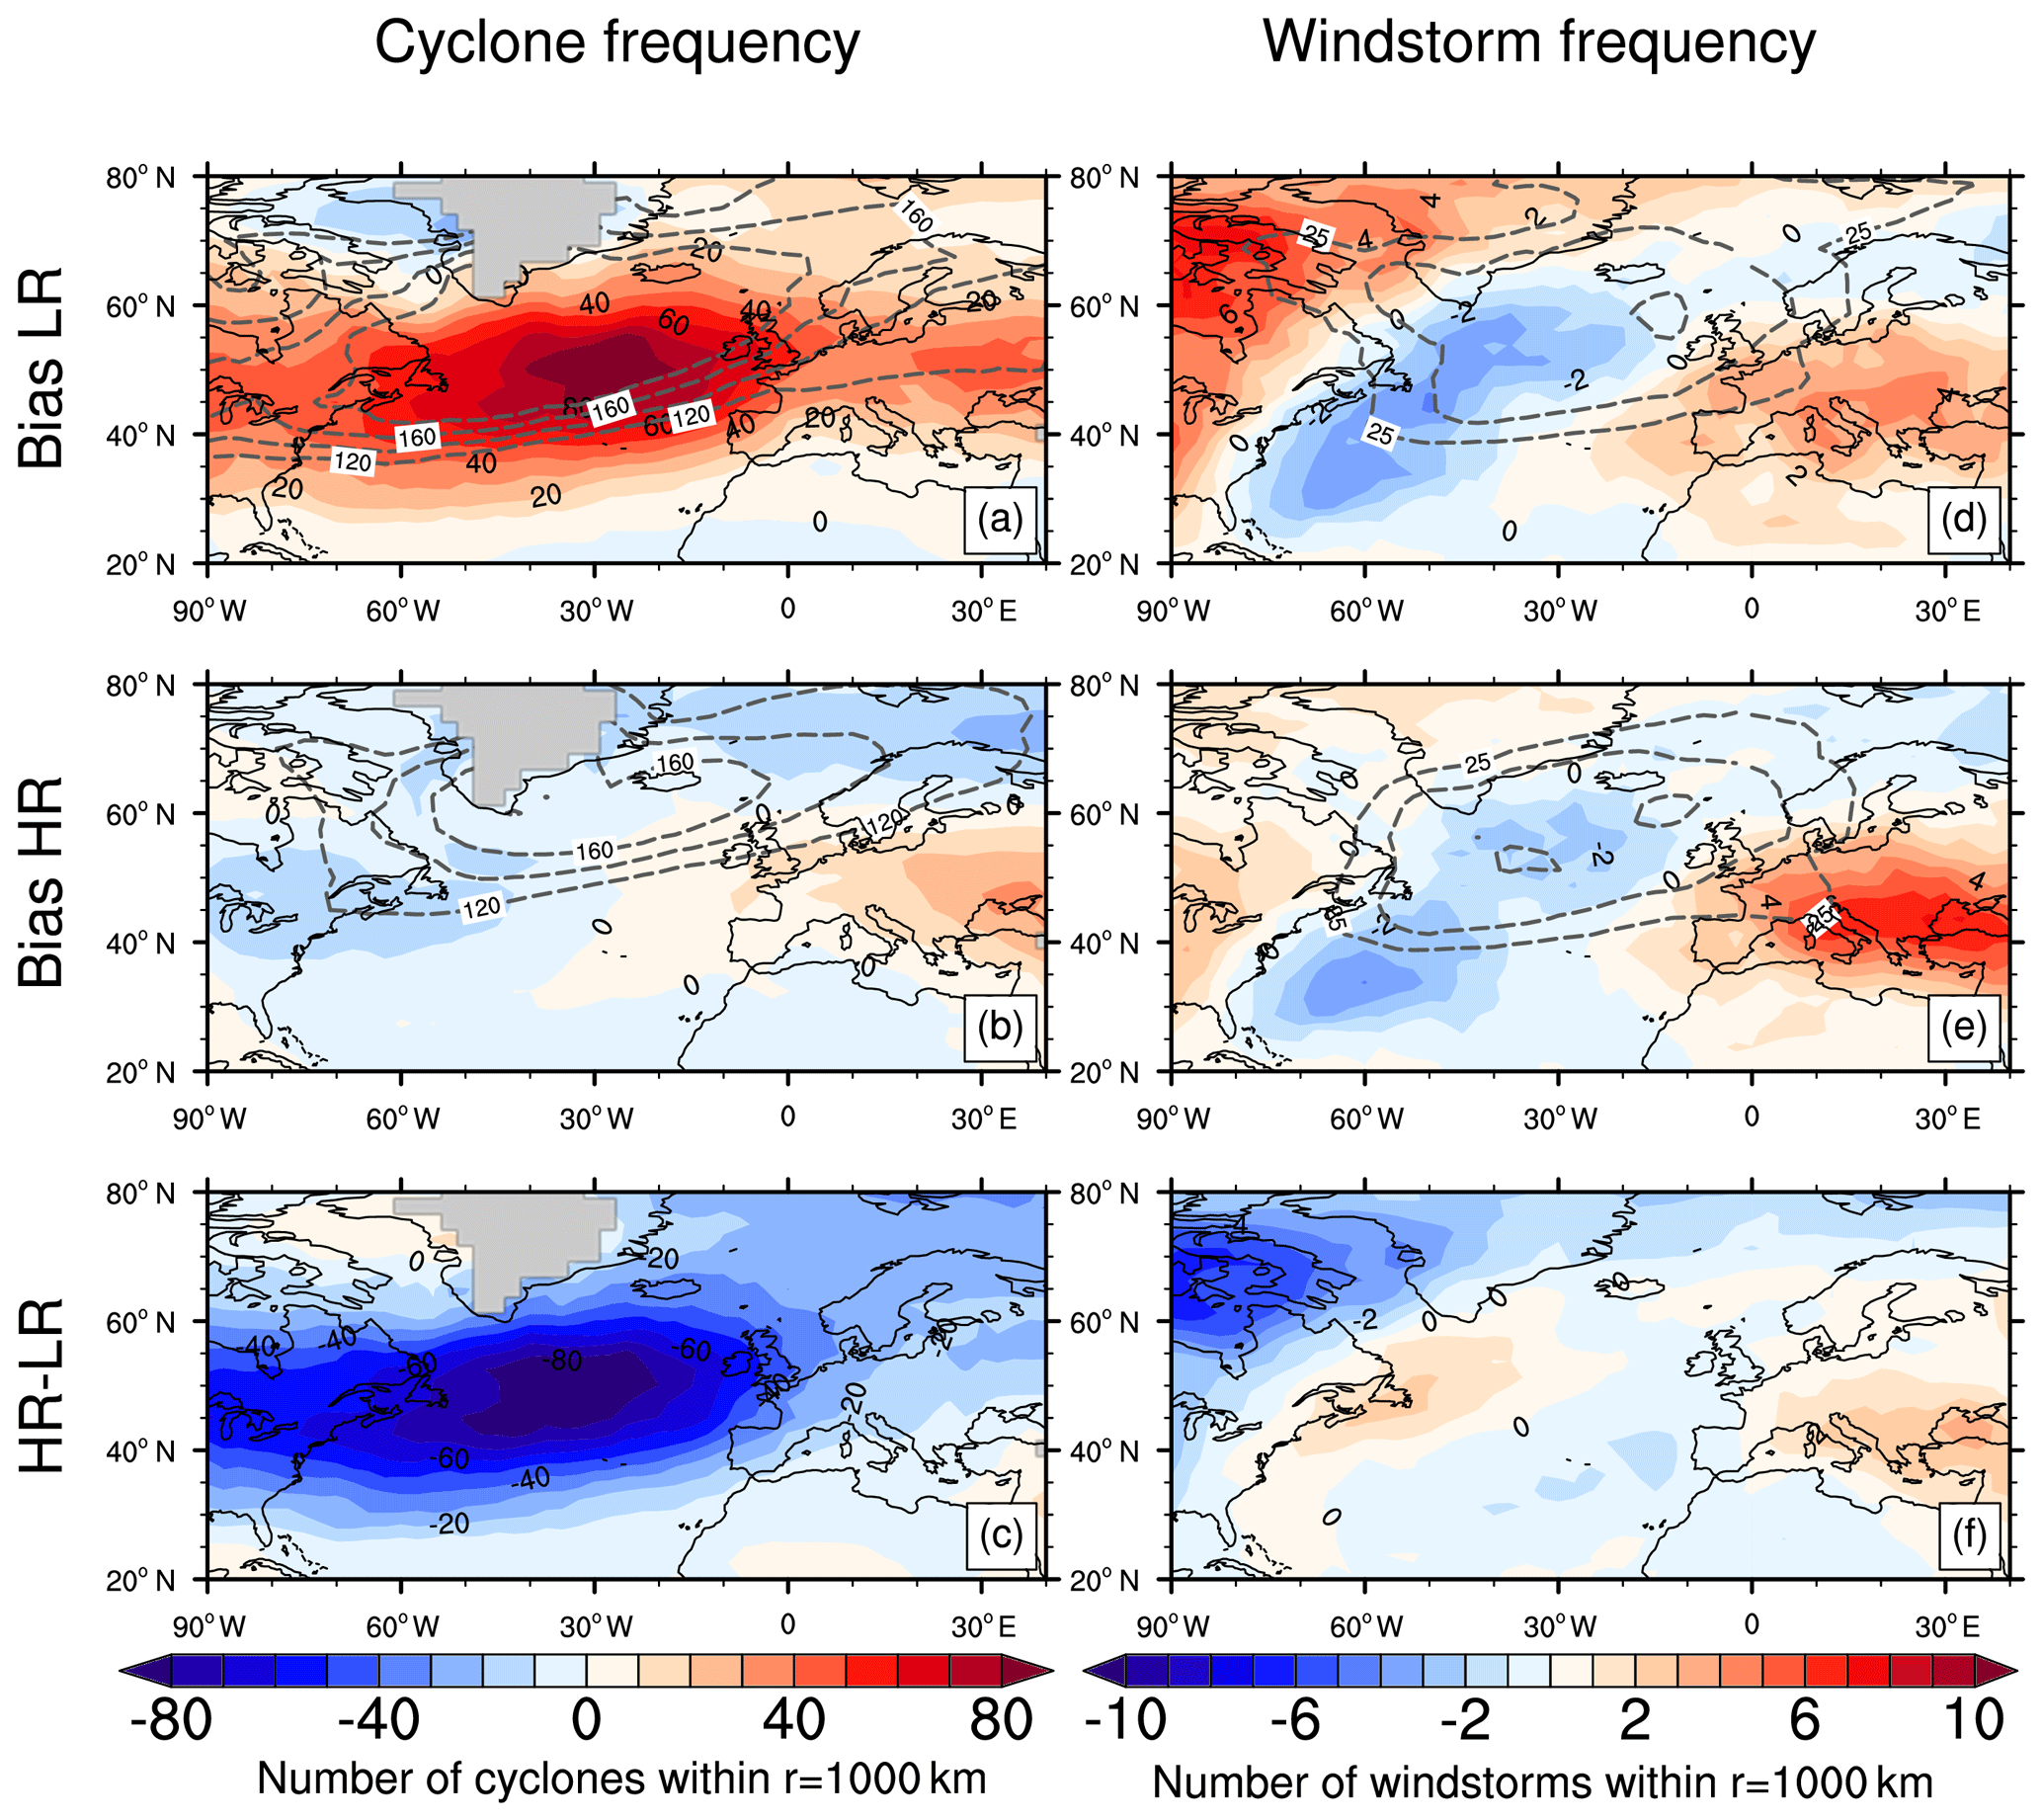
The windstorm frequency shows a slightly different behavior. There are too few windstorms (−3) present over the western and central North Atlantic along the North Atlantic Current and too many windstorms over the continents: +3 over Europe and +5 over North America (Fig. 3d). Given that there are too many cyclones in LR, the negative windstorm bias over the Atlantic might seem contradictory, as windstorms are a consequence of strong cyclones. However, it should be highlighted that the cyclone tracking algorithm also detects weak and moderate cyclones. Thus, the windstorms displayed in Fig. 3d–f can be considered a subset of all (weak, moderate and strong) cyclones displayed in Fig. 3a–c. This suggests that the positive cyclone frequency bias in LR is caused by weak cyclones. This is confirmed by the intensity and lifetime histograms displayed in Fig. 4, which only include cyclones that pass the central North Atlantic (50–10∘ W, 40–60∘ N) at some point during their lifetime. While the distributions of those North Atlantic cyclones match very well between HR and ERA-Interim, the LR prediction system overestimates weak to moderate (0.7–2.2 hPa ∕ (degree latitude)2) and short- to average-lived (1–7 d) cyclones. Those cyclones are, however, usually not strong enough to develop a windstorm. A similar feature was reported by Kruschke et al. (2014) for the uninitialized LR runs of the previous MPI-ESM system. Although the positive cyclone frequency bias is generally weaker for the uninitialized runs, they demonstrated that it can mainly be attributed to weak and moderate systems by illustrating a reduced bias over the North Atlantic and Europe when only intense cyclones, i.e., the strongest 25 % in terms of the Laplacian of the sea level pressure, are considered. The negative windstorm frequency bias over the central North Atlantic is therefore not contradictory. In fact, it is in line with the overly zonally oriented storm track (Fig. 2a, b), also resulting in too many windstorms over central Europe and the Mediterranean and too few storms over northern Europe (Fig. 3d, e). The increase in the model resolution yields an increase in windstorm frequency over the North Atlantic Current (Fig. 3e) and a remarkable reduction over the Hudson Bay. The bias over southeastern Europe, however, is amplified. This leaves the higher-resolution system with biases of −2 along the North Atlantic Current and the central North Atlantic and +6 over southeastern Europe (Fig. 3f).
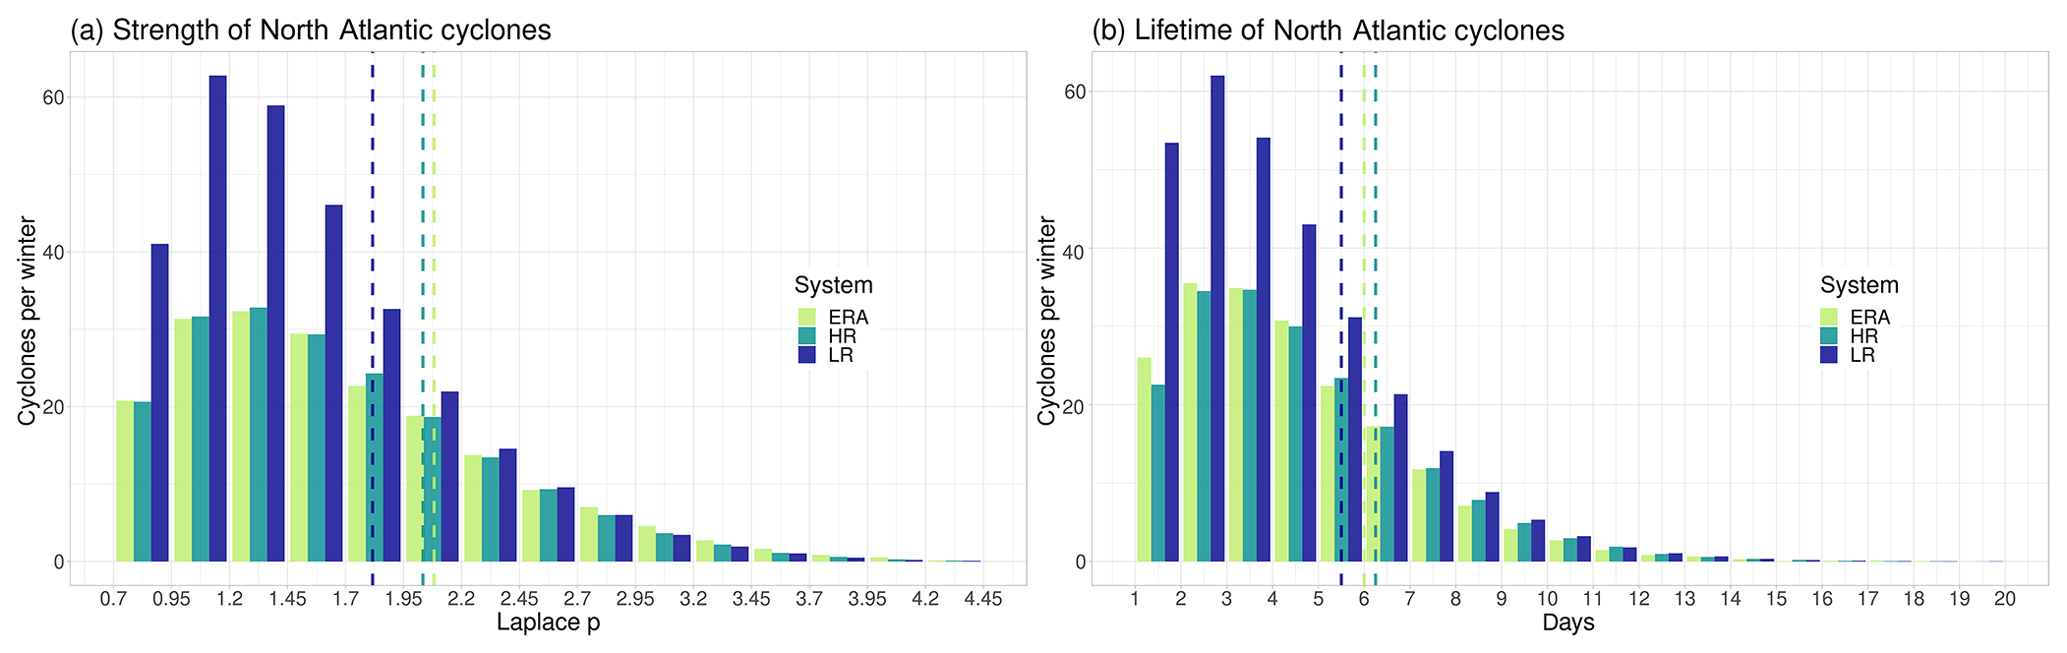
Figure 4Histograms of (a) the strength (max. along-track Laplacian of the sea level pressure in hPa ∕ (degree latitude)2) and (b) the lifetime (in days) of cyclones that pass the central North Atlantic (50–10∘ W, 40–60∘ N) at any time during their existence. For the hindcasts individual cyclone tracks of all five members and lead winters 2–5 of the initializations 1978–2012 are used, and for ERA-Interim individual cyclone tracks of the period 1979/80 to 2016/17 are used. Vertical dashed lines denote the 0.75 quantile, i.e., the 25 % strongest and longest-lived cyclones of each sample.
While the exact location and magnitude of the extratropical circulation features over the North Atlantic and European region exhibit deviations from the observations, overall the MPI-ESM is capable of representing those dynamical quantities. In Müller et al. (2018) it also is noted that although bias reductions from LR to HR are modest for the multitude of diagnostics they analyzed, the dynamics of the atmosphere still benefit from the increase in resolution and make this model suitable for prediction studies. We therefore proceed to analyze the deterministic decadal prediction skill.
3.2 Prediction skill
The anomaly correlation between the storm track in the LR hindcast and ERA-Interim for the winters 2–5 after initialization is shown in Fig. 5a. Although both significant positive and negative correlations are equally valuable from a mathematical point of view, a significant negative correlation, i.e., a consistently opposite prediction of the observed climate variability, is inconsistent with the physically based model setup. We thus consider only significantly positive correlations to be model prediction skill. The LR system shows skill for the storm track over the central North Atlantic (correlation coefficient r=0.4) as well as over Canada, the Baffin Bay and the Barents Sea. However, southwestward of the climatological storm track maximum, over the North Atlantic Current where the meridional gradient of the storm track climatology is strongest, there is a significant negative correlation (). This lack of skill in that area is overcome when the resolution of the dynamical model is increased. In the HR system (Fig. 5c) there is a large area of significant positive correlation over the North Atlantic Current (r=0.6) and additionally over Iceland and central Europe (r=0.5). The improvement from LR to HR, shown in Fig. 5e, is strongest over the North Atlantic Current and the tropical North Atlantic. Additionally, there are areas of statistically significant skill improvement east of the Azores, west of Iceland, and over the North and Baltic Sea. Although positive anomaly correlations are not a direct consequence of bias reductions, the better representation of the average circulation and its variability does have an impact on the anomaly correlation and thus the prediction skill. Therefore, the skill improvement over those regions is in line with the average extended storm track in HR and the related bias reductions found on the northern side and downstream end of the storm track. However, there is also an area of a significant reduction of the anomaly correlation for the storm track over northern Canada and the Baffin Bay. Interestingly, the increase in resolution merely has an influence on the ensemble mean storm track bias along the North Atlantic Current (Fig. 2c) and yet appears to have a strong influence on interannual variability and prediction skill in that region (Fig. 5e).
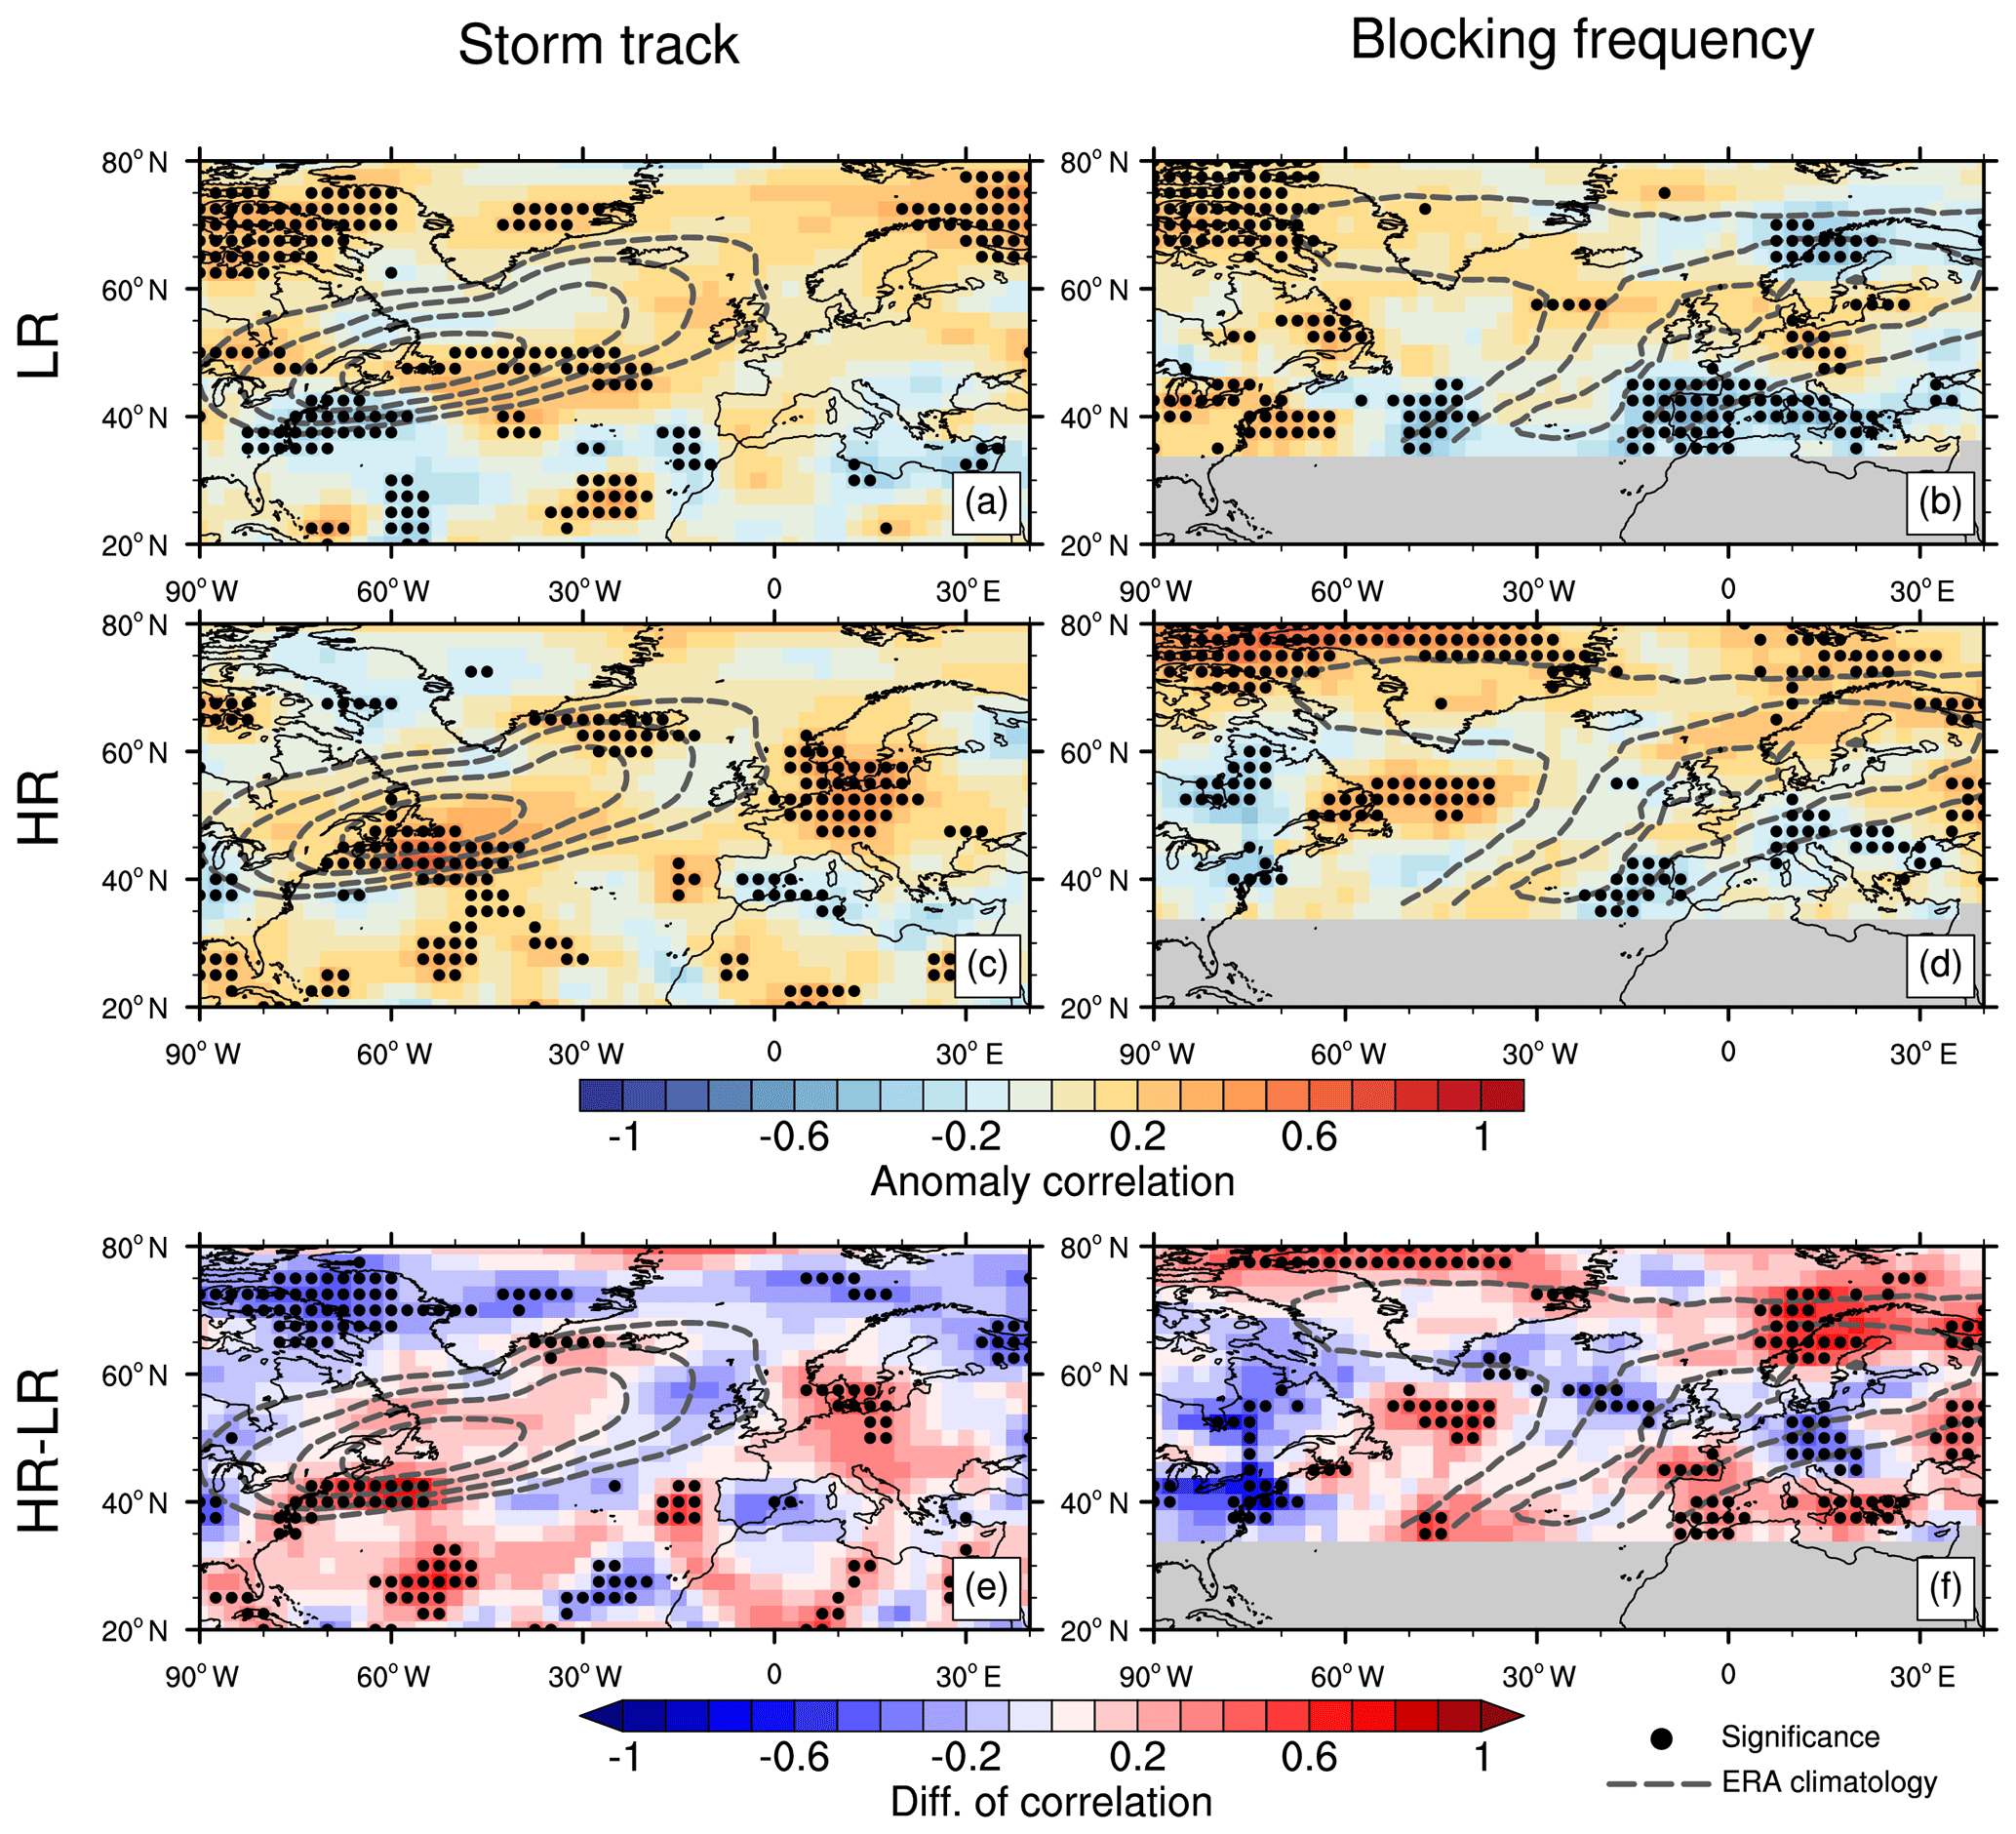
Figure 5Anomaly correlation between the respective circulation quantity in ERA-Interim and LR (a, b), between ERA-Interim and HR (c, d), and the difference between them (e, f). The circulation quantities displayed are the storm track (a, c, e) and the blocking frequency (b, d, f). Initializations from the period 1978–2012 are used for both LR and HR, and the correlation is computed for the winter (October–March) average of the hindcast winters 2–5. The dots mark significance (1000 times resampling of reanalysis–hindcast time series) at the 95 % significance level. The dashed contours show the climatology of the circulation quantity in ERA-Interim (1979/80 to 2016/17) as depicted in Fig. 1.
The anomaly correlation between LR and ERA-Interim for the winter blocking frequencies is illustrated in Fig. 5b. Similar to the storm track, there is skill over Canada (r=0.3). Although the correlation is positive in large areas over the North Atlantic and central Europe (r=0.2), it is only significant at a few of those grid points, e.g., south of Iceland and around the Baltic Sea. This changes in the HR system, wherein larger areas around and downstream of Newfoundland (r=0.4) and over northern and eastern Europe (r=0.3) show skill for the winters 2–5 (Fig. 5d). Also, large areas of significantly negative correlation over the central North Atlantic around 40∘ N, the Mediterranean and Scandinavia, present in LR, are reduced in size or converted to positive correlation in HR. A significant improvement in correlation with respect to the blocking frequency is therefore found for several areas, such as east of Newfoundland and all around Europe, i.e., the Mediterranean as well as eastern and northern Europe (Fig. 5f), except for central Europe, which actually suffers from a significant decrease in correlation from LR to HR. The concurrence of the skill improvement around the Mediterranean and downstream of Newfoundland and the bias reduction in the same areas again speaks for an overall better representation of the blocking dynamics in HR.
For cyclone frequencies in the winters 2–5 in LR (Fig. 6a) there is a small area of significant skill over the Arctic Ocean north of Scandinavia (r=0.2); however, the rest of the domain is dominated by even smaller or negative correlation ( to r=0.2). There are large regions with significantly negative correlation west of Great Britain () and over the Mediterranean (). Once again, with the increase in resolution the skill strongly improves. In HR (Fig. 6c) a positive anomaly correlation bestrides the entire North Atlantic, and the prediction is skillful (significant correlation) over a large contiguous area over the North Sea and Scandinavia (r=0.4) and at scattered grid points over the central North Atlantic (r=0.3). Only a small area over the Hudson Strait shows significant negative correlation in HR (r=0.3). Thus, the skill for extratropical cyclone frequencies is significantly improved through the finer resolution in large areas over the central and eastern North Atlantic, the North Sea, Scandinavia, and eastern Europe (Fig. 6e). Those areas in which the skill is improved in HR coincide with the location of the maximum bias improvement and with the more accurately represented climatological cyclone frequencies on the downstream end along the European west coast. The analysis also reveals that not only the skill for the cyclone track frequency improves, but also for the cyclone genesis frequency; i.e., the location where the cyclones form (not shown). There is significant skill improvement from LR to HR of the cyclogenesis frequency south of Greenland, over the entire eastern North Atlantic and over northern Europe (not shown), indicating that not only the lifetime and pathway of existing maritime cyclones are improved but also the genesis of cyclones that form just off the European west coast and continental cyclones.
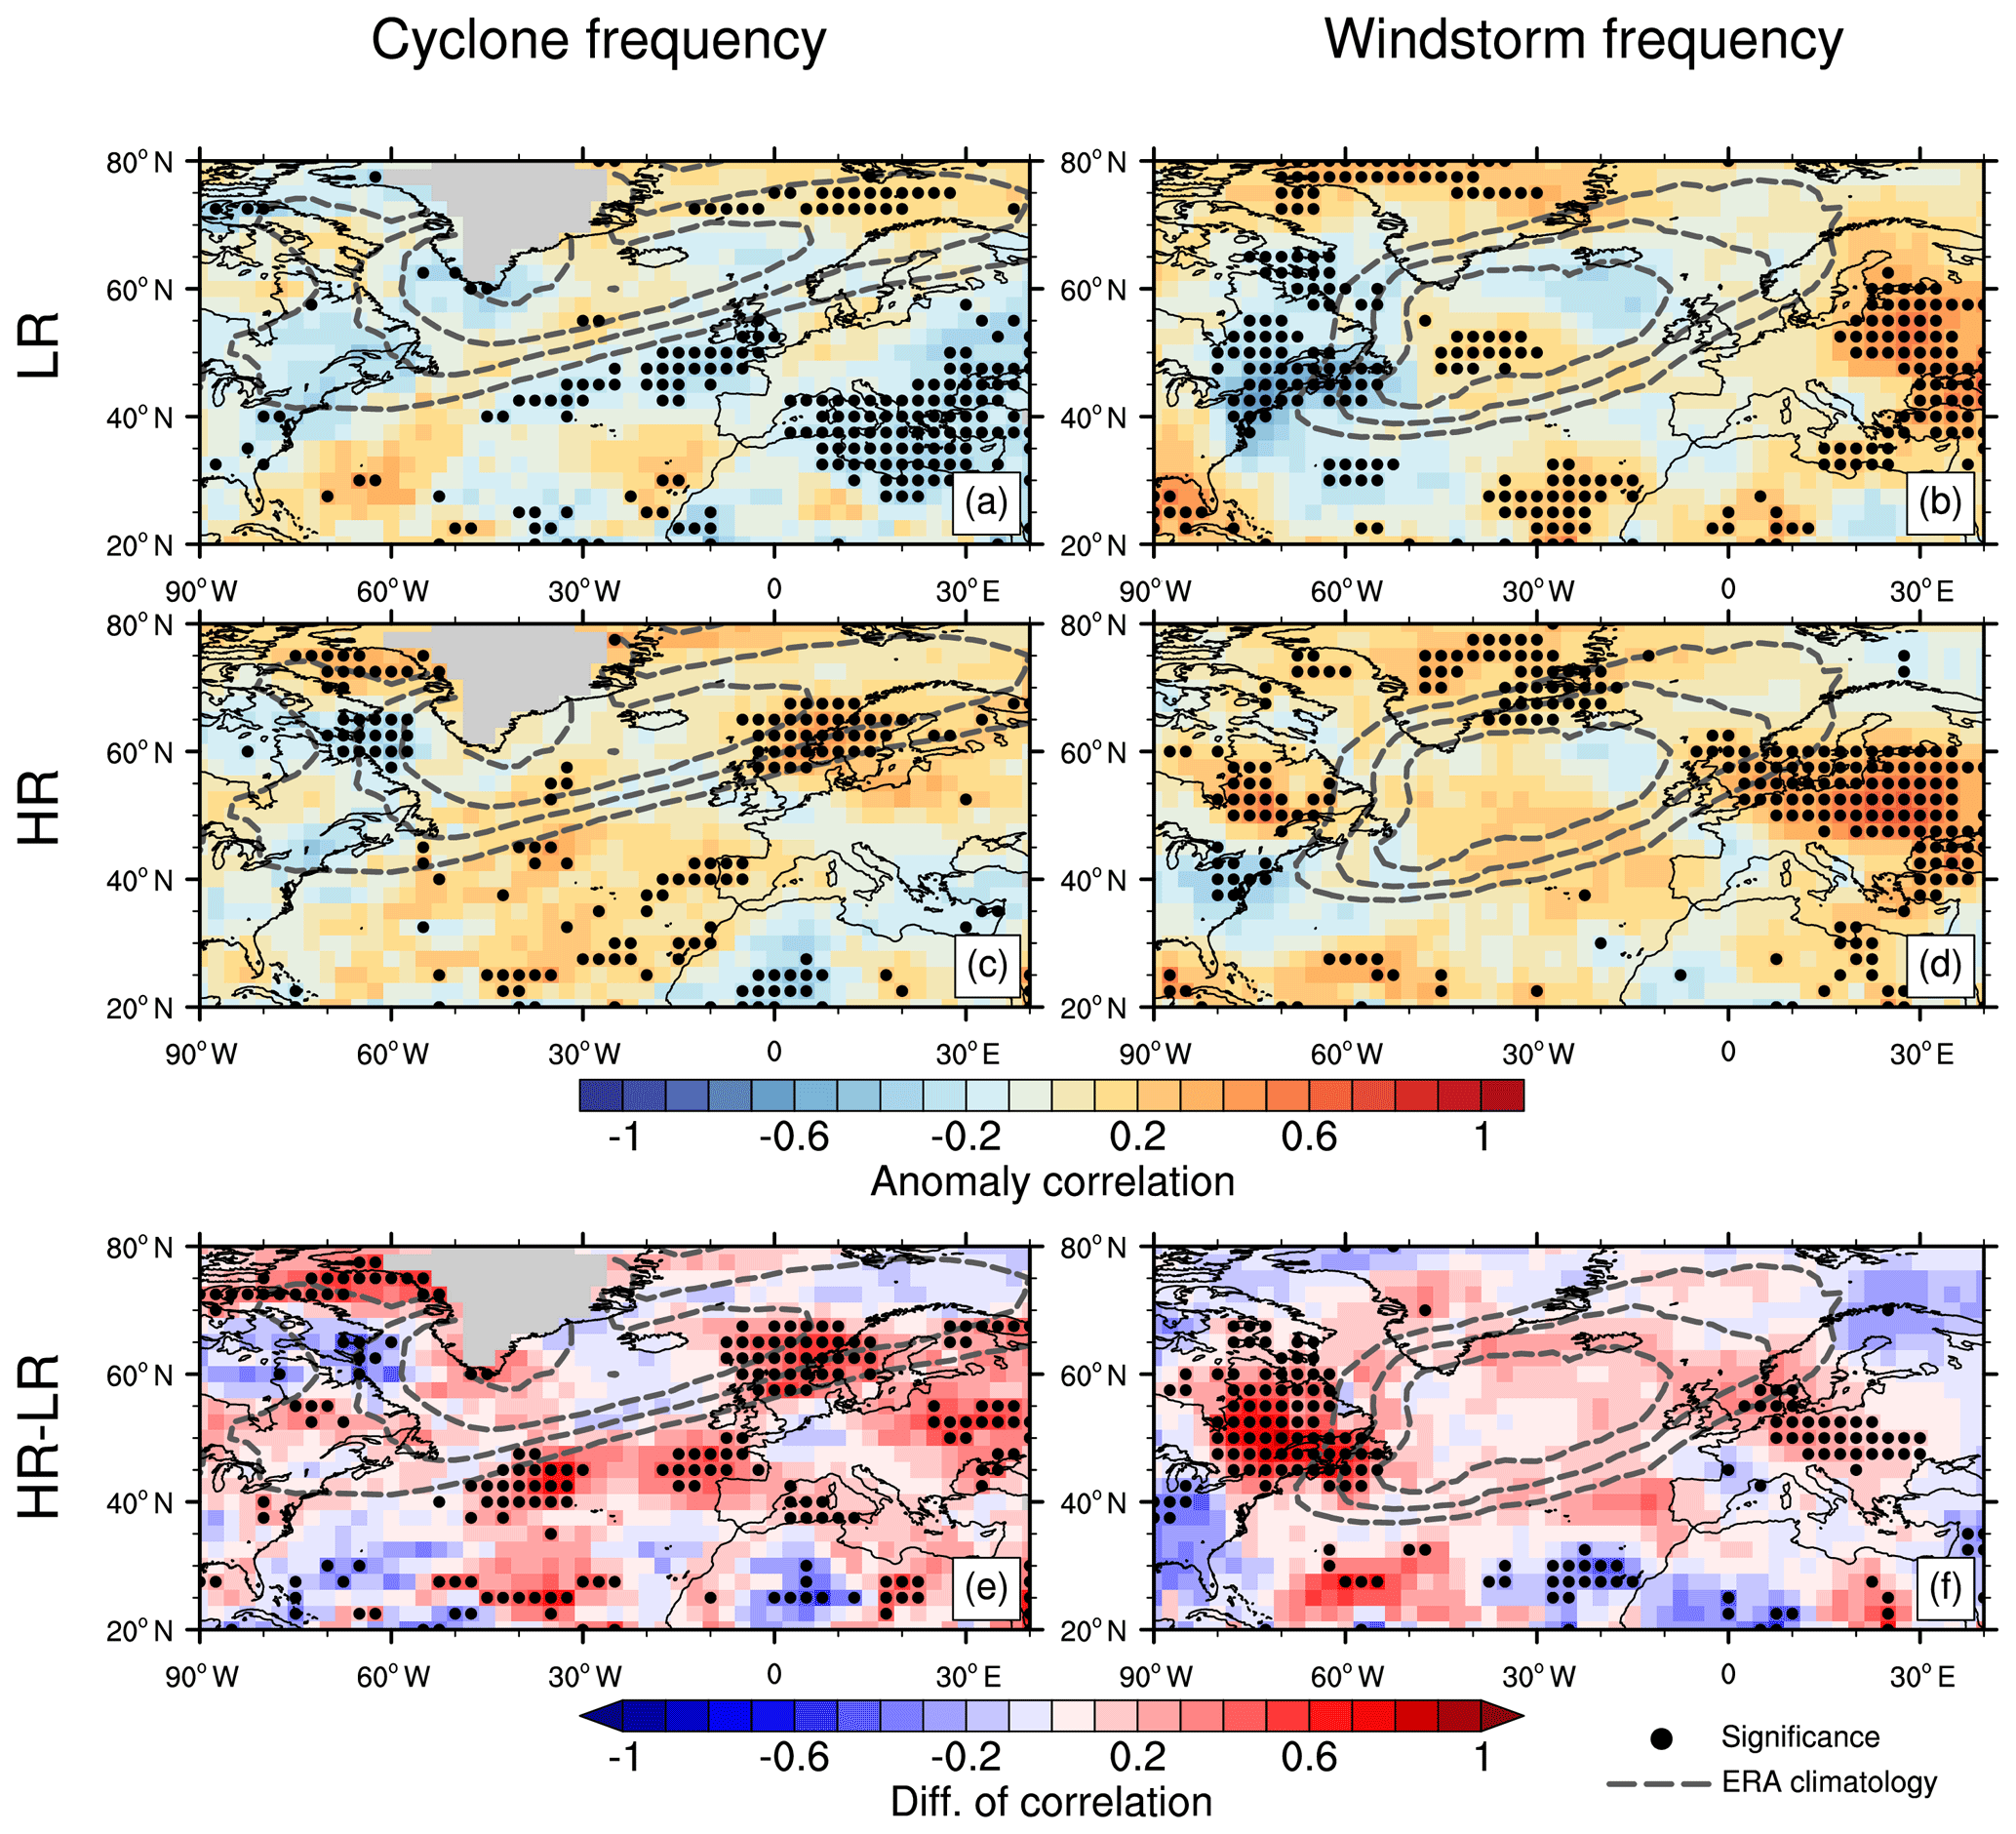
Figure 6Same as Fig. 5 but for the cyclone frequency (a, c, e) and the windstorm frequency (b, d, f).
Prediction skill for the winter windstorms in the LR prediction system is present over the central North Atlantic (r=0.2) in the region of the maximum of the windstorm climatology and over eastern Europe (r=0.5; Fig. 6b). A large area of significant negative anomaly correlation is located around Newfoundland (r=0.6). It is remarkable that with the finer resolution the skill increases almost throughout the entire domain; i.e., it improves over the ocean but also and most strongly over continental areas (Fig. 6f). This effect is strongest and significant around Newfoundland and over central and eastern Europe. This matches the results for the skill improvement of the cyclone frequencies in Fig. 6e, indicating that if the cyclone tracks are improved along the European west coast, the downstream impact of the associated wind fields of strong cyclones is also improved. Also, the skill improvement over Canada and Newfoundland again coincides with the bias reduction of the ensemble mean windstorm climatology in this region. The HR system thus produces skillful windstorm predictions over large regions of the Northern Hemisphere, e.g., eastern Canada (r=0.5), but most impressively over central and eastern Europe (r=0.6; Fig. 6d).
4.1 Model bias
The LR system shows bias patterns that are quite common in climate models of moderate resolution: a North Atlantic storm track that is oriented rather zonally and is southward displaced (as found, e.g., for CMIP5 models in Zappa et al., 2013) and accordingly blocking frequencies that are too low over the eastern North Atlantic and northern Europe (as documented, e.g., by Scaife et al., 2011). With respect to the storm track, the overly zonal pattern in LR is to some extent corrected in HR, especially over northern Europe. This corresponds to findings from Müller et al. (2018), who note a reduced bias of the atmospheric jet stream position in the northern extratropics, a decrease in the storm track bias over the northern North Atlantic and increased storm activity over northern Europe for the uninitialized runs of the higher-resolution system. Thus, in HR the storm track reaches further across the North Atlantic and is more tilted towards northern Europe; to that effect it is closer to the observed storm track than in LR. This conforms with the results presented by Zappa et al. (2013), who state that only the higher-resolution models of their study are able to capture the tilt of the winter storm track. However, the general bias of a southward displacement over the central North Atlantic is still apparent in HR, in agreement with the overly zonal North Atlantic Current identified in both model versions by Müller et al. (2018).
The corresponding deficit in blocking over the Atlantic, which is the strongest near the end of the storm track in both systems, has also been reported in previous works (e.g., by Scaife et al., 2010; Davini et al., 2017). While other studies that investigate the effect of the resolution on the blocking frequency bias find an increase over central and eastern Europe (Berckmans et al., 2013) or northern Europe (Davini et al., 2017), HR shows the increase in blocking frequency over the central and eastern North Atlantic – as seen in Müller et al. (2018). However, the changes in our study are small, and a widespread negative bias remains along the European coast. A comparable result is documented in Jiang et al. (2019), who state that the underestimation of blocking frequencies over the North Atlantic found in their lower-resolution (1∘) model version mainly persists in the higher-resolution (0.25∘) version. They conclude that, in contrast to North Pacific blocking, North Atlantic blocking is mainly driven by low‐frequency eddies, which are not influenced by the higher resolution.
In contrast to the previously discussed quantities, cyclone frequencies are affected very strongly by the increase in resolution. The intense positive cyclone frequency bias, which is visible over the entire North Atlantic in LR, is almost entirely removed in HR. A similar bias tendency and pattern, but not as strong, are reported in previous studies with MPI-ESM predecessors (Kruschke et al., 2014; Bengtsson et al., 2006). The first analyses reveal that the strong bias in our study appears to be the result of a combined effect of the LR system and the initialization (see Supplement Fig. S1), as there is no such bias present in the respective uninitialized simulations of the LR system (Fig. S1) or in the initialized HR system (Fig. 3b). In fact, we find that this strong cyclone frequency bias is of the same order of magnitude already inherent in the initialized runs of the previous MPI-ESM-LR version termed Baseline1, as analyzed by Kruschke et al. (2014) (Fig. S2); however, they only show biases for the uninitialized simulations, which do not exhibit this cyclone frequency bias (Figs. S1, S3). The contributions to the bias through (a) the different reanalysis used in Kruschke et al. (2014) (Fig. S3) and (b) the different model physics of the now more advanced prediction system (Fig. S4) are negligible. The detection and a detailed analysis of the factors and processes provoking this bias in the LR system are beyond the scope of this study and remain to be addressed in future investigations. Nevertheless, we would like to emphasize that there is no such cyclone frequency bias in the HR system, which makes it suitable for studies on the variability and decadal prediction skill of extratropical cyclones.
In line with the southward shifted exit region of the storm track in LR, there is a positive windstorm frequency bias over central Europe and the Mediterranean. Also, the central North Atlantic is experiencing an underestimation of windstorms. A similar bias pattern is identified by Kruschke et al. (2016) for the uninitialized runs of a previous MPI-ESM system and by Befort et al. (2019) for the ECMWF's seasonal forecast systems S3 and S4. This bias is not corrected by the higher resolution in our study or in the higher-resolved S4 system in Befort et al. (2019), and the bias over the Mediterranean in HR is even aggravated. On the other hand, a slight bias improvement is found along the North Atlantic Current and a strong improvement over Canada. A better representation of near-surface processes would seem to be a likely cause, as the windstorms are identified from low-level wind speed, but sea surface temperature, 2 m temperature and sea ice fraction do not show considerable improvement over that area in the higher-resolution system (Müller et al., 2018). Only the sea level pressure shows a bias reduction over Canada; however, the opposite is the case over the North Atlantic Current.
Although the bias and the anomaly correlation are per se unrelated, they are both important metrics to assess the model's performance to correctly represent the mean state and the variability of the atmospheric circulation. If they appear to be improved in the same location this does not imply a causal interrelation. However, it all the more indicates that local physical processes are improved in the higher-resolution prediction system.
4.2 Prediction skill
With respect to the decadal prediction skill, for the storm track a strong (statistically significant) skill improvement is found along the North Atlantic Current and over central Europe. Given the important role of surface heat fluxes and local SST gradients for the dynamics of the storm track (Brayshaw et al., 2011), these are likely sources of improved atmospheric variability in the HR system. The skill improvement over central Europe is in line with the bias improvement of the storm track at its downstream end (stronger tilt and downstream extension) shown in our study as well as with reduced sea surface temperature and salinity biases over the eastern and northern North Atlantic found in Müller et al. (2018) for the uninitialized runs of the same model system. However, the influence of local SST gradients on the storm track skill improvement along the North Atlantic Current is debatable, given the mostly unchanged bias of the North Atlantic Current in HR documented in Müller et al. (2018).
The skill for blocking frequencies over the North Atlantic and European domain is basically nonexistent in the LR system; it shows skill only over Canada. A similar pattern of skill is found in Athanasiadis et al. (2014) for seasonal forecasts performed with the system of the Centro Euro-Mediterraneo sui Cambiamenti Climatici (CMCC), which is also based on ECHAM. They further find that this lower-resolution model (CMCC; atm. ∼1.875∘) underrepresents the variance of blocking in the eastern North Atlantic more than the higher-resolution model (UK Met Office, UKMO; atm. ) of their study. We find in HR a significant improvement in the anomaly correlation of the blocking frequency downstream of where the storm track skill is improved, i.e., over the central North Atlantic, northern Europe and the Mediterranean. The latter coincides with a strong bias reduction in that area. This matches the results of Athanasiadis et al. (2014), wherein only the higher-resolution system shows skill for blocking frequencies in the Euro-Atlantic sector – in their case over the eastern North Atlantic and central Europe. They state that those are primarily the regions where blocking activity is strong and related to the variability of the North Atlantic Oscillation (NAO). If this relation was also valid for our simulations, the skill improvement for blocking over northern Europe and the Mediterranean would be in line with NAO amplitudes reaching further towards Europe in HR than in LR, as found by Müller et al. (2018).
The strong misrepresentation of the cyclone frequencies in LR results in no decadal forecast skill throughout the North Atlantic and European domain. But with the increase in resolution not only is a striking climatological bias reduction achieved, but the prediction skill is also improved throughout the entire domain (significantly over the central and eastern North Atlantic and northern Europe), resulting in skillful cyclone frequency predictions over northern Europe in HR. The improved representation of cyclones in this region may also be beneficial for the prediction of blocking over Scandinavia (where the skill in HR is significantly improved), as cyclones can contribute to downstream blocking formation through eddy vorticity forcing (Shutts, 1983) and diabatic processes (Pfahl et al., 2015). Apart from the removed initialization effect in HR, a more accurate representation of smaller-scale diabatic processes may be a reason for the increased forecast skill of cyclones at the southern flank of the main storm track, over the subtropical North Atlantic and the Mediterranean, as moist processes are thought to be particularly important for such subtropical systems (e.g., Davis, 2010). The fact that Kruschke et al. (2014) find the decadal forecast skill to be higher for strong cyclones than for all cyclones in the former LR system could also be related to the initialization effect apparent in LR. As strong cyclones are not affected by this initialization-induced bias, their prediction skill is likely also more credible.
Although the forecast skill for 10 m wind speeds and wind energy output only differs slightly between different ocean initializations (Moemken et al., 2016), this study reveals that an increased model resolution has a large impact on the hindcast skill of synoptic-scale features, such as cyclones and windstorms. Thus, in line with these skill improvements in the cyclone frequency, the skill for windstorms also improves significantly over northeastern and central Europe, i.e., south of the cyclone signal. This matches with the general southeastward displacement of the maximum wind speeds relative to the cyclone center (Leckebusch et al., 2008). Müller et al. (2018) deduced from the storm track bias changes they found in the uninitialized higher-resolution runs that more storms entering the northern European region can be expected, relative to LR. Although this cannot be confirmed with respect to the windstorm frequency climatology in our study, its prediction skill is significantly improved from the North Sea through eastern Europe. Different studies suggest that a better representation of the North Atlantic Current in the model would contribute to a better representation of the storm track (e.g., Brayshaw et al., 2011; Scaife et al., 2011) and thus would probably lead to increased downstream predictive skill for cyclones and windstorms (Kruschke et al., 2014). Although the improvement for the North Atlantic Current in terms of sea surface temperature and salinity is small for the HR system, as reported by Müller et al. (2018) for the uninitialized runs, this study found improved decadal prediction skill downstream of the storm track, not only for cyclones and windstorms but also for blocking frequencies. This indicates that the variability of strong North Atlantic cyclones causing windstorms in northern and central Europe is much better captured by HR.
This study evaluated the response of the deterministic decadal forecast skill of the atmospheric extratropical winter circulation to an increase in the resolution of the forecast system. This was performed under otherwise unchanged conditions; i.e., the same numerical model, initialization technique and parametrization were used, and only the resolution of the model was changed. The two hindcast sets (LR: atm. ∼1.8∘, ocean ∼1.5∘ and HR: atm. ∼0.9∘, ocean ∼0.4∘) were initialized in the period 1978–2012 and evaluated for the winters 2–5 after the initialization using five members each. Those hindcasts were performed with the MiKlip pre-operational decadal prediction system based on the MPI-ESM. The forecast skill was analyzed over the North Atlantic region in terms of anomaly correlation for the storm track, blocking frequency, cyclone frequency and windstorm frequency. ERA-Interim, i.e., the winterly averages of the four quantities between 1979/80 and 2016/17, served as the reference dataset. The analysis of the ensemble mean model bias has provided additional insights into the modified atmospheric dynamics and into possible sources of improved forecast skill in the higher-resolved system.
In summary, we demonstrated an improvement of the midlatitude dynamics in the North Atlantic region with an increase in the model resolution. This comprises an improvement of both the mean state (climatology) and the temporal variability (decadal prediction skill) for the different extratropical circulation metrics. Although there are no other studies on this topic with respect to decadal timescales, our results are in agreement with findings from seasonal prediction studies (e.g., Prodhomme et al., 2016; Befort et al., 2019) showing skill improvements for blocking, windstorm and cyclone frequencies when the same model is used and only the resolution is increased.
The improvements found in our study for the different metrics follow a physically consistent line of argument, and the areas of improved forecast skill are crucial regions for the genesis and intensification of synoptic weather systems over the North Atlantic and for their impact on Europe. Thus, we identified a significant improvement of the storm track skill along the North Atlantic Current (i.e., the source region of synoptic eddies), a downstream improvement of the cyclone frequency skill over the central North Atlantic (where the synoptic systems intensify), and finally improved skill of the cyclone, windstorm and blocking frequencies over the European continent (i.e., the impact area). Additionally, not only does the prediction skill improve with a finer resolution (HR vs. LR), but the HR system itself also offers significant deterministic decadal forecast skill for the extratropical circulation metrics in large regions over the North Atlantic and Europe (HR vs. ERA-Interim) for the considered lead time of two to five winters.
By analyzing different but physically linked extratropical circulation metrics, this study contributes to the elucidation of the processes that lead to the decadal prediction skill in the North Atlantic region. Our results are encouraging as they document the successful advancement of decadal prediction systems, in particular the deterministic decadal prediction skill of extratropical features and extreme events. However, future studies using different prediction systems (possibly with higher resolution and larger ensemble sizes) and process-oriented analyses will be needed to shed further light on the robustness of our results and the sources of the presented skill.
The model output from all simulations described in this paper will be distributed through the World Data Climate Center at https://www.dkrz.de/up/systems/wdcc (DKRZ, 2019) and will be freely accessible through this data portal after registration. The reanalysis data are publicly available from https://www.ecmwf.int/en/forecasts/datasets/archive-datasets/reanalysis-datasets/era-interim ECMWF (2019). The software for the evaluation of the circulation quantities can be accessed through the MiKlip Central Evaluation System (https://www-miklip.dkrz.de, MiKlip, 2019a) and is documented at https://www-miklip.dkrz.de/plugins (MiKlip, 2019b), with the respective suffixes /stormtrack/detail/ (storm track), /blocking_2d/detail/ (blocking), /zykpak/detail/ (cyclones), /wtrack/detail/ (windstorms) and /murcss/detail/ (skill analysis).
The supplement related to this article is available online at: https://doi.org/10.5194/esd-10-901-2019-supplement.
The article was composed by, and the figures were created by, MS. The MiKip Central Evaluation System used in this study has been developed by CK and SI. The plugins, i.e., software used for the evaluation of the single circulation quantities and the evaluation of the LR and HR systems and reanalysis regarding those quantities (storm track, blocking, cyclone and windstorm frequencies), have been provided by TS, AR, MS and JG. Additional expertise in the field of extratropical circulation was contributed by UU and SP. Expertise in the fields of model development and decadal prediction skill was contributed by WAM and HP as well as JG, SI, CK, AR and MS.
The authors declare that they have no conflict of interest.
We would especially like to thank the anonymous reviewers for helping to improve this paper through their valuable comments. The decadal simulations as well as the evaluation were performed at the German Climate Computing Centre (DKRZ). We thank the Mittelfristige Klimaprognosen (MiKlip) community and the DKRZ for providing the simulations. The reanalysis dataset ERA-Interim was provided by the European Centre for Medium-Range Weather Forecasts (ECMWF).
The authors would like to recognize funding from CoreLogic SARL Paris and from the Federal Ministry of Education and Research in Germany (BMBF) through the research program MiKlip II (FKZ: 01LP1519A, 01LP1519B, 01LP1520A) and the CMIP6-DICAD project (FKZ: 01LP1605D). We acknowledge financial support by the Open Access Publication Fund of the Freie Universität Berlin.
This paper was edited by Gerrit Lohmann and reviewed by two anonymous referees.
Athanasiadis, P. J., Bellucci, A., Hermanson, L., Scaife, A. A., MacLachlan, C., Arribas, A., Materia, S., Borrelli, A., and Gualdi, S.: The Representation of Atmospheric Blocking and the Associated Low-Frequency Variability in Two Seasonal Prediction Systems, J. Climate, 27, 9082–9100, https://doi.org/10.1175/JCLI-D-14-00291.1, 2014. a, b
Balmaseda, M. A., Mogensen, K., and Weaver, A. T.: Evaluation of the ECMWF ocean reanalysis system ORAS4, Q. J. Roy. Meteor. Soc., 139, 1132–1161, https://doi.org/10.1002/qj.2063, 2013. a
Barnes, E. A., Slingo, J., and Woollings, T.: A methodology for the comparison of blocking climatologies across indices, models and climate scenarios, Clim. Dynam., 38, 2467–2481, https://doi.org/10.1007/s00382-011-1243-6, 2012. a
Befort, D. J., Wild, S., Knight, J. R., Lockwood, J. F., Thornton, H. E., Hermanson, L., Bett, P. E., Weisheimer, A., and Leckebusch, G. C.: Seasonal forecast skill for extratropical cyclones and windstorms, Q. J. Roy. Meteor. Soc., 145, 92–104, https://doi.org/10.1002/qj.3406, 2019. a, b, c
Bengtsson, L., Hodges, K. I., and Roeckner, E.: Storm tracks and climate change, J. Climate, 19, 3518–3543, https://doi.org/10.1175/JCLI3815.1, 2006. a
Berckmans, J., Woollings, T., Demory, M.-E., Vidale, P.-L., and Roberts, M.: Atmospheric blocking in a high resolution climate model: influences of mean state, orography and eddy forcing, Atmos. Sci. Lett., 14, 34–40, https://doi.org/10.1002/asl2.412, 2013. a
Blackmon, M. L., Wallace, J., Lau, N., and Mullen, S. L.: An observational study of the Northern Hemisphere wintertime circulation, J. Atmos. Sci., 34, 1040–1053, https://doi.org/10.1175/1520-0469(1977)034<1040:AOSOTN>2.0.CO;2, 1976. a
Boer, G. J., Smith, D. M., Cassou, C., Doblas-Reyes, F., Danabasoglu, G., Kirtman, B., Kushnir, Y., Kimoto, M., Meehl, G. A., Msadek, R., Mueller, W. A., Taylor, K. E., Zwiers, F., Rixen, M., Ruprich-Robert, Y., and Eade, R.: The Decadal Climate Prediction Project (DCPP) contribution to CMIP6, Geosci. Model Dev., 9, 3751–3777, https://doi.org/10.5194/gmd-9-3751-2016, 2016. a, b, c
Brayshaw, D. J., Hoskins, B., and Blackburn, M.: The Basic Ingredients of the North Atlantic Storm Track. Part II: Sea Surface Temperatures, J. Atmos. Sci., 68, 1784–1805, https://doi.org/10.1175/2011JAS3674.1, 2011. a, b
Davini, P., Corti, S., D'Andrea, F., Rivière, G., and von Hardenberg, J.: Improved Winter European Atmospheric Blocking Frequencies in High-Resolution Global Climate Simulations, J. Adv. Model. Earth Sy., 9, 2615–2634, https://doi.org/10.1002/2017MS001082, 2017. a, b, c
Davis, C. A.: Simulations of Subtropical Cyclones in a Baroclinic Channel Model, J. Atmos. Sci., 67, 2871–2892, https://doi.org/10.1175/2010JAS3411.1, 2010. a
Dawson, A., Matthews, A. J., Stevens, D. P., Roberts, M. J., and Vidale, P. L.: Importance of oceanic resolution and mean state on the extra-tropical response to El Niño in a matrix of coupled models, Clim. Dynam., 41, 1439–1452, https://doi.org/10.1007/s00382-012-1518-6, 2013. a
Dee, D. P., Uppala, S. M., Simmons, A. J., Berrisford, P., Poli, P., Kobayashi, S., Andrae, U., Balmaseda, M. A., Balsamo, G., Bauer, P., Bechtold, P., Beljaars, A. C. M., van de Berg, L., Bidlot, J., Bormann, N., Delsol, C., Dragani, R., Fuentes, M., Geer, A. J., Haimberger, L., Healy, S. B., Hersbach, H., Holm, E. V., Isaksen, L., Kallberg, P., Koehler, M., Matricardi, M., McNally, A. P., Monge-Sanz, B. M., Morcrette, J. J., Park, B. K., Peubey, C., de Rosnay, P., Tavolato, C., Thepaut, J. N., and Vitart, F.: The ERA-Interim reanalysis: configuration and performance of the data assimilation system, Q. J. Roy. Meteor. Soc., 137, 553–597, https://doi.org/10.1002/qj.828, 2011. a, b
DeutscheRück: Sturmdokumentation 2018 Deutschland, available at: https://www.deutscherueck.de/fileadmin/user_upload/Sturmdoku_2018.pdf (last access: 9 December 2019), 2018. a
Deutsches Klimarechenzentrum (DKRZ): World Data Center for Climate (WDCC), available at: https://www.dkrz.de/up/systems/wdcc, last access: 9 December 2019. a
Doblas-Reyes, F. J., Andreu-Burillo, I., Chikamoto, Y., Garcia-Serrano, J., Guemas, V., Kimoto, M., Mochizuki, T., Rodrigues, L. R. L., and van Oldenborgh, G. J.: Initialized near-term regional climate change prediction, Nat. Commun., 4, 1715, https://doi.org/10.1038/ncomms2704, 2013. a
European Centre for Medium-Range Weather Forecasts (ECMWF): ERA-Interim reanalysis, available at: https://www.ecmwf.int/en/forecasts/datasets/archive-datasets/reanalysis-datasets/era-interim, last access: 9 December 2019. a
Eyring, V., Bony, S., Meehl, G. A., Senior, C. A., Stevens, B., Stouffer, R. J., and Taylor, K. E.: Overview of the Coupled Model Intercomparison Project Phase 6 (CMIP6) experimental design and organization, Geosci. Model Dev., 9, 1937–1958, https://doi.org/10.5194/gmd-9-1937-2016, 2016. a
Giorgetta, M. A., Jungclaus, J., Reick, C. H., Legutke, S., Bader, J., Boettinger, M., Brovkin, V., Crueger, T., Esch, M., Fieg, K., Glushak, K., Gayler, V., Haak, H., Hollweg, H.-D., Ilyina, T., Kinne, S., Kornblueh, L., Matei, D., Mauritsen, T., Mikolajewicz, U., Müller, W., Notz, D., Pithan, F., Raddatz, T., Rast, S., Redler, R., Roeckner, E., Schmidt, H., Schnur, R., Segschneider, J., Six, K. D., Stockhause, M., Timmreck, C., Wegner, J., Widmann, H., Wieners, K.-H., Claussen, M., Marotzke, J., and Stevens, B.: Climate and carbon cycle changes from 1850 to 2100 in MPI-ESM simulations for the Coupled Model Intercomparison Project phase 5, J. Adv. Model. Earth Sy., 5, 572–597, https://doi.org/10.1002/jame.20038, 2013. a
Goddard, L., Kumar, A., Solomon, A., Smith, D., Boer, G., Gonzalez, P., Kharin, V., Merryfield, W., Deser, C., Mason, S. J., Kirtman, B. P., Msadek, R., Sutton, R., Hawkins, E., Fricker, T., Hegerl, G., Ferro, C. A. T., Stephenson, D. B., Meehl, G. A., Stockdale, T., Burgman, R., Greene, A. M., Kushnir, Y., Newman, M., Carton, J., Fukumori, I., and Delworth, T.: A verification framework for interannual-to-decadal predictions experiments, Clim. Dynam., 40, 245–272, https://doi.org/10.1007/s00382-012-1481-2, 2013. a, b, c
Haas, R., Reyers, M., and Pinto, J. G.: Decadal predictability of regional-scale peak winds over Europe using the Earth System Model of the Max-Planck-Institute for Meteorology, Meteorol. Z., 25, 739–752, https://doi.org/10.1127/metz/2015/0583, 2016. a
Hewitt, H. T., Roberts, M. J., Hyder, P., Graham, T., Rae, J., Belcher, S. E., Bourdallé-Badie, R., Copsey, D., Coward, A., Guiavarch, C., Harris, C., Hill, R., Hirschi, J. J.-M., Madec, G., Mizielinski, M. S., Neininger, E., New, A. L., Rioual, J.-C., Sinha, B., Storkey, D., Shelly, A., Thorpe, L., and Wood, R. A.: The impact of resolving the Rossby radius at mid-latitudes in the ocean: results from a high-resolution version of the Met Office GC2 coupled model, Geosci. Model Dev., 9, 3655–3670, https://doi.org/10.5194/gmd-9-3655-2016, 2016. a
Illing, S., Kadow, C., Oliver, K., and Cubasch, U.: MurCSS: A Tool for Standardized Evaluation of Decadal Hindcast Systems, Journal of Open Research Software, 2, https://doi.org/10.5334/jors.bf, 2014. a
Jiang, T., Evans, K., Branstetter, M., Caldwell, P., Neale, R., Rasch, P. J., Tang, Q., and Xie, S.: Northern Hemisphere Blocking in similar to 25-km-Resolution E3SM v0.3 Atmosphere-Land Simulations, J. Geophys. Res.-Atmos., 124, 2465–2482, https://doi.org/10.1029/2018JD028892, 2019. a
Jung, T., Miller, M. J., Palmer, T. N., Towers, P., Wedi, N., Achuthavarier, D., Adams, J. M., Altshuler, E. L., Cash, B. A., Kinter, J. L., Marx, L., Stan, C., and Hodges, K. I.: High-Resolution Global Climate Simulations with the ECMWF Model in Project Athena: Experimental Design, Model Climate, and Seasonal Forecast Skill, J. Climate, 25, 3155–3172, https://doi.org/10.1175/JCLI-D-11-00265.1, , 2012. a
Kadow, C., Illing, S., Kunst, O., Schartner, T., Grieger, J., Schuster, M., Richling, A., Kirchner, I., Rust, H., Cubasch, U., and Ulbrich, U.: Freva – Free Evaluation System Framework for Earth System Modeling, Journal of Open Research Software, in review, 2019. a
Kadow, C., Illing, S., Kunst, O., Rust, H. W., Pohlmann, H., Müller, W. A., and Cubasch, U.: Evaluation of forecasts by accuracy and spread in the MiKlip decadal climate prediction system, Meteorol. Z., 25, 631–643, https://doi.org/10.1127/metz/2015/0639, 2016. a, b
Kadow, C., Illing, S., Kroener, I., Ulbrich, U., and Cubasch, U.: Decadal climate predictions improved by ocean ensemble dispersion filtering, J. Adv. Model. Earth Sy., 9, 1138–1149, https://doi.org/10.1002/2016MS000787, 2017. a
Kaspar, F., Rust, H. W., Ulbrich, U., and Becker, P.: Verification and process oriented validation of the MiKlip decadal prediction system, Meteorol. Z., 25, 629–630, https://doi.org/10.1127/metz/2016/0831, 2016. a
Keenlyside, N. S., Latif, M., Jungclaus, J., Kornblueh, L., and Roeckner, E.: Advancing decadal-scale climate prediction in the North Atlantic sector, Nature, 453, 84–88, https://doi.org/10.1038/nature06921, 2008. a
Kim, H. M., Webster, P. J., and Curry, J. A.: Evaluation of short-term climate change prediction in multi-model CMIP5 decadal hindcasts, Geophys. Res. Lett., 39, L10701, https://doi.org/10.1029/2012GL051644, 2012. a
Kirtman, B., Power, S., Adedoyin, J., Boer, G., Bojariu, R., Camilloni, I., Doblas-Reyes, F., Fiore, A., Kimoto, M., Meehl, G., Prather, M., Sarr, A., Schär, C., Sutton, R., van Oldenborgh, G., Vecchi, G., and Wang, H.: Near-term Climate Change: Projections and Predictability, book section 11, p. 953–1028, Cambridge University Press, Cambridge, United Kingdom and New York, NY, USA, https://doi.org/10.1017/CBO9781107415324.023, 2013. a
Kröger, J., Pohlmann, H., Sienz, F., Marotzke, J., Baehr, J., Köhl, A., Modali, K., Polkova, I., Stammer, D., Vamborg, F. S. E., and Müller, W. A.: Full-field initialized decadal predictions with the MPI earth system model: an initial shock in the North Atlantic, Clim. Dynam., 51, 2593–2608, https://doi.org/10.1007/s00382-017-4030-1, 2017. a
Kruschke, T.: Winter wind storms: Identication, verication of decadal predictions, and regionalization, PhD thesis, Freie Universität Berlin, Berlin, 2014. a
Kruschke, T., Rust, H. W., Kadow, C., Leckebusch, G. C., and Ulbrich, U.: Evaluating decadal predictions of northern hemispheric cyclone frequencies, Tellus A, 66, 22830, https://doi.org/10.3402/tellusa.v66.22830, 2014. a, b, c, d, e, f, g, h
Kruschke, T., Rust, H. W., Kadow, C., Müller, W. A., Pohlmann, H., Leckebusch, G. C., and Ulbrich, U.: Probabilistic evaluation of decadal prediction skill regarding Northern Hemisphere winter storms, Meteorol. Z., 25, 721–738, https://doi.org/10.1127/metz/2015/0641, 2016. a, b, c, d
Kushnir, Y., Scaife, A. A., Arritt, R., Balsamo, G., Boer, G., Doblas-Reyes, F., Hawkins, E., Kimoto, M., Kolli, R. K., Kumar, A., Matei, D., Matthes, K., Müller, W. A., O'Kane, T., Perlwitz, J., Power, S., Raphael, M., Shimpo, A., Smith, D., Tuma, M., and Wu, B.: Towards operational predictions of the near-term climate, Nat. Clim. Change, 9, 94–101, https://doi.org/10.1038/s41558-018-0359-7, 2019. a
Leckebusch, G. and Ulbrich, U.: On the relationship between cyclones and extreme windstorm events over Europe under climate change, Global Planet. Change, 44, 181–193, https://doi.org/10.1016/j.gloplacha.2004.06.011, 2004. a
Leckebusch, G. C., Renggli, D., and Ulbrich, U.: Development and application of an objective storm severity measure for the Northeast Atlantic region, Meteorol. Z., 17, 575–587, https://doi.org/10.1127/0941-2948/2008/0323, 2008. a, b
Marotzke, J., Müller, W. A., Vamborg, F. S. E., Becker, P., Cubasch, U., Feldmann, H., Kaspar, F., Kottmeier, C., Marini, C., Polkova, I., Proemmel, K., Rust, H. W., Stammer, D., Ulbrich, U., Kadow, C., Koehl, A., Kroeger, J., Kruschke, T., Pinto, J. G., Pohlmann, H., Reyers, M., Schroeder, M., Sienz, F., Timmreck, C., and Ziese, M.: MIKLIP A NATIONAL RESEARCH PROJECT ON DECADAL CLIMATE PREDICTION, B. Am. Meteorol. Soc., 97, 2379–2394, https://doi.org/10.1175/BAMS-D-15-00184.1, 2016. a, b
Mauritsen, T., Bader, J., Becker, T., Behrens, J., Bittner, M., Brokopf, R., Brovkin, V., Claussen, M., Crueger, T., Esch, M., Fast, I., Fiedler, S., Fläschner, D., Gayler, V., Giorgetta, M., Goll, D. S., Haak, H., Hagemann, S., Hedemann, C., Hohenegger, C., Ilyina, T., Jahns, T., Jimenéz-de-la Cuesta, D., Jungclaus, J., Kleinen, T., Kloster, S., Kracher, D., Kinne, S., Kleberg, D., Lasslop, G., Kornblueh, L., Marotzke, J., Matei, D., Meraner, K., Mikolajewicz, U., Modali, K., Möbis, B., Müller, W. A., Nabel, J. E. M. S., Nam, C. C. W., Notz, D., Nyawira, S.-S., Paulsen, H., Peters, K., Pincus, R., Pohlmann, H., Pongratz, J., Popp, M., Raddatz, T. J., Rast, S., Redler, R., Reick, C. H., Rohrschneider, T., Schemann, V., Schmidt, H., Schnur, R., Schulzweida, U., Six, K. D., Stein, L., Stemmler, I., Stevens, B., von Storch, J.-S., Tian, F., Voigt, A., Vrese, P., Wieners, K.-H., Wilkenskjeld, S., Winkler, A., and Roeckner, E.: Developments in the MPI-M Earth System Model version 1.2 (MPI-ESM1.2) and Its Response to Increasing CO2, J. Adv. Model. Earth Sy., 11, 998–1038, https://doi.org/10.1029/2018MS001400, 2019. a
Meehl, G. A., Goddard, L., Boer, G., Burgman, R., Branstator, G., Cassou, C., Corti, S., Danabasoglu, G., Doblas-Reyes, F., Hawkins, E., Karspeck, A., Kimoto, M., Kumar, A., Matei, D., Mignot, J., Msadek, R., Navarra, A., Pohlmann, H., Rienecker, M., Rosati, T., Schneider, E., Smith, D., Sutton, R., Teng, H., van Oldenborgh, G. J., Vecchi, G., and Yeager, S.: DECADAL CLIMATE PREDICTION An Update from the Trenches, B. Am. Meteorol. Soc., 95, 243–267, https://doi.org/10.1175/BAMS-D-12-00241.1, 2014. a
Mittelfristige Klimaprognosen (MiKlip): MiKlip – Decadal Prediction and Evaluation System, available at: https://www-miklip.dkrz.de, last access: 9 December 2019a. a
Mittelfristige Klimaprognosen (MiKlip): MiKlip – Plugins, available at: https://www-miklip.dkrz.de/plugins, last access: 9 December 2019b. a
Moemken, J., Reyers, M., Buldmann, B., and Pinto, J. G.: Decadal predictability of regional scale wind speed and wind energy potentials over Central Europe, Tellus A, 68, 29199, https://doi.org/10.3402/tellusa.v68.29199, 2016. a, b
Monerie, P.-A., Coquart, L., Maisonnave, É., Moine, M.-P., Terray, L., and Valcke, S.: Decadal prediction skill using a high-resolution climate model, Clim. Dynam., 49, 3527–3550, https://doi.org/10.1007/s00382-017-3528-x, 2017. a
Monerie, P. A., Robson, J., Dong, B. W., and Dunstone, N.: A role of the Atlantic Ocean in predicting summer surface air temperature over North East Asia?, Clim. Dynam., 51, 473–491, https://doi.org/10.1007/s00382-017-3935-z, 2018. a
Murray, R. J. and Simmonds, I.: A numerical scheme for tracking cyclone centres from digital data. Part I: Development and operation of the scheme, Aust. Meteorol. Mag., 39, 155–166, 1991. a
Müller, W. A., Jungclaus, J. H., Mauritsen, T., Baehr, J., Bittner, M., Budich, R., Bunzel, F., Esch, M., Ghosh, R., Haak, H., Ilyina, T., Kleine, T., Kornblueh, L., Li, H., Modali, K., Notz, D., Pohlmann, H., Roeckner, E., Stemmler, I., Tian, F., and Marotzke, J.: A Higher-resolution Version of the Max Planck Institute Earth System Model (MPI-ESM1.2-HR), J. Adv. Model. Earth Sy., 10, 1383–1413, https://doi.org/10.1029/2017MS001217, 2018. a, b, c, d, e, f, g, h, i, j, k, l, m, n
Müller, W. A., Baehr, J., Haak, H., Jungclaus, J. H., Kroeger, J., Matei, D., Notz, D., Pohlmann, H., von Storch, J. S., and Marotzke, J.: Forecast skill of multi-year seasonal means in the decadal prediction system of the Max Planck Institute for Meteorology, Geophys. Res. Lett., 39, L22707,2 https://doi.org/10.1029/2012GL053326, 2012. a
Park, T., Park, W., and Latif, M.: Correcting North Atlantic sea surface salinity biases in the Kiel Climate Model: influences on ocean circulation and Atlantic Multidecadal Variability, Clim. Dynam., 47, 2543–2560, https://doi.org/10.1007/s00382-016-2982-1, 2016. a
Pfahl, S. and Wernli, H.: Quantifying the relevance of atmospheric blocking for co‐located temperature extremes in the Northern Hemisphere on (sub‐)daily time scales, Geophys. Res. Lett., 39, L12807, https://doi.org/10.1029/2012GL052261, 2012. a
Pfahl, S., Schwierz, C., Croci-Maspoli, M., Grams, C. M., and Wernli, H.: Importance of latent heat release in ascending air streams for atmospheric blocking, Nat. Geosci., 8, 610–614, https://doi.org/10.1038/NGEO2487, 2015. a
Pohlmann, H., Muller, W. A., Kulkarni, K., Kameswarrao, M., Matei, D., Vamborg, F. S. E., Kadow, C., Illing, S., and Marotzke, J.: Improved forecast skill in the tropics in the new MiKlip decadal climate predictions, Geophys. Res. Lett., 40, 5798–5802, https://doi.org/10.1002/2013GL058051, 2013. a, b, c
Polkova, I., Brune, S., Kadow, C., Romanova, V., Gollan, G., Baehr, J., Glowienka-Hense, R., Greatbatch, R. J., Hense, A., Illing, S., Köhl, A., Kröger, J., Müller, W. A., Pankatz, K., and Stammer, D.: Initialization and Ensemble Generation for Decadal Climate Predictions: A Comparison of Different Methods, J. Adv. Model. Earth Sy., 11, 149–172, https://doi.org/10.1029/2018MS001439, 2019. a
Prodhomme, C., Batté, L., Massonnet, F., Davini, P., Bellprat, O., Guemas, V., and Doblas-Reyes, F. J.: Benefits of Increasing the Model Resolution for the Seasonal Forecast Quality in EC-Earth, J. Climate, 29, 9141–9162, https://doi.org/10.1175/JCLI-D-16-0117.1, 2016. a
Robson, J., Polo, I., Hodson, D. L. R., Stevens, D. P., and Shaffrey, L. C.: Decadal prediction of the North Atlantic subpolar gyre in the HiGEM high-resolution climate model, Clim. Dynam., 50, 921–937, https://doi.org/10.1007/s00382-017-3649-2, 2018. a
Scaife, A. A., Woollings, T., Knight, J., Martin, G., and Hinton, T.: Atmospheric Blocking and Mean Biases in Climate Models, J. Climate, 23, 6143–6152, https://doi.org/10.1175/2010JCLI3728.1, 2010. a
Scaife, A. A., Copsey, D., Gordon, C., Harris, C., Hinton, T., Keeley, S., O'Neill, A., Roberts, M., and Williams, K.: Improved Atlantic winter blocking in a climate model, Geophys. Res. Lett., 38, L23703, https://doi.org/10.1029/2011GL049573, 2011. a, b, c, d, e
Scherrer, S. C., Croci-Maspoli, M., Schwierz, C., and Appenzeller, C.: Two-dimensional indices of atmospheric blocking and their statistical relationship with winter climate patterns in the Euro-Atlantic region, Int. J. Climatol., 26, 233–249, https://doi.org/10.1002/joc.1250, 2006. a, b
Shaffrey, L. C., Stevens, I., Norton, W. A., Roberts, M. J., Vidale, P. L., Harle, J. D., Jrrar, A., Stevens, D. P., Woodage, M. J., Demory, M. E., Donners, J., Clark, D. B., Clayton, A., Cole, J. W., Wilson, S. S., Connolley, W. M., Davies, T. M., Iwi, A. M., Johns, T. C., King, J. C., New, A. L., Slingo, J. M., Slingo, A., Steenman-Clark, L., and Martin, G. M.: U.K. HiGEM: The New U.K. High-Resolution Global Environment Model – Model Description and Basic Evaluation, J. Climate, 22, 1861–1896, https://doi.org/10.1175/2008JCLI2508.1, 2009. a
Shutts, G. J.: The Propagation of Eddies In Diffluent Jetstreams – Eddy Vorticity Forcing of Blocking Flow-fields, Q. J. Roy. Meteorol. Soc., 109, 737–761, https://doi.org/10.1002/qj.49710946204, 1983. a
Sillmann, J. and Croci-Maspoli, M.: Present and future atmospheric blocking and its impact on European mean and extreme climate, Geophys. Res. Lett., 36, L10702, https://doi.org/10.1029/2009GL038259, 2009. a
Smith, D. M., Cusack, S., Colman, A. W., Folland, C. K., Harris, G. R., and Murphy, J. M.: Improved surface temperature prediction for the coming decade from a global climate model, Science, 317, 796–799, https://doi.org/10.1126/science.1139540, 2007. a, b
Taylor, K. E., Stouffer, R. J., and Meehl, G. A.: An Overview of CMIP5 and the Experiment Design, B. Am. Meteorol. Soc., 93, 485–498, https://doi.org/10.1175/BAMS-D-11-00094.1, 2012. a
Ulbrich, U., Leckebusch, G. C., and Pinto, J. G.: Extra-tropical cyclones in the present and future climate: a review, Theoretical and Applied Climatology, 6th European Conference on Applied Climatology (ECAC), Ljubljana, Slovenia, Sep, 2006, 96, 117–131, https://doi.org/10.1007/s00704-008-0083-8, 2009. a
Uppala, S. M., Kallberg, P. W., Simmons, A. J., Andrae, U., Bechtold, V. D., Fiorino, M., Gibson, J. K., Haseler, J., Hernandez, A., Kelly, G. A., Li, X., Onogi, K., Saarinen, S., Sokka, N., Allan, R. P., Andersson, E., Arpe, K., Balmaseda, M. A., Beljaars, A. C. M., Van De Berg, L., Bidlot, J., Bormann, N., Caires, S., Chevallier, F., Dethof, A., Dragosavac, M., Fisher, M., Fuentes, M., Hagemann, S., Holm, E., Hoskins, B. J., Isaksen, L., Janssen, P. A. E. M., Jenne, R., McNally, A. P., Mahfouf, J. F., Morcrette, J. J., Rayner, N. A., Saunders, R. W., Simon, P., Sterl, A., Trenberth, K. E., Untch, A., Vasiljevic, D., Viterbo, P., and Woollen, J.: The ERA-40 re-analysis, Q. J. Roy. Meteorol. Soc., 131, 2961–3012, https://doi.org/10.1256/qj.04.176, 2005. a
Wang, C., Zhang, L., Lee, S.-K., Wu, L., and Mechoso, C. R.: A global perspective on CMIP5 climate model biases, Nat. Clim. Change, 4, 201–205, https://doi.org/10.1038/nclimate2118, 2014. a
Xin, X. G., Gao, F., Wei, M., Wu, T. W., Fang, Y. J., and Zhang, J.: Decadal prediction skill of BCC-CSM1.1 climate model in East Asia, Int. J. Climatol., 38, 584–592, https://doi.org/10.1002/joc.5195, 2018. a
Zappa, G., Shaffrey, L. C., and Hodges, K. I.: The Ability of CMIP5 Models to Simulate North Atlantic Extratropical Cyclones, J. Climate, 26, 5379–5396, https://doi.org/10.1175/JCLI-D-12-00501.1, 2013. a, b