the Creative Commons Attribution 4.0 License.
the Creative Commons Attribution 4.0 License.
 | 01 Feb 2019
Climatological moisture sources for the Western North American Monsoon through a Lagrangian approach: their influence on precipitation intensity
Raquel Nieto
Luis Gimeno
Pedro Ribera
David Gallego
Carlos Abraham Ochoa-Moya
Arturo Ignacio Quintanar
This work examines the origin of atmospheric water vapor arriving to the western North American monsoon (WNAM) region over a 34-year period (1981–2014) using a Lagrangian approach. This methodology computes budgets of evaporation minus precipitation (E−P) by calculating changes in the specific humidity of thousands of air particles advected into the study area by the observed winds. The length of the period analyzed (34 years) allows the method to identify oceanic and terrestrial sources of moisture to the WNAM region from a climatological perspective.
During the wet season, the WNAM region itself is on average the main evaporative source, followed by the Gulf of California. However, water vapor originating from the Caribbean Sea, the Gulf of Mexico, and terrestrial eastern Mexico is found to influence regional-scale rainfall generation.
Enhanced (reduced) moisture transport from the Caribbean Sea and the Gulf of Mexico from 4 to 6 days before precipitation events seems to be responsible for increased (decreased) rainfall intensity on regional scales during the monsoon peak. Westward propagating mid- to upper-level inverted troughs (IVs) seem to favor these water vapor fluxes from the east. In particular, a 200 % increase in the moisture flux from the Caribbean Sea to the WNAM region is found to be followed by the occurrence of heavy precipitation in the WNAM area a few days later. Low-level troughs off the coast of northwestern Mexico and upper-level IVs over the Gulf of Mexico are also related to these extreme rainfall events.
- Article
(4817 KB) - Full-text XML
- BibTeX
- EndNote


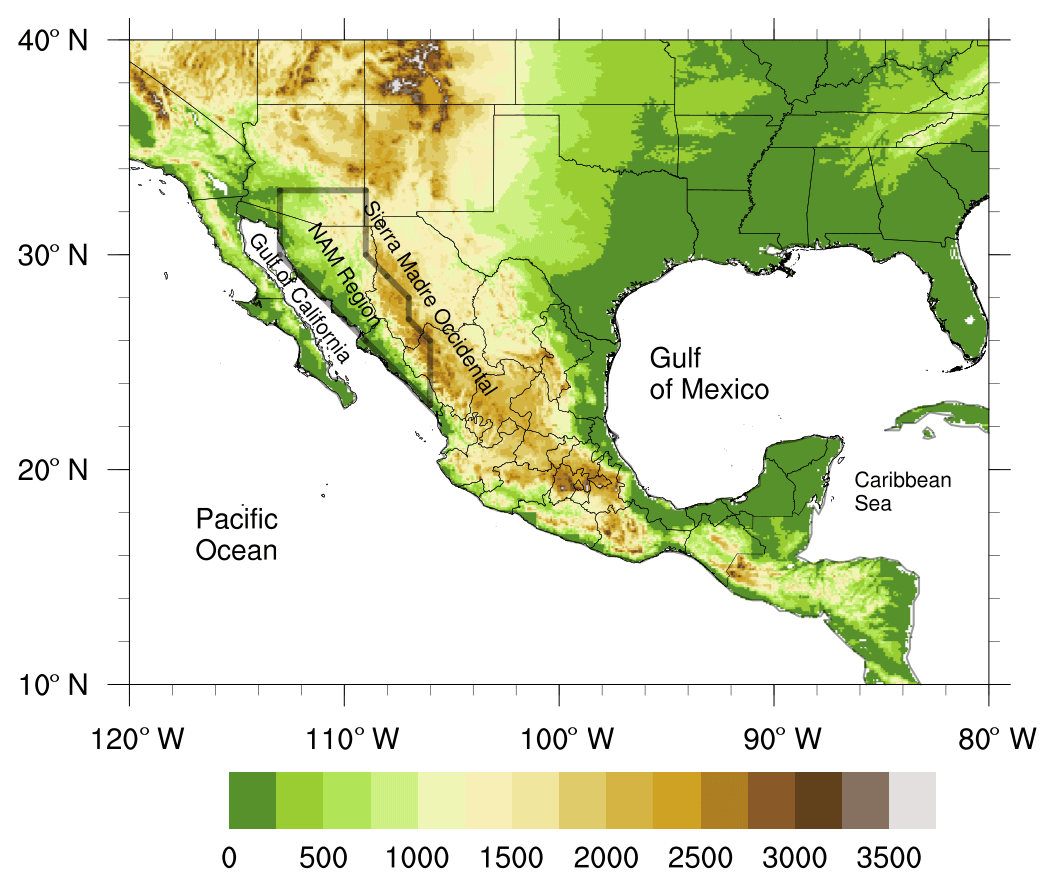
Historical studies used the reversal in large-scale lower tropospheric circulation to identify a monsoon domain (Ramage, 1971). Such monsoon domains were found mainly over tropical areas of the Eastern Hemisphere because the seasonal wind reversal is much more well defined there than over the Americas (Hsu, 2016). In addition to the wind field, precipitation is another fundamental variable that has been more recently used to define a monsoon climate; in a monsoon region the majority of the annual rainfall occurs in summer ( due to the annual cycle of solar heating), while winters are quite dry. This rainfall-based classification of monsoon regions includes the North American and South American monsoon regions that are roughly located over the tropical to subtropical Americas. Particularly, the “North American monsoon” (NAM) region covers much of Central America and central Mexico, extending over northwestern Mexico, and almost reaching to the southwestern US (e.g., Wang and Ding, 2006, 2008; Liu et al., 2009, 2016; Wang et al., 2012, 2018; Huo-Po and Jia-Qi, 2013; Lee and Wang, 2014; Mohtadi et al., 2016).
However, the term “NAM” has also been extensively used to refer to the precipitation of Sinaloa, Sonora (northwestern Mexico), southern Arizona, and New Mexico (southwestern US) (e.g., Douglas et al., 1993; Adams and Comrie, 1997; Higgins et al., 1997, 1999; Barlow et al., 1998; Vera et al., 2006; Higgins and Gochis, 2007). This region is more reduced, covering approximately the northern tip of the region described in the paragraph above. Off the western coast of Sinaloa and Sonora, over the Gulf of California (GOC), there is a seasonal surface wind reversal. During July, August, and September low-level winds over the GOC change from northerly to southwesterly due to the northward displacement of the Pacific high and the development of a thermally induced trough over land; however, this wind reversal is not of sufficient magnitude and scale to meet the Ramage's criteria (Ramage, 1971; Hoell et al., 2016). The annual precipitation is roughly 70 %, 45 %, and 35 % for northwestern Mexico, New Mexico, and Arizona, respectively (Vivoni et al., 2008; Erfani and Mitchell, 2014).
It is important to highlight that the same term is employed in scientific literature to denote the climatic characteristics of different regions. Therefore in this work, the term “western North American monsoon (WNAM)” is hereafter used to refer to the summer climate of northwestern Mexico and the southwestern US, which distinguishes this monsoonal region with its own regional characters from the larger NAM region that extends northward from the Equator.
The identification of the origin of the water available for precipitation in a region constitutes a very complex problem. Over the years, it has been accepted that moist air moves into the WNAM system on a broad band of middle troposphere southeast winds from the Gulf of Mexico (GOM) (Jurwitz, 1953; Bryson and Lowry, 1955; Green and Sellers, 1964). Later studies have claimed that the eastern tropical Pacific and boundary layer flow from the GOC are the major sources of moisture for the WNAM system (Douglas, 1995; Stensrud et al., 1995; Berbery, 2001; Mitchell et al., 2002), while the middle tropospheric transport has also remained important (Schmitz and Mullen, 1996). In addition to mean flow moisture transport, transient features such as the “gulf surge”, a coastally trapped disturbance that is typically initiated by a tropical easterly wave or tropical storm that crosses near the GOC entrance and is then propagated northwestward along the GOC axis (Rogers and Johnson, 2007; Newman and Johnson, 2013), are also important mechanisms for initiating precipitation in the WNAM region. A gulf surge is termed wet or dry depending on if the surge is followed by positive or negative spatially averaged mean precipitation anomalies over Arizona and/or western New Mexico (Hales, 1972; Stensrud et al., 1997; Higgins et al., 2004; Pascale and Bordoni, 2016). Wet surges occur between 7 and 10 times during the monsoon season (Pascale et al., 2016). Transient upper-level inverted troughs (IVs), cold-core cut off lows, open troughs in the westerlies, and surface fronts (Douglas and Engelhardt, 2007; Seastrand et al., 2015) also contribute to precipitation events in the WNAM area. Gulf surges often occur in conjunction with such disturbances, particularly IVs, to produce rainfall over the northern WNAM region (Stensrud et al., 1997; Fuller and Stensrud, 2000; Higgins et al., 2004; Bieda et al., 2009; Newman and Johnson, 2012; Seastrand et al., 2015).
Today it is widely accepted that both the middle-level easterly moisture from the GOM and the southwesterly low-level moisture from the GOC contribute to monsoonal precipitation. In addition, other studies have highlighted the role of surface soil moisture and vegetation dynamics in the WNAM region (e.g., Dominguez et al., 2008; Méndez-Barroso et al., 2009; Mendez-Barroso and Vivoni, 2010; Bohn and Vivoni, 2016; Xiang et al., 2018). Specifically, Hu and Dominguez (2015) found that terrestrial sources contribute approximately 40 % of monsoonal moisture using the extended dynamic recycling model (DRM, Dominguez et al., 2006). Bosilovich et al. (2003) used water vapor tracer diagnostics in global numerical simulations to quantify the effect of local continental evaporation on monsoon precipitation. These authors found that local evaporation is the second most important source of precipitation after the GOM. Dominguez et al. (2016) used water vapor tracer diagnostics in a regional climate model to quantify the water vapor from four different oceanic and terrestrial regions that contribute to precipitation during the WNAM season. They documented that local recycling is the second most important source after the lower-level moisture from the GOC. Therefore, despite the large number of studies of WNAM moisture sources, the major moisture sources to the WNAM system and their relative importance are still actively debated.
In this work, we use the Lagrangian particle dispersion model FLEXPART to analyze the water vapor transport towards the WNAM region. Evaporation minus precipitation (E−P) is tracked from the WNAM area along the backward trajectories of appropriately selected particles, thereby facilitating the determination of water source–receptor relationships. This work addresses two main objectives: (1) define the main moisture sources for the WNAM region, and (2) determine the moisture transport that contributes to the regional-scale rainfall intensity over the WNAM area. In Sect. 2 the data and methods are presented, followed by the results in Sect. 3. We dedicate Sect. 4 to the main conclusions of the study.
2.1 Lagrangian diagnostic of E−P for the WNAM region
This work makes use of the method developed by Stohl and James (2004, 2005) with respect to quantifying the atmospheric water vapor transport towards a region using the Lagrangian particle dispersion model FLEXPART (Stohl et al., 2005), which is driven by meteorological gridded data. At the start of the model, the atmosphere is homogeneously divided into a large number of air parcels (particles), each representing a fraction of the total atmospheric mass. The particles are then allowed to move freely with the observed wind, overlapping stochastic turbulent and convective motions (Stohl et al., 2005) while maintaining their mass constant. Particle positions and their specific humidity are recorded every 6 h. For each particle the net rate of change in water vapor content is computed using the changes in specific humidity over time:
where q is the specific humidity, m is the mass of the particle, and e and p are the rates of moisture increases and decreases of the particle along the trajectory, respectively. To diagnose the net surface water flux in an area A, the moisture changes of all particles in the atmospheric column over A are aggregated giving the field (E−P):
where K is the number of particles residing over the area A, E is the evaporation rate, and P is the precipitation rate per unit of area.
Finally, to find the moisture sources of a region, the (e−p) of all of the particles located over the region at a given time is evaluated along their back trajectories. By integrating the humidity changes (i.e., the moisture increases and decreases) of all of these particles, it is possible to find the areas where the particles have either gained () or lost moisture () along their path. It is also feasible to find the day of the recharge preceding the arrival of the particles at the target region. When a long enough period is analyzed, the mean moisture sources can be described from a climatological point of view. Note that, as the particles originally located over the target region disperse, the particles residing in an atmospheric column no longer represent its entire atmospheric mass, and only constitute the part of the column fulfilling the criterion that later reaches the target. Therefore, (E−P) values do not represent the surface net water vapor flux, and can only be regarded as the net water vapor flux into the air mass traveling to the target region (Stohl and James, 2005).
In this study FLEXPARTv9 was run for a 34-year period from 1981 to 2014 and was driven by ERA-Interim reanalysis data at a resolution (Dee et al., 2011). These data are available on 61 model levels from 0.1 to 1000 hPa; there are approximately 14 model levels below 1500 m and 23 below 5000 m. This 34-year period was the span for which data was available at the time that the experiment was carried out. We used analyses every 6 h (00:00, 06:00, 12:00, and 18:00 UTC) and 3 h forecasts at intermediate times (03:00, 09:00, 15:00, and 21:00 UTC). The 3 h forecasts are used here to supplement the analyses because the time resolution is critical for the accuracy of Lagrangian trajectories (Stohl et al., 1995). The abovementioned method was applied backward in time from the WNAM region shown in Fig. 1. The boundary selected to represent the WNAM region is similar to that used by Hu and Dominguez (2015), whose core WNAM region was also consistent with the North American Monsoon Experiment (NAME; Higgins and Gochis, 2007) and the NAME precipitation zones defined by Castro et al. (2012).
To establish the transport time adequately represented by FLEXPART, we used the Climate Hazards Group InfraRed Precipitation with Station data (CHIRPS) (Funk et al., 2015). CHIRPS integrates 0.05∘ resolution satellite imagery with in situ station data and was shown by Perdigón-Morales et al. (2018) to properly reproduce some of the particular characteristics of Mexican rainfall such as the midsummer drought. The minimum absolute difference between the precipitation simulated by FLEXPART and the “real” precipitation over the WNAM defined by CHIRPS was 6 days, so we limited the transport time to this period. This life span was also computed with ERA-Interim precipitation data with similar results. Further details regarding this methodology can be found in Miralles et al. (2016).
Limitations of FLEXPART
FLEXPART requires only self-consistent meteorological analysis data as input. The accuracy of the data employed is critical, as errors in these data can lead to systematic miscalculations of (E−P). For instance, as the flux (E−P) is diagnosed using the time derivate of humidity, unrealistic fluctuations of humidity could be identified as water vapor fluxes. If these fluctuations are random, they will cancel over longer periods of time. However, if the trajectory data suffer from substantial inaccuracies, even if these errors are random, results can be systematically affected. This could be the case if, for instance, a particle that is originally located in a relatively moist air mass leaves this air mass due to trajectory errors and enters a drier air mass. The humidity would then decrease along this trajectory, and would be erroneously diagnosed. The opposite is true for relatively dry air masses, i.e., (E−P) would be systematically too large for trajectories from dry regions (Stohl and James, 2005). In this sense, the ERA-Interim reanalysis data used in this study have been found to provide a reliable representation of the atmospheric branch of the hydrological cycle when compared to other reanalysis products such as CFSR or MERRA (Trenberth et al., 2011; Lorenz and Kunstmann, 2012).
A second limitation is imposed by computational constraints. We executed FLEXPART driven by ERA-Interim data at a spatial resolution. Global-scale atmospheric models with this grid spacing do not resolve convective clouds, and even the mesoscale convective systems with horizontal dimensions in the order of a couple of hundred kilometers are not sufficiently resolved and must be parameterized (Foster et al., 2007). However, analogous works on moisture transport diagnosis have achieved promising results for tropical regions where convective rainfall clearly dominates, using this relatively coarse resolution (e.g., Duran-Quesada et al., 2010; Drumond et al., 2011; Hoyos et al., 2018). Nevertheless, given this limitation, we opted not to evaluate processes that occur over the WNAM region at the local scale (sub-grid) or over a very short periods of time (sub-daily).
Traditionally, the search for the origin of precipitation has been approached using so-called Eulerian methods, based on the analysis of the divergent part of the vertically integrated moisture flux (VIMF). Eulerian methods are considered quite accurate at approximating E−P (Simmonds et al., 1999; Ruprecht and Kahl, 2003; Mo et al., 2005); however, for this study we opted to use a Lagrangian approach for two main reasons. First, Stohl and James (2005) obtained practically identical results using a Lagrangian approach based on FLEXPART and the Eulerian equivalent. Second, a Lagrangian approach allows forward or backward tracking along defined trajectories, facilitating the determination of the source–receptor water vapor relationships. Nevertheless, in order to asses our results, here we make use of the VIMF to validate the moisture budgets calculated using FLEXPART. We based this comparison on both ERA-Interim data and the more recent “Modern-Era Retrospective analysis for Research and Applications V2” dataset (MERRA-2: Bosilovich et al., 2017). MERRA-2 was chosen because it incorporates an improved water cycle.
2.2 Tracking E−P for individual precipitation events
The methodology described in Sect. 2.1 determines the average net changes of q for air particles aimed toward the study area, but the moisture transported towards the WNAM region does not always generate effective precipitation. This limitation can be overcome by tracking the air particles that arrive at the WNAM during wet and dry days separately. Therefore, a definition of wet and dry days over the WNAM region is necessary. For this purpose, daily CHIRPS data are used which have a spatial resolution of , and the assessment of long-term statistics is also performed on a 34-year (1981–2014) period. A “common wet day” for the WNAM area is defined as a rainfall day covering a large proportion of the study area. This is achieved using the methodology described in Ordoñez et al. (2012). At each grid point, precipitation values above 10 % of the standard deviation computed for all of the grid points in the study area are considered individual precipitation events for that day. Next, the percentage of precipitation days for each grid point is computed and the averaged value is then obtained for all grids (20.3 %). To define a wet day across the WNAM region we compute the percentage of grid points inside the region that must have simultaneous precipitation in order to obtain the annual value of average precipitation over the region. This resulted in a value of 41.3 %, and a total of 2513 days were classified as wet days for the entire WNAM region during the study period. Figure 2 shows the monthly distribution of precipitation events throughout the year according to this methodology.
An analogous method is employed to classify the wet days according to their intensity. To define moderate and extreme precipitation events, the 50th (P50) and 90th (P90) percentiles of the precipitation time series at each grid point are computed. We then require that these percentiles be simultaneously exceeded in at least 41.3 % of the grid points inside the WNAM area. In this fashion, the method assures that a moderate or extreme rainfall event is characterized by a well determined precipitation value that covers a significant portion of the WNAM region. Weak precipitation days are the remaining wet days. Figure 3 shows the yearly precipitation composites for the different precipitation categories. The general increase in the precipitation area as precipitation intensity increases for wet days is clearly shown in Fig. 3b–d.
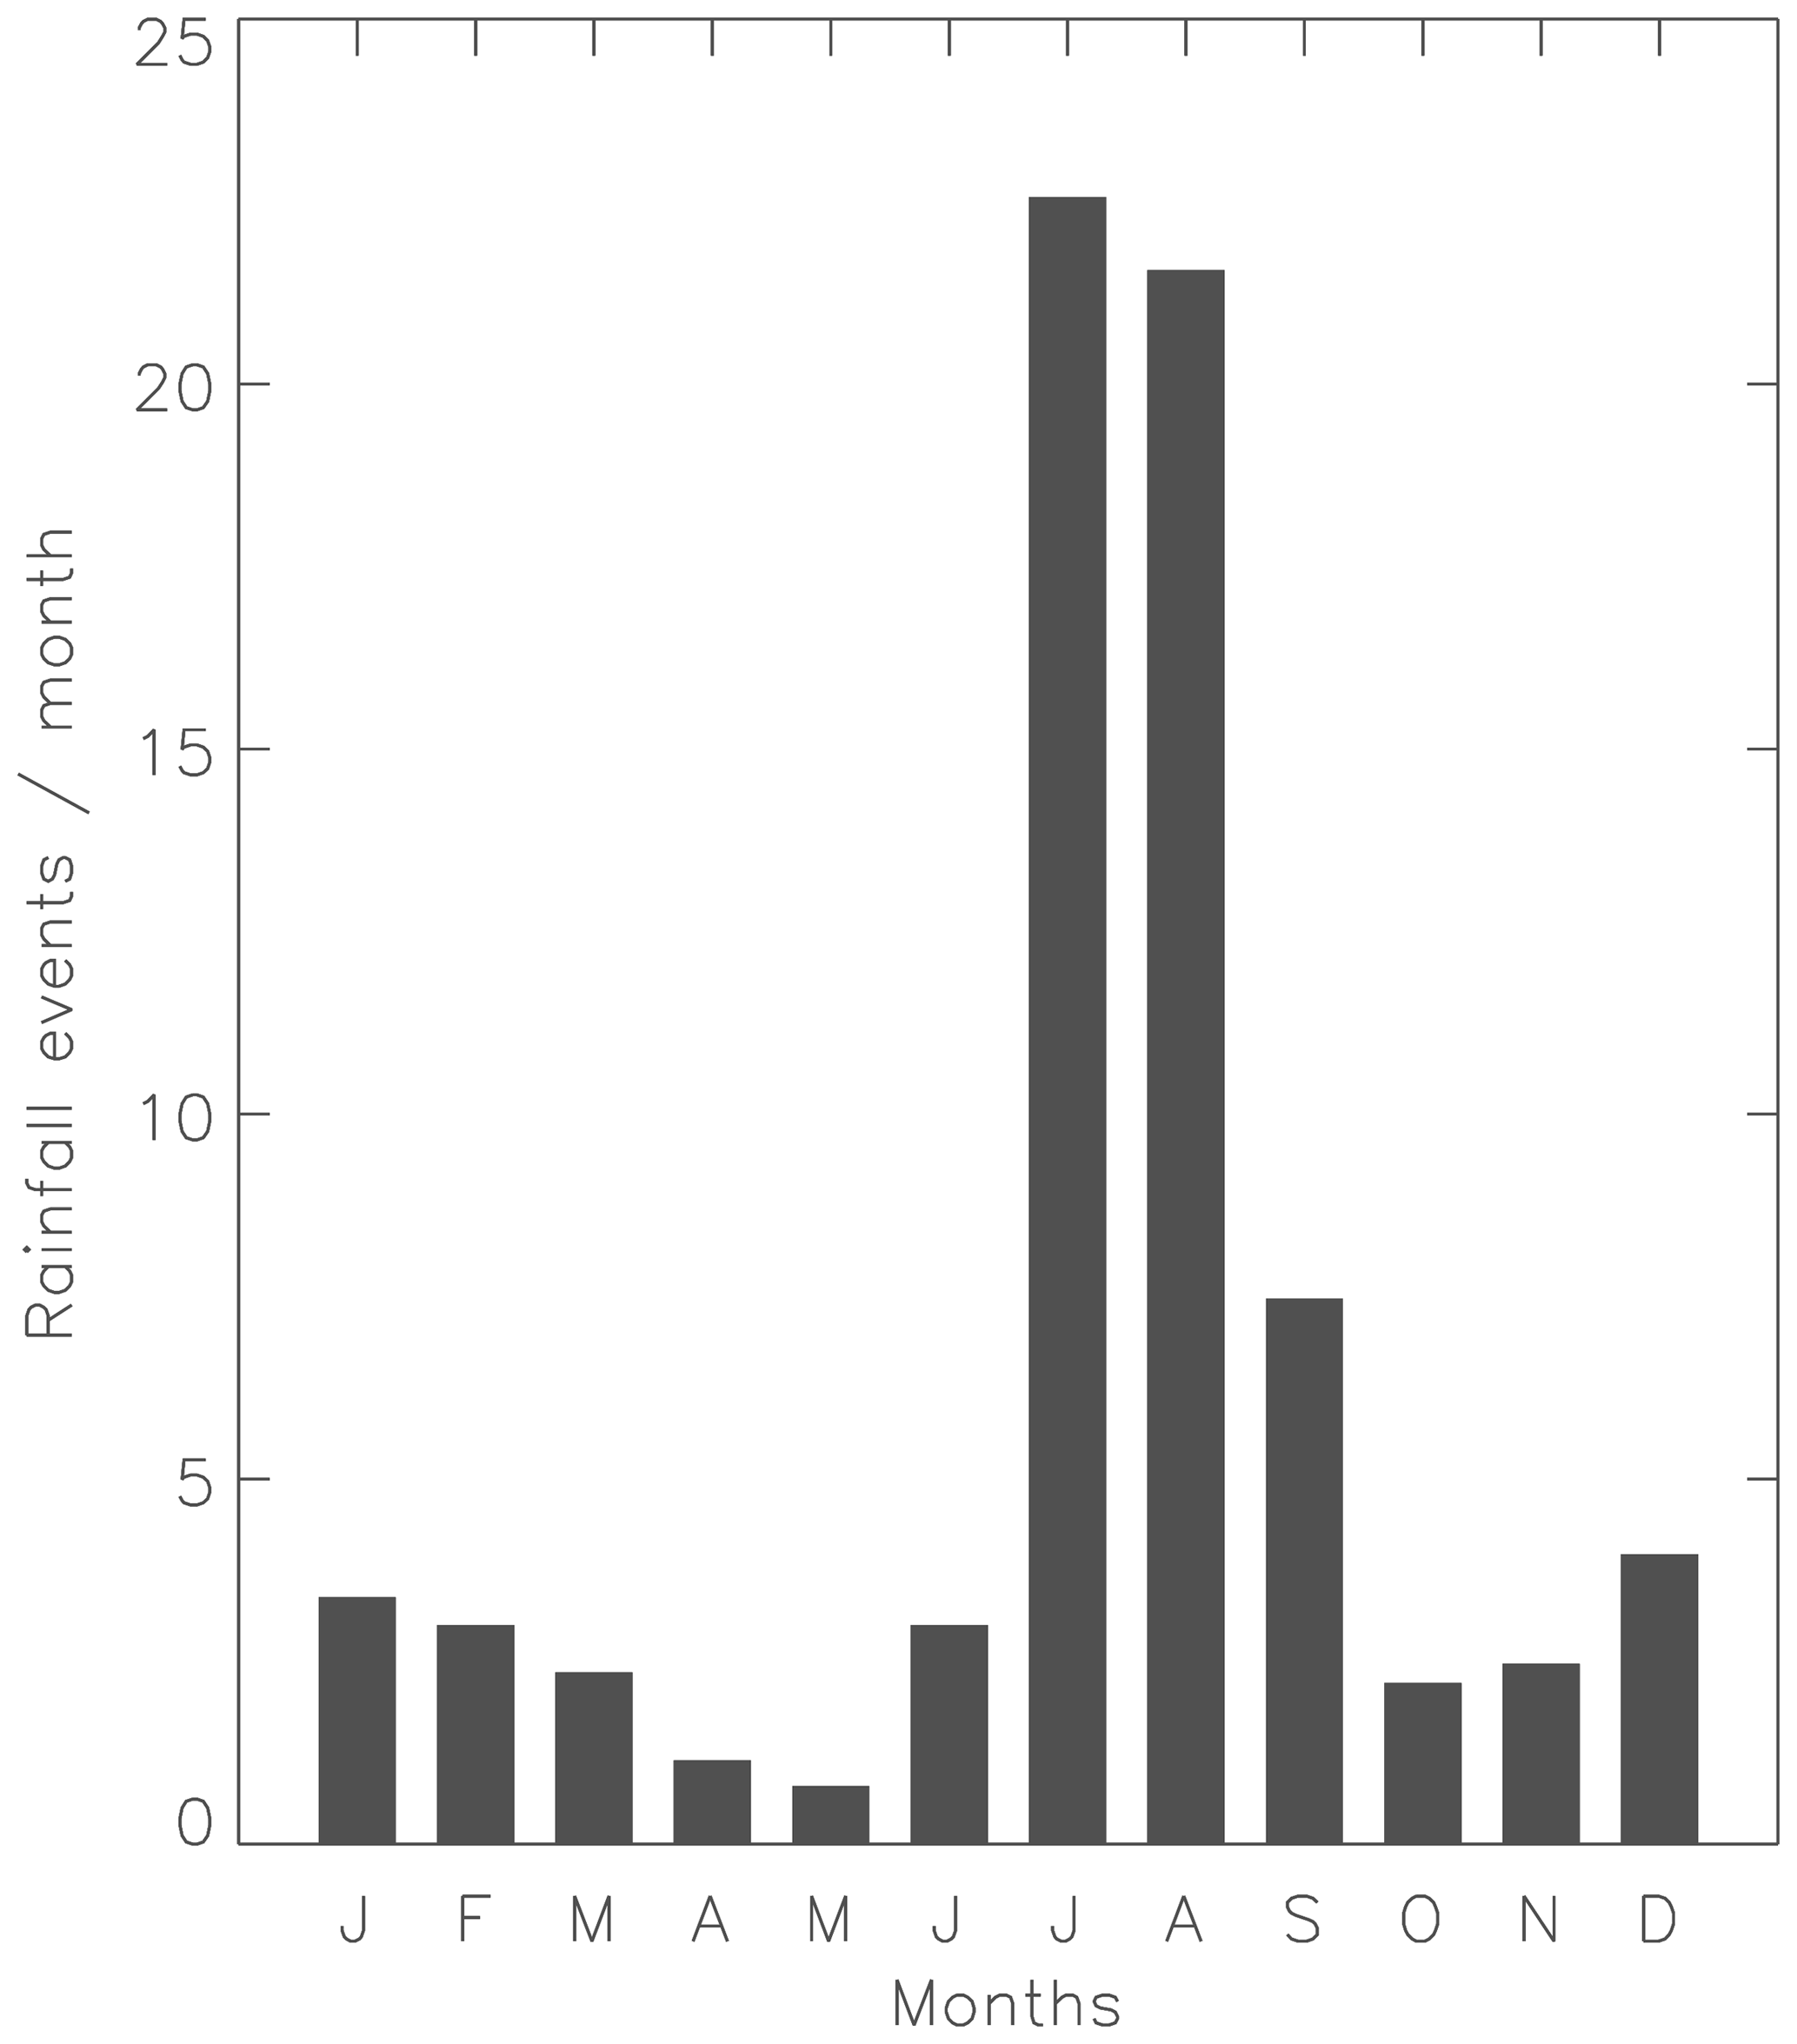
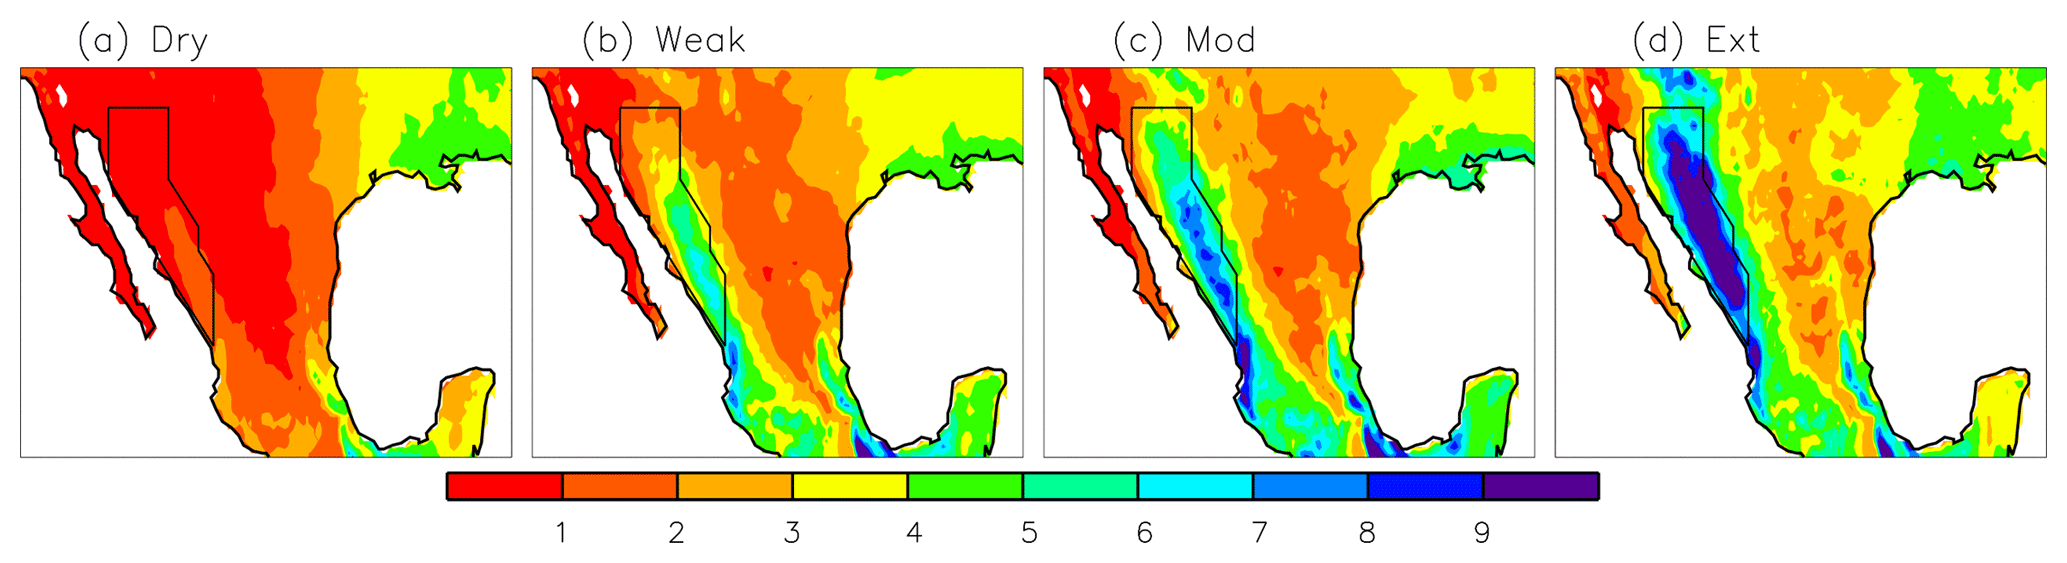
Figure 3Mean daily rainfall (in mm day−1 for the period from 1981 to 2014) for the (a) dry days, (b) weak precipitation days, (c) moderate precipitation days, and (d) extreme precipitation days over the WNAM region. The black boundary delineates the study region.
The accuracy of FLEXPART regarding the capture of rainy days in relation to CHIRPS is also tested by comparing the average (E−P) values obtained by FLEXPART over the WNAM domain during the first 6 h time step of the trajectories for the different precipitation events against the average values obtained using CHIRPS. In making this comparison, we are assuming that E and P cannot coexist in the same point of space and time. Under this assumption, the instantaneous rates of evaporation or precipitation can be diagnosed by FLEXPART. Note that FLEXPART fails to diagnose precipitation during the weak and moderate rainfall events, yielding low positive (E−P) values. This result indicates that not all of the moisture particles traced by FLEXPART contribute to the precipitation events. However, the annual mean of (E−P) in the WNAM region diagnosed by FLEXPART during extreme precipitation events is below −11.4 mm day−1, whereas CHIRPS indicates values below 9 mm day−1 of rainfall in most of the grid cells (see Fig. 3d). This suggests that FLEXPART is reliable for capturing extreme precipitation events over the region.
In order to estimate the actual evaporation over the moisture source regions we used the state-of-the-art Global Land Evaporation Amsterdam Model (GLEAM). The monthly evaporation from land was estimated from GLEAM v3.2 data at a resolution which is largely driven by satellite data (Miralles et al., 2011).
Furthermore, we used different climatic fields (geopotential height, specific humidity, and horizontal winds components) from the ERA-Interim reanalysis in order to extract information about regional-scale patterns associated with the different rainfall intensity categories over the WNAM region defined above.

Figure 4Monthly averaged values of (E−P)1–6 (mm day−1) for all of the particles aimed toward the WNAM region during (a) June, (b) July, (c) August, and (d) September (period of study: 1981–2014). The black boundary delineates the study region.
3.1 Moisture sources for the WNAM region
Figure 4 shows the 6-day aggregated monthly average values of water vapor flux (E−P) before air masses aimed towards the WNAM reach the region for the period from 1981 to 2014. (E−P)n designates the water vapor flux value for day “n” before arrival to the target area. The sum of the net water vapor flux from day 1 to day 6 (the sum of (E−P)1, (E−P)2, …, (E−P)6) is denoted using (E−P)1–6. Although the WNAM season is usually defined as being from July to September, we found several regional-scale precipitation events during June (see Fig. 2); hence, the results for the 4 months from June to September are presented in Fig. 4. Reddish (bluish) colors are used to show regions of water vapor gain, (loss, ), according to the sign of dq∕dt of particles following their trajectories. The northeastern Pacific off the coast of the US and the GOC are found to be net moisture sources during the summer. The monthly analysis shows that the terrestrial region east of the WNAM domain is also an active source throughout the summer. In addition, there are source regions over the GOM and the Caribbean Sea that seem to be significant – primarily during July and August. The southwestern US also appears as a source region from June to September, where evaporation is larger than precipitation. Finally, the WNAM region itself seems to be an evaporative moisture source for the whole region in June and September, whereas during July and August only the northern section of the WNAM acts as an evaporative moisture source, while the southern WNAM section indicates negative (E−P)1–6 values, suggesting that this area is a sink of moisture during the peak monsoon.
Figure 5 depicts the average VIMF divergence for the same months (June to September) for the study period using ERA-Interim reanalysis data at a resolution. Positive values indicate moisture flux divergence () while negative values indicate moisture flux convergence (). The Eulerian results are quite similar to the Lagrangian diagnostics. Even the temporal variability over the eastern WNAM region, the GOM, and the Caribbean Sea is very similar, showing higher contributions during July and August compared with June and September. The main difference is seen over the Pacific Ocean, where the Eulerian method indicates VIMF divergence that does not appear as a moisture source when using the Lagrangian approach. However, we found that the moisture flux over this oceanic region is not aimed toward the WNAM domain. Therefore, the agreement between the Lagrangian and the Eulerian diagnostics is excellent. The Eulerian diagnostic performed with MERRA-2 data at resolution (not shown) does not capture the seasonal variability over eastern Mexico and the Caribbean Sea, but otherwise the monthly VIMF divergence patterns are consistent with those performed using ERA-Interim data.
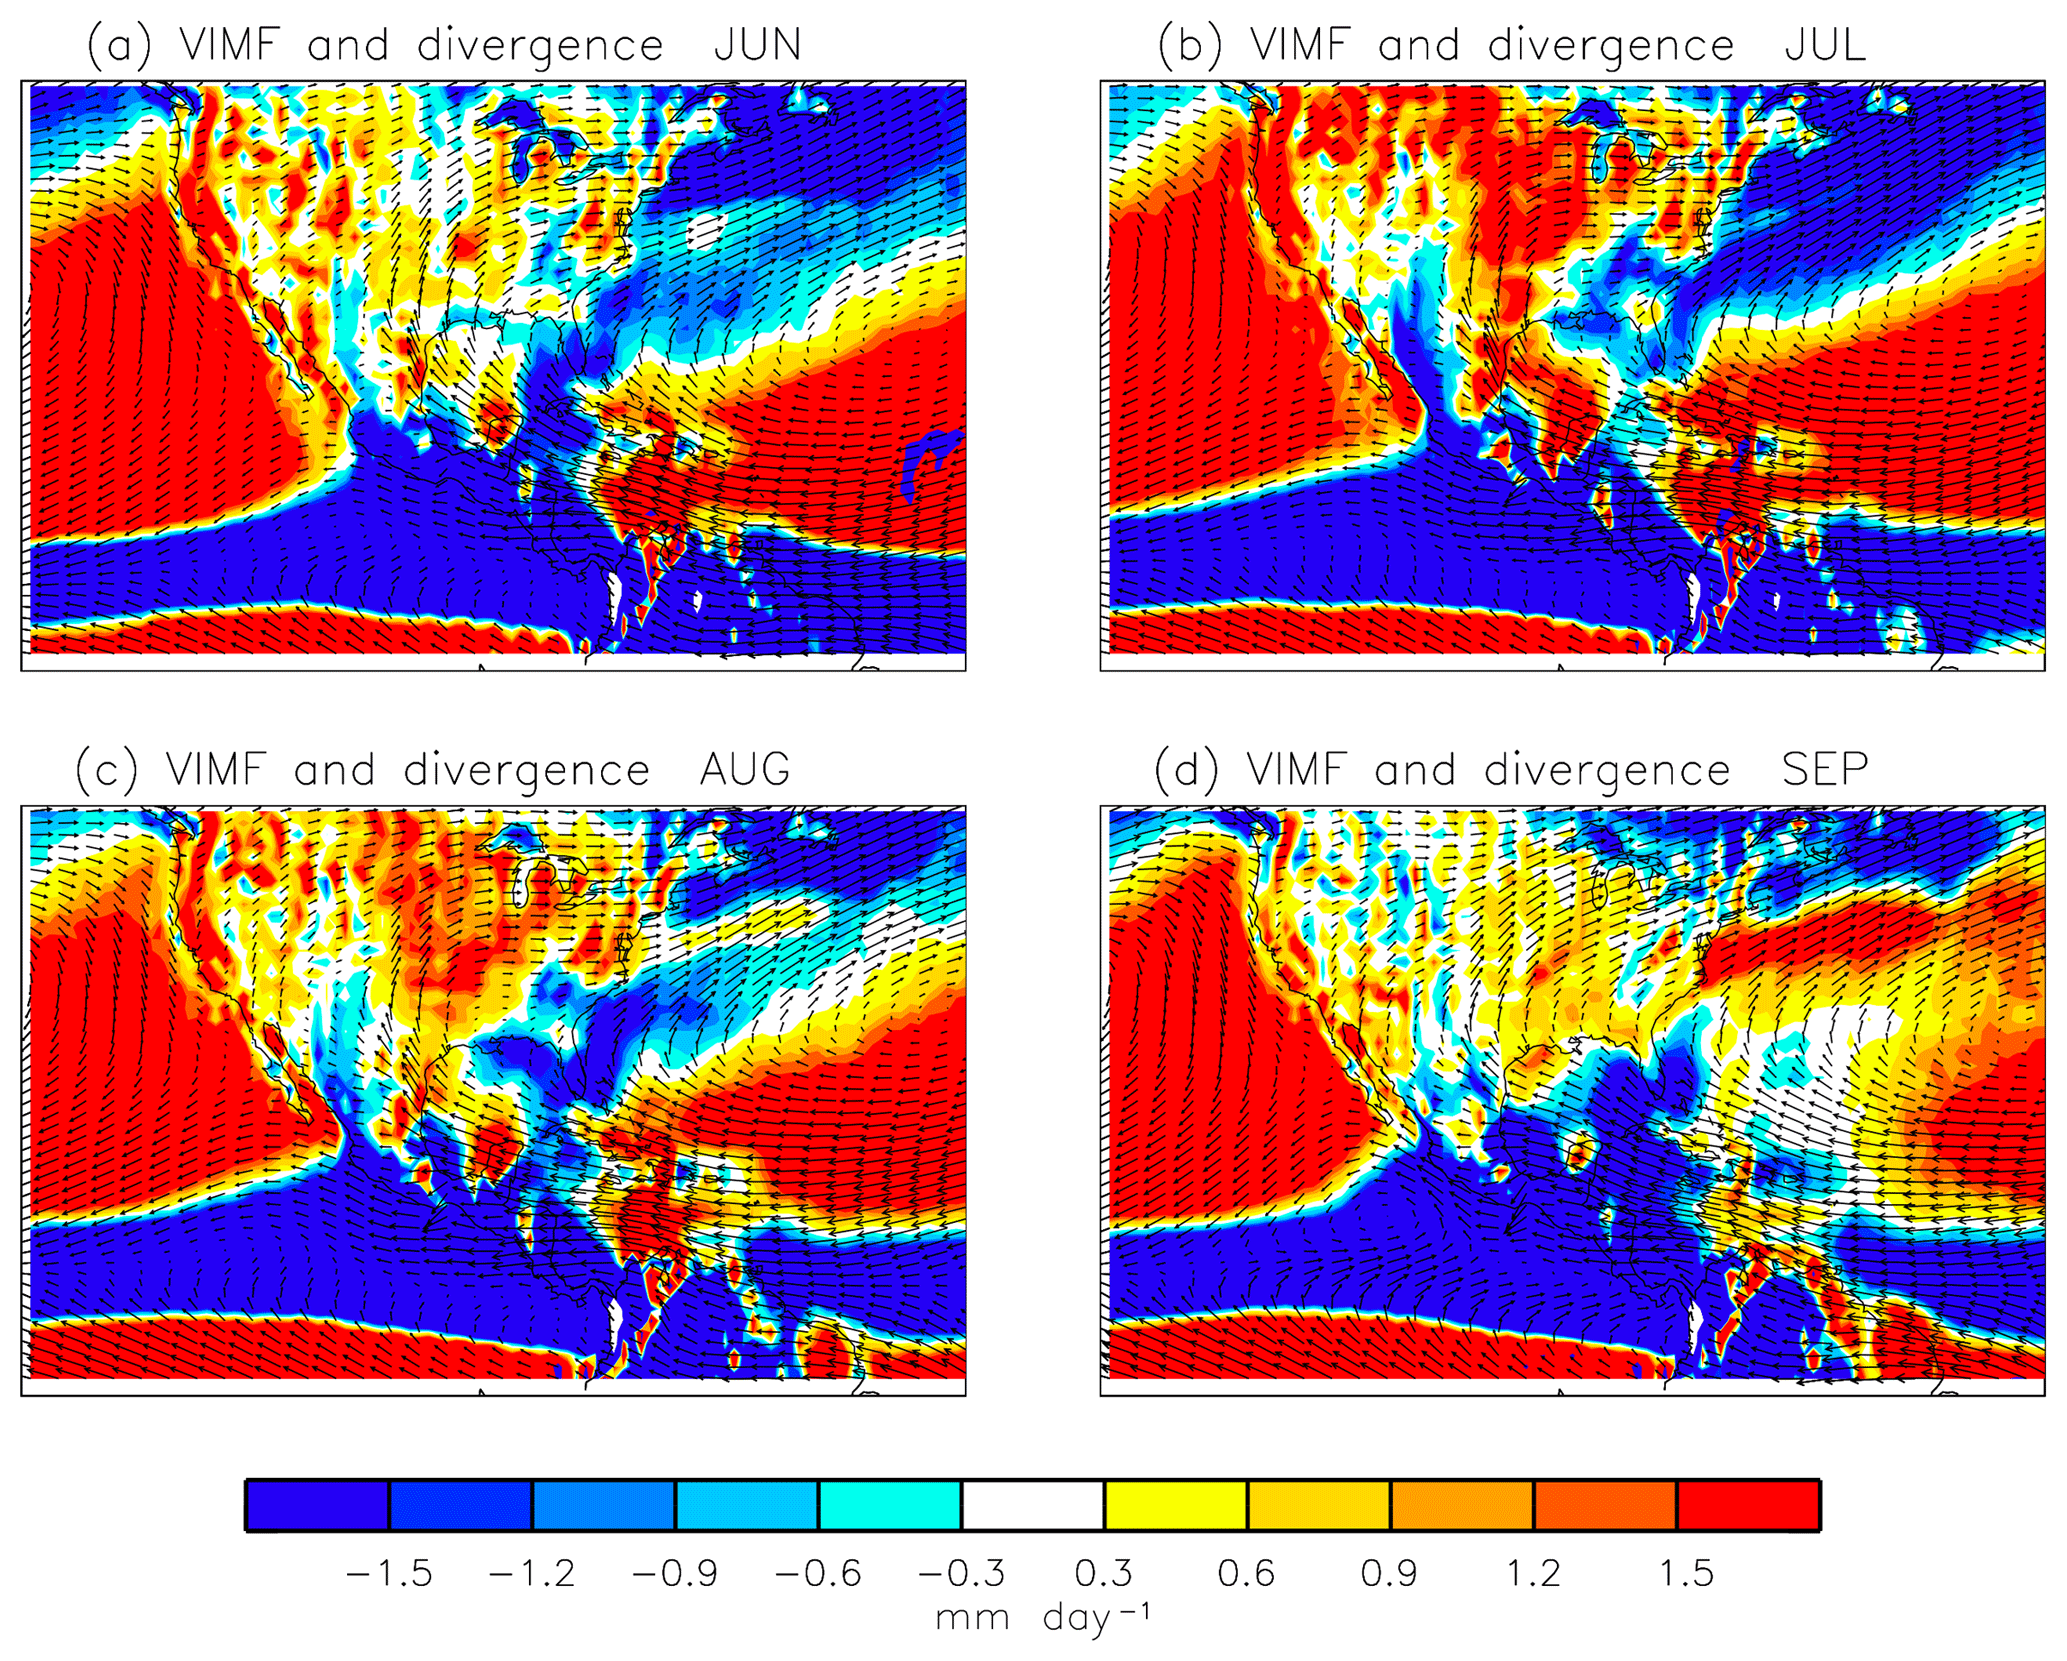
Figure 5Monthly averaged values of vertically integrated moisture flux (VIMF; kg m−1 s−1) and divergence–convergence (reddish–bluish colors) (mm day-1).
According to these results, six main moisture sources for the WNAM region have been defined: (1) the WNAM region itself (WNAM); (2) the terrestrial region east of the WNAM domain (NE-MEX); (3) the Atlantic which includes a part of the GOM and the Caribbean Sea (GOM-CAR); (4) the southwestern US, toward the north of the WNAM domain (SW-US); the Pacific which includes (5) the northeastern Pacific (NEP); and (6) the GOC (GOC). Figure 6 shows their boundaries. These source regions were defined using the values of greater than P90 for the period from June to September. The summer monthly evolution of (E−P)1–6 integrated for these fixed areas is shown in Fig. 7. During June, the inland evaporative source over the WNAM itself and the water vapor from the GOC are the main moisture sources for the WNAM system. In July, SW-US provides a slightly greater amount of moisture than these regions. The situation is a little different for August, when the WNAM region is the main source and the NE-MEX region shows its peak (E−P)1–6 values. September is characterized by the peak contribution from the WNAM region, while the relative contribution from the remaining sources decrease with respect to their August values.
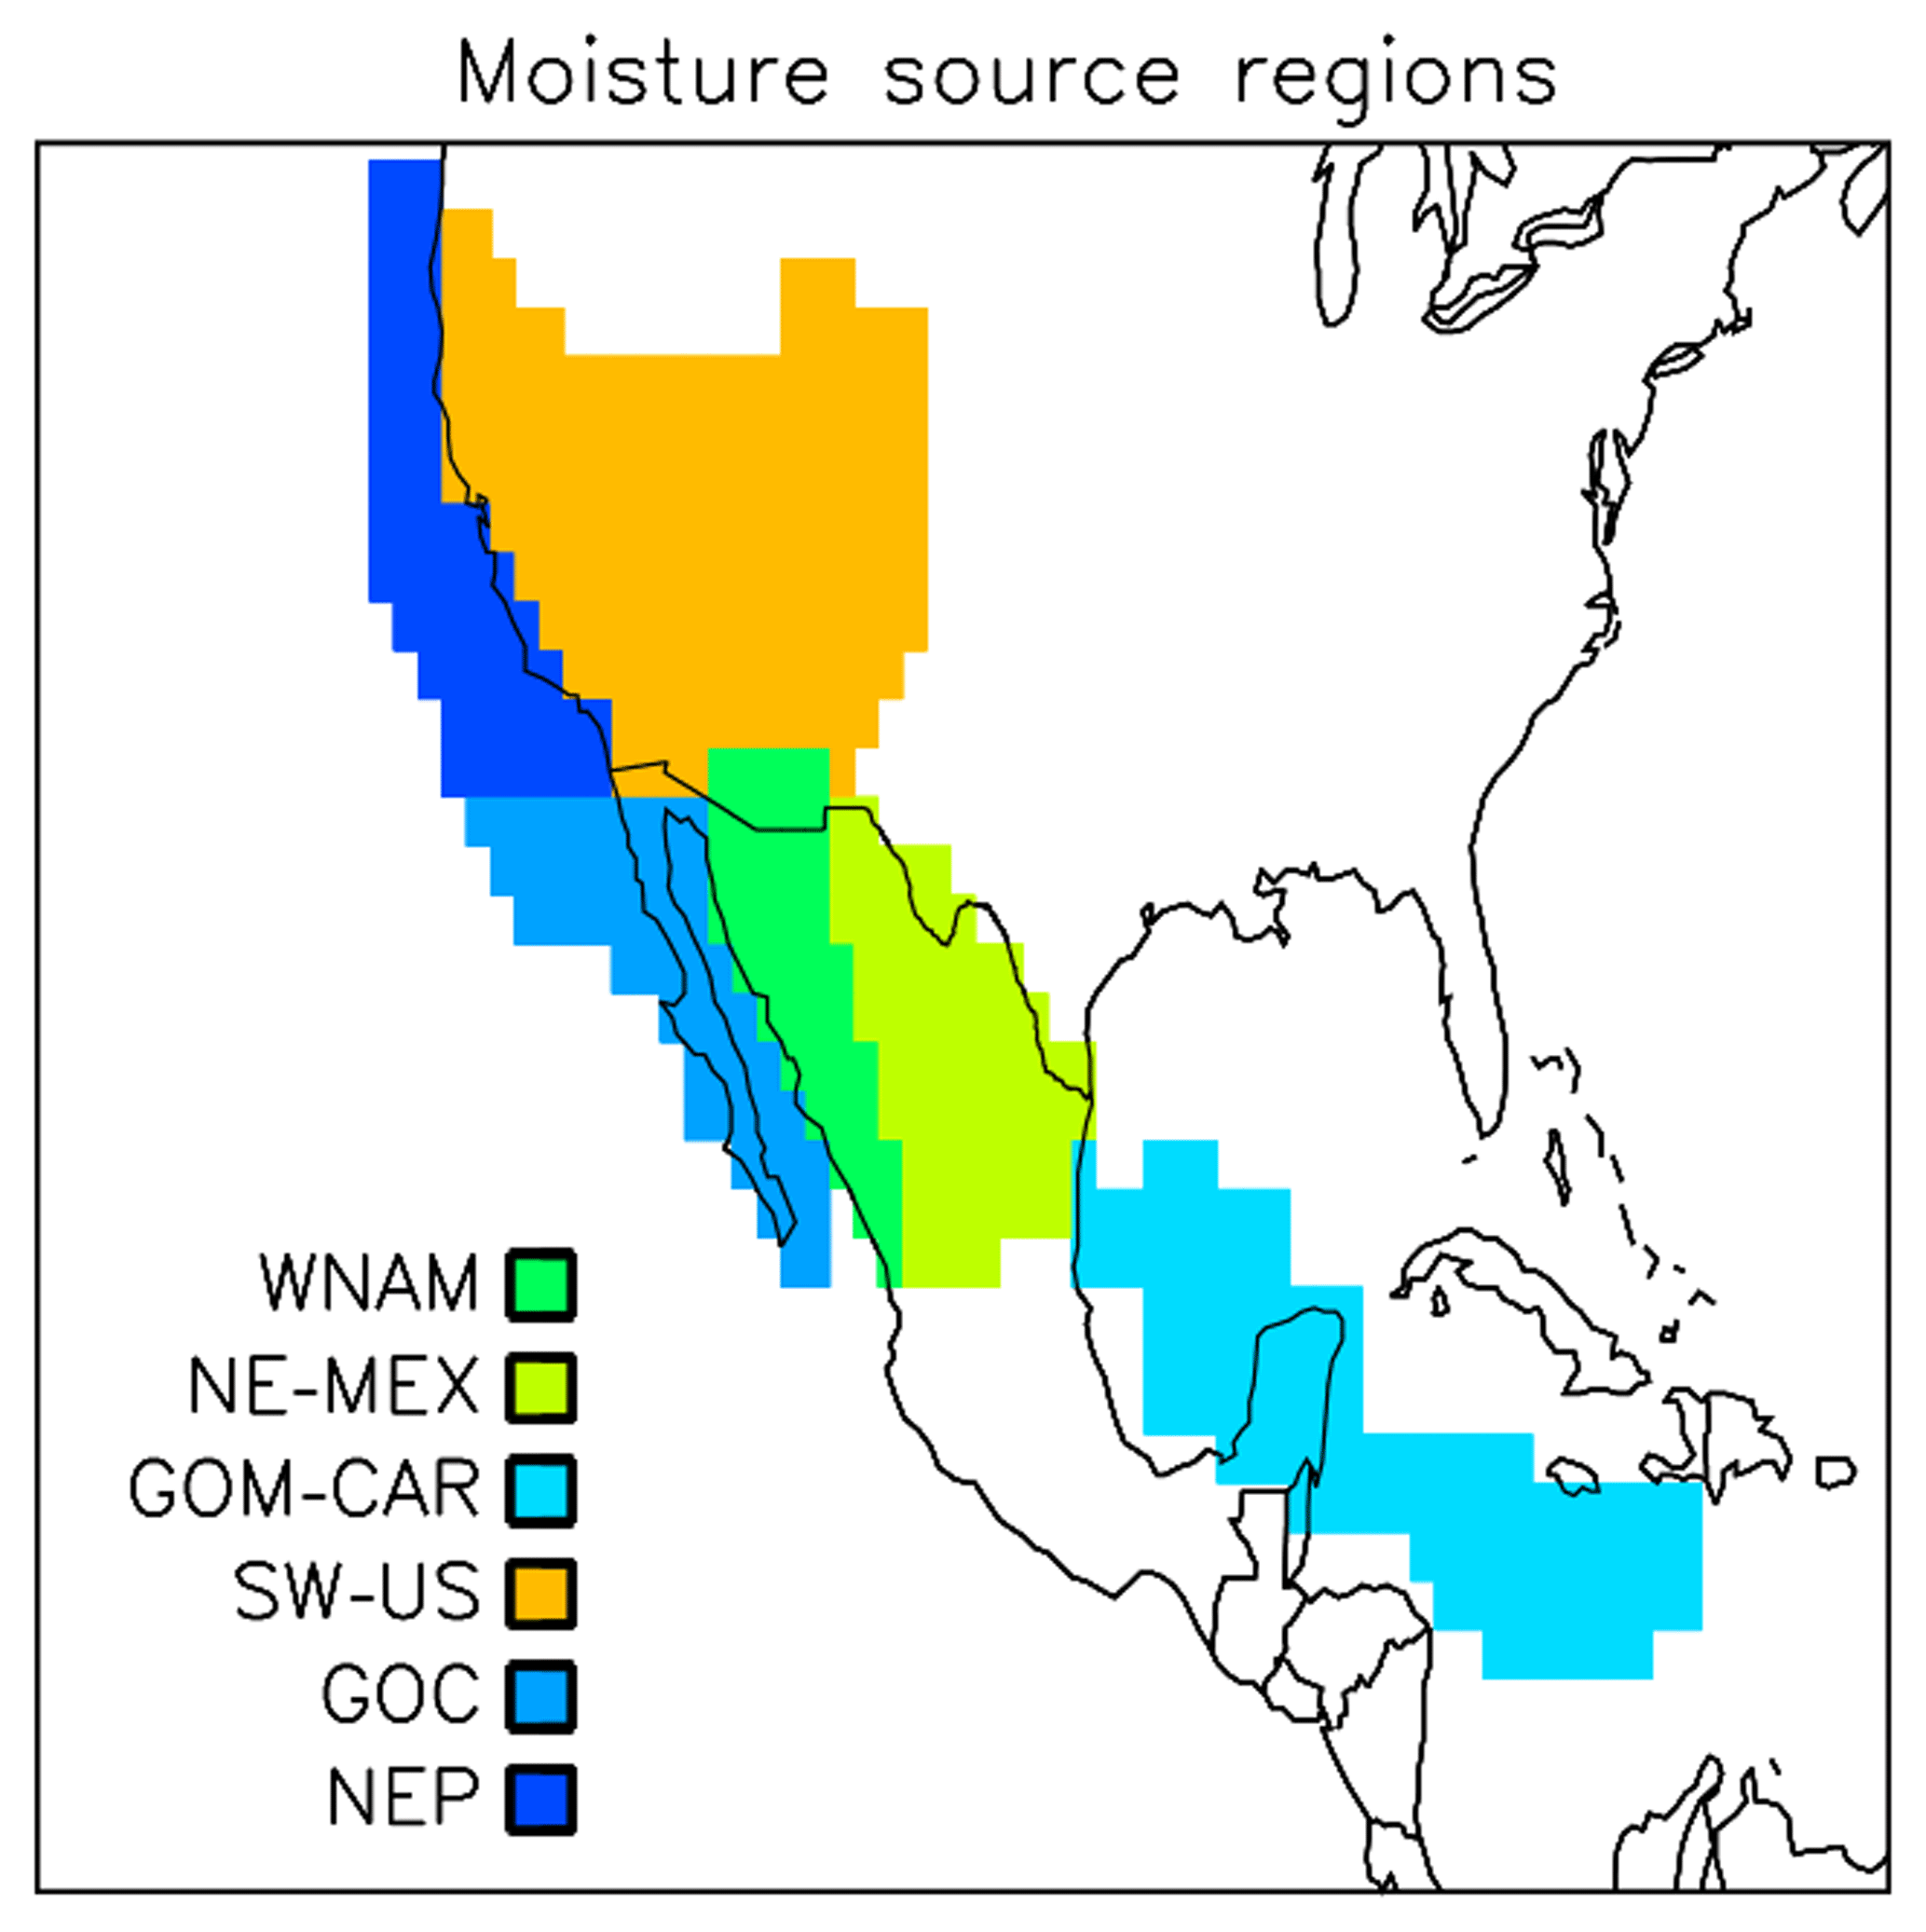
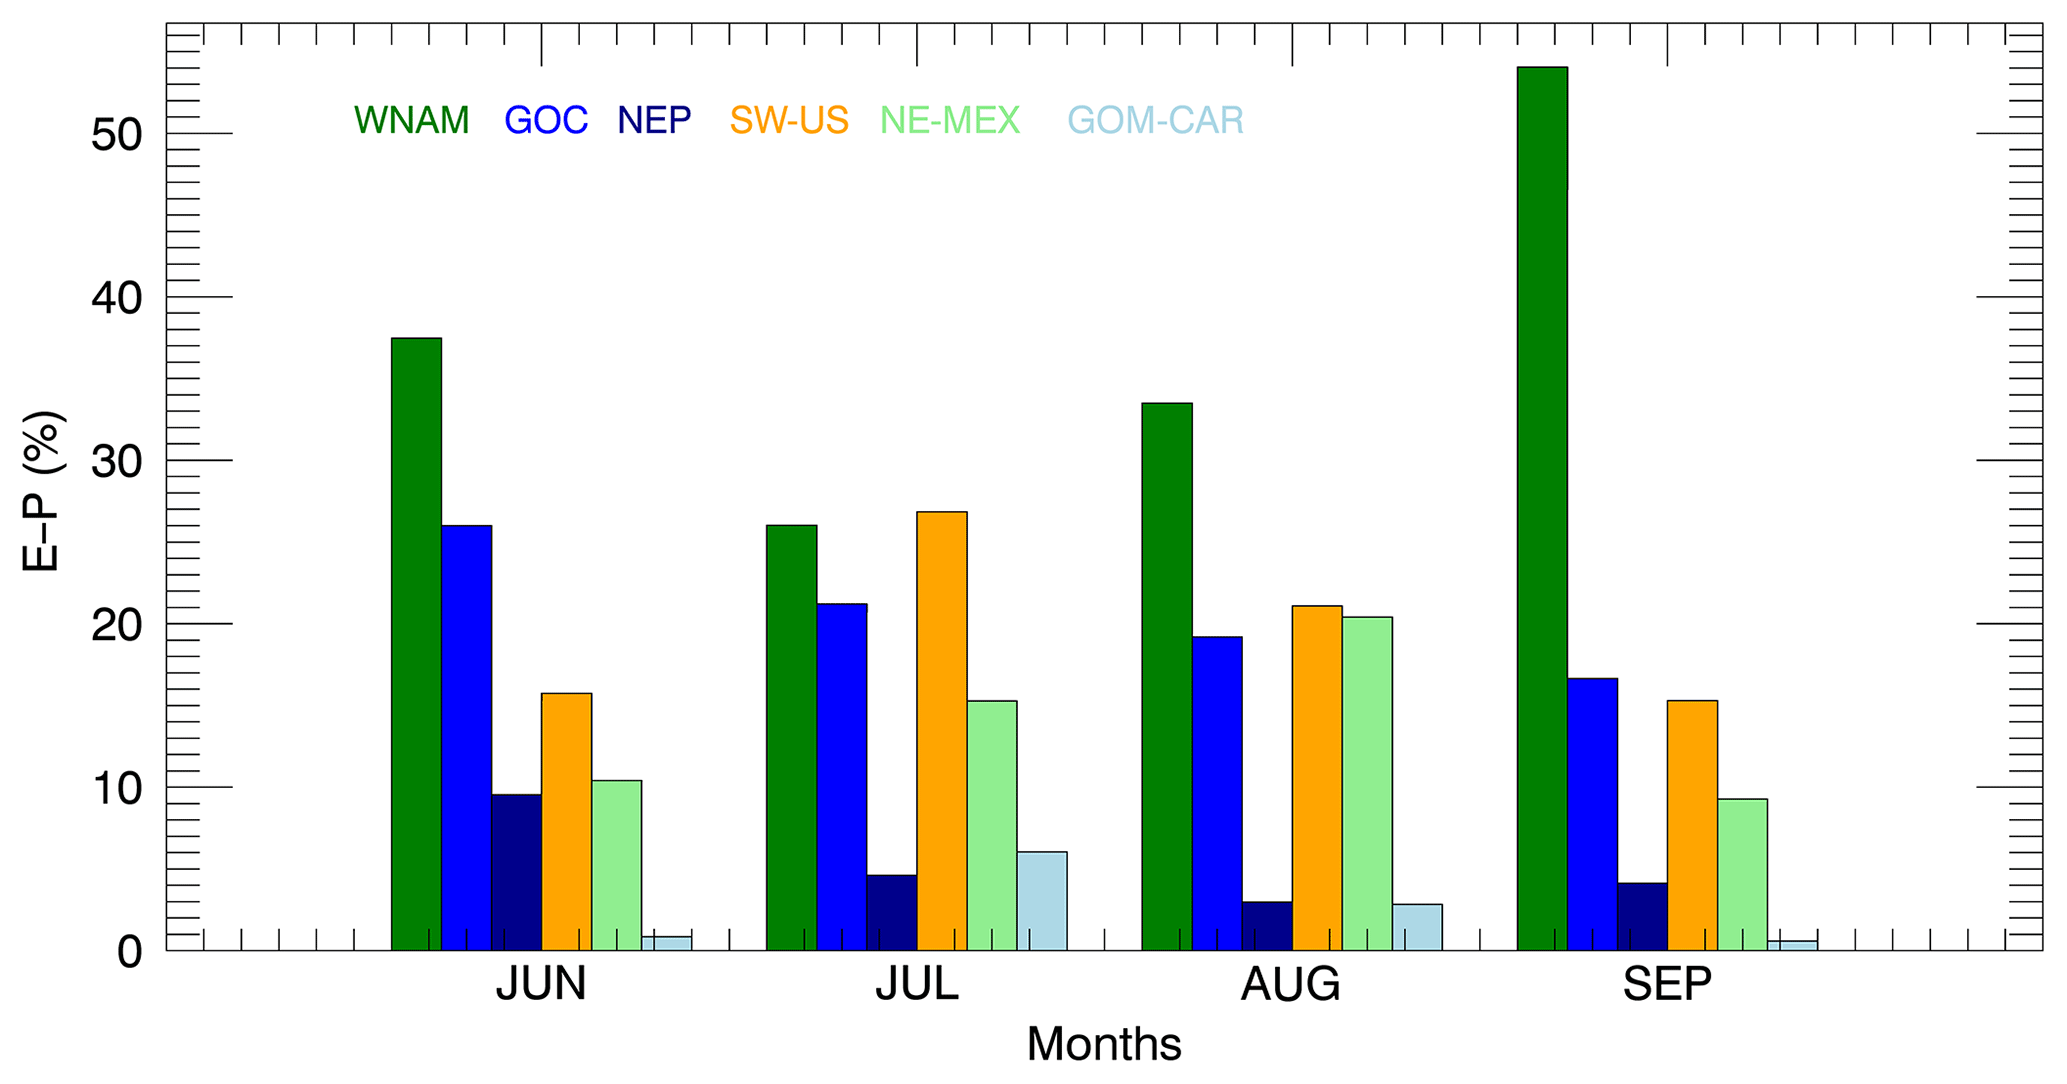

Figure 8JAS (July, August, September) time series of (E−P)n (n=1 to 6) integrated over (a) WNAM, (b) NE-MEX, (c) GOM-CAR, (d) SW-US, (e) NEP, and (f) GOC. The solid line represents wet days, and the dotted line represents dry days. Note that panel (a) is scaled by 0.5.
From July to September, FLEXPART describes a terrestrial moisture contribution from the WNAM region of 38 % on average, with a water vapor flux from this region of 26 %, 34 %, and 55 % during July, August, and September, respectively. Our results using FLEXPART find larger moisture transports from the WNAM region than previous studies, but our results are not strictly comparable to them. For instance, Bosilovich et al. (2003) considered the entire Mexican continental region and found it to be the dominant source of moisture for the monsoon, with contributions of roughly 30 %, 25 %, and 20 % during July, August, and September, respectively. In their study these authors computed the fraction of precipitation that originates as evaporation and estimated the values of evaporation from all of the Mexican territory that contributes to the WNAM precipitation. Hu and Dominguez (2015) estimated the precipitable water contribution from recycling to be about 10 % during the monsoon peak. However, the model that they used for this work has proven to be imprecise at tracking moisture transport in the monsoon region due to the model's assumption of a well-mixed atmosphere. This assumption does not hold over the WNAM region where a relatively strong shear occurs, causing an underestimation of local recycling by their model (Dominguez et al., 2016). As previously stated, FLEXPART estimates the net moisture gain, , as precipitation and evaporation are not directly separable in this model.
Regarding the summer monsoon evolution of this inland evaporative source, Bosilovich et al. (2003) affirm that the terrestrial supply of moisture to the WNAM decreases with time, while Hu and Dominguez (2015) show a maximum local contribution during August. In our case, (E−P) considerably increases with time throughout the summer monsoon (Fig. 7). GLEAM shows that the greatest monthly mean evaporation over the WNAM domain during the summer monsoon season occurs in August followed by July and September. The observed monthly mean precipitation peaks in July and decreases with time. The (E−P) monthly means from the difference of these independently estimated values of E and P are lowest in July and increase with time, peaking in September, which is consistent with our results.
3.2 The role of moisture source regions during regional-scale precipitation events
Figure 8 depicts differences in the advected moisture over the source regions before the wet and dry days over the WNAM domain. The time series of (E−P) are shown from the sixth to the first day before the air particles aimed toward the WNAM reach this region during the monsoon season (JAS).
The WNAM region contributes higher moisture amounts before the rainfall events, except for on day −1 when a fraction of the particles located over the region could be already losing moisture. Similar conditions are experienced by the adjacent GOC and NE-MEX regions, which carry more water vapor before the rainfall events for days −6 to −2, but lower quantities on day −1. In the same way, due to their proximity to the target region, the air masses over the GOC and NE-MEX regions could start to lose part of their moisture the day before the rainfall events over the WNAM domain. GOM-CAR provides higher moisture amounts from day −6 to −3, while during the period from day −3 to −1 the particles still do not reach this region. The SW-US region could also contribute to rainfall development as it supplies more water vapor to the WNAM before the rainfall events. Finally, the NEP region shows slightly lower moisture contributions before the rainfall events, indicating that more moisture is arriving to the GOC and WNAM from the southwest during these events. Although all the regions excluding the NEP could potentially contribute to rainfall generation over the WNAM domain, the greatest difference in the total amount of moisture transported before dry and wet days is obtained for the NE-MEX area.
Bosilovich et al. (2003) found local evaporation and transport from the tropical Atlantic Ocean (including the GOM and Caribbean Sea) to be the dominant sources of precipitation. In contrast, Dominguez et al. (2016) reported that the GOC contributes a higher moisture amount to WNAM precipitation than the GOM or local evapotranspiration (ET). The latter study used water vapor tracers embedded into a regional climate model with lateral boundary conditions derived from the North American Regional Reanalysis (NARR; Mesinger et al., 2006). However, the ET fields from NARR might have significant deficiencies in these areas (Bohn and Vivoni, 2016). Our results are in better agreement with those of Bosilovich et al. (2003) which suggest that the GOM-CAR and NE-MEX regions could be major contributors to the monsoonal regional rainfall. However, we cannot conclude that these areas are the one decisive source for rainfall development because, as we have mentioned, the other sources also exhibit important changes for precipitation versus no precipitation days.
Our next objective is to examine which source regions are the most relevant for the modulation of rainfall intensity. We have found only 32 extreme precipitation events occurring in September during the period from 1981 to 2014. Therefore, in order to obtain statistically meaningful results, only water vapor transport that generated heavy rainfall during the monsoon peak (July and August) is studied. Figure 9 shows the difference in (E−P) for the extreme precipitation days with respect to weak intensity days for days −1, −2, and −5. For the northern WNAM region, is lower just before the extreme days than before weak days, indicating greater moisture loss preceding extreme days. On day −2, larger evaporation values are seen before the extreme days over the WNAM region as a whole. Larger values of are found along a pathway that crosses the NE-MEX and reaches the GOM-CAR region for extreme days relative to weak days. A high (low) moisture supply from the GOM-CAR domain for 4 to 6 days back in time seems to be one of the most important factors affecting the precipitation intensity during the monsoon peak.
The abovementioned differences can be clearly observed in Fig. 10, which shows the results of the integration of moisture changes for the WNAM, NE-MEX, GOM-CAR, and GOC areas, before the extreme, moderate, and weak rainfall days. The water intake from day −6 to −4 and from day −6 to −2 over GOM-CAR and NE-MEX, respectively, seems to be related to the precipitation intensity (Fig. 10c, b), with more than a 200 % increase in the case of GOM-CAR and a 44 % increase for the NE-MEX region during the extreme rainfall events. The integrated time series of (E−P) for the WNAM itself (Fig. 10a) show that and behave in a similar fashion during moderate and heavy rainfall events, peaking during day −2 and decreasing during day −1; this could be related to the strong surface heating that is needed prior to such precipitation events. However, and for the weak rainfall events behave more similarly to the dry events (Fig. 8a). Finally, in the case of the GOC region, it is noteworthy that the moisture transport amount is inversely related to the rainfall intensity on day −1 (Fig. 10d), which could be associated with the proximity to the target domain. These results suggest that the southeasterly vapor fluxes from the Caribbean Sea, passing over the Sierra Madre at higher altitudes, are related to the monsoonal rainfall intensity.
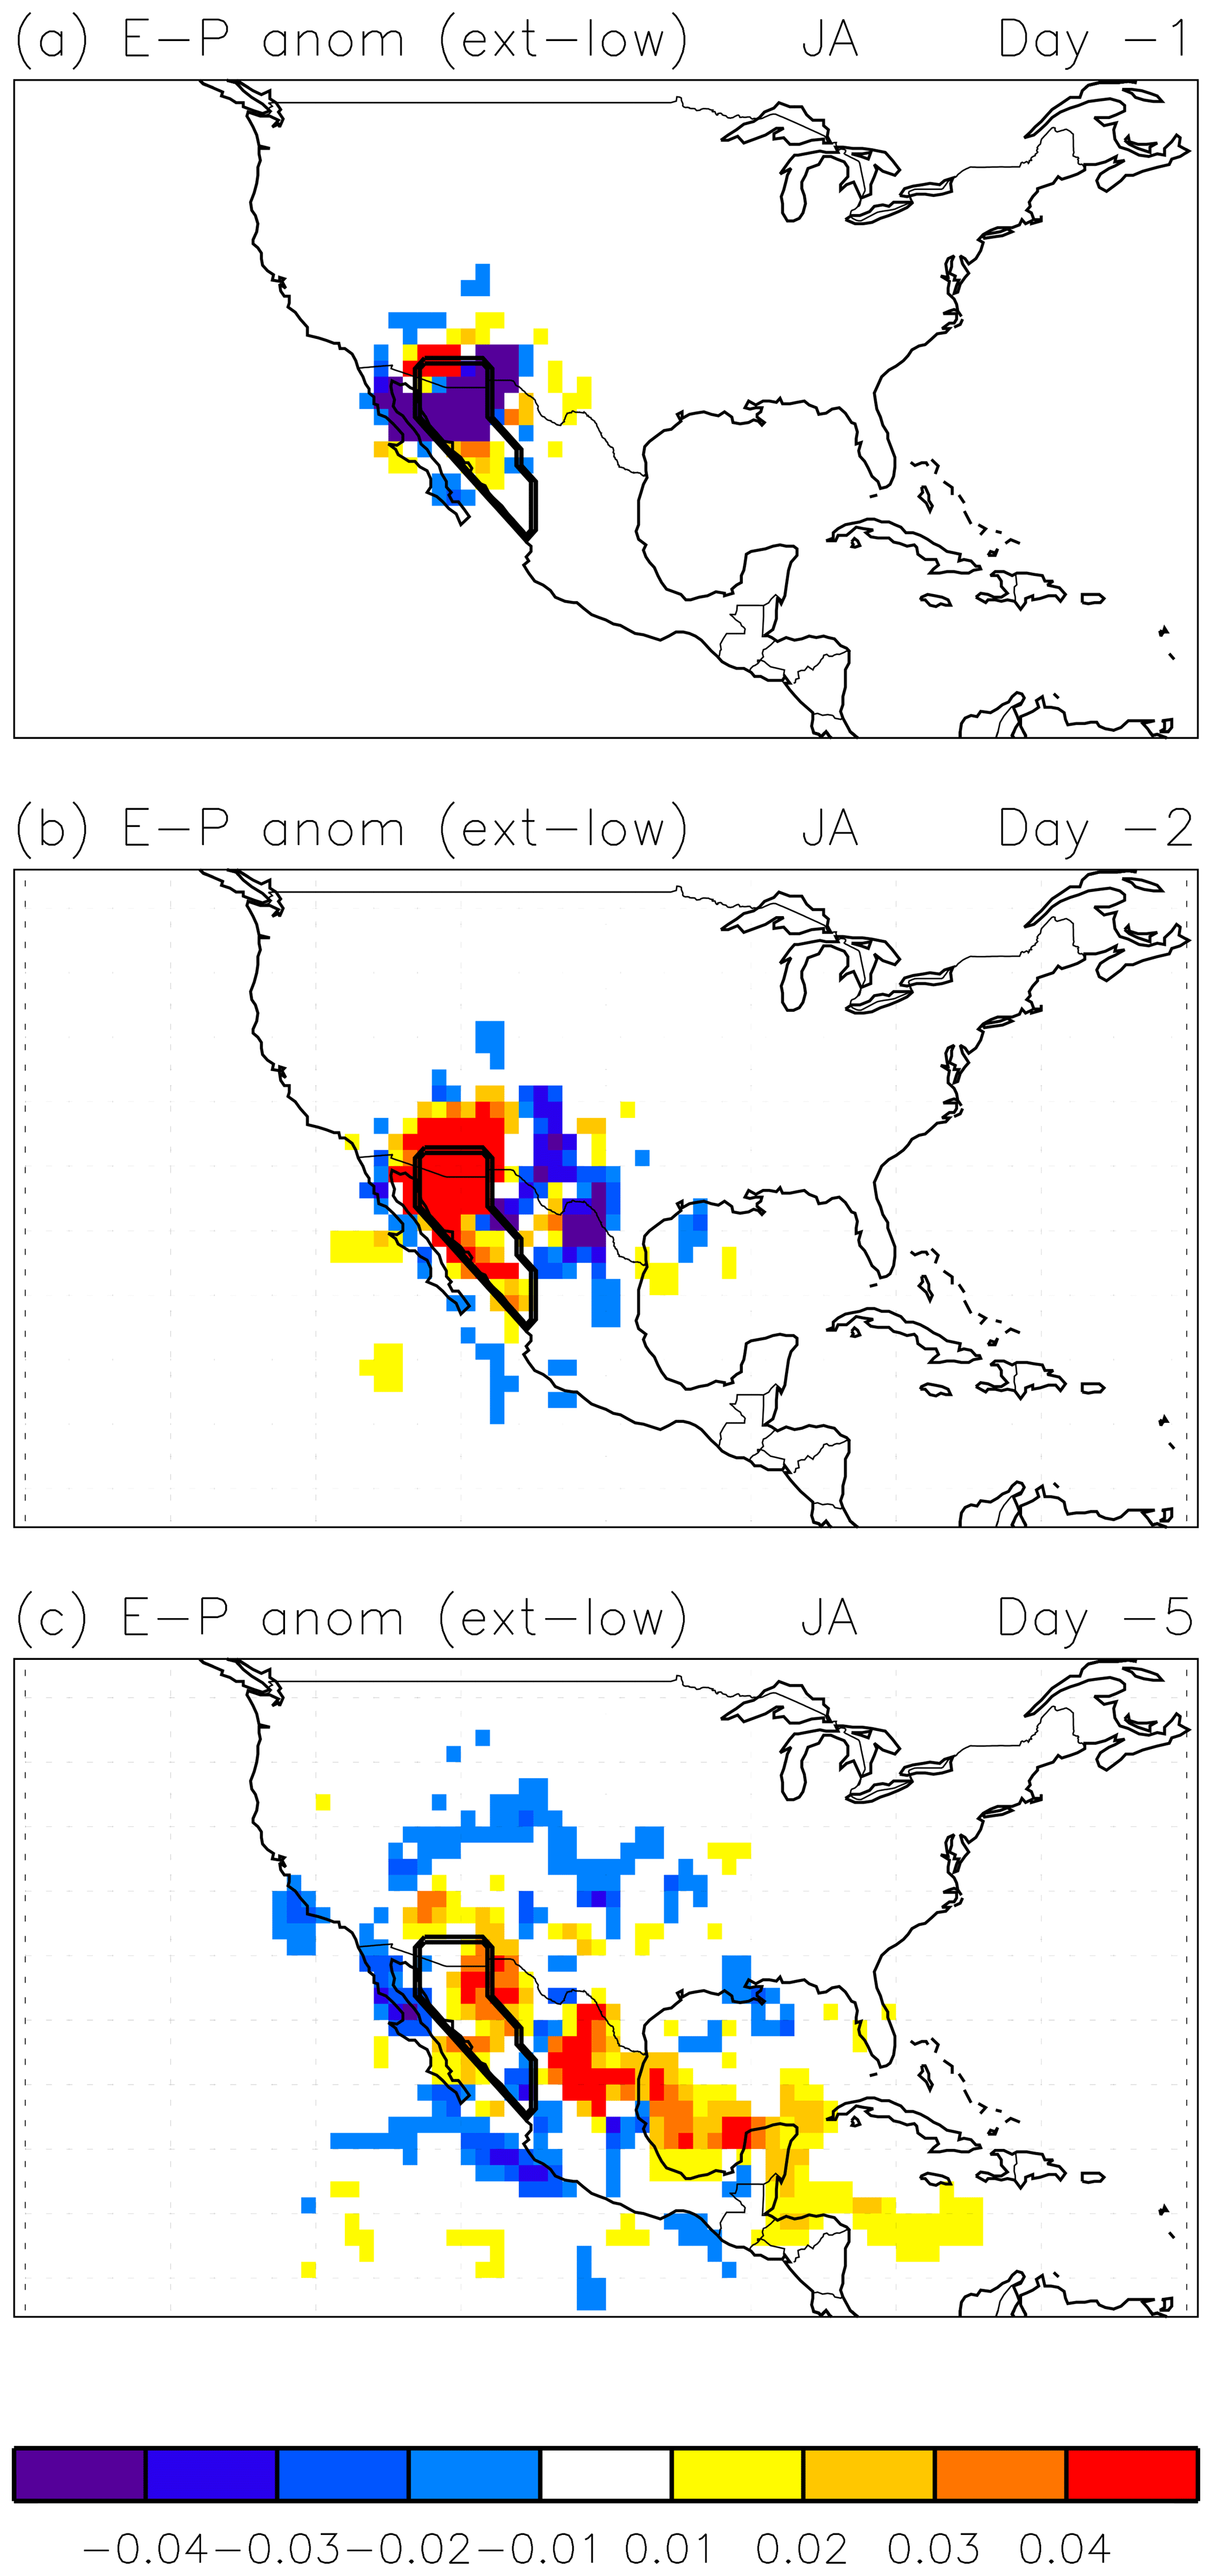
Figure 9Anomalies of (E−P)1, (E−P)2, and during July and August(JA; 1981–2014) for extreme rainfall days minus low rainfall days. Unit: mm day−1. The black line delineates the study region.
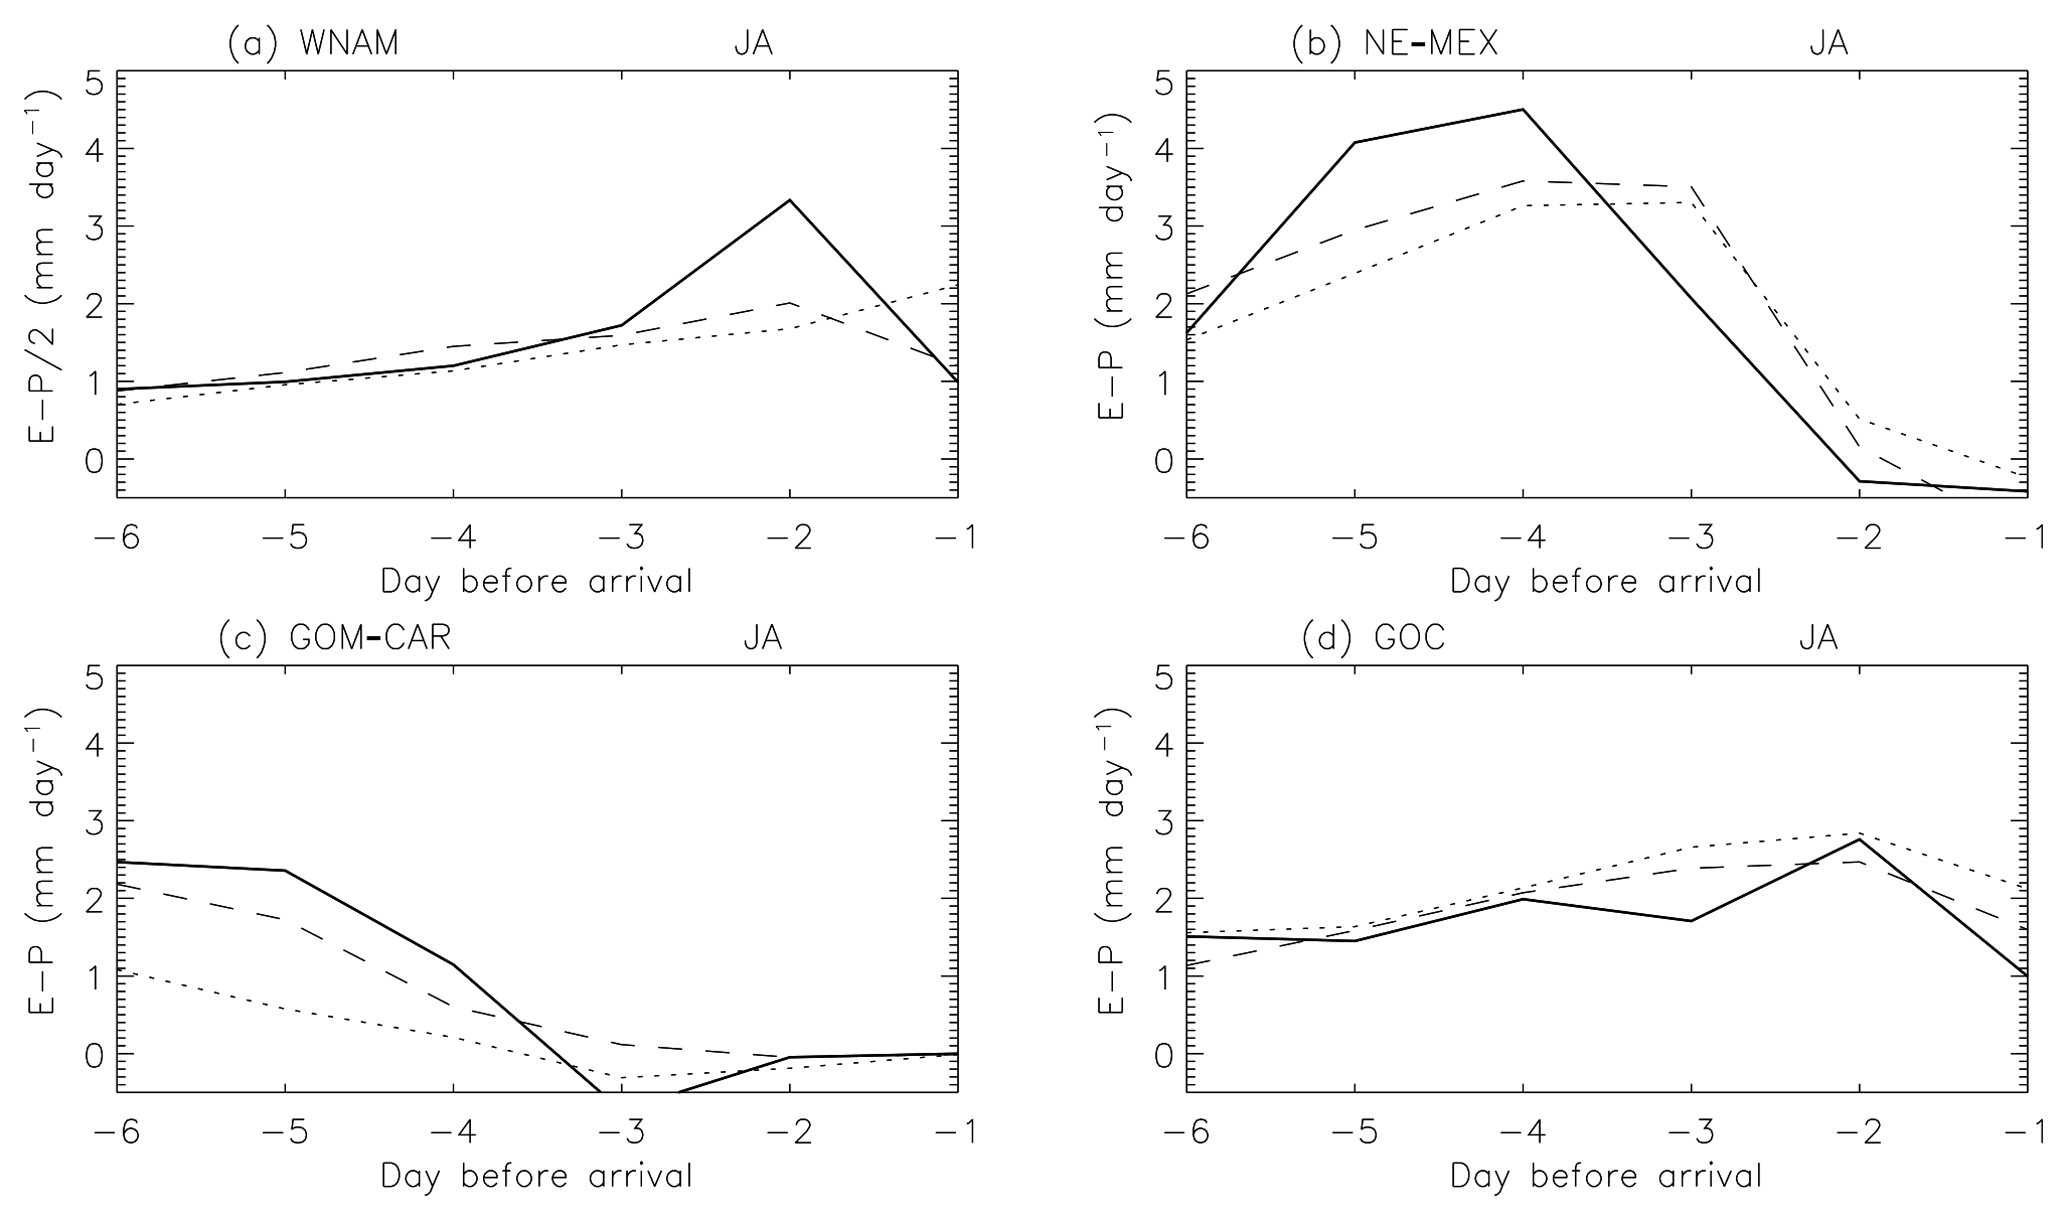
Figure 10JA time series of (E−P)n (n=1 to 6) integrated over the (a) WNAM, (b) NE-MEX, (c) GOM-CAR, and (d) GOC regions. The black solid line represents extreme rainfall events, the dashed line represents moderate rainfall events, and the dotted line represents weak rainfall events. Note that panel (a) is scaled by 0.5.
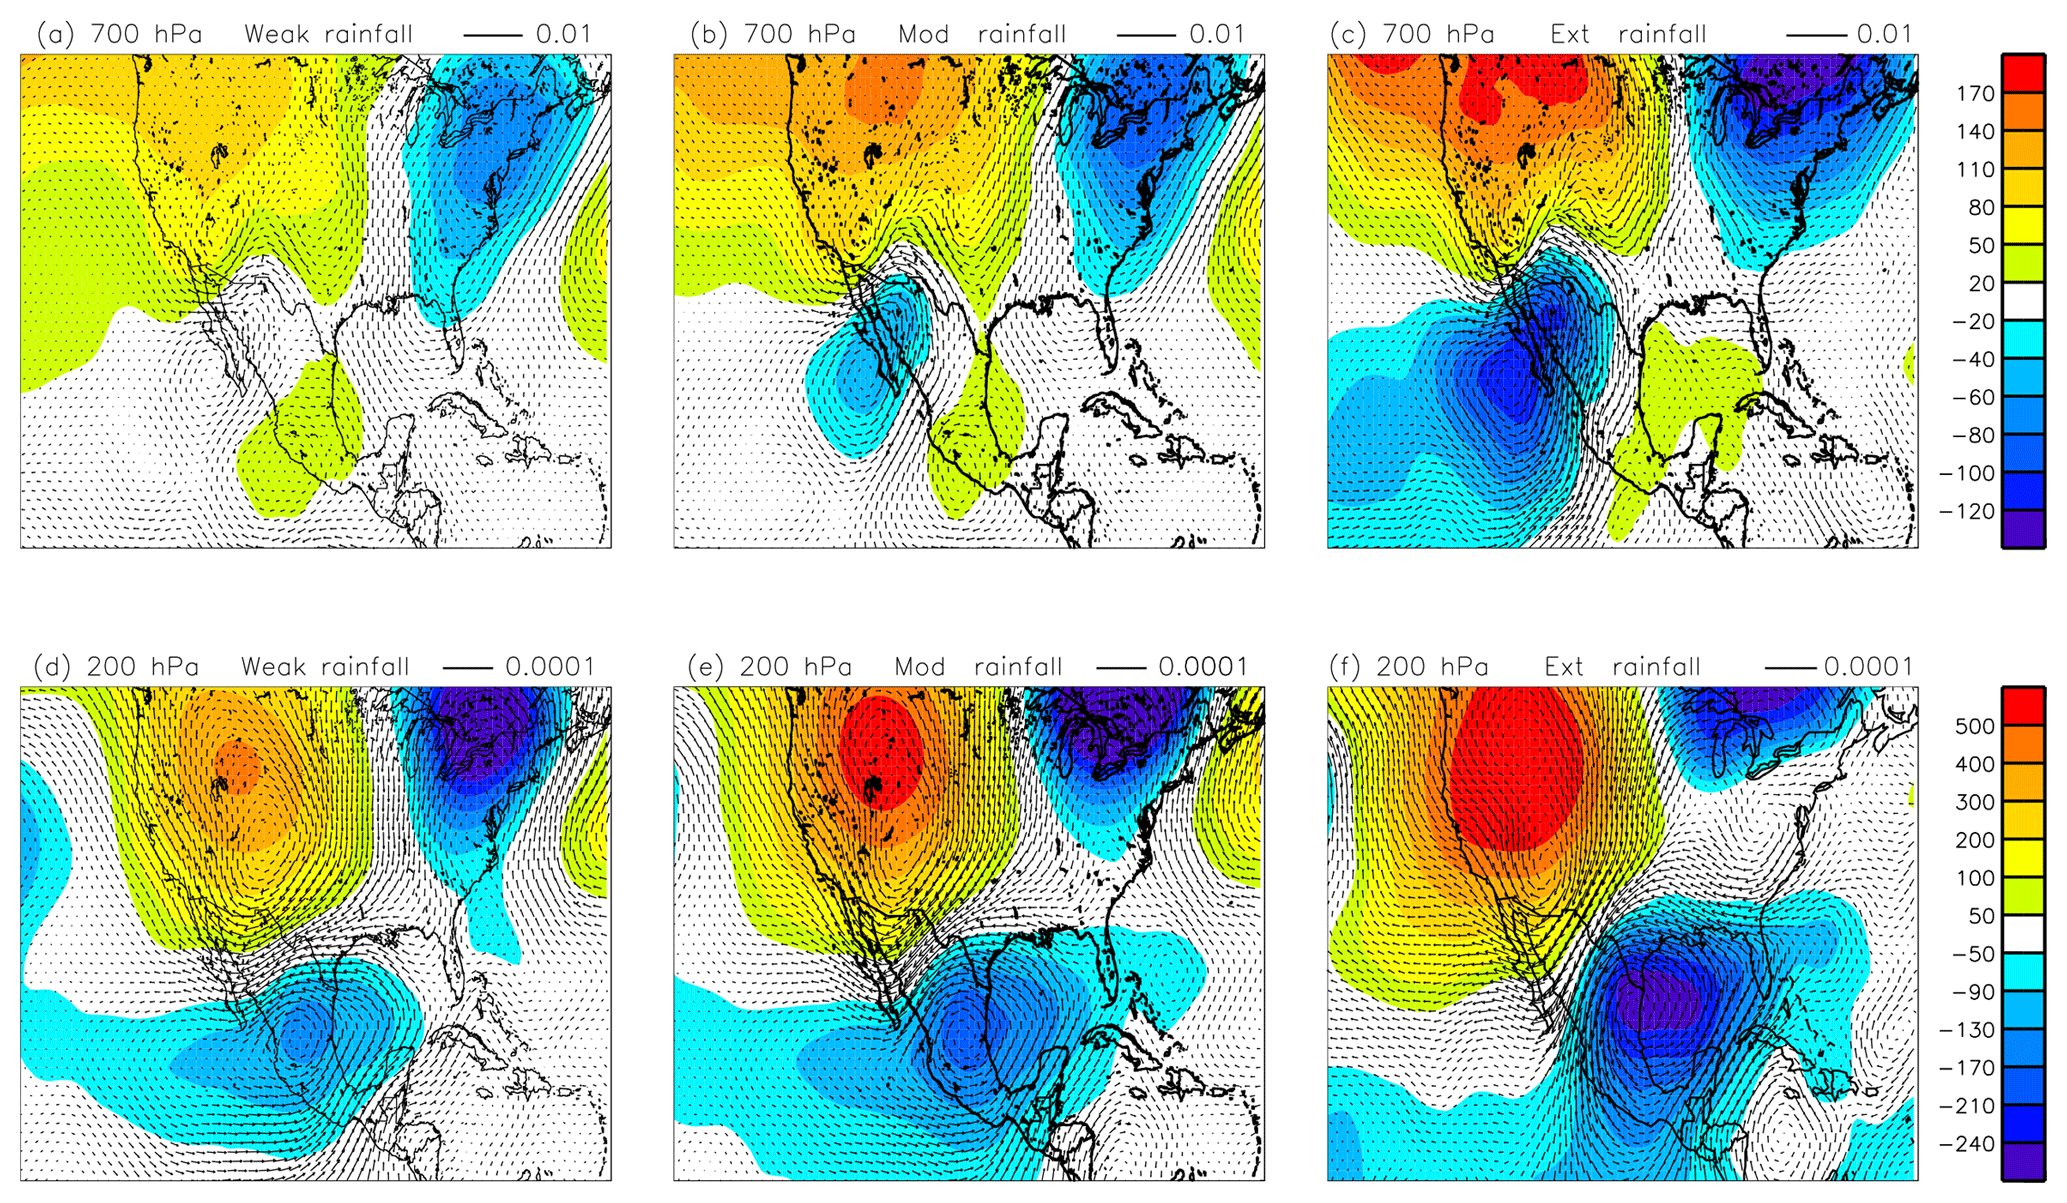
Figure 11Composites of geopotential height anomalies (colors; m) and moisture transport anomalies (arrows; kg kg−1 m s−1) with respect to regional-scale dry events over the WNAM region during the monsoon peak (July and August) for (a) weak, (b) moderate, and (c) extreme precipitation events at 200 hPa and (d) weak, (e) moderate, and (f) extreme precipitation events at 700 hPa.
Figure 11 depicts geopotential height and moisture transport differences at 700 and 200 hPa, for weak, moderate, and strong precipitation days with respect to dry days. For the low- to mid-troposphere (Fig. 11a, b, and c) positive geopotential height differences show a center over the western US; negative geopotential height differences are also observed off the west coast of the WNAM region (transient lows – easterly waves or tropical cyclones – typically located at the mouth of the GOC). Both features are better defined as the precipitation becomes more intense over the WNAM domain. At 200 hPa, a positive height difference is located over desert areas of the southwestern US as an extension of the monsoon anticyclone (Fig. 11d, e, f). A negative height difference develops roughly over the GOM which is also more intense as precipitation intensifies over the WNAM domain and may indicate an inverted trough (IV). This result has been previously described as low-level troughs interacting with an upper-level IV enhancing precipitation into the southwestern US and northwestern Mexico (Stensrud et al., 1997; Fuller and Stensrud, 2000; Higgins et al., 2004; Seastrand et al., 2015). IVs have been associated with heavy rainfall events in the US–Mexico border region (Bieda et al., 2009; Finch and Johnson, 2010; Newman and Johnson, 2012). How exactly mesoscale and synoptic circulations related to IVs help organize deep convection over the NAM region is not entirely known (Lahmers et al., 2016). Newman and Johnson (2012) found that these transient features increase surface-to-mid level wind shear, with mid-level flow from the northeast perpendicular to the topography. The enhanced vertical wind shear across the topography supports the upscale growth and westward propagation of diurnal convection initiated over the Sierra Madre Occidental, resulting in widespread convection over the western slopes and coastal low lands of the WNAM region. Divergence aloft on the west flank of an IV can also lead to ascent and destabilization (Pytlak et al., 2005). Regardless of the physical mechanisms, these composites support previous studies which assert that IVs play an important role in generating widespread heavy precipitation across the WNAM domain.
More observations of the dynamic and thermodynamic environment during the passage of IVs, as well as improved models of the flow over complex terrain are both needed to better understand the role of IVs in supporting convective outbreaks across the monsoon region. This work suggests that an anomalous tongue of mid-level moisture over northeastern Mexico (Fig. 9c) occurs in conjunction with upper-level IVs and is related to widespread heavy precipitation over the WNAM region.
Despite the large body of literature on the transport of water vapor and precipitation patterns associated with the WNAM, there are still important knowledge gaps regarding the sources of water vapor, their relative importance, and the detailed pathways through which the water vapor can reach the WNAM region. This study is focused on the climatological large-scale aspects of moisture transport and precipitation occurrence over the WNAM domain. The well-tested FLEXPART model is used to assess the location of the major moisture sources of the WNAM for a 34-year period from 1981 to 2014. Six main moisture sources have been identified, three terrestrial and three oceanic: the evapotranspiration from the region itself, the Mexican terrestrial area east of the WNAM region, the southern part of the Gulf of Mexico and the adjacent Caribbean Sea, the southwestern US, the Gulf of California, and an oceanic adjacent area over the Pacific. The main moisture sources identified by FLEXPART coincide with the existent literature, in which the debate has traditionally been centered on the relative importance of the Gulf of California versus the Gulf of Mexico and more recently, on the role of the recycling process.
Our results indicate that during the monsoon season (from July to September), the WNAM itself is the main moisture source, while the Gulf of California is the second most important origin. However, when the moisture transport for the days leading up to regional-scale wet days is compared, the relevance of the water vapor originating from the Caribbean Sea and the Gulf of Mexico is evidenced. A clear difference in E−P between extreme and low precipitation days is seen over the Gulf of Mexico, the Caribbean Sea, and the terrestrial area east of the WNAM region from day −6 to day −2 prior to the onset of precipitation; this suggests that these regions could play a significant role in supporting regional-scale heavy precipitation development over the WNAM domain. Conversely, the relevance of water vapor transport from the Gulf of California diminishes a day before regional-scale precipitation events, as the intensity of both the low-level transient lows and the precipitation over the WNAM region increase.
It must be stressed that there is currently a lively debate with regard to the origin of the water vapor advected to the northern WNAM region which leads to extreme precipitation events. In a recent study, Ralph and Galarneau (2017) documented the role of the transport of water vapor from the east in modulating the most extreme precipitation events over southeastern Arizona. The water vapor aimed toward this region was hypothesized to flow through a gap in the mountain range that connects the continental divide and the Sierra Madre in southern Arizona–New Mexico and northern Mexico, known as the Chiricahua Gap. In contrast, Jana et al. (2018) found the Gulf of California to be the leading moisture source for precipitation development at two locations selected over Arizona (Laveen) and New Mexico (Redrock), although these authors also noted a moisture contribution from the Gulf of Mexico at low levels (below 2000 m) for a western New Mexico location.
Due to the limitations of our methodology, our results are not conclusive; however, they seem to support the significance of the westward moisture flux from the Gulf of Mexico and the Caribbean Sea for extreme WNAM precipitation. We cannot assure that this anomalous water vapor transport implies that air masses crossing Sierra Madre into the WNAM region result in the development of strong precipitation, as this process cannot be resolved at the spatial resolution used in this study; moreover, low-level moisture is also needed to develop convection. Nevertheless, we have found the presence of low-level troughs and upper-level IVs during these same extreme wet days, which presents a scenario compatible with the occurrence of convective precipitation. In this sense, Schiffer and Nesbitt (2012) describe deep easterly flow anomalies along the southern edge of the monsoon high over the WNAM core prior to the initiation of a wet surge that would be essential for providing pre-surge moisture to the northern WNAM domain. Whereas the region itself and GOC moisture would be important after the surge arrives at the northern end of the GOC. Other authors have also reported gulf surges occurring if an easterly wave trough passes east to the GOC following the passage of an upper-level midlatitude trough (Stensrud et al., 1997; Fuller and Stensrud, 2000). Our results agree with these works, suggesting that moisture from the GOM could be important in combination with other sources such as tropical cyclones and IVs, which can sometimes even form from midlatitude fronts before propagating westward in the easterly flow south of the upper tropospheric monsoon anticyclone (Lahmers et al., 2016). These features would imply that the WNAM cloud should be considered as a hybrid monsoon, with characteristics of a tropical monsoon and additional impacts from midlatitudes.
The ERA-Interim datasets are available from https://www.ecmwf.int/ (last access: 25 January 2019). MERRA-2 data are available from https://gmao.gsfc.nasa.gov/reanalysis/MERRA/data_access/ (last access: 25 January 2019). The precipitation data from CHIRPS (Funk et al., 2015) can be downloaded from http://chg.geog.ucsb.edu/data/chirps/ (last access: 25 January 2019). The land evaporation data from the GLEAM model (Miralles et al., 2011) are available from http://www.gleam.eu (last access: 25 January 2019). The FLEXPART model (Stohl and James, 2004, 2005) can be freely downloaded from https://www.flexpart.eu/ (last access: 25 January 2019). Data from the FLEXPART results are available on request from the authors.
PO, PR and DG developed the concept for the paper. PO and RN performed the data analysis. All authors (PO, RN, LG, PR, DG, CAOM, AIQ) contributed ideas and took part in the interpretation of the results and revisions of the paper.
The authors declare that they have no conflict of interest.
This article is part of the special issue “The 8th EGU Leonardo Conference: From evaporation to precipitation: the atmospheric moisture transport”. It is a result of the 8th EGU Leonardo Conference, Ourense, Spain, 25–27 October 2016.
This research is a contribution to the PAPIIT IA103116 “Principales
fuentes de humedad de la República Mexicana y su variabilidad
climática” project. Pedro Ribera and David Gallego were also supported by the
Spanish “Ministerio de Economia y Competitividad” via the
“Variabilidad del vapor de agua en la baja estratosfera” project
(project no. CGL2016-78562-P) and the RNM-356 research group belonging to the “Plan Andaluz de
Investigación Desarrollo e Innovación”. We thank Yolande Serra for
in depth discussions and comments on the paper.
Edited by: Sergio Martín Vicente Serrano
Reviewed by: Ana María Durán-Quesada, Enrique R. Vivoni, and two anonymous referees
Adams, D. K. and Comrie, A. C.: The North American Monsoon, B. Am. Meteorol. Soc., 78, 2197–2213, https://doi.org/10.1175/1520-0477(1997)078<2197:TNAM>2.0.CO;2, 1997.
Barlow, M., Nigam, S., and Berbery, E. H.: Evolution of the North American Monsoon System, J. Climate, 11, 2238–2257, https://doi.org/10.1175/1520-0442(1998)011<2238:EOTNAM>2.0.CO;2, 1998.
Berbery, E. H.: Mesoscale moisture analysis of the North American monsoon, J. Climate, 14, 121–137, 2001.
Bieda III, S. W., Castro, C. L., Mullen, S. L., Comrie, A. C., and Pytlak, E.: The Relationship of Transient Upper-Level Troughs to Variability of the North American Monsoon Systems, J. Climate, 22, 4213–4227, 2009.
Bohn, T. J. and Vivoni, E. R.: Process-based characterization of evapotranspiration sources over the North American monsoon region, Water Resour. Res., 52, 358–384, https://doi.org/10.1002/2015WR017934, 2016.
Bosilovich, M. G., Sud, Y., Schubert, S., and Walke, G.: Numerical simulationof the large-scale North American monsoon water sources, J. Geophys. Res., 108, 8614, https://doi.org/10.1029/2002JD003095, 2003.
Bosilovich, M. G., Robertson, R. F., Takacs, L., Molod, A., and Mocko, D.: Atmospheric Water Balance and Variability in the MERRA-2 Reanalysis, J. Climate, 30, 1178–1196, 2017.
Bryson, R. and Lowry, W. P.: Synoptic climatology of the Arizona summer precipitation singularity, B. Am. Meteorol. Soc., 36, 329–339, 1955.
Castro, C. L., Chang, H. I., and Dominguez, F.: Can a regional climate model improve the ability to forecast the North American monsoon?, J. Climate, 25, 8212–8237, https://doi.org/10.1175/JCLI-D-11-00441.1, 2012.
Dee, D. P., Uppala, S. M., Simmons, A. J., Berrisford, P., Poli, P. Kobayashi, S., Andrae, U., Balmaseda, M. A., Balsamo, G., Bauer, P., Bechtold, P., Beljaars, A. C. M., van de Berg, L., Bidlot, J. Bormann, N., Delsol, C., Dragani, R., Fuentes, M., Geer, A. J., Haimberger, L., Healy, S. B., Hersbach, H., Hólm, E. V., Isaksen, L., Kållberg, P., Köhler, M., Matricardi, M., McNally, A. P., Monge-Sanz, B. M., Morcrette, J.-J., Park, B.-K., Peubey, C., de Rosnay, P., Tavolato, C., Thépaut, J.-N., and Vitart, F.: The ERA-Interim reanalysis: Configuration and performance of the data assimilation system, Q. J. Roy. Meteor. Soc., 137, 553–597, https://doi.org/10.1002/qj.828, 2011.
Dominguez, F., Kumar, P., Liang, X. Z., and Ting, M.: Impact of atmospheric moisture storage on precipitation recycling, J. Climate, 19, 1513–1530, https://doi.org/10.1175/JCLI3691.1, 2006.
Dominguez, F., Kumar, P., and Vivoni, E. R.: Precipitation recycling variability and ecoclimatological stability – A study using NARR data. Part II: North American monsoon region, J. Climate, 21, 5187–5203, 2008.
Dominguez, F., Miguez-Macho, G., and Huancui, H.: WRF with Water Vapor Tracers: A Study of Moisture Sources for the North American Monsoon, J. Hydrometeorol., 17, 1915–1927, https://doi.org/10.1175/JHM-D-15-0221.1, 2016.
Douglas, A. V. and Englehart, P. J.: A climatological perspective of transient synoptic features during NAME 2004, J. Climate, 20, 1947–1954, https://doi.org/10.1175/JCLI4095.1, 2007.
Douglas, M. W.: The summertime low-level jet over the Gulf of California, Mon. Weather Rev., 123, 2334–2347, 1995.
Douglas, M. W., Maddox, R. A., Howard, K., Rand eyes, S.: The Mexican monsoon, J. Climate, 6, 1665–1677, https://doi.org/10.1175/1520-0442(1993)006<1665:TMM>2.0.CO;2, 1993.
Drumond, A., Nieto, R., and Gimeno, L.: Sources of moisture for China and their variations during drier and wetter conditions in 2000–2004: a Lagrangian approach, Clim. Res., 50, 215–225, https://doi.org/10.3354/cr01043, 2011.
Duran-Quesada, A. M., Gimeno, L., Amador, J. A., and Nieto, R.: Moisture sources for Central America: Identification of moisture sources using a Lagrangian analysis technique, J. Geophys. Res.-Atmos., 115, D05103, https://doi.org/10.1029/2009JD012455, 2010.
Erfani, E. and Mitchell, D.: A partial mechanistic understanding of the North American monsoon, J. Geophys. Res., 119, 13096–13115, https://doi.org/10.1002/2014JD022038, 2014.
Finch, Z. O. and Johnson, R. H.: Observational Analysis of an Upper-Level Inverted Trough during the 2004 North American Monsoon Experiment, Mon. Weather Rev., 138, 3540–3555, 2010.
Foster, C., Stohl, A., and Seibert, P.: Parameterization of Convective Transport in a Lagrangian Particle Dispersion Model and Its Evaluation, J. Appl. Meteorol. Clim., 46, 403–422, 2007.
Fuller, R. D. and Stensrud, D. J.: The relationship between tropical easterly waves and surges over the Gulf of California during the North American monsoon, Mon. Weather Rev., 128, 2983–2989, 2000.
Funk, C., Peterson, P., Landsfeld, M., Pedreros, D., Verdin, J., Shukla, S., Husak, G., Rowland, J., Harrison, L., Hoell, A., and Michaelsen, J.: The climate hazards infrared precipitation with stations – a new environmental record for monitoring extremes, Scientific Data, 2, 150066, https://doi.org/10.1038/sdata.2015.66, 2015.
Green, C. R. and Sellers, W. D.: Arizona Climate, University of Arizona Press, Tucson, AZ, USA, 503 pp., 1964.
Hales Jr., J. E.: Surges of Maritime Tropical Air Northward Over Gulf of California, Mon. Weather Rev., 100, 298–306, https://doi.org/10.1175/1520-0493(1972)100<0298:SOMTAN>2.3.CO;2, 1972.
Higgins, R. W., Yao, Y., and Wang, X. L.: Influence of the North American monsoon system on the U.S. Summer Precipitation Regime, J. Climate, 10, 2600–2622, https://doi.org/10.1175/1520-0442(1997)010<2600:IOTNAM>2.0.CO;2, 1997.
Higgins, R. W., Chen, Y., and Douglas, A. V.: Interannual variability of the North American warm season precipitation regime, J. Climate, 12, 653–680, https://doi.org/10.1175/1520-0442(1999)012<0653:IVOTNA>2.0.CO;2, 1999.
Higgins, R. W., Shi, W., and Hain, C.: Relationships between Gulf of California Moisture Surges and Precipitation in the Southwestern United States, J. Climate, 17, 2983–2997, https://doi.org/10.1175/1520-0442(2004)017<2983:RBGOCM>2.0.CO;2, 2004.
Higgins, W. and Gochis, D.: Synthesis of results from the North American Monsoon Experiment (NAME) process study, J. Climate, 20, 1601–1607, https://doi.org/10.1175/JCLI4081.1, 2007.
Hoell, A., Funk, C., Barlow, M., and Shukla, S.: Recent and Possible Future Variations in the North American Monsoon, in: The Monsoons and Climate Change. Observations and Modeling, Springer Climate, https://doi.org/10.1007/978-3-319-21650-8, 2016.
Hoyos, I., Dominguez, F., Canon-Barriga, J., Martinez, J. A., Nieto, R., Gimeno, P., and Dirmeyer, P. A.: Moisture origin and transport processes in Colombia, northern South America, Clim. Dynam., 50, 971–990, https://doi.org/10.1007/s00382-017-3653-6, 2018.
Hsu, P.-C.: Global Monsoon in a Changing Climate, in: The Monsoons and Climate Change. Observations and Modeling, Springer Climate, https://doi.org/10.1007/978-3-319-21650-8, 2016.
Hu, H., and Dominguez, F.: Evaluation of oceanic and terrestrial sources of moisture for the North American monsoon using numerical models and precipitation stable isotopes, J. Hydrometeor., 16, 19–35, https://doi.org/10.1175/JHM-D-14-0073.1, 2015.
Huo-Po, C. and Jian-Qi, S.: How Large Precipitation Changes over Global Monsoon Regions by CMIP5 Models?, Atmospheric and Oceanic Science Letters, 6, 306–311, 2013.
Jana, S., Rajagopalan, B., Alexander, M. A., and Ray, A. J.: Understanding the dominant sources and tracks of moisture for summer rainfall in the southwest United States, J. Geophys. Res.-Atmos, 123, 4850–4870, https://doi.org/10.1029/2017JD027652, 2018.
Jurwitz, L. R.: Arizona's two-season rainfall pattern, Weatherwise, 6, 96–99, 1953.
Lahmers, T., Castro, C. L., Adams, D. K., Serra, Y. L., Brost, J. J., and Luong, T.: Long-Term Changes in the Climatology of Transient Inverted Troughs over the North American Monsoon Region and Their Effects on Precipitation, J. Climate, 29, 6037–6064, https://doi.org/10.1175/JCLI-D-15-0726.1, 2016.
Lee, J.-Y. and Wang, B.: Future change of global monsoon in the CMIP5, Clim. Dynam., 42, 101–119, https://doi.org/10.1007/s00382-012-1564-0, 2014.
Liu, J., Wang, B., Ding, Q., Kuang, X., Soon, W., and Zorita, E.: Centennial variations of the global monsoon precipitation in the last millennium: Results from ECHO-G model, J. Climate, 22, 2356–2371, https://doi.org/10.1175/2008JCLI2353.1, 2009.
Liu, F., Chai, J., Wang, B., Liu, J., Zhang, X., and Wang, Z.: Global monsoon precipitation responses to large volcanic eruptions, Nature Scientific Reports, 6, 24331, https://doi.org/10.1038/srep24331, 2016.
Lorenz, C. and Kunstmann, H.: The hydrological cycle in three state of- the-art reanalyses: Intercomparison and performance analysis, J Hydrometeor., 13, 1397–1420, https://doi.org/10.1175/jhm-d-11-088.1, 2012.
Mendez-Barroso, L. A. and Vivoni, E. R.: Observed Shifts in Land Surface Conditions during the North American Monsoon: Implications for a Vegetation-Rainfall Feedback Mechanism, J. Arid Environ., 74, 549–555, 2010.
Méndez-Barroso, L. A., Vivoni, E. R., Watts, C. J., and Rodríguez, J. C.: Seasonal and interannual relations between precipitation, surface soil moisture and vegetation dynamics in the North American monsoon region, J. Hydrol., 377, 59–70, 2009.
Mesinger, F., DiMego, G., Kalnay, E., Mitchell, K., Shafran, P. C., Ebisuzaki, W., Jovic, D., Woollen, J., Rogers, E., and Berbery, E. H.: North American Regional Reanalysis, B. Am. Meteorol. Soc., 87, 343–360, 2006.
Miralles, D. G., Holmes, T. R. H., De Jeu, R. A. M., Gash, J. H., Meesters, A. G. C. A., and Dolman, A. J.: Global land-surface evaporation estimated from satellite-based observations, Hydrol. Earth Syst. Sci., 15, 453–469, https://doi.org/10.5194/hess-15-453-2011, 2011.
Miralles, D. G., Nieto, R., McDowell, N. G., Dorigo, W. A., Verhoest, N. E. C., Liu, Y. Y., Teuling, A. J., Dolman, A. J., Good, S. P., and Gimeno, L.: Contribution of water-limited ecoregions to their own supply of rainfall, Environ. Res. Lett., 11, 124007, https://doi.org/10.1088/1748-9326/11/12/124007, 2016.
Mitchell, D. L., Ivanova, D., Rabin, R., Brown, T. J., and Redmond, K.: Gulf of California sea surface temperatures and the North American monsoon: Mechanistic implications from observations, J. Climate, 15, 2261–2281, 2002.
Mo, K. C., Chelliah, M., Carrera, M. L., Higgings, R. W., and Ebisuzaki, W.: Atmospheric Moisture Transport over the United States and Mexico as Evaluated in the NCEP Regional Reanalysis, J. Hydrometeorol., 6, 711–728, 2005.
Mohtadi, M., Prange, M., and Steinke, S.: Palaeoclimatic insights into forcing and response of monsoon rainfall, Nature, 533, 191–199, https://doi.org/10.1038/nature17450, 2016.
Newman, A. and Johnson, R. H.: Mechanisms for Precipitation Enhancement in a North American Monsoon Upper-Tropospheric Trough, J. Atmos. Sci., 69, 1775–1792, https://doi.org/10.1175/JAS-D-11-0223.1, 2012.
Newman, A. J. and Johnson, R. H.: Dynamics of a Simulated North American Monsoon Gulf Surge Event, Mon. Weather Rev., 141, 3238–3253, https://doi.org/10.1175/MWR-D-12-00294.1, 2013.
Ordoñez, P., Ribera, P., Gallego, D., and Peña-Ortiz. C.: Major moisture sources for Western and Southern India and their role on synoptic-scale rainfall events, Hydrol. Process., 26, 3886–3895, https://doi.org/10.1002/hyp.8455, 2012.
Pascale, S. and Bordoni, S.: Tropical and extratropical controls of Gulf of California surges and summertime precipitation over the southwestern United States, Mon. Weather Rev., 144, 2695–2718, https://doi.org/10.1175/MWR-D-15-0429.1, 2016.
Pascale, S., Bordoni, S., Kapnick, S. B., Vechhi, G. A., Jia, L., Delworth, T. L., Underwood, S., and Andersoon, W.: The Impact of Horizontal Resolution on North American Monsoon Gulf of California Moisture Surges in a Suite of Coupled Global Climate Models, J. Climate, 29, 7911–7944, https://doi.org/10.1175/JCLI-D-16-0199.1, 2016.
Perdigón-Morales, J., Romero-Centeno, R., Ordoñez Perez, P., and Barrett, B. S.: The midsummer drought in Mexico: perspectives on duration and intensity from the CHIRPS precipitation database, Int. J. Climatol., 38, 2174–2186, https://doi.org/10.1002/joc.5322, 2018.
Pytlak, E., Goering, M., and Bennett, A.: Upper Tropospheric Troughs and Their Interaction with the North American Monsoon, 19th Conf. on Hydrology, 9–13 January 2005, San Diego, CA, USA, Amer. Meteor. Soc., 1–5, available at: https://ams.confex.com/ams/pdfpapers/85393.pdf (last access: 25 January 2019), 2005.
Ralph, F. M. and Galarneau Jr., T. J.: The Chiricahua Gap and the Role of Easterly Water Vapor Transport in Southeastern Arizona Monsoon Precipitation, J. Hydrometeorol., 18, 2511–2520, https://doi.org/10.1175/JHM-D-17-0031.1, 2017.
Ramage, C. S.: Monsoon meteorology. Academic Press, London, UK, p. 296, 1971.
Rogers, P. J. and Johnson, R. H.: Analysis of the 13–14 July Gulf Surge Event during the 2004 North American Monsoon Experiment, Mon. Weather Rev., 135, 3098–3117, https://doi.org/10.1175/MWR3450.1, 2007.
Ruprecht, E. and Kahl, T.: Investigation of the atmospheric water budget of the BALTEX area using NCEP/NCAR reanalysis data, Tellus, 55A, 426–437, 2003.
Schiffer, N. J. and Nesbitt, S. W.: Flow, Moisture, and Thermodynamic Variability Associated with Gulf of California Surges within the North American Monsoon, J. Climate, 25, 4220–4241, https://doi.org/10.1175/JCLI-D-11-00266.1, 2012.
Schmitz, J. T. and Mullen, S. L.: Water vapor transport associated with the summertime North American monsoon as depicted by ECMWF analyses, J. Climate, 9, 1621–1634, 1996.
Seastrand, S., Serra, Y., Castro, C., and Ritchie, E.: The dominant synoptic-scale modes of North American monsoon precipitation, Int. J. Climatol., 35, 2019–2032, https://doi.org/10.1002/joc.4104, 2015.
Simmonds, I., Bi, D., and Hope, P.: Atmospheric Water Vapor Flux and Its Association with Rainfall over China in Summer, J. Climate, 12, 1353–1367, 1999.
Stensrud, D. J., Gall, R. L., Mullen, S. L., and Howard, K. W.: Model Climatology of the Mexican Monsoon, J. Climate, 8, 1775–1794, 1995.
Stensrud, D. J., Gall, R., and Nordquist, M. K.: Surges over the Gulf of California during the Mexican Monsoon, Mon. Weather Rev., 125, 417–437, 1997.
Stohl, A. and James, P.: A Lagrangian analysis of the atmospheric branch of the global water cycle. Part 1: Method description, validation, and demonstration for the August 2002 flooding in central Europe, J. Hydrometeorol., 5, 656–678, 2004.
Stohl, A. and James, P.: A Lagrangian analysis of the atmospheric branch of the global water cycle. Part 2: Earth's river catchments, ocean basins, and moisture transports between them, J. Hydrometeorol., 6, 961–984, 2005.
Stohl, A., Wotawa, G., Seibert, P., and Kromp-Kolb, H.: Interpolation errors in wind fields as a function of spatial and temporal resolution and their impact on different types of kinematic trajectories, J. Appl. Meteorol., 34, 2149–2165, 1995.
Stohl, A., Forster, C., Frank, A., Seibert, P., and Wotawa, G.: Technical note: The Lagrangian particle dispersion model FLEXPART version 6.2, Atmos. Chem. Phys., 5, 2461–2474, https://doi.org/10.5194/acp-5-2461-2005, 2005.
Trenberth, K. E., Fasullo, J. T., and Mackaro, J.: Atmospheric moisture transports from ocean to land and global energy flows in reanalyses, J. Climate, 24, 4907–4924, https://doi.org/10.1175/2011jcli4171.1, 2011.
Vera, C., Higgins, W., Amador, J., Ambrizzi, T., Garreaud, R., Gochis, D., Gutzler, D., Lettenmaier, D., Marengo, J., Mechoso, C. R., Nogues-Paegle, J., Silva Dias, P. L., and Zhang, C.: Toward a Unified View of the American Monsoon Systems, J. Climate – Special Section, 19, 4977–4999, 2006.
Vivoni, E. R., Moreno, H. A., Mascaro, G., Rodríguez, J. C., Watts, C. J., Garatuza-Payan, J., and Scott, R. L.: Observed Relation between Evapotranspiration and Soil Moisture in the North American Monsoon Region, Geophys. Res. Lett., 35, L22403, https://doi.org/10.1029/2008GL036001, 2008.
Wang, B. and Ding, Q.: Changes in global monsoon precipitation over the past 56 years, Geophys. Res. Lett., 33, L06711, https://doi.org/10.1029/2005GL025347, 2006.
Wang, B. and Ding, Q.: Global monsoon: dominant mode of annual variation in the tropics, Dynam. Atmos. Oceans, 44, 165–183, 2008.
Wang, B., Liu, J., Kim, H. J., Webster, P. J., and Yim, S.-Y.: Recent change of the global monsoon precipitation (1979–2008), Clim. Dynam., 39, 1123–1135, https://doi.org/10.1007/s00382-011-1266-z, 2012.
Wang, B., Li, J., Cane, M. A., Liu, J., Webster, P. J., Xiang, B., Kim, H.-M., Cao, J., and Ha, K.-J.: Toward Predicting Changes in the Land Monsoon Rainfall a Decade in Advance, J. Climate, 31, 2699–2714, https://doi.org/10.1175/JCLI-D-17-0521.1, 2018.
Xiang, T., Vivoni, E. R., and Gochis, D. J.: Influence of Initial Soil Moisture and Vegetation Conditions on Monsoon Precipitation Events in Northwest Mexico, Atmosfera, 31, 25–45, 2018.