the Creative Commons Attribution 4.0 License.
the Creative Commons Attribution 4.0 License.
 | 02 May 2019
Tracking the moisture transport from the Pacific towards Central and northern South America since the late 19th century
David Gallego
Ricardo García-Herrera
Francisco de Paula Gómez-Delgado
Paulina Ordoñez-Perez
Pedro Ribera
In this paper, we develop an instrumental index based on historical wind direction observations aimed to quantify the moisture transport from the tropical Pacific to Central and northern South America at a monthly scale. This transport is mainly driven by the so-called “Chocó jet”, a low-level westerly jet whose core is located at 5∘ N and 80∘ W. The Chocó jet is profoundly related to the dynamics of the Intertropical Convergence Zone in the eastern equatorial Pacific and it is responsible for up to 30 % of the total precipitation in these areas. We have been able to produce an index for this transport starting in the 19th century, adding almost a century of data to previous comparable indices. Our results indicate that the seasonal distribution of the precipitation in Central America has changed throughout the 20th century as a response to the changes in the Chocó jet, decreasing (increasing) its strength in July (September). Additionally, we have found that in general, the relationship between the Chocó jet and the El Niño–Southern Oscillation has been remarkably stable throughout the entire 20th century, a finding particularly significant because the stability of this relation is usually the basis of the hydrologic reconstructions in northern South America.
- Article
(4980 KB) - Full-text XML
- BibTeX
- EndNote


The Northern Hemisphere eastern equatorial Pacific is an interesting area from a climatological point of view. It is affected by two different low-level jets whose interaction determines the moisture transport towards wide regions of Central America and northern South America, generating huge amounts of precipitation and affecting the living of millions of people (Arias et al., 2015). In the eastern equatorial Pacific, the Intertropical Convergence Zone (ITCZ) is predominantly located in the Northern Hemisphere (Wodzicki and Rapp, 2016). In this region, the Southern Hemisphere trade winds cross the Equator and the change in the sign of the Coriolis term, facilitated by the coast orientation and the land–sea temperature gradients, deflects the trades to the east, entering northern South America at 5∘ N as a low-level westerly jet, whose core is located at the 925 hPa level (Fig. 1a) introducing huge amounts of moisture into the continent (Poveda and Mesa, 1999, 2000). This jet was first described by Poveda and Mesa (1999), who named it as the Chocó Jet, the name functioning both as an acronym for “CHorro del Occidente COlombiano” (Western Colombian Jet) and as the place name Chocó, one of Colombia's departments most affected by the moisture advection from the Pacific related to this jet (Poveda and Mesa, 1999, 2000). In some localities such as Lloró (5∘30′ N, 76∘32′ W), the large amounts of moisture transported from the Pacific into the Colombian coast result in average rainfall ranging from 8000 to 13 000 mm, making this region one of the rainiest in the world (Murphy, 1939; Trojer, 1958; Arnett and Steadman, 1970; Meisner and Arkin, 1987; Janowiak et al., 1994; Poveda and Mesa, 2000; Poveda et al., 2011; Jaramillo et al., 2017; King et al., 2017). At 80∘ W, the cross section of the zonal wind from 5∘ S to 20∘ N (Fig. 1b) shows the distinctive characteristics of this system, a jet core located at 925 hPa and 5∘ N confined to the lower troposphere, with westerlies restricted to altitudes below 850 hPa. Although the location of the core is almost constant throughout the year (Poveda and Mesa, 2000; Sakamoto et al., 2011; Sierra et al., 2018), its intensity has a strong seasonal cycle (Fig. 1c, black line). Minimum velocities at this jet core are found in February–March (below 1 m s−1), and maximum ones occur in October–November (6 to 7 m s−1). From May up to December, the jet is quite active and its relation with the ITCZ seasonal migration is evidenced by the presence of two relative maxima in June and October (Fig. 1c).
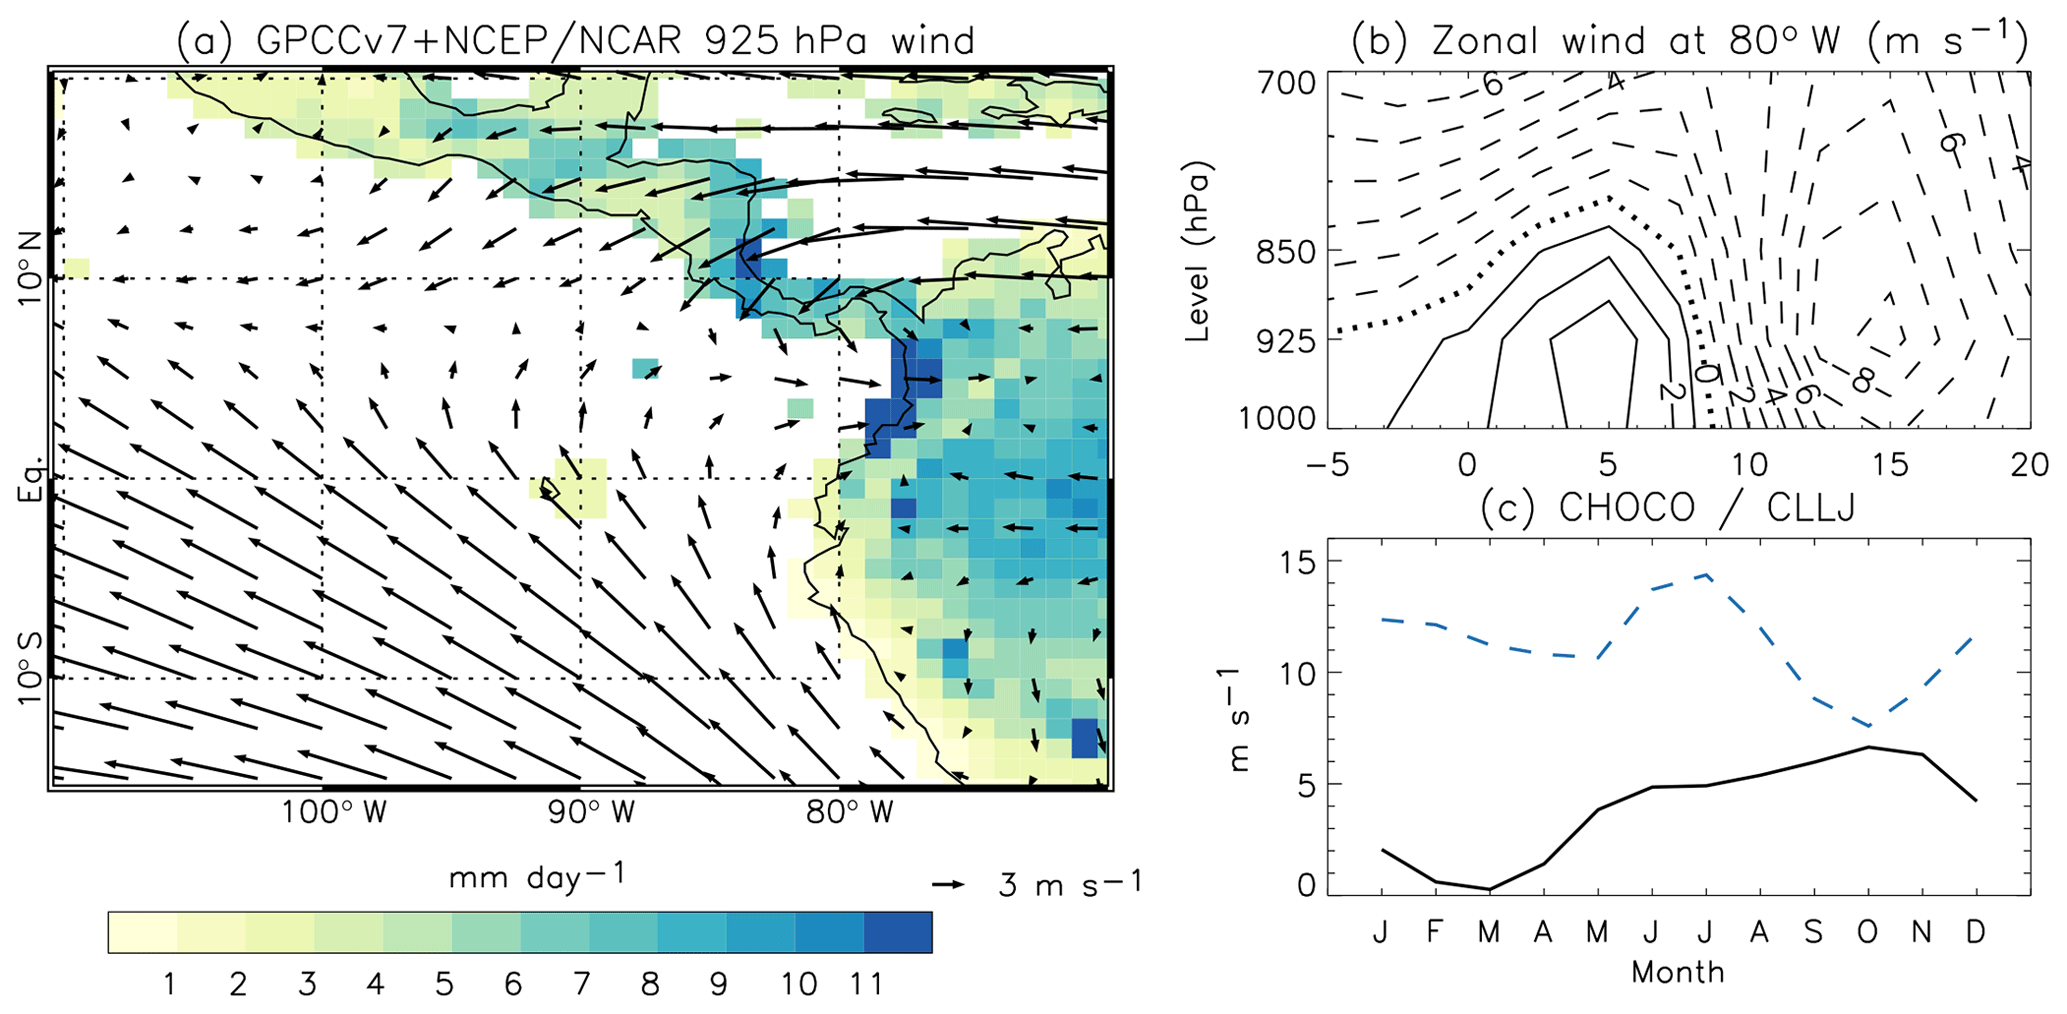
Figure 1(a) Average NCEP-NCAR wind vector at 925 hPa for the period 1981–2010 shading shows the corresponding average GPCCv7 precipitation; (b) 1981–2010 average cross section of the zonal wind from 5∘ S to 20∘ N at 80∘ W. Positive/negative (westerly/easterly) zonal wind is indicated by continuous/dashed contours; (c) 1981–2010 average monthly evolution of the zonal wind at 5∘ N, 80∘ W and 925 hPa (CHOCÓ, black line) and zonal wind (change of sign) at 15∘ N, 75∘ W and 925 hPa (CLLJ, blue dashed line).
In Fig. 1b a maximum of easterly zonal winds around 10 m s−1 is observed at 15∘ N and 925 hPa. It corresponds to the Caribbean Low-Level Jet (CLLJ) (Amador, 1998; Poveda and Mesa, 1999; Poveda et al., 2006; Wang, 2007). This jet also shows a marked seasonal variation. The absolute value of the zonal wind at 15∘ N, 75∘ W and 925 hPa constitutes a good measure of the intensity of this jet (Fig. 1c, dashed blue line). At the core of the CLLJ the absolute value of the wind speed varies between a minimum around 7 m s−1 (October) and a maximum of 14 m s−1 in July, with a secondary maximum in December and January (12 m s−1).

Figure 2(a) NCEP-NCAR wind vector at 925 hPa for August 1997. The black box indicates the area where the index developed in this paper is defined. (b) Cross section of the zonal wind from 5∘ S to 20∘ N at 80∘ W. (c) Cross section of the zonal wind from 5∘ S to 20∘ N at 90∘ W. In (b) and (c), positive/negative (westerly/easterly) zonal wind is indicated by continuous/dashed contours.
While the location of the core of both jets is rather constant at inter-annual scales, their relative strength is quite variable and strongly dependent upon the SST (sea surface temperature) in the tropical Pacific. This dependence is different in each case. Ultimately, the Chocó jet originates in the Southern Hemisphere trades; so, the weakening of the trades associated with positive SST anomalies in the eastern tropical Pacific (El Niño conditions) results in a weaker Chocó jet (Poveda et al., 2001). On the other hand, the dependence of the CLLJ with the SST anomalies is season dependent. As demonstrated by Wang (2007), during the boreal winter, a weak (strong) CLLJ corresponds to warm (cold) SST anomalies in the tropical Pacific. By contrast, during the boreal summer, a strong (weak) CLLJ is associated with warm (cold) SST anomalies. In this way, during the boreal winter, warm (cold) SST anomalies are associated both with weaker (stronger) Chocó jet and the CLLJ. In summer, the modulation of the SST over both jets is the opposite. Warm (cold) SST anomalies are associated with weak (strong) Chocó jets but strong (weak) CLLJs. This divergent behaviour results in a major signature on the distribution of the westerlies or easterlies noticeable at the surface level and over a large area of the eastern tropical North Pacific. As an example, Fig. 2 shows the average winds during August 1997, a month with high positive SST anomalies over the tropical Pacific. The pressure–latitude cross section of the zonal wind at 80∘ W (Fig. 2b) shows the consequent weak Chocó jet (although still existing and evidenced by positive zonal wind at 5∘ N) and an enhanced CLLJ. It is clearly evidenced that during these episodes, easterlies dominate a large area in the tropical North Pacific (outlined area in Fig. 2a). Westward of 90∘ W the prevalence of the easterly component is absolute, even at the surface. By contrast, in August 2010 (Fig. 3), a month of strong SST negative anomalies in the eastern equatorial Pacific, the enhanced Chocó jet is quite evident (Fig. 3b) and, most interestingly, in these cases, the westerlies (predominantly southwesterlies) dominate a wide area of the tropical Pacific (outlined area in Fig. 3a). Remarkably, the cross section of the zonal wind at 90∘ W (Fig. 3c) shows that at the surface the westerlies can reach 14∘ N.
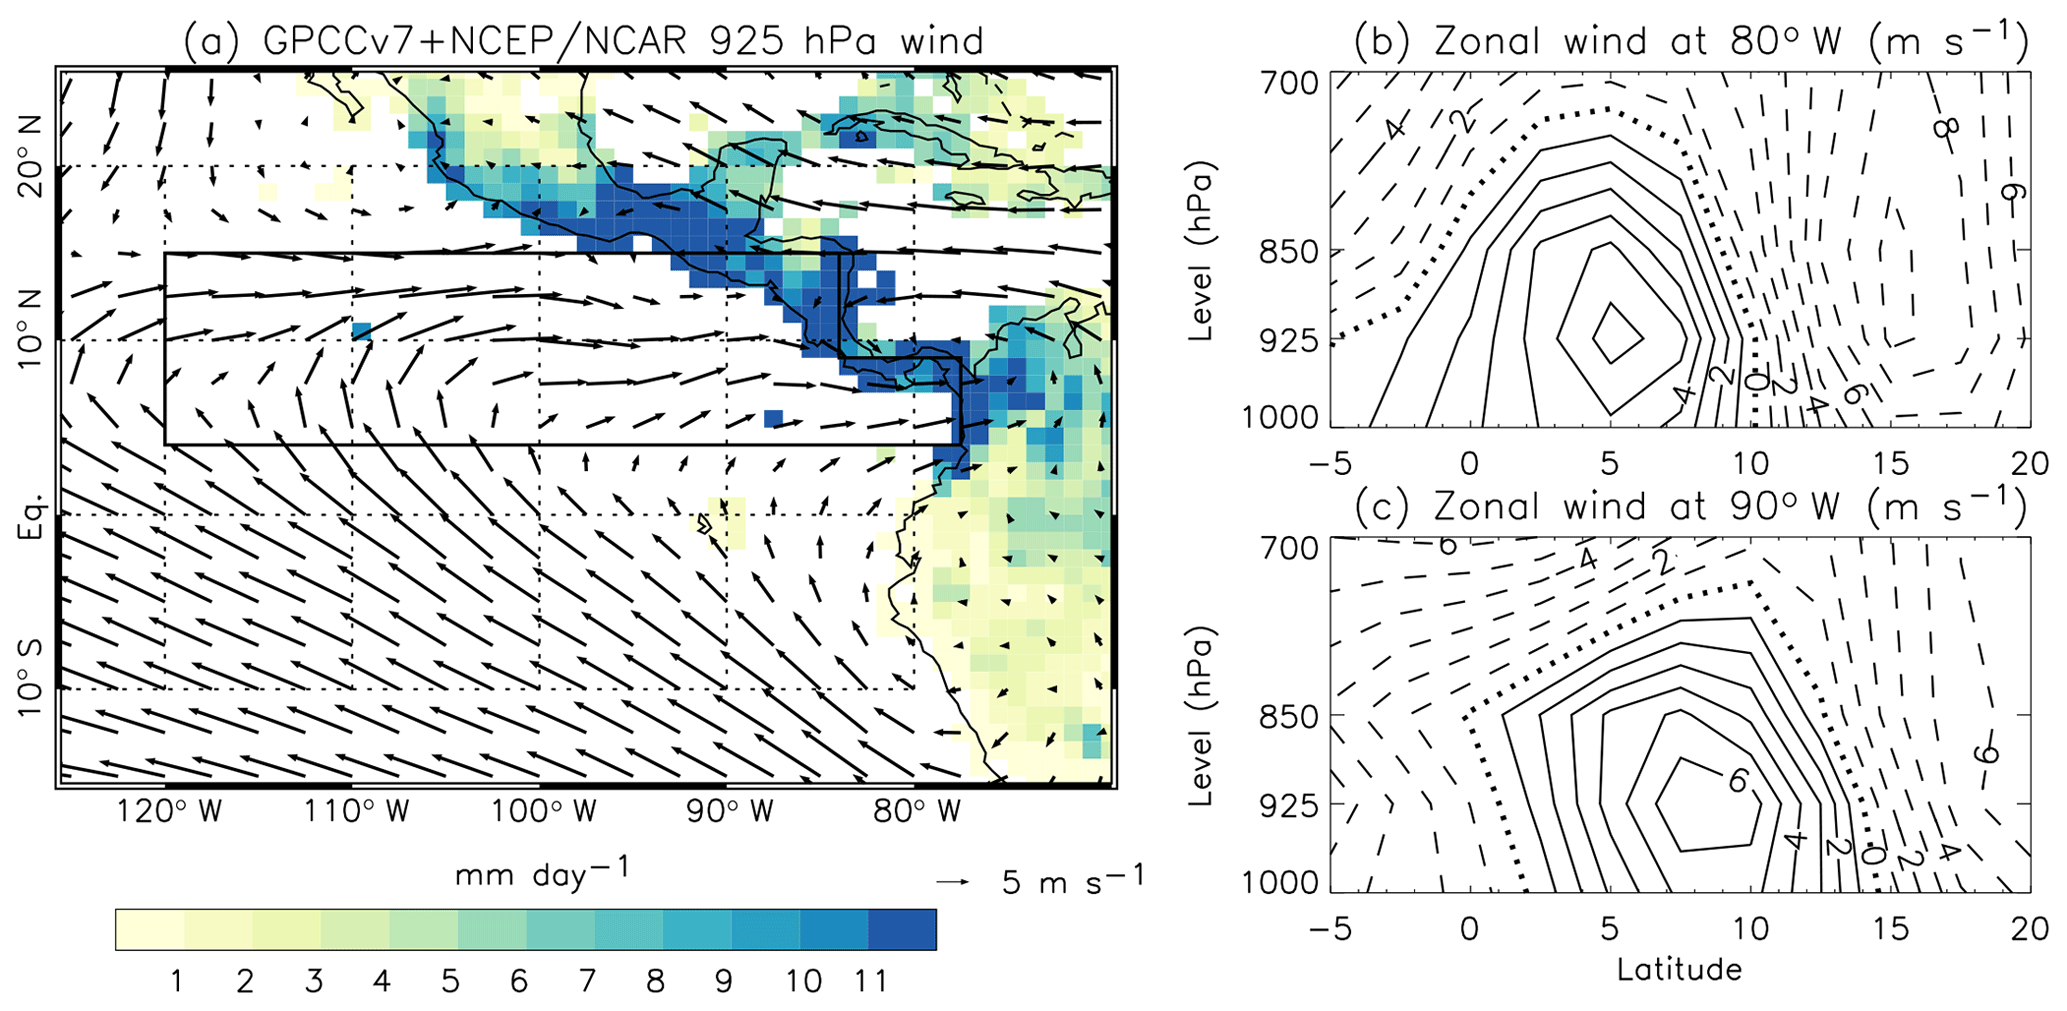
Figure 3(a) NCEP-NCAR wind vector at 925 hPa for August 2010. The black box indicates the area where the index developed in this paper is defined. (b) Cross section of the zonal wind from 5∘ S to 20∘ N at 80∘ W. (c) Cross section of the zonal wind from 5∘ S to 20∘ N at 90∘ W. In (b) and (c), positive/negative (westerly/easterly) zonal wind is indicated by continuous/dashed contours.
From the previous discussion, it is clear that, although the Chocó jet always blows from the west at its core (925 hPa, 5∘ N and 80∘ W), for the boreal warm season the changes in the strength of the Chocó jet are concurrent with significant changes in the distribution of the wind direction over a broad area at the surface. In a recent review paper, Garcia-Herrera et al. (2018) demonstrated that this kind of signature in the surface wind field can be exploited to design indices relying only on wind direction measurements. They also showed that these indices are highly representative of the moisture advection toward continental areas. The main advantage of these so-called “directional indices” is that by design, they only require the knowledge of the wind direction, a variable that has been routinely measured aboard ships since the end of the 17th century and avoid the uncertainties associated with the measurement of wind speed for early times (Prieto et al., 2005; Gallego et al., 2007). As a result of several data recovery projects (García-Herrera et al., 2005; Allan et al., 2011; Wilkinson et al., 2011, among others), millions of these early wind observations are today incorporated into the International Comprehensive Ocean-Atmosphere Data Set (ICOADS) database (Freeman et al., 2017). In its most recent release ICOADS holds over 456 million individual marine reports, covering the period 1662–2014. The objective of this paper is to develop a new index representative of the Chocó jet strength by exclusively using the raw wind direction measurement currently incorporated in ICOADS. As we will show below, this method provides an extension of almost one century to the current available indices for this jet.

Figure 4Number of wind direction observations in a 1×1 grid (May to November) and the 1800–2014 period available in ICOADS 3.0. Black contour indicates the area selected to compute the CHOCO-D index (4–15∘ N; 120–80∘ W). The graph at the bottom-left shows the time evolution of the cumulative number of wind direction observations inside the selected domain not considering data taken at moored buoys (note the logarithmic y scale).
2.1 Index definition
Directional indices are based solely on daily observations of wind direction and are usually defined as the monthly frequency of wind direction coming from a given range of angles. For a directional index to be representative, the climatological feature intended to be quantified must have a noticeable signature on the wind direction over a wide area at the surface level. We selected the area 4–15∘ N, 120–84∘ W plus the area 4–9∘ N, 84–77.5∘ W (outlined area in Figs. 2a and 3a) as those where the change in the distribution of easterlies or westerlies is most dependent on the relative strength of the two low-level jets active in the region. Figure 4 shows the selected domain, while shading shows the 1800–2014 cumulative density of ICOADS observations in a grid between May and November. The darkest grid points noticeable in the equatorial Pacific in Fig. 4 correspond to data taken by moored buoys, which in this region started operating in June 1986. Some of these buoys are inside the selected domain, and due to their fixed location, far from most usual ship's routes, and their high temporal resolution, they have become the dominant source of data since the 1990s in the selected domain. In order to maintain the homogeneity in the geographical distribution of the observed data in the domain, we did not consider data taken by moored buoys.

Figure 5(a) Monthly averages (1948–2014) of the NCEP-NCAR zonal wind at 925 hPa averaged over the 5–7.5∘ N, 90–80∘ W area (blue dashed line) and monthly averages of the CHOCO-D index for the same period in percentage of days in a month with prevailing wind flowing from the southwest (black line). Numbers over the CHOCO-D values indicate the monthly correlation between both series for the 1948–2014 period. Only correlations statistically significant (p<0.01) are displayed. Note that the scale of the wind is expressed as 10 m s−1 to ease comparison. (b) Standardized temporal series (June to October average) of the CHOCO-D index and the NCEP-NCAR zonal wind at 925 hPa averaged over 5–7.5∘ N, 90–80∘ W (blue dashed line).
The graph at the bottom-left corner in Fig. 4 shows the temporal evolution in the number of the available wind direction observations inside the selected area between May and November. Unfortunately, for the first half of the 19th century, ICOADS has a very poor coverage in the Pacific (typically below 100 observations between May and November). Around 1850 there is an increase in the data coverage, and, for some years, up to around 1000 observations can be found. However, the number of observations diminishes again to below 100 per year between 1860 and the final decade of the 19th century. From the beginning of the 20th century onwards, the number of observations is typically well over 1000 per year (with the exception of the World War II period) rising to more than 10 000 after the end of the 1950s. It is noteworthy that a large number of observations correspond to the routes following the coast, with a large contribution from the route from North America to the Panama Canal since its opening in the late 1910s. In fact, the latitude of the Panama Canal (around 9∘ N) was the southernmost latitude reached for most of the ships aiming for the Caribbean Sea.

Figure 6Expected dispersion (in %) of CHOCO-D as a function of the number of wind direction observations used to compute it (x axis) for May to November.
As a calibration series, we selected the NCEP-NCAR monthly zonal wind at 925 hPa averaged over the area 5–7.5∘ N, 90–80∘ W (Kalnay et al., 1996) as this database allows performing the calibration since 1948. Although the original Chocó jet index was defined exclusively at 80∘ W (Poveda and Mesa, 2000), we chose an extended region from 90 to 80∘ W to calibrate our index series to take into account the presence of westerlies as far west as 90∘ W in episodes of enhanced Chocó jet (See Fig. 3c). Inside the area outlined in Fig. 4a, we computed the so called CHOCO-D index (Chocó – Directional index) as the percentage of days per month with a prevalent wind blowing from the southwest (observed wind direction ranging between 180 and 270∘ from the north). Following the methodology of Barriopedro et al. (2014), we considered a day as “a day with prevalent wind flowing from the southwest” when at least 37 % of the wind observations in the selected area for a given day reported this wind direction. This percentage was set as the one maximizing the average correlation between June and October for 1948–2014 with the calibration series. It must be stressed that a sensitivity test (not shown) proves that variations in this optimal percentage of up to % produce only minor changes in the resulting CHOCO-D. A minimum of 10 days represented in a month was required to compute the index (Barriopedro et al., 2014).
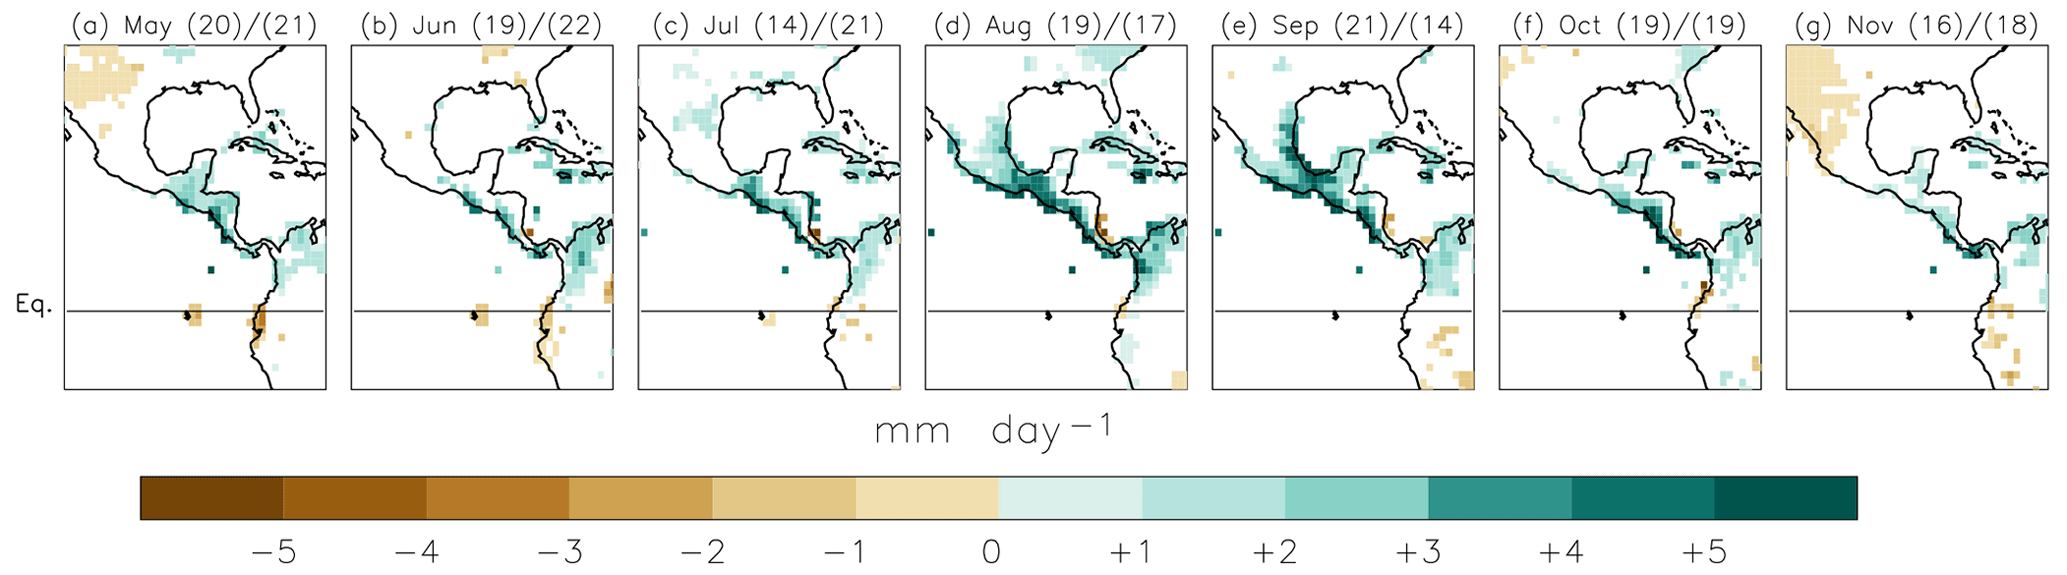
Figure 7GPCC precipitation differences between months with CHOCO-D over standard deviation for the 1901–2013 period (number of cases are indicated in brackets). Only areas with precipitation differences statistically significant at p<0.05 are represented.
The seasonal cycle of both the CHOCO-D index (black line) and the calibration series (dashed blue line) are displayed in Fig. 5a for the 1948–2014 period. The calibration series (dashed blue line) shows that the region from 90 to 80∘ W is dominated by weak northeasterly winds between January and March, but this regime has already changed to a westward one by April and the westward component characteristic of the Chocó jet is clearly evidenced between May and November. The two characteristic relative maxima in June and October are also found. The CHOCO-D index based exclusively on ICOADS wind direction observations (black line) closely mimics the seasonal march of the calibration series, with percentages of westerly days close to zero up to April and higher values between May and November. Two relative maxima are also found in June and September. A relative minimum is observed in July, coincident with the well-known midsummer drought in Central America (Small et al., 2007; Duran-Quesada et al., 2017). Figure 5a also shows the monthly correlations between the calibration series and the CHOCO-D index for the concurrent 1948–2014 period. For all the active jet season, correlations are positive and significant, with a maximum value of +0.69 (p<0.01) for August and always above +0.50 (p<0.01) from May to October. With the exception of some years around 1960, the close agreement between the temporal series of the CHOCO-D index and the 925 hPa zonal wind for the (June–October average) is shown in Fig. 5b. These values indicate that CHOCO-D captures a significant part of the variability of the zonal winds at the latitude of the Chocó jet.
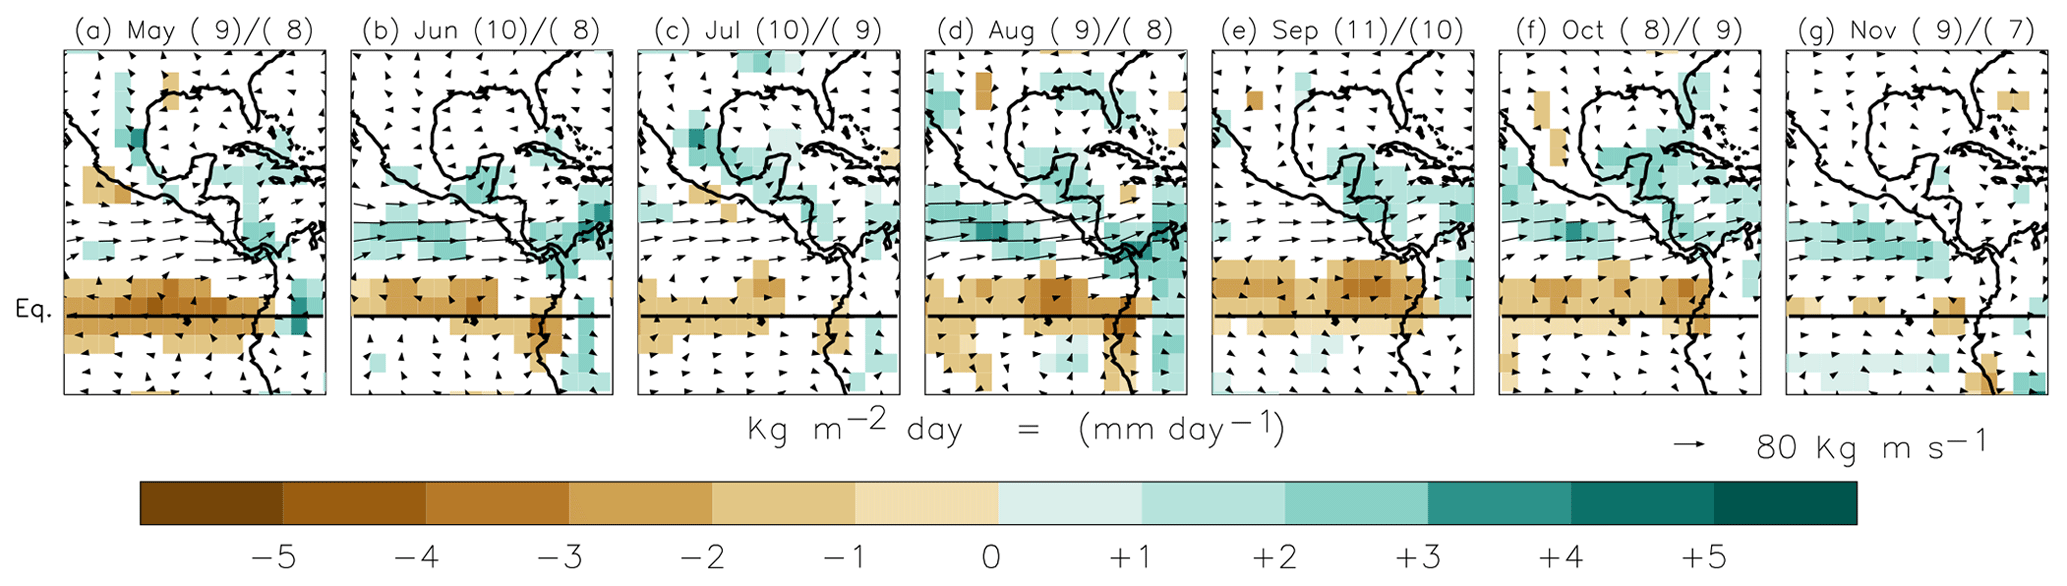
Figure 8Vertically integrated moisture transport between 1000 and 850 hPa (arrows; scale at the lower-right corner) and moisture convergence (shaded areas) differences between CHOCO-D standard deviations, years for the 1979–2014 period and NCEP-NCAR reanalysis data. Only moisture convergence differences significant at p<0.05 are represented. The number of CHOCO-D positive/negative cases used to compute the anomalies is indicated in brackets.
2.2 Assessment of the CHOCO-D index uncertainty
As shown by Gallego et al. (2015), directional indices suffer from a certain uncertainty derived from the fact that the wind direction in the chosen sector is represented by a limited number of point observations. Consequently, it is related to the number of data used to compute the index. In this case, the region encompasses around 5 000 000 km2. The inherent spatial variability of the wind inside this huge region and the finite number of available measurements in a given month is translated as dispersion in a particular realization of the index based on a finite sample of data. To estimate the expected uncertainty as a function of the number of available measurements, we computed 1000 “degraded” CHOCO-D indices constructed from N randomly selected wind observations inside the selected area. with N ranging between 10 and 500. For each N, the 1000 degraded CHOCO-D are expected to be different because they are computed from a different set of observations. The average standard deviation of these 1000 series as a function of N between May and November is shown in Fig. 6 for the period 1971–2010. This particular period was selected in order to have a large-enough pool of wind observation in ICOADS to select a random sample of at least 500 observations. The results are scarcely dependent on the month and, as expected, the largest standard deviations are found for N=10 (around 16 %) in all cases. This value rapidly decreases as N increases. For N=50 observations, the standard deviation is below 10 % and, for N over 400, the standard deviation is almost stable around 6 % to 7 %. The fact that the standard deviation does not tend to zero as N increases reflects the inherent spatial variability of the wind inside the large region considered. We took the standard deviation shown in Fig. 6 as a conservative dispersion measure for the final CHOCO-D index. It must be pointed out that this dispersion measure is purely empirical, depends on the region and should be only interpreted as the expected standard deviation of a CHOCO-D value computed from a particular set of wind direction measurements and not as a confidence interval in a statistical sense.

Figure 9Standardized CHOCO-D for May to November between 1840 and 2014. Error bars indicate the expected standard deviation based on the number of observations available each year in ICOADS 3.0 (see text for details). Shaded smoothed curve is computed as a robust locally weighted regression with a 31-year window (Cleveland, 1979).
Traditionally, it has been considered that the Caribbean Sea was the main moisture supplier for Central America and northern South America through the CLLJ (Wang et al., 2006). However, the importance of the transport from the Pacific source by the Chocó jet has been recently highlighted, and it is estimated that the moisture advected from this ocean can contribute up to 30 % of the total precipitation in areas of the western coast of Central America (Duran-Quesada et al., 2010, 2017; Hoyos, 2018). The relevance of the Pacific source is captured by CHOCO-D. Figure 7 shows the difference between precipitation composites for months with CHOCO-D above and below 1 standard deviation of its average value for the 1901–2013 period (“positive” and “negative” Chocó jet phases in succession) covered by the Global Precipitation Climatology Centre (v7) dataset (Becker et al., 2013). The precipitation changes associated with opposite anomalies of the CHOCO-D index extend over large areas of southern Mexico and Central America and spread southward into northern Colombia. The largest positive precipitation anomalies are found between July and September, when the Chocó jet is fully developed, and they are especially noticeable in the western coast of Central America from Guatemala to Panama, where precipitation anomalies exceed 5 mm day−1 during positive phases of CHOCO-D in relation to the negative ones. The connection of these rainfall anomalies with the moisture advection has been assessed by computing the vertically integrated moisture transport through the 1000–850 hPa levels and the corresponding moisture convergence (Fig. 8). We limited the latter analysis to the 1979–2014 period because of the large uncertainties in the vertical distribution of the specific humidity in the NCEP-NCAR reanalysis over the equatorial Pacific prior to the satellite era. In order to attain a large enough number of cases for this shorter period, we relaxed the threshold for including positive/negative phases by considering the years above/below 0.75 standard deviation of the CHOCO-D index. Despite the different periods considered and the lower spatial resolution of the reanalysis, the agreement between Figs. 7 and 8 is remarkable. As expected, large CHOCO-D values appear related to an enhanced moisture transport (anomalies of up to 100 kg m−1 s−1) from the Pacific into Central America in a latitude band extending from around 4 to 15∘ N. The higher values of moisture convergence related to this enhanced transport are located over Panama and the pacific coast of Colombia, westward of the Cordillera Central. It is also interesting to note that the Pacific is a relevant moisture source for the Caribbean as well. Over this area, large values of moisture convergence occur, resulting in significant changes in the precipitation of the Greater Antilles, especially in Jamaica and large areas of Cuba (see Fig. 7d, for example).
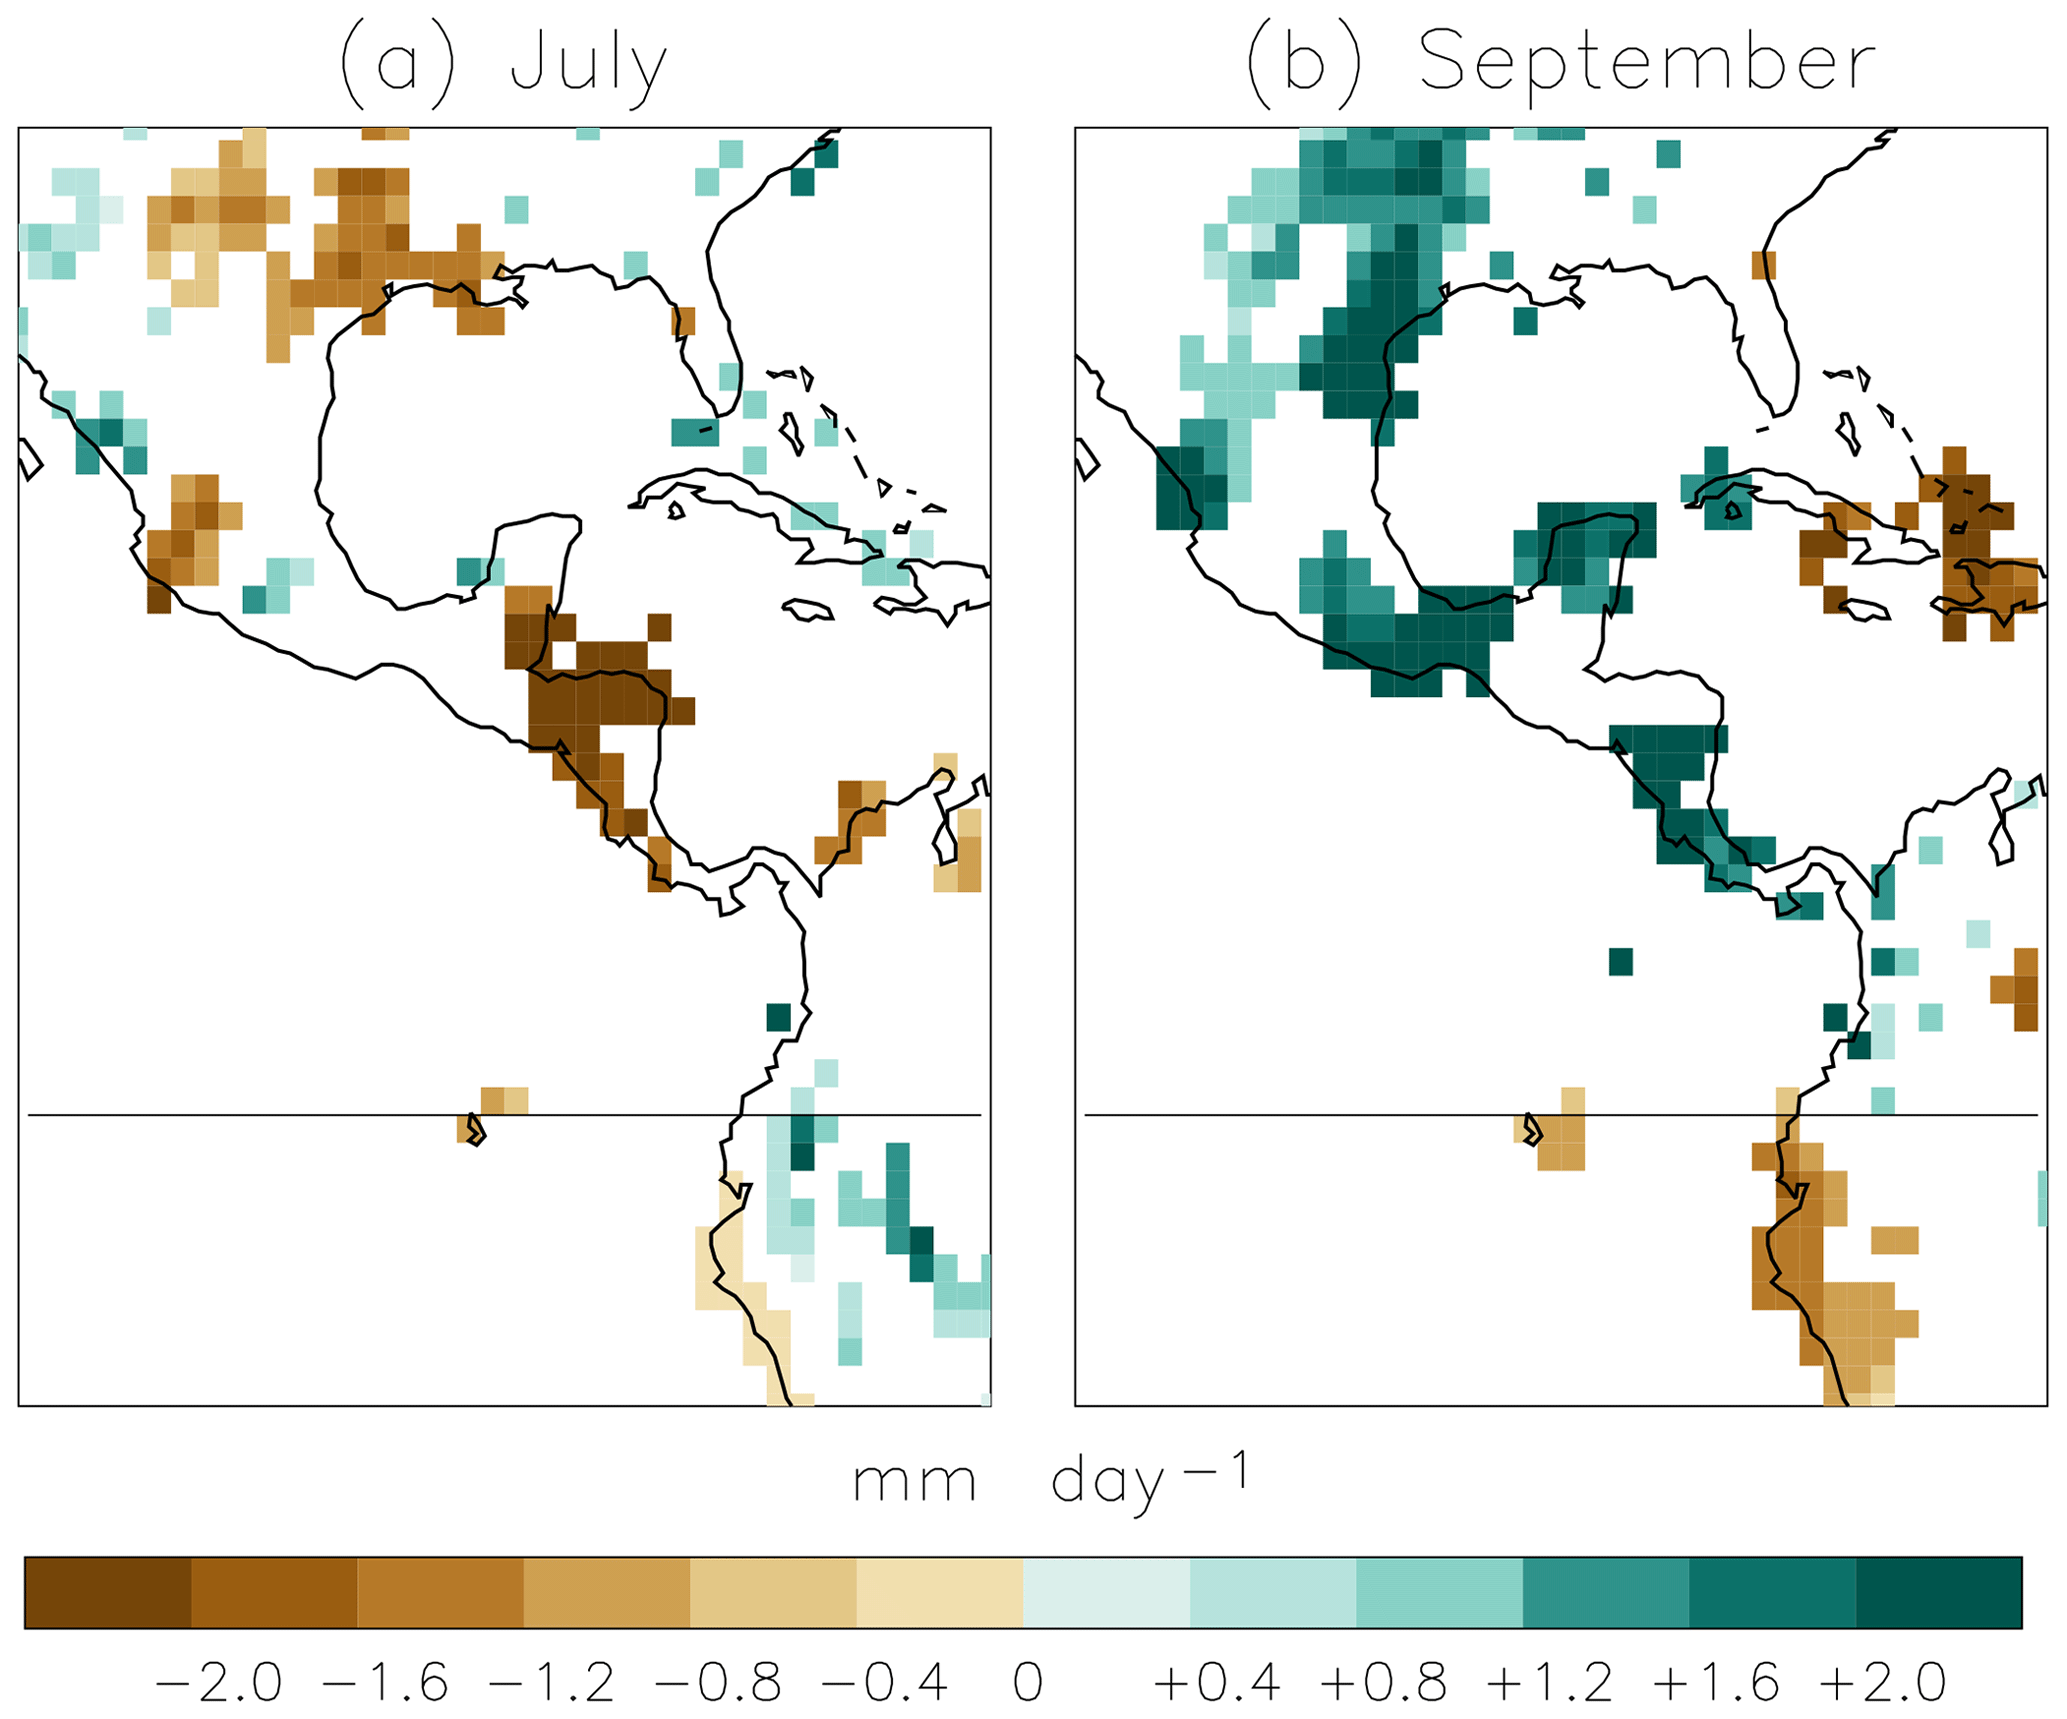
Figure 10GPCC precipitation differences between the 11-year period 1965–1975 and 1901–1911 for (a) July and (b) September. Only differences at p<0.05 are displayed.
4.1 Inter-annual and decadal variability
The exceptional time coverage of ICOADS allows building an almost continuous monthly record of the CHOCO-D index starting in the 1880s and for some years between 1850 and 1860 (Fig. 9). The series indicates that the Chocó jet is rather variable at an inter-annual scale but the most prominent feature of the time evolution is a marked interdecadal variability, which is evident for all months (smoothed coloured curves in Fig. 9). This longer-term variability is quite dependent on the considered month. In general, the period 1880–1910 was characterized by stronger-than-average jets from May to August and also in November, while weaker-than-average jets are found in September and October. The subsequent three decades (1910–1940) show a general tendency to lower than average jets (except in November) which is quite evident in August. After the 1940s, the long-term anomalies even became most dependent on the month. In May, CHOCO-D shows an alternating behaviour at near-decadal periods, while in June the index oscillates around the average. In July and August, CHOCO-D was mostly below its long-term average up to the 1990s, while in September and October it was above it up to the end of the series (2014), with a short period (1981–1990) of weak jets in October. November shows a long period of quite weak jets from 1960 to the late 1990s followed by a recovery to near-average values since the first years of the 21st century.
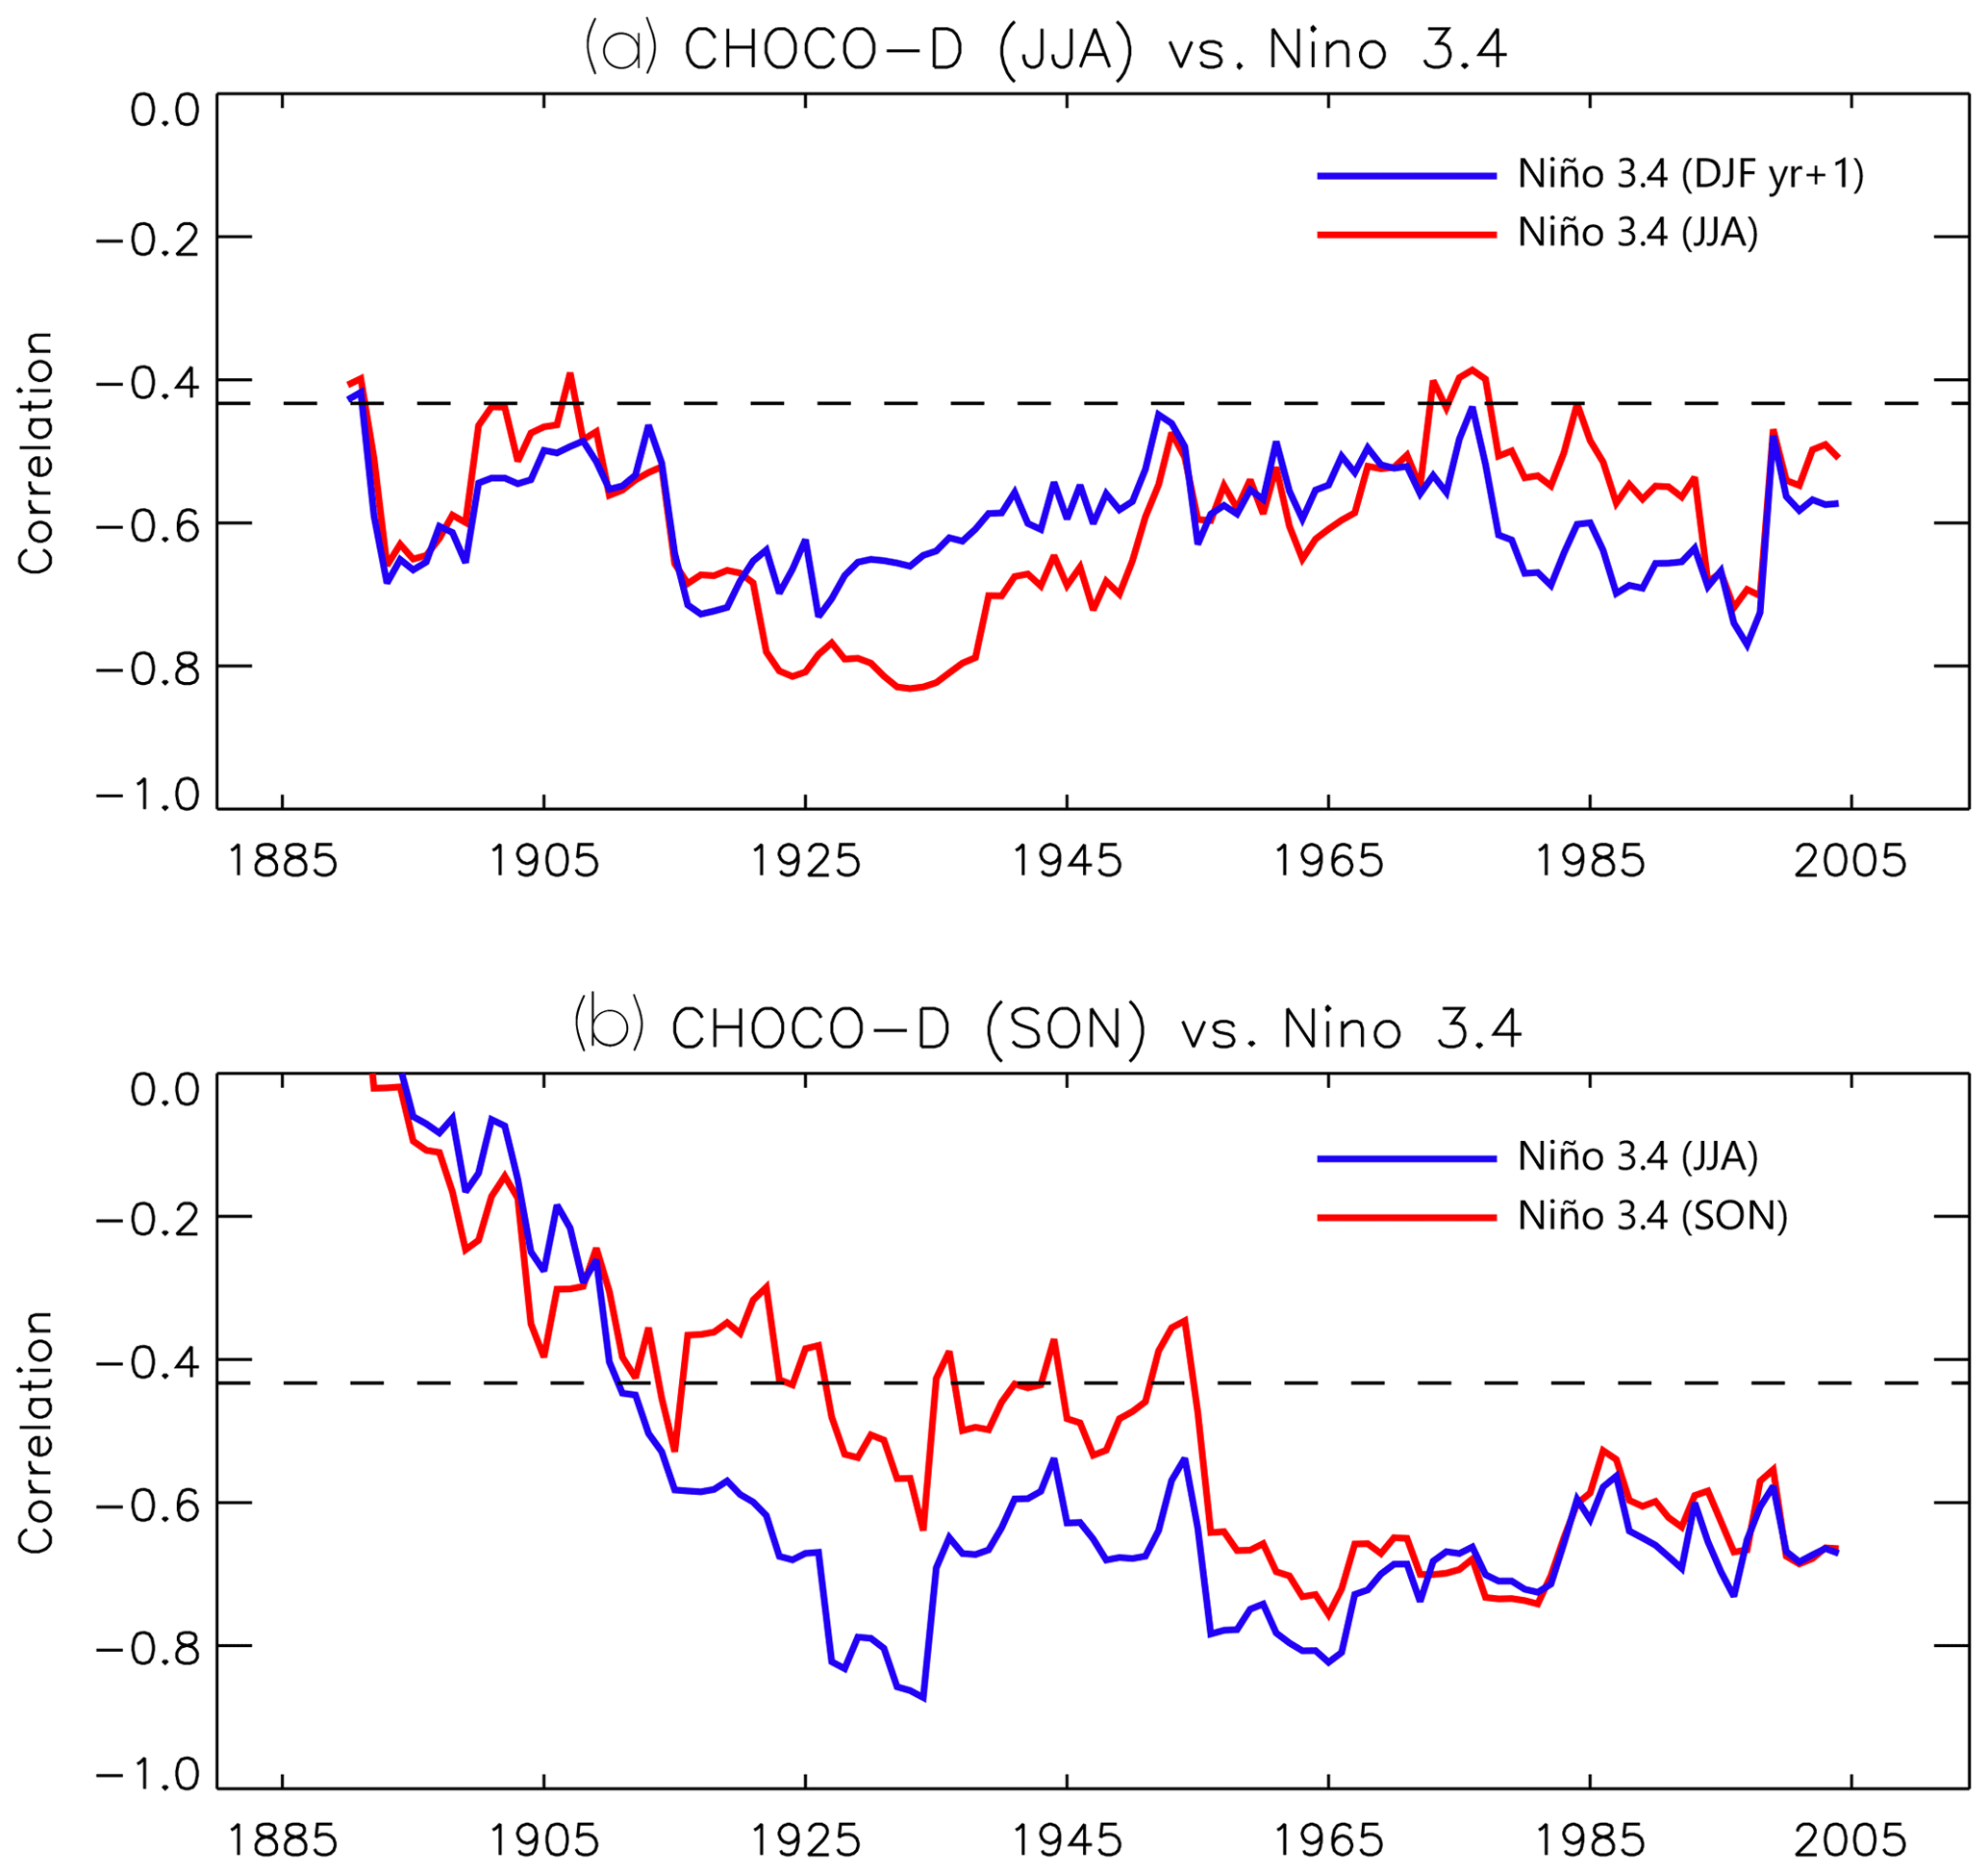
Figure 11(a) Twenty-one-year running Pearson's correlation coefficient between CHOCO-D (JJA) and El Niño3.4 in Phase (JJA, red line) and the following boreal winter (DJF yr +1, blue line); (b) 21 yr running Pearson's correlation coefficient between CHOCO-D (SON) and El Niño3.4 the previous boreal summer (JJA, blue) and in phase (SON, red line). Dotted line indicates statistically significant correlation at p<0.05.
The strong dependence of the CHOCO-D behaviour on the month suggests that the seasonal distribution of the precipitation associated with the Pacific moisture source could be modulated by these long-term changes in the Chocó jet. Accounting for no more that 30 % of the total precipitation in the area (Duran-Quesada et al., 2010), the changes in the total precipitation associated with the variability of the Chocó jet are necessarily moderate but yet discernible in cases of large opposite jet anomalies. For example, according to Fig. 9, the period 1901–1911 was characterized by a persistent strong jet in July and a relatively weak one in September. The opposite situation is observed in 1965–1975, with a very weak jet in July and a strong one in September. When the Global Precipitation Climatology Centre (GPCC) difference in precipitation between the 11-year periods 1965–1975 and 1911–1911 is computed (Fig. 10), it is found that in July (September), the period 1965–1975 was significantly drier (wetter) than 1911–1911 in large parts of Central America and northern Colombia, with changes in the total precipitation of the order of mm day−1.
4.2 Relationship with ENSO
As stated in the introduction, the Chocó jet ultimately originates in the southerly trade winds, making it strongly dependent on the meridional SST gradient along the eastern equatorial Pacific (Martinez et al., 2003) and therefore on ENSO. Typically the ENSO cycle encompasses two calendar years. A warm event (El Niño) tends to begin during the boreal spring (year 0), developing increasing SST anomalies peaking the following winter (year +1), then declining to the subsequent summer (year +1). The diminished temperature gradient between the Peruvian coast and the Panama Bight/northern Colombian western coast around 5∘ N during the course of an El Niño event is accompanied by a weaker Chocó jet (Poveda et al., 2001). The profound link between this meridional SST gradient and the precipitation in western Colombia through changes in the Chocó jet has been documented for the second part of the 20th century by Poveda and Mesa (2000) and Poveda et al. (2001), and it has been subsequently assumed as the basis for the reconstruction of the climate in the area since the last glaciation (Martinez et al., 2003). The long series of the CHOCO-D index allows us to assess the stability of this relationship between the Chocó jet and the ENSO at a secular scale for the first time.
Figure 11 shows that as expected, the correlation between the El Niño3.4 index and CHOCO-D has been mostly negative throughout the entire 20th century for the in-phase (JJA, Fig. 3a red line) and the lagged cases (CHOCO-D(JJA) leading El Niño3.4; DJF yr +1). This indicates that a weak jet in JJA tends to be followed by SST increases (El Niño conditions) the following winter. Some fluctuations in the absolute magnitude of the correlation are found, but Fig. 11a shows that these relations have been remarkably stable throughout the 20th century. On the other hand, Fig. 11b shows that, according to our series, a weak jet during SON is also typically concurrent with in-phase warmer SSTs (Fig. 11b, red line), while warm SSTs during JJA tend to be followed by a weaker jet (Fig. 11b, blue line). Interestingly, the intensity of these relations involving the SON-averaged CHOCO-D has changed throughout the 20th century, being clearly weaker prior to the 1920s.
During the last years, a number of studies have dealt with climate reconstructions based on historical wind direction measurements (see Garcia-Herrera et al., 2018, for a recent review). However, due to the low number of historical meteorological records over the eastern Pacific, most of these works correspond to reconstructions over the North Atlantic or the Indian Ocean. The few exceptions considering the Pacific are limited to the study of the climatic implications in the changes in the duration of a particular shipping route (Garcia et al., 2001), focus on the westernmost North Pacific (Vega et al., 2018) or make use of indirect approaches, by estimating the climate in the tropical Pacific through the use of present-day teleconnection patterns using data from other oceanic basins (e.g. Barrett et al., 2017a, b). In this work, we have found that the strength of the Chocó jet can be estimated through an index starting in the 1850s by using in situ wind direction measurements contained in ICOADS. To the best of our knowledge, this is the first time that a quantitative instrumental climate index over the eastern tropical Pacific has been built for such a long period.
This reconstruction has been possible because the signature of the Chocó jet variability in the distribution of the wind direction at the surface is sought in a large area where the aggregated number of observations available in ICOADS is currently enough for computing a meaningful index. As described graphically by Poveda (2018), in the tropical eastern Pacific, the wind field configuration is the result of a “tug of war” between two low-level jets blowing from opposite directions: the CLLJ blowing from the Caribbean into the Pacific and the Chocó jet originating in the Southern Hemisphere trade winds belt and recurving to the east as it crosses the Equator (Poveda et al., 2001, 2006 and 2014). While the location of the core of both jets is almost stationary (Poveda and Mesa, 2000; Sakamoto et al., 2011; Sierra et al., 2018), their relative strength is quite dependent on the SST anomalies over the equatorial Pacific. During the Northern Hemisphere warm season, the modulation of the SST anomalies over both jets is opposite (Wang, 2007), and this results in a significant change in the distribution of the westerlies/easterlies in a large oceanic area. In this way during years of a strong Chocó jet, at the surface the westerlies can reach the 15∘ N latitude limit even as far west as 120∘ W, while in years of a weak Chocó jet, the westerlies are restricted to 80∘ W. We found that, the proportion of days with wind blowing from the southwest in the areas 4–15∘ N, 120–84∘ W plus 4–9∘ N, 84–77.5∘ W is significantly related to the relative strength of the Chocó jet as measured by the average wind speed at its core.
It must be pointed out that our index has some caveats. On the one hand, the strength of the Chocó jet is not exclusively dependent on the relative strengths of the CLLJ and the Chocó jet, as it is implicitly assumed in our approach. In fact, the strength of the Chocó jet is partly dependent on the CLLJ dynamics. From the Caribbean, the CLLJ divides in two branches, one passes through Central America toward the Pacific (the one entering our study area), but the other one crosses the Panama Isthmus and then merges with the Chocó jet (see Fig. 1a), enhancing it (Poveda et al., 2014). On the other hand, the Chocó jet suffers from positive feedbacks not necessarily related to the CLLJ, as the Chocó jet core is enhanced by the latent heat released as it enters the continent generating precipitation (Velasco and Fritsch, 1987; Poveda and Mesa, 2000). Additionally, while the Chocó jet is present in the region throughout the whole year, our index can be only computed between May and November. Between December and April, the southward migration of the ITCZ allows the northeasterly Northern Hemisphere trade winds to blow as far south as 4∘ N (Wodzicki and Rapp, 2016), and during these months easterlies are essentially dominant in our study area, and the CHOCO-D index is near zero regardless of the strength of the Chocó jet.
These limitations explain both the absence of estimations of the Chocó jet strength between December and April and the moderate correlation between CHOCO-D and the Chocó jet strength for the rest of the year ( p<0.01 for the May–October average; see Fig. 5b). However, during these months, this relation is significant, peaking in May and August, with correlations above (p<0.01). Additionally, we have found that CHOCO-D is strongly representative of the moisture advection from the Pacific into Central America and northern South America and, therefore, of a significant part of the precipitation in this area related to the moisture transported from the Pacific.
According to the CHOCO-D record, the Chocó jet has experienced changes at decadal scales at least since 1880. They are quite dependent on the month. Interestingly the July series shows a tendency to be above its long-term average value from 1840 to 1910 and below it from 1910 to 1990. September exhibits an opposite behaviour, being below average up to the 1920s and above it from that decade onwards. As the reversal in the trends for July and September occurred at the beginning of the 20th century, the evaluation of the consequent changes in independent precipitation records is rather uncertain because of the low number of precipitation data in this part of the world during the first two decades of the 20th century (Becker et al., 2013). Notwithstanding this, the analysis of the GPCC dataset suggests that throughout the 20th century, there was a discernible change in the seasonal distribution of the precipitation related to the intra-annual variability of the Chocó jet. Finally, it is worth mentioning that Carmona and Poveda (2014) found an increasing trend in the precipitation of the Pacific coast of Colombia starting in the last decades of the 20th century. Our results support this finding, as the strength of the Chocó jet has been steadily increasing for May, June, July and August since the last years of the 20th century (Fig. 9).
Since their conception, one of the main applications of directional indices has been the analysis of the stability of teleconnection patterns (Gomez-Delgado et al., 2019). For instance, directional indices have been used to prove that the relation between the strength of the West African monsoon and the ENSO or the Atlantic Multidecadal Oscillation have been unstable (Gallego et al., 2015). Similarly, instabilities have been described in the relation between the ENSO and the strength of the western North Pacific summer monsoon (Vega et al., 2018). By contrast, we have found that the relation between the Chocó jet strength during JJA and the El Niño3.4 index (JJA and DJF yr +1) has been remarkably stable at least since the 1880s. This is particularly relevant because the stability of this relation is usually the basis of the hydrologic reconstruction or prediction in northern South America (Gutiérrez and Dracup, 2001; Prange et al., 2010; Córdoba-Machado et al., 2015). However, our results suggest that the intensity of these relations involving the SON-averaged CHOCO-D has changed throughout the 20th century, being clearly weaker prior to the 1930s. We do not currently have an explanation for this finding, and it must be considered cautiously as the uncertainty of CHOCO-D during this early period is the largest (Fig. 9), but it could be related to the shift from negative to positive anomalies around the 1920s–1930s discussed for the September and October CHOCO-D series (see Fig. 9). The results are also found when the ENSO cycle is represented by the Southern Oscillation Index (Ropelewski and Jones, 1987) based on sea level pressure instrumental measurements (not shown).
In this paper, we present a new example of how climate indices based exclusively on wind direction measurements over the ocean have a large potential to provide a better understanding of the long-term climate variability, in this case in the eastern equatorial Pacific, a region with scarce inland observational records. The low-level circulation in this region is dominated by the Chocó jet, driving a large amount of moisture toward Central America and northern South America, which as a result is one of the rainiest areas in the world. With the data currently available on ICOADS, it has been possible to assess the long-term variability of this jet since the late 19th century and some years of the 1850s, revealing a complex but significant variability at multidecadal scales. However, there are still some important gaps in the data coverage such as the World War II period and the years between 1860 and 1880, while prior to the 1920s, the low number of available observations results in uncertainties of the CHOCO-D index around 15 %. We expect the results of this research will stimulate future efforts in data rescue aimed at improving the data coverage in this part of the world for years prior to the 1920s.
NCEP reanalysis derived data (Kalnay et al., 1996), CMAP precipitation data (Huffman et al., 1997) and GPCC precipitation data (Becker et al., 2013) are provided by the NOAA/OAR/ESRL PSD, Boulder, Colorado, USA, from their website at http://www.esrl.noaa.gov/psd/ (last access: 4 January 2019). ICOADS data (Freeman et al., 2017) are provided by the NCAR/UCAR Research Data Archive, from their website at https://rda.ucar.edu/datasets/ds548.0/ (last access: 4 January 2019).
DG, RGH and POP conceived the study and developed the methodology. DG developed the software, computed the index and prepared the manuscript with contributions from PR. FdPG calculated the relationship between CHOCO-D and ENSO. All authors discussed the results and took part in the revision of the original manuscript.
The authors declare that they have no conflict of interest.
This article is part of the special issue “The 8th EGU Leonardo Conference: From evaporation to precipitation: the atmospheric moisture transport”. It is a result of the 8th EGU Leonardo Conference, Ourense, Spain, 25–27 October 2016.
This research was funded by the Spanish Ministerio de Economía y Competitividad through the projects CGL2013-44530-P, CGL2014-51721-REDT and the research group RNM-356 belonging to the “Plan Andaluz de Investigación Desarrollo e Innovación”.
This paper was edited by Sergio Martín Vicente Serrano and reviewed by Germán Poveda and two anonymous referees.
Allan, R., Brohan, P., Compo, G. P., Stone, R., Luterbacher, J., and Brönnimann, S.: The International Atmospheric Circulation Reconstructions over the Earth (ACRE) Initiative, B. Am. Meteorol. Soc., 92, 1421–1425, https://doi.org/10.1175/2011BAMS3218.1, 2011.
Amador, J. A.: A climatic feature of the tropical Americas: The trade wind easterly jet, Top. Meteor. Oceanogr., 5, 91–102, 1998.
Arias, P. A., Martínez, J. A., and Vieira, S. C.: Moisture sources to the 2010–2012 anomalous wet season in northern South America, Clim. Dynam., 45, 2861–2884, https://doi.org/10.1007/s00382-015-2511-7, 2015.
Arnett, A. B. and Steadman, C. R.: Low-level wind flow over eastern Panama and northwestern Colombia, ESSA Technical Memorandum ERLTM-ARL 26, U.S. Department of Commerce, Environmental Science Services, Administration Research Laboratories, Air Resources Lab., Silver Spring, Maryland, 73 pp., 1970.
Barrett, H. G., Jones, J. M., and Bigg, G. R.: Reconstructing El Niño Southern Oscillation using data from ships' logbooks, 1815–1854, Part I: methodology and evaluation, Clim. Dynam., 50, 845–862, https://doi.org/10.1007/s00382-017-3644-7, 2017a.
Barrett, H. G., Jones, J. M., and Bigg, G. R.: Reconstructing El Niño Southern Oscillation using data from ships' logbooks, 1815–1854, Part II: Comparisons with existing ENSO reconstructions and implications for reconstructing ENSO diversity, Clim. Dynam., 50, 3131–3152, https://doi.org/10.1007/s00382-017-3797-4, 2017b.
Barriopedro, D., Gallego, D., Alvarez-Castro, M. C., Garcia-Herrera, R., Wheeler, D., Peña-Ortiz, C., and Barbosa, S. M.: Witnessing North Atlantic westerlies variability from ship's logbooks (1685–2008), Clim. Dynam., 43, 939–955, https://doi.org/10.1007/s00382-013-1957-8, 2014.
Becker, A., Finger, P., Meyer-Christoffer, A., Rudolf, B., Schamm, K., Schneider, U., and Ziese, M.: A description of the global land-surface precipitation data products of the Global Precipitation Climatology Centre with sample applications including centennial (trend) analysis from 1901-present, Earth Syst. Sci. Data, 5, 71–99, https://doi.org/10.5194/essd-5-71-2013, 2013.
Carmona, A. and Poveda, G.: Detection of long-term trends in monthly hydro-climatic series of Colombia through Empirical Mode Decomposition, Climatic Change, 123, 301–313, https://doi.org/10.1007/s10584-013-1046-3, 2014.
Cleveland, W. S.: Robust locally weighted regression and smoothing scatterplots, J. Am. Stat. Assoc., 74, 829–836, https://doi.org/10.1080/01621459.1979.10481038, 1979.
Córdoba-Machado, S., Palomino-Lemus, R., Gámiz-Fortis, S. R., Castro-Díez, Y., and Esteban-Parra, M. J.: Influence of tropical Pacific SST on seasonal precipitation in Colombia: prediction using El Niño and El Niño Modoki, Clim. Dynam., 44, 1293–1310, https://doi.org/10.1007/s00382-014-2232-3, 2015.
Durán-Quesada, A. M., Gimeno, L., Amador, J. A., and Nieto, R.: Moisture sources for Central America: Identification of moisture sources using a Lagrangian analysis technique, J. Geophys. Res., 115, D05103, https://doi.org/10.1029/2009JD012455, 2010.
Durán-Quesada, A. M., Gimeno, L., and Amador, J.: Role of moisture transport for Central American precipitation, Earth Syst. Dynam., 8, 147–161, https://doi.org/10.5194/esd-8-147-2017, 2017.
Freeman, E., Woodruff, S. D., Worley, S. J., Lubker, S. J., Kent, E. C., Angel, W. E., Berry, D. I., Brohan, P., Eastman, R., Gates, L., Gloeden, W., Ji, Z., Lawrimore, J., Rayner, N. A., Rosenhagen, G., and Smith, S. R.: ICOADS Release 3.0: A major update to the historical marine climate record, Int. J. Climatol., 37, 2211–2237, https://doi.org/10.1002/joc.4775, 2017.
Gallego, D., García-Herrera, R., Calvo, N., and Ribera, P.: A new meteorological record for Cadiz (Spain) 1806–1854, J. Geophys. Res., 112, D12108, https://doi.org/10.1029/2007JD008517, 2007.
Gallego, D., Ordóñez, P., Ribera, P., Peña-Ortiz, C., and García-Herrera, R.: An instrumental index of the West African Monsoon back to the 19th century, Q. J. Roy. Meteor. Soc., 141, 3166–3176, https://doi.org/10.1002/qj.2601, 2015.
Garcia, R. R., Díaz, H. F., García-Herrera, R., Eischeid, J., Prieto, M. R., Hernández, E., Gimeno, L., Durán, F. R., and Bascary, A. M.: Atmospheric Circulation Changes in the Tropical Pacific Inferred from the Voyages of the Manila Galleons in the Sixteenth–Eighteenth Centuries, B. Am. Meteorol. Soc., 82, 2435–2456, https://doi.org/10.1175/1520-0477(2001)082<2435:ACCITT>2.3.CO;2, 2001.
García-Herrera, R., Können, G. P., Wheeler, D. A., Prieto, M. R., Jones, P. D., and Koek F. B.: CLIWOC: a climatological database for the World's Oceans 1750–1854, Climatic Change, 73, 1–12, https://doi.org/10.1007/s10584-005-6952-6, 2005.
Garcia-Herrera, R., Barriopedro, D., Gallego, D., Mellado-Cano, J., Wheeler, D., and Wilkinson, C.: Understanding weather and climate of the last 300 years from ship's logbooks, WIREs Clim. Change, 9, e544, https://doi.org/10.1002/wcc.544, 2018.
Gomez-Delgado, F., Gallego, D., Peña-Ortiz, C., Vega, I., Ribera, P., and García-Herrera, R.: Long term variability of the northerly winds over the Eastern Mediterranean as seen from historical wind observations, Global Planet. Change, 172, 355–364, https://doi.org/10.1016/j.gloplacha.2018.10.008, 2019.
Gutiérrez, F. and Dracup, J. A.: An analysis of the feasibility of long-range streamflow forecasting for Colombia using El Niño-Southern Oscillation indicators, J. Hydrol., 246, 181–196, https://doi.org/10.1016/S0022-1694(01)00373-0, 2001.
Hoyos, I., Dominguez, F., Cañón-Barriga, J., Martínez, J. A., Nieto, R., Gimeno, L., and Dirmeyer, P. A.: Moisture origin and transport processes in Colombia, northern South America, Clim. Dynam., 50, 971–990, https://doi.org/10.1007/s00382-017-3653-6, 2018.
Huffman, G. J., Adler, R. F., Arkin, P., Chang, A., Ferraro, R., Gruber, A., Janowiak, J., McNab, A., Rudolf, B., and Schneider, U.: The Global Precipitation Climatology Project (GPCP) Combined Precipitation Dataset, B. Am. Meteorol. Soc., 78, 5–20, https://doi.org/10.1175/1520-0477(1997)078<0005:TGPCPG>2.0.CO;2, 1997.
Janowiak, J. E., Arkin, P. A., and Morrissey, M.: An examination of the diurnal cycle in oceanic tropical rainfall using satellite and in situ data, Mon. Weather Rev., 122, 2296–2311, https://doi.org/10.1175/1520-0493(1994)122<2296:AEOTDC>2.0.CO;2, 1994.
Jaramillo, L., Poveda, G., and Mejía, J. F.: Mesoscale convective systems and other precipitation features over the tropical Americas and surrounding seas as seen by TRMM, Int. J. Climatol., 37, 380–397, https://doi.org/10.1002/joc.5009, 2017.
Kalnay, E., Kanamitsu, M., Kistler, R., Collins, W., Deaven, D., Gandin, L., Iredell, M., Saha, S., White, G., Woollen, J., Zhu, Y., Leetmaa, A., Reynolds, R., Chelliah, M., Ebisuzaki, W., Higgins, W., Janowiak, J., Mo, K. C., Ropelewski, C., Wang, J., Jenne, R., and Joseph, D.: The NCEP/NCAR 40 year Reanalysis Project, B. Am. Meteorol. Soc., 77, 437–471, https://doi.org/10.1175/1520-0477(1996)077<0437:TNYRP>2.0.CO;2, 1996.
King, M. J., Wheeler, M. C., and Lane, T. P.: Mechanisms Linking Global 5-Day Waves to Tropical Convection, J. Atmos. Sci., 74, 3679–3702, https://doi.org/10.1175/JAS-D-17-0101.1, 2017.
Martínez, I., Keigwin, L., Barrows, T. T., Yokoyama, Y., and Southon, J.: La Niña-like conditions in the eastern equatorial Pacific and a stronger Choco jet in the northern Andes during the last glaciation, Paleoceanography, 18, 1033, https://doi.org/10.1029/2002PA000877, 2003.
Meisner, B. N. and Arkin, P. A.: Spatial and annual variations in the diurnal cycle of large-scale tropical convective clouds and precipitation, Mon. Weather Rev., 115, 2009–2032, https://doi.org/10.1175/1520-0493(1987)115<2009:SAAVIT>2.0.CO;2, 1987.
Murphy, R. C.: The Littoral of Pacific Colombia and Ecuador, Geogr. Rev., 29, 1–33, https://doi.org/10.2307/210063, 1939.
Poveda, G. and Mesa, O. J.: La Corriente de Chorro superficial del Oeste (“del Chocó”) y otras dos corrientes de chorro en Colombia: Climatología y variabilidad durante las fases de ENSO, Rev. Acad. Colom. Cien., 23, 517–528, 1999 (in Spanish).
Poveda, G. and Mesa, O. J.: On the existence of Lloró (the rainiest locality on Earth): Enhanced ocean-land-atmosphere interaction by a low-level jet, Geophys. Res. Lett., 27, 1675–1678, https://doi.org/10.1029/1999GL006091, 2000.
Poveda, G., Jaramillo, A., Gil, M. M., Quiceno, N., and Mantilla, R. I.: Seasonally in ENSO-related precipitation, river discharges, soil moisture, and vegetation index in Colombia, Water Resour. Res., 37, 2169–2178, https://doi.org/10.1029/2000WR900395, 2001.
Poveda, G., Waylen, P. R., and Pulwarty, R. S.: Annual and interannual variability of the present climate in northern South America and southern Mesoamerica, Palaeogeogr. Palaeocl., 234, 3–27, https://doi.org/10.1016/j.palaeo.2005.10.031, 2006.
Poveda, G., Alvarez, D. M., and Rueda, O. A.: Hydro-climatic variability over the Andes of Colombia associated with ENSO: a review of climatic processes and their impact on one of the Earth's most important biodiversity hotspots, Clim. Dynam., 36, 2233–2249, https://doi.org/10.1007/s00382-010-0931-y, 2011.
Poveda, G., Jaramillo, L., and Vallejo, L. F.: Seasonal precipitation patterns along pathways of South American low-level jets and aerial rivers, Water Resour. Res., 50, 98–118, https://doi.org/10.1002/2013WR014087, 2014.
Poveda, G.: Interactive comment on “Tracking the Choco jet since the 19th Century by using historical wind direction measurements”, Earth Syst. Dynam. Discuss., https://doi.org/10.5194/esd-2018-54-RC2, 2018.
Prange, M., Steph, S., Schulz, M., and Keigwin, L. D.: Inferring moisture transport across Central America: Can modern analogs of climate variability help reconcile paleosalinity records?, Quaternary Sci. Rev., 29, 1317–1321, https://doi.org/10.1016/j.quascirev.2010.02.029, 2010.
Prieto, M. R., Gallego, D., García-Herrera, R., and Calvo, N.: Deriving wind force terms from nautical reports through content analysis, The Spanish and French cases, Clim. Change, 73, 37–55, https://doi.org/10.1007/s10584-005-6956-2, 2005.
Ropelewski, C. F. and Jones, P. D.: An extension of the Tahiti-Darwin Southern Oscillation Index. Mon. Weather Rev., 115, 2161–2165, https://doi.org/10.1175/1520-0493(1987)115<2161:AEOTTS>2.0.CO;2, 1987.
Sakamoto, M. S., Ambrizzi, T., and Poveda, G.: Moisture sources and life cycle of convective systems over Western Colombia, Adv. Meteorol., 2011, 890759, https://doi.org/10.1155/2011/890759, 2011.
Sierra, J. P., Arias, P. A., Vieira, S. C., and Agudelo, J.: How well do CMIP5 models simulate the low-level jet in western Colombia?, Clim. Dynam., 51, 2247–2265, https://doi.org/10.1007/s00382-017-4010-5, 2018.
Small, R. J., de Szoeke, S. P., and Xie, S.: The Central American Midsummer Drought: Regional Aspects and Large-Scale Forcing, J. Climate, 20, 4853–4873, https://doi.org/10.1175/JCLI4261.1, 2007.
Trojer, H.: Meteorología y climatología de la vertiente del Pacífico colombiano, Rev. Acad. Colomb. Cienc. Ex. Fis. Nat., 10, 199–219, 1958 (in Spanish).
Vega, I., Gallego, D., Ribera, P., Gómez-Delgado, F., García-Herrera R., and Peña-Ortiz, C.: Reconstructing the Western North Pacific Summer Monsoon since the late 19th century, J. Climate, 31, 355–368, https://doi.org/10.1175/JCLI-D-17-0336.1, 2018.
Velasco, I. and Fritsch, J. M.: Mesoscale convective complexes in the Americas, J. Geophys. Res., 92, 9591–9613, https://doi.org/10.1029/JD092iD08p09591, 1987.
Wang, C., Enfield, D. B., Lee, S., and Landsea, C. W.: Influences of the Atlantic Warm Pool on Western Hemisphere Summer Rainfall and Atlantic Hurricanes, J. Climate, 19, 3011–3028, https://doi.org/10.1175/JCLI3770.1, 2006.
Wang, C.: Variability of the Caribbean Low-Level Jet and its relations to climate, Clim. Dynam., 29, 411–422, https://doi.org/10.1007/s00382-007-0243-z, 2007.
Wilkinson, C., Woodruff, S. D., Brohan, P., Claesson, S., Freeman, E., Koek, F., Lubker, S. J., Marzin, C., and Wheeler, D.: Recovery of logbooks and international marine data: the RECLAIM project, Int. J. Climatol., 31, 968–979, https://doi.org/10.1002/joc.2102, 2011.
Wodzicki, K. R. and Rapp, A. D.: Long-term characterization of the Pacific ITCZ using TRMM, GPCP, and ERA-Interim, J. Geophys. Res.-Atmos., 121, 3153–3170, https://doi.org/10.1002/2015JD024458, 2016.