the Creative Commons Attribution 4.0 License.
the Creative Commons Attribution 4.0 License.
 | 18 May 2018
Impacts of climate change and climate extremes on major crops productivity in China at a global warming of 1.5 and 2.0 °C
Yi Chen
Zhao Zhang
Fulu Tao
A new temperature goal of “holding the increase in global average temperature well below 2 ∘C above pre-industrial levels and pursuing efforts to limit the temperature increase to 1.5 ∘C above pre-industrial levels” has been established in the Paris Agreement, which calls for an understanding of climate risk under 1.5 and 2.0 ∘C warming scenarios. Here, we evaluated the effects of climate change on growth and productivity of three major crops (i.e. maize, wheat, rice) in China during 2106–2115 in warming scenarios of 1.5 and 2.0 ∘C using a method of ensemble simulation with well-validated Model to capture the Crop–Weather relationship over a Large Area (MCWLA) family crop models, their 10 sets of optimal crop model parameters and 70 climate projections from four global climate models. We presented the spatial patterns of changes in crop growth duration, crop yield, impacts of heat and drought stress, as well as crop yield variability and the probability of crop yield decrease. Results showed that climate change would have major negative impacts on crop production, particularly for wheat in north China, rice in south China and maize across the major cultivation areas, due to a decrease in crop growth duration and an increase in extreme events. By contrast, with moderate increases in temperature, solar radiation, precipitation and atmospheric CO2 concentration, agricultural climate resources such as light and thermal resources could be ameliorated, which would enhance canopy photosynthesis and consequently biomass accumulations and yields. The moderate climate change would slightly worsen the maize growth environment but would result in a much more appropriate growth environment for wheat and rice. As a result, wheat, rice and maize yields would change by +3.9 (+8.6), +4.1 (+9.4) and +0.2 % (−1.7 %), respectively, in a warming scenario of 1.5 ∘C (2.0 ∘C). In general, the warming scenarios would bring more opportunities than risks for crop development and food security in China. Moreover, although the variability of crop yield would increase from 1.5 ∘C warming to 2.0 ∘C warming, the probability of a crop yield decrease would decrease. Our findings highlight that the 2.0 ∘C warming scenario would be more suitable for crop production in China, but more attention should be paid to the expected increase in extreme event impacts.
- Article
(14832 KB) - Full-text XML
-
Supplement
(1380 KB) - BibTeX
- EndNote


In the past decades, global warming has markedly shifted the spatio-temporal patterns of temperature and precipitation (Gourdji et al., 2013; Liu and Allan, 2013). Moreover, the warming trend is expected to go on in the following decades with the increase in greenhouse gas emissions (Zhao et al., 2017), especially in cultivated areas (Lobell et al., 2011). The effects of climate changes and climate extreme on the growth and yields of crops have been of great concern (Porter et al., 2014; Asseng et al., 2015). Researchers have extensively demonstrated crop responses to climate factors through conducting environment-controlled experiments (e.g. Ottman et al., 2012; Chen et al., 2016), analysing historical records (e.g. Lobell et al., 2011; Tao et al., 2012, 2014) and carrying out crop model simulations (Porter et al., 2014; Asseng et al., 2015). These studies have documented that increasing temperature could shorten crop growth duration and reduce crop yields across a wide area (Porter et al., 2014). Meanwhile, with climate warming, the frequency and intensity of climate extreme events, for example heat stress, are projected to increase and substantially threaten crop growth and food security, especially for some susceptible areas (Wahid et al., 2007; Asseng et al., 2011; Gourdji et al., 2013). Beside the negative impacts, the warmer environment could also improve crop production in some areas that suffer from a heat deficit (Tao et al., 2008a, 2012, 2014; Zhang et al., 2014). In addition, elevated CO2 concentration could inhibit stomatal conductance and reduce transpiration rates (Brown and Rosenberg, 1997; Burkart et al., 2011; Deryng et al., 2016), enhance photosynthesis, and consequently have fertilization effects on crop productivity (Ainsworth et al., 2008; Leakey, 2009; Vanuytrecht et al., 2012; Pugh et al., 2016).
With the progresses on impact mechanisms, crop model improvements and impact assessment approaches such as ensemble simulations, climate change impact assessments have been elaborated in recent decades (Porter et al., 2014). The results of these studies have stressed the remarkable increase in extreme events and the decrease in major food crop yields, particularly under those scenarios with a relatively higher temperature increase (Lobell et al., 2014; Porter et al., 2014). These results alerted researchers to the food crisis and highlighted the importance of mitigating the impacts of human activities on climate change. Recently, a new temperature goal of “holding the increase in global average temperature well below 2 ∘C above pre-industrial levels and pursuing efforts to limit the temperature increase to 1.5 ∘C above pre-industrial levels” has been established in the Paris Agreement for the purpose of significantly reducing the risks and impacts that are caused by climate change (UNFCCC, 2015). This goal implied a more moderate climate scenario in the future, requiring more focuses on the impact evaluation in a warming world with ambitious mitigation strategies, and it thus called for climate change impact assessments under the 1.5 ∘C warming and 2.0 ∘C warming scenarios (Mitchell et al., 2016).
China is one of the major countries producing staple foods including maize, rice and wheat. Crop productions in China have accounted for roughly 21, 28 and 17 % of the global total production of maize, rice and wheat, respectively, during the past decade. However, so far there has been no study of the impacts of 1.5 ∘C warming and 2.0 ∘C warming on crop production in China. Therefore, little information is available on the question of what may probably happen to the future crop production in China under a moderate temperature increase. Here, we conducted a study to evaluate the influences of climate change and climate extremes on these major crop yields in China in the warming scenarios of 1.5 and 2.0 ∘C. We aimed to provide the spatial patterns of changes in crop growth duration, crop yield, yield decrease probability, and the impacts of heat and drought stress for three major crops under these warming scenarios across China at a spatial resolution of 0.5∘ × 0.5∘.
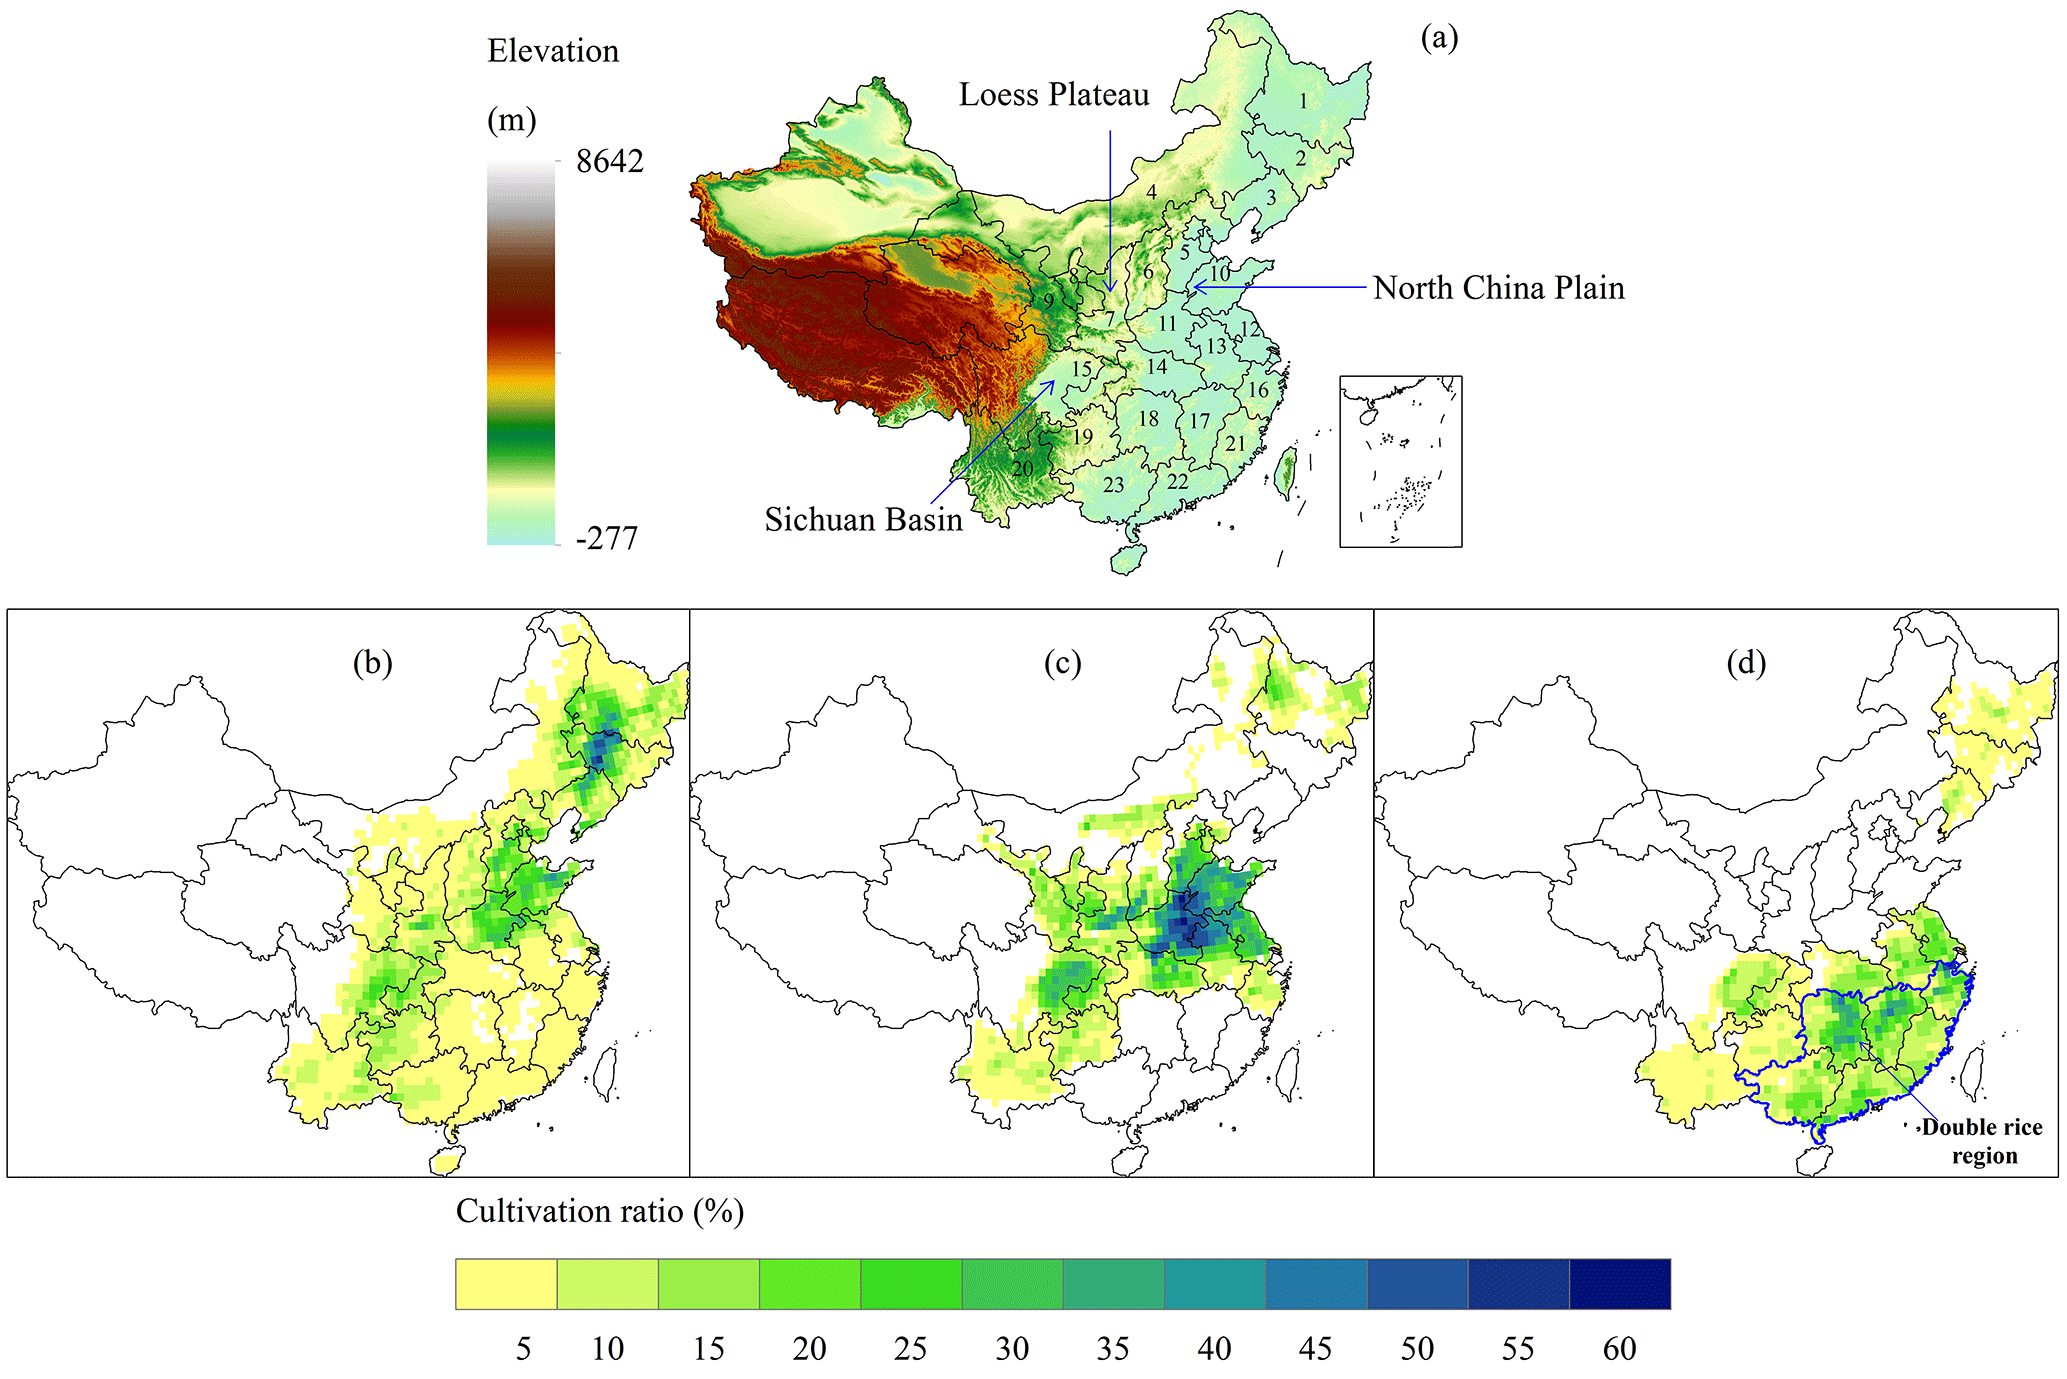
Figure 1Terrain (a) and cultivation fractions of maize (b), wheat (c) and rice (d) in the study area. Province codes: 1: Heilongjiang; 2: Jilin; 3: Liaoning: 4: Inner Mongolia; 5: Hebei and Beijing and Tianjin; 6: Shanxi; 7: Shannxi; 8: Ningxia; 9: Gansu; 10: Shandong; 11: Henan; 12: Jiangsu; 13: Anhui; 14: Hubei; 15: Sichuan and Chongqing; 16: Zhejiang; 17: Jiangxi; 18: Hunan; 19: Guizhou; 20: Yunnan; 21: Fujian; 22: Guangdong; 23: Guangxi.
2.1 Study area
This study focused on the cultivation area of maize, wheat and rice across China. The crop cultivation areas are shown in Fig. 1. The study was conducted at a grid scale with spatial resolution of 0.5∘ × 0.5∘. The maize was mainly sown in northeast China, the North China Plain (NCP) and some areas of southwest China (Fig. 1b). The major cultivation areas of winter wheat were across the NCP and Sichuan Basin, and spring wheat was sown above 40∘ N (latitude) (Fig. 1c). The rice was widely cultivated in northeast, southwest and south China (Fig. 1d). The double rice cropping system (early rice and later rice) was used in six provinces in south China, while single rice cropping was practiced in other regions. The dataset of cultivation area information was obtained from Monfreda et al. (2008). The information for crop phenology can be found at http://data.cma.cn/en (last access: 15 August 2017). In addition, crop yields in each growing season have been recorded by the National Bureau of Statistics of China (http://www.stats.gov.cn/english/, last access: 20 August 2017).
2.2 Data
The climate dataset used in this study were the outputs of the half a degree additional warming, projections, prognosis and impacts (HAPPI) experiment, which provided historical climate datasets during 2006–2015 and the projected climate scenarios that were 1.5 and 2.0 ∘C warmer than the pre-industrial level during 2106–2115 (Mitchell et al., 2017). Data from four global climate models (GCMs) including the CAM4, ECHAM6, MIROC5 and NorESM1 with 1.5 ∘C warming and 2.0 ∘C warming scenarios were published by the National Energy Research Scientific Computing Center (NERSC) at http://portal.nersc.gov/c20c/data.html (last access: 20 October 2017). These datasets were bias corrected using the methods in Hempel et al. (2013) and Frieler et al. (2017) and the dataset EWEMBI (Frieler et al., 2017; Lange, 2016). These climate datasets were generated using ensemble simulations driven with different initial conditions. In the datasets, the CAM4, ECHAM6 and NorESM1 provided 20 runs of simulation results and the MIROC5 provided 10 runs of simulation results. All these runs were input into crop models and treated equally. In this study, the period of 2006–2015 was regarded as the historical period and the period of 2106–2115 was regarded as the future period. The soil texture and hydrological property data that were used during crop model simulation were obtained from the FAO soil dataset as described in Tao and Zhang (2013a).
Table 1Validation of the MCWLA family models for maize, wheat and rice in different provinces of China.
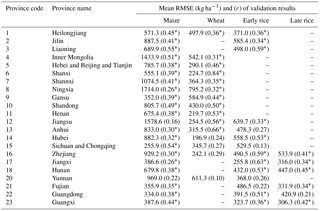
* p<0.1; – no cultivation.
2.3 The MCWLA and its parameterization
The Model to capture the Crop-Weather relationship over a Large Area (MCWLA) model family, including the MCWLA-Maize (Tao et al., 2009a, b), the MCWLA-Wheat (Tao and Zhang, 2013a) and the MCWLA-Rice (Tao and Zhang, 2013b), were used as tools to simulate crop growth in this study. The MCWLAs were designed for crop growth simulation at a daily step and crop yield estimation. Briefly, the MCWLAs take the temperature and photoperiods into account to drive the simulation of daily crop development. Meanwhile, the growth rates driven by heat and the water stress were considered estimating leaf area index (LAI) growth. In addition, the models adopted the process-based representation of the coupled CO2 and H2O exchanges in the Lund–Potsdam–Jena (LPJ) model. The models adopted a simplified method using a yield gap parameter to account for the effects of pests, diseases and non-optimal management such as fertilization. The differences in the calibrated yield gap parameter in different regions represented the heterogeneity of managements.
The MCWLAs have been widely used to simulate the effects of climate change and climate extremes on crop growth and yields in wide areas of the world (Asseng et al., 2013, 2015; Bassu et al., 2014; Li et al., 2015; Tao et al., 2015; Shuai et al., 2016; Wang et al., 2016; Chen et al., 2017a, b; Zhang et al., 2017). The simulation results in previous studies indicated that the MCWLAs could capture the effects of climate change, climate extreme and elevated CO2 on crop growth and yields fairly well, including crop yield variability due to variations in temperature (Tao and Zhang, 2013a, b), heat stress (Asseng et al., 2015) and CO2 concentration (Tao and Zhang, 2013a; Durand et al., 2017; Hasegawa et al., 2017).
In this study, the MCWLAs were used to simulate the yields of maize, wheat and rice in China at a grid scale under different climate scenarios. The model parameters have been well calibrated and validated in China by previous studies for maize (Tao et al., 2009a, b; Shuai et al., 2016), rice (Tao and Zhang, 2013a; Wang et al., 2016) and wheat (Tao and Zhang, 2013a; Chen et al., 2017b). In these studies, MCWLAs were calibrated and validated at a province scale. The Bayesian probability inversion, the Markov chain Monte Carlo (MCMC) technique and a particle swarm optimization algorithm have been applied to analyse uncertainties in parameter estimation and model prediction and to optimize the model. Model calibration and validation were based on the historical provincial yield statistics. The root-mean-square error (RMSE) and the correlation coefficient (r) were used to evaluate the simulation accuracy of models. For each crop in each province, 10 optimal sets of parameters that produced the minimum RMSE and appropriate r were selected. Using multiple sets of parameters, crop models could better represent the diverse cultivars and management practices in a region and thus can have a better estimate of regional yield, which has been addressed in previous papers (Tao et al., 2009a, b). The validation results of MCWLAs for maize, wheat and two growing seasons of rice in our study areas were summarized in Table 1.
2.4 Methods to evaluate the impacts of climate change and climate extreme
For each grid cell across the cultivation areas of each crop, the bias-corrected climate datasets were used as input data to drive the well-validated MCWLAs. According to the protocol of HAPPI, the emission scenario of 1.5 ∘C warming was close to that of RCP 2.6 and the emission scenario of 2.0 ∘C warming was weighted between RCP 2.6 and RCP 4.5 (Mitchell et al., 2017). In this study, the simulation during 2006–2015 used a CO2 concentration of 390.5 ppm. Meanwhile, the CO2 concentration during 2106–2115 was set to 416.1 and 490.5 ppm for warming scenarios of 1.5 and 2.0 ∘C, respectively. The irrigation was considered during model simulation. For maize and wheat, we assumed automatic irrigation in simulation settings; that is, an irrigation of 50 mm would be conducted if the ratio between transpiration and potential transpiration was lower than 0.5. For rice, full irrigation was assumed when necessary during simulation.
The annual average simulation results during 2006–2015 and 2106–2115 were compared at a grid scale. Because we used 70 runs of climate data and 10 sets of parameters, we could obtain an ensemble of 70 climate projections × 10 sets of parameters = 700 sets of comparison results for each grid under a single warming scenario. Then the median of these results was used to demonstrate the changes between the two periods for a certain variable such as crop growth duration and crop yield.
In this study, we evaluated the changes in growth duration, yield and the impacts of climate extreme events on crop yield for each grid with crop cultivation across China in the warming scenarios of 1.5 and 2.0 ∘C. For growth duration and yield in each grid under one set of climate data, the changes were identified as Eq. (1):
where Sc was the change percentage between two periods and Sh and Sf were annual average simulation result for the historical and the future period, respectively. Meanwhile, the standard deviation (SD) of Sc for yield was also calculated at a grid scale to represent yield variability. Moreover, we also computed the probability of a yield decrease by calculating the percentage of simulation results that showed a yield decrease among the 700 simulated results at each grid.
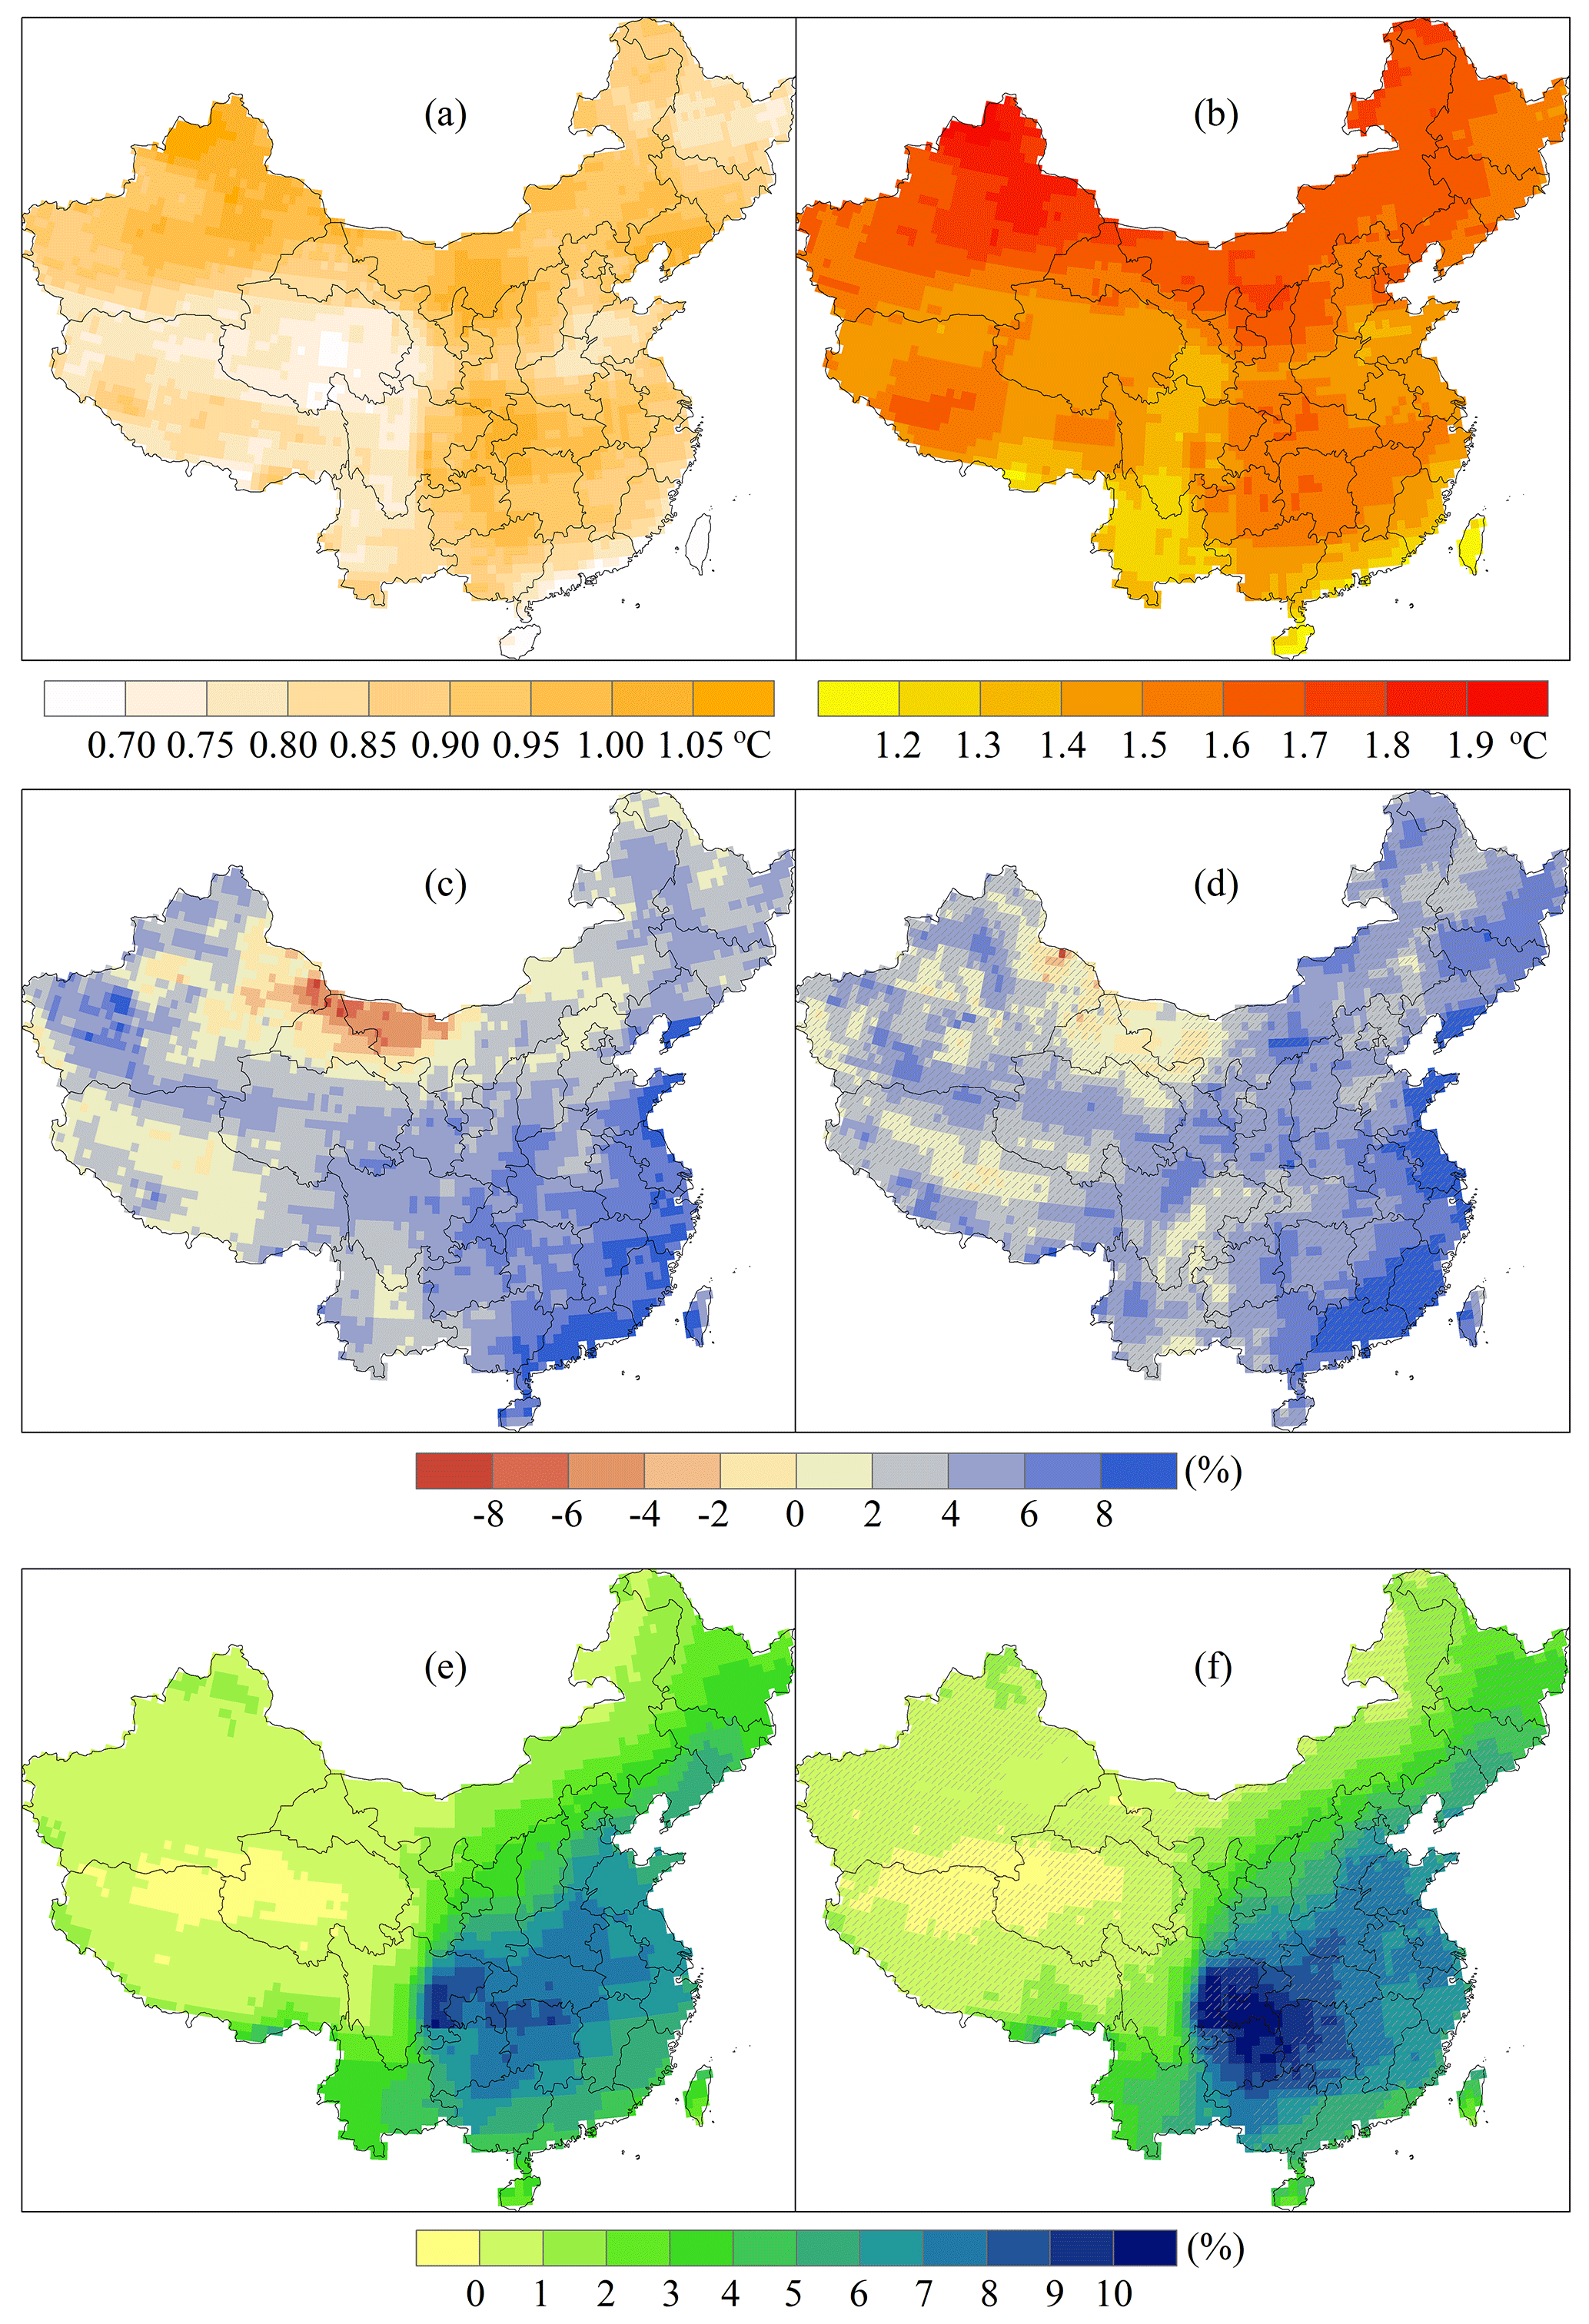
Figure 2Median changes in mean temperature (a, b), precipitation (c, d) and solar radiation (e, f) during 2106–2115 under the 1.5 ∘C warming (a, c, e) and 2.0 ∘C warming (b, d, f) scenarios relative to 2006–2015. Hatching indicates the areas where the differences between the 1.5 and 2.0 ∘C warming scenarios are not significant (P>0.05).
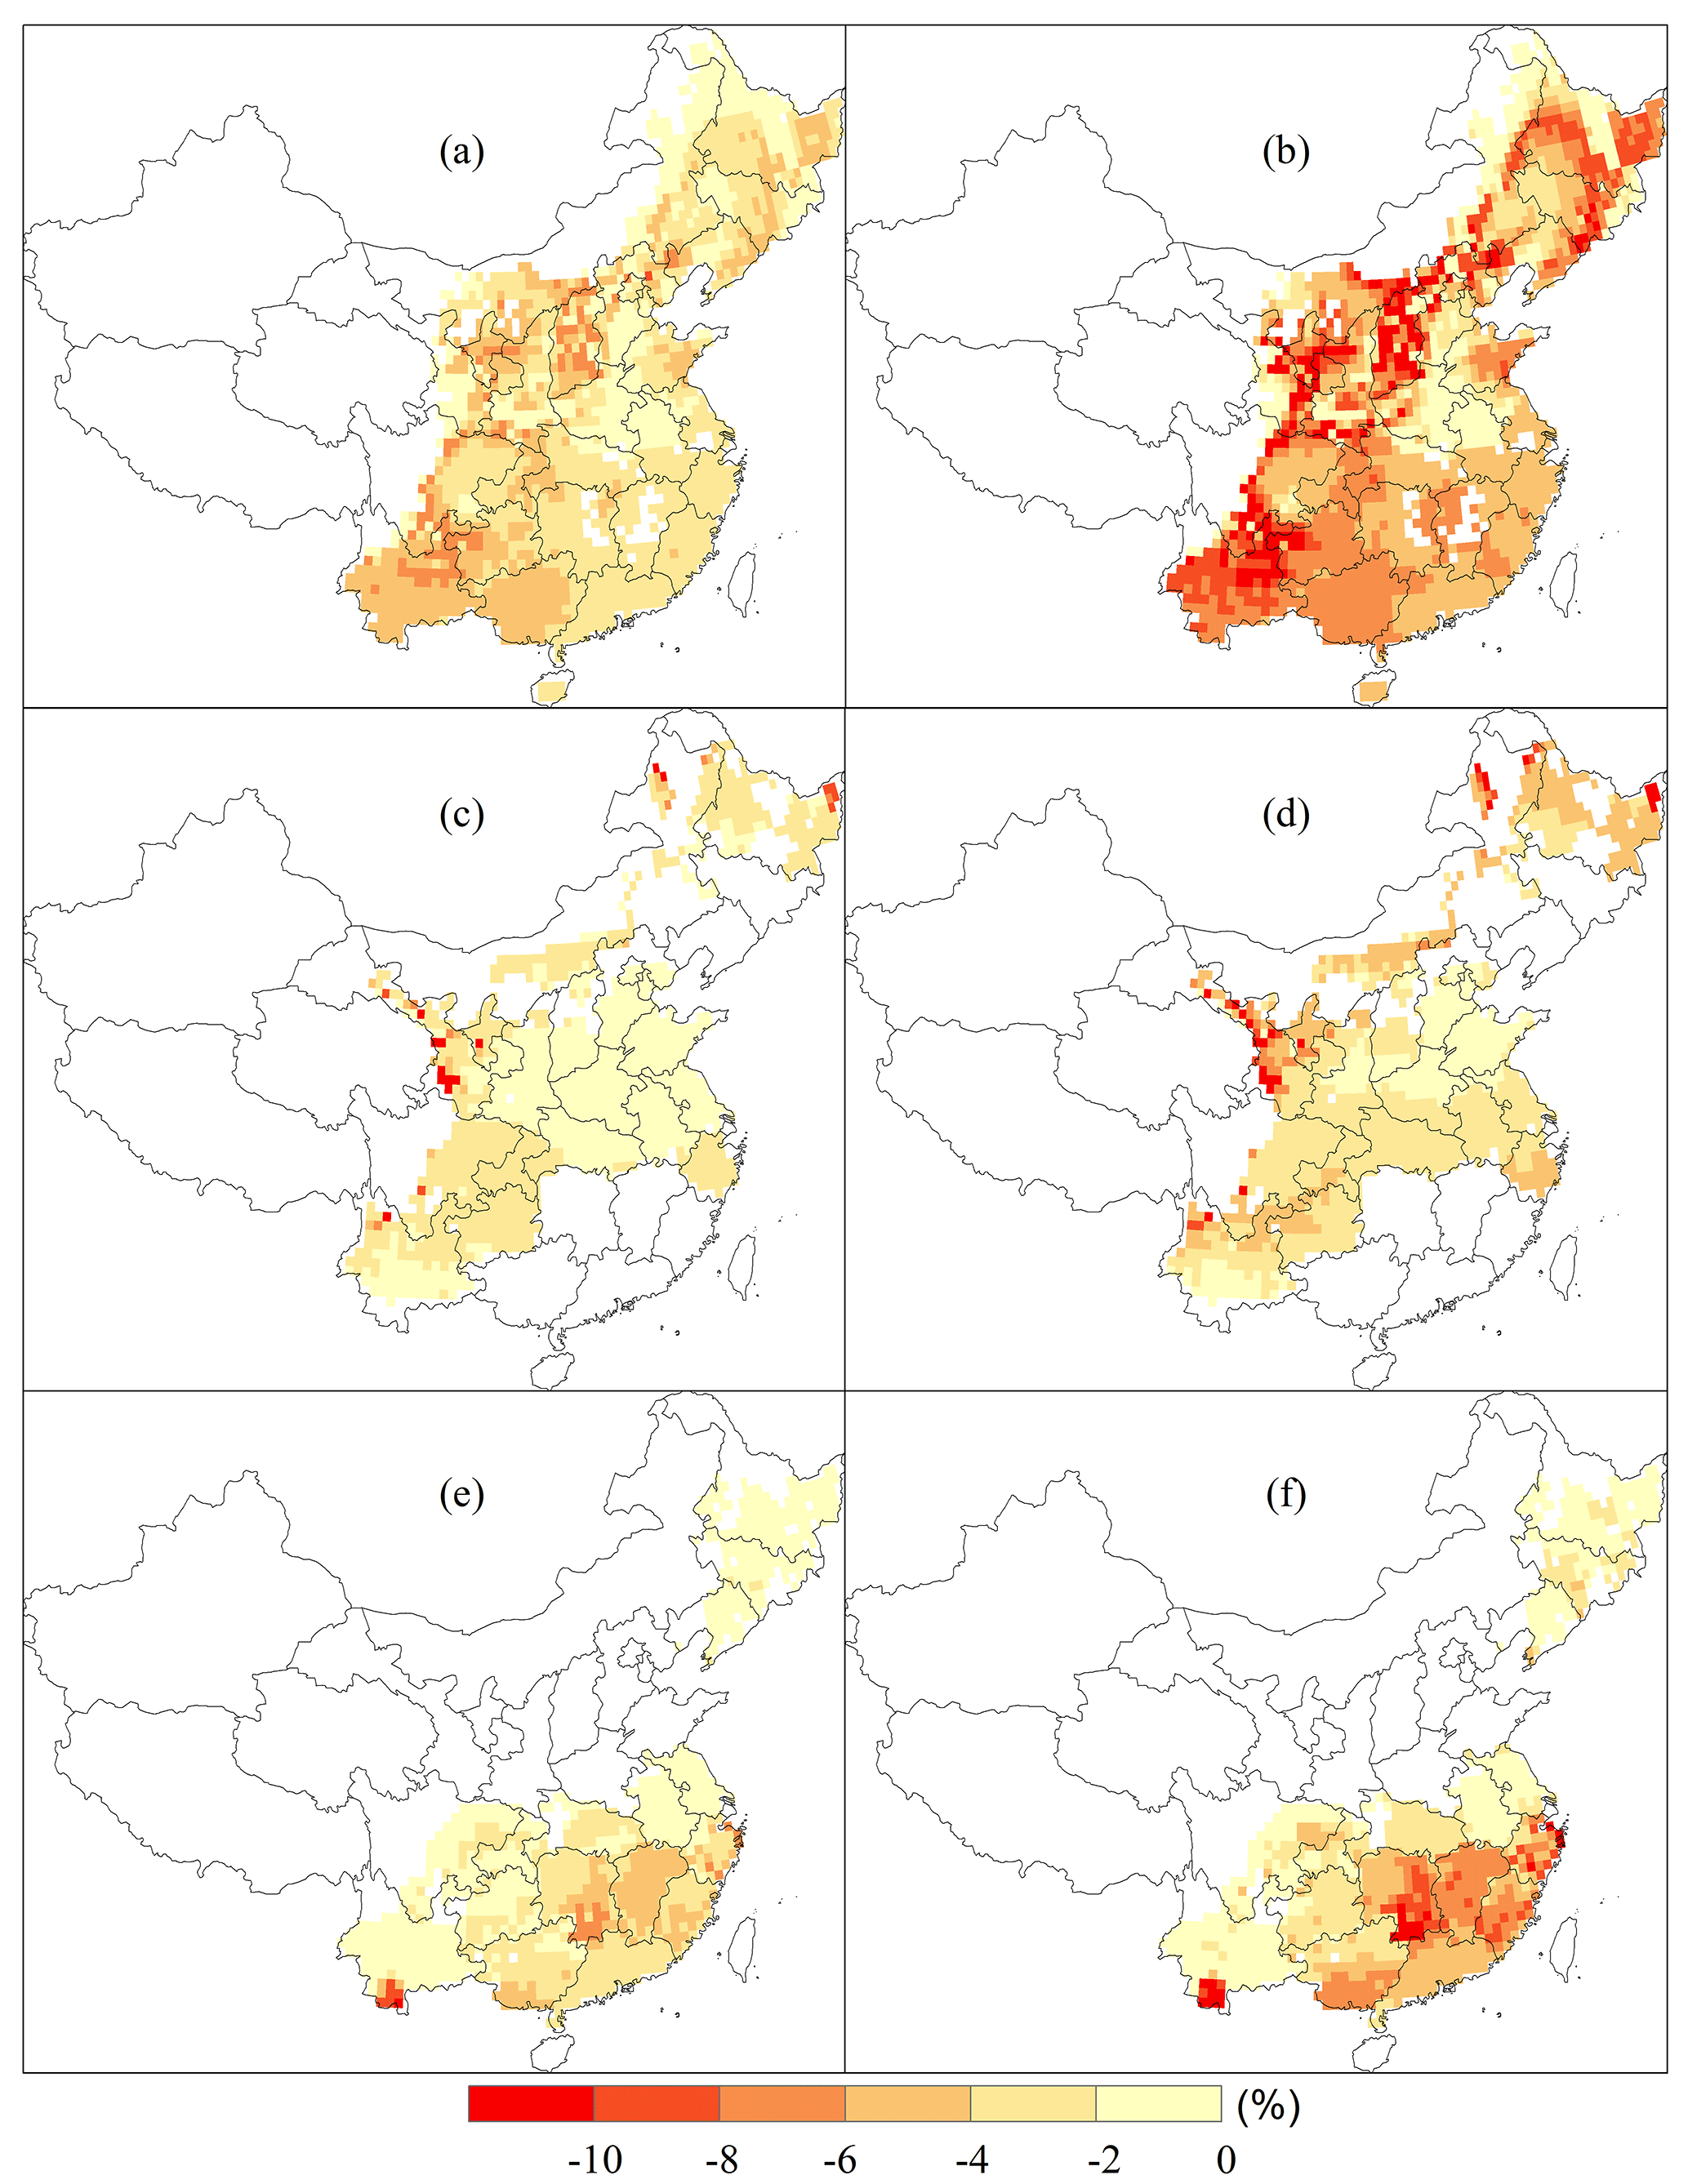
Figure 3Median changes in growth duration for maize (a, b), wheat (c, d) and rice (e, f) during 2106–2115 under the 1.5 ∘C warming (a, c, e) and 2.0 ∘C warming (b, d, f) scenarios relative to 2006–2015.
Furthermore, to evaluate the impact of climate extreme events, we selected heat stress on rice and wheat and drought stress on wheat and maize as typical extreme events. The impacts of heat stress and drought stress were considered in MCWLAs by inhibited function, limiting the leaf growth, root growth, photosynthesis, biomass accumulation and the calculation of the harvest index. The impacts of climate extreme events on crop yield were quantified as the differences between the simulated yields with and without considering the limitation of extreme event stresses:
where YL was the yield loss percentage caused by extreme events. Y0 was the simulated yield using the original MCWLA which considered the impacts of the extreme event. Y1 was the simulated yield with the assumption that those extreme events would not limit crop growth. We calculated the YL for both the historical period and the future period. The differences in YL between the historical and future periods were used to evaluate the changes in the impacts of extreme events on crop yield.
Beside the analysis at a grid scale, we also aggregated the simulated yields to a country scale using the cultivation area-weighted mean based on the crop cultivation ratios for each grid to present the impact of climate change on the national food supply.
3.1 Changes in critical climate factors in the warming scenarios of 1.5 and 2.0 ∘C
The spatial patterns of projected annual changes in average temperature, precipitation and solar radiation during 2106–2115, relative to 2006–2015, are shown in Fig. 2. These changes are the median changes based on the 70 sets of climate projections. The spatial patterns of climate change in the warming scenarios of 1.5 and 2.0 ∘C were similar. An increase in temperature was projected of approximately 0.7–1.05 and 1.2–1.9 ∘C, respectively, in the warming scenarios of 1.5 and 2.0 ∘C (Fig. 2a, b). The SD of temperature changes could generally range from 0.3 to 0.5 ∘C in most areas in China (Supplement Fig. S1a, b). Significant differences in temperature changes could be present in all of China between the two warming scenarios (Fig. 2b). Temperature would increase less in northeast China, the NCP, southwest China and the Qinghai–Tibet Plateau. As for precipitation, the median change showed that precipitation would increase by up to 8 % during 2106–2115 in most parts of China (Fig. 2c, d). However, precipitation variability was large, with a SD up to 15 % in most cultivation areas (Fig. S1c, d). In general, the increase in precipitation in the warming scenario of 2.0 ∘C would be larger than that in the warming scenario of 1.5 ∘C except in some areas in southwest China although the differences between the two warming scenarios were not significant in general. For most of the cultivation areas of major crops in China, the increase in precipitation would range from 2 to 6 %. The increase in precipitation would be greater in southeast China, by more than 6 %. Solar radiation would increase in nearly the whole country (Fig. 2e, f). Under the 1.5 ∘C warming scenario, it was expected to increase by more than 7 % in the southern parts of China, particularly Sichuan, Chongqing, Guizhou and Hunan provinces. Moreover, solar radiation in these areas would increase more significantly under the 2.0 ∘C warming scenario. In other regions, solar radiation would increase by less than 6 %, which was similar under the two warming scenarios. In regions with a large increase in solar radiation, the SD could be large too. In the study area, the SD of solar radiation changes was projected to be 2–7 % (Fig. S1e, f).
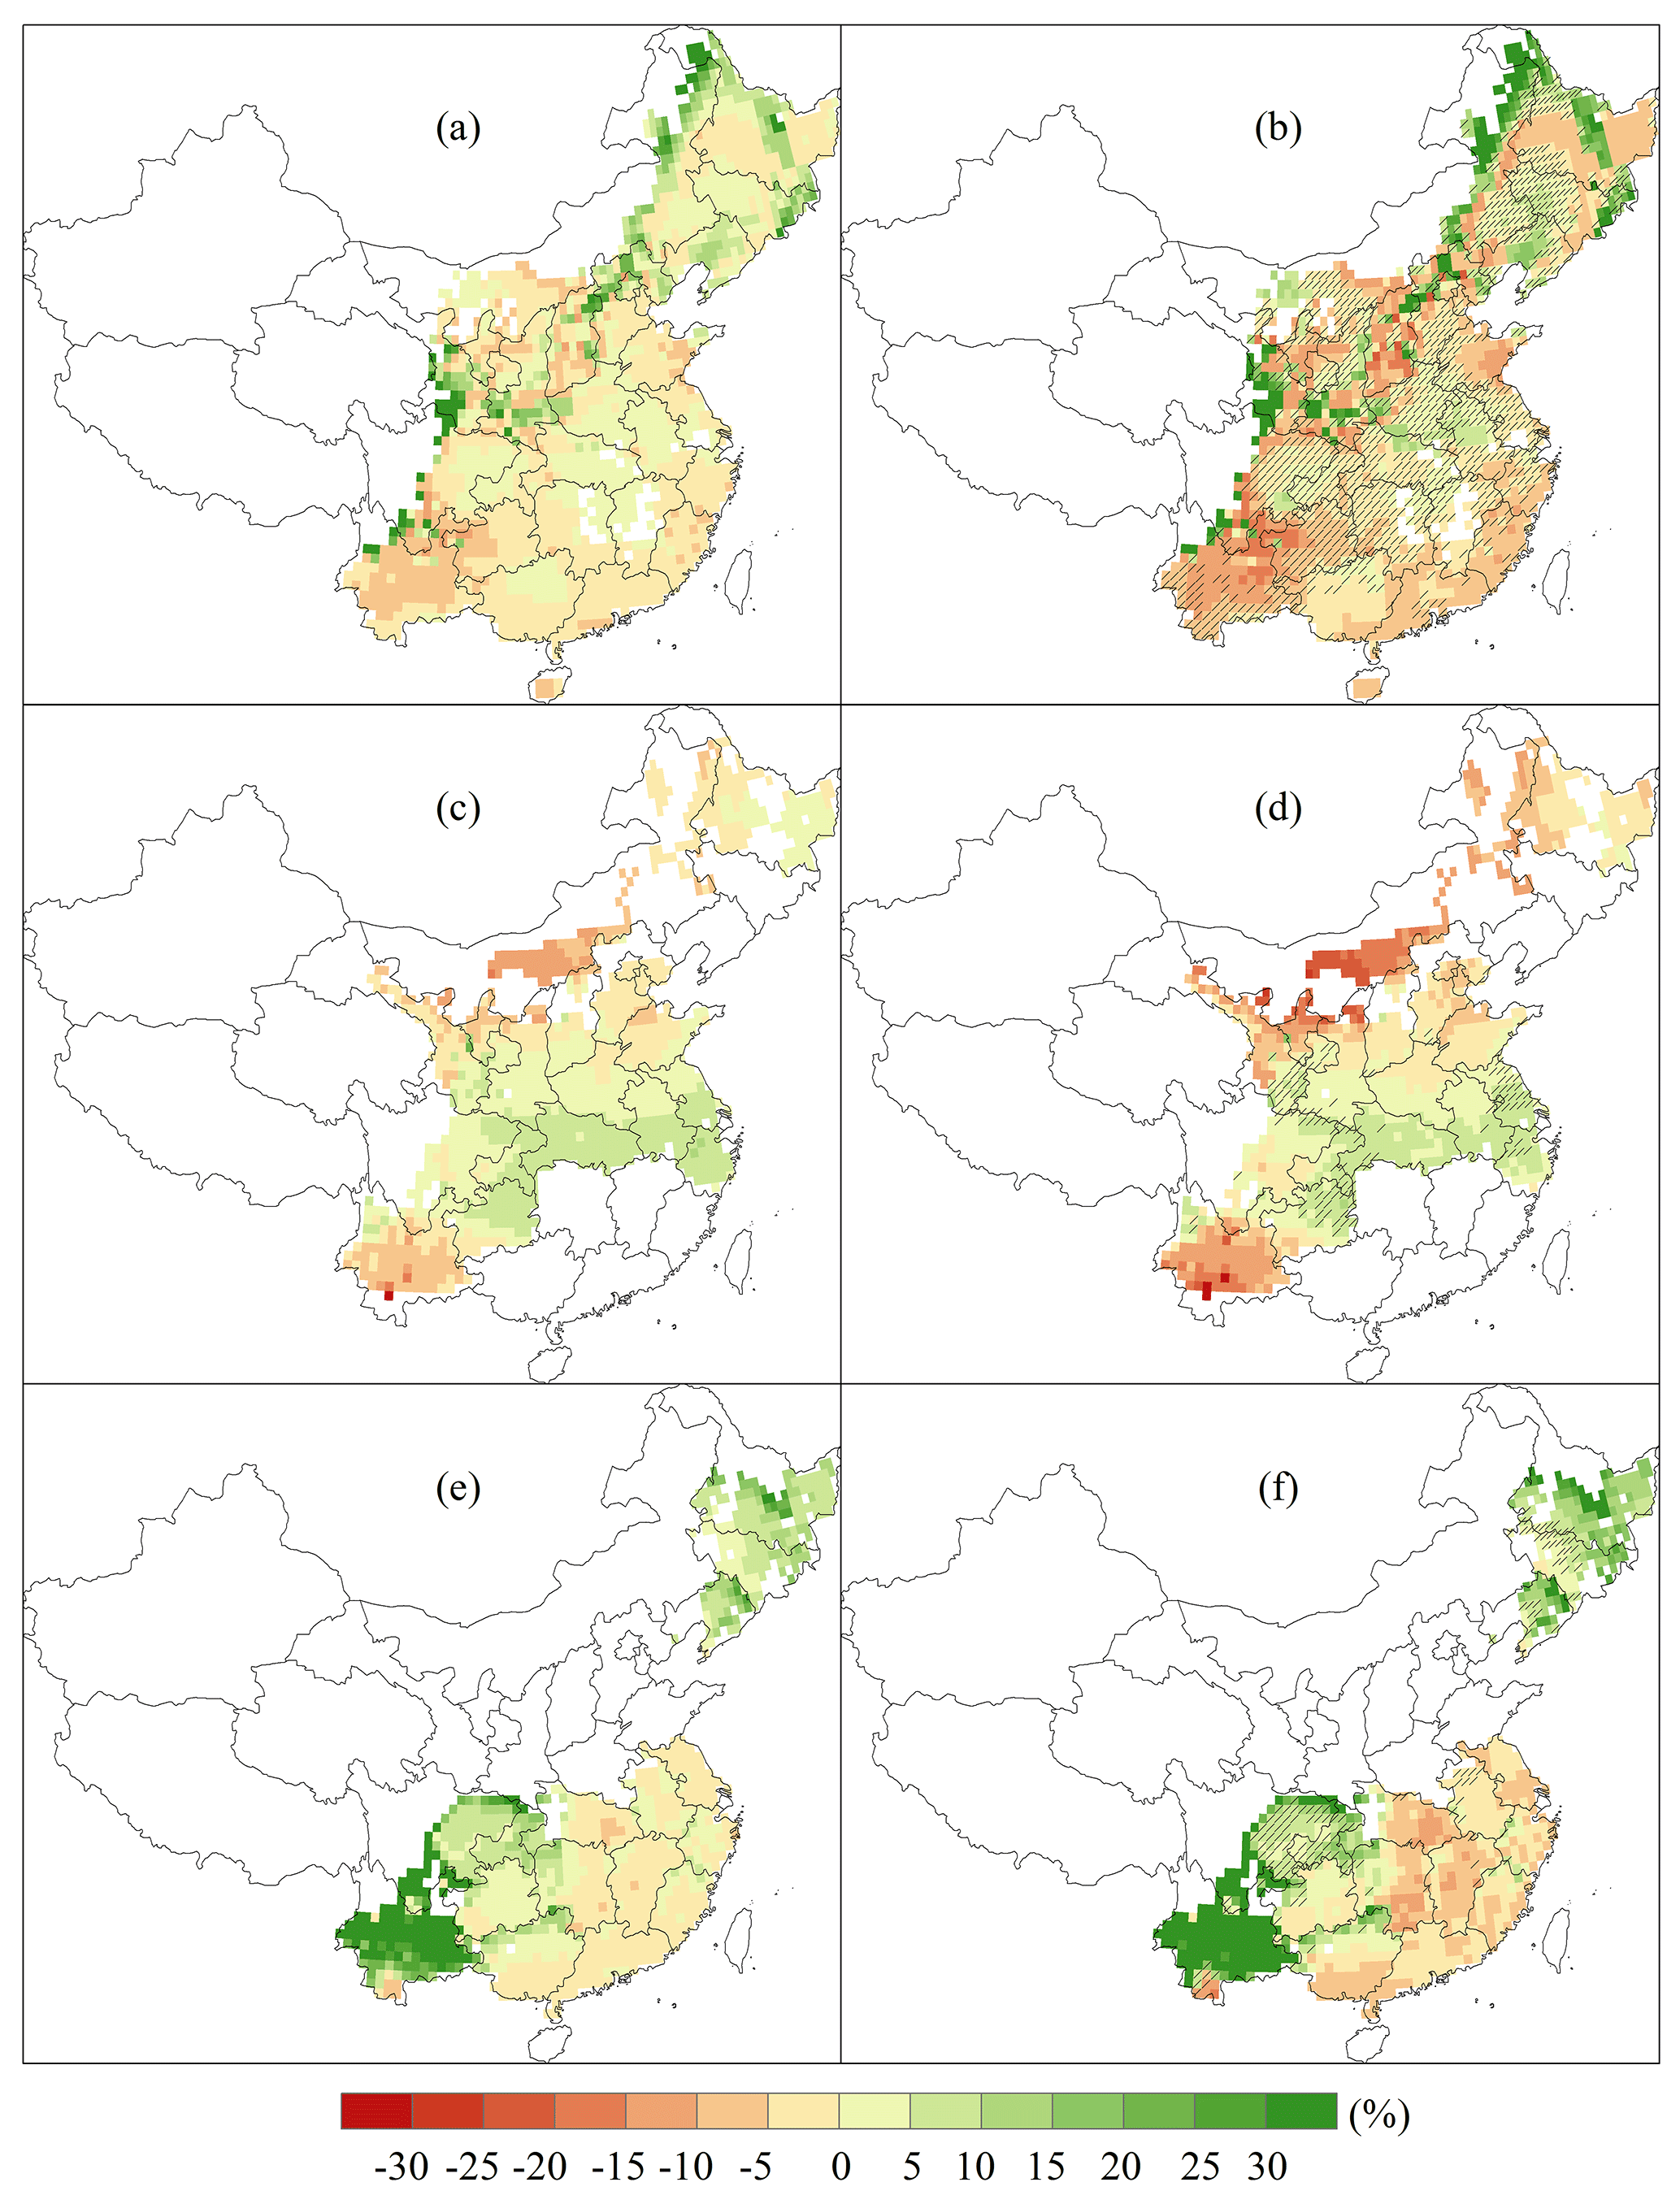
Figure 4Median changes in projected yield for maize (a, b), wheat (c, d) and rice (e, f) during 2106–2115 under the 1.5 ∘C warming (a, c, e) and 2.0 ∘C warming (b, d, f) scenarios relative to 2006–2015, without taking the CO2 fertilization effect into account. Hatching indicates the areas where the differences between the 1.5 and 2.0 ∘C warming scenarios are not significant (P>0.05).
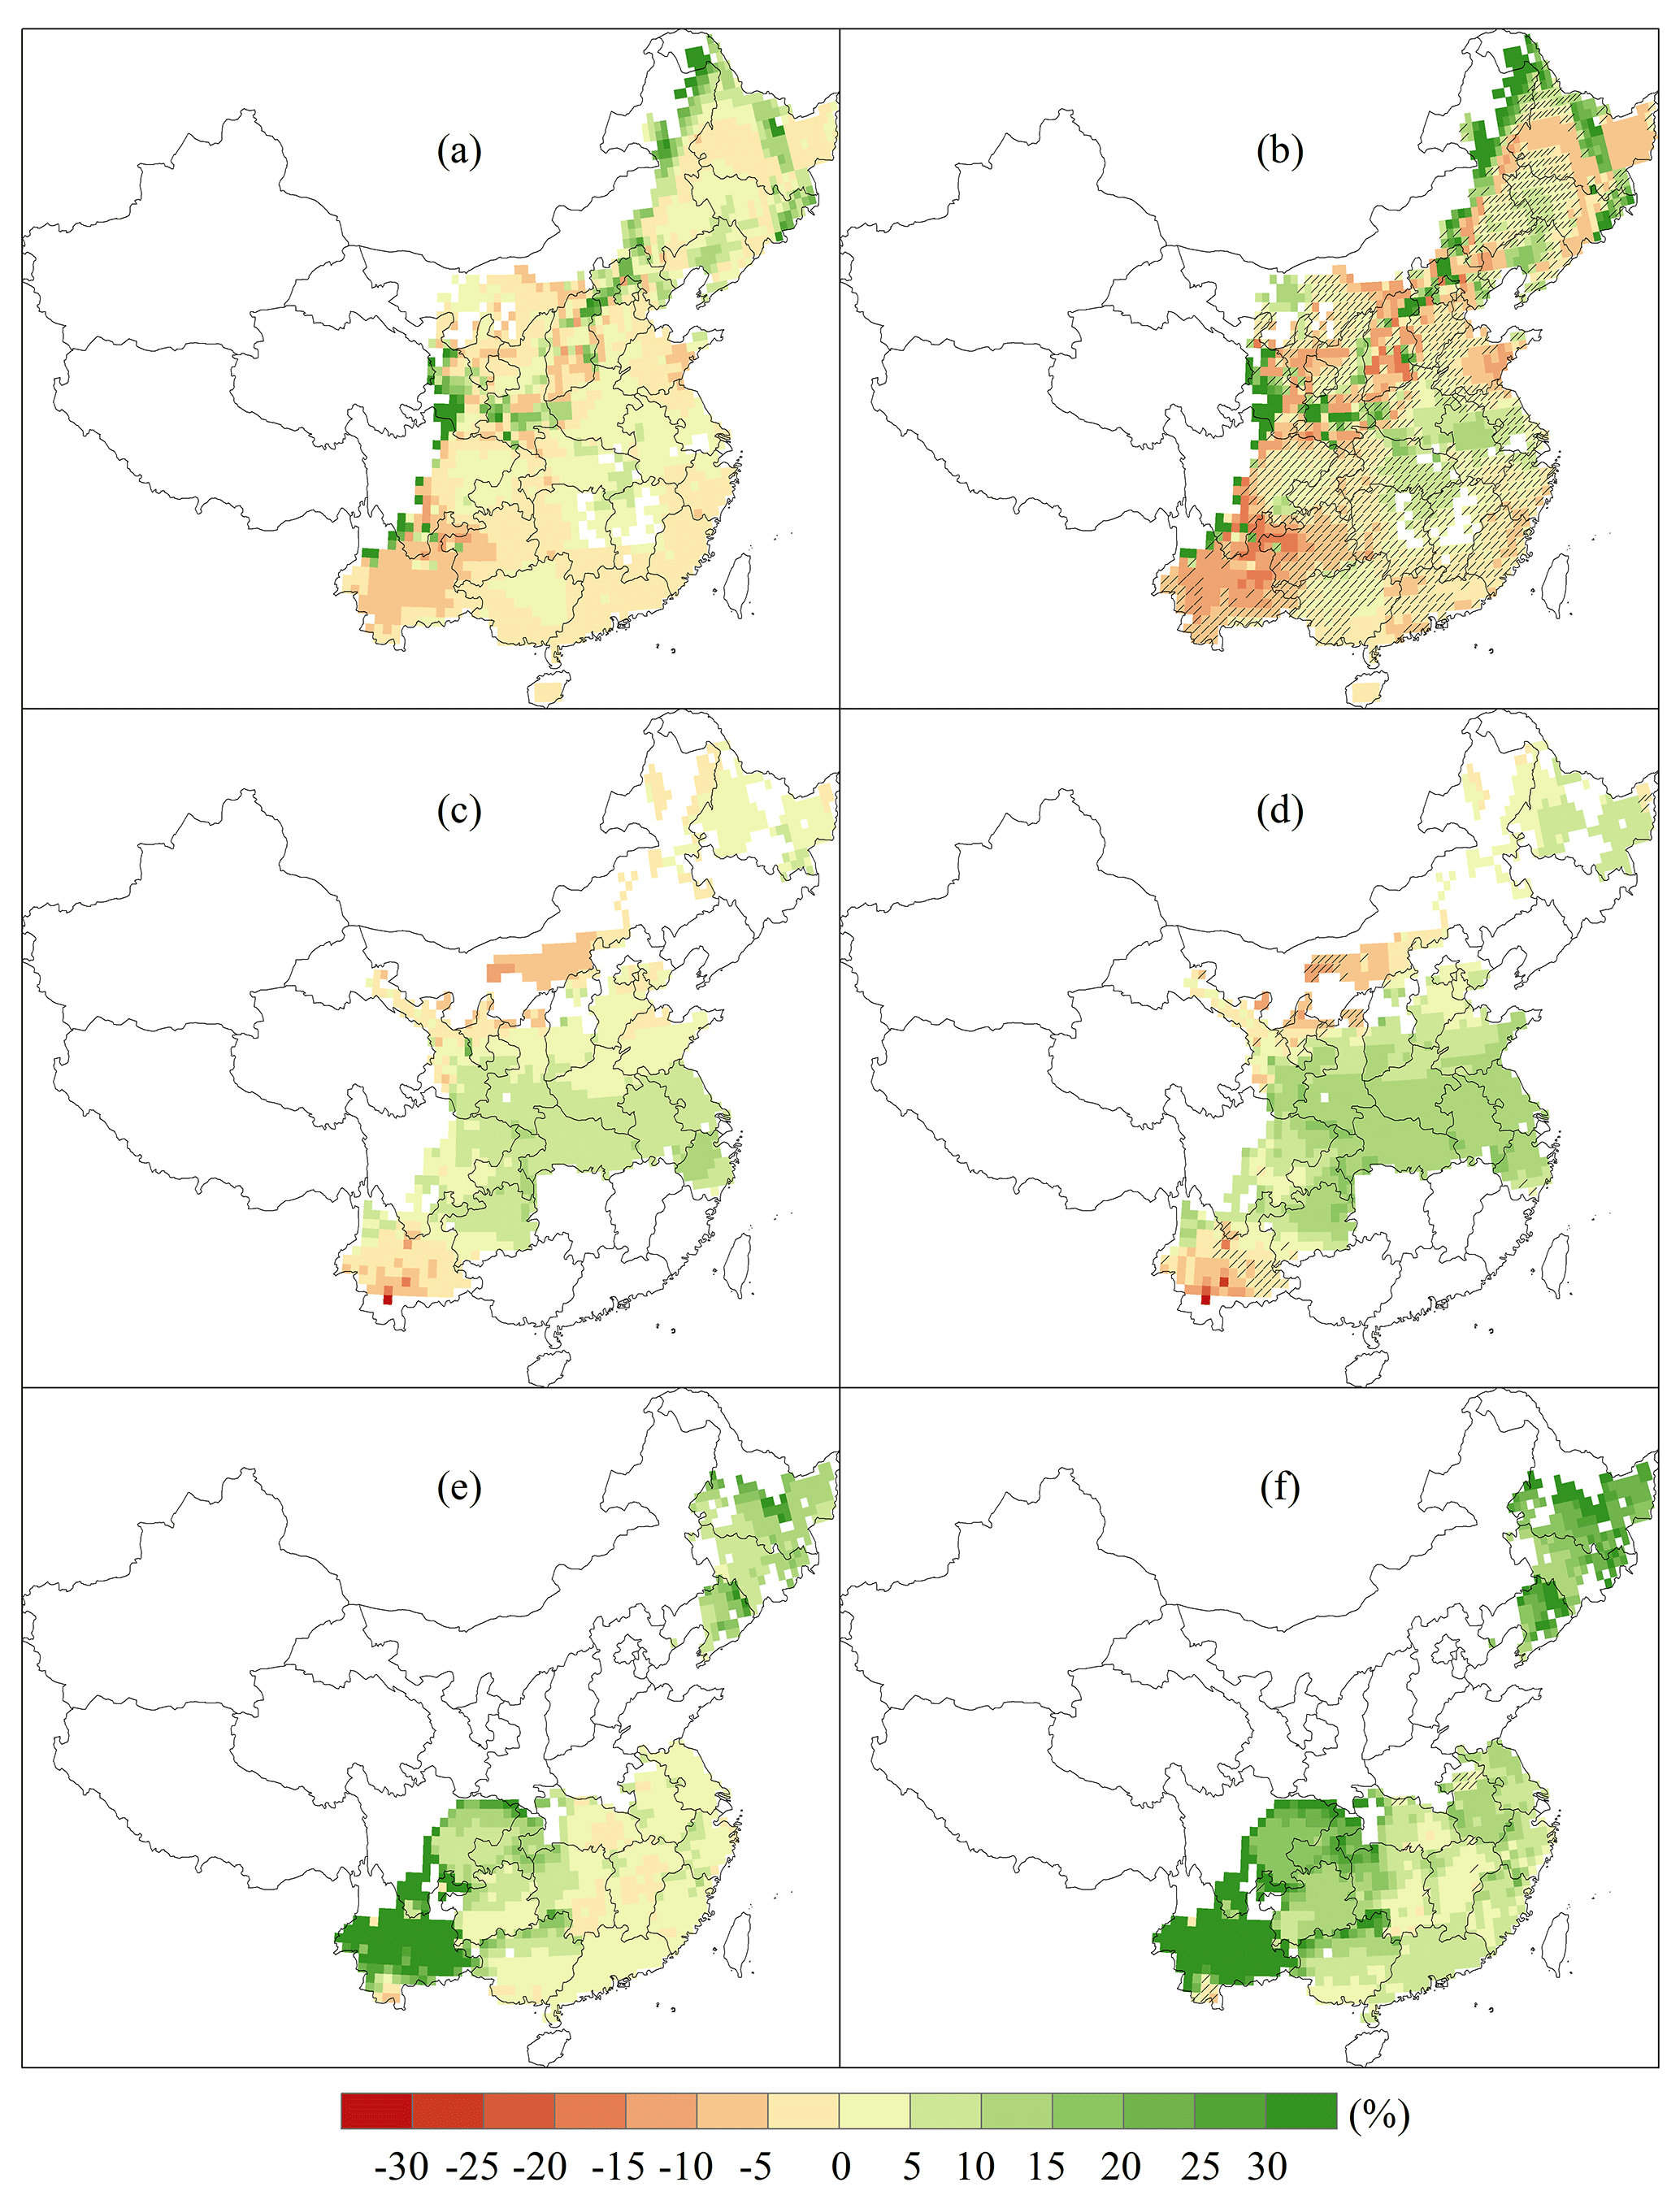
Figure 5Median changes in projected yield for maize (a, b), wheat (c, d) and rice (e, f) during 2106–2115 under the 1.5 ∘C warming (a, c, e) and 2.0 ∘C warming (b, d, f) scenarios relative to 2006–2015, taking the CO2 fertilization effect into account. Hatching indicates the areas where the differences between the 1.5 and 2.0 ∘C warming scenarios are not significant (P>0.05).
3.2 Impacts of climate change on major crops growth durations
An increase in temperature would accelerate crop development rate and consequently reduce crop growth duration. Results showed that an increase in temperature would ubiquitously shorten the growth duration of the three major crops (Fig. 3). The most prominent decrease in maize growth duration could be expected in northeast China, southwest China and the Loess Plateau by up to 6 and 10 % in the warming scenarios of 1.5 and 2.0 ∘C, respectively (Fig. 3a, b). The decrease in maize growth duration would be relatively smaller (4–8 %) in south China. In addition, the impacts of climate change on maize growth duration would be the smallest in the NCP where it was expected to be reduced by less than 2 % in most areas. The decrease in growth durations of wheat would be smaller than that of maize (Fig. 3c, d). In most regions, wheat growth duration would decrease slightly, by less than 4 %, particularly in the NCP (less than 2 %). Wheat growth duration could decrease more in northeast, southwest and northwest China. Under the 2.0 ∘C warming scenario, the decrease in growth duration would be approximately 2 % more than that under the 1.5 ∘C warming scenario in most cultivation areas, except the NCP. Rice phenology would change more obviously in the double rice cropping region (Fig. 3e, f). Rice growth duration was projected to decrease by 4–8 and 6–10 % in the warming scenarios of 1.5 and 2.0 ∘C, respectively. By contrast, it was projected to reduce by less than 2 % in other regions, with slight differences between the two warming scenarios.
3.3 Impacts of climate change on major crops yields
The projected impacts of climate changes on the three major crops yields in China were investigated without (Fig. 4) and with taking the CO2 fertilization effect into account (Fig. 5). Without taking the CO2 fertilization effect into account, the maize yield in most of the cultivation areas would decrease by less than 10 % under the 1.5 ∘C warming scenario (Fig. 4a). Under the 2.0 ∘C warming scenario, the yield decrease would be less than 15 % in most areas. The yield decrease would be larger than 15 % at 5.6 % of the grids with maize cultivation (Fig. 4b). The maize yield was expected to increase mainly in northeast China and some parts of northwest China. The proportion of grids with a yield increase would be 45.5 % under the 1.5 ∘C warming scenarios and 35.1 % under the 2.0 ∘C warming scenarios. In 50.5 % of grids with maize cultivation, yield changes between the 1.5 and 2.0 ∘C warming scenarios were not significant (Fig. 4b). As for wheat, the areas with a yield increase would be in the southern parts of the cultivation areas (Fig. 4c, d), where yield was expected to increase by less than 10 % under both warming scenarios. The regions with a yield decrease were located in the northern parts of China and in Yunnan Province in southwest China, where yield was expected to decrease by up to 15 and 25 % in the warming scenarios of 1.5 and 2.0 ∘C, respectively. Under the 2.0 ∘C warming scenario, the areas with a yield increase would shrink slightly. Moreover, the yield decrease would be aggravated clearly by approximately 5 % in most areas with a yield decrease under the 1.5 ∘C warming scenario. The differences in yield changes between the 1.5 and 2.0 ∘C warming scenarios were generally significant except in some grids (∼ 14.5 %) in Gansu, Guizhou and Jiangsu provinces (Fig. 4d). For rice, there was a spatially explicit pattern of yield changes (Fig. 4e, f). The rice yield would increase by 5–15 % or even more than 30 % in northeast and southwest China. The yield increase in these areas would be greater in a warming scenario of 2.0 ∘C than that at 1.5 ∘C. However, in the central parts of rice cultivation areas and the double rice cultivation region, the rice yield was projected to decrease widely by less than 10 and 15 % in the warming scenarios of 1.5 and 2.0 ∘C, respectively. The differences in yield changes between the two warming scenarios would be less significant in the Sichuan Basin and some areas of northeast China than in other rice cultivation areas.
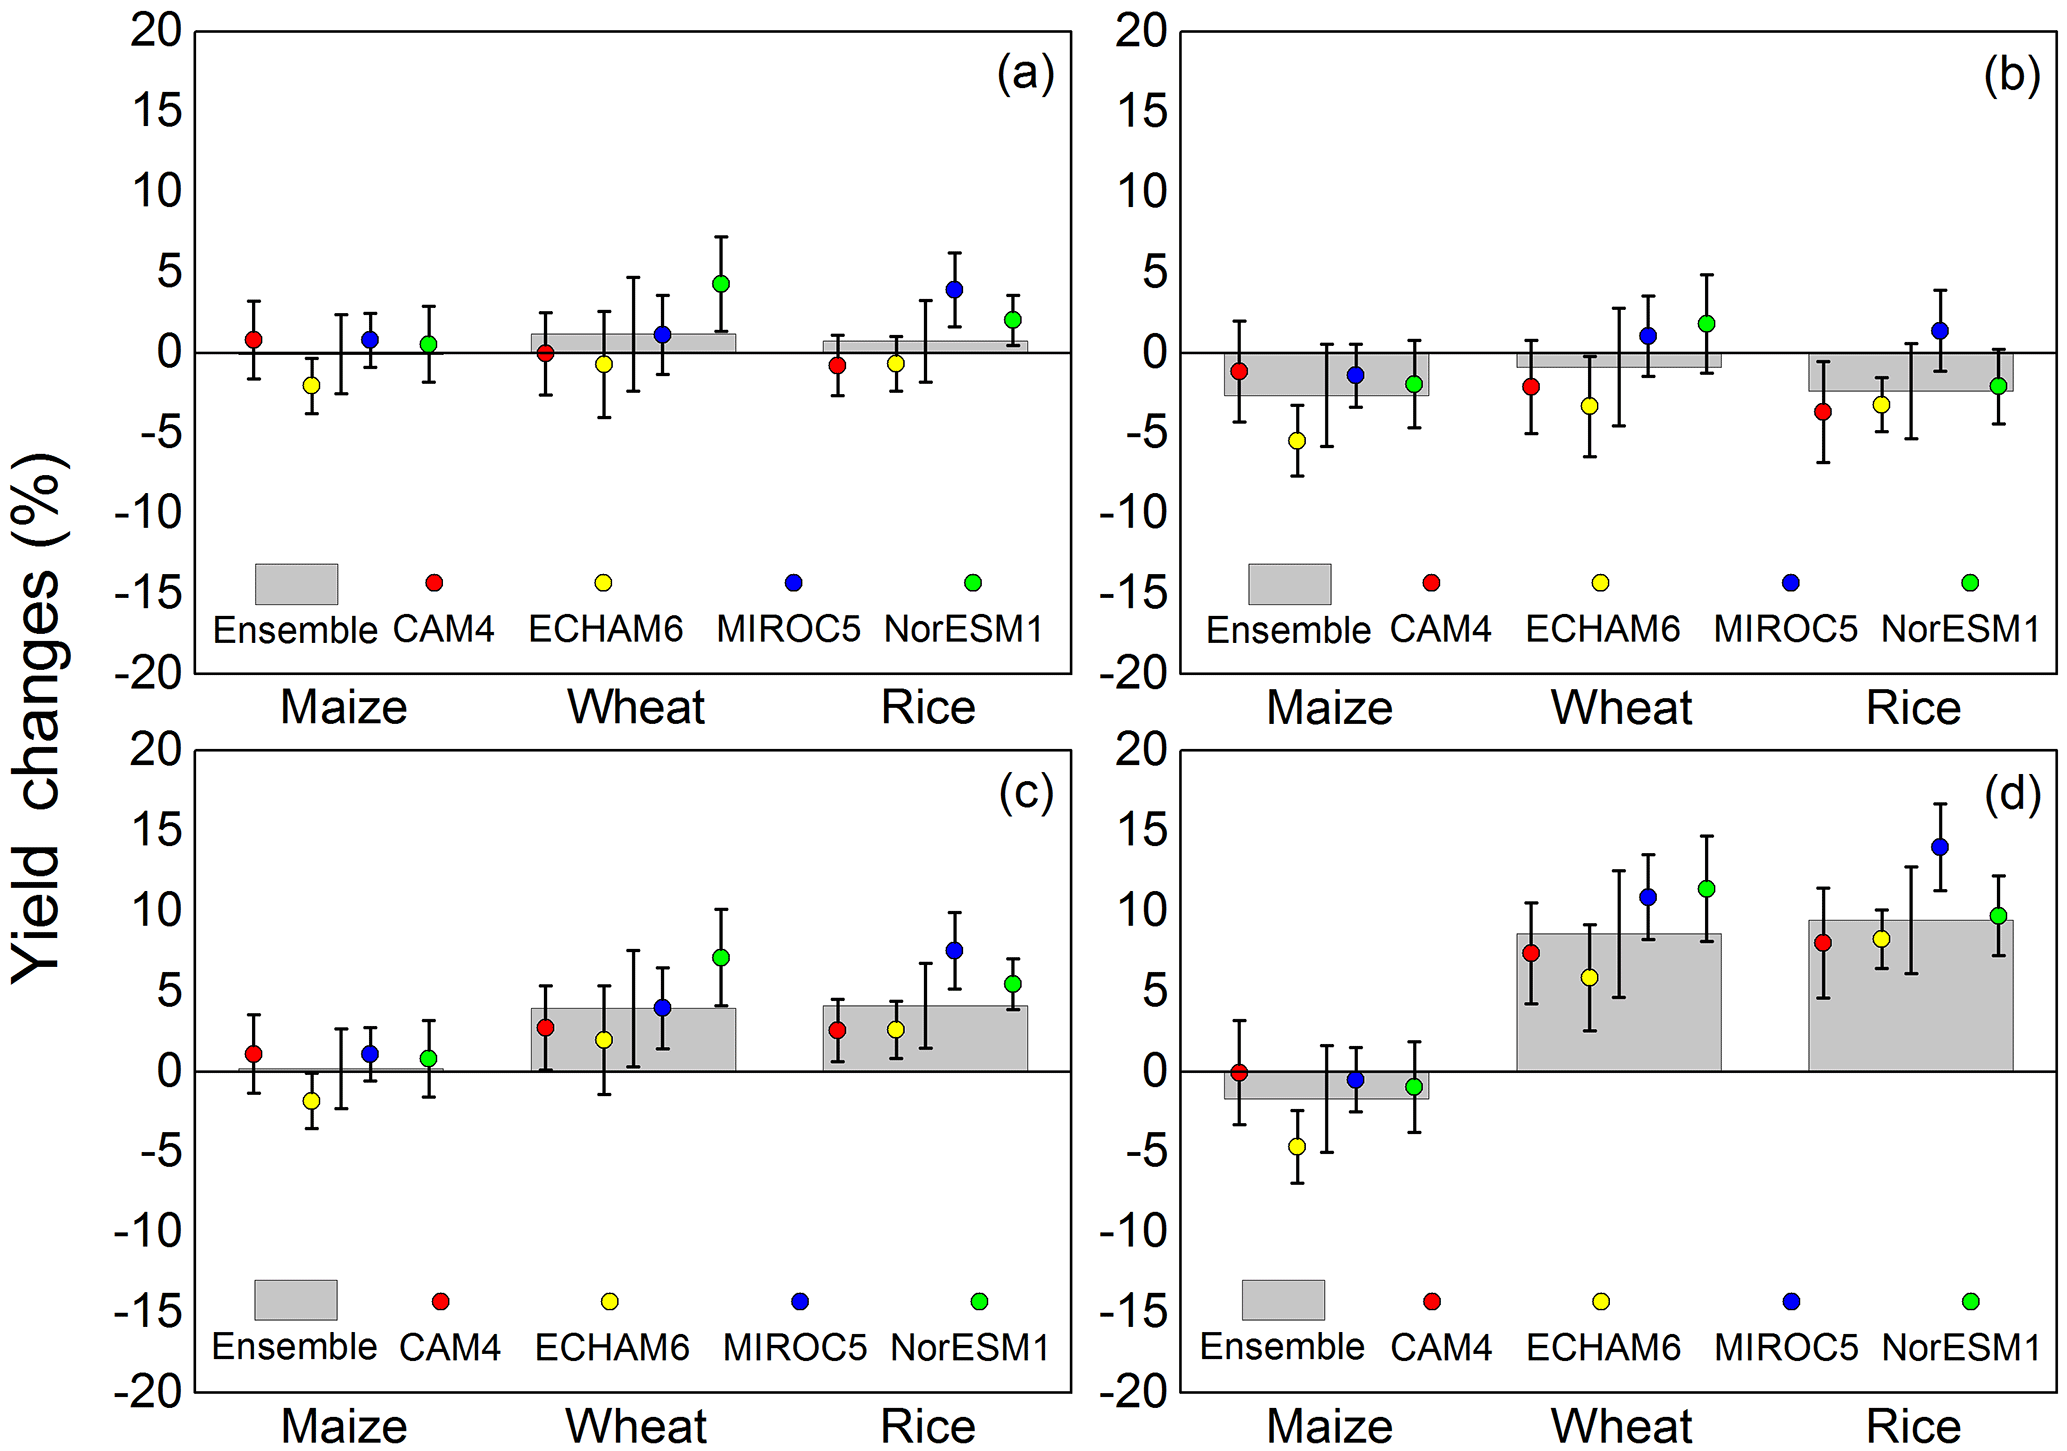
Figure 6Projected yield change using climate projection from different GCMs at a country scale during 2106–2115 in the warming scenarios of 1.5 ∘C (a, c) and 2.0 ∘C (b, d) relative to 2006–2015, without (a, b) and with (c, d) the CO2 fertilization effect.
When considering the CO2 fertilization effect, the effects of CO2 fertilization could enhance crop photosynthesis and increase crop productivity to some extent for all the three major crops (Fig. 5). For maize, the differences between the simulated yields with and without considering the CO2 fertilization effect were small (Figs. 4a, b, 5a, b). The contribution of the CO2 fertilization effect to maize yields was generally less than 6 %, and it would be a little more obvious in the warming scenario of 2.0 ∘C than that at 1.5 ∘C. In regions such as the NCP and middle and lower reaches of Yangtze River (MLYR), the maize yield would increase in more areas than those without the CO2 fertilization effect. Nevertheless, yield would still decrease in more than half of grids with maize cultivation. In comparison with maize, the yields of wheat and rice benefited more from the elevated CO2 concentrations. The contribution of the CO2 fertilization effect to wheat yield could reach 4 and 15 % in the warming scenarios of 1.5 and 2.0 ∘C, respectively (Fig. 5c, d). With the CO2 fertilization effect, the decrease in wheat yield in northeast China and the NCP could be compensated for entirely. As a result, yield could be expected to increase by approximately 5–15 % in most of the wheat cultivation areas (Fig. 5c, d). The increase in wheat yield under the 2.0 ∘C warming scenario would be 5 % larger than those under the 1.5 ∘C warming scenario. In addition, the wheat yield decrease in Inner Mongolia and Yunnan Province would be less than 10 %, suggesting that the risks of yield decrease caused by climate change could be reduced by the rising of CO2 concentration in these areas. As for rice, the contribution of the CO2 fertilization effect could be 2–5 and 8–16 % in the warming scenarios of 1.5 and 2.0 ∘C, respectively (Fig. 5e, f). The yield decrease in central China and double rice cropping regions could be compensated for, and a widespread yield increase would be expected across the entire rice cultivation areas. The yield increase under the 2.0 ∘C warming scenario would be 5–10 % larger than that under the 1.5 ∘C warming scenario. The elevated CO2 concentrations would lead to a more significant difference between yield changes under the 1.5 and 2.0 ∘C warming scenarios for wheat and rice. In general, there were significant differences between simulation results under the 1.5 and 2.0 ∘C warming scenarios in nearly the entire cultivation region (Fig. 5d, f). However, the maize yield was less sensitive to the rising of CO2 concentration. The significance of differences between yield changes under the 1.5 and 2.0 ∘C warming scenarios was similar to those without considering the CO2 fertilization effect (Figs. 4b, 5b).
To evaluate the possible effects of climate change on country-level crop productivities, the simulation results at a grid scale were aggregated to a country scale. The yield changes for the three major crops at a country scale under different climate scenarios are shown in Fig. 6. Without the CO2 fertilization effect, maize yields at country level would decrease by 0.1 and 2.6 % in the warming scenarios of 1.5 and 2.0 ∘C, respectively (Fig. 6a, b). By contrast, wheat and rice would slightly benefit from climate change in the warming scenario of 1.5 ∘C but suffer from negative impacts in the warming scenario of 2.0 ∘C (Fig. 6a, b). The wheat yield would increase by 1.2 % but decrease by 0.9 % in the warming scenarios of 1.5 and 2.0 ∘C, respectively. The rice yield would increase by 0.7 % under the 1.5 ∘C warming scenario but decrease by 2.4 % under the 2.0 ∘C warming scenario. When considering the CO2 fertilization effect, crops would obtain a larger yield increase or a lesser yield decrease (Fig. 6c, d). The maize yield would increase by 0.2 % under the 1.5 ∘C warming scenario, and the yield decrease would be reduced by 1.7 % under the 2.0 ∘C warming scenario. Wheat and rice yields would increase by 3.9 and 4.1 %, respectively, under the warming scenario of 1.5 ∘C (Fig. 6c), and by 8.6 and 9.4 %, respectively, under the warming scenario of 2.0 ∘C (Fig. 6d).
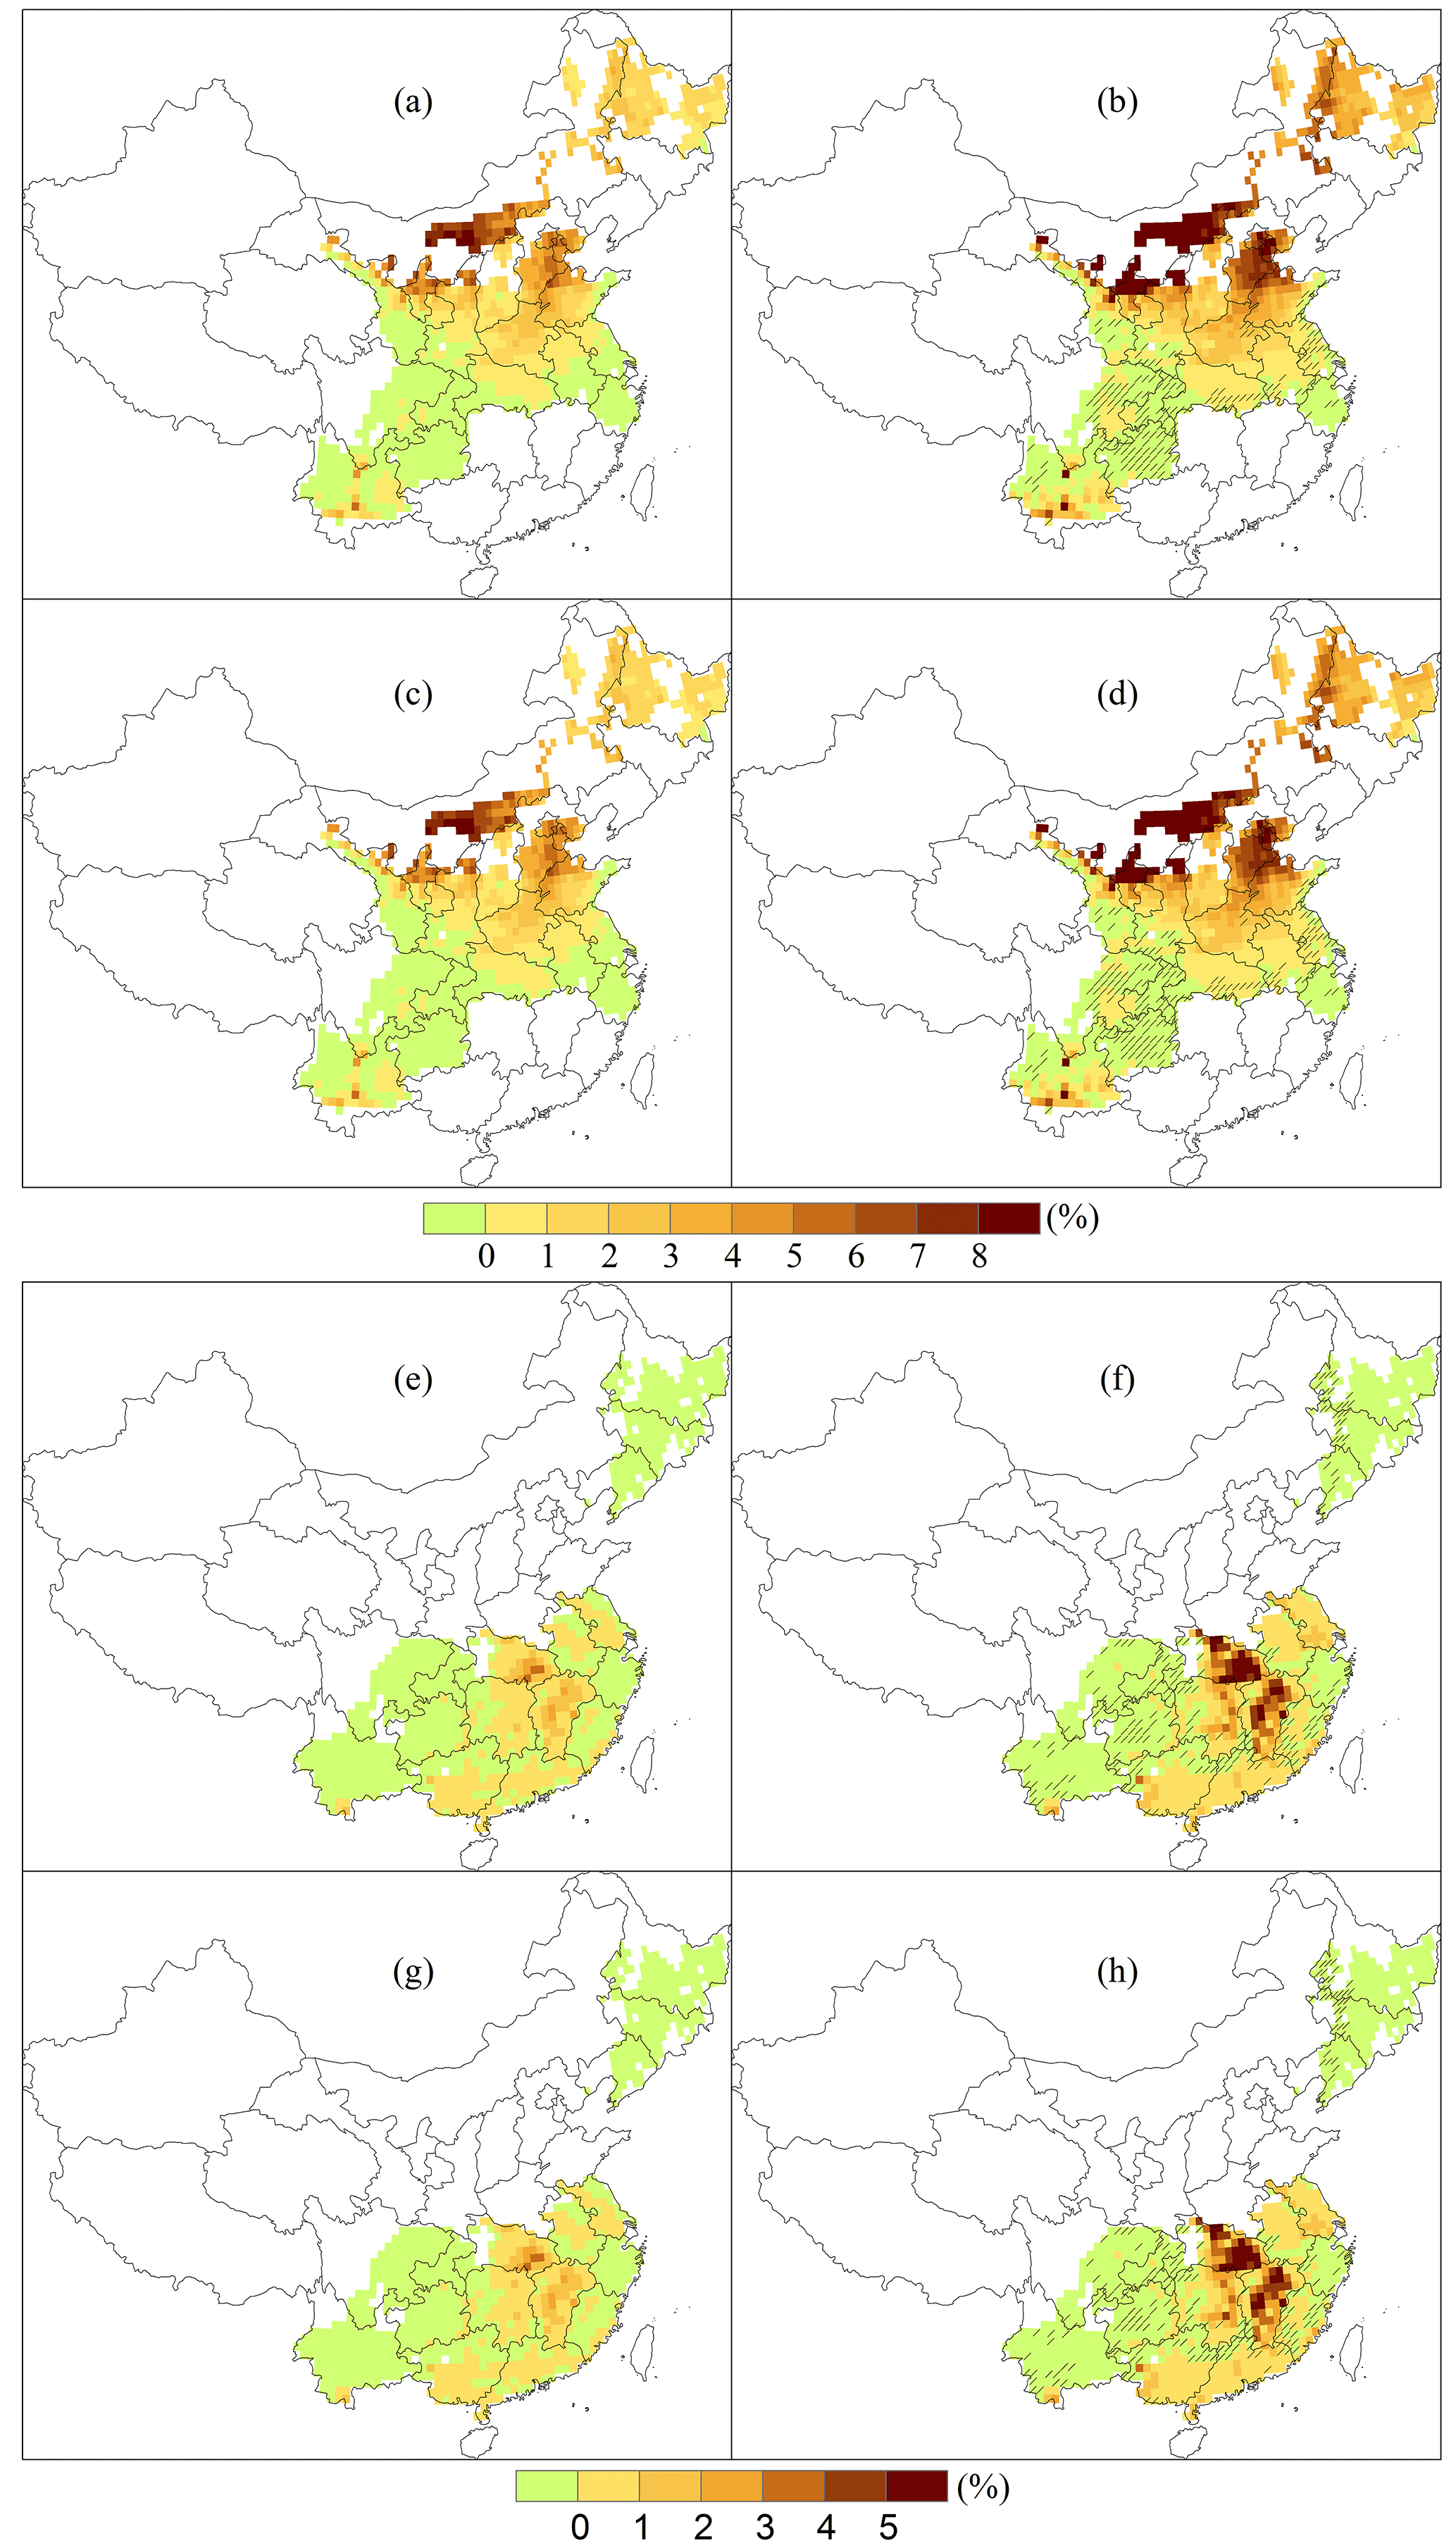
Figure 7Median changes in yield loss caused by heat stress for wheat (a–d) and rice (e–h) during 2106–2115 under the 1.5 ∘C warming (a, c, e, g) and 2.0 ∘C warming (b, d, f, h) scenarios relative to 2006–2015, without (a, b, e, f) and with (c, d, g, h) the CO2 fertilization effect. Hatching indicates the areas where differences between the 1.5 and 2.0 ∘C warming scenarios are not significant (P>0.05).
3.4 Impacts of climate extremes on major crops yields
The influences of climate extreme events, including heat stress and drought stress, on yield have been explicitly accounted for in this study. The impacts of heat stress on wheat and rice (Fig. 7) and the impacts of drought stress on wheat and maize (Fig. 8) have been shown here. Without considering CO2 fertilization effects, wheat yield loss caused by heat stress would increase in the northern parts of China by up to 8 % under the warming scenario of 1.5 ∘C (Fig. 7a), particularly in Inner Mongolia, the Loess Plateau and the NCP, and it would become significantly larger in the warming scenario of 2.0 ∘C (Fig. 7b). In other regions, such as southwest China, the risk of heat stress would not change noticeably. In addition, the heat stress risk would not change significantly between the 1.5 and 2.0 ∘C warming scenarios in these areas. As for rice, yield loss caused by heat stress would increase by less than 2 and 5 % under the 1.5 and 2.0 ∘C warming scenarios, respectively, mainly in the MLYR (Fig. 7e, f). Under the 2.0 ∘C warming scenario, the increase in heat stress risk would be more significant in these areas than those under the 1.5 ∘C warming scenario. In other regions, such as northeast China and southwest China, the risk of heat stress would not change much compared with the historical period, and the increase in temperature from the 1.5 ∘C warming to the 2.0 ∘C warming scenario would not significantly increase the heat stress risk. When taking the CO2 fertilization effect into account, the results were quite similar to those without considering the CO2 fertilization effect (Figs. 7c, d, g, h and S2), indicating that the rising of CO2 concentration would not noticeably influence the changes in heat stress risk.
The impacts of drought stress on the wheat and the maize yield are shown in Fig. 8. The impacts of drought stress on wheat yield would be more severe in nearly the entire cultivation areas (Fig. 8a, b). Under the 1.5 ∘C warming scenario, wheat yield loss due to drought stress would increase by less than 4 % in most areas (Fig. 8a). Yield loss would increase by more than 2 % in 45.5 % of the grids with wheat cultivation. Under the 2.0 ∘C warming scenario, the yield loss would be significantly larger in northeast China, Inner Mongolia and Guizhou Province than that under the 1.5 ∘C warming scenario (Fig. 8b). Yield loss in the southern parts of the NCP would decrease noticeably. In general, the yield loss would increase by more than 2 % in 50.8 % of the grids with wheat cultivation. As for maize, the impacts of drought stress would decrease in southeast China by approximately 2 % (Fig. 8e, f). By contrast, in most parts of maize cultivation areas, the maize yield loss due to drought stress would increase by up to 8 %, mainly in the Loess Plateau, the NCP and some areas in northeast China and southwest China. Grids with a yield loss increase of more than 2 % would be expected in 31.6 % in the warming scenarios of 1.5 ∘C. Impacts of drought would be significantly aggravated under the 2.0 ∘C warming scenario, particularly for the Loess Plateau, the NCP and northernmost China. Overall, 53.5 % of all grids would suffer from a yield loss increase of more than 2 %.
Elevated CO2 concentration would reduce impacts of drought stress on crop growth, consequently reducing yield loss. Yield loss would be reduced more significantly under the warming scenario of 2.0 ∘C than 1.5 ∘C. For wheat, the percentage of grids with an increased yield loss of more than 2 % would be reduced by 18.8 % in the warming scenario of 1.5 ∘C (Fig. 8c). Meanwhile, yield loss under the 2.0 ∘C warming scenario was expected to decrease in nearly 60 % of the grids (Fig. 8d). By contrast, a decrease in yield loss could be found in only 5.7 % of grids when the CO2 fertilization effect was not taken into accounted. For maize, yield loss due to drought stress could be expected to decrease in a larger area, particularly northeast China and southwest China (Fig. 8g, h). The Loess Plateau would still be the hotspot of areas suffering from increased drought stress; however, the increase in yield loss would be less than 6 % generally.
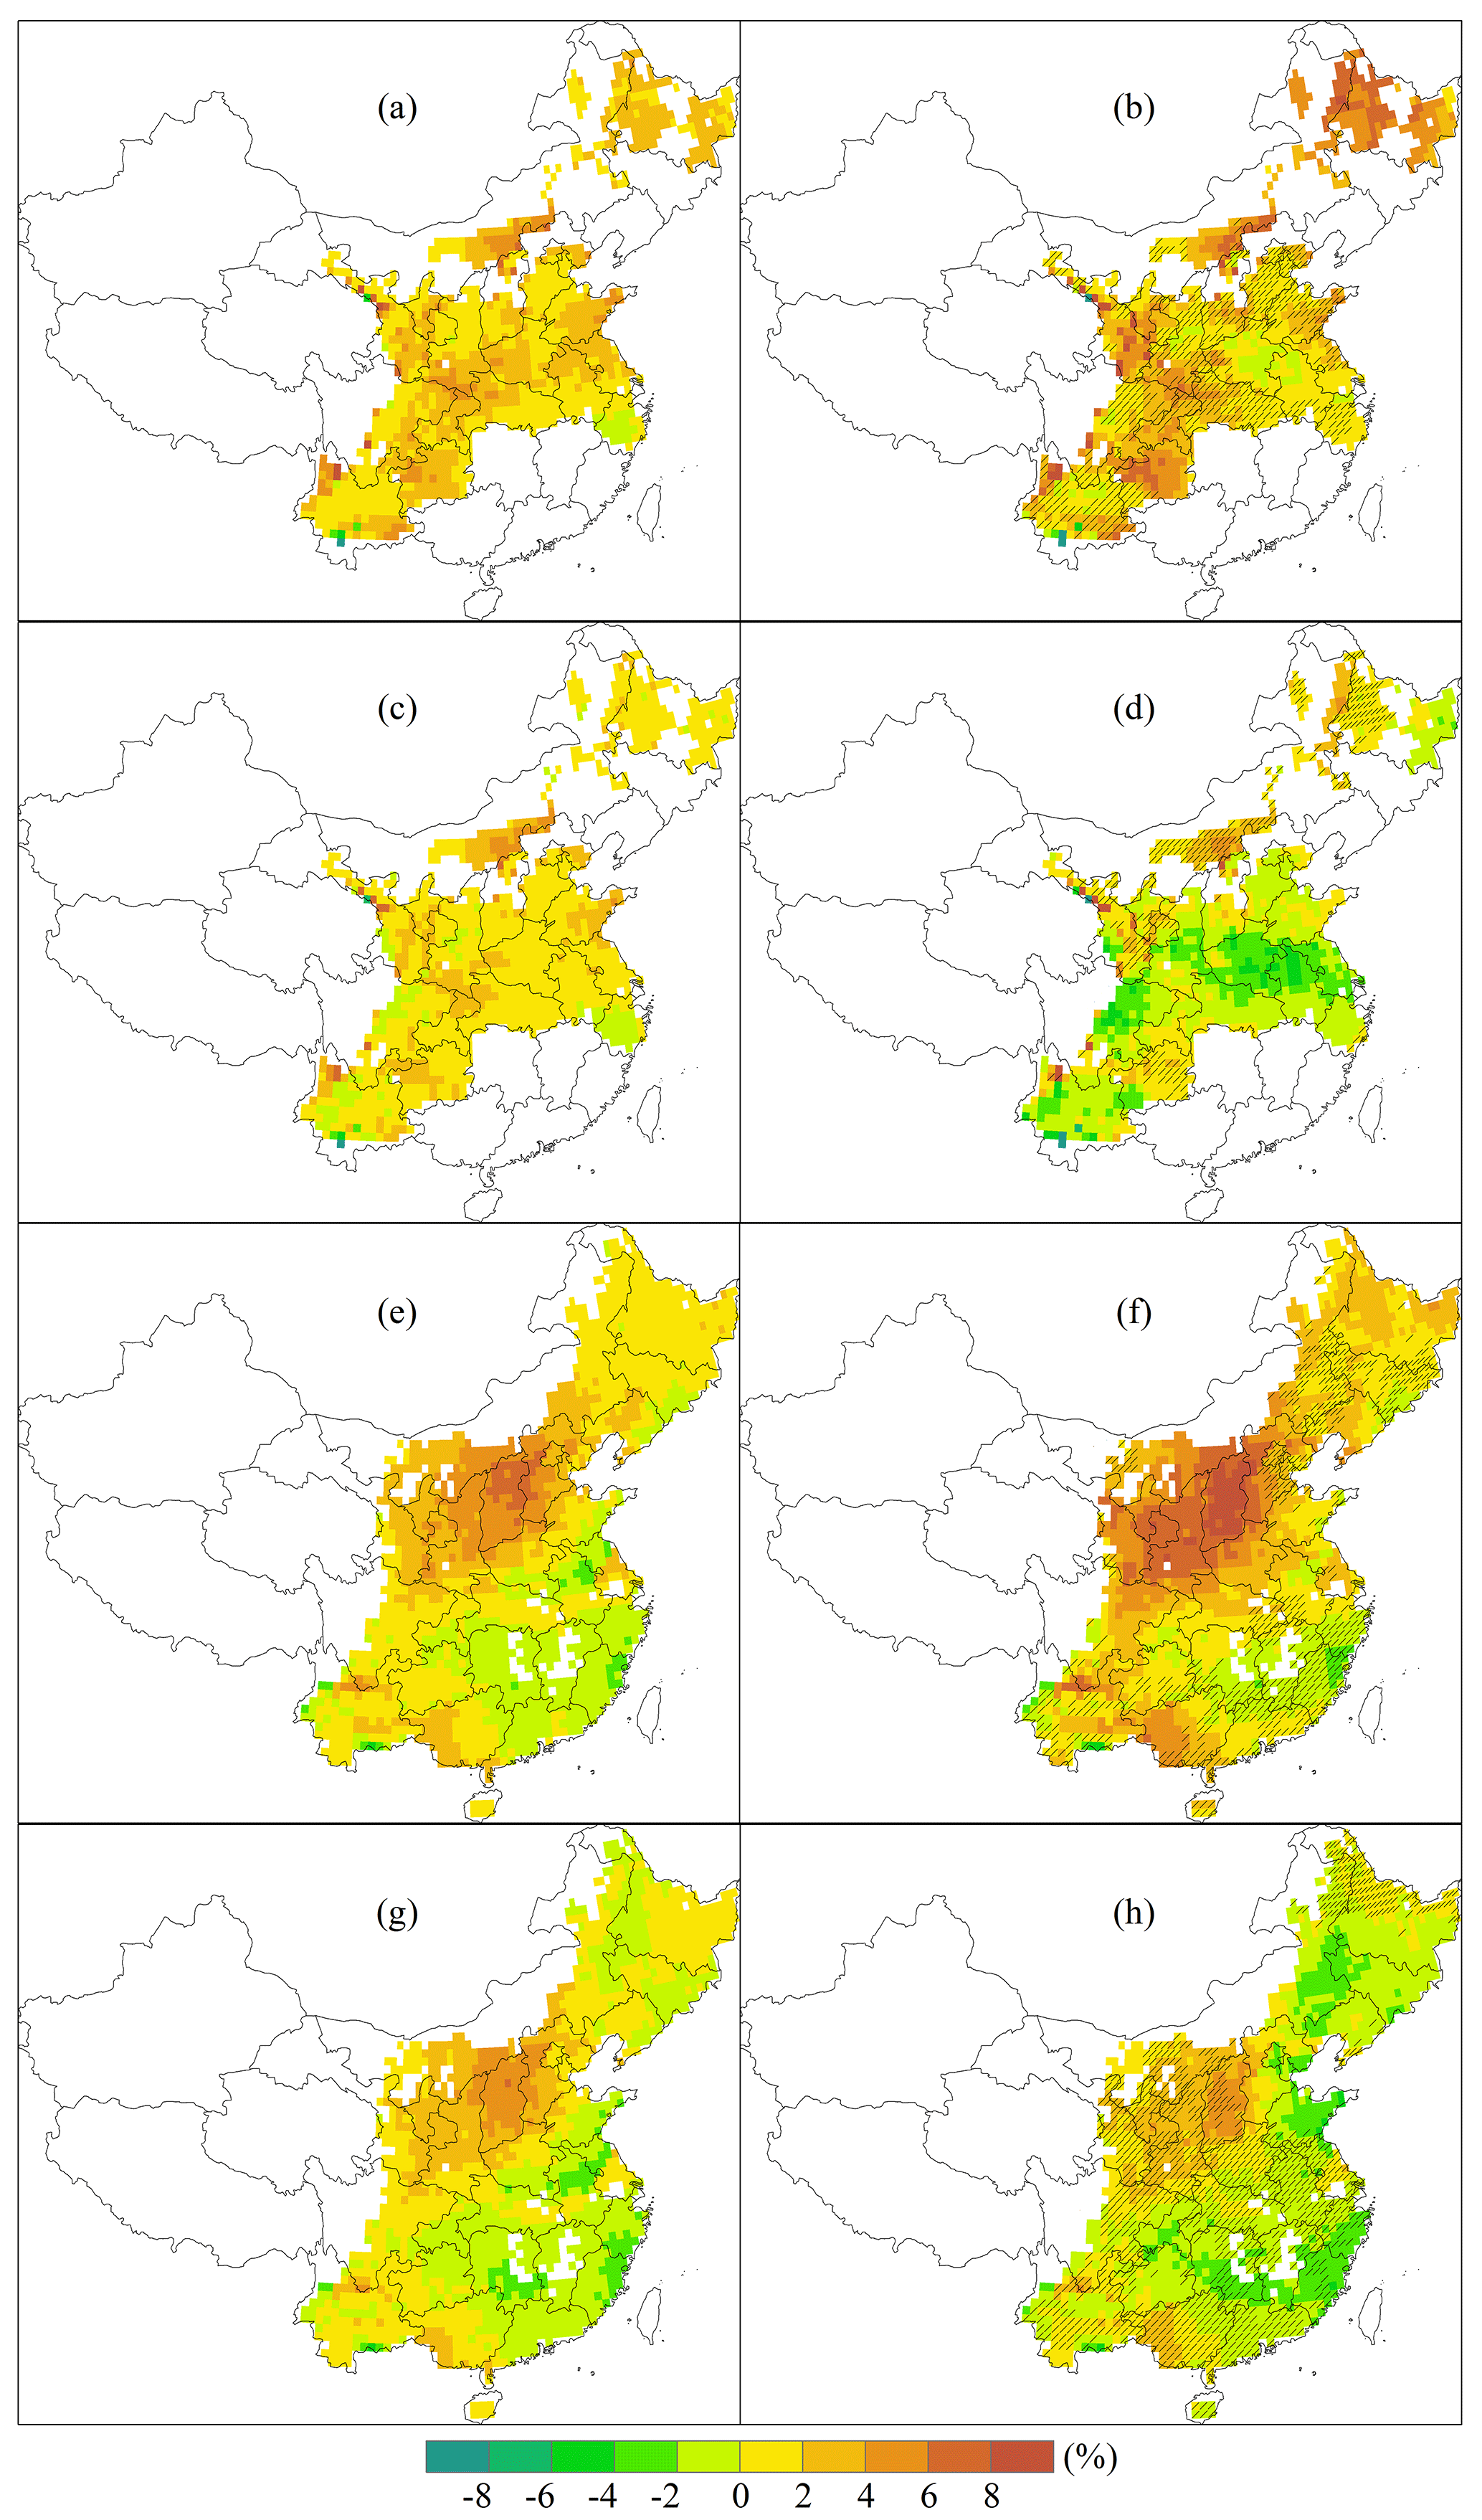
Figure 8Median changes in yield loss caused by drought stress for wheat (a–d) and maize (e–h) during 2106–2115 under the 1.5 ∘C warming (a, c, e, g) and 2.0 ∘C warming scenarios (b, d, f, h) relative to 2006–2015, without (a, b, e, f) and with (c, d, g, h) the CO2 fertilization effect. Hatching indicates the areas where differences between the 1.5 and 2.0 ∘C warming scenarios are not significant (P>0.05).
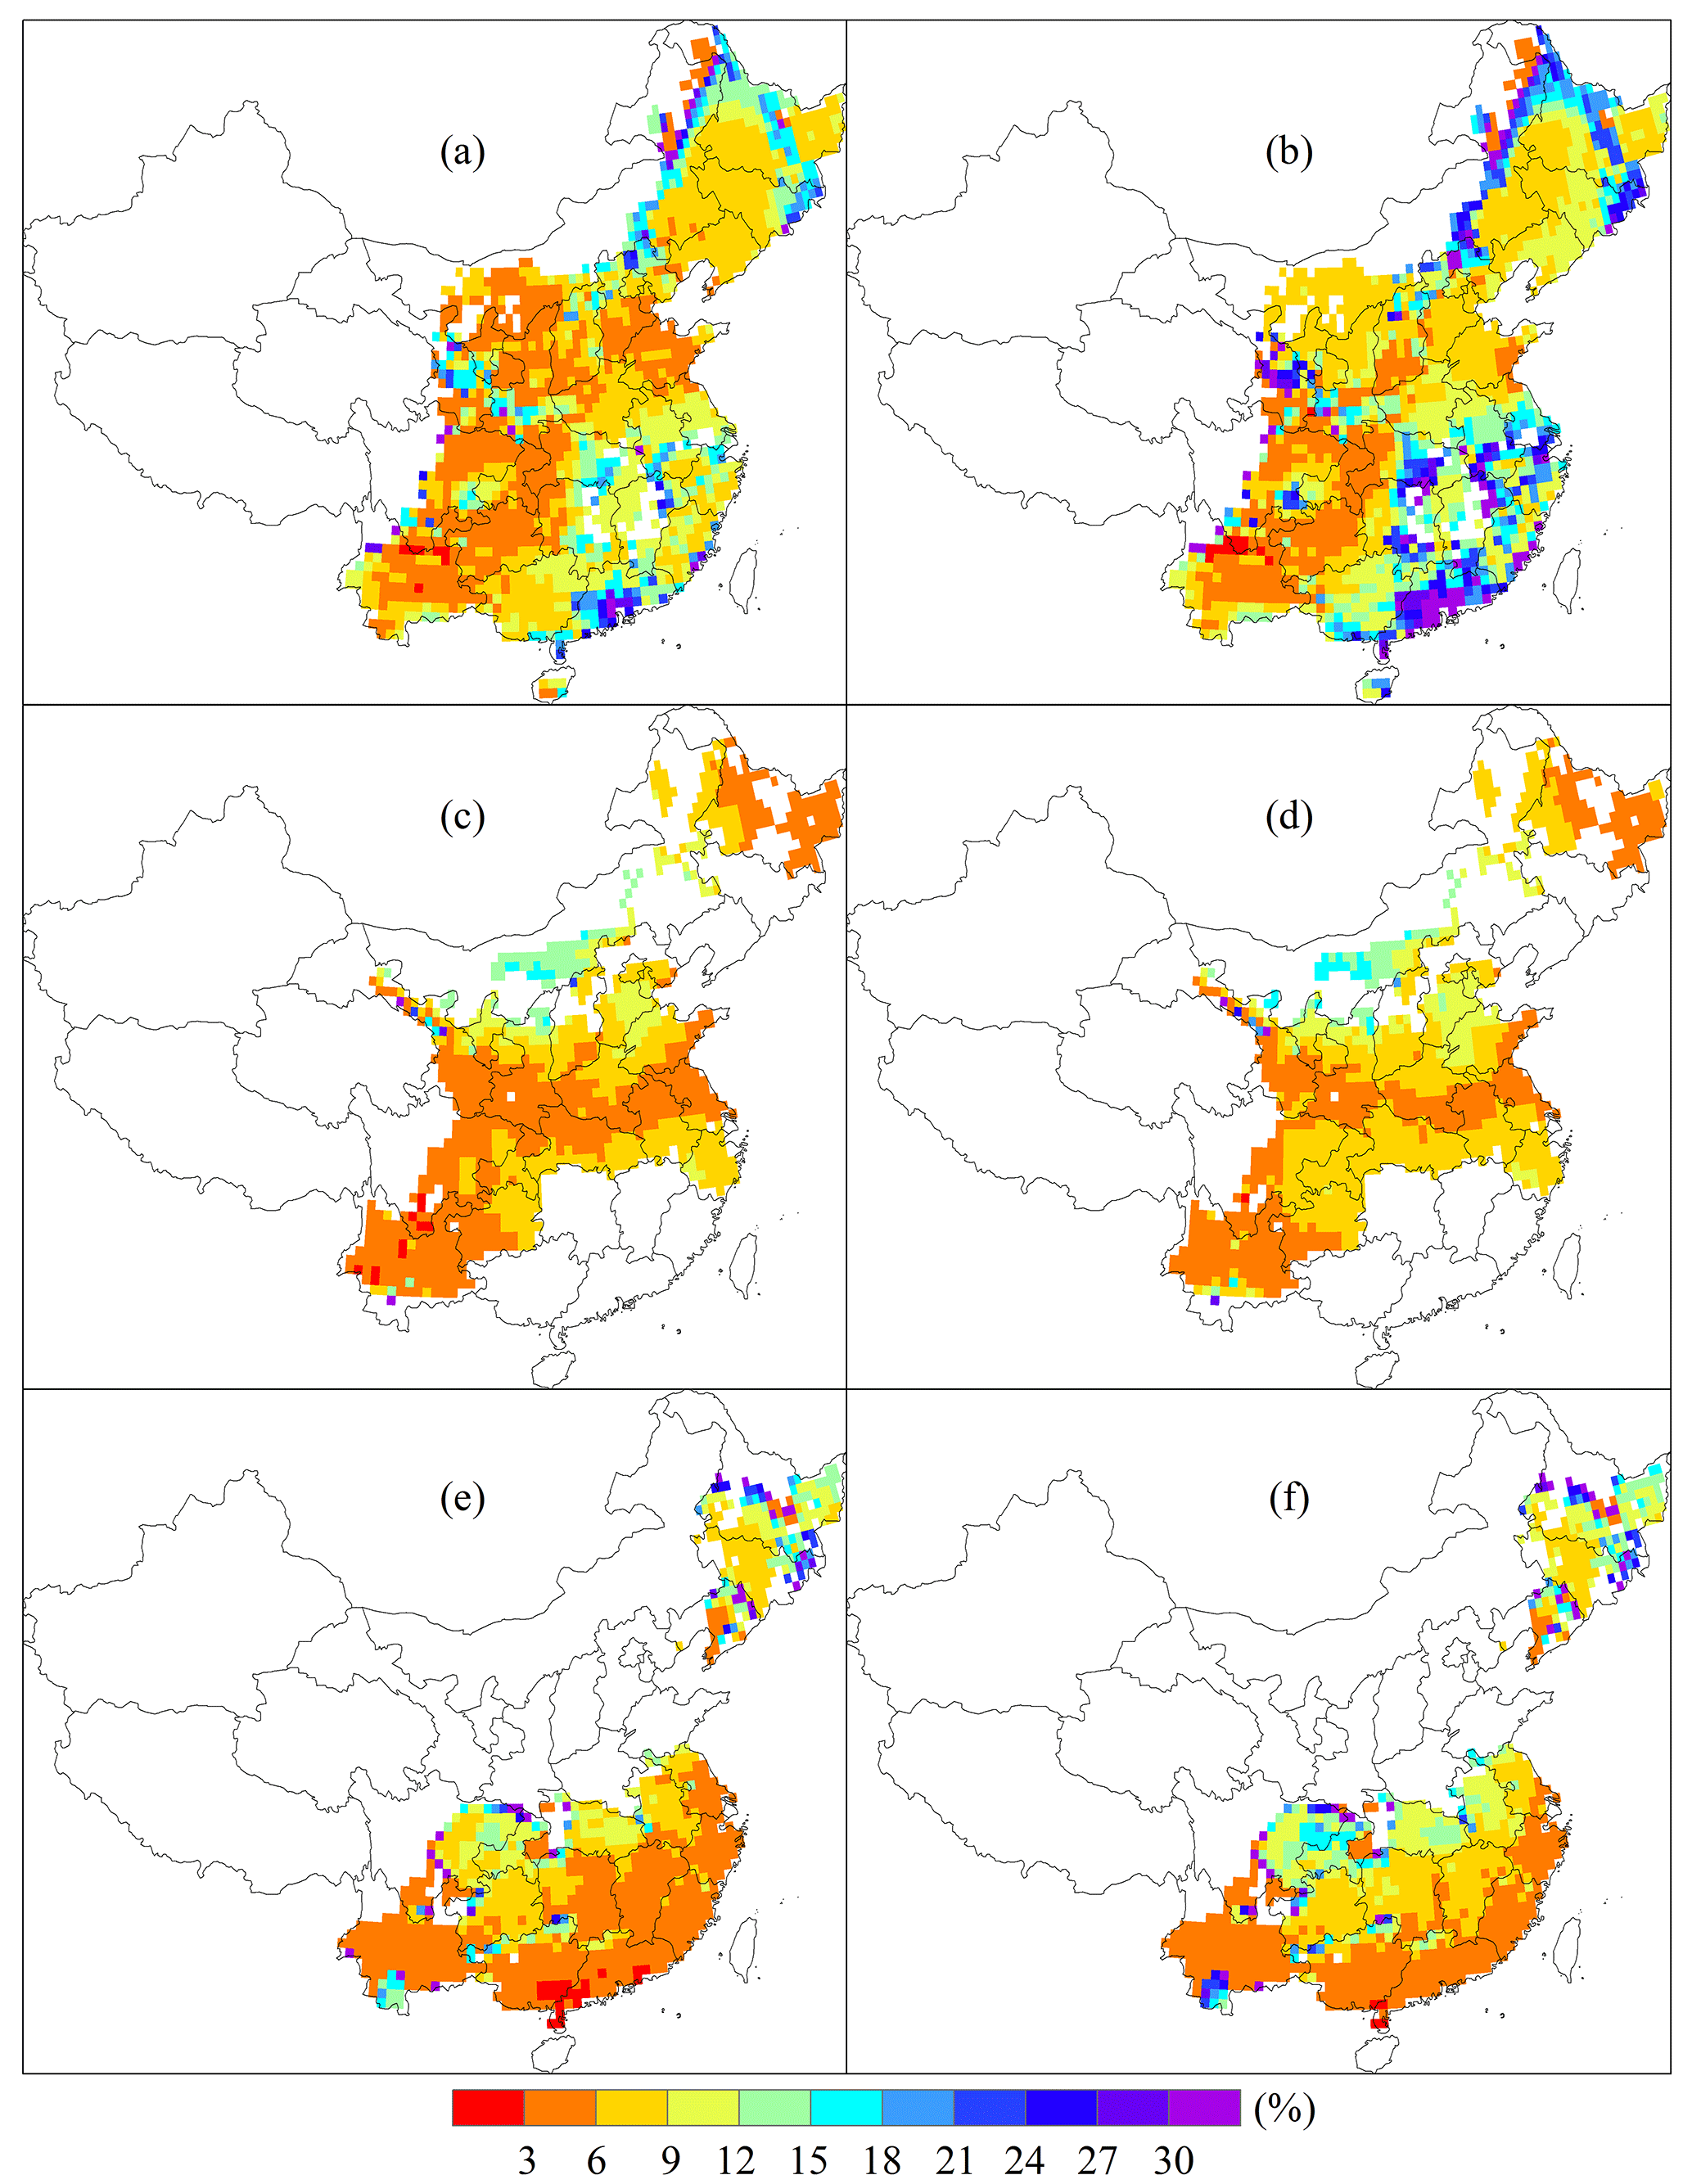
Figure 9Standard deviation of the projected yield changes for maize (a, b), wheat (c, d) and rice (e, f) under the 1.5 ∘C warming (a, c, e) and 2.0 ∘C warming (b, d, f) scenarios, taking the CO2 fertilization effect into account.
3.5 Variability in the projected yield changes
The SD of the projected yield changes between the historical and future periods is shown in Fig. 9. For maize, the SD would be relatively larger in south China and some marginal areas of northeast China, where it could be larger than 20 %. By contrast, it was generally less than 10 % in most parts of northeast China, the NCP, the Loess Plateau and southwest China (Fig. 9a, b). The SD under the 2.0 ∘C warming scenario would generally be larger than that under the 1.5 ∘C warming scenario except the areas with a relatively smaller SD in the NCP and the Loess Plateau. For wheat, under both warming scenarios, the SD of simulated yield changes was less than 9 % in most of the cultivation areas. However, it could be up to 12 and 18 %, respectively, in the NCP and Inner Mongolia (Fig. 9c, d). The SD under the two warming scenarios was similar in most cultivation areas, while the SD under the 2.0 ∘C warming scenario would increase in some areas of the NCP and southern parts of cultivation areas. As for rice, the simulated yield changes in the double rice cropping region and most parts of southwest China were relatively stable, with a SD of generally less than 9 % under both warming scenarios (Fig. 9e, f); by contrast, the SD would range from 9 to more than 20 % in northeast China, central China and the Sichuan Basin (Fig. 9e, f). The SD in MLYR in the warming scenario of 2.0 ∘C would be larger than that in the warming scenario of 1.5 ∘C. In other regions, the variability of rice yield changes was similar under the two warming scenarios.
Changes in the coefficient of variation (CV) of simulated yields were used to show the changes in variability of simulated yields between the 1.5 and 2.0 ∘C warming scenarios (Fig. S3). For maize, CV would increase mainly in northernmost China and southeast China by 4–8 %. In other regions, the changes in CV were generally within ±2 %. As for wheat, the changes in CV were generally within ±2 % in the entire study area, indicating small changes between the two scenarios. For rice, the CV of simulated yields would decrease mainly in northeast and southwest China by more than 2 or even 4 %. In other regions, the changes in CV were within ±2 %.
The SD of the changes in yield loss due to heat stress and drought stress are shown in Figs. S4 and S5, respectively. The CO2 fertilization effect would not noticeably affect the SD of projected changes in yield loss. However, the changes in the warming scenario from 1.5 to 2.0 ∘C would more or less affect the projected changes in yield loss. For heat stress, the projected changes in wheat yield loss showed large variability in the northern parts of the study area, while the variability for rice was large in the double rice cropping region in south China, with a SD ranging from 4 to 10 % in these areas.By contrast, the SDs in other areas were generally less than 2 %. For drought stress, the SD of projected changes in wheat yield loss could be larger than 8 % in northeast China, the NCP and southwest China. The SD of projected changes in maize yield loss was larger in the NCP and the Loess Plateau than in other cultivation areas, with a SD of 4–6 %.
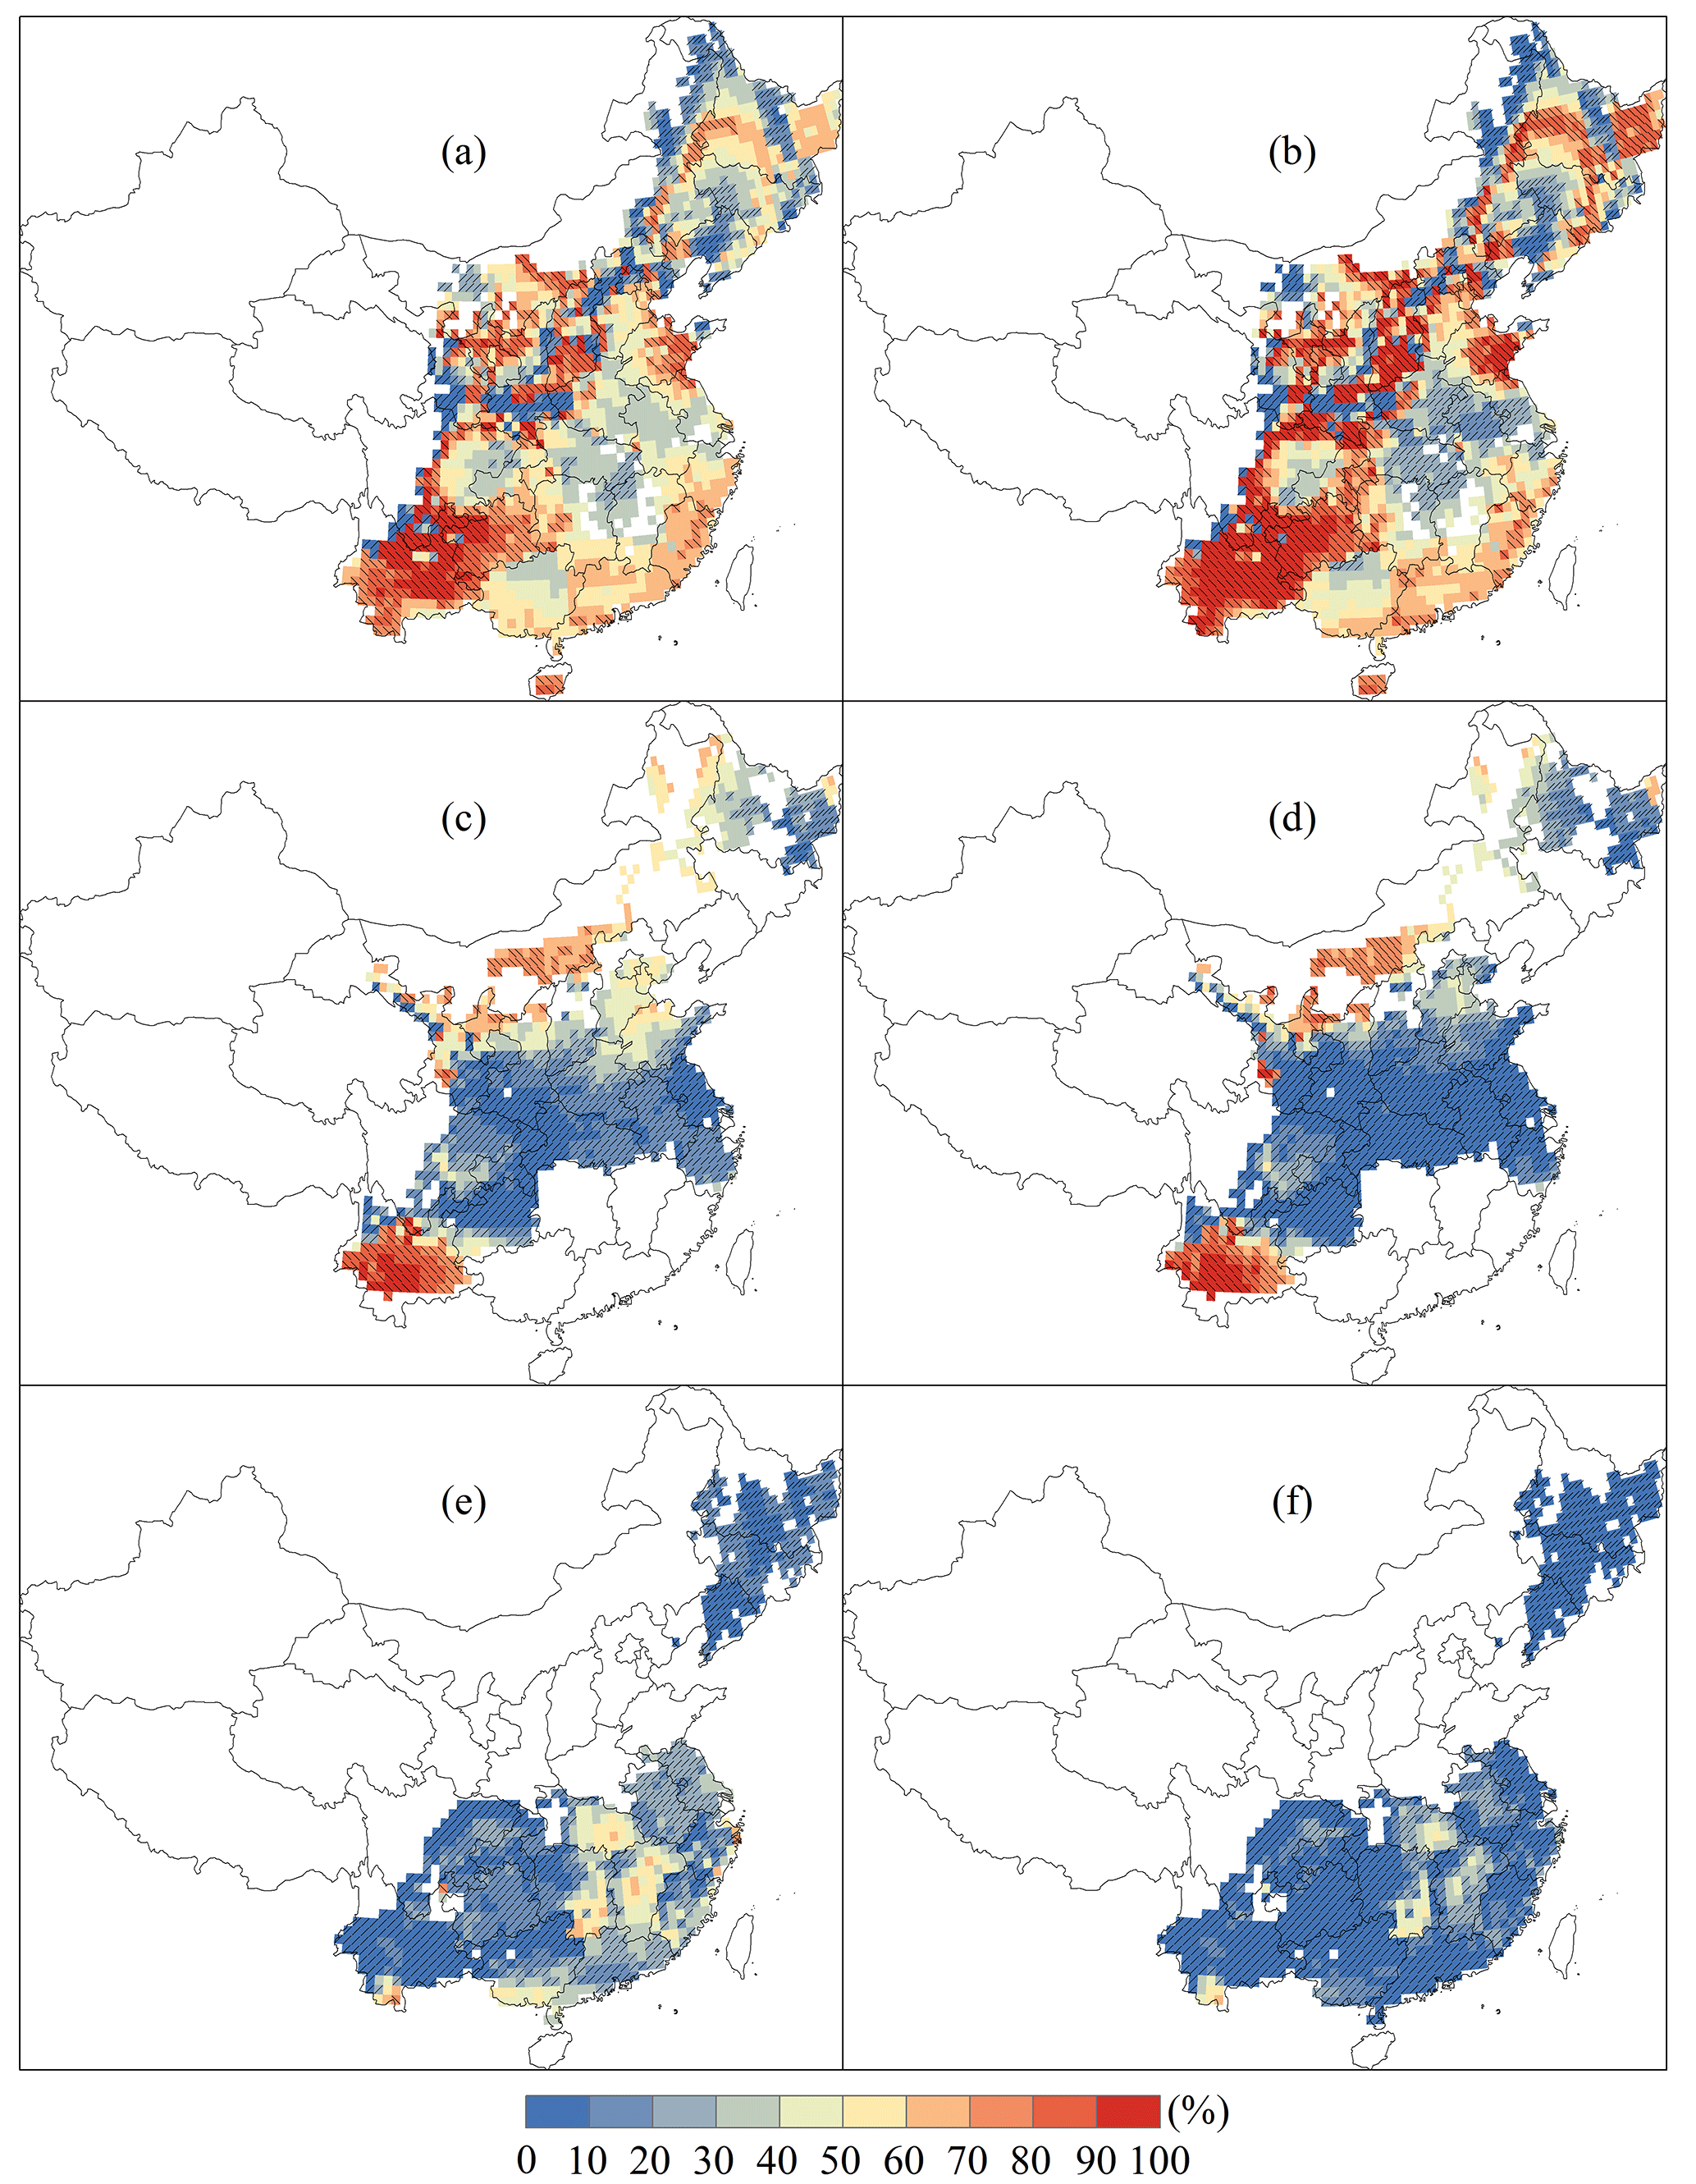
Figure 10Median of projected yield decrease probability for maize (a, b), wheat (c, d) and rice (e, f) during 2106–2115 under the 1.5 ∘C warming (a, c, e) and 2.0 ∘C warming (b, d, f) scenarios, taking the CO2 fertilization effect into account. Hatching indicates the areas where more than 70 % of the ensemble simulations agree on the sign of yield change.
3.6 Probability of a yield decrease in the warming scenarios of 1.5 and 2.0 ∘C
Based on the large number of ensemble simulations, the probability of a major crop yield decrease was estimated and presented in Fig. 10. For maize, yield would decrease with a probability of more than 60 % in the warming scenario of 1.5 ∘C in southwest China, southeast coast areas, some parts of north China, the NCP and northeast China (Fig. 10a). Moreover, the probability of a yield decrease in these areas would increase in the warming scenario of 2.0 ∘C (Fig. 10b). In contrast, the probability of a maize yield decrease would be less than 40 % in the MLYR and northeast China (Fig. 10a). In addition, the yield decrease probability in these areas would decrease to less than 30 % in the warming scenario of 2.0 ∘C (Fig. 10b). For wheat, the probability of a yield decrease was projected to generally less than 30 % in more than half of the wheat cultivation areas in the warming scenario of 1.5 ∘C (Fig. 10c). However, yield would decrease with a probability of more than 60 % in southwest China, north China and some marginal areas in northeast China. In the warming scenario of 2.0 ∘C, the probability of a yield decrease would be reduced in the areas with a low decrease probability (Fig. 10d). Overall, 66 % of grids would have a yield decrease probability of less than 30 %, while the number of grids with a yield decrease probability larger than 70 % would not change much. For rice, the probability of a yield decrease was projected to be less than 30 % across most of the cultivation areas under the 1.5 ∘C warming scenario, and the probability would be even less under the 2.0 ∘C warming scenario. But in some areas in the MLYR, the probability of a yield decrease could range from 40 to 60 and 40 to 50 % in the warming scenarios of 1.5 and 2.0 ∘C, respectively.
Taking the CO2 fertilization effect into account, at a country scale, the SD of simulated yield changes ranged from 1.5 to 4 % under different ensemble members (Fig. 6c, d). Meanwhile, the SD under the 2.0 ∘C warming scenario would be generally larger than that under the 1.5 ∘C warming scenario. For maize, wheat and rice, respectively, the probability of a yield decrease was 46.1, 18.3 and 4.3 % under the 1.5 ∘C warming scenario and 70, 0.6 and 0 % under the 2.0 ∘C warming scenario.
4.1 Impacts of climate change on future crop productivity in China
The results showed there was a similar spatial pattern between changes in growth duration and that of yield decrease without the CO2 fertilization effect, for example, wheat in the northern parts of China, rice in the double rice cultivation regions and maize across China. These results suggested that growth duration should play a critical role in affecting crop yields. Beside changes in growth duration, varieties in temperature and solar radiation would also impact crop yields by affecting the photosynthesis process. A moderate increase in mean temperature and the increase in solar radiation would promote the yield increase by enhancing crop canopy photosynthesis and consequently biomass accumulation and yield (Tao et al., 2013). These positive effects could underlie the crop responses of yield increase in the current study. For example, in cultivation areas of maize with a growth duration decrease of less than 2 %, the yield would generally increase, which would be due to the increase in solar radiation and the warmer environment that is close to the optimal temperature for photosynthesis. As for wheat, in southern parts of the cultivation areas, although the growth duration would noticeably decrease because of the relatively large increase in temperature, the yield loss could be compensated for by the positive effects of increasing temperature and solar radiation on photosynthesis. For rice, the contribution of increased temperature and solar radiation would be more distinct in southwest and northeast China where growth duration would decrease by less than 2 %. The large increase in rice yield in these areas indicated a more appropriate environment, particularly a more suitable thermal scenario, for photosynthesis (Tao et al., 2008b; Zhang et al., 2017).
According to the simulation results, impacts from extreme events would still be a critical limitation factor for crop growth in the future. Although their impacts might be slightly mitigated in some areas, the projected increases in stress impacts were always remarkable. The increase in impacts of heat stresses on wheat in the northern parts of China and on rice in south China would significantly aggravate the yield loss in these areas, suggesting the requirement for improving adaptation strategies with a higher priority. Meanwhile, the increase in drought impacts indicated that water requirement would widely increase the risk of a water crisis in most of the cultivation areas.
The elevated atmospheric CO2 concentration, which is a critical factor in global warming, also has positive impacts on crop yields. The interactions between a moderate increase in temperature, solar radiation and CO2 concentration would enhance photosynthesis (Sage et al., 1995; Hikosaka et al., 2006; Sage and Kubien, 2007; Zhu et al., 2008). The combination of these effects would consequently benefit the biomass accumulations and yield. In this study, the CO2 fertilization effects have compensated for a yield decrease in wheat and rice in most of the cultivation areas. As for maize, although it is less sensitive to the elevated CO2 concentration, the CO2 fertilization effect could reduce yield loss to some extent. In addition, the rising CO2 could also be expected to effectively reduce drought stress because of the stomatal “anti-transpirant” response of plants and the increase in root density and canopy closure which would reduce the transpiration rates at leaf level and increase the water availability (Polley et al., 2007; Jiahong et al., 2010). However, for hotspot areas of drought stress aggravation, particularly wheat production in north China and maize production in the Loess Plateau, the increase in irrigation would be inevitable and more input in agricultural infrastructure would be necessary.
4.2 Risks and opportunities in regard to crop production in China with climate change
Climate change will substantially alter the growing environment of crops and consequently change the yield potential and yield expectation in future periods (Gourdji et al., 2013; Nelson et al., 2014; Rosenzweig et al., 2014; Assenget al., 2015). In past decades, there has been a critical focus on the negative impacts of climate change since the predicted population growth and more frequent extreme events may lead to a pessimistic conclusion regarding food supply (Wheeler and Von Braun, 2013; Trnka et al., 2014). In this study, the projected yield changes under the 1.5 and 2.0 ∘C warming scenarios presented possible risks to crop production but also suggest opportunities and potentials for agricultural development. The negative impacts generally resulted from the decrease in growth duration and the aggravation of the impacts of extreme events. However, the negative impacts under moderate warming scenarios would be very limited at a country scale, suggesting low risks for crop production and food security. Moreover, the negative impacts of warming scenarios could be compensated for by the increase in solar radiation and temperature, the more appropriate temperature environment in some relatively colder areas, and the fertilization effects of elevated atmospheric CO2 concentration. As a consequence, yield would increase with a high probability for rice and wheat under both warming scenarios. The yield of maize, which was not sensitive to CO2 fertilization effects, would slightly decrease in a 1.5 ∘C warmer world and decrease more under the 2.0 ∘C warming scenario. However, the contribution of climate change to increasing wheat and rice productivity would be always much larger than the decrease in maize productivity, indicating that the overall national food supply would benefit from climate change.
We concluded that the 1.5 or 2.0 ∘C warming scenario would bring more opportunities than risks to the food supply in China, particularly for wheat and rice. When comparing the effects between warming scenarios of 1.5 and 2.0 ∘C, although the variability of yield changes would be larger under the 2.0 ∘C warming scenario, the probability of a wheat and rice yield decrease would be less, and their yields would increase much more in the warming scenario of 2.0 ∘C than that at 1.5 ∘C.
4.3 Uncertainties of the study
The uncertainties in the simulation results have been explicitly quantified in this study. Uncertainties in GCMs and model parameterization are critical sources of uncertainties in simulation results (Elliott et al., 2014; Lobell et al., 2014; Tao et al., 2018). Here, we used ensemble GCM data to address the uncertainties from climate change scenarios. Meanwhile, we used multiple sets of parameters to account for the uncertainties in cultivars and management on a province scale. In order to provide more accurate evaluation of climate change impacts, the input data, the quality of the crop model and the climate projection should be further elaborated. More elaborate parameters for a smaller scale might help better clarify and reduce the uncertainties from model parameterization. Furthermore, crop model selection could be another source of uncertainties. The processes and methods used to simulate crop growth, development and yield formation are different among crop models, and consequently the simulation results could be different to some extent when using different crop models (Tao et al., 2018). Evaluating climate change impact with multiple crop models can be more robust (Asseng, et al., 2013; Martre et al., 2015). When discussing the future crop responses, the parameter that was calibrated based on the current crop datasets may lead to new uncertainties. The changes in cultivars and the development of adaptation methods in future may lead to more optimistic results than the current study, given the rapid update of adaptive cultivars. In future studies, the combination of assessing results across multiple sectors, such as the accurate prediction of changes in climate factors, cultivars and adaptation capacity, could be expected to help better quantify the future risks and opportunities for agricultural development and provide more accurate and effective suggestions for the government and farmers.
In the current study, using the well-validated MCWLA family crop models, their 10 sets of optimal parameters and 70 climate projections from four GCMs, we evaluated the potential changes in major crop growth and yields during 2106–2115 relative to 2006–2015 under the 1.5 and 2.0 ∘C warming scenarios. Results showed that the decrease in crop growth duration and the increase in extreme event impacts would be critical reasons for a yield decrease in the future. Meanwhile, agricultural climate resources such as light and thermal resource could be ameliorated, which would enhance canopy photosynthesis, biomass accumulations and yield and could partly compensate for the yield decrease or even contribute to the yield increase. In general, without considering CO2 fertilization effects, the food supply at a country scale would not change much under the 1.5 ∘C warming scenario, while the crop production for all three kinds of major crops would tend to be reduced slightly under the 2.0 ∘C warming scenario. Maize production in most cultivation areas, wheat production in north and southwest China, and rice production in south China, would be hotspots that encounter adverse impacts caused by climate change. The combination of a moderate increase in temperature, solar radiation, precipitation and CO2 fertilization effects, would result in a more appropriate growth environment for wheat and rice and slightly worsen the growth environment of maize. Overall, the benefits from climate change would be larger than the crop loss caused by the adverse factors in a moderate warming environment. Thus, we could expect that the 1.5 and 2.0 ∘C warming scenarios would bring more opportunities than risks for agricultural production and food supply in China in general. Moreover, because of the larger increase in crop productivity and the lesser probability of yield loss, the 2.0 ∘C warming scenario might be more suitable for crop production in China than the 1.5 ∘C warming scenario.
The meteorological data that are provided by National Energy Research Scientific Computing Center (NERSC) are available at http://portal.nersc.gov/c20c/data/ClimateAnalytics/ (last access: 20 October 2017; Hempel et al., 2013; Frieler et al., 2017; Lange, 2016) . The dataset of cultivation area information (Monfreda et al., 2008) is available at http://www.earthstat.org/data-download/ (last access: 3 August 2017) Crop yield data in China are available at http://data.stats.gov.cn/english/ (last access: 15 August 2017).The information for crop phenology is available at http://data.cma.cn/data/cdcdetail/dataCode/AGME_AB2_CHN_TEN.html (last access: 15 August 2017). The Soil dataset is available at http://www.fao.org/geonetwork/srv/en/metadata.show?id=14116 (last access: 3 August 2017).
The supplement related to this article is available online at: https://doi.org/10.5194/esd-9-543-2018-supplement.
The authors declare that they have no conflict of interest.
This article is part of the special issue “The Earth system at a global warming of 1.5 ∘C and 2.0 ∘C”. It is not associated with a conference.
This study is funded by the National Key Research and Development Program of
China (project nos. 2017YFD0300301, 2016YFD0300201) and the National Natural
Science Foundation of China (nos. 31761143006, 31561143003, 41571493 and
41571088). We acknowledge the HAPPI core team and NERSC for data
storage.
Edited by: Somnath Baidya Roy
Reviewed by: two
anonymous referees
Ainsworth, E. A., Leakey, A. D., Ort, D. R., and Long, S. P.: FACE-ing the facts: inconsistencies and interdependence among field, chamber and modeling studies of elevated [CO2 ] impacts on crop yield and food supply, New Phytol., 179, 5–9, https://doi.org/10.1111/j.1469-8137.2008.02500.x, 2008.
Asseng, S., Ewert, F., Rosenzweig, C., Jones, J. W., Hatfield, J. L., Ruane, A. C., Boote, K. J., Thorburn, P. J., Rötter, R. P., Cammarano, D., Brisson, N., Basso, B., Martre, P., Aggarwal, P. K., Angulo, C., Bertuzzi, P., Biernath, C., Challinor, A. J., Doltra, J., Gayler, S., Goldberg, R., Grant, R., Heng, L., Hooker, J., Hunt, L. A., Ingwersen, J., Izaurralde, R. C., Kersebaum, K. C., Müller, C., Naresh Kumar, S., Nendel, C., O'Leary, G., Olesen, J. E., Osborne, T. M., Palosuo, T., Priesack, E., Ripoche, D., Semenov, M. A., Shcherbak, I., Steduto, P., Stöckle, C., Stratonovitch, P., Streck, T., Supit, I., Tao, F., Travasso, M., Waha, K., Wallach, D., White, J. W., Williams, J. R., and Wolf, J.: Uncertainty in simulating wheat yields under climate change, Nat. Clim. Change, 3, 827–832, https://doi.org/10.1038/nclimate1916, 2013.
Asseng, S., Ewert, F., Martre, P., Rötter, R. P., Lobell, D. B., Cammarano, D., Kimball, B. A., Ottman, M. J., Wall, G. W., White, J. W., Reynolds, M. P., Alderman, P. D., Prasad, P. V. V., Aggarwal, P. K., Anothai, J., Basso, B., Biernath, C., Challinor, A. J., De Sanctis, G., Doltra, J., Fereres, E., Garcia-Vila, M., Gayler, S., Hoogenboom, G., Hunt, L. A., Izaurralde, R. C., Jabloun, M., Jones, C. D., Kersebaum, K. C., Koehler, A.-K., Müller, C., Naresh Kumar, S., Nendel, C., O'Leary, G., Olesen, J. E., Palosuo, T., Priesack, E., Eyshi Rezaei, E., Ruane, A. C., Semenov, M. A., Shcherbak, I., Stöckle, C., Stratonovitch, P., Streck, T., Supit, I., Tao, F., Thorburn, P. J., Waha, K., Wang, E., Wallach, D., Wolf, J., Zhao, Z., and Zhu, Y.: Rising temperatures reduce global wheat production, Nat. Clim. Change, 5, 143–147, https://doi.org/10.1038/nclimate2470, 2015.
Asseng, S., Foster, I., and Turner, N. C.: The impact of temperature variability on wheat yields, Global Change Biol., 17, 997–1012, https://doi.org/10.1111/j.1365-2486.2010.02262.x, 2011.
Bassu, S., Brisson, N., Durand, J. L., Boote, K., Lizaso, J., Jones, J. W., Rosenzweig, C., Ruane, A. C., Adam, M., Baron, C., Basso, B., Biernath, C., Boogaard, H., Conijn, S., Corbeels, M., Deryng, D., Sanctis, G., Gayler, S., Grassini, P., Hatfield, J., Hoek, S., Izaurralde, C., Jongschaap, R., Kemanian, A. R., Kersebaum, K. C., Kim, S., Kumar, N. S., Makowski, D., Müller, C., Nendel, C., Priesack, E., Pravia, M. V., Sau, F., Shcherbak, I., Tao, F., Teixeira, E., Timlin, D., and Waha, K.: How do various maize crop models vary in their responses to climate change factors?, Global Change Biol., 20, 2301–2320, https://doi.org/10.1111/gcb.12520, 2014.
Brown, R. A. and Rosenberg, N. J.: Sensitivity of crop yield and water use to change in a range of climatic factors and CO2 concentrations: a simulation study applying EPIC to the central USA, Agr. Forest Meteorol., 83, 171–203, https://doi.org/10.1016/S0168-1923(96)02352-0, 1997.
Burkart, S., Manderscheid, R., Wittich, K. P., Löpmeier, F. J., and Weigel, H. J.: Elevated CO2 effects on canopy and soil water flux parameters measured using a large chamber in crops grown with free-air CO2 enrichment, Plant Biol., 13, 258–269, https://doi.org/10.1111/j.1438-8677.2010.00360.x, 2011.
Chen, J., Chen, C., Tian, Y., Zhang, X., Dong, W., Zhang, B., Zhang, J., Zheng, C., Deng, A. and Song, Z.: Differences in the impacts of nighttime warming on crop growth of rice-based cropping systems under field conditions, Eur. J. Agron., 82, 80–92, https://doi.org/10.1016/j.eja.2016.10.006, 2016.
Chen, Y., Wang, P., Zhang, Z., Tao, F., and Wei, X.: Rice yield development and the shrinking yield gaps in China, 1981–2008, Reg. Environ. Change, 17, 2397–2408, https://doi.org/10.1007/s10113-017-1168-7, 2017a.
Chen, Y., Zhang, Z., Tao, F., Wang, P., and Wei, X.: Spatio-temporal patterns of winter wheat yield potential and yield gap during the past three decades in North China, Field Crop. Res., 206, 11–20, https://doi.org/10.1016/j.fcr.2017.02.012, 2017b.
Deryng, D., Elliott, J., Folberth, C., Müller, C., Pugh, T. A., Boote, K. J., Conway, D., Ruane, A. C., Gerten, D., and Jones, J. W.: Regional disparities in the beneficial effects of rising CO2 concentrations on crop water productivity, Nat. Clim. Change, 6, 786–790, https://doi.org/10.1038/nclimate2995, 2016.
Durand, J. L., Delusca, K., Boote, K., Lizaso, J., Manderscheid, R., Weigel, H. J., Ruane, A. C., Rosenzweig, C., Jones, J., and Ahuja, L.: How accurately do maize crop models simulate the interactions of atmospheric CO2 concentration levels with limited water supply on water use and yield?, Eur. J. Agron., https://doi.org/10.1016/j.eja.2017.01.002, online first, 2017.
Elliott, J., Deryng, D., Müller, C., Frieler, K., Konzmann, M., Gerten, D., Glotter, M., Flörke, M., Wada, Y., Best, N., Eisner, S., Fekete, B., Folberth, C., Foster, I., Gosling, S., Haddeland, I., Khabarov, N., Ludwig, F., Masaki, Y., Olin, S., Rosenzweig, C., Ruane, A., Satoh, Y., Schmid, E., Stacke, T., Tang, Q., and Wisser, D.: Constraints and potentials of future irrigation water availability on agricultural production under climate change, P. Natl. Acad. Sci. USA, 111, 3239–3244, https://doi.org/10.1073/pnas.1222474110, 2014.
Frieler, K., Lange, S., Piontek, F., Reyer, C. P. O., Schewe, J., Warszawski, L., Zhao, F., Chini, L., Denvil, S., Emanuel, K., Geiger, T., Halladay, K., Hurtt, G., Mengel, M., Murakami, D., Ostberg, S., Popp, A., Riva, R., Stevanovic, M., Suzuki, T., Volkholz, J., Burke, E., Ciais, P., Ebi, K., Eddy, T. D., Elliott, J., Galbraith, E., Gosling, S. N., Hattermann, F., Hickler, T., Hinkel, J., Hof, C., Huber, V., Jägermeyr, J., Krysanova, V., Marcé, R., Müller Schmied, H., Mouratiadou, I., Pierson, D., Tittensor, D. P., Vautard, R., van Vliet, M., Biber, M. F., Betts, R. A., Bodirsky, B. L., Deryng, D., Frolking, S., Jones, C. D., Lotze, H. K., Lotze-Campen, H., Sahajpal, R., Thonicke, K., Tian, H., and Yamagata, Y.: Assessing the impacts of 1.5 ∘C global warming – simulation protocol of the Inter-Sectoral Impact Model Intercomparison Project (ISIMIP2b), Geosci. Model Dev., 10, 4321–4345, https://doi.org/10.5194/gmd-10-4321-2017, 2017.
Gourdji, S. M., Sibley, A. M., and Lobell, D. B.: Global crop exposure to critical high temperatures in the reproductive period: historical trends and future projections, Environ. Res. Lett., 8, 024041, https://doi.org/10.1088/1748-9326/8/2/024041, 2013.
Hasegawa, T., Li, T., Yin, X., Zhu, Y., Boote, K., Baker, J., Bregaglio, S., Buis, S., Confalonieri, R., and Fugice, J.: Causes of variation among rice models in yield response to CO2 examined with Free-Air CO2 Enrichment and growth chamber experiments, Sci. Rep.-UK, 7, 14858, https://doi.org/10.1038/s41598-017-13582-y, 2017.
Hempel, S., Frieler, K., Warszawski, L., Schewe, J., and Piontek, F.: A trend-preserving bias correction – the ISI-MIP approach, Earth Syst. Dynam., 4, 219–236, https://doi.org/10.5194/esd-4-219-2013, 2013.
Hikosaka, K., Ishikawa, K., Borjigidai, A., Muller, O., and Onoda, Y.: Temperature acclimation of photosynthesis: mechanisms involved in the changes in temperature dependence of photosynthetic rate, J. Exp. Bot., 57, 291–302, https://doi.org/10.1093/jxb/erj049, 2006.
Jiahong, L. I., John, E. E., Peresta, G., and Drake, B. G.: Evapotranspiration and water use efficiency in a Chesapeake Bay wetland under carbon dioxide enrichment, Global Change Biol., 16, 234–245, https://doi.org/10.1111/j.1365-2486.2009.01941.x, 2010.
Lange, S.: EartH2Observe, WFDEI and ERA-Interim data Merged and Bias-corrected for ISIMIP (EWEMBI), GFZ Data Services, https://doi.org/10.5880/pik.2016.004, 2016.
Leakey, A. D.: Rising atmospheric carbon dioxide concentration and the future of C4 crops for food and fuel, P. Roy. Entomol. Soc. B, 276, 2333–2343, https://doi.org/10.1098/rspb.2008.1517, 2009.
Li, T., Hasegawa, T., Yin, X., Zhu, Y., Boote, K., Adam, M., Bregaglio, S., Buis, S., Confalonieri, R., Fumoto, T., Gaydon, D., Marcaida, M., Nakagawa, H., Oriol, P., Ruane, A., Ruget, F., Singh, B., Singh, U., Tang, L., Tao, F., Wilkens, P., Yoshida, H., Zhang, Z., and Bouman, B.: Uncertainties in predicting rice yield by current crop models under a wide range of climatic conditions, Global Change Biol., 21, 1328–1341, https://doi.org/10.1111/gcb.12758, 2015.
Liu, C. and Allan, R. P.: Observed and simulated precipitation responses in wet and dry regions 1850–2100, Environ. Res. Lett., 8, 34002, https://doi.org/10.1088/1748-9326/8/3/034002, 2013.
Lobell, D. B., Schlenker, W., and Costaroberts, J.: Climate Trends and Global Crop Production Since 1980, Science, 333, 616–620, https://doi.org/10.1126/science.1204531, 2011.
Lobell, D. B., Howden, S. M., Smith, D. R., and Chhetri, N.: A meta-analysis of crop yield under climate change and adaptation, Nat. Clim. Change, 4, 287–291, https://doi.org/10.1038/nclimate2153, 2014.
Martre, P., Wallach, D., Asseng, S., Ewert, F., Jones, J. W., Rötter, R. P., Boote, K. J., Ruane, A. C., Thorburn, P. J., Cammarano, D., Hatfield, J. L., Rosenzweig, C., Aggarwal, P. K., Angulo, C., Basso, B., Bertuzzi, P., Biernath, C., Brisson, N., Challinor, A. J., Doltra, J., Gayler, S., Goldberg, R., Grant, R. F., Heng, L., Hooker, J., Hunt, L. A., Ingwersen, J., Izaurralde, R. C., Kersebaum, K. C., Müller, C., Kumar, S. N., Nendel, C., O'leary, G., Olesen, J. E., Osborne, T. M., Palosuo, T., Priesack, E., Ripoche, D., Semenov, M. A., Shcherbak, I., Steduto, P., Stöckle, C. O., Stratonovitch, P., Streck, T., Supit, I., Tao, F., Travasso, M., Waha, K., White, J. W., and Wolf, J.: Multimodel ensembles of wheat growth: many models are better than one, Global Change Biol., 21, 911–925, https://doi.org/10.1111/gcb.12768, 2015.
Mitchell, D., James, R., Forster, P. M., Betts, R. A., Shiogama, H., and Allen, M.: Realizing the impacts of a 1.5 ∘C warmer world, Nat. Clim. Change, 6, 735–737, https://doi.org/10.1038/nclimate3055, 2016.
Mitchell, D., Achuta Rao, K., Allen, M., Bethke, I., Beyerle, U., Ciavarella, A., Forster, P. M., Fuglestvedt, J., Gillett, N., Haustein, K., Ingram, W., Iversen, T., Kharin, V., Klingaman, N., Massey, N., Fischer, E., Schleussner, C.-F., Scinocca, J., Seland, Ø., Shiogama, H., Shuckburgh, E., Sparrow, S., Stone, D., Uhe, P., Wallom, D., Wehner, M., and Zaaboul, R.: Half a degree additional warming, prognosis and projected impacts (HAPPI): background and experimental design, Geosci. Model Dev., 10, 571–583, https://doi.org/10.5194/gmd-10-571-2017, 2017.
Monfreda, C., Ramankutty, N., and Foley, J. A.: Farming the planet: 2. Geographic distribution of crop areas, yields, physiological types, and net primary production in the year 2000, Global Biogeochem. Cy., 22, GB1022, https://doi.org/10.1029/2007GB002947, 2008.
Nelson, G., Valin, H., Sands, R., Havlík, P., Ahammad, H., Deryng, D., Elliott, J., Fujimori, S., Hasegawa, T., Heyhoe, E., Kyle, P., Von Lampe, M., Lotze-Campen, H., Mason d'Croz, D., van Meijl, H., van der Mensbrugghe, D., Müller, C., Popp, A., Robertson, R., Robinson, S., Schmid, E., Schmitz, C., Tabeau, A., and Willenbockel, D.: Climate change effects on agriculture: Economic responses to biophysical shocks, P. Natl. Acad. Sci. USA, 111, 3274–3279, https://doi.org/10.1073/pnas.1222465110, 2014.
Ottman, M. J., Kimball, B. A., White, J. W., and Wall, G. W.: Wheat Growth Response to Increased Temperature from Varied Planting Dates and Supplemental Infrared Heating, Agron. J., 104, 7–16, https://doi.org/10.2134/agronj2011.0212, 2012.
Polley, H. W., Dugas, W. A., Mielnick, P. C., and Johnson, H. B.: C3-C4 composition and prior carbon dioxide treatment regulate the response of grassland carbon and water fluxes to carbon dioxide, Funct. Ecol., 21, 11–18, https://doi.org/10.1111/j.1365-2435.2006.01213.x, 2007.
Porter, J. R., Xie, L., Challinor, A. J., Cochrane, K., Howden, S. M., Iqbal, M. M., Lobell, D. B., and Travasso, M. I.: Food security and food production systems, chap. 7, Cambridge University Press, 2014.
Pugh, T., Müller, C., Arneth, A., Haverd, V., and Smith, B.: Key knowledge and data gaps in modelling the influence of CO2 concentration on the terrestrial carbon sink, J. Plant Physiol., 203, 3–15, https://doi.org/10.1016/j.jplph.2016.05.001, 2016.
Rosenzweig, C., Elliott, J., Deryng, D., Ruane, A., Müller, C., Arneth, A., Boote, K., Folberth, C., Glotter, M., Khabarov, N., Neumann, K., Piontek, F., Pugh, T., Schmid, E., Stehfest, E., Yang, H., and Jones, J.: Assessing agricultural risks of climate change in the 21st century in a global gridded crop model intercomparison, P. Natl Acad. Sci. USA, 111, 3268–3273, https://doi.org/10.1073/pnas.1222463110, 2014.
Sage, R. F. and Kubien, D. S.: The temperature response of C3 and C4 photosynthesis, Plant Cell Environ., 30, 1086–1106, https://doi.org/10.1111/j.1365-3040.2007.01682.x, 2007.
Sage, R. F., Santrucek, J., and Grise, D. J.: Temperature effects on the photosynthetic response of C3 plants to long-term CO2 enrichment, Vegetatio, 121, 67–77, https://doi.org/10.1007/BF00044673, 1995.
Shuai, J., Zhang, Z., Tao, F., and Shi, P.: How ENSO affects maize yields in China: understanding the impact mechanisms using a process – based crop model, Int. J. Climatol., 36, 424–438, https://doi.org/10.1002/joc.4360, 2016.
Tao, F. and Zhang, Z.: Climate change, wheat productivity and water use in the North China Plain: A new super-ensemble-based probabilistic projection, Agr. Forest Meteorol., 170, 146–165, https://doi.org/10.1016/j.agrformet.2011.10.003, 2013a.
Tao, F. and Zhang, Z.: Climate change, high-temperature stress, rice productivity, and water use in Eastern China: a new superensemble-based probabilistic projection, J. Appl. Meteorol. Clim., 52, 531–551, https://doi.org/10.1175/JAMC-D-12-0100.1, 2013b.
Tao, F., Hayashi, Y., Zhang, Z., Sakamoto, T., and Yokozawa, M.: Global warming, rice production, and water use in China: Developing a probabilistic assessment, Agr. Forest Meteorol., 148, 94–110, https://doi.org/10.1016/j.agrformet.2007.09.012, 2008a.
Tao, F., Yokozawa, M., Liu, J., and Zhang, Z.: Climate–crop yield relationships at provincial scales in China and the impacts of recent climate trends, Clim. Res., 38, 83–94, https://doi.org/10.3354/cr00771, 2008b.
Tao, F., Yokozawa, M., and Zhang, Z.: Modelling the impacts of weather and climate variability on crop productivity over a large area: a new process-based model development, optimization, and uncertainties analysis, Agr. Forest Meteorol., 149, 831–850, https://doi.org/10.1016/j.agrformet.2008.11.004, 2009a.
Tao, F., Zhang, Z., Liu, J., and Yokozawa, M.: Modelling the impacts of weather and climate variability on crop productivity over a large area: A new super-ensemble-based probabilistic projection, Agr. Forest Meteorol., 149, 1266–1278, https://doi.org/10.1016/j.agrformet.2009.02.015, 2009b.
Tao, F., Zhang, Z., Zhang, S., Zhu, Z., and Shi, W.: Response of crop yields to climate trends since 1980 in China, Clim. Res., 54, 233–247, https://doi.org/10.3354/cr01131, 2012.
Tao, F., Zhang, Z., Xiao, D., Zhang, S., Rötter, R. P., Shi, W., Liu, Y., Wang, M., Liu, F., and Zhang, H.: Responses of wheat growth and yield to climate change in different climate zones of China, 1981–2009, Agr. Forest Meteorol., 189–190, 91–104, https://doi.org/10.1016/j.agrformet.2014.01.013, 2014.
Tao, F., Zhang, S., Zhang, Z., and Rötter, R. P.: Temporal and spatial changes of maize yield potentials and yield gaps in the past three decades in China, Agr. Ecosyst. Environ., 208, 12–20, https://doi.org/10.1016/j.agee.2015.04.020, 2015.
Tao, F., Rötter, R. P., Palosuo, T., Díaz Ambrona, C. G. H., Mínguez, M. I., Semenov, M. A., Kersebaum, K. C., Nendel, C., Specka, X., and Hoffmann, H.: Contribution of crop model structure, parameters and climate projections to uncertainty in climate change impact assessments, Global Change Biol., 24, 1291–1307, https://doi.org/10.1111/gcb.14019, 2018.
Trnka, M., Rötter, R. P., Ruiz-Ramos, M., Kersebaum, K. C., Olesen, J. E., Zalud, Z., and Semenov, M. A.: Adverse weather conditions for European wheat production will become more frequent with climate change, Nat. Clim. Change, 4, 637–643, https://doi.org/10.1038/nclimate2242, 2014.
UNFCCC: Adoption of the Paris Agreement, United Nations/Framework Convention on Climate Change, 1st Conference of the Parties, United Nations, Paris, 2015.
Vanuytrecht, E., Raes, D., Willems, P., and Geerts, S.: Quantifying field-scale effects of elevated carbon dioxide concentration on crops, Clim. Res., 54, 35–47, https://doi.org/10.3354/cr01096, 2012.
Wahid, A., Gelani, S., Ashraf, M., and Foolad, M. R.: Heat tolerance in plants: An overview, Environ. Exp. Bot., 61, 199–223, https://doi.org/10.1016/j.envexpbot.2007.05.011, 2007.
Wang, P., Zhang, Z., Chen, Y., Wei, X., Feng, B., and Tao, F.: How much yield loss has been caused by extreme temperature stress to the irrigated rice production in China?, Clim. Change, 134, 635–650, https://doi.org/10.1007/s10584-015-1545-5, 2016.
Wheeler, T. and Von Braun, J.: Climate change impacts on global food security, Science, 341, 508–513, https://doi.org/10.1126/science.1239402, 2013.
Zhang, Z., Chen, Y., Wang, C., Wang, P., and Tao, F.: Future extreme temperature and its impact on rice yield in China, Int. J. Climatol., 37,4814–4827, https://doi.org/10.1002/joc.5125, 2017.
Zhang, Z., Liu, X., Wang, P., Shuai, J., Chen, Y., Song, X., and Tao, F.: The heat deficit index depicts the responses of rice yield to climate change in the northeastern three provinces of China, Reg. Environ. Change, 14, 27–38, https://doi.org/10.1007/s10113-013-0479-6, 2014.
Zhao, C., Liu, B., Piao, S., Wang, X., Lobell, D., Huang, Y., Huang, M., Yao, Y., Bassu, S., Ciais, P., Durand, J., Elliott, J., Ewert, F., Janssens, I., Li, T., Lin, E., Liu, Q., Martre, P., Müller, C., Peng, S., Peñuelas, J., Ruane, A., Wallach, D., Wang, T., Wu, D., Liu, Z., Zhu, Y., Zhu, Z., and Asseng, S.: Temperature increase reduces global yields of major crops in four independent estimates, P. Natl. Acad. Sci. USA, 114, 9326–9331, https://doi.org/10.1073/pnas.1701762114, 2017.
Zhu, X., Long, S. P., and Ort, D. R.: What is the maximum efficiency with which photosynthesis can convert solar energy into biomass?, Curr. Opin. Biotech., 19, 153–159, https://doi.org/10.1016/j.copbio.2008.02.004, 2008.