the Creative Commons Attribution 4.0 License.
the Creative Commons Attribution 4.0 License.
 | 27 Apr 2018
Projections of East Asian summer monsoon change at global warming of 1.5 and 2 °C
Jiawei Liu
Haiming Xu
Jiechun Deng
Much research is needed regarding the two long-term warming targets of the 2015 Paris Agreement, i.e., 1.5 and 2 ∘C above pre-industrial levels, especially from a regional perspective. The East Asian summer monsoon (EASM) intensity change and associated precipitation change under both warming targets are explored in this study. The multimodel ensemble mean projections by 19 CMIP5 models show small increases in EASM intensity and general increases in summer precipitation at 1.5 and 2 ∘C warming, but with large multimodel standard deviations. Thus, a novel multimodel ensemble pattern regression (EPR) method is applied to give more reliable projections based on the concept of emergent constraints, which is effective at tightening the range of multimodel diversity and harmonize the changes of different variables over the EASM region. Future changes projected by using the EPR method suggest decreased precipitation over the Meiyu belt and increased precipitation over the high latitudes of East Asia and Central China, together with a considerable weakening of EASM intensity. Furthermore, reduced precipitation appears over 30–40∘ N of East Asia in June and over the Meiyu belt in July, with enhanced precipitation at their north and south sides. These changes in early summer are attributed to a southeastward retreat of the western North Pacific subtropical high (WNPSH) and a southward shift of the East Asian subtropical jet (EASJ), which weaken the moisture transport via southerly wind at low levels and alter vertical motions over the EASM region. In August, precipitation would increase over the high latitudes of East Asia with more moisture from the wetter area over the ocean in the east and decrease over Japan with westward extension of WNPSH. These monthly precipitation changes would finally contribute to a tripolar pattern of EASM precipitation change at 1.5 and 2 ∘C warming. Corrected EASM intensity exhibits a slight difference between 1.5 and 2 ∘C, but a pronounced moisture increase during extra 0.5 ∘C leads to enhanced EASM precipitation over large areas in East Asia at 2 ∘C warming.
- Article
(1517 KB) - Full-text XML
- BibTeX
- EndNote


The East Asian summer monsoon (EASM) is one of the most important climate systems, which provides a large amount of summer rainfall to densely populated areas in East Asia. Variation of the EASM exerts great influence on flooding, drought and agricultural harvest, and thus has close relationships with livelihoods of billions of people in countries including China, Japan and South Korea (Huang et al., 2012). As global warming is ongoing, much attention has been paid to the EASM change in a warmer climate (e.g., Chen and Sun, 2013; Seo et al., 2013).
To limit anthropogenic influence on climate systems, the 2015 Paris Agreement under the United Nations Framework Convention on Climate Change (UNFCCC) includes two long-term global temperature goals, i.e., “holding the increase in the global average temperature to well below 2 ∘C above pre-industrial levels and pursuing efforts to limit the temperature increase to 1.5 ∘C” (UNFCCC, 2015). While a world of 2 ∘C warming is inadequate to be considered safe (SED, 2015), there is a lack of scientific research regarding the 1.5 ∘C target, especially for regional climates (Mitchell et al., 2016). Studies generally evaluated differences of global climate impacts at global warming of 1.5 and 2 ∘C levels (Schleussner et al., 2016; Sanderson et al., 2017). No clear pictures, however, are presented for the EASM under both scenarios.
Many studies projected EASM intensity and precipitation for different time periods in the 21st century (e.g., Chen and Sun, 2013; Seo et al., 2013). For the near future (2016–2035), projections suggest EASM precipitation amount and intensity have statistically significant increases over most regions of East Asia (Chen and Sun, 2013). By the end of the 21st century, a much more obvious increase in precipitation is projected, although some pattern differences exist under different Representative Concentration Pathway scenarios (RCPs; Chen and Sun, 2013; Seo et al., 2013). In spite of a general increase in summer precipitation over East Asia in these projections, summer monsoon would only slightly strengthen due to increased zonal and meridional land–sea thermal contrasts over the 21st century (Jiang and Tian, 2013). For specific global warming targets, most attention was paid to the projections of climate extremes, including heat waves and precipitation extremes over China (Guo et al., 2016, 2017).
Although most projections of EASM change are based on coupled ocean–atmosphere general circulation models (CGCMs) from the Intergovernmental Panel on Climate Change (IPCC) Coupled Model Intercomparison Project, Phase 5 (CMIP5; e.g., Chen and Sun, 2013; Seo et al., 2013), significant inter-model spreads exist in these simulations (Huang et al., 2013; Chen and Bordoni, 2014). Similarly, projections of some climate systems, which are highly related to the EASM variability, have severe uncertainty. The East Asian subtropical jet (EASJ) stream, which induces warm advection and leads to upward moisture transport, has a close relationship with the EASM rainfall (Sampe and Xie, 2010; Kosaka et al., 2011). Thus, future position of rain belt may become much more uncertain due to the meridional position biases of EASJ in CGCMs (Ma et al., 2015). On the other hand, the western North Pacific subtropical high (WNPSH) also shows a great diversity in CMIP5 simulations (He and Zhou, 2015). The WNPSH transports moisture via southerly wind on its western flank and anchors the rain belt on its northwestern periphery (Zhou and Yu, 2005).
The multimodel ensemble mean (MMM) method and model weighting method are commonly applied to improve the reliability of climate model projections. However, these methods have problems with common background bias among ensemble members (e.g., Li and Xie, 2014; Wang et al., 2014; Huang and Ying, 2015; Li et al., 2016), leading to biases in MMM change and limiting the reliability of future projections (e.g., Boé et al., 2009; Cox et al., 2013). Another method based on the concept of emergent constraints is used in future climate projections to reduce uncertainties (e.g., Boé et al., 2009; Räisänen et al., 2010; Abe et al., 2011; Bracegirdle and Stephenson, 2012; Cox et al., 2013; Huang and Ying, 2015; Li et al., 2016). This method detects relationship between inter-model similarity in the observed climate and that in the simulated future climate change. Calibrations by this “present–future” relationship can efficiently constrain the simulated climate change to a narrower range (Boé et al., 2009; Bracegirdle and Stephenson, 2012; Huang and Ying, 2015; Li et al., 2016).
In this study, we investigate the EASM change at levels of 1.5 and 2 ∘C global mean surface air temperature (GMST) increases above pre-industrial levels (henceforth 1.5 and 2 ∘C warming), using state-of-the-art CGCM outputs from the IPCC CMIP5. The influences of biases related to EASJ and WNPSH on EASM precipitation change are examined first. Then, projections of EASM intensity and precipitation at 1.5 and 2 ∘C warming are given using a novel emergent constraints correction method. The rest of the paper is organized as follows. In Sect. 2, we describe datasets and methods. The inter-model spread is examined in Sect. 3. We present major results of corrected EASM changes in Sect. 4. A summary and discussion are given in Sect. 5.
2.1 Data
In this study, 43 available CMIP5 CGCMs are first examined in terms of their performance in EASM precipitation simulation for the reference period of 1986–2005. With the skill score S (Taylor, 2001) of precipitation over the EASM region (100–150∘ E, 20–50∘ N) greater than 0.75, 19 CMIP5 CGCMs are selected for further analyses, including their conventional variables in historical and RCP4.5 (a medium emission scenario) runs (Taylor et al., 2012). A brief summary of the models is given in Table 1. For both historical and RCP4.5 runs, monthly data from first ensemble member (r1i1p1) are used in our analyses. Due to intrinsic errors of simulated 500 hPa geopotential height in the RCP4.5 runs of five models, only 14 models are used in geopotential height analysis. Precipitation from the Global Precipitation Climatology Project (GPCP; Adler et al., 2003), sea surface temperature (SST) from Hadley Centre Sea Ice and Sea Surface Temperature (HadISST1.1; Rayner et al., 2003) dataset and several variables from the ECMWF ERA-Interim reanalysis (Dee et al., 2011) for the reference period are also used in this study. All datasets from observations and models are interpolated to 1∘ × 1∘ grid first.
2.2 Methods
Periods of 1.5 and 2 ∘C GMST increase above pre-industrial levels are defined as 20-year time slices relative to the reference period (Table 1). As the reference period is 0.61 ∘C warmer than pre-industrial levels of 1850–1900 (IPCC, 2014), 1.5 and 2 ∘C warmings translate to 0.89 and 1.39 ∘C above the reference period levels, respectively, following Schleussner et al. (2016).
Several indexes have been designed to measure the strength of the EASM. According to the assessment of Wang et al. (2008), the shear vorticity index defined by Wang and Fan (1999) is best correlated with the leading principle component (PC) of EASM multivariate empirical orthogonal function (EOF) analysis of a set of six meteorological fields (the correlation coefficient is −0.97). Therefore, to measure the EASM intensity change, we adopt the negative of the Wang and Fan (1999) index (WFN):
Following the recommendation of He et al. (2015), 500 hPa eddy geopotential height (He) is used to measure the WNPSH in warming climate rather than traditionally used geopotential height. He is defined as the deviation of geopotential height from the regional average over 0–40∘ N globally and the He = 0 contour represents the boundary of WNPSH. Because of the increase in 500 hPa geopotential height over all of East Asia and western North Pacific, the East Asian summer rain belt does not follow the traditional indicator, the 5880 m contour of 500 hPa geopotential height over the western North Pacific (He et al., 2015). A more suitable indicator, He, was thus designed (He et al., 2015) to solve this problem.
The multimodel ensemble pattern regression (EPR) method proposed by Huang and Ying (2015) is used to correct biases of future precipitation change in individual models and MMM. A brief introduction to this method is provided here. Future change (Ci) is defined as the difference of future climatology (Fi) and historical climatology (Hi) in model i, i.e., . The future change (Ci) can be decomposed into the real change (Creal), common change bias ( = − Creal, where N is the number of models) and individual change bias ( = Ci − ), respectively, as follows,
Although it is impossible to get Creal, we can close in on it by reducing the bias. And that is what this method tries to do.
Similarly, the historical climatology (Hi) can be decomposed into the observed climate (Hobs), common historical bias ( = − Hobs) and individual historical bias ( = Hi − ), respectively, as below,
Then, spatially correlated modes between the historical and future change biases are explored by using the inter-model diversity in and from all the models. To be specific, the EOF analysis is performed on , and spatially orthogonal modes EOj with corresponding PCij, where j = 1, …, M (M is the number of EOF modes) are obtained. Here, M equals 12 or 16 for different variables, which is adequate to represent and . The present–future relationship is established through a multivariant linear regression analysis of PCs and . Thus, can be estimated as follows:
where denotes regression patterns.
can be further projected onto EOFj:
where ej denotes expansion coefficients.
Substituting ej into Eq. (4), an estimation of can be expressed by
Thus, the corrected MMM change can be estimated as = − , where = . Thus, can represent Creal more reasonably than . Similarly, individual model changes can also be corrected.
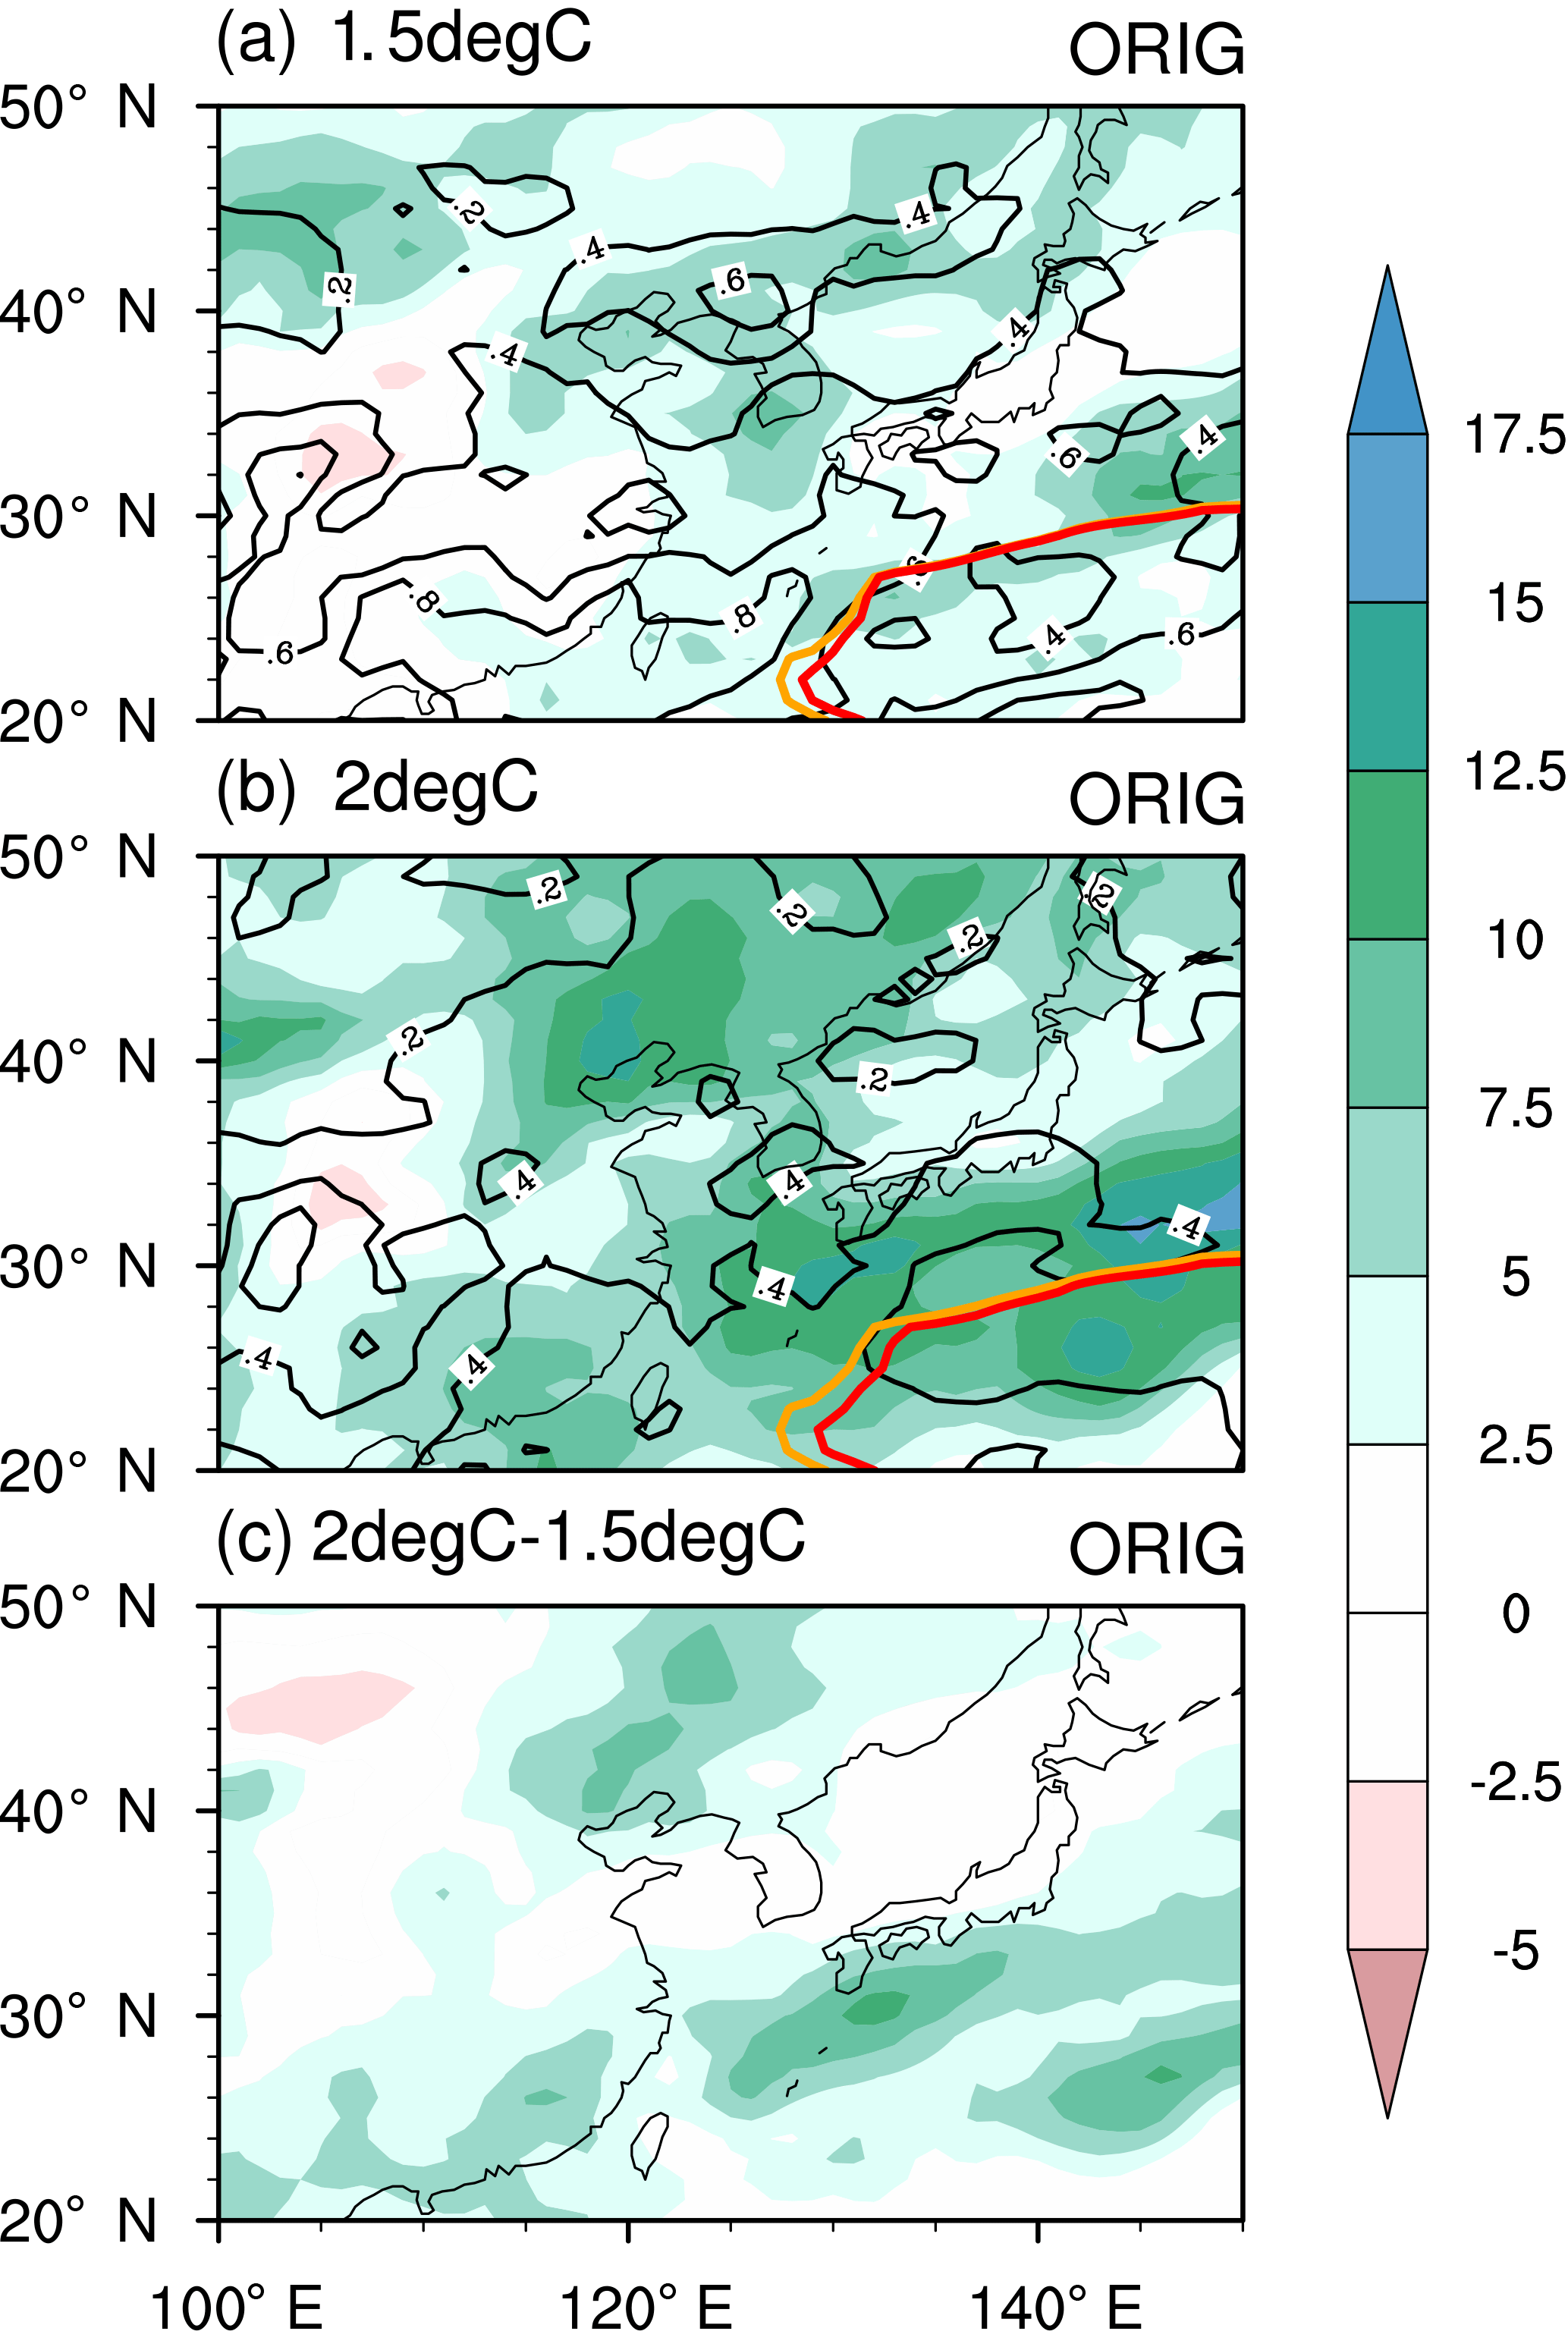
Figure 1MMM-projected summer precipitation change in percentage (shading; in percent) and multimodel precipitation change standard deviation (mm day−1; black contours) per degree of GMST increase at (a) 1.5 ∘C and (b) 2 ∘C warming relative to the reference period. (c) Difference of (a) and (b). Thick orange curves denote WNPSH boundaries for the reference period, and thick red curves denote MMM-projected WNPSH boundaries at (a) 1.5 ∘C and (b) 2 ∘C warming.
Although the periods of 1.5 and 2 ∘C warming projected are not far away from present (Table 1), a general increase in summer precipitation appears over the EASM region for both warming targets (Fig. 1a and b), consistent with previous findings. Prominent increase is mainly located over the high latitudes (∼ 40∘ N) covering northeast China and the Korean Peninsula and the low latitudes (∼ 25∘ N) covering southeast China and the western North Pacific. The spatial pattern of precipitation change at 2 ∘C warming is similar to that at 1.5 ∘C, with a larger enhancement for the 2 ∘C warming (Fig. 1). Considering that the precipitation changes range from −2.69 to 4.53 mm day−1 and from −1.31 to 2.00 mm day−1 per degree of GMST increase for 1.5 and 2 ∘C warming, the multi-model standard deviation ranges from 0.4 to larger than 1.2 mm day−1 per degree of GMST increase over areas of major precipitation increase (Fig. 1a and b), indicative of a large uncertainty in EASM precipitation projection. Figure 2 displays changes in EASM intensity by the 19 individual CMIP5 models and their MMM, measured by the WFN index. Changes in the WFN index for individual models vary from below −2 to above 2, representing significant weakening and strengthening of EASM intensity. Thus, the MMM EASM intensity shows a slight change, which is consistent with Jiang and Tian (2013).
The inter-model variability of summer-mean 200 hPa zonal wind climatology is examined at 1.5 ∘C warming over the EASM region by performing an inter-model EOF analysis of the 19 CMIP5 CGCMs. The first inter-model EOF mode of 200 hPa zonal wind, explaining 59.8 % of the total inter-model variability, shows opposite signs to the north and south of ∼ 37∘ N over East Asia, which captures the uncertainty in meridional position of EASJ (Fig. 3a). Positive and negative values of the first inter-model PC (PC1) indicate northward and southward shifts of EASJ meridional position, respectively (Fig. 3b). Meridional displacement of the EASJ manifests as one of the most dominant modes of upper-tropospheric zonal and meridional wind anomalies along the Asian subtropical jet in summer (Hong and Lu, 2016). This uncertainty may be inherited from meridional position biases of EASJ in the historical runs (Ma et al., 2015).
To further investigate the influence of EASJ meridional position uncertainty on the summer precipitation change at 1.5 ∘C warming, we use composite anomalies of precipitation change due to the northward- (Fig. 4a; six models; PC1 in Fig. 3b larger than 100) and southward-shifted (Fig. 4b; six models; PC1 in Fig. 3b smaller than −70) EASJ relative to their MMM, and their differences (Fig. 4c). When the EASJ is northward shifted (Fig. 4a), a positive anomaly of precipitation change occurs over the midlatitudes (30–40∘ N) of China and a negative anomaly of precipitation change occurs over 20–25∘ N of the western North Pacific. On the other hand, a negative anomaly is over 20–40∘ N in China due to the southward shift of EASJ (Fig. 4b). The opposite precipitation changes in EASJ northward- and southward-shifted conditions lead to a statistically significant difference over 20–40∘ N in China (Fig. 4c). Similar results are found under 2 ∘C warming (not shown). These results indicate that the meridional shift of EASJ exerts a great influence on the projected EASM precipitation change at both warming targets.
Table 1Summary of 19 CMIP5 models used in this study and the time periods for 1.5 and 2 ∘C warming above pre-industrial levels.
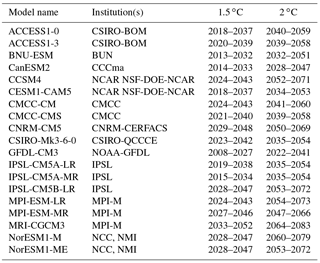
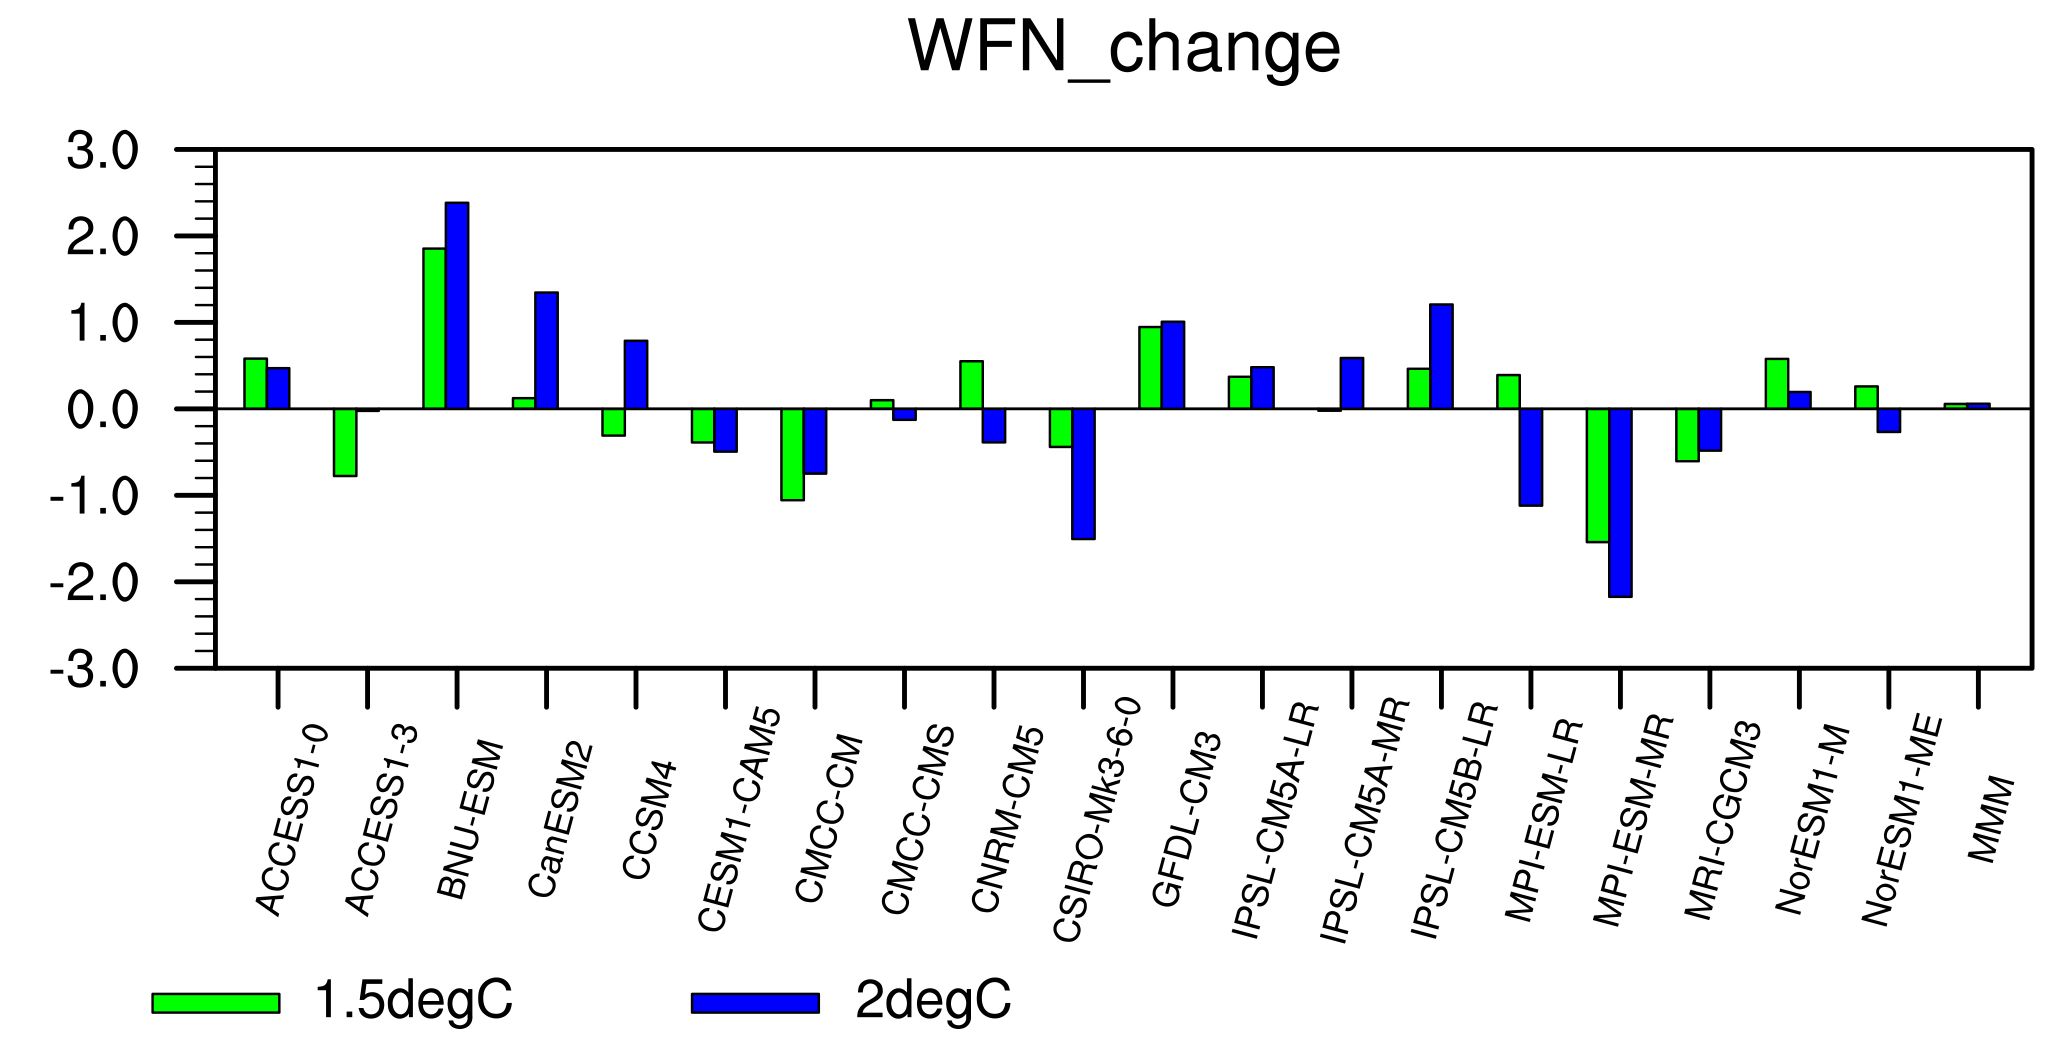
Figure 2WFN index change in 19 individual CMIP5 models listed in Table 1, and MMM at 1.5 ∘C (green bars) and 2 ∘C (blue bars) warming relative to the reference period.
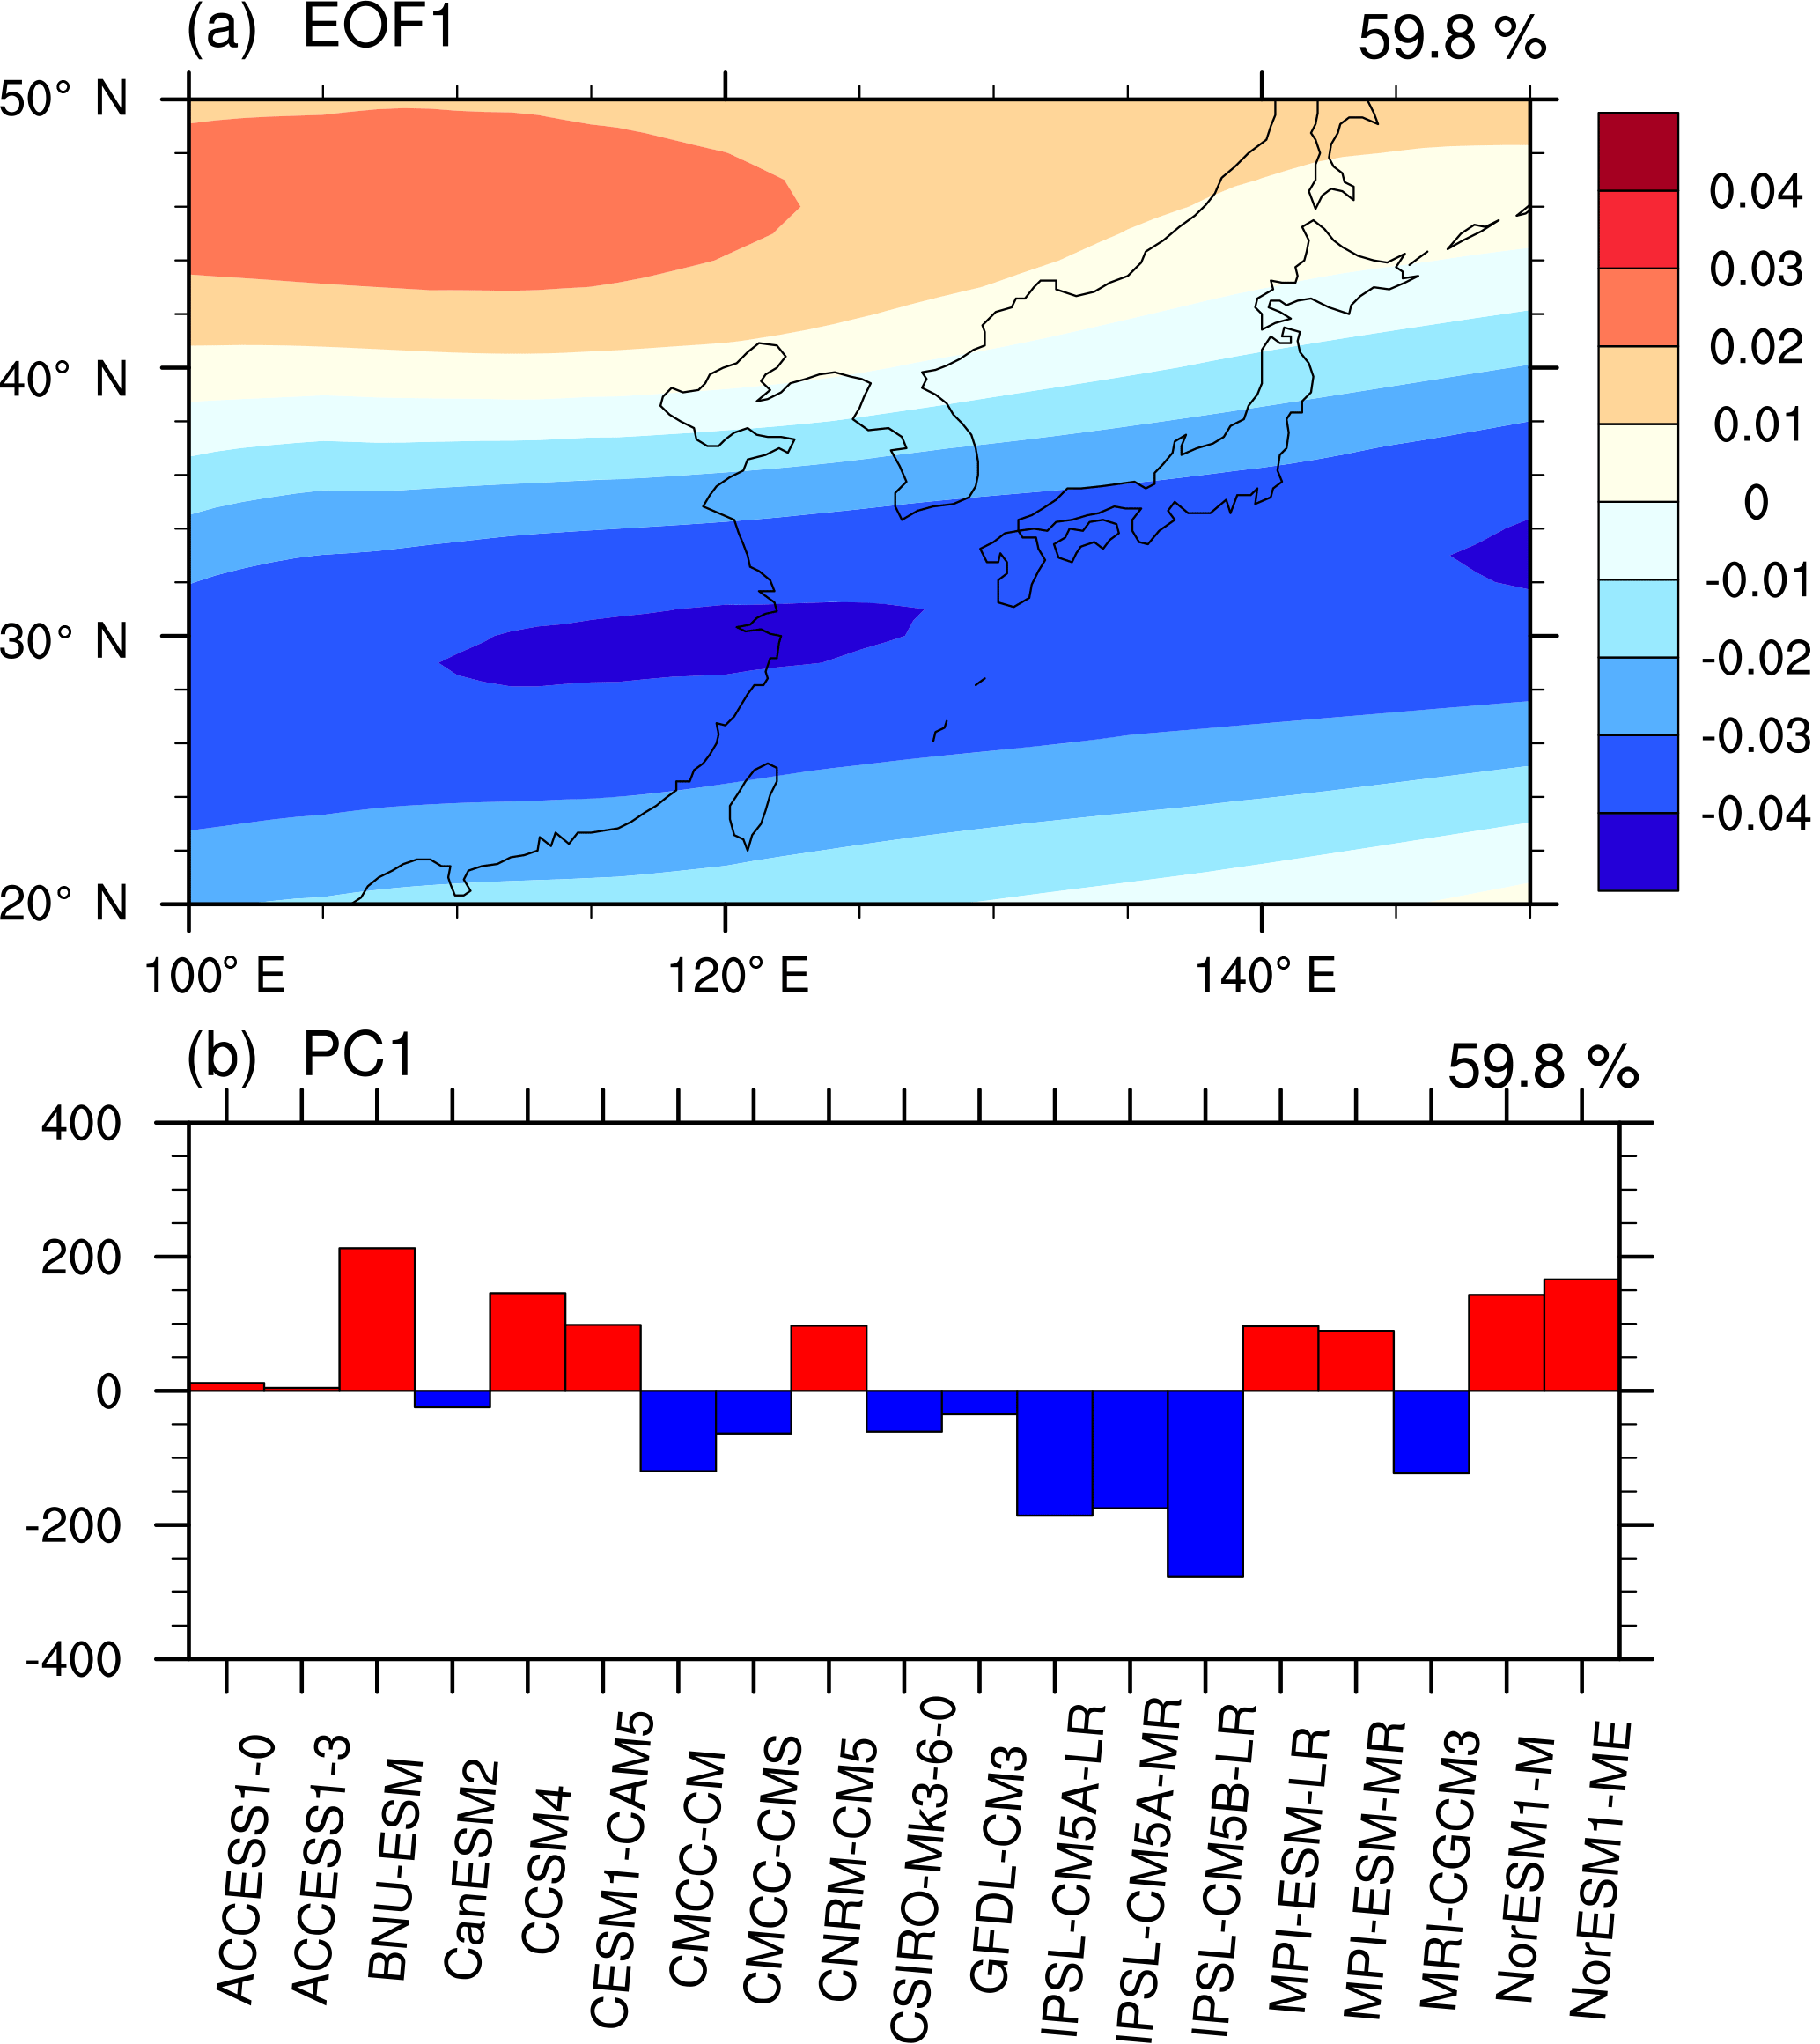
Figure 3(a) First mode of inter-model EOF analysis (EOF1) of 200 hPa zonal wind (19 models) over EASM region (100–150∘ E, 20–50∘ N) at 1.5 ∘C warming. (b) Corresponding inter-model principal component (PC1) of each model.
Figure 5 shows a similar inter-model EOF analysis of 500 hPa He climatology for the 14 CMIP5 CGCMs at 1.5 ∘C warming. The first inter-model EOF mode (Fig. 5a), explaining 56.7 % of the total He variability, suggests that the WNPSH also exhibits major uncertainty in its meridional position, shown as opposite variations to the north and south of ∼ 20∘ N over the western North Pacific. Positive and negative values of PC1 (Fig. 5b) represent the southward and northward shifts of the WNPSH boundary, respectively. Figure 6 depicts composite anomalies of precipitation change under southward- (Fig. 6a; five models; PC1 in Fig. 5b larger than 300) and northward-shifted (Fig. 6b; five models; PC1 in Fig. 5b smaller than −300) WNPSH conditions, respectively, relative to their MMM; their difference is given in Fig. 6c. When the WNPSH is southward shifted (Fig. 6a), the southwest–northeast-oriented positive precipitation anomaly lies over the western North Pacific and the negative anomaly appears over 35–45∘ N in China. The opposite anomalies can be found under the northward shift of WNPSH conditions (Fig. 6b), leading to significant differences from those under southward-shifted conditions (Fig. 6c). Similar results are found at 2 ∘C warming (not shown). In the literature, much attention has been paid to the change of WNPSH under ongoing global warming, but projections based on model outputs are inconclusive (Liu et al., 2014; He and Zhou, 2015; He et al., 2015). Thus, the inter-model uncertainty shown here confirms the difficulty in projecting the WNPSH.
In general, considerable uncertainty exists in projections of EASM intensity, precipitation and major climate systems at 1.5 and 2 ∘C warming. To get more reliable projections, a more effective correction method is needed beyond the traditional methods.
Table 2Parameters and the EASM region mean inter-model standard deviation (MISD) per degree of GMST increase for each variable being corrected. (N: number of models; M: number of EOF modes; Pre: precipitation; Zg500: 500 hPa geopotential height; U850 and V850: zonal and meridional 850 hPa wind, respectively; Hus850: 850 hPa specific humidity; , and Wap: meridional sections of zonal, meridional and vertical wind averaged from 115 to 120∘ E, respectively; org: original data; cor: corrected data).
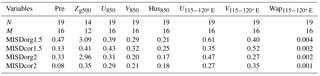

Figure 4Composites of precipitation anomalies (shading; mm day−1) for EASJ (a) northward (six models; PC1 in Fig. 3b larger than 100) and (b) southward (six models; PC1 in Fig. 3b smaller than −70) conditions relative to MMM precipitation change at 1.5 ∘C warming. (c) Difference of (a) and (b). Stippling indicates significance at 95 % confidence level.
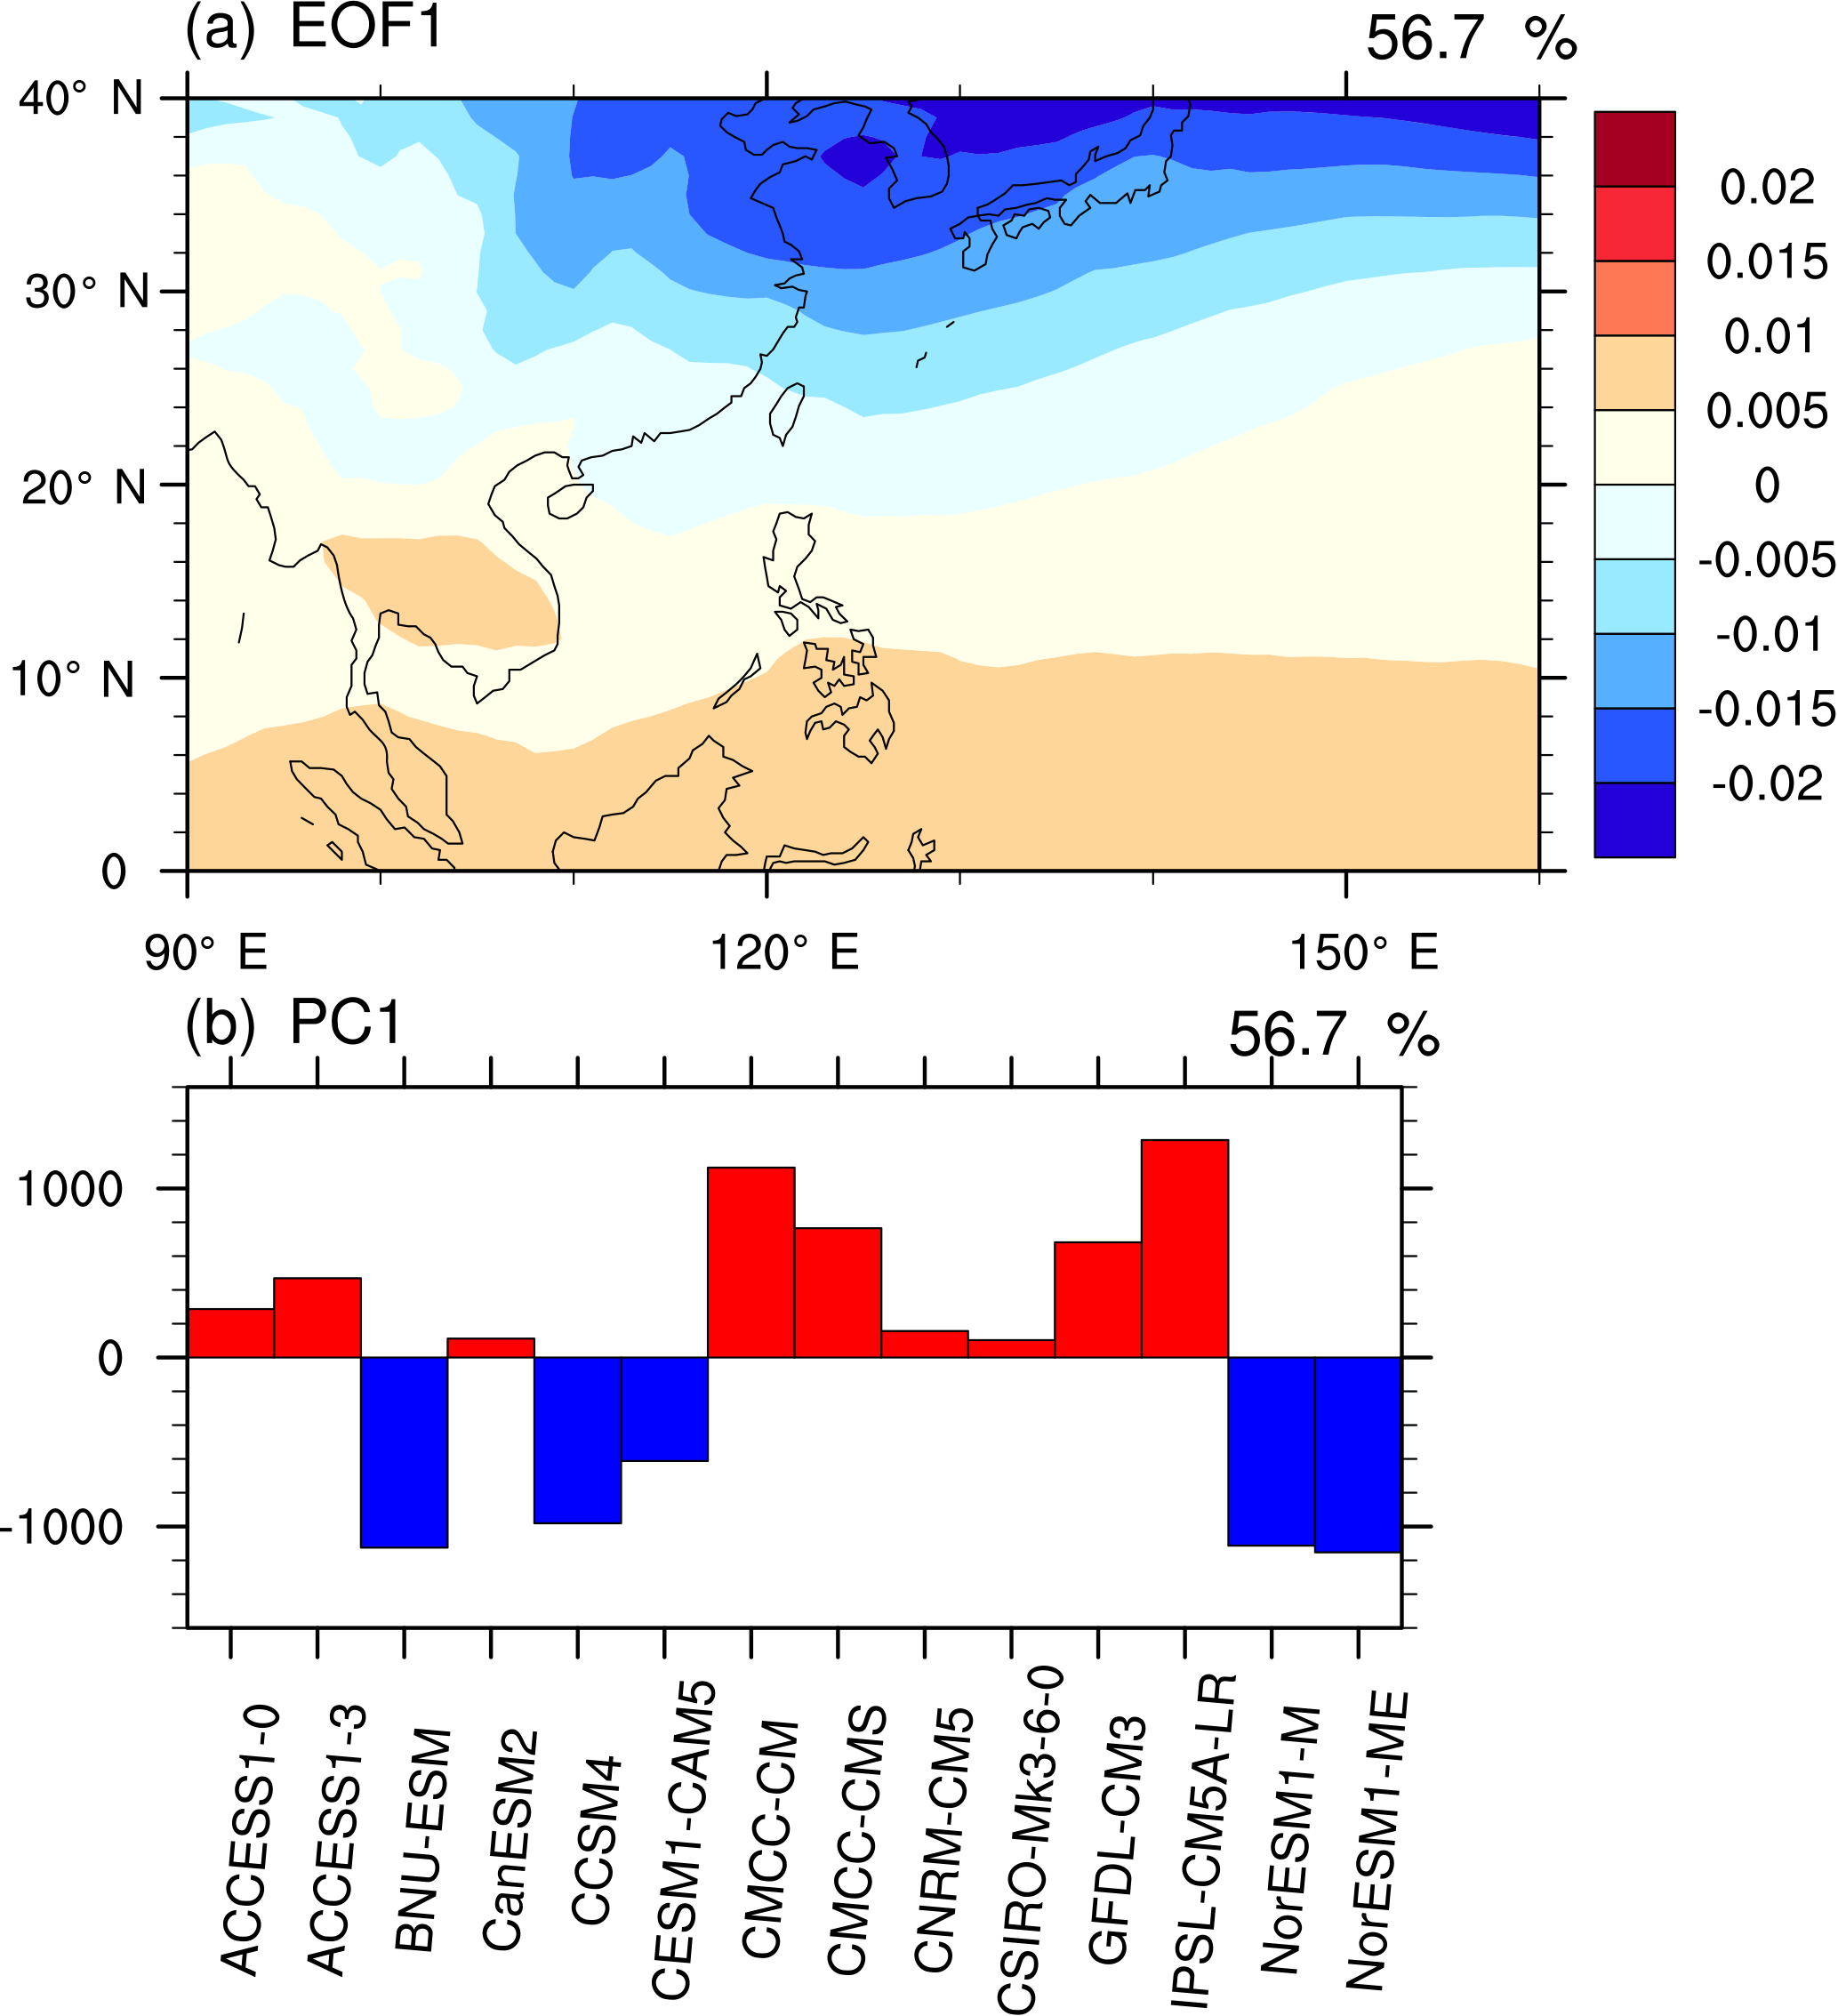
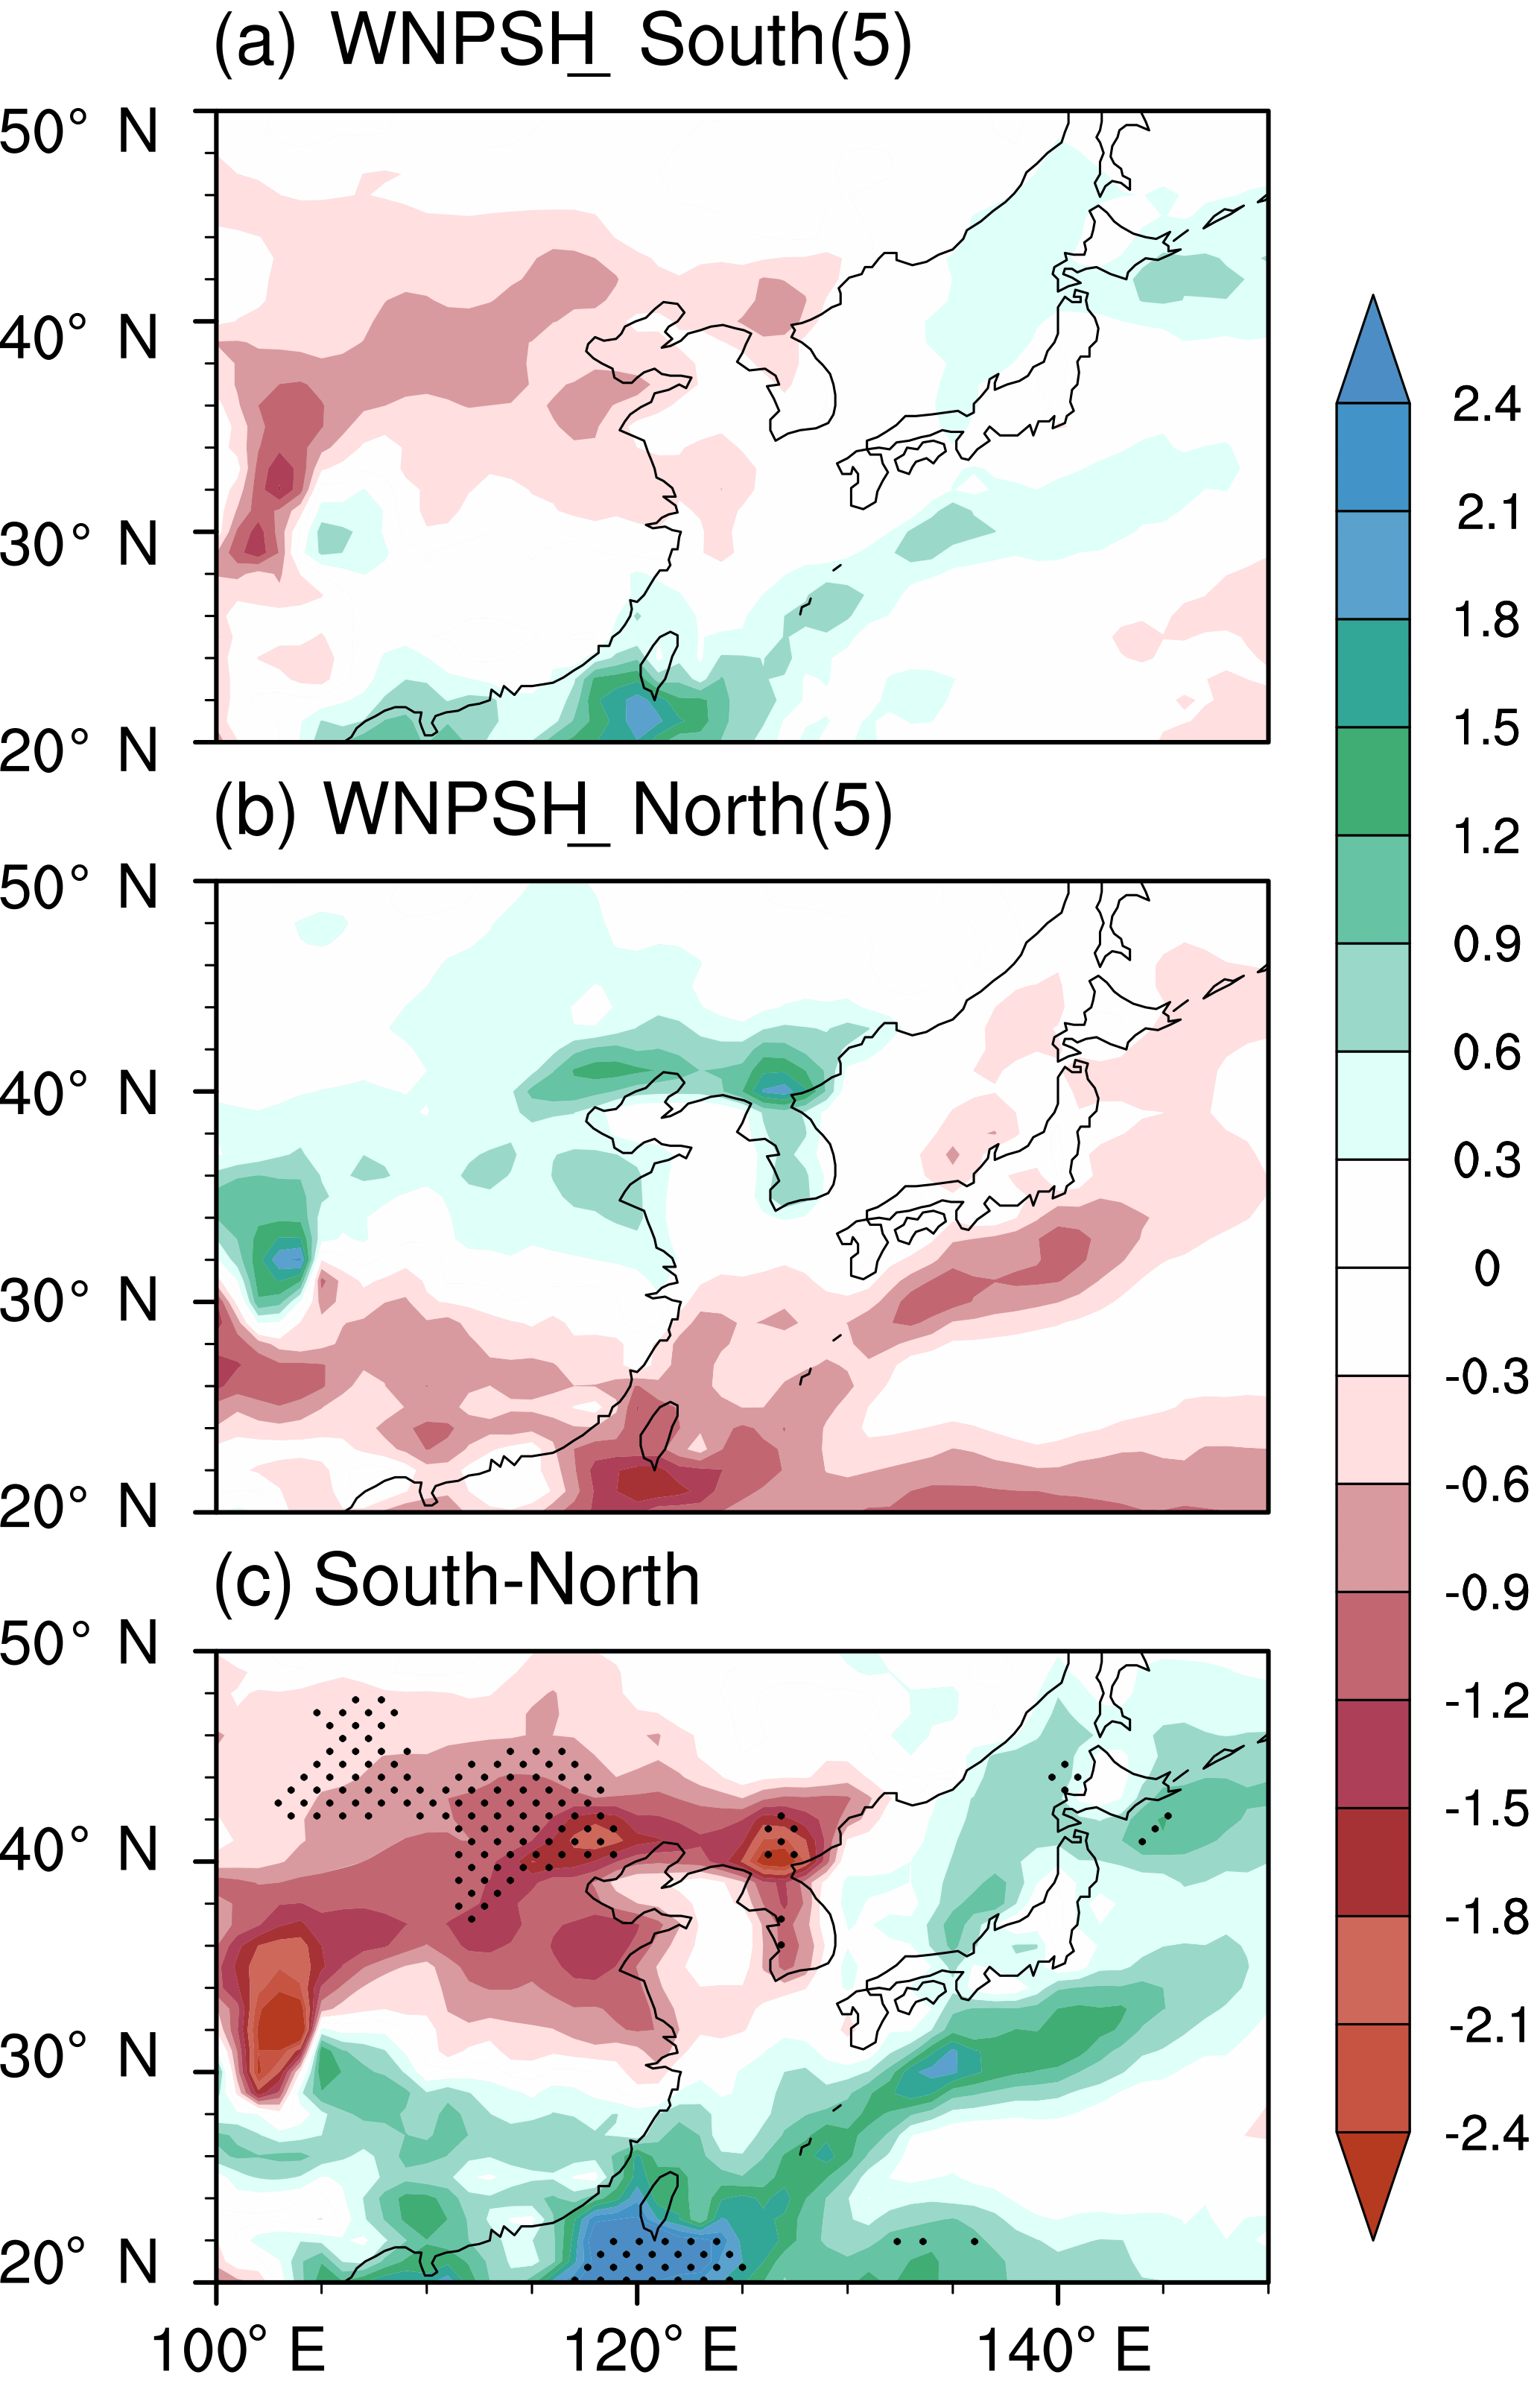
Figure 6Same as Fig. 4, except for WNPSH (a) southward (five models; PC1 in Fig. 5b larger than 300) and (b) northward (five models; PC1 in Fig. 5b smaller than −300) conditions.
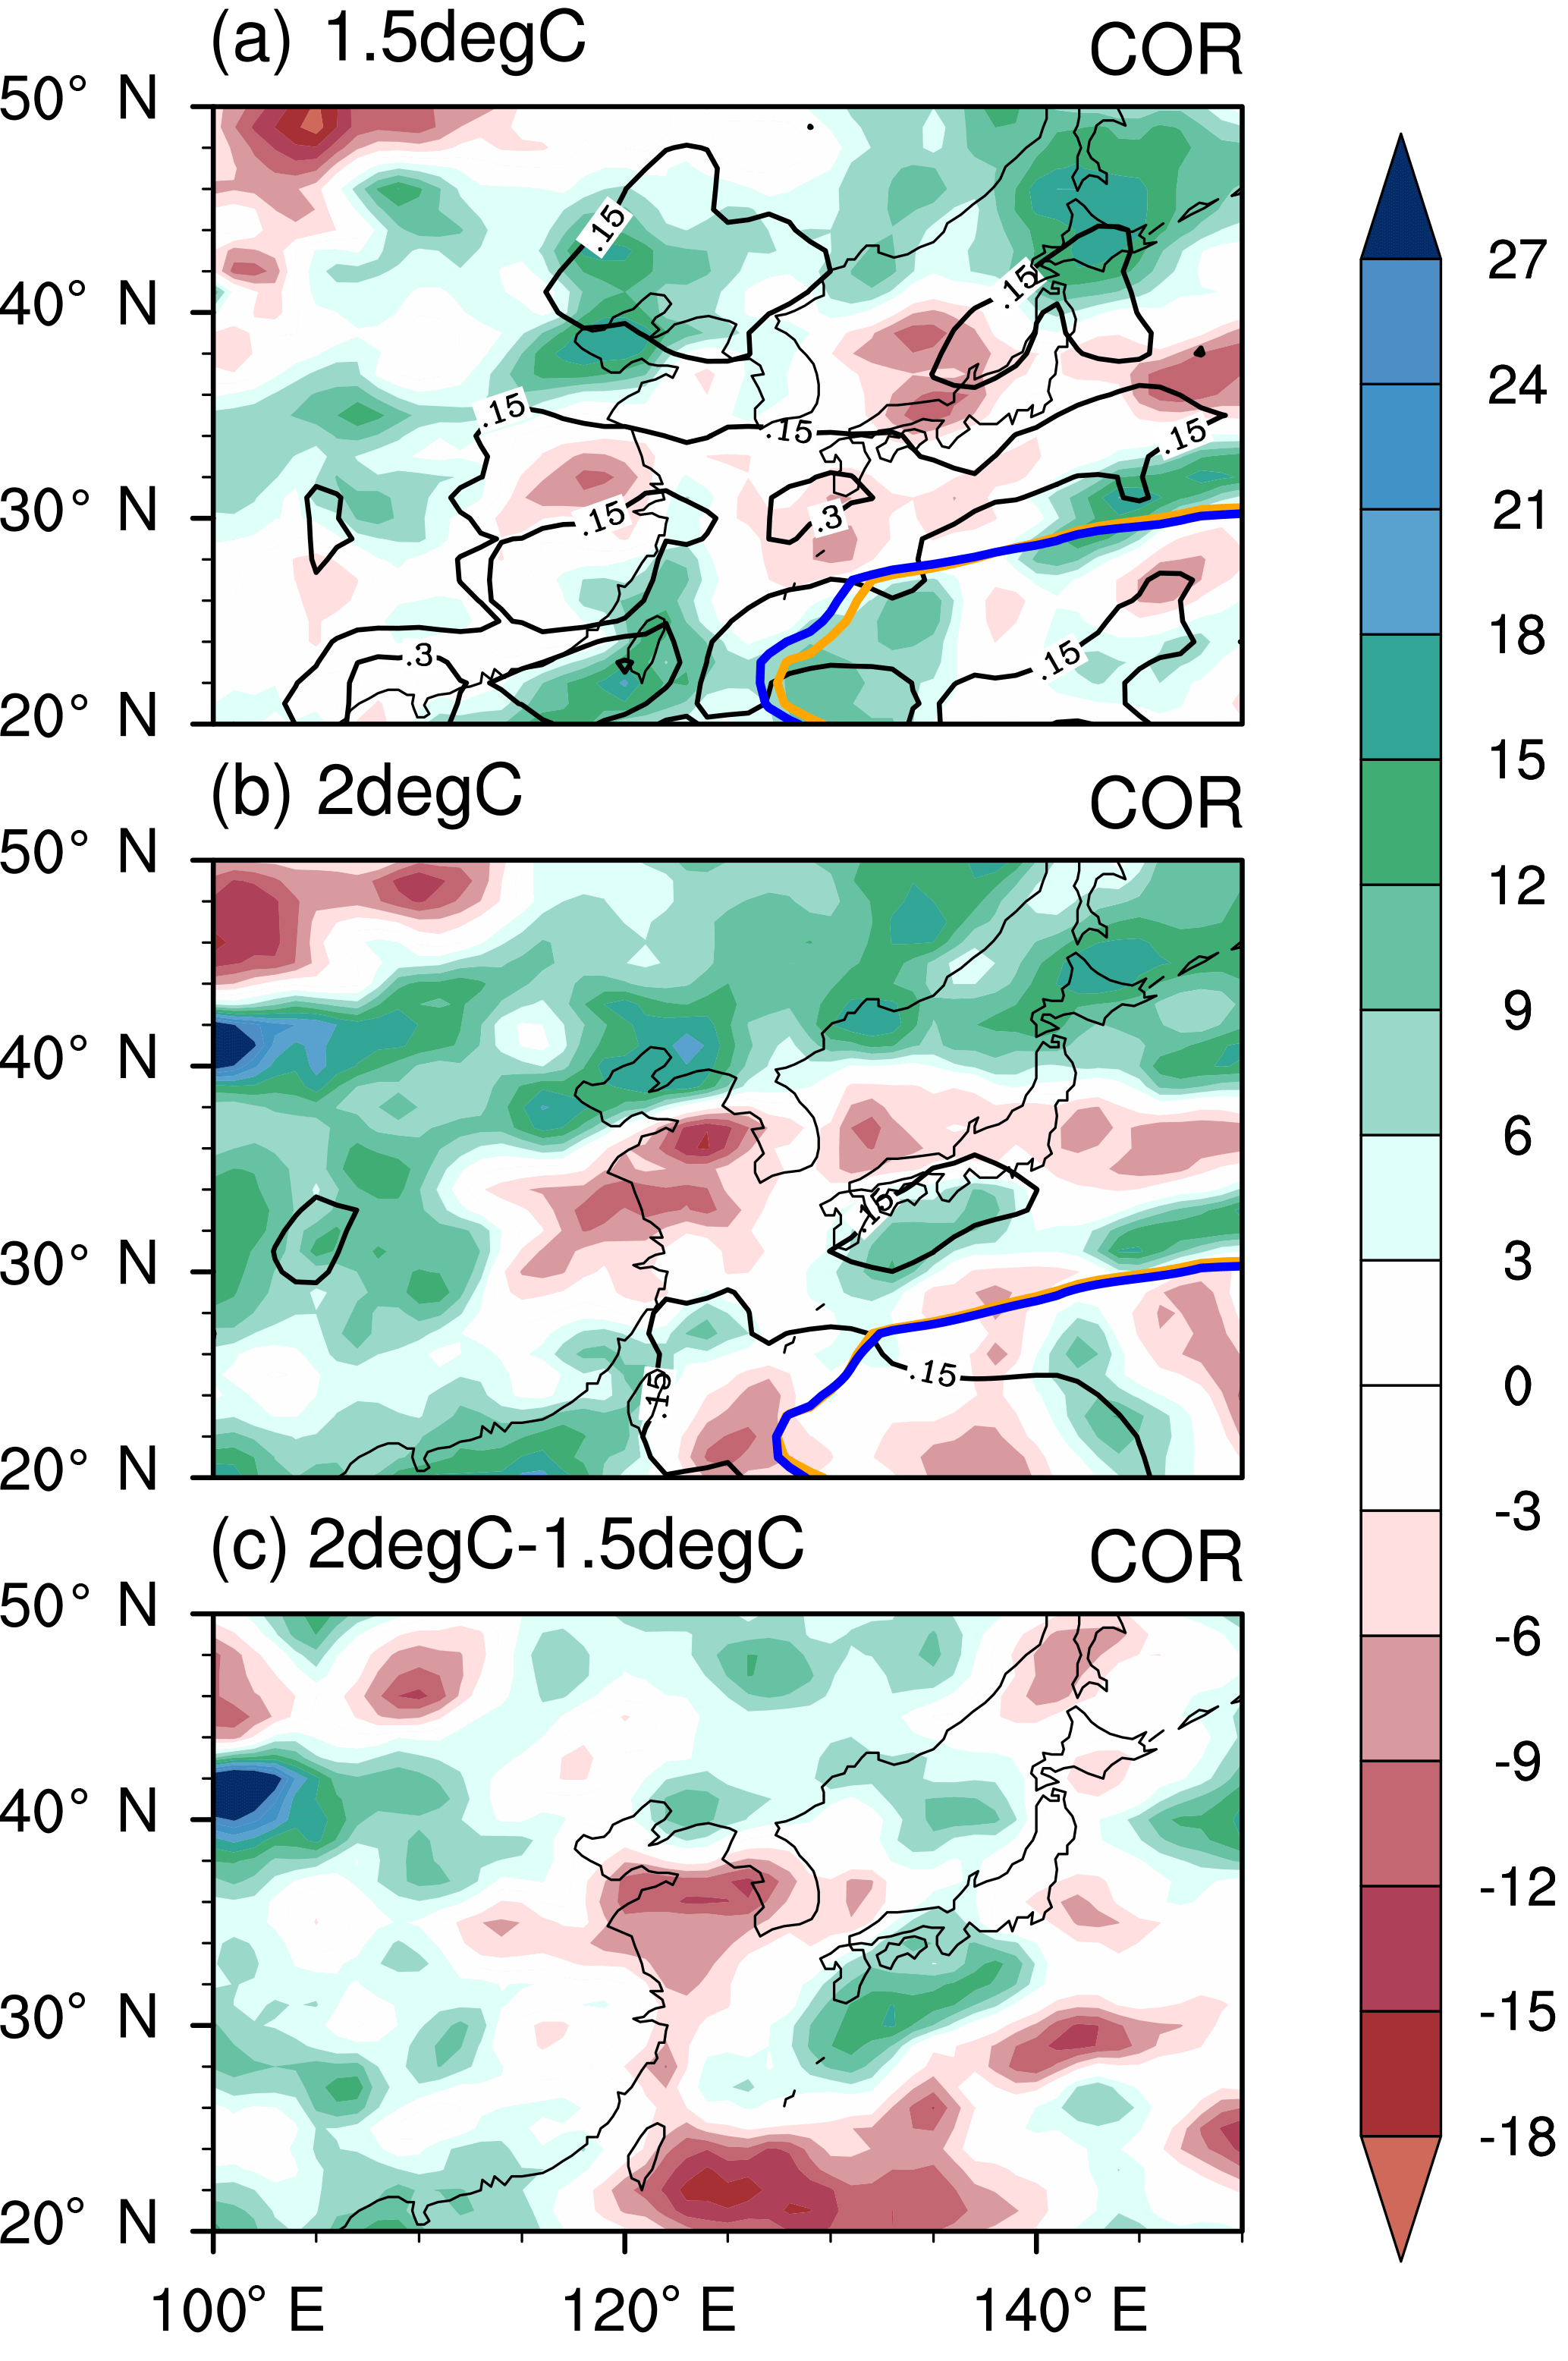
Figure 7Same as Fig. 1, except for corrected MMM precipitation change percentage (shading; in percent). Blue contours denote corrected MMM-projected WNPSH boundaries.
Figure 7 illustrates the precipitation change improved by the EPR method (Huang and Ying, 2015). The multimodel standard deviation of precipitation decreases dramatically below 0.30 and 0.15 mm day−1 per degree of GMST increase over most of the EASM region at 1.5 and 2 ∘C warming, respectively (Fig. 7a and b), indicative of improved similarity and reliability in projections. Table 2 shows original and corrected EASM region mean inter-model standard deviation per degree of GMST increase for each variable. It is found that the mean inter-model standard deviation is reduced largely when the original inter-model standard deviation is relatively large, such as precipitation, 500 hPa geopotential height and zonal wind averaged from 115 to 120∘ E. The mean inter-model standard deviation changes slightly when the original inter-model standard deviation is relatively small. Generally, the EPR method works well over the EASM region. Major improvements of precipitation change are located over the Meiyu belt covering eastern China, the Korean Peninsula and Japan. After the corrections, increased precipitation over the Meiyu belt shows an obvious negative change at 1.5 ∘C warming (Fig. 7a), and a stronger reduction is revealed at 2 ∘C warming (Fig. 7b). Meanwhile, the increase in precipitation is larger in the high latitudes of East Asia and central China (Fig. 7a and b). While the uniform increase pattern of precipitation before corrections is similar to that in the MMM for the near future, the corrected change pattern is in accordance with the result of the six best-performing models in the study of Chen and Sun (2013). These changes suggest that some wet areas (e.g., the Meiyu belt) may face more droughts and some arid and semi-arid areas (e.g., the high latitudes of East Asia and central China) may get wetter, which may bring about various challenges.
Uncorrected projections show a slight change in MMM EASM intensity at both 1.5 and 2 ∘C warming, which is consistent with previous studies (e.g., Jiang and Tian, 2013). Figure 8 shows monthly changes in MMM WFN index using the corrected data. The EASM intensity displays a considerable weakening at both 1.5 and 2 ∘C warming in June, July and August. This change could lead to weaker moisture transport by the southerly wind over East Asia (Fig. 10) and thus impact the spatial pattern of precipitation change (Fig. 7).
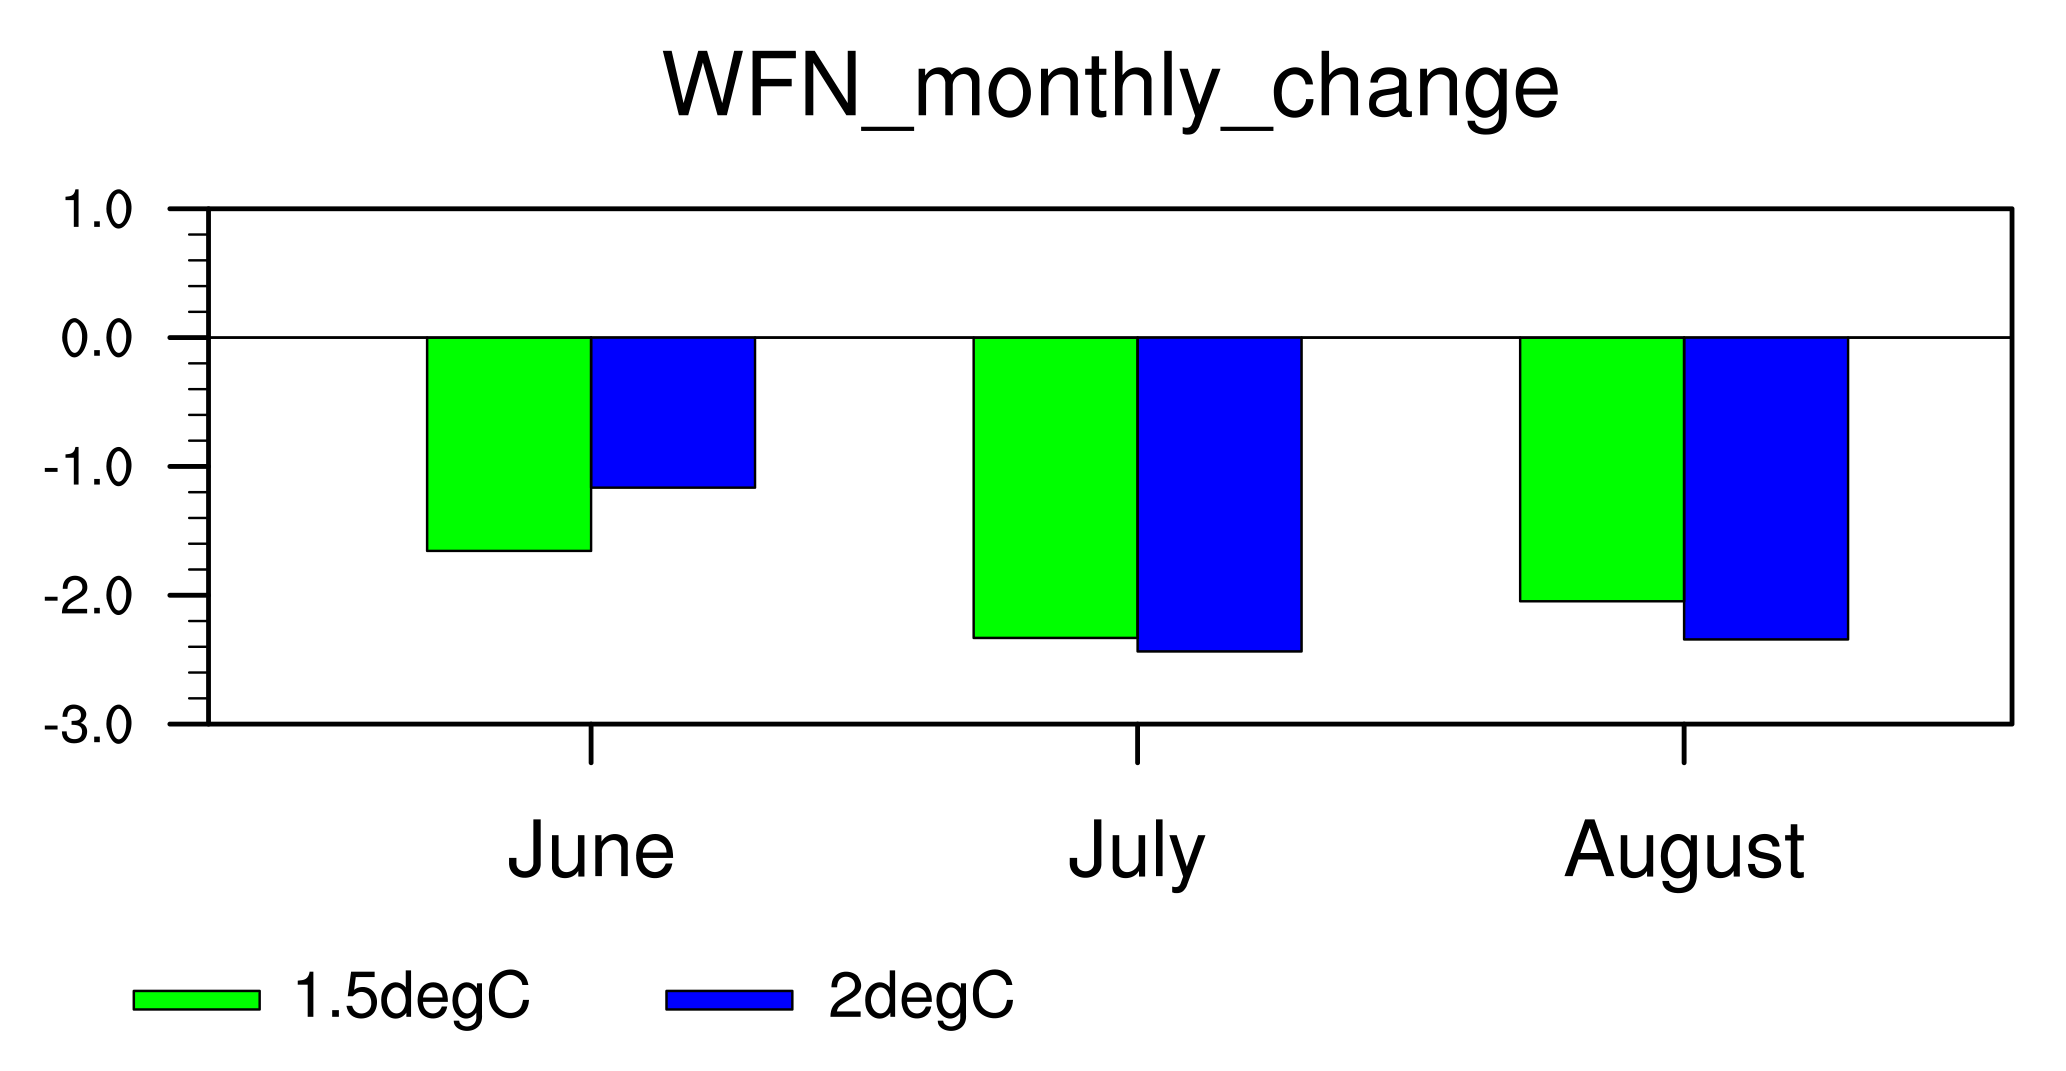
Figure 8Corrected monthly MMM WFN index change at 1.5 ∘C (green bars) and 2 ∘C (blue bars) warming relative to the reference period.

Figure 9Corrected monthly precipitation change percent (shading; in percent) and horizontal 850 hPa wind change (vector; m s−1) for (a, d) June, (b, e) July and (c, f) August. (a–c) 1.5 ∘C warming relative to the reference period; (d–e) 2 ∘C warming. Orange and blue contours denote the boundaries of WNPSH for the reference period and projected warming levels, respectively.
Considering remarkable differences between the East Asia monsoon in early summer and in late summer (Wang et al., 2009), monthly changes in precipitation and 850 hPa wind from June to August are further illustrated in Fig. 9 to show the seasonal march of summer precipitation. In June (Fig. 9a), precipitation is reduced by 20–50 % over 30–40∘ N extending from eastern China to the Korean Peninsula and Japan. Besides, greatly increased precipitation is over the western North Pacific with a southward retreat of the WNPSH boundary. In July (Fig. 9b), precipitation decreases over the Meiyu belt accompanied with an anticyclone wind change, which is more obvious at 2 ∘C warming (Fig. 9e). Meanwhile, enhanced precipitation is located on both north and south sides of the Meiyu belt with the eastward-shifted WNPSH boundary. Thus, a tripolar pattern of precipitation change is formed over East Asia, especially at 2 ∘C warming. The monsoon in southern East Asia is closely related to the WNPSH in early summer (Chen et al., 2004). Southward and eastward shifts of the WNPSH boundary in June and July, respectively, suggest that more moisture may linger over the western North Pacific rather than being transported to the midlatitudes of East Asia, in agreement of the weakened EASM intensity (Fig. 8). In August (Fig. 9c), precipitation increases over the high latitudes (40–50 ∘N) of East Asia and decreases over Japan, together with a westward extension of the WNPSH. The displacements of the WNPSH in July and August are offset, leading to no significant change in its summer-mean position (Fig. 7a and b).
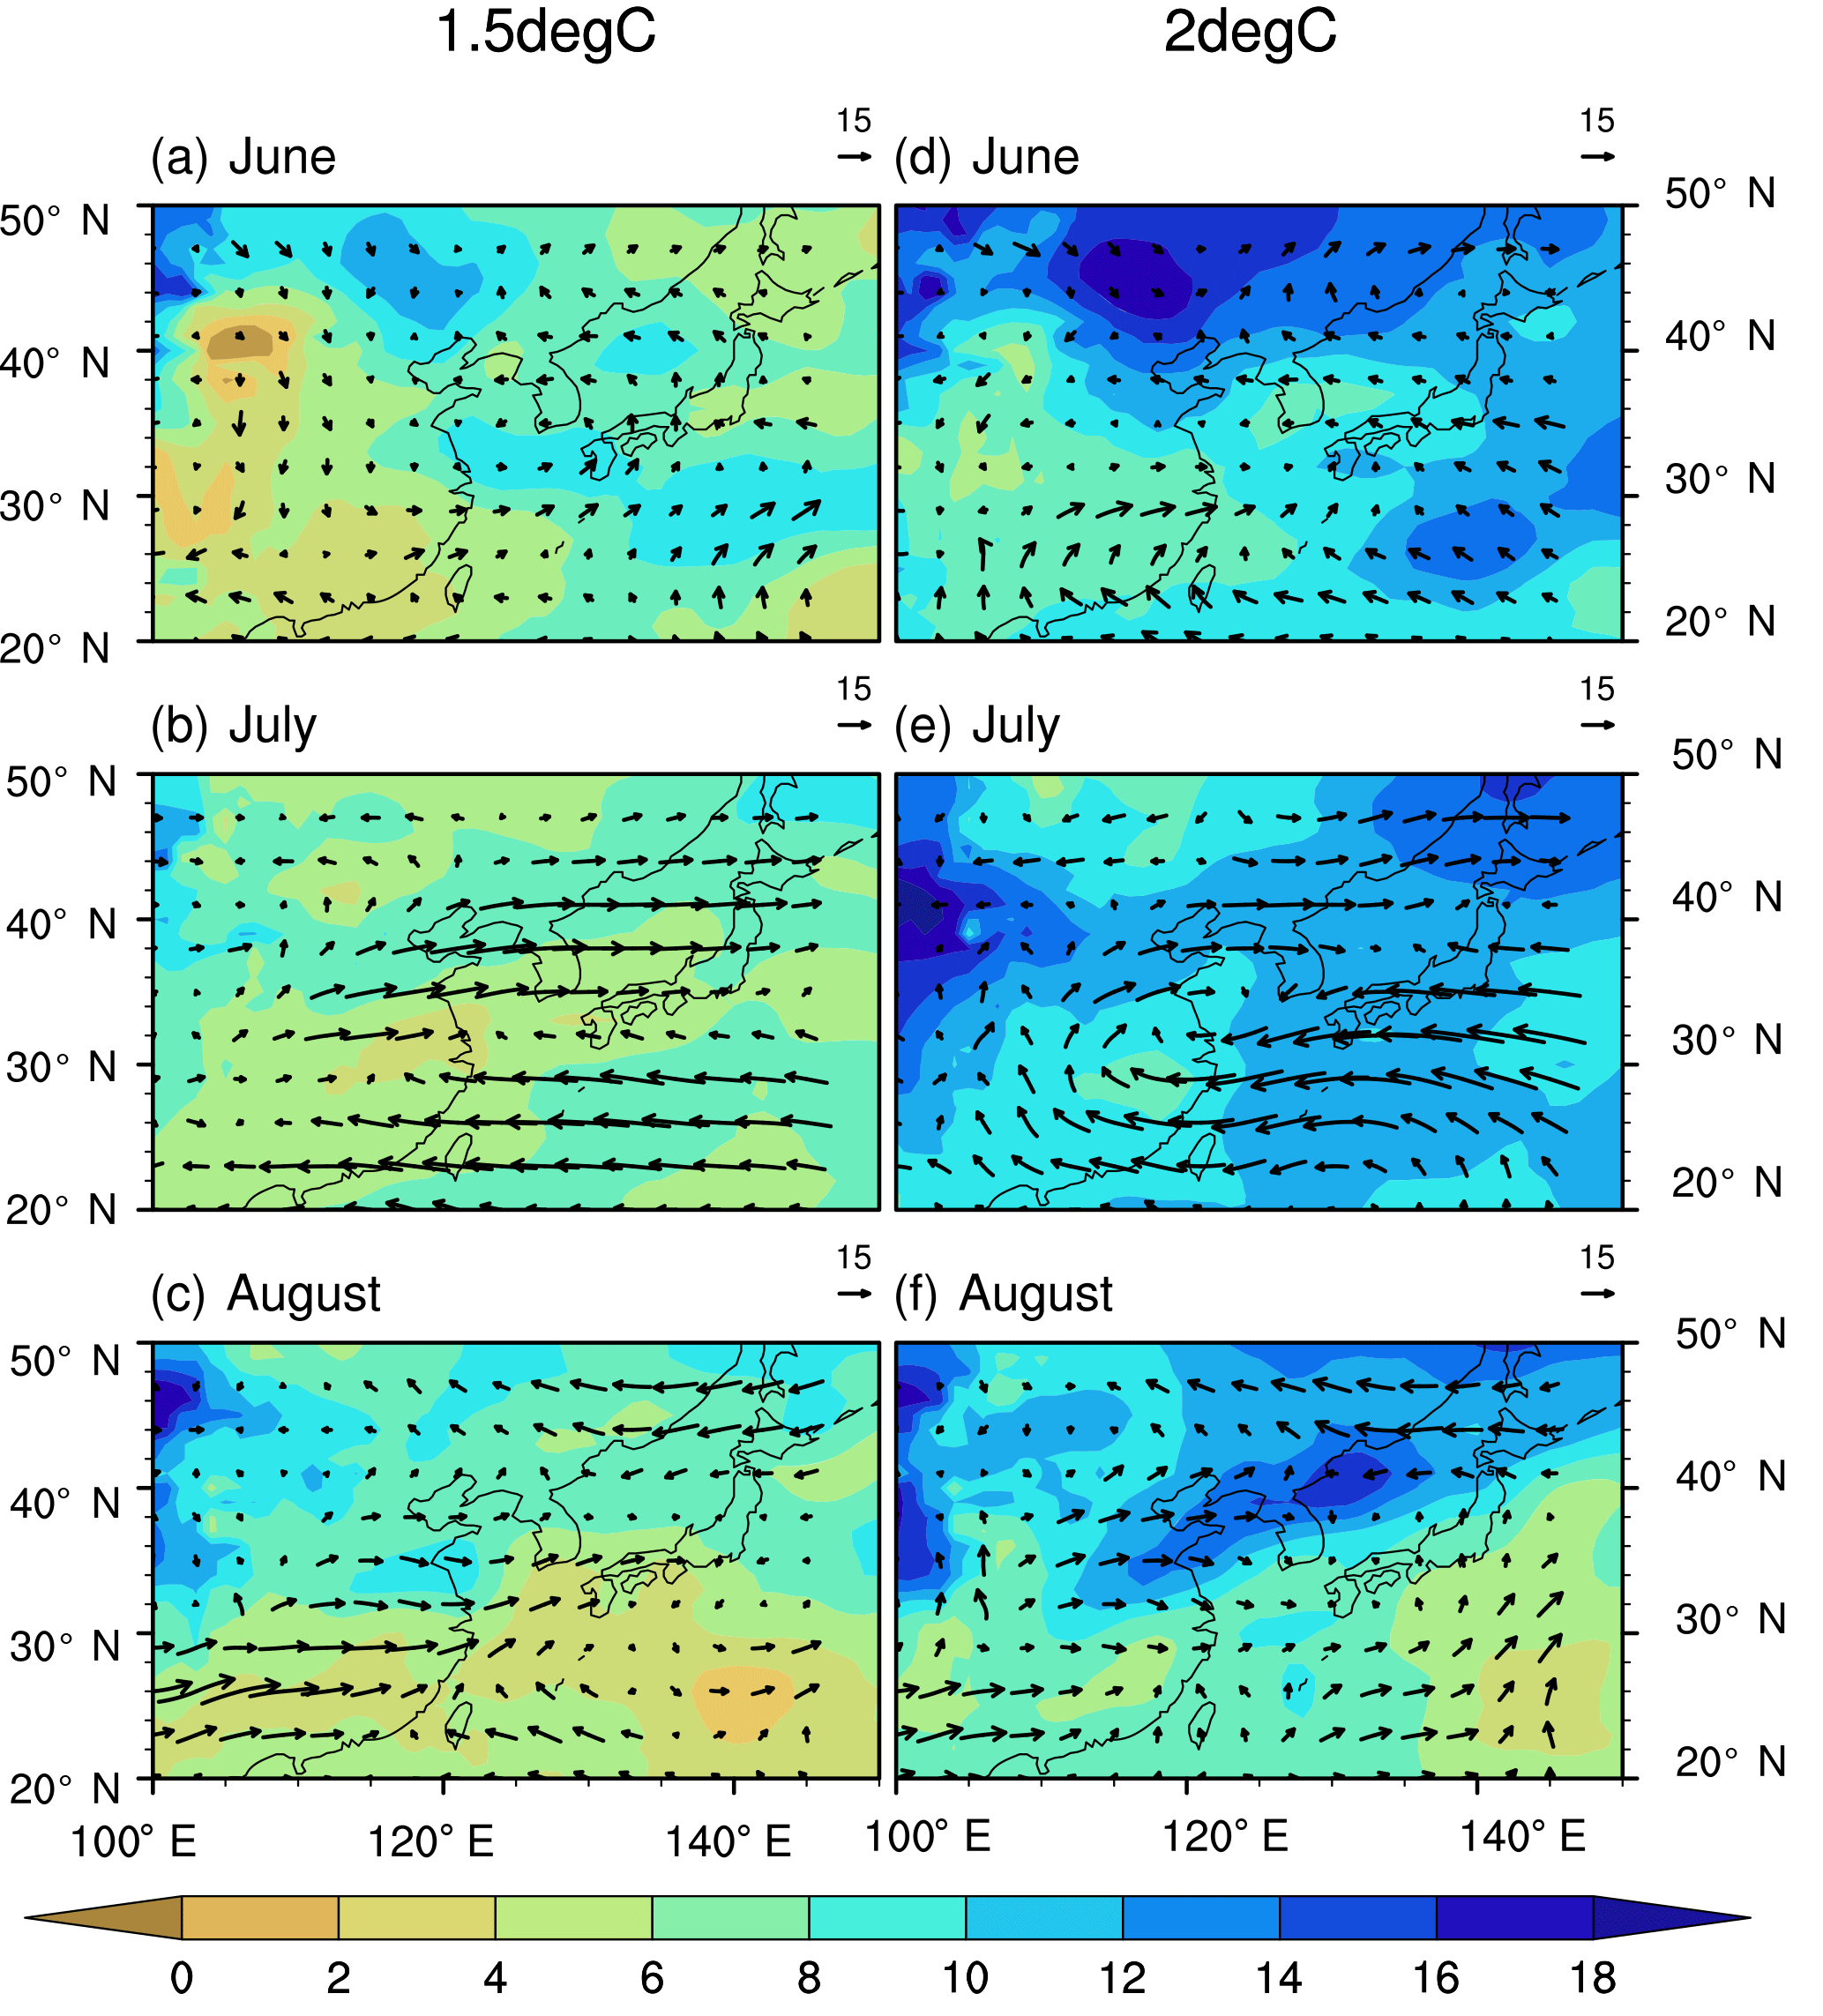
Figure 10Corrected monthly 850 hPa specific humidity change percentage (shading; in percent) and 850 hPa moisture flux change (vector; g kg−1 m s−1) for (a, d) June, (b, e) July and (c, f) August. (a–c) 1.5 ∘C warming relative to the reference period; (d–e) 2 ∘C warming.
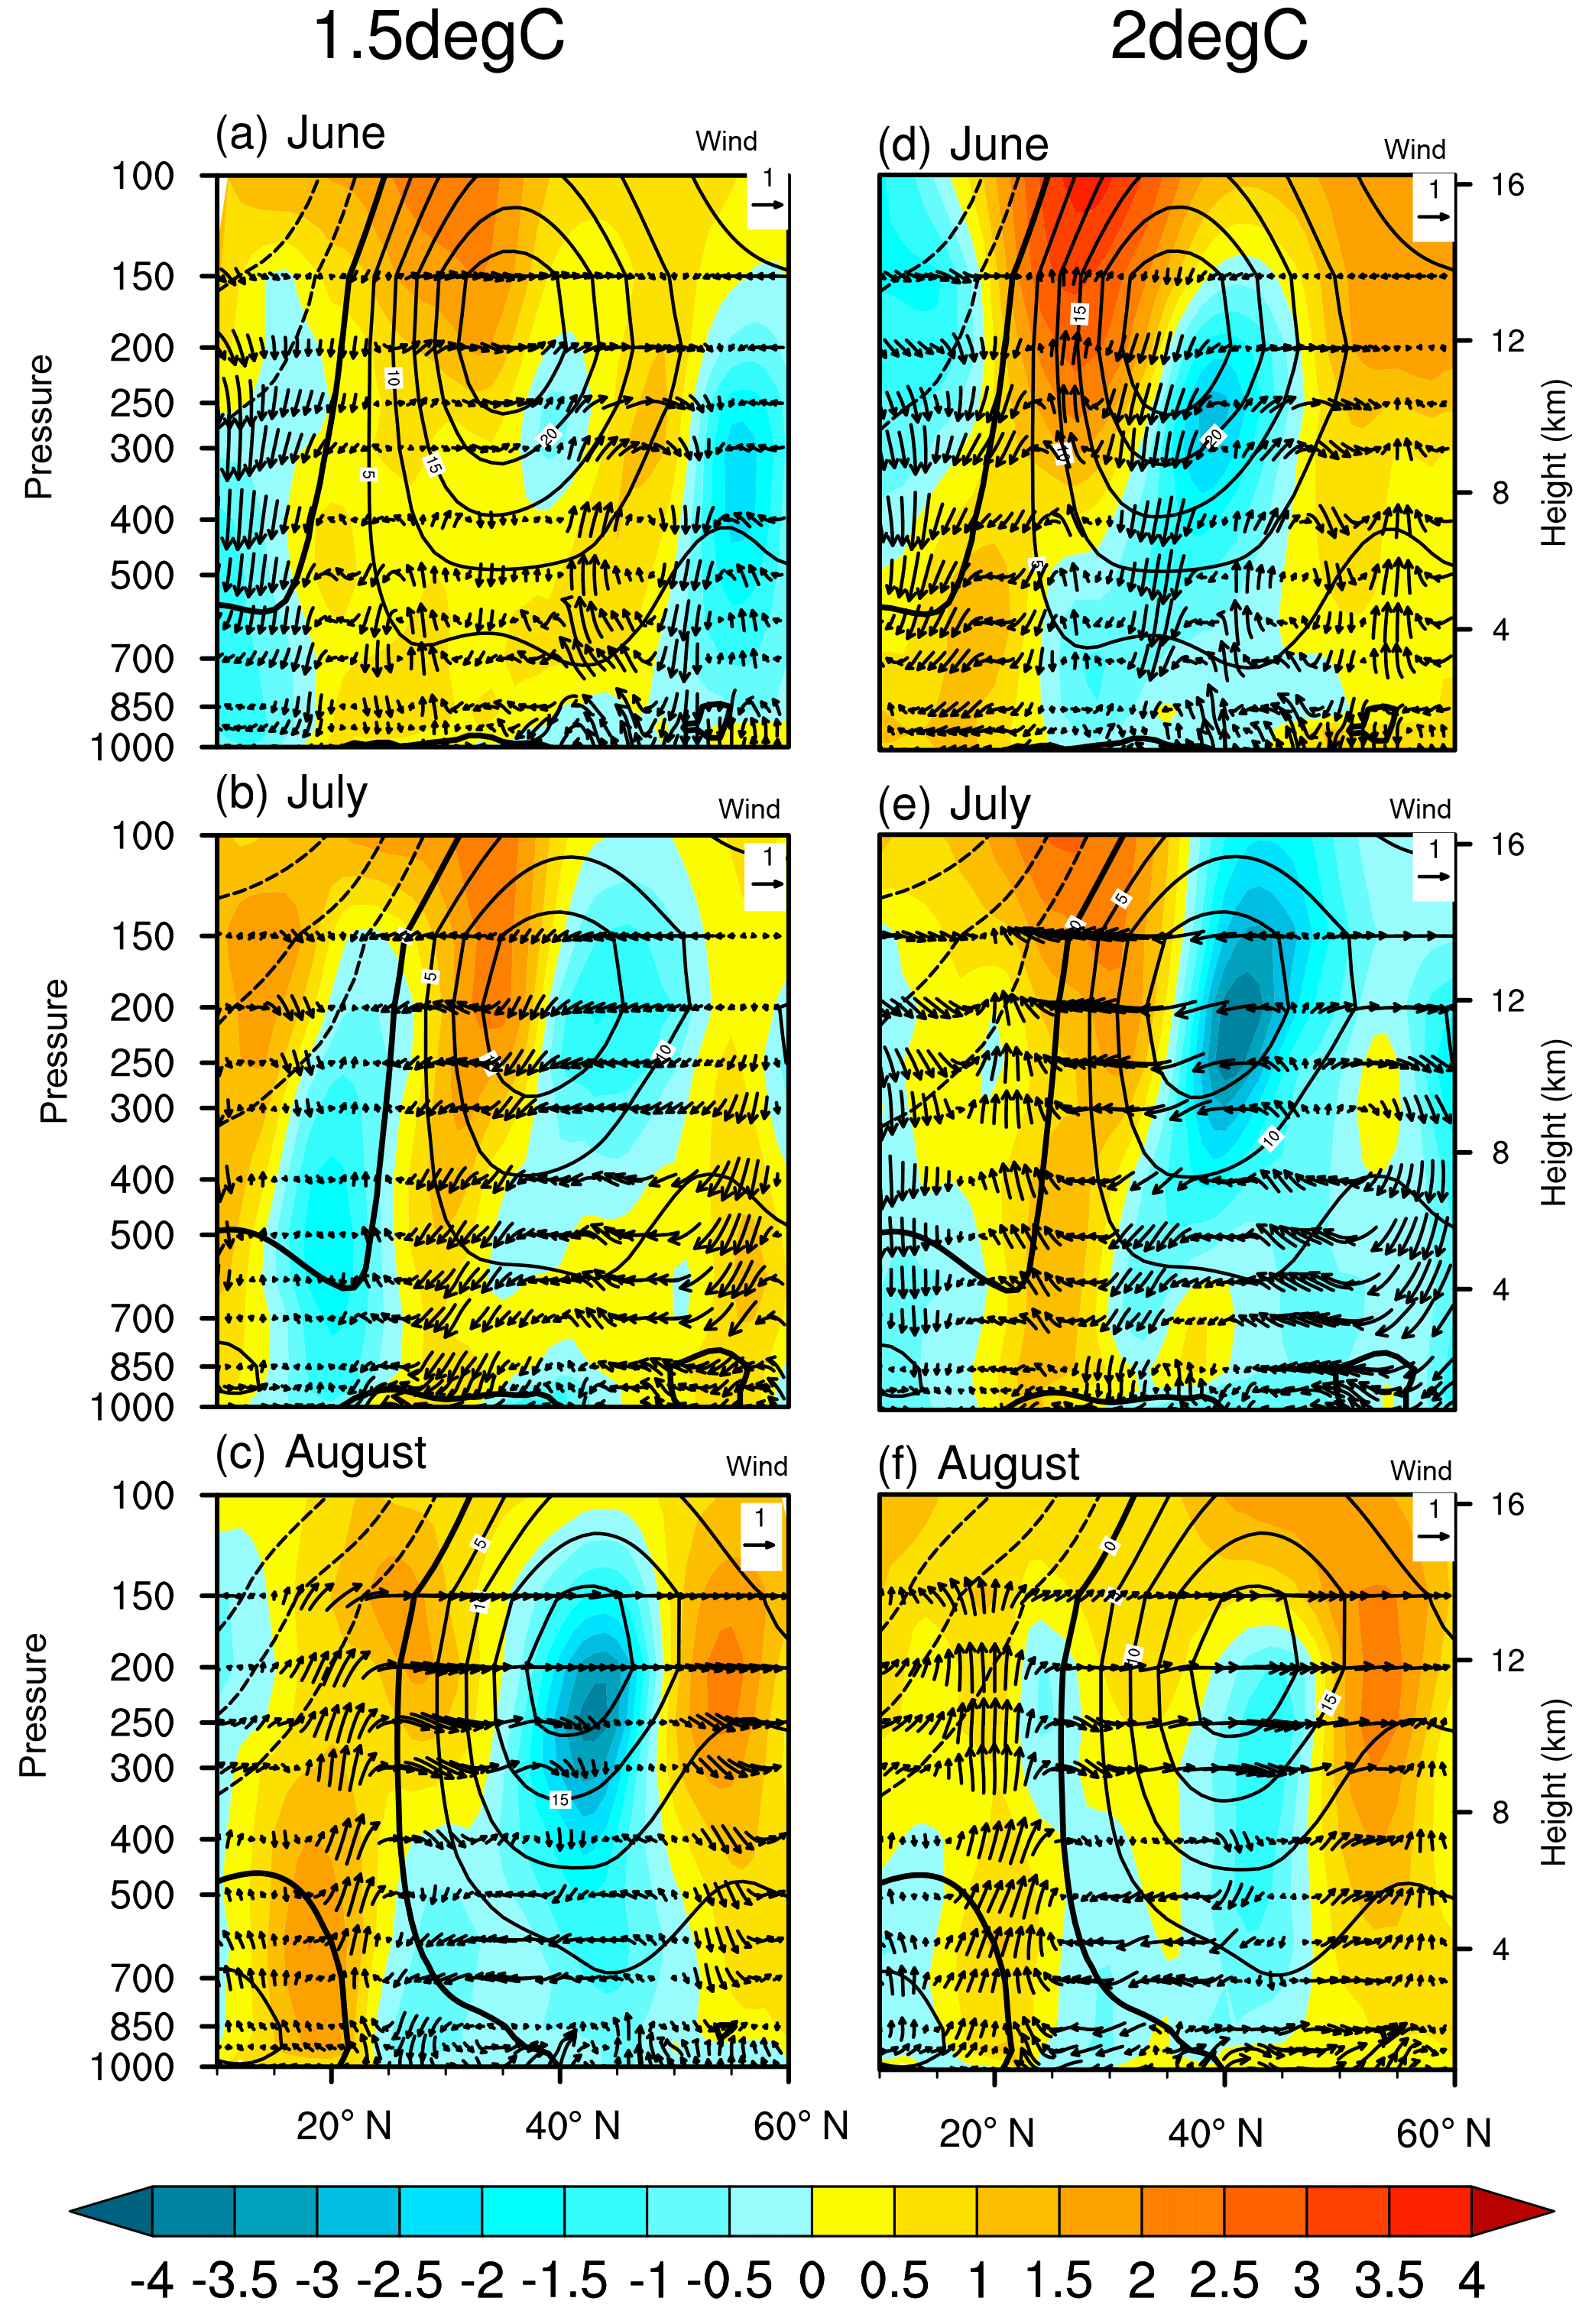
Figure 11Meridional sections of corrected monthly zonal wind change (shading; m s−1) and the meridional and vertical wind change (arrow; m s−1 and Pa s−1, respectively; vertical wind is multiplied by 100) averaged from 115 to 120∘ E for (a, d) June, (b, e) July and (c, f) August. (a–c) 1.5 ∘C warming relative to the reference period; (d–e) 2 ∘C warming. Contours denote climatological-mean zonal wind speed (m s−1) for the reference period.
Changes in specific humidity and moisture flux at 850 hPa are presented in Fig. 10. Specific humidity keeps enhancing over almost the whole EASM region under continuous global warming, and an obvious increase occurs at 2 ∘C warming, due to the extra 0.5 ∘C warming. Budget analysis in Seo et al. (2013) revealed that the domain-averaged precipitation increase over East Asia has a tight link with enhanced evaporation due to increased surface temperature. From this perspective, enhanced specific humidity at 850 hPa fundamentally supports the increase in domain-averaged precipitation over the EASM region. In addition, the spatial patterns of low-level specific humidity enhancement and moisture flux change are consistent with that of the precipitation change (Fig. 10). In June (Fig. 10a), slightly enhanced specific humidity and southward moisture transport appear over 30–40∘ N of East Asia where precipitation is reduced. Conversely, a relatively strong increase is located over the western North Pacific and the high latitudes of East Asia where precipitation is increased, accompanied with a relatively strong northward moisture transport. In July (Fig. 10b), the change in specific humidity is quite similar to that in precipitation. The specific humidity increase is relatively small with a weak moisture transport over the Meiyu belt and is much larger with a strong transport of moisture to both north and south sides of the rain belt. In August (Fig. 10c), specific humidity is slightly increased over the western North Pacific due to the westward extension of the WNPSH. Over the high latitudes of East Asia, specific humidity is robustly enhanced with westward moisture transport from wet areas over the ocean.
The analyses of corrected WNPSH and moisture transport show consistency between their changes and EASM. Southward and eastward shifts of the WNPSH boundary in early summer lead to weaker northward moisture transport on its western flank; thus, more moisture and precipitation can be found over the western North Pacific rather than over the midlatitudes of East Asia. In addition, the westward extension of the WNPSH boundary in August leads to a larger increase in 850 hPa specific humidity over the high latitudes of East Asia than that over the midlatitudes, favoring high-latitude precipitation.
Figure 11 shows meridional sections of monthly wind change averaged over 115–120∘ E at 1.5 and 2 ∘C warming. A prominent feature of EASJ change is the southward shift in early summer. The corresponding vertical motion change is consistent with the precipitation change. In June (Fig. 11a), a descending motion change appears over 30–40∘ N and an ascending change motion appears to the south and north. In July (Fig. 11b), a descending motion change is significant at the former vertically tilted ascending area, which is anchored by EASJ axis during the reference period. Many studies have addressed the importance of EASJ to the EASM precipitation (e.g., Liao et al., 2004; Sampe and Xie, 2010; Kosaka et al., 2011). Therefore, the southward shift of EASJ and the corresponding vertical motion change in early summer lead to a prominent decrease in precipitation over 30–40∘ N of East Asia. These changes correspond to the 850 hPa anomalous anti-cyclone (Fig. 9) and further determine the tripolar pattern of precipitation change over the EASM region. In August (Fig. 11c), the EASJ strengthens to the north and south of the EASJ core during the reference period. The vertical transport change induced by the change in EASJ is relatively small. Still, an ascending change is favorable for increased precipitation over the high latitudes of East Asia.
In this study, we present the changes in EASM intensity and the associated precipitation projected by 19 CMIP5 CGCMs, and examine the influences of the two most-related climate systems' biases on the EASM precipitation change pattern at global warming levels of 1.5 and 2 ∘C. Using the emergent constraints method, we provide more reliable projections of EASM intensity and precipitation.
Although MMM projections for 1.5 and 2 ∘C warming exhibit a general increase in summer precipitation and a slight change in EASM intensity, which is in accordance with previous findings (e.g., Chen and Sun, 2013; Jiang and Tian, 2013; Seo et al., 2013), it is important to note that large model uncertainty cannot be ignored in these projections. A large multimodel standard deviation appears along with change in precipitation, and the projected EASM intensity experiences huge diversity among individual models. In addition, uncertainties in projected meridional positions of both EASJ and WNPSH, captured by an inter-model EOF analysis, have significant influence on the change in East Asia summer precipitation.
Given the limitation of the traditional methods in climate change projections, a novel EPR method (Huang and Ying, 2015) based on the concept of emergent constraints is used to provide more reliable projections. The multimodel standard deviation of precipitation is largely reduced over the entire EASM region after the correction. Prominent corrections include decreased precipitation over the Meiyu belt and increased precipitation over the high latitudes of East Asia and central China. Additionally, the EASM intensity is considerably weakened in June, July and August at 1.5 and 2 ∘C warming, which agrees with the decreased northward temperature gradient over East Asia (not shown). Monthly change projections further suggest that reduced precipitation over 30–40∘ N of East Asia in June and over the Meiyu belt in July are mainly determined by changes in the EASJ and WNPSH. Southeastward retreat of the WNPSH and southward shift of EASJ act to weaken the moisture transport via southerly wind at low levels and hinder the vertical ascending motion over the reduced-precipitation area. Moreover, precipitation increases on both north and south sides of the reduced-precipitation area, which is beneficial to the wetter environment and the ascending motion change. In early summer, precipitation increases more over southern East Asia, resulting from a weakened northward moisture transport. In August, a robust increase in precipitation is over the high latitudes of East Asia with sufficient moisture from the wetter area over the ocean in the east, where surface temperature is greatly increased (not shown), and reduced precipitation is located over Japan with a westward extension of the WNPSH. Precipitation changes in each month of summer finally form a tripolar pattern of EASM precipitation change at 1.5 and 2 ∘C warming.
Regarding the differences between 1.5 and 2 ∘C warming scenarios, corrected EASM intensity displays a slight change. Enhanced summer precipitation over large area of East Asia may be caused by a pronounced moisture increase during 2 ∘C warming thanks to the extra 0.5 ∘C warming. However, the descending motion change induced by the EASJ change overwhelms the effect of moisture increase over the Meiyu belt.
Climate models are useful tools for climate projections, and their basic capacity at simulating EASM precipitation has been demonstrated in many studies (e.g., Zhou and Zou, 2010). However, significant biases in simulated location, amount and seasonal evolution of precipitation over East Asia exist (e.g., Zhou et al., 2009; Huang et al., 2013; Chen and Bordoni, 2014). In this study, we aim at projecting more reliable future changes in EASM intensity and precipitation by using the emergent constraints strategy. Due to the complexity of the EASM system, it is still too difficult to demonstrate whether the common change bias of each variable is corrected by the historical common bias from itself or not. The effect of historical common bias on the common change bias for each variable remains unclear. For example, it cannot be concluded that an underestimation of the Meiyu in the historical period will lead to an underestimation of Meiyu in projection. Many previous studies have shown the underestimation of Meiyu in the historical period (e.g., Chen and Sun, 2013; Sperber et al., 2013). However, while multimodel ensemble projects an increase in precipitation around the Meiyu belt in the near future, six models that best reproduced the observed climate project decreases in precipitation over Japan and some parts of eastern China (Chen and Sun, 2013). Therefore, we attempt to make our results more convincing by showing decreased inter-model standard deviation and improved consistency in changes of many variables over the EASM region instead.
The CMIP5 datasets (Taylor et al., 2012) are available at http://cmip-pcmdi.llnl.gov/cmip5/. The GPCP datasets (Adler et al., 2003) are available at http://gpcp.umd.edu/. The HadISST1.1 datasets (Rayner et al., 2003) are available at https://www.metoffice.gov.uk/hadobs/hadisst/. The ERA-Interim reanalysis datasets (Dee et al., 2011) are available at http://apps.ecmwf.int/datasets/. To obtain the corrected projections datasets of this study, please contact liujw@nuist.edu.cn.
The authors declare that they have no conflict of interest.
We acknowledge the World Climate Research Programme's Working Group on
Coupled Modeling, which is responsible for the CMIP5, and the climate
modeling groups for producing and making available their model outputs.
This work was jointly supported by the National Natural Science Foundation
of China (grants 41490643 and 41575077), and the Priority Academic Program
Development of Jiangsu Higher Education Institutions (PAPD).
Edited by: Raghavan Krishnan
Reviewed by: two anonymous referees
Abe, M., Shiogama, H., Nozawa, T., and Emori, S.: Estimation of future surface temperature changes constrained using the future-present correlated modes in inter-model variability of CMIP3 multimodel simulations, J. Geophys. Res., 116, D18104, https://doi.org/10.1029/2010JD015111, 2011.
Adler, R. F., Huffman, G. J., Chang, A., Ferraro, R., Xie, P.-P., Janowiak, J., Rudolf, B., Schneider, U., Curtis, S., Bolvin, D., Gruber, A., Susskind, J., Arkin, P., and Nelkin, E.: The Version-2 Global Precipitation Climatology Project (GPCP) Monthly Precipitation Analysis (1979–Present), J. Hydrometeorol., 4, 1147–1167, https://doi.org/10.1175/1525-7541(2003)004<1147:tvgpcp>2.0.co;2, 2003.
Boé, J., Hall, A., and Qu, X.: September sea-ice cover in the Arctic Ocean projected to vanish by 2100, Nat. Geosci., 2, 341–343, https://doi.org/10.1038/ngeo467, 2009.
Bracegirdle, T. J. and Stephenson, D. B.: Higher precision estimates of regional polar warming by ensemble regression of climate model projections, Clim. Dynam., 39, 2805–2821, https://doi.org/10.1007/s00382-012-1330-3, 2012.
Chen, H. and Sun, J.: Projected change in East Asian summer monsoon precipitation under RCP scenario, Meteorol. Atmos. Phys., 121, 55–77, https://doi.org/10.1007/s00703-013-0257-5, 2013.
Chen, J., and Bordoni, S.: Intermodel spread of East Asian summer monsoon simulations in CMIP5, Geophys. Res. Let., 41, 1314–1321, https://doi.org/10.1002/2013GL058981, 2014.
Chen, T., Wang, S. Y., Huang, W. R., and Yen, M.: Variation of the East Asian Summer Monsoon Rainfall, J. Climate, 17, 744–762, https://doi.org/10.1175/1520-0442(2004)017<0744:VOTEAS>2.0.CO;2, 2004.
Cox, P. M., Pearson, D., Booth, B. B., Friedlingstein, P., Huntingford, C., Jones, C. D., and Luke, C. M.: Sensitivity of tropical carbon to climate change constrained by carbon dioxide variability, Nature, 494, 341–344, https://doi.org/10.1038/nature11882, 2013.
Dee, D. P., Uppala, S. M., Simmons, A. J., Berrisford, P., Poli, P., Kobayashi, S., Andrae, U., Balmaseda, M. A., Balsamo, G., Bauer, P., Bechtold, P., Beljaars, A. C. M., van de Berg, L., Bidlot, J., Bormann, N., Delsol, C., Dragani, R., Fuentes, M., Geer, A. J., Haimberger, L., Healy, S. B., Hersbach, H., Hólm, E. V., Isaksen, L., Kållberg, P., Köhler, M., Matricardi, M., McNally, A. P., Monge-Sanz, B. M., Morcrette, J. J., Park, B. K., Peubey, C., de Rosnay, P., Tavolato, C., Thépaut, J. N., and Vitart, F.: The ERA-Interim reanalysis: configuration and performance of the data assimilation system, Q. J. Roy. Meteorol. Soc., 137, 553–597, https://doi.org/10.1002/qj.828, 2011.
Guo, X., Huang, J., Luo, Y., Zhao, Z., and Xu, Y.: Projection of precipitation extremes for eight global warming targets by 17 CMIP5 models, Nat. Hazards, 84, 2299–2319, https://doi.org/10.1007/s11069-016-2553-0, 2016.
Guo, X., Huang, J., Luo, Y., Zhao, Z., and Xu, Y.: Projection of heat waves over China for eight different global warming targets using 12 CMIP5 models, Theor. Appl. Climatol., 128, 507–522, https://doi.org/10.1007/s00704-015-1718-1, 2017.
He, C. and Zhou, T.: Responses of the Western North Pacific Subtropical High to Global Warming under RCP4.5 and RCP8.5 Scenarios Projected by 33 CMIP5 Models: The Dominance of Tropical Indian Ocean–Tropical Western Pacific SST Gradient, J. Climate, 28, 365–380, https://doi.org/10.1175/JCLI-D-13-00494.1, 2015.
He, C., Zhou, T., Lin, A., Wu, B., Gu, D., Li, C., and Zheng, B.: Enhanced or Weakened Western North Pacific Subtropical High under Global Warming?, Scient. Rep., 5, 16771, https://doi.org/10.1038/srep16771, 2015.
Hong, X. and Lu, R.: The Meridional Displacement of the Summer Asian Jet, Silk Road Pattern, and Tropical SST Anomalies, J. Climate, 29, 3753–3766, https://doi.org/10.1175/JCLI-D-15-0541.1, 2016.
Huang, D.-Q., Zhu, J., Zhang, Y.-C., and Huang, A.-N.: Uncertainties on the simulated summer precipitation over Eastern China from the CMIP5 models, J. Geophys. Res., 118, 9035–9047, https://doi.org/10.1002/jgrd.50695, 2013.
Huang, P. and Ying, J.: A Multimodel Ensemble Pattern Regression Method to Correct the Tropical Pacific SST Change Patterns under Global Warming, J. Climate, 28, 4706–4723, https://doi.org/10.1175/JCLI-D-14-00833.1, 2015.
Huang, R., Chen, J., Wang, L., and Lin, Z.: Characteristics, processes, and causes of the spatio-temporal variabilities of the East Asian monsoon system, Adv. Atmos. Sci., 29, 910–942, https://doi.org/10.1007/s00376-012-2015-x, 2012.
IPCC: Climate Change 2013 – The Physical Science Basis: Working Group I Contribution to the Fifth Assessment Report of the Intergovernmental Panel on Climate Change, Cambridge University Press, Cambridge, 2014.
Jiang, D. and Tian, Z.: East Asian monsoon change for the 21st century: Results of CMIP3 and CMIP5 models, Chin. Sci. Bull., 58, 1427–1435, https://doi.org/10.1007/s11434-012-5533-0, 2013.
Kosaka, Y., Xie, S.-P., and Nakamura, H.: Dynamics of Interannual Variability in Summer Precipitation over East Asia, J. Climate, 24, 5435–5453, https://doi.org/10.1175/2011jcli4099.1, 2011.
Li, G. and Xie, S.-P.: Tropical Biases in CMIP5 Multimodel Ensemble: The Excessive Equatorial Pacific Cold Tongue and Double ITCZ Problems, J. Climate, 27, 1765–1780, https://doi.org/10.1175/jcli-d-13-00337.1, 2014.
Li, G., Xie, S.-P., and Du, Y.: A Robust but Spurious Pattern of Climate Change in Model Projections over the Tropical Indian Ocean, J. Climate, 29, 5589–5608, https://doi.org/10.1175/jcli-d-15-0565.1, 2016.
Liao, Q.-H., Tao, S.-Y., and Wang, H.-J.: Interannual Variation of Summer Subtropical Westerly Jet in East Asia and Its Impacts on the Climate Anomalies of East Asia Summer Monsoon, Chin. J. Geophys., 47, 12–21, https://doi.org/10.1002/cjg2.449, 2004.
Liu, Y., Li, W., Zuo, J., and Hu, Z.-Z.: Simulation and projection of the western pacific subtropical high in CMIP5 models, J. Meteorol. Res., 28, 327–340, https://doi.org/10.1007/s13351-014-3151-2, 2014.
Ma, J., Xu, H., and Lin, P.: Meridional position biases of East Asian subtropical jet stream in CMIP5 models and their relationship with ocean model resolutions, Int. J. Climatol., 35, 3942–3958, https://doi.org/10.1002/joc.4256, 2015.
Mitchell, D., James, R., Forster, P. M., Betts, R. A., Shiogama, H., and Allen, M.: Realizing the impacts of a 1.5 ∘C warmer world, Nat. Clim. Change, 6, 735–737, https://doi.org/10.1038/nclimate3055, 2016.
Räisänen, J., Ruokolainen, L., and Ylhäisi, J.: Weighting of model results for improving best estimates of climate change, Clim. Dynam., 35, 407–422, https://doi.org/10.1007/s00382-009-0659-8, 2010.
Rayner, N. A., Parker, D. E., Horton, E. B., Folland, C. K., Alexander, L. V., Rowell, D. P., Kent, E. C., and Kaplan, A.: Global analyses of sea surface temperature, sea ice, and night marine air temperature since the late nineteenth century, J. Geophys. Res., 108, 4407, https://doi.org/10.1029/2002JD002670, 2003.
Sampe, T. and Xie, S.-P.: Large-Scale Dynamics of the Meiyu-Baiu Rainband: Environmental Forcing by the Westerly Jet, J. Climate, 23, 113–134, https://doi.org/10.1175/2009jcli3128.1, 2010.
Sanderson, B. M., Xu, Y., Tebaldi, C., Wehner, M., O'Neill, B., Jahn, A., Pendergrass, A. G., Lehner, F., Strand, W. G., Lin, L., Knutti, R., and Lamarque, J. F.: Community climate simulations to assess avoided impacts in 1.5 and 2 ∘C futures, Earth Syst. Dynam., 8, 827–847, https://doi.org/10.5194/esd-8-827-2017, 2017.
Schleussner, C., Lissner, T., Fischer, E. M., Wohland, J., Perrette, M., Golly, A., Rogelj, J., Childers, K., Schewe, J., and Frieler, K.: Differential climate impacts for policy-relevant limits to global warming: the case of 1.5 ∘C and 2 ∘C, Earth Syst. Dynam., 7, 327–351, https://doi.org/10.5194/esd-7-327-2016, 2016.
SED: UNFCCC: Report on the Structured Expert Dialogue (SED) on the 2013–2015 review, FCCC/SB/2015/INF.1, https://unfccc.int/documents/8707#beg (last access: April 2018), 2015.
Seo, K.-H., Ok, J., Son, J.-H., and Cha, D.-H.: Assessing Future Changes in the East Asian Summer Monsoon Using CMIP5 Coupled Models, J. Climate, 26, 7662–7675, https://doi.org/10.1175/jcli-d-12-00694.1, 2013.
Sperber, K. R., Annamalai, H., Kang, I.-S., Kitoh, A., Moise, A., Turner, A., Wang, B., and Zhou, T.: The Asian summer monsoon: an intercomparison of CMIP5 vs. MIP3 simulations of the late 20th century, Clim. Dynam., 41, 2711–2744, https://doi.org/10.1007/s00382-012-1607-6, 2013.
Taylor, K. E.: Summarizing multiple aspects of model performance in a single diagram, J. Geophys. Res., 106, 7183–7192, https://doi.org/10.1029/2000JD900719, 2001.
Taylor, K. E., Stouffer, R. J., and Meehl, G. A.: An Overview of CMIP5 and the Experiment Design, B. Am. Meteorol. Soc., 93, 485–498, https://doi.org/10.1175/bams-d-11-00094.1, 2012.
UNFCCC: Adoption of the Paris Agreement, FCCC/CP/2015/10/Add.1, Paris, France, 1–32, 2015.
Wang, B. and Fan, Z.: Choice of South Asian Summer Monsoon Indices, B. Am. Meteorol. Soc., 80, 629–638, https://doi.org/10.1175/1520-0477(1999)080<0629:cosasm>2.0.co;2, 1999.
Wang, B., Wu, Z., Li, J., Liu, J., Chang, C.-P., Ding, Y., and Wu, G.: How to Measure the Strength of the East Asian Summer Monsoon, J. Climate, 21, 4449–4463, https://doi.org/10.1175/2008jcli2183.1, 2008.
Wang, B., Liu, J., Yang, J., Zhou, T., and Wu, Z.: Distinct Principal Modes of Early and Late Summer Rainfall Anomalies in East Asia, J. Climate, 22, 3864–3875, https://doi.org/10.1175/2009jcli2850.1, 2009.
Wang, C., Zhang, L., Lee, S.-K., Wu, L., and Mechoso, C. R.: A global perspective on CMIP5 climate model biases, Nat. Clim. Change, 4, 201–205, https://doi.org/10.1038/nclimate2118, 2014.
Zhou, T. and Zou, L.: Understanding the Predictability of East Asian Summer Monsoon from the Reproduction of Land–Sea Thermal Contrast Change in AMIP-Type Simulation, J. Climate, 23, 6009–6026, https://doi.org/10.1175/2010jcli3546.1, 2010.
Zhou, T., Wu, B., and Wang, B.: How Well Do Atmospheric General Circulation Models Capture the Leading Modes of the Interannual Variability of the Asian–Australian Monsoon?, J. Climate, 22, 1159–1173, https://doi.org/10.1175/2008jcli2245.1, 2009.
Zhou, T.-J. and Yu, R.-C.: Atmospheric water vapor transport associated with typical anomalous summer rainfall patterns in China, J. Geophys. Res., 110, D08104, https://doi.org/10.1029/2004JD005413, 2005.
present–futurerelationship in observed climate and model-simulated future climate is applied to give more reliable projections of East Asian summer monsoon intensity and associated precipitation changes at 1.5 and 2 °C warming levels. Projected future changes suggest decreased precipitation over the Meiyu belt and increased precipitation over the high latitudes of East Asia and central China, together with a considerable weakening of EASM intensity.
present–futurerelationship in observed climate and model-simulated...