the Creative Commons Attribution 4.0 License.
the Creative Commons Attribution 4.0 License.
 | 01 Jul 2026
Strong intensification of extreme fire weather in Europe under 3 °C compared to 2 °C global warming
Joaquim G. Pinto
Célia M. Gouveia
Alexandre M. Ramos
The climate in Europe is warming faster than the global average, raising concerns about how climate change will affect extreme fire events. In this study, we use ERA5-Land reanalysis data and an ensemble of 33 high-resolution regional climate models (RCMs) from the EURO-CORDEX framework to compute the Canadian Forest Fire Weather Index (FWI) and investigate both recent and projected changes in atmospheric conditions favorable for wildfires across Europe. Historical trends (1950–2023) based on ERA5-Land data reveal statistically significant increases in the frequency and intensity of extreme fire weather in regions such as the Iberian Peninsula, Central Europe, and parts of Eastern Europe. All RCM input fields were bias-adjusted prior to FWI calculation using Quantile Delta Mapping, resulting in improved FWI representation relative to unadjusted simulations. Projections based on the bias-adjusted EURO-CORDEX ensemble indicate that future extreme fire weather will become more frequent, more intense, and more widespread across Europe as global warming progresses. The strongest signals are projected for southern Europe, with a northward expansion of fire-prone conditions under higher global warming levels (GWLs). At 3 °C GWL, the spatial extent of robust changes in extreme fire weather metrics nearly doubles compared to 2 °C, with one metric increasing fivefold. Relative increases in frequency-based metrics generally exceed those in magnitude-based metrics. These changes coincide with rising vapor pressure deficit, suggesting that thermodynamic processes play a key role through atmospheric drying. The projected intensification of extreme fire weather in Europe highlights the growing need for coordinated climate action along with proactive mitigation strategies.
- Article
(14844 KB) - Full-text XML
-
Supplement
(21540 KB) - BibTeX
- EndNote


Wildfires have been part of Earth's history since the emergence of terrestrial plants more than 400 million years ago (Bowman et al., 2009; Scott and Glasspool, 2006). They are an essential component of the Earth system, shaping the evolution and distribution of plant and animal life, as well as influencing key biogeochemical processes (Bowman et al., 2020; He et al., 2019). Fires burn approximately 4 million km2 area each year (Chuvieco et al., 2018) and have significant direct and indirect impacts on both global and regional climate through the emission of greenhouse gases and aerosols. Despite considerable uncertainty, recent data indicate that global mean carbon emissions from anthropogenic and natural fires were estimated at 3.4 PgC yr−1 during the period 2002–2022 (van der Werf et al., 2025), which is approximately 30.6 % of the magnitude of global anthropogenic CO2 emissions in 2022 (Bowman et al., 2020; Friedlingstein et al., 2023).
Satellite-derived data show a nearly 25 % decrease in global burned area between 1998 and 2015 (Andela et al., 2017). This decline is primarily concentrated in tropical savannas and grasslands and is largely attributed to agricultural expansion and changes in land cover (Andela et al., 2017). However, despite this decrease in global burned area, global fire emissions have remained relatively stable (Zheng et al., 2021), which is explained by an increase in forest fire emissions across North America and Eurasia where fires release more CO2 per unit area burned (Jones et al., 2024; Zheng et al., 2021). Moreover, the frequency and magnitude of extreme wildfires more than doubled between 2003 and 2023 (Cunningham et al., 2024), and a significant proportion of extreme fire events occurred under extreme fire weather conditions (Bowman et al., 2017).
Fire weather refers to atmospheric conditions that are conducive to triggering and propagating wildfires (Masson-Delmotte et al., 2021). Numerous fire weather indices based on daily surface weather variables (e.g., temperature, precipitation, relative humidity, and wind) have been developed and applied across different regions (Jolly et al., 2015; Jones et al., 2022). These indices reflect the effects of atmospheric conditions on fuel dryness and subsequent potential fire danger, and are strongly correlated with the magnitude and extent of wildfires, particularly in ecosystems with intermediate moisture availability (Abatzoglou et al., 2018; Bedia et al., 2015; Carvalho et al., 2008; Jolly et al., 2015; Jones et al., 2022). In recent decades, increasing global trends have been observed both in the duration of the fire season and the frequency of these conditions (Jolly et al., 2015; Jones et al., 2022). Under projected global warming, both the frequency and intensity of extreme fire weather are expected to further increase worldwide (Abatzoglou et al., 2019; Bowman et al., 2017; Jones et al., 2022; Masson-Delmotte et al., 2021).
Europe has warmed at twice the global average rate since the 1980s (Copernicus Climate Change Service (C3S) and World Meteorological Organization (WMO), 2025). Moreover, approximately 70 %–90 % of the continent's land area is projected to shift into different climate zones by the end of the century under high-emission scenario simulations, with a notable tendency toward warmer and drier conditions in the southern and western regions (Bayar et al., 2023). Consistent with this tendency and the expected increase in compound hot and dry events (Masson-Delmotte et al., 2021), extreme fire weather is also projected to increase across much of Europe (Abatzoglou et al., 2019; Jones et al., 2022), with particularly pronounced changes in the Mediterranean region (Fargeon et al., 2020; Ruffault et al., 2020). Growing concern also surrounds the impacts of climate change on extreme fire weather in central Europe, an area that is historically less prone to these events. (Carnicer et al., 2022; Miller et al., 2024; Mozny et al., 2021)
In addition to global-scale studies that show a projected increase in fire weather extremes across the continent (e.g., Abatzoglou et al., 2019; Jones et al., 2022), two recent pan-European scale studies projected widespread increases in extreme fire weather under the impacts of climate change (El Garroussi et al., 2024; Hetzer et al., 2024). Both studies relied on global climate model output from the sixth phase of the Climate Model Intercomparison Project (CMIP6) (Eyring et al., 2016) and applied statistical downscaling techniques to reach the target resolution (∼ 31 km in El Garroussi et al., 2024 and ∼ 9 km in Hetzer et al., 2024). However, since statistically downscaled fields still inherit the climate change signal from driving global climate models (GCMs) and do not incorporate fine-grid scale physical processes, they may not fully capture important regional scale phenomena, such as snow-albedo feedback in mountainous regions (Maraun et al., 2017), potentially leading to a loss of physical consistency and biased results. To address this limitation, dynamically downscaled regional climate models (RCMs) offer an alternative approach as they refine the large-scale circulation response obtained from GCMs to finer scales by explicitly simulating sub-GCM grid-scale processes (Giorgi, 2019). Consistent with this, a recent study found that RCMs from the Coordinated Regional Climate Downscaling Experiment (CORDEX) reproduce historical fire weather trends more accurately than GCMs participating in CMIP5 and CMIP6 (Nogherotto et al., 2026).
Many studies have used RCMs from the EURO-CORDEX domain (Jacob et al., 2014) to project fire weather danger across Europe in a warming climate, but many of them relied on relatively small ensemble sizes (e.g., de Rigo et al., 2017; Galizia et al., 2023), which limits the characterization of model uncertainty. Moreover, they were often limited to specific regions, such as Greece (Rovithakis et al., 2022), France (Fargeon et al., 2020; Varela et al., 2019), or the Iberian Peninsula (Bento et al., 2023; Calheiros et al., 2021). In addition to these limitations, simulations in the EURO-CORDEX framework have been found to exhibit systematic biases relative to observations and reanalysis, with an overall tendency to be too cold, too wet, and too windy (Vautard et al., 2021). Since extreme fire weather is a multivariate phenomenon driven by the combined effect of these fields, biases in them may compound and amplify the overall uncertainty in fire weather indices and associated outcomes. Accordingly, input fields for calculating the FWI need to be adjusted for biases to increase confidence in decision-making regarding the impacts of extreme fire weather in a warming climate.
Despite the growing literature on projections of extreme fire weather in Europe, important gaps remain in terms of better representing regional details and uncertainty through the use of larger RCM ensembles, as well as increasing confidence in projections by bias-adjusting atmospheric fields. To address these research gaps, we use a relatively large ensemble from the EURO-CORDEX framework (Jacob et al., 2014), consisting of 33 GCM-RCM chains and aim to comprehensively assess projections of extreme fire weather danger at a pan-European scale in a warming climate. We focus on projected changes at 2 and 3 °C global warming levels (GWLs) and rely on scenario simulations based on the Representative Concentration Pathway (RCP) 8.5. Fire weather is quantified using the Canadian Forest Fire Weather Index (FWI) System (Van Wagner, 1987), as it relies solely on daily meteorological input fields and has been shown to perform well in Europe, especially in the Mediterranean (Carvalho et al., 2008; Jones et al., 2022; San-Miguel-Ayanz et al., 2012; Viegas et al., 1999). Prior to calculating projected fire weather danger, model input fields are bias adjusted using quantile delta mapping (QDM) (Cannon et al., 2015), with ERA5-Land reanalysis data (Muñoz-Sabater et al., 2021) serving as reference. We also use ERA5-Land reanalysis to estimate historical trends in FWI across Europe. Finally, we investigate subcomponents of the FWI system, individual meteorological fields, and vapor pressure deficit (VPD) to shed light on potential drivers of projected future changes in extreme fire weather. The main objectives of this study are as follows:
-
Examine the observed climatology of extreme fire weather across Europe and its associated trends since 1950 based on ERA5-Land.
-
Assess the added value of bias adjustment using QDM in terms of spatial patterns of bias in extreme FWI for the EURO-CORDEX multi-model ensemble median.
-
Quantify changes in the frequency and intensity of extreme fire weather at 2 °C and 3 °C GWLs, and identify the potential drivers underlying these changes based on the bias-adjusted EURO-CORDEX multi-model ensemble.
The study is structured as follows: Section 2 gives an overview of data and methods, Section 3 describes the results in detail, including the observed trends, the added value of bias adjustment, and projections of extreme fire weather across Europe in a warming climate. Section 4 summarizes the main results and provides a discussion.
2.1 Data
2.1.1 ERA5-Land Reanalysis
In this study, hourly atmospheric fields, including 2-meter temperature, precipitation, 10 meter u (zonal) and v (meridional) components of wind speed and 2-meter dew point temperature were used from the European Centre for Medium-Range Weather Forecasts (ECMWF) ERA5-Land reanalysis (Muñoz-Sabater et al., 2021). The main advantage of ERA5-Land is its enhanced horizontal grid resolution of 9 km, compared to 31 km for ERA5 (Muñoz-Sabater et al., 2021). The dataset covers the period from 1950 to the present, with data up to 2023 used in this study. ERA5-Land reanalysis data were used for several purposes throughout the study, which can be summarized as follows:
-
The hourly atmospheric fields were first used to calculate the original noon-time (12:00) FWI. These fields were then aggregated to the daily scale to estimate the most suitable proxy input variable combination to replace the original noon-time FWI calculation at the daily scale (see Table S1 in the Supplement for a complete list of variables used).
-
The historical climatology of FWI metrics and the associated trends were calculated using the selected daily proxy input combination.
-
The daily atmospheric fields derived from GCM-RCM chains were bias-adjusted using daily aggregated ERA5-Land values as a reference.
2.1.2 EURO-CORDEX Simulations
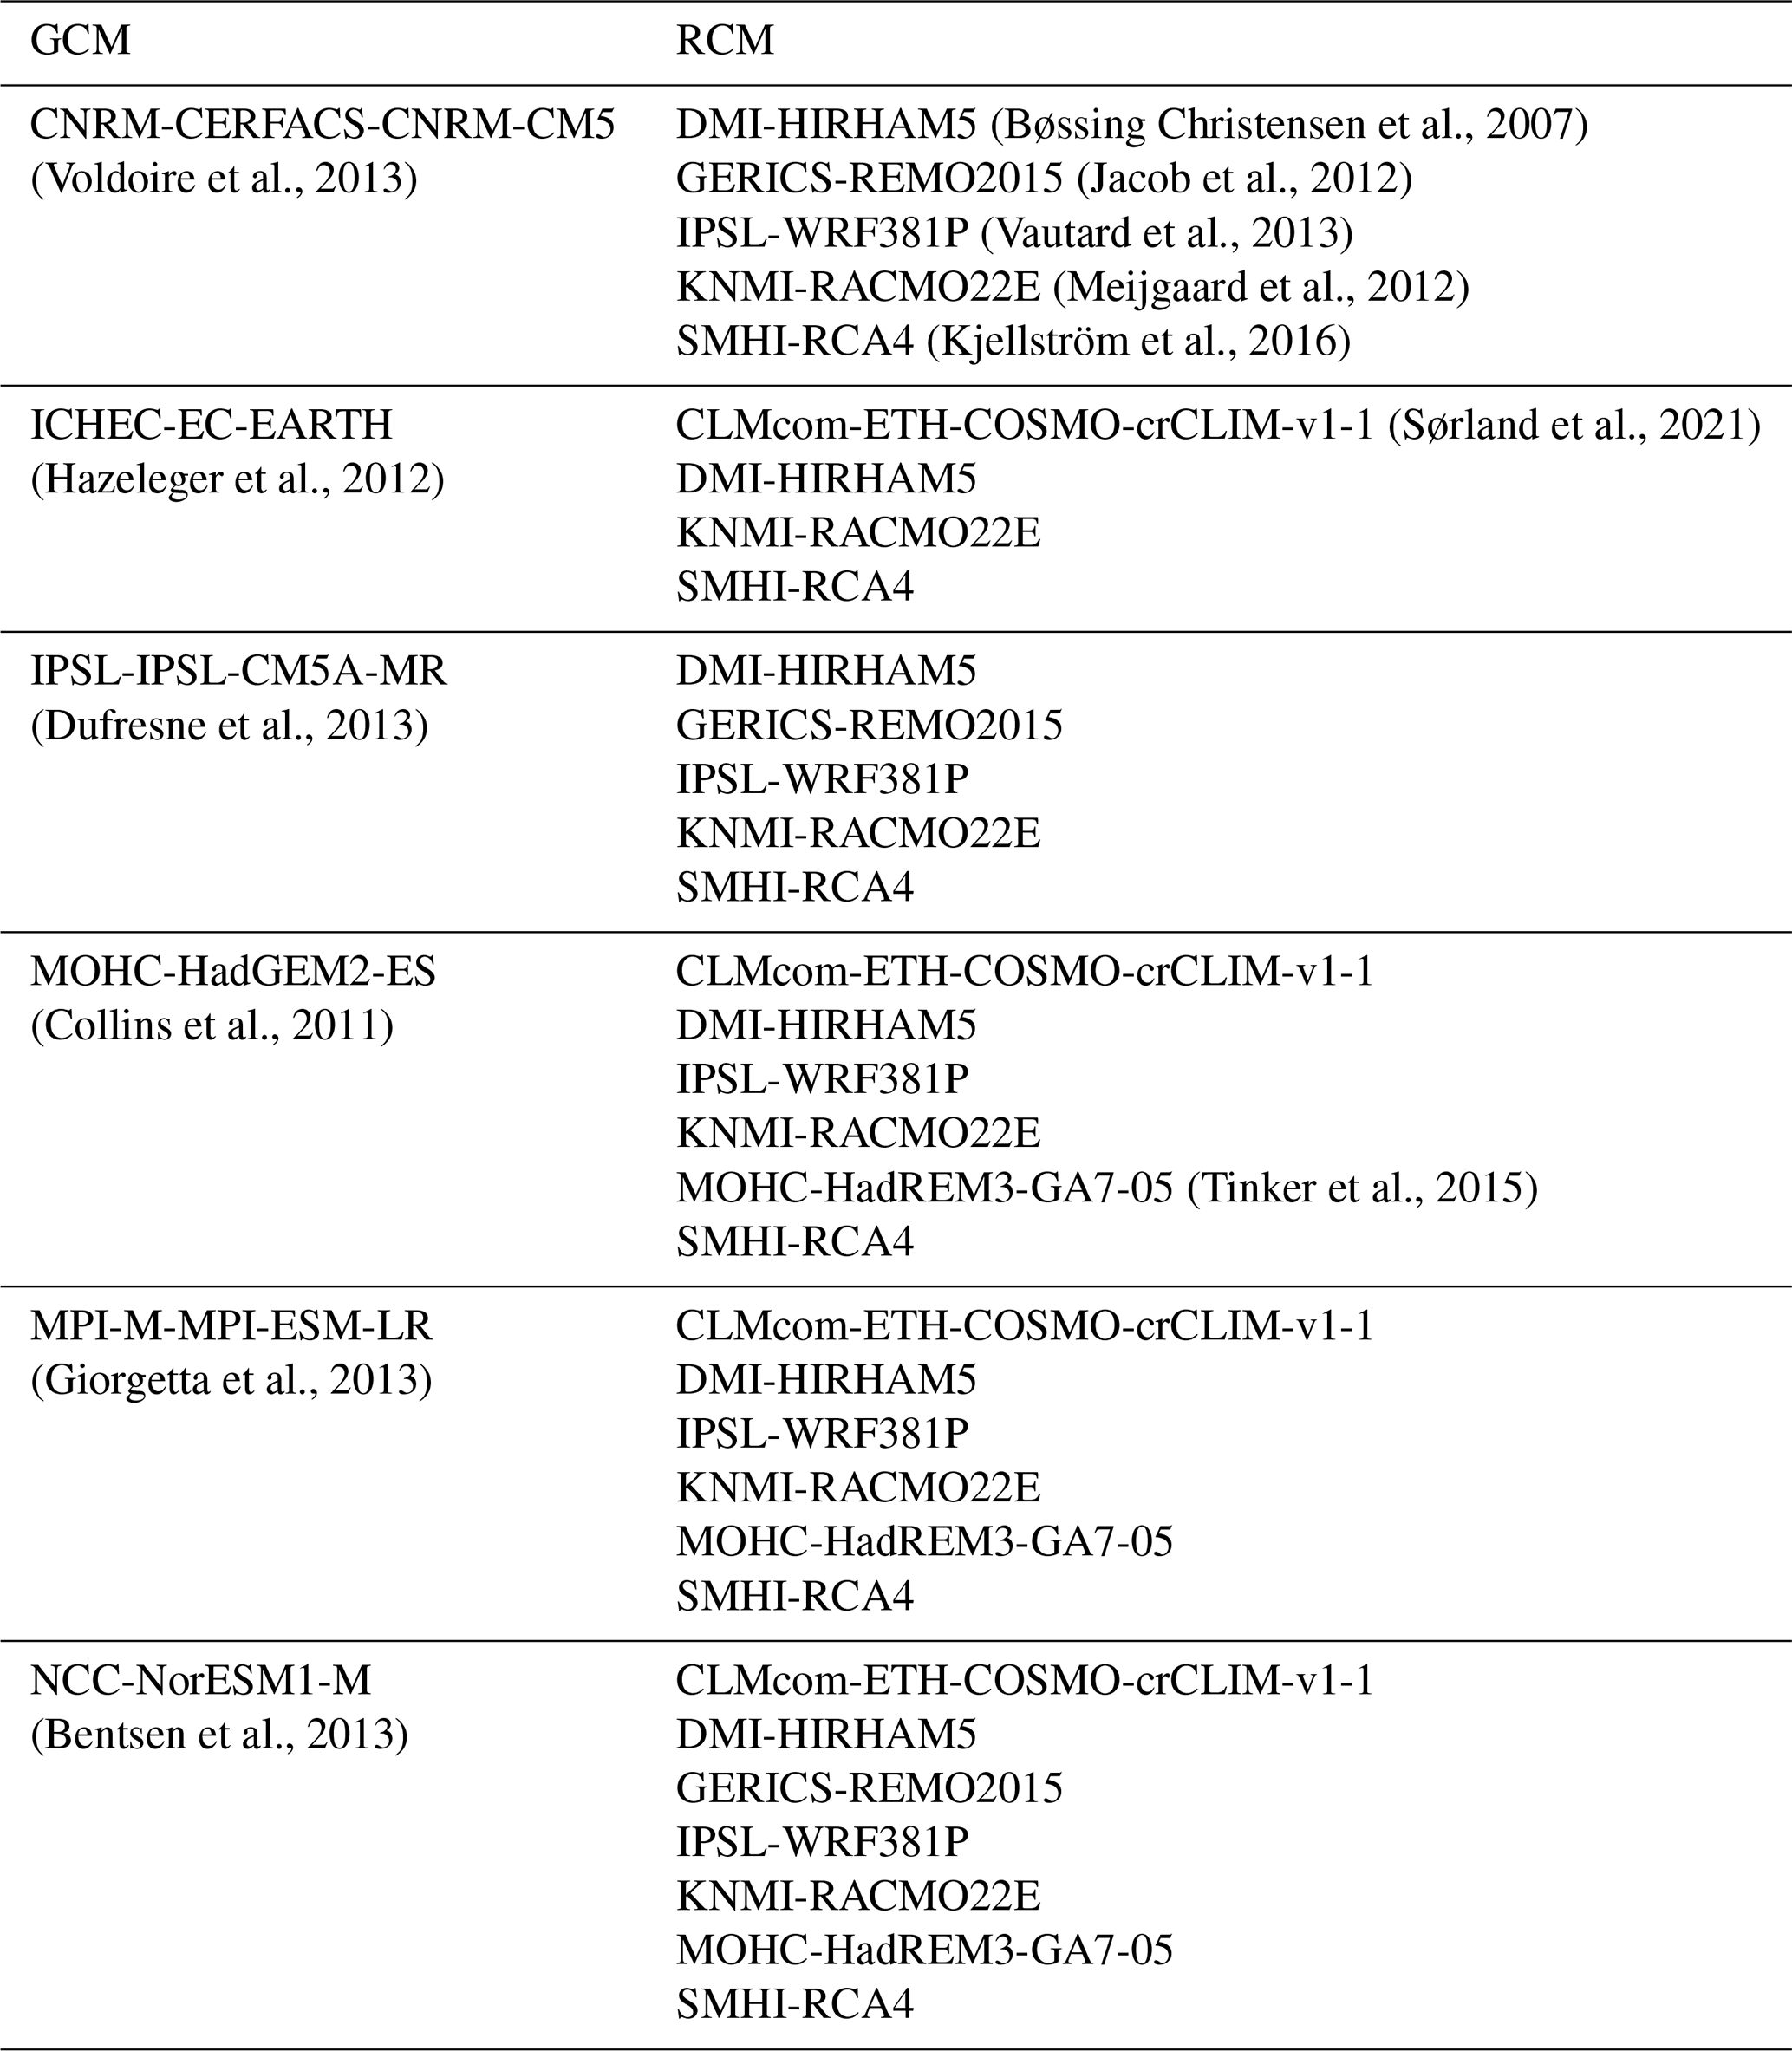
We considered a set of 33 GCM-RCM chains from the EURO-CORDEX framework (Jacob et al., 2014) to quantify future changes in extreme fire weather in Europe (the largest ensemble available during the data curation phase of this study in December 2024 included 34 model chains, from which we removed one due to quality issues). The variables used include daily maximum temperature, accumulated precipitation, mean relative humidity, and maximum wind speed (for details on variable selection, see Sects. 2.2.4 and 3.1). EURO-CORDEX simulations are dynamically downscaled from GCMs participating in CMIP5 (Taylor et al., 2012) to provide high-resolution regional climate simulations across Europe. All models share a common horizontal grid spacing of ∼ 12 km. Both historical simulations (covering the period from 1950 or 1970, depending on the model, to 2005) and scenario simulations (covering 2006 to 2100) were used. The scenario simulations follow the RCP8.5 scenario, which represents a high-end greenhouse gas emission scenario with a radiative forcing of 8.5 W m−2 by the end of the century. We focused exclusively on the RCP8.5 scenario as all simulations reach both 2 °C and 3 °C GWL thresholds within the 21st century under this pathway, which allows for consistent ensemble sizes and a robust comparison across warming levels. A single model realization (r1i1p1) was used for each model. All simulations were regridded to the ERA5-Land grid resolution of 9 km using first-order conservative remapping (Jones, 1999). The list of models used in this study is provided in Table 1.
(Bøssing Christensen et al., 2007)(Voldoire et al., 2013)(Jacob et al., 2012)(Vautard et al., 2013)(Meijgaard et al., 2012)(Kjellström et al., 2016)(Sørland et al., 2021)(Hazeleger et al., 2012)(Dufresne et al., 2013)(Collins et al., 2011)(Tinker et al., 2015)(Giorgetta et al., 2013)(Bentsen et al., 2013)Table 1List of the 33 GCM-RCM chains used in this study. All scenario simulations follow RCP8.5, so that all models reach the 3 °C GWL during the 21st century. All models belong to the same ensemble member r1i1p1.
In order to better understand regional differences in extreme fire weather behavior across Europe, these metrics have also been spatially aggregated and averaged over the PRUDENCE regions (Christensen and Christensen, 2007). In addition to the eight regions that were previously defined, Turkey was included as an additional subregion (Fig. 1a), as it has been shown to be particularly sensitive to extreme climate events (Gumus et al., 2023). We note that the eastern boundary of Turkey is not covered by the EURO-CORDEX domain and is therefore not included in this study.
2.1.3 Burned Area and Land Cover Data
In order to provide a historical context for the projected changes in fire weather, we used burned area data from the fifth version of the Global Fire Emissions Database (GFED5; Chen et al., 2023). This dataset provides a monthly burned area record from 2002 to 2022 at a 0.25° grid resolution, and is derived from the Moderate Resolution Imaging Spectroradiometer (MODIS) MCD64A1 burned area product (Chen et al., 2023). We used GFED5 burned area data to present the climatology of the total annual burned area fraction relative to the grid cell area across Europe (Fig. 1b).
We also obtained Global Land Cover data from Copernicus (Buchhorn et al., 2020) for 2019 at a 100 m grid resolution to mask out regions that are considered unburnable. Similar to what was done for the EURO-CORDEX simulations, we first interpolated this field to the ERA5-Land grid resolution using first-order conservative remapping. Then, land areas classified as containing more than 80 % of urban/built-up, bare or sparse vegetation, snow and ice, or water were considered unburnable (Abatzoglou et al., 2019). Finally, this interpolated unburnable land mask was applied to all fire weather-related analyses throughout the study.
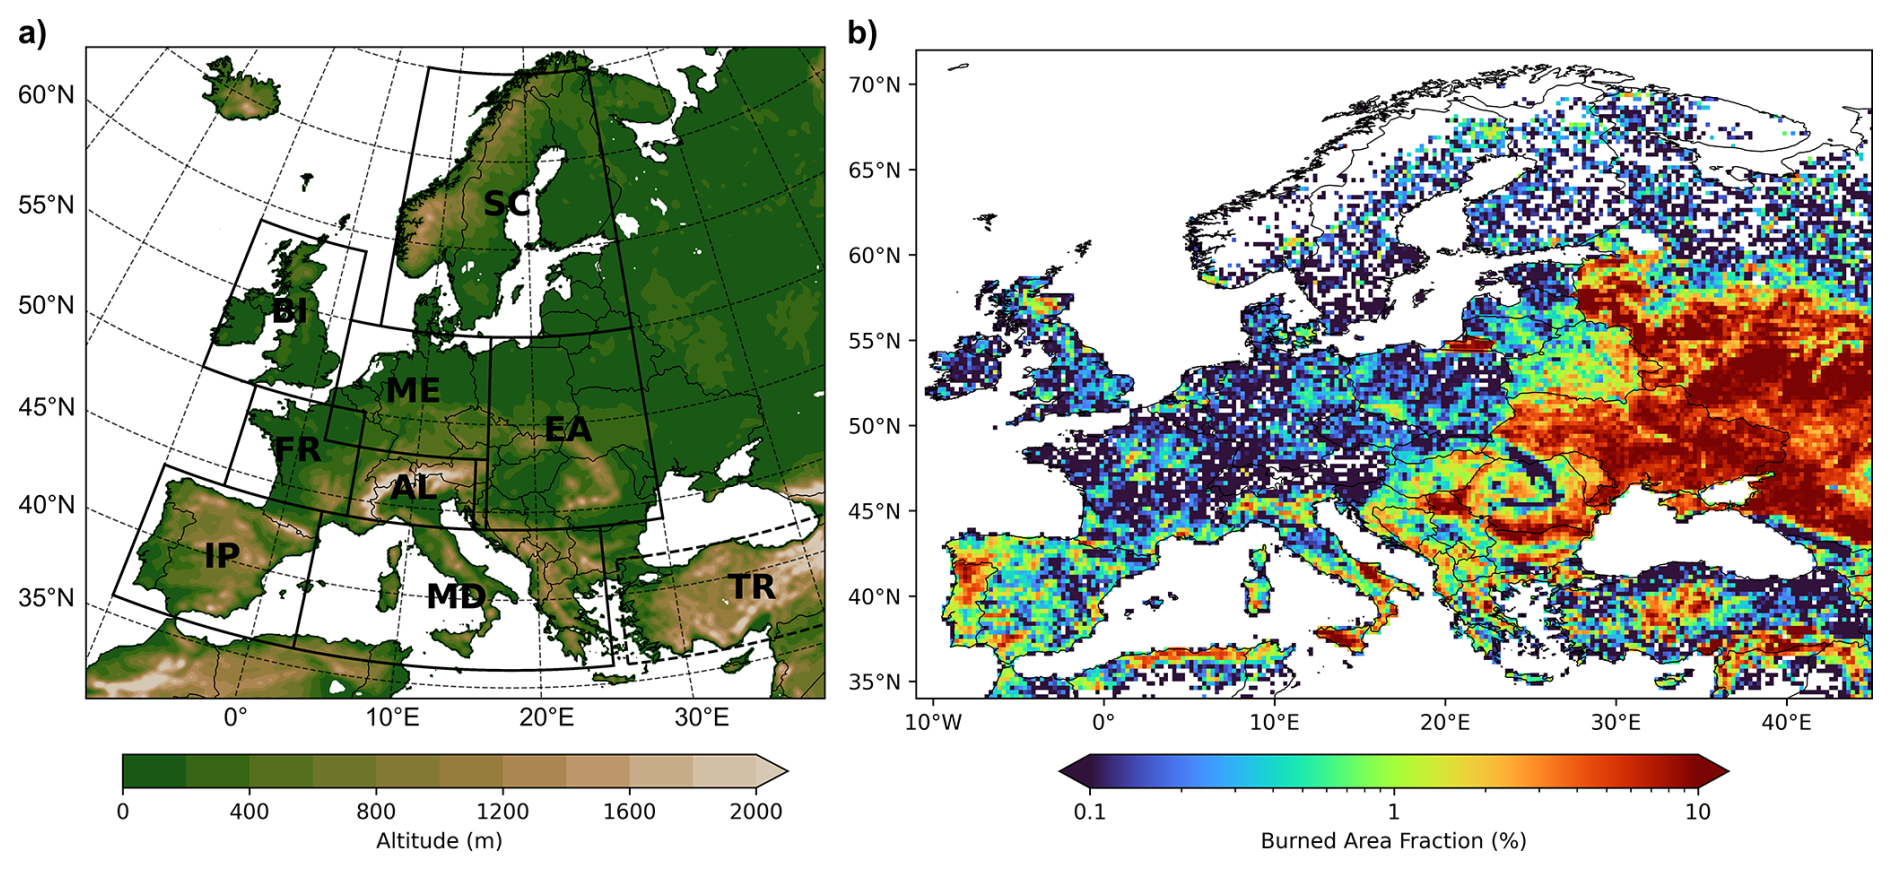
Figure 1(a) PRUDENCE regions investigated in this study, based on the definitions of Christensen and Christensen (2007) and shown with surface altitude data from COSMO-CLM in the EURO-CORDEX domain (Sørland et al., 2021). BI = British Isles, SC = Scandinavia, FR = France, ME = Mid-Europe, AL = Alps, EA = Eastern Europe, IP = Iberian Peninsula, MD = Mediterranean, TR = Turkey. Note that Turkey is included here in addition to the previously defined regions. (b) Climatology of the annual total burned area fraction relative to the grid cell area (% yr−1), calculated for the period 2002–2022 based on GFED5 (Chen et al., 2023). The figure aims to provide a historical context to the projected changes in fire weather extremes from a burned area perspective.
2.2 Methods
2.2.1 Global Warming Levels
We use GWLs to quantify changes in extreme fire weather as many drivers of global and regional climate impacts are closely linked to GWLs (Masson-Delmotte et al., 2021). GCMs have different climate sensitivities and each follows its own trajectory to reach a given GWL at a different time. Using the GWL approach enables the estimation of impacts independently of the specific scenario or timing at which a given GWL is reached. This study focuses on +2 and +3 °C GWLs relative to the preindustrial reference period 1881–1910 following Moemken et al. (2022) and Hundhausen et al. (2024). The methodology is based on the time sampling approach (James et al., 2017) as implemented by Vautard et al. (2014) and Teichmann et al. (2018) for regional climate change signals in Europe.
First, the 30-year running average of the global mean temperature was calculated from the scenario simulations of the GCMs. The observed global warming from 1881–1910 to 1971–2000 was already estimated as 0.46 °C (Vautard et al., 2014). The average global mean temperature of the GCMs during 1971–2000 was then used as historical reference, so that an increase of 1.54 °C (2.54 °C) from that value corresponds to +2 °C (+3 °C) GWL relative to the preindustrial period. Next, 30-year time periods were identified based on when the relevant GWLs are reached for the first time in the running average (as listed in Table S2). We note that although the GWLs are defined relative to the preindustrial period, the change signals presented in this study are expressed relative to the historical reference period (1971–2000, +0.46 °C). This is a deliberate choice, as RCM simulations from the EURO-CORDEX framework only begin after 1950.
2.2.2 Bias Adjustment of EURO-CORDEX Simulations
GCMs are known to have systematic biases due to various factors, such as discretization and spatial averaging within grid cells (Teutschbein and Seibert, 2012), inadequate representation of thermodynamic processes (Wehrli et al., 2018), or inaccuracies in simulating atmospheric dynamics (Shepherd, 2014). Since the nested downscaled model is driven by imposed boundary conditions, RCMs also often inherit the biases of their driving GCMs, such as incorrect placement of storm tracks (Giorgi, 2019), and can also introduce their own biases. Therefore, it is common practice to adjust biases in climate model output, particularly before using the results for impact modeling (Chen et al., 2021; Dosio and Paruolo, 2011; Hakala et al., 2018; Muerth et al., 2013).
Here, we applied the QDM method (Cannon et al., 2015) to adjust the biases in the input fields extracted from EURO-CORDEX simulations, which were subsequently used to calculate the FWI. It could be argued that adjusting the FWI itself might be a more direct and computationally cheaper approach than adjusting the input fields, especially if the sole objective is to increase confidence in the FWI projections. However, our aim is not only to enhance confidence in the FWI projections but also to understand the physical drivers of the expected changes in FWI by tracing changes in the underlying input fields. To avoid inconsistencies that might arise from adjusting only the FWI, each individual input field was adjusted via QDM.
In order to apply QDM, the non-exceedance probabilities of the simulations were first calculated over the projected time window:
where xs,p(t) is the projected simulation value of the variable of interest at time step t, is the empirical cumulative distribution function (CDF) of the time series being corrected and τ(t) is the non-exceedance probability associated with time step t and has a range between 0 and 1.
Next, the relative change signal between the projected and historical simulations was calculated:
where Δ(t) is the relative change signal at time step t and is the inverse CDF of the simulation during the calibration period.
Finally, the calculated climate change signal was multiplied by the corresponding reference observation value (from ERA5-Land) at the same quantile during the calibration period:
where xba(t) is the bias adjusted variable at time step t and is the inverse CDF of the reference data (ERA5-Land) during the calibration period (1971–2000).
We note that the described multiplicative approach was applied to precipitation, mean relative humidity, and maximum wind speed. An additive version of the same method was used for maximum temperature. For further details on the bias adjustment methodology, please see Section S1 in the Supplement.
2.2.3 FWI Calculation
We employ the widely used Canadian Forest Fire Weather Index System (Van Wagner, 1987) to calculate the historical and projected distribution of extreme fire weather throughout Europe. It consists of six components. The first three components are fuel moisture codes, namely, Fine Fuel Moisture Code (FFMC), Duff Moisture Code (DMC), and Drought Code (DC) and they represent the dryness of fuels in different layers of the Canadian forest floor (Wotton, 2009). The final three components of the FWI system represent fire behavior: Initial Spread Index (ISI) predicts the potential rate of fire spread based on wind speed and surface fuel dryness, BUI represents the total amount of fuel available for burning and FWI, which results from the combination of the previous two, is a numeric rating of the potential fire intensity (Wotton, 2009). Figure 2 provides a schematic overview of the calculation flow and the required atmospheric input fields.
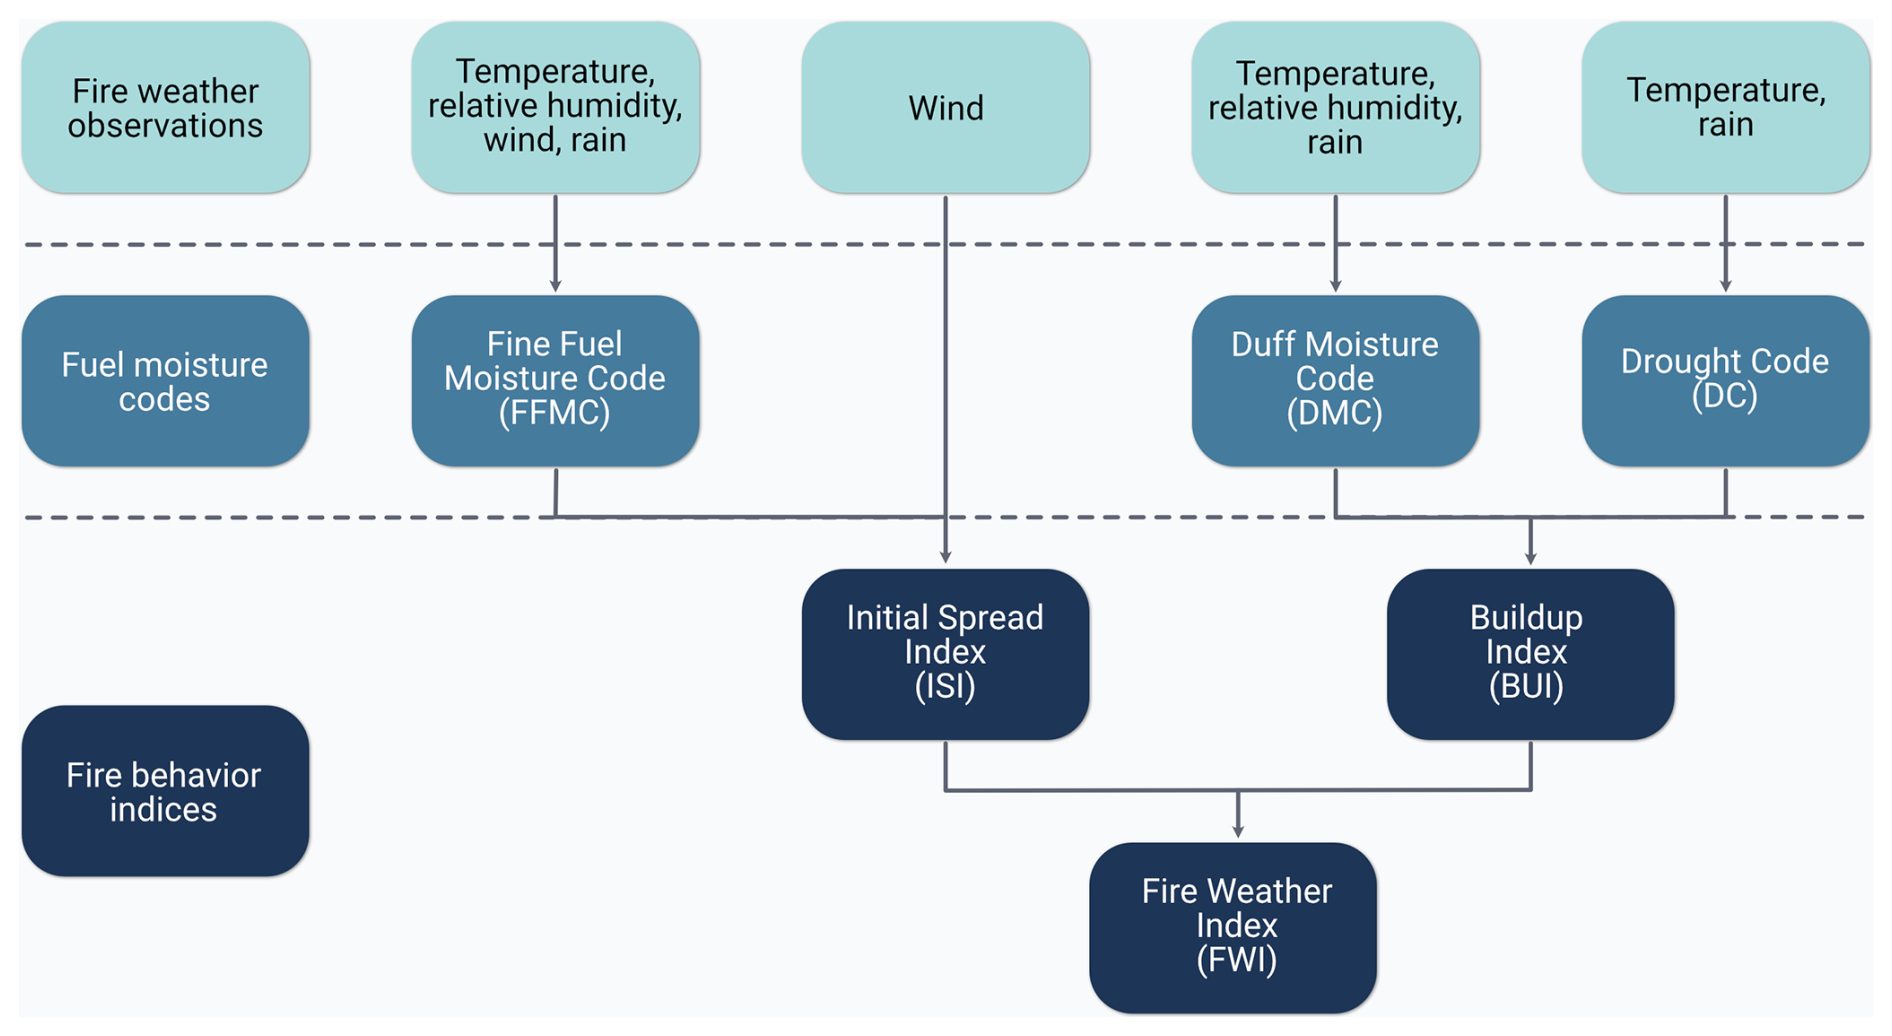
Figure 2Schematic representation of the Canadian Forest Fire Weather Index System, showing its input variables and six components, based on Van Wagner (1987).
By definition, the FWI calculation requires temperature, relative humidity, and wind speed at local noon (12:00), as well as accumulated precipitation from the previous day's noon to the current day's noon. All input data required for the FWI calculation are directly available from the ERA5-Land reanalysis product, except for relative humidity. Therefore, relative humidity was calculated using the 2 m temperature and 2 m dewpoint temperature outputs from ERA5-Land, applying the Magnus formula (Alduchov and Eskridge, 1996). FWI was then computed for the ERA5-Land reanalysis from 1950 to 2023 using these four atmospheric fields at noon as input.
To account for dry conditions outside the fire season (fall and winter), the overwintering approach was applied to the Drought Code (DC) (McElhinny et al., 2020). The overwintering calculation requires a definition of the fire season, outside of which FWI is not calculated. The definition used here follows Wotton and Flannigan (1993), where the fire season begins when the maximum temperature exceeds 12 °C for at least three consecutive days and ends when it drops below 5 °C for at least three consecutive days (Quilcaille et al., 2023). The purpose of overwintering the DC is to capture dry fall and winter conditions, which can lead to more severe fire weather conditions at the beginning of the fire season compared to the default DC value (McElhinny et al., 2020).
We used four annual FWI metrics to analyze the extreme fire weather behavior at each grid cell for the reference period (1971–2000, +0.46 °C) and at +2 and +3 °C GWLs, following the metrics used in Jolly et al. (2015), Abatzoglou et al. (2019) and Quilcaille et al. (2023):
-
Number of days exceeding the reference period (1971–2000) 95th percentile of FWI (FWI95 d), representing days with potentially high fire danger at the local scale
-
Number of days exceeding the mid-range FWI value (FWIfwsl), as an indicator of the duration of the fire season
-
30-year averaged annual maximum FWI (FWImax), as an indicator of the magnitude of the local extreme fire danger
-
30-year average of the annual peak 90 d mean FWI (FWIfs), representing the average fire weather conditions during the peak fire season.
The mid-range FWI value (FWImid) is defined as the mean of the 30-year averaged annual minimum and maximum FWI during 1971–2000. It should be noted that despite the high spatial correlation among these metrics due to their dependence on the same climatic drivers, each of them captures a different dimension of fire weather danger from a process- and impact-based perspective.
2.2.4 Concatenation of the Reanalysis Data and Sensitivity Analysis
In order to account for the variation in local noon times across Europe, three different time zones were used to extract atmospheric fields at the corresponding local noon: UTC+1 for grids west of 0° longitude, UTC+2 for those between 0 and 20° E longitudes and UTC+3 for grids east of 20° E longitude. These three regions were then concatenated into a single product to represent the original FWI calculation.
As many RCMs in the EURO-CORDEX framework do not provide sub-daily information, we searched for the best proxy input combination at daily resolution to approximate the typical noon-time FWI calculation. With this aim, hourly ERA5-Land data were first aggregated to daily resolution, including several combinations (a summary of the daily aggregated variable combinations tested in this study is provided in Table S1). Then, the FWI estimates derived from these combinations were compared with the original noon-time FWI calculation based on ERA5-Land. Specifically, the relative percentage bias in the 95th percentile of FWI was calculated at grid scale to evaluate the performance of each proxy input combination:
where FWI is the FWI 95th percentile value obtained from the original calculation scheme (noon-time variables), FWI is the FWI 95th percentile value obtained using the input combination being tested. The time period covered is 1950 to 2023.
Finally, the combination resulting in the lowest absolute area-weighted average bias was selected (see Sect. 3.1). Since some daily resolution atmospheric fields may not be available for some models (e.g., minimum relative humidity), obtaining a sufficiently large model ensemble was also considered in the selection process.
2.2.5 Vapor Pressure Deficit
To shed light on the potential drivers of changes in extreme fire weather, we further investigated changes in VPD. VPD is defined as the difference between the saturation vapor pressure (es) and the actual vapor pressure (ea) and serves as an indicator of atmospheric aridity (Seager et al., 2015). It is an essential metric for understanding how atmospheric conditions influence fuel dryness (He et al., 2025) and has been shown to be closely linked to wildfire activity, for example, in western U.S. forests (Abatzoglou and Williams, 2016; Williams et al., 2019). VPD can be calculated using temperature and relative humidity:
where RH is the relative humidity and es(Ta) is the saturation vapor pressure as a function of the air temperature Ta, calculated using the Clausius-Clapeyron equation:
where es(T0) = 6.112 hPa is the saturation vapor pressure at the reference temperature T0 = 273.15 K, Lv = 2.5×10⁶ J kg−1 is the latent heat of vaporization for water and Rv = 461 J kg−1 K−1 is the specific gas constant for water vapor. We note that daily maximum temperature and mean relative humidity from the bias adjusted EURO-CORDEX simulations were used here to estimate projected changes in VPD, which leads to a possible overestimation (He et al., 2025). However, the focus of this study is not on absolute VPD values, but rather on deviations from the baseline, which minimizes the implications of possible shortcomings.
2.2.6 Composite Analysis of Meteorological Conditions during Extreme Fire Weather Days
In order to characterize the average background conditions associated with the extreme fire weather days, we created composites of the meteorological conditions. To this end, we first calculated the 99th percentile of FWI for each grid cell and each warming level (reference period, +2 and +3 °C GWLs) using the 30-year period corresponding to that climate state. Then, days exceeding this threshold during each warming level (FWI > FWI99) were identified and used as a mask to extract the meteorological conditions that correspond to these extreme fire weather days. Finally, these meteorological fields were averaged over all exceedance days within each period and across the PRUDENCE regions for each model chain in the ensemble.
We created these composites for daily maximum temperature, 30 d accumulated antecedent precipitation, daily mean relative humidity, daily maximum wind speed, and VPD, as well as for FWI system sub-components (ISI and BUI), all of which are conditioned on days when FWI exceeds FWI99. Changes in these meteorological composites were then analyzed to diagnose the association between extreme fire weather and its drivers in a warming climate.
2.2.7 Significance and Robustness
To calculate trends in the historical period, the non-parametric Theil-Sen slope estimator was used, as it is relatively insensitive to outliers (Sen, 1968; Theil, 1950). The significance of these trends was tested using the non-parametric Mann-Kendall test (Kendall, 1955; Mann, 1945) at a significance level of p<0.05.
To assess the robustness of the future climate change signal in the FWI indices, a criterion based on model agreement in both the significance and sign of the reported change was applied. Specifically, the climate change signal is considered robust only when at least 66 % of the models agree on both the sign and the statistical significance of the change (Jacob et al., 2014; Pfeifer et al., 2015). The significance of the simulated change was evaluated using a paired t-test at a significance level of p<0.05.
3.1 Sensitivity to Different Input Data
The typical FWI calculation is performed using the relevant atmospheric fields at local noon-time (Van Wagner, 1987). Since many RCMs do not provide subdaily scale information, daily fields need to be identified in such a way that they can replace the typical noon-time calculation with minimal bias. Figure 3 shows the distribution of the relative percentage bias in the 95th percentile of FWI calculated using the four different input combinations (given in Table S1) relative to the typical noon-time 95th percentile of FWI (FWI) across Europe based on ERA5-Land reanalysis (note that the straight lines at 0 and 20° longitudes result from to the concatenation operation described in Sect. 2.2.4). At the European scale, combinations that include mean relative humidity generally underestimate extreme fire weather danger (Fig. 3a and b), while those that include minimum relative humidity tend to overestimate it (Fig. 3c and d). Regarding the magnitude of the bias, using minimum relative humidity instead of mean relative humidity increases the absolute bias when the accompanying variable is maximum wind (Fig. 3a and c), whereas it decreases the bias when the accompanying variable is mean wind (Fig. 3b and d).
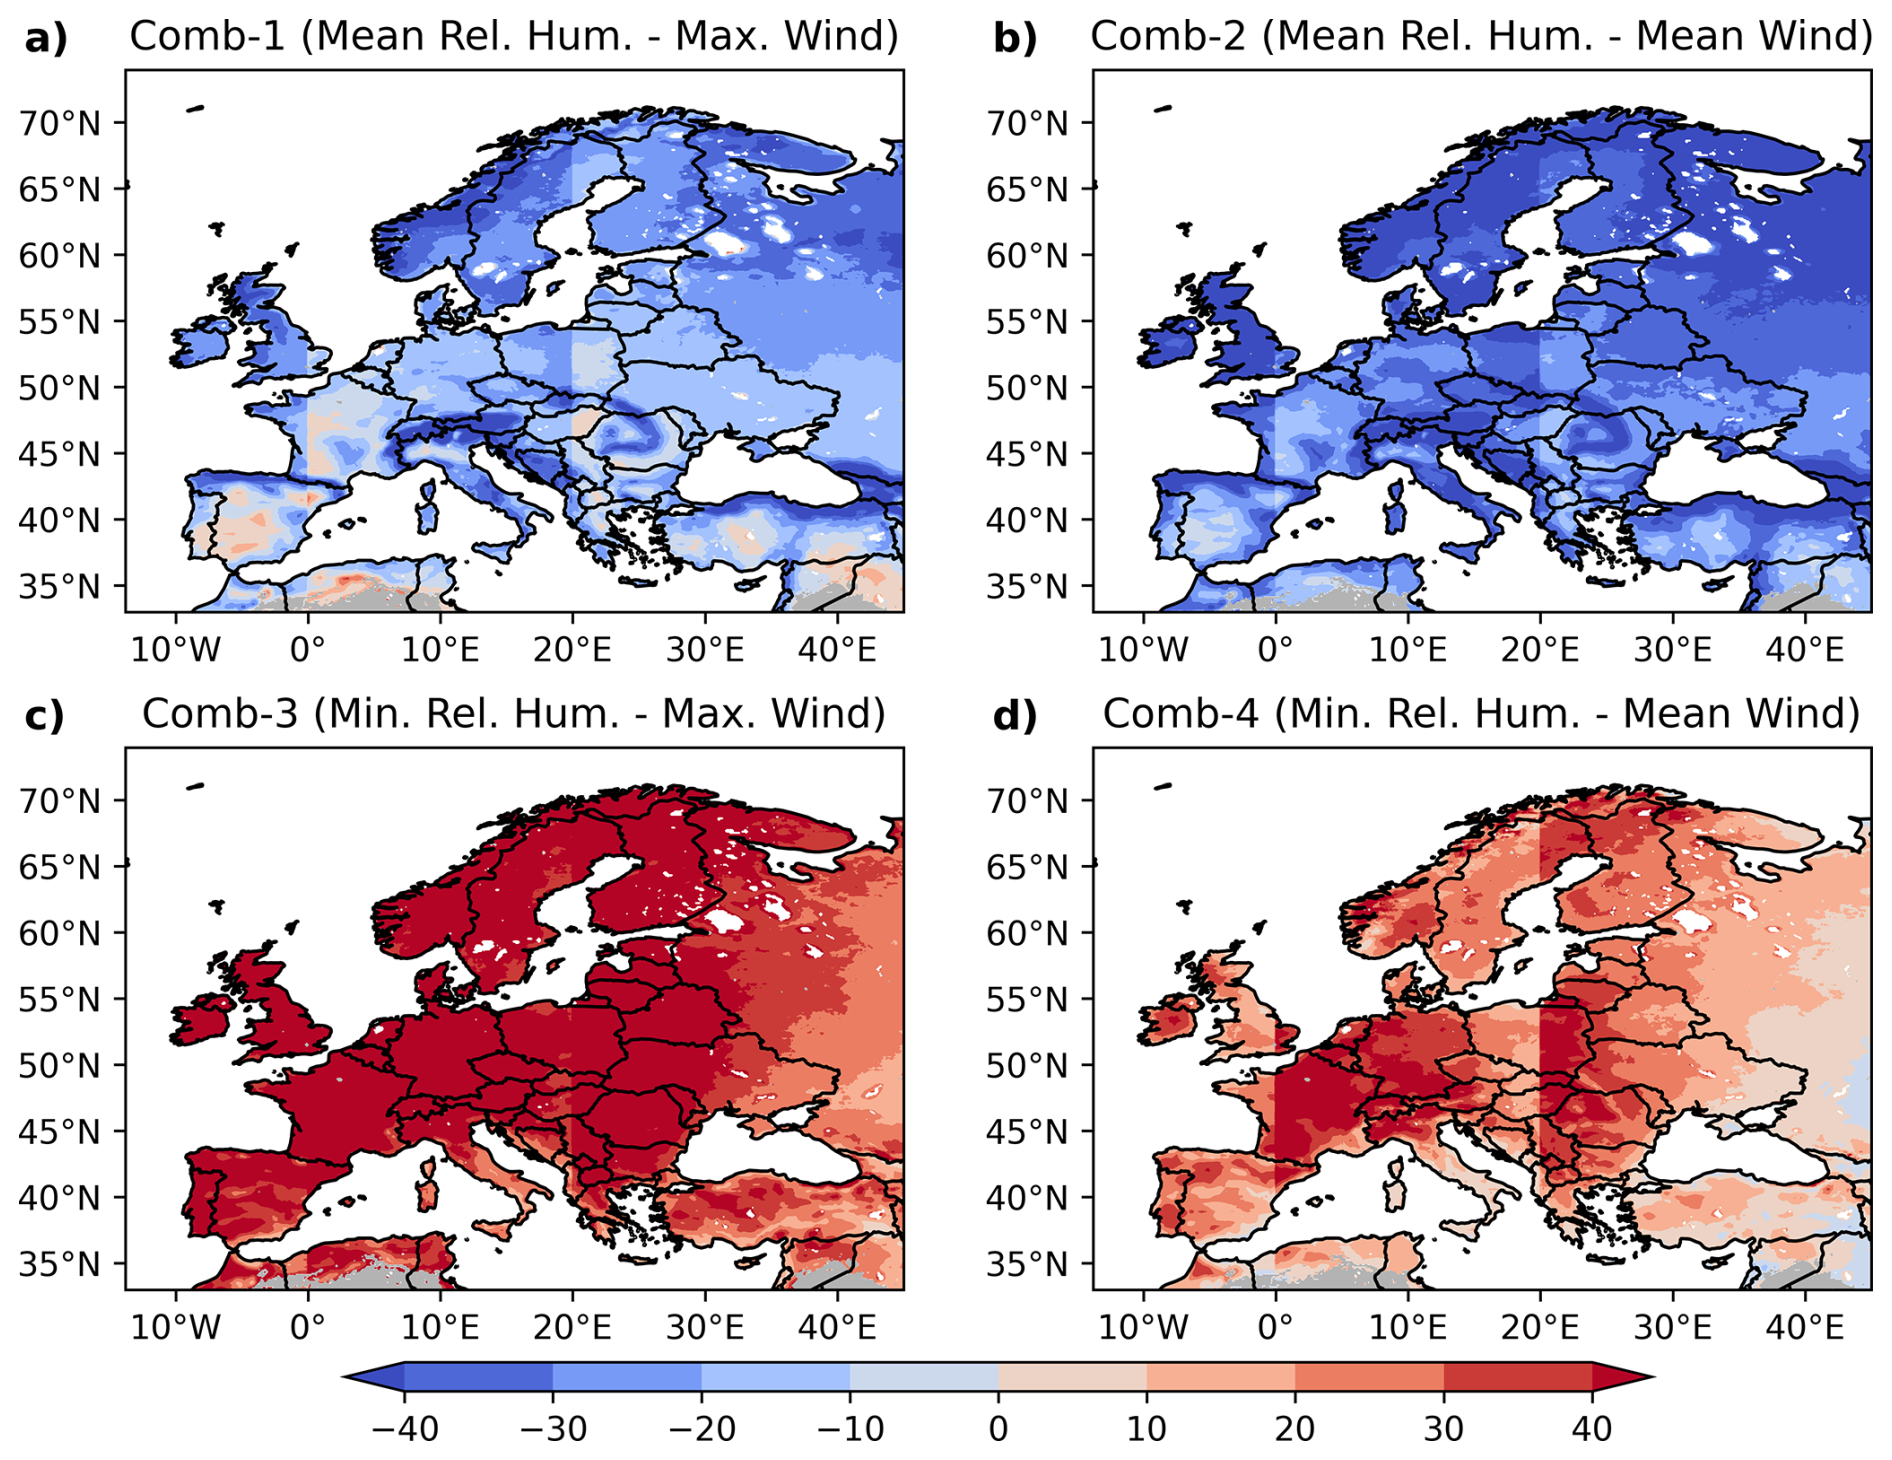
Figure 3Relative percentage bias (%) of the 95th percentile of FWI calculated using the four daily input variable combinations (a) Comb-1, (b) Comb-2, (c) Comb-3, and (d) Comb-4, compared to the original noon-time FWI calculation based on ERA5-Land reanalysis data. Daily maximum temperature and daily accumulated precipitation are common to all combinations. The time period analyzed is 1950–2023. Areas classified as unburnable are shown in gray. Note that the artifacts near 0 and 20° longitudes result from the concatenation operation described in Sect. 2.2.4. Details of the variables used in all combinations are given in Table S1.
Since maximum temperature and daily precipitation are common in all combinations, using mean values for both relative humidity and wind leads to a substantial underestimation of FWI with a mean absolute relative bias of 35.1 % (Fig. 3b). In contrast, using daily extremes, i.e., minimum relative humidity and maximum wind speed, considerably overestimates FWI, resulting in a mean absolute relative bias of 43.9 % (Fig. 3c). Thus, using the daily extreme for one variable and the mean for the other appears to offer a balanced compromise. The mean absolute biases for these combinations are similar: 21.2 % for Comb-1 and 20.8 % for Comb-4 (Fig. 3a and d, respectively). Sensitivity tests show that this spatial pattern of bias between the different combinations does not depend on the 95th percentile threshold and is qualitatively similar across other parts of the distribution (Figs. S1–5 in the Supplement). Selecting Comb-4 would significantly reduce the number of models in the EURO-CORDEX ensemble, as minimum relative humidity is not an available output for most simulations. Therefore, Comb-1 is selected to calculate the FWI projections using the EURO-CORDEX ensemble, namely, daily maximum temperature, daily accumulated precipitation, mean relative humidity, and daily maximum wind speed. The remainder of the analysis in this study uses these atmospheric fields, for both ERA5-Land reanalysis and EURO-CORDEX models to ensure consistency.
3.2 Observed Climatology and Trends
To better understand the influence of ongoing climate change on fire danger in Europe, this section explores the climatology and trends of two FWI metrics, namely FWImid and FWI95 d, for the period 1950–2023 based on ERA5-Land data. We begin with FWImid, first presenting its climatology (Fig. 4a), followed by the corresponding trends (Fig. 4c). The FWImid climatology displays a latitudinal gradient, with the highest values found around the Mediterranean Basin due to hot and dry summers, while the lower values are found in northern Europe (Fig. 4a). The Iberian Peninsula and Turkey are mainly associated with FWImid values in the range of moderate and high levels of fire risk according to the scale developed by San-Miguel-Ayanz et al. (2012). FWImid shows a small but statistically significant positive trend in the central Iberian Peninsula, France, and Germany, with statistically significant trends observed in almost 30 % of the total burnable area across the study domain (Fig. 4c). Most of Europe shows an increase in the intensity of fire weather conditions, but in eastern Europe and Scandinavia the trends are generally not statistically significant. It is also important to note that some of these regions are historically not prone to burning due to limiting factors such as climate or lack of ignition sources, as in parts of Norway (Fig. 1b).
FWI95 climatology (Fig. 4b) displays the highest values in the Mediterranean Basin, with a latitudinal gradient across Europe except for lower values in mountainous regions. FWI95 values above 38 indicate very high fire danger (San-Miguel-Ayanz et al., 2012), but this relationship varies regionally: higher values (∼ 50) usually signal extreme danger in warm and dry climates, while lower values (∼ 25) may indicate similar danger in cooler and moister climates (Kudláčková et al., 2024). Therefore, FWImid and FWI95 should be interpreted with caution, taking into account the local climate and biome.
Regarding the trends in FWI95 d (Fig. 4d), more than 36 % of all burnable areas exhibit a significant trend, almost all of which indicate an increase. Notable positive trends were observed in the Iberian Peninsula, France, Germany and Ukraine, with trends exceeding 3 d decade−1 in some areas, corresponding to more than 20 additional days of extreme fire weather over the 74-year study period. Some areas of the Iberian Peninsula show trends above 5 d decade−1, amounting to almost 40 additional days of high fire danger during the study period. In contrast, a small region in the eastern Mediterranean shows a statistically significant negative trend, while parts of Scandinavia and the United Kingdom show either no trend or negative but non-significant changes. Other fire-prone regions, including Italy, the Balkans, and the eastern Mediterranean, show mixed and generally non-significant trends, reflecting large interannual variability in extreme fire weather conditions. We note that an analysis focusing on more recent decades (e.g., 1980–2023) results in a much higher proportion of significant trends, with up to 61 % of the burnable land area exhibiting statistically significant trends (results not shown).
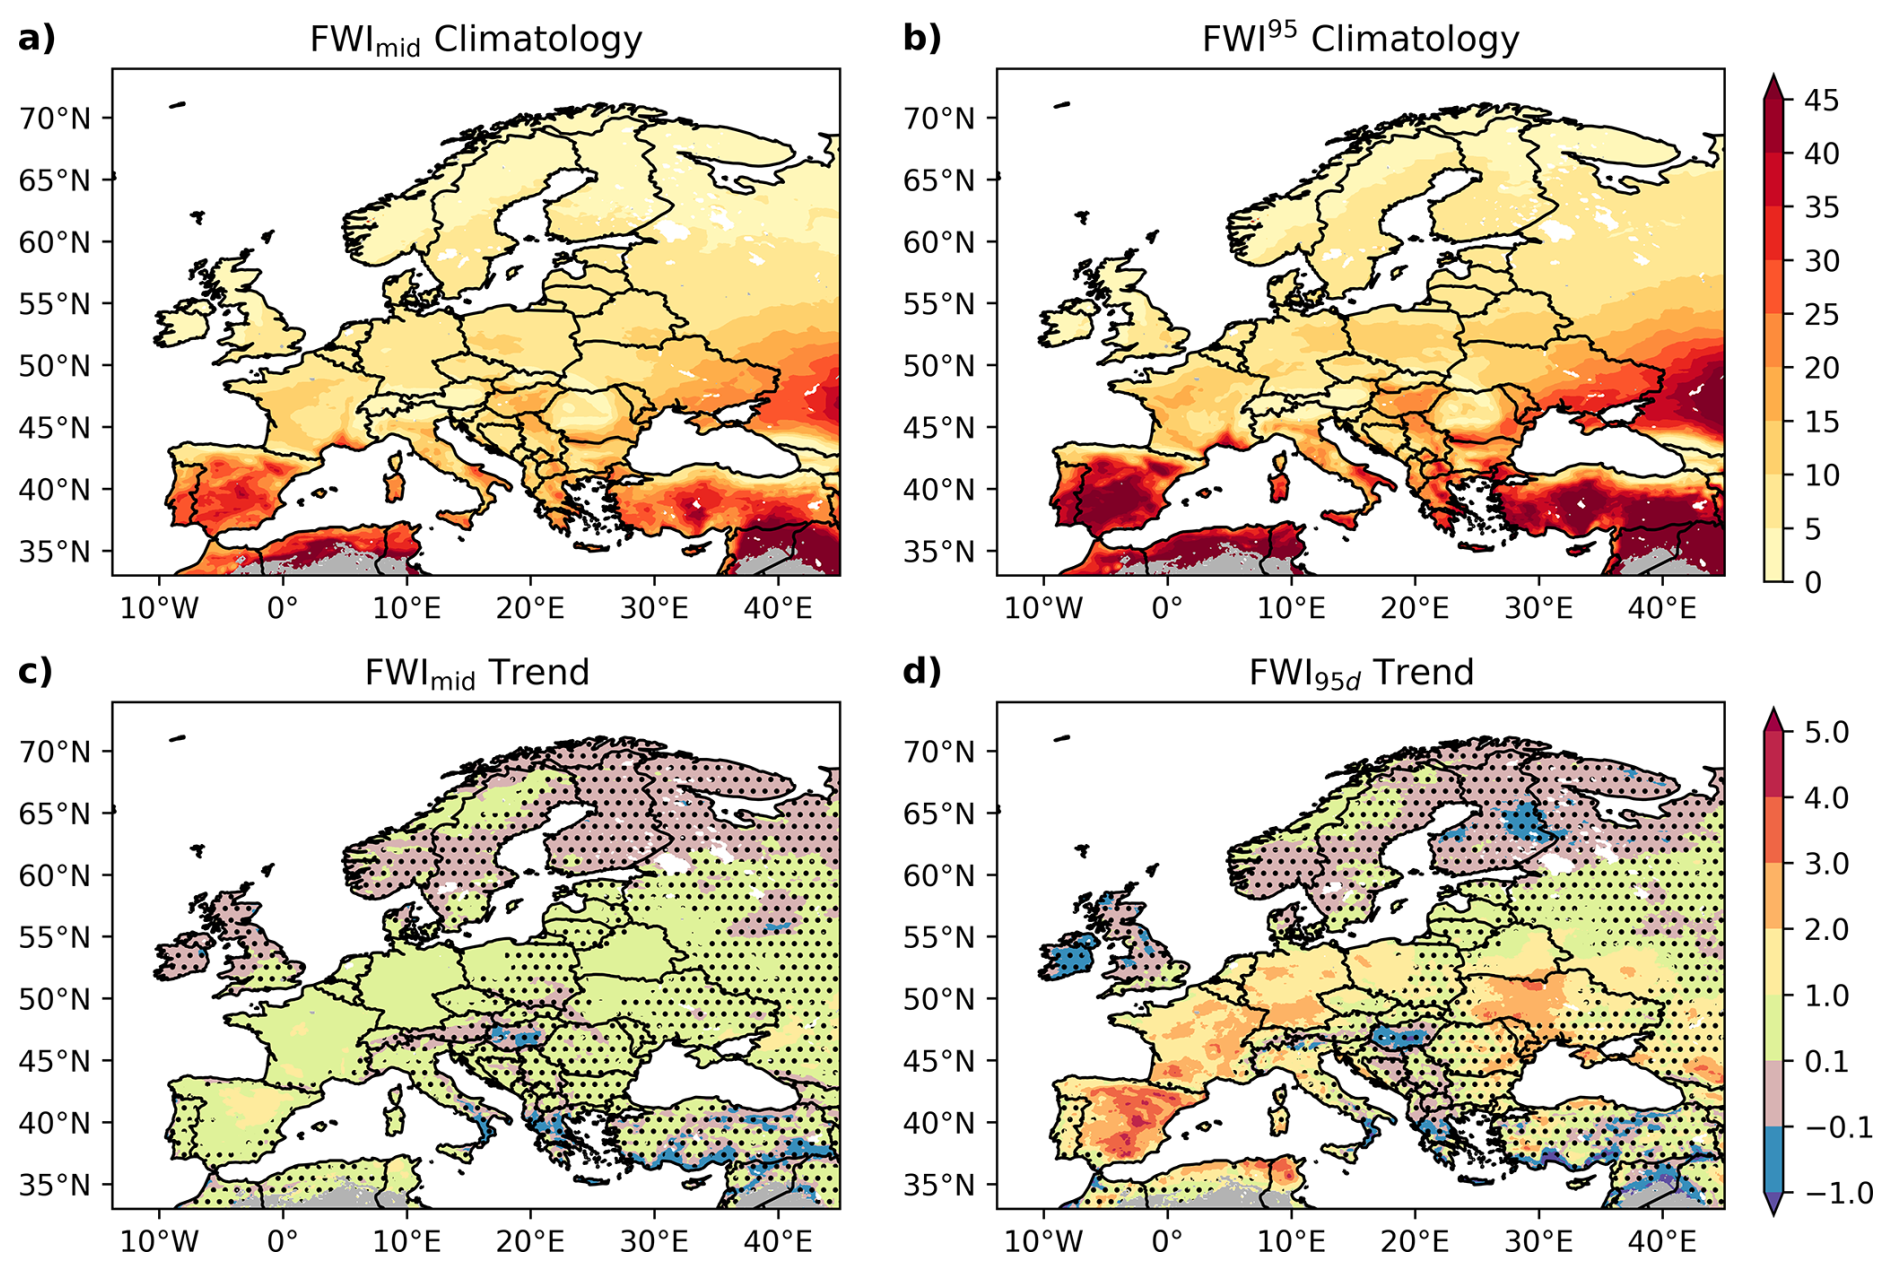
Figure 4(a) Observed climatology of the mid-range FWI (FWImid) and (b) the 95th percentile FWI (FWI95) during the analysis period of 1950–2023 based on ERA5-Land reanalysis data. (c) Observed trends (decade−1) in FWImid and (d) in the number of days per yr when FWI exceeds the 95th percentile (FWI95 d) relative to the reference period 1971–2000 (days decade−1) based on ERA5-Land reanalysis data. Trends are calculated using the Theil-Sen slope estimator. Areas without stippling indicate regions where the trend is statistically significant (p<0.05), according to the Mann-Kendall test. The analysis covers the period 1950–2023. Areas classified as unburnable are shown in gray. Note that a single colorbar is used for both trend panels, although the units differ.
3.3 Evaluation of Model Performance after Bias Adjustment
GCMs are known to exhibit systematic biases for various reasons, and RCMS often inherit these biases because they use GCMs as boundary conditions for downscaling and may also introduce their own biases (Giorgi, 2019). Figure 5 evaluates the bias in the 95th percentile of the FWI for the EURO-CORDEX ensemble median before and after bias adjustment, relative to the ERA5-Land reanalysis. It should be noted that the time period for the evaluation here is the same as the calibration period for bias adjustment (1971–2000). Although the performance of bias adjustment methods is typically evaluated using a separate validation period (e.g., Cannon et al., 2015), we focus on evaluating model performance during the calibration period as the historical simulations are not long enough to allocate a separate validation period for most of the EURO-CORDEX models, considering that 30 years of data have already been used for calibration. In addition, it is important to note that a cross-validation strategy may not always provide reliable results when evaluating the bias adjustment performance, as the internal variability of the climate system can dominate the differences between calibration and validation periods, potentially leading to misleading evaluations, particularly in mid-latitudes (Maraun and Widmann, 2018).
Adjusting the biases of the individual model input fields prior to the calculation of the FWI results in a significant reduction in the bias of the FWI ensemble median (Fig. 5). The spatial mean of the absolute relative percentage bias in the 95th percentile is 80 % before adjustment (Fig. 5a), with particularly large biases found south of the 50° latitude. After bias adjustment, this spatial mean bias of the ensemble median is reduced to less than 9 % (Fig. 5b), with significant improvements observed in regions where the raw ensemble median previously exhibited large biases. Sensitivity tests show that the observed spatial pattern of bias reduction is robust and largely independent of the choice of the 95th percentile threshold and exhibits qualitatively similar behavior across other parts of the distribution (Figs. S6–10). However, some small areas still exhibit high biases, especially mountainous regions, such as parts of the Alps, Carpathians, and Caucasus Mountains. However, it should be noted that the FWI values over the mountainous regions are already very low, so even large percentage biases are also usually low in terms of absolute values in these regions. For the purposes of this study, the substantial improvement in model performance by adjusting the input fields with the univariate QDM approach is considered sufficient; hence, the bias-adjusted ensemble is used for the rest of the study.
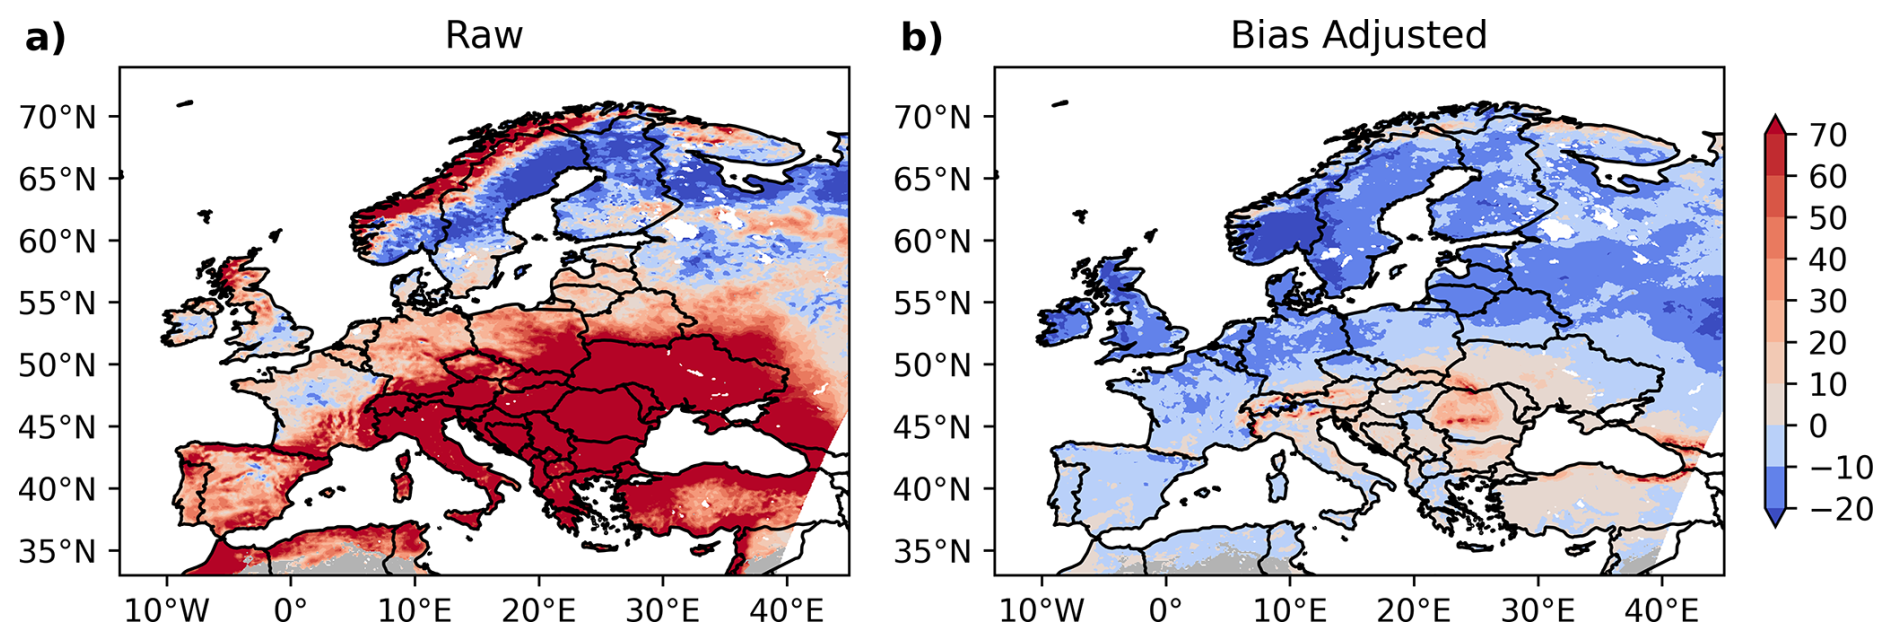
Figure 5Relative percentage bias (%) in the 95th percentile of FWI for EURO-CORDEX ensemble median relative to ERA5-Land data during 1971–2000, based on (a) raw (unadjusted) and (b) bias-adjusted simulations. Areas classified as unburnable are shown in gray.
3.4 Projections of Extreme Fire Weather in Europe
As significant trends in extreme fire weather have been observed in many regions of Europe, and since all regions are projected to experience warmer summer climates, with a particular tendency towards increased drying in the southern and western regions (Bayar et al., 2023), it is reasonable to expect further changes in a warming climate. Figure 6 shows the patterns of the frequency-based FWI metrics (left panels for FWIfwsl and right panels for FWI95 d) over Europe during the reference period (1971–2000) and the changes relative to the reference period at 2 and 3 °C GWL based on the ensemble median of 33 bias-adjusted EURO-CORDEX models. The climatological patterns of FWIfwsl (Fig. 6a) show longer fire seasons in southern Europe, particularly in the Iberian Peninsula, southern Italy, Greece and Turkey, with more than 60 d yr−1. In contrast, central and northern Europe experience shorter fire seasons. Since these values may seem lower than expected, it is important to distinguish between different methods for calculating the duration of the fire season. Wotton and Flannigan (1993) define the fire season based on a temperature threshold, and it is used for overwintering the DC (McElhinny et al., 2020; Quilcaille et al., 2023). However, this definition may lead to an overestimation of fire season length, especially in southern Europe due to warmer temperatures throughout the yr. In contrast, Jolly et al. (2015) define FWIfwsl as the number of days when FWI exceeds its mid-range value. Here, the definition of Jolly et al. (2015) is followed for FWIfwsl, as in some other studies (Abatzoglou et al., 2019; Jones et al., 2022). However, this approach possibly underestimated the actual FWIfwsl in some regions, because overwintering the DC reduces the number of days with an available FWI value throughout the yr due to the condition of Wotton and Flannigan (1993).
The projected changes in FWIfwsl at 2 °C and 3 °C GWLs relative to the reference period are shown in Fig. 6c and e, respectively. At 2 °C, robust increases in FWIfwsl are already evident in some regions, with a magnitude of up to 100 % in areas like parts of the Balkans, but the larger changes are mostly limited to regions with smaller climatological values. The increase in FWIfwsl becomes more widespread and intense at 3 °C, particularly in France and the Balkans, with a relative increase exceeding 150 %. Almost all regions show positive changes in FWIfwsl at both GWLs (except for a small area in northern Poland at 2 °C). The projected mean relative change in FWIfwsl for the grids where the models agree on both the sign and significance of the change almost doubles between the two GWLs: 52 % at 2 °C and 94 % at 3 °C. The signal is largely confined to regions south of 50° latitude, with a robust signal simulated in 25 % and 48 % of the burnable land area, at 2 °C and 3 °C, respectively.
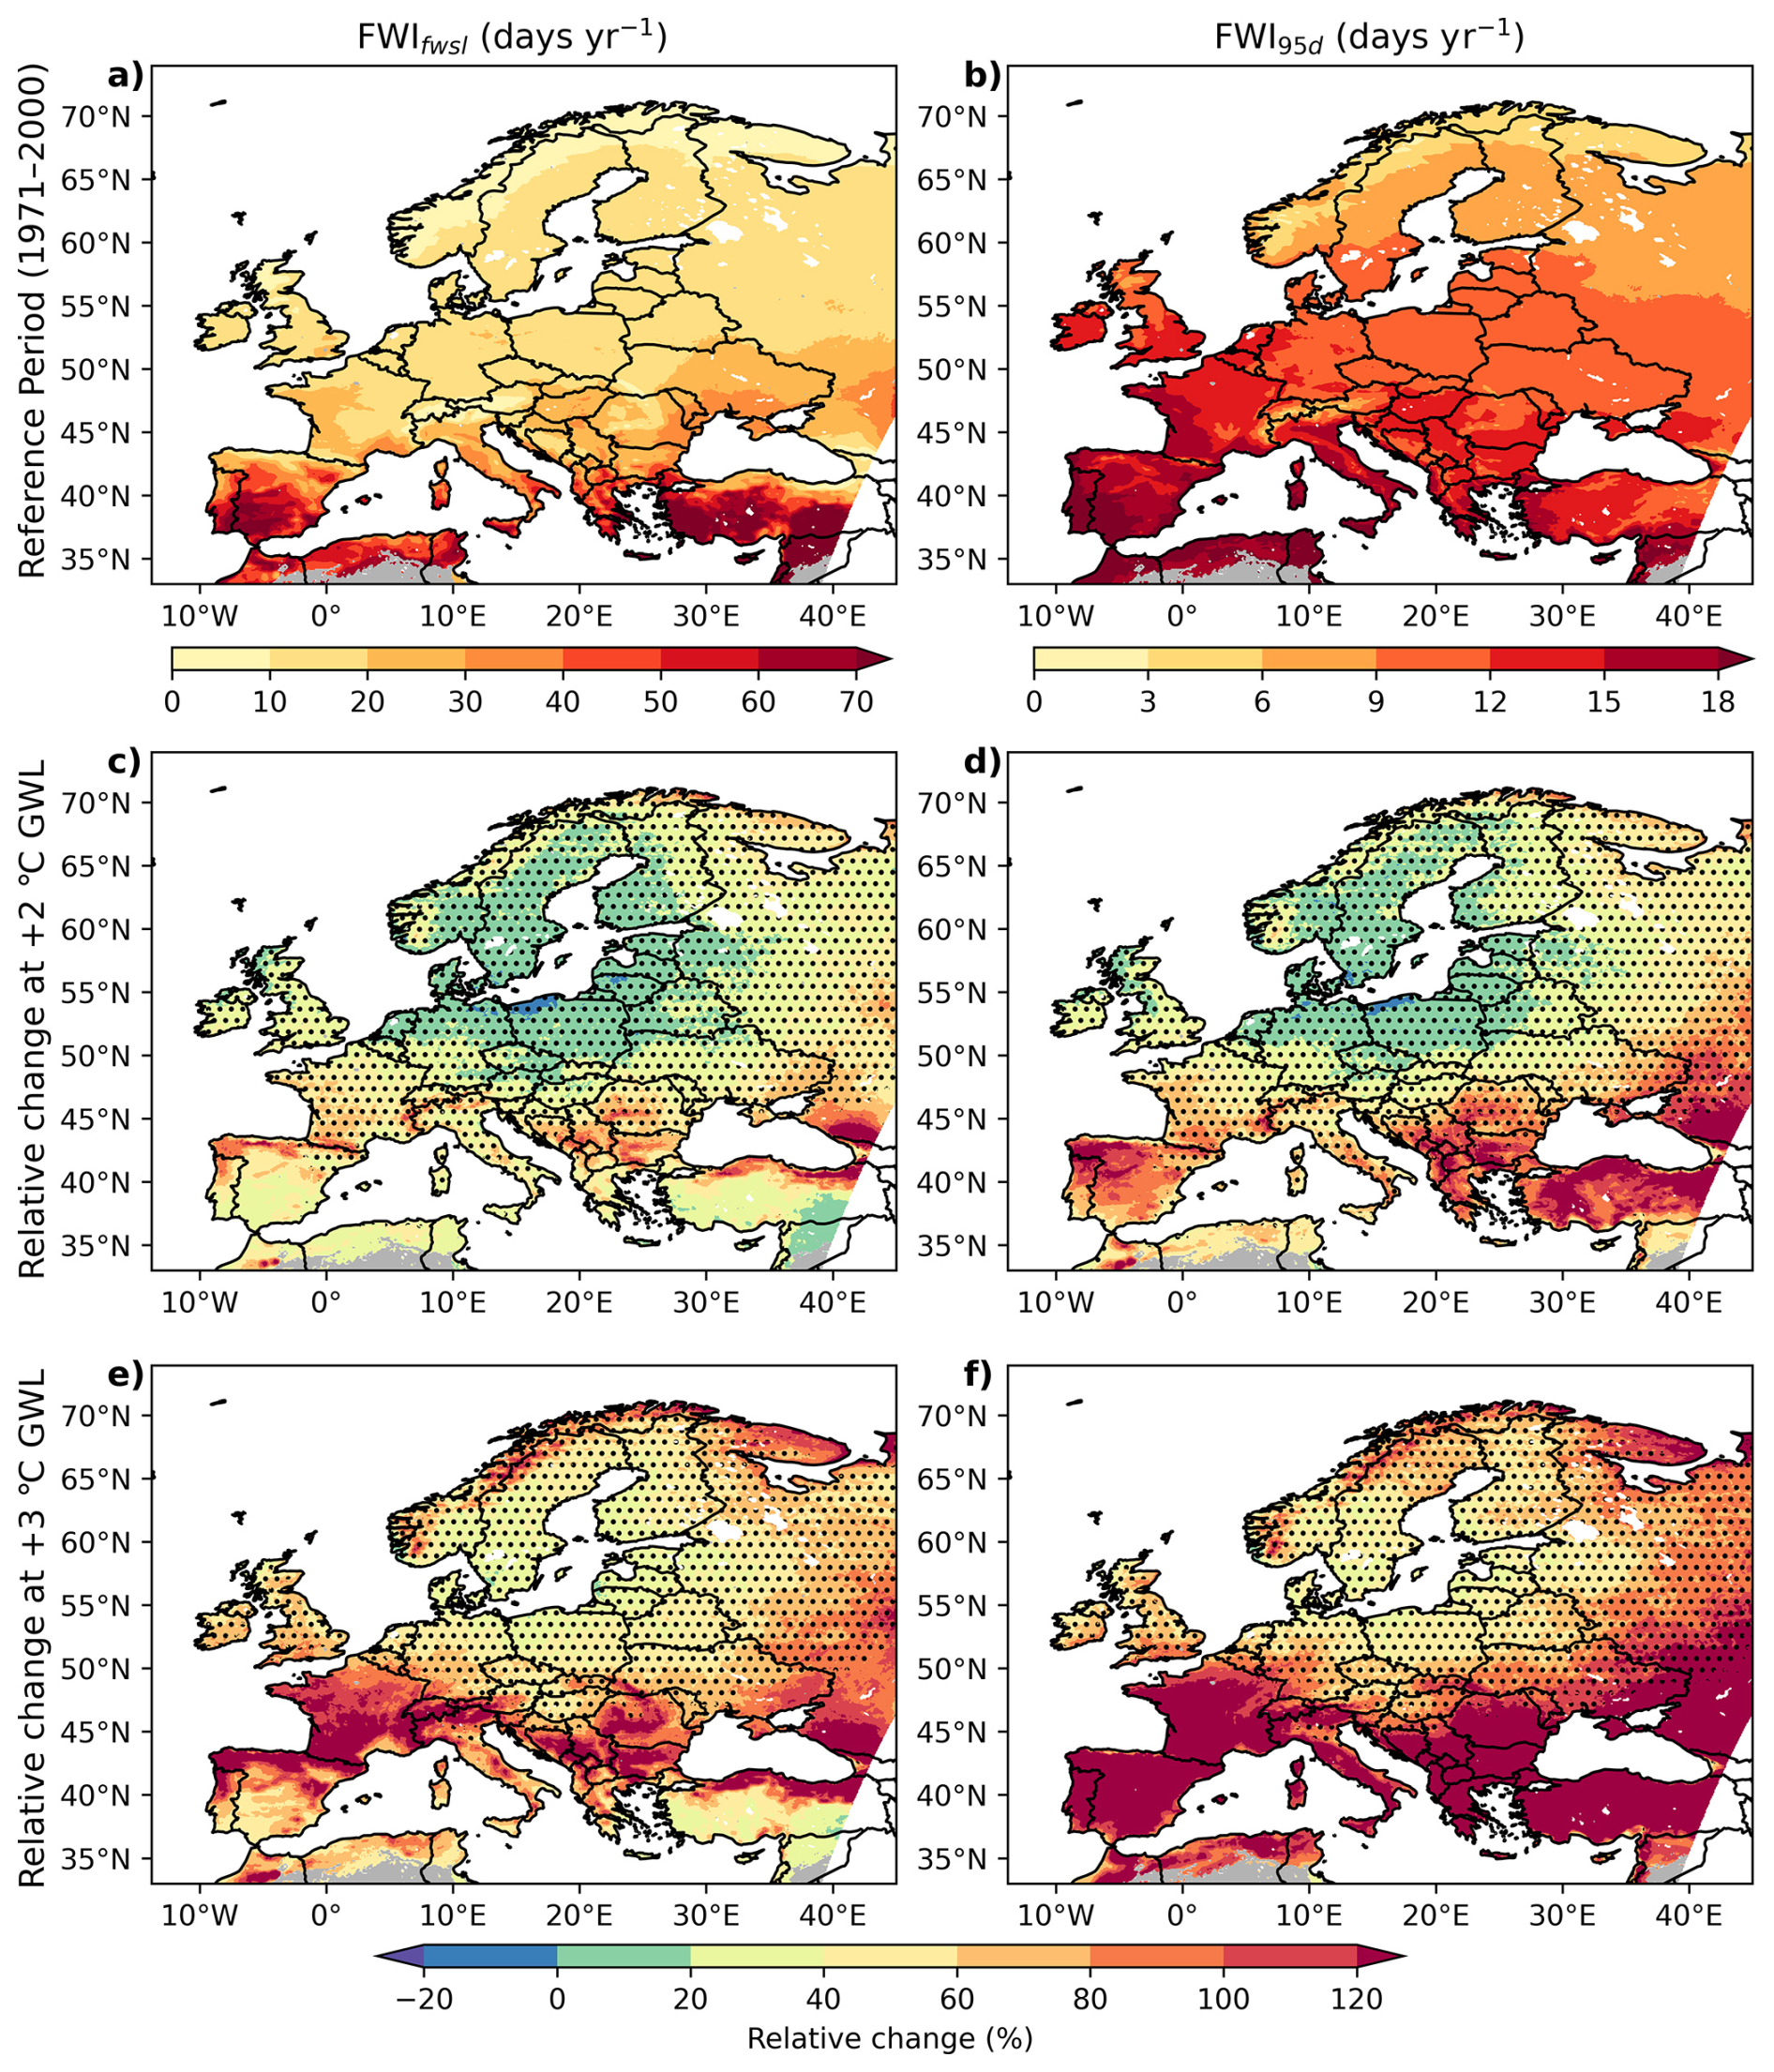
Figure 6Patterns of frequency-based extreme fire weather metrics and their projected relative changes in Europe based on the ensemble median of 33 bias-adjusted EURO-CORDEX models. The left panels show the fire weather season length (FWIfwsl) and the right panels show the number of days per yr exceeding the 95th percentile FWI (FWI95 d) relative to the reference period (1971–2000). a, b) Reference period patterns with a separate colorbar shown below, c, d) changes relative to the reference period at +2 °C GWL and e, f) changes relative to the reference period at +3 °C GWL. Note that the reference period is already 0.46 °C warmer than the preindustrial period. Areas without stippling indicate regions where at least 66 % of the models project statistically significant changes according to a t-test (p<0.05) and agree on the sign of change. Areas classified as unburnable are shown in gray. Absolute changes are shown in Fig. S11 to facilitate interpretation in regions where relative changes may be amplified by climatologically low baseline values.
The right column of Fig. 6 shows the number of days per yr that exceed the 95th percentile FWI (FWI95 d) during the reference period (Fig. 6b), along with the relative changes compared to the reference period at 2 °C (Fig. 6d) and 3 °C (Fig. 6f) GWLs. Here, it is important to note that the spatial distribution of FWI95 d during the reference period would be nearly uniform with around 18 d yr−1 across the domain if FWI was calculated continuously, since the 95th percentile is calculated locally for each grid. However, this is not the case here, as overwintering of the DC interrupts the continuous FWI calculation. Therefore, the latitudinal differences in FWI95 d are a natural consequence of this calculation. More days exceed the local 95th percentile at lower latitudes, primarily because the fire season is longer as defined by Wotton and Flannigan (1993). In the Iberian Peninsula and some regions in southern Europe, there are about 18 d yr−1 of FWI95 d, indicating that the fire season defined by the temperature threshold endures almost all yr.
The projected changes in FWI95 d relative to the reference period at 2 °C and 3 °C GWLs are shown in Fig. 6d and f. At 2 °C, the changes are mainly confined to southern Europe, with only 23 % of the total burnable land area in the domain exhibiting robust signals (Fig. 6d). In contrast, at 3 °C, significant and robust signals are projected to extend into central Europe, covering 46 % of the total burnable area (Fig. 6f). In addition, the strength of the signal becomes much more pronounced at 3 °C, with relative increases exceeding 150 % in many regions, such as the Iberian Peninsula, southern France, the Balkans, and Turkey. Even regions with historically low frequencies of extreme fire weather, such as northern Europe, show increases of up to 50 %. However, these increases are not statistically significant or model agreement is not established. In areas where the change signal is robust, the mean relative increase in FWI95 d is 97 % and 153 %, respectively, at 2 and 3 °C GWLs. Overall, a general increase in the frequency of fire weather conditions is projected across Europe, with the magnitude and spatial extent of the changes becoming much more pronounced at 3 °C compared to 2 °C. However, robust changes are still mainly limited to areas south of 50 °C latitude even at 3 °C.
In addition to projections of the frequency of extreme fire weather, it is also important to quantify the projected changes in the magnitude of extreme fire weather. Figure 7 shows the patterns of the magnitude-based FWI metrics (left panels for FWIfs and right panels for FWImax) over Europe during the reference period (1971–2000) and the changes relative to the reference period at 2 °C and 3 °C GWLs based on the ensemble median of 33 bias-adjusted EURO-CORDEX models. Similar to frequency metrics, a latitudinal gradient is apparent for FWIfs, with higher values concentrated mainly in southern Europe due to hot and dry summer conditions (Fig. 7a). In regions such as the Iberian Peninsula, southern Italy, Greece, and Turkey FWIfs values exceed 30, approaching the very high fire danger threshold of 38, as accepted by San-Miguel-Ayanz et al. (2012).
The projections show a minor relative increase in FWIfs at 2 °C GWL across Europe, with the exception of regions such as Poland and northern Scandinavia (Fig. 7c). However, many areas still lack robustness, with only 22 % of the burnable land area is projected to show robust signals. At +3 °C, FWIfs is projected to become more widespread and intense, following the same pattern seen in frequency-based metrics (Fig. 7e). It is projected to increase by more than 50 % (with robust signals) not only in southern and eastern Europe, but also in regions that historically exhibited lower fire danger, such as eastern France. The percentage of burnable land area with model agreement also increases to 41 % at 3 °C. The spatially averaged relative increase in FWIfs for regions with model agreement on robustness of the change signal is also projected to increase as the GWL increases: 25 % at 2 °C and 47 % at 3 °C.
The climatological distribution of FWImax displays higher values exceeding 40 in southern Europe and lower values, usually below 20 in central to northern Europe (Fig. 7b). Mountainous regions, such as the Alps and Carpathians, exhibit very low FWImax values, reflecting their colder and moister climates compared to the surrounding areas. In southern Europe, regions like the Iberian Peninsula and Turkey have FWImax values greater than 50, indicating that these areas experience extreme fire weather conditions annually on average.
The projected changes in FWImax at 2 and 3 °C GWLs relative to the reference period are shown in Fig. 7d and f, respectively. At 2 °C, the simulated positive changes are relatively small (around 10 %–20 %). Central and northern Europe show spatial variability, including negative changes in some regions (e.g., Poland), although these are not robust signals (Fig. 7d). Only 8 % of the burnable land area shows model agreement on the direction and significance of the change at 2 °C, and these areas are mostly limited to regions with very low climatological FWImax values. In contrast, at 3 °C, the percentage of burnable land area where the majority of models project robust climate change signals increases sharply to 40 % (Fig. 7f). However, areas with higher relative changes are still primarily the regions with low climatological values (e.g., mountainous regions), with the exception of some parts of Southern Europe, such as Italy and the Balkans, where projected increases range from 20 % to 40 %. Overall, in regions where change signal is robust, the simulated mean increase in FWImax is 26 % and 33 % relative to the reference period, respectively, at 2 and 3 °C.
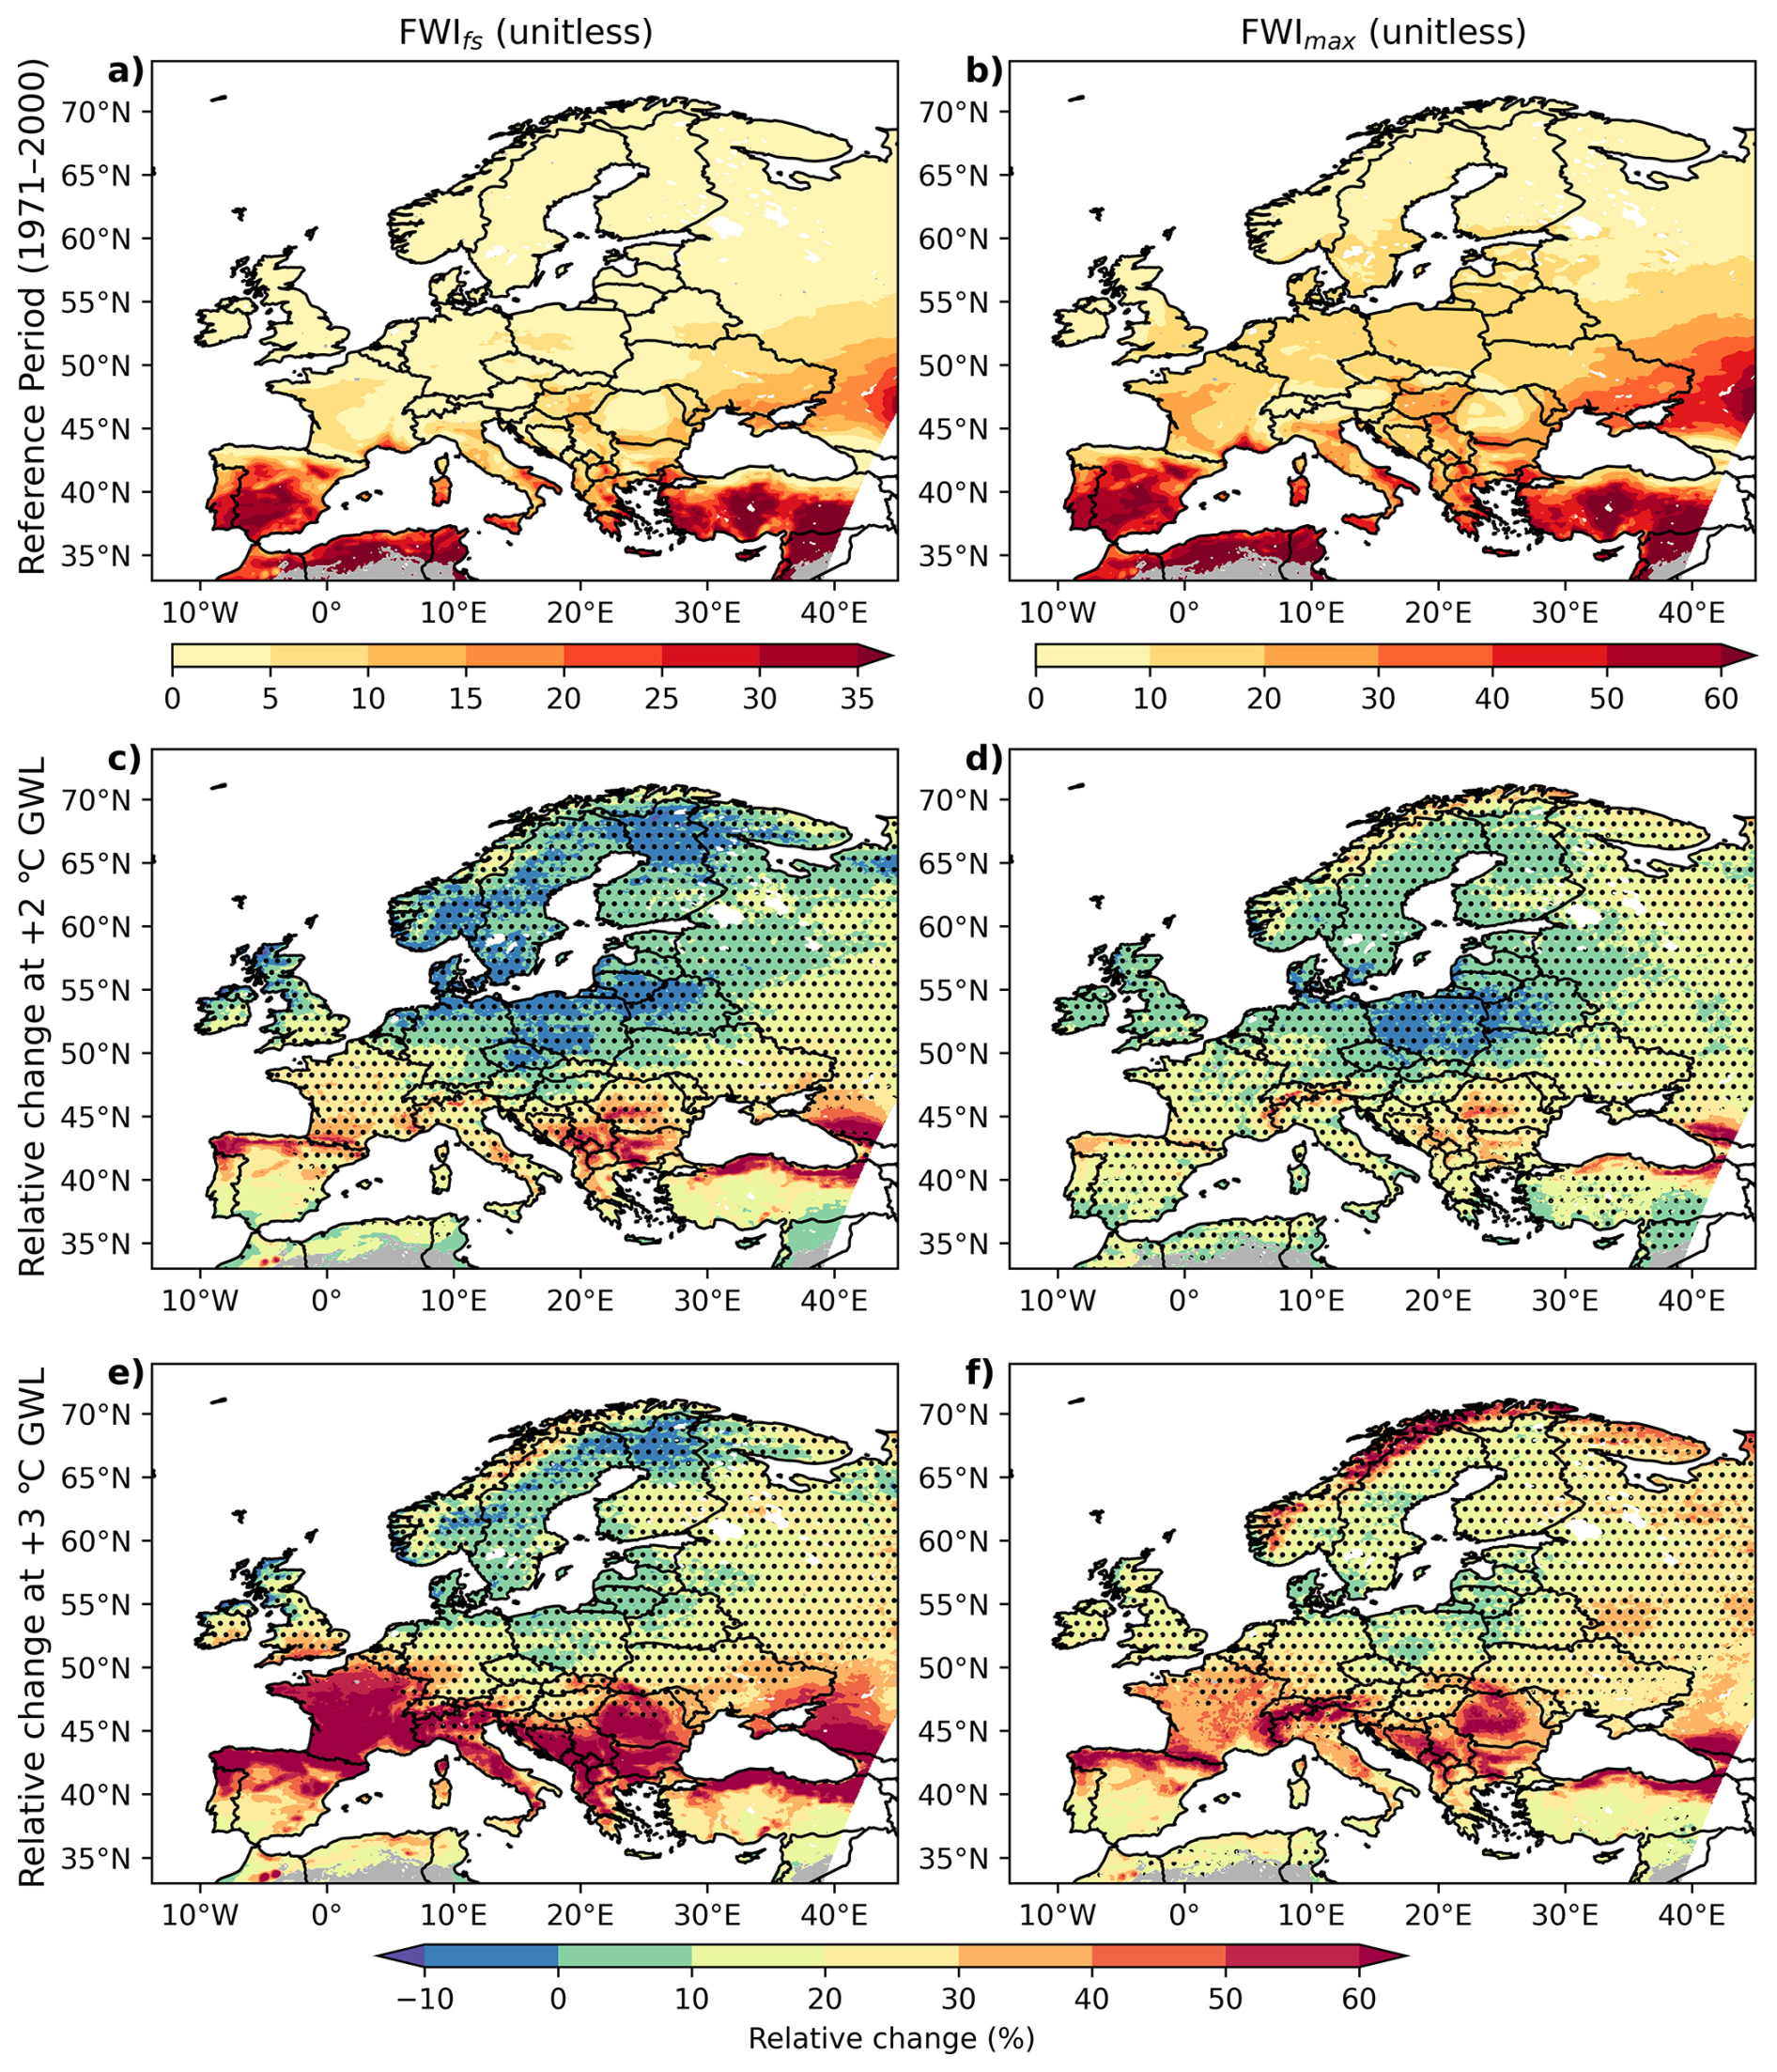
Figure 7Patterns of magnitude-based extreme fire weather metrics and their projected relative changes in Europe based on the ensemble median of 33 bias-adjusted EURO-CORDEX models. The left panels show the annual peak 90 d average FWI (FWIfs) and the right panels show the annual maximum FWI (FWImax). (a, b) Reference period (1971–2000) patterns with a separate colorbar shown below, (c, d) changes relative to the reference period at +2 °C GWL and (e, f) changes relative to the reference period at +3 °C GWL. Note that the reference period is already 0.46 °C warmer than the preindustrial period. Areas without stippling indicate regions where at least 66 % of the models project statistically significant changes according to a t-test (p<0.05) and agree on the sign of change. Areas classified as unburnable are shown in gray. Absolute changes are shown in Fig. S12 to facilitate interpretation in regions where relative changes may be amplified by climatologically low baseline values.
3.5 Sub-European Regions
In this section section, we show the same fire weather metrics analyzed throughout the study (FWI95 d, FWIfwsl, FWImax, FWIfs), but aggregate and average them over the PRUDENCE regions to highlight differences between the European subregions and show the spread across the model ensemble. Using the absolute values, we also aim to provide context for the relative changes presented in Sect. 3.4. The results are displayed as box plots for each PRUDENCE region for the reference period (1971-2000), and at 2 and 3 °C GWLs (Fig. 8). The regions are ordered in a way that roughly corresponds to the latitude-longitude orientation (North-West to South-East) of the regions.
FWI95 d shows a quasi-uniform distribution across models in all PRUDENCE regions for the reference period, due to the definition of the metric and the bias adjustment of temperature, which effectively determines the start and end of the fire season based on the temperature-threshold used for overwintering DC (Fig. 8a). Under both warming scenarios, the median FWI95 d is projected to increase across all regions with a stronger signal at 3 °C. In the Iberian Peninsula, for example, FWI95 d is projected to increase rapidly from a median of ∼ 17 d yr−1 during 1971–2000 to 31 d yr−1 at 2 °C and to 46 d yr−1 at 3 °C (Fig. 8a). A similar trend is projected for France, with the median increasing from 14.5 d yr−1 during 1971–2000 to more than 23 d yr−1 at 2 °C and to 35 d yr−1 at 3 °C. In some regions, such as Eastern Europe, the model spread is large, with some models projecting a negative change, and some projecting a very extreme positive change. The model agreement is stronger in southern European regions (IP, MD, TR), where all models project a positive trend under both 2 and 3 °C GWLs. In addition, the spread among models increases from 2 °C to 3 °C in all regions, indicating a growing uncertainty with higher levels of warming.
There is a clear regional separation in both the reference period and projected values of FWIfwsl, with southern European regions (IP, MD, TR) showing higher levels of fire danger than the rest of Europe (Fig. 8b). However, a positive change signal is evident across almost all regions, especially at 3 °C GWL. In the Alps, a region historically characterized by shorter fire seasons, the median FWIfwsl is projected to more than double: from 14.4 d yr−1 during 1971–2000, to almost 22 d yr−1 at 2 °C, and to more than 31 d yr−1 at 3 °C. The Iberian Peninsula is projected to experience the highest absolute increase in multi-model median FWIfwsl, rising from 43 d yr−1 during 1971–2000 to a projected 64 d yr−1 at 2 °C and almost 78 d yr−1 at 3 °C.
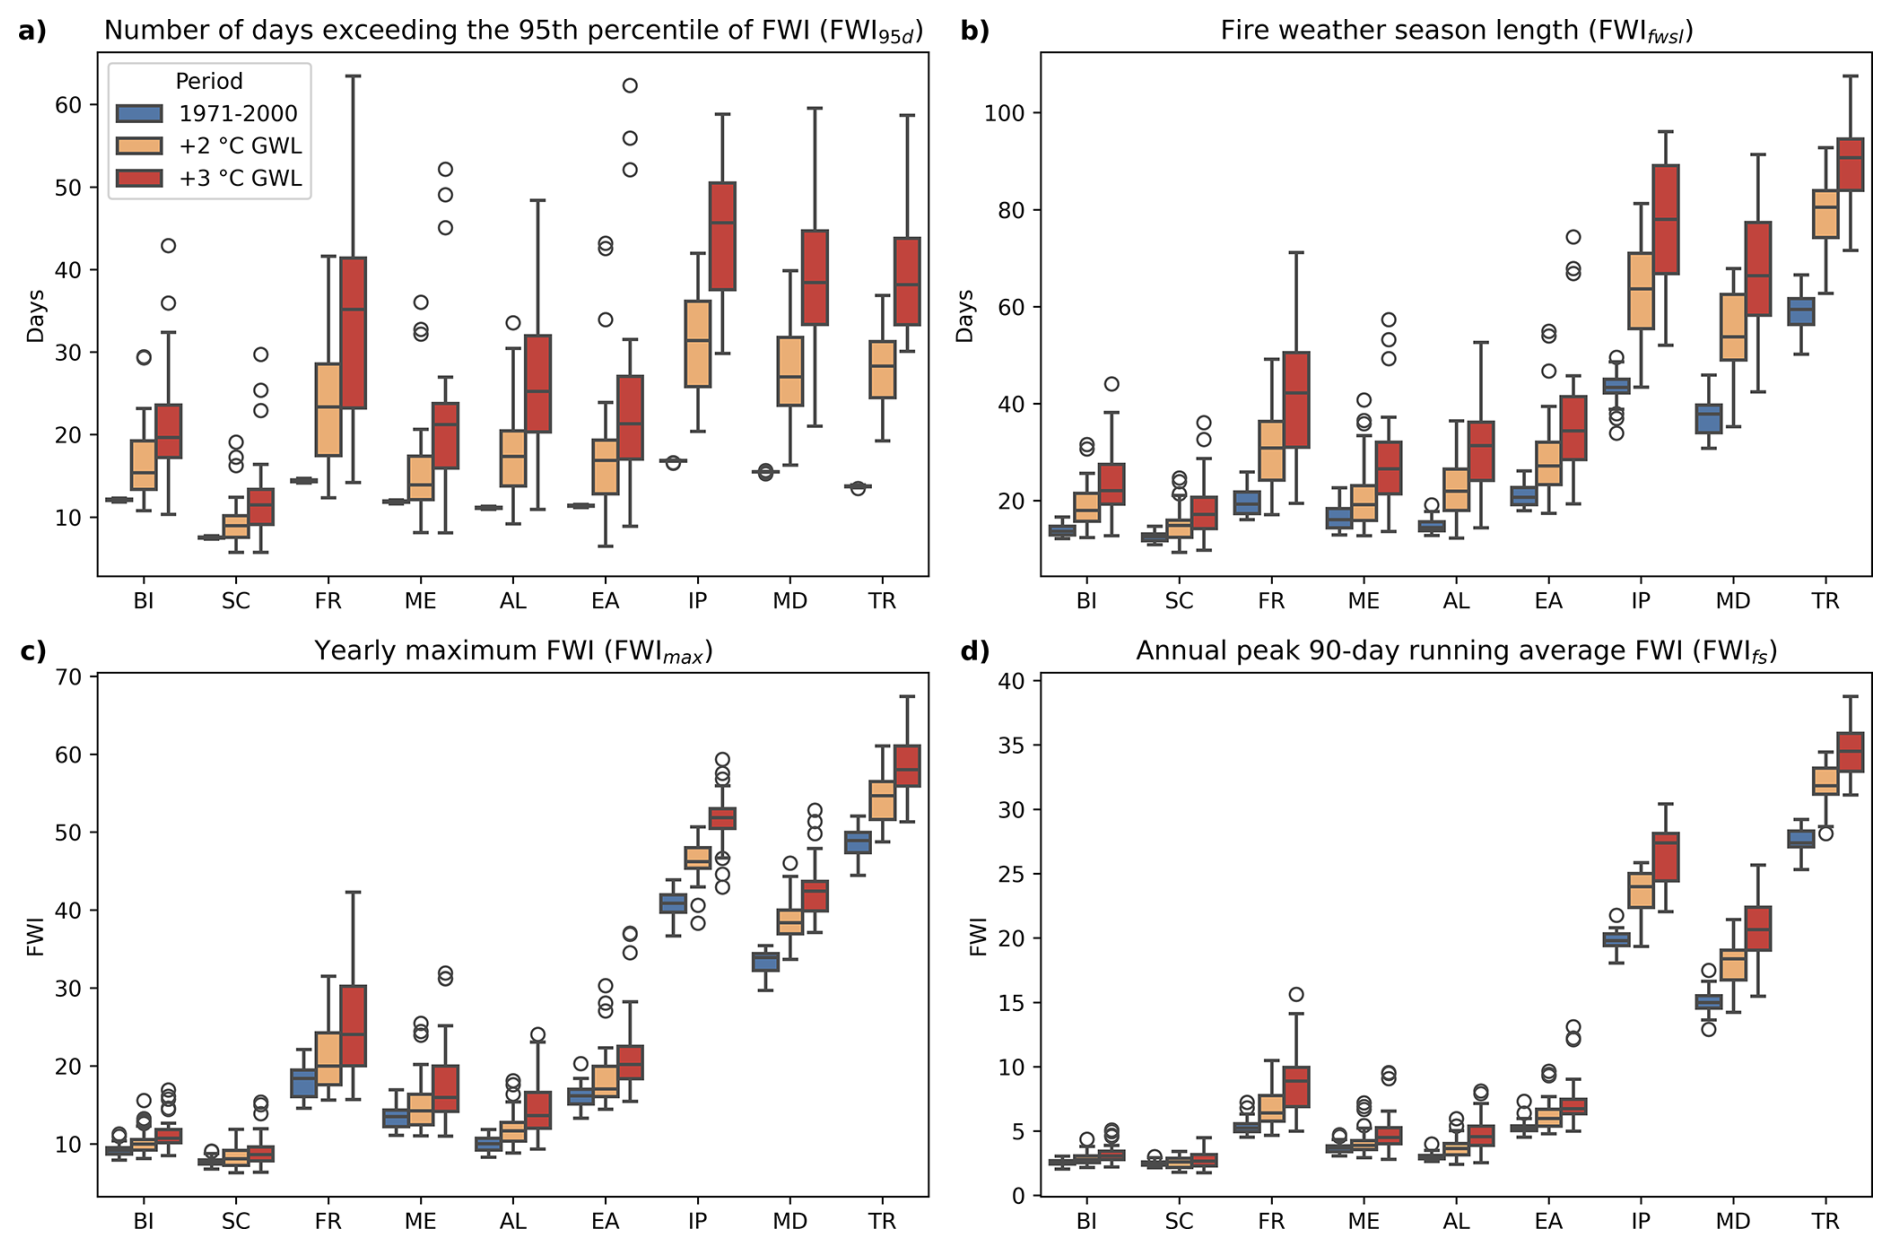
Figure 8Model spread of FWI metrics, spatially aggregated and averaged over the PRUDENCE regions, for the reference period (blue), +2 °C GWL (orange), and +3 °C GWL (red) based on the bias-adjusted EURO-CORDEX ensemble for a) FWI95 d, b) FWIfwsl, c) FWImax, d) FWIfs. Whiskers in the boxplots represent 1.5 times the inter-quartile range of the ensemble, with circles denoting outliers. BI = British Isles, SC = Scandinavia, FR = France, ME = Mid-Europe, AL = Alps, EA = Eastern Europe, IP = Iberian Peninsula, MD = Mediterranean, TR = Turkey.
A clear latitudinal gradient is also observed in the magnitude of FWImax during the reference period and at both 2 °C and 3 °C GWLs with southern European regions exhibiting higher fire danger due to their warm and dry summer climates (Fig. 8c). The main exception to this latitudinal pattern is the Alps, which exhibits lower values due to its colder and moister climate conditions. Overall, the median FWImax is projected to increase consistently across all regions as the GWL increases. However, the projected relative changes in FWImax (Fig. 8c), a magnitude-based metric, are not as pronounced as those seen in frequency-based metrics (Fig. 8a and b). The Mediterranean, the Iberian Peninsula, and Turkey clearly stand out from other regions. For instance, Turkey shows a simulated median FWImax of 49 during 1971–2000, which is projected to increase to 54.6 at 2 °C and to 58 at 3 °C.
The FWIfs (Fig. 8d) is also projected to follow a similar pattern to FWImax. However, the distribution ranges for FWIfs are narrower than those for FWImax, particularly in northern and central European regions due to the time averaging. The intensity of prolonged fire weather, as represented by FWIfs, is projected to increase in all regions. For example, the median FWIfs in the Mediterranean is projected to increase from 15 during 1971–2000 to 18 and 20 at 2 and 3 °C GWLs, respectively.
In summary, all four fire weather metrics are projected to increase in all regions with increasing temperature, and more pronounced changes are expected at 3 °C GWL compared to 2 °C. In general, southern European regions (IP, MED, TR) are projected to experience more intense and prolonged extreme fire weather conditions, consistent with their baseline climatologies of dry and warm summers. Overall, the relative change signals are stronger for the frequency-based metrics (FWI95 d and FWIfwsl) than for the magnitude-based metrics (FWImax and FWIfs). A clear latitudinal gradient is also observed, with southern European regions projected to experience more severe and frequent fire weather conditions. Furthermore, the ensemble spread increases from 2 to 3 °C GWL, particularly for the frequency-based metrics, indicating greater uncertainty at higher warming levels.
3.6 Evaluation of the Potential Drivers
Given the projected changes in extreme fire weather conditions across Europe, it is important to explain possible drivers. To provide insights into this question, we examine the two main subcomponents of FWI: BUI, which represents the effects of longer-term atmospheric conditions on fuel dryness, and ISI, which reflects the influence of short-term atmospheric conditions, namely the role of wind patterns and FFMC (Ramos et al., 2023). Figure 9 illustrates FWI as a function of ISI and BUI across PRUDENCE regions, based on spatially aggregated fields from the bias-adjusted EURO-CORDEX models. The ISI–BUI pairs correspond to the averaged values for the days when FWI exceeds its 99th percentile during the reference period (1971–2000), as well as at 2 and 3 °C GWLs for each model in the ensemble.
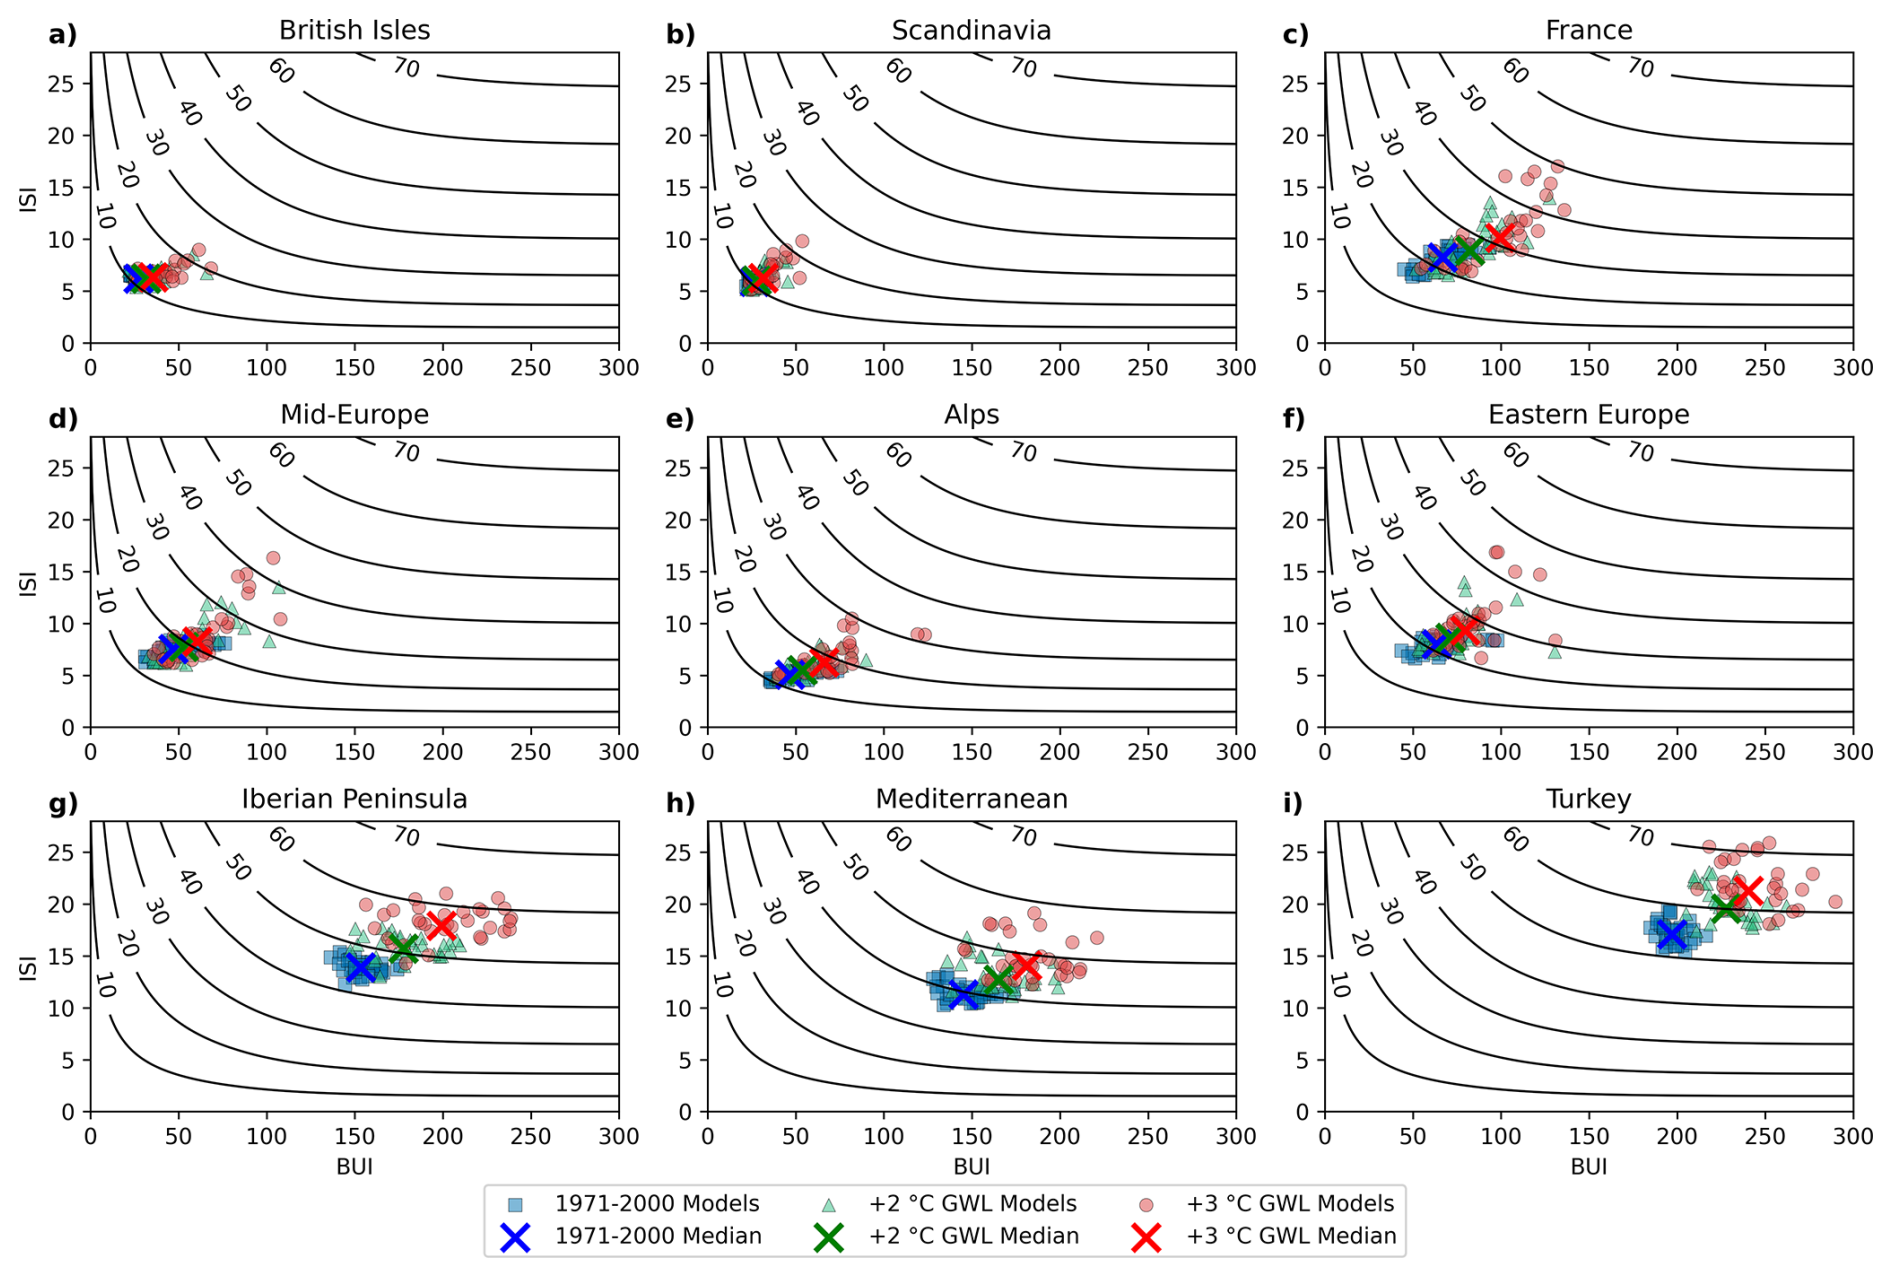
Figure 9FWI as a function of ISI and BUI, with theoretical FWI contours overlaid for the PRUDENCE regions. ISI and BUI composite averages are shown for days when the FWI exceeds its 99th percentile. Blue squares denote the reference period (1971–2000), green triangles correspond to +2 °C GWL, and red circles represent +3 °C GWL. All values are spatially aggregated and area-weighted averaged over the PRUDENCE regions, namely: (a) British Isles, (b) Scandinavia, (c) France, (d) Mid-Europe, (e) Alps, (f) Eastern Europe, (g) Iberian Peninsula, (h) Mediterranean, and (i) Turkey. Each value corresponds to a bias adjusted EURO-CORDEX model; crosses indicate ensemble medians.
As global warming increases, there is a projected shift in BUI towards higher values in all regions (Fig. 9). However, the signals in BI and SC are mixed, with a slight tendency towards higher fire danger (Fig. 9a and b). In FR, ME, AL and EA regions, there is a notable shift in BUI, along with an increase in ISI, both of which contribute to the resulting increase FWI (Fig. 9c–f). In particular in France, the median BUI is projected to increase by almost 50 % at 3 °C GWL relative to the reference period, while ISI is projected to increase only by around 25 %, which is an indication of the worsening of longer-term fuel drying. The increase in BUI is also apparent in the southern European regions (Fig. 9g–i). However, this does not directly translate into a significant increase in FWI in these regions because the contribution of BUI to FWI saturates at higher BUI values, consistent with the principle that there is a limit to the amount of fuel that can be used in fires (Van Wagner, 1987). Instead, in these regions, the projected increase in FWI is driven by a projected increase in ISI values, which may result from an increased surface layer dryness (reflected by FFMC) or stronger winds.
To disentangle the contributions of wind speed and dryness conditions, Fig. 10 shows VPD plotted against maximum wind speed across PRUDENCE regions. The VPD-wind speed pairs correspond to the averaged values for the days when FWI exceeds its 99th percentile during the reference period (1971–2000), as well as at 2 and 3 °C GWLs for each model in the EURO-CORDEX ensemble. The medians of maximum wind speeds are projected to either decrease or remain largely unchanged across all PRUDENCE regions, except in southern Europe, where a very slight increase (less than 2 %) is projected, but likely not significant. In contrast, the median VPD, which reflects the thermodynamic effects of temperature and relative humidity through atmospheric drying, is projected to increase across all regions, with particularly strong increases in central and southern Europe. In southern European regions, the projected increase in the median VPD on days when FWI exceeds its 99th percentile at 3 °C GWL relative to the reference period is almost 40 %, with some models projecting changes greater than 70 % (Fig. 10g–i).
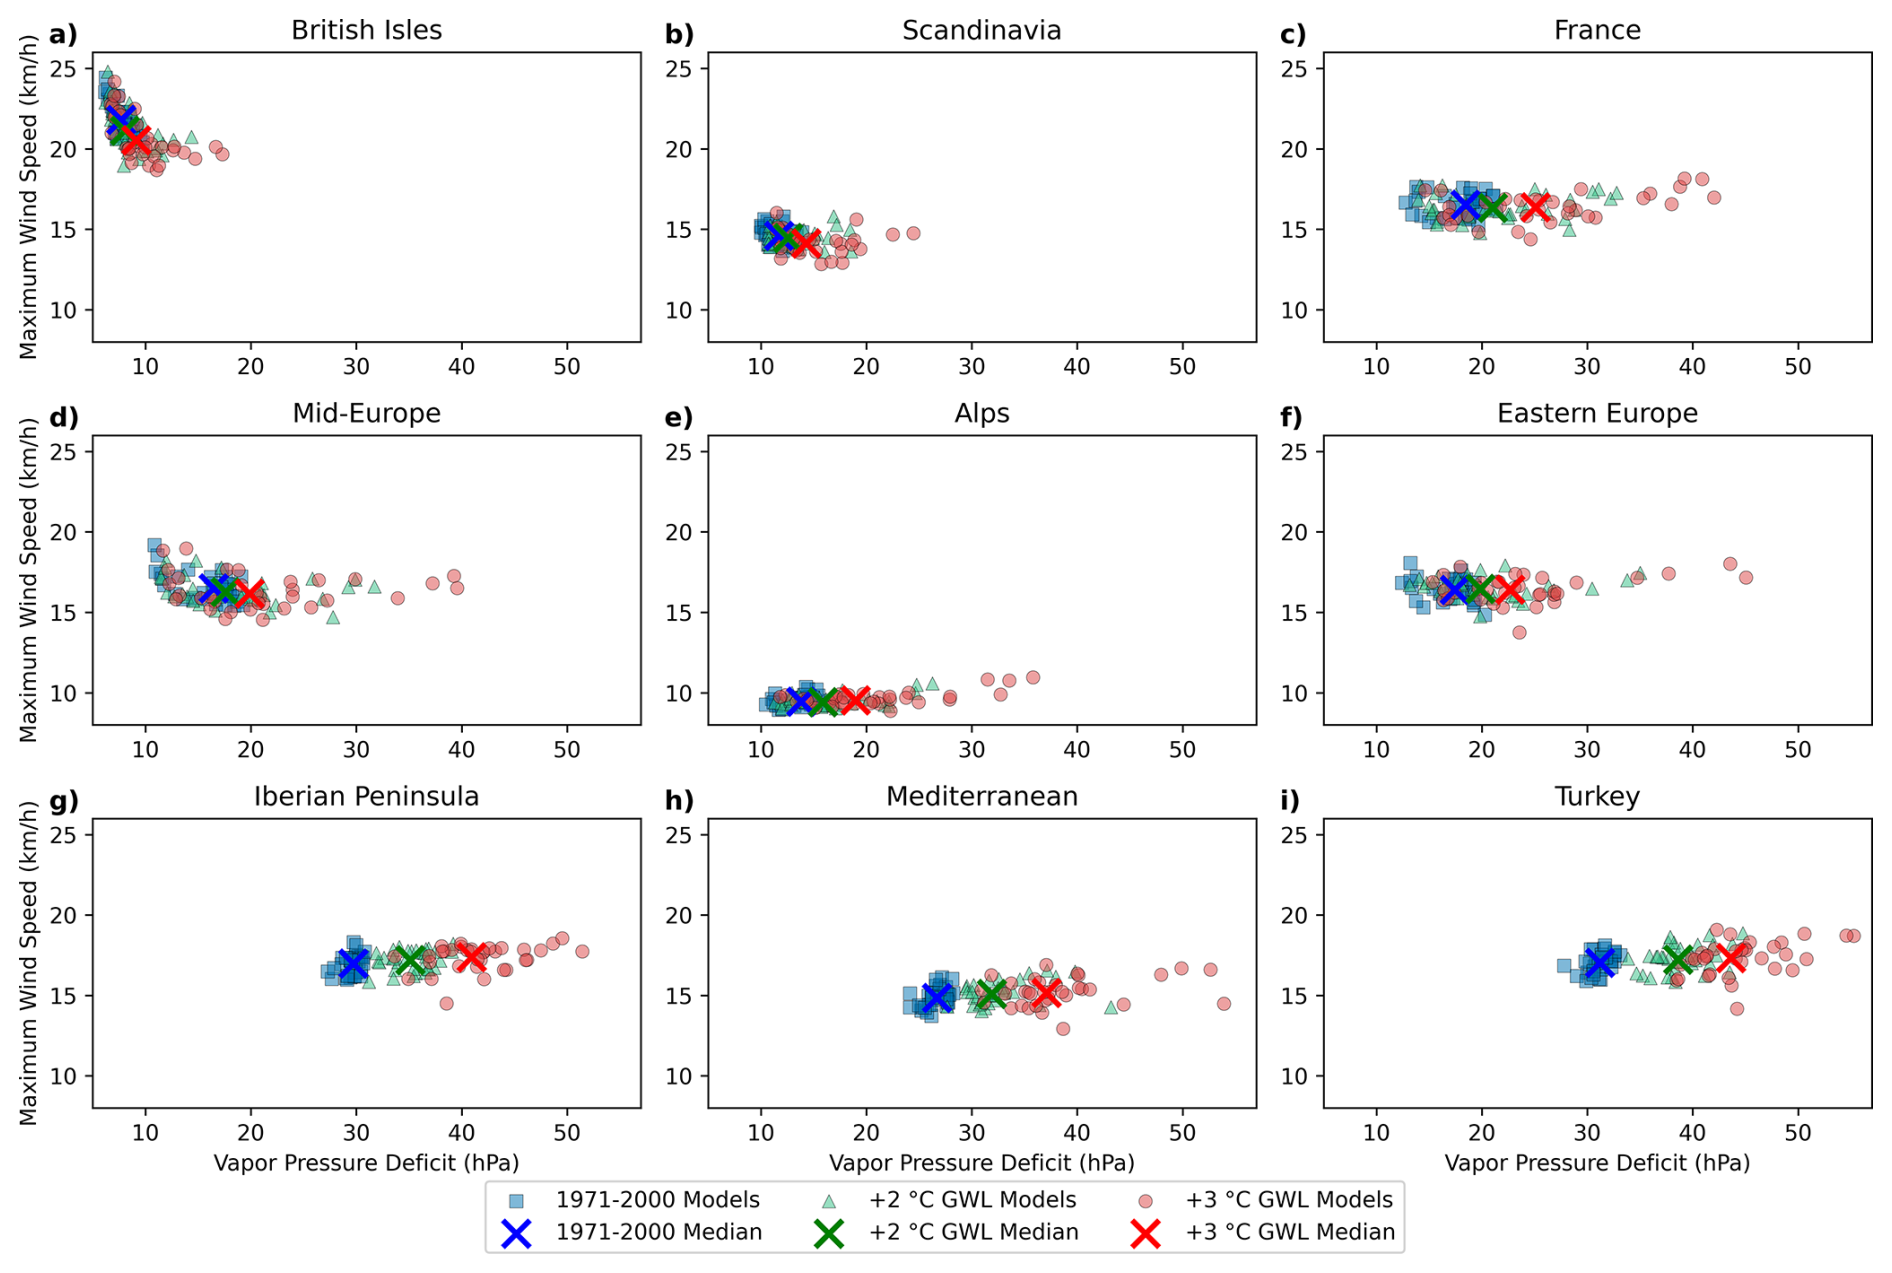
Figure 10VPD (hPa) vs. maximum wind speed (km/h) composites for the PRUDENCE regions. VPD and maximum wind speed averages are shown for days when the FWI exceeds its 99th percentile. Blue squares denote the reference period (1971–2000), green triangles correspond to +2 °C GWL, and red circles represent +3 °C GWL. All values are spatially aggregated and area-weighted averaged over the PRUDENCE regions, namely (a) British Isles, (b) Scandinavia, (c) France, (d) Mid-Europe, (e) Alps, (f) Eastern Europe, (g) Iberian Peninsula, (h) Mediterranean, and (i) Turkey. Each value corresponds to a bias adjusted EURO-CORDEX model; crosses indicate ensemble medians. Note that the absolute VPD values are likely overestimated, as they are calculated using daily maximum temperature and daily mean relative humidity.
To further analyze the key drivers responsible for changes in fire weather extremes, we calculate the simulated changes in 30 d accumulated antecedent precipitation conditioned on days with extreme FWI values (Fig. S13). There is a trend towards decreasing precipitation totals as GWL increases across regions for these conditional days in the ensemble median (except for Scandinavia). The decreasing precipitation totals seem more critical for regions such as France, in contrast to southern Europe, where the baseline climatology during extreme fire weather days is already very dry. Therefore, further drying in these regions might not increase fire weather danger as much as increases in temperature, as also reported in El Garroussi et al. (2024). However, to better discern the role of precipitation in intensifying fire weather extremes, a more targeted analysis is needed, as there is no model agreement in the change signal in many regions (e.g., Eastern Europe).
These results suggest that projected changes in FWI in southern Europe are primarily associated with an increase in fuel aridity due to amplified atmospheric moisture demand rather than changes in wind speeds. This may also indicate that the projected changes in ISI in southern Europe (Fig. 9) are largely influenced by increased surface layer fuel dryness (FFMC), rather than wind speed. Precipitation is also an important contributor in regions such as France, but its role is more difficult to assess in many other regions due to the higher uncertainty.
In addition to the distribution of model statistics across the PRUDENCE regions, we also present the spatial pattern of the ensemble median changes in the composites of the variables of interest at 2 and 3 °C GWLs relative to the reference period conditioned on days when FWI exceeds its 99th percentile (Fig. 11). The pattern of changes in extreme FWI (mean FWI on days when FWI > FWI99) shows a high spatial correlation with changes in VPD on these days, higher than the individual correlations with maximum temperature and relative humidity. Specifically, the ensemble median field correlation between changes in VPD and FWI composites is 0.85 at 2 °C GWL and 0.87 at 3 °C GWL, with ensemble ranges of 0.51–0.91 and 0.71–0.91, respectively (at 2 °C, only two models show correlations below 0.67). The decline in 30 d accumulated precipitation is also evident in regions such as France and suggests that these events occur under drier antecedent conditions, especially at 3 °C GWL, but this is less relevant for southern regions. Changes in maximum wind speed are weak and spatially heterogeneous. Overall, the northward expansion of more extreme fire weather danger in a warming climate in Europe is associated with stronger atmospheric moisture demand through increasing VPD (i.e., increasing temperature and/or decreasing relative humidity), with compounding effects from declining precipitation in regions such as France. However, these relationships should be interpreted with caution, as they represent spatial co-variations rather than formal attribution statements.
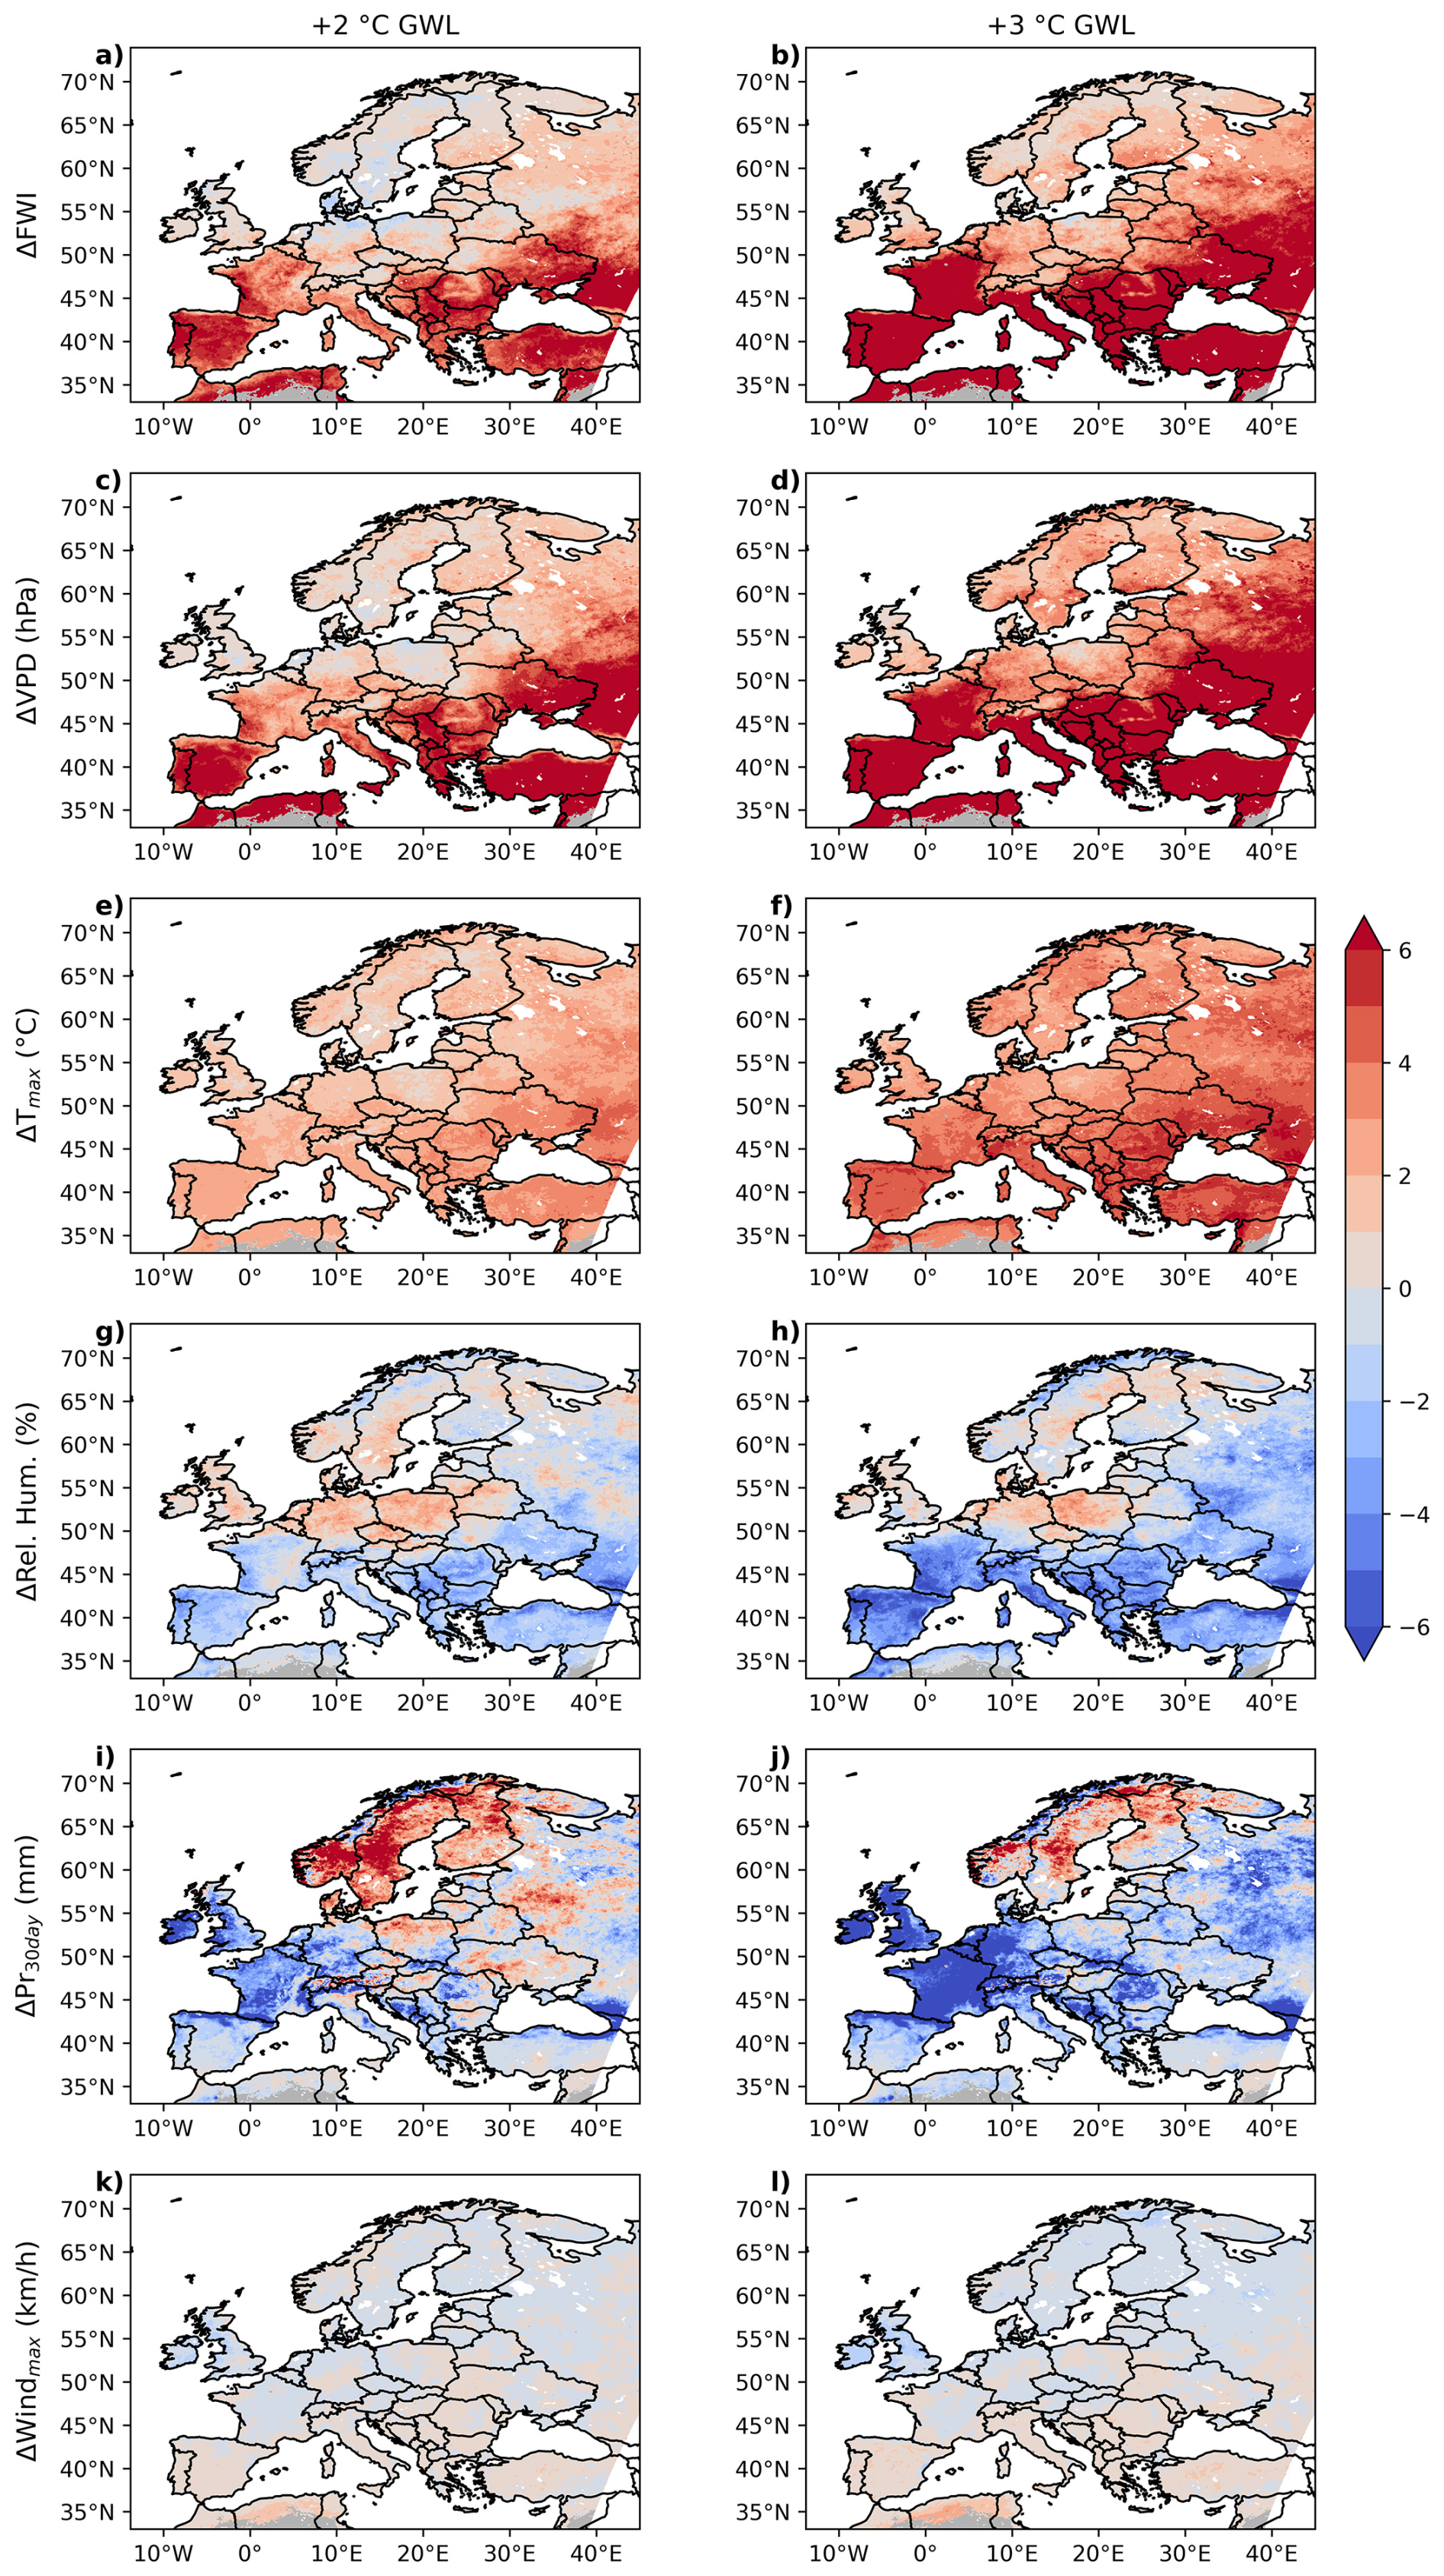
Figure 11Spatial patterns of the composites based on the ensemble median of 33 bias-adjusted EURO-CORDEX models, shown as changes relative to the reference period (1971–2000) at +2 °C (left panels) and +3 °C GWLs (right panels). Composites are created by averaging delta changes of (a, b) FWI, (c, d) VPD (hPa), (e, f) daily maximum temperature (°C), (g, h) daily mean relative humidity (%), (i, j) 30 d antecedent accumulated precipitation (mm), and (k, l) daily maximum wind speed (km h−1) on days when FWI exceeds its 99th percentile.
This study assesses how extreme fire weather in Europe is influenced by recent and future climate change. With this aim, it also evaluates the performance of EURO-CORDEX simulations in representing the extreme fire weather and the potential improvements offered by bias adjustment with QDM. The main results are as follows:
-
The most suitable combination of daily input variables to approximate typical noon-time FWI includes maximum temperature, accumulated precipitation, mean relative humidity, and maximum wind speed. These atmospheric fields were selected on the basis of their relatively lower bias in the resulting FWI calculations and broader model availability in the EURO-CORDEX ensemble.
-
An analysis of the historical period (1950–2023) based on ERA5-Land reanalysis data revealed a clear latitudinal gradient in extreme fire weather, with more severe conditions occurring in southern Europe. A positive trend in the frequency and magnitude of extreme fire weather has been observed since the 1950s across many regions, such that 30 % and 36 % of the burnable land area exhibited a significant trend in FWImid and FWI95 d, respectively. The majority of the significant trends for both metrics were concentrated in the Iberian Peninsula, Central Europe, and Ukraine.
-
As the raw model outputs from the EURO-CORDEX framework have systematic biases (Vautard et al., 2021), the input fields were bias adjusted before calculating the FWI. The bias adjustment of the input fields with QDM significantly reduced the resulting FWI bias during the calibration period. Bias relative to the ERA5-Land for the 95th percentile of FWI in the EURO-CORDEX ensemble median is reduced from 80 % to below 9 %.
-
EURO-CORDEX future projections show that extreme fire weather in Europe is projected to become more widespread, more frequent, and more intense with increasing GWLs, consistent with previous assessments (Abatzoglou et al., 2019; El Garroussi et al., 2024; Hetzer et al., 2024; Jones et al., 2022). Relative increases in frequency-based extreme fire weather metrics are larger than those for magnitude-based metrics. The spatial extent of robust signals is projected to nearly double at 3 °C GWL compared to 2 °C for three of the four metrics. For FWImax, the spatial extent at 3 °C is five times as large as that at 2 °C. It should be noted that extreme fire weather events may still occur even under a 2 °C GWL (Bevacqua et al., 2026).
-
A latitudinal gradient is also evident in the projected fire weather danger, where southern European regions (the Iberian Peninsula, the Mediterranean and Turkey) are expected to experience longer and more intense fire weather conditions. The frequency and magnitude of extreme fire weather are also projected to increase in regions such as France, the Alps, Eastern Europe, and Mid-Europe, particularly at 3 °C GWL.
-
The subcomponents of the FWI system, namely the BUI and the ISI are projected to increase in most regions, although with a relatively smaller increase for ISI. In regions such as France and Eastern Europe, contribution to the increase in FWI is shared between BUI and ISI. However, since the influence of BUI on FWI saturates beyond a certain threshold (Van Wagner, 1987) and southern European regions already exhibit very high BUI values, changes in ISI emerge as the dominant driver of the increase in FWI in these regions.
-
The relevance of projected changes in wind speed is marginal, whereas VPD is projected to increase across all regions. This indicates that thermodynamic factors, through atmospheric drying, are the primary contributors to the projected changes in fire weather extremes in Europe. Declining antecedent precipitation totals during periods of extreme FWI are also projected for regions such as France. These findings align with a growing body of evidence indicating that increased fuel dryness is the key driver behind both observed and projected increases in fire weather in many regions worldwide (Clarke et al., 2022; Ellis et al., 2022; Jain et al., 2022; Resco de Dios et al., 2021; Williams et al., 2019).
The proxy variable combination we selected to represent the original noon-time FWI calculation at daily resolution may have resulted in a possible underestimation of the baseline climatological values (as shown in Fig. 3). However, a recent study found that all combinations at daily resolution overestimate the trend in FWI95 d relative to the original noon-time calculation (Matteo et al., 2025). We also calculated the difference between the trends from the original calculation and those from the proxy combination selected at daily resolution, and found that the daily combination overestimates the trend in FWI95 d by an area-weighted domain average of 17.7 %. This difference shows spatial heterogeneity across the domain, with the strongest signal concentrated in regions such as the Iberian Peninsula and western France (Fig. S14). Therefore, although our analysis revealed an underestimation of the extreme portion of the FWI distribution due to the use of mean relative humidity, it is still possible that the projected trends are overestimated. Similar to Matteo et al. (2025), we suggest that the next generation of climate model simulations should include more sub-daily output to better estimate risks associated with compound hazards in a warming climate.
The evaluation period used to assess bias-adjustment performance was the same as the calibration period (1971–2000), as it was important to use a longer period to reduce sampling uncertainty, and the historical time series from the EURO-CORDEX simulations are not long enough to allocate a separate validation period. Since uncertainty may also arise from the choice of bias adjustment methods, some studies have shown that the application of a multivariate bias adjustment method that not only adjusts the marginal distributions but also inter-variable dependencies can further improve the model performance in representing the multivariate hazard estimates (Cannon, 2018; Zscheischler et al., 2019). However, they usually come with greater computational cost (e.g., Cannon (2018)). We suggest that there is still a need for further research on the performance of univariate and multivariate bias adjustment methods for the multivariate hazard estimates at a pan-European scale with a relatively large model ensemble.
Although extreme fire weather conditions, as represented by the FWI, are projected to intensify in terms of both frequency and magnitude, it is important to emphasize that the FWI is a fire weather rating metric and not a measure of fire occurrence. In fact, fire weather creates conditions that may enhance the susceptibility of landscapes to other key wildfire drivers, namely ignition, fuel dryness, and fuel continuity (Pausas and Keeley, 2021). Burned area climatology from the past two decades (Fig. 1b) reveals that fire occurrence has remained structurally limited in some regions, such as parts of Scandinavia, possibly due to a combination of bioclimatic and anthropogenic factors. However, it remains unclear whether these factors will remain unchanged in Europe in the future. In general, FWI provides the most meaningful danger information in regions where fire activity is limited by fuel dryness rather than by vegetation productivity (Jones et al., 2022). The strongest relationships between FWI and burned area are observed in ecosystems with intermediate moisture availability (Jones et al., 2022), including boreal and evergreen forests (Abatzoglou et al., 2018; Bedia et al., 2015), as well as in Mediterranean Europe (Calheiros et al., 2020; Carvalho et al., 2008; Fox et al., 2018; Jones et al., 2022; Urbieta et al., 2015). Furthermore, since the relationship between FWI and fire occurrence – and the thresholds for what constitutes extreme – varies regionally, it is important to incorporate regional climate and biome characteristics when interpreting FWI values for fire danger assessments to improve early warning systems and fire mitigation strategies in a changing climate (Kudláčková et al., 2024).
The ecosystem and socioeconomic impacts of a fire depend not only on fire weather, the availability of flammable vegetation, and ignition sources, but also on forest management practices prior to fire events and suppression efforts. For instance, the burned area in the Mediterranean has shown a declining trend since the 1980s, primarily due to enhanced suppression strategies (Turco et al., 2016), despite increasing trends in fire weather. However, increasing pressure from climate change and more extreme fire weather may lead to conditions where high-intensity fires overwhelm the suppression capacity (Abatzoglou et al., 2021; Podur and Wotton, 2010). In response to this growing challenge, international resource sharing has been recognized as both necessary and effective in Europe (Bloem et al., 2022) and RescEU has been established as a collective response of European member states to this growing need by pooling resources (Hopkins and Faulkner, 2021). However, it is also critical to recognize the so-called “fire-fighting trap” or the “suppression paradox”, where extinguishing all fires at any cost may lead to fires with greater severity in the following years under extreme fire weather conditions, due to fuel accumulation over time (Kreider et al., 2024; Moreira et al., 2020; Parisien et al., 2020). Given that the duration and intensity of extreme fire weather conditions are projected to increase with increasing greenhouse gas emissions, particularly in Mediterranean-type climates, a paradigm shift is advocated, emphasizing the importance of mitigation measures (Moreira et al., 2020). In this context, policy effectiveness should not be measured solely by the extent of the burned area, but rather by the degree to which socio-ecological damage is avoided (Moreira et al., 2020).
The next generation of simulations in the EURO-CORDEX framework, downscaled from CMIP6 GCMs, is currently underway (Katragkou et al., 2024), with some outputs expected to become available soon. This new generation of simulations retains the same spatial resolution as their CMIP5 counterparts, but incorporates greenhouse gas forcing scenarios based on the state-of-the-art Shared Socioeconomic Pathways (SSPs) instead of RCPs, along with a consistent space- and time-varying aerosol forcing (Katragkou et al., 2024). The latter may lead to a better representation of regional extreme fire weather conditions, considering that models that do not account for time-evolving aerosols underestimate the European summer warming (Schumacher et al., 2024). In our analysis, we also found that the EURO-CORDEX ensemble median slightly underestimates the warming trend in the daily maximum temperature, as given in Fig. S15. In this sense, FWI-based analysis can serve as a useful framework to evaluate whether newer model generations improve the representation of complex multivariate weather hazards. Future studies should also employ these RCMs for further investigation while accounting for the “hot model problem” that was identified shortly after the release of the associated GCMs (Hausfather et al., 2022). The present study can thus be seen as one more piece of the puzzle towards advancing our understanding of extreme fire weather in Europe in a warming climate, while emphasizing the need for measures to protect vulnerable regions.
The QDM implementation is based on the Python package cmethods (Schwertfeger et al., 2023), available at https://python-cmethods.readthedocs.io/en/latest/, last access: 29 June 2026. Singularity Stochastic Removal, seasonal cycle correction, and relative change signal adjustment were implemented on top of this package by the authors of this study. FWI calculations were performed using a Python script provided by Quilcaille et al. (2023) and available at https://github.com/yquilcaille/FWI_CMIP6, last access: 29 June 2026. All datasets used in this study are publicly available. ERA5-Land hourly reanalysis data are available at https://cds.climate.copernicus.eu/datasets/reanalysis-era5-land, last access: 30 December 2024. CMIP5 global climate model and EURO-CORDEX regional climate model data are available from the Earth System Grid Federation node at the German Climate Computing Center through https://esgf-metagrid.cloud.dkrz.de/search?project=CMIP5, last access: 30 December 2024 and https://esgf-metagrid.cloud.dkrz.de/search?project=CORDEX, last access: 30 December 2024. GFED5 monthly burned area data is accessible at https://www.globalfiredata.org/data.html, last access: 17 March 2026 and Copernicus land cover data is available at https://zenodo.org/records/3939050 (Buchhorn et al., 2020).
The supplement related to this article is available online at https://doi.org/10.5194/esd-17-929-2026-supplement.
ASB: conceptualization, data curation, formal analysis, methodology, software, visualization, writing – original draft, writing – review and editing. JGP: conceptualization, methodology, resources, supervision, writing – review and editing. CMG: conceptualization, methodology, writing – review and editing. AMR: conceptualization, methodology, project administration, resources, supervision, writing – review and editing.
The contact author has declared that none of the authors has any competing interests.
Publisher's note: Copernicus Publications remains neutral with regard to jurisdictional claims made in the text, published maps, institutional affiliations, or any other geographical representation in this paper. The authors bear the ultimate responsibility for providing appropriate place names. Views expressed in the text are those of the authors and do not necessarily reflect the views of the publisher.
We acknowledge support by the KIT-Publication Fund of the Karlsruhe Institute of Technology. The authors thank the German Climate Computing Center (DKRZ) for providing computing resources. We also acknowledge the World Climate Research Program's Working Group on Coupled Modeling, which is responsible for CMIP, and the relevant climate modeling groups (listed in Table 1) for producing and making the CMIP5 output available. We also acknowledge the CORDEX community for producing the EURO-CORDEX simulations and making them available (listed in Table 1). AI-assisted tools (OpenAI ChatGPT, GPT-5 family models) were used for minor language editing of this manuscript. AMR was supported by the Helmholtz “Changing Earth – Sustaining our Future” program. JGP thanks the AXA Research Fund for support. The contribution of CMG was performed under the framework of the DHEFEUS project, funded by FCT (https://doi.org/10.54499/2022.09185.PTDC). The authors thank Hendrik Feldmann and Florian Ehmele (both IMKTRO, KIT) for discussions on EURO-CORDEX models and bias adjustment. The authors also thank Emanuele Bevacqua and Andreia F.S. Ribeiro (both UFZ, Germany) for helpful discussions after the revisions. Finally, we thank the editor and the two anonymous reviewers for their constructive feedback, which helped improve the manuscript.
The article processing charges for this open-access publication were covered by the Karlsruhe Institute of Technology (KIT).
This paper was edited by Somnath Baidya Roy and reviewed by two anonymous referees.
Abatzoglou, J. T. and Williams, A. P.: Impact of anthropogenic climate change on wildfire across western US forests, P. Natl. Acad. Sci. USA, 113, 11770–11775, https://doi.org/10.1073/pnas.1607171113, 2016. a
Abatzoglou, J. T., Williams, A. P., Boschetti, L., Zubkova, M., and Kolden, C. A.: Global patterns of interannual climate–fire relationships, Glob. Change Biol., 24, 5164–5175, https://doi.org/10.1111/gcb.14405, 2018. a, b
Abatzoglou, J. T., Williams, A. P., and Barbero, R.: Global Emergence of Anthropogenic Climate Change in Fire Weather Indices, Geophys. Res. Lett., 46, 326–336, https://doi.org/10.1029/2018GL080959, 2019. a, b, c, d, e, f, g
Abatzoglou, J. T., Juang, C. S., Williams, A. P., Kolden, C. A., and Westerling, A. L.: Increasing Synchronous Fire Danger in Forests of the Western United States, Geophys. Res. Lett., 48, e2020GL091377, https://doi.org/10.1029/2020GL091377, 2021. a
Alduchov, O. A. and Eskridge, R. E.: Improved Magnus Form Approximation of Saturation Vapor Pressure, J. Appl. Meteorol. Climatol., 35, 601–609, https://doi.org/10.1175/1520-0450(1996)035<0601:IMFAOS>2.0.CO;2, 1996. a
Andela, N., Morton, D. C., Giglio, L., Chen, Y., van der Werf, G. R., Kasibhatla, P. S., DeFries, R. S., Collatz, G. J., Hantson, S., Kloster, S., Bachelet, D., Forrest, M., Lasslop, G., Li, F., Mangeon, S., Melton, J. R., Yue, C., and Randerson, J. T.: A human-driven decline in global burned area, Science, 356, 1356–1362, https://doi.org/10.1126/science.aal4108, 2017. a, b
Bayar, A. S., Yılmaz, M. T., Yücel, İ., and Dirmeyer, P.: CMIP6 Earth System Models Project Greater Acceleration of Climate Zone Change Due To Stronger Warming Rates, Earth's Future, 11, e2022EF002972, https://doi.org/10.1029/2022EF002972, 2023. a, b
Bedia, J., Herrera, S., Gutiérrez, J. M., Benali, A., Brands, S., Mota, B., and Moreno, J. M.: Global patterns in the sensitivity of burned area to fire-weather: Implications for climate change, Agr. Forest Meteorol., 214/215, 369–379, https://doi.org/10.1016/j.agrformet.2015.09.002, 2015. a, b
Bento, V. A., Lima, D. C. A., Santos, L. C., Lima, M. M., Russo, A., Nunes, S. A., DaCamara, C. C., Trigo, R. M., and Soares, P. M. M.: The future of extreme meteorological fire danger under climate change scenarios for Iberia, Weather Clim. Extrem., 42, 100623, https://doi.org/10.1016/j.wace.2023.100623, 2023. a
Bentsen, M., Bethke, I., Debernard, J. B., Iversen, T., Kirkevåg, A., Seland, Ø., Drange, H., Roelandt, C., Seierstad, I. A., Hoose, C., and Kristjánsson, J. E.: The Norwegian Earth System Model, NorESM1-M – Part 1: Description and basic evaluation of the physical climate, Geosci. Model Dev., 6, 687–720, https://doi.org/10.5194/gmd-6-687-2013, 2013. a
Bevacqua, E., Fischer, E., Sillmann, J., and Zscheischler, J.: Moderate global warming does not rule out extreme global climate outcomes, Nature, 651, 946–953, https://doi.org/10.1038/s41586-026-10237-9, 2026. a
Bloem, S., Cullen, A. C., Mearns, L. O., and Abatzoglou, J. T.: The Role of International Resource Sharing Arrangements in Managing Fire in the Face of Climate Change, Fire, 5, 88, https://doi.org/10.3390/fire5040088, 2022. a
Bøssing Christensen, O., Drews, M., Hesselbjerg Christensen, J., Dethloff, K., Ketelsen, K., Hebestadt, I., and Rinke, A.: The HIRHAM Regional Climate Model. Version 5 (beta), Technical Report 06-17, Danish Climate Centre, Danish Meteorological Institute, ISSN: 1399-1388, 2007. a
Bowman, D. M. J. S., Balch, J. K., Artaxo, P., Bond, W. J., Carlson, J. M., Cochrane, M. A., D'Antonio, C. M., DeFries, R. S., Doyle, J. C., Harrison, S. P., Johnston, F. H., Keeley, J. E., Krawchuk, M. A., Kull, C. A., Marston, J. B., Moritz, M. A., Prentice, I. C., Roos, C. I., Scott, A. C., Swetnam, T. W., Werf, G. R. v. d., and Pyne, S. J.: Fire in the Earth System, Science, 324, 481–484, https://doi.org/10.1126/science.1163886, 2009. a
Bowman, D. M. J. S., Williamson, G. J., Abatzoglou, J. T., Kolden, C. A., Cochrane, M. A., and Smith, A. M. S.: Human exposure and sensitivity to globally extreme wildfire events, Nat. Ecol. Evol., 1, 1–6, https://doi.org/10.1038/s41559-016-0058, 2017. a, b
Bowman, D. M. J. S., Kolden, C. A., Abatzoglou, J. T., Johnston, F. H., van der Werf, G. R., and Flannigan, M.: Vegetation fires in the Anthropocene, Nat. Rev. Earth Environ., 1, 500–515, https://doi.org/10.1038/s43017-020-0085-3, 2020. a, b
Buchhorn, M., Smets, B., Bertels, L., Roo, B. D., Lesiv, M., Tsendbazar, N.-E., Herold, M., and Fritz, S.: Copernicus Global Land Service: Land Cover 100m: collection 3: epoch 2019: Globe (V3.0.1), Zenodo [data set], https://doi.org/10.5281/zenodo.3939050, 2020. a, b
Calheiros, T., Nunes, J. P., and Pereira, M. G.: Recent evolution of spatial and temporal patterns of burnt areas and fire weather risk in the Iberian Peninsula, Agr. Forest Meteorol., 287, 107923, https://doi.org/10.1016/j.agrformet.2020.107923, 2020. a
Calheiros, T., Pereira, M. G., and Nunes, J. P.: Assessing impacts of future climate change on extreme fire weather and pyro-regions in Iberian Peninsula, Sci. Total Environ., 754, 142233, https://doi.org/10.1016/j.scitotenv.2020.142233, 2021. a
Cannon, A. J.: Multivariate quantile mapping bias correction: an N-dimensional probability density function transform for climate model simulations of multiple variables, Clim. Dynam., 50, 31–49, https://doi.org/10.1007/s00382-017-3580-6, 2018. a, b
Cannon, A. J., Sobie, S. R., and Murdock, T. Q.: Bias Correction of GCM Precipitation by Quantile Mapping: How Well Do Methods Preserve Changes in Quantiles and Extremes?, J. Clim., 28, 6938–6959, https://doi.org/10.1175/JCLI-D-14-00754.1, 2015. a, b, c
Carnicer, J., Alegria, A., Giannakopoulos, C., Di Giuseppe, F., Karali, A., Koutsias, N., Lionello, P., Parrington, M., and Vitolo, C.: Global warming is shifting the relationships between fire weather and realized fire-induced CO2 emissions in Europe, Sci. Rep., 12, 10365, https://doi.org/10.1038/s41598-022-14480-8, 2022. a
Carvalho, A., Flannigan, M. D., Logan, K., Miranda, A. I., and Borrego, C.: Fire activity in Portugal and its relationship to weather and the Canadian Fire Weather Index System, Int. J. Wildl. Fire, 17, 328–338, https://doi.org/10.1071/WF07014, 2008. a, b, c
Chen, J., Arsenault, R., Brissette, F. P., and Zhang, S.: Climate Change Impact Studies: Should We Bias Correct Climate Model Outputs or Post-Process Impact Model Outputs?, Water Resour. Res., 57, e2020WR028638, https://doi.org/10.1029/2020WR028638, 2021. a
Chen, Y., Hall, J., van Wees, D., Andela, N., Hantson, S., Giglio, L., van der Werf, G. R., Morton, D. C., and Randerson, J. T.: Multi-decadal trends and variability in burned area from the fifth version of the Global Fire Emissions Database (GFED5), Earth Syst. Sci. Data, 15, 5227–5259, https://doi.org/10.5194/essd-15-5227-2023, 2023. a, b, c
Christensen, J. H. and Christensen, O. B.: A summary of the PRUDENCE model projections of changes in European climate by the end of this century, Climatic Change, 81, 7–30, https://doi.org/10.1007/s10584-006-9210-7, 2007. a, b
Chuvieco, E., Lizundia-Loiola, J., Pettinari, M. L., Ramo, R., Padilla, M., Tansey, K., Mouillot, F., Laurent, P., Storm, T., Heil, A., and Plummer, S.: Generation and analysis of a new global burned area product based on MODIS 250 m reflectance bands and thermal anomalies, Earth Syst. Sci. Data, 10, 2015–2031, https://doi.org/10.5194/essd-10-2015-2018, 2018. a
Clarke, H., Nolan, R. H., De Dios, V. R., Bradstock, R., Griebel, A., Khanal, S., and Boer, M. M.: Forest fire threatens global carbon sinks and population centres under rising atmospheric water demand, Nat. Commun., 13, 7161, https://doi.org/10.1038/s41467-022-34966-3, 2022. a
Collins, W. J., Bellouin, N., Doutriaux-Boucher, M., Gedney, N., Halloran, P., Hinton, T., Hughes, J., Jones, C. D., Joshi, M., Liddicoat, S., Martin, G., O'Connor, F., Rae, J., Senior, C., Sitch, S., Totterdell, I., Wiltshire, A., and Woodward, S.: Development and evaluation of an Earth-System model – HadGEM2, Geosci. Model Dev., 4, 1051–1075, https://doi.org/10.5194/gmd-4-1051-2011, 2011. a
Copernicus Climate Change Service (C3S) and World Meteorological Organization (WMO): European State of the Climate 2024, Tech. rep., Copernicus Climate Change Service (C3S), https://doi.org/10.24381/14j9-s541, 2025. a
Cunningham, C. X., Williamson, G. J., and Bowman, D. M. J. S.: Increasing frequency and intensity of the most extreme wildfires on Earth, Nat. Ecol. Evol., 8, 1420–1425, https://doi.org/10.1038/s41559-024-02452-2, 2024. a
de Rigo, D., Libertà, G., Houston Durrant, T., Vivancos, T. A., San-Miguel-Ayanz, J., and Union, P. O. o. t. E.: Forest fire danger extremes in Europe under climate change: variability and uncertainty, Research Report, Publications Office of the European Union, https://doi.org/10.2760/13180, 2017. a
Dosio, A. and Paruolo, P.: Bias correction of the ENSEMBLES high-resolution climate change projections for use by impact models: Evaluation on the present climate, J. Geophys. Res.-Atmos., 116, https://doi.org/10.1029/2011JD015934, 2011. a
Dufresne, J.-L., Foujols, M.-A., Denvil, S., Caubel, A., Marti, O., Aumont, O., Balkanski, Y., Bekki, S., Bellenger, H., Benshila, R., Bony, S., Bopp, L., Braconnot, P., Brockmann, P., Cadule, P., Cheruy, F., Codron, F., Cozic, A., Cugnet, D., de Noblet, N., Duvel, J.-P., Ethé, C., Fairhead, L., Fichefet, T., Flavoni, S., Friedlingstein, P., Grandpeix, J.-Y., Guez, L., Guilyardi, E., Hauglustaine, D., Hourdin, F., Idelkadi, A., Ghattas, J., Joussaume, S., Kageyama, M., Krinner, G., Labetoulle, S., Lahellec, A., Lefebvre, M.-P., Lefevre, F., Levy, C., Li, Z. X., Lloyd, J., Lott, F., Madec, G., Mancip, M., Marchand, M., Masson, S., Meurdesoif, Y., Mignot, J., Musat, I., Parouty, S., Polcher, J., Rio, C., Schulz, M., Swingedouw, D., Szopa, S., Talandier, C., Terray, P., Viovy, N., and Vuichard, N.: Climate change projections using the IPSL-CM5 Earth System Model: from CMIP3 to CMIP5, Clim. Dynam., 40, 2123–2165, https://doi.org/10.1007/s00382-012-1636-1, 2013. a
El Garroussi, S., Di Giuseppe, F., Barnard, C., and Wetterhall, F.: Europe faces up to tenfold increase in extreme fires in a warming climate, npj Clim. Atmos. Sci., 7, 30, https://doi.org/10.1038/s41612-024-00575-8, 2024. a, b, c, d
Ellis, T. M., Bowman, D. M. J. S., Jain, P., Flannigan, M. D., and Williamson, G. J.: Global increase in wildfire risk due to climate-driven declines in fuel moisture, Glob. Change Biol., 28, 1544–1559, https://doi.org/10.1111/gcb.16006, 2022. a
Eyring, V., Bony, S., Meehl, G. A., Senior, C. A., Stevens, B., Stouffer, R. J., and Taylor, K. E.: Overview of the Coupled Model Intercomparison Project Phase 6 (CMIP6) experimental design and organization, Geosci. Model Dev., 9, 1937–1958, https://doi.org/10.5194/gmd-9-1937-2016, 2016. a
Fargeon, H., Pimont, F., Martin-StPaul, N., De Caceres, M., Ruffault, J., Barbero, R., and Dupuy, J.-L.: Projections of fire danger under climate change over France: where do the greatest uncertainties lie?, Climatic Change, 160, 479–493, https://doi.org/10.1007/s10584-019-02629-w, 2020. a, b
Fox, D. M., Carrega, P., Ren, Y., Caillouet, P., Bouillon, C., and Robert, S.: How wildfire risk is related to urban planning and Fire Weather Index in SE France (1990–2013), Sci. Total Environ., 621, 120–129, https://doi.org/10.1016/j.scitotenv.2017.11.174, 2018. a
Friedlingstein, P., O'Sullivan, M., Jones, M. W., Andrew, R. M., Bakker, D. C. E., Hauck, J., Landschützer, P., Le Quéré, C., Luijkx, I. T., Peters, G. P., Peters, W., Pongratz, J., Schwingshackl, C., Sitch, S., Canadell, J. G., Ciais, P., Jackson, R. B., Alin, S. R., Anthoni, P., Barbero, L., Bates, N. R., Becker, M., Bellouin, N., Decharme, B., Bopp, L., Brasika, I. B. M., Cadule, P., Chamberlain, M. A., Chandra, N., Chau, T.-T.-T., Chevallier, F., Chini, L. P., Cronin, M., Dou, X., Enyo, K., Evans, W., Falk, S., Feely, R. A., Feng, L., Ford, D. J., Gasser, T., Ghattas, J., Gkritzalis, T., Grassi, G., Gregor, L., Gruber, N., Gürses, Ö., Harris, I., Hefner, M., Heinke, J., Houghton, R. A., Hurtt, G. C., Iida, Y., Ilyina, T., Jacobson, A. R., Jain, A., Jarníková, T., Jersild, A., Jiang, F., Jin, Z., Joos, F., Kato, E., Keeling, R. F., Kennedy, D., Klein Goldewijk, K., Knauer, J., Korsbakken, J. I., Körtzinger, A., Lan, X., Lefèvre, N., Li, H., Liu, J., Liu, Z., Ma, L., Marland, G., Mayot, N., McGuire, P. C., McKinley, G. A., Meyer, G., Morgan, E. J., Munro, D. R., Nakaoka, S.-I., Niwa, Y., O'Brien, K. M., Olsen, A., Omar, A. M., Ono, T., Paulsen, M., Pierrot, D., Pocock, K., Poulter, B., Powis, C. M., Rehder, G., Resplandy, L., Robertson, E., Rödenbeck, C., Rosan, T. M., Schwinger, J., Séférian, R., Smallman, T. L., Smith, S. M., Sospedra-Alfonso, R., Sun, Q., Sutton, A. J., Sweeney, C., Takao, S., Tans, P. P., Tian, H., Tilbrook, B., Tsujino, H., Tubiello, F., van der Werf, G. R., van Ooijen, E., Wanninkhof, R., Watanabe, M., Wimart-Rousseau, C., Yang, D., Yang, X., Yuan, W., Yue, X., Zaehle, S., Zeng, J., and Zheng, B.: Global Carbon Budget 2023, Earth Syst. Sci. Data, 15, 5301–5369, https://doi.org/10.5194/essd-15-5301-2023, 2023. a
Galizia, L. F., Barbero, R., Rodrigues, M., Ruffault, J., Pimont, F., and Curt, T.: Global Warming Reshapes European Pyroregions, Earth's Future, 11, e2022EF003182, https://doi.org/10.1029/2022EF003182, 2023. a
Giorgetta, M. A., Jungclaus, J., Reick, C. H., Legutke, S., Bader, J., Böttinger, M., Brovkin, V., Crueger, T., Esch, M., Fieg, K., Glushak, K., Gayler, V., Haak, H., Hollweg, H.-D., Ilyina, T., Kinne, S., Kornblueh, L., Matei, D., Mauritsen, T., Mikolajewicz, U., Mueller, W., Notz, D., Pithan, F., Raddatz, T., Rast, S., Redler, R., Roeckner, E., Schmidt, H., Schnur, R., Segschneider, J., Six, K. D., Stockhause, M., Timmreck, C., Wegner, J., Widmann, H., Wieners, K.-H., Claussen, M., Marotzke, J., and Stevens, B.: Climate and carbon cycle changes from 1850 to 2100 in MPI-ESM simulations for the Coupled Model Intercomparison Project phase 5, J. Adv. Model. Earth Syst., 5, 572–597, https://doi.org/10.1002/jame.20038, 2013. a
Giorgi, F.: Thirty Years of Regional Climate Modeling: Where Are We and Where Are We Going next?, J. Geophys. Res.-Atmos., 124, 5696–5723, https://doi.org/10.1029/2018JD030094, 2019. a, b, c
Gumus, B., Oruc, S., Yucel, I., and Yilmaz, M. T.: Impacts of Climate Change on Extreme Climate Indices in Türkiye Driven by High-Resolution Downscaled CMIP6 Climate Models, Sustainability, 15, 7202, https://doi.org/10.3390/su15097202, 2023. a
Hakala, K., Addor, N., and Seibert, J.: Hydrological Modeling to Evaluate Climate Model Simulations and Their Bias Correction, J. Hydrometeorol., 19, https://doi.org/10.1175/JHM-D-17-0189.1, 2018. a
Hausfather, Z., Marvel, K., Schmidt, G. A., Nielsen-Gammon, J. W., and Zelinka, M.: Climate simulations: recognize the “hot model” problem, Nature, 605, 26–29, https://doi.org/10.1038/d41586-022-01192-2, 2022. a
Hazeleger, W., Wang, X., Severijns, C., Ştefănescu, S., Bintanja, R., Sterl, A., Wyser, K., Semmler, T., Yang, S., van den Hurk, B., van Noije, T., van der Linden, E., and van der Wiel, K.: EC-Earth V2.2: description and validation of a new seamless earth system prediction model, Clim. Dynam., 39, 2611–2629, https://doi.org/10.1007/s00382-011-1228-5, 2012. a
He, Q., Williams, A. P., Johnston, M. R., Juang, C. S., and Wang, B.: Influence of Time-Averaging of Climate Data on Estimates of Atmospheric Vapor Pressure Deficit and Inferred Relationships With Wildfire Area in the Western United States, Geophys. Res. Lett., 52, e2024GL113708, https://doi.org/10.1029/2024GL113708, 2025. a, b
He, T., Lamont, B. B., and Pausas, J. G.: Fire as a key driver of Earth's biodiversity, Biol. Rev., 94, 1983–2010, https://doi.org/10.1111/brv.12544, 2019. a
Hetzer, J., Forrest, M., Ribalaygua, J., Prado-López, C., and Hickler, T.: The fire weather in Europe: large-scale trends towards higher danger, Environ. Res. Lett., 19, 084017, https://doi.org/10.1088/1748-9326/ad5b09, 2024. a, b, c
Hopkins, W. J. and Faulkner, H.: To The RescEU? Disaster Response As A Driver For European Integration, Tech. rep., University of Canterbury, https://doi.org/10.26021/12400, 2021. a
Hundhausen, M., Feldmann, H., Kohlhepp, R., and Pinto, J. G.: Climate change signals of extreme precipitation return levels for Germany in a transient convection-permitting simulation ensemble, Int. J. Climatol., 44, 1454–1471, https://doi.org/10.1002/joc.8393, 2024. a
Jacob, D., Elizalde, A., Haensler, A., Hagemann, S., Kumar, P., Podzun, R., Rechid, D., Remedio, A. R., Saeed, F., Sieck, K., Teichmann, C., and Wilhelm, C.: Assessing the Transferability of the Regional Climate Model REMO to Different COordinated Regional Climate Downscaling EXperiment (CORDEX) Regions, Atmosphere, 3, 181–199, https://doi.org/10.3390/atmos3010181, 2012. a
Jacob, D., Petersen, J., Eggert, B., Alias, A., Christensen, O. B., Bouwer, L. M., Braun, A., Colette, A., Déqué, M., Georgievski, G., Georgopoulou, E., Gobiet, A., Menut, L., Nikulin, G., Haensler, A., Hempelmann, N., Jones, C., Keuler, K., Kovats, S., Kröner, N., Kotlarski, S., Kriegsmann, A., Martin, E., van Meijgaard, E., Moseley, C., Pfeifer, S., Preuschmann, S., Radermacher, C., Radtke, K., Rechid, D., Rounsevell, M., Samuelsson, P., Somot, S., Soussana, J.-F., Teichmann, C., Valentini, R., Vautard, R., Weber, B., and Yiou, P.: EURO-CORDEX: new high-resolution climate change projections for European impact research, Reg. Environ. Change, 14, 563–578, https://doi.org/10.1007/s10113-013-0499-2, 2014. a, b, c, d
Jain, P., Castellanos-Acuna, D., Coogan, S. C. P., Abatzoglou, J. T., and Flannigan, M. D.: Observed increases in extreme fire weather driven by atmospheric humidity and temperature, Nat. Clim. Change, 12, 63–70, https://doi.org/10.1038/s41558-021-01224-1, 2022. a
James, R., Washington, R., Schleussner, C.-F., Rogelj, J., and Conway, D.: Characterizing half-a-degree difference: a review of methods for identifying regional climate responses to global warming targets, WIREs Climate Change, 8, e457, https://doi.org/10.1002/wcc.457, 2017. a
Jolly, W. M., Cochrane, M. A., Freeborn, P. H., Holden, Z. A., Brown, T. J., Williamson, G. J., and Bowman, D. M. J. S.: Climate-induced variations in global wildfire danger from 1979 to 2013, Nat. Commun., 6, 7537, https://doi.org/10.1038/ncomms8537, 2015. a, b, c, d, e, f
Jones, M. W., Abatzoglou, J. T., Veraverbeke, S., Andela, N., Lasslop, G., Forkel, M., Smith, A. J. P., Burton, C., Betts, R. A., van der Werf, G. R., Sitch, S., Canadell, J. G., Santín, C., Kolden, C., Doerr, S. H., and Le Quéré, C.: Global and Regional Trends and Drivers of Fire Under Climate Change, Rev. Geophys., 60, e2020RG000726, https://doi.org/10.1029/2020RG000726, 2022. a, b, c, d, e, f, g, h, i, j, k, l
Jones, M. W., Veraverbeke, S., Andela, N., Doerr, S. H., Kolden, C., Mataveli, G., Pettinari, M. L., Quéré, C. L., Rosan, T. M., Werf, G. R. v. d., Wees, D. v., and Abatzoglou, J. T.: Global rise in forest fire emissions linked to climate change in the extratropics, Science, 386, https://doi.org/10.1126/science.adl5889, 2024. a
Jones, P. W.: First- and Second-Order Conservative Remapping Schemes for Grids in Spherical Coordinates, Mon. Weather Rev., 127, 2204–2210, https://doi.org/10.1175/1520-0493(1999)127<2204:FASOCR>2.0.CO;2, 1999. a
Katragkou, E., Sobolowski, S. P., Teichmann, C., Solmon, F., Pavlidis, V., Rechid, D., Hoffmann, P., Fernandez, J., Nikulin, G., and Jacob, D.: Delivering an Improved Framework for the New Generation of CMIP6-Driven EURO-CORDEX Regional Climate Simulations, Bull. Am. Meteorol. Soc., 105, E962–E974, https://doi.org/10.1175/BAMS-D-23-0131.1, 2024. a, b
Kendall, M. G.: Rank correlation methods., Hafner Publishing Co., Griffin, 1955. a
Kjellström, E., Bärring, L., Nikulin, G., Nilsson, C., Persson, G., and Strandberg, G.: Production and use of regional climate model projections – A Swedish perspective on building climate services, Climate Services, 2-3, 15–29, https://doi.org/10.1016/j.cliser.2016.06.004, 2016. a
Kreider, M. R., Higuera, P. E., Parks, S. A., Rice, W. L., White, N., and Larson, A. J.: Fire suppression makes wildfires more severe and accentuates impacts of climate change and fuel accumulation, Nat. Commun., 15, 2412, https://doi.org/10.1038/s41467-024-46702-0, 2024. a
Kudláčková, L., Bartošová, L., Linda, R., Bláhová, M., Poděbradská, M., Fischer, M., Balek, J., Žalud, Z., and Trnka, M.: Assessing fire danger classes and extreme thresholds of the Canadian Fire Weather Index across global environmental zones: a review, Environ. Res. Lett., 20, 013001, https://doi.org/10.1088/1748-9326/ad97cf, 2024. a, b
Mann, H. B.: Nonparametric Tests Against Trend, Econometrica, 13, 245–259, https://doi.org/10.2307/1907187, 1945. a
Maraun, D. and Widmann, M.: Cross-validation of bias-corrected climate simulations is misleading, Hydrol. Earth Syst. Sci., 22, 4867–4873, https://doi.org/10.5194/hess-22-4867-2018, 2018. a
Maraun, D., Shepherd, T. G., Widmann, M., Zappa, G., Walton, D., Gutiérrez, J. M., Hagemann, S., Richter, I., Soares, P. M. M., Hall, A., and Mearns, L. O.: Towards process-informed bias correction of climate change simulations, Nat. Clim. Change, 7, 764–773, https://doi.org/10.1038/nclimate3418, 2017. a
Masson-Delmotte, V., Zhai, P., Pirani, A., Connors, S. L., Péan, C., Berger, S., Caud, N., Chen, Y., Goldfarb, L., Gomis, M. I., Huang, M., Leitzell, K., Lonnoy, E., Matthews, J. B. R., Maycock, T. K., Waterfield, T., Yelekçi, Ö., Yu, R., and Zhou, B., eds.: Climate Change 2021: The Physical Science Basis. Contribution of Working Group I to the Sixth Assessment Report of the Intergovernmental Panel on Climate Change, Cambridge University Press, Cambridge, United Kingdom and New York, NY, USA, https://doi.org/10.1017/9781009157896, 2021. a, b, c, d
Matteo, A., Garnés-Morales, G., Moreno, A., Ribeiro, A. F. S., Azorin-Molina, C., Bedia, J., Di Giuseppe, F., Dunn, R. J. H., Herrera, S., Provenzale, A., Quilcaille, Y., Torres-Vázquez, M. Á., and Turco, M.: Challenges in assessing Fire Weather changes in a warming climate, npj Clima. Atmos. Sci., 8, 284, https://doi.org/10.1038/s41612-025-01163-0, 2025. a, b
McElhinny, M., Beckers, J. F., Hanes, C., Flannigan, M., and Jain, P.: A high-resolution reanalysis of global fire weather from 1979 to 2018 – overwintering the Drought Code, Earth Syst. Sci. Data, 12, 1823–1833, https://doi.org/10.5194/essd-12-1823-2020, 2020. a, b, c
Meijgaard, E. v., Ulft, L. H. v., Lenderink, G., Roode, S. R. d., Wipfler, E. L., Boers, R., and Timmermans, R. M. A. v.: Refinement and application of a regional atmospheric model for climate scenario calculations of Western Europe, KVR, ISBN 978-90-8815-046-3, 2012. a
Miller, J., Böhnisch, A., Ludwig, R., and Brunner, M. I.: Climate change impacts on regional fire weather in heterogeneous landscapes of central Europe, Nat. Hazards Earth Syst. Sci., 24, 411–428, https://doi.org/10.5194/nhess-24-411-2024, 2024. a
Moemken, J., Koerner, B., Ehmele, F., Feldmann, H., and Pinto, J. G.: Recurrence of Drought Events Over Iberia. Part II: Future Changes Using Regional Climate Projections, Tellus A, 74, 262–279, https://doi.org/10.16993/tellusa.52, 2022. a
Moreira, F., Ascoli, D., Safford, H., Adams, M. A., Moreno, J. M., Pereira, J. M. C., Catry, F. X., Armesto, J., Bond, W., González, M. E., Curt, T., Koutsias, N., McCaw, L., Price, O., Pausas, J. G., Rigolot, E., Stephens, S., Tavsanoglu, C., Vallejo, V. R., Van Wilgen, B. W., Xanthopoulos, G., and Fernandes, P. M.: Wildfire management in Mediterranean-type regions: paradigm change needed, Environ. Res. Lett., 15, 011001, https://doi.org/10.1088/1748-9326/ab541e, 2020. a, b, c
Mozny, M., Trnka, M., and Brázdil, R.: Climate change driven changes of vegetation fires in the Czech Republic, Theor. Appl. Climatol., 143, 691–699, https://doi.org/10.1007/s00704-020-03443-6, 2021. a
Muerth, M. J., Gauvin St-Denis, B., Ricard, S., Velázquez, J. A., Schmid, J., Minville, M., Caya, D., Chaumont, D., Ludwig, R., and Turcotte, R.: On the need for bias correction in regional climate scenarios to assess climate change impacts on river runoff, Hydrol. Earth Syst. Sci., 17, 1189–1204, https://doi.org/10.5194/hess-17-1189-2013, 2013. a
Muñoz-Sabater, J., Dutra, E., Agustí-Panareda, A., Albergel, C., Arduini, G., Balsamo, G., Boussetta, S., Choulga, M., Harrigan, S., Hersbach, H., Martens, B., Miralles, D. G., Piles, M., Rodríguez-Fernández, N. J., Zsoter, E., Buontempo, C., and Thépaut, J.-N.: ERA5-Land: a state-of-the-art global reanalysis dataset for land applications, Earth Syst. Sci. Data, 13, 4349–4383, https://doi.org/10.5194/essd-13-4349-2021, 2021. a, b, c
Nogherotto, R., Raffaele, F., Giuliani, G., and Coppola, E.: Has the fire weather index emerged? Insights from global and regional climate models, Weather Clim. Extrem., 51, 100861, https://doi.org/10.1016/j.wace.2026.100861, 2026. a
Parisien, M.-A., Barber, Q. E., Hirsch, K. G., Stockdale, C. A., Erni, S., Wang, X., Arseneault, D., and Parks, S. A.: Fire deficit increases wildfire risk for many communities in the Canadian boreal forest, Nat. Commun., 11, 2121, https://doi.org/10.1038/s41467-020-15961-y, 2020. a
Pausas, J. G. and Keeley, J. E.: Wildfires and global change, Front. Ecol. Environ., 19, 387–395, https://doi.org/10.1002/fee.2359, 2021. a
Pfeifer, S., Bülow, K., Gobiet, A., Hänsler, A., Mudelsee, M., Otto, J., Rechid, D., Teichmann, C., and Jacob, D.: Robustness of Ensemble Climate Projections Analyzed with Climate Signal Maps: Seasonal and Extreme Precipitation for Germany, Atmosphere, 6, 677–698, https://doi.org/10.3390/atmos6050677, 2015. a
Podur, J. and Wotton, M.: Will climate change overwhelm fire management capacity?, Ecol. Model., 221, 1301–1309, https://doi.org/10.1016/j.ecolmodel.2010.01.013, 2010. a
Quilcaille, Y., Batibeniz, F., Ribeiro, A. F. S., Padrón, R. S., and Seneviratne, S. I.: Fire weather index data under historical and shared socioeconomic pathway projections in the 6th phase of the Coupled Model Intercomparison Project from 1850 to 2100, Earth Syst. Sci. Data, 15, 2153–2177, https://doi.org/10.5194/essd-15-2153-2023, 2023. a, b, c, d
Ramos, A. M., Russo, A., DaCamara, C. C., Nunes, S., Sousa, P., Soares, P. M. M., Lima, M. M., Hurduc, A., and Trigo, R. M.: The compound event that triggered the destructive fires of October 2017 in Portugal, iScience, 26, 106141, https://doi.org/10.1016/j.isci.2023.106141, 2023. a
Resco de Dios, V., Hedo, J., Cunill Camprubí, À., Thapa, P., Martínez del Castillo, E., Martínez de Aragón, J., Bonet, J. A., Balaguer-Romano, R., Díaz-Sierra, R., Yebra, M., and Boer, M. M.: Climate change induced declines in fuel moisture may turn currently fire-free Pyrenean mountain forests into fire-prone ecosystems, Sci. Total Environ., 797, 149104, https://doi.org/10.1016/j.scitotenv.2021.149104, 2021. a
Rovithakis, A., Grillakis, M. G., Seiradakis, K. D., Giannakopoulos, C., Karali, A., Field, R., Lazaridis, M., and Voulgarakis, A.: Future climate change impact on wildfire danger over the Mediterranean: the case of Greece, Environ. Res. Lett., 17, 045022, https://doi.org/10.1088/1748-9326/ac5f94, 2022. a
Ruffault, J., Curt, T., Moron, V., Trigo, R. M., Mouillot, F., Koutsias, N., Pimont, F., Martin-StPaul, N., Barbero, R., Dupuy, J.-L., Russo, A., and Belhadj-Khedher, C.: Increased likelihood of heat-induced large wildfires in the Mediterranean Basin, Sci. Rep., 10, 13790, https://doi.org/10.1038/s41598-020-70069-z, 2020. a
San-Miguel-Ayanz, J., Schulte, E., Schmuck, G., Camia, A., Strobl, P., Liberta, G., Giovando, C., Boca, R., Sedano, F., Kempeneers, P., McInerney, D., Withmore, C., Oliveira, S. S. d., Rodrigues, M., Durrant, T., Corti, P., Oehler, F., Vilar, L., Amatulli, G., San-Miguel-Ayanz, J., Schulte, E., Schmuck, G., Camia, A., Strobl, P., Liberta, G., Giovando, C., Boca, R., Sedano, F., Kempeneers, P., McInerney, D., Withmore, C., Oliveira, S. S. d., Rodrigues, M., Durrant, T., Corti, P., Oehler, F., Vilar, L., and Amatulli, G.: Comprehensive Monitoring of Wildfires in Europe: The European Forest Fire Information System (EFFIS), in: Approaches to Managing Disaster – Assessing Hazards, Emergencies and Disaster Impacts, IntechOpen, ISBN 978-953-51-0294-6, 2012. a, b, c, d
Schumacher, D. L., Singh, J., Hauser, M., Fischer, E. M., Wild, M., and Seneviratne, S. I.: Exacerbated summer European warming not captured by climate models neglecting long-term aerosol changes, Commun. Earth Environ., 5, 182, https://doi.org/10.1038/s43247-024-01332-8, 2024. a
Schwertfeger, B. T., Lohmann, G., and Lipskoch, H.: Introduction of the BiasAdjustCXX command-line tool for the application of fast and efficient bias corrections in climatic research, SoftwareX, 22, 101379, https://doi.org/10.1016/j.softx.2023.101379, 2023. a
Scott, A. C. and Glasspool, I. J.: The diversification of Paleozoic fire systems and fluctuations in atmospheric oxygen concentration, P. Natl. Acad. Sci. USA, 103, 10861–10865, https://doi.org/10.1073/pnas.0604090103, 2006. a
Seager, R., Hooks, A., Williams, A. P., Cook, B., Nakamura, J., and Henderson, N.: Climatology, Variability, and Trends in the U.S. Vapor Pressure Deficit, an Important Fire-Related Meteorological Quantity, J. Appl. Meteorol. Climatol., 54, 1121–1141, https://doi.org/10.1175/JAMC-D-14-0321.1, 2015. a
Sen, P. K.: Estimates of the Regression Coefficient Based on Kendall's Tau, J. Am. Stat. Assoc., 63, 1379–1389, https://doi.org/10.1080/01621459.1968.10480934, 1968. a
Shepherd, T. G.: Atmospheric circulation as a source of uncertainty in climate change projections, Nat. Geosci., 7, 703–708, https://doi.org/10.1038/ngeo2253, 2014. a
Sørland, S. L., Brogli, R., Pothapakula, P. K., Russo, E., Van de Walle, J., Ahrens, B., Anders, I., Bucchignani, E., Davin, E. L., Demory, M.-E., Dosio, A., Feldmann, H., Früh, B., Geyer, B., Keuler, K., Lee, D., Li, D., van Lipzig, N. P. M., Min, S.-K., Panitz, H.-J., Rockel, B., Schär, C., Steger, C., and Thiery, W.: COSMO-CLM regional climate simulations in the Coordinated Regional Climate Downscaling Experiment (CORDEX) framework: a review, Geosci. Model Dev., 14, 5125–5154, https://doi.org/10.5194/gmd-14-5125-2021, 2021. a, b
Taylor, K. E., Stouffer, R. J., and Meehl, G. A.: An Overview of CMIP5 and the Experiment Design, Bull. Am. Meteorol. Soc., 93, 485–498, https://doi.org/10.1175/BAMS-D-11-00094.1, 2012. a
Teichmann, C., Bülow, K., Otto, J., Pfeifer, S., Rechid, D., Sieck, K., and Jacob, D.: Avoiding Extremes: Benefits of Staying below +1.5 °C Compared to +2.0 °C and +3.0 °C Global Warming, Atmosphere, 9, 115, https://doi.org/10.3390/atmos9040115, 2018. a
Teutschbein, C. and Seibert, J.: Bias correction of regional climate model simulations for hydrological climate-change impact studies: Review and evaluation of different methods, J. Hydrol., 456/457, 12–29, https://doi.org/10.1016/j.jhydrol.2012.05.052, 2012. a
Theil, H.: A Rank-Invariant Method of Linear and Polynomial Regression Analysis, in: Henri Theil's Contributions to Economics and Econometrics: Econometric Theory and Methodology, edited by: Raj, B. and Koerts, J., 345–381, Springer Netherlands, Dordrecht, ISBN 978-94-011-2546-8, 1950. a
Tinker, J., Lowe, J., Holt, J., Pardaens, A., and Wiltshire, A.: Validation of an ensemble modelling system for climate projections for the northwest European shelf seas, Prog. Oceanogr., 138, 211–237, https://doi.org/10.1016/j.pocean.2015.07.002, 2015. a
Turco, M., Bedia, J., Liberto, F. D., Fiorucci, P., Hardenberg, J. v., Koutsias, N., Llasat, M.-C., Xystrakis, F., and Provenzale, A.: Decreasing Fires in Mediterranean Europe, PLOS ONE, 11, e0150663, https://doi.org/10.1371/journal.pone.0150663, 2016. a
Urbieta, I. R., Zavala, G., Bedia, J., Gutiérrez, J. M., Miguel-Ayanz, J. S., Camia, A., Keeley, J. E., and Moreno, J. M.: Fire activity as a function of fire–weather seasonal severity and antecedent climate across spatial scales in southern Europe and Pacific western USA, Environ. Res. Lett., 10, 114013, https://doi.org/10.1088/1748-9326/10/11/114013, 2015. a
van der Werf, G. R., Randerson, J. T., van Wees, D., Chen, Y., Giglio, L., Hall, J., Vernooij, R., Mu, M., Binte Shahid, S., Barsanti, K. C., Yokelson, R., and Morton, D. C.: Landscape fire emissions from the 5th version of the Global Fire Emissions Database (GFED5), Sci. Data, 12, 1870, https://doi.org/10.1038/s41597-025-06127-w, 2025. a
Van Wagner, C.: Development and structure of the Canadian Forest Fire Weather Index System, Technical Report 35, The Canadian Forestry Service, Ottawa, ISBN: 0-662-15198-4, 1987. a, b, c, d, e, f
Varela, V., Vlachogiannis, D., Sfetsos, A., Karozis, S., Politi, N., and Giroud, F.: Projection of Forest Fire Danger due to Climate Change in the French Mediterranean Region, Sustainability, 11, 4284, https://doi.org/10.3390/su11164284, 2019. a
Vautard, R., Gobiet, A., Jacob, D., Belda, M., Colette, A., Déqué, M., Fernández, J., García-Díez, M., Goergen, K., Güttler, I., Halenka, T., Karacostas, T., Katragkou, E., Keuler, K., Kotlarski, S., Mayer, S., van Meijgaard, E., Nikulin, G., Patarčić, M., Scinocca, J., Sobolowski, S., Suklitsch, M., Teichmann, C., Warrach-Sagi, K., Wulfmeyer, V., and Yiou, P.: The simulation of European heat waves from an ensemble of regional climate models within the EURO-CORDEX project, Clim. Dynam., 41, 2555–2575, https://doi.org/10.1007/s00382-013-1714-z, 2013. a
Vautard, R., Gobiet, A., Sobolowski, S., Kjellström, E., Stegehuis, A., Watkiss, P., Mendlik, T., Landgren, O., Nikulin, G., Teichmann, C., and Jacob, D.: The European climate under a 2 °C global warming, Environ. Res. Lett., 9, 034006, https://doi.org/10.1088/1748-9326/9/3/034006, 2014. a, b
Vautard, R., Kadygrov, N., Iles, C., Boberg, F., Buonomo, E., Bülow, K., Coppola, E., Corre, L., Meijgaard, E. v., Nogherotto, R., Sandstad, M., Schwingshackl, C., Somot, S., Aalbers, E., Christensen, O. B., Ciarlo, J. M., Demory, M.-E., Giorgi, F., Jacob, D., Jones, R. G., Keuler, K., Kjellström, E., Lenderink, G., Levavasseur, G., Nikulin, G., Sillmann, J., Solidoro, C., Sørland, S. L., Steger, C., Teichmann, C., Warrach-Sagi, K., and Wulfmeyer, V.: Evaluation of the Large EURO-CORDEX Regional Climate Model Ensemble, J.Geophys. Res.-Atmos., 126, e2019JD032344, https://doi.org/10.1029/2019JD032344, 2021. a, b
Viegas, D. X., Bovio, G., Ferreira, A., Nosenzo, A., and Sol, B.: Comparative study of various methods of fire danger evaluation in southern Europe, Int. J. Wildl. Fire, 9, 235–246, https://doi.org/10.1071/wf00015, 1999. a
Voldoire, A., Sanchez-Gomez, E., Salas y Mélia, D., Decharme, B., Cassou, C., Sénési, S., Valcke, S., Beau, I., Alias, A., Chevallier, M., Déqué, M., Deshayes, J., Douville, H., Fernandez, E., Madec, G., Maisonnave, E., Moine, M.-P., Planton, S., Saint-Martin, D., Szopa, S., Tyteca, S., Alkama, R., Belamari, S., Braun, A., Coquart, L., and Chauvin, F.: The CNRM-CM5.1 global climate model: description and basic evaluation, Clim. Dynam. 40, 2091–2121, https://doi.org/10.1007/s00382-011-1259-y, 2013. a
Wehrli, K., Guillod, B. P., Hauser, M., Leclair, M., and Seneviratne, S. I.: Assessing the Dynamic Versus Thermodynamic Origin of Climate Model Biases, Geophys. Res. Lett., 45, 8471–8479, https://doi.org/10.1029/2018GL079220, 2018. a
Williams, A. P., Abatzoglou, J. T., Gershunov, A., Guzman-Morales, J., Bishop, D. A., Balch, J. K., and Lettenmaier, D. P.: Observed Impacts of Anthropogenic Climate Change on Wildfire in California, Earth's Future, 7, 892–910, https://doi.org/10.1029/2019EF001210, 2019. a, b
Wotton, B. M.: Interpreting and using outputs from the Canadian Forest Fire Danger Rating System in research applications, Environ. Ecol. Stat., 16, 107–131, https://doi.org/10.1007/s10651-007-0084-2, 2009. a, b
Wotton, B. M. and Flannigan, M. D.: Length of the fire season in a changing climate, The Forestry Chronicle, 69, 187–192, https://doi.org/10.5558/tfc69187-2, 1993. a, b, c, d
Zheng, B., Ciais, P., Chevallier, F., Chuvieco, E., Chen, Y., and Yang, H.: Increasing forest fire emissions despite the decline in global burned area, Sci. Adv., 7, https://doi.org/10.1126/sciadv.abh2646, 2021. a, b
Zscheischler, J., Fischer, E. M., and Lange, S.: The effect of univariate bias adjustment on multivariate hazard estimates, Earth Syst. Dynam., 10, 31–43, https://doi.org/10.5194/esd-10-31-2019, 2019. a
Europe is warming faster than the global average, raising concerns about future wildfire risks. Using regional climate models, we find that extreme fire weather is projected to become more severe, more frequent, and more widespread across the continent, especially if global warming reaches 3 °C. The projected increase is mainly linked to a drier atmosphere. Our findings highlight the need to limit warming and strengthen adaptation practices to protect vulnerable ecosystems and communities.
Europe is warming faster than the global average, raising concerns about future wildfire risks....