the Creative Commons Attribution 4.0 License.
the Creative Commons Attribution 4.0 License.
 | 30 Jun 2026
Northern high latitudes could become a net carbon source below 2 °C global warming
Rebecca M. Varney
Daniel Hooke
Norman J. Steinert
T. Luke Smallman
Camilla Mathison
Eleanor J. Burke
Under historical warming, terrestrial ecosystems within the northern high latitudes have been a net carbon sink, providing vital mitigation against anthropogenic emissions of CO2. However, the long-term stability of this net sink is uncertain due to complex carbon cycle feedbacks in response to future climate change. Here, the PRIME framework is used to probabilistically quantify if and when this region will transition from a net carbon sink to a carbon source in a range of plausible future climate scenarios (SSP1-2.6, SSP2-4.5, SSP5-8.5), including overshoot (SSP5-3.4-OS). JULES – the land surface model component of PRIME, has the capability to explicitly simulate permafrost physics, dynamic vegetation and fire; key processes within northern high-latitude terrestrial ecosystems that are yet to be coupled together in Earth system models. In a low emission scenario, permafrost carbon emissions increase the risk of northern high latitudes becoming a net carbon source by more than 50 % at 2 °C of warming, and at greater levels of warming in high emission scenarios. Conversely, in all emission scenarios dynamic vegetation is found to limit the sink-to-source transition at all warming levels by enhancing the carbon sink. Fire emissions can further weaken the sink by reducing its resilience to warming. A high temperature overshoot further limits the resilience of the carbon sink due to a reduction in temperatures after the peak, providing less optimal conditions for vegetation growth. These results highlight the importance of vegetation on the strength of the Arctic terrestrial carbon sink under warming and emphasise the need for representing comprehensive terrestrial climate feedbacks in Earth system models to improve projections of the land carbon response in future climate change trajectories.
- Article
(5446 KB) - Full-text XML
-
Supplement
(1049 KB) - BibTeX
- EndNote


Terrestrial ecosystems within the northern high latitudes contain at least twice as much carbon as the atmosphere. Carbon is stored in boreal forests, tundra, and include both permafrost and non-permafrost soils; ecosystems that are known to be particularly sensitive to climate change (Schuur et al., 2022; Maes et al., 2024; Muccio et al., 2025). Currently, the land surface globally absorbs approximately one third of anthropogenic emissions, limiting the increase in atmospheric CO2 concentrations and providing vital climate change mitigation (Friedlingstein et al., 2026). Understanding the fate of carbon within the northern high latitudes will help determine whether the Earth's land surface will remain a carbon sink in the future, continuing to support mitigation against elevated atmospheric CO2 concentrations and the resultant climate change. The stability of the carbon sink within the northern high-latitude region however, is associated with large uncertainty, both in terms of magnitude and sign (Hugelius et al., 2024; Virkkala et al., 2025). Recent research suggests some regions may have already transitioned to a net carbon source due to climate change (Natali et al., 2024; Zhu et al., 2024). Quantifying the resilience of the current net carbon sink, and the likelihood of its transition to a net carbon source, is therefore essential to calculate rigorous carbon budgets required for policy-relevant future emissions and climate mitigation scenarios (Cox et al., 2024).
The uncertainty in the net carbon balance is due to complex and interacting biological and physical processes that determine the uptake and release of carbon between land ecosystems and the atmosphere. Under climate change, increases in atmospheric CO2 and global mean temperatures impact the net balance of carbon, and Arctic amplification means that northern high latitudes have already and will continue to experience increases in global temperatures greater than in the rest of the world (Rantanen et al., 2023; Previdi et al., 2021; England et al., 2021).
Carbon uptake by the land is predominantly due to the absorption of carbon by plants and the rate of vegetation productivity. Elevated atmospheric CO2 concentrations can increase land carbon uptake by enabling higher rates of photosynthesis (Schimel et al., 2015), and in addition, increasing temperatures in the high latitudes creates more favourable conditions for photosynthesis and vegetation growth (Dial et al., 2022). Model results suggest this will cause a northward expansion of boreal forests and an increased growth of shrubs, which in turn would result in greater carbon uptake compared to typical tundra (Pugh et al., 2018), though the extent of this change in observations is debated (Rotbarth et al., 2023).
Carbon losses by the land are predominantly due to heterotrophic respiration from soil organic matter, which is projected to increase with warming temperatures as a result of both direct accelerated microbial decomposition and indirect permafrost thaw, which exposes additional currently inert carbon to decomposition (Varney et al., 2020; Hugelius et al., 2020). Climate change also impacts fire regimes, increasing the fire risk across the world both in terms of the magnitude and geographical expansion (Gallo et al., 2025). Future projections suggest an increase in carbon emissions from burning vegetation, and fire is likely to increase both abrupt and gradual permafrost thaw rates, which could result in a rapid release of CO2 (McCarty et al., 2021; Miner et al., 2022). If the magnitude of carbon loss becomes greater than the carbon uptake, the northern high latitudes will become a source of carbon.
Earth system models (ESMs) are routinely used to produce large-scale climate projections under a range of emissions scenarios representing different potential future climate policy pathways. The most recent Coupled Model Intercomparison Project phase 6 (CMIP6) provides an ensemble of ESMs representing the most up-to-date coupled model simulations (Eyring et al., 2016). Within CMIP6, the northern high latitudes are projected to remain a carbon sink by 2100, regardless of climate scenario (Qiu et al., 2023). However, the potential for a temporary source transition during the 22nd century is possible with a high overshoot scenario (Melnikova et al., 2021; Koven et al., 2022). Although used to evaluate net land carbon fluxes (Canadell et al., 2021), even the most recent ensemble of CMIP6 ESMs often omit key processes involved in ecosystem carbon cycling (Gier et al., 2024; Varney et al., 2022; Burke et al., 2020). For example, despite some models explicitly simulating permafrost physics or including dynamic vegetation, no models include both processes coupled together in CMIP6 simulations (Arora et al., 2020; Varney et al., 2024). An important challenge yet to be overcome is the delay between the most recent developments in land surface models and their coupling into ESMs. For example, the most developed features of the UK land surface model (Joint UK Environment Simulator; JULES) are yet to be coupled within an ESM. In addition there are many years between each CMIP phase, which means there is a multi-year gap between the use of new model generations in a model intercomparison context (Bock et al., 2020).
Projections of the net ecosystem carbon balance are subject to uncertainties caused by modelling limitations, uncertainty in Earth's climate sensitivity, and sensitivity to future climate scenarios. In this study, we address these limitations using the PRIME framework (Probabilistic Regional Impacts from Model patterns and Emissions; Mathison et al., 2025) with the state-of-the-art JULES land surface model. PRIME is an emissions-to-impacts Earth system model emulator and is used here to project the northern high-latitude sink-to-source carbon transition in the context of a wide range of plausible uncertainties. One advantage of PRIME is the possibility to use JULES configurations which include the most recent model developments, yet to be coupled into an ESM. This is the first time JULES has been used to evaluate the future carbon budgets in the northern high latitudes with the explicit representation of permafrost physics and dynamic vegetation - processes which are key in understanding the net carbon balance in this region. Additional simulations including explicit fire emissions are also included. PRIME allows for various sources of uncertainty to be addressed and quantified. PRIME is used to produce a large ensemble of projections, where for each climate scenario, the ensemble covers the spread in global temperature response to emissions uncertainties, and uncertainties due to variation in the spatial climate response to the global temperature change (Munday et al., 2025).
Here, the probabilistic PRIME framework is used to investigate the northern high-latitude ecosystem carbon balance in a variety of future policy-relevant SSP scenarios, with and without overshoot (O'Neill et al., 2016). We quantify the range and likelihood of the timing of the sink-to-source transition using an ensemble covering a range of future climate sensitivities. Further, multiple JULES configurations are used with PRIME to address potential underestimations in carbon source projections due to models without permafrost, and underestimations in carbon sink projections due to models without vegetation competition.
2.1 PRIME framework
The PRIME framework is an ESM emulator designed to rapidly explore spatially resolved climate impacts for any emissions scenario (Mathison et al., 2025). It draws on available CMIP6 multi-model ensemble results, but extends these to fill gaps not yet populated by ESMs or impact models, and can be used to simulate multi-century responses.
The main input to PRIME are scenarios of emissions which are required by FaIR (Smith et al., 2018), a reduced complexity climate model. FaIR uses these emission scenarios and generates a probabilistic distribution of projections of global mean temperature and CO2 concentrations. This distribution was sub-sampled by selecting the following percentiles of the global mean temperature in 2100 from SSP1-2.6: 0th, 1st, 5th, 25th, 50th, 75th, 95th, 99th, 100th (representing low to high climate sensitivities). These samples were then used to reconstruct regional changes using pattern scaling for all of the climate forcing variables required to drive the JULES land surface model (see Sect. 2.2). The changes in forcing data were derived by combining spatial patterns of sensitivity to global mean temperature change with the FaIR global mean temperature projections. Here, time series of changes were created for 8 forcing variables required for JULES: near-surface air temperature, diurnal temperature range, precipitation, short-wave radiation, long-wave radiation, near-surface specific humidity, 10 m wind speed, and surface pressure. The spatial patterns of change were calculated on a monthly basis using the SSP5-8.5 scenario with 18 CMIP6 ESMs, which were selected from the full CMIP6 ensemble and span the available range of uncertainty (Table S1). The spatial patterns represent the different patterns of change in the climate variables used to drive JULES seen in each CMIP6 ESM at the same global mean temperature change (i.e. different magnitudes of Arctic amplification). These changes in forcing were superimposed on a spatially distributed monthly climatology to emulate internal climate variability (see Mathison et al., 2025 for more details).
JULES was run for each ESM pattern individually with the global mean temperature change and CO2 concentrations sampled from the FaIR distribution. This study used the PRIME framework to run a range of future climate scenarios: SSP1-2.6, SSP5-3.4-OS (overshoot), SSP2-4.5 and SSP5-8.5, with the CO2 emissions shown in Fig. S2. These were extended to 2300, following the methods in Meinshausen et al. (2020).
2.2 JULES land surface model
JULES is a process-based land surface model which can be used to investigate land surface climate change impacts (Best et al., 2011; Clark et al., 2011), and is also the land surface component of the UK Earth system model (UKESM; Sellar et al., 2019). It simulates fluxes of energy, water, and carbon and their exchange with the atmosphere. This enables, for example, the carbon stocks and the hydrological state to be simulated. JULES also includes an interactive nitrogen cycle, which can simulate the impact of nitrogen limitations on vegetation productivity (Wiltshire et al., 2021).
JULES includes the simulation of dynamic vegetation. This allows for competition between plant functional types (PFTs) by updating the plant and soil carbon distribution based on the land-atmosphere CO2 fluxes (e.g. grassland transition to forest). Recent developments of JULES include the explicit representation of processes that were not implemented within UKESM1. These include an explicit representation of permafrost physics with vertically resolved soil carbon (Burke et al., 2017), and the combustion and loss to the atmosphere of soil litter and vegetation carbon during fire (Burton et al., 2019).
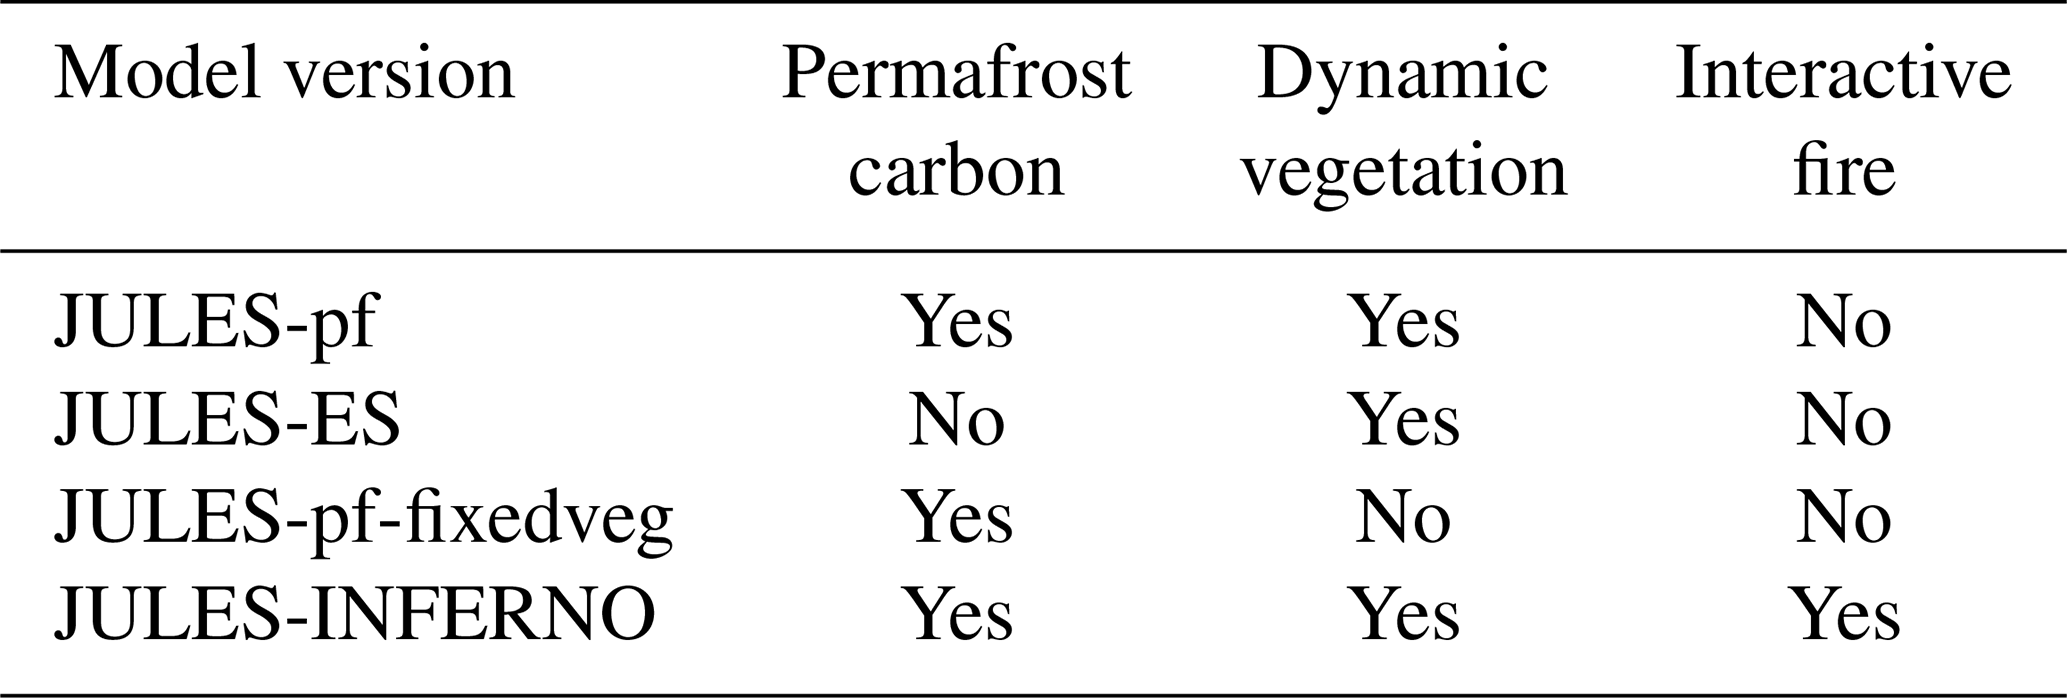
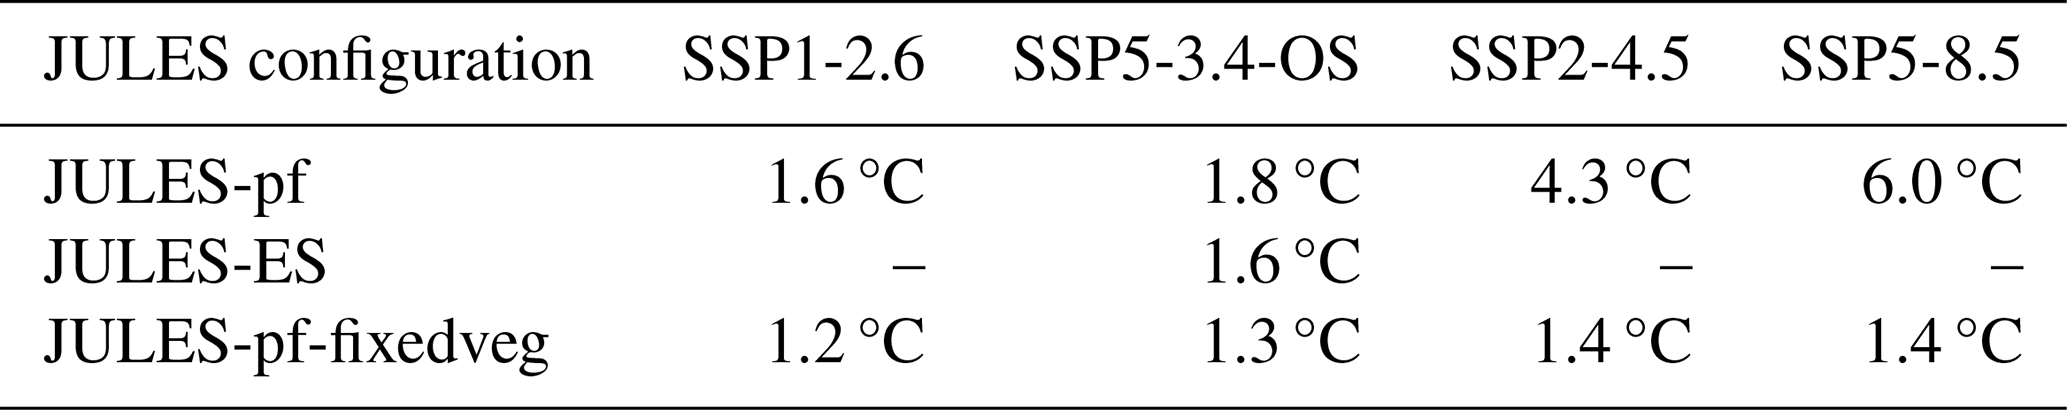
To isolate the role of the above components, several configurations of JULES are used in this study (Table 1). This study primarily focuses on the “JULES-pf” configuration, which explicitly represents permafrost carbon and competition between different PFTs, i.e. dynamic vegetation. Processes that are yet to be coupled together in an ESM and are important for the northern high-latitude carbon budget. To isolate the impacts of both permafrost and dynamic vegetation, the configurations “JULES-ES” and “JULES-pf-fixedveg” were used. JULES-ES includes dynamic vegetation but does not include explicit permafrost carbon (UKESM1 configuration used in CMIP6; Mathison et al., 2023), and JULES-pf-fixedveg includes vertically resolved permafrost carbon but has no dynamic vegetation (i.e. has fixed vegetation fractions rather than PFT competition).
One further configuration, “JULES-INFERNO”, is used to investigate the role of fire on the net carbon fluxes. Feedbacks between fire and dynamic vegetation in JULES-INFERNO which are not present in JULES-pf mean that a comparison between JULES-pf and JULES-INFERNO is not only a direct result of fire emissions, meaning the configurations are not directly comparable (Table 1). Therefore, the contribution and role of fire in the northern high latitude carbon budgets was evaluated independently.
Net Ecosystem Productivity (NEP) is defined as the difference between Net Primary Productivity (NPP; the net carbon assimilated by plants through photosynthesis minus loss due to plant respiration) and heterotrophic respiration (Rh; microbial respiration within the soil): NEP = NPP − Rh. For the net carbon balance, a carbon sink is then defined as positive NEP (NPP is greater than Rh) and a carbon source as negative NEP (NPP is less than Rh). In JULES-INFERNO simulations, an additional fire emissions variable (Efire) can be calculated. In this paper, projections of the future carbon budgets are considered over the REgional Carbon Cycle Assessment and Processes-2 (RECCAP2) northern high-latitude region used in Hugelius et al. (2024) (Fig. S1).
Table 1The different JULES configurations used within this study, showing which explicit processes were included or not included in each simulation.
2.3 Evaluation of JULES-pf configuration
The new JULES-pf configuration is assessed using an observationally-informed model-data fusion analysis (CARDAMOM V14; see Supplementary Material for more details on CARDAMOM). In brief, CARDAMOM has integrated time series Earth observation estimates (and their uncertainties) of leaf area, absorbed photosynthetically active radiation, woody biomass and geospatial estimates of soil carbon and several plant-traits into a systemic representation of the contemporary (2003–2024) carbon cycle including gridbox specific estimates of uncertainty.
We evaluate JULES-pf against CARDAMOM's observationally informed estimates of carbon fluxes (NEP, NPP, Rh), carbon stored in vegetation (Cv), soil (Cs) and key emergent ecosystem properties (CUE, τe, τs) which strongly influence sink-source dynamics across the RECCAP2 region (Table 2). CUE is the carbon use efficiency of vegetation (CUE = NPP GPP), and τe and τs are the mean carbon turnover times for the ecosystem (τe= (Cv+Cs) (Ra+Rh); Carvalhais et al., 2014) and the soil (; Varney et al., 2020). The CARDAMOM values given are averaged over the period 2003–2024, and JULES 2000–2020. The percentage of the region which falls within the CARDAMOM 95 % percentile range for each JULES-pf variable is also presented. For CUE, τs and NEP, maps indicate whether the JULES-pf estimate for each gridbox falls below, within or above CARDAMOM's 95 % uncertainty bound (Fig. 1). These variables are highlighted because they are useful indicators of an ecosystem's resilience to a changing climate.
JULES-pf is found to simulate the net carbon sink (NEP) consistently with CARDAMOM V14, with the mean value falling centrally within the 95 % percentile range (Table 2) and the majority of JULES-pf gridboxes falling within the range (99 %; Fig. 1). We also compared the NEP mean value with an ensemble of estimates for the contemporary period (2001–2019) derived using a combination of top-down and bottom-up approaches (Hugelius et al., 2024). Hugelius et al. (2024) used three broad methodological approaches to quantify the NEP: land surface models, atmospheric inversion and in-situ upscaling (including JULES-ES and CARDAMOM V13), each of which has a large uncertainty range. The total plausible range of NEP spans from a net source of −0.66 to a net sink of 1.37 Gt yr−1; the large range reflects data uncertainties, including whether fire is explicit or implicit, and methodological uncertainties.
For most domain-averaged evaluation variables, the values predicted by JULES-pf fall within the 95 % uncertainty intervals estimated by CARDAMOM (Table 2). Only mean soil carbon stocks differ significantly, which are much lower in CARDAMOM compared with JULES-pf. This is because CARDAMOM V14 simulates carbon to 1m depth while JULES-pf simulates to 3m depth. If JULES-pf is compared with observational values down to greater depths than the values are more consistent (see Table 3 in Varney et al., 2022). Lower percentage values are seen in the carbon fluxes and stores compared to the emergent properties when comparing JULES-pf patterns with the CARDAMOM's 95 % uncertainty range. Some differences with JULES-pf patterns are expected, where inconsistencies are commonly seen in land ecosystem variables amongst CMIP6 ESMs when compared to global observational datasets (Varney et al., 2022; Gier et al., 2024).
CUE is consistent between CARDAMOM and JULES-pf except on the east coast of Canada and Northern Europe (Fig. 1). These deviations are likely due to forests in these areas being intensively managed, deviating from the natural ecosystems implicitly simulated by JULES. This does not undermine JULES's ability to simulate the dominant natural ecosystem, the focus of this study, but does highlight a need in specific domains of intensive land management to use models which can explicitly simulate the impacts of management. JULES-pf estimate of τs also largely agrees with CARDAMOM's uncertainty bounds except in the far east of Russia which is likely due to a larger regional bias in soil carbon stocks in this region between CARDAMOM and JULES-pf, driven by the previously mentioned differences in soil depth being represented.
Table 2Evaluation of JULES-pf (2000–2020) configuration using CARDAMOM V14 (2003–2024). JULES-pf output variables are compared with the domain average values for CARDAMOM's observationally-informed estimates, where the 50th (2.5th/97.5th) percentiles are shown. For these JULES-pf variables, the % of grid-points that fall within the CARDAMOM 95 % percentile range is shown.
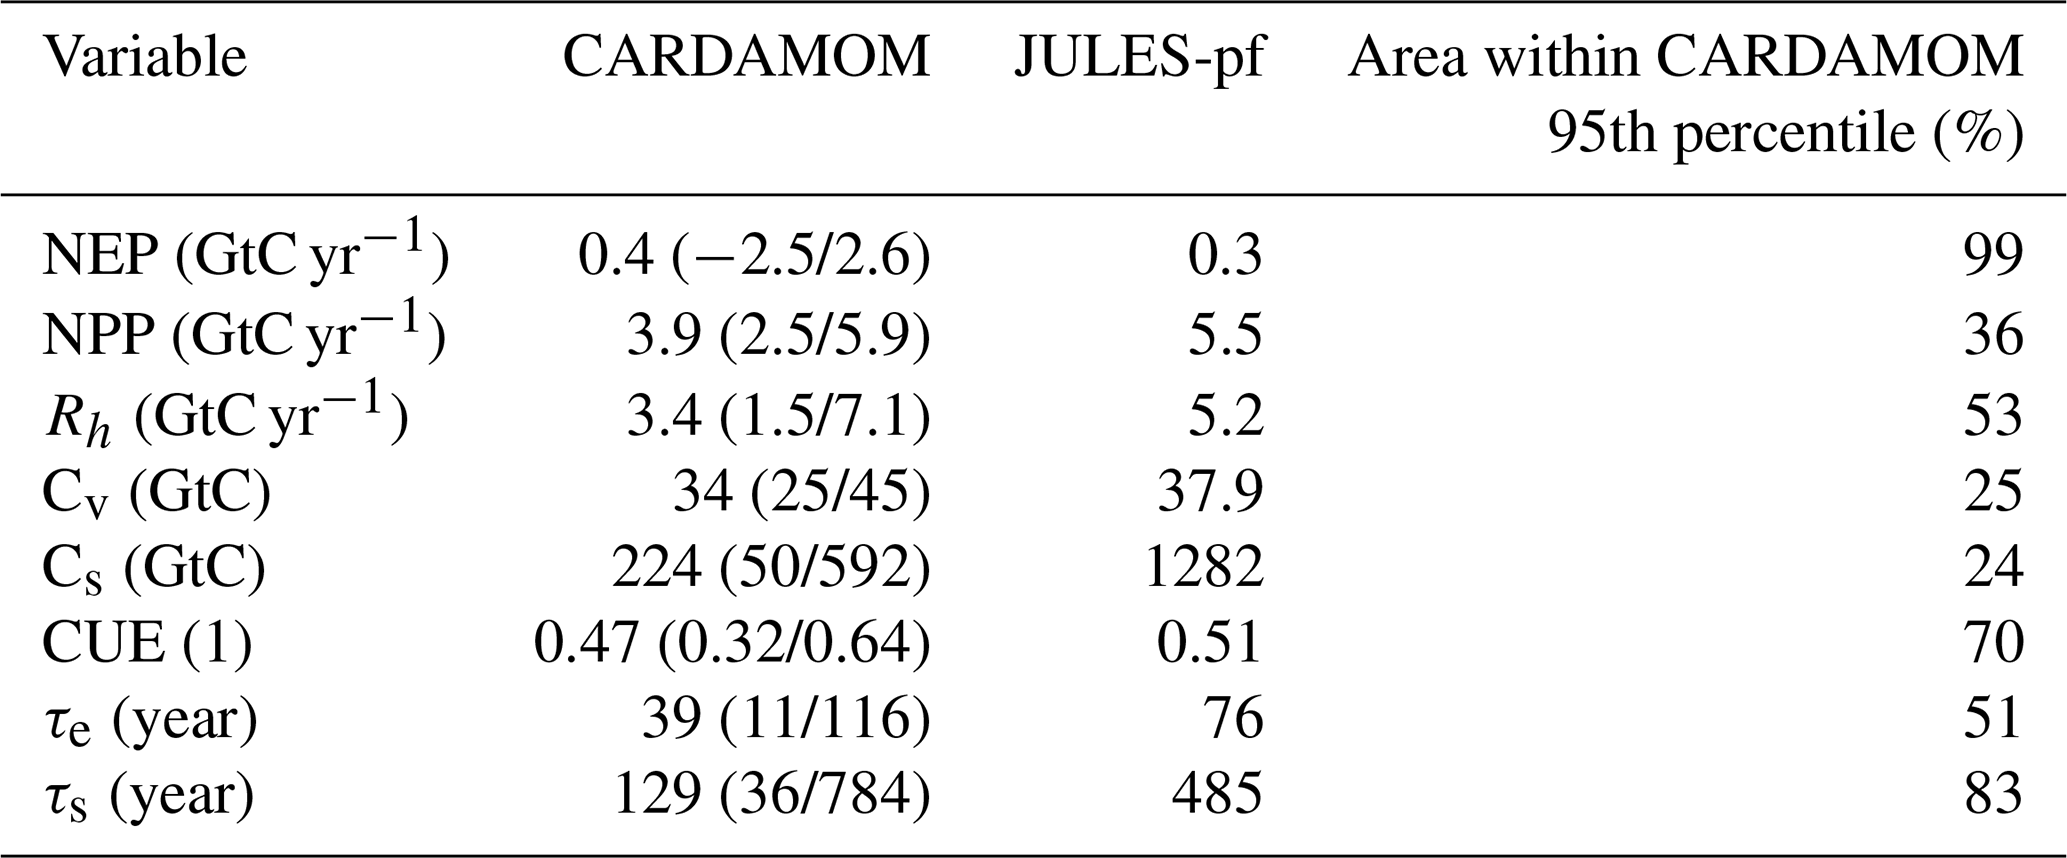
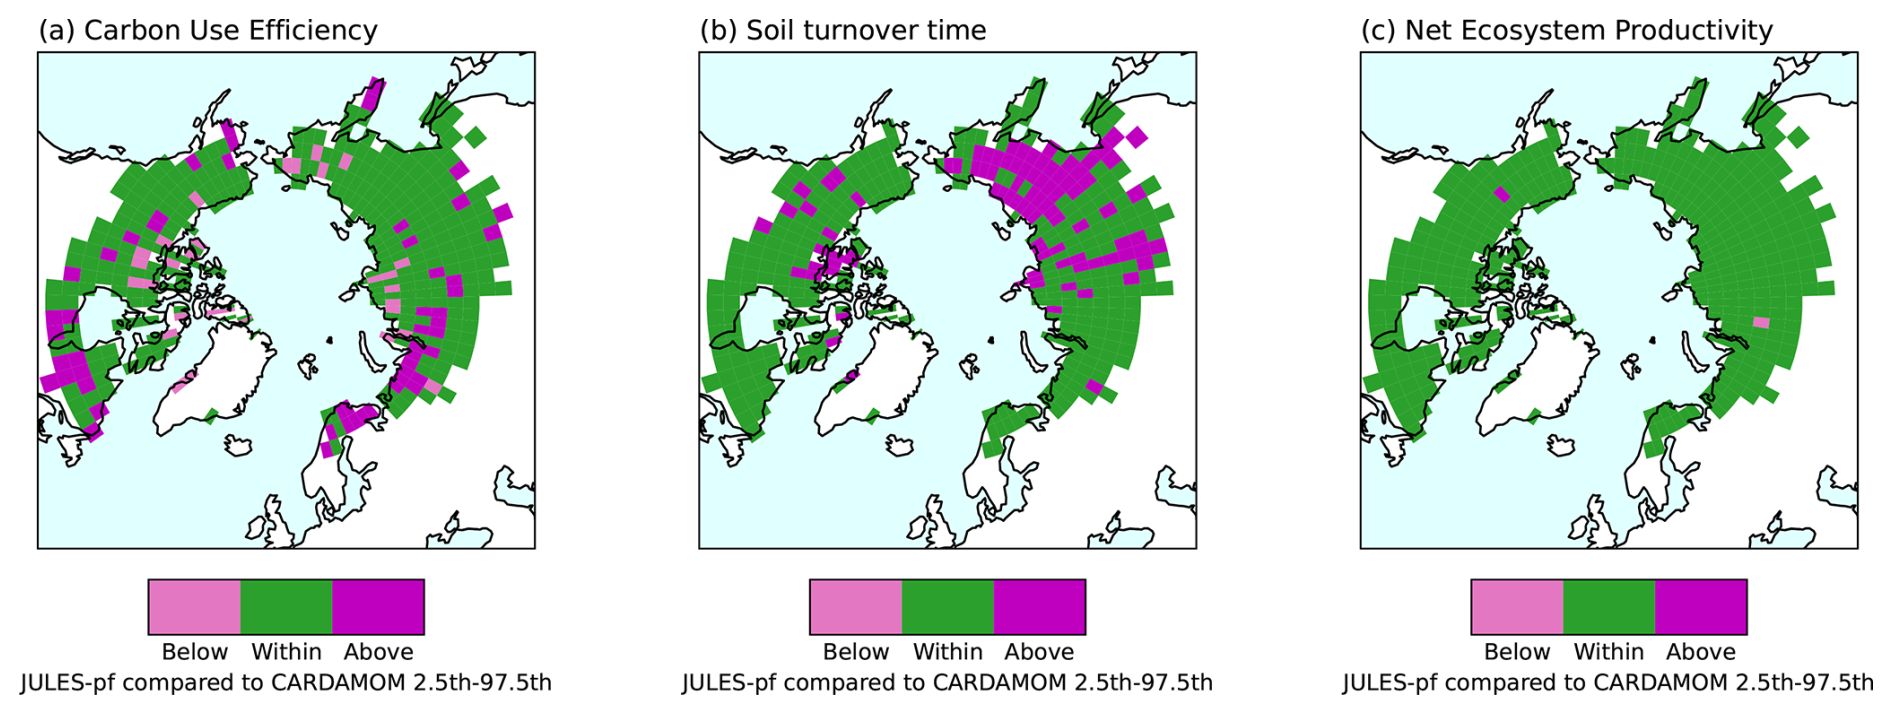
Figure 1Comparison of the JULES-pf configuration with the CARDAMOM 95 % percentile range, for variables: (a) Carbon use efficiency (NPP GPP), (b) soil carbon turnover time (τs), and (c) net ecosystem productivity (NEP).
3.1 Carbon sink-to-source transition
Figure 2 shows the net carbon balance (NEP, positive is a sink and negative is a source) for the RECCAP2 permafrost region (Fig. S1) using JULES-pf projections. The simulated NEP depends on the choice of climate scenario (panels a–d), spatial sensitivity of the climate patterns to climate change (lines of the same colour), and the sensitivity of the climate to emissions (different coloured lines). In all scenarios, the strength of the carbon sink initially increases with a warming climate. This is caused by a faster-acting CO2 fertilisation effect, compared to a slower respiration response (Fig. S4 and S5). The simulations show a projected maximum carbon uptake of between 0.32 and 0.47 GtC yr−1 for SSP2-4.5 occurring in 2054. Similar peak magnitudes are found across all climate scenarios, but occur in different years (0.37 for SSP1-2.6 in 2036, 0.47 for SSP5-2.4-OS in 2055, 0.56 for SSP5-8.5 in 2074). Beyond this NEP peak, the carbon sink (positive NEP) declines because CO2 fertilisation becomes less effective and carbon uptake is counterbalanced by increasing carbon loss from soil respiration. The majority of ensemble members, especially from higher climate sensitivity percentiles, transition to a carbon source (negative NEP) by 2300, despite all scenarios reducing CO2 emissions beyond 2100 (Fig. S2). The projected decline in the carbon sink is in line with the predicted saturation of CO2 fertilisation, primarily due to nutrient limitations (Wang et al., 2020), and a delay in increased respiration of the system (Turetsky et al., 2019). The SSP2-4.5 and SSP5-8.5 scenarios have a larger uncertainty range, with some simulations showing a large carbon source after 2100 and some remaining a sink. The SSP1-2.6 and SSP5-3.4-OS scenarios have a much smaller uncertainty range and a generally smaller projected carbon source. The larger spread in projected NEP is greater in the scenarios with higher climate signals and is consistent with the greater variability in the magnitude and pattern of future climate change amongst the Earth system models used.
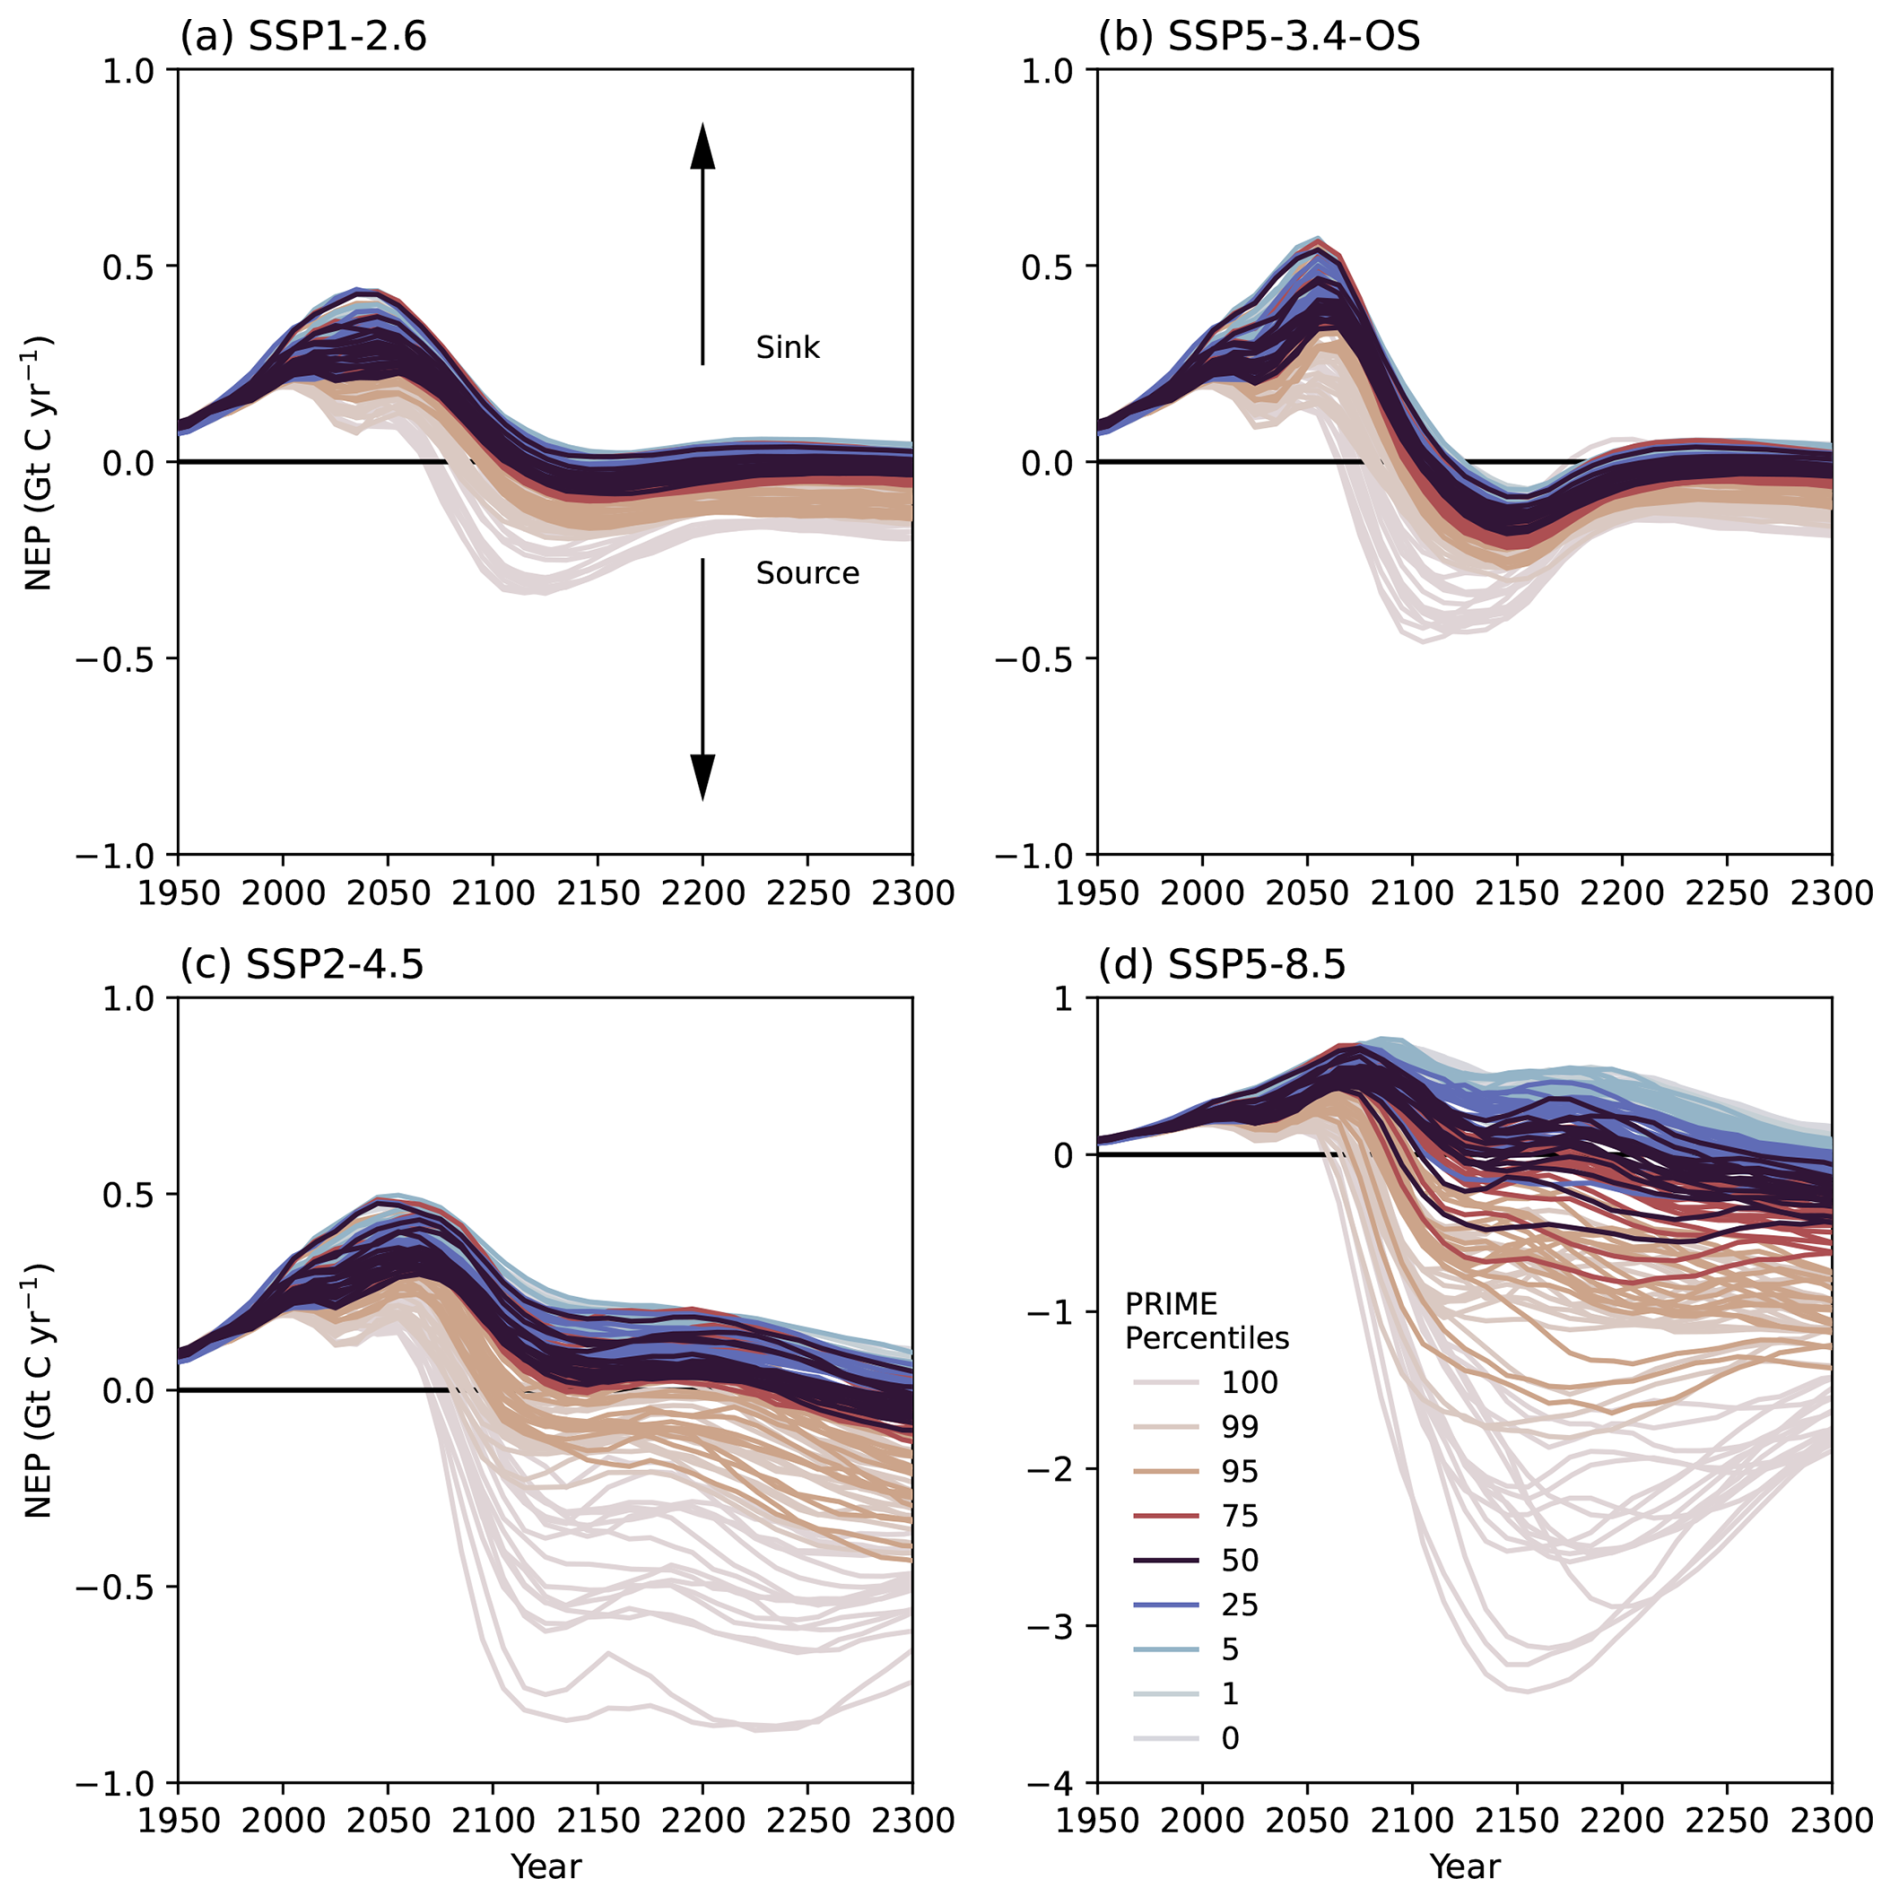
Figure 2Timeseries of total Net ecosystem productivity (NEP; Gt C yr−1) over the RECCAP2 permafrost region in the JULES-pf configuration, for: (a) SSP1-2.6, (b) SSP5-3.4-OS, (c) SSP2-4.5, and (d) SSP5-8.5. The different colours are for different PRIME percentiles representing a range of climate sensitivities and the individual lines within each colour are different spatial patterns of change across the selected CMIP6 ESMs. Note: the NEP y-axis range on (d) is different to that on (a)–(c).
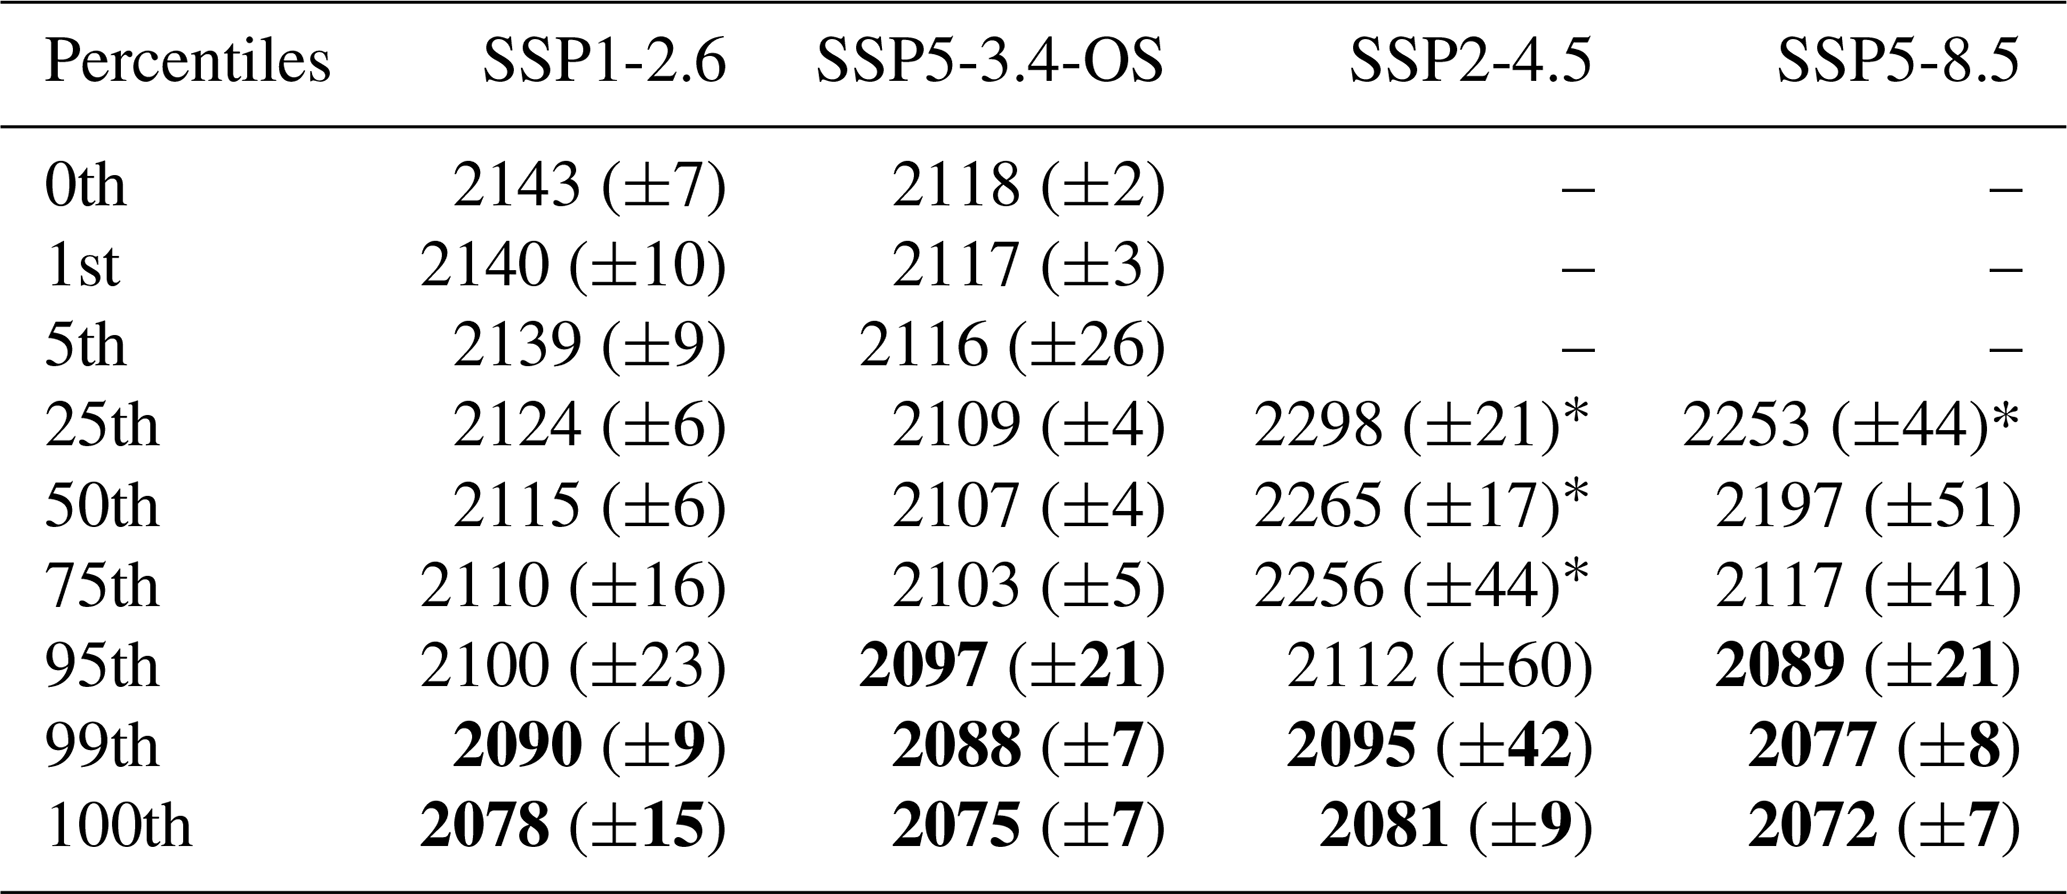
The year at which NEP becomes a carbon source (negative) is of particular interest because at this time the northern high latitudes will release more carbon than they take up and have a positive feedback on the atmosphere (Table 3). The central estimate (50th percentile) projects the transition to a source to occur at similar times for SSP1-2.6 (2115; with 75th–25th percentiles of 2110–2206) and SSP5-3.4-OS (2107; with 75th–25th percentiles of 2103–2280). However, in SSP2-4.5 and SSP5-8.5 the carbon source transition is projected to occur later with central estimates in 2265 (2256–2298; 75th–25th percentiles) and 2197 (2117–2253; 75th–25th percentiles), respectively. The higher emission scenarios have ensemble members which don't project a carbon source before 2300, but only from members with low climate sensitivities. Generally, the ensemble members suggest that the lower the climate sensitivity, the greater the resilience of the land carbon sink.
Ensemble members with a high climate sensitivity (95th to 100th percentiles) have sink-to-source transitions before 2100 (Table 3), and show potentially large source magnitudes in the medium and high warming scenarios (SSP2-4.5 and SSP5-8.5; Fig. 2). In this case, the initial carbon uptake limited by the CO2 fertilisation saturation is outpaced by strongly increased soil respiration which includes permafrost-thaw induced soil carbon loss. Despite a sink-to-source transition occurring in other scenarios and ensemble members, the carbon source is much stronger under higher warming due to the sustained warming exposure, leading to larger long-term cumulative emissions from the high latitudes (Fig. S6). This suggests that high warming (from high climate sensitivity) not only accelerates the timing of the sink-to-source transition but also amplifies the magnitude of carbon loss from northern high-latitude ecosystems, underscoring the critical role of climate-carbon feedbacks in shaping future carbon budgets.
The results here highlight how the timing of the sink-to-source transition depends individually on the climate sensitivity and climate scenario (Table 3). This means that the sensitivity of the carbon sink is a balance between changes in CO2 and temperature, and how they change with respect to one another. For example, in low climate sensitivity ensemble members (0th to 5th percentiles), the carbon sink is shown to be more resilient in high emission scenarios (SSP2-4.5, SSP5-8.5) compared to lower emission scenarios (SSP1-2.6, SSP5-3.4-OS). This is likely due to the higher CO2 and temperature levels providing more optimal conditions for vegetation growth and CO2 fertilisation. However, if we compare results from low climate sensitivity (0th to 5th percentiles) and high emission scenario (SSP2-4.5, SSP5-8.5) with medium climate sensitivity (25th to 75th percentiles) and lower emission scenario (SSP1-2.6, SSP5-3.4-OS), the timing of the sink-to-source transition is shown to vary by more than 200 years despite similar amounts of global warming seen (i.e. not transitioned by 2300 versus transitioning during 22nd century; Table 3). This implies that under the same global warming level, the CO2 fertilisation effect negates the carbon loss from the soil under higher emissions, but not in the lower emission scenarios.
Table 3The sink-to-source transition years for the JULES-pf configuration, presented for all PRIME percentiles and using the mean (and standard deviation) of the climate patterns. The values in bold show the combinations which have a projected sink-to-source transition before 2100, the * after 2200, and the dash (–) represents the scenario remaining a carbon sink beyond 2300.
3.2 Process contributions to net carbon balance
The PRIME framework was used to isolate the control of specific processes on the ecosystem carbon balance in the northern high latitudes by including simulations with additional JULES configurations (JULES-ES and JULES-pf-fixedveg; Table 1). Figure 3 presents the likelihood of a carbon source transition at different levels of global warming for the JULES-pf, JULES-ES and JULES-pf-fixedveg configurations, for a range of future climate scenarios. JULES-pf (orange line; Fig. 3) projects a typical sink-to-source transition between 2 and 6 °C depending on the scenario, with over 50 % of the ensembles transitioning by 6 °C in all scenarios (Table 4). Nearly all of the ensemble members in SSP1-2.6, a lower emission scenario, transition to a source by around 3.5 °C and more than 50 % of ensemble members by 2 °C. This is in contrast to the two higher emissions scenarios SSP2-4.5 and SSP5-8.5 where 30 %–40 % remain a sink even at the very high temperature changes.
The inclusion of permafrost carbon (the main difference between the JULES-pf and JULES-ES configurations) had a notable impact on net carbon balance. In contrast with JULES-pf, JULES-ES projects a very high likelihood (> 94 %) of a net carbon sink with future warming in SSP1-2.6, SSP2-4.5 and SSP5-8.5; even with the extreme levels of warming seen in SSP5-8.5 (blue line; Fig. 3). The comparison of these two sets of simulations shows that simulating permafrost carbon reduces the net carbon budget within this region, and highlights the importance of including permafrost carbon to accurately capture northern high-latitude carbon cycling (Schädel et al., 2024).
Figure 3 also shows the strength of the net carbon sink is strongly related to the response of vegetation dynamics. JULES-pf-fixedveg (green line) does not have competition between modelled PFTs, and hence cannot represent the geographic expansion of vegetation cover (e.g. northward shift of Boreal forests). In nearly all ensemble members, a sink-to-source transition is projected in JULES-pf-fixedveg earlier than the other configurations. It can be seen that ≈ 100 % of percentiles transition to a carbon source below 2.5 °C of global warming across all scenarios. This means that vegetation expansion (from competition between vegetation types) is a strong determinant for the strength of the northern high-latitude carbon sink in JULES-pf. This result highlights the reliance of the northern high-latitude ecosystem carbon sink on vegetation carbon cycling and suggests that without this additional carbon uptake, there would be a transition to a carbon source much sooner. If the vegetation expansion and related carbon uptake is overestimated, the projected net carbon sink will be overestimated which impacts global carbon budgets.
In SSP5-3.4-OS, which is a moderate overshoot scenario, there is a reduced likelihood of a net carbon sink compared with the other climate scenarios (Fig. 3; note SSP1-2.6 also has a small overshoot but much lower than in SSP5-3.4-OS). For example, in JULES-pf at 2 °C projections of a net carbon sink are 62 % more likely in SSP2-4.5 compared to SSP5-3.4-OS. Under falling atmospheric CO2 concentrations and temperature levels, plant productivity will respond relatively quickly whilst the thermal inertia of the soil means the rate of respiration does not respond fully before temperatures decrease again due to its lagged temperature response (Melnikova et al., 2021). In this overshoot scenario, the temperature increase is reversed by negative emissions (Figs. S2 and S3), so the maximum temperature increase is lower and the exposure time of such high temperatures is shorter than in, for example, SSP5-8.5 which initially follows the same pathway as SSP5-3.4-OS. Therefore, the temperature increase might not be sufficient or sustained enough to establish robust vegetation that is resilient against the subsequent cooling. Any reduction in leaf area reduces carbon uptake from vegetation expansion. In this case, the increased rate of respiration under smaller amounts of warming offsets carbon uptake from the vegetation faster than compared with a non-overshoot scenario. In summary, in JULES, negative emissions reduce the duration and magnitude of the natural carbon sink in the northern high latitudes, bringing the ecosystem sink-to-source transition earlier. These results highlight the increased uncertainty of carbon cycle responses under climate overshoot. It should be noted that the change in the vegetation distribution in response to climate change is dependent on the specific land model used. The overshoot can only be effective in reducing the likelihood of carbon sink-to-source transitions if the cumulative warming is minimal because higher peak warming or longer overshoot durations would likely lead to larger contributions of soil respiration to the carbon balance.
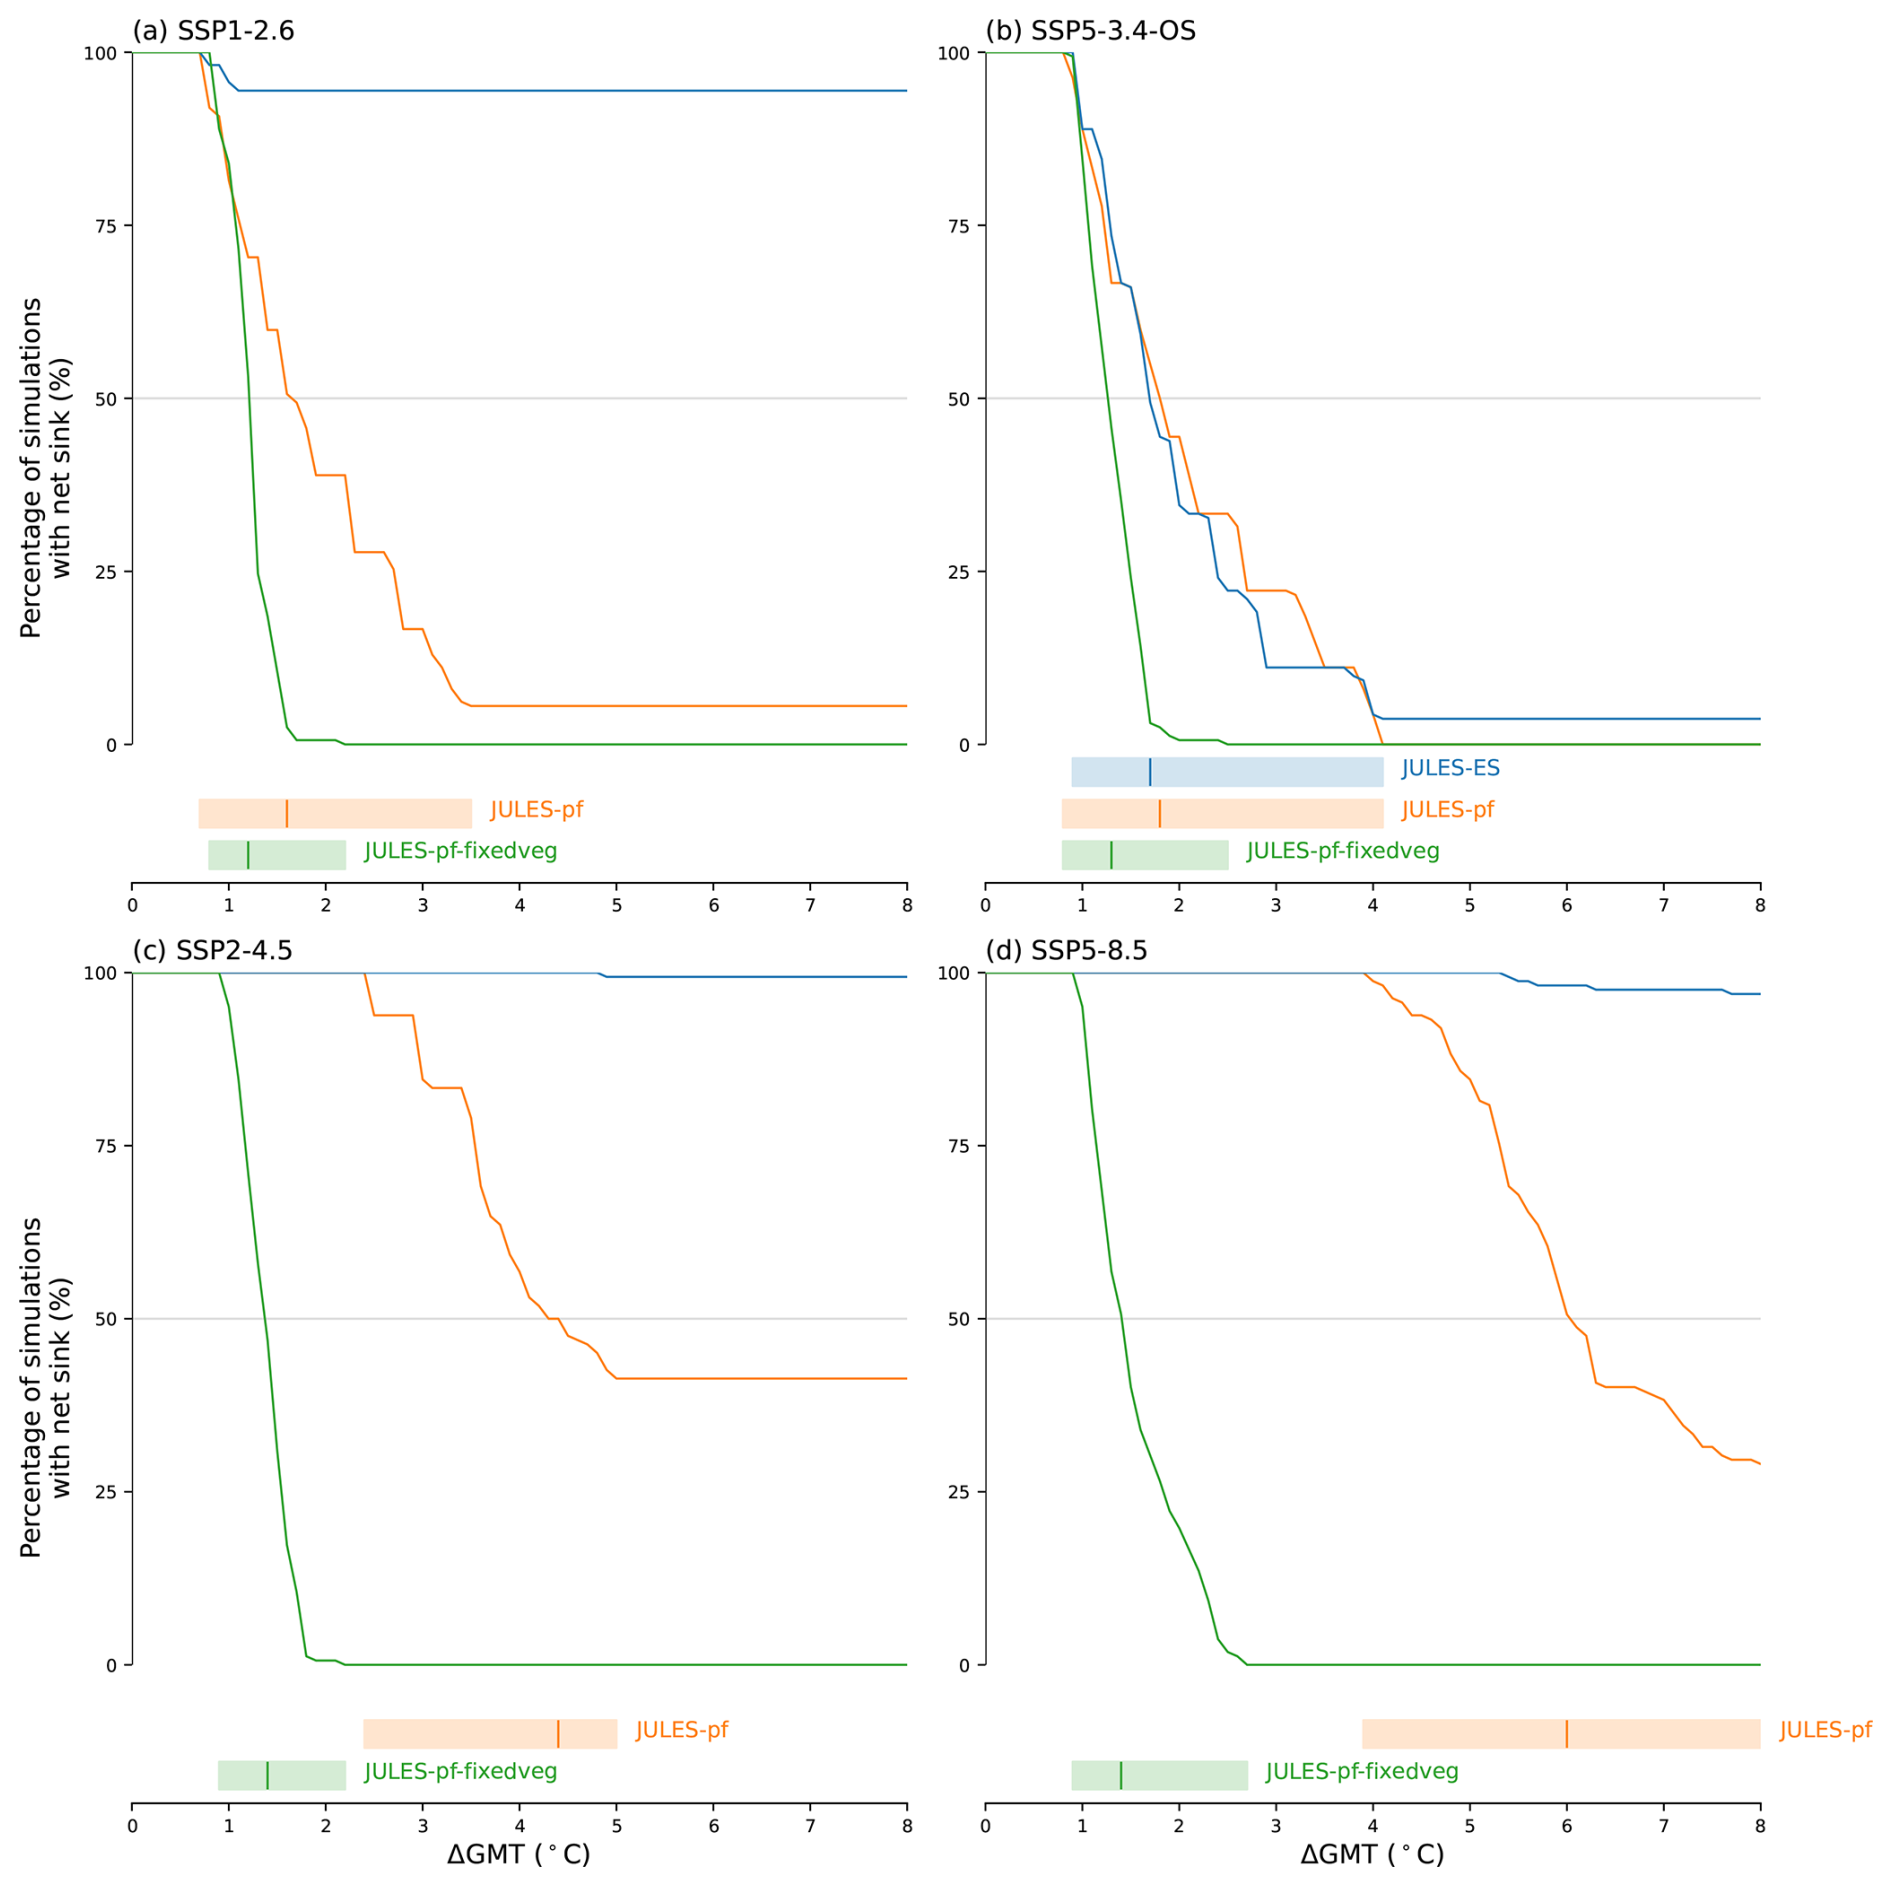
Figure 3The projected percentage of the simulation ensemble members which transition from a net carbon sink to a net carbon source for the model ensembles. This indicates the likelihood of a net carbon sink within the northern high latitudes at different levels of global warming (ΔGMT). This is shown for each SSP scenario: (a) SSP1-2.6, (b) SSP5-3.4-OS, (c) SSP2-4.5, and (d) SSP5-8.5. In addition to JULES-pf (orange), results for JULES-ES (blue) and JULES-pf-fixedveg (green) are included to explore the impact of different processes on the transition from sink to source. The shaded bars at the bottom of each panel indicate the temperature range at which ensemble members transition from a carbon sink to a carbon source, with the central estimate (i.e., 50 % transitioned; source more likely than sink), shown by the vertical line in the panels. The shaded bar is not included if the simulation does not see more than 50 % of ensemble members transitioning to a carbon source.
Table 4Warming levels (ΔGMT) of the sink-to-source transition for 50 % of ensemble members (transition more likely than not; see Fig. 3) in all climate scenarios and JULES configurations (except JULES-INFERNO). A dash (–) means that more than 50 % of ensemble members remain a carbon sink.
3.3 Spatial distribution of carbon sinks and sources
Figure 4 (top row) shows the spatial distribution of the carbon sinks and sources within the northern high-latitude region for JULES-pf. In 2005, the tundra region is relatively neutral and the boreal region is overall more of a sink as the amount of climate change is relatively small up to that time. In JULES-pf, the increased carbon sink is projected to dominate in the majority of areas within the region up until 2095. However by 2295, the projections are more spatially heterogenous and net sources are more widely distributed. The increased carbon sink has been suggested to only be dominant in non-permafrost ecosystems, as not negated by the carbon loss from permafrost (See et al., 2024). More specifically, Virkkala et al. (2025) states that tundra regions could have already transitioned to a carbon source at present. In JULES-pf simulations, regions of boreal forest become a net source, especially beyond 2100 within permafrost regions.
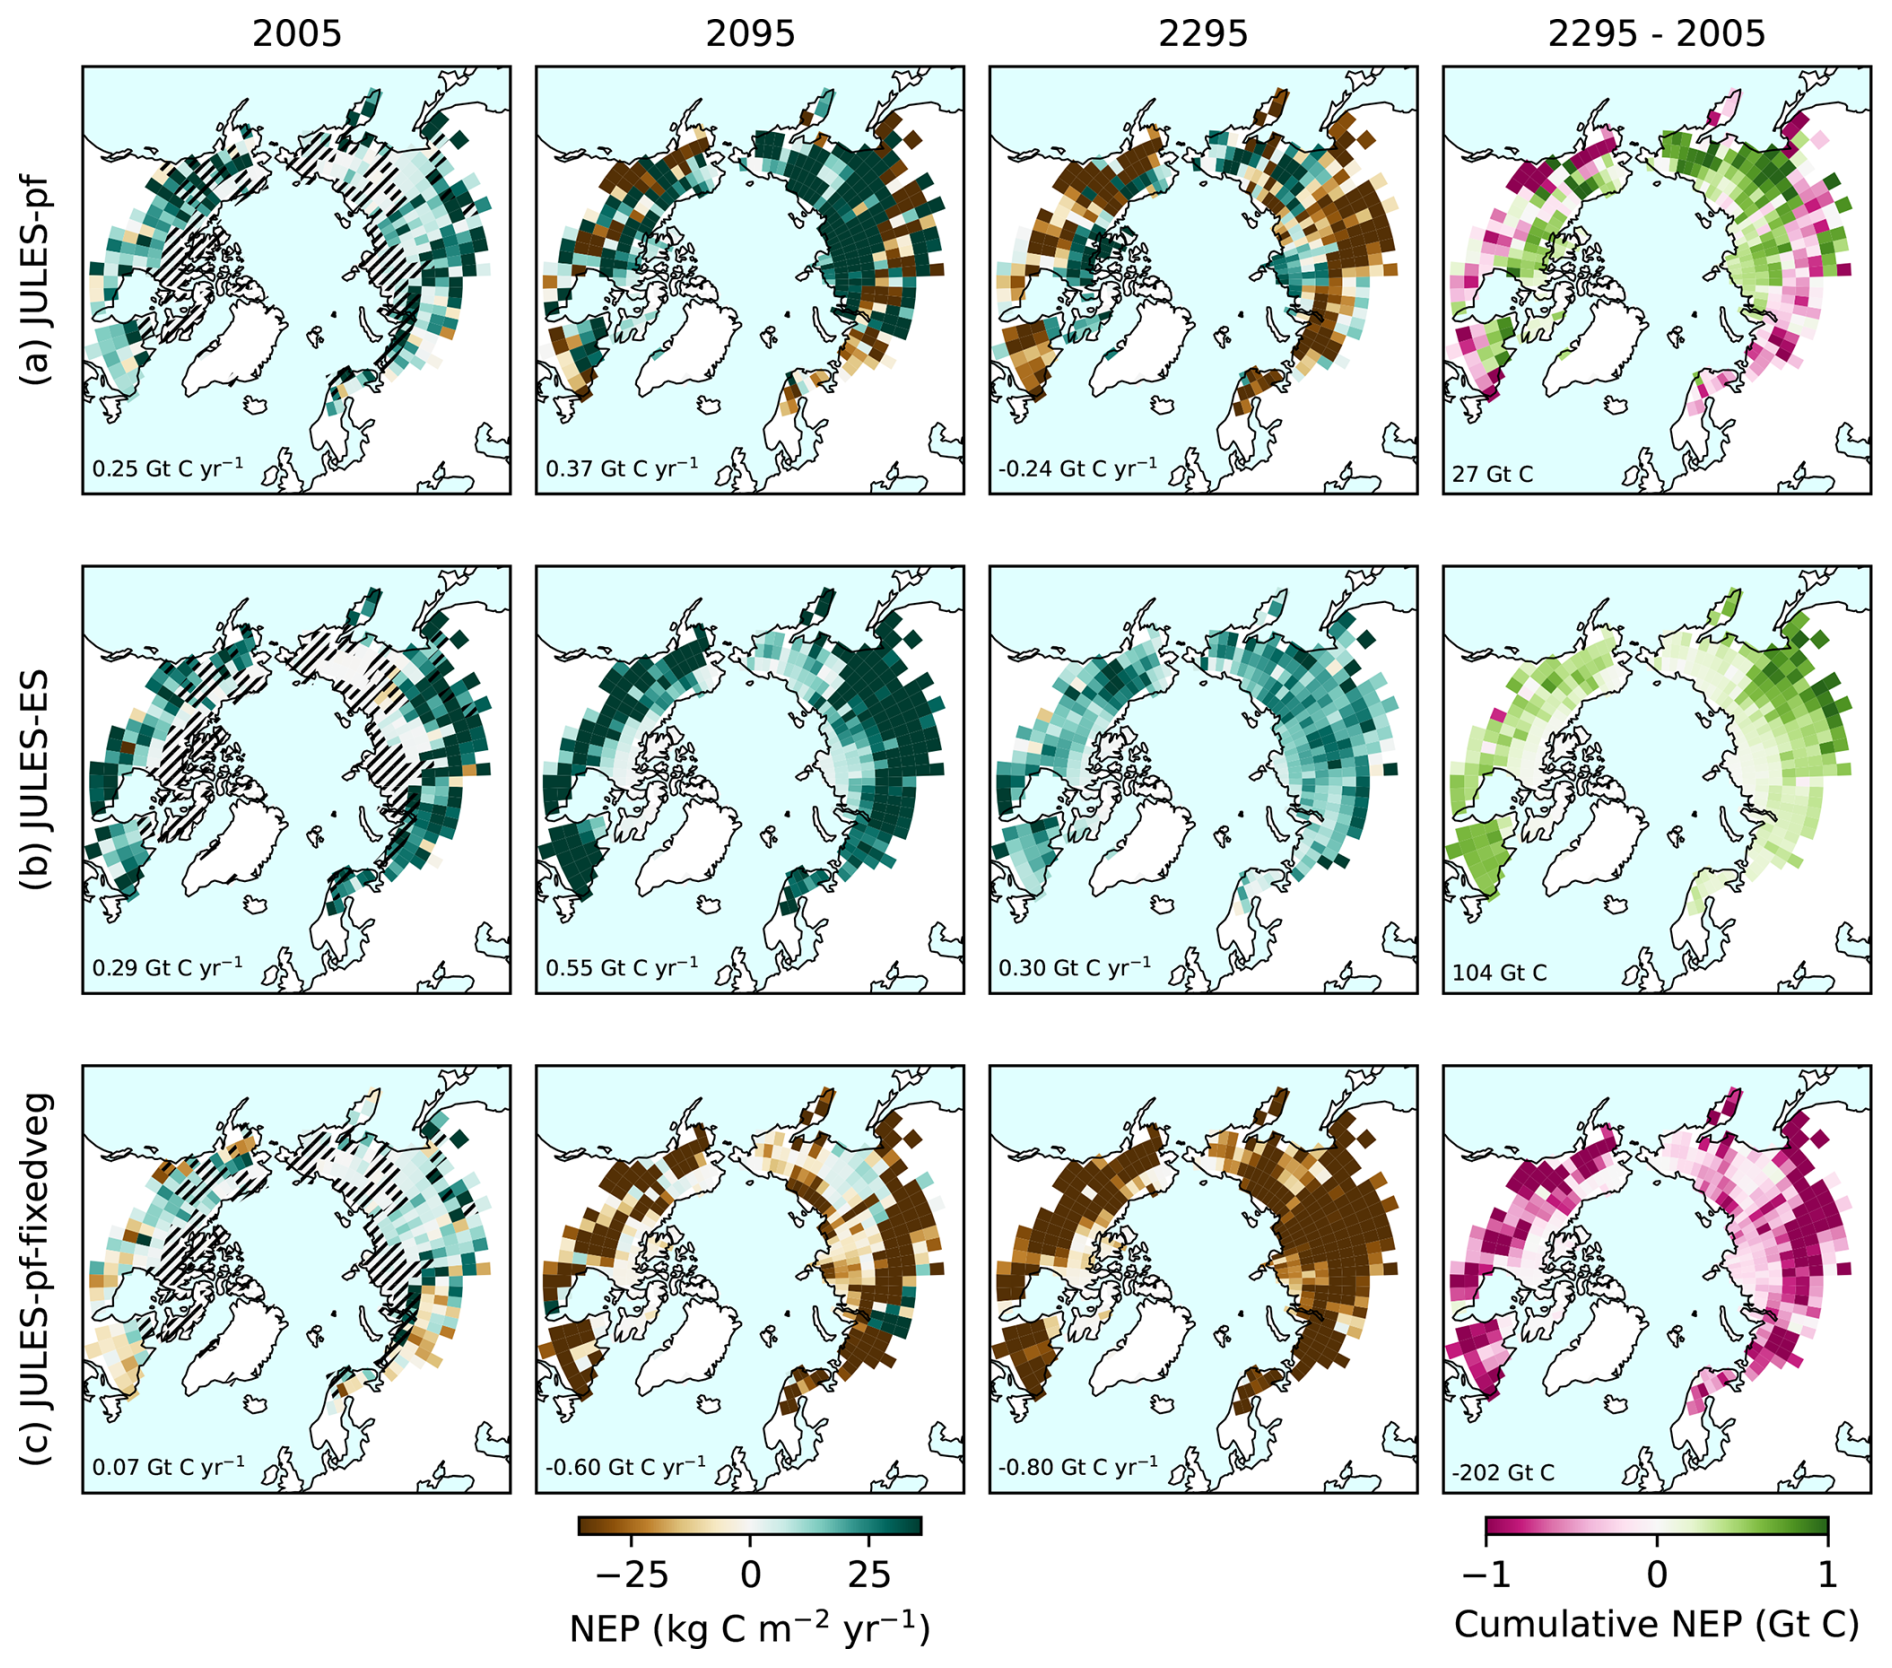
Figure 4Spatial patterns of Net ecosystem productivity (NEP) in the years 2005, 2095, 2295 and cumulative NEP for the period 2005–2295 (decadal means) for the northern high-latitude region using the JULES configurations: JULES-pf (top row), JULES-ES (middle row), and JULES-pf-fixedveg (bottom row). The figures show the central estimate (50th percentile) using the mean of the climate patterns from PRIME for the SSP5-8.5 climate scenario. The hatched area in 2005 represents the tundra regions in the pre-industrial climate, and the non-hatched area represents boreal forests within JULES. Note that this can change in the simulations other than JULES-pf-fixedveg.
Cumulative NEP shows a net carbon sink within the more northern regions, likely to be due to enhanced forest growth within the tundra. In this case, carbon loss from permafrost does not dominate the carbon balance, however it is shown to dominate in the other areas of the region considered (top row; Fig. 4). In reality there are additional sources of uncertainty which determine the net carbon balance, such as the amount of boreal forest expansion that will be seen (Rotbarth et al., 2023). For example, there are uncertainties in the amount of tree growth potential within permafrost ecosystems, where it is argued that the allocation of nutrients within a tree will prioritise remaining upright on unstable grounds rather than growth in these regions (Alfaro-Sánchez et al., 2024). The spatial patterns will also be influenced by complex interactions with water and nutrients which could limit growth potential (See et al., 2024; Zhao et al., 2022), and additionally, the impact of fire creates large amounts of uncertainty to the spatial carbon loss (Virkkala et al., 2025).
In JULES-ES, the only configuration without explicit permafrost, a net carbon sink is seen across the region by 2095 (middle row; Fig. 4). The cumulative gain in carbon shows the effect of poleward vegetation expansion, which in this configuration is not being negated by permafrost carbon loss. The greatest increase in carbon uptake occurs between 2005 and 2095, whereas by 2295 the carbon sink strength is shown to saturate. This is likely due to nitrogen limitations within JULES (Wiltshire et al., 2021). In contrast, the JULES-pf-fixedveg configuration, which includes explicit permafrost carbon but no dynamic vegetation, projects carbon loss from the majority of the region in 2095, and the entire region by 2295 (bottom row; Fig. 4). In this case, the strength of the carbon source only increases with time and NEP continues to increase beyond 2100. This further emphasises the delicate balance between increased input and output fluxes of carbon in the future.
3.4 Impact of fire emissions
Emissions from fire are expected to result in an additional carbon flux between the land and the atmosphere, further impacting the net carbon balance in the northern high latitude region (NEP = NEP − fire C flux; Li et al., 2014). Final simulations were run with the JULES-INFERNO configuration, which includes a coupling to an explicit fire model (see Table 1), to enable a investigation into the magnitude of this contribution. Fire modelling is known to present significant difficulties (Hantson et al., 2016), however these simulations provide an estimate of the order of magnitude of the carbon flux due to fire emissions and the contribution to the net ecosystem fluxes across a wide range of forcing conditions.
Even at present day there is uncertainty in the contribution of fire to the northern high latitude carbon budgets, shown in Hugelius et al. (2014) using calculations from atmospheric inversions, upscaling methods, as well as land surface models. However, it is predicted that fire activity in the northern high latitudes will increase under global warming, which is expected to offset the increased carbon sink in this region (Descals et al., 2022; Witze, 2020). JULES-INFERNO projections show an increase in carbon emissions due to fire across all future scenarios (Fig. 5; (a) SSP1-2.6, (b) SSP5-3.4-OS, (c) SSP2-4.5 and (d) SSP5-8.5), where negative is a net flux of CO2 into the atmosphere. The rates of increase are found to be related to the magnitude of global warming, with greater increases in fire fluxes seen in higher warming scenarios. In the 50th percentile simulations, SSP2-4.5 reaches a maximum rate of 0.16 Gt C yr−1 in 2300 (120 % increase compared to 2005) and in SSP5-8.5 0.42 Gt C yr−1 in 2244 (422 % increase). In the SSP1-2.6 and SSP5-3.4-OS scenarios, maximum rates of increase are seen much earlier in the years 2085 (42 % increase) and 2075 (60 % increase) respectively, and then decrease again with reduced global warming.
Uncertainty in the projected increase of fire emissions can be seen due to the climate scenario, climate sensitivity and spatial warming patterns (Fig. 5), agreeing with literature that changes in fire regimes will be both spatially and temporally varying (Young et al., 2017). In the 50th percentile SSP5-8.5 simulation, JULES-INFERNO projections fire emissions to increase in all areas of the northern high-latitude region (Fig. 5; (e) 2005, (f) 2095 and (g) 2295). The greatest rates of increase are seen in lower-latitude areas, where increases are seen between 2005 and 2095, and further between 2095 and 2295. By 2295, the increase in fire emissions is projected to increase more northward, and is shown to cover large areas of the northern high latitudes. This suggests an increase in fire emissions within the tundra region with greater levels of global warming; though it is noted this increase is likely enhanced due to the boreal forest expansion seen in these simulations (Young et al., 2017).
It has been suggested that within permafrost ecosystems alone, the offset due to fire emissions will be approximately 28 %–45 % by the year 2100, depending on the climate scenario (Zhu et al., 2024). For the 50 % percentile, the simulations here project an increase in fire carbon emissions of 41 %–181 % in the year 2100 within the RECCAP2 region, dependent on spatial warming patterns and climate scenario. It should be noted that the current JULES-INFERNO configuration does not burn soil within the model, or explicitly simulate peatland fires, which are key in carbon cycling within this region and would likely further decrease the probability of a net carbon sink under future climate changes.
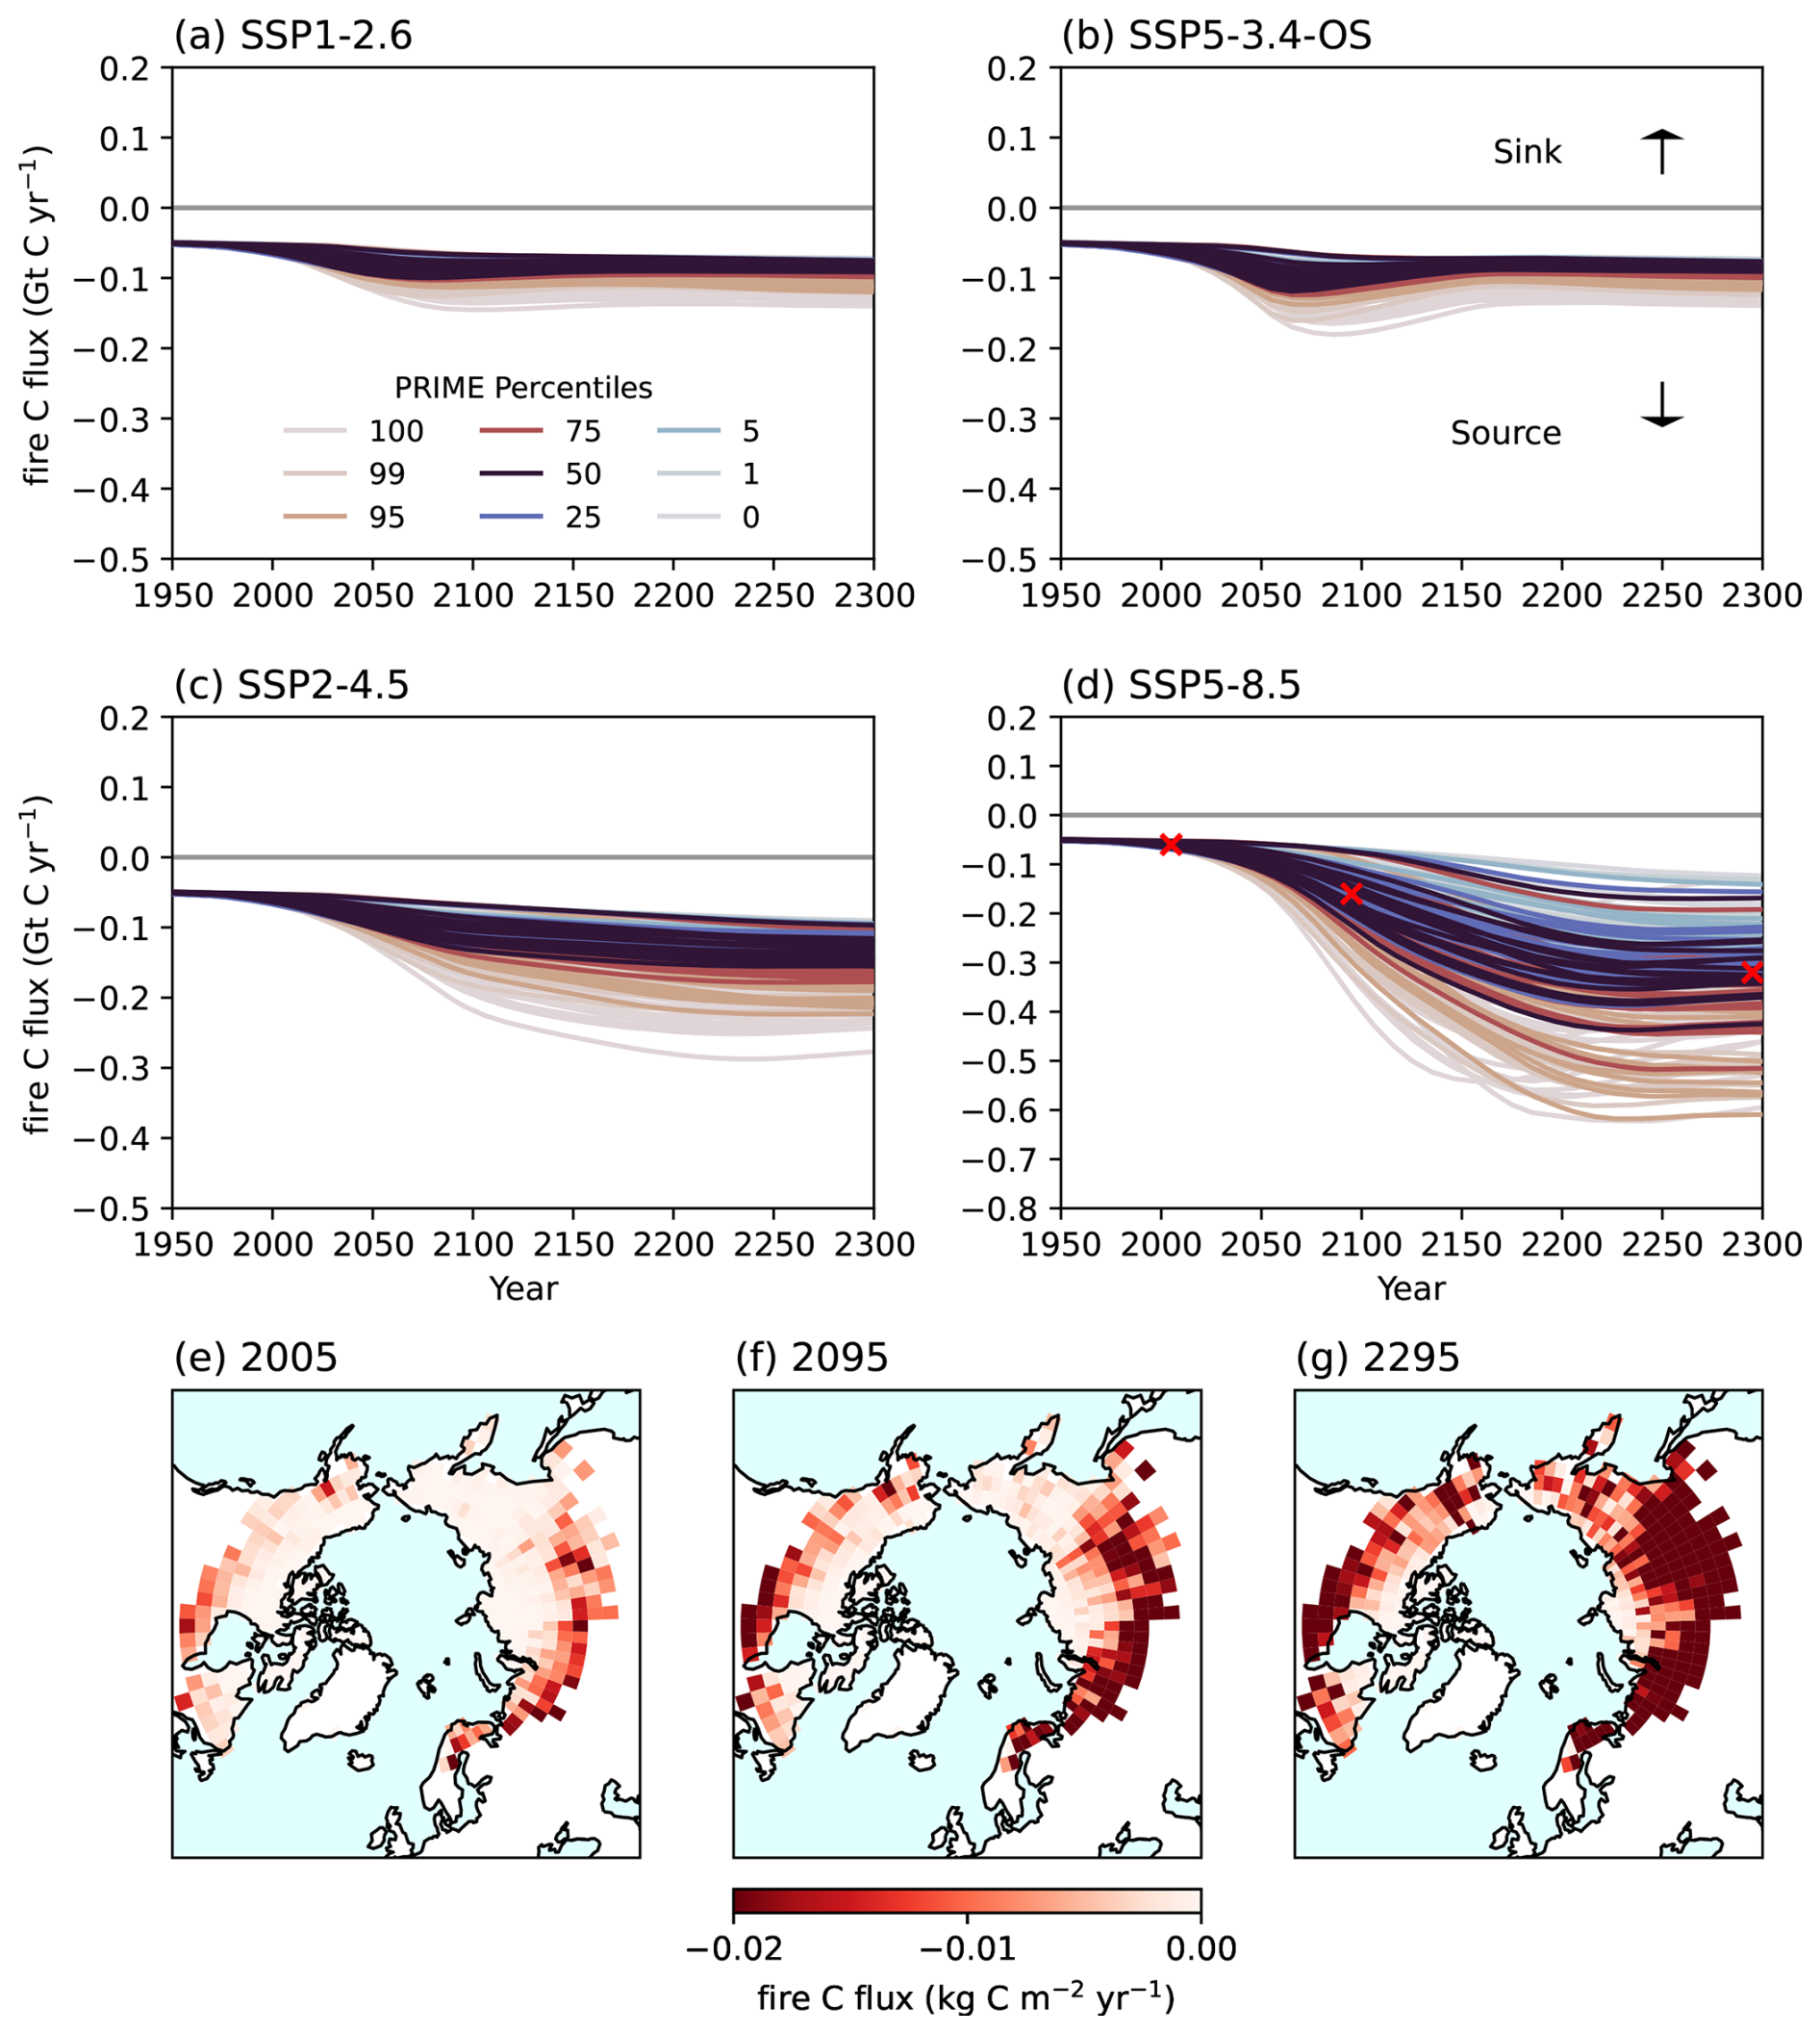
Figure 5Carbon flux due to fire emissions in the JULES-INFERNO configuration as a global total for each PRIME percentile (colours) and pattern (lines of same colour), in (a) SSP1-2.6, (b) SSP5-3.4-OS, (c) SSP2-4.5, (d) SSP5-8.5. Spatial changes are shown for the 50th percentile in SSP5-8.5, in (e) 2005, (f) 2095, (g) 2295 (where decadal means are taken around these years). The crosses on panel (d) represent the point in time of each map. Note: the y-axis range on (d) is different to that on (a)–(c).
Quantifying global warming and climate impacts is associated with considerable uncertainty, depending on uncertain carbon cycle feedbacks, the climate sensitivity of Earth, and the global climate policies implemented. ESMs currently include more processes than ever before, providing vital tools to evaluate climate change and the subsequent possible impacts with a range of future climate scenarios. However, these models are slow to run, limited due to computational power and lag behind offline land surface model developments. The PRIME framework has allowed us to investigate net carbon fluxes in the northern high latitudes with a range of climate sensitivities and policy-relevant climate scenarios, but with the advantage of including key processes which have not yet been coupled together in ESMs and with significantly lower computational expense.
The net carbon balance within the northern high-latitude ecosystem is the result of large, counteracting fluxes between the land and atmosphere, both sensitive to climate change. Physical processes such as permafrost and the movement of vegetation heavily influence the rate of change of these fluxes, particularly in high-latitude regions, which are subject to the most extreme rates of global warming. None of the most recent CMIP6 ESMs explicitly simulate the coupling of permafrost together with dynamic vegetation, limiting the robustness of carbon budget projections in these regions (Arora et al., 2020; Varney et al., 2024). The results presented here have highlighted the need to include key processes within ESMs that control the net ecosystem carbon balance to accurately quantify and understand the strength and decline of the carbon sink.
This study highlights the reduced carbon budget in the northern high latitudes due to permafrost carbon loss under warming, and the associated increased likelihood of a net carbon source. When explicitly included in the model, a net carbon source transition occurs below 2 °C of global warming in both SSP1-2.6 and SSP5-3.4-OS climate scenarios, which are both overshoot scenarios. Due to boreal forest expansion, a carbon source transition is projected at higher global warming levels (4–6 °C) in SSP2-4.5 and SSP5-8.5. This indicates that overshoot scenarios cause an earlier (with respect to both time and warming levels) sink-to-source transition of the northern high latitudes compared with scenarios of continuous warming. This source behaviour arises because vegetation productivity declines rapidly once temperatures drop back below the optimum for growth, while delayed soil respiration continues to rise. Thus, just as the climate system relies on substantial net-negative emissions to bring temperatures back down, additional warming-induced natural carbon emissions emerge from high-latitude ecosystems that are not typically accounted for in mitigation planning. However, overshoot trajectories ultimately prevent much larger multi-century carbon emissions because they expose the northern high latitudes to lower cumulative warming than continuous warming pathways. This highlights a profound temporal trade-off in the design and assessment of overshoot mitigation strategies.
Overall, rising atmospheric CO2 concentrations and global mean temperatures create a balance between enhanced vegetation productivity, which strengthens the terrestrial carbon sink, and increasing permafrost thaw, which releases previously frozen carbon and weakens the sink; where the magnitudes of these individual responses remain uncertain across modelling studies (Pugh et al., 2018; Varney et al., 2023). It is found that this balance is dependent both on the climate sensitivity of the system, as well as the climate scenario followed. Even if CO2 emissions stabilise after 2100, carbon loss from soils will continue long beyond the end of the 21st century, however the initial increase in vegetation storage will saturate. This highlights the importance of extending simulations beyond 2100 to account for the full impact of slower processes on long-term carbon budgets, such as carbon stored in soils. Additional impacts on the net carbon balance, such as additional carbon emissions due to fires, have been shown to further increase the likelihood of a carbon source with greater levels of climate change.
Future generations of ESMs, such as those within CMIP7, are expected to see the inclusion of more land carbon cycle processes, such as the ones considered here (Fisher and Koven, 2020). Investigating the balance of carbon fluxes in this region in additional land surface models will allow for inter-model comparison and help to further understand the sensitivity of such fluxes to climate change (Padrón et al., 2022). Additionally, simulations with coupled models will allow for an evaluation of the ecosystem carbon balance including the additional biophysical feedbacks, a current limitation with the PRIME framework. It is noted here that there are additional physical processes within the northern high latitudes which are yet to be included in the majority of land surface models, and will likely not be developed on the timeline of CMIP7. Further processes, including non-linear feedbacks such as thermokarst, are expected to further reduce the carbon budgets in this region (Turetsky et al., 2020). Additionally, it is noted that this study focuses on the net balance of CO2, whereas methane emissions are additional contributions to the overall net carbon balance and will also contribute to climate change impacts (Comyn-Platt et al., 2018).
To date, the global land carbon sink has been essential in absorbing increased CO2 concentrations and offsetting fossil fuel emissions (Friedlingstein et al., 2026). However, this study suggests the carbon sink within the northern high latitudes cannot be relied upon under long-term warming when making policy decisions.
The code used for analysis and plotting in this study is available here: https://github.com/rebeccamayvarney/PRIME-PF (Varney et al., 2026).
The output data used in this study is available here: https://doi.org/10.5281/zenodo.17814696 (Burke et al., 2025).
The supplement related to this article is available online at https://doi.org/10.5194/esd-17-913-2026-supplement.
RMV, EJB, DH and NJS came up with the research questions and designed the study. RMV wrote the manuscript. EJB produced the PRIME and JULES simulations. DH produced the figures. TLS provided CARDAMOM data used for evaluation. All co-authors provided guidance on the study and provided edits to the manuscript.
The contact author has declared that none of the authors has any competing interests.
Publisher's note: Copernicus Publications remains neutral with regard to jurisdictional claims made in the text, published maps, institutional affiliations, or any other geographical representation in this paper. The authors bear the ultimate responsibility for providing appropriate place names. Views expressed in the text are those of the authors and do not necessarily reflect the views of the publisher.
RMV and this study received support from the CALIPSO project provided by Schmidt Sciences. EJB received funding from the European Union's Horizon 2020 research and innovation programme under Grant Agreement No 101003536 (ESM2025), and Grant Agreement No 101081193 (OptimESM) and the Met Office Hadley Centre Climate Programme funded by DSIT. DH and CM received funding from the European Union's Horizon 2020 research and innovation programme under Grant Agreement No 101081193 (OptimESM) and the Met Office Hadley Centre Climate Programme funded by DSIT. NJS has been supported by the Norwegian Research Council through the projects TRIFECTA (grant no. 334811) and NAVIGATE (grant no. 352142). TLS is funded by the UK's National Centre for Earth Observation (NE/12016518/1) and by the Natural Environment Research Council (NERC grant reference number NE/X019071/1, `UK EO Climate Information Service').
This research has been supported by the Schmidt Futures (CALIPSO).
The publication of this article was funded by the Swedish Research Council, Forte, Formas, and Vinnova.
This paper was edited by Sibyll Schaphoff and reviewed by two anonymous referees.
Alfaro-Sánchez, R., Richardson, A. D., Smith, S. L., Johnstone, J. F., Turetsky, M. R., Cumming, S. G., Le Moine, J. M., and Baltzer, J. L.: Permafrost instability negates the positive impact of warming temperatures on boreal radial growth, P. Natl. Acad. Sci. USA, 121, e2411721 121, https://doi.org/10.1073/pnas.2411721121, 2024. a
Arora, V. K., Katavouta, A., Williams, R. G., Jones, C. D., Brovkin, V., Friedlingstein, P., Schwinger, J., Bopp, L., Boucher, O., Cadule, P., Chamberlain, M. A., Christian, J. R., Delire, C., Fisher, R. A., Hajima, T., Ilyina, T., Joetzjer, E., Kawamiya, M., Koven, C. D., Krasting, J. P., Law, R. M., Lawrence, D. M., Lenton, A., Lindsay, K., Pongratz, J., Raddatz, T., Séférian, R., Tachiiri, K., Tjiputra, J. F., Wiltshire, A., Wu, T., and Ziehn, T.: Carbon–concentration and carbon–climate feedbacks in CMIP6 models and their comparison to CMIP5 models, Biogeosciences, 17, 4173–4222, https://doi.org/10.5194/bg-17-4173-2020, 2020. a, b
Best, M. J., Pryor, M., Clark, D. B., Rooney, G. G., Essery, R. L. H., Ménard, C. B., Edwards, J. M., Hendry, M. A., Porson, A., Gedney, N., Mercado, L. M., Sitch, S., Blyth, E., Boucher, O., Cox, P. M., Grimmond, C. S. B., and Harding, R. J.: The Joint UK Land Environment Simulator (JULES), model description – Part 1: energy and water fluxes, Geosci. Model Dev., 4, 677–699, https://doi.org/10.5194/gmd-4-677-2011, 2011. a
Bock, L., Lauer, A., Schlund, M., Barreiro, M., Bellouin, N., Jones, C., Meehl, G., Predoi, V., Roberts, M., and Eyring, V.: Quantifying progress across different CMIP phases with the ESMValTool, J. Geophys. Res.-Atmos., 125, e2019JD032321, https://doi.org/10.1029/2019JD032321, 2020. a
Burke, E. J., Chadburn, S. E., and Ekici, A.: A vertical representation of soil carbon in the JULES land surface scheme (vn4. 3_permafrost) with a focus on permafrost regions, Geosci. Model Dev., 10, 959–975, https://doi.org/10.5194/gmd-10-959-2017, 2017. a
Burke, E. J., Zhang, Y., and Krinner, G.: Evaluating permafrost physics in the Coupled Model Intercomparison Project 6 (CMIP6) models and their sensitivity to climate change, The Cryosphere, 14, 3155–3174, https://doi.org/10.5194/tc-14-3155-2020, 2020. a
Burke, E., Smallman, T., Varney, R., and Hooke, D.: PRIME-PF data, Zenodo [data set], https://doi.org/10.5281/zenodo.17814696, 2025. a
Burton, C., Betts, R., Cardoso, M., Feldpausch, T. R., Harper, A., Jones, C. D., Kelley, D. I., Robertson, E., and Wiltshire, A.: Representation of fire, land-use change and vegetation dynamics in the Joint UK Land Environment Simulator vn4. 9 (JULES), Geosci. Model Dev., 12, 179–193, https://doi.org/10.5194/gmd-12-179-2019, 2019. a
Canadell, J., Monteiro, P., Costa, M., Cotrim da Cunha, L., Cox, P., Eliseev, A., Henson, S., Ishii, M., Jaccard, S., Koven, C., Lohila, A., Patra, P., Piao, S., Rogelj, J., Syampungani, S., Zaehle, S., and Zickfeld, K.: Global Carbon and other Biogeochemical Cycles and Feedbacks, Cambridge University Press, Cambridge, United Kingdom and New York, NY, USA, https://doi.org/10.1017/9781009157896.007, 2021. a
Carvalhais, N., Forkel, M., Khomik, M., Bellarby, J., Jung, M., Migliavacca, M., Mu, M., Saatchi, S., Santoro, M., Thurner, M., and Weber, U.: Global covariation of carbon turnover times with climate in terrestrial ecosystems, Nature, 514, 213–217, https://doi.org/10.1038/nature13731, 2014. a
Clark, D. B., Mercado, L. M., Sitch, S., Jones, C. D., Gedney, N., Best, M. J., Pryor, M., Rooney, G. G., Essery, R. L. H., Blyth, E., Boucher, O., Harding, R. J., Huntingford, C., and Cox, P. M.: The Joint UK Land Environment Simulator (JULES), model description Part 2: Carbon fluxes and vegetation dynamics, Geosci. Model Dev., 4, 701–722, https://doi.org/10.5194/gmd-4-701-2011, 2011. a
Comyn-Platt, E., Hayman, G., Huntingford, C., Chadburn, S. E., Burke, E. J., Harper, A. B., Collins, W. J., Webber, C. P., Powell, T., Cox, P. M., Gedney, N., and Sitch, S.: Carbon budgets for 1.5 and 2 C targets lowered by natural wetland and permafrost feedbacks, Nat. Geosci., 11, 568–573, https://doi.org/10.1038/s41561-018-0174-9, 2018. a
Cox, P. M., Williamson, M. S., Friedlingstein, P., Jones, C. D., Raoult, N., Rogelj, J., and Varney, R. M.: Emergent constraints on carbon budgets as a function of global warming, Nat. Commun., 15, 1885, https://doi.org/10.1038/s41467-024-46137-7, 2024. a
Descals, A., Gaveau, D. L., Verger, A., Sheil, D., Naito, D., and Peñuelas, J.: Unprecedented fire activity above the Arctic Circle linked to rising temperatures, Science, 378, 532–537, https://doi.org/10.1126/science.abn9768, 2022. a
Dial, R. J., Maher, C. T., Hewitt, R. E., and Sullivan, P. F.: Sufficient conditions for rapid range expansion of a boreal conifer, Nature, 608, 546–551, https://doi.org/10.1038/s41586-022-05093-2, 2022. a
England, M. R., Eisenman, I., Lutsko, N. J., and Wagner, T. J.: The recent emergence of Arctic amplification, Geophys. Res. Lett., 48, e2021GL094086, https://doi.org/10.1029/2021GL094086, 2021. a
Eyring, V., Bony, S., Meehl, G. A., Senior, C. A., Stevens, B., Stouffer, R. J., and Taylor, K. E.: Overview of the Coupled Model Intercomparison Project Phase 6 (CMIP6) experimental design and organization, Geosci. Model Dev., 9, 1937–1958, https://doi.org/10.5194/gmd-9-1937-2016, 2016. a
Fisher, R. A. and Koven, C. D.: Perspectives on the future of land surface models and the challenges of representing complex terrestrial systems, J. Adv. Model. Ea. Sy., 12, e2018MS001453, https://doi.org/10.1029/2018MS001453, 2020. a
Friedlingstein, P., O'Sullivan, M., Jones, M. W., Andrew, R. M., Bakker, D. C. E., Hauck, J., Landschützer, P., Le Quéré, C., Li, H., Luijkx, I. T., Peters, G. P., Peters, W., Pongratz, J., Schwingshackl, C., Sitch, S., Canadell, J. G., Ciais, P., Aas, K., Alin, S. R., Anthoni, P., Barbero, L., Bates, N. R., Bellouin, N., Benoit-Cattin, A., Berghoff, C. F., Bernardello, R., Bopp, L., Brasika, I. B. M., Chamberlain, M. A., Chandra, N., Chevallier, F., Chini, L. P., Collier, N. O., Colligan, T. H., Cronin, M., Djeutchouang, L. M., Dou, X., Enright, M. P., Enyo, K., Erb, M., Evans, W., Feely, R. A., Feng, L., Ford, D. J., Foster, A., Fransner, F., Gasser, T., Gehlen, M., Gkritzalis, T., Goncalves De Souza, J., Grassi, G., Gregor, L., Gruber, N., Guenet, B., Gürses, O., Harrington, K., Harris, I., Heinke, J., Hurtt, G. C., Iida, Y., Ilyina, T., Ito, A., Jacobson, A. R., Jain, A. K., Jarníková, T., Jersild, A., Jiang, F., Jones, S. D., Kato, E., Keeling, R. F., Klein Goldewijk, K., Knauer, J., Kong, Y., Korsbakken, J. I., Koven, C., Kunimitsu, T., Lan, X., Liu, J., Liu, Z., Liu, Z., Lo Monaco, C., Ma, L., Marland, G., McGuire, P. C., McKinley, G. A., Melton, J. R., Monacci, N., Monier, E., Morgan, E. J., Munro, D. R., Müller, J. D., Nakaoka, S.-I., Nayagam, L. R., Niwa, Y., Nutzel, T., Olsen, A., Omar, A. M., Pan, N., Pandey, S., Pierrot, D., Qin, Z., Regnier, P., Rehder, G., Resplandy, L., Roobaert, A., Rosan, T. M., Rödenbeck, C., Schwinger, J., Skjelvan, I., Smallman, T. L., Spada, V., Sreeush, M. G., Sun, Q., Sutton, A. J., Sweeney, C., Swingedouw, D., Séférian, R., Takao, S., Tatebe, H., Tian, H., Tian, X., Tilbrook, B., Tsujino, H., Tubiello, F., van Ooijen, E., van der Werf, G. R., van de Velde, S. J., Walker, A. P., Wanninkhof, R., Yang, X., Yuan, W., Yue, X., and Zeng, J.: Global Carbon Budget 2025, Earth Syst. Sci. Data, 18, 3211–3288, https://doi.org/10.5194/essd-18-3211-2026, 2026. a, b
Gallo, C., Dieppois, B., Quilcaille, Y., Chiriacò, M. V., Fulé, P. Z., Drobyshev, I., San-Miguel-Ayanz, J., Blackett, M., and Eden, J. M.: Future Impacts of Climate Change on Global Fire Weather: Insight from Weighted CMIP6 Multimodel Ensembles, J. Clim., 38, 6445–6462, https://doi.org/10.1175/JCLI-D-24-0540.1, 2025. a
Gier, B. K., Schlund, M., Friedlingstein, P., Jones, C. D., Jones, C., Zaehle, S., and Eyring, V.: Representation of the terrestrial carbon cycle in CMIP6, Biogeosciences, 21, 5321–5360, https://doi.org/10.5194/bg-21-5321-2024, 2024. a, b
Hantson, S., Arneth, A., Harrison, S. P., Kelley, D. I., Prentice, I. C., Rabin, S. S., Archibald, S., Mouillot, F., Arnold, S. R., Artaxo, P., Bachelet, D., Ciais, P., Forrest, M., Friedlingstein, P., Hickler, T., Kaplan, J. O., Kloster, S., Knorr, W., Lasslop, G., Li, F., Mangeon, S., Melton, J. R., Meyn, A., Sitch, S., Spessa, A., van der Werf, G. R., Voulgarakis, A., and Yue, C.: The status and challenge of global fire modelling, Biogeosciences, 13, 3359–3375, https://doi.org/10.5194/bg-13-3359-2016, 2016. a
Hugelius, G., Strauss, J., Zubrzycki, S., Harden, J. W., Schuur, E. A. G., Ping, C.-L., Schirrmeister, L., Grosse, G., Michaelson, G. J., Koven, C. D., O'Donnell, J. A., Elberling, B., Mishra, U., Camill, P., Yu, Z., Palmtag, J., and Kuhry, P.: Estimated stocks of circumpolar permafrost carbon with quantified uncertainty ranges and identified data gaps, Biogeosciences, 11, 6573–6593, https://doi.org/10.5194/bg-11-6573-2014, 2014. a
Hugelius, G., Loisel, J., Chadburn, S., Jackson, R. B., Jones, M., MacDonald, G., Marushchak, M., Olefeldt, D., Packalen, M., Siewert, M. B., Treat, C., Turetsky, M., Voigt, C., and Yu, Z.: Large stocks of peatland carbon and nitrogen are vulnerable to permafrost thaw, P. Natl. Acad. Sci. USA, 117, 20438–20446, https://doi.org/10.1073/pnas.1916387117, 2020. a
Hugelius, G., Ramage, J., Burke, E., Chatterjee, A., Smallman, T. L., Aalto, T., Bastos, A., Biasi, C., Canadell, J. G., Chandra, N., Chevallier, F., Ciais, P., Chang, J., Feng, L., Jones, M. W., Kleinen, T., Kuhn, M., Lauerwald, R., Liu, J., López-Blanco, E., Luijkx, I. T., Marushchak, M. E., Natali, S. M., Niwa, Y., Olefeldt, D., Palmer, P. I., Patra, P. K., Peters, W., Potter, S., Poulter, B., Rogers, B. M., Riley, W. J., Saunois, M., Schuur, E. A. G., Thompson, R. L., Treat, C., Tsuruta, A., Turetsky, M. R., Virkkala, A.-M., Voigt, C., Watts, J., Zhu, Q., and Zheng, B.: Permafrost region greenhouse gas budgets suggest a weak CO2 sink and CH4 and N2O sources, but magnitudes differ between top-down and bottom-up methods, Global Biogeochem. Cy., 38, e2023GB007969, https://doi.org/10.1029/2023GB007969, 2024. a, b, c, d
Koven, C. D., Arora, V. K., Cadule, P., Fisher, R. A., Jones, C. D., Lawrence, D. M., Lewis, J., Lindsay, K., Mathesius, S., Meinshausen, M., Mills, M., Nicholls, Z., Sanderson, B. M., Séférian, R., Swart, N. C., Wieder, W. R., and Zickfeld, K.: Multi-century dynamics of the climate and carbon cycle under both high and net negative emissions scenarios, Earth Syst. Dynam., 13, 885–909, https://doi.org/10.5194/esd-13-885-2022, 2022. a
Li, F., Bond-Lamberty, B., and Levis, S.: Quantifying the role of fire in the Earth system – Part 2: Impact on the net carbon balance of global terrestrial ecosystems for the 20th century, Biogeosciences, 11, 1345–1360, https://doi.org/10.5194/bg-11-1345-2014, 2014. a
Maes, S. L., Dietrich, J., Midolo, G., Schwieger, S., Kummu, M., Vandvik, V., Aerts, R., Althuizen, I. H. J., Biasi, C., Björk, R. G., Böhner, H., Carbognani, M., Chiari, G., Christiansen, C. T., Clemmensen, K. E., Cooper, E. J., Cornelissen, J. H. C., Elberling, B., Faubert, P., Fetcher, N., Forte, T. G. W., Gaudard, J., Gavazov, K., Guan, Z., Guðmundsson, J., Gya, R., Hallin, S., Hansen, B. B., Haugum, S. V., He, J.-S., Hicks Pries, C., Hovenden, M. J., Jalava, M., Jónsdóttir, I. S., Juhanson, J., Jung, J. Y., Kaarlejärvi, E., Kwon, M. J., Lamprecht, R. E., Le Moullec, M., Lee, H., Marushchak, M. E., Michelsen, A., Munir, T. M., Myrsky, E. M., Nielsen, C. S., Nyberg, M., Olofsson, J., Óskarsson, H., Parker, T. C., Pedersen, E. P., Petit Bon, M., Petraglia, A., Raundrup, K., Ravn, N. M. R., Rinnan, R., Rodenhizer, H., Ryde, I., Schmidt, N. M., Schuur, E. A. G., Sjögersten, S., Stark, S., Strack, M., Tang, J., Tolvanen, A., Töpper, J. P., Väisänen, M. K., van Logtestijn, R. S. P., Voigt, C., Walz, J., Weedon, J. T., Yang, Y., Ylänne, H., Björkman, M. P., Sarneel, J. M., and Dorrepaal, E.: Environmental drivers of increased ecosystem respiration in a warming tundra, Nature, 629, 105–113, https://doi.org/10.1038/s41586-024-07274-7, 2024. a
Mathison, C., Burke, E., Hartley, A. J., Kelley, D. I., Burton, C., Robertson, E., Gedney, N., Williams, K., Wiltshire, A., Ellis, R. J., Sellar, A. A., and Jones, C. D.: Description and evaluation of the JULES-ES set-up for ISIMIP2b, Geosci. Model Dev., 16, 4249–4264, https://doi.org/10.5194/gmd-16-4249-2023, 2023. a
Mathison, C., Burke, E. J., Munday, G., Jones, C. D., Smith, C. J., Steinert, N. J., Wiltshire, A. J., Huntingford, C., Kovacs, E., Gohar, L. K., Varney, R. M., and McNeall, D.: A rapid-application emissions-to-impacts tool for scenario assessment: Probabilistic Regional Impacts from Model patterns and Emissions (PRIME), Geosci. Model Dev., 18, 1785–1808, https://doi.org/10.5194/gmd-18-1785-2025, 2025. a, b, c
McCarty, J. L., Aalto, J., Paunu, V.-V., Arnold, S. R., Eckhardt, S., Klimont, Z., Fain, J. J., Evangeliou, N., Venäläinen, A., Tchebakova, N. M., Parfenova, E. I., Kupiainen, K., Soja, A. J., Huang, L., and Wilson, S.: Reviews and syntheses: Arctic fire regimes and emissions in the 21st century, Biogeosciences, 18, 5053–5083, https://doi.org/10.5194/bg-18-5053-2021, 2021. a
Meinshausen, M., Nicholls, Z. R. J., Lewis, J., Gidden, M. J., Vogel, E., Freund, M., Beyerle, U., Gessner, C., Nauels, A., Bauer, N., Canadell, J. G., Daniel, J. S., John, A., Krummel, P. B., Luderer, G., Meinshausen, N., Montzka, S. A., Rayner, P. J., Reimann, S., Smith, S. J., van den Berg, M., Velders, G. J. M., Vollmer, M. K., and Wang, R. H. J.: The shared socio-economic pathway (SSP) greenhouse gas concentrations and their extensions to 2500, Geosci. Model Dev., 13, 3571–3605, https://doi.org/10.5194/gmd-13-3571-2020, 2020. a
Melnikova, I., Boucher, O., Cadule, P., Ciais, P., Gasser, T., Quilcaille, Y., Shiogama, H., Tachiiri, K., Yokohata, T., and Tanaka, K.: Carbon cycle response to temperature overshoot beyond 2 C: An analysis of CMIP6 models, Earth's Future, 9, e2020EF001967, https://doi.org/10.1029/2020EF001967, 2021. a, b
Miner, K. R., Turetsky, M. R., Malina, E., Bartsch, A., Tamminen, J., McGuire, A. D., Fix, A., Sweeney, C., Elder, C. D., and Miller, C. E.: Permafrost carbon emissions in a changing Arctic, Nat. Rev. Earth Environ., 3, 55–67, https://doi.org/10.1038/s43017-021-00230-3, 2022. a
Muccio, D., Keppel-Aleks, G., and Parazoo, N.: Contrasting temperature sensitivity of boreal forest productivity in North America and Eurasia, J. Geophys. Res.-Biogeo., 130, e2024JG008634, https://doi.org/10.1029/2024JG008634, 2025. a
Munday, G., Jones, C. D., Steinert, N. J., Mathison, C., Burke, E. J., Smith, C., Huntingford, C., Varney, R. M., and Wiltshire, A. J.: Risks of unavoidable impacts on forests at 1.5 °C with and without overshoot, Nat. Clim. Change, 15, 650–655, https://doi.org/10.1038/s41558-025-02327-9, 2025. a
Natali, S. M., Rogers, B., Schuur, E. A., Romanovsky, V., Alcock, H., Arndt, K., Euskirchen, E. S., Falvo, G., Fiske, G., and Hould-Gosselin, G.: NOAA Arctic Report Card 2024: Arctic Terrestrial Carbon Cycling, NOAA Technical Report OAR ARC, https://doi.org/10.25923/0gpp-mn10, 2024. a
O'Neill, B. C., Tebaldi, C., van Vuuren, D. P., Eyring, V., Friedlingstein, P., Hurtt, G., Knutti, R., Kriegler, E., Lamarque, J.-F., Lowe, J., Meehl, G. A., Moss, R., Riahi, K., and Sanderson, B. M.: The scenario model intercomparison project (ScenarioMIP) for CMIP6, Geosci. Model Dev., 9, 3461–3482, https://doi.org/10.5194/gmd-9-3461-2016, 2016. a
Padrón, R. S., Gudmundsson, L., Liu, L., Humphrey, V., and Seneviratne, S. I.: Drivers of intermodel uncertainty in land carbon sink projections, Biogeosciences, 19, 5435–5448, https://doi.org/10.5194/bg-19-5435-2022, 2022. a
Previdi, M., Smith, K. L., and Polvani, L. M.: Arctic amplification of climate change: a review of underlying mechanisms, Environ. Res. Lett., 16, 093003, https://doi.org/10.1088/1748-9326/ac1c29, 2021. a
Pugh, T. A. M., Jones, C. D., Huntingford, C., Burton, C., Arneth, A., Brovkin, V., Ciais, P., Lomas, M., Robertson, E., Piao, S. L., and Sitch, S.: A large committed long-term sink of carbon due to vegetation dynamics, Earth's Future, 6, 1413–1432, https://doi.org/10.1029/2018EF000935, 2018. a, b
Qiu, H., Hao, D., Zeng, Y., Zhang, X., and Chen, M.: Global and northern-high-latitude net ecosystem production in the 21st century from CMIP6 experiments, Earth Syst. Dynam., 14, 1–16, https://doi.org/10.5194/esd-14-1-2023, 2023. a
Rantanen, M., Kämäräinen, M., Niittynen, P., Phoenix, G. K., Lenoir, J., Maclean, I., Luoto, M., and Aalto, J.: Bioclimatic atlas of the terrestrial Arctic, Sci. Data, 10, 40, https://doi.org/10.1038/s41597-023-01959-w, 2023. a
Rotbarth, R., Van Nes, E. H., Scheffer, M., Jepsen, J. U., Vindstad, O. P. L., Xu, C., and Holmgren, M.: Northern expansion is not compensating for southern declines in North American boreal forests, Nat. Commun., 14, 3373, https://doi.org/10.1038/s41467-023-39092-2, 2023. a, b
Schädel, C., Rogers, B. M., Lawrence, D. M., Koven, C. D., Brovkin, V., Burke, E. J., Genet, H., Huntzinger, D. N., Jafarov, E., McGuire, A. D., Riley, W. J., and Natali, S. M.: Earth system models must include permafrost carbon processes, Nat. Clim. Change, 14, 114–116, https://doi.org/10.1038/s41558-023-01909-9, 2024. a
Schimel, D., Stephens, B. B., and Fisher, J. B.: Effect of increasing CO2 on the terrestrial carbon cycle, P. Natl. Acad. Sci. USA, 112, 436–441, https://doi.org/10.1073/pnas.1407302112, 2015. a
Schuur, E. A., Abbott, B. W., Commane, R., Ernakovich, J., Euskirchen, E., Hugelius, G., Grosse, G., Jones, M., Koven, C., Leshyk, V., Lawrence, D., Loranty, M. M., Mauritz, M., Olefeldt, D., Natali, S., Rodenhizer, H., Salmon, V., Schädel, C., Strauss, J., Treat, C., and Turetsky, M.: Permafrost and climate change: carbon cycle feedbacks from the warming Arctic, Ann. Rev. Environ. Res., 47, 343–371, https://doi.org/10.1146/annurev-environ-012220-011847, 2022. a
See, C. R., Virkkala, A.-M., Natali, S. M., Rogers, B. M., Mauritz, M., Biasi, C., Bokhorst, S., Boike, J., Bret-Harte, M. S., Celis, G., Chae, N., Christensen, T. R., Murner (Connon), S. J., Dengel, S., Dolman, H., Edgar, C. W., Elberling, B., Emmerton, C. A., Euskirchen, E. S., Göckede, M., Grelle, A., Heffernan, L., Helbig, M., Holl, D., Humphreys, E., Iwata, H., Järveoja, J., Kobayashi, H., Kochendorfer, J., Kolari, P., Kotani, A., Kutzbach, L., Kwon, M. J., Lathrop, E. R., López-Blanco, E., Mammarella, I., Marushchak, M. E., Mastepanov, M., Matsuura, Y., Merbold, L., Meyer, G., Minions, C., Nilsson, M. B., Nojeim, J., Oberbauer, S. F., Olefeldt, D., Park, S.-J., Parmentier, F.-J. W., Peichl, M., Peter, D., Petrov, R., Poyatos, R., Prokushkin, A. S., Quinton, W., Rodenhizer, H., Sachs, T., Savage, K., Schulze, C., Sjögersten, S., Sonnentag, O., St. Louis, V. L., Torn, M. S., Tuittila, E.-S., Ueyama, M., Varlagin, A., Voigt, C., Watts, J. D., Zona, D., Zyryanov, V. I., and Schuur, E. A. G.: Decadal increases in carbon uptake offset by respiratory losses across northern permafrost ecosystems, Nat. Clim. Change, 14, 853–862, https://doi.org/10.1038/s41558-024-02057-4, 2024. a, b
Sellar, A. A., Jones, C. G., Mulcahy, J. P., Tang, Y., Yool, A., Wiltshire, A., O'Connor, F. M., Stringer, M., Hill, R., Palmieri, J., Woodward, S., de Mora, L., Kuhlbrodt, T., Rumbold, S. T., Kelley, D. I., Ellis, R., Johnson, C. E., Walton, J., Abraham, N. L., Andrews, M. B., Andrews, T., Archibald, A. T., Berthou, S., Burke, E., Blockley, E., Carslaw, K., Dalvi, M., Edwards, J., Folberth, G. A., Gedney, N., Griffiths, P. T., Harper, A. B., Hendry, M. A., Hewitt, A. J., Johnson, B., Jones, A., Jones, C. D., Keeble, J., Liddicoat, S., Morgenstern, O., Parker, R. J., Predoi, V., Robertson, E., Siahaan, A., Smith, R. S., Swaminathan, R., Woodhouse, M. T., Zeng, G., and Zerroukat, M.: UKESM1: Description and evaluation of the UK Earth System Model, J. Adv. Model. Ea. Sy., 11, 4513–4558, https://doi.org/10.1029/2019MS001739, 2019. a
Smith, C. J., Forster, P. M., Allen, M., Leach, N., Millar, R. J., Passerello, G. A., and Regayre, L. A.: FAIR v1. 3: a simple emissions-based impulse response and carbon cycle model, Geosci. Model Dev., 11, 2273–2297, https://doi.org/10.5194/gmd-11-2273-2018, 2018. a
Turetsky, M. R., Abbott, B. W., Jones, M., Walter Anthony, K., Olefeldt, D., Schuur, E. A., Koven, C., McGuire, A. D., Grosse, G., Kuhry, P., and Hugelius, G.: Permafrost collapse is accelerating carbon release, Nature, 569, 32–34, https://doi.org/10.1038/d41586-019-01313-4, 2019. a
Turetsky, M. R., Abbott, B. W., Jones, M. C., Anthony, K. W., Olefeldt, D., Schuur, E. A., Grosse, G., Kuhry, P., Hugelius, G., Koven, C., Lawrence, D. M., Gibson, C., Sannel, B., and McGuire, D.: Carbon release through abrupt permafrost thaw, Nat. Geosci., 13, 138–143, https://doi.org/10.1038/s41561-019-0526-0, 2020. a
Varney, R. M., Chadburn, S. E., Friedlingstein, P., Burke, E. J., Koven, C. D., Hugelius, G., and Cox, P. M.: A spatial emergent constraint on the sensitivity of soil carbon turnover to global warming, Nat. Commun., 11, 5544, https://doi.org/10.1038/s41467-020-19208-8, 2020. a, b
Varney, R. M., Chadburn, S. E., Burke, E. J., and Cox, P. M.: Evaluation of soil carbon simulation in CMIP6 Earth system models, Biogeosciences, 19, 4671–4704, https://doi.org/10.5194/bg-19-4671-2022, 2022. a, b, c
Varney, R. M., Chadburn, S. E., Burke, E. J., Jones, S., Wiltshire, A. J., and Cox, P. M.: Simulated responses of soil carbon to climate change in CMIP6 Earth system models: the role of false priming, Biogeosciences, 20, 3767–3790, https://doi.org/10.5194/bg-20-3767-2023, 2023. a
Varney, R. M., Friedlingstein, P., Chadburn, S. E., Burke, E. J., and Cox, P. M.: Soil carbon-concentration and carbon-climate feedbacks in CMIP6 Earth system models, Biogeosciences, 21, 2759–2776, https://doi.org/10.5194/bg-21-2759-2024, 2024. a, b
Varney, R. M., Hooke, D., and Burke, E.: PRIME-PF, GitHub repository [code], https://github.com/rebeccamayvarney/PRIME-PF (last access: 11 June 2026), 2026. a
Virkkala, A.-M., Rogers, B. M., Watts, J. D., Arndt, K. A., Potter, S., Wargowsky, I., Schuur, E. A. G., See, C. R., Mauritz, M., Boike, J., Bret-Harte, M. S., Burke, E. J., Burrell, A., Chae, N., Chatterjee, A., Chevallier, F., Christensen, T. R., Commane, R., Dolman, H., Edgar, C. W., Elberling, B., Emmerton, C. A., Euskirchen, E. S., Feng, L., Göckede, M., Grelle, A., Helbig, M., Holl, D., Järveoja, J., Karsanaev, S. V., Kobayashi, H., Kutzbach, L., Liu, J., Luijkx, I. T., López-Blanco, E., Lunneberg, K., Mammarella, I., Marushchak, M. E., Mastepanov, M., Matsuura, Y., Maximov, T. C., Merbold, L., Meyer, G., Nilsson, M. B., Niwa, Y., Oechel, W., Palmer, P. I., Park, S.-J., Parmentier, F.-J. W., Peichl, M., Peters, W., Petrov, R., Quinton, W., Rödenbeck, C., Sachs, T., Schulze, C., Sonnentag, O., St. Louis, V. L., Tuittila, E.-S., Ueyama, M., Varlagin, A., Zona, D., and Natali, S. M.: Wildfires offset the increasing but spatially heterogeneous Arctic–boreal CO2 uptake, Nat. Clim. Change, 15, 188–195, https://doi.org/10.1038/s41558-024-02234-5, 2025. a, b, c
Wang, S., Zhang, Y., Ju, W., Chen, J. M., Ciais, P., Cescatti, A., Sardans, J., Janssens, I. A., Wu, M., Berry, J. A., Campbell, E., Fernández-Martínez, M., Alkama, R., Sitch, S., Friedlingstein, P., Smith, W. K., Yuan, W., He, W., Lombardozzi, D., Kautz, M., Zhu, D., Lienert, S., Kato, E., Poulter, B., Sanders, T. G. M., Krüger, I., Wang, R., Zeng, N., Tian, H., Vuichard, N., Jain, A. K., Wiltshire, A., Haverd, V., Goll, D. S., and Peñuelas, J.: Recent global decline of CO2 fertilization effects on vegetation photosynthesis, Science, 370, 1295–1300, https://doi.org/10.1126/science.abb7772, 2020. a
Wiltshire, A. J., Burke, E. J., Chadburn, S. E., Jones, C. D., Cox, P. M., Davies-Barnard, T., Friedlingstein, P., Harper, A. B., Liddicoat, S., Sitch, S., and Zaehle, S.: JULES-CN: a coupled terrestrial carbon–nitrogen scheme (JULES vn5.1), Geosci. Model Dev., 14, 2161–2186, https://doi.org/10.5194/gmd-14-2161-2021, 2021. a, b
Witze, A.: Why Arctic fires are bad news for climate change, Nature, 585, 336–337, https://doi.org/10.1038/d41586-020-02568-y, 2020. a
Young, A. M., Higuera, P. E., Duffy, P. A., and Hu, F. S.: Climatic thresholds shape northern high-latitude fire regimes and imply vulnerability to future climate change, Ecography, 40, 606–617, https://doi.org/10.1111/ecog.02205, 2017. a, b
Zhao, P., Chi, J., Nilsson, M. B., Löfvenius, M. O., Högberg, P., Jocher, G., Lim, H., Mäkelä, A., Marshall, J., Ratcliffe, J., Tian, X., Näsholm, T., Lundmark, T., Linder, S., and Peichl, M.: Long-term nitrogen addition raises the annual carbon sink of a boreal forest to a new steady-state, Agr. Forest Meteorol., 324, 109112, https://doi.org/10.1016/j.agrformet.2022.109112, 2022. a
Zhu, X., Jia, G., and Xu, X.: Wildfire emissions offset more permafrost ecosystem carbon sink in the 21st century, Earth's Future, 12, e2024EF005098, https://doi.org/10.1029/2024EF005098, 2024. a, b