the Creative Commons Attribution 4.0 License.
the Creative Commons Attribution 4.0 License.
 | 11 Jun 2025
Biogeochemical versus biogeophysical temperature effects of historical land-use change in CMIP6
Clemens Schwingshackl
Akihiko Ito
Alina Barbu
Christine Delire
Daniele Peano
David M. Lawrence
David Wårlind
Eddy Robertson
Edouard L. Davin
Elena Shevliakova
Ian N. Harman
Nicolas Vuichard
Paul A. Miller
Peter J. Lawrence
Tilo Ziehn
Tomohiro Hajima
Victor Brovkin
Yanwu Zhang
Vivek K. Arora
Julia Pongratz
Anthropogenic land-use change (LUC) substantially impacts climate dynamics, primarily through modifications in the surface biogeophysical (BGP) and biogeochemical (BGC) fluxes, which alter the exchange of energy, water, and carbon with the atmosphere. Despite the established significance of both the BGP and BGC effects, their relative contribution to climate change remains poorly quantified. In this study, we leveraged data from an unprecedented number of Earth system models (ESMs) of the latest generation that contributed to the Land Use Model Intercomparison Project (LUMIP), under the auspices of the Coupled Model Intercomparison Project Phase 6 (CMIP6). Our analysis of BGP effects indicates a range of global annual near-surface air temperature changes across ESMs due to historical LUC, from a cooling of −0.23 °C to a warming of 0.14 °C, with a multi-model mean and spread of °C under present-day conditions relative to the pre-industrial era. Notably, the BGP effects indicate warming at high latitudes. Still, there is a discernible cooling pattern between 30° N and 60° N, extending across large landmasses from the Great Plains of North America to the Northeast Plain of Asia. The BGC effect shows substantial land carbon losses, amounting to Gt C over the historical period, with decreased vegetation carbon pools driving the losses in nearly all analysed ESMs. Based on the transient climate response to cumulative emissions (TCRE), we estimate that LUC-induced carbon emissions result in a warming of approximately 0.21±0.14 °C, which is consistent with previous estimates. When the BGP and BGC effects are taken together, our results suggest that the net effect of LUC on historical climate change has been to warm the climate. To understand the regional drivers (and thus potential levers to alter the climate), we show the contribution of each grid cell to LUC-induced global temperature change, as a warming contribution over the tropics and subtropics with a nuanced cooling contribution over the mid-latitudes. Our findings indicate that, historically, the BGC temperature effects dominate the BGP temperature effects at the global scale. However, they also reveal substantial discrepancies across models in the magnitude, directional impact, and regional specificity of LUC impacts on global temperature and land carbon dynamics. This underscores the need for further improvement and refinement in model simulations, including the consideration and implementation of land-use data and model-specific parameterizations, to achieve more accurate and robust estimates of the climate effect of LUC.
- Article
(8642 KB) - Full-text XML
-
Supplement
(8043 KB) - BibTeX
- EndNote


Land-use change and land management, hereafter referred to as land-use change (LUC), can influence the climate through (1) the alteration of physical characteristics (e.g. albedo, surface roughness, and evapotranspiration (ET)) by influencing land surface processes, such as moisture, momentum, and energy fluxes (biogeophysics, BGP), and (2) the alteration of the atmospheric composition between Earth's surface and the atmosphere, primarily through changes in atmospheric carbon dioxide (CO2) concentration, which affects the planet's radiative balance (biogeochemistry, BGC). These processes culminate in altering global and regional temperatures. LUC, as a term, is often used to describe an agglomeration of many processes leading to the alteration or modification of land (land use or purpose for which humans exploit land) for the purpose or function of a particular land cover through a set of practices or strategies (land management or ways humans exploit the land) aimed at optimizing the use, conservation, and stewardship of land resources (Lawrence et al., 2016; Pongratz et al., 2021). While LUC-induced land cover change is typically clearly visible (e.g. deforestation or afforestation/reforestation), land management processes, including fertilization, irrigation, pesticide application, and methods of wood harvesting (selective logging versus clear-cutting), do not alter the land cover, yet they have recently been revealed to have substantial effects on climate as well (Erb et al., 2018; Luyssaert et al., 2014).
As evidenced by previous studies and assessments (e.g. Friedlingstein et al., 2023; Jia et al., 2019; Simmons and Matthews, 2016), emissions from LUC and their associated BGP and BGC effects constitute a significant component of anthropogenic influences on climate: LUC accounts for one-third of historical CO2 emissions since pre-industrial times (Jia et al., 2019). LUC was a dominant anthropogenic forcing in both the pre-industrial (Ellis, 2021; Pongratz et al., 2009) and industrial eras (Hansen et al., 1998) and remains relevant at present (Findell et al., 2017), making its consideration necessary in future climate projections (Pongratz et al., 2021; Dong et al., 2019; Brovkin et al., 2013). Understanding carbon emissions from LUC is also crucial for assessing the full impact of land-based carbon dioxide removal (CDR) solutions in climate mitigation targets (Fuhrman et al., 2023; Zickfeld et al., 2023; Matthews et al., 2022). Given that LUC patterns and their impacts are often heterogeneous, distinct from those of greenhouse gases (GHGs) (Christidis et al., 2013), a thorough understanding of these impacts is essential to refine our understanding of observed climate change, discern regional variations, effectively map and accurately attribute the drivers of observed climate change, anticipate expected patterns, and recognize potential divergence from expected patterns. Although GHG emissions resulting from ongoing LUCs, particularly deforestation and forest degradation, have garnered considerable attention, the BGP effects of LUC remain underappreciated in policy discussions, despite their acknowledged significance (Duveiller et al., 2020). Furthermore, deliberate LUC strategies aimed at climate modification, such as CDR initiatives, often tend to emphasize CO2 reduction and overlook the BGP effects of such interventions (Jia et al., 2019).
LUC significantly affects local surface temperatures through non-radiative processes, such as changes in evapotranspiration and sensible heat exchange, and through radiative processes initiated through changes in surface albedo (BGP effects). Both changes in turbulent fluxes and the radiative balance of the land surface impact local climate to varying degrees depending on the LUC type and location. A local cooling effect might result from forest cover gains (Bright et al., 2017) or losses (Williams et al., 2021), depending on the region, thus emphasizing the role of forestation (collectively referring to reforestation and afforestation) in climate strategies. For example, over the Northern Hemisphere, a cooling of the Earth's climate often occurs after the conversion of forests to pasture and cropland (Lawrence et al., 2016) or after deforestation in the boreal forest region (Boysen et al., 2020; Davin and De Noblet-Ducoudré, 2010; de Noblet-Ducoudré et al., 2012) due to a reduction in available net radiation at the land surface through increased albedo. In contrast, a reduction in evapotranspiration (ET) after deforestation in the tropics generally leads to local warming (Zhu et al., 2023; Windisch et al., 2021; Lejeune et al., 2015). On the role of surface roughness, the results from idealized deforestation experiments (e.g. Davin and De Noblet-Ducoudré, 2010; Boysen et al., 2020) affirmed that converting forests to grasslands reduces surface roughness and decreases boundary layer turbulence. This leads to lower heat and water vapour transport, causing surface warming due to greater humidity and temperature gradients. Results from simulations (Davin and De Noblet-Ducoudré, 2010; Boysen et al., 2020) showed that global surface warming, especially over land and in the tropics, is linked to weaker turbulent exchanges that hinder energy transfer to the atmosphere, increasing outgoing longwave radiation. In addition to the local effects (pertaining to direct effects on the surrounding area) mentioned above, LUC can also induce non-local effects, i.e. broader influence on remote regions via atmospheric circulation changes, or the advection of heat and moisture (Pongratz et al., 2021; Winckler et al., 2019a). Importantly, changes in surface characteristics can differently impact local and non-local temperature changes (Laguë et al., 2019; De Hertog et al., 2023; Pongratz et al., 2021). Albedo changes affecting the amount of shortwave radiation absorbed by the surface have been shown to be important for non-local effects (Breil et al., 2024; Li et al., 2023; De Hertog et al., 2023), whereas ET and surface roughness changes dominate local effects (Pongratz et al., 2021; Duveiller et al., 2018). Although our understanding of the underlying physics has improved, estimates of BGP effects remain inconsistent across modelling studies using Earth system models (ESMs), often differing in magnitude (De Hertog et al., 2023; Winckler et al., 2019b; Arora and Montenegro, 2011), extent (Grant et al., 2023; Santos et al., 2023; Luo et al., 2022), and direction (Devaraju et al., 2018; Pongratz et al., 2010; Pitman et al., 2009), including in regional climate models (Davin et al., 2020).
The BGC effects of LUC are often quantified as losses of carbon stored in vegetation biomass and soil. Alternatively, they are measured through the change in atmospheric CO2 concentration in response to LUC emissions, which contribute to increased radiative forcing in addition to contributions from changes in other GHG fluxes, such as methane, nitrous oxide, and emissions of aerosol precursors. The impact of LUC on the carbon cycle, notably by influencing atmospheric CO2 levels, implies that LUC emissions remain a relevant flux component in global climate dynamics, accounting for about half of all LUC-related GHG emissions (Hong et al., 2021) and 12 % of total anthropogenic CO2 emissions of the last 20 years (Friedlingstein et al., 2023). CO2 emissions from LUC are primarily due to deforestation and conversion of natural vegetation into pasture and cropland, alongside degradation, wood harvest, and the decay of related products, as well as peat drainage and peat burning (Friedlingstein et al., 2022a; Pongratz et al., 2021).
Prior attempts to identify the historical effects of LUC on climate include the Land-Use and Climate, Identification of Robust Impacts (LUCID; Pitman et al., 2009; de Noblet-Ducoudré et al., 2012) project. In LUCID, Pitman et al. (2009) analysed the BGP effects of historical LUC as simulated by several ESMs and attributed inconsistencies across ESMs to their implementation of LUC, the depiction of crop phenology, the parameterization of albedo, and the representation of ET across various types of land cover. Using LUCID datasets, Lejeune et al. (2017) reported higher daytime warming temperatures across regions with forest versus non-forest cover. However, they also revealed the inability of ESMs to capture the observed daytime warming and nighttime cooling effects of deforestation, indicating a need for model refinement. Among other issues, a major shortfall of LUCID was the relatively small sample size of participating ESMs, often leading to inconclusive results (Pitman et al., 2009; de Noblet-Ducoudré et al., 2012). Although LUCID stipulated a clear protocol to implement LUC, it failed to specify the distribution of natural vegetation. As a result, this left the outcome of LUC processes, such as forest conversion (to croplands or pastures), to the discretion of models or modellers (de Noblet-Ducoudré et al., 2012). Additionally, models used varying definitions of the term “forest” and differed in which natural vegetation type was utilized for pasture expansion. The importance of selecting specific rules for modelling land cover changes, particularly with regard to their capacity to accurately reflect the preferential historical conversion of natural, non-forested lands into pastures, was demonstrated by Reick et al. (2013). Their results illustrated how different strategies for modelling pasture expansion – whether preferring natural grasslands or a proportional use of forests and grasslands – can significantly impact global forest coverage. Using simulations performed under the Coupled Model Intercomparison Project Phase 5 (CMIP5), Brovkin et al. (2013) and Boysen et al. (2014) also revealed diverse interpretations of common land-use scenarios across ESMs, especially regarding the allocation of areas for crops and pastures. They showed that the distinct representation of land-use classes across models leads to inconsistencies in the simulation of LUC across the models. Additional differences stemmed from model-specific implementations, with simulations showing diverse responses in land carbon storage driven by LUC due to differences in model assumptions and accounted processes (e.g. the treatment of deforestation biomass, the simulation of fire, CO2 fertilization effect, regrowth after land abandonment, and wood harvest). Empirical evidence (e.g. Reick et al., 2013) suggests that incorporating a rule of preferentially allocating pasture on non-forest land results in a more realistic representation of forest area reduction over time, significantly affecting global carbon emissions and forest cover in specific regions, particularly in the savannas. However, such a rule was not consistent across LUCID and CMIP5 participating models. The disparity in the distribution of natural vegetation made it difficult to interpret the effects of LUC in LUCID and CMIP5 climate projections, highlighting the need for a consistent and comprehensive implementation of land-use processes across ESMs (Reick et al., 2013). The diversity in modelling approaches and adherence to simulation protocols result in varied interpretations and implementations of LUC. While both factors affect the comparability and consistency of outcomes, adherence to protocols offers room for model improvement. In contrast, the diversity in modelling approaches also reflects the inherent uncertainty in model structure and helps to mitigate an illusion of accuracy in resulting estimates.
Against this backdrop, the Land Use Model Intercomparison Project (LUMIP; Lawrence et al., 2016) evolved to provide a unique opportunity to compare the climate impact of LUC in ESMs participating in phase 6 of the Coupled Model Intercomparison Project (CMIP6; Eyring et al., 2016). To better understand the contribution and global warming mitigation potential of LUC, the LUMIP protocol includes a dataset of reconstructed LUC and model diagnostic variables. The LUMIP dataset has proven instrumental in a number of studies, including the detection and attribution of LUC effects (Grant et al., 2023), contribution from different LUC types to temperature effects (Yu and Leng, 2022), localized impacts of LUC (Tang et al., 2023), and LUC impacts on soil carbon (Ito et al., 2020), as well as deforestation- and forestation-induced climate effects (Liu et al., 2023; Luo et al., 2023; Loughran et al., 2023; Li et al., 2022a; Luo et al., 2022; Boysen et al., 2020). Furthermore, LUMIP has been used in regional (Santos et al., 2023; Singh et al., 2020) and LUC-induced global economic inequality studies (e.g. Liu et al., 2022) due to its ability to isolate impacts due to LUC.
Our study utilizes the LUMIP dataset to evaluate how LUC is implemented across LUMIP models, to quantify carbon emissions and near-surface air temperature changes due to historical LUC, and to estimate the relative contribution of both BGP and BGC effects to historical global temperature changes. By doing so, we aim to investigate potential differences in the Earth system response of different ESMs in the controlled LUMIP setup, which offers greater uniformity and comparability across the latest generation of ESMs. This controlled setup is of high relevance, as analyses based on earlier attempts, such as the LUCID and CMIP5 projects, have been limited by inconsistencies across ESMs, such as variations in the implementation of land use and the representation of land cover types through different plant functional types (PFTs). Beyond LUCID and CMIP5, the latest generation of models participating in LUMIP has improved by implementing more land-use processes and land management practices, such as crop irrigation, fertilization of cropland, wood harvest, and residue management. LUMIP aimed at greater consistency across ESMs compared to LUCID and CMIP5 by also employing the latest generation of ESMs, utilizing an updated harmonized land-use dataset including more detail and guidance on implementation (LUH2; Hurtt et al., 2020). Additionally, the number of models contributing to LUMIP is substantially higher; some models have been evaluated across a broad range of objectives (e.g. Grant et al., 2023; Santos et al., 2023; Boysen et al., 2020). Consequently, LUMIP should deliver more robust estimates of BGP and BGC effects and make it possible to identify more comprehensively the magnitude and extent of the model spread in LUC effects. Thus, our study represents a logical next step, bridging the gap between previous studies and advancing our understanding of LUC impacts on climate through the use of LUMIP's specialized simulations.
Leveraging this progress, we analyse the response of near-surface air temperature to both BGP and BGC effects of LUC across ESMs participating in LUMIP. Near-surface air temperature is a model diagnostic that is sensitive to model (land and atmosphere) structure and internal parameterization, indicative of anthropogenic climate change and a key quantity for climate policy. We also analyse the changes in land carbon pools due to LUC, and, using the transient climate response to cumulative emissions (TCRE; Matthews et al., 2009), we estimate the temperature response associated with carbon emissions due to LUC. Furthermore, we investigate the contributions of different regions to global temperature change via the BGC and BGP effects, evaluating the relative importance of BGP and BGC effects in influencing near-surface air temperature. With the inclusion of more land management processes in the models used in LUMIP, our results enhance the understanding of the temperature effects of LUC across state-of-the-art models, extending beyond LUCID and CMIP5 to also underline the significance of historical LUC for future projections.
2.1 Simulation setup
In this study, we utilized two CMIP6 simulations: the historical and hist-noLu experiments. The CMIP6 historical experiment (henceforth historical) is described in Eyring et al. (2016). The historical experiment is a coupled “concentration-driven” simulation that captures the interactions between land, atmosphere, and ocean dynamics. In this simulation, external forcings, including anthropogenic changes in the atmospheric composition (e.g. GHGs and aerosols), solar variability, and volcanic aerosols, are prescribed based on observational data. This setup facilitates the evaluation of the models' capability to reproduce historical climate change, ensures the consistency of climate model forcing and model sensitivity against observational benchmarks, and serves as a foundation for formal detection and attribution studies (Grant et al., 2023; Lawrence et al., 2016). The LUMIP historical with no land-use change experiment (henceforth, hist-noLu) also aligns with the CMIP6 historical concentration-driven experiment but with a notable exception: land use and land cover remain static at their pre-industrial levels (here, 1850) akin to the CMIP6 pre-industrial control (piControl) simulation (Lawrence et al., 2016). In simpler terms, land use and land management were kept constant at their 1850 level throughout the simulation period, which resulted in no change in the prescribed distributions of cropland, pastureland, different crop types, land management practices, and wood harvesting, among other factors. If changes in the coverage of natural vegetation occurred in the hist-noLu simulation, this was due to an ESM representing dynamics in the biogeographic distribution of natural vegetation types (if represented by the respective ESM) and not due to LUC.
The hist-noLu simulation is counterfactual to the historical simulation, as the latter includes the observed evolution of historical land use and climate based on the land-use harmonization 2 dataset (LUH2; Hurtt et al., 2020). The provision of both the historical and hist-noLu simulations is imperative to achieving the LUC separation and thus serves as the primary criterion for selecting the ESMs used in this study. Differences in climate between the historical and hist-noLu concentration-driven setups can be attributed exclusively to differences in the physical properties of the land surface caused by LUC (Boysen et al., 2020). For models with a full land carbon cycle, this setup also permits the isolation of the land CO2 fluxes as they are disturbed by LUC. Note that, because the historical and hist-noLu simulations prescribe the same CO2 concentration, the altered land CO2 fluxes correspond directly to the widely used net LUC flux or, more colloquially, “land-use emissions” (Friedlingstein et al., 2023). However, because environmental conditions other than atmospheric CO2 concentration, such as climate, are simulated differently in the historical and hist-noLu simulations, the BGP effects of LUC influence climate and trigger BGP feedback loops, which in turn affect plant growth and decomposition rates only in the historical simulation (Pongratz et al., 2014). These effects, however, are minor compared to the impact of atmospheric CO2 concentration on global carbon fluxes and can cancel out on a global scale (Pongratz, 2009). By contrast, if two emission-driven simulations with and without historical LUC were compared to each other, the resulting “land-use feedback” would increase the atmospheric CO2 in the simulation with LUC over and above that due to increased fossil fuel emissions (Pongratz et al., 2014; Arora and Boer, 2010). The change in climate in these two simulations would thus result from both changes in land cover (the BGP effect) and the differences in atmospheric CO2 concentration (the BGC effect). The increased atmospheric CO2 in the experiment with LUC would also stimulate plant growth, thus reducing the estimated LUC emissions derived from the experiment (Pongratz et al., 2010).
We combine the estimated land-use emissions (based on the concentration-driven simulations) with model-specific TCRE values to transform the land-use emissions into the BGC effect on climate (see Sect. 2.3.2). Our analysis of BGC effects is restricted to carbon and does not include the effect of other non-CO2 GHG fluxes. This is due to the fact that most ESMs still lack the capability to model fluxes such as N2O, CH4, and other GHGs (Resplandy et al., 2024; Chang et al., 2021). The climate effect of these fluxes is, however, included in the forcing of the concentration-driven runs for the historical and hist-noLu simulations.
2.2 Model description
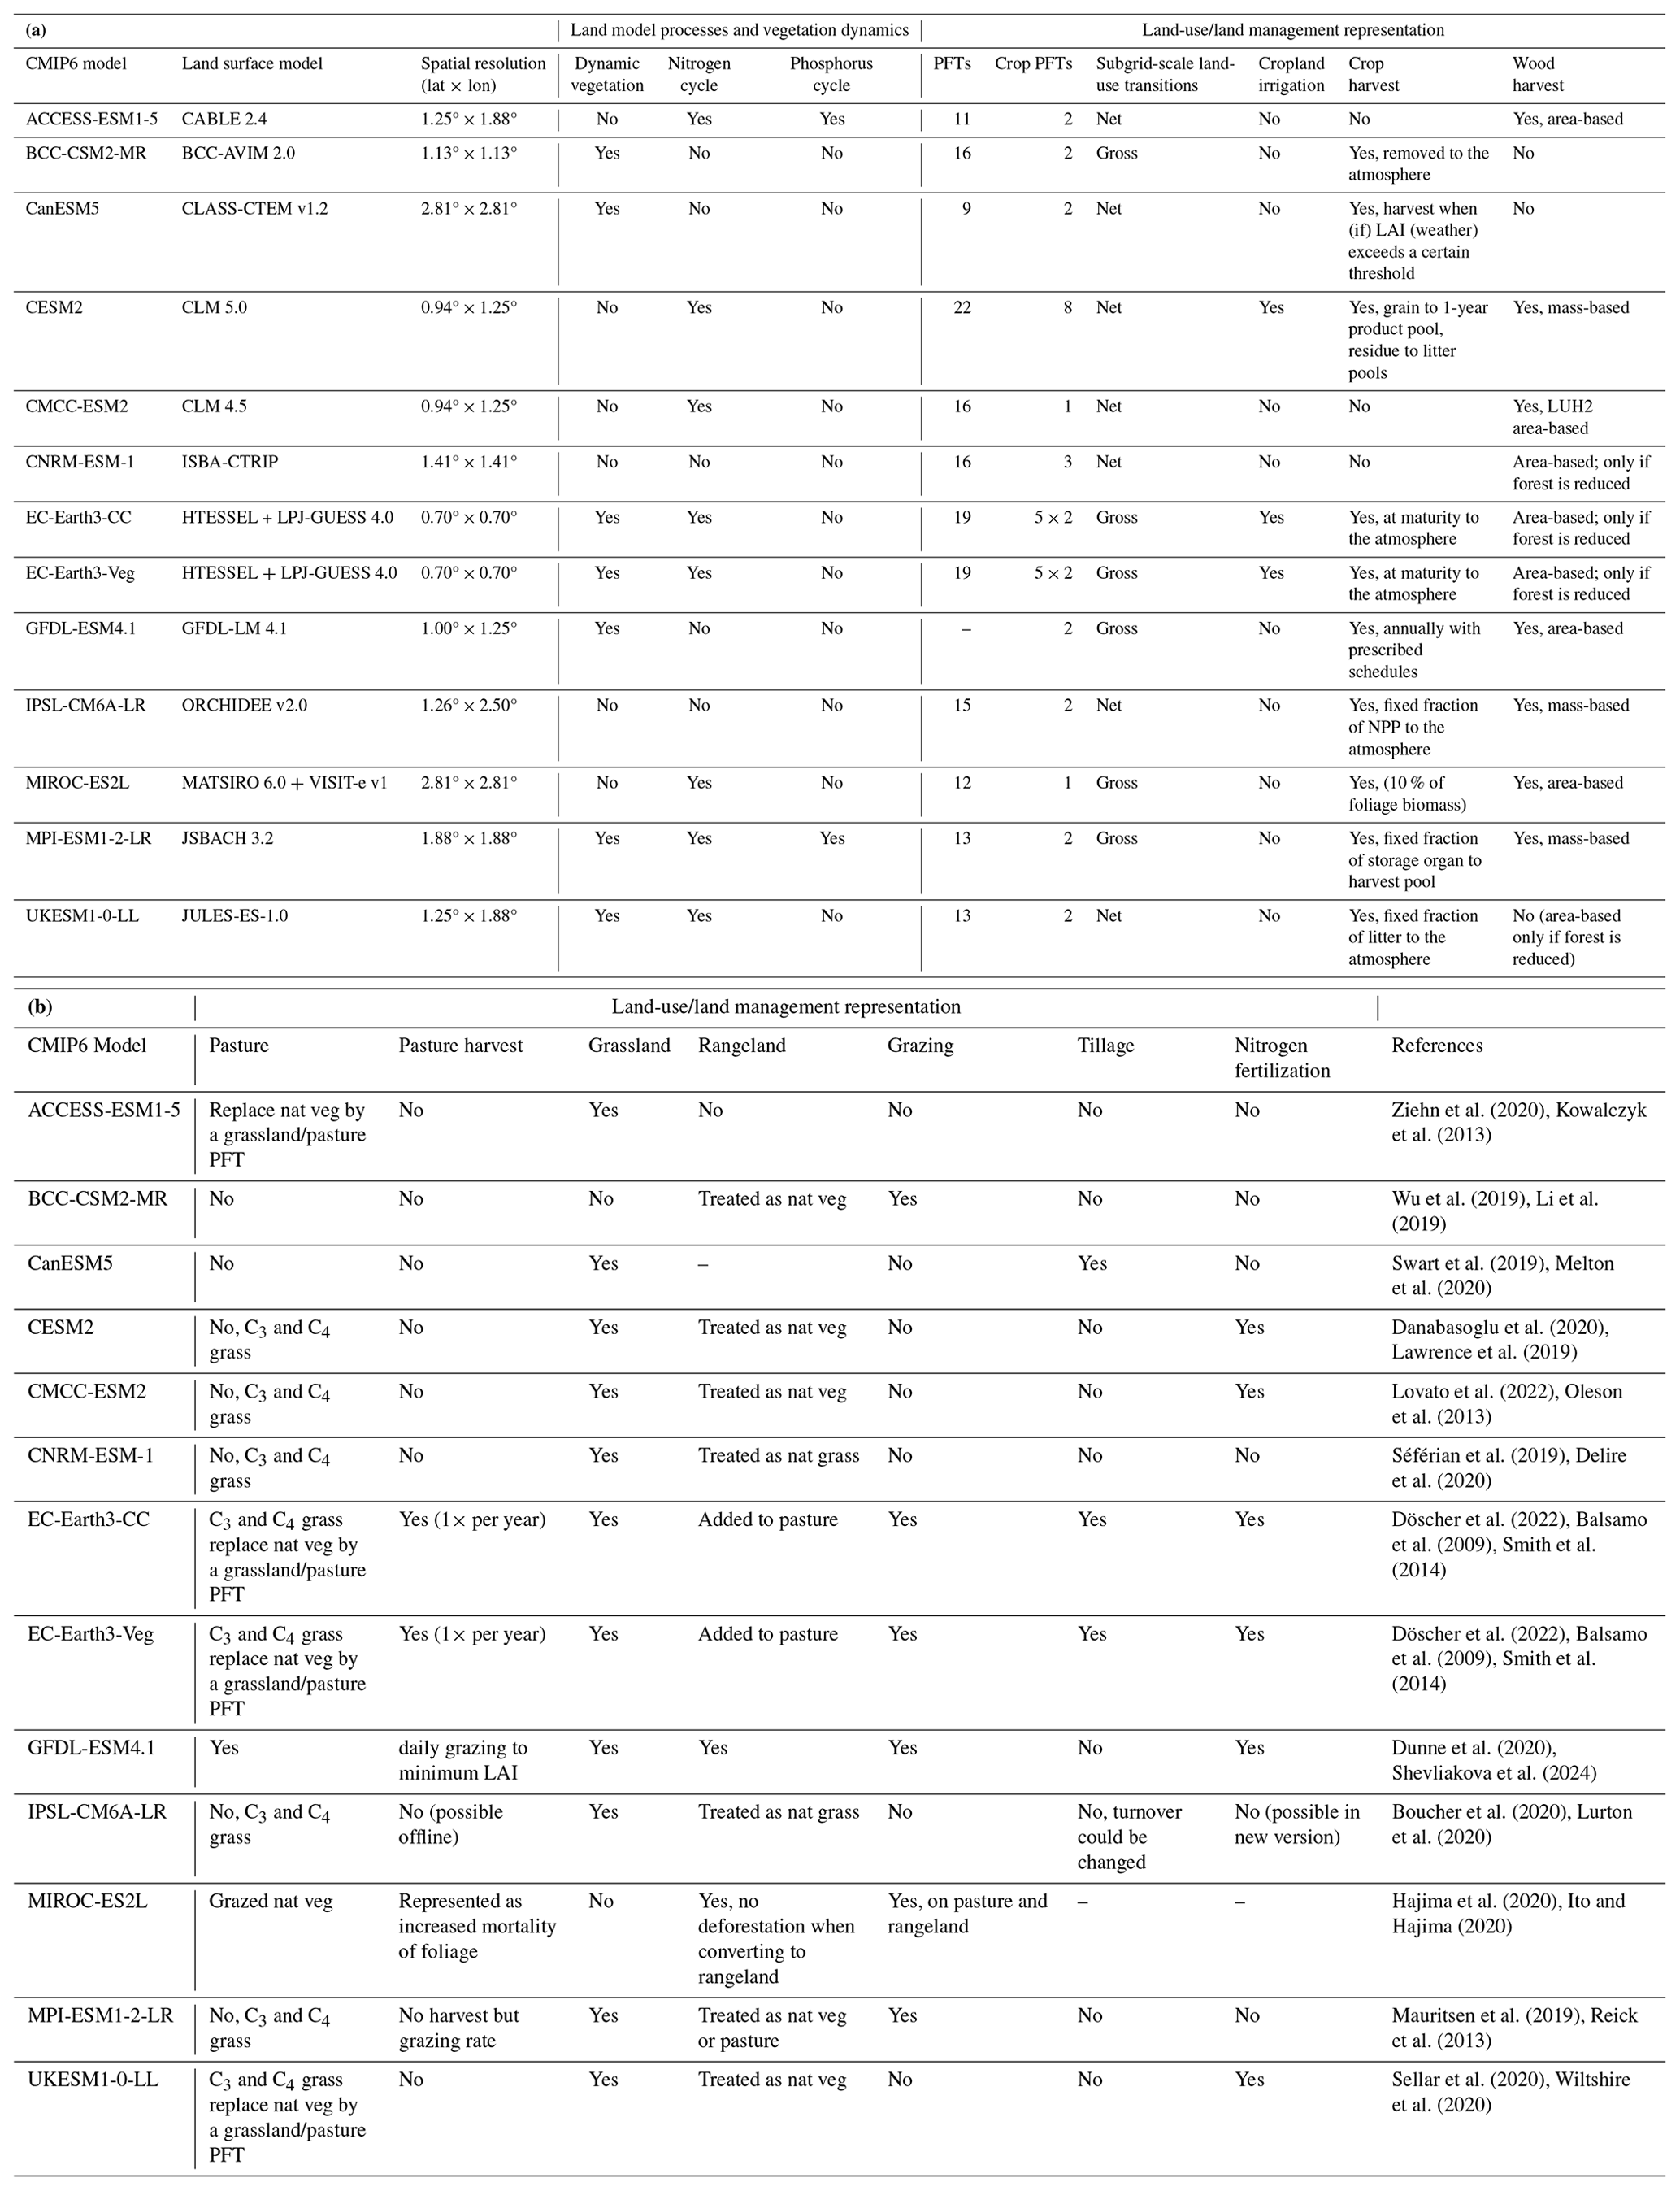
Determined by model output availability, our analysis considered data from the 13 ESMs that provide data for both the historical and hist-noLu simulations: ACCESS-ESM1-5 (Ziehn et al., 2020), BCC-CSM2-MR (Li et al., 2019), CanESM5 (Swart et al., 2019), CESM2 (Danabasoglu et al., 2020), CMCC-ESM2 (Lovato et al., 2022), CNRM-ESM2-1 (Delire et al., 2020; Séférian et al., 2019), EC-Earth3-CC and EC-Earth3-Veg (Döscher et al., 2022; Hazeleger et al., 2012), GFDL-ESM4 (Dunne et al., 2020), IPSL-CM6A-LR (Boucher et al., 2020; Lurton et al., 2020), MIROC-ES2L (Hajima et al., 2020), MPI-ESM1.2-LR (Mauritsen et al., 2019), and UKESM1-0-LL (Sellar et al., 2019). For ease of in-text reference, we hereafter refer to these models as ACCESS, BCC, CanESM5, CESM2, CMCC, CNRM, EC-Earth3-CC, EC-Earth3-Veg, GFDL, IPSL, MIROC, MPI, and UKESM, respectively. Despite some ESMs providing multiple ensemble members for both simulations, we used only one member per ESM, at a monthly time step, to ensure equal contribution from each model. Specifically, we used the variant label r1i1p1f1 or the next-lowest variant number if r1i1p1f1 was not available. For brevity, only salient features, such as the implementation of land model processes, vegetation dynamics, and land-use change processes in the ESMs pertinent to this study, are outlined in Table 1. For comprehensive specifications of each model, readers are directed to the respective primary literature (see references in Table 1). The data for both the historical and hist-noLu simulations was retrieved from the Earth System Grid Federation (ESGF; https://www.esgf-data.dkrz.de/, last access: 14 August 2023).
Due to the model structure, clear distinctions but also commonalities exist between how ESMs treat land management. While the LUMIP protocol specifies the LUH2 dataset to be used, its implementation across ESMs still depends on the individual model architecture. For example, in the treatment of pasture, for both EC-Earth3 models, rangeland is treated as managed pasture, not allowing any shrubs or trees to grow. In UKESM, rangeland from LUH2 is not utilized, and pasture PFTs are duplicates of natural grasses with no representation of management; pasture and total crop area from LUH2 are passed to the dynamic vegetation scheme, and changes in these drivers result in changes in the areas of natural, crop, and pasture PFTs. In estimating land-use emissions, a handful of the ESMs (CESM2, CMCC, and MIROC) utilize the LUH distinction between primary and secondary land area, while others (ACCESS and IPSL) sum the LUH primary and secondary land fractions such that changes in primary and secondary land area fractions correspond to those of simulated ecosystem land areas (e.g. forests, grasslands). In the computation of the carbon stored in land (cLand), for a few models (BCC, CanESM5, and CESM2), land carbon pools include the contribution from carbon stored in litter (cLitter), soil (cSoil), and vegetation (cVeg) pools. For IPSL, MIROC, MPI, and the EC-Earth3 models, this also includes carbon stored in wood products (cProduct). UKESM does not simulate litter pools, but it incorporates cProduct into cVeg and cSoil. In addition to the main carbon pools (cLitter, cSoil, and cVeg), the cLitter component of CESM2, CMCC, and the EC-Earth3 models also incorporates carbon pools from coarse woody debris, while ACCESS additionally includes a labile carbon pool (i.e. a small fraction of soil carbon that is decomposed at timescales of days). In CanESM5, some of the removed biomass is burned, while the rest is distributed into cLitter and cSoil. The CESM2 model, however, distributes removed biomass between the product and litter carbon pools, while the rest is released into the atmosphere. In CMCC and MIROC, removed biomass is transferred to the product carbon pools, while, across the EC-Earth3 models, fractions of aboveground biomass are transferred to surface litter, product pools, and the atmosphere. For IPSL, woody aboveground biomass is removed to three product carbon pools, each with different residence times, before being released into the atmosphere. In UKESM, an approximation of aboveground carbon is removed to three product pools with varying decay rates, with woody PFTs contributing more to the slowly decaying product pools. The EC-Earth3 models also have two product pools with different residence times. Generally, the partitioning of biomass into these product pools across different models is determined by the type of material, such as PFT specificity, stem, and coarse roots. For instance, stems and coarse woody roots typically contribute to pools with longer residence times due to their slower decay rates, while finer materials, such as leaves and fine roots, decompose more quickly and are assigned to pools with shorter residence times. This material-specific partitioning ensures that each model can accurately simulate the carbon dynamics by accounting for the varying decomposition rates and the eventual release of carbon back into the atmosphere. In this configuration, in UKESM, for example, the stem component of vegetation carbon arguably includes big roots, while the root component only represents fine roots; in the absence of explicit litter carbon pools, fine-root carbon is directly added to the soil carbon pools. Further details on model-specific carbon pool representations are available in the Supplement.
In the absence of observational data, the plots and tables included in this study include reference data from the Global Carbon Budget 2023 (GCB2023; Friedlingstein et al., 2023) whenever possible. In the GCB, land-use emissions are simulated by three bookkeeping models, which are semi-empirical models that combine LUC reconstructions with information on carbon densities for different vegetation types and specific regrowth and decay curves to simulate changes in vegetation, soil, and product carbon pools. Since much of this information is based on observational data or multi-model means, the GCB estimates can be considered an independent benchmark for comparison and are likely more consistent with observations than the ESM estimates. A direct comparison to carbon pools or fluxes is not possible, since observational data comprise both natural and anthropogenic effects, such that the LUC effects alone are not separable (Pongratz et al., 2010). To contrast the change in land carbon between the year 1850 and the present, we compare the spread across the LUMIP estimates of carbon stored in soil (cSoil) and vegetation (cVeg) with estimates of dynamic global vegetation models (DGVMs) from the Trends and drivers of the regional-scale sources and sinks of carbon dioxide (TRENDY v11; Sitch et al., 2015) simulations (http://sites.exeter.ac.uk/trendy/, last access: 11 November 2023). In total, 16 TRENDY models were used (see Table S1 in the Supplement). Configuration details of the TRENDY simulations can be found in Sitch et al. (2015) and Obermeier et al. (2021). Land-use change in the TRENDY models is computed by contrasting the S2 simulation (simulation without land-use change) and the S3 simulation (simulation with land-use change) of the respective models. The TRENDY-S3 simulation uses a similar land-use forcing to the LUMIP simulations, i.e. the land-use harmonization dataset (LUH2; Hurtt et al., 2020), though in updated form (Friedlingstein et al., 2023; Chini et al., 2021). Some of the TRENDY models also serve (though partly in older model versions) as land models of some ESMs used in this study.
Ziehn et al. (2020)Kowalczyk et al. (2013)Wu et al. (2019)Li et al. (2019)Swart et al. (2019)Melton et al. (2020)Danabasoglu et al. (2020)Lawrence et al. (2019)Lovato et al. (2022)Oleson et al. (2013)Séférian et al. (2019)Delire et al. (2020)Döscher et al. (2022)Balsamo et al. (2009)Smith et al. (2014)Döscher et al. (2022)Balsamo et al. (2009)Smith et al. (2014)Dunne et al. (2020)Shevliakova et al. (2024)Boucher et al. (2020)Lurton et al. (2020)Hajima et al. (2020)Ito and Hajima (2020)Mauritsen et al. (2019)Reick et al. (2013)Sellar et al. (2020)Wiltshire et al. (2020)Table 1(a) CMIP6 models used in this study and their implementation of land-use processes. The columns indicate whether the model's land surface component has representations of dynamic vegetation (biogeographic shifts in vegetation types in response to environmental changes), nitrogen cycle, phosphorus cycle, subgrid-scale land-use transitions (referring to changes in land use that occur within a smaller area than the grid cell), irrigation of croplands, crop harvest, and wood harvest. NPP refers to net primary productivity, and PFT refers to plant functional type. (b) Similar to (a) but with additional details. The columns indicate whether the model's land surface component has representations of grazing, rangeland, pasture, tillage, nitrogen fertilization, and shifting cultivation. PFT refers to plant functional type, nat veg refers to natural vegetation, and LAI refers to leaf area index. The changes (by percentage area) in tree cover, crop cover, natural grassland, and pasture across the individual models are shown in Figs. S13–S16.
2.3 Data analysis and statistical methods
2.3.1 Isolating land-use change effects
The difference in near-surface air temperature between the historical and hist-noLu simulations is used here to isolate the BGP effect on temperature attributable to LUC. For each model, we express the change in near-surface air temperature as
where T is the near-surface air temperature (CMIP6 variable: tas), ΔTbgp is the temperature change due to BGP effects of LUC as a function of time (t) in the grid cell (x), and the index n indicates the nth model. The equation is valid for the quantification of the global mean response and for the temperature change from LUC at any given grid cell. Similarly, the contrast in carbon pools between the historical and hist-noLu simulations yields the BGC effect on carbon attributable to LUC:
where ΔC is the change in any of the carbon pools (cLand, cLitter, cSoil, and cVeg) due to LUC. We used the cLand variable for our analysis of LUC, and, where not available, cLand was computed as a summation of cLitter, cSoil, and cVeg. For IPSL, this also includes cProduct.
2.3.2 Global temperature response to land-use change
To quantify the temperature response from the change in land carbon stocks, we use an approximation by the transient climate response to cumulative emissions (TCRE; see Gillett et al., 2013; Matthews et al., 2009). TCRE is expressed as the ratio of the transient climate response (TCR) to cumulative fossil fuel emissions (Leduc et al., 2016; Matthews et al., 2009), where TCR is defined as the global temperature change at the time of CO2 doubling in a simulation with a 1 % per year compounded CO2 increase (1pctCO2 simulation in CMIP6). TCR is computed as the change in the global average surface temperature over 20 years, centred at CO2 doubling (years 60 to 79 in the 1pctCO2 simulation), relative to the same period in the pre-industrial control simulation and smoothed with a 140-year linear fit to correct for residual drift (Meehl et al., 2020). While TCR focuses on the radiative response of temperature to increased atmospheric CO2 concentrations, TCRE additionally considers the dynamics of land and ocean carbon sinks, which influence the amount of cumulative fossil fuel emissions necessary to double atmospheric CO2 concentrations. TCRE identifies the amount of global warming (ΔT) per unit of cumulative fossil fuel emission at the time of atmospheric CO2 concentrations doubling relative to the pre-industrial baseline in the 1pctCO2 simulation, expressed as °C Eg C−1 (where 1 exagram of carbon = 1018 g C). Empirical studies (e.g. Leduc et al., 2016, 2015; Gillett et al., 2013; Matthews et al., 2009) have consistently shown that the TCRE is approximately constant over time and independent of the emission trajectory, underscoring a near-linear relationship between cumulative CO2 emissions and global temperature change. Furthermore, the spatial pattern of temperature change per degree of global warming has been shown to remain approximately constant with increasing global mean temperature (GMT) (Gillett et al., 2013). In prior research, Arora et al. (2020) identified TCRE ratios for an array of CMIP6 models, from which we retrieve the TCRE value for each model used in this study, adding the TCRE for CMCC-ESM2 derived by Lovato et al. (2022). For the two EC-Earth3 models, no TCRE values are available from the literature; thus, we exclude them from the TCRE analysis. As applied across earlier studies (e.g. Kondo et al., 2022; Boysen et al., 2020; Leduc et al., 2016; Boysen et al., 2014), we integrated the derived TCRE metrics with changes in land carbon fluxes (ΔcLand) to estimate the temperature response to the change in land carbon fluxes. For each model, we express the global mean temperature response as
where is the global near-surface air temperature change due to BGC effects of LUC; is the diagnosed value of each model's global cumulative CO2 emissions from LUC, calculated as the total change in the land carbon content between the historical and hist-noLu simulations; and the TCRE value is obtained for each model from Arora et al. (2020) and Lovato et al. (2022). The overline indicates globally averaged values. The minus sign accounts for the fact that a decrease in land carbon content (ΔC, estimated from Eq. (2) on the grid cell level and then summed globally) corresponds to an increase in atmospheric carbon content and thus to a temperature increase.
Given that the regional patterns of temperature change scale approximately linearly to the cumulative CO2 emissions (Leduc et al., 2016, 2015; Matthews et al., 2009), we use this to create a spatial pattern associated with the global mean temperature change due to the BGC effects (Eq. 3). For this purpose, we utilized a simple linear regression to obtain the regional-to-global ratio of temperature for each model, a process also known as simple pattern scaling (Mitchell, 2003; Tebaldi and Arblaster, 2014):
Here, the slope a represents the regional-to-global ratio of temperature at each grid cell, and represents the global mean temperature (GMT) for each model. We use data from the 1pctCO2 simulation for a period ranging between 150 to 165 simulation years, depending on the model, to estimate both the GMT and the grid cell temperature with which the slope was derived. The estimated grid cell slope, a(n,x), is hereafter combined with (n,t) to quantify the temperature response to the BGC effects for each model and each grid cell over time:
2.3.3 Grid cell contributions to global temperature change
We further attempt to distinguish between the grid cell temperature contribution to global temperature change and the grid cell temperature effect. The temperature contribution quantifies how much an individual grid cell's LUC adds to the global temperature signal, highlighting the spatial sources that contribute most substantially to the global temperature change pattern. In contrast, the temperature effect measures how the climate in each specific location is affected by global LUC, allowing us to assess localized impacts. Providing both quantities thus enables us to understand both the aggregate impact of LUC on global temperature and the specific local climate response to global LUC. The underlying carbon stock changes in a grid cell are driven foremost by the LUC within that specific grid cell because our experimental setup isolates the effect of LUC by comparing two scenarios: historical and hist-noLu. By design, observed differences in carbon stocks in a given grid cell are directly attributable to the local LUC imposed in that cell, since this is the only variable altered between the two experiments. Therefore, the primary driver of carbon stock changes in each grid cell is the local LUC, as the experimental approach controls for other influences on carbon stocks.
We quantify the grid cell contribution to the global signal by estimating how carbon emissions in each grid cell due to historical LUC contribute to the estimated global BGC-induced temperature change. For this purpose, we multiply the change in land carbon due to LUC for each model and in each grid cell with each model's TCRE value:
differs from ΔTbgc estimated in Eq. (5), as the former quantifies the contribution of carbon emissions due to LUC in each grid cell to the global temperature change, while the latter quantifies the local temperature change caused by the total global carbon emissions due to LUC.
Finally, to estimate how the BGP effects in each grid cell contribute to the global BGP-induced temperature change, we multiply the grid cell estimated temperature change, , by the grid cell weighted area, where the grid cell weighted area is expressed as the ratio of the grid cell area, Agrid, for each model (n) to the Earth's surface area (ASFC). We express each grid cell's BGP contribution as
2.3.4 Descriptive statistics
We applied Eqs. (1) through (7) to the spatial fields of each CMIP6 model (differentiating between grid cell and global metrics) and subsequently computed the ensemble statistics for 13 models and 11 models for the BGP and BGC estimates, respectively. We excluded EC-Earth3-CC and EC-Earth3-Veg from the analysis of the BGC effects, as the ocean component needed to estimate the TCRE value is missing in the former, while the latter has no fully activated C cycle. All spatial representations in this study depict the mean over the last 3 decades of the historical and hist-noLu simulations (spanning 1985 to 2014) for both climate and carbon metrics, whereas temporal plots are presented as a 10-year running average. To distinguish the BGP effects from internal climate variability, we employ the modified Student's t test adjusted for spatial auto-correlation (Lorenz et al., 2016; Zwiers and von Storch, 1995) to identify grid cells with statistically significant changes at the 5 % significance level. For the temperature change due to the BGC effects, we used a one-sample t test with the 1pctCO2 simulation to identify grid cells that are statistically significant at the 5 % significance level. For the BGP analysis, spatial maps and estimates are computed as the mean of 1985–2014, while, for the BGC analysis, we used the value at the end of the simulation period (the year 2014), which represents the cumulative emissions from 1850–2014. Evidenced by previous studies (e.g. Hajima et al., 2025; Séférian et al., 2020; Gier et al., 2020; Collier et al., 2018), we interpret the multi-model mean across ESMs as the most accurate representation of the global estimates, while the standard deviation across the model estimates delineates the associated inter-model uncertainty. The signal-to-noise ratio was computed by dividing the multi-model mean by the standard deviation across the models, whereas the model agreement was computed by summing the direction of change (+1 or −1) of individual grid cells across all models. For spatial multi-model representations, we interpolated the results of each model using Climate Data Operators (CDO; Schulzweida, 2023) onto a uniform grid, using a spatial resolution already common to some of the ESMs: 0.94° × 1.25° (latitude × longitude). For extensive variables, such as land-use emissions, we used conservative remapping with the remapcon function to preserve the integrals of the global totals (Jones, 1999). For intensive variables, such as temperature, we used bilinear interpolation with the remapbil function to preserve the mean values.
3.1 Contribution of carbon pools to cumulative land emissions
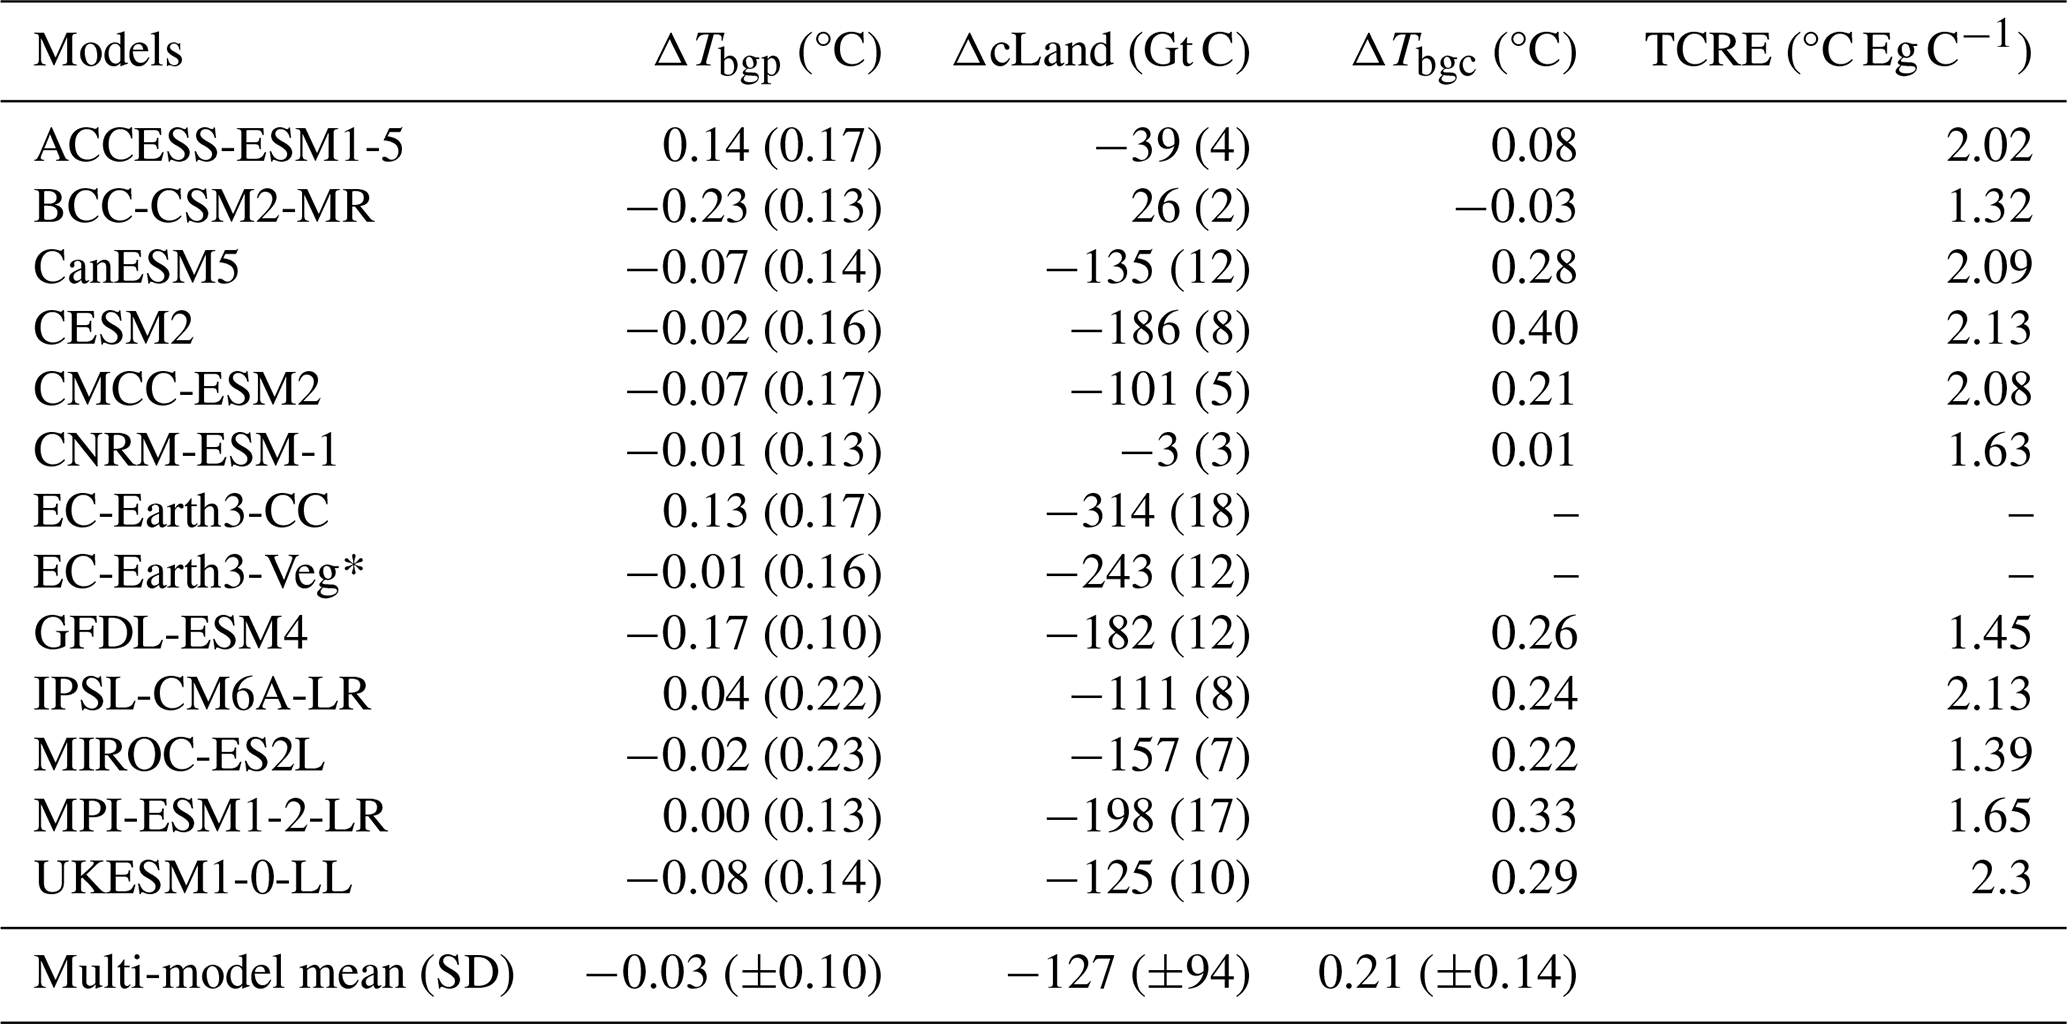
The global multi-model mean carbon loss due to historical LUC is Gt C cumulatively over the period 1850–2014 (Table 2). The upper bound aligns with reference values in GCB2023 (Friedlingstein et al., 2023), providing a useful comparison. However, the spread in the magnitude of LUC emissions among the ESMs is immediately apparent, with five ESMs – MIROC, CMCC, GFDL, CESM2, and EC-Earth3-Veg – yielding estimates very close to those in GCB2023 (Fig. 1a). Out of the considered ESMs, the EC-Earth3-CC model simulated the largest historical decrease in total land carbon with up to 314 Gt C in carbon loss, whereas CNRM shows the smallest decrease in land carbon of about 3 Gt C. By contrast, BCC is the only model simulating a gain in land carbon due to historical LUC of about 26 Gt C.
In examining the trajectories of total land carbon change, ΔcLand, we observe considerable variation in how ESMs simulate changes in land CO2 fluxes (Fig. 1a). However, some models follow similar patterns that likely reflect underlying similarities in their representation of land-use processes. For instance, annual LUC emissions of CanESM5, CMCC, IPSL, and UKESM are very similar (Fig. 1c), which might reflect that these models share a common approach: all of them implement net subgrid transitions, explicitly consider explicit grassland simulations, and do not represent pasture or grazing. Models that implement net subgrid transitions, such as these, share a simplified method for representing land-use change by focusing on the net effect of transitions within a grid cell, rather than tracking all individual land-use conversions. This can lead to more uniform estimates of land carbon fluxes across models by smoothing over offsetting transitions and reducing variability associated with land turnover. Moreover, focusing on grassland ecosystems rather than pasture or grazing may standardize the carbon flux response in these models, as grasslands generally have different carbon storage and release patterns than managed lands such as pastures. Consequently, these shared characteristics could explain the observed alignment in land CO2 flux trajectories by prompting a similar response to LUC across these models. Boysen et al. (2020) also suggest that such model configurations can significantly influence land carbon dynamics, thereby explaining the observed similarity. The GCB2023 multi-model decadal estimates of land carbon emissions from the 1960s to the 2000s, included in Fig. 1c, also show that our multi-model mean estimate lies inside the uncertainty range of the decadal mean estimates; only a few ESMs with low (BCC, CNRM, ACCESS) and very high (EC-Earth3-CC) LUC emission rates – about one-third of the ESMs – fall outside the GCB2023 uncertainty range. While the long-term (cumulative) emissions from LUC are captured reasonably well by the ESMs, as shown in Fig. 1a, the annual and decadal emission estimates in Fig. 1c align more closely with the GCB2023 estimates. This closer alignment is due to annual (decadal) estimates being more responsive to recent changes in land-use practices, policies, and socio-economic conditions, such as deforestation and agricultural expansion. In contrast, long-term (cumulative) estimates smooth out year-to-year variations, which can obscure recent trends and compound discrepancies over time.
The increase in ΔcLand in BCC (Fig. 1a) results from a carbon gain due to LUC and can be partly traced to increasing carbon content in its litter and soil carbon pools (Figs. S1b–c and S3–S5), whereas vegetation carbon (ΔcVeg) shows an almost steady decrease in line with (though smaller than) the other models (Figs. S1a and S2). Boysen et al. (2020) reported an increasing trend in ΔcVeg for BCC over the temperate regions outside deforested areas, where cooling and precipitation increases overlap, leading to a higher gross primary productivity. This disparity may suggest that, while BCC shows a decrease in ΔcVeg globally, specific regional differences exist, and such an increase in temperate areas could indicate a complex interaction between land carbon pool treatments in BCC and regional climate dynamics over the Northern Hemisphere. Additionally, carbon transfer in BCC, from deforested carbon to soil carbon pools instead of the atmosphere, could account for the simulated increase. Similarly to BCC, the small ΔcLand change also in CNRM arises from contrasting changes in its contributing pools: specifically, a decrease in ΔcVeg contrasts with increases in both the litter and soil carbon pools. In CNRM, grasses with a higher root-to-shoot ratio contribute more belowground litter than trees, leading to accumulation in soil carbon pools (Boysen et al., 2020, 2021). This is in addition to crop harvest not being represented in CNRM, which could lead to overestimation in its cLitter. For all models except BCC and CanESM5, changes in the total land carbon due to LUC are primarily driven by changes in cVeg across most grid cells (Figs. 1a and S1). In contrast, for BCC and CNRM, changes in cLand are predominantly influenced by changes in cSoil, with both models simulating an increase in cSoil due to LUC.
Table 2Changes in global mean near-surface air temperature (T, in °C) and global ΔcLand (sum of ΔcSoil, ΔcVeg, and ΔcLitter) due to biogeophysical (BGP) and biogeochemical (BGC) impacts of land-use change for the 13 Earth system models (ESMs) considered in this study. Values in parentheses denote the standard deviation, estimated as the global spread across each ESM (1985–2014) and as the global model spread across the set of ESMs in the multi-model mean. The standard deviation for ΔTbgc is less than 0.01 for all the models and is therefore not included. TCRE values for CMCC-ESM2 are obtained from Lovato et al. (2022) and for all other models from Arora et al. (2020). The multi-model mean and standard deviation are computed across the set of ESMs. The model marked * (EC-Earth3-Veg*) is excluded from the multi-model mean of ΔcLand because it has no fully activated carbon cycle. For the two EC-Earth3 models, no TCRE values are available from the literature; hence ΔTbgc was not computed for these models.
We now focus on the spatial patterns of ΔcLand and provide additional details of the different carbon pools contributing to the total land carbon in the Supplement. Collectively, the ESMs spatially depict a widespread depletion in cLand (Fig. 2a), a pattern that is more obvious over certain regions. Specifically, there is substantial and spatially coherent depletion in ΔcLand across regions spanning western to eastern Africa, the eastern US, southern Brazil, and southeastern Asia (Fig. 2a). The inter-model variability among ESMs (Fig. 2b) reveals a pattern: regions with noticeable inter-model variability correspond to regions registering peak losses in cLand. There is a high signal-to-noise ratio (Fig. 2c) over regions with large changes in cLand, albeit with magnitude variations across ESMs (Fig. S2). This is corroborated by the inter-model agreement (Fig. 2d), which shows general agreement in the direction of change in land CO2 fluxes in the regions that exhibit large changes in land carbon content. While overarching commonalities may exist across ESMs in regions impacted by LUC, disparities exist in the specifics, distribution, and intensities. This reflects the complexity of LUC impacts, which can both sequester (e.g. forestation) and release (e.g. deforestation) carbon. For example, CNRM and BCC show pronounced increase in ΔcLand over several regions, whereas models such as ACCESS and CMCC show more muted changes (Fig. S2), with the muted changes in ACCESS likely due to low representation of land management practices, among other reasons. The EC-Earth3 models show a loss in cLand, which is stronger than the other models evaluated. Over the polar regions, MIROC and IPSL show clear changes, while others, such as CMCC and UKESM, have no noticeable changes. Over Africa and Australia, responses also vary among models, with models such as MIROC and MPI depicting more obvious changes compared to ACCESS, BCC, and CNRM. Some ESMs, including EC-Earth3-CC, EC-Earth3-Veg, GFDL, and UKESM, reveal obvious carbon pool reduction over Siberia (Fig. S2), a signal ambiguous across other models. Additionally, while both BCC and CNRM distinctly simulate an increase in land carbon storage over North America (a trend also mirrored in their simulation of ΔcSoil), BCC is the only model indicating an increase in ΔcLand in that region (Figs. 1a, c, and S2).
Furthermore, while the decrease in ΔcLand for CanESM5 is attributable to the decrease in ΔcVeg and ΔcSoil, similarly to most models (while ΔcLitter shows an increase), the decrease in ΔcSoil is stronger and much steeper beyond 1900 relative to the other models. Except for BCC and CNRM, tropical changes dominate the decline in land carbon: a change mirrored in distribution (mid-latitudes) and direction (increase) in both BCC and CNRM (Figs. S2 and S3). In models such as CESM2 and GFDL, a decrease in the ΔcLand is already visible at the start of the simulation (not shown), a decrease disproportionate across other models, and we attribute this to models' treatment of pre-1850 land use. Notwithstanding these differences, our estimates of ΔcVeg and ΔcSoil fall within the range simulated across DGVMs (grey shading in Fig. S1), capturing most individual model estimates. In exploring these differences, we note that, while a handful of models indicate ΔcLand estimates to be equal to the sum of changes in the cVeg, cSoil, and cLitter pools, this is not consistent across all the models, giving rise to what we prefer to term “residuals” (Fig. S12). For some ESMs, this residual is equal to the carbon stored in the product pools (cProduct; see Fig. S1c), while, for others, it is non-existent, reflecting how different models implement LUC.
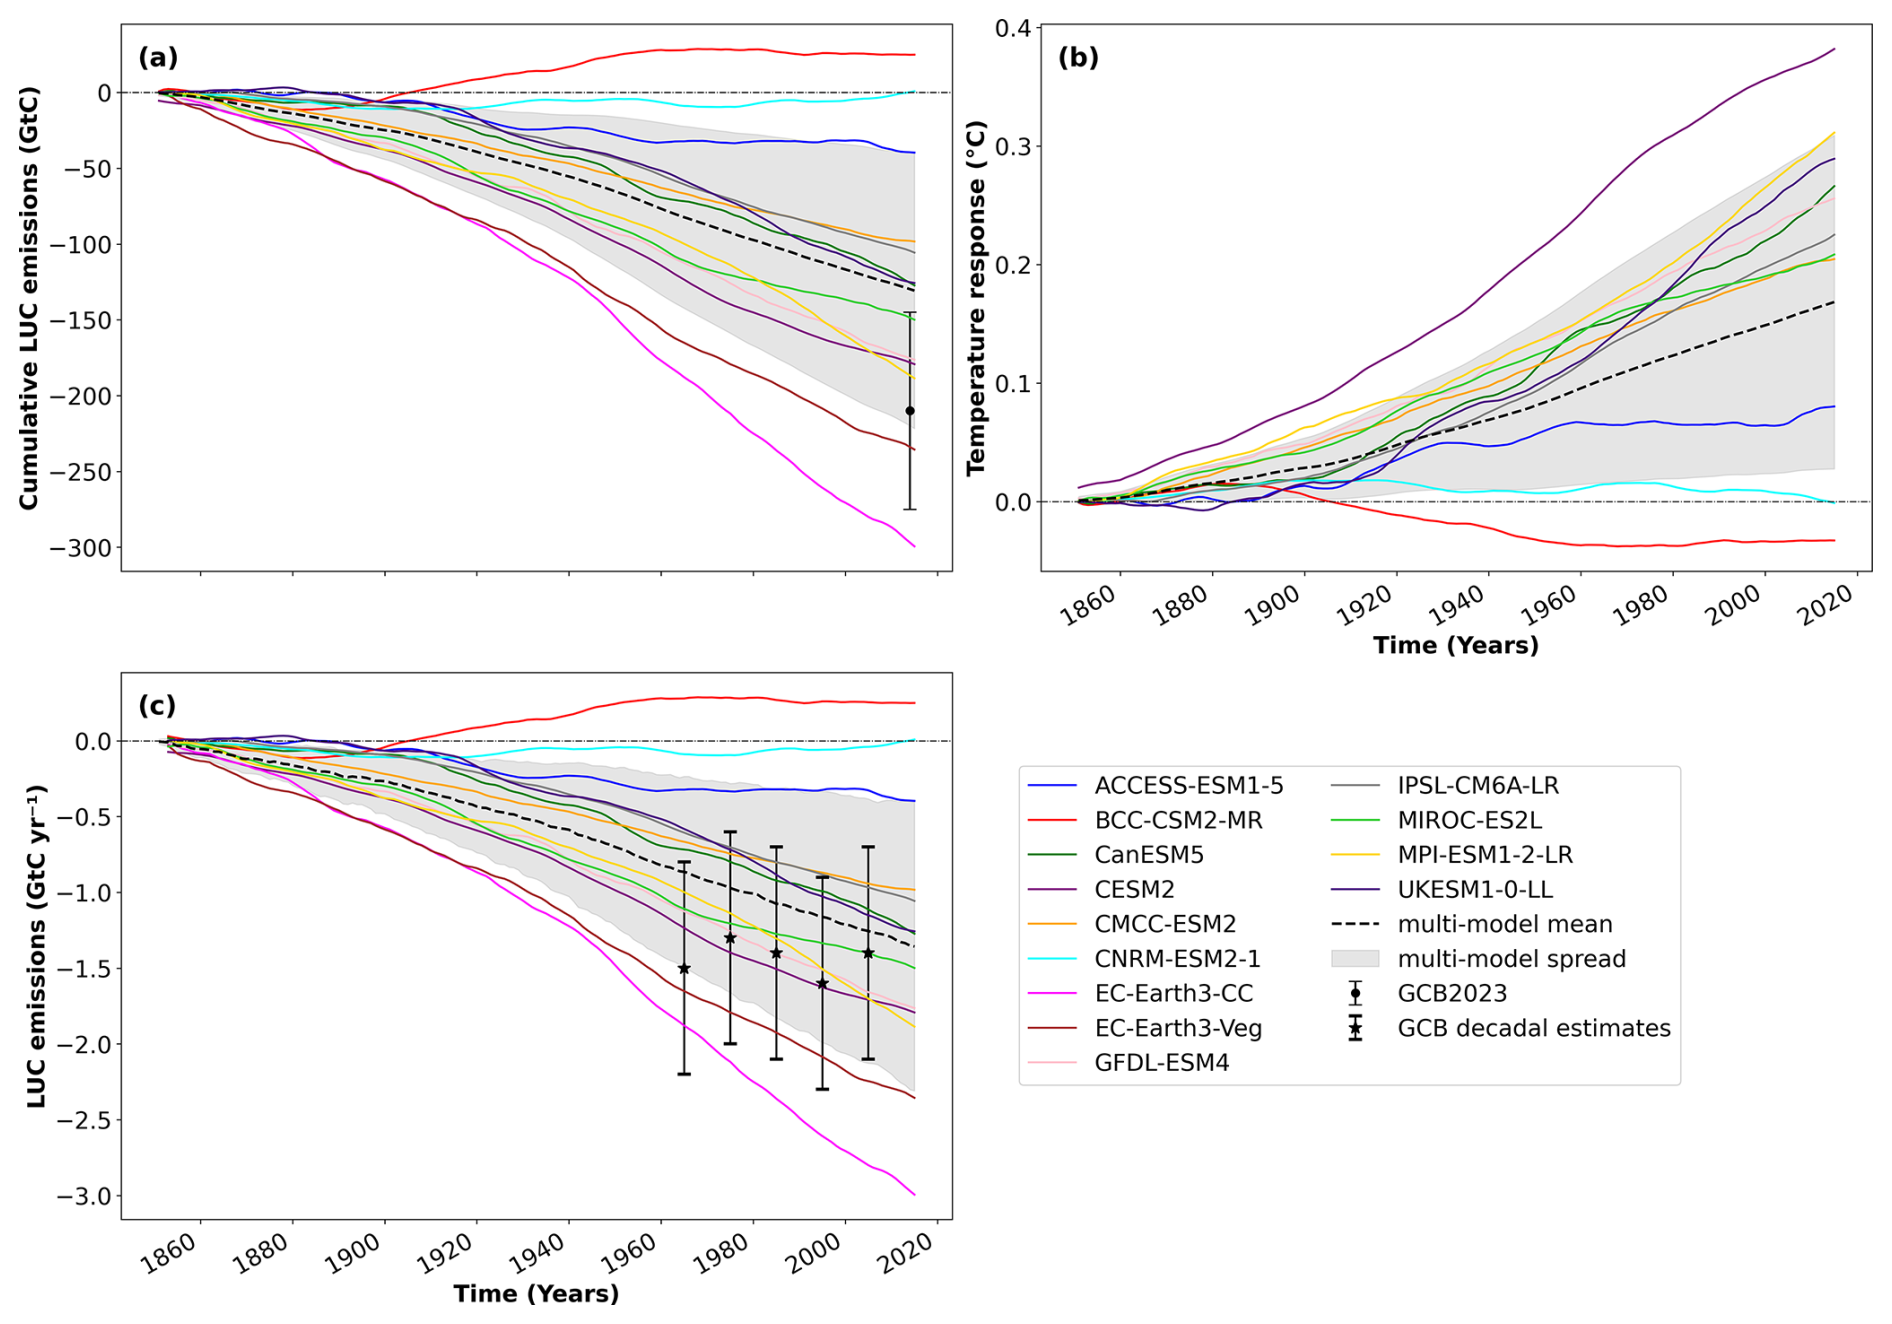
Figure 1Time series of change in (a) total land carbon pools (ΔcLand), (b) the global temperature response to cumulative emissions, and (c) LUC emissions (Gt C yr−1) due to biogeochemical effects of land-use change (LUC) as simulated by CMIP6 Earth system models (ESMs). A 10-year running average is applied. The black dot with whiskers in panel (a) represents the mean and standard deviation in ΔcLand estimates of the Global Carbon Budget (Table 8; Friedlingstein et al., 2023), which is based on simulations from three bookkeeping models with uncertainties quantified using dynamic global vegetation models. In panel (c), data-based estimates of decadal mean net LUC emissions for the 1960s, 1970s, 1980s, 1990s, and 2000s from the Global Carbon Budget are overlaid as an asterisk (*), with uncertainty ranges from Table 7 of Friedlingstein et al. (2023). The thick dotted black line and the grey shaded area represent the multi-model mean estimate and the standard deviation across 13 ESM estimates for panels (a) and (c) and across 11 ESM estimates for panel (b).
3.2 Biogeochemical effects of land-use change
Hereafter, we estimate the temperature response to cumulative LUC emissions across the ESMs to determine the effect of resulting LUC emissions on the climate (Table 2). Our estimates of the overall global mean temperature response (ΔTbgc) to historical LUC-induced CO2 fluxes demonstrate considerable variation across models. The globally averaged mean temperature change (Table 2) ranges from a cooling of −0.03°C (BCC) to a warming of 0.40 °C (CESM2), with a multi-model mean (standard deviation) of 0.21 (±0.14) °C (Fig. 3, Table 2). The spatial patterns of the multi-model mean of ΔTbgc show warming throughout the globe (Fig. 3a) with a clear Arctic amplification, as expected in response to GHG forcing (Fig. 3a) and consistent with previous findings on the impacts of GHGs (e.g. Rantanen et al., 2022; Kornhuber and Tamarin-Brodsky, 2021; Cohen et al., 2018). While the ESMs generally agree on the direction of the BGC-induced temperature change (Fig. 3d), the spread in magnitude (Fig. 3b) suggests considerable inter-model variability over the high latitudes relative to the mid- and low latitudes and over land, a pattern similar to that observed in the multi-model mean. We already see this spread in the evolution of models' responses to the cumulative land CO2 fluxes (Fig. 1b), with a gradual but consistent trend of increasing warmth since the pre-industrial era. We observe a wider dispersion across the ESMs' temperature response at the end of the simulation (year 2014), a spread that also highlights the divergence and variability across models' TCRE estimates (Lamboll et al., 2023; Canadell et al., 2021; Matthews et al., 2009). BCC evolves like the other ESMs but begins a gradual descent post-1900, making it distinct from other ESMs by being the sole model to simulate an overall cooling in response to the gain in land carbon due to the historical LUC mentioned earlier. A similar but delayed decline (towards zero) is observed in CNRM after a prolonged period of relatively stable ΔTbgc, making it the only model that agrees with BCC. In ACCESS, BCC, and CNRM, the temperature response to land CO2 fluxes (Fig. 1b) evolves similarly to the land CO2 fluxes (Fig. 1a). We note that, within the overall increasing temperature trend, the CESM2 model stands out for its particularly steep increase in comparison to other models due to its relatively high TCRE value (highest after UKESM) compared to other ESMs used in this study. However, unlike CNRM, CESM2 does not show any distinctive behaviour either temporally or spatially.
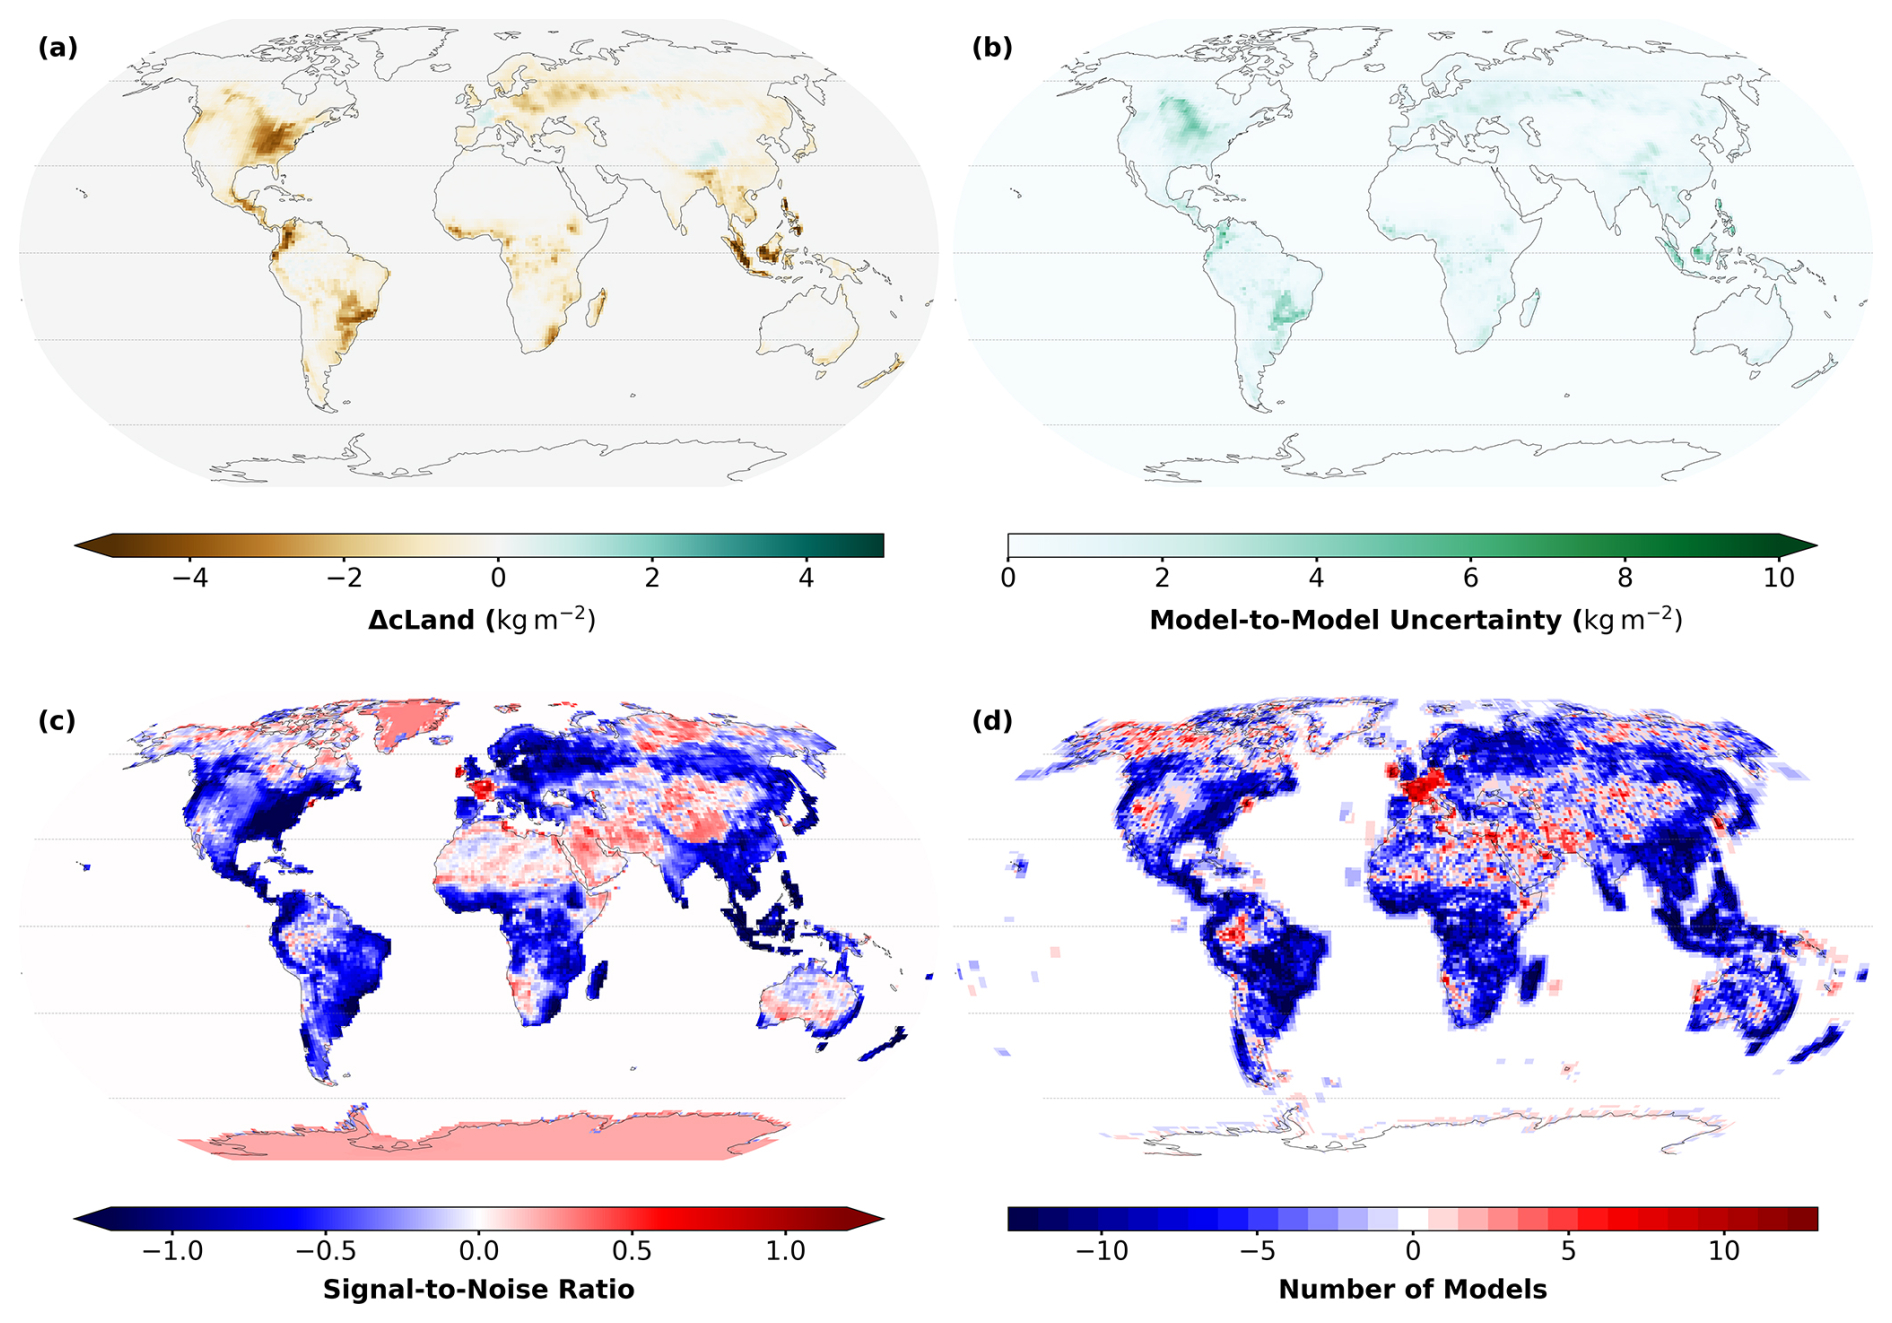
Figure 2Change in total land carbon pools (ΔcLand) shown as (a) the multi-model mean; (b) the inter-model spread; (c) the signal-to-noise ratio; and (d) the inter-model agreement, due to biogeochemical effects of land-use change. Results were computed from 13 Earth system models as the cumulative value at the end of the simulation (year 2014). The signal-to-noise ratio (c) indicates the strength of the signal as compared to the inter-model uncertainty. It measures the relative weight of the multi-model mean anomalies in panel (a) with respect to the model coherence in panel (b), where a high absolute number means a robust signal. The inter-model agreement, on the other hand, shows the direction, rather than the magnitude, of change for each grid cell (blues: negative/decreasing; reds: positive/increasing), indicating the number of ESMs that agree on the direction of the signal.
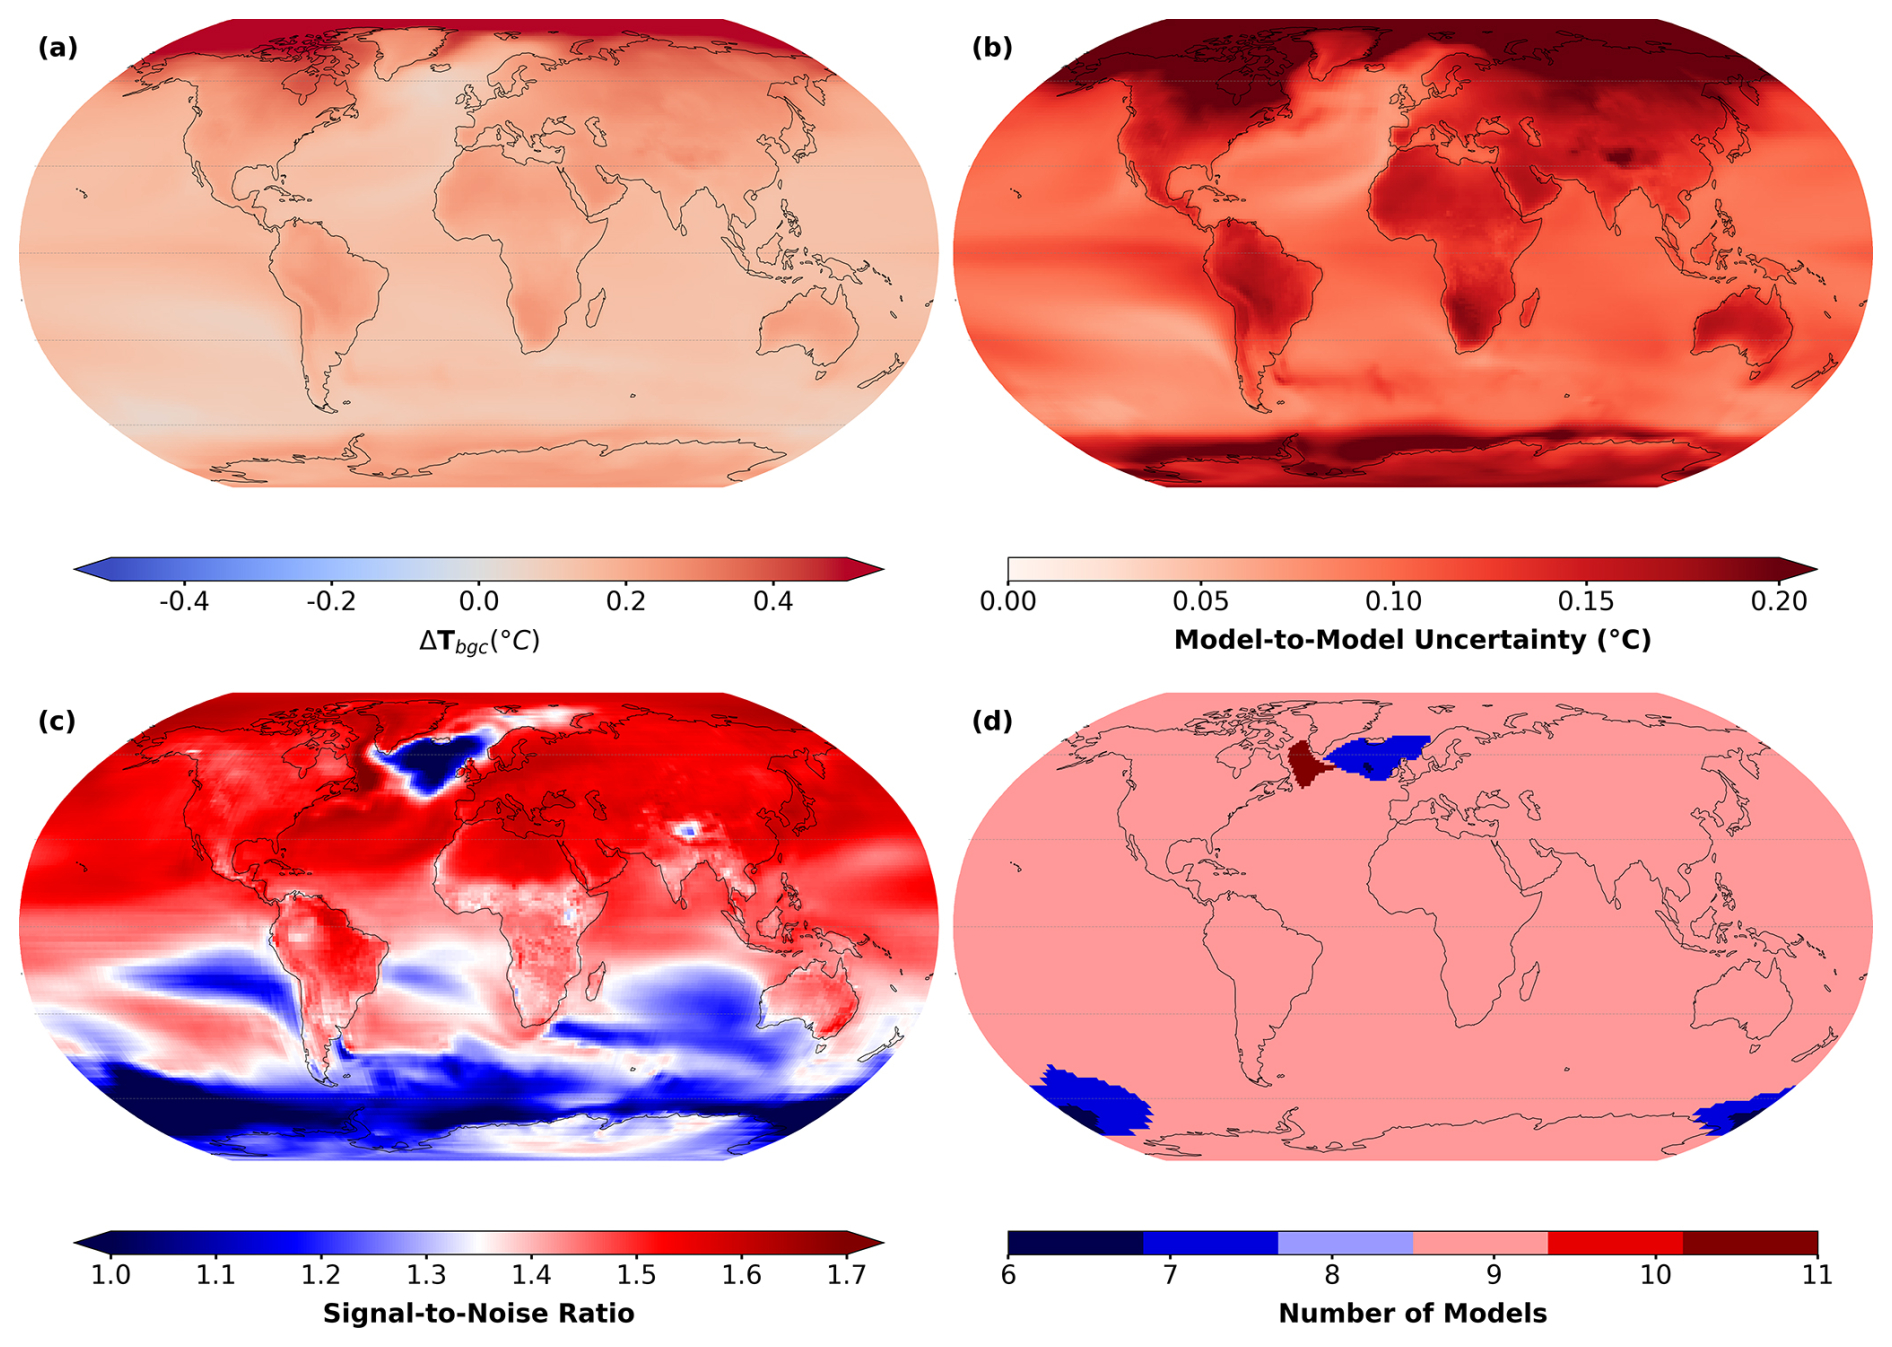
Figure 3Estimated temperature response to cumulative LUC emissions (ΔTbgc) shown as (a) the multi-model mean (stippling indicates regions where two-thirds of the models are not statistically significant at the 5 % significance level) and (b) the inter-model spread, computed as the standard deviation, showing the uncertainty in estimates over each grid cell. The signal-to-noise ratio (c) indicates the strength of the signal as compared to the inter-model uncertainty. It measures the relative weight of the multi-model mean anomalies in panel (a) with respect to the model coherence in panel (b), where a high absolute number means a robust signal. Finally, (d) the inter-model agreement shows the sum of the sign of ΔTbgc (−1 or +1) across all models (direction, rather than magnitude) for each grid cell (blues: negative/decreasing; reds: positive/increasing), indicating the number of ESMs that agree on the direction of the signal. Results are computed across 11 Earth system models, as the temperature response due to the cumulative land CO2 fluxes at the end of the simulation (year 2014), for each model from the difference between the historical and hist-noLu simulations.
3.3 Biogeophysical impacts of land-use change
We further analyse the biogeophysical effects of LUC on a global scale (Fig. 4) as the multi-model mean of near-surface air temperature (ΔTbgp) for a 30-year time frame (1985–2014). Our results demonstrate a weak global signal, ranging across models from −0.23 °C (cooling, BCC) to 0.14 °C (warming, ACCESS) with a multi-model mean (standard deviation) of −0.03 °C (±0.10) °C (Fig. 5, Table 2). Locally, ΔTbgp remains small in many regions (Fig. 4), and the robust features (also with a high model agreement; Figs. 4d and S7) are only found in isolated regions, including a warming pattern in the North Atlantic and a cooling over the Great Plains of the US. There is a tendency towards a cooling effect in the mid- to high latitudes, with a cooling strip between latitudes 30° N and 60° N, extending as a cooling band over land through eastern Europe to the Northeast Plain of Asia. We also note the more subdued warming in some tropical regions and in western and southern Africa with mixed or nuanced signals. The Arctic warming stands out especially in the EC-Earth3 and IPSL models, despite some models, such as BCC, CanESM, and GFDL, showing a cooling pattern and others presenting a patchwork of cooling and warming effects (Fig. S7). Furthermore, in Fig. 4b, we highlight the variability in ESM estimates, most notably in the polar regions, confirming the complexity of attributing specific patterns to the BGP effects of LUC. High model agreement is observed in the areas that exhibit the strongest temperature responses, particularly in North America, parts of Eurasia, and the North Atlantic (Fig. 4d). This agreement is nuanced by the signal-to-noise ratio, which is particularly high over North America and the North Atlantic, indicating a rather clear BGP signal due to LUC in these regions (Fig. 4c). Conversely, the signal-to-noise ratio is low in the higher latitudes, suggesting more uncertain estimates over these regions.
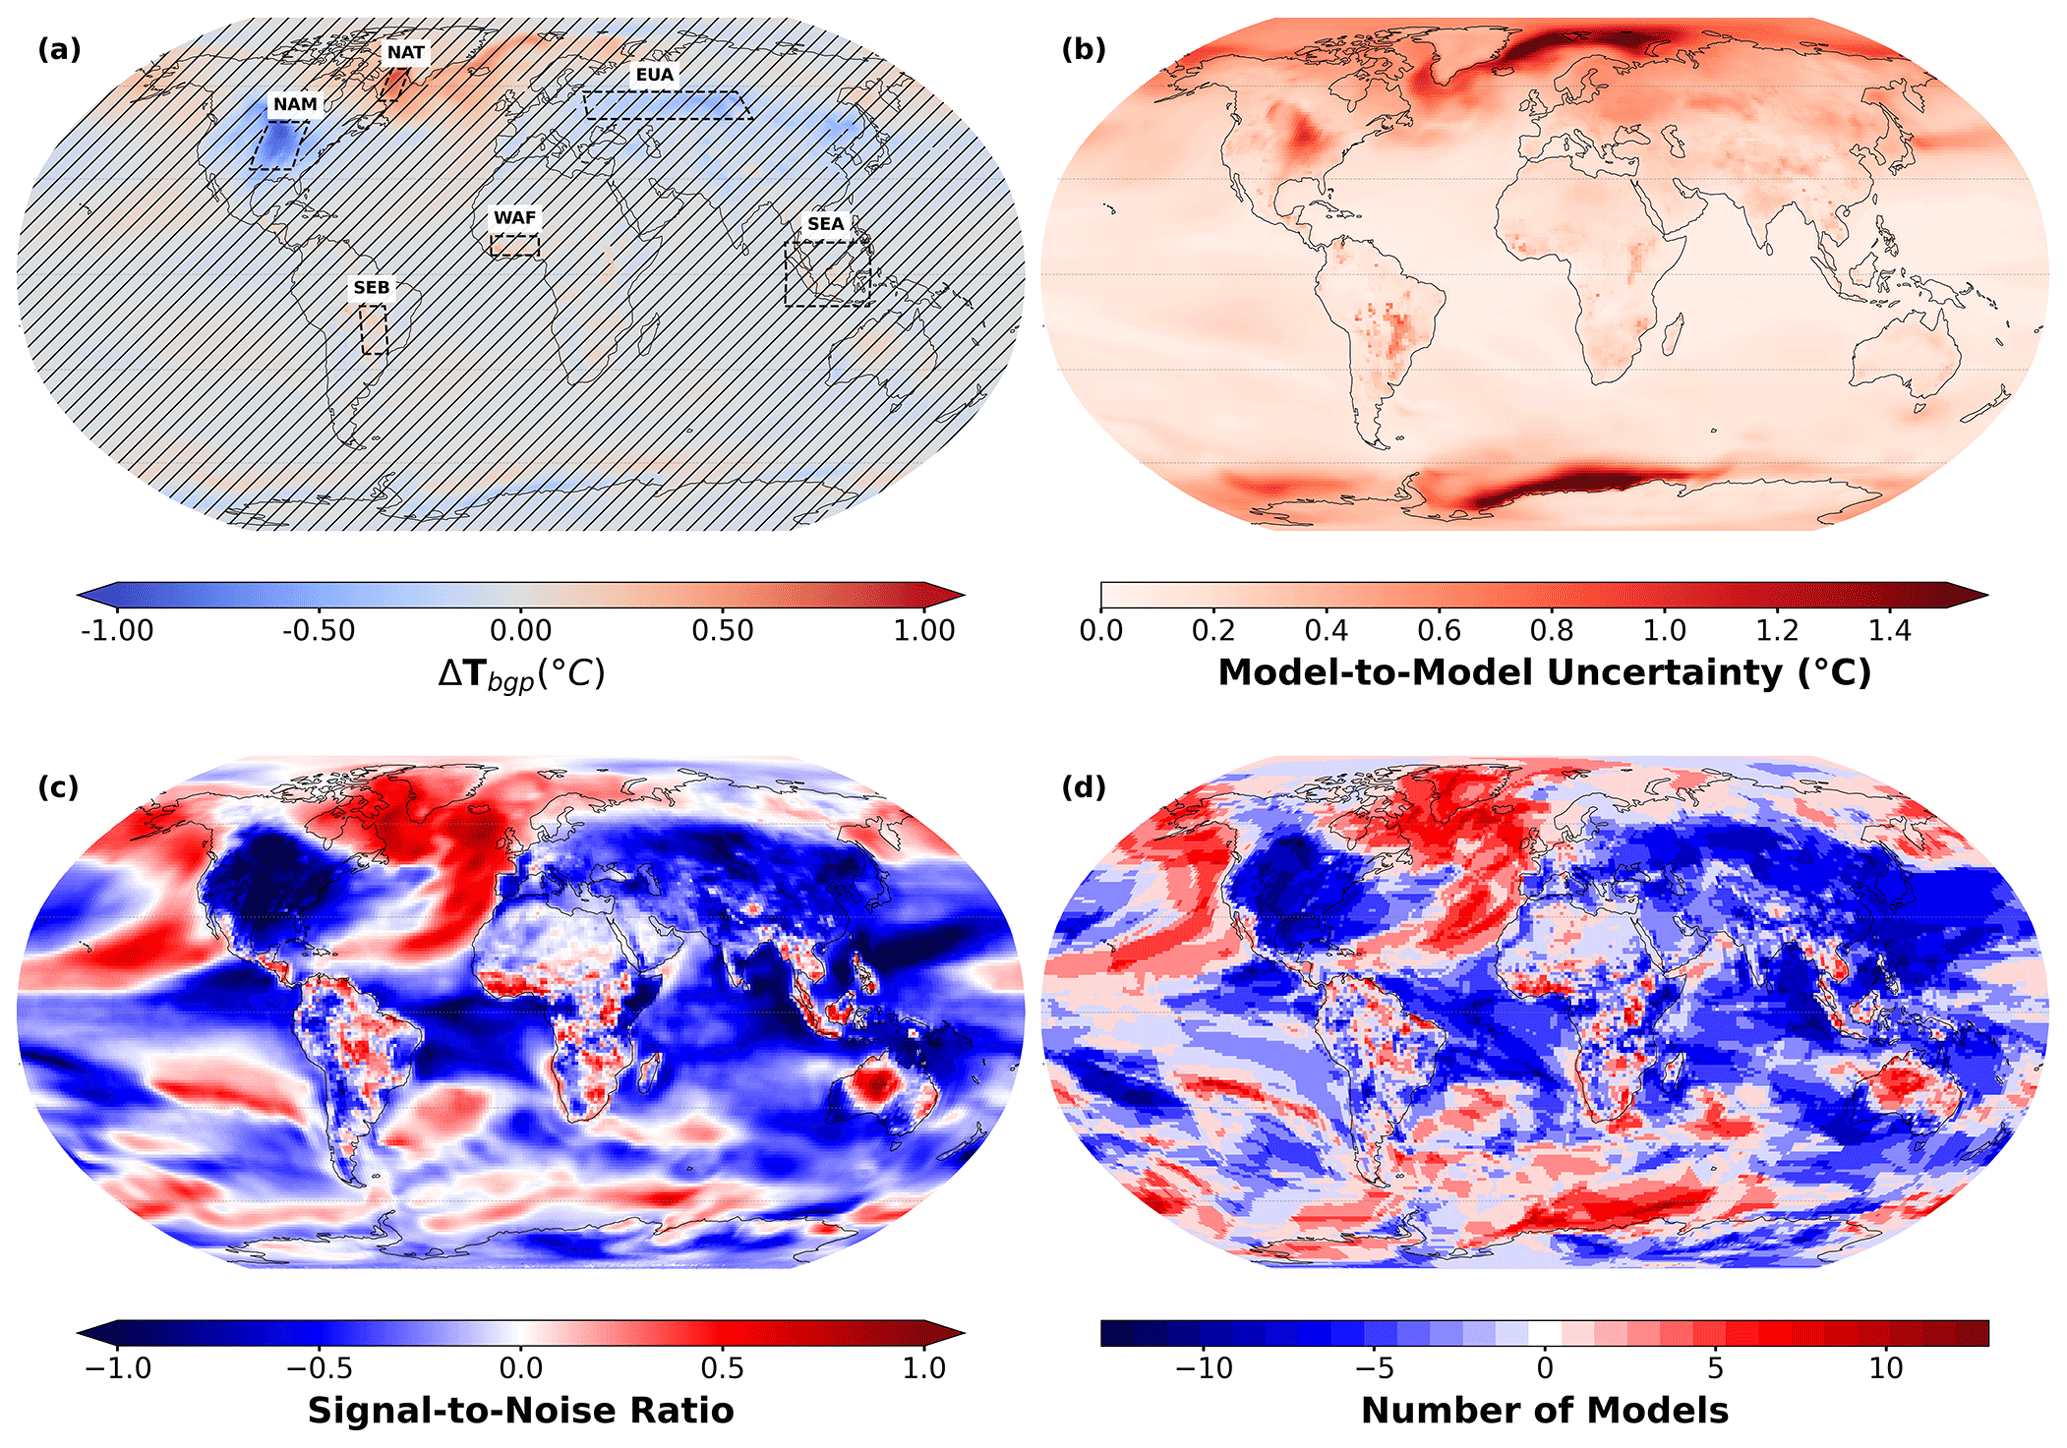
Figure 4Response of near-surface air temperature to biogeophysical effects of LUC (ΔTbgp) across 13 Earth system models (ESMs) shown as (a) the multi-model mean, indicating the average temperature response (stippling indicates regions where two-thirds of the models are not statistically significant at 5 % significance level; the dashed boxes show the spatial extents of the regions considered in Fig. 5), and (b) the inter-model spread, computed as the standard deviation across models, showing the uncertainty in estimates over each grid cell. The signal-to-noise ratio (c) indicates the strength of the signal as compared to the inter-model uncertainty. It measures the relative weight of the multi-model mean anomalies in panel (a) with respect to the model coherence in panel (b), where a high absolute number means a robust signal. Finally, (d) the inter-model agreement shows the sum of the sign of ΔTbgp (−1 or +1) across all models (direction, rather than magnitude) for each grid cell (blues: negative/decreasing; reds: positive/increasing). Results are computed as the difference between the historical and hist-noLu simulations in 1985–2014.
Looking into the individual ESM outputs (Fig. S7), particularly over the tropics, most ESMs show detectable changes in ΔTbgp, as seen over the Amazon and western and central Africa, a change that is consistent with expectations given the extensive LUC in these areas, particularly deforestation. Additionally, the inter-model variability becomes evident. Notably, the northern Atlantic east of Greenland reveals substantial differences among models, with several ESMs indicating a clear yet opposite signal of ΔTbgp. Such contrast suggests that the signal in Fig. 4a could be more by chance of the large-warming models being one more than the large-cooling models, rather than a definitive effect of LUC. In southern Brazil, only CESM2 shows a clear warming pattern, whereas the other models exhibit a mixed response, underlining the variation in the influence of LUC on regional climates across models. This demonstrates that, while certain areas show large absolute values in temperature change due to BGP effects, the robustness of the multi-model mean is low, as the signals vary significantly across ESMs, necessitating careful consideration of model spread and underlying factors contributing to the disparity in estimates.
The evolution of the global ΔTbgp due to LUC (Fig. 5a) also shows a wide spread across ESMs, which slightly widens over time. However, the trends (warming and cooling) remain inconsistent across models, a trend still present when analysed across models with multiple ensemble members (not shown). Globally, we observe a smaller magnitude in ΔTbgp (compared to the regional trends; Fig. 5b–g), with the multi-model mean indicating a small cooling effect. For a few regions (selected due to their distinct cooling/warming spatial signals in the direction of ΔTbgp; see Fig. 4a); however, the trends in ΔTbgp show higher magnitudes with smaller disparity across ESMs. Furthermore, we observe higher variability across the high latitudes (Fig. 5b–d) compared to regions over the tropics (Fig. 5e–g), with a change in ΔTbgp that tends towards zero from the high latitudes to the tropics.
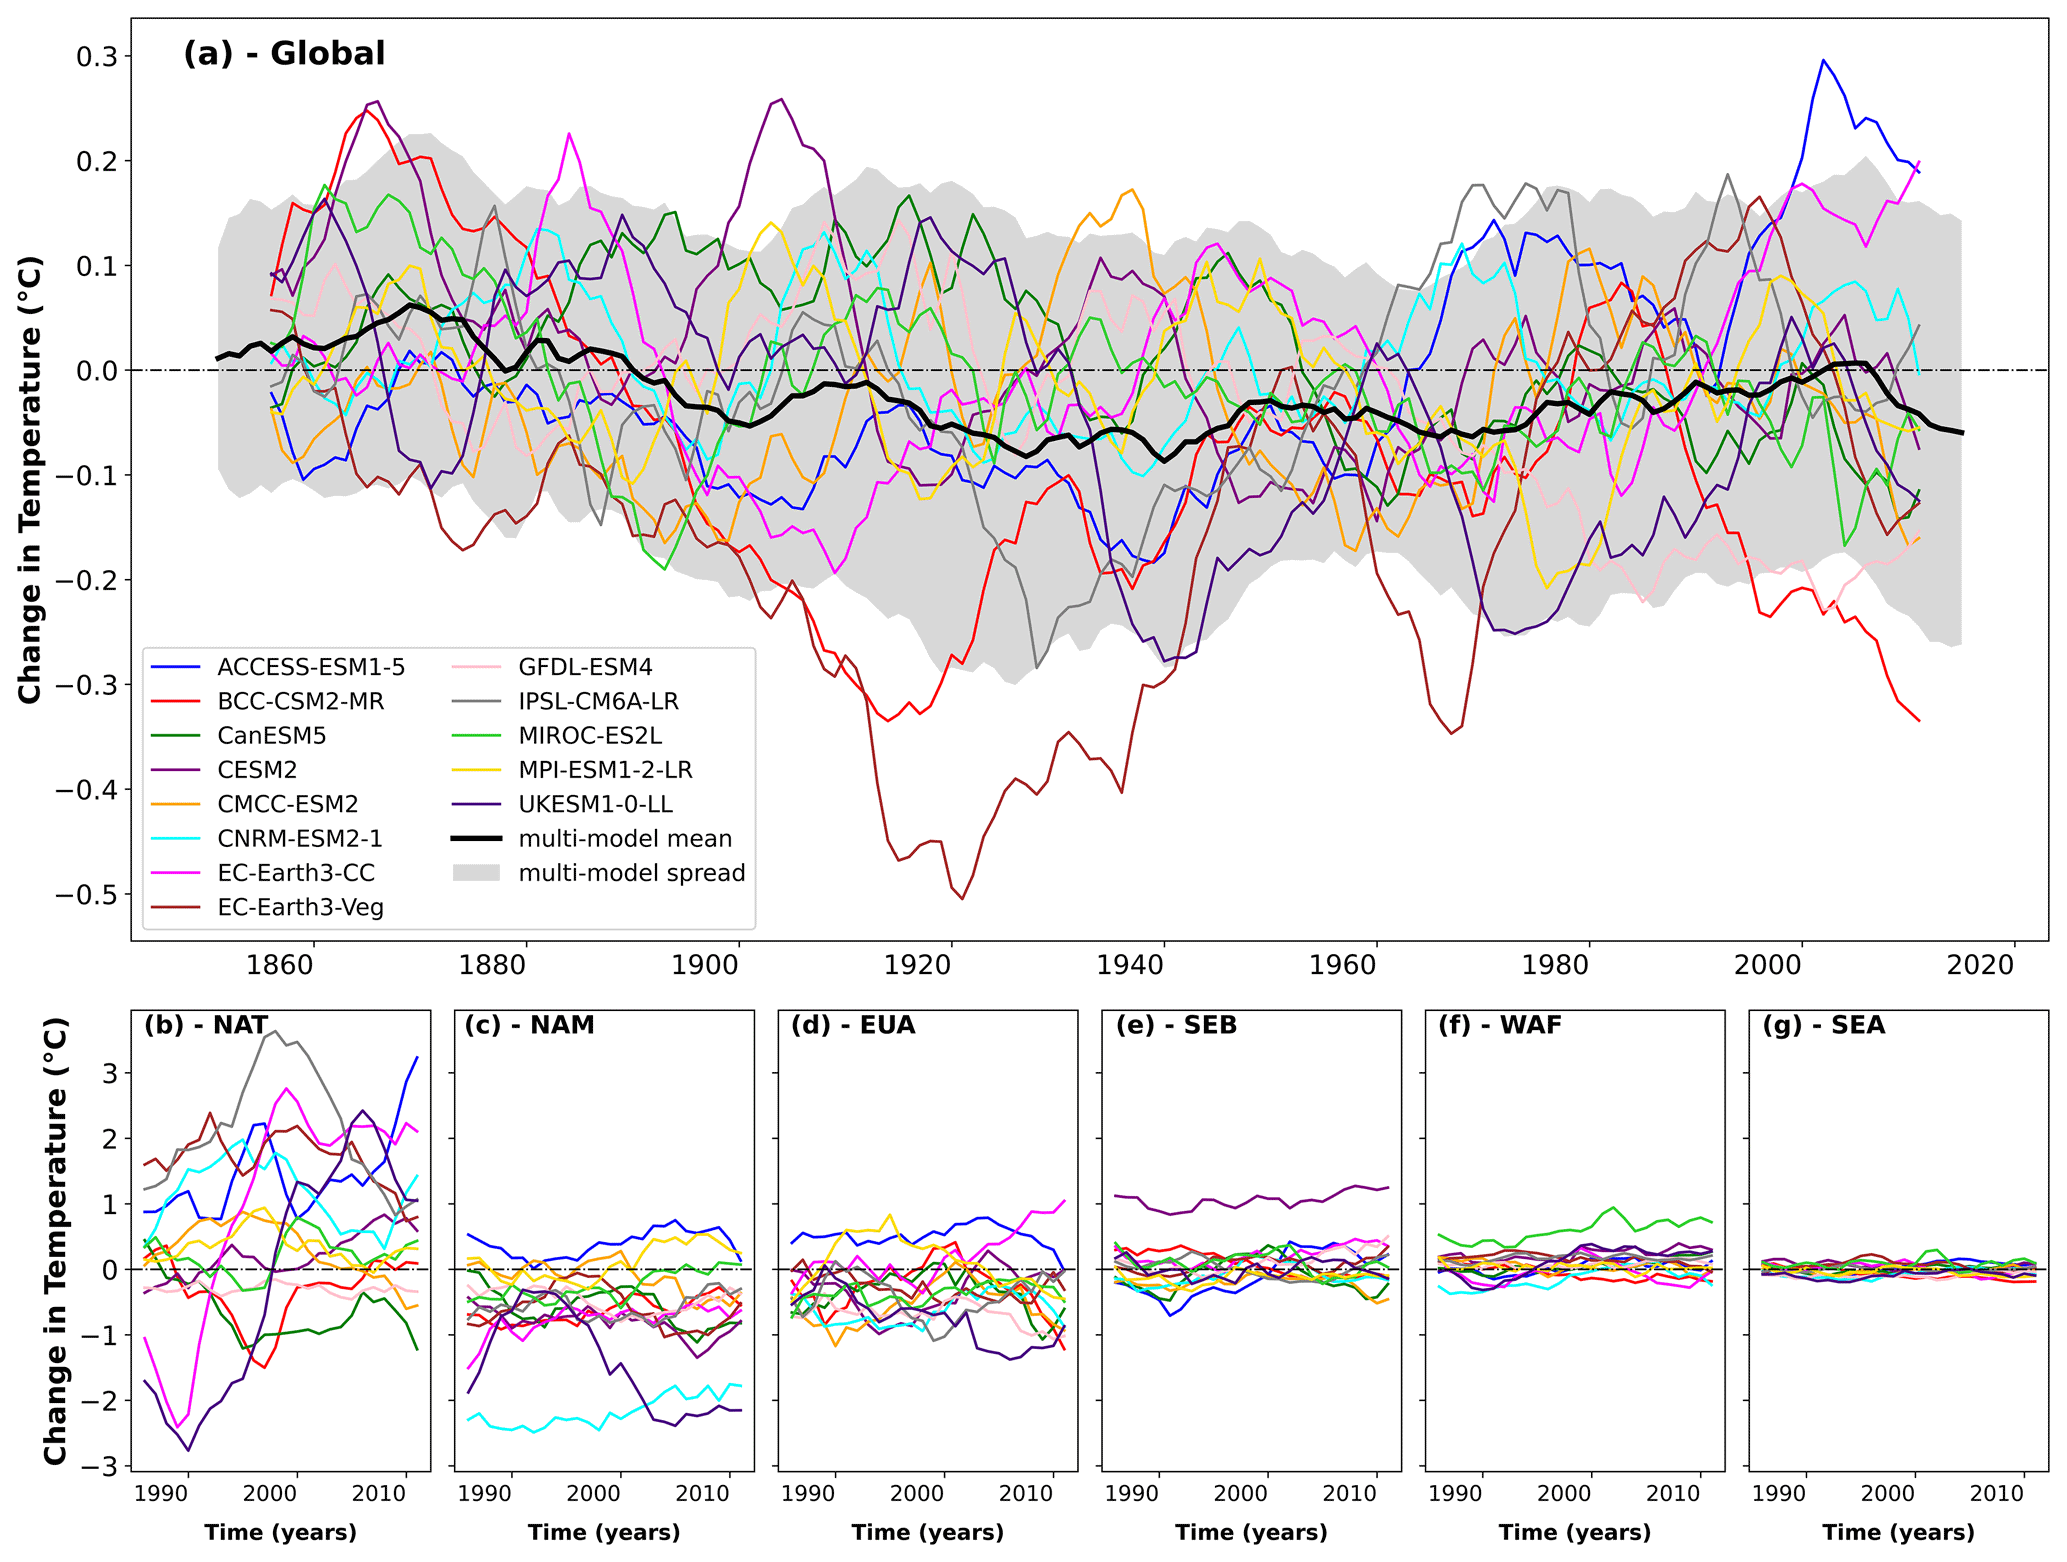
Figure 5Time series of the global (a) and regional (b–g) response of near-surface air temperature to biogeophysical effects of LUC (ΔTbgp) across 13 Earth system models (ESMs). Results are computed as the difference between the historical and hist-noLu simulation from 1850–2014 for the global estimate in panel (a) and from 1985–2014 for the regional estimates in panels (b)–(g). A 10-year running average is applied across both global and regional estimates. The thick black line and the grey shaded area in panel (a) represent the ensemble mean estimate and the standard deviation, respectively, across all ESMs. The dash-dotted line represents the zero line. The acronyms are as follows. NAT: North Atlantic; NAM: North America; EUA: Eurasia; SEB: southeastern Brazil; WAF: western Africa; SEA: southeastern Asia. Refer to Fig. 4a for the spatial extents used in computing panels (b)–(g).
3.4 Regional biogeochemical versus biogeophysical response to land-use emissions
To analyse the impact of LUC, we distinguish between the grid cell temperature contribution and the grid cell temperature effect (see Sect. 2). The metric ΔTbgc shows the effect on near-air surface temperature stemming from changes in land CO2 fluxes due to historical LUC. In addition, we quantify how local land CO2 fluxes due to LUC contributed to the global temperature change, quantified as (Fig. S8), computed using Eq. (6). These maps do not show warming or cooling in the individual grid cells but instead if a grid cell contributed a warming or cooling effect to the global signal; this perspective becomes relevant when considering deploying LUC intentionally to mitigate global warming, as is the case for reforestation. The multi-model mean (Fig. S8a) indicates an overall warming contribution, with only a few grid cells in the eastern US and Europe showing a cooling contribution. This cooling contribution across the US and Europe is primarily due to decades of reforestation and effective land management, and it highlights the potential of LUC as a CDR strategy. Historical records reveal that LUC, particularly reforestation, has the potential to provide the intended cooling benefits on global temperatures. This historical precedent suggests that current and future LUC initiatives, such as forestation, could be effective in mitigating global warming, as evidenced by their cooling contributions over these regions. The variability across model estimates (Fig. S8b) not only suggests a dispersion in potential impacts of LUC-based mitigation strategies but also mitigates the risk of locking decision-makers in a single outcome.
We also analyse the local contribution of each grid cell to the BGP-induced global temperature change, quantified as (Fig. S9), computed using Eq. (7). Our results show a warming contribution across the tropics, including eastern Canada and central Australia, whereas a cooling contribution dominates over the US and Eurasia (Fig. S9a). Regions with a warming contribution also correspond to high inter-model spread (Fig. S9b), whereas variability is lower over regions with a cooling contribution, except for the eastern US. Nevertheless, the ESMs again agree reasonably well in the direction of the grid cell contribution to the global temperature change (Fig. S9d), with a pattern dominated by a cooling contribution, which switches to a polewards warming contribution. Differently from , the cannot easily be interpreted as the contribution of the LUC in a given grid cell to the global temperature signal. While the underlying carbon stock changes in are primarily driven by the LUC within the grid cell itself (since direct changes in land cover, vegetation type, and soil management directly affect carbon stocks at the local scale), the resulting BGP temperature change in each grid cell reflects broader climatic impacts. These include changes in local surface properties (e.g. albedo, evapotranspiration) and energy and water vapour changes that may be caused by air transported into the grid cell originating from LUC in other locations. The pattern of is, therefore, a mixture of both the local and non-local effects of LUC (Winckler et al., 2019a), and the two effects cannot be separated without additional simulations. However, in regions with extensive LUC (see Figs. S13–S16), such as areas experiencing substantial changes in vegetation cover or other land surface properties, it is reasonable to hypothesize that local BGP effects have a more pronounced influence (Winckler et al., 2019a). Large-scale changes in vegetation and surface properties in these regions would likely create strong localized impacts on albedo, evapotranspiration, and surface roughness, which are direct drivers of BGP effects. Thus, while our current approach cannot precisely quantify the local versus non-local contributions to , our maps provide an indication of areas where the unintended BGP effects of LUC are most likely significant. It is in this sense that our maps provide some guidance on the unintended effect of LUC in a specific location on global climate via BGP pathways (which again may be indicative of LUC deployed intentionally to dampen climate change), a consideration relevant for evaluating LUC as a strategy for climate mitigation.
We sum the BGC and BGP contribution to global temperature change to highlight the regional contribution to the overall global temperature change due to LUC (Fig. 6a). We emphasize that this does not correspond to any observable measure but instead is a metric for the relevance of a grid cell for the observed global temperature change in relation to the other grid cells. Although our results focus on a multi-model mean, the BGC contribution of LUC dominates over the BGP contribution; this balance is not spatially homogeneous. In the direction of signals, we find the warming contribution over the tropics to be common across the BGC and BGP effects (as in Fig. 2b of Windisch et al., 2021) but with opposing signals over the US and Eurasia. In magnitude, the warming pattern around Greenland can only be seen in the BGP contribution, which we attribute to mechanistic non-local LUC-induced effects on ocean currents and sea ice (see Bauer et al., 2025). A few patches of grid cells towards the Arctic and grid cells over the tropics, including parts of North America, contributed to warming, with lower warming from the former, while a few grid cells over the US and Europe contributed to a cooling of the climate. The spatial pattern of the combined effect (Fig. 6a) resembles that of the BGC contribution (Fig. S8a), except for a more pronounced warming in the tropics. Overall, the cooling contribution from the BGP effect is dampened by the warming contribution from the BGC effect.
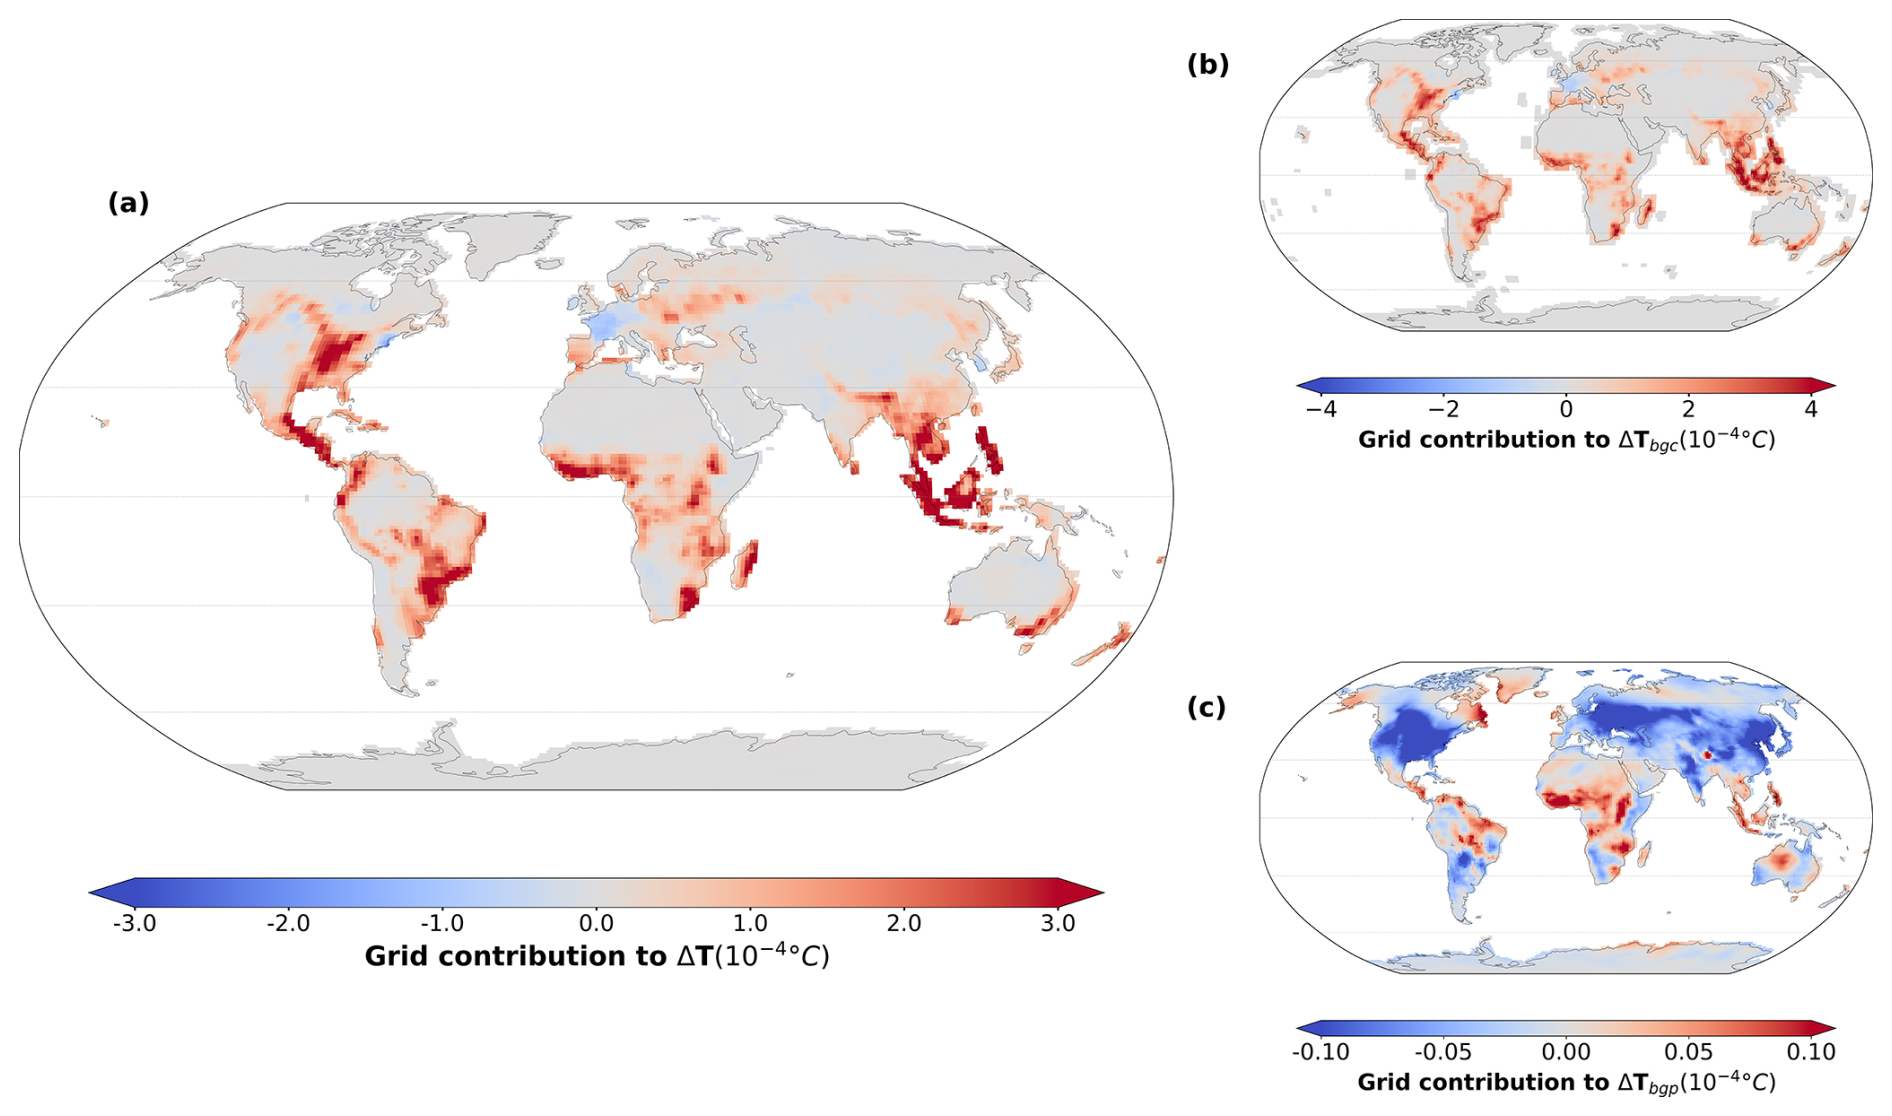
Figure 6(a) Combined biogeochemical (BGC) and biogeophysical (BGP) contribution to global temperature change computed from the sum of the regional BGC (b) and BGP (c) contribution computed using Eqs. (6) and (7), respectively; (b) regional BGC contribution of each grid cell to global temperature change computed across 11 Earth system models (ESMs) as the product of the mean grid cell land-use emissions over 30 years (1985–2014) and the model-specific TCRE value; and (c) regional BGP contribution of each grid cell to global temperature change computed across 13 ESMs, as the product of the mean grid cell temperature over 30 years (1985–2014) and the grid cell weighted area. Both BGC and BGP contributions are computed from the difference between the historical and hist-noLu simulations. Panels (b) and (c) are identical to Figs. S8a and S9a, respectively, and have been reproduced here for comparison. The ocean surface is masked out in panel (c) to isolate the regional contribution resulting only from land surfaces. Refer to Fig. S9a for the full regional BGP contribution, including over ocean surfaces. Note the varying limits of the colour bars in the individual subpanels.
4.1 Disparity in estimates of near-surface air temperature across ESMs
In highlighting the disparity across model estimates of near-surface air temperature, we show that our findings align with previous studies in some aspects but also uncover critical deviations, particularly in the stronger BGC-induced warming observed in specific models. Unlike prior single-model studies or simplified model intercomparisons, we integrate multi-model analyses, spatial variability, and mechanistic insights into both regional and global BGP and BGC effects. Notably, we highlight how regional patterns, such as cooling over mid-latitudes and warming in the tropics, are shaped by complex interactions between BGP and BGC effects, including local and non-local feedbacks. While the global BGC-induced warming aligns with IPCC estimates and prior studies, its magnitude varies with LUC implementation details in models, such as gross versus net transitions and forest cover representation. The BGP effects show greater inter-model disparity, largely influenced by differences in how vegetation fractions (e.g. tree cover) are modelled, affecting energy balance, albedo, and evapotranspiration. We expatiate on these findings below.
In Table 2, we presented the estimated temperature responses from both the BGP and BGC effects of LUC, comparing them with results from prior studies (Fig. 7). Across ESMs, the temperature range due to BGC effects spans −0.03 (BCC) to +0.40 °C (CESM2), with a multi-model mean of 0.21 (±0.14) °C closely matching the IPCC estimate of 0.20 °C (Jia et al., 2019). Our estimate deviates only slightly from values retrieved from similar studies reporting global warming due to the BGC effects of LUC. In earlier studies based on single models, Brovkin et al. (2004) and Pongratz et al. (2010) estimated global warming of 0.18 °C, while Matthews et al. (2004) and Simmons and Matthews (2016), using different versions of the same model, reported slightly higher global warming of 0.3 and 0.22 °C, respectively. Most recently, Devaraju et al. (2022), using an earlier version of CESM (CESM1), reported 0.24 °C in global warming due to BGC effects, which is about 40 % lower than our estimate using CESM2 (0.40 °C). Our LUC-induced warming estimate is, however, likely underestimated, as we quantify the BGC effects of LUC based on the 1pctCO2 simulation (see Sect. 2). The 1pctCO2 simulation runs with pre-industrial land cover and does not consider the loss in forest area due to deforestation. As forests act as carbon sinks, a reduced forest area would increase the fraction and amount of CO2 remaining in the atmosphere, thus causing larger warming.
The BGP effect range of −0.23 to +0.14 °C across models, with a mean (standard deviation) of −0.03 (±0.10) °C that we described above, is similar to an earlier global cooling estimate of −0.03 °C reported by Pongratz et al. (2010) and is also quite close to the estimate of −0.05 °C reported by Davin et al. (2007) in studies involving single ESMs. Our estimated mean and range are, however, substantially weaker than most estimates from previous studies (Fig. 7a), such as a BGP response range of −0.13 to −0.25 °C reported by Brovkin et al. (2006) in an intercomparison study involving six ESMs of intermediate complexity (EMICs), along with estimates from other single-model studies yielding global effects of −0.06 to −0.22 °C (Matthews et al., 2004), −0.26 °C (Brovkin et al., 2004), and −0.1 °C (Lawrence et al., 2012) in global BGP effects. The large disparity across ESM estimates of BGP effects, in both pattern and magnitude (Figs. 4 and S7), is not entirely unexpected, as this has been reported in previous studies as well, including an intercomparison study involving 15 EMICs by Eby et al. (2013). Using seven LUCID atmosphere–land surface models (LSMs), de Noblet-Ducoudré et al. (2012) estimated a global cooling ranging from −0.005 to −0.056 °C. This spread was larger when models were forced with LUC than the combined effect of GHGs and sea surface temperature due to large differences across ESMs regarding how the land cover type partitions the available energy. This leads us to speculate that the different implementation of LUC across models, as seen across the different vegetative fractions (see Figs. S13–S16), at least partly accounts for the wide spread across the BGP estimates in this study. For example, tree cover fraction (Fig. S13), which is seen to vary considerably across ESMs, significantly influences surface temperature through mechanisms involving energy balance, albedo, and evapotranspiration. Depending on the location, forested areas, with their lower albedo, absorb more sunlight, leading to higher temperatures compared to lighter, non-forested areas that reflect more solar radiation. However, forests typically also have higher rates of evapotranspiration, which cools the air, and greater heat capacity, moderating temperature fluctuations. As suggested by the multi-model mean of our BGP estimates (Fig. 4a), there is a possibility that historical LUC caused feedbacks in sensitive components of the Earth system, namely Arctic and Antarctic sea ice, and may have influenced the Atlantic meridional overturning circulation (AMOC). The spatial temperature patterns in some models, particularly in higher latitudes, suggest links to AMOC changes. This interpretation aligns with findings in the broader literature, such as Weijer et al. (2020), who discuss AMOC behaviour in CMIP6 models, and other studies examining AMOC fingerprints (e.g. Rahmstorf, 2024). Certain regional patterns, such as cooling over the US Great Plains and Eurasia, are captured by most of the ESMs (Figs. 4 and S7), supporting the overall cooling over North America (−0.44±0.4 °C) and Eurasia (−0.3±0.3 °C) reported earlier by de Noblet-Ducoudré et al. (2012), including other model- (Boysen et al., 2020) and observation-based (Luo et al., 2022) deforestation studies. The cooling over the mid-latitudes has been reported as potentially driven by changes in both surface albedo and the surface moisture balance, leading to increased latent heat flux and decreased sensible heat flux, especially in regions where crops were exchanged for short grass (Diffenbaugh, 2009; Mahmood et al., 2014; Chen and Dirmeyer, 2020; Bromley et al., 2020). The role of surface fluxes on climate and their dependence on soil moisture have been substantiated by other studies as even stronger over irrigated areas (e.g. Seneviratne et al., 2010; Thiery et al., 2017, 2020), as shown in the models simulating irrigation: CESM2 and the EC-Earth3 models (Fig. S7). In contrast to cooling over the US Great Plains, the warming around Greenland's coast (Fig. 4a) is likely related to the coupled sea ice–ocean feedbacks, following increased export of Arctic sea ice into the subpolar North Atlantic, as described by Arellano-Nava et al. (2022). A combined decomposition of moisture flux convergence and surface energy balance analysis could be performed to investigate the source of these patterns, particularly over the higher latitudes, as commonly simulated across the ESMs used in this study.
In assessing how carbon emissions in each grid cell due to historical LUC contributed to the estimated global BGC-induced temperature change (), the mean across ESMs indicates an overall warming pattern, with a higher magnitude of contribution over the tropics, particularly over southeastern Asia (Fig. S8a). In a recent LUC assessment over southeastern Asia involving TRENDY models, Kondo et al. (2022) described a variation between a peak in LUC emissions and over-dependence in forest products in the 1990s, which was countered by forest and environmental policies in the 2000s and beyond. These regional land-use trends likely underlie the warming contribution seen in this region (Fig. S8a). In Europe, this pattern coincides with regions where changes in land use and land management, primarily through land abandonment, have been discussed in previous studies (e.g. Ganzenmüller et al., 2022, Winkler et al., 2023), which examined LUC trends but did not quantify cooling contributions. Spatially, the mean warming pattern is largely coherent across models (Fig. S8d), but there exist some regions of larger model spread, notably over the continental US and southeastern Asia, expressed by the inter-model variability (Fig. S8b), suggesting variability in potential impacts of LUC-based mitigation strategies but also mitigating the risk of locking decision-makers into a single outcome.
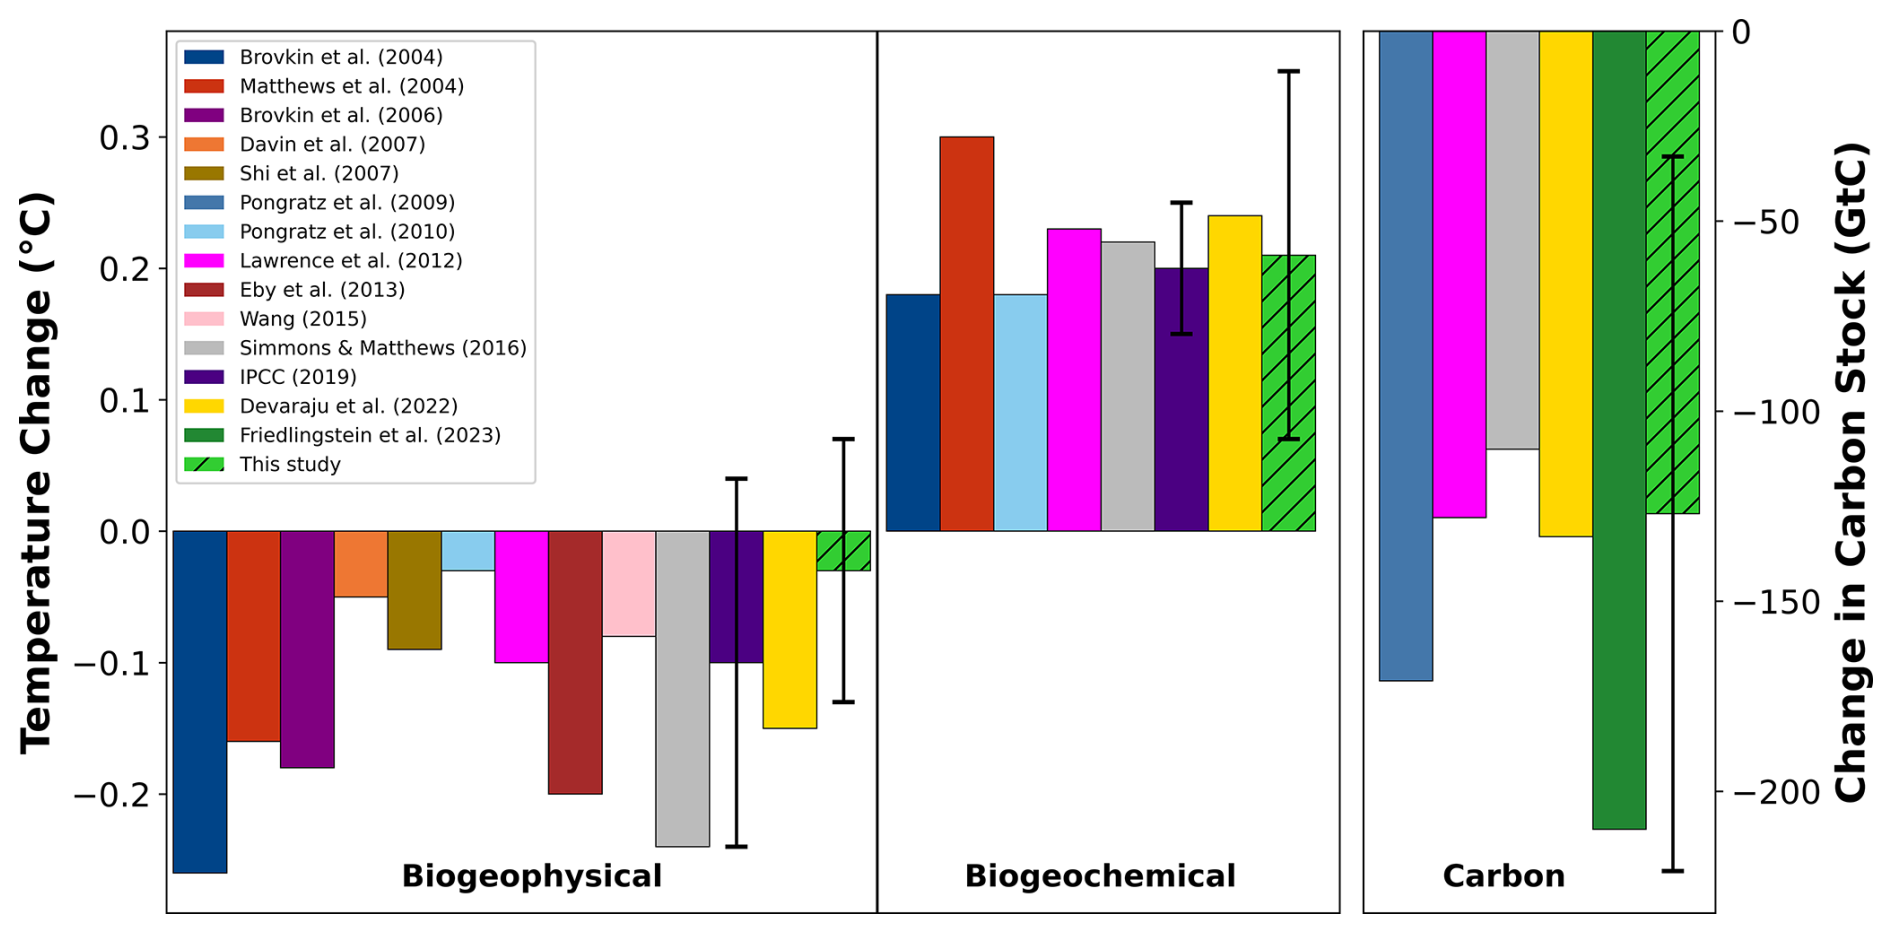
Figure 7Biogeophysical and biogeochemical effects and the changes in carbon stocks quantified in this study (hatched green bars) compared with other studies. Where vertical lines exist, they represent the standard deviation of estimates. See Table S2 for the studies and their estimation periods.
Our findings indicate that the BGP effects () have resulted in a warming contribution across the tropics, including regions such as eastern Canada and central Australia, while cooling contributions are more prevalent over the US and Eurasia (Figs. 6a and S9a). The warming contribution over the tropics is mostly attributable to the latitudinal impact of deforestation and is already well corroborated across previous research studies, which gives confidence to our results. For example, the results of idealized deforestation studies by Li et al. (2022b) and Boysen et al. (2020) revealed that the BGP effects of deforestation, such as reduced precipitation and increased temperature, could amplify carbon losses, with the resulting regional warming having stronger impacts on tropical ecosystems than warming from global radiative forcing. Zhu et al. (2023), using idealized deforestation scenarios, also showed that deforestation in the Amazon results in significant local warming and drying with a substantial reduction in rainfall, exacerbating temperature increases. Similar patterns were also observed in the Congo, where deforestation led to local temperature rises due to decreased precipitation and increased dryness. This was also supported by Zeng et al. (2021) in a study across tropical mountain regions, which found that tropical deforestation led to an increase in surface air temperature due to decreased evapotranspiration and changes in albedo, with a notable elevation dependency: higher elevations experienced cooler temperatures, while lower elevations were warmer. Similarly, Windisch et al. (2021) assessed the impact of climate mitigation policies and demonstrated that the conservation and reforestation of tropical forests provide the highest climate benefit by significantly reducing local temperatures. They also found that these measures can lead to local warming at higher latitudes during winter, analogous to the latitudinal and elevation dependence observed by Zeng et al. (2021). These demonstrate the unintended effect of LUC in a specific location on global climate via BGP pathways, which again may be indicative of LUC deployed intentionally to dampen climate change. Given that future climate might differ from the past, the BGP effects of the same LUC may change.
As the climate warms, the influence of LUC on surface temperature could become more significant. Winckler et al. (2017) identified key factors: afforestation scenarios such as RCP4.5 tend to cool surfaces, while deforestation causes warming, driven by changes in albedo, energy balance, and heat fluxes. Regional impacts vary: for example, forest dieback in the Amazon (particularly under RCP8.5) resulted in a cooling effect, while the northward shift in the boreal tree line induced warming (Winckler et al., 2017). Deforestation starting from lower forest fractions leads to more significant warming, especially in a warmer climate, due to reduced snow cover and changes in heat fluxes (Pongratz et al., 2011). Human activities, including GHG emissions and LUC, have been shown to warm the mid-latitudes more than the tropics, with higher CO2 levels increasing precipitation and intensifying the hydrological cycle. Pitman et al. (2011) also showed that changes in snow and rainfall under increased GHGs dominate how LUC affects regional temperatures. Such changes would impact the snow albedo feedback and water supply, limiting evaporation and controlling LUC's net climate impact. Buechel et al. (2024) recently found that, while afforestation has some detectable effects on regional hydrology, these effects are small compared to the more substantial impacts of variables such as precipitation, temperature, and CO2 levels. In regions such as Eurasia and the eastern US, increased CO2 results in higher precipitation and moisture availability, enhancing the cooling effects of LUC. The poleward cooling contribution towards the higher latitudes, also seen in our study, has also been reported by de Noblet-Ducoudré et al. (2012). We therefore highlight the regional heterogeneity of BGP impacts, showing that the climate response to LUC is strongly shaped by geographical and latitudinal factors. Moreover, as the climate continues to warm, the relative importance of LUC-induced BGP effects on surface temperatures may also become more pronounced.
In our attempt to highlight the combined contribution to global temperature change due to historical LUC, we show the aggregate of the BGC and BGP effects as an overall warming contribution (Fig. 6a). The BGC effects, felt globally as the CO2 released by LUC mixes in the atmosphere (Grant et al., 2023; Ito and Hajima, 2020; Pongratz et al., 2021), contrast with the often globally negligible BGP effects, which, as earlier mentioned, exert a stronger influence on climate at the local scale. The interaction between BGP and BGC effects is revealed to result in complex climate impacts, with BGP effects either mitigating or enhancing BGC-induced warming over different regions (Pongratz et al., 2021; Windisch et al., 2021; Jia et al., 2019). However, depending on the geographical location, BGC effects are shown to also amplify the warming caused by local BGP effects (Windisch et al., 2021; Boysen et al., 2014). While the strong warming pattern over the tropics can be traced to both the BGC and the BGP effects, the poleward warming contribution is due to the BGP effect alone, which includes both the local and non-local effects of LUC. For example, the warming pattern around Greenland seen only in the BGP contribution (Fig. 6c) can be attributed to mechanistic non-local LUC-induced effects on ocean currents and sea ice. There is a range of evidence that non-local BGP effects, as a teleconnective consequence of LUC occurring elsewhere (Pongratz et al., 2010), regionally dominate over local BGP effects. This has been demonstrated across deforestation experiments (e.g. Winckler et al., 2019b; Davin and De Noblet-Ducoudré, 2010) and most recently in an idealized LUC experiment (De Hertog et al., 2023). While the global mean BGC effect is shown to dominate over the BGP effect, we also observe that the BGP effects are more relevant on a regional scale than suggested by the global mean. We therefore reach a similar conclusion to Pongratz et al. (2011), who demonstrated the global dominance of CO2 over albedo forcing, contributing to warming and cooling, respectively, albeit with regional specificities. Understanding the regions where these effects differ in magnitude and direction could help in the attribution of historical climate change. For instance, research has shown that historical warming can be attributed to human activities beyond changes in GHGs (Bruhwiler et al., 2021; Hegerl et al., 2007), including aerosols (Seinfeld et al., 2016), land use (Hegerl et al., 2007), and changes in the Earth's energy absorption and reflection (Bruhwiler et al., 2021). Anderson et al. (2016) highlighted additional climate system feedbacks, such as the melting of snow and ice, which alters albedo, and reduced land carbon uptake in a warmer world (Solomon et al., 2010). Therefore, regardless of the global dominance of the contribution from the BGC effects, the role of the contribution from the BGP effects on both regional (local effects) and global (local + non-local effects) climate cannot be overlooked.
For local mitigation and adaptation projects, a separation between local and non-local effects is crucial. While the BGP effects of land-based CDR on global temperature are still subject to ongoing research, such effects are reported to depend on the scale and type of CDR deployment and the resulting modification of the Earth's surface energy balance. In addition to the potential of land-based CDR techniques such as forestation, bioenergy crop cultivation, and soil carbon sequestration practices to alter surface characteristics such as albedo, energy partitioning, evapotranspiration, and surface roughness (Bonan, 2008; Jackson et al., 2008; Betts, 2000; Buechel et al., 2024), these modifications could lead to potential global and regional temperature changes (Cheng et al., 2024; Windisch et al., 2021; Cerasoli et al., 2021) – in some cases even beyond where the LUC is implemented (De Hertog et al., 2023; Winckler et al., 2019a). Such changes in BGP processes can impact local and potentially global temperatures, with effects shown to vary with latitude and regional characteristics, such as instances where reforestation leads to decreased albedo and increased evapotranspiration, affecting cloud cover and regional temperatures with latitudinal dependence (Bright et al., 2017; Arora and Montenegro, 2011). Similarly, agricultural techniques that enhance soil carbon sequestration or the use of bioenergy crops have been reported to have the potential to alter local climate through changes in albedo and surface roughness (Hirsch et al., 2018; Davin et al., 2014). Zickfeld et al. (2023) suggested a continental- or global-scale implementation of land-based CDR techniques would be necessary for significant global temperature modulation, but the results of the combined effects suggest that such an impact might be more visible at local or regional scales of implementation.
4.2 Regional heterogeneity in BGP versus BGC effects on near-surface air temperature
Results from our analysis in Sect. 3.3 confirm heterogeneous BGP effects, where LUC imprints on the spatial temperature pattern, and homogeneous BGC effects. We provide summaries for more regions, with more models, than previous studies. Such regional information is important for anticipating how a region will be affected by LUC and important for knowing what to adapt to. This applies particularly to regions where many models agree on LUC-induced temperature changes, such as NAM, where almost all models (more than in studies before and with a better LUC description and more processes) agree on the cooling, on average by 0.5 °C. Given that LUC needs to adapt to climate change, CDR needs, and the world economy, it is important to factor such benefits in to avoid bad surprises.
The multi-model mean shows a wide spread in ΔTbgp estimates, especially in regions with strong effects, such as NAT and NAM (Fig. 8a and c). This variability is due to diverse responses to LUC and different interpretations of surface flux changes by atmospheric models. The high heterogeneity in BGP effects is due to immediate, heterogeneous local changes in land cover, affecting surface heat fluxes and albedo (Duveiller et al., 2018). Boysen et al. (2014) also noted significant BGP effects in regions with intense LUC, with varied responses depending on the model and region. In tropical regions, changes in latent heat fluxes are more impactful than albedo changes, while in mid- to high-latitude regions, seasonal changes in albedo due to snow cover are influential. Our estimate of the LUC-induced BGP effects is, however, likely an underestimation, as we employed monthly temperatures and thus did not account for the difference between daytime and nighttime temperatures. The difference in impact between daytime versus nighttime temperatures has been shown to differ in directional impact (Lejeune et al., 2017; Qiao et al., 2013; He et al., 2024) and can often average out to near-zero impacts. Sub-diurnal temperatures were also recently demonstrated to have a “reversed asymmetric warming” due to other factors beyond LUC (Zhong et al., 2023). Although beyond the scope of our analysis, we highlight that accounting for the daytime versus nighttime temperature difference could lead to diverging estimates from those presented in this study. The BGC effects, on the other hand, lead to more uniform temperature changes (Fig. 8b and d), as they are influenced by well-mixed GHGs, nutrient cycling from different vegetation types, soil composition, and human activities such as agriculture and deforestation (Pongratz et al., 2010). These processes contribute to a more consistent and homogeneous impact on regional and global climates. Our findings further demonstrate the complexity and heterogeneity of BGP effects on regional climates, emphasizing the need for careful consideration of local LUC effects and their direct impact. In contrast, the more consistent BGC effects reflect the influence of well-mixed GHGs, leading to more uniform temperature changes. Integrating diverse regional responses into global models might be a step in the right direction towards improving the accuracy of climate projections and region-specific mitigation and adaptation strategies.
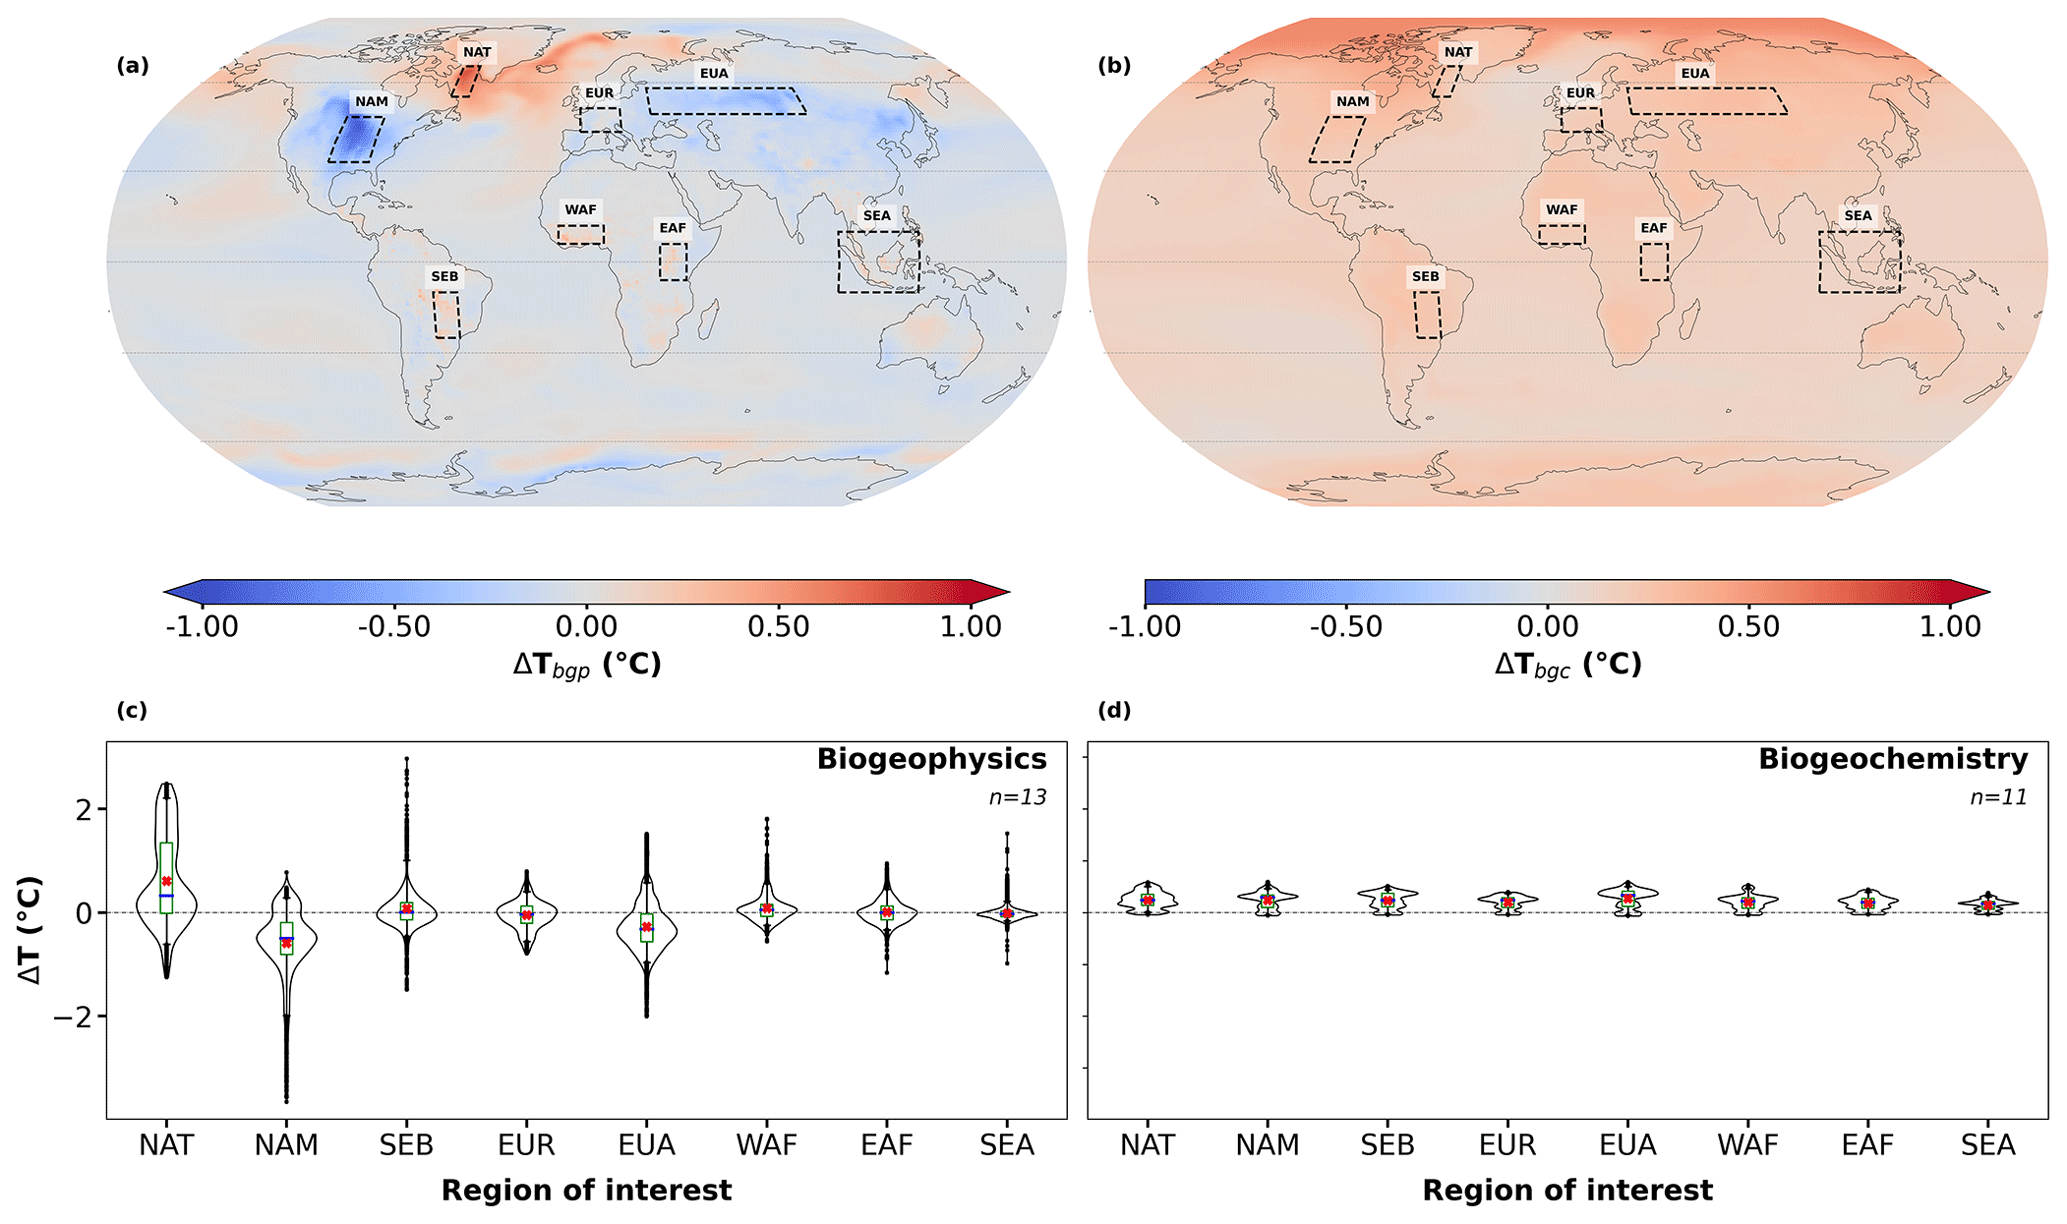
Figure 8Inter-model variability across the ensemble average in near-surface air temperature ΔT due to (a) biogeophysical effects (ΔTbgp) and (b) biogeochemical effects (ΔTbgc) of land-use change, computed as the mean of 13 and 11 Earth system models (ESMs), respectively. Panels (c) and (d) indicate the spread in model estimates of ΔT for the regions highlighted in panels (a) and (b). The violin plot shows the distribution shape of estimates, indicating probability. The green boxplot extends from the first to the third quartile (25th and 75th percentiles, respectively), with the red X and the solid blue bar (–) representing the mean and median estimate from all grid cells within the region of interest, respectively. The vertical whiskers extend from the first to the third quartile (the upper and lower boundaries), while the outliers are represented by *. For ease of reference, Figs. 4a and 3a are reproduced here in panels (a) and (b), respectively.
4.3 Differences across models' estimates of land-use-change carbon emissions
The variability in LUC-induced carbon emissions across ESMs reveals factors driving differences, including gross versus net transitions (Bayer et al., 2017; Bastos et al., 2022), initial carbon pool conditions (Exbrayat et al., 2014; Boysen et al., 2021), and model-specific treatments of factors such as wood harvest (Stocker et al., 2014; Hartung et al., 2021) and irrigation (Roy et al., 2022; Qin et al., 2024). Our study builds on earlier work by quantifying the influence of these factors and examines their interactions in a multi-model framework using the latest ESMs complemented by a survey across modelling teams. Regional patterns confirm carbon losses in tropical regions due to deforestation (Matricardi et al., 2020; Zhu et al., 2023) and gains in Europe from land abandonment and regrowth (Ganzenmüller et al., 2022). Notably, gross transitions amplify flux estimates by capturing bidirectional land-use changes, while model-specific changes point to additional influences, such as irrigation and pre-industrial conditions (Melnikova et al., 2022). We therefore highlight the complexities of simulating LUC impacts and the critical need for harmonized modelling frameworks to improve the reliability and comparability of carbon flux projections across ESMs.
Historically, LUC has had pronounced effects on carbon distribution over land surfaces across the ESMs. The multi-model mean change in carbon due to the historical LUC of Gt C reported earlier is close to the LUC estimates of −110, −128, and −133 Gt C reported by Devaraju et al. (2022), Lawrence et al. (2012), and Simmons and Matthews (2016), respectively, but substantially lower than other estimates (Fig. 7c and Table S2). Beside the −210 Gt C of cumulative emissions from LUC estimated by GCB2023, earlier estimates fall within the upper uncertainty bounds of our reported multi-model mean carbon loss. Our results indicate that the BGC effects of LUC are not only consistent across ESMs but have spatial homogeneity over certain regions. For example, there is a consistent depiction of changes in carbon storage in the Northern Hemisphere, especially over the boreal forests in Canada and Russia, which could be indicative of shifting forest boundaries, logging, or other disturbances in addition to factors such as LUC or pest infestations reported by Foster et al. (2022). Notably, over Europe, we observe an increase in carbon stocks, designating Europe as a carbon sink. In addition to an array of studies (e.g. Kilpeläinen and Peltola, 2022; Pilli et al., 2022; Lasanta et al., 2017), the observed increase across European carbon pools was reported by Ganzenmüller et al. (2022), who largely attributed the increasing carbon stocks to agricultural land abandonment, reforestation, and forest regrowth, among other drivers (e.g. Fayet et al., 2022; Perpiña Castillo et al., 2021). The degree of change near the Arctic region also shows clear variations. Over the Northern Hemisphere, several models indicate carbon gains in parts of North America, Europe, and northern Asia. This is due to forestation, reduced cropping, and/or natural forest regrowth in these regions (Figs. S13 and S14).
In examining regional variability in LUC effects, the US Great Plains region offers insights into model differences, particularly in ΔcSoil estimates (Fig. S5). While models such as BCC and CNRM indicate carbon gain in this region, CESM2 suggests carbon loss. This discrepancy highlights how model-specific assumptions, including those related to grazing, impact soil carbon. Derner et al. (2019) found that grazing does not significantly influence soil carbon levels in the Great Plains – a finding recently contested by Ren et al. (2024). Our analysis similarly finds no systematic relationship between ΔcSoil and models that implement grazing (see Table 1). This lack of alignment suggests that LUC effects on soil carbon in grazing systems may be highly model-dependent, underlining the complex interactions between LUC and regional soil carbon responses. In parts of Western Australia, there is a general agreement (Figs. 2 and S2) among models indicating carbon loss, likely reflecting LUCs such as deforestation and agricultural activities. In contrast, the evident decline in total land carbon over regions including the Amazon rainforest, western and central Africa, and southeastern Asia is consistent with the widely reported tropical deforestation (Smith et al., 2023; Zeng et al., 2021; Lejeune et al., 2018).
Our results on the spatial distribution of both increase and decline in total land carbon (Figs. 2a and S2) are supported by previous model and observation studies, attributing the decline in the tropics to deforestation and land degradation (Zhu et al., 2023; Matricardi et al., 2020; Baccini et al., 2017; Lorenz et al., 2016) and to regrowth following historical wood harvest and deforestation over the US, Russia, and Europe (Pongratz et al., 2008). Our observed carbon gain across Europe is also well corroborated by previous studies (e.g. Winkler et al., 2023; Ganzenmüller et al., 2022; McGrath et al., 2015) in what they attribute to changes in land use and land management primarily due to expanding forest area/regrowth following land abandonment/forest transitions in the 19th and 20th centuries. We find there is a general decrease in ΔcLand over southeastern Asia (Figs. 2 and S2), though with large inter-model variability (Fig. 2b), supported by the findings of Kondo et al. (2022). In their analysis involving TRENDY simulations, some of which also serve (though partly in older model versions) as LSMs of some ESMs used in this study, variability across model estimates of LUC fluxes over southeastern Asia was partly due to incomplete processes in the LUC forcing data, including temporal changes in peatland conversion and the overlooked carbon cycle of oil palm ecosystems. Kondo et al. (2022) also attributed this variability to peak LUC emissions resulting from heavy reliance on forest products in the 1990s, which was later mitigated by forest and environmental policies in the 2000s and beyond. The revealed variability across models underscores the inherent uncertainties associated with modelling complex Earth system processes in addition to model input parameterization.
Furthermore, the implementation of gross versus net transitions of LUC is seen to influence the resulting carbon emissions. Specifically, our estimates of LUC carbon fluxes reveal that ESMs implementing gross transition (i.e. bidirectional land-use changes within a grid cell, e.g. forest to crop and crop to forest) result in higher estimates compared to models implementing net transitions (i.e. overall changes in land-use categories within a grid cell over a given period, without accounting for the processes that occur within the grid cell). Of the 13 ESMs in the present study, all models (except for BCC) considering gross transitions sit within the uncertainty range of the reference value of cumulative emissions due to LUC as estimated by GCB2023. The issue of gross versus net transitions usually relates to the inclusion of shifting cultivation areas in ESMs (Ganzenmüller et al., 2022; Lawrence et al., 2016) but has also been contested to occur everywhere on the globe (Fuchs et al., 2018). Including shifting cultivation is reported to lead to higher estimates of LUC carbon fluxes (Hartung et al., 2021; Stocker et al., 2014; Wilkenskjeld et al., 2014), increasing estimates by 20 %–30 %. Bayer et al. (2017) also noted that accounting for gross transitions significantly amplifies the impact of LUC on carbon stocks and fluxes, releasing up to 15 % more carbon compared to when net transitions were considered. Furthermore, Bastos et al. (2022) highlight substantial differences due to the implementation of gross transitions in estimates based on LUH2 compared to estimates based on other LUC datasets. This suggests that the land-use transition structure within an LSM is likely to govern the model's ability to produce accurate land CO2 fluxes relative to other system parameterizations. We find that BCC and CESM2 are unique among the models in their responses to the gross versus net transition approach to LUC. BCC, which uses gross transitions, simulates carbon gain due to LUC, while CESM2, which employs net transitions, shows a high carbon loss, comparable in magnitude to models using gross transitions. This suggests that, while the distinction between gross and net transitions generally explains model responses to LUC, it does not fully account for the behaviour observed in BCC and CESM2, indicating that additional processes likely influence these outcomes.
Building on this observation, we note here that CESM2 stands out as one of the few models in our study (alongside EC-Earth3 models) that explicitly implements irrigation, a factor we find to correlate with high land CO2 flux estimates (Table 2). Our results suggest that irrigation could also be a contributing factor to the large carbon fluxes in CESM2, as irrigation has been shown in previous studies to increase LUC-related carbon fluxes (Qin et al., 2024; Roy et al., 2022; Taheripour et al., 2013) in addition to its BGP impacts on the land surface (De Hertog et al., 2023; Al-Yaari et al., 2022; de Vrese and Hagemann, 2018). According to de Vrese and Hagemann (2018), irrigation introduces heterogeneity within grid cells by increasing water availability in one part of the cell, creating sharp contrasts in land surface characteristics. This heterogeneity could help explain why CESM2's response to LUC differs from other models and why it shows high carbon loss despite using net transitions. Our findings thus highlight that model configurations, such as irrigation and the choice between gross versus net transitions, interact in complex ways, affecting carbon flux outcomes in ways not solely attributable to LUC representation.
For ESMs simulating wood harvest (ACCESS, CESM2, CMCC, IPSL, GFDL, MIROC, and MPI), biomass due to harvest is transferred to the product pool (on- or off-site) and eventually decays, releasing carbon into the atmosphere. Harvest residues are generally transferred into soil/litter carbon pools, except in CMCC (where the harvest goes into the product pool) and IPSL (where residues are not considered). Additionally, IPSL models wood harvest as an annual event, harvesting only aboveground biomass, which is then allocated to product pools (Lurton et al., 2020). In MIROC, carbon harvesting depends on specific land-use transitions (e.g. conversion of natural vegetation to cropland causes harvesting, whereas cropland or pasture abandonment does not result in carbon removal). In contrast, wood harvest occurs only in ACCESS when forest area decreases. Neglecting wood harvest in carbon flux estimates can significantly impact LUC flux estimates. Wood harvest has been found to contribute between 19 % (Stocker et al., 2014) and 28 % (Hartung et al., 2021) of the cumulative LUC flux, underscoring its critical role in capturing anthropogenic land-use emissions. Together with these findings, our analysis highlights the necessity of including wood harvest in ESMs to achieve more accurate carbon flux estimates.
Another major difference in LUC carbon flux estimates can be linked to the initial conditions (pre-industrial conditions) of the carbon cycle even across models with similar LUC implementation. We observe little to no relationship between the initial conditions and the global changes in the carbon pools (not shown). However, we find spatial correlation at the regional level. The variation in initial conditions of land cover and land use of ESM simulations is known to impact the estimates of global carbon cycle feedback parameters even under idealized scenarios. Using data from six LSMs that also serve as the LSMs for ESMs in this study, Boysen et al. (2021) found that initial soil organic carbon (SOC) stocks differ among LSMs due to different approaches in representing SOC. Using data from 10 ESMs participating in CMIP5 (six of the ESMs using earlier versions of the LSMs to those in this study), Exbrayat et al. (2014) also reported large differences in initial SOC stocks among models due to variations in decomposition processes during model setup. Tian et al. (2015) showed that global SOC stocks varied widely in the first simulation year, while changes over the following years accounted for only a small percentage of the initial SOC stock. Using data from 10 terrestrial biosphere models, they reported a strong correlation between initial (year 1901) and contemporary (year 2010) SOC estimates, driven by significant differences in initial SOC stocks. Recently, Melnikova et al. (2022) noted that, even for the same land cover types, variations in pre-industrial land covers among ESMs result in spatial differences in ecosystem carbon stocks (e.g. models with larger forest cover have larger land carbon pools). It is, therefore, conceivable that models with the same implementation of LUC can lead to order differences on the global scale simply because of the baseline conditions on which the LUC is imposed. Based on our estimates of net LUC carbon flux, we find that a wide margin already exists across model estimates, a range that also existed at the beginning of the CMIP5 historical simulations (Exbrayat et al., 2014). We also find a spatial correlation between the initial conditions (year 1850) and estimates at the end of the simulation (year 2014). Specifically, across the spatial patterns, models like GFDL and CESM2 already show a substantial reduction in total land carbon at the beginning of the simulation (not shown). Since the ESMs used almost similar externally specified land-use forcing, LUH2, we resolve the large range in initial conditions to the internal model differences.
Despite the shared framework of the LUMIP protocol and LUH2 dataset, each ESM's unique architecture leads to considerable variability in outputs. This variation stems from different approaches to LUC implementation and carbon pool accounting, ranging from nuanced LUH-based transitions to aggregated vegetative fractions. Such heterogeneity demonstrates the complexities of simulating land management and carbon dynamics (Boysen et al., 2021) and highlights the challenge of drawing general conclusions about land carbon emissions and temperature responses from an ensemble of ESMs. Consequently, this breadth of outcomes emphasizes a critical point: despite underlying commonalities in data sources and objectives, the disparities in model implementations and results appear to dominate, suggesting that the differences in ESMs' treatment of land management and carbon cycle processes may indeed outweigh their similarities. Furthermore, progressive but non-uniform inclusion of land management practices (see Blyth et al., 2021) is speculated to increase the model spread and thus divergence across model estimates (Pongratz et al., 2018). Such variability not only emphasizes the need for cautious interpretation of model outputs but also signals a pressing need for increased coherence in model development. It also highlights the importance of advancing model intercomparison and harmonization efforts needed to plug the gap between estimates from ESMs. Such efforts will be fundamental to enhancing the reliability and comparability of climate projections crucial for informing global environmental policy and climate action strategies, particularly in the face of increasing land-use changes and their profound climatic implications.
Model intercomparison studies provide a multifaceted advantage, facilitating the computation of the mean response of models, quantifying associated uncertainties by examining the dispersion across different models, and identifying the factors contributing to variability in model estimates. The analysis of land carbon dynamics within LUMIP permits us to explore the progression of LUC representation in ESMs and related signal strengths since LUCID and CMIP5. In this study, we primarily focused on separating the temperature response caused by biogeophysical (BGP) effects of historical land-use change (LUC) from those caused by biogeochemical (BGC) effects. We go beyond previous studies to analyse the most recent CMIP6 data, using state-of-the-art datasets contributed by the LUMIP project in an attempt to improve existing knowledge on the relative contribution of BGP and BGC effects of LUC on climate.
Our results highlight that BGC-induced warming dominates globally, contributing 0.21±0.14 °C to near-surface air temperature, while BGP effects contribute °C on average. These estimates are consistent with earlier studies. However, on regional scales, the BGP effects emerge as critically important, driving cooling over mid- to high-latitude regions and warming in the tropics. For example, while temperate and boreal regions contributed to BGP-induced cooling, the tropical regions contributed to BGP-induced warming during the historical period. These regional impacts are shaped by local feedbacks, such as albedo, surface energy balance, and evapotranspiration, and are further influenced by model-specific representations of vegetation, snow cover, and land management practices. The prevalence of BGP effects in climate analysis remains invaluable for attributing historical climate. As already evidenced by research, land-based CDR techniques, such as reforestation and agricultural practices, can substantially alter surface characteristics such as albedo, evapotranspiration, and roughness, thereby impacting regional and potentially global climate (Zhu et al., 2023; Windisch et al., 2021; Boysen et al., 2020; de Noblet-Ducoudré et al., 2012). Although contingent upon the type and scale of CDR deployment (Zickfeld et al., 2023), the role of BGP effects remains vital for local mitigation and adaptation policies. While the BGC-induced effects exhibit a globally dominant warming effect, highest over the Arctic, we find this to be the only commonality with the BGP effects, transitioning to a cooling strip on land surfaces over the mid- to upper latitudes, from the US Great Plains to the Northeast Plain of Asia. Nuanced warming patches are also evident over the tropics and subtropics, but these signals are largely mixed, indistinguishable, and difficult to attribute.
In exploring the carbon dynamics, we identified the historical effects of LUC on total land carbon (ΔcLand) as consistent in the direction of change across most models, with a mean and spread loss of Gt C. Notably, this differs from the Gt C estimate reported in GCB2023. Our study reveals that historical LUC emissions estimated by coupled models are significantly lower than those reported by other models, such as those used by the Global Carbon Budget. The bookkeeping models used in GCB differ in their assumptions, methodologies, and data inputs from the ESMs used in our study. Coupled models, which account for interactions between climate and land systems, may offer unique insights into land-use impacts on carbon emissions. The discrepant estimates highlight the importance of using diverse modelling approaches to capture the full range of potential impacts of land-use changes. Further investigation into these factors is necessary to reconcile these estimates, improve our understanding of LUC impacts on land carbon dynamics, enhance the accuracy of carbon budget assessments, and inform more effective climate policy strategies.
The contributing fluxes and impacts on specific carbon pools also differ strongly across models and regions, particularly due to the interplay of vegetation cover and carbon pools. While it is possible to attribute trends in ΔcLand to being largely dominated by the contribution from vegetation carbon pools, this generalization does not hold for all ESMs. Despite using the latest generation of ESMs, our results identify a wide variation in land CO2 fluxes, which is largely traceable to the underlying model architecture, particularly in how models implement LUC and land management using the LUH2 dataset. We also see clear differences in the treatment of land management in ESMs but also some common features. Primarily, while what constitutes total land carbon still differs widely across models based on designed model architecture to implement climate processes, common modelling protocols, such as the use of the LUH2 dataset, ensure some degree of consistency in their approaches. We also find that the implementation of gross versus net land-use transitions at the subgrid level also influences estimates of LUC carbon fluxes. Specifically, models implementing gross transitions resulted in higher estimates compared to those implementing net transitions, in addition to other factors such as wood harvest and the initial condition (pre-industrial treatment of land use) of LUC. The resulting range in estimates shows that improvement efforts are needed to narrow the gulf between models to support more robust climate estimates, thus joining earlier recommendations for a better representation of biogeophysical (e.g. Duveiller et al., 2018; Forzieri et al., 2018) and biogeochemical (e.g. Schädel et al., 2024; Bastos et al., 2022) processes in ESMs.
A novel aspect of our study is our attempt to estimate the grid-scale contribution to global temperature change. We show the regional disparity in the BGC contribution to LUC-induced global temperature change as highest over the tropics and subtropics, where LUC was mostly registered. Patches of grid cells over the eastern US and western Europe show a warming contribution to the global temperature. While a BGP-induced cooling contribution is more prevalent over the US and Eurasia, we find warming contributions over regions such as eastern Canada, central Australia, and the tropics. We identified the warming contribution over the tropics resulting from the BGP effects as the only commonality between the BGP and BGC effects. In contrast, the warming pattern around Greenland can only be seen in the BGP contribution, which we attribute to mechanistic non-local LUC-induced effects on ocean currents and sea ice. Treated in combination (BGP and BGC effects), we identify a much higher warming contribution from the North Atlantic attributable to BGP effects, including the local and non-local effects of LUC owing to the teleconnective consequences of LUC occurring elsewhere. Therefore, recognizing and accounting for both the local and non-local effects of LUC on climate is essential for developing holistic climate policies that address the full range of impacts associated with LUC. Such insights, crucial to identifying where land-based projects can potentially alter surface temperature, can enhance mitigation benefits at both the local and global scales. Additionally, the heterogeneous nature of LUC also leads to impacts at scales often too small to be captured by the spatial resolution of most ESMs. The standard ESM output provides only the average grid cell impact. However, for the subgrid areas where the land cover change occurs, the effect might be significantly larger than suggested by the grid cell mean; this phenomenon is also known as “hyper-local” impact. Although these specifics are essential, their considerations are beyond the scope of our analysis. Therefore, we highlight that accounting for these factors, when possible, could lead to diverging estimates from those presented in this study.
Finally, despite advances in LUC representation, substantial variability persists across ESMs owing to differences in model architecture and process implementation. Our estimated BGC-induced warming is close to previously reported values, including estimates from previous generations of models. We anchor our findings on the premise that BGC fluxes typically rely on an ensemble of models for a robust best estimate (e.g. Friedlingstein et al., 2022a, b) despite the difference in implementation of land-use and land management practices across models. Therefore, in concluding this model intercomparison study, we note that an ensemble of the latest generation of ESMs produces a mean and a spread in estimates for both BGP and BGC effects that are large and similar to those observed across previous LUCID and CMIP5 estimates. We have highlighted a few aspects in the model architecture contributing to the observed spread but also note that ESMs currently stand at different progressive stages, with some accounting for more land-use and land management processes than others. As models strive to become more complete by implementing more processes, such improvements could likewise lead to more divergence across model estimates, even with consistent anthropogenic forcings. Convergence can most likely be anticipated when modelling groups are able to achieve reasonable implementation of the major land-use processes, efforts that will be pivotal for and enhance confidence in future climate projections.
Preprocessing and postprocessing scripts, including those used to generate the figures through the article, are available at https://doi.org/10.5281/zenodo.14998926 (Amali, 2025).
All CMIP6 data used in our analysis can be retrieved from the Earth System Grid Federation (ESGF; https://www.esgf-data.dkrz.de/ (last access: 14 August 2023; now redirects to https://esgf-metagrid.cloud.dkrz.de/, ESGF, 2025). TRENDY data are available at http://sites.exeter.ac.uk/trendy/ (last access: 20 May 2025) upon request from Sitch et al. (2015). Secondary data, including those processed from the CMIP6 data archive, can be made available upon reasonable request from the corresponding author.
The supplement related to this article is available online at https://doi.org/10.5194/esd-16-803-2025-supplement.
JP initialized the project and provided the research idea. AAA, CS, and JP designed the study. AAA performed the analysis and wrote the article with inputs from CS and JP. All authors contributed to evaluating the results and proofreading the article.
At least one of the (co-)authors is a member of the editorial board of Earth System Dynamics. The peer-review process was guided by an independent editor, and the authors also have no other competing interests to declare.
Publisher's note: Copernicus Publications remains neutral with regard to jurisdictional claims made in the text, published maps, institutional affiliations, or any other geographical representation in this paper. While Copernicus Publications makes every effort to include appropriate place names, the final responsibility lies with the authors.
This work used resources of the Deutsches Klimarechenzentrum (DKRZ) granted by its Scientific Steering Committee (WLA) under Project ID mj0060. We thank the climate modelling groups for producing and making available their model output, the Earth System Grid Federation (ESGF) for archiving the data and providing access, and the multiple funding agencies that support CMIP6 and ESGF. The EC-Earth3-Veg computations, data handling, and storage were enabled by resources provided by the National Academic Infrastructure for Supercomputing in Sweden (NAISS); the Swedish National Infrastructure for Computing (SNIC) at Tetralith, NSC, Linköping University; and SWESTORE/dCache, partially funded by the Swedish Research Council through grant nos. 2022-06725 and 2018-05973. Amali A. Amali and Julia Pongratz are supported by the German Federal Ministry for Research and Education (BMBF) through the research project STEPSEC (grant no. 01LS2102A).
Ian N. Harman and Tilo Ziehn are supported by funding from the Australian Government's National Environmental Science Program. Julia Pongratz and Victor Brovkin received support from the European Union's Horizon 2020 Research and Innovation Programme as part of the ESM2025 project (grant no. 101003536). Victor Brovkin is supported by the European Research Council (ERC) as part of the Q-Arctic project (grant no. 951288).
This paper was edited by Kirsten Zickfeld and reviewed by two anonymous referees.
Al-Yaari, A., Ducharne, A., Thiery, W., Cheruy, F., and Lawrence, D.: The Role of Irrigation Expansion on Historical Climate Change: Insights From CMIP6, Earth's Future, 10, 1–19, https://doi.org/10.1029/2022EF002859, 2022. a
Amali, A. A.: Amali et al. (2025): Biogeochemical versus biogeophysical temperature effects of historical land-use change in CMIP6, Zenodo [code], https://doi.org/10.5281/zenodo.14998926, 2025. a
Anderson, T. R., Hawkins, E., and Jones, P. D.: CO2, the greenhouse effect and global warming: from the pioneering work of Arrhenius and Callendar to today's Earth System Models, Endeavour, 40, 178–187, https://doi.org/10.1016/j.endeavour.2016.07.002, 2016. a
Arellano-Nava, B., Halloran, P. R., Boulton, C. A., Scourse, J., Butler, P. G., Reynolds, D. J., and Lenton, T. M.: Destabilisation of the Subpolar North Atlantic prior to the Little Ice Age, Nat. Commun., 13, 5008, https://doi.org/10.1038/s41467-022-32653-x, 2022. a
Arora, V. K. and Boer, G. J.: Uncertainties in the 20th century carbon budget associated with land use change, Global Change Biol., 16, 3327–3348, https://doi.org/10.1111/j.1365-2486.2010.02202.x, 2010. a
Arora, V. K. and Montenegro, A.: Small temperature benefits provided by realistic afforestation efforts, Nat. Geosci., 4, 514–518, https://doi.org/10.1038/ngeo1182, 2011. a, b
Arora, V. K., Katavouta, A., Williams, R. G., Jones, C. D., Brovkin, V., Friedlingstein, P., Schwinger, J., Bopp, L., Boucher, O., Cadule, P., Chamberlain, M. A., Christian, J. R., Delire, C., Fisher, R. A., Hajima, T., Ilyina, T., Joetzjer, E., Kawamiya, M., Koven, C. D., Krasting, J. P., Law, R. M., Lawrence, D. M., Lenton, A., Lindsay, K., Pongratz, J., Raddatz, T., Séférian, R., Tachiiri, K., Tjiputra, J. F., Wiltshire, A., Wu, T., and Ziehn, T.: Carbon–concentration and carbon–climate feedbacks in CMIP6 models and their comparison to CMIP5 models, Biogeosciences, 17, 4173–4222, https://doi.org/10.5194/bg-17-4173-2020, 2020. a, b, c
Baccini, A., Walker, W., Carvalho, L., Farina, M., Sulla-Menashe, D., and Houghton, R. A.: Tropical forests are a net carbon source based on aboveground measurements of gain and loss, Science, 358, 230–234, https://doi.org/10.1126/science.aam5962, 2017. a
Balsamo, G., Beljaars, A., Scipal, K., Viterbo, P., Van Den Hurk, B., Hirschi, M., and Betts, A. K.: A Revised Hydrology for the ECMWF Model: Verification from Field Site to Terrestrial Water Storage and Impact in the Integrated Forecast System, J. Hydrometeorol., 10, 623–643, https://doi.org/10.1175/2008JHM1068.1, 2009. a, b
Bastos, A., Ciais, P., Sitch, S., Aragão, L. E. O. C., Chevallier, F., Fawcett, D., Rosan, T. M., Saunois, M., Günther, D., Perugini, L., Robert, C., Deng, Z., Pongratz, J., Ganzenmüller, R., Fuchs, R., Winkler, K., Zaehle, S., and Albergel, C.: On the use of Earth Observation to support estimates of national greenhouse gas emissions and sinks for the Global stocktake process: lessons learned from ESA-CCI RECCAP2, Carbon Balance and Management, 17, 15, https://doi.org/10.1186/s13021-022-00214-w, 2022. a, b, c
Bauer, V. M., Schemm, S., Portmann, R., Zhang, J., Eirund, G. K., De Hertog, S. J., and Zibell, J.: Impacts of North American forest cover changes on the North Atlantic Ocean circulation, Earth Syst. Dynam., 16, 379–409, https://doi.org/10.5194/esd-16-379-2025, 2025. a
Bayer, A. D., Lindeskog, M., Pugh, T. A. M., Anthoni, P. M., Fuchs, R., and Arneth, A.: Uncertainties in the land-use flux resulting from land-use change reconstructions and gross land transitions, Earth Syst. Dynam., 8, 91–111, https://doi.org/10.5194/esd-8-91-2017, 2017. a, b
Betts, R. A.: Offset of the potential carbon sink from boreal forestation by decreases in surface albedo, Nature, 408, 187–190, https://doi.org/10.1038/35041545, 2000. a
Blyth, E. M., Arora, V. K., Clark, D. B., Dadson, S. J., De Kauwe, M. G., Lawrence, D. M., Melton, J. R., Pongratz, J., Turton, R. H., Yoshimura, K., and Yuan, H.: Advances in Land Surface Modelling, Current Climate Change Reports, 7, 45–71, https://doi.org/10.1007/s40641-021-00171-5, 2021. a
Bonan, G. B.: Forests and Climate Change: Forcings, Feedbacks, and the Climate Benefits of Forests, Science, 320, 1444–1449, https://doi.org/10.1126/science.1155121, 2008. a
Boucher, O., Servonnat, J., Albright, A. L., Aumont, O., Balkanski, Y., Bastrikov, V., Bekki, S., Bonnet, R., Bony, S., Bopp, L., Braconnot, P., Brockmann, P., Cadule, P., Caubel, A., Cheruy, F., Codron, F., Cozic, A., Cugnet, D., D'Andrea, F., Davini, P., De Lavergne, C., Denvil, S., Deshayes, J., Devilliers, M., Ducharne, A., Dufresne, J., Dupont, E., Éthé, C., Fairhead, L., Falletti, L., Flavoni, S., Foujols, M., Gardoll, S., Gastineau, G., Ghattas, J., Grandpeix, J., Guenet, B., Guez, E., L., Guilyardi, E., Guimberteau, M., Hauglustaine, D., Hourdin, F., Idelkadi, A., Joussaume, S., Kageyama, M., Khodri, M., Krinner, G., Lebas, N., Levavasseur, G., Lévy, C., Li, L., Lott, F., Lurton, T., Luyssaert, S., Madec, G., Madeleine, J., Maignan, F., Marchand, M., Marti, O., Mellul, L., Meurdesoif, Y., Mignot, J., Musat, I., Ottlé, C., Peylin, P., Planton, Y., Polcher, J., Rio, C., Rochetin, N., Rousset, C., Sepulchre, P., Sima, A., Swingedouw, D., Thiéblemont, R., Traore, A. K., Vancoppenolle, M., Vial, J., Vialard, J., Viovy, N., and Vuichard, N.: Presentation and Evaluation of the IPSL-CM6A-LR Climate Model, J. Adv. Model. Earth Sy., 12, e2019MS002010, https://doi.org/10.1029/2019MS002010, 2020. a, b
Boysen, L. R., Brovkin, V., Arora, V. K., Cadule, P., de Noblet-Ducoudré, N., Kato, E., Pongratz, J., and Gayler, V.: Global and regional effects of land-use change on climate in 21st century simulations with interactive carbon cycle, Earth Syst. Dynam., 5, 309–319, https://doi.org/10.5194/esd-5-309-2014, 2014. a, b, c, d
Boysen, L. R., Brovkin, V., Pongratz, J., Lawrence, D. M., Lawrence, P., Vuichard, N., Peylin, P., Liddicoat, S., Hajima, T., Zhang, Y., Rocher, M., Delire, C., Séférian, R., Arora, V. K., Nieradzik, L., Anthoni, P., Thiery, W., Laguë, M. M., Lawrence, D., and Lo, M.-H.: Global climate response to idealized deforestation in CMIP6 models, Biogeosciences, 17, 5615–5638, https://doi.org/10.5194/bg-17-5615-2020, 2020. a, b, c, d, e, f, g, h, i, j, k, l, m
Boysen, L. R., Brovkin, V., Wårlind, D., Peano, D., Lansø¸, A. S., Delire, C., Burke, E., Poeplau, C., and Don, A.: Evaluation of soil carbon dynamics after forest cover change in CMIP6 land models using chronosequences, Environ. Res. Lett., 16, 074030, https://doi.org/10.1088/1748-9326/ac0be1, 2021. a, b, c, d
Breil, M., Schneider, V. K. M., and Pinto, J. G.: The effect of forest cover changes on the regional climate conditions in Europe during the period 1986–2015, Biogeosciences, 21, 811–824, https://doi.org/10.5194/bg-21-811-2024, 2024. a
Bright, R. M., Davin, E., O'Halloran, T., Pongratz, J., Zhao, K., and Cescatti, A.: Local temperature response to land cover and management change driven by non-radiative processes, Nat. Clim. Change, 7, 296–302, https://doi.org/10.1038/nclimate3250, 2017. a, b
Bromley, G. T., Gerken, T., Prein, A. F., and Stoy, P. C.: Recent Trends in the Near-Surface Climatology of the Northern North American Great Plains, J. Climate, 33, 461–475, https://doi.org/10.1175/JCLI-D-19-0106.1, 2020. a
Brovkin, V., Sitch, S., Von Bloh, W., Claussen, M., Bauer, E., and Cramer, W.: Role of land cover changes for atmospheric CO2 increase and climate change during the last 150 years, Global Change Biology, 10, 1253–1266, https://doi.org/10.1111/j.1365-2486.2004.00812.x, 2004. a, b
Brovkin, V., Claussen, M., Driesschaert, E., Fichefet, T., Kicklighter, D., Loutre, M. F., Matthews, H. D., Ramankutty, N., Schaeffer, M., and Sokolov, A.: Biogeophysical effects of historical land cover changes simulated by six Earth system models of intermediate complexity, Clim. Dynam., 26, 587–600, https://doi.org/10.1007/s00382-005-0092-6, 2006. a
Brovkin, V., Boysen, L., Arora, V. K., Boisier, J. P., Cadule, P., Chini, L., Claussen, M., Friedlingstein, P., Gayler, V., Hurk, B. J. J. M. V. D., Hurtt, G. C., Jones, C. D., Kato, E., Noblet-Ducoudré, N. D., Pacifico, F., Pongratz, J., and Weiss, M.: Effect of Anthropogenic Land-Use and Land-Cover Changes on Climate and Land Carbon Storage in CMIP5 Projections for the Twenty-First Century, J. Climate, 26, 6859–6881, https://doi.org/10.1175/JCLI-D-12-00623.1, 2013. a, b
Bruhwiler, L., Basu, S., Butler, J. H., Chatterjee, A., Dlugokencky, E., Kenney, M. A., McComiskey, A., Montzka, S. A., and Stanitski, D.: Observations of greenhouse gases as climate indicators, Clim. Change, 165, 12, https://doi.org/10.1007/s10584-021-03001-7, 2021. a, b
Buechel, M., Slater, L., and Dadson, S.: Broadleaf afforestation impacts on terrestrial hydrology insignificant compared to climate change in Great Britain, Hydrol. Earth Syst. Sci., 28, 2081–2105, https://doi.org/10.5194/hess-28-2081-2024, 2024. a, b
Canadell, J. G., Monteiro, P. M., Costa, M. H., Cunha, L. C. d., Cox, P. M., Eliseev, A. V., Henson, S., Ishii, M., Jaccard, S., Koven, C., Lohila, A., Patra, P. K., Piao, S., Rogelj, J., Syampungani, S., Zaehle, S., and Zickfeld, K.: Global Carbon and other Biogeochemical Cycles and Feedbacks, in: Climate Change 2021: The Physical Science Basis. Contribution of Working Group I to the Sixth Assessment Report of the Intergovernmental Panel on Climate Change, edited by: Masson-Delmotte, V., Zhai, P., Pirani, A., Connors, S. L., Péan, C., Berger, S., Caud, N., Chen, Y., Goldfarb, L., Gomis, M. I., Huang, M., Leitzell, K., Lonnoy, E., Matthews, R. J., Maycock, T. K., Waterfield, T., Yelekçi, O., Yu, R., and Zhou, B., 673–816, Cambridge University Press, Cambridge, United Kingdom and New York, NY, USA,, ISBN 978-1-00-915789-6, https://doi.org/10.1017/9781009157896.007, 2021. a
Cerasoli, S., Yin, J., and Porporato, A.: Cloud cooling effects of afforestation and reforestation at midlatitudes, P. Natl. Acad. Sci. USA, 118, e2026241118, https://doi.org/10.1073/pnas.2026241118, 2021. a
Chang, J., Ciais, P., Gasser, T., Smith, P., Herrero, M., Havlík, P., Obersteiner, M., Guenet, B., Goll, D. S., Li, W., Naipal, V., Peng, S., Qiu, C., Tian, H., Viovy, N., Yue, C., and Zhu, D.: Climate warming from managed grasslands cancels the cooling effect of carbon sinks in sparsely grazed and natural grasslands, Nat. Commun., 12, 118, https://doi.org/10.1038/s41467-020-20406-7, 2021. a
Chen, L. and Dirmeyer, P. A.: Distinct Impacts of Land Use and Land Management on Summer Temperatures, Front. Earth Sci., 8, 245, https://doi.org/10.3389/feart.2020.00245, 2020. a
Cheng, Y., Lawrence, D. M., Pan, M., Zhang, B., Graham, N. T., Lawrence, P. J., Liu, Z., and He, X.: A bioenergy-focused versus a reforestation-focused mitigation pathway yields disparate carbon storage and climate responses, P. Natl. Acad. Sci. USA, 121, e2306775121, https://doi.org/10.1073/pnas.2306775121, 2024. a
Chini, L., Hurtt, G., Sahajpal, R., Frolking, S., Klein Goldewijk, K., Sitch, S., Ganzenmüller, R., Ma, L., Ott, L., Pongratz, J., and Poulter, B.: Land-use harmonization datasets for annual global carbon budgets, Earth Syst. Sci. Data, 13, 4175–4189, https://doi.org/10.5194/essd-13-4175-2021, 2021. a
Christidis, N., Stott, P. A., Hegerl, G. C., and Betts, R. A.: The role of land use change in the recent warming of daily extreme temperatures, Geophys. Res. Lett., 40, 589–594, https://doi.org/10.1002/grl.50159, 2013. a
ESGF: CMIP6, ESGF [data set], https://esgf-metagrid.cloud.dkrz.de/ (last access: 11 June 2025), 2025. a
Cohen, J., Pfeiffer, K., and Francis, J. A.: Warm Arctic episodes linked with increased frequency of extreme winter weather in the United States, Nat. Commun., 9, 869, https://doi.org/10.1038/s41467-018-02992-9, 2018. a
Collier, N., Hoffman, F. M., Lawrence, D. M., Keppel-Aleks, G., Koven, C. D., Riley, W. J., Mu, M., and Randerson, J. T.: The International Land Model Benchmarking (ILAMB) System: Design, Theory, and Implementation, J. Adv. Model. Earth Sy., 10, 2731–2754, https://doi.org/10.1029/2018MS001354, 2018. a
Danabasoglu, G., Lamarque, J., Bacmeister, J., Bailey, D. A., DuVivier, A. K., Edwards, J., Emmons, L. K., Fasullo, J., Garcia, R., Gettelman, A., Hannay, C., Holland, M. M., Large, W. G., Lauritzen, P. H., Lawrence, D. M., Lenaerts, J. T. M., Lindsay, K., Lipscomb, W. H., Mills, M. J., Neale, R., Oleson, K. W., Otto-Bliesner, B., Phillips, A. S., Sacks, W., Tilmes, S., Kampenhout, L., Vertenstein, M., Bertini, A., Dennis, J., Deser, C., Fischer, C., Fox-Kemper, B., Kay, J. E., Kinnison, D., Kushner, P. J., Larson, V. E., Long, M. C., Mickelson, S., Moore, J. K., Nienhouse, E., Polvani, L., Rasch, P. J., and Strand, W. G.: The Community Earth System Model Version 2 (CESM2), J. Adv. Model. Earth Sy., 12, 1–35, https://doi.org/10.1029/2019MS001916, 2020. a, b
Davin, E. L. and De Noblet-Ducoudré, N.: Climatic Impact of Global-Scale Deforestation: Radiative versus Nonradiative Processes, J. Climate, 23, 97–112, https://doi.org/10.1175/2009JCLI3102.1, 2010. a, b, c, d
Davin, E. L., de Noblet-Ducoudré, N., and Friedlingstein, P.: Impact of land cover change on surface climate: Relevance of the radiative forcing concept, Geophys. Res. Lett., 34, L13702, https://doi.org/10.1029/2007GL029678, 2007. a
Davin, E. L., Seneviratne, S. I., Ciais, P., Olioso, A., and Wang, T.: Preferential cooling of hot extremes from cropland albedo management, P. Natl. Acad. Sci. USA, 111, 9757–9761, https://doi.org/10.1073/pnas.1317323111, 2014. a
Davin, E. L., Rechid, D., Breil, M., Cardoso, R. M., Coppola, E., Hoffmann, P., Jach, L. L., Katragkou, E., de Noblet-Ducoudré, N., Radtke, K., Raffa, M., Soares, P. M. M., Sofiadis, G., Strada, S., Strandberg, G., Tölle, M. H., Warrach-Sagi, K., and Wulfmeyer, V.: Biogeophysical impacts of forestation in Europe: first results from the LUCAS (Land Use and Climate Across Scales) regional climate model intercomparison, Earth Syst. Dynam., 11, 183–200, https://doi.org/10.5194/esd-11-183-2020, 2020. a
De Hertog, S. J., Havermann, F., Vanderkelen, I., Guo, S., Luo, F., Manola, I., Coumou, D., Davin, E. L., Duveiller, G., Lejeune, Q., Pongratz, J., Schleussner, C.-F., Seneviratne, S. I., and Thiery, W.: The biogeophysical effects of idealized land cover and land management changes in Earth system models, Earth Syst. Dynam., 14, 629–667, https://doi.org/10.5194/esd-14-629-2023, 2023. a, b, c, d, e, f
Delire, C., Séférian, R., Decharme, B., Alkama, R., Calvet, J., Carrer, D., Gibelin, A., Joetzjer, E., Morel, X., Rocher, M., and Tzanos, D.: The Global Land Carbon Cycle Simulated With ISBA-CTRIP: Improvements Over the Last Decade, J. Adv. Model. Earth Sy., 12, e2019MS001886, https://doi.org/10.1029/2019MS001886, 2020. a, b
De Noblet-Ducoudré, N., Boisier, J.-P., Pitman, A., Bonan, G. B., Brovkin, V., Cruz, F., Delire, C., Gayler, V., Van Den Hurk, B. J. J. M., Lawrence, P. J., Van Der Molen, M. K., Müller, C., Reick, C. H., Strengers, B. J., and Voldoire, A.: Determining Robust Impacts of Land-Use-Induced Land Cover Changes on Surface Climate over North America and Eurasia: Results from the First Set of LUCID Experiments, J. Climate, 25, 3261–3281, https://doi.org/10.1175/JCLI-D-11-00338.1, 2012. a, b, c, d, e, f, g, h
Derner, J. D., Augustine, D. J., and Frank, D. A.: Does Grazing Matter for Soil Organic Carbon Sequestration in the Western North American Great Plains?, Ecosystems, 22, 1088–1094, https://doi.org/10.1007/s10021-018-0324-3, 2019. a
Devaraju, N., De Noblet-Ducoudré, N., Quesada, B., and Bala, G.: Quantifying the Relative Importance of Direct and Indirect Biophysical Effects of Deforestation on Surface Temperature and Teleconnections, J. Climate, 31, 3811–3829, https://doi.org/10.1175/JCLI-D-17-0563.1, 2018. a
Devaraju, N., Tharammal, T., and Bala, G.: Biophysical and biogeochemical effects of historical and future scenarios of anthropogenic land cover change on climate, Research Square, https://doi.org/10.21203/rs.3.rs-2292826/v1, 2022. a, b
de Vrese, P. and Hagemann, S.: Uncertainties in modelling the climate impact of irrigation, Clim. Dynam., 51, 2023–2038, https://doi.org/10.1007/s00382-017-3996-z, 2018. a, b
Diffenbaugh, N. S.: Influence of modern land cover on the climate of the United States, Clim. Dynam., 33, 945–958, https://doi.org/10.1007/s00382-009-0566-z, 2009. a
Dong, N., Liu, Z., Luo, M., Fang, C., and Lin, H.: The Effects of Anthropogenic Land Use Changes on Climate in China Driven by Global Socioeconomic and Emission Scenarios, Earth's Future, 7, 784–804, https://doi.org/10.1029/2018EF000932, 2019. a
Dunne, J. P., Horowitz, L. W., Adcroft, A. J., Ginoux, P., Held, I. M., John, J. G., Krasting, J. P., Malyshev, S., Naik, V., Paulot, F., Shevliakova, E., Stock, C. A., Zadeh, N., Balaji, V., Blanton, C., Dunne, K. A., Dupuis, C., Durachta, J., Dussin, R., Gauthier, P. P. G., Griffies, S. M., Guo, H., Hallberg, R. W., Harrison, M., He, J., Hurlin, W., McHugh, C., Menzel, R., Milly, P. C. D., Nikonov, S., Paynter, D. J., Ploshay, J., Radhakrishnan, A., Rand, K., Reichl, B. G., Robinson, T., Schwarzkopf, D. M., Sentman, L. T., Underwood, S., Vahlenkamp, H., Winton, M., Wittenberg, A. T., Wyman, B., Zeng, Y., and Zhao, M.: The GFDL Earth System Model Version 4.1 (GFDL-ESM 4.1): Overall Coupled Model Description and Simulation Characteristics, J. Adv. Model. Earth Sy., 12, e2019MS002015, https://doi.org/10.1029/2019MS002015, 2020. a, b
Duveiller, G., Forzieri, G., Robertson, E., Li, W., Georgievski, G., Lawrence, P., Wiltshire, A., Ciais, P., Pongratz, J., Sitch, S., Arneth, A., and Cescatti, A.: Biophysics and vegetation cover change: a process-based evaluation framework for confronting land surface models with satellite observations, Earth Syst. Sci. Data, 10, 1265–1279, https://doi.org/10.5194/essd-10-1265-2018, 2018. a, b, c
Duveiller, G., Caporaso, L., Abad-Viñas, R., Perugini, L., Grassi, G., Arneth, A., and Cescatti, A.: Local biophysical effects of land use and land cover change: towards an assessment tool for policy makers, Land Use Policy, 91, 104382, https://doi.org/10.1016/j.landusepol.2019.104382, 2020. a
Döscher, R., Acosta, M., Alessandri, A., Anthoni, P., Arsouze, T., Bergman, T., Bernardello, R., Boussetta, S., Caron, L.-P., Carver, G., Castrillo, M., Catalano, F., Cvijanovic, I., Davini, P., Dekker, E., Doblas-Reyes, F. J., Docquier, D., Echevarria, P., Fladrich, U., Fuentes-Franco, R., Gröger, M., v. Hardenberg, J., Hieronymus, J., Karami, M. P., Keskinen, J.-P., Koenigk, T., Makkonen, R., Massonnet, F., Ménégoz, M., Miller, P. A., Moreno-Chamarro, E., Nieradzik, L., van Noije, T., Nolan, P., O'Donnell, D., Ollinaho, P., van den Oord, G., Ortega, P., Prims, O. T., Ramos, A., Reerink, T., Rousset, C., Ruprich-Robert, Y., Le Sager, P., Schmith, T., Schrödner, R., Serva, F., Sicardi, V., Sloth Madsen, M., Smith, B., Tian, T., Tourigny, E., Uotila, P., Vancoppenolle, M., Wang, S., Wårlind, D., Willén, U., Wyser, K., Yang, S., Yepes-Arbós, X., and Zhang, Q.: The EC-Earth3 Earth system model for the Coupled Model Intercomparison Project 6, Geosci. Model Dev., 15, 2973–3020, https://doi.org/10.5194/gmd-15-2973-2022, 2022. a, b, c
Eby, M., Weaver, A. J., Alexander, K., Zickfeld, K., Abe-Ouchi, A., Cimatoribus, A. A., Crespin, E., Drijfhout, S. S., Edwards, N. R., Eliseev, A. V., Feulner, G., Fichefet, T., Forest, C. E., Goosse, H., Holden, P. B., Joos, F., Kawamiya, M., Kicklighter, D., Kienert, H., Matsumoto, K., Mokhov, I. I., Monier, E., Olsen, S. M., Pedersen, J. O. P., Perrette, M., Philippon-Berthier, G., Ridgwell, A., Schlosser, A., Schneider von Deimling, T., Shaffer, G., Smith, R. S., Spahni, R., Sokolov, A. P., Steinacher, M., Tachiiri, K., Tokos, K., Yoshimori, M., Zeng, N., and Zhao, F.: Historical and idealized climate model experiments: an intercomparison of Earth system models of intermediate complexity, Clim. Past, 9, 1111–1140, https://doi.org/10.5194/cp-9-1111-2013, 2013. a
Ellis, E. C.: Land Use and Ecological Change: A 12,000-Year History, Annu. Rev. Environ. Resour., 46, 1–33, https://doi.org/10.1146/annurev-environ-012220-010822, 2021. a
Erb, K.-H., Kastner, T., Plutzar, C., Bais, A. L. S., Carvalhais, N., Fetzel, T., Gingrich, S., Haberl, H., Lauk, C., Niedertscheider, M., Pongratz, J., Thurner, M., and Luyssaert, S.: Unexpectedly large impact of forest management and grazing on global vegetation biomass, Nature, 553, 73–76, https://doi.org/10.1038/nature25138, 2018. a
Exbrayat, J.-F., Pitman, A. J., and Abramowitz, G.: Response of microbial decomposition to spin-up explains CMIP5 soil carbon range until 2100, Geosci. Model Dev., 7, 2683–2692, https://doi.org/10.5194/gmd-7-2683-2014, 2014. a, b, c
Eyring, V., Bony, S., Meehl, G. A., Senior, C. A., Stevens, B., Stouffer, R. J., and Taylor, K. E.: Overview of the Coupled Model Intercomparison Project Phase 6 (CMIP6) experimental design and organization, Geosci. Model Dev., 9, 1937–1958, https://doi.org/10.5194/gmd-9-1937-2016, 2016. a, b
Fayet, C. M., Reilly, K. H., Van Ham, C., and Verburg, P. H.: The potential of European abandoned agricultural lands to contribute to the Green Deal objectives: Policy perspectives, Environ. Sci. Policy, 133, 44–53, https://doi.org/10.1016/j.envsci.2022.03.007, 2022. a
Findell, K. L., Berg, A., Gentine, P., Krasting, J. P., Lintner, B. R., Malyshev, S., Santanello, J. A., and Shevliakova, E.: The impact of anthropogenic land use and land cover change on regional climate extremes, Nat. Commun., 8, 989, https://doi.org/10.1038/s41467-017-01038-w, 2017. a
Forzieri, G., Duveiller, G., Georgievski, G., Li, W., Robertson, E., Kautz, M., Lawrence, P., Garcia San Martin, L., Anthoni, P., Ciais, P., Pongratz, J., Sitch, S., Wiltshire, A., Arneth, A., and Cescatti, A.: Evaluating the Interplay Between Biophysical Processes and Leaf Area Changes in Land Surface Models, J. Adv. Model. Earth Sy., 10, 1102–1126, https://doi.org/10.1002/2018MS001284, 2018. a
Foster, A. C., Wang, J. A., Frost, G. V., Davidson, S. J., Hoy, E., Turner, K. W., Sonnentag, O., Epstein, H., Berner, L. T., Armstrong, A. H., Kang, M., Rogers, B. M., Campbell, E., Miner, K. R., Orndahl, K. M., Bourgeau-Chavez, L. L., Lutz, D. A., French, N., Chen, D., Du, J., Shestakova, T. A., Shuman, J. K., Tape, K., Virkkala, A.-M., Potter, C., and Goetz, S.: Disturbances in North American boreal forest and Arctic tundra: impacts, interactions, and responses, Environ. Res. Lett., 17, 113001, https://doi.org/10.1088/1748-9326/ac98d7, 2022. a
Friedlingstein, P., Jones, M. W., O'Sullivan, M., Andrew, R. M., Bakker, D. C. E., Hauck, J., Le Quéré, C., Peters, G. P., Peters, W., Pongratz, J., Sitch, S., Canadell, J. G., Ciais, P., Jackson, R. B., Alin, S. R., Anthoni, P., Bates, N. R., Becker, M., Bellouin, N., Bopp, L., Chau, T. T. T., Chevallier, F., Chini, L. P., Cronin, M., Currie, K. I., Decharme, B., Djeutchouang, L. M., Dou, X., Evans, W., Feely, R. A., Feng, L., Gasser, T., Gilfillan, D., Gkritzalis, T., Grassi, G., Gregor, L., Gruber, N., Gürses, Ö., Harris, I., Houghton, R. A., Hurtt, G. C., Iida, Y., Ilyina, T., Luijkx, I. T., Jain, A., Jones, S. D., Kato, E., Kennedy, D., Klein Goldewijk, K., Knauer, J., Korsbakken, J. I., Körtzinger, A., Landschützer, P., Lauvset, S. K., Lefèvre, N., Lienert, S., Liu, J., Marland, G., McGuire, P. C., Melton, J. R., Munro, D. R., Nabel, J. E. M. S., Nakaoka, S.-I., Niwa, Y., Ono, T., Pierrot, D., Poulter, B., Rehder, G., Resplandy, L., Robertson, E., Rödenbeck, C., Rosan, T. M., Schwinger, J., Schwingshackl, C., Séférian, R., Sutton, A. J., Sweeney, C., Tanhua, T., Tans, P. P., Tian, H., Tilbrook, B., Tubiello, F., van der Werf, G. R., Vuichard, N., Wada, C., Wanninkhof, R., Watson, A. J., Willis, D., Wiltshire, A. J., Yuan, W., Yue, C., Yue, X., Zaehle, S., and Zeng, J.: Global Carbon Budget 2021, Earth Syst. Sci. Data, 14, 1917–2005, https://doi.org/10.5194/essd-14-1917-2022, 2022a. a, b
Friedlingstein, P., O'Sullivan, M., Jones, M. W., Andrew, R. M., Gregor, L., Hauck, J., Le Quéré, C., Luijkx, I. T., Olsen, A., Peters, G. P., Peters, W., Pongratz, J., Schwingshackl, C., Sitch, S., Canadell, J. G., Ciais, P., Jackson, R. B., Alin, S. R., Alkama, R., Arneth, A., Arora, V. K., Bates, N. R., Becker, M., Bellouin, N., Bittig, H. C., Bopp, L., Chevallier, F., Chini, L. P., Cronin, M., Evans, W., Falk, S., Feely, R. A., Gasser, T., Gehlen, M., Gkritzalis, T., Gloege, L., Grassi, G., Gruber, N., Gürses, Ö., Harris, I., Hefner, M., Houghton, R. A., Hurtt, G. C., Iida, Y., Ilyina, T., Jain, A. K., Jersild, A., Kadono, K., Kato, E., Kennedy, D., Klein Goldewijk, K., Knauer, J., Korsbakken, J. I., Landschützer, P., Lefèvre, N., Lindsay, K., Liu, J., Liu, Z., Marland, G., Mayot, N., McGrath, M. J., Metzl, N., Monacci, N. M., Munro, D. R., Nakaoka, S.-I., Niwa, Y., O'Brien, K., Ono, T., Palmer, P. I., Pan, N., Pierrot, D., Pocock, K., Poulter, B., Resplandy, L., Robertson, E., Rödenbeck, C., Rodriguez, C., Rosan, T. M., Schwinger, J., Séférian, R., Shutler, J. D., Skjelvan, I., Steinhoff, T., Sun, Q., Sutton, A. J., Sweeney, C., Takao, S., Tanhua, T., Tans, P. P., Tian, X., Tian, H., Tilbrook, B., Tsujino, H., Tubiello, F., van der Werf, G. R., Walker, A. P., Wanninkhof, R., Whitehead, C., Willstrand Wranne, A., Wright, R., Yuan, W., Yue, C., Yue, X., Zaehle, S., Zeng, J., and Zheng, B.: Global Carbon Budget 2022, Earth Syst. Sci. Data, 14, 4811–4900, https://doi.org/10.5194/essd-14-4811-2022, 2022b. a
Friedlingstein, P., O'Sullivan, M., Jones, M. W., Andrew, R. M., Bakker, D. C. E., Hauck, J., Landschützer, P., Le Quéré, C., Luijkx, I. T., Peters, G. P., Peters, W., Pongratz, J., Schwingshackl, C., Sitch, S., Canadell, J. G., Ciais, P., Jackson, R. B., Alin, S. R., Anthoni, P., Barbero, L., Bates, N. R., Becker, M., Bellouin, N., Decharme, B., Bopp, L., Brasika, I. B. M., Cadule, P., Chamberlain, M. A., Chandra, N., Chau, T.-T.-T., Chevallier, F., Chini, L. P., Cronin, M., Dou, X., Enyo, K., Evans, W., Falk, S., Feely, R. A., Feng, L., Ford, D. J., Gasser, T., Ghattas, J., Gkritzalis, T., Grassi, G., Gregor, L., Gruber, N., Gürses, Ö., Harris, I., Hefner, M., Heinke, J., Houghton, R. A., Hurtt, G. C., Iida, Y., Ilyina, T., Jacobson, A. R., Jain, A., Jarníková, T., Jersild, A., Jiang, F., Jin, Z., Joos, F., Kato, E., Keeling, R. F., Kennedy, D., Klein Goldewijk, K., Knauer, J., Korsbakken, J. I., Körtzinger, A., Lan, X., Lefèvre, N., Li, H., Liu, J., Liu, Z., Ma, L., Marland, G., Mayot, N., McGuire, P. C., McKinley, G. A., Meyer, G., Morgan, E. J., Munro, D. R., Nakaoka, S.-I., Niwa, Y., O'Brien, K. M., Olsen, A., Omar, A. M., Ono, T., Paulsen, M., Pierrot, D., Pocock, K., Poulter, B., Powis, C. M., Rehder, G., Resplandy, L., Robertson, E., Rödenbeck, C., Rosan, T. M., Schwinger, J., Séférian, R., Smallman, T. L., Smith, S. M., Sospedra-Alfonso, R., Sun, Q., Sutton, A. J., Sweeney, C., Takao, S., Tans, P. P., Tian, H., Tilbrook, B., Tsujino, H., Tubiello, F., van der Werf, G. R., van Ooijen, E., Wanninkhof, R., Watanabe, M., Wimart-Rousseau, C., Yang, D., Yang, X., Yuan, W., Yue, X., Zaehle, S., Zeng, J., and Zheng, B.: Global Carbon Budget 2023, Earth Syst. Sci. Data, 15, 5301–5369, https://doi.org/10.5194/essd-15-5301-2023, 2023. a, b, c, d, e, f, g, h
Fuchs, R., Prestele, R., and Verburg, P. H.: A global assessment of gross and net land change dynamics for current conditions and future scenarios, Earth Syst. Dynam., 9, 441–458, https://doi.org/10.5194/esd-9-441-2018, 2018. a
Fuhrman, J., Bergero, C., Weber, M., Monteith, S., Wang, F. M., Clarens, A. F., Doney, S. C., Shobe, W., and McJeon, H.: Diverse carbon dioxide removal approaches could reduce impacts on the energy–water–land system, Nat. Clim. Change, 13, 341–350, https://doi.org/10.1038/s41558-023-01604-9, 2023. a
Ganzenmüller, R., Bultan, S., Winkler, K., Fuchs, R., Zabel, F., and Pongratz, J.: Land-use change emissions based on high-resolution activity data substantially lower than previously estimated, Environ. Res. Lett., 17, 064050, https://doi.org/10.1088/1748-9326/ac70d8, 2022. a, b, c, d, e
Gier, B. K., Buchwitz, M., Reuter, M., Cox, P. M., Friedlingstein, P., and Eyring, V.: Spatially resolved evaluation of Earth system models with satellite column-averaged CO2, Biogeosciences, 17, 6115–6144, https://doi.org/10.5194/bg-17-6115-2020, 2020. a
Gillett, N. P., Arora, V. K., Matthews, D., and Allen, M. R.: Constraining the Ratio of Global Warming to Cumulative CO2 Emissions Using CMIP5 Simulations, J. Climate, 26, 6844–6858, https://doi.org/10.1175/JCLI-D-12-00476.1, 2013. a, b, c
Grant, L., Gudmundsson, L., Davin, E. L., Lawrence, D. M., Vuichard, N., Robertson, E., Séférian, R., Ribes, A., Hirsch, A. L., and Thiery, W.: Biogeophysical Effects of Land-Use and Land-Cover Change Not Detectable in Warmest Month, J. Climate, 36, 1845–1861, https://doi.org/10.1175/JCLI-D-22-0391.1, 2023. a, b, c, d, e
Hajima, T., Watanabe, M., Yamamoto, A., Tatebe, H., Noguchi, M. A., Abe, M., Ohgaito, R., Ito, A., Yamazaki, D., Okajima, H., Ito, A., Takata, K., Ogochi, K., Watanabe, S., and Kawamiya, M.: Development of the MIROC-ES2L Earth system model and the evaluation of biogeochemical processes and feedbacks, Geosci. Model Dev., 13, 2197–2244, https://doi.org/10.5194/gmd-13-2197-2020, 2020. a, b
Hajima, T., Kawamiya, M., Ito, A., Tachiiri, K., Jones, C. D., Arora, V., Brovkin, V., Séférian, R., Liddicoat, S., Friedlingstein, P., and Shevliakova, E.: Consistency of global carbon budget between concentration- and emission-driven historical experiments simulated by CMIP6 Earth system models and suggestions for improved simulation of CO2 concentration, Biogeosciences, 22, 1447–1473, https://doi.org/10.5194/bg-22-1447-2025, 2025. a
Hansen, J. E., Sato, M., Lacis, A., Ruedy, R., Tegen, I., and Matthews, E.: Climate forcings in the Industrial era, P. Natl. Acad. Sci. USA, 95, 12753–12758, https://doi.org/10.1073/pnas.95.22.12753, 1998. a
Hartung, K., Bastos, A., Chini, L., Ganzenmüller, R., Havermann, F., Hurtt, G. C., Loughran, T., Nabel, J. E. M. S., Nützel, T., Obermeier, W. A., and Pongratz, J.: Bookkeeping estimates of the net land-use change flux – a sensitivity study with the CMIP6 land-use dataset, Earth Syst. Dynam., 12, 763–782, https://doi.org/10.5194/esd-12-763-2021, 2021. a, b, c
Hazeleger, W., Wang, X., Severijns, C., Ştefănescu, S., Bintanja, R., Sterl, A., Wyser, K., Semmler, T., Yang, S., Van Den Hurk, B., Van Noije, T., Van Der Linden, E., and Van Der Wiel, K.: EC-Earth V2.2: description and validation of a new seamless earth system prediction model, Clim. Dynam., 39, 2611–2629, https://doi.org/10.1007/s00382-011-1228-5, 2012. a
He, T., Wang, N., Chen, J., Wu, F., Xu, X., Liu, L., Han, D., Sun, Z., Lu, Y., Hao, Y., and Qiao, Z.: Direct and indirect impacts of land use/cover change on urban heat environment: a 15-year panel data study across 365 Chinese cities during summer daytime and nighttime, Landscape Ecology, 39, 67, https://doi.org/10.1007/s10980-024-01807-1, 2024. a
Hegerl, G. C., Zwiers, F. W., Braconnot, P., Gillett, N. P., Luo, Y., Orsini, J. A. M., Nicholls, N., Penner, J. E., Stott, P. A., Allen, M., Ammann, C., Andronova, N., Betts, R. A., Clement, A., Collins, W. D., Crooks, S., Delworth, T. L., Forest, C., Forster, P., Goosse, H., Gregory, J. M., Harvey, D., Jones, G. S., Joos, F., Kenyon, J., Kettleborough, J., Kharin, V., Knutti, R., Lambert, F. H., Lavine, M., Lee, T. C. K., Levinson, D., Masson-Delmotte, V., Nozawa, T., Otto-Bliesner, B., Pierce, D., Power, S., Rind, D., Rotstayn, L., Santer, B. D., Senior, C., Sexton, D., Stark, S., Stone, D. A., Tett, S., Thorne, P., van Dorland, R., Wong, T., Xu, L., Zhang, X., Zorita, E., Karoly, D. J., Ogallo, L., and Planton, S.: Understanding and Attributing Climate Change, in: Climate Change 2007: The Physical Science Basis. Contribution of Working Group I to the Fourth Assessment Report of the Intergovernmental Panel on Climate Change, edited by: Solomon, S., Qin, D., Manning, M., Zhenlin, C., Melinda, M., Averyt, K. B., Tignor, M., and Miller, H. L., 663–745, Cambridge University Press, Cambridge, United Kingdom and New York, NY, USA, ISBN 978-0-521-88009-1, https://www.ipcc.ch/site/assets/uploads/2018/02/ar4-wg1-chapter9-1.pdf (last access: 20 May 2025), 2007. a, b
Hirsch, A. L., Guillod, B. P., Seneviratne, S. I., Beyerle, U., Boysen, L. R., Brovkin, V., Davin, E. L., Doelman, J. C., Kim, H., Mitchell, D. M., Nitta, T., Shiogama, H., Sparrow, S., Stehfest, E., van Vuuren, D. P., and Wilson, S.: Biogeophysical Impacts of Land-Use Change on Climate Extremes in Low-Emission Scenarios: Results From HAPPI-Land, Earth's Future, 6, 396–409, https://doi.org/10.1002/2017EF000744, 2018. a
Hong, C., Burney, J. A., Pongratz, J., Nabel, J. E. M. S., Mueller, N. D., Jackson, R. B., and Davis, S. J.: Global and regional drivers of land-use emissions in 1961–2017, Nature, 589, 554–561, https://doi.org/10.1038/s41586-020-03138-y, 2021. a
Hurtt, G. C., Chini, L., Sahajpal, R., Frolking, S., Bodirsky, B. L., Calvin, K., Doelman, J. C., Fisk, J., Fujimori, S., Klein Goldewijk, K., Hasegawa, T., Havlik, P., Heinimann, A., Humpenöder, F., Jungclaus, J., Kaplan, J. O., Kennedy, J., Krisztin, T., Lawrence, D., Lawrence, P., Ma, L., Mertz, O., Pongratz, J., Popp, A., Poulter, B., Riahi, K., Shevliakova, E., Stehfest, E., Thornton, P., Tubiello, F. N., van Vuuren, D. P., and Zhang, X.: Harmonization of global land use change and management for the period 850–2100 (LUH2) for CMIP6, Geosci. Model Dev., 13, 5425–5464, https://doi.org/10.5194/gmd-13-5425-2020, 2020. a, b, c
Ito, A. and Hajima, T.: Biogeophysical and biogeochemical impacts of land-use change simulated by MIROC-ES2L, Progress in Earth and Planetary Science, 7, 54, https://doi.org/10.1186/s40645-020-00372-w, 2020. a, b
Ito, A., Hajima, T., Lawrence, D. M., Brovkin, V., Delire, C., Guenet, B., Jones, C. D., Malyshev, S., Materia, S., McDermid, S. P., Peano, D., Pongratz, J., Robertson, E., Shevliakova, E., Vuichard, N., Wårlind, D., Wiltshire, A., and Ziehn, T.: Soil carbon sequestration simulated in CMIP6-LUMIP models: implications for climatic mitigation, Environ. Res. Lett., 15, 124061, https://doi.org/10.1088/1748-9326/abc912, 2020. a
Jackson, R. B., Randerson, J. T., Canadell, J. G., Anderson, R. G., Avissar, R., Baldocchi, D. D., Bonan, G. B., Caldeira, K., Diffenbaugh, N. S., Field, C. B., Hungate, B. A., Jobbágy, E. G., Kueppers, L. M., Nosetto, M. D., and Pataki, D. E.: Protecting climate with forests, Environ. Res. Lett., 3, 044006, https://doi.org/10.1088/1748-9326/3/4/044006, 2008. a
Jia, G., Shevliakova, E., Artaxo, P., Noblet-Ducoudré, N. D., Houghton, R., House, J., Kitajima, K., Lennard, C., Popp, A., Sirin, A., Sukumar, R., and Verchot, L.: Land–climate interactions, in: Climate Change and Land: an IPCC Special Report on Climate Change, Desertification, Land Degradation, Sustainable Land Management, Food Security, and Greenhouse Gas Fluxes in Terrestrial Ecosystems, edited by: Shukla, P. R., Skea, J., Buendía, E. C., Masson-Delmotte, V., Pörtner, H.-O., Roberts, D. C., Zhai, P., Slade, R., Connors, S. L., Diemen, R. v., Ferrat, M., Haughey, E., Luz, S., Neogi, S., Pathak, M., Petzold, J., Portugal Pereira, J., Vyas, P., Huntley, E., Kissick, K., Belkacemi, M., and Malley, J., 131–248, Cambridge University Press, 1st edn., ISBN 978-1-00-915798-8 978-1-00-915801-5, https://doi.org/10.1017/9781009157988.004, 2019. a, b, c, d, e
Jones, P. W.: First- and Second-Order Conservative Remapping Schemes for Grids in Spherical Coordinates, Mon. Weather Rev., 127, 2204–2210, https://doi.org/10.1175/1520-0493(1999)127<2204:FASOCR>2.0.CO;2, 1999. a
Kilpeläinen, A. and Peltola, H.: Carbon Sequestration and Storage in European Forests, in: Forest Bioeconomy and Climate Change, edited by: Hetemäki, L., Kangas, J., and Peltola, H., vol. 42, pp. 113–128, Springer International Publishing, Cham, ISBN 978-3-030-99205-7 978-3-030-99206-4, https://doi.org/10.1007/978-3-030-99206-4_6, 2022. a
Kondo, M., Sitch, S., Ciais, P., Achard, F., Kato, E., Pongratz, J., Houghton, R. A., Canadell, J. G., Patra, P. K., Friedlingstein, P., Li, W., Anthoni, P., Arneth, A., Chevallier, F., Ganzenmüller, R., Harper, A., Jain, A. K., Koven, C., Lienert, S., Lombardozzi, D., Maki, T., Nabel, J. E. M. S., Nakamura, T., Niwa, Y., Peylin, P., Poulter, B., Pugh, T. A. M., Rödenbeck, C., Saeki, T., Stocker, B., Viovy, N., Wiltshire, A., and Zaehle, S.: Are Land-Use Change Emissions in Southeast Asia Decreasing or Increasing?, Global Biogeochem. Cycles, 36, e2020GB006909, https://doi.org/10.1029/2020GB006909, 2022. a, b, c, d
Kornhuber, K. and Tamarin-Brodsky, T.: Future Changes in Northern Hemisphere Summer Weather Persistence Linked to Projected Arctic Warming, Geophys. Res. Lett., 48, e2020GL091603, https://doi.org/10.1029/2020GL091603, 2021. a
Kowalczyk, E., Stevens, L., Law, R., Dix, M., Wang, Y., Harman, I., Haynes, K., Srbinovsky, J., Pak, B., and Ziehn, T.: The land surface model component of ACCESS: description and impact on the simulated surface climatology, Aust. Meteorol. Ocean., 63, 65–82, https://doi.org/10.22499/2.6301.005, 2013. a
Laguë, M. M., Bonan, G. B., and Swann, A. L. S.: Separating the Impact of Individual Land Surface Properties on the Terrestrial Surface Energy Budget in both the Coupled and Uncoupled Land–Atmosphere System, J. Climate, 32, 5725–5744, https://doi.org/10.1175/JCLI-D-18-0812.1, 2019. a
Lamboll, R. D., Nicholls, Z. R. J., Smith, C. J., Kikstra, J. S., Byers, E., and Rogelj, J.: Assessing the size and uncertainty of remaining carbon budgets, Nat. Clim. Change, 13, 1360–1367, https://doi.org/10.1038/s41558-023-01848-5, 2023. a
Lasanta, T., Arnáez, J., Pascual, N., Ruiz-Flaño, P., Errea, M., and Lana-Renault, N.: Space–time process and drivers of land abandonment in Europe, CATENA, 149, 810–823, https://doi.org/10.1016/j.catena.2016.02.024, 2017. a
Lawrence, D. M., Hurtt, G. C., Arneth, A., Brovkin, V., Calvin, K. V., Jones, A. D., Jones, C. D., Lawrence, P. J., de Noblet-Ducoudré, N., Pongratz, J., Seneviratne, S. I., and Shevliakova, E.: The Land Use Model Intercomparison Project (LUMIP) contribution to CMIP6: rationale and experimental design, Geosci. Model Dev., 9, 2973–2998, https://doi.org/10.5194/gmd-9-2973-2016, 2016. a, b, c, d, e, f
Lawrence, D. M., Fisher, R. A., Koven, C. D., Oleson, K. W., Swenson, S. C., Bonan, G., Collier, N., Ghimire, B., Van Kampenhout, L., Kennedy, D., Kluzek, E., Lawrence, P. J., Li, F., Li, H., Lombardozzi, D., Riley, W. J., Sacks, W. J., Shi, M., Vertenstein, M., Wieder, W. R., Xu, C., Ali, A. A., Badger, A. M., Bisht, G., Van Den Broeke, M., Brunke, M. A., Burns, S. P., Buzan, J., Clark, M., Craig, A., Dahlin, K., Drewniak, B., Fisher, J. B., Flanner, M., Fox, A. M., Gentine, P., Hoffman, F., Keppel-Aleks, G., Knox, R., Kumar, S., Lenaerts, J., Leung, L. R., Lipscomb, W. H., Lu, Y., Pandey, A., Pelletier, J. D., Perket, J., Randerson, J. T., Ricciuto, D. M., Sanderson, B. M., Slater, A., Subin, Z. M., Tang, J., Thomas, R. Q., Val Martin, M., and Zeng, X.: The Community Land Model Version 5: Description of New Features, Benchmarking, and Impact of Forcing Uncertainty, J. Adv. Model. Earth Sy., 11, 4245–4287, https://doi.org/10.1029/2018MS001583, 2019. a
Lawrence, P. J., Feddema, J. J., Bonan, G. B., Meehl, G. A., O'Neill, B. C., Oleson, K. W., Levis, S., Lawrence, D. M., Kluzek, E., Lindsay, K., and Thornton, P. E.: Simulating the Biogeochemical and Biogeophysical Impacts of Transient Land Cover Change and Wood Harvest in the Community Climate System Model (CCSM4) from 1850 to 2100, J. Climate, 25, 3071–3095, https://doi.org/10.1175/JCLI-D-11-00256.1, 2012. a, b
Leduc, M., Matthews, H. D., and De Elía, R.: Quantifying the Limits of a Linear Temperature Response to Cumulative CO2 Emissions, J. Climate, 28, 9955–9968, https://doi.org/10.1175/JCLI-D-14-00500.1, 2015. a, b
Leduc, M., Matthews, H. D., and De Elía, R.: Regional estimates of the transient climate response to cumulative CO2 emissions, Nat. Clim. Change, 6, 474–478, https://doi.org/10.1038/nclimate2913, 2016. a, b, c, d
Lejeune, Q., Davin, E. L., Guillod, B. P., and Seneviratne, S. I.: Influence of Amazonian deforestation on the future evolution of regional surface fluxes, circulation, surface temperature and precipitation, Clim. Dynam., 44, 2769–2786, https://doi.org/10.1007/s00382-014-2203-8, 2015. a
Lejeune, Q., Seneviratne, S. I., and Davin, E. L.: Historical Land-Cover Change Impacts on Climate: Comparative Assessment of LUCID and CMIP5 Multimodel Experiments, J. Climate, 30, 1439–1459, https://doi.org/10.1175/JCLI-D-16-0213.1, 2017. a, b
Lejeune, Q., Davin, E. L., Gudmundsson, L., Winckler, J., and Seneviratne, S. I.: Historical deforestation locally increased the intensity of hot days in northern mid-latitudes, Nat. Clim. Change, 8, 386–390, https://doi.org/10.1038/s41558-018-0131-z, 2018. a
Li, W., Zhang, Y., Shi, X., Zhou, W., Huang, A., Mu, M., Qiu, B., and Ji, J.: Development of Land Surface Model BCC_AVIM2.0 and Its Preliminary Performance in LS3MIP/CMIP6, J. Meteorol. Res., 33, 851–869, https://doi.org/10.1007/s13351-019-9016-y, 2019. a, b
Li, Y., Brando, P. M., Morton, D. C., Lawrence, D. M., Yang, H., and Randerson, J. T.: Deforestation-induced climate change reduces carbon storage in remaining tropical forests, Nat. Commun., 13, 1964, https://doi.org/10.1038/s41467-022-29601-0, 2022a. a
Li, Y., Zhao, Z., Xin, Y., Xu, A., Xie, S., Yan, Y., and Wang, L.: How Are Land-Use/Land-Cover Indices and Daytime and Nighttime Land Surface Temperatures Related in Eleven Urban Centres in Different Global Climatic Zones?, Land, 11, 1312, https://doi.org/10.3390/land11081312, 2022b. a
Li, Y., Li, Z.-L., Wu, H., Zhou, C., Liu, X., Leng, P., Yang, P., Wu, W., Tang, R., Shang, G.-F., and Ma, L.: Biophysical impacts of earth greening can substantially mitigate regional land surface temperature warming, Nat. Commun., 14, 121, https://doi.org/10.1038/s41467-023-35799-4, 2023. a
Liu, S., Wang, Y., Zhang, G. J., Wei, L., Wang, B., and Yu, L.: Contrasting influences of biogeophysical and biogeochemical impacts of historical land use on global economic inequality, Nat. Commun., 13, 2479, https://doi.org/10.1038/s41467-022-30145-6, 2022. a
Liu, S., Hua, W., Zhou, L., Chen, H., Yu, M., Li, X., and Cui, Y.: Local and Non-Local Biophysical Impacts of Deforestation on Global Temperature During Boreal Summer: CMIP6-LUMIP Multimodel Analysis, J. Geophys. Res.-Atmos., 128, e2022JD038229, https://doi.org/10.1029/2022JD038229, 2023. a
Lorenz, R., Pitman, A. J., and Sisson, S. A.: Does Amazonian deforestation cause global effects; can we be sure?, J. Geophys. Res.-Atmos., 121, 5567–5584, https://doi.org/10.1002/2015JD024357, 2016. a, b
Loughran, T. F., Ziehn, T., Law, R., Canadell, J. G., Pongratz, J., Liddicoat, S., Hajima, T., Ito, A., Lawrence, D. M., and Arora, V. K.: Limited Mitigation Potential of Forestation Under a High Emissions Scenario: Results From Multi-Model and Single Model Ensembles, J. Geophys. Res.-Biogeo., 128, e2023JG007605, https://doi.org/10.1029/2023JG007605, 2023. a
Lovato, T., Peano, D., Butenschön, M., Materia, S., Iovino, D., Scoccimarro, E., Fogli, P. G., Cherchi, A., Bellucci, A., Gualdi, S., Masina, S., and Navarra, A.: CMIP6 Simulations With the CMCC Earth System Model (CMCC-ESM2), J. Adv. Model. Earth Sy., 14, e2021MS002814, https://doi.org/10.1029/2021MS002814, 2022. a, b, c, d, e
Luo, X., Ge, J., Guo, W., Fan, L., Chen, C., Liu, Y., and Yang, L.: The Biophysical Impacts of Deforestation on Precipitation: Results from the CMIP6 Model Intercomparison, J. Climate, 35, 3293–3311, https://doi.org/10.1175/JCLI-D-21-0689.1, 2022. a, b, c
Luo, X., Ge, J., Guo, W., Cao, Y., Liu, Y., Chen, C., and Yang, L.: An Evaluation of CMIP6 Models in Representing the Biophysical Effects of Deforestation With Satellite-Based Observations, J. Geophys. Res.-Atmos., 128, 1–20, https://doi.org/10.1029/2022JD038198, 2023. a
Lurton, T., Balkanski, Y., Bastrikov, V., Bekki, S., Bopp, L., Braconnot, P., Brockmann, P., Cadule, P., Contoux, C., Cozic, A., Cugnet, D., Dufresne, J., Éthé, C., Foujols, M., Ghattas, J., Hauglustaine, D., Hu, R., Kageyama, M., Khodri, M., Lebas, N., Levavasseur, G., Marchand, M., Ottlé, C., Peylin, P., Sima, A., Szopa, S., Thiéblemont, R., Vuichard, N., and Boucher, O.: Implementation of the CMIP6 Forcing Data in the IPSL-CM6A-LR Model, J. Adv. Model. Earth Sy., 12, e2019MS001940, https://doi.org/10.1029/2019MS001940, 2020. a, b, c
Luyssaert, S., Jammet, M., Stoy, P. C., Estel, S., Pongratz, J., Ceschia, E., Churkina, G., Don, A., Erb, K., Ferlicoq, M., Gielen, B., Grünwald, T., Houghton, R. A., Klumpp, K., Knohl, A., Kolb, T., Kuemmerle, T., Laurila, T., Lohila, A., Loustau, D., McGrath, M. J., Meyfroidt, P., Moors, E. J., Naudts, K., Novick, K., Otto, J., Pilegaard, K., Pio, C. A., Rambal, S., Rebmann, C., Ryder, J., Suyker, A. E., Varlagin, A., Wattenbach, M., and Dolman, A. J.: Land management and land-cover change have impacts of similar magnitude on surface temperature, Nat. Clim. Change, 4, 389–393, https://doi.org/10.1038/nclimate2196, 2014. a
Mahmood, R., Pielke Sr., R. A., Hubbard, K. G., Niyogi, D., Dirmeyer, P. A., McAlpine, C., Carleton, A. M., Hale, R., Gameda, S., Beltrán-Przekurat, A., Baker, B., McNider, R., Legates, D. R., Shepherd, M., Du, J., Blanken, P. D., Frauenfeld, O. W., Nair, U., and Fall, S.: Land cover changes and their biogeophysical effects on climate, Int. J. Climatol., 34, 929–953, https://doi.org/10.1002/joc.3736, 2014. a
Matricardi, E. A. T., Skole, D. L., Costa, O. B., Pedlowski, M. A., Samek, J. H., and Miguel, E. P.: Long-term forest degradation surpasses deforestation in the Brazilian Amazon, Science, 369, 1378–1382, https://doi.org/10.1126/science.abb3021, 2020. a, b
Matthews, H. D., Weaver, A. J., Meissner, K. J., Gillett, N. P., and Eby, M.: Natural and anthropogenic climate change: incorporating historical land cover change, vegetation dynamics and the global carbon cycle, Clim. Dynam., 22, 461–479, https://doi.org/10.1007/s00382-004-0392-2, 2004. a, b
Matthews, H. D., Gillett, N. P., Stott, P. A., and Zickfeld, K.: The proportionality of global warming to cumulative carbon emissions, Nature, 459, 829–832, https://doi.org/10.1038/nature08047, 2009. a, b, c, d, e, f
Matthews, H. D., Zickfeld, K., Dickau, M., MacIsaac, A. J., Mathesius, S., Nzotungicimpaye, C.-M., and Luers, A.: Temporary nature-based carbon removal can lower peak warming in a well-below 2 °C scenario, Commun. Earth Environ., 3, 65, https://doi.org/10.1038/s43247-022-00391-z, 2022. a
Mauritsen, T., Bader, J., Becker, T., Behrens, J., Bittner, M., Brokopf, R., Brovkin, V., Claussen, M., Crueger, T., Esch, M., Fast, I., Fiedler, S., Fläschner, D., Gayler, V., Giorgetta, M., Goll, D. S., Haak, H., Hagemann, S., Hedemann, C., Hohenegger, C., Ilyina, T., Jahns, T., Jimenéz-de-la-Cuesta, D., Jungclaus, J., Kleinen, T., Kloster, S., Kracher, D., Kinne, S., Kleberg, D., Lasslop, G., Kornblueh, L., Marotzke, J., Matei, D., Meraner, K., Mikolajewicz, U., Modali, K., Möbis, B., Müller, W. A., Nabel, J. E. M. S., Nam, C. C. W., Notz, D., Nyawira, S., Paulsen, H., Peters, K., Pincus, R., Pohlmann, H., Pongratz, J., Popp, M., Raddatz, T. J., Rast, S., Redler, R., Reick, C. H., Rohrschneider, T., Schemann, V., Schmidt, H., Schnur, R., Schulzweida, U., Six, K. D., Stein, L., Stemmler, I., Stevens, B., Storch, J., Tian, F., Voigt, A., Vrese, P., Wieners, K., Wilkenskjeld, S., Winkler, A., and Roeckner, E.: Developments in the MPI-M Earth System Model version 1.2 (MPI-ESM1.2) and Its Response to Increasing CO 2, J. Adv. Model. Earth Sy., 11, 998–1038, https://doi.org/10.1029/2018MS001400, 2019. a, b
McGrath, M. J., Luyssaert, S., Meyfroidt, P., Kaplan, J. O., Bürgi, M., Chen, Y., Erb, K., Gimmi, U., McInerney, D., Naudts, K., Otto, J., Pasztor, F., Ryder, J., Schelhaas, M.-J., and Valade, A.: Reconstructing European forest management from 1600 to 2010, Biogeosciences, 12, 4291–4316, https://doi.org/10.5194/bg-12-4291-2015, 2015. a
Meehl, G. A., Senior, C. A., Eyring, V., Flato, G., Lamarque, J.-F., Stouffer, R. J., Taylor, K. E., and Schlund, M.: Context for interpreting equilibrium climate sensitivity and transient climate response from the CMIP6 Earth system models, Sci. Adv., 6, eaba1981, https://doi.org/10.1126/sciadv.aba1981, 2020. a
Melnikova, I., Boucher, O., Cadule, P., Tanaka, K., Gasser, T., Hajima, T., Quilcaille, Y., Shiogama, H., Séférian, R., Tachiiri, K., Vuichard, N., Yokohata, T., and Ciais, P.: Impact of bioenergy crop expansion on climate–carbon cycle feedbacks in overshoot scenarios, Earth Syst. Dynam., 13, 779–794, https://doi.org/10.5194/esd-13-779-2022, 2022. a, b
Melton, J. R., Arora, V. K., Wisernig-Cojoc, E., Seiler, C., Fortier, M., Chan, E., and Teckentrup, L.: CLASSIC v1.0: the open-source community successor to the Canadian Land Surface Scheme (CLASS) and the Canadian Terrestrial Ecosystem Model (CTEM) – Part 1: Model framework and site-level performance, Geosci. Model Dev., 13, 2825–2850, https://doi.org/10.5194/gmd-13-2825-2020, 2020. a
Mitchell, T. D.: Pattern Scaling: An Examination of the Accuracy of the Technique for Describing Future Climates, Clim. Change, 60, 217–242, https://doi.org/10.1023/A:1026035305597, 2003. a
Obermeier, W. A., Nabel, J. E. M. S., Loughran, T., Hartung, K., Bastos, A., Havermann, F., Anthoni, P., Arneth, A., Goll, D. S., Lienert, S., Lombardozzi, D., Luyssaert, S., McGuire, P. C., Melton, J. R., Poulter, B., Sitch, S., Sullivan, M. O., Tian, H., Walker, A. P., Wiltshire, A. J., Zaehle, S., and Pongratz, J.: Modelled land use and land cover change emissions – a spatio-temporal comparison of different approaches, Earth Syst. Dynam., 12, 635–670, https://doi.org/10.5194/esd-12-635-2021, 2021. a
Oleson, K., Lawrence, D., Bonan, G., Drewniak, B., Huang, M., Koven, C., Levis, S., Li, F., Riley, W., Subin, Z., Swenson, S., Thornton, P., Bozbiyik, A., Fisher, R., Heald, C., Kluzek, E., Lamarque, J.-F., Lawrence, P., Leung, L., Lipscomb, W., Muszala, S., Ricciuto, D., Sacks, W., Sun, Y., Tang, J., and Yang, Z.-L.: Technical description of version 4.5 of the Community Land Model (CLM), Tech. rep., UCAR/NCAR, https://doi.org/10.5065/D6RR1W7M, 2013. a
Perpiña Castillo, C., Jacobs-Crisioni, C., Diogo, V., and Lavalle, C.: Modelling agricultural land abandonment in a fine spatial resolution multi-level land-use model: An application for the EU, Environ. Model. Softw., 136, 104946, https://doi.org/10.1016/j.envsoft.2020.104946, 2021. a
Pilli, R., Alkama, R., Cescatti, A., Kurz, W. A., and Grassi, G.: The European forest carbon budget under future climate conditions and current management practices, Biogeosciences, 19, 3263–3284, https://doi.org/10.5194/bg-19-3263-2022, 2022. a
Pitman, A. J., De Noblet-Ducoudré, N., Cruz, F. T., Davin, E. L., Bonan, G. B., Brovkin, V., Claussen, M., Delire, C., Ganzeveld, L., Gayler, V., Van Den Hurk, B. J. J. M., Lawrence, P. J., Van Der Molen, M. K., Müller, C., Reick, C. H., Seneviratne, S. I., Strengers, B. J., and Voldoire, A.: Uncertainties in climate responses to past land cover change: First results from the LUCID intercomparison study, Geophys. Res. Lett., 36, L14814, https://doi.org/10.1029/2009GL039076, 2009. a, b, c, d
Pitman, A. J., Avila, F. B., Abramowitz, G., Wang, Y. P., Phipps, S. J., and de Noblet-Ducoudré, N.: Importance of background climate in determining impact of land-cover change on regional climate, Nat. Clim. Change, 1, 472–475, https://doi.org/10.1038/nclimate1294, 2011. a
Pongratz, J.: A model estimate on the effect of anthropogenic land cover change on the climate of the last millennium, Reports on Earth System Science, 7162251, https://doi.org/10.17617/2.993955, 2009. a
Pongratz, J., Reick, C., Raddatz, T., and Claussen, M.: A reconstruction of global agricultural areas and land cover for the last millennium, Global Biogeochem. Cycles, 22, GB3018, https://doi.org/10.1029/2007GB003153, 2008. a
Pongratz, J., Raddatz, T., Reick, C. H., Esch, M., and Claussen, M.: Radiative forcing from anthropogenic land cover change since A.D. 800, Geophys. Res. Lett., 36, L02709, https://doi.org/10.1029/2008GL036394, 2009. a
Pongratz, J., Reick, C. H., Raddatz, T., and Claussen, M.: Biogeophysical versus biogeochemical climate response to historical anthropogenic land cover change: Climate effects of historical land cover change, Geophys. Res. Lett., 37, L08702, https://doi.org/10.1029/2010GL043010, 2010. a, b, c, d, e, f, g
Pongratz, J., Reick, C. H., Raddatz, T., Caldeira, K., and Claussen, M.: Past land use decisions have increased mitigation potential of reforestation, Geophys. Res. Lett., 38, L15701, https://doi.org/10.1029/2011GL047848, 2011. a, b
Pongratz, J., Reick, C. H., Houghton, R. A., and House, J. I.: Terminology as a key uncertainty in net land use and land cover change carbon flux estimates, Earth Syst. Dynam., 5, 177–195, https://doi.org/10.5194/esd-5-177-2014, 2014. a, b
Pongratz, J., Dolman, H., Don, A., Erb, K., Fuchs, R., Herold, M., Jones, C., Kuemmerle, T., Luyssaert, S., Meyfroidt, P., and Naudts, K.: Models meet data: Challenges and opportunities in implementing land management in Earth system models, Global Change Biology, 24, 1470–1487, https://doi.org/10.1111/gcb.13988, 2018. a
Pongratz, J., Schwingshackl, C., Bultan, S., Obermeier, W., Havermann, F., and Guo, S.: Land Use Effects on Climate: Current State, Recent Progress, and Emerging Topics, Current Climate Change Reports, 7, 99–120, https://doi.org/10.1007/s40641-021-00178-y, 2021. a, b, c, d, e, f, g, h
Qiao, Z., Tian, G., and Xiao, L.: Diurnal and seasonal impacts of urbanization on the urban thermal environment: A case study of Beijing using MODIS data, ISPRS J. Photogramm. Remote, 85, 93–101, https://doi.org/10.1016/j.isprsjprs.2013.08.010, 2013. a
Qin, J., Duan, W., Zou, S., Chen, Y., Huang, W., and Rosa, L.: Global energy use and carbon emissions from irrigated agriculture, Nat. Commun., 15, 3084, https://doi.org/10.1038/s41467-024-47383-5, 2024. a, b
Rahmstorf, S.: Is the Atlantic Overturning Circulation Approaching a Tipping Point?, Oceanography, 37, 16–29, https://doi.org/10.5670/oceanog.2024.501, 2024. a
Rantanen, M., Karpechko, A. Y., Lipponen, A., Nordling, K., Hyvärinen, O., Ruosteenoja, K., Vihma, T., and Laaksonen, A.: The Arctic has warmed nearly four times faster than the globe since 1979, Commun. Earth Environ., 3, 168, https://doi.org/10.1038/s43247-022-00498-3, 2022. a
Reick, C. H., Raddatz, T., Brovkin, V., and Gayler, V.: Representation of natural and anthropogenic land cover change in MPI-ESM, J. Adv. Model. Earth Sy., 5, 459–482, https://doi.org/10.1002/jame.20022, 2013. a, b, c, d
Ren, S., Terrer, C., Li, J., Cao, Y., Yang, S., and Liu, D.: Historical impacts of grazing on carbon stocks and climate mitigation opportunities, Nat. Clim. Change, 14, 380–386, https://doi.org/10.1038/s41558-024-01957-9, 2024. a
Resplandy, L., Hogikyan, A., Müller, J. D., Najjar, R. G., Bange, H. W., Bianchi, D., Weber, T., Cai, W.-J., Doney, S. C., Fennel, K., Gehlen, M., Hauck, J., Lacroix, F., Landschützer, P., Le Quéré, C., Roobaert, A., Schwinger, J., Berthet, S., Bopp, L., Chau, T. T. T., Dai, M., Gruber, N., Ilyina, T., Kock, A., Manizza, M., Lachkar, Z., Laruelle, G. G., Liao, E., Lima, I. D., Nissen, C., Rödenbeck, C., Séférian, R., Toyama, K., Tsujino, H., and Regnier, P.: A Synthesis of Global Coastal Ocean Greenhouse Gas Fluxes, Global Biogeochem. Cycles, 38, 1–38, https://doi.org/10.1029/2023GB007803, 2024. a
Roy, P. S., Ramachandran, R. M., Paul, O., Thakur, P. K., Ravan, S., Behera, M. D., Sarangi, C., and Kanawade, V. P.: Anthropogenic Land Use and Land Cover Changes—A Review on Its Environmental Consequences and Climate Change, J. Indian Soc. Remot., 50, 1615–1640, https://doi.org/10.1007/s12524-022-01569-w, 2022. a, b
Santos, J. F., Schickhoff, U., Ul Hasson, S., and Böhner, J.: Biogeophysical Effects of Land-Use and Land-Cover Changes in South Asia: An Analysis of CMIP6 Models, Land, 12, 880, https://doi.org/10.3390/land12040880, 2023. a, b, c
Schulzweida, U.: CDO User Guide: Version 2.3.0, 1–251, Zenodo [data set], https://doi.org/10.5281/ZENODO.10020800, 2023. a
Schädel, C., Rogers, B. M., Lawrence, D. M., Koven, C. D., Brovkin, V., Burke, E. J., Genet, H., Huntzinger, D. N., Jafarov, E., McGuire, A. D., Riley, W. J., and Natali, S. M.: Earth system models must include permafrost carbon processes, Nat. Clim. Change, 14, 114–116, https://doi.org/10.1038/s41558-023-01909-9, 2024. a
Séférian, R., Nabat, P., Michou, M., Saint-Martin, D., Voldoire, A., Colin, J., Decharme, B., Delire, C., Berthet, S., Chevallier, M., Sénési, S., Franchisteguy, L., Vial, J., Mallet, M., Joetzjer, E., Geoffroy, O., Guérémy, J., Moine, M., Msadek, R., Ribes, A., Rocher, M., Roehrig, R., Salas-y-Mélia, D., Sanchez, E., Terray, L., Valcke, S., Waldman, R., Aumont, O., Bopp, L., Deshayes, J., Éthé, C., and Madec, G.: Evaluation of CNRM Earth System Model, CNRM-ESM2-1: Role of Earth System Processes in Present-Day and Future Climate, J. Adv. Model. Earth Sy., 11, 4182–4227, https://doi.org/10.1029/2019MS001791, 2019. a, b
Séférian, R., Berthet, S., Yool, A., Palmiéri, J., Bopp, L., Tagliabue, A., Kwiatkowski, L., Aumont, O., Christian, J., Dunne, J., Gehlen, M., Ilyina, T., John, J. G., Li, H., Long, M. C., Luo, J. Y., Nakano, H., Romanou, A., Schwinger, J., Stock, C., Santana-Falcón, Y., Takano, Y., Tjiputra, J., Tsujino, H., Watanabe, M., Wu, T., Wu, F., and Yamamoto, A.: Tracking Improvement in Simulated Marine Biogeochemistry Between CMIP5 and CMIP6, Current Climate Change Reports, 6, 95–119, https://doi.org/10.1007/s40641-020-00160-0, 2020. a
Seinfeld, J. H., Bretherton, C., Carslaw, K. S., Coe, H., DeMott, P. J., Dunlea, E. J., Feingold, G., Ghan, S., Guenther, A. B., Kahn, R., Kraucunas, I., Kreidenweis, S. M., Molina, M. J., Nenes, A., Penner, J. E., Prather, K. A., Ramanathan, V., Ramaswamy, V., Rasch, P. J., Ravishankara, A. R., Rosenfeld, D., Stephens, G., and Wood, R.: Improving our fundamental understanding of the role of aerosol–cloud interactions in the climate system, P. Natl. Acad. Sci. USA, 113, 5781–5790, https://doi.org/10.1073/pnas.1514043113, 2016. a
Sellar, A. A., Jones, C. G., Mulcahy, J. P., Tang, Y., Yool, A., Wiltshire, A., O'Connor, F. M., Stringer, M., Hill, R., Palmieri, J., Woodward, S., Mora, L., Kuhlbrodt, T., Rumbold, S. T., Kelley, D. I., Ellis, R., Johnson, C. E., Walton, J., Abraham, N. L., Andrews, M. B., Andrews, T., Archibald, A. T., Berthou, S., Burke, E., Blockley, E., Carslaw, K., Dalvi, M., Edwards, J., Folberth, G. A., Gedney, N., Griffiths, P. T., Harper, A. B., Hendry, M. A., Hewitt, A. J., Johnson, B., Jones, A., Jones, C. D., Keeble, J., Liddicoat, S., Morgenstern, O., Parker, R. J., Predoi, V., Robertson, E., Siahaan, A., Smith, R. S., Swaminathan, R., Woodhouse, M. T., Zeng, G., and Zerroukat, M.: UKESM1: Description and Evaluation of the U.K. Earth System Model, J. Adv. Model. Earth Sy., 11, 4513–4558, https://doi.org/10.1029/2019MS001739, 2019. a
Sellar, A. A., Walton, J., Jones, C. G., Wood, R., Abraham, N. L., Andrejczuk, M., Andrews, M. B., Andrews, T., Archibald, A. T., De Mora, L., Dyson, H., Elkington, M., Ellis, R., Florek, P., Good, P., Gohar, L., Haddad, S., Hardiman, S. C., Hogan, E., Iwi, A., Jones, C. D., Johnson, B., Kelley, D. I., Kettleborough, J., Knight, J. R., Köhler, M. O., Kuhlbrodt, T., Liddicoat, S., Linova-Pavlova, I., Mizielinski, M. S., Morgenstern, O., Mulcahy, J., Neininger, E., O'Connor, F. M., Petrie, R., Ridley, J., Rioual, J., Roberts, M., Robertson, E., Rumbold, S., Seddon, J., Shepherd, H., Shim, S., Stephens, A., Teixiera, J. C., Tang, Y., Williams, J., Wiltshire, A., and Griffiths, P. T.: Implementation of U.K. Earth System Models for CMIP6, J. Adv. Model. Earth Sy., 12, e2019MS001946, https://doi.org/10.1029/2019MS001946, 2020. a
Seneviratne, S. I., Corti, T., Davin, E. L., Hirschi, M., Jaeger, E. B., Lehner, I., Orlowsky, B., and Teuling, A. J.: Investigating soil moisture–climate interactions in a changing climate: A review, Earth-Sci. Rev., 99, 125–161, https://doi.org/10.1016/j.earscirev.2010.02.004, 2010. a
Shevliakova, E., Malyshev, S., Martinez-Cano, I., Milly, P. C. D., Pacala, S. W., Ginoux, P., Dunne, K. A., Dunne, J. P., Dupuis, C., Findell, K. L., Ghannam, K., Horowitz, L. W., Knutson, T. R., Krasting, J. P., Naik, V., Phillipps, P., Zadeh, N., Yu, Y., Zeng, F., and Zeng, Y.: The Land Component LM4.1 of the GFDL Earth System Model ESM4.1: Model Description and Characteristics of Land Surface Climate and Carbon Cycling in the Historical Simulation, J. Adv. Model. Earth Sy., 16, e2023MS003922, https://doi.org/10.1029/2023MS003922, 2024. a
Simmons, C. T. and Matthews, H. D.: Assessing the implications of human land-use change for the transient climate response to cumulative carbon emissions, Environ. Res. Lett., 11, 035001, https://doi.org/10.1088/1748-9326/11/3/035001, 2016. a, b, c
Singh, A., Kumar, S., Akula, S., Lawrence, D. M., and Lombardozzi, D. L.: Plant Growth Nullifies the Effect of Increased Water-Use Efficiency on Streamflow Under Elevated CO2 in the Southeastern United States, Geophys. Res. Lett., 47, e2019GL086940, https://doi.org/10.1029/2019GL086940, 2020. a
Sitch, S., Friedlingstein, P., Gruber, N., Jones, S. D., Murray-Tortarolo, G., Ahlström, A., Doney, S. C., Graven, H., Heinze, C., Huntingford, C., Levis, S., Levy, P. E., Lomas, M., Poulter, B., Viovy, N., Zaehle, S., Zeng, N., Arneth, A., Bonan, G., Bopp, L., Canadell, J. G., Chevallier, F., Ciais, P., Ellis, R., Gloor, M., Peylin, P., Piao, S. L., Le Quéré, C., Smith, B., Zhu, Z., and Myneni, R.: Recent trends and drivers of regional sources and sinks of carbon dioxide, Biogeosciences, 12, 653–679, https://doi.org/10.5194/bg-12-653-2015, 2015. a, b, c
Smith, B., Wårlind, D., Arneth, A., Hickler, T., Leadley, P., Siltberg, J., and Zaehle, S.: Implications of incorporating N cycling and N limitations on primary production in an individual-based dynamic vegetation model, Biogeosciences, 11, 2027–2054, https://doi.org/10.5194/bg-11-2027-2014, 2014. a, b
Smith, C., Baker, J. C. A., and Spracklen, D. V.: Tropical deforestation causes large reductions in observed precipitation, Nature, 615, 270–275, https://doi.org/10.1038/s41586-022-05690-1, 2023. a
Solomon, S., Daniel, J. S., Sanford, T. J., Murphy, D. M., Plattner, G.-K., Knutti, R., and Friedlingstein, P.: Persistence of climate changes due to a range of greenhouse gases, P. Natl. Acad. Sci. USA, 107, 18354–18359, https://doi.org/10.1073/pnas.1006282107, 2010. a
Stocker, B. D., Feissli, F., Strassmann, K. M., Spahni, R., and Joos, F.: Past and future carbon fluxes from land use change, shifting cultivation and wood harvest, Tellus B, 66, 23188, https://doi.org/10.3402/tellusb.v66.23188, 2014. a, b, c
Swart, N. C., Cole, J. N. S., Kharin, V. V., Lazare, M., Scinocca, J. F., Gillett, N. P., Anstey, J., Arora, V., Christian, J. R., Hanna, S., Jiao, Y., Lee, W. G., Majaess, F., Saenko, O. A., Seiler, C., Seinen, C., Shao, A., Sigmond, M., Solheim, L., von Salzen, K., Yang, D., and Winter, B.: The Canadian Earth System Model version 5 (CanESM5.0.3), Geosci. Model Dev., 12, 4823–4873, https://doi.org/10.5194/gmd-12-4823-2019, 2019. a, b
Taheripour, F., Hertel, T. W., and Liu, J.: The role of irrigation in determining the global land use impacts of biofuels, Energy, Sustainability and Society, 3, 1–18, https://doi.org/10.1186/2192-0567-3-4, 2013. a
Tang, T., Lee, X., Zhang, K., Cai, L., Lawrence, D. M., and Shevliakova, E.: Biophysical Impact of Land-Use and Land-Cover Change on Subgrid Temperature in CMIP6 Models, J. Hydrometeorol., 24, 373–388, https://doi.org/10.1175/JHM-D-22-0073.1, 2023. a
Tebaldi, C. and Arblaster, J. M.: Pattern scaling: Its strengths and limitations, and an update on the latest model simulations, Clim. Change, 122, 459–471, https://doi.org/10.1007/s10584-013-1032-9, 2014. a
Thiery, W., Davin, E. L., Lawrence, D. M., Hirsch, A. L., Hauser, M., and Seneviratne, S. I.: Present-day irrigation mitigates heat extremes, J. Geophys. Res.-Atmos., 122, 1403–1422, https://doi.org/10.1002/2016JD025740, 2017. a
Thiery, W., Visser, A. J., Fischer, E. M., Hauser, M., Hirsch, A. L., Lawrence, D. M., Lejeune, Q., Davin, E. L., and Seneviratne, S. I.: Warming of hot extremes alleviated by expanding irrigation, Nat. Commun., 11, 290, https://doi.org/10.1038/s41467-019-14075-4, 2020. a
Tian, H., Lu, C., Yang, J., Banger, K., Huntzinger, D. N., Schwalm, C. R., Michalak, A. M., Cook, R., Ciais, P., Hayes, D., Huang, M., Ito, A., Jain, A. K., Lei, H., Mao, J., Pan, S., Post, W. M., Peng, S., Poulter, B., Ren, W., Ricciuto, D., Schaefer, K., Shi, X., Tao, B., Wang, W., Wei, Y., Yang, Q., Zhang, B., and Zeng, N.: Global patterns and controls of soil organic carbon dynamics as simulated by multiple terrestrial biosphere models: Current status and future directions, Global Biogeochem. Cycles, 29, 775–792, https://doi.org/10.1002/2014GB005021, 2015. a
Weijer, W., Cheng, W., Garuba, O. A., Hu, A., and Nadiga, B. T.: CMIP6 Models Predict Significant 21st Century Decline of the Atlantic Meridional Overturning Circulation, Geophys. Res. Lett., 47, e2019GL086075, https://doi.org/10.1029/2019GL086075, 2020. a
Wilkenskjeld, S., Kloster, S., Pongratz, J., Raddatz, T., and Reick, C. H.: Comparing the influence of net and gross anthropogenic land-use and land-cover changes on the carbon cycle in the MPI-ESM, Biogeosciences, 11, 4817–4828, https://doi.org/10.5194/bg-11-4817-2014, 2014. a
Williams, C. A., Gu, H., and Jiao, T.: Climate impacts of U.S. forest loss span net warming to net cooling, Sci. Adv., 7, eaax8859, https://doi.org/10.1126/sciadv.aax8859, 2021. a
Wiltshire, A. J., Duran Rojas, M. C., Edwards, J. M., Gedney, N., Harper, A. B., Hartley, A. J., Hendry, M. A., Robertson, E., and Smout-Day, K.: JULES-GL7: the Global Land configuration of the Joint UK Land Environment Simulator version 7.0 and 7.2, Geosci. Model Dev., 13, 483–505, https://doi.org/10.5194/gmd-13-483-2020, 2020. a
Winckler, J., Reick, C. H., and Pongratz, J.: Why does the locally induced temperature response to land cover change differ across scenarios?, Geophys. Res. Lett., 44, 3833–3840, https://doi.org/10.1002/2017GL072519, 2017. a, b
Winckler, J., Lejeune, Q., Reick, C. H., and Pongratz, J.: Nonlocal Effects Dominate the Global Mean Surface Temperature Response to the Biogeophysical Effects of Deforestation, Geophys. Res. Lett., 46, 745–755, https://doi.org/10.1029/2018GL080211, 2019a. a, b, c, d
Winckler, J., Reick, C. H., Luyssaert, S., Cescatti, A., Stoy, P. C., Lejeune, Q., Raddatz, T., Chlond, A., Heidkamp, M., and Pongratz, J.: Different response of surface temperature and air temperature to deforestation in climate models, Earth Syst. Dynam., 10, 473–484, https://doi.org/10.5194/esd-10-473-2019, 2019b. a, b
Windisch, M. G., Davin, E. L., and Seneviratne, S. I.: Prioritizing forestation based on biogeochemical and local biogeophysical impacts, Nat. Clim. Change, 11, 867–871, https://doi.org/10.1038/s41558-021-01161-z, 2021. a, b, c, d, e, f, g
Winkler, K., Yang, H., Ganzenmüller, R., Fuchs, R., Ceccherini, G., Duveiller, G., Grassi, G., Pongratz, J., Bastos, A., Shvidenko, A., Araza, A., Herold, M., Wigneron, J.-P., and Ciais, P.: Changes in land use and management led to a decline in Eastern Europe's terrestrial carbon sink, Commun. Earth Environ., 4, 237, https://doi.org/10.1038/s43247-023-00893-4, 2023. a, b
Wu, T., Lu, Y., Fang, Y., Xin, X., Li, L., Li, W., Jie, W., Zhang, J., Liu, Y., Zhang, L., Zhang, F., Zhang, Y., Wu, F., Li, J., Chu, M., Wang, Z., Shi, X., Liu, X., Wei, M., Huang, A., Zhang, Y., and Liu, X.: The Beijing Climate Center Climate System Model (BCC-CSM): the main progress from CMIP5 to CMIP6 , Geosci. Model Dev., 12, 1573–1600, https://doi.org/10.5194/gmd-12-1573-2019, 2019. a
Yu, L. and Leng, G.: Global effects of different types of land use and land cover changes on near-surface air temperature, Agric. Forest Meteorol., 327, 109232, https://doi.org/10.1016/j.agrformet.2022.109232, 2022. a
Zeng, Z., Wang, D., Yang, L., Wu, J., Ziegler, A. D., Liu, M., Ciais, P., Searchinger, T. D., Yang, Z.-L., Chen, D., Chen, A., Li, L. Z. X., Piao, S., Taylor, D., Cai, X., Pan, M., Peng, L., Lin, P., Gower, D., Feng, Y., Zheng, C., Guan, K., Lian, X., Wang, T., Wang, L., Jeong, S.-J., Wei, Z., Sheffield, J., Caylor, K., and Wood, E. F.: Deforestation-induced warming over tropical mountain regions regulated by elevation, Nat. Geosci., 14, 23–29, https://doi.org/10.1038/s41561-020-00666-0, 2021. a, b, c
Zhong, Z., He, B., Chen, H. W., Chen, D., Zhou, T., Dong, W., Xiao, C., Xie, S.-p., Song, X., Guo, L., Ding, R., Zhang, L., Huang, L., Yuan, W., Hao, X., Ji, D., and Zhao, X.: Reversed asymmetric warming of sub-diurnal temperature over land during recent decades, Nat. Commun., 14, 7189, https://doi.org/10.1038/s41467-023-43007-6, 2023. a
Zhu, L., Li, W., Ciais, P., He, J., Cescatti, A., Santoro, M., Tanaka, K., Cartus, O., Zhao, Z., Xu, Y., Sun, M., and Wang, J.: Comparable biophysical and biogeochemical feedbacks on warming from tropical moist forest degradation, Nat. Geosci., 16, 244–249, https://doi.org/10.1038/s41561-023-01137-y, 2023. a, b, c, d, e
Zickfeld, K., MacIsaac, A. J., Canadell, J. G., Fuss, S., Jackson, R. B., Jones, C. D., Lohila, A., Matthews, H. D., Peters, G. P., Rogelj, J., and Zaehle, S.: Net-zero approaches must consider Earth system impacts to achieve climate goals, Nat. Clim. Change, 13, 1298–1305, https://doi.org/10.1038/s41558-023-01862-7, 2023. a, b, c
Ziehn, T., Chamberlain, M. A., Law, R. M., Lenton, A., Bodman, R. W., Dix, M., Stevens, L., Wang, Y.-P., and Srbinovsky, J.: The Australian Earth System Model: ACCESS-ESM1.5, Journal of Southern Hemisphere Earth Systems Science, 70, 193–214, https://doi.org/10.1071/ES19035, 2020. a, b
Zwiers, F. W. and von Storch, H.: Taking Serial Correlation into Account in Tests of the Mean, J. Climate, 8, 336–351, https://doi.org/10.1175/1520-0442(1995)008<0336:TSCIAI>2.0.CO;2, 1995. a