the Creative Commons Attribution 4.0 License.
the Creative Commons Attribution 4.0 License.
 | 03 Nov 2025
Evaluating dynamic global vegetation models in China: challenges in capturing trends in leaf area and gross primary productivity
Anzhou Zhao
Ziyang Li
Lidong Zou
Jiansheng Wu
Kayla Stan
Arturo Sanchez-Azofeifa
Terrestrial ecosystems are crucial in mitigating global climate change, and dynamic global vegetation models (DGVMs) have become essential tools for simulating these ecosystems. However, uncertainties remain in DGVM simulations for China, highlighting the need for systematic evaluations of their dynamics across various timescales to enhance model performance. As such, we utilize reprocessed monthly MODIS leaf area index (LAI) and contiguous solar-induced fluorescence (CSIF) data as observational references to assess the long-term trends and seasonal variations of LAI and gross primary production (GPP) simulated by 14 models (CABLE-POP, CLASSIC, CLM5.0, DLEM, IBIS, ISAM, ISBA-CTRIP, JULES, LPJ-GUESS, LPX, OCN, ORCHIDEEv3, SDGVM, and VISIT) in China from 2003 to 2019. Additionally, we evaluate the trends and seasonal variations of simulated LAI and GPP in response to environmental and climatic factors. Our findings indicate the following. (1) While the overall trend of simulated LAI is captured, the spatial performance of simulated LAI and GPP is poor, with underestimation in forested areas, overestimation in grasslands, and misestimation in croplands. (2) The models misestimate the simulated LAI and GPP responses to changes in environmental factors, as well as their inaccuracy in capturing anthropogenic impacts on vegetation dynamics. We indicate that the main reason for the model's misestimation is that the model's representation of the CO2 fertilization effect is inadequate and thus fails to simulate the vegetation response to CO2 concentration. (3) Despite these issues, the models can effectively capture the seasonality of LAI and GPP in China, largely due to their robust representation of seasonal responses to climate factors.
- Article
(12591 KB) - Full-text XML
-
Supplement
(4327 KB) - BibTeX
- EndNote


Terrestrial ecosystems sequester approximately 30 % of anthropogenic carbon emissions, playing a significant role in global climate stabilization (Le Quéré et al., 2015). Although China covers only 6.5 % of Earth's land area, it is estimated to contribute between 10 % and 31 % of the global carbon sink in terrestrial ecosystems, highlighting its crucial role in climate mitigation (Piao et al., 2022). However, significant uncertainties remain in estimating China's carbon budget due to limited understanding of carbon cycle mechanisms (Wang et al., 2023; Zhong et al., 2023). Developing measurable and verifiable methods for carbon sink accounting is essential for informing China's emission reduction and sink enhancement policies. Currently, although China's terrestrial ecosystems have effectively offset a portion of the country's fossil fuel emissions, the growth rate of carbon sinks is significantly slowed by the increase in fossil fuel emissions (Piao et al., 2022). Additionally, China's forest ecosystems, dominated by young and middle-aged planted forests, offer substantial potential for future carbon sequestration (Zhang et al., 2017). Accurate estimation and prediction of carbon sinks in China's terrestrial ecosystems remain critical and challenging tasks for the scientific community.
To date, the primary methods for assessing terrestrial ecosystem carbon sinks include the inventory method, atmospheric inversion method, Eddy covariance method, and ecosystem process modeling method (Piao et al., 2022). However, estimating China's terrestrial ecosystems presents significant challenges due to the strong heterogeneity of terrestrial ecosystems. The use of different estimation methods in China often yields widely varying results (Piao et al., 2022). Even with the atmospheric inversion method, estimates of carbon sinks in China's terrestrial ecosystems show considerable variation, largely due to the complex distribution of diverse ecosystem types and the uneven pattern of atmospheric CO2 observation stations across the country (Wang et al., 2020; Chen et al., 2021). Meanwhile, the inventory and Eddy covariance methods are significantly constrained by limited spatial resolution and the availability of ground stations (Jiang et al., 2016; Piao et al., 2022). As a subset of ecosystem process models and a crucial component of the Earth system model (ESM), the dynamic global vegetation model (DGVM) provided gridded carbon flux estimates and simulated the complex processes, such as ecosystem carbon and nutrient cycling, vegetation growth–death, and natural or anthropogenic disturbance, as well as mechanisms within the terrestrial ecosystem carbon cycle. DGVMs have therefore become essential tools for evaluating carbon sequestration in terrestrial ecosystems on both global and regional scales. Despite their ability to overcome limitations related to spatial resolution and predict future changes in carbon sinks (Friedlingstein et al., 2020), modeling regional carbon sequestration capacity in China remains particularly challenging due to significant uncertainties in model structure, parameters, and driving factors such as climate and land use change data (Houghton, 2020). For example, Wang et al. (2022a) found that the model's sensitivity to temperature contradicted actual observations when predicting carbon sinks in the Chinese region. Additionally, Piao et al. (2018) noted that models often overlook or simplify the impacts of ecosystem management practices, such as forest management and irrigated agriculture, on the carbon cycle.
The ability of the DGVMs to accurately simulate the response of vegetation and ecosystem dynamics in response to historical climatic and ecological processes, as well as carbon and biogeochemical cycling, is crucial for predicting future ecosystem changes. There is significant potential for improving these models by systematically comparing model outputs with relevant observations (Prentice and Cowling, 2013). DGVMs have been tested against various metrics, including carbon and water fluxes, photosynthetic capacity, and carbon storage at sites around the world. For instance, Kucharik et al. (2006) assessed the plant phenology using data from three eddy covariance sites to evaluate forest CO2 and water vapor exchange. Similarly, Macbean et al. (2021) found that DGVMs underestimated net ecosystem exchange (NEE) based on their analysis of NEE data from 12 dryland flux sites in the southwestern United States. Medlyn et al. (2015) leveraged empirical data from the Duke and ORNL Free-Air CO2 Enrichment (FACE) experiments to refine the parameterization of CO2 fertilization effects in DGVMs, significantly enhancing their capacity to simulate forest responses to elevated atmospheric CO2 concentrations (eCO2). Additionally, remotely sensed observations are widely used to evaluate model outputs on a regional scale due to the limited number of ground-based observation sites (Piao et al., 2020; Zou et al., 2023; Zeng et al., 2018). For instance, Song et al. (2021) observed that the peak of leaf area index (LAI) occurs 1–2 months earlier than predicted by the ESM. Anav et al. (2015) reported significant global variability in model-estimated gross primary production (GPP). Similarly, Winkler et al. (2021) found that models failed to effectively capture the slowdown in global greening, contrasting with remotely sensed observations. Zou et al. (2023) evaluated the annual and seasonal trend of LAI and the effect of El Niño on the greenness of DGVMs in tropical rainforest regions from 2003 to 2019. These discrepancies indicate that the models struggle to accurately represent spatially diverse characteristics due to their narrow focus on processes that govern carbon flux, primarily involving only CO2 and climate factors.
Meanwhile, accurately assessing the various responses of DGVMs and observations to both environmental and anthropogenic factors could provide insights to improve DGVMs. Wang et al. (2022a) discovered that, compared to an upscaled flux tower dataset using satellite, DGVMs did not accurately capture the temperature and precipitation responses in certain tropical regions. Jiao et al. (2024) determined that the DGVMs generally overestimated the sensitivity of temperature and precipitation in China when compared with multi-source data. Yuan et al. (2019) found that models underestimated the limiting effect of vapor pressure deficit (VPD) on vegetation productivity. Furthermore, the models exhibit considerable ambiguity in their simulations of vegetation responses to human activities. Many models lack observational constraints (Li et al., 2017), and some even fail to account for land use changes (Séférian et al., 2019). For example, Zeng et al. (2018) found that ESMs typically underestimated shifts in land use types due to agricultural deforestation in Southeast Asia. Song et al. (2021) suggested that errors in the land use and land cover change (LULCC) dataset used as input data for many DGVMs likely led to inaccurate estimations of vegetation biomass changes in China.
LAI and GPP are critical parameters in the carbon cycle of terrestrial ecosystems, representing vegetation canopy structure and photosynthetic activity, respectively. These parameters are also key outputs of DGVMs (Piao et al., 2022; Zou et al., 2023). However, the accuracy of LAI and GPP simulations by these models in China and their responses to environmental and anthropogenic factors remain unclear. This uncertainty significantly hampers our systematic understanding of carbon cycling mechanisms in China's terrestrial ecosystems. Advanced reanalyzed LAI remotely sensed datasets are available to validate the LAI dynamics simulated by DGVMs (Zou et al., 2023; Yuan et al., 2011). However, due to substantial uncertainties in GPP inversion models derived directly from remotely sensed data in China (Wang et al., 2024), it has been proposed that SIF (solar-induced chlorophyll fluorescence) remotely sensed data, which directly reflect vegetative photosynthesis, could be a more reliable substitute for large-scale GPP estimation (Li et al., 2018). However, it remains poorly documented what the comparison between observations and model simulations is, leading to significant uncertainty about the applicability of DGVM in China. Current evaluations of DGVM applicability in China have predominantly relied on site scale (Han et al., 2025; Zhu and Zeng, 2024), which lacks integration with long-term spatial observational constraints to verify model systematicity. Additionally, despite increasing utilization of remote sensing and multi-source datasets for validation, these validations remain fragmented and inconsistently address vegetation-type-specific model output variables (Yue et al., 2024; Jiao et al., 2024).
In this context, we systematically assessed the performance of 14 DGVM models (CABLE-POP, CLASSIC, CLM5.0, DLEM, IBIS, ISAM, ISBA-CTRIP, JULES, LPJ-GUESS, LPX, OCN, ORCHIDEEv3, SDGVM, and VISIT) in simulating the interannual trends and seasonality of LAI and GPP across China's landmass from 2003 to 2019. Additionally, to identify model deficiencies and provide insights for improvement, we evaluated the impacts of environmental and anthropogenic factors on LAI and GPP simulations at both interannual and seasonal scales. The specific objective of this study is to offer guidance for future enhancements in the simulation of vegetation LAI and GPP, ultimately reducing uncertainties in the study of carbon sinks in China's terrestrial ecosystems. This work aims to identify priority pathways for DGVM structural improvements and enhance understanding of the carbon cycle applicable to China and other regions sharing similar ecological characteristics. Specifically, our analysis seeks to identify key pathways for improving DGVM structure and parameterization, advance mechanistic understanding of China's unique carbon cycle dynamics, and provide insights into quantifying regional carbon sinks, thus supporting climate-related policy development and guiding future regional-scale ecosystem modeling studies.
2.1 Study area
China, located at the intersection of East and Central Asia, spans approximately 18 to 53° north latitude and 73 to 135° east longitude. The country features a diverse topography, ranging from expansive plains and rolling hills in the east to towering plateaus and mountain ranges in the west, with a general west-to-east elevation gradient. China's climate is complex, exhibiting considerable spatial variability in both annual precipitation and temperature. The eastern monsoon region, characterized by abundant rainfall and a pronounced north–south temperature gradient, supports a wide variety of plant species. In contrast, the arid regions of western China experience minimal precipitation and sparse vegetation cover. This climatic diversity has given rise to a wide range of vegetation types, from moist evergreen broad-leaved forests to arid desert steppes. Additionally, there are significant regional differences in the seasonal and interannual fluctuations of these vegetation patterns.
Since the late 20th century, China has undertaken several large-scale ecological projects. These include the Three-North Shelterbelt Project (initiated in 1978), which aims to improve the ecological conditions of northern China's arid and semi-arid regions; the Grain for Green Program (launched in 1999), which focuses on converting farmland back to forest and grassland in ecologically fragile areas of western and northern China; and the Natural Forest Protection Program (started in 1998), which primarily targets the Yangtze River Basin and the upper reaches of the Yellow River. These initiatives have significantly influenced vegetation cover and ecosystem functions across the country.
For the purposes of this study, China's vegetation is classified into four major categories: forest, grassland, cropland, and non-vegetated areas (Fig. S1 in the Supplement).
2.2 Dynamic global vegetation model (DGVM)
DGVMs offer a wide range of capabilities, serving as essential tools for systematizing our understanding of the functionality and universality of vegetation and ecosystems. The development of DGVMs has enhanced our comprehension of the empirical relationships among functional plant traits and their interactions with the environment. These models also allow for predictions of the impacts of climate change on ecosystems and the resulting biogeochemical feedbacks. Specifically, DGVMs can simulate surface fluxes of CO2 and water, as well as the dynamics of water and carbon reservoirs and their responses to factors such as climate change, atmospheric composition, and land use changes.
In this study, we employed 14 DGVM models (CABLE-POP, CLASSIC, CLM5.0, DLEM, IBIS, ISAM, ISBA-CTRIP, JULES, LPJ-GUESS, LPX, OCN, ORCHIDEEv3, SDGVM, and VISIT), selected for their superior performance in simulating gridded monthly LAI and GPP, to explore vegetation dynamics (Zou et al., 2023). These models were coordinated by the Comparative Productivity in Net Biota project (Trends in the Land Carbon Cycle, TRENDY), which is part of a broader initiative. Within the TRENDY project, all DGVMs employ uniform spin-up durations. Initialization of simulations utilizes the 1700 baseline conditions with model-specific plant functional types (PFTs). Pre-industrial climate forcing data (1901–1920) are recycled through model-dependent cycling or stochastic sampling until a carbon equilibrium state is achieved (Sitch et al., 2024). Despite uniform TRENDY spin-up protocols, inherent structural differences among DGVMs (e.g., carbon cycling, vegetation dynamics) generate divergent initial states (LAI, GPP) that propagate into early transient simulations. Although such discrepancies may impact model–data comparisons in the first few decades, their effects are minimal during our study period (2003–2019). Concurrently, all participating DGVMs adopt LUH2, leveraging its CMIP-optimized architecture to standardize forcing and enhance DGVM compatibility as the unified land use change dataset. All models were subjected to scenarios S1, S2, and S3. Additionally, they were driven by historical climate fields and land use data from the Climate Research Unit's National Center for Environmental Prediction (CRUNCEP) dataset. In S1 simulations, the models were influenced solely by increasing atmospheric CO2 concentrations, with a constant climate based on cyclic climate averages and variability from the early 20th century. The S2 scenario varied both atmospheric CO2 concentrations and climate, while the S3 scenario included variations in CO2 concentrations, climate, and land use. For this study, the S2 scenario, which involved varying atmospheric CO2 concentrations and climate, was used to obtain simulated LAI and GPP. The difference between the S3 and S2 simulations (S3–S2) was utilized to evaluate the models' representation of the impacts of land use changes on LAI and GPP. In the TRENDY project, all DGVMs provide monthly outputs at a standardized spatial resolution of 0.5°×0.5°.
2.3 Benchmark and environmental data
This study utilizes the reprocessed MODIS LAI in China from 2003 to 2019 (Yuan et al., 2011) to validate the simulated LAI of the 14 DGVMs. The reprocessing of the observed LAI data involves filling gaps in the original MODIS LAI (MOD15A2H and MYD15A2H) datasets, which are identified as low quality, using a modified spatiotemporal filtering (mTSF) technique. This is followed by a second round of processing using the TIMESAT SG filtering technique to generate the final products. For this study, the observed LAI data were resampled into monthly gridded data with a resolution of 0.5°×0.5°.
To validate the simulated GPP of DGVM, we used the CSIF dataset, which is processed by a neural network as a proxy for remotely sensed observations (Zhang et al., 2018). The CSIF dataset is derived from MODIS surface reflectance and OCO-2 SIF inversion data, trained using machine learning algorithms on daily SIF observations to produce a cloud-independent CSIF dataset. This dataset accurately captures the seasonal dynamics of satellite-observed SIF and shows a high degree of consistency with ecosystem GPP, making it a suitable proxy for GPP. In this study, the CSIF data were aggregated from a 4 d period to a monthly scale, and the spatial resolution was sampled to a 0.5°×0.5° grid using mean aggregation. Meanwhile, to enable a direct comparison of SIF and GPP values, both SIF and GPP data were normalized at both the annual and monthly scales.
FLUXNET, established with the aim of offering a high-quality, shared dataset for land surface model validation and development, is a global network of micrometeorological flux measurement sites. We used the FLUXNET dataset to analyze the seasonal response of LAI and GPP. In this study, we used monthly-scale GPP data from FLUXNET to validate the seasonal correlation of GPP at the site scale. Due to the limited duration of consistently observed GPP at the sites in China, they are not suitable for long-term trend validation of GPP but can be used for seasonal validation.
We utilize the monthly CO2 concentration data from the Mauna Loa Observatory in Hawaii (https://gml.noaa.gov/ccgg/trends/data.html, last access: 26 September 2025) as a representative regional indicator for CO2 concentrations within China.
To reduce uncertainty in analyzing LAI responses to environmental factors, we employed the same dataset that drives the DGVM. Specifically, historical temperature and precipitation data were sourced from the reanalyzed CRUNCEP dataset. We utilized monthly data from the atmospheric stress component of CRUNCEP (https://gdex.ucar.edu/datasets/d314003/, last access: 26 September 2025) and standardized the spatial resolution to 0.5°×0.5°.
Given that the CRUNCEP dataset does not include a variable for light radiation, this study utilizes monthly-scale net solar radiation data sourced from ERA5 (https://cds.climate.copernicus.eu/datasets/reanalysis-era5-land-monthly-means?tab=download, last access: 26 September 2025). The spatial resolution of this data is sampled at 0.5°×0.5°.
2.4 Auxiliary data
The IGBP classification scheme in MCD12Q1 of MODIS was used to categorize China into four types: forest (tree cover), grassland, cropland (crop), and non-vegetated areas (non-vegetable) (Fig. S1). The image resolution was initially resampled to 0.5°×0.5° using the majority rule. Evergreen coniferous forest, evergreen broadleaf forest, deciduous coniferous forest, deciduous broadleaf forest, mixed forest, woody savanna, and savanna were then combined into a single category termed forested land. Closed shrubland, open shrubland, grassland, and permanent wetland were collectively classified as grassland. Farmland and agricultural land (natural vegetation) were grouped together as cropland. Urban and built-up land, permanent snow and ice, and unutilized land were also categorized as non-vegetation.
We used the percent tree cover data from the Terra MODIS vegetation continuum field (VCF) product dataset, which provides subpixel-level estimates of global surface vegetation, as an indicator of actual tree cover to validate the accuracy of models for land use change in forested land. The spatial resolution of the tree cover data was aggregated to a 0.5°×0.5° annual scale through mean aggregation.
This study also utilized the statistical yearbooks of each Chinese province to assess the influence of human activities on vegetation in selected regions. For provinces predominantly characterized by grassland land use types (Tibet, Sichuan, Qinghai, and Inner Mongolia), the intensity of grazing was determined by counting the number of livestock enclosures reported in the respective province's statistical yearbooks. In contrast, for provinces primarily featuring cropland land use types (Henan, Heilongjiang, and Jiangsu), the extent of crop cultivation was assessed by calculating the area dedicated to farming practices as reported in the statistical yearbooks.
2.5 Analysis
The Theil–Sen median method was employed to determine interannual trends in extensive time series, with significance testing conducted via the Mann–Kendall (MK) test. The primary metric for evaluating model performance focused on the interannual trends of LAI and GPP, as simulated by the DGVM model at both regional and pixel scales. To spatially evaluate the DGVM model's performance, a t test was executed using a running sample size of 9, based on a 3×3 sliding window of remotely sensed observation images.
To elucidate the mechanisms underlying the trends in annual LAI and GPP changes and to address the limitations of DGVMs, we analyzed the impacts on vegetation dynamics from two perspectives: human activities and environmental drivers. This study assessed the influence of human activities on vegetation dynamics by examining variations in grazing intensity and crop cultivation area, both sourced directly from statistical yearbooks. Grazing intensity was calculated by tallying the number of cattle and sheep confined and then multiplying this by an empirical estimate of pasture consumption per animal. To evaluate the response of annually observed and simulated LAI to environmental factors (atmospheric CO2 concentration, precipitation, temperature, and radiation) from 2003 to 2019, the multiple linear regression equations were primarily employed to determine the sensitivity of these observed and simulated LAI values to environmental variables:
where LAI and CO2 are annual average LAI and carbon dioxide concentration, respectively; pre, tem, and rad are the annual average precipitation, temperature, and radiation, respectively; a, b, c, and d are regression coefficients; and ε is the residual error term, which is the amount of influence of anthropogenic activities on vegetation dynamics. Both the dependent and independent variables were normalized.
Pearson correlation coefficients were used to assess the seasonal performance of LAI and GPP for each model at both regional and pixel scales. Multi-year averages of observed and simulated LAI and GPP, calculated from January to December, were determined. Subsequently, their respective correlation coefficients (r) and significance (p) were independently calculated. A positive correlation coefficient with a p value less than 0.5 suggests that the model demonstrates strong seasonal cycle performance. Additionally, the site GPP data from FLUXNET were utilized to evaluate the seasonal performance of DGVMs at various sites within China.
Meanwhile, the cross-correlation function (CCF) was used to analyze the correlation between monthly-scale LAI and GPP data across all years, alongside climate factors – specifically precipitation, temperature, and radiation – that may influence the seasonal dynamics of vegetation. CCF is a statistical tool employed to quantify the correlation between two time series, which reflects the correlation of one series with another at varying time lags. In the context of climate data analysis, CCF can detect seasonal variations by identifying cyclical patterns and analyzing seasonal lags. Our objective is to determine the seasonal correlation between LAI and GPP in relation to these environmental factors and to identify any temporal delay in the vegetation's response to seasonal climate changes. Additionally, we aimed to quantify the extent to which these environmental factors impact vegetation growth and the subsequent lag effects they produce.
3.1 Long-term trends in LAI and GPP in China
In general, the LAI and GPP of all models exhibit an upward trend, aligning with the direction of remotely sensed observation (Fig. 1). Regarding the spatial distribution of the observed LAI (Fig. S2 in the Supplement), most of the area experienced an increase in LAI from 2003 to 2019, with 60.31 % of the area showing a significant upward trend and a total of 88.11 % of the area exhibiting some level of increase. The regions with significant increases were primarily located in areas dominated by forested and cultivated land use types. The increasing trend of observed LAI is 0.012 , which aligns with the trend simulated by the multi-model ensemble (MME) (0.0094 ± 0.0058 ), suggesting that the simulated LAI effectively captures the overall interannual trend of LAI. However, the normalized interannual trend of the observed CSIF is 0.16 yr−1, which exceeds the normalized GPP trend simulated by the MME (0.086 ± 0.021 yr−1), indicating that the models may underestimate the actual GPP interannual trend. The spatial distribution pattern of the observed CSIF data closely mirrors that of the observed LAI (Fig. S3 in the Supplement), with most areas displaying an increasing trend – 66.4 % of the area showing a significant increase and a total of 93.22 % of the area showing some increase.
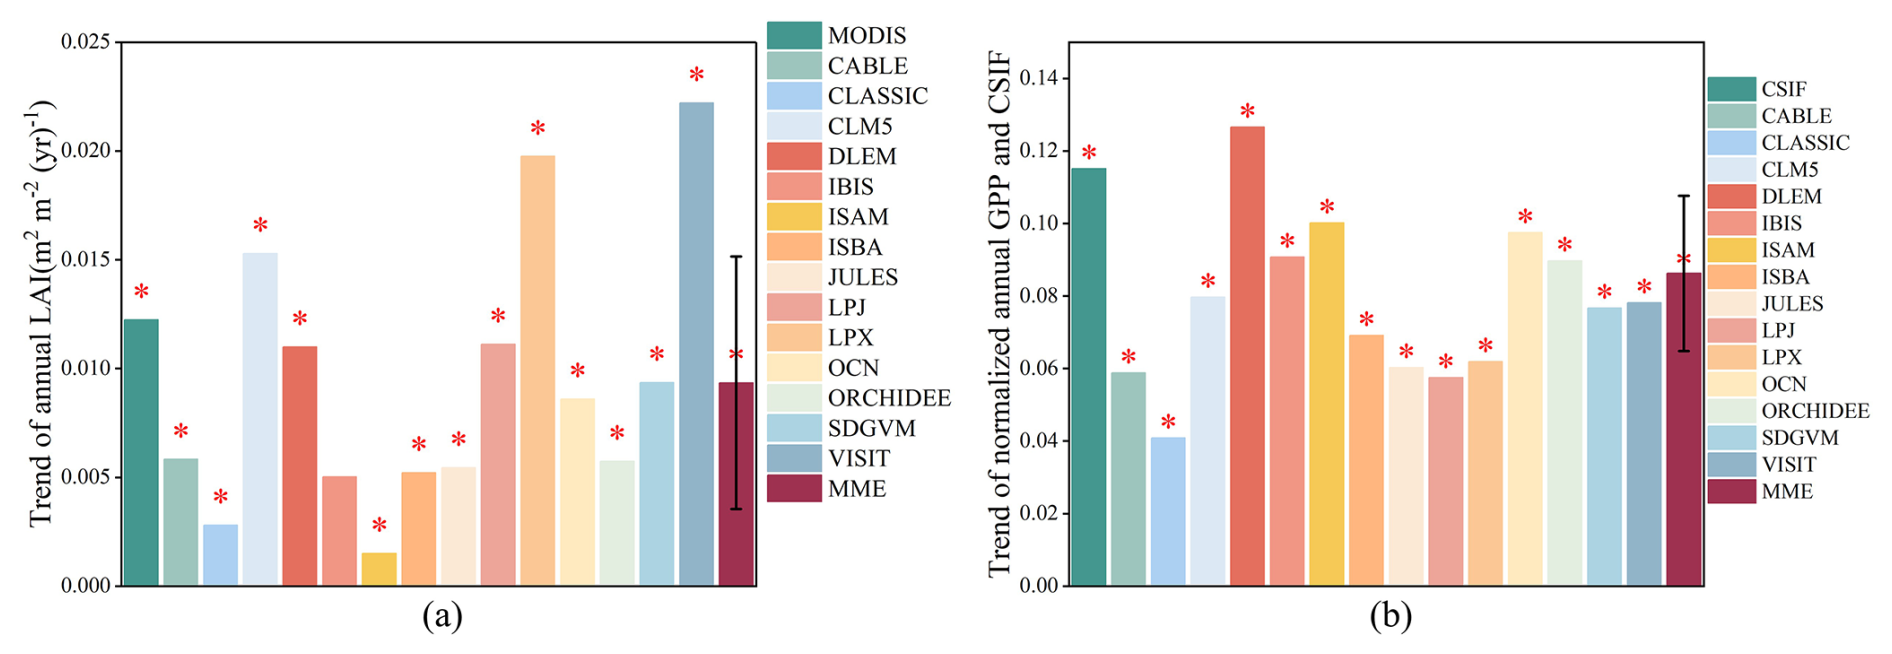
Figure 1Overall annual average LAI and GPP trends in China during 2003–2019. (a) Annual trends in observed and simulated LAI. (b) Annual trends in observed and simulated GPP. The asterisk (*) indicates the significant trend (p<0.05). The error bar for MME is the standard deviation of the 14 simulated trends.
Spatially, the comparison between simulated and observed LAI reveals that all models exhibit both overestimations and underestimations across most regions of China (Fig. 2). In the MME (Fig. 2a), only about one-third of the area demonstrates strong performance in simulating LAI trends. The normalized trend comparisons between simulated GPP and observed CSIF mirror the performance observed with LAI (Fig. 3). However, most models tend to underestimate GPP over a larger area than they do LAI. Although the DLEM model outperforms other models in simulating long-term GPP trends, its accuracy remains constrained below 50 % relative to observational benchmarks (Fig. 3e). Notably, the MME underestimates GPP in more than 50 % of the area (Fig. 3a).
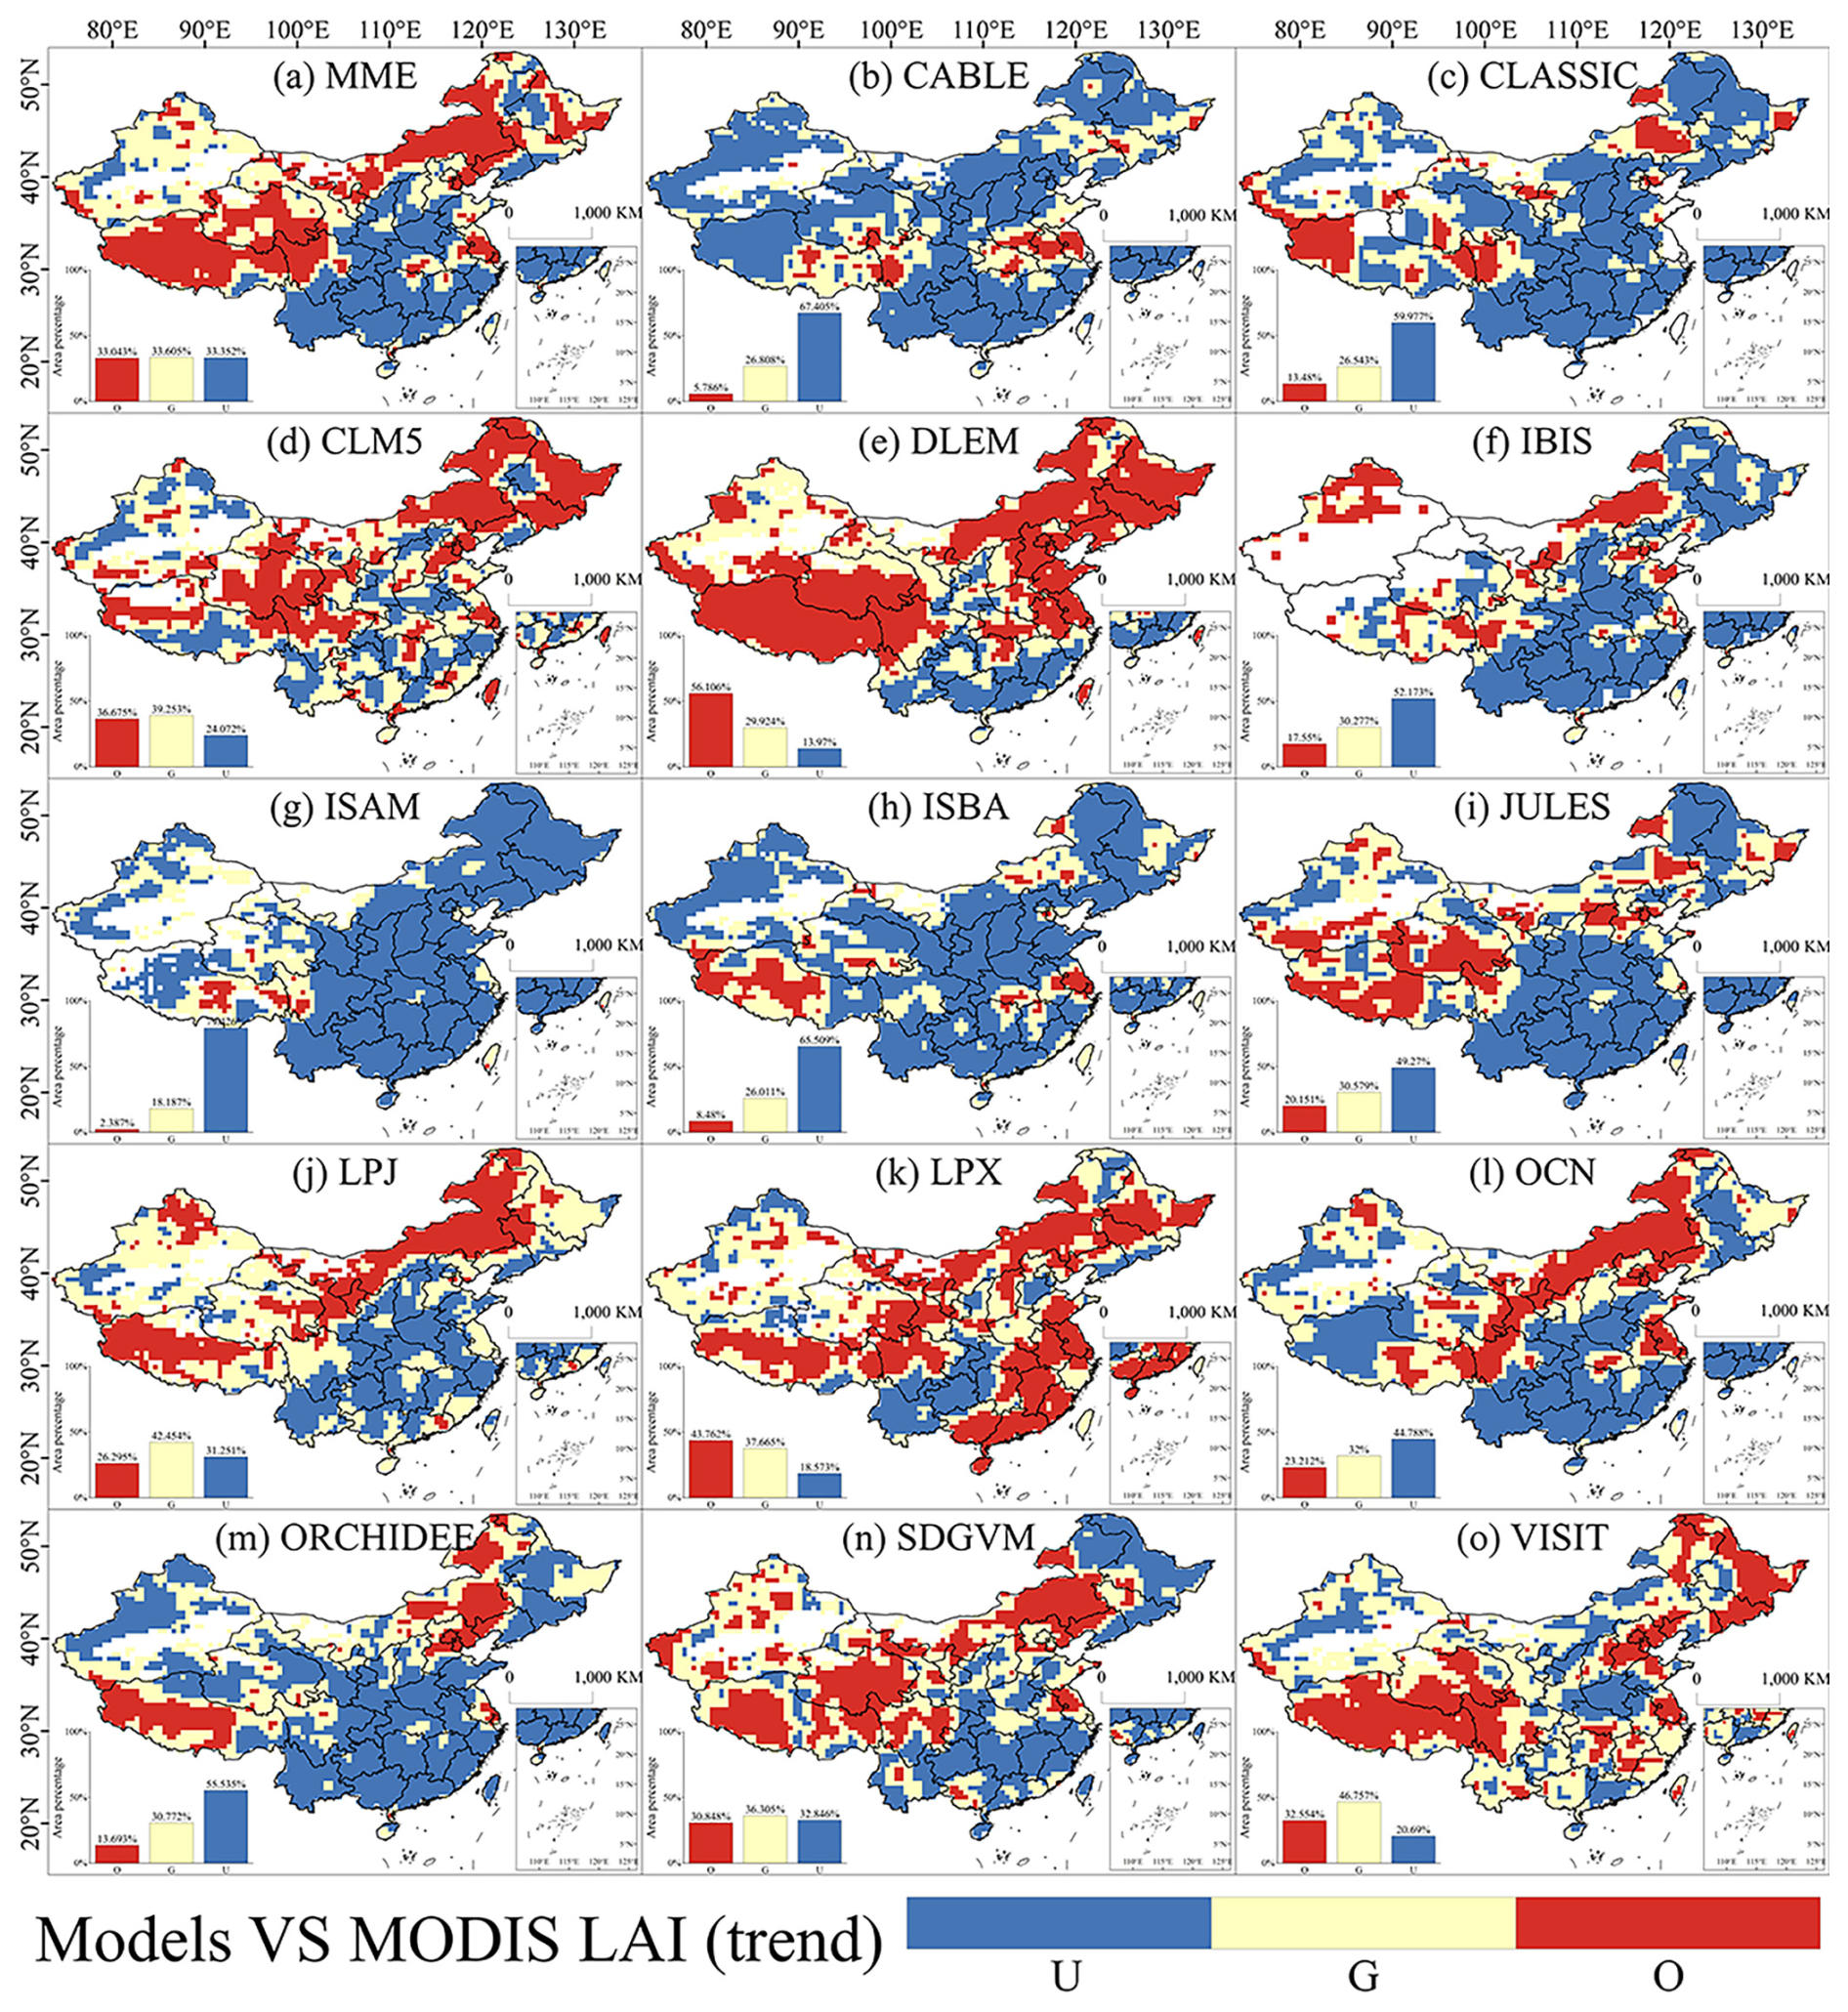
Figure 2Evaluation of the LAI trend performance of the DGVMs from 2003 to 2019 in China. A paired t test with a sample size of 9 was conducted using a 3×3 sliding window to determine whether the model simulated a trend that was not significantly different from the observed data (good), significantly smaller than the observed data (underestimate), or significantly larger than the observed data (overestimate). U, G, and O represent “underestimate”, “good”, and “overestimate”, respectively.
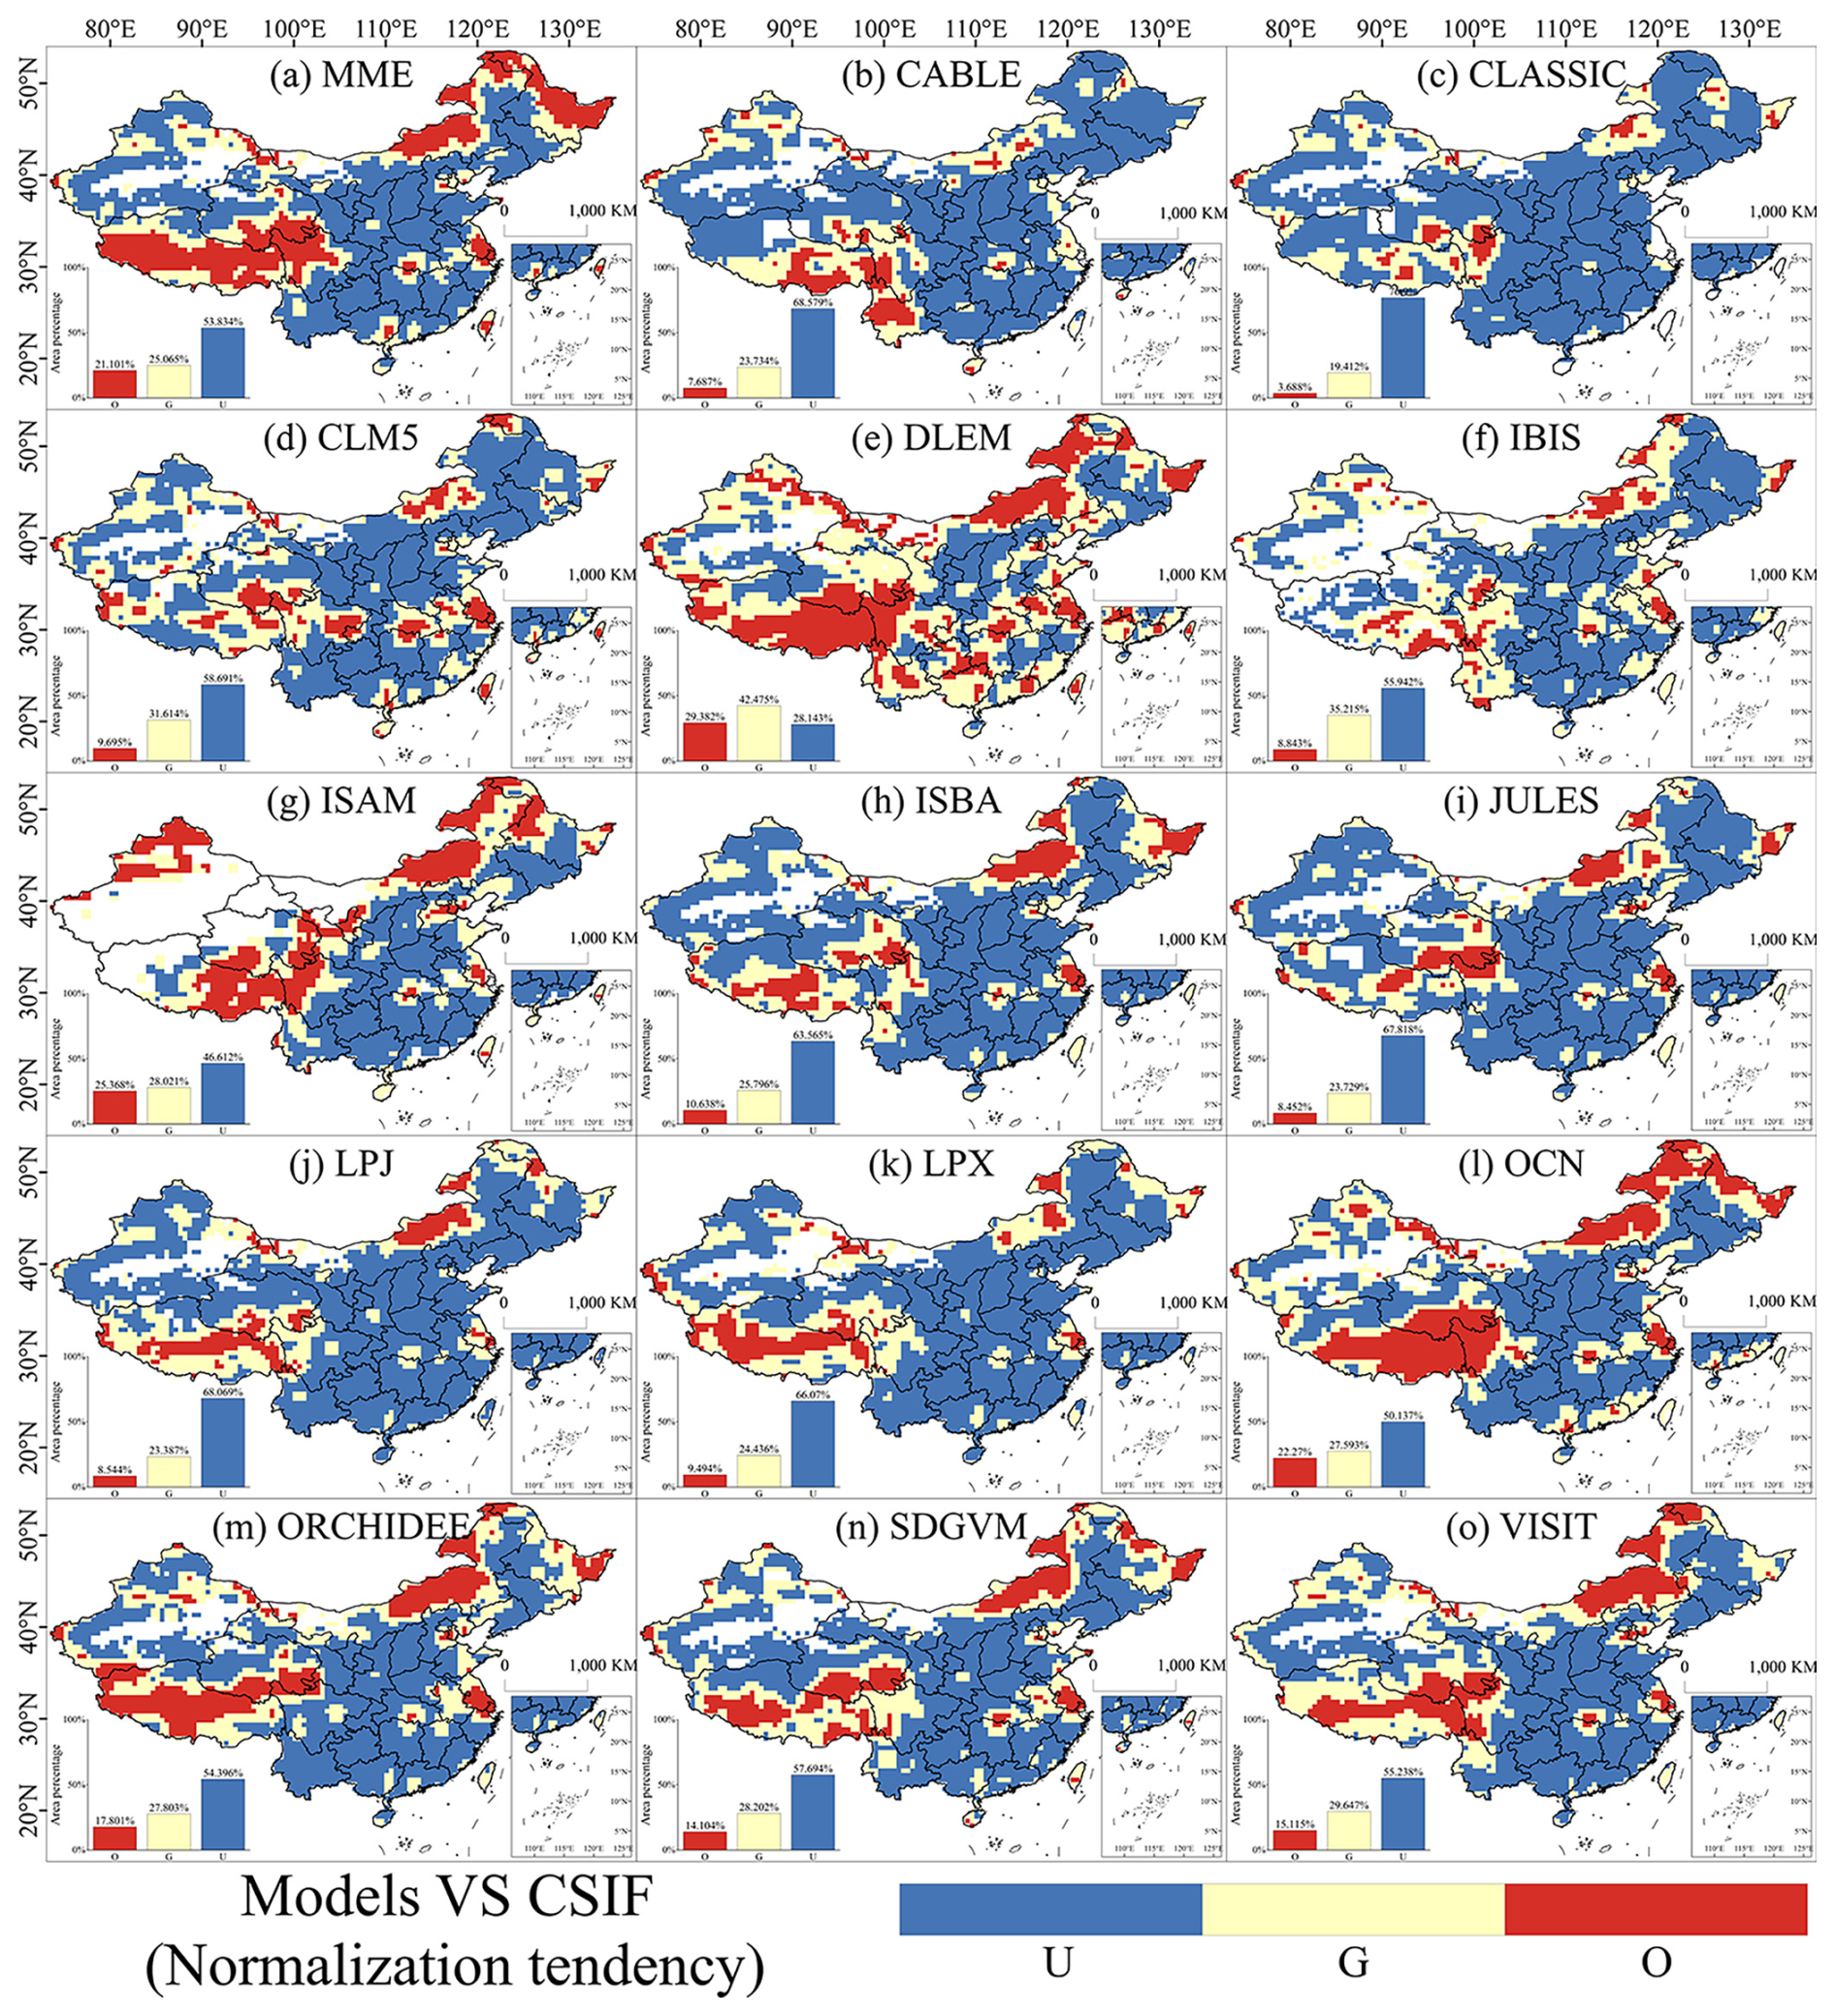
Figure 3Evaluation of the normalized GPP trend performance of the DGVMs from 2003 to 2019 in China. A paired t test with a sample size of 9 was conducted using a 3×3 sliding window to determine whether the model simulated a trend that was not significantly different from the observed data (good), significantly smaller than the observed data (underestimate), or significantly larger than the observed data (overestimate). U, G, and O represent “underestimate”, “good”, and “overestimate”, respectively.
Combining the results from Figs. 2 and 3, we observed that the regions where the models overestimate or underestimate LAI and GPP display similar overall distribution patterns. These patterns closely correspond with the spatial distribution of vegetation and land use types in China. To enhance the accuracy and relevance of our analysis, we classified the study area based on these land use types. As shown in Fig. S4 in the Supplement, the overall simulated LAI and GPP trends in forested land were generally underestimated. The LAI trend for MME in forested land was 0.015 ± 0.011 , and the normalized trend of GPP was 0.13 ± 0.025 yr−1. These values are significantly lower than the trend value of observed LAI in forested land (0.027 ) and the normalized trend of observed CSIF (0.16). In contrast, the trends of observed LAI in grassland and cropland were 0.0047 and 0.086 , respectively, which fall within the margin of error of the multi-model trend. The LAI trend values for the models in grassland and cropland were 0.0088 ± 0.0066 and 0.011 ± 0.0072 , respectively. The normalized trends of observed CSIF in grassland and cropland were 0.086 and 0.13 yr−1, respectively. In grassland, the normalized MME's GPP was 0.091 ± 0.026 yr−1, which includes the trend of observed CSIF within its error margin. However, the normalized post-trend value of GPP for MME in cropland (0.093 ± 0.030 yr−1) was relatively low.
Upon calculating the percentage of area misestimated for forest land, grassland, and cropland, respectively (Fig. S5 in the Supplement), distinct patterns of misestimation became evident across different land use types. The models underestimated the LAI trend in forest land by up to 71.26 % of the area, with overestimation occurring in less than 10 % of the area. Conversely, for grassland, the models overestimated the LAI trend in 60.80 % of the area, with underestimation occurring in less than 10 %. In cropland, the models overestimated the LAI trend for 20.90 % of the area and underestimated it for 41.80 %. Overall, the models predominantly underestimated the LAI trend in forest land, displayed varying degrees of misestimation in cropland.
3.2 Long-term responses of LAI and GPP to environmental factors
The variation in the impact of environmental factors on vegetation LAI can be understood as a combination of the trends in these factors and their sensitivity to LAI (Fig. 4). Among these factors, the sensitivity of LAI to CO2 concentrations – both observed and simulated data – was significantly higher compared to other environmental variables. The annual normalized trend increase in CO2 concentration was 0.20, markedly surpassing that of precipitation (0.035), temperature (0.048), and light radiation (−0.036) (Figs. 4 and S6–S8 in the Supplement). Thus, when considering both trends and sensitivities, CO2 concentration stands out as the most dominant environmental factor driving changes in both observed and most simulated LAI.
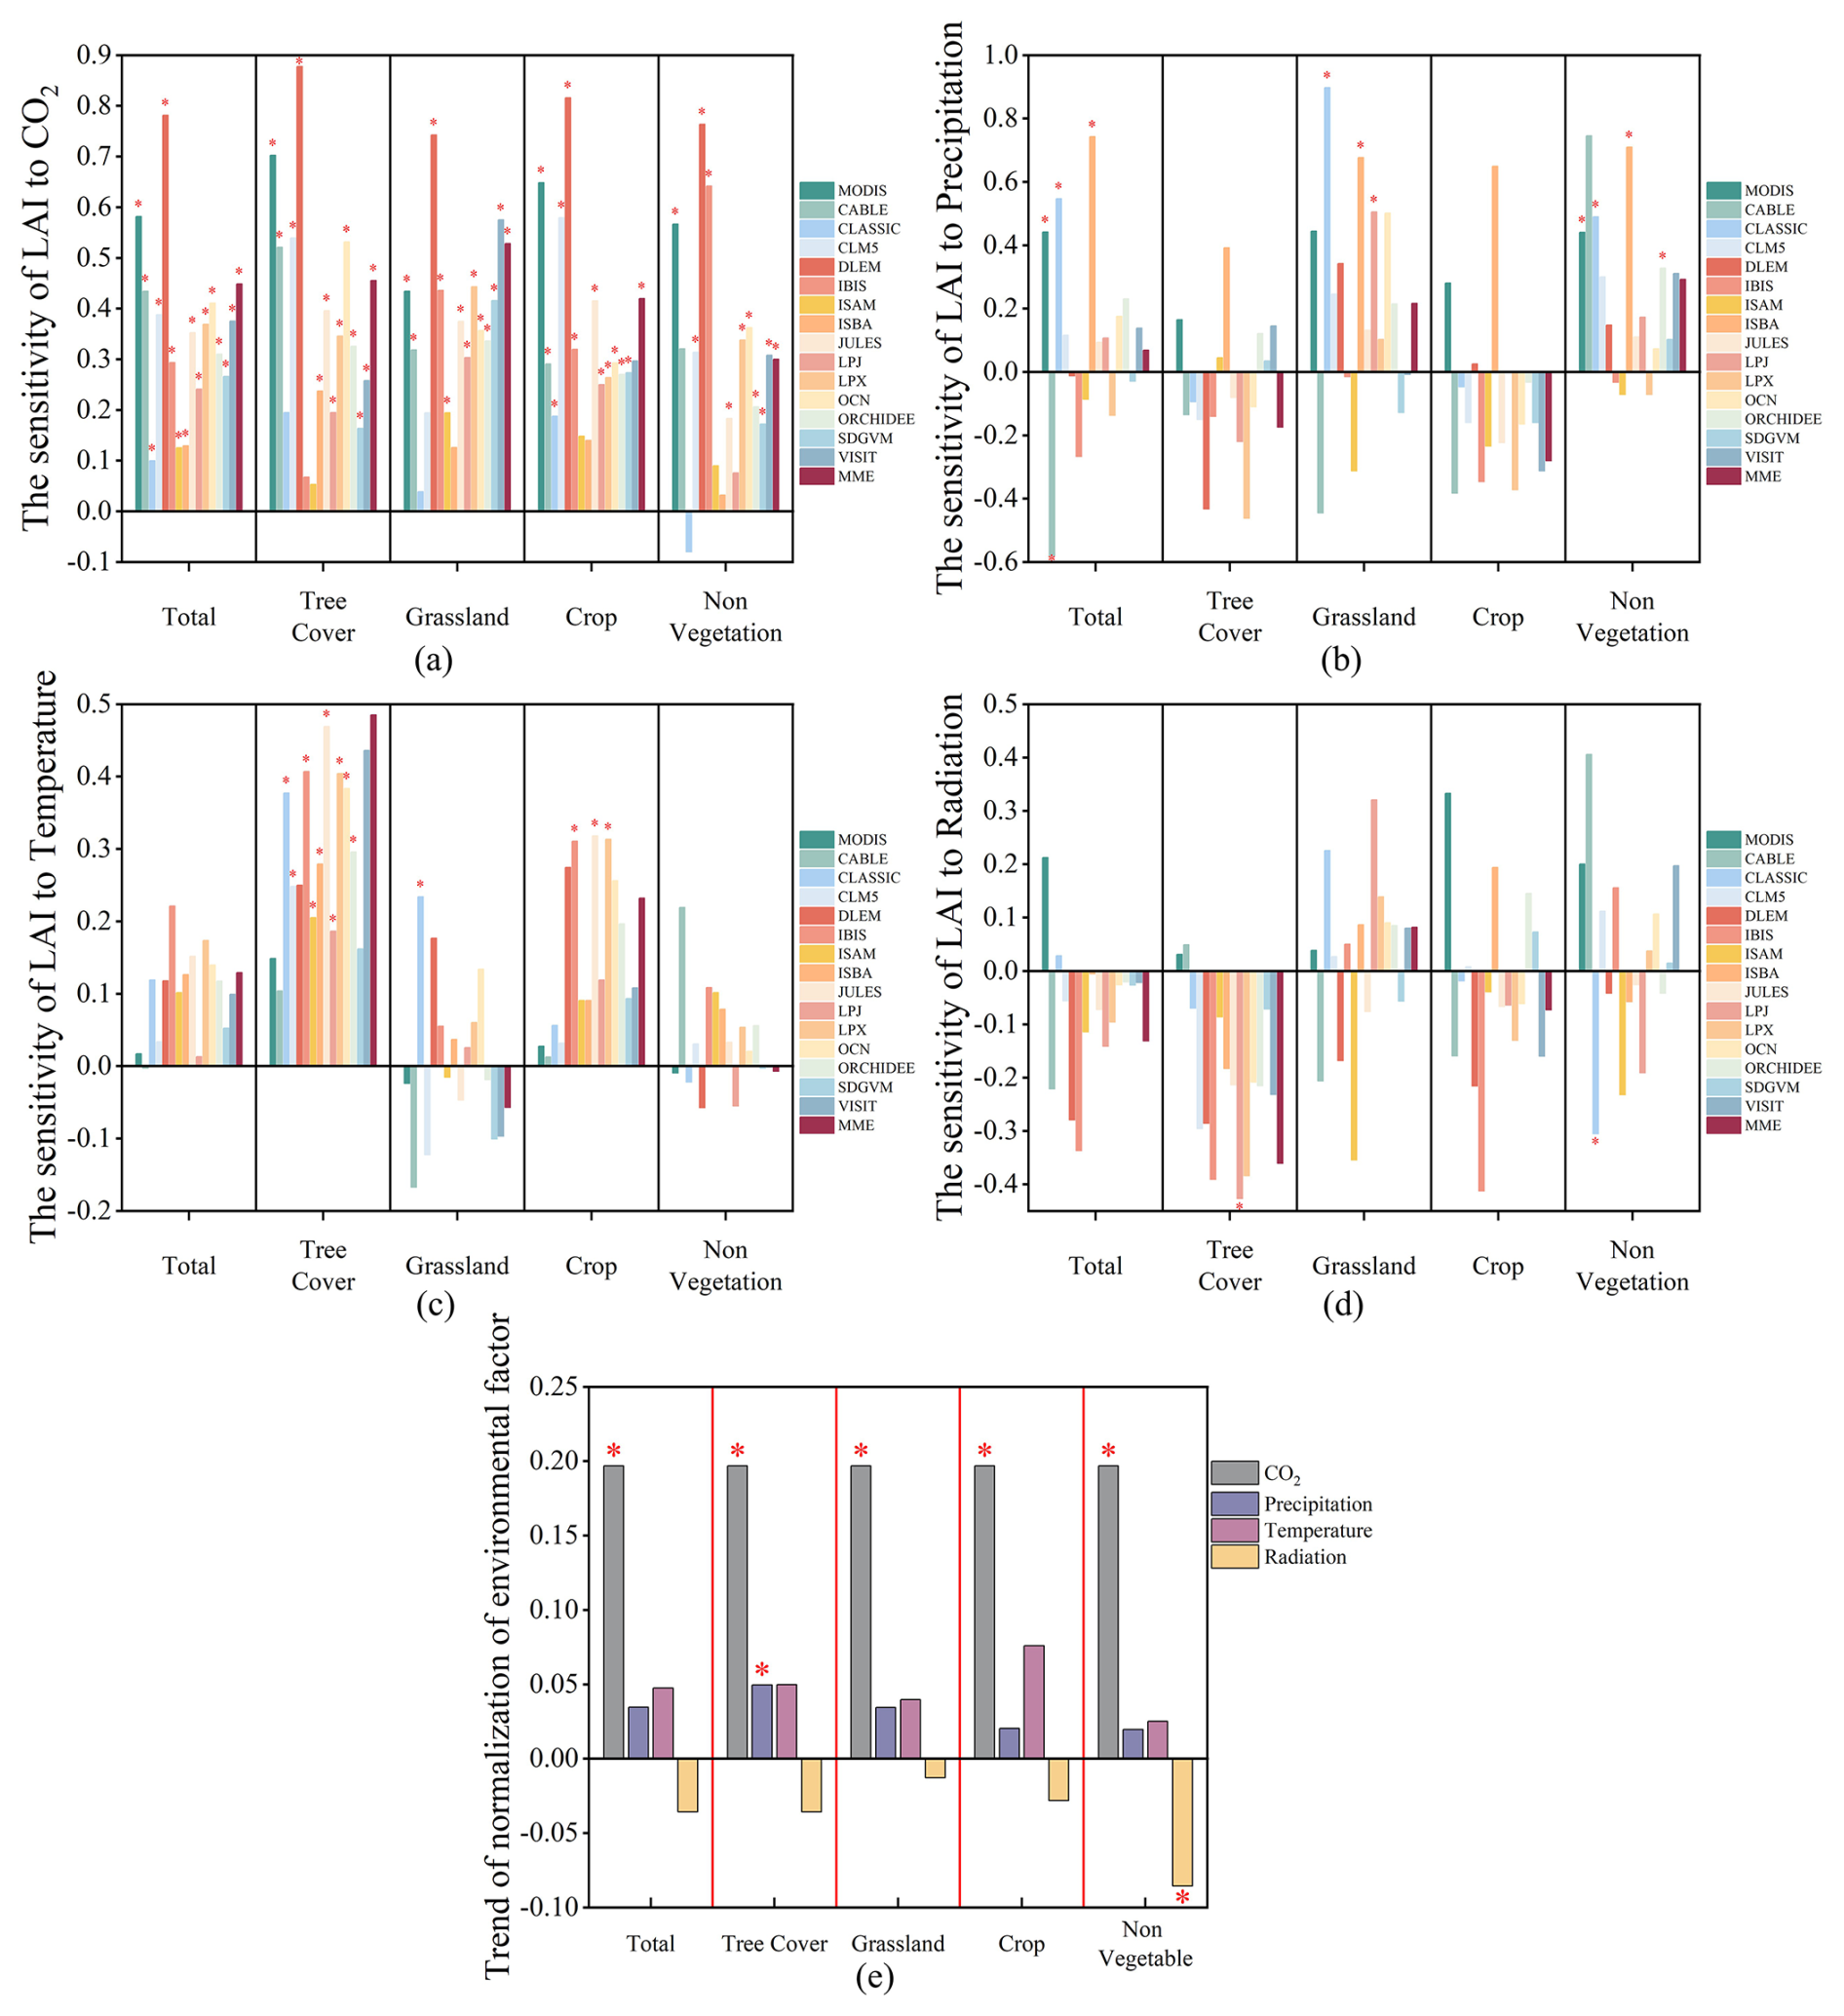
Figure 4The long-term response of observed and simulated annual mean LAI to CO2, precipitation, temperature, and radiation over different land use types during 2003–2019 in China. (a–d) The sensitivity of response of annual mean observed and simulated LAI to the four environmental factors, respectively. (e) The annual mean normalized trends of the four environmental factors. The asterisk (*) indicates the significant sensitivity or significant trend (p<0.05) for environmental factors.
The study identified CO2 concentration as the most significant environmental factor influencing changes in both observed and simulated LAI. A spatial comparison was conducted to assess the impact of CO2 concentration on simulated LAI changes versus those observed in observed LAI (Fig. 5). The results indicated that in most models, the influence of CO2 concentration on LAI changes deviated significantly from actual observations. Even the best-performing model, CLM5, accurately accounted for less than 40 % of the area with accurately observed LAI changes, with large areas showing either overestimation or underestimation. These misestimated areas displayed a consistent pattern in their spatial distribution, mirroring the spatial trends observed in the model's overall LAI trend performance (Fig. 2), where significant overestimation occurred in grasslands. Regarding spatial differences in the sensitivity of observed and simulated LAI to precipitation, temperature, and radiation effects (Figs. S9–S11 in the Supplement), the models still exhibited substantial areas of underestimated and overestimated misestimation for these three environmental factors. However, the proportion of well-performing models increased compared to those influenced by CO2 concentration. Notably, the spatial distribution of simulated LAI changes in response to CO2 concentration closely resembled the spatial distribution of actual LAI changes (Figs. 2 and 5).
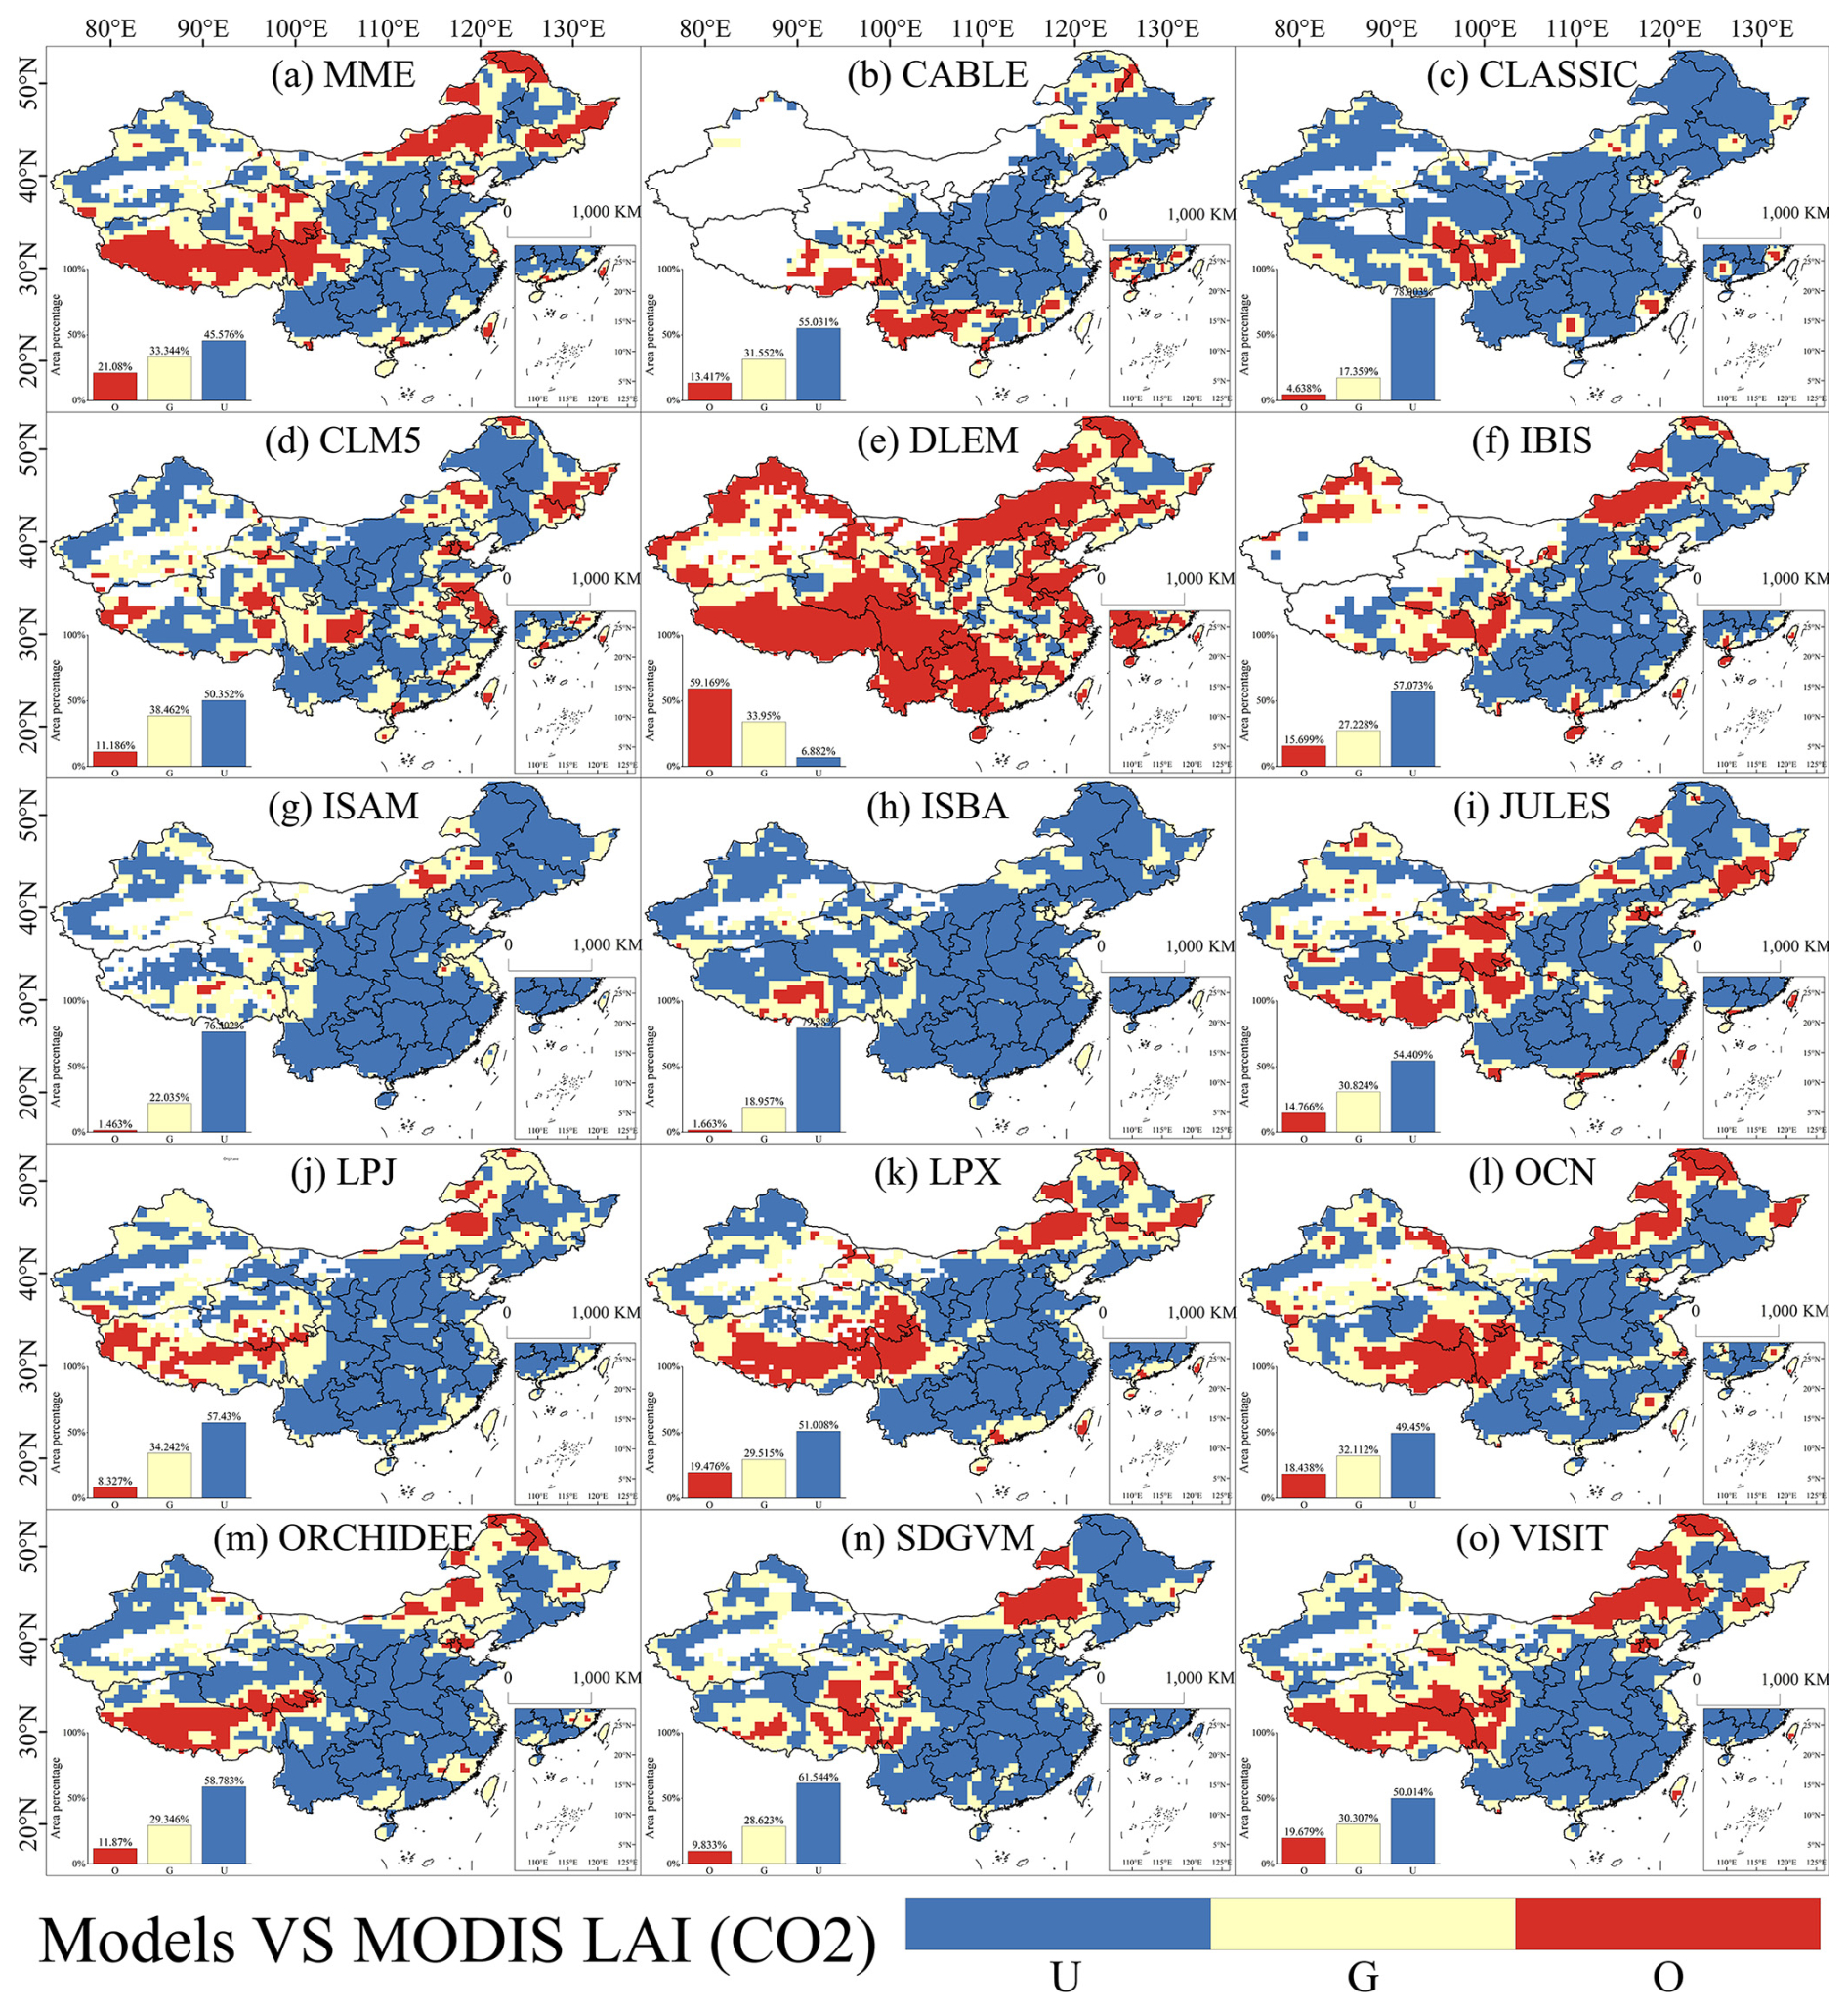
Figure 5Spatial distribution of sensitivity differences between the effects of CO2 concentration on observed and simulated LAI in China. A paired t tests with a sample size of 9 was conducted using a 3×3 sliding window to determine whether the effect of CO2 concentration on the amount of simulated LAI change was not significantly different from the effect on the amount of observed LAI change (good), was significantly smaller than the observed data (underestimate), or was significantly larger than the observed data (overestimate). U, G, and O represent “underestimate”, “good”, and “overestimate”, respectively.
3.3 Seasonal variations in LAI and GPP in China
Site-scale seasonal performance was validated using data from five FLUXNET sites in China, comparing simulated GPP with observed CSIF (Fig. S12 in the Supplement). The results in Fig. S12 demonstrate that a significant portion of the simulated GPP and CSIF data exhibit strong seasonality across the different sites, closely aligning with the seasonal patterns observed in the GPP data from the FLUXNET sites. The seasonal correlations between the FLUXNET sites and the simulated GPP and CSIF exceeded the significance threshold.
The overall seasonal correlations between simulated LAI and GPP indicate that most models performed well in terms of seasonal accuracy in vegetated areas (Fig. 6). With a few exceptions, such as the DLEM model, most models demonstrated that seasonal correlations with observed LAI exceeded the threshold, indicating significant seasonal performance. Additionally, all models showed exceptionally high seasonal correlations between GPP and CSIF, surpassing the threshold. In summary, the models effectively capture the seasonal performance of both LAI and GPP, whether considered globally or across different land use types.
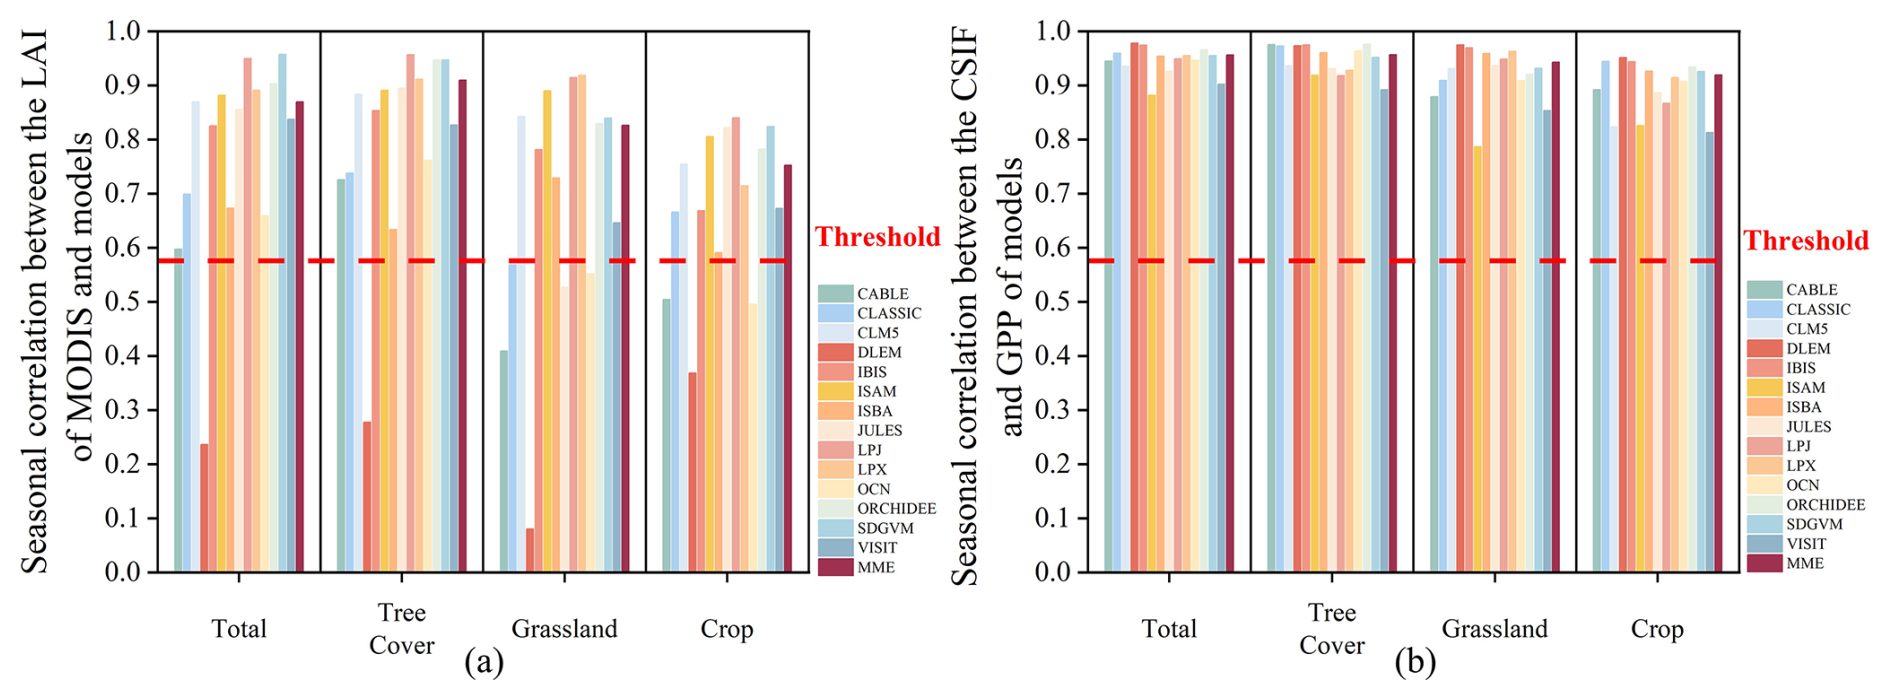
Figure 6The overall seasonal correlation between observed and simulated in China. (a) The seasonal correlation of simulated LAI with observed LAI over different land use types. (b) The seasonal correlation of simulated GPP with observed CSIF over different land use types. The red line indicates the correlation coefficient corresponding to the significance level (p=0.05). The values over the red line indicate that the model can capture the seasonality of MODIS LAI or CSIF in phase.
Spatially, most areas exhibited good to very good seasonal performance for LAI and GPP across most models (Figs. 7 and 8). Specifically, the percentage of areas with good seasonal performance for LAI in MME was 95.60 %, while for GPP it was 88.58 %. When analyzing land use type classification in China, regions exhibiting weak seasonal performance (i.e., p>0.05) in LAI and GPP were predominantly found in non-vegetated areas. Therefore, among vegetated regions, the seasonal accuracy of simulated LAI and GPP across China is remarkably high.
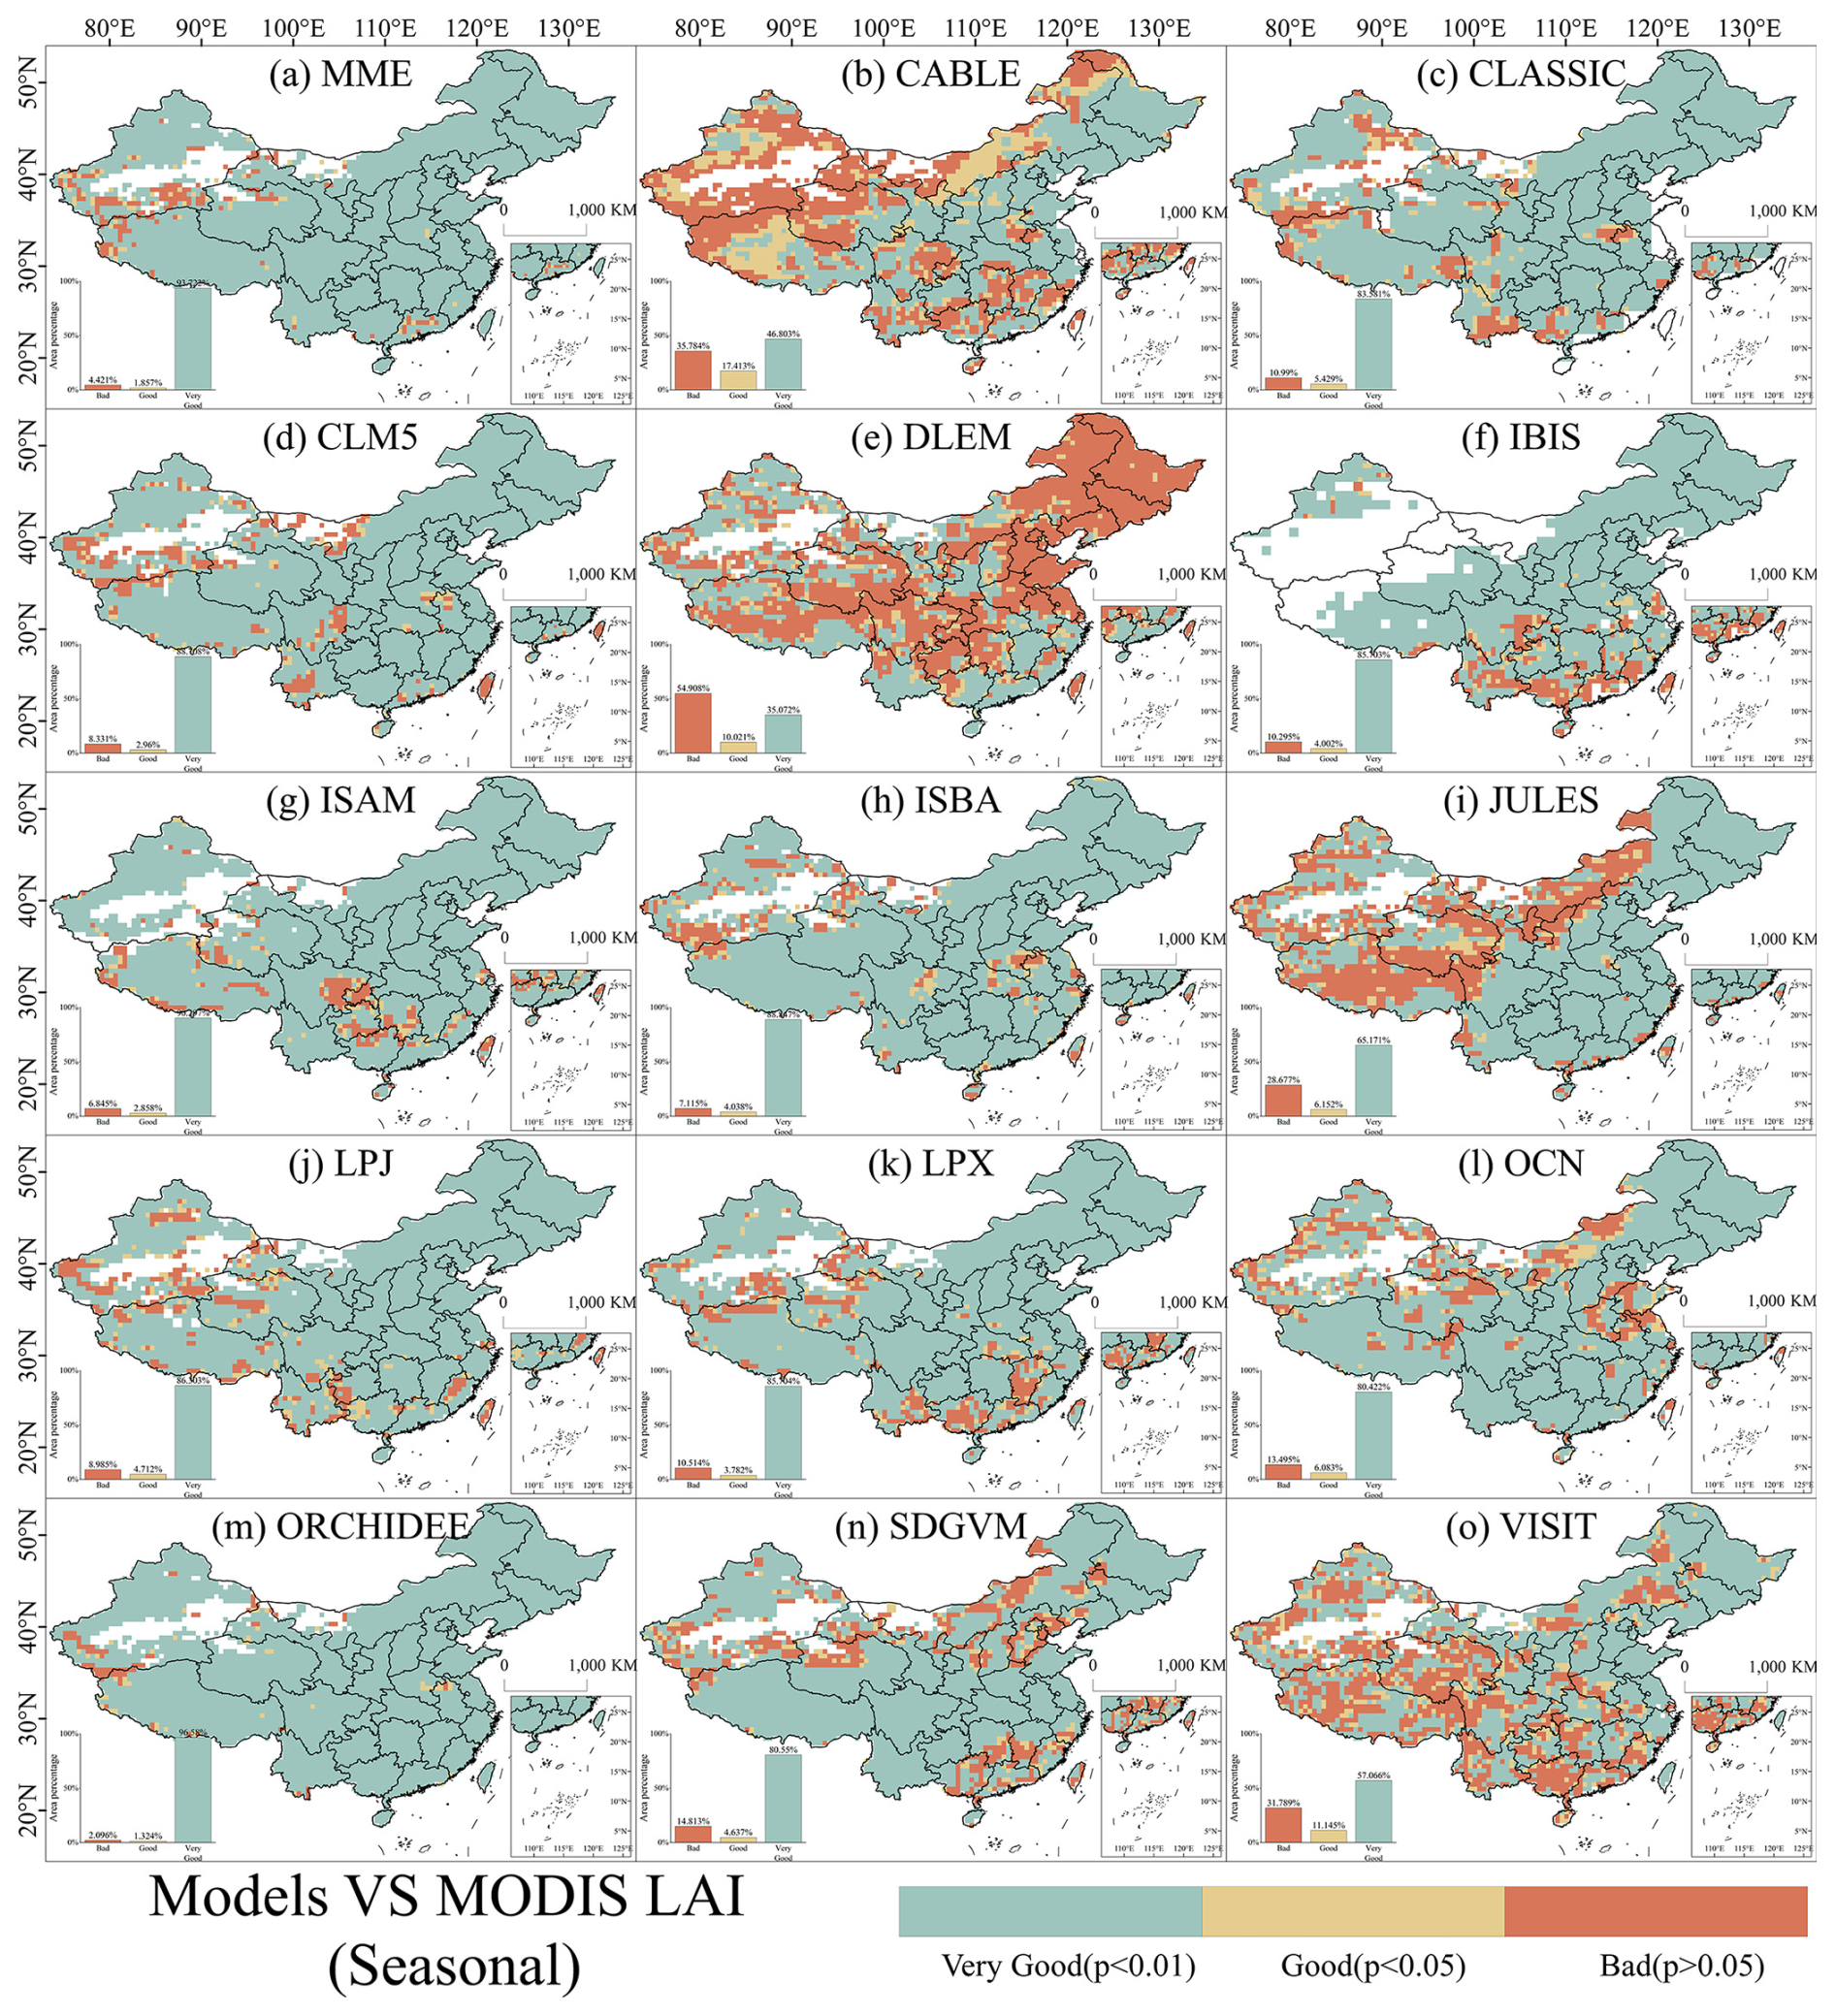
Figure 7Spatial distribution of Pearson correlations of the seasonality of observed and simulated LAI during 2003–2019 in China. Pearson correlations were conducted using a 3×3 sliding window to determine whether simulated seasonal LAI was highly significantly correlated (p≤0.01) with observed data (very good), significantly correlated (p≤0.05) with observed data (good), or not significantly correlated (p>0.05) with observed data (bad). B, G, and VG represent “bad”, “good”, and “very good”, respectively.
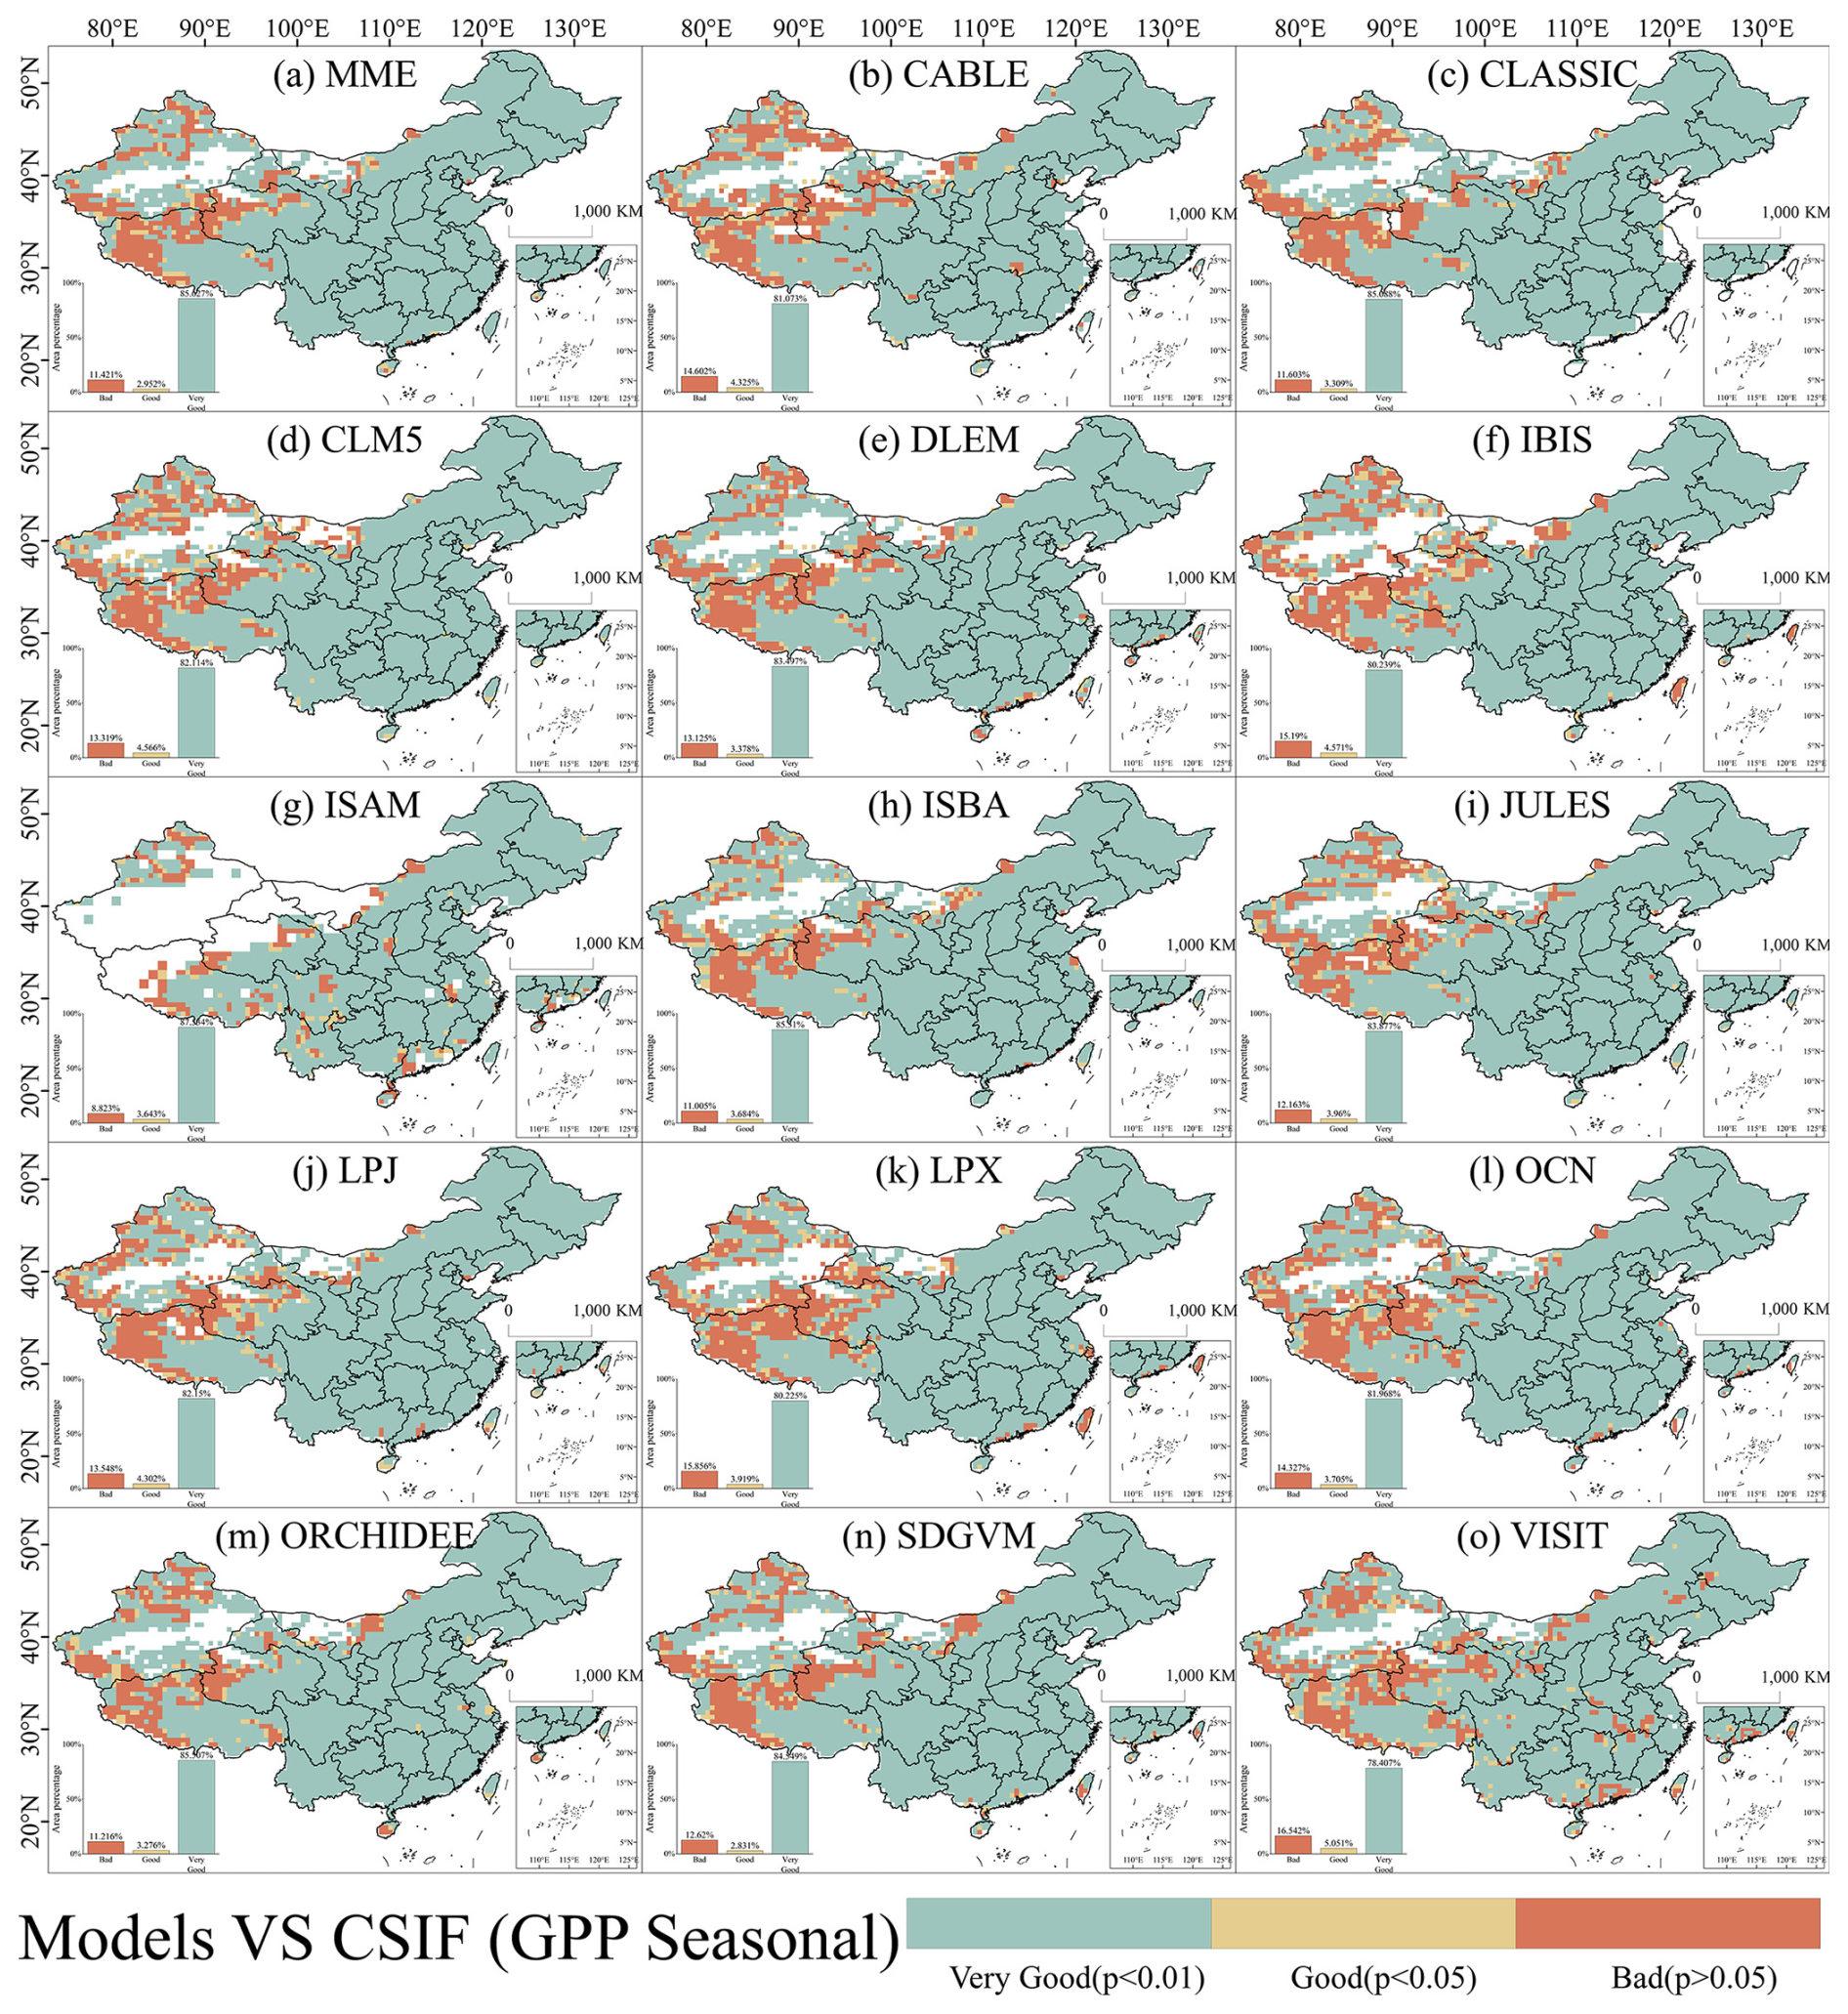
Figure 8Spatial distribution of Pearson correlations of the seasonality of observed and simulated GPP during 2003–2019 in China. Pearson correlations were conducted using a 3×3 sliding window to determine whether simulated seasonal GPP was highly significantly correlated (p≤0.01) with observed data (very good), significantly correlated (p≤0.05) with observed data (good), or not significantly correlated (p>0.05) with observed data (bad). B, G, and VG represent “bad”, “good”, and “very good”, respectively.
3.4 Seasonal responses of LAI and GPP to climate factors
The CCF analysis revealed statistically significant correlations between observed and simulated LAI and key climatic variables – precipitation, temperature, and solar radiation (Figs. 9–11). Similarly, the CCF correlations with all simulated GPP are also very high, except for the DLEM. The correlation coefficients of these models with climate factors all surpass the threshold of significance. Specifically, the CCF seasonal correlations of observed and simulated LAI and GPP with precipitation and temperature slightly surpassed those with radiation. Additionally, the lagged effects of precipitation and temperature were not as pronounced as radiation on LAI and GPP growth promotion. Specifically, the CCF correlations of observed LAI with precipitation and temperature were 0.96 and 0.95, as the correlations of observed CSIF were 0.95 and 0.94, respectively. These values were marginally higher than the CCF correlations of observed LAI and CSIF with radiation, at 0.90 and 0.89. In contrast, the CCF correlations of simulated LAI for MME with precipitation, temperature, and radiation were 0.94, 0.97, and 0.94, while those of simulated GPP with the three climate factors were 0.95, 0.99, and 0.96, respectively. This implies that the simulated LAI and GPP may overestimate the seasonal response to climatic factors. However, in non-vegetated areas, the CCF correlations of observed CSIF with all three environmental factors were lower, with coefficients of 0.76, 0.70, and 0.65 for precipitation, radiation, and temperature, respectively. Nonetheless, the CCF correlations of the simulated GPP with the three climate factors remained very high for the MME, showing coefficients of 0.88, 0.94, and 0.95 for precipitation, radiation, and temperature, respectively. Although the high CCF intercorrelations between seasonal simulated LAI and climate factors are evident, the models generally captured the lagged effects of these factors on LAI for periods 1–2 months longer than observed in remotely sensed data, except for radiation. This time lag is more pronounced in the simulated LAI response compared to actual observations, particularly when compared to the simulated GPP response.
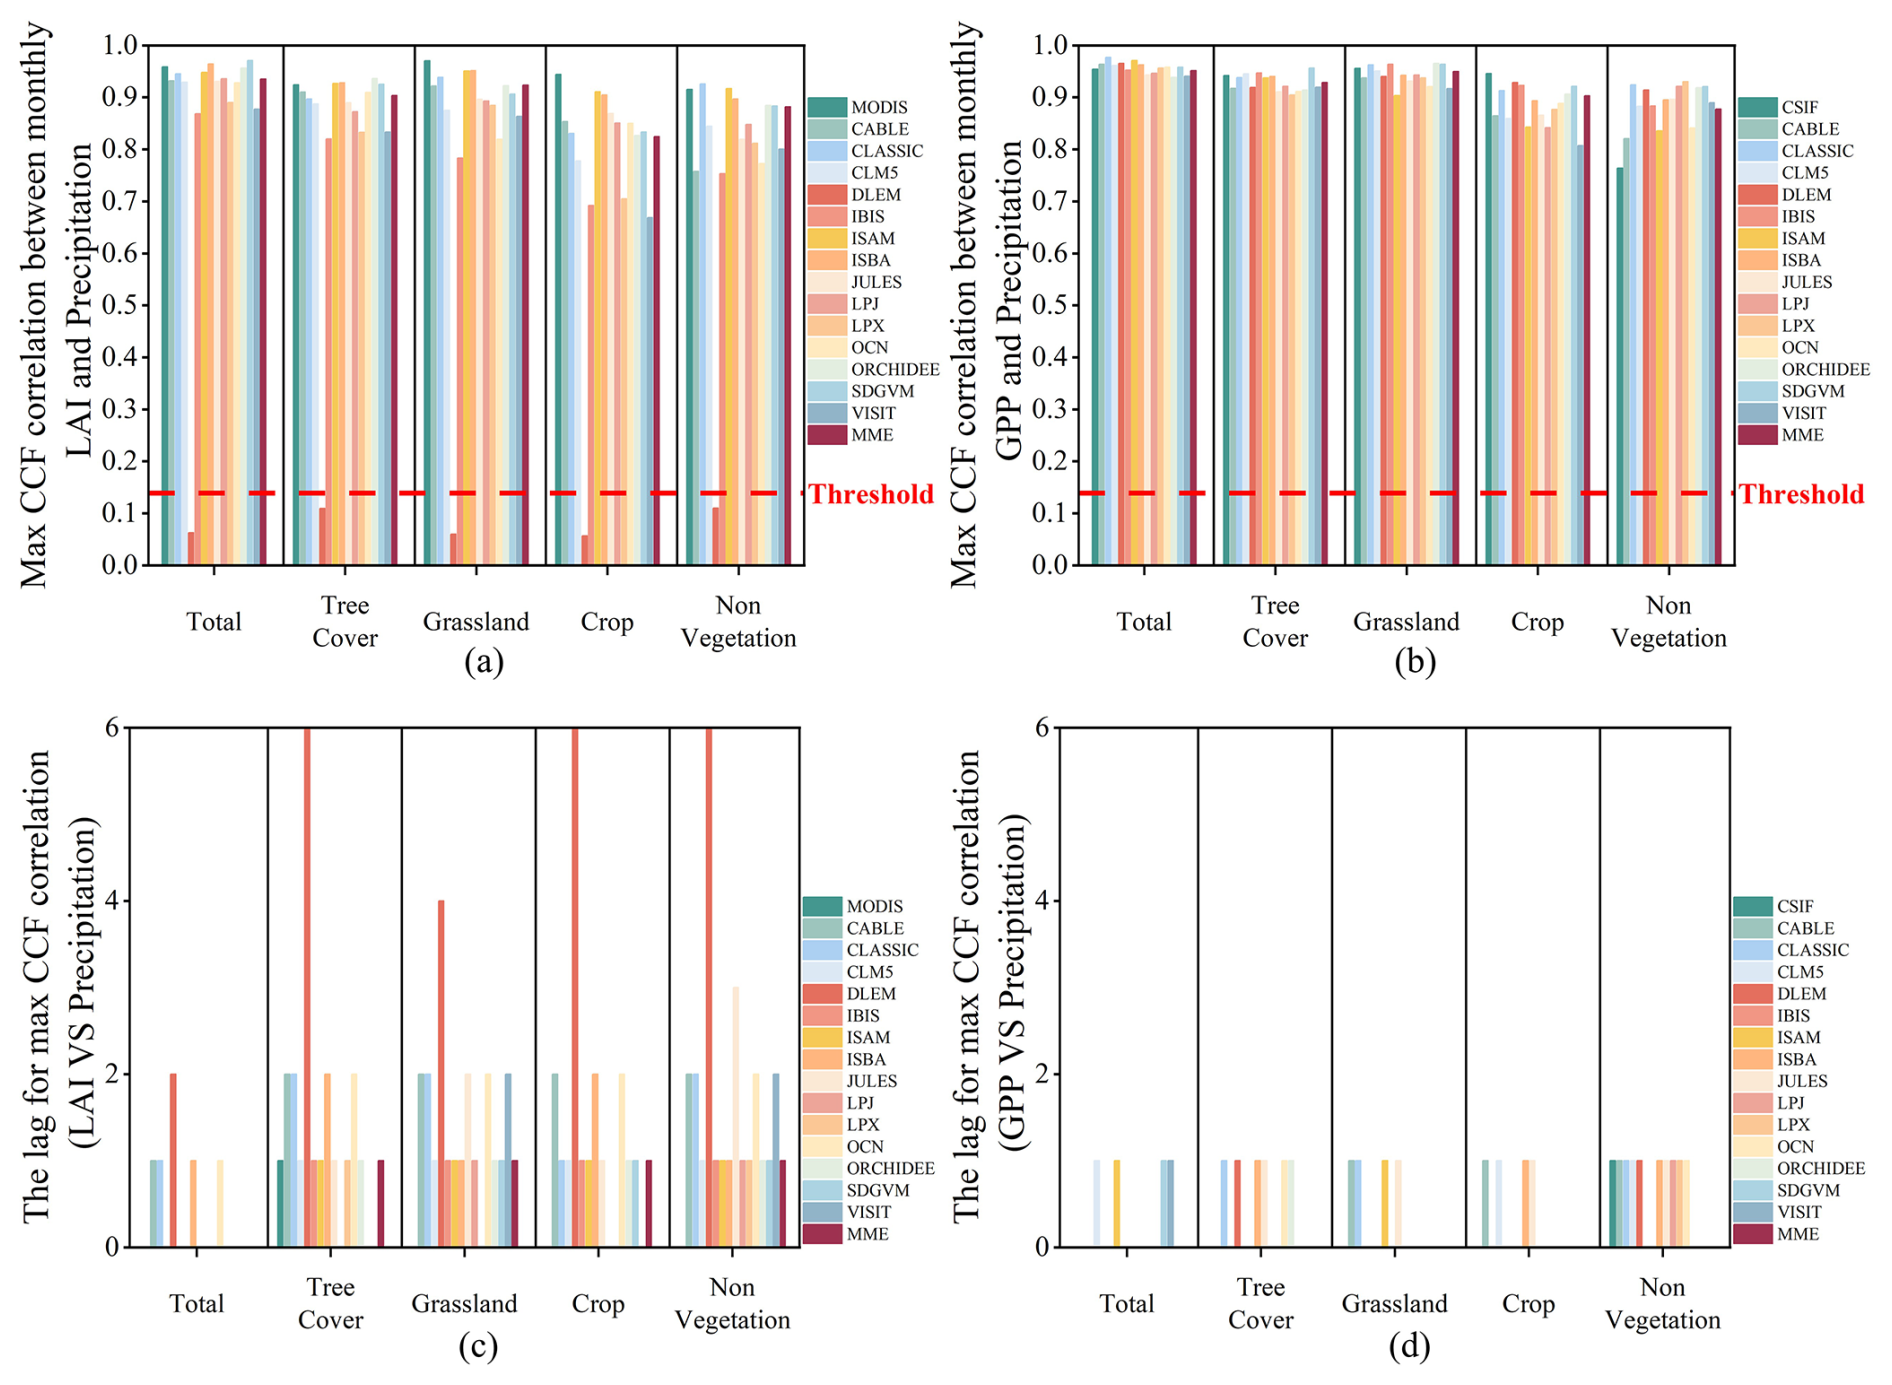
Figure 9The overall CCF of observed and simulated data with precipitation. (a, b) The maximum CCF correlation between observed and simulated LAI and GPP and precipitation. (c, d) The lags between observed and simulated data corresponding to precipitation. The red line indicates the correlation coefficient corresponding to the significance level (p=0.05). The values over the red line indicate that the LAI or GPP can capture the seasonality of the climate factor in phase.
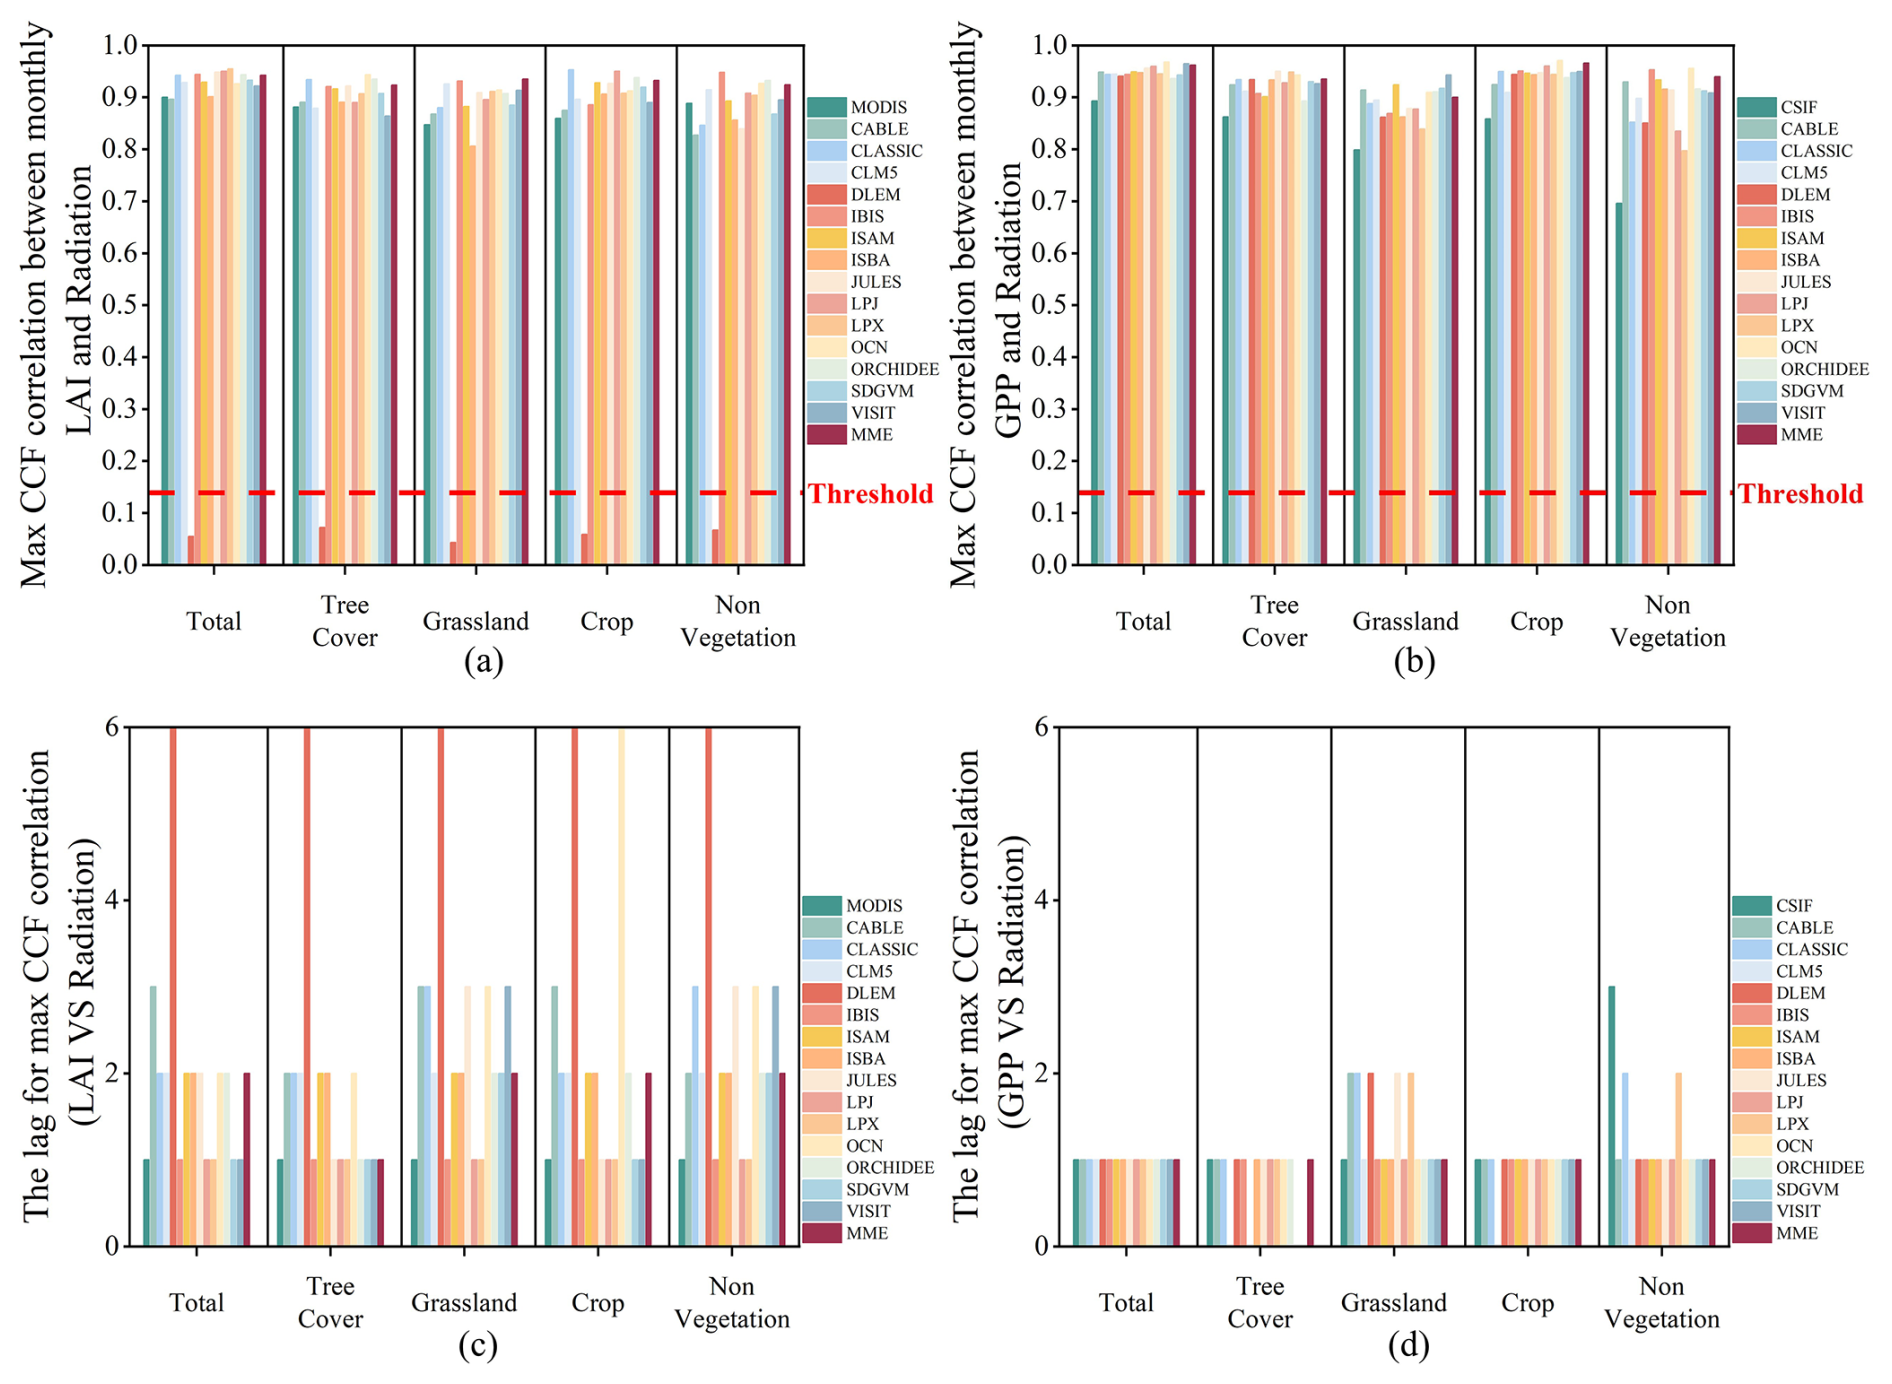
Figure 10The overall CCF of observed and simulated data with radiation. (a, b) The maximum CCF correlation between observed and simulated LAI and GPP and radiation. (c, d) The lags between observed and simulated data corresponding to radiation. The red line indicates the correlation coefficient corresponding to the significance level (p=0.05). The values over the red line indicate that the LAI or GPP can capture the seasonality of the climate factor in phase.
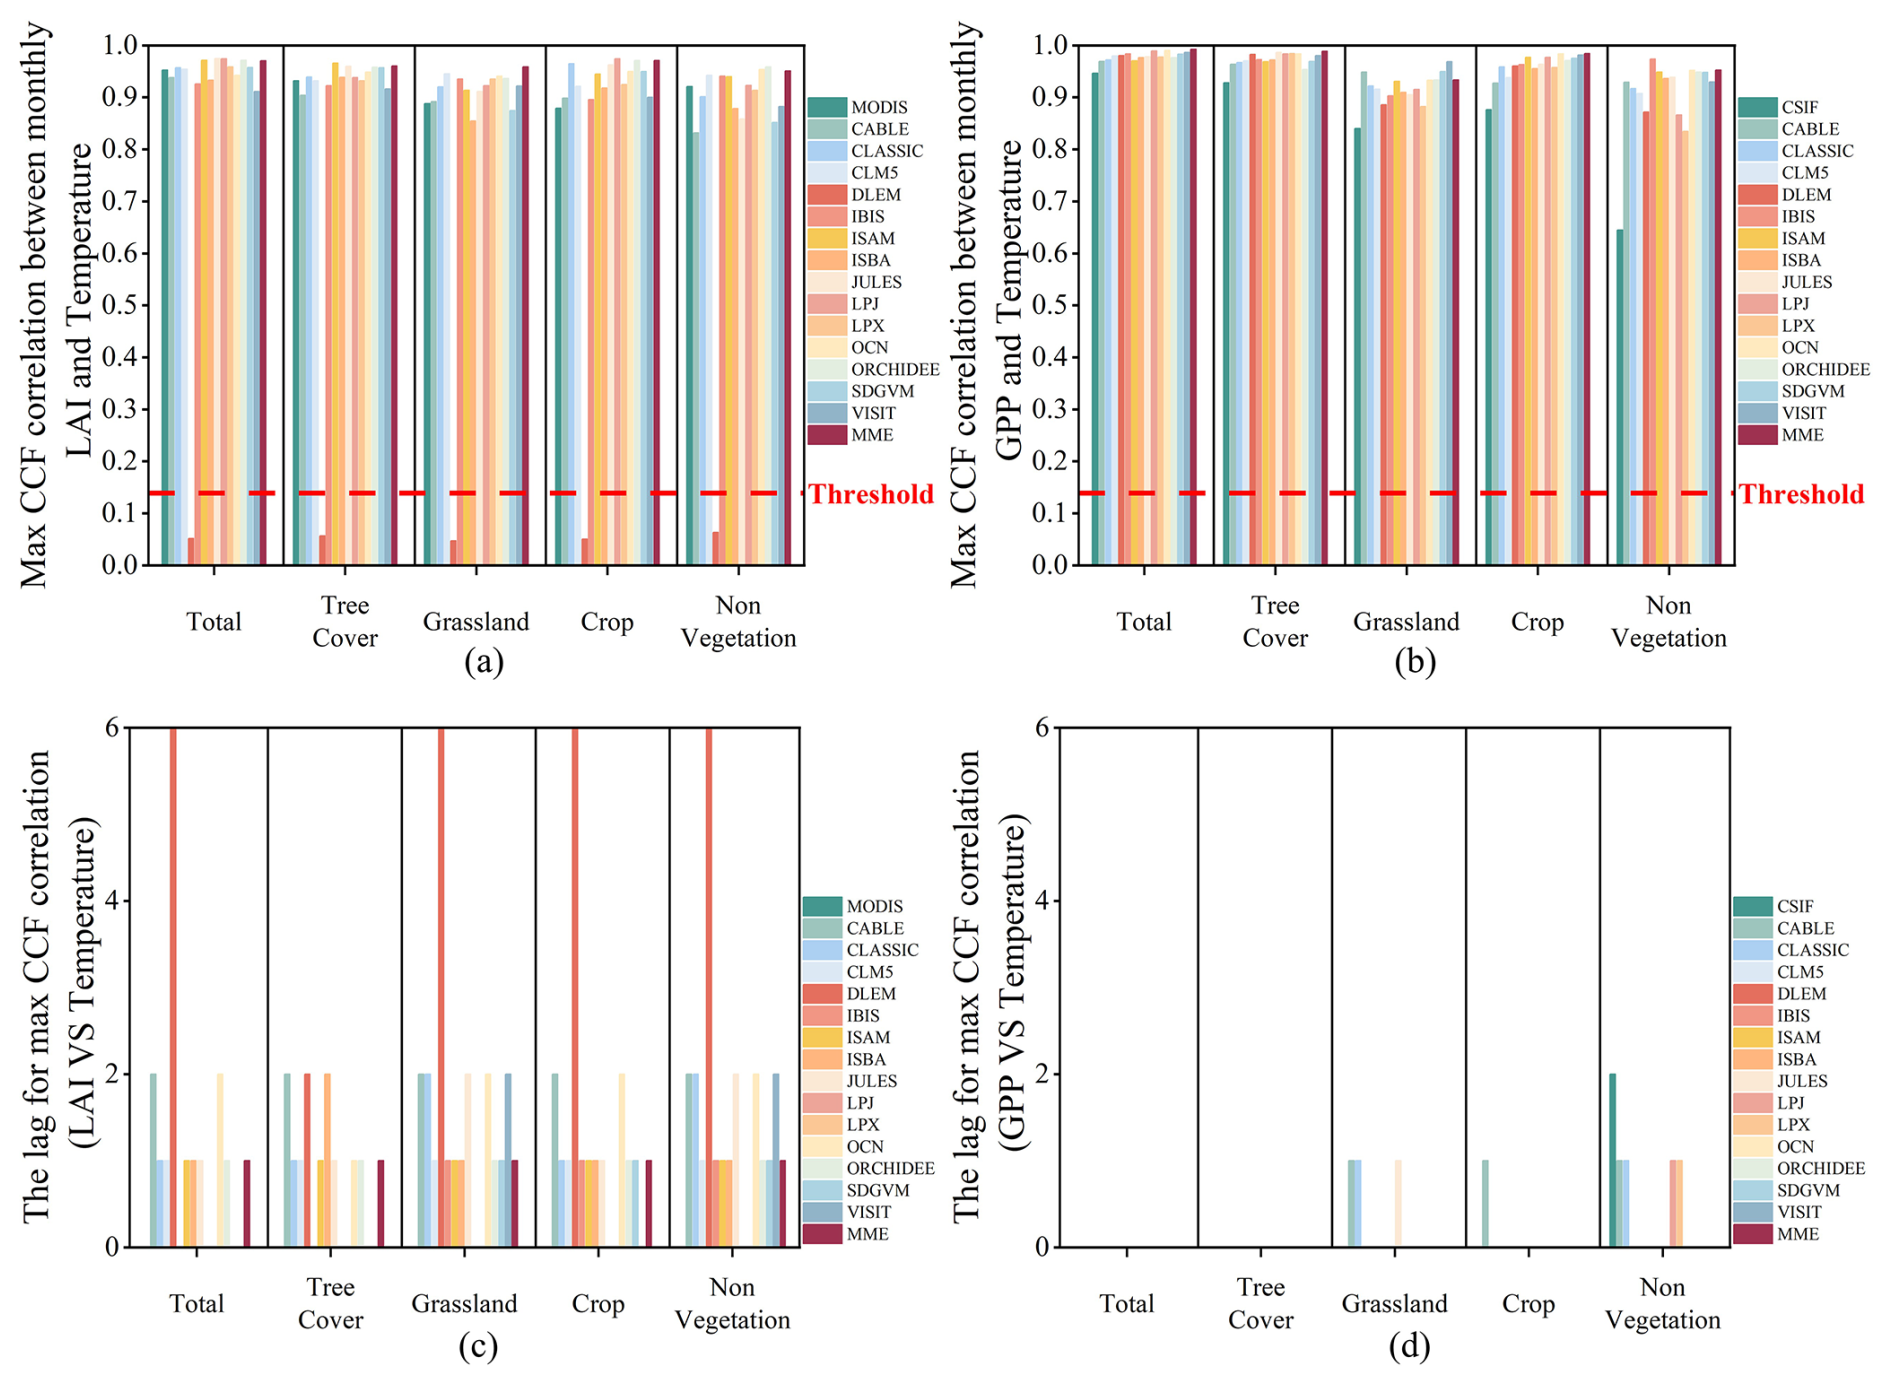
Figure 11The overall CCF of observed and simulated data with temperature. (a, b) The maximum CCF correlation between observed and simulated LAI and GPP and temperature. (c, d) The lags between observed and simulated data corresponding to temperature. The red line indicates the correlation coefficient corresponding to the significance level (p=0.05). The values over the red line indicate that the LAI or GPP can capture the seasonality of the climate factor in phase.
In this study, our findings revealed discrepancies in simulating trends in LAI and GPP, highlighting the limitations of DGVMs in China. Specifically, the models tended to underestimate LAI and GPP in forested areas, overestimate them in grassland regions, and exhibit inaccuracies in agricultural zones. A likely contributing factor to these discrepancies is the models' overestimation of the sensitivity of LAI and GPP to elevated CO2 concentrations in China. Despite these challenges, the models demonstrated a solid capacity to capture the seasonal variations of LAI and GPP. This ability is likely due to their effective representation of vegetation responses to seasonal climatic factors. Numerous studies have shown that vegetation dynamics are shaped by a complex interaction of factors, with human activities and climate change playing significant roles (Li et al., 2021; Liu et al., 2022; Ge et al., 2021). The capacity of these models to accurately simulate the effects of both natural and human influences on vegetation dynamics is critical to their overall effectiveness.
4.1 The environmental drivers of long-term changes in vegetation dynamics and photosynthetic capacity
Increasing concentrations of CO2, climate change, nitrogen deposition, and land use collectively shape long-term vegetation greening trends (Piao et al., 2013; Li et al., 2024). Our study indicates a significant misestimation of trends in simulated LAI and GPP at both pixel and regional scales in China (Figs. 1–3). Overall, the observed LAI trends demonstrate reasonable consistency with model simulations within uncertainty bounds (Fig. 1a), indicating that current DGVM frameworks can effectively capture the overall trend of vegetation dynamics. However, the overall agreement contrasts with substantial spatial discrepancies in trend misestimation, as evidenced by pronounced spatial misestimations in China (Fig. 2). The primary reason for these inaccuracies in simulated LAI and GPP trends at pixel scale appears to be the limited ability of DGVMs to capture vegetation responses to elevated CO2 concentrations (Figs. 4 and 5). This aligns with previous findings that underscore the significant role of CO2 fertilization in global vegetation changes (Zhu et al., 2016; Piao et al., 2020). Differences between observed and simulated LAI trends reveal a spatial pattern similar to those seen in the disparities between observed and simulated LAI responses to CO2 concentration, indicating that misestimation of simulated LAI trends likely stems from the model's inadequate representation of LAI response to CO2 variations (Figs. 2 and 5). Besides, the model's representation of LAI response to climate change appears to have a minor effect on trend accuracy, which is less critical than the response to CO2 (Figs. 4 and 5, Figs. S9–S11). On the other hand, the spatial patterns of dominant environmental and anthropogenic drivers affecting observed LAI responses differ markedly from those affecting simulated responses (Fig. S13 in the Supplement). In particular, the areas where dominant drivers in the model diverge from actual drivers are prominent in southeastern and south-central forested regions, northern and western grasslands, and northern crop areas in China (Fig. S13a and b). For example, in south-central and southeastern forests, the model suggests that temperature is the primary driver of LAI trends, whereas CO2 and anthropogenic factors are the actual dominant influences. Conversely, in northern and western grasslands, the model emphasizes CO2 dominance, while precipitation is, in reality, the primary driver. These discrepancies partly explain the model's underestimation of LAI response to CO2 in southern forested areas and its overestimation in northern grasslands (Fig. 5). Parameterization and model structure are fundamental for ecosystem models to generate realistic projections, playing a critical role in their accuracy (Luo et al., 2016). On the one hand, due to the complexity of physiological processes and environmental interactions in ecosystems, model accuracy is highly sensitive to parameterization. However, DGVMs often simplify these interactions, using empirical functions to model leaf-level photosynthetic processes – such as CO2 partial pressure, carboxylation, and electron transport (Reich et al., 2014; Wang et al., 2017). This approach can result in modeled stomatal conductance responses to environmental factors that deviate from observed reality, particularly during the light reaction phase (Buckley, 2017; Mcdermid et al., 2021). Simulating stomatal conductance under varying conditions (temperature, moisture, vapor pressure, and light radiation) on a global scale is challenging, as models typically rely on a single temperature response curve, which fails to capture ecosystem variability (Powell et al., 2013; Trugman et al., 2018; Lin et al., 2015). Furthermore, the species-specific sensitivity of stomatal conductance to CO2 is often overlooked, limiting the model's ability to reflect diverse physiological responses (Buckley, 2017). DGVMs generally employ PFTs to simulate vegetation responses to environmental changes (Rogers et al., 2017), but PFTs simplify plant functional and adaptive traits, reducing the accuracy of physiological responses under climate change (Rogers et al., 2014). Given substantial interspecies differences in photosynthetic and water-use efficiencies, a single PFT approach is insufficient to represent the varied responses of diverse plant types to environmental shifts (Rezende et al., 2016; Rogers et al., 2014).
On the other hand, model behavior is also shaped by equations representing real-world processes, which affect the model's capacity to simulate system functions accurately (Luo et al., 2016). Studies show that current models fail to capture nitrogen and phosphorus limitations on CO2 fertilization effects (Terrer et al., 2019). Nutrient limitations, particularly of nitrogen and phosphorus, can lead to reduced Rubisco – an essential, nitrogen-rich enzyme in photosynthesis – which, in turn, downregulates photosynthetic capacity and decreases CO2 assimilation by vegetation (Ainsworth and Rogers, 2007; Long et al., 2004; Terrer et al., 2016, 2018). DGVM assumptions of C–N and C–P coupling are thus inadequate. While plants employ various symbiotic strategies to mitigate nitrogen limitation, DGVMs often overlook these mechanisms (Sulman et al., 2019). Additionally, evidence from phosphorus-limited ecosystems suggests that elevated CO2 may aid plants in acquiring or mineralizing phosphorus (Nazeri et al., 2013). However, models generally assume a relatively closed phosphorus cycle, and the fundamental dynamics of vegetation under phosphorus limitation remain poorly understood, introducing uncertainty in C–P coupling (Medlyn et al., 2016).
4.2 Impacts of human activities on vegetation dynamics
While linear models are useful for analyzing the contribution of environmental factors to long-term vegetation trends, determining the impact of human activities on vegetation dynamics remains a subject of debate in previous studies (Ge et al., 2021; Liu et al., 2022). This uncertainty arises from the complexity of human activities and the diverse conditions across different study areas (Liang et al., 2023). In China, specific human activities, such as enhancing the productivity of cropland and implementing reforestation policies, have been shown to significantly enhance vegetation growth (Zhang et al., 2000). Conversely, urbanization and other similar human activities have been found to have a considerable negative effect on vegetation growth (Wang et al., 2022b; Lin et al., 2019; Jiang et al., 2022). To quantify the effects of land use changes driven by human activities, two sets of scenarios were applied in DGVMs, where the S3 scenario applies historical changes in land use, and the other S2 scenario applies a time-invariant pre-industrial land cover distribution. By difference of the two scenarios, the dynamic evolution of vegetation in response to land use change can be quantified (Friedlingstein et al., 2022b).
In this study, we analyzed the trends of grazing intensity and crop acreage in provinces predominantly characterized by grassland and cropland. This analysis was conducted by examining the number of livestock and crop acreage from the respective provinces' statistical yearbooks. Additionally, tree cover data are utilized to represent actual regional trends in forested land, allowing us to assess the model's ability to capture the effects of human activities on LAI. The S3–S2 scenario was employed to evaluate the influence of land use change on vegetation LAI and GPP as perceived by the DGVM model (Fig. S14 in the Supplement). Overall, the model did not show a significant effect of land use change on LAI in forested land and grassland areas within the MME. Spatially, most simulated LAI and GPP trends exhibited similar patterns under the S3–S2 scenario (Figs. S15 and S16 in the Supplement), with most of the area showing insignificant changes (72.47 % and 87.31 % of the area showed insignificant changes in LAI and GPP, respectively). In terms of tree cover change data (Fig. S17 in the Supplement), there was a significant increase in tree cover in the southern and northeastern regions of China, with 80.60 % of the area experiencing growth and 31.54 % showing significant growth. Tree cover increased across all land use types in China, with the highest annual growth rate (0.417) occurring in forested land (Fig. S17). Data on grazing intensity and cropped area were obtained from the statistical yearbook for grassland and cropland, respectively, and trends in grazing intensity or cropped area were compared with trends in normalized LAI from the model's S3–S2 scenario (Fig. S18 in the Supplement). The results indicated that the model's representation of LAI changes due to land use change was inadequate in several provinces dominated by cropland and grassland. For instance, the model's normalized LAI trend does not accurately reflect the actual anthropogenic changes on vegetation LAI in the Inner Mongolia (IM) province, where the changes were insignificant. In Qinghai (QH), Tibet (TI), Sichuan (SC), Heilongjiang (HLJ), and Hunan (HN), the direction of the LAI trend in the model's S3–S2 scenario contradicts the direction of anthropogenic effects on vegetation LAI. Consequently, the model fails to adequately capture the intensity or direction of anthropogenic impacts on vegetation LAI.
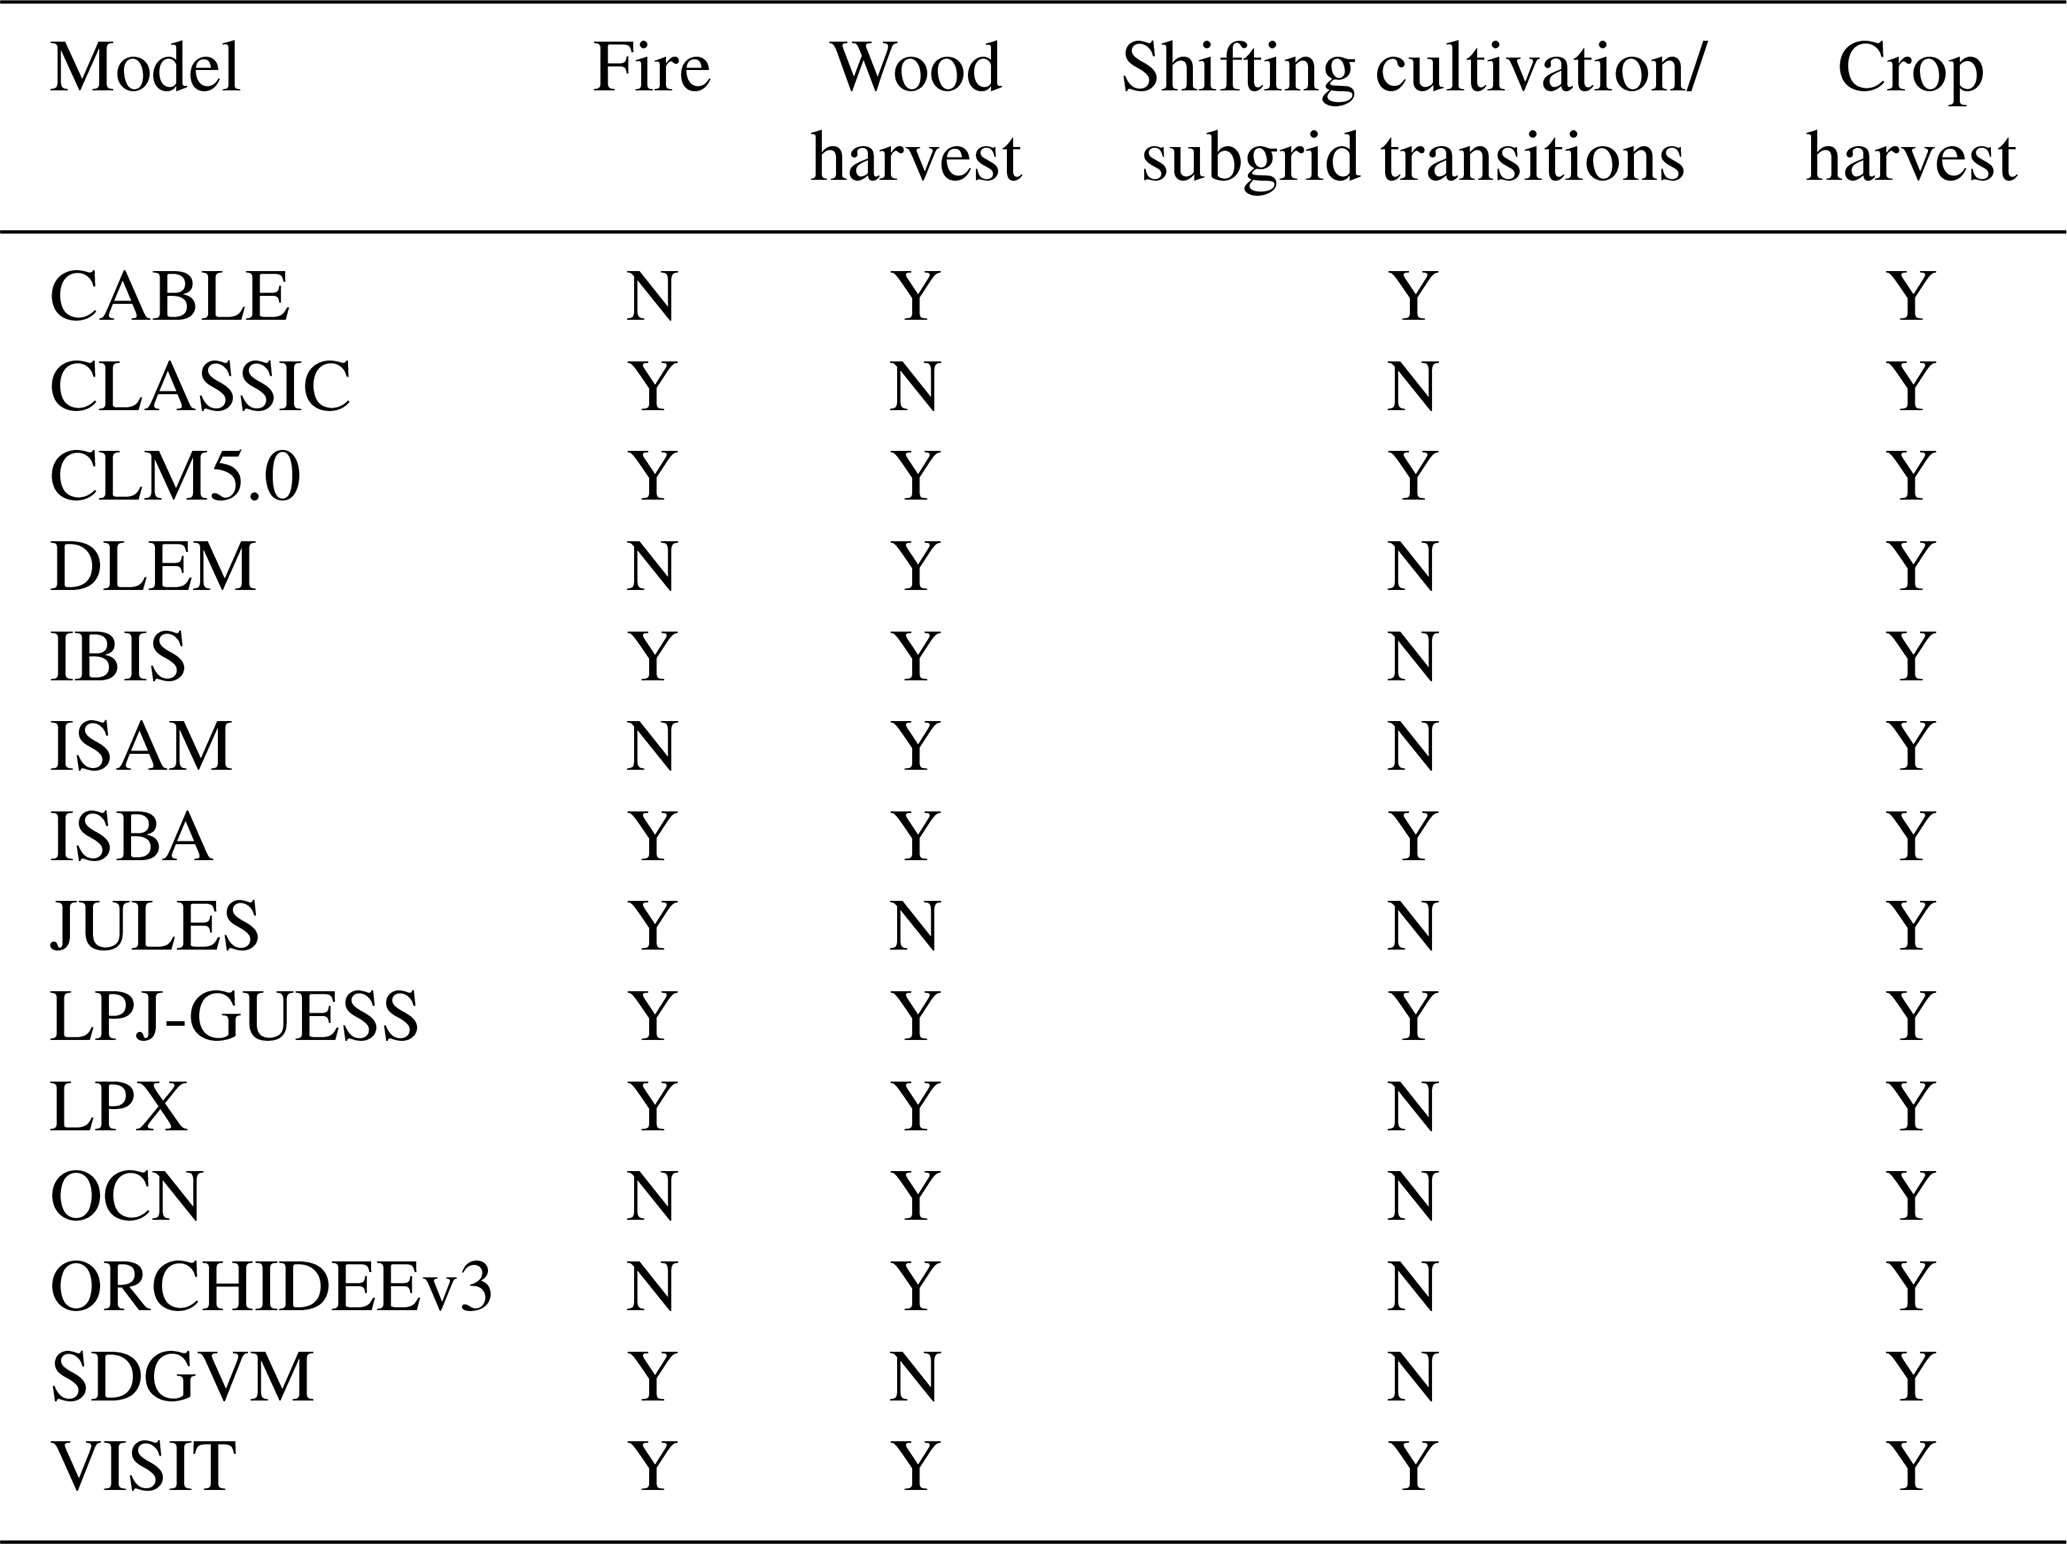
Although DGVMs can dynamically adjust to imposed land use change, there are substantial limitations for models to respond to land use changes, which struggle to ensure the quality of input data and incorporate land management practices and accurately simulate ecosystem responses to change. In the TRENDY project, most of DGVMs use the HYDE and LUH2 databases for LULCC data input variables (Klein Goldewijk et al., 2017; Hurtt et al., 2020; Sitch et al., 2024). However, absolute agreement with all observations remains unattainable for any global product. While these LULCC datasets are common across models, their implementation varies according to the land use processes and functionalities inherent to individual DGVMs. In this study, we employ Table 1 to describe differences in the performance of individual DGVMs, which were adapted from Sitch et al. (2024). Meanwhile, the historical land use estimates within the datasets exhibit regional variations and limitations of spatial resolution accuracy, which may result in inaccurate simulations of responses to land use changes due to discrepancies in the data (Prestele et al., 2016). The globally applicable gridded dataset necessitates simplifications of patterns and historical trends in deforestation, cropland, and pasture management, yet these simplifications inherently introduce uncertainties (Prestele et al., 2016; Arneth et al., 2017). These limitations may contribute to the model's inadequate representation of anthropogenic factors affecting regional vegetation LAI and GPP trends in China, as the models struggle to accurately capture the impacts of human activities on forested land, grassland, and cropland.
4.3 Challenges of individual DGVMs for plant physiology
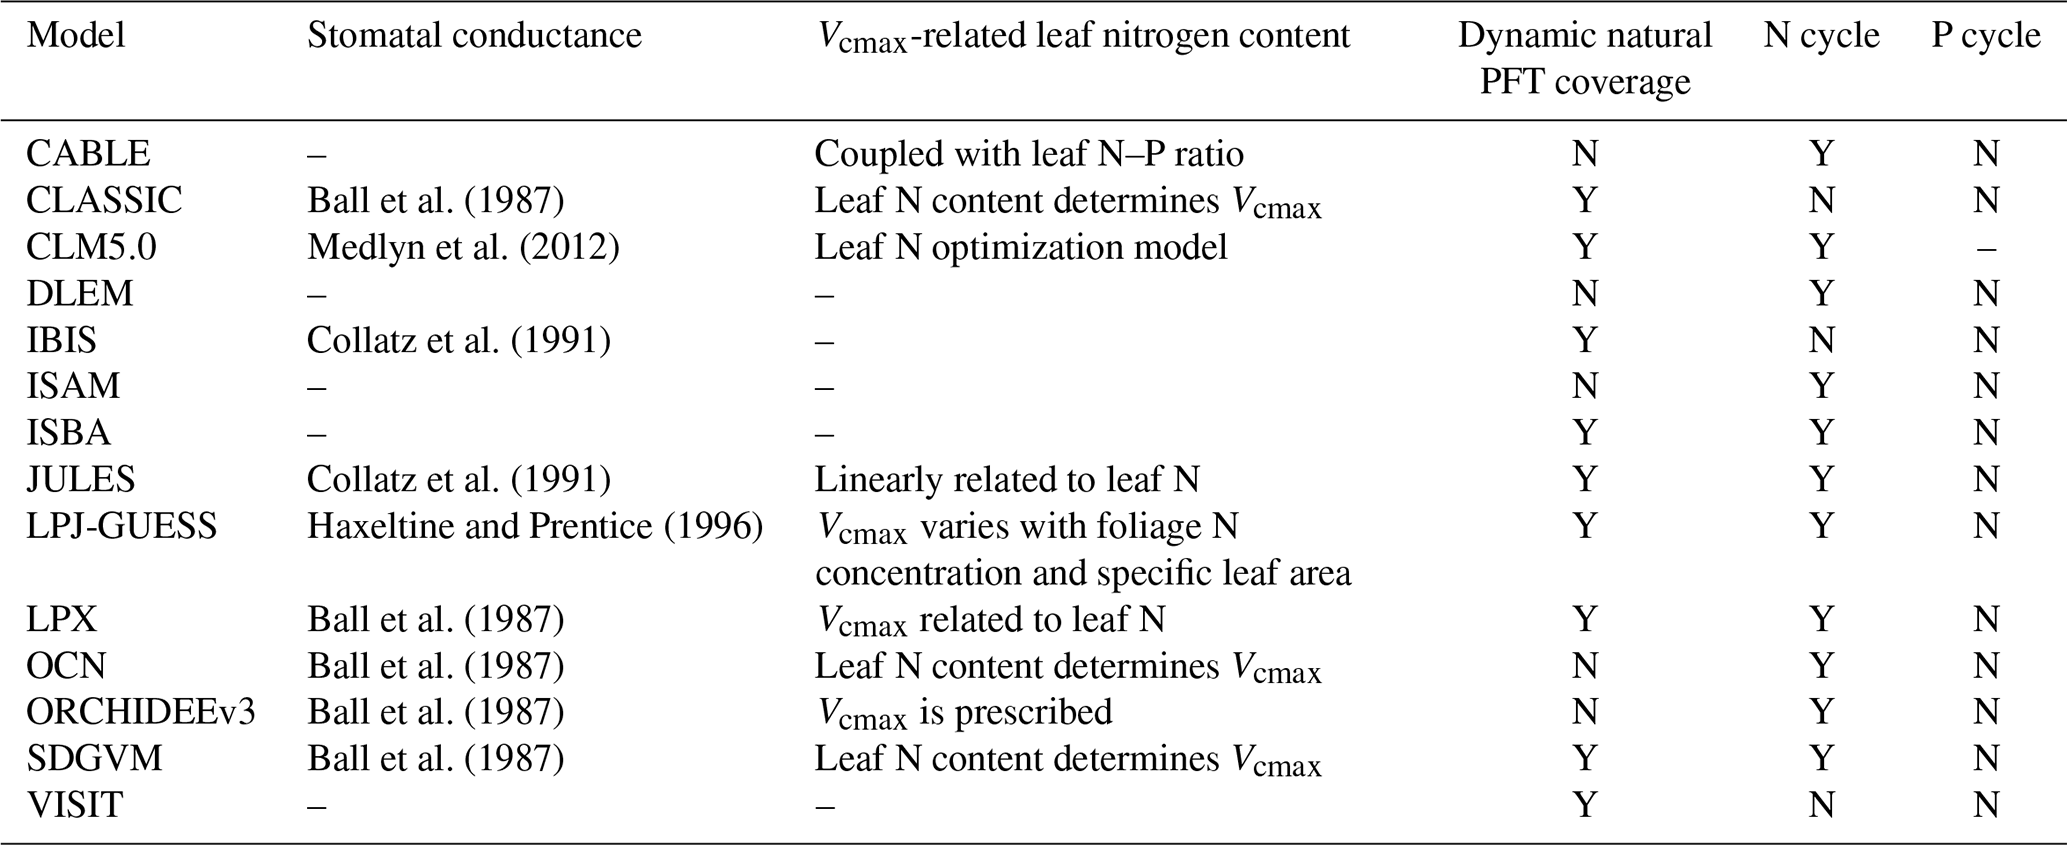
Our analysis highlights several critical limitations in the current DGVMs regarding their ability to accurately represent vegetation responses to environmental drivers and anthropogenic changes. These limitations arise primarily from differences in how individual DGVMs parameterize and simulate critical ecological and physiological processes. For example, Teckentrup et al. (2021) demonstrated significant divergences among DGVMs, particularly in their approaches to modeling responses to elevated atmospheric CO2 concentrations and nutrient cycle. Among these physiological processes, plant carbon assimilation mechanisms such as stomatal conductance and maximum carboxylation velocity (Vcmax) play pivotal roles. Previous studies found that stomatal functioning and Vcmax are related to elevated atmospheric CO2 and photosynthesis acclimation, potentially impacting the estimation of vegetation dynamics in DGVMs (Rezende et al., 2016). Many DGVMs currently simplify or inadequately represent these physiological processes. For instance, several DGVMs estimate Vcmax at the canopy scale rather than the physiologically more appropriate leaf scale, leading to systematic underestimations. Furthermore, nutrient cycling modules integrated into DGVMs often reduce the sensitivity of vegetation growth to elevated CO2 concentrations (Smith et al., 2014; Zaehle, 2013; Meyerholt et al., 2020). Collectively, these simplifications constitute structural deficiencies that substantially affect DGVM accuracy. To elucidate mechanistic discrepancies in vegetation trend simulations, we synthesize findings from prior studies to summarize the operational frameworks of 14 models across six critical parameters: the presence of stomatal conductance, Vcmax-related leaf nitrogen content, dynamic natural PFT coverage, and nutrient cycle (Teckentrup et al., 2021; Rezende et al., 2016; Lian et al., 2021; Friedlingstein et al., 2022a; Sitch et al., 2024). A systematic comparison of these parameterizations is presented in Table 2.
Table 1DGVMs and their main processes relevant to LULCC emissions.
Our results clearly indicate that no single DGVM among the evaluated 14 consistently performs well across all aspects of vegetation dynamics (e.g., trend vs. seasonal variations, LAI vs. GPP) throughout China (Figs. 2 and 3, Figs. 7 and 8). For example, while DLEM performs relatively better in capturing regional GPP trends in certain locations, its successful performance is spatially limited (covering less than 50 % of the study area) and remains poor in capturing LAI trends (Figs. 2e and 3e). Similar discrepancies exist for other models regarding their ability to simulate different vegetation variables. Thus, we emphasize the effectiveness and importance of utilizing MME approaches, which collectively capture model strengths and weaknesses, thereby providing more robust and comprehensive assessments.
4.4 Climatic factors influencing the seasonal performance of the DGVM
In contrast to the vegetation trend, the models simulate the seasonal cycle of LAI and GPP excellently both overall and spatially (Figs. 6–8). The simulated GPP also demonstrates high seasonal cycle correlations with observed GPP in sites (Fig. S12). Seasonal variations in precipitation, radiation, and temperature play a crucial role in influencing the seasonal dynamics of vegetation (Hou et al., 2022; Duan et al., 2022; Wu et al., 2015). While temperature is often considered the primary factor controlling plant phenology, the complex interactions between temperature and other climatic factors cannot be overlooked (Flynn and Wolkovich, 2018). Radiation works in concert with temperature to regulate the timing of defoliation, meet vegetation growth thresholds, and influence phenological events (Flynn and Wolkovich, 2018; Chuine, 2010), while precipitation affects plant phenology primarily through its indirect influence on the thermal requirements of these events (Fu et al., 2014). The findings that observed LAI and CSIF exhibit similar seasonal fluctuations in response to the three key climate factors suggest that the model may effectively capture the response to seasonality of vegetation in China (Figs. S19 and S20 in the Supplement). In this paper, we verified the seasonal cyclic correlation of simulated LAI and GPP with climate factors through CCF (Figs. 9–11) and demonstrated that the simulated LAI and GPP are equipped with realistic seasonal cycles due to the simulated vegetation's ability to respond to cyclic climatic variations affecting its seasonality. Given that the Farquhar model and its variants, which underpin the photosynthesis module of the DGVM, provide a detailed and unified understanding of photosynthesis (Farquhar et al., 1980), DGVMs are capable of reasonably simulating dynamics of photosynthesis and vegetation change (Zhao et al., 2022). To further improve simulation accuracy, researchers have developed more mechanistic models that account for vegetation growth influenced by seasonal climate variations (Piao et al., 2019).
Moreover, we observed that the simulated LAI response to seasonal climate factors typically lags behind the simulated GPP response, which aligns with the analysis by Zhao et al. (2022). This discrepancy arises because the model simulates carbon allocation to canopy structure in response to seasonal climate changes more slowly than what occurs in reality (Du et al., 2020). As with the above research, studies on peak seasonal values and phenological greening dynamics hold significant research importance, and future work will strengthen research efforts in this thematic area.
4.5 Uncertainties of the observed LAI in China
Remotely sensed observations used in the study might be compromised by various factors such as atmospheric disturbances and sensor errors, leading to noise, blurring, and distortion. Even with the use of the latest reprocessed MODIS LAI data and advanced spatiotemporal filtering techniques, it is impossible to completely eliminate the potential impacts of cloud cover, aerosol pollution, and sensor degradation (Yuan et al., 2011; Zou et al., 2023). These limitations mean that satellite-based estimates may inherently underpredict values, requiring careful consideration when comparing model data to ensure appropriate metrics and accurate site-based comparisons for model evaluation (De Kauwe et al., 2016). The quality of the MODIS LAI data used in this study is particularly low in non-vegetated areas but significantly better in vegetated regions (Fig. S21 in the Supplement). Additionally, in northern China, pixel quality is severely affected from December to February due to snow accumulation and other factors. Consequently, the pixel quality of the remotely sensed observations themselves represents the primary source of uncertainty in the experiments conducted in this study.
This study evaluated the long-term trends and seasonality performance in LAI and GPP in DGVMs in China from 2003 to 2019. Overall, DGVMs struggled to accurately capture the trends of simulated LAI and GPP in the region, though they effectively captured their seasonality. While the overall trend of simulated LAI was reasonably represented, the trend of simulated GPP was not. Spatially, both simulated LAI and GPP trends exhibited similar inaccuracies, with notable misestimations. The distribution of these over- and underestimations in simulated LAI trends was closely linked to land use type: the models tended to underestimate LAI and GPP trends in forested areas, overestimate them in grasslands, and misestimate them in croplands. Despite these issues, the seasonal variations of simulated LAI and GPP were consistent with both measurements and remotely sensed observations, demonstrating a strong alignment in capturing seasonal fluctuations.
To elucidate the reasons for the inability of DGVMs to simulate LAI trends accurately and the good performance in seasonal variations of simulated LAI and GPP, we analyzed the model's shortcomings in responding to environmental and anthropogenic changes, as well as its correlation with seasonal climate factors and lagged effects. The findings indicate the following. (1) With regard to environmental factors, the simulated LAI and GPP exhibited an inadequate sensitivity in response to changes in environmental conditions, particularly to CO2 concentrations. Furthermore, the failure to capture the impacts of human activities on vegetation dynamics is likely due to limitations in input land use data and the oversimplified representation of land management and land use change in DGVMs. Overall, the insufficient response of the simulated LAI and GPP to CO2 fertilization effects is the primary factor contributing to the model's misestimation of LAI and GPP trends in China. (2) The accurate capture of seasonal variations in simulated LAI and GPP in response to climate factors strongly supports the reliability of DGVMs in modeling seasonal fluctuations in China.
All raw data can be provided by the corresponding authors upon request.
The supplement related to this article is available online at https://doi.org/10.5194/esd-16-1935-2025-supplement.
AZ, LZ, and ZL planned the campaign. AZ, ZL, LZ, JW, KS, and ASA performed the measurements. LZ, ZL, and AZ analyzed the data. AZ, LZ, and ZL wrote the manuscript draft. JW, KS, and ASA reviewed and edited the manuscript. LZ and AZ designed the experiments and ZL carried them out. ZL and LZ developed the model code and performed the simulations. AZ, LZ, and ZL prepared the manuscript with contributions from all co-authors.
The contact author has declared that none of the authors has any competing interests.
Publisher's note: Copernicus Publications remains neutral with regard to jurisdictional claims made in the text, published maps, institutional affiliations, or any other geographical representation in this paper. While Copernicus Publications makes every effort to include appropriate place names, the final responsibility lies with the authors. Regarding the maps used in this paper, please note that Figs. 2, 3, 5, 7, and 8 contain disputed territories.
The authors would like to thank the editors and anonymous reviewers for their constructive comments and suggestions.
This research has been supported by the Postdoctoral Later-stage Foundation Project of Shenzhen Polytechnic University (grant no. 6023271029K), the National Natural Science Foundation of China (grant no. 42171212), the Guangdong Basic and Applied Basic Research Foundation (grant no. 2021A1515110769), and the National Natural Science Foundation of Hebei Province of China (grant no. D2022402030).
This paper was edited by Gabriele Messori and reviewed by two anonymous referees.
Ainsworth, E. A. and Rogers, A.: The response of photosynthesis and stomatal conductance to rising [CO2]: mechanisms and environmental interactions, Plant, Cell & Environment, 30, 258–270, https://doi.org/10.1111/j.1365-3040.2007.01641.x, 2007.
Anav, A., Friedlingstein, P., Beer, C., Ciais, P., Harper, A., Jones, C., Murray-Tortarolo, G., Papale, D., Parazoo, N. C., and Peylin, P.: Spatiotemporal patterns of terrestrial gross primary production: A review, Reviews of Geophysics, 53, 785–818, https://doi.org/10.1002/2015RG000483, 2015.
Arneth, A., Sitch, S., Pongratz, J., Stocker, B. D., Ciais, P., Poulter, B., Bayer, A. D., Bondeau, A., Calle, L., and Chini, L. P.: Historical carbon dioxide emissions caused by land-use changes are possibly larger than assumed, Nature Geoscience, 10, 79–84, https://doi.org/10.1038/ngeo2882, 2017.
Ball, J. T., Woodrow, I. E., and Berry, J. A.: A Model Predicting Stomatal Conductance and its Contribution to the Control of Photosynthesis under Different Environmental Conditions, in: Progress in Photosynthesis Research: Volume 4 Proceedings of the VIIth International Congress on Photosynthesis Providence, Rhode Island, USA, 10–15 August 1986, edited by: Biggins, J., Springer Netherlands, Dordrecht, 221–224, https://doi.org/10.1007/978-94-017-0519-6 48, 1987.
Buckley, T. N.: Modeling Stomatal Conductance, Plant Physiology, 174, 572–582, https://doi.org/10.1104/pp.16.01772, 2017.
Chen, B., Zhang, H., Wang, T., and Zhang, X.: An atmospheric perspective on the carbon budgets of terrestrial ecosystems in China: Progress and challenges, Science Bulletin, 66, 1713–1718, https://doi.org/10.1016/j.scib.2021.05.017, 2021.
Chuine, I.: Why does phenology drive species distribution?, Philosophical Transactions of the Royal Society B: Biological Sciences, 365, 3149–3160, https://doi.org/10.1098/rstb.2010.0142, 2010.
Collatz, G. J., Ball, J. T., Grivet, C., and Berry, J. A.: Physiological and environmental regulation of stomatal conductance, photosynthesis and transpiration: a model that includes a laminar boundary layer, Agricultural and Forest Meteorology, 54, 107–136, https://doi.org/10.1016/0168-1923(91)90002-8, 1991.
De Kauwe, M. G., Keenan, T. F., Medlyn, B. E., Prentice, I. C., and Terrer, C.: Satellite based estimates underestimate the effect of CO2 fertilization on net primary productivity, Nature Climate Change, 6, 892–893, https://doi.org/10.1038/nclimate3105, 2016.
Du, E., Terrer, C., Pellegrini, A. F., Ahlström, A., van Lissa, C. J., Zhao, X., Xia, N., Wu, X., and Jackson, R. B.: Global patterns of terrestrial nitrogen and phosphorus limitation, Nature Geoscience, 13, 221–226, https://doi.org/10.1038/s41561-019-0530-4, 2020.
Duan, H., Qi, Y., Kang, W., Zhang, J., Wang, H., and Jiang, X.: Seasonal Variation of Vegetation and Its Spatiotemporal Response to Climatic Factors in the Qilian Mountains, China, Sustainability, 14, 4926, https://doi.org/10.3390/su14094926, 2022.
Farquhar, G. D., von Caemmerer, S., and Berry, J. A.: A biochemical model of photosynthetic CO2 assimilation in leaves of C3 species, Planta, 149, 78–90, https://doi.org/10.1007/BF00386231, 1980.
Flynn, D. and Wolkovich, E.: Temperature and photoperiod drive spring phenology across all species in a temperate forest community, New Phytologist, 219, 1353–1362, https://doi.org/10.1111/nph.15232, 2018.
Friedlingstein, P., O'Sullivan, M., Jones, M. W., Andrew, R. M., Hauck, J., Olsen, A., Peters, G. P., Peters, W., Pongratz, J., Sitch, S., Le Quéré, C., Canadell, J. G., Ciais, P., Jackson, R. B., Alin, S., Aragão, L. E. O. C., Arneth, A., Arora, V., Bates, N. R., Becker, M., Benoit-Cattin, A., Bittig, H. C., Bopp, L., Bultan, S., Chandra, N., Chevallier, F., Chini, L. P., Evans, W., Florentie, L., Forster, P. M., Gasser, T., Gehlen, M., Gilfillan, D., Gkritzalis, T., Gregor, L., Gruber, N., Harris, I., Hartung, K., Haverd, V., Houghton, R. A., Ilyina, T., Jain, A. K., Joetzjer, E., Kadono, K., Kato, E., Kitidis, V., Korsbakken, J. I., Landschützer, P., Lefèvre, N., Lenton, A., Lienert, S., Liu, Z., Lombardozzi, D., Marland, G., Metzl, N., Munro, D. R., Nabel, J. E. M. S., Nakaoka, S.-I., Niwa, Y., O'Brien, K., Ono, T., Palmer, P. I., Pierrot, D., Poulter, B., Resplandy, L., Robertson, E., Rödenbeck, C., Schwinger, J., Séférian, R., Skjelvan, I., Smith, A. J. P., Sutton, A. J., Tanhua, T., Tans, P. P., Tian, H., Tilbrook, B., van der Werf, G., Vuichard, N., Walker, A. P., Wanninkhof, R., Watson, A. J., Willis, D., Wiltshire, A. J., Yuan, W., Yue, X., and Zaehle, S.: Global Carbon Budget 2020, Earth Syst. Sci. Data, 12, 3269–3340, https://doi.org/10.5194/essd-12-3269-2020, 2020.
Friedlingstein, P., Jones, M. W., O'Sullivan, M., Andrew, R. M., Bakker, D. C. E., Hauck, J., Le Quéré, C., Peters, G. P., Peters, W., Pongratz, J., Sitch, S., Canadell, J. G., Ciais, P., Jackson, R. B., Alin, S. R., Anthoni, P., Bates, N. R., Becker, M., Bellouin, N., Bopp, L., Chau, T. T. T., Chevallier, F., Chini, L. P., Cronin, M., Currie, K. I., Decharme, B., Djeutchouang, L. M., Dou, X., Evans, W., Feely, R. A., Feng, L., Gasser, T., Gilfillan, D., Gkritzalis, T., Grassi, G., Gregor, L., Gruber, N., Gürses, Ö., Harris, I., Houghton, R. A., Hurtt, G. C., Iida, Y., Ilyina, T., Luijkx, I. T., Jain, A., Jones, S. D., Kato, E., Kennedy, D., Klein Goldewijk, K., Knauer, J., Korsbakken, J. I., Körtzinger, A., Landschützer, P., Lauvset, S. K., Lefèvre, N., Lienert, S., Liu, J., Marland, G., McGuire, P. C., Melton, J. R., Munro, D. R., Nabel, J. E. M. S., Nakaoka, S.-I., Niwa, Y., Ono, T., Pierrot, D., Poulter, B., Rehder, G., Resplandy, L., Robertson, E., Rödenbeck, C., Rosan, T. M., Schwinger, J., Schwingshackl, C., Séférian, R., Sutton, A. J., Sweeney, C., Tanhua, T., Tans, P. P., Tian, H., Tilbrook, B., Tubiello, F., van der Werf, G. R., Vuichard, N., Wada, C., Wanninkhof, R., Watson, A. J., Willis, D., Wiltshire, A. J., Yuan, W., Yue, C., Yue, X., Zaehle, S., and Zeng, J.: Global Carbon Budget 2021, Earth Syst. Sci. Data, 14, 1917–2005, https://doi.org/10.5194/essd-14-1917-2022, 2022a.
Friedlingstein, P., O'Sullivan, M., Jones, M. W., Andrew, R. M., Gregor, L., Hauck, J., Le Quéré, C., Luijkx, I. T., Olsen, A., Peters, G. P., Peters, W., Pongratz, J., Schwingshackl, C., Sitch, S., Canadell, J. G., Ciais, P., Jackson, R. B., Alin, S. R., Alkama, R., Arneth, A., Arora, V. K., Bates, N. R., Becker, M., Bellouin, N., Bittig, H. C., Bopp, L., Chevallier, F., Chini, L. P., Cronin, M., Evans, W., Falk, S., Feely, R. A., Gasser, T., Gehlen, M., Gkritzalis, T., Gloege, L., Grassi, G., Gruber, N., Gürses, Ö., Harris, I., Hefner, M., Houghton, R. A., Hurtt, G. C., Iida, Y., Ilyina, T., Jain, A. K., Jersild, A., Kadono, K., Kato, E., Kennedy, D., Klein Goldewijk, K., Knauer, J., Korsbakken, J. I., Landschützer, P., Lefèvre, N., Lindsay, K., Liu, J., Liu, Z., Marland, G., Mayot, N., McGrath, M. J., Metzl, N., Monacci, N. M., Munro, D. R., Nakaoka, S.-I., Niwa, Y., O'Brien, K., Ono, T., Palmer, P. I., Pan, N., Pierrot, D., Pocock, K., Poulter, B., Resplandy, L., Robertson, E., Rödenbeck, C., Rodriguez, C., Rosan, T. M., Schwinger, J., Séférian, R., Shutler, J. D., Skjelvan, I., Steinhoff, T., Sun, Q., Sutton, A. J., Sweeney, C., Takao, S., Tanhua, T., Tans, P. P., Tian, X., Tian, H., Tilbrook, B., Tsujino, H., Tubiello, F., van der Werf, G. R., Walker, A. P., Wanninkhof, R., Whitehead, C., Willstrand Wranne, A., Wright, R., Yuan, W., Yue, C., Yue, X., Zaehle, S., Zeng, J., and Zheng, B.: Global Carbon Budget 2022, Earth Syst. Sci. Data, 14, 4811–4900, https://doi.org/10.5194/essd-14-4811-2022, 2022b.
Fu, Y. H., Piao, S., Zhao, H., Jeong, S. J., Wang, X., Vitasse, Y., Ciais, P., and Janssens, I. A.: Unexpected role of winter precipitation in determining heat requirement for spring vegetation green-up at northern middle and high latitudes, Global Change Biology, 20, 3743–3755, https://doi.org/10.1111/gcb.12610, 2014.
Ge, W., Deng, L., Wang, F., and Han, J.: Quantifying the contributions of human activities and climate change to vegetation net primary productivity dynamics in China from 2001 to 2016, Science of the Total Environment, 773, 145648, https://doi.org/10.1016/j.scitotenv.2021.145648, 2021.
Han, Q., Liu, L., and Liu, X.: Harmonizing and Comparing Divergent Estimates of China's Forest Carbon Sinks, Ecological Indicators, 171, 113250, https://doi.org/10.1016/j.ecolind.2025.113250, 2025.
Haxeltine, A. and Prentice, I. C.: A general model for the light-use efficiency of primary production, Functional Ecology, 10, 551–561, https://doi.org/10.2307/2390165, 1996.
Hou, Q., Pei, T., Yu, X., Chen, Y., Ji, Z., and Xie, B.: The seasonal response of vegetation water use efficiency to temperature and precipitation in the Loess Plateau, China, Global Ecology and Conservation, 33, e01984, https://doi.org/10.1016/j.gecco.2021.e01984, 2022.
Houghton, R. A.: Terrestrial fluxes of carbon in GCP carbon budgets, Global Change Biology, 26, 3006–3014, https://doi.org/10.1111/gcb.15050, 2020.
Hurtt, G. C., Chini, L., Sahajpal, R., Frolking, S., Bodirsky, B. L., Calvin, K., Doelman, J. C., Fisk, J., Fujimori, S., Klein Goldewijk, K., Hasegawa, T., Havlik, P., Heinimann, A., Humpenöder, F., Jungclaus, J., Kaplan, J. O., Kennedy, J., Krisztin, T., Lawrence, D., Lawrence, P., Ma, L., Mertz, O., Pongratz, J., Popp, A., Poulter, B., Riahi, K., Shevliakova, E., Stehfest, E., Thornton, P., Tubiello, F. N., van Vuuren, D. P., and Zhang, X.: Harmonization of global land use change and management for the period 850–2100 (LUH2) for CMIP6, Geosci. Model Dev., 13, 5425–5464, https://doi.org/10.5194/gmd-13-5425-2020, 2020.
Jiang, F., Chen, J. M., Zhou, L., Ju, W., Zhang, H., Machida, T., Ciais, P., Peters, W., Wang, H., and Chen, B.: A comprehensive estimate of recent carbon sinks in China using both top-down and bottom-up approaches, Scientific Reports, 6, 22130, https://doi.org/10.1038/srep22130, 2016.
Jiang, H., Xu, X., Zhang, T., Xia, H., Huang, Y., and Qiao, S.: The relative roles of climate variation and human activities in vegetation dynamics in coastal China from 2000 to 2019, Remote Sensing, 14, 2485, https://doi.org/10.3390/rs14102485, 2022.
Jiao, K., Liu, Z., Wang, W., Yu, K., Mcgrath, M. J., and Xu, W.: Carbon cycle responses to climate change across China's terrestrial ecosystem: Sensitivity and driving process, Science of the Total Environment, 915, 170053, https://doi.org/10.1016/j.scitotenv.2024.170053, 2024.
Klein Goldewijk, K., Beusen, A., Doelman, J., and Stehfest, E.: Anthropogenic land use estimates for the Holocene – HYDE 3.2, Earth Syst. Sci. Data, 9, 927–953, https://doi.org/10.5194/essd-9-927-2017, 2017.
Kucharik, C. J., Barford, C. C., El Maayar, M., Wofsy, S. C., Monson, R. K., and Baldocchi, D. D.: A multiyear evaluation of a Dynamic Global Vegetation Model at three AmeriFlux forest sites: Vegetation structure, phenology, soil temperature, and CO2 and H2O vapor exchange, Ecological Modelling, 196, 1–31, https://doi.org/10.1016/j.ecolmodel.2005.11.031, 2006.
Le Quéré, C., Moriarty, R., Andrew, R. M., Peters, G. P., Ciais, P., Friedlingstein, P., Jones, S. D., Sitch, S., Tans, P., Arneth, A., Boden, T. A., Bopp, L., Bozec, Y., Canadell, J. G., Chini, L. P., Chevallier, F., Cosca, C. E., Harris, I., Hoppema, M., Houghton, R. A., House, J. I., Jain, A. K., Johannessen, T., Kato, E., Keeling, R. F., Kitidis, V., Klein Goldewijk, K., Koven, C., Landa, C. S., Landschützer, P., Lenton, A., Lima, I. D., Marland, G., Mathis, J. T., Metzl, N., Nojiri, Y., Olsen, A., Ono, T., Peng, S., Peters, W., Pfeil, B., Poulter, B., Raupach, M. R., Regnier, P., Rödenbeck, C., Saito, S., Salisbury, J. E., Schuster, U., Schwinger, J., Séférian, R., Segschneider, J., Steinhoff, T., Stocker, B. D., Sutton, A. J., Takahashi, T., Tilbrook, B., van der Werf, G. R., Viovy, N., Wang, Y.-P., Wanninkhof, R., Wiltshire, A., and Zeng, N.: Global carbon budget 2014, Earth Syst. Sci. Data, 7, 47–85, https://doi.org/10.5194/essd-7-47-2015, 2015.
Li, P., Wang, J., Liu, M., Xue, Z., Bagherzadeh, A., and Liu, M.: Spatio-temporal variation characteristics of NDVI and its response to climate on the Loess Plateau from 1985 to 2015, Catena, 203, 105331, https://doi.org/10.1016/j.catena.2021.105331, 2021.
Li, W., Ciais, P., Peng, S., Yue, C., Wang, Y., Thurner, M., Saatchi, S. S., Arneth, A., Avitabile, V., Carvalhais, N., Harper, A. B., Kato, E., Koven, C., Liu, Y. Y., Nabel, J. E. M. S., Pan, Y., Pongratz, J., Poulter, B., Pugh, T. A. M., Santoro, M., Sitch, S., Stocker, B. D., Viovy, N., Wiltshire, A., Yousefpour, R., and Zaehle, S.: Land-use and land-cover change carbon emissions between 1901 and 2012 constrained by biomass observations, Biogeosciences, 14, 5053–5067, https://doi.org/10.5194/bg-14-5053-2017, 2017.
Li, X., Xiao, J., and He, B.: Chlorophyll fluorescence observed by OCO-2 is strongly related to gross primary productivity estimated from flux towers in temperate forests, Remote Sensing of Environment, 204, 659–671, https://doi.org/10.1016/j.rse.2017.09.034, 2018.
Li, X., Wang, K., Huntingford, C., Zhu, Z., Peñuelas, J., Myneni, R. B., and Piao, S.: Vegetation greenness in 2023, Nature Reviews Earth & Environment, 5, 241–243, https://doi.org/10.1038/s43017-024-00543-z, 2024.
Lian, X., Piao, S., Chen, A., Wang, K., Li, X., Buermann, W., Huntingford, C., Peñuelas, J., Xu, H., and Myneni, R. B.: Seasonal biological carryover dominates northern vegetation growth, Nature Communications, 12, 983, https://doi.org/10.1038/s41467-021-21223-2, 2021.
Liang, W., Quan, Q., Wu, B., and Mo, S.: Response of vegetation dynamics in the three-north region of China to climate and human activities from 1982 to 2018, Sustainability, 15, 3073, https://doi.org/10.3390/su15043073, 2023.
Lin, Y., Qiu, R., Yao, J., Hu, X., and Lin, J.: The effects of urbanization on China's forest loss from 2000 to 2012: Evidence from a panel analysis, Journal of Cleaner Production, 214, 270–278, https://doi.org/10.1016/j.jclepro.2018.12.317, 2019.
Lin, Y.-S., Medlyn, B. E., Duursma, R. A., Prentice, I. C., Wang, H., Baig, S., Eamus, D., De Dios, V. R., Mitchell, P., and Ellsworth, D. S.: Optimal stomatal behaviour around the world, Nature Climate Change, 5, 459–464, https://doi.org/10.1038/nclimate2550, 2015.
Liu, Y., Liu, H., Chen, Y., Gang, C., and Shen, Y.: Quantifying the contributions of climate change and human activities to vegetation dynamic in China based on multiple indices, Science of The Total Environment, 838, 156553, https://doi.org/10.1016/j.scitotenv.2022.156553, 2022.
Long, S. P., Ainsworth, E. A., Rogers, A., and Ort, D. R.: Rising atmospheric carbon dioxide: plants FACE the future, Annu. Rev. Plant Biol., 55, 591–628, https://doi.org/10.1146/annurev.arplant.55.031903.141610, 2004.
Luo, Y., Ahlström, A., Allison, S. D., Batjes, N. H., Brovkin, V., Carvalhais, N., Chappell, A., Ciais, P., Davidson, E. A., Finzi, A., Georgiou, K., Guenet, B., Hararuk, O., Harden, J. W., He, Y., Hopkins, F., Jiang, L., Koven, C., Jackson, R. B., Jones, C. D., Lara, M. J., Liang, J., McGuire, A. D., Parton, W., Peng, C., Randerson, J. T., Salazar, A., Sierra, C. A., Smith, M. J., Tian, H., Todd-Brown, K. E. O., Torn, M., van Groenigen, K. J., Wang, Y. P., West, T. O., Wei, Y., Wieder, W. R., Xia, J., Xu, X., Xu, X., and Zhou, T.: Toward more realistic projections of soil carbon dynamics by Earth system models, Global Biogeochemical Cycles, 30, 40–56, https://doi.org/10.1002/2015GB005239, 2016.
MacBean, N., Scott, R. L., Biederman, J. A., Peylin, P., Kolb, T., Litvak, M. E., Krishnan, P., Meyers, T. P., Arora, V. K., and Bastrikov, V.: Dynamic global vegetation models underestimate net CO2 flux mean and inter-annual variability in dryland ecosystems, Environmental Research Letters, 16, 094023, https://doi.org/10.1088/1748-9326/ac1a38, 2021.
McDermid, S. S., Cook, B. I., De Kauwe, M. G., Mankin, J., Smerdon, J. E., Williams, A. P., Seager, R., Puma, M. J., Aleinov, I., and Kelley, M.: Disentangling the regional climate impacts of competing vegetation responses to elevated atmospheric CO2, Journal of Geophysical Research: Atmospheres, 126, e2020JD034108, https://doi.org/10.1029/2020JD034108, 2021.
Medlyn, B. E., Duursma, R. A., Eamus, D., Ellsworth, D. S., Colin Prentice, I., Barton, C. V. M., Crous, K. Y., de Angelis, P., Freeman, M., and Wingate, L.: Reconciling the optimal and empirical approaches to modelling stomatal conductance, Global Change Biology, 18, 3476–3476, https://doi.org/10.1111/j.1365-2486.2012.02790.x, 2012.
Medlyn, B. E., Zaehle, S., De Kauwe, M. G., Walker, A. P., Dietze, M. C., Hanson, P. J., Hickler, T., Jain, A. K., Luo, Y., and Parton, W.: Using ecosystem experiments to improve vegetation models, Nature Climate Change, 5, 528–534, https://doi.org/10.1038/nclimate2621, 2015.
Medlyn, B. E., De Kauwe, M. G., Zaehle, S., Walker, A. P., Duursma, R. A., Luus, K., Mishurov, M., Pak, B., Smith, B., and Wang, Y. P.: Using models to guide field experiments: A priori predictions for the CO2 response of a nutrient-and water-limited native Eucalypt woodland, Global Change Biology, 22, 2834–2851, https://doi.org/10.1111/gcb.13268, 2016.
Meyerholt, J., Sickel, K., and Zaehle, S.: Ensemble projections elucidate effects of uncertainty in terrestrial nitrogen limitation on future carbon uptake, Global Change Biology, 26, 3978–3996, https://doi.org/10.1111/gcb.15114, 2020.
Nazeri, N. K., Lambers, H., Tibbett, M., and Ryan, M. H.: Do arbuscular mycorrhizas or heterotrophic soil microbes contribute toward plant acquisition of a pulse of mineral phosphate?, Plant and Soil, 373, 699–710, https://doi.org/10.1007/s11104-013-1838-2, 2013.
Piao, S., Sitch, S., Ciais, P., Friedlingstein, P., Peylin, P., Wang, X., Ahlström, A., Anav, A., Canadell, J. G., and Cong, N.: Evaluation of terrestrial carbon cycle models for their response to climate variability and to CO2 trends, Global Change Biology, 19, 2117–2132, https://doi.org/10.1111/gcb.12187, 2013.
Piao, S., Huang, M., Liu, Z., Wang, X., Ciais, P., Canadell, J. G., Wang, K., Bastos, A., Friedlingstein, P., and Houghton, R. A.: Lower land-use emissions responsible for increased net land carbon sink during the slow warming period, Nature Geoscience, 11, 739–743, https://doi.org/10.1038/s41561-018-0204-7, 2018.
Piao, S., Liu, Q., Chen, A., Janssens, I. A., Fu, Y., Dai, J., Liu, L., Lian, X., Shen, M., and Zhu, X.: Plant phenology and global climate change: Current progresses and challenges, Global Change Biology, 25, 1922–1940, https://doi.org/10.1111/gcb.14619, 2019.
Piao, S., Wang, X., Park, T., Chen, C., Lian, X., He, Y., Bjerke, J. W., Chen, A., Ciais, P., and Tømmervik, H.: Characteristics, drivers and feedbacks of global greening, Nature Reviews Earth & Environment, 1, 14–27, https://doi.org/10.1038/s43017-019-0001-x, 2020.
Piao, S., He, Y., Wang, X., and Chen, F.: Estimation of China's terrestrial ecosystem carbon sink: Methods, progress and prospects, Science China Earth Sciences, 65, 641–651, https://doi.org/10.1007/s11430-021-9892-6, 2022.
Powell, T. L., Galbraith, D. R., Christoffersen, B. O., Harper, A., Imbuzeiro, H. M., Rowland, L., Almeida, S., Brando, P. M., da Costa, A. C. L., and Costa, M. H.: Confronting model predictions of carbon fluxes with measurements of Amazon forests subjected to experimental drought, New Phytologist, 200, 350–365, https://doi.org/10.1111/nph.12390, 2013.
Prentice, I. C. and Cowling, S. A.: Dynamic global vegetation models, in: Encyclopedia of biodiversity, Elsevier, 670–689, https://doi.org/10.1016/B978-0-12-384719-5.00412-3, 2013.
Prestele, R., Alexander, P., Rounsevell, M. D., Arneth, A., Calvin, K., Doelman, J., Eitelberg, D. A., Engström, K., Fujimori, S., and Hasegawa, T.: Hotspots of uncertainty in land-use and land-cover change projections: a global-scale model comparison, Global Change Biology, 22, 3967–3983, https://doi.org/10.1111/gcb.13337, 2016.
Reich, P. B., Hobbie, S. E., and Lee, T. D.: Plant growth enhancement by elevated CO2 eliminated by joint water and nitrogen limitation, Nature Geoscience, 7, 920–924, https://doi.org/10.1038/ngeo2284, 2014.
Rezende, L. F. C., Arenque, B. C., Aidar, S. T., Moura, M. S. B., Von Randow, C., Tourigny, E., Menezes, R. S. C., and Ometto, J. P. H. B.: Evolution and challenges of dynamic global vegetation models for some aspects of plant physiology and elevated atmospheric CO2, International Journal of Biometeorology, 60, 945–955, https://doi.org/10.1007/s00484-015-1087-6, 2016.
Rogers, A., Medlyn, B. E., and Dukes, J. S.: Improving representation of photosynthesis in Earth System Models, New Phytologist, 204, 12–14, https://doi.org/10.1111/nph.12972, 2014.
Rogers, A., Medlyn, B. E., Dukes, J. S., Bonan, G., Von Caemmerer, S., Dietze, M. C., Kattge, J., Leakey, A. D., Mercado, L. M., and Niinemets, Ü.: A roadmap for improving the representation of photosynthesis in Earth system models, New Phytologist, 213, 22–42, https://doi.org/10.1111/nph.14283, 2017.
Séférian, R., Nabat, P., Michou, M., Saint-Martin, D., Voldoire, A., Colin, J., Decharme, B., Delire, C., Berthet, S., and Chevallier, M.: Evaluation of CNRM Earth system model, CNRM-ESM2-1: Role of Earth system processes in present-day and future climate, Journal of Advances in Modeling Earth Systems, 11, 4182–4227, https://doi.org/10.1029/2019MS001791, 2019.
Sitch, S., O'Sullivan, M., Robertson, E., Friedlingstein, P., Albergel, C., Anthoni, P., Arneth, A., Arora, V. K., Bastos, A., Bastrikov, V., Bellouin, N., Canadell, J. G., Chini, L., Ciais, P., Falk, S., Harris, I., Hurtt, G., Ito, A., Jain, A. K., Jones, M. W., Joos, F., Kato, E., Kennedy, D., Klein Goldewijk, K., Kluzek, E., Knauer, J., Lawrence, P. J., Lombardozzi, D., Melton, J. R., Nabel, J. E. M. S., Pan, N., Peylin, P., Pongratz, J., Poulter, B., Rosan, T. M., Sun, Q., Tian, H., Walker, A. P., Weber, U., Yuan, W., Yue, X., and Zaehle, S.: Trends and Drivers of Terrestrial Sources and Sinks of Carbon Dioxide: An Overview of the TRENDY Project, Global Biogeochemical Cycles, 38, e2024GB008102, https://doi.org/10.1029/2024GB008102, 2024.
Smith, B., Wårlind, D., Arneth, A., Hickler, T., Leadley, P., Siltberg, J., and Zaehle, S.: Implications of incorporating N cycling and N limitations on primary production in an individual-based dynamic vegetation model, Biogeosciences, 11, 2027–2054, https://doi.org/10.5194/bg-11-2027-2014, 2014.
Song, X., Wang, D.-Y., Li, F., and Zeng, X.-D.: Evaluating the performance of CMIP6 Earth system models in simulating global vegetation structure and distribution, Advances in Climate Change Research, 12, 584–595, https://doi.org/10.1016/j.accre.2021.06.008, 2021.
Sulman, B. N., Shevliakova, E., Brzostek, E. R., Kivlin, S. N., Malyshev, S., Menge, D. N., and Zhang, X.: Diverse mycorrhizal associations enhance terrestrial C storage in a global model, Global Biogeochemical Cycles, 33, 501–523, https://doi.org/10.1029/2018GB005973, 2019.
Teckentrup, L., De Kauwe, M. G., Pitman, A. J., Goll, D. S., Haverd, V., Jain, A. K., Joetzjer, E., Kato, E., Lienert, S., Lombardozzi, D., McGuire, P. C., Melton, J. R., Nabel, J. E. M. S., Pongratz, J., Sitch, S., Walker, A. P., and Zaehle, S.: Assessing the representation of the Australian carbon cycle in global vegetation models, Biogeosciences, 18, 5639–5668, https://doi.org/10.5194/bg-18-5639-2021, 2021.
Terrer, C., Vicca, S., Hungate, B. A., Phillips, R. P., and Prentice, I. C.: Mycorrhizal association as a primary control of the CO2 fertilization effect, Science, 353, 72–74, https://doi.org/10.1126/science.aaf4610, 2016.
Terrer, C., Vicca, S., Stocker, B. D., Hungate, B. A., Phillips, R. P., Reich, P. B., Finzi, A. C., and Prentice, I. C.: Ecosystem responses to elevated CO2 governed by plant–soil interactions and the cost of nitrogen acquisition, New Phytologist, 217, 507–522, https://doi.org/10.1111/nph.14872, 2018.
Terrer, C., Jackson, R. B., Prentice, I. C., Keenan, T. F., Kaiser, C., Vicca, S., Fisher, J. B., Reich, P. B., Stocker, B. D., and Hungate, B. A.: Nitrogen and phosphorus constrain the CO2 fertilization of global plant biomass, Nature Climate Change, 9, 684–689, https://doi.org/10.1038/s41558-019-0545-2, 2019.
Trugman, A., Medvigy, D., Mankin, J., and Anderegg, W.: Soil moisture stress as a major driver of carbon cycle uncertainty, Geophysical Research Letters, 45, 6495–6503, https://doi.org/10.1029/2018GL078131, 2018.
Wang, H., Prentice, I. C., Keenan, T. F., Davis, T. W., Wright, I. J., Cornwell, W. K., Evans, B. J., and Peng, C.: Towards a universal model for carbon dioxide uptake by plants, Nature Plants, 3, 734–741, https://doi.org/10.1038/s41477-017-0006-8, 2017.
Wang, J., Feng, L., Palmer, P. I., Liu, Y., Fang, S., Bösch, H., O'Dell, C. W., Tang, X., Yang, D., and Liu, L.: Large Chinese land carbon sink estimated from atmospheric carbon dioxide data, Nature, 586, 720–723, https://doi.org/10.1038/s41586-020-2849-9, 2020.
Wang, K., Bastos, A., Ciais, P., Wang, X., Rödenbeck, C., Gentine, P., Chevallier, F. D. R., Humphrey, V. W., Huntingford, C., and O'Sullivan, M.: Regional and seasonal partitioning of water and temperature controls on global land carbon uptake variability, Nature Communications, 13, 3469, https://doi.org/10.1038/s41467-022-31175-w, 2022a.
Wang, T., Zhang, Y., Yue, C., Wang, Y., Wang, X., Lyu, G., Wei, J., Yang, H., and Piao, S.: Progress and challenges in remotely sensed terrestrial carbon fluxes, Geo-spatial Information Science, 1–21, https://doi.org/10.1080/10095020.2024.2336599, 2024.
Wang, Y., Zhang, Z., and Chen, X.: The dominant driving force of Forest change in the Yangtze River basin, China: climate variation or anthropogenic activities?, Forests, 13, 82, https://doi.org/10.3390/f13010082, 2022b.
Wang, Y., Tian, X., Duan, M., Zhu, D., Liu, D., Zhang, H., Zhou, M., Zhao, M., Jin, Z., and Ding, J.: Optimal design of surface CO2 observation network to constrain China's land carbon sink, Science Bulletin, 68, 1678–1686, https://doi.org/10.1016/j.scib.2023.07.010, 2023.
Winkler, A. J., Myneni, R. B., Hannart, A., Sitch, S., Haverd, V., Lombardozzi, D., Arora, V. K., Pongratz, J., Nabel, J. E. M. S., Goll, D. S., Kato, E., Tian, H., Arneth, A., Friedlingstein, P., Jain, A. K., Zaehle, S., and Brovkin, V.: Slowdown of the greening trend in natural vegetation with further rise in atmospheric CO2, Biogeosciences, 18, 4985–5010, https://doi.org/10.5194/bg-18-4985-2021, 2021.
Wu, D., Zhao, X., Liang, S., Zhou, T., Huang, K., Tang, B., and Zhao, W.: Time-lag effects of global vegetation responses to climate change, Global Change Biology, 21, 3520–3531, https://doi.org/10.1111/gcb.12945, 2015.
Yuan, H., Dai, Y., Xiao, Z., Ji, D., and Shangguan, W.: Reprocessing the MODIS Leaf Area Index products for land surface and climate modelling, Remote Sensing of Environment, 115, 1171–1187, https://doi.org/10.1016/j.rse.2011.01.001, 2011.
Yuan, W., Zheng, Y., Piao, S., Ciais, P., Lombardozzi, D., Wang, Y., Ryu, Y., Chen, G., Dong, W., and Hu, Z.: Increased atmospheric vapor pressure deficit reduces global vegetation growth, Science Advances, 5, eaax1396, https://doi.org/10.1126/sciadv.aax1396, 2019.
Yue, X., Zhou, H., Cao, Y., Liao, H., Lu, X., Yu, Z., Yuan, W., Liu, Z., Lei, Y., Sitch, S., Knauer, J., and Wang, H.: Large potential of strengthening the land carbon sink in China through anthropogenic interventions, Science Bulletin, 69, 2622–2631, https://doi.org/10.1016/j.scib.2024.05.037, 2024.
Zaehle, S.: Terrestrial nitrogen–carbon cycle interactions at the global scale, Philosophical Transactions of the Royal Society B: Biological Sciences, 368, 20130125, https://doi.org/10.1098/rstb.2013.0125, 2013.
Zeng, Z., Estes, L., Ziegler, A. D., Chen, A., Searchinger, T., Hua, F., Guan, K., Jintrawet, A., and Wood, E. F.: Highland cropland expansion and forest loss in Southeast Asia in the twenty-first century, Nature Geoscience, 11, 556–562, https://doi.org/10.1038/s41561-018-0166-9, 2018.
Zhang, P., Shao, G., Zhao, G., Le Master, D. C., Parker, G. R., Dunning Jr., J. B., and Li, Q.: China's forest policy for the 21st century, Science, 288, 2135–2136, https://doi.org/10.1126/science.288.5474.2135, 2000.
Zhang, Y., Yao, Y., Wang, X., Liu, Y., and Piao, S.: Mapping spatial distribution of forest age in China, Earth and Space Science, 4, 108–116, https://doi.org/10.1002/2016EA000177, 2017.
Zhang, Y., Joiner, J., Alemohammad, S. H., Zhou, S., and Gentine, P.: A global spatially contiguous solar-induced fluorescence (CSIF) dataset using neural networks, Biogeosciences, 15, 5779–5800, https://doi.org/10.5194/bg-15-5779-2018, 2018.
Zhao, Q., Zhu, Z., Zeng, H., Myneni, R. B., Zhang, Y., Peñuelas, J., and Piao, S.: Seasonal peak photosynthesis is hindered by late canopy development in northern ecosystems, Nature Plants, 8, 1484–1492, https://doi.org/10.1038/s41477-022-01278-9, 2022.
Zhong, J., Zhang, X., Guo, L., Wang, D., Miao, C., and Zhang, X.: Ongoing CO2 monitoring verify CO2 emissions and sinks in China during 2018–2021, Science Bulletin, 68, 2467–2476, https://doi.org/10.1016/j.scib.2023.08.039, 2023.
Zhu, J. and Zeng, X.: Trend in seasonal amplitude of northern net ecosystem production: Simulated results from IAP DGVM in CAS-ESM2, Atmospheric and Oceanic Science Letters, 17, 100445, https://doi.org/10.1016/j.aosl.2023.100445, 2024.
Zhu, Z., Piao, S., Myneni, R. B., Huang, M., Zeng, Z., Canadell, J. G., Ciais, P., Sitch, S., Friedlingstein, P., and Arneth, A.: Greening of the Earth and its drivers, Nature Climate Change, 6, 791–795, https://doi.org/10.1038/nclimate3004, 2016.
Zou, L., Stan, K., Cao, S., and Zhu, Z.: Dynamic global vegetation models may not capture the dynamics of the leaf area index in the tropical rainforests: A data-model intercomparison, Agricultural and Forest Meteorology, 339, 109562, https://doi.org/10.1016/j.agrformet.2023.109562, 2023.