the Creative Commons Attribution 4.0 License.
the Creative Commons Attribution 4.0 License.
 | 24 Jul 2024
Observation-inferred resilience loss of the Amazon rainforest possibly due to internal climate variability
Raphael Grodofzig
Martin Renoult
Thorsten Mauritsen
Recent observation-based studies suggest that the Amazon rainforest has lost substantial resilience since 1990, indicating that the forest might undergo a critical transition in the near future due to global warming and deforestation. The idea is to use trends in a lag-1 auto-correlation of leaf density as an early-warning signal of an imminent critical threshold for rainforest dieback. Here we test whether the observed change in auto-correlations could arise from internal variability using historical and control simulations of nine sixth-generation Earth system model ensembles (Phase 6 of the Coupled Model Intercomparison Project, CMIP6). We quantify trends in the leaf area index auto-correlation from both models and satellite-observed vegetation optical depth from 1990 to 2017. Four models reproduce the observed trend with at least one historical realization whereby the observations lie at the upper limit of model variability. Three out of these four models exhibit similar behavior in control runs, suggesting that historical forcing is not necessary for simulating the observed trends. Furthermore, we do not observe a critical transition in any future runs under the strongest greenhouse gas emission scenario (SSP5-8.5) until 2100 in the four models that best reproduce the past observed trends. Hence, the currently observed trends could be caused simply by internal variability and, unless the data records are extended, have limited applicability as an early-warning signal. Our results suggest that the current rapid decline in the Amazon rainforest coverage is not foremost caused by global warming.
- Article
(9578 KB) - Full-text XML
- BibTeX
- EndNote


The resilience level of the Amazon rainforest to external stresses, such as global warming and deforestation, is subject to ongoing debate (Feldpausch et al., 2016; Boers et al., 2017; Boulton et al., 2022). Since the 1970s the Amazon rainforest has lost about 20 % of its coverage (Simmons et al., 2019), and the net carbon uptake of the formerly persistent carbon sink has been declining over the last 4 decades due to intensification of the dry season and elevated deforestation (Gatti et al., 2021). The rapid development has raised warnings that the Amazon rainforest is approaching a critical threshold, beyond which irreversible damage is unavoidable (Brando et al., 2014; Boers et al., 2017; Boulton et al., 2022; Parry et al., 2022; Doughty et al., 2023).
Model studies, however, differ widely in their results, and the inter-model spread of vegetation responses in future projections remains high with moderate forest resilience this century but a higher risk of sporadic rainforest loss past 2100 (Huntingford et al., 2013; Boulton et al., 2017; Chai et al., 2021). Notably, Parry et al. (2022) found localized rainforest dieback using an abrupt-shift-detection algorithm in five out of seven CMIP6 models they investigated in simulations wherein CO2 is increased by 1 % yr−1 until it quadrupled after 140 years. All in all, though, climate models do not predict an imminent and complete collapse of the Amazon rainforest. However, it has been reported that climate models underestimate vegetation-related feedbacks (Richardson et al., 2013; Green et al., 2017; Forkel et al., 2019).
Observation-based studies of the recent historical record convey a more alarming picture. Tao et al. (2022) reported the capacity of undamaged rainforests to withstand future droughts to be limited, especially in the Amazon. Analyzing remotely sensed vegetation data, Boulton et al. (2022) supported this idea and found that more than three-quarters of the Amazon rainforest has been losing resilience since the 2000s, especially in regions of less rainfall and in proximity to regions of human activity. They present evidence for an imminent tipping point of the rainforest in the near future.
Such a tipping point may be initiated by a major tree loss from fires, deforestation, or climate change (Cox et al., 2008; Brando et al., 2014). Land cover transitions, such as forest to crops or forest to pasture, decrease the net surface radiation and latent heat flux while increasing the sensible heat flux, resulting in warming of the land surface (Silvério et al., 2015). Reducing the vegetation density by deforestation is associated with enhanced precipitation run-off and reduced evapotranspiration. Hence, both deforestation and forest degradation by droughts weaken the moisture transport by recycling, which is mainly directed westwards over the Amazonian basin along the prevalent wind direction (Salati et al., 1979). This causes reduced precipitation downwind and degraded forest health in a positive feedback loop.
Negative feedbacks and stabilizing effects may also exist. For instance, vegetation responds positively to increasing levels of CO2 (Kolby Smith et al., 2016), provided sufficient water and nutrients are available, something which can be observed to happen in most parts of the world, including the Amazon basin (Zhu et al., 2016). Another possible mechanism could be convective clouds that actively shift precipitation from wet to dry regions; the temperature gradient, arising from evaporative cooling in wet regions while warming dry regions activates a low-level breeze that transports moisture to the dry areas (Hohenegger and Stevens, 2018). This, by extension, would be a negative feedback in the Amazon in that the atmosphere acts to moisten dry regions. Since the Amazon rainforest has existed for at least thousands (Malhi et al., 2004) or even millions of years (Maslin et al., 2005), the rainforest must have been dominated by negative feedback in the past.
Tipping points are typically accompanied by a regime shift from a stable state, where negative feedback mechanisms dominate, to a marginally stable state with transition to a net positive feedback parameter. Several statistical metrics, known as early-warning signals, have been proposed to predict a regime shift (Scheffer et al., 2009; Lenton et al., 2012). Most commonly, they quantify the recovery rate of the system to small perturbations. The resilience of a system is subsequently defined as the ability to recover from those disturbances. As the stability of the system decreases, it recovers slower when stochastically forced. This phenomenon, known as critical slowing down (CSD), can be detected by an increase in the lag-1 auto-correlation (AR(1)) of a time series representing the dynamics of the system. Increasing AR(1) has been widely used as an early-warning signal for Earth's dynamical systems such as the western Greenland Ice Sheet (Boers and Rypdal, 2021) or the Amazonian rainforest (Boulton et al., 2022). However, the increase in AR(1) has been shown to occur, likewise, for other physical reasons (Verbesselt et al., 2016), as well as to not occur prior to critical transitions; for instance, when the rate of forcing is higher than the intrinsic response timescale for CSD (Boulton et al., 2013).
Here, we compare the observational record to nine large CMIP6 historical model ensembles and control simulations, quantifying model forest resilience between 1990 and 2014 using the same method as in Boulton et al. (2022). By analyzing large model ensembles, we can test whether internal variability in auto-correlation could be the source of the observation-inferred resilience loss.
2.1 Data
We use the Amazon basin as our region of study, taken to be the domain defined as by RAISG (Amazon Network of Georeferenced Socio-Environmental Information; accessed in March 2023). The observational data are provided by the Vegetation Optical Depth Climate Archive (VODCA) (Moesinger et al., 2020), which is available in a 0.25°×0.25° resolution in daily frequency for the period July 1987 to June 2017. The passive or active satellite observations capture the attenuation of microwave radiation by vegetation, which is known as the vegetation optical depth (VOD). The attenuation depends on various factors like the density, type, and water content of the vegetation and the wavelength range of the sensor (Owe et al., 2008). Shorter wavelengths are more sensitive to the upper-leaf canopy than longer wavelengths, since they experience higher attenuation by vegetation. We chose the lowest-wavelength product available (Ku band; ∼ 19 GHz) for the period January 1990 to December 2017, following the study by Boulton et al. (2022). The monthly means of the VODCA product are interpolated to 1°×1° to compare them better to models, although this did not substantially affect the observed trend (see Fig. A1).
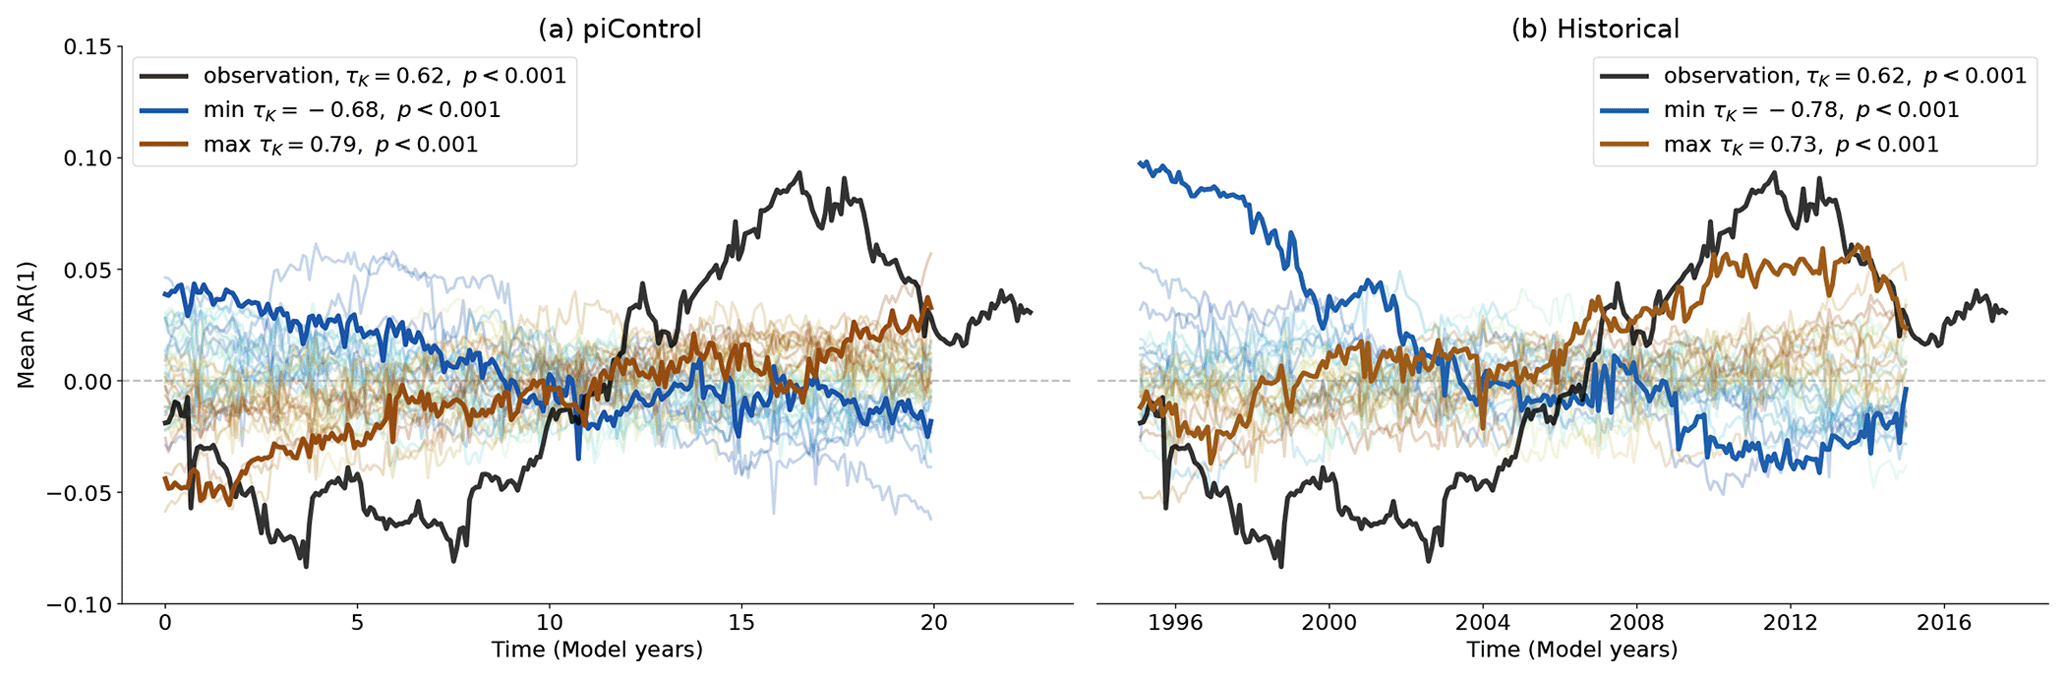
Figure 1Anomaly of the spatially averaged AR(1) series for observations and MPI-ESM1-2-LR piControl (a) and historical (b) ensemble. The anomaly is computed by subtracting the temporal mean from the time series and is plotted at the end of the 5-year sliding window. The ensemble member with the largest and smallest τK values are highlighted. The color gradient of all ensemble runs corresponds to increasing τK.
To assess internal variability, CMIP6 model ensembles with at least seven historical runs available and interactive leaf area index (LAI) are included in the study (Table 1). The non-dimensional LAI is defined as the total area of leaves per unit surface area. Although LAI and VOD are not identical variables but physically closely related, changes in both variables are strongly correlated, such that they can be considered good proxies for forest health and resilience (Moesinger et al., 2020).
The model LAI output is evaluated in the period January 1990 to December 2014, as the historical experiments are only available until this point in time. Additionally, we use Shared Socioeconomic Pathway 5 (SSP5-8.5) and pre-industrial control simulations of 500 or 1000 years in length that we cut into windows of 25 years that correspond to the length of the historical period. In that way, we create a control ensemble of 20 or 40 members. Control simulations have the advantage that the internal variability in the model can be directly assessed since no external forcing is present.
The models' land surface components (Table 1) simulate exchanges of energy, water, and carbon between the land surface and the atmosphere, as well as biogeochemical processes like photosynthesis. The LAI is computed dynamically in all models investigated. The ecosystem processes are mostly run on a daily time step; however, CanESM5 and IPSL-CM6A run a water and energy budget, as well as photosynthesis computations, on a sub-daily scale (in accordance with the atmospheric component). Only the two MPI-ESM1-2 models and EC-Earth3-Veg have simulated natural vegetation distribution, while all other models investigated prescribe the plant functional type (PFT) fractions e.g., using the LUH2 v2h data set (Hurtt et al., 2020). However, the number of implemented PFTs differs widely from 4 (CanESM5) to 22 (CESM2). The nitrogen cycle is explicitly resolved in ACCESS-ESM1.5, CESM2, MIROC-ES2L, EC-EARTH-Veg3, and MPI-ESM1-2, while wildfires that are deliberately modeled in CESM2 and the MPI-ESM1-2 family occur randomly in EC-EARTH-Veg3 and are not considered in the other models (references see Table 1). Song et al. (2021) report a generally good global representation of LAI in the global climate models (GCMs) in question. In the Amazon, the multi-year (1982–2014) and yearly average is slightly underestimated by models, just as the inter-annual variability is also underestimated. Long-term LAI trends are generally captured but can vary in bias compared to observations in forested regions.
Last, we determine the land use and land cover change (LUCC) using the land use harmonization data set LUH2 v2h and v2f (Hurtt et al., 2020) that is available as annual values on a 0.25°×0.25° spatial resolution and utilized to force the land components of CMIP6 models.
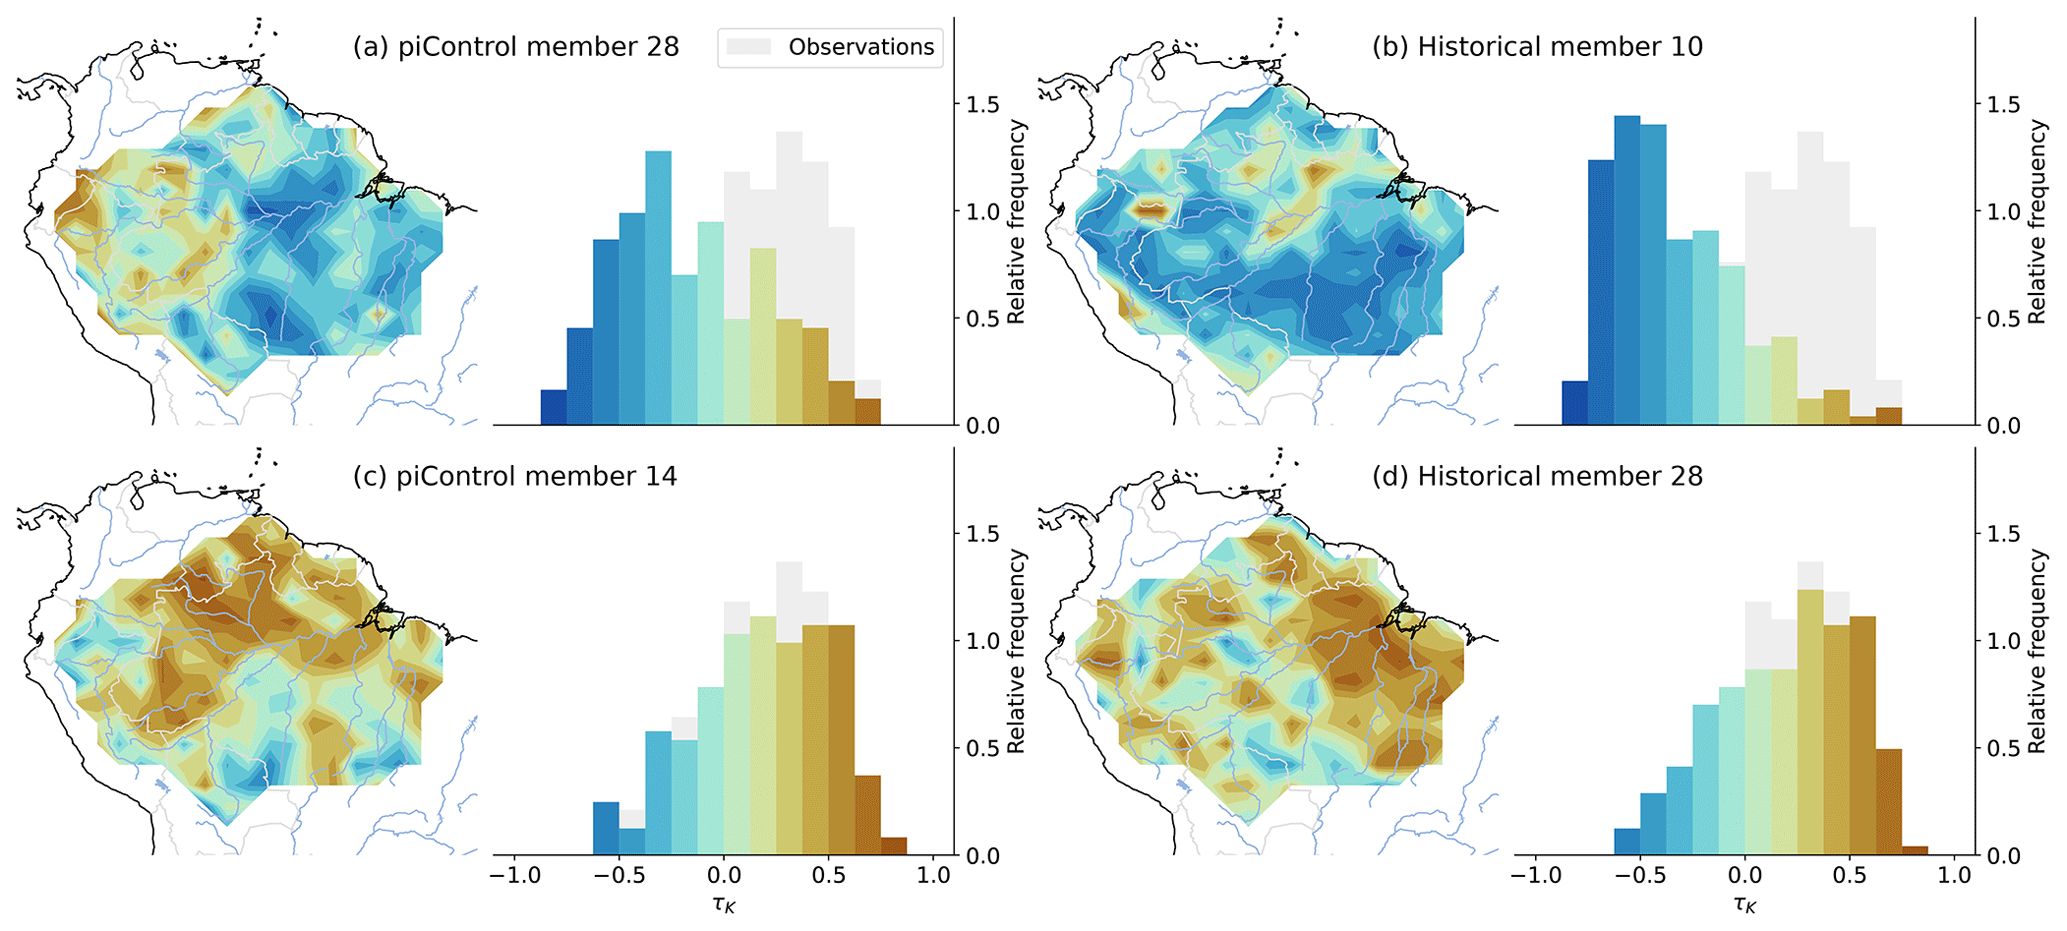
Figure 2Maps and histograms of the τK values of selected members from the piControl (a, c) and historical (b, d) MPI-ESM1-2-LR ensemble. The observed τK distribution is plotted in grey for comparison. We selected the ensemble members that have the highest and lowest τK values of the spatially averaged AR(1) series to present the full range of the model variability.
2.2 Resilience indicator AR(1)
The random variability in a signal contains information about the recovery rate from stochastic perturbations, such that we can separate trend, seasonality, and residual of the signal using seasonal trend decomposition (STL) by loess (Cleveland et al., 1990). Assuming the seasonality is constant in time, we choose the STL input parameters trend = 19, season = 13, and period = 12 months, corresponding to choices made in previous work (Boulton et al., 2022). Nevertheless, slightly altering the STL parameters has no relevant influence on the presented results. The residual component of each grid cell can then be used to quantify the short-term responses of the forest by calculating the AR(1) on a sliding window of 5 years. We find the AR(1) time series using an ordinary least squares fitting method for the autoregressive model (Eq. 1), where ϵt represents the white noise of the model with zero mean and constant variance , Xt is the time series in each grid point, and φ is the autoregressive coefficient, also denoted AR(1).
We then quantify the trend of this AR(1) time series with Kendall's rank correlation τK that measures how well two data vectors agree on their ranks (Kendall, 1938). Choosing one vector to be time, a Kendall's τK=1 indicates a strictly increasing AR(1) trend, a strictly decreasing, and τK=0 no trend. The significance p of this statistic is computed by randomly generating phase surrogates of the time series' Fourier transform under constant variance and serial correlation (Dakos et al., 2008).
For comparison between observations and models, we calculate both the τK of the spatially averaged AR(1) series and for individual grid cells. The spatial distributions of τK are tested for the similarity in the frequency between the observations and the model using the non-parametric, two-sample Kolmogorov–Smirnov test (Berger and Zhou, 2014). Its test statistic is given by the maximum difference between two cumulative distribution functions and is computed under the null hypothesis that both samples are drawn from populations that have an arbitrary, yet identical, underlying distribution. The higher the p value of this test, the less likely it is that the samples are drawn from different underlying distributions.
Ziehn et al. (2020)Boucher et al. (2020)Mauritsen et al. (2019)Hajima et al. (2020)Swart et al. (2019)Mauritsen et al. (2019)Volodin and Gritsun (2018)Danabasoglu et al. (2020)Döscher et al. (2022)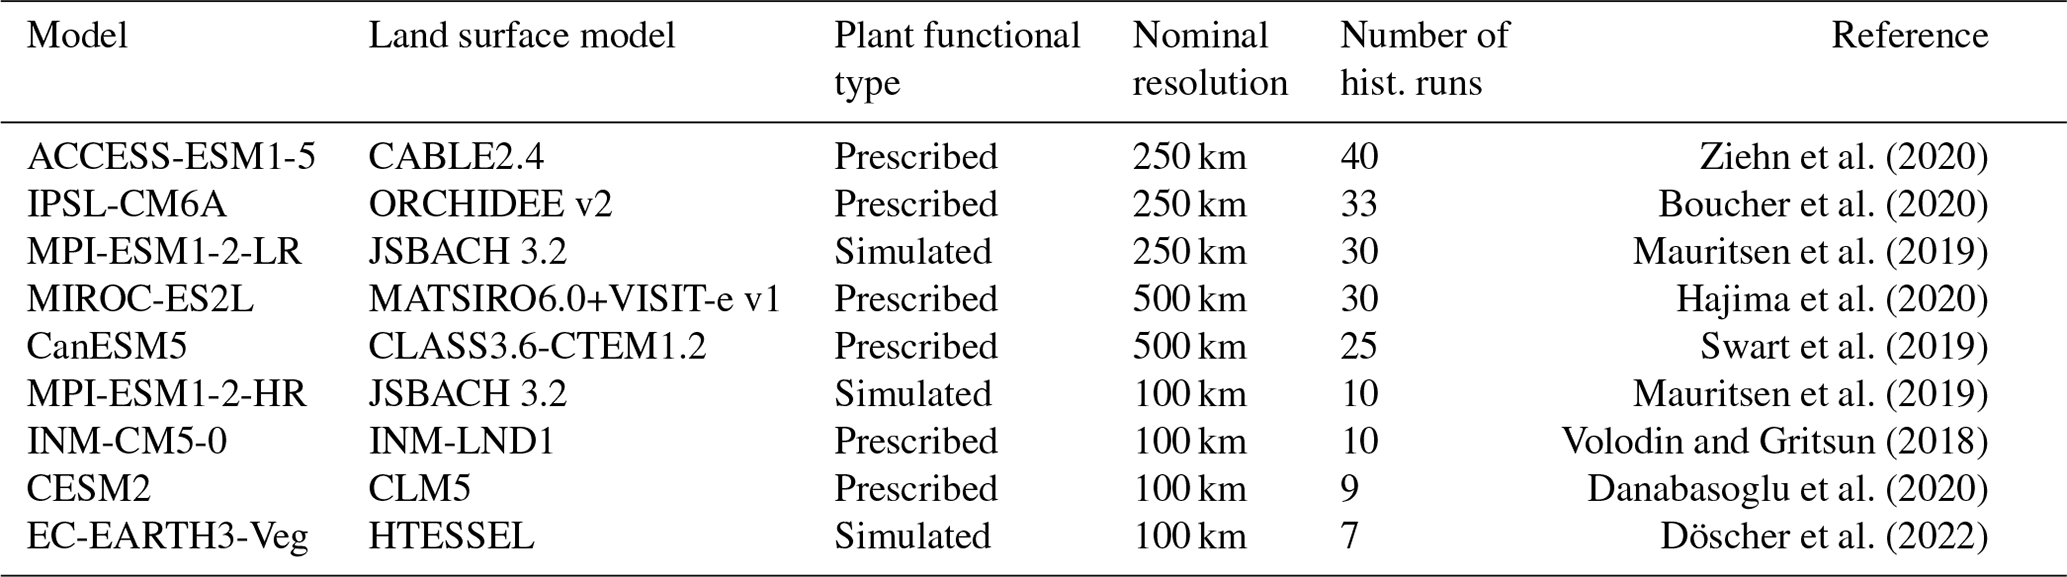
The observational record of the auto-correlation of VOD from the Amazon basin exhibits variations and trends (Fig. 1), but it is impossible based solely on a single-data record to figure out whether such variations are caused by external forcing or whether it is simply an expression of internal variability. A commonly used method to detect forced changes and events in observational records that contain internal and natural variability is to compare them in various ways to multiple climate model runs with different codes and/or starting from different initial conditions (e.g., Hasselmann, 1997; Otto, 2023). In particular, it has become common that global climate models are run multiple times with the same historical boundary conditions but start from different initial conditions in order to explore their internal variability (Kay et al., 2015; Maher et al., 2021; Table 1). With such large ensembles it is possible to ask whether the observed trend is within the range of variability exhibited by the model and by extension, in the present case, whether an increasing trend in auto-correlation constitutes a skillful early-warning signal.
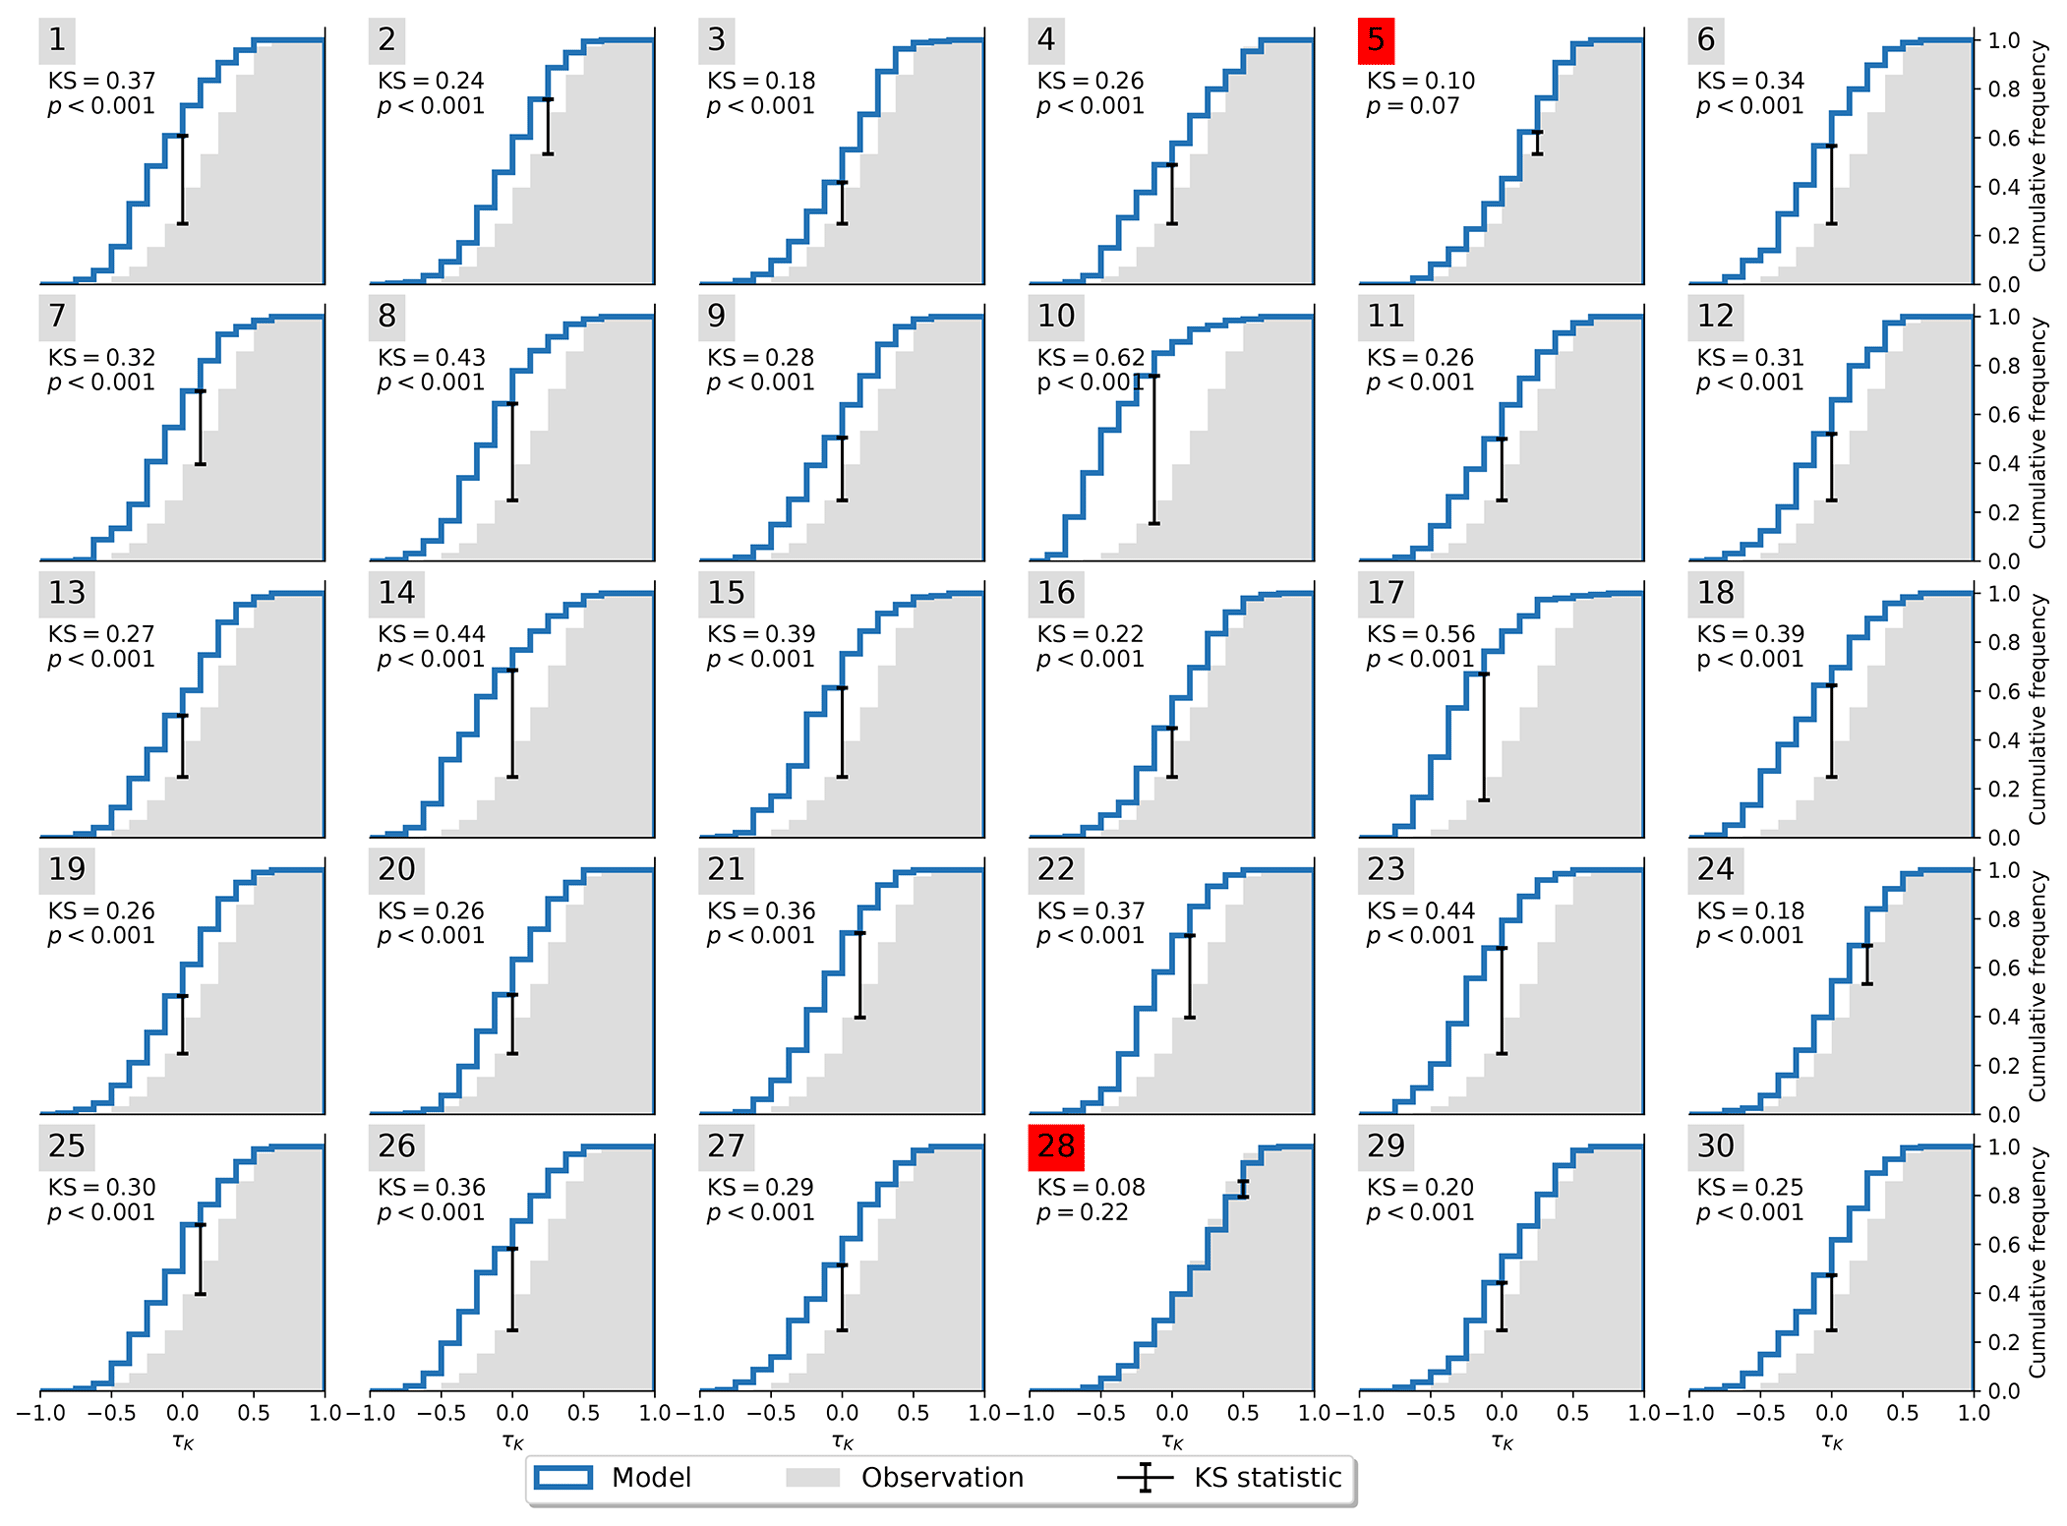
Figure 3Cumulative distribution functions of τK for observations and members of MPI-ESM1-2-LR. The KS statistic is drawn as a black error bar. Members that are not significantly different from the observational distribution are marked in red. Member 28 shows the best agreement with KS =0.08 and p=0.22.
As an example, we display 30 simulations of the historical experiment of one CMIP6 model and MPI-ESM1-2-LR, together with the observations (Fig. 1; right panel). We see that the observed trend in the spatially averaged AR(1) of τK = 0.62 is within the range of trends exhibited by the model ensemble members (−0.76 to 0.72) when calculated over the same period. Therefore, in terms of this model's behavior, the observed trend is within the range of variability. To investigate whether global warming or land use change is affecting the trends, we can also inspect equally long-duration chunks from the same model's pre-industrial control simulation (Fig. 1; left panel). Here we also find trends that encapsulate the observed trend (−0.68 to 0.79). Even though the shorter-term deviations appear slightly muted in this case compared to the historical ensemble, the overall trend range in the control and historical experiment does only differ marginally. Moreover, the largest AR(1) trend of this model is found among the control runs, suggesting that the forced response of the Amazon rainforest is not needed to generate an increase in AR(1) of a similar magnitude to that observed.
The modeled spatial distributions of the trends in AR(1) further support the idea that the origin is internal variability. We can inspect maps and frequency distributions from the two historical ensemble members and the two chunks from the pre-industrial control in Fig. 2 that exhibited the largest trends (Fig. 1). All historical ensemble members are shown in Fig. A2. We see that positive trends can occur in any part of the Amazon basin and are not preferentially occurring in the southern parts where most of the land use changes happened (Fig. A6). There are, however, cases wherein this pattern occurs (e.g., members 4, 13, 15, 26, and 30). Also noteworthy is that the model does display trend patterns with spatial scales that are substantially larger than the model resolution such that the underlying causes must be a simulated feature of the model, e.g., large-scale weather events.
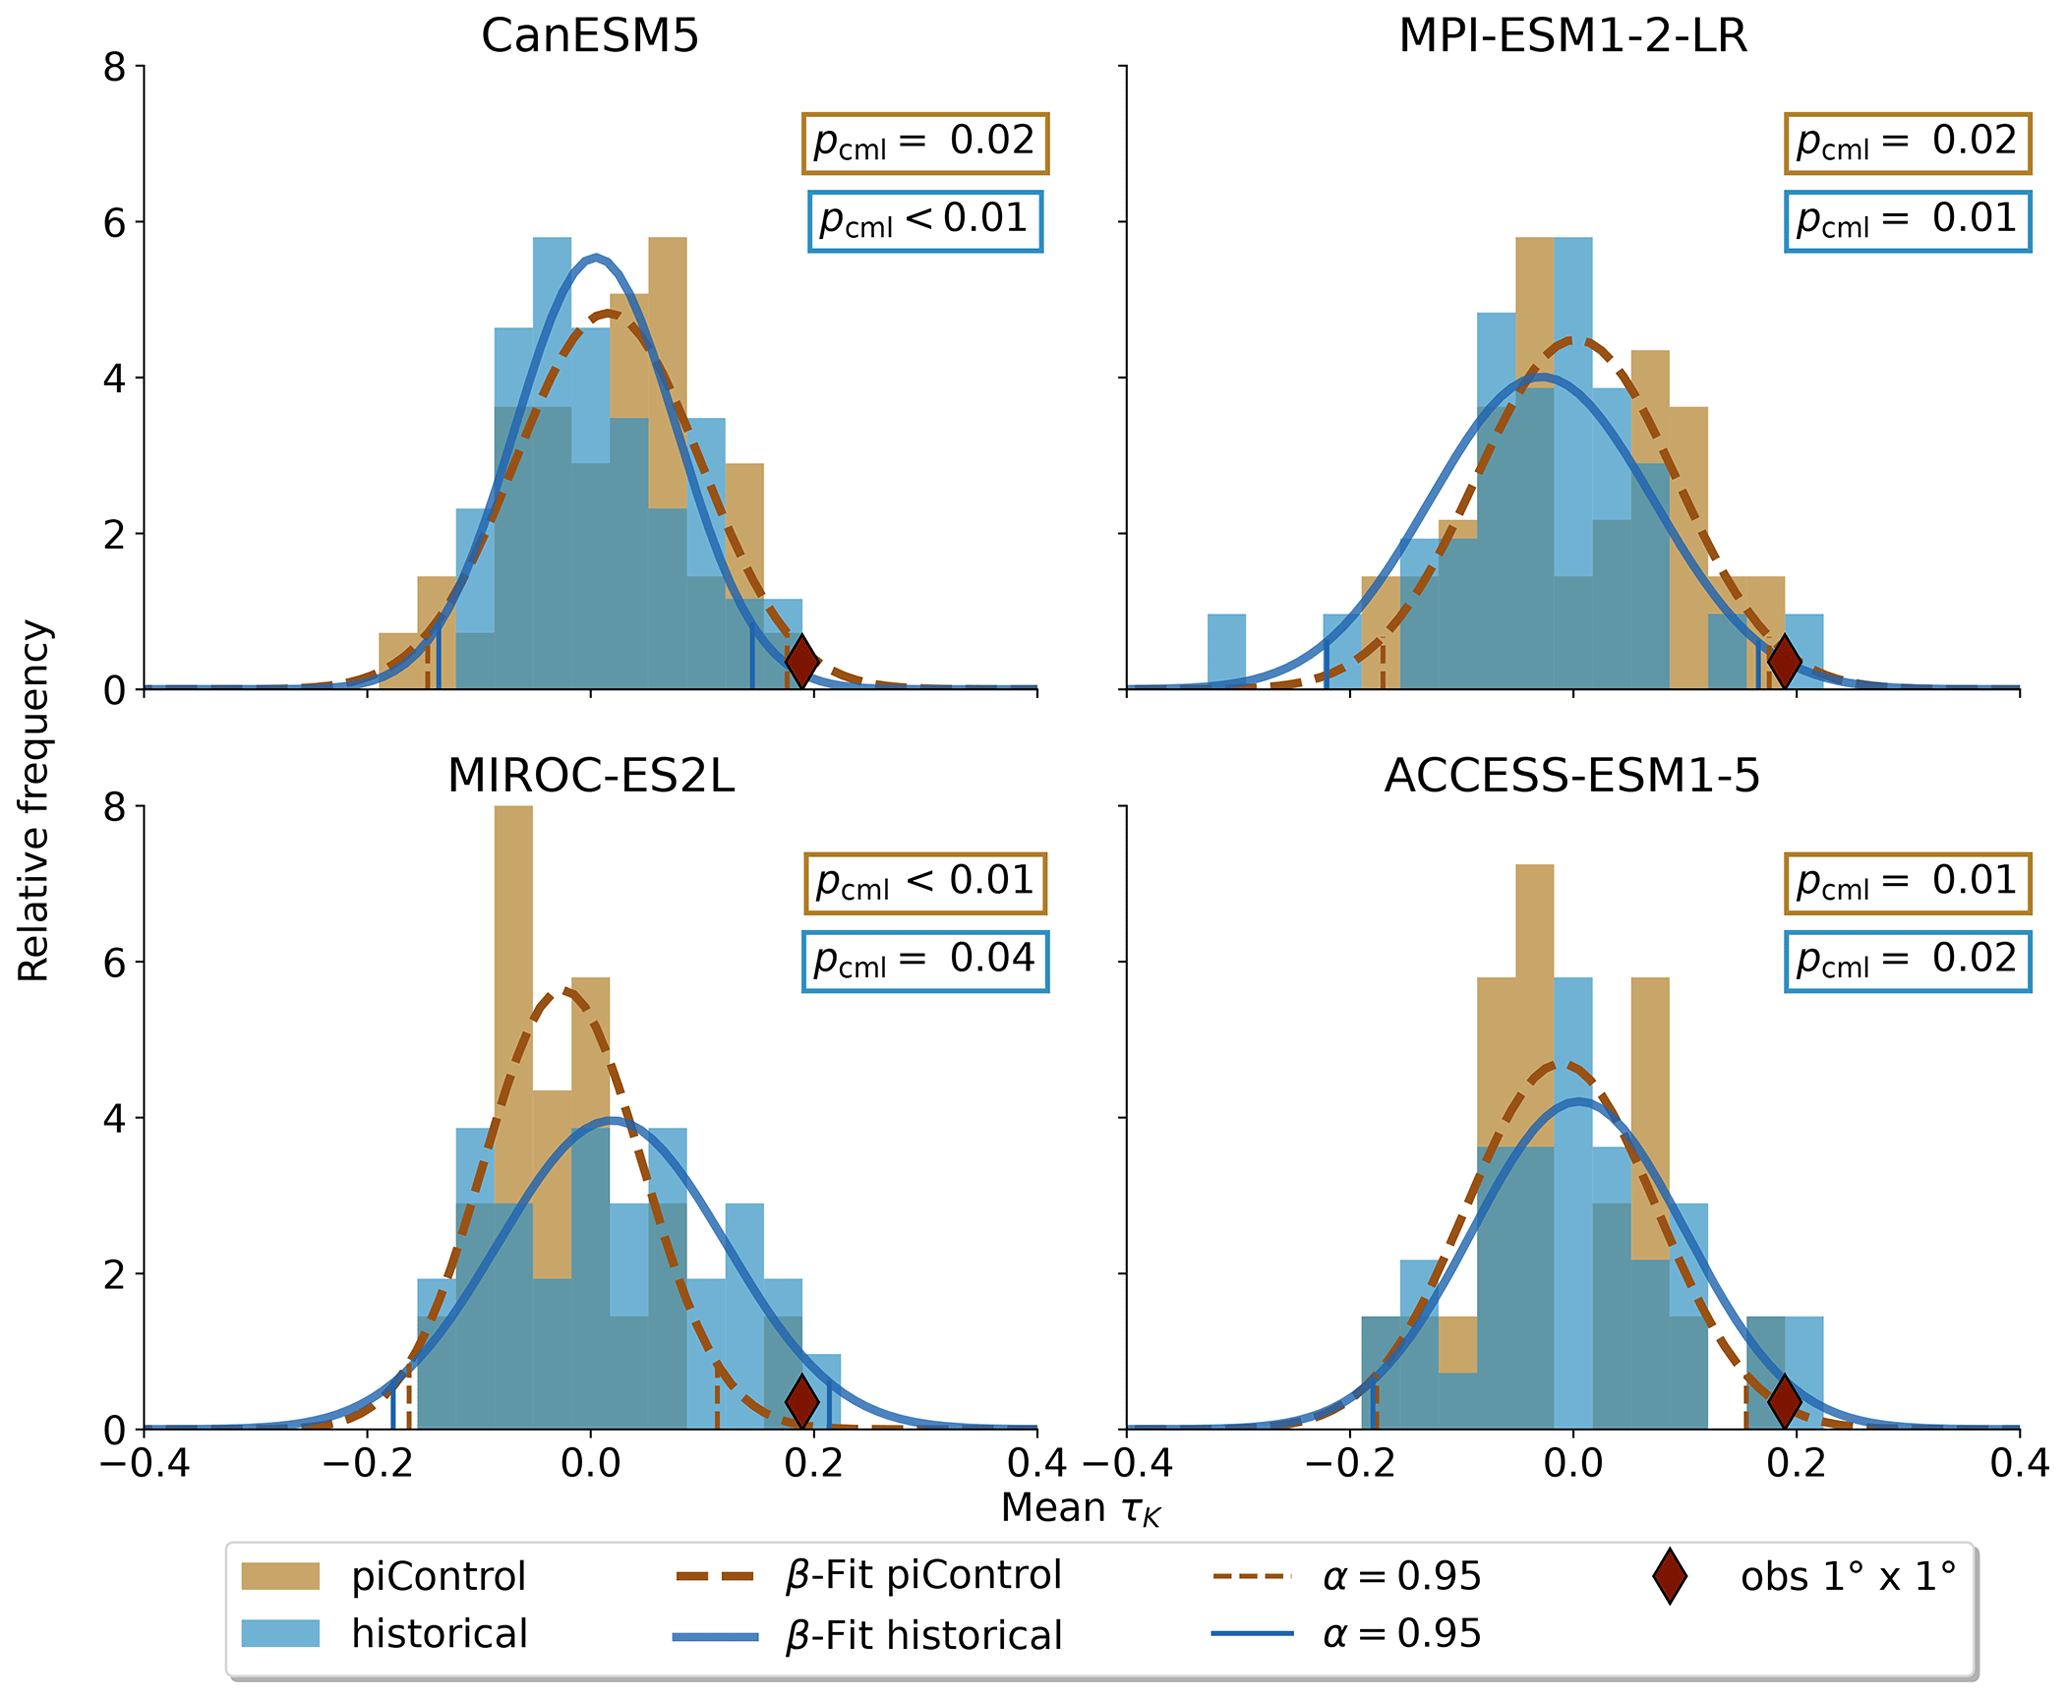
Figure 4Model's mean τK distributions for piControl and historical runs. The histograms are fitted with a β distribution on the interval . The observation's percentile within the respective distribution is denoted by pcml. Historical forcing makes the occurrence of the observations more likely only in MIROC-ES2L and ACCESS-ESM1-5, while CanESM5 and MPI-ESM1-2 simulate a higher probability in control runs.
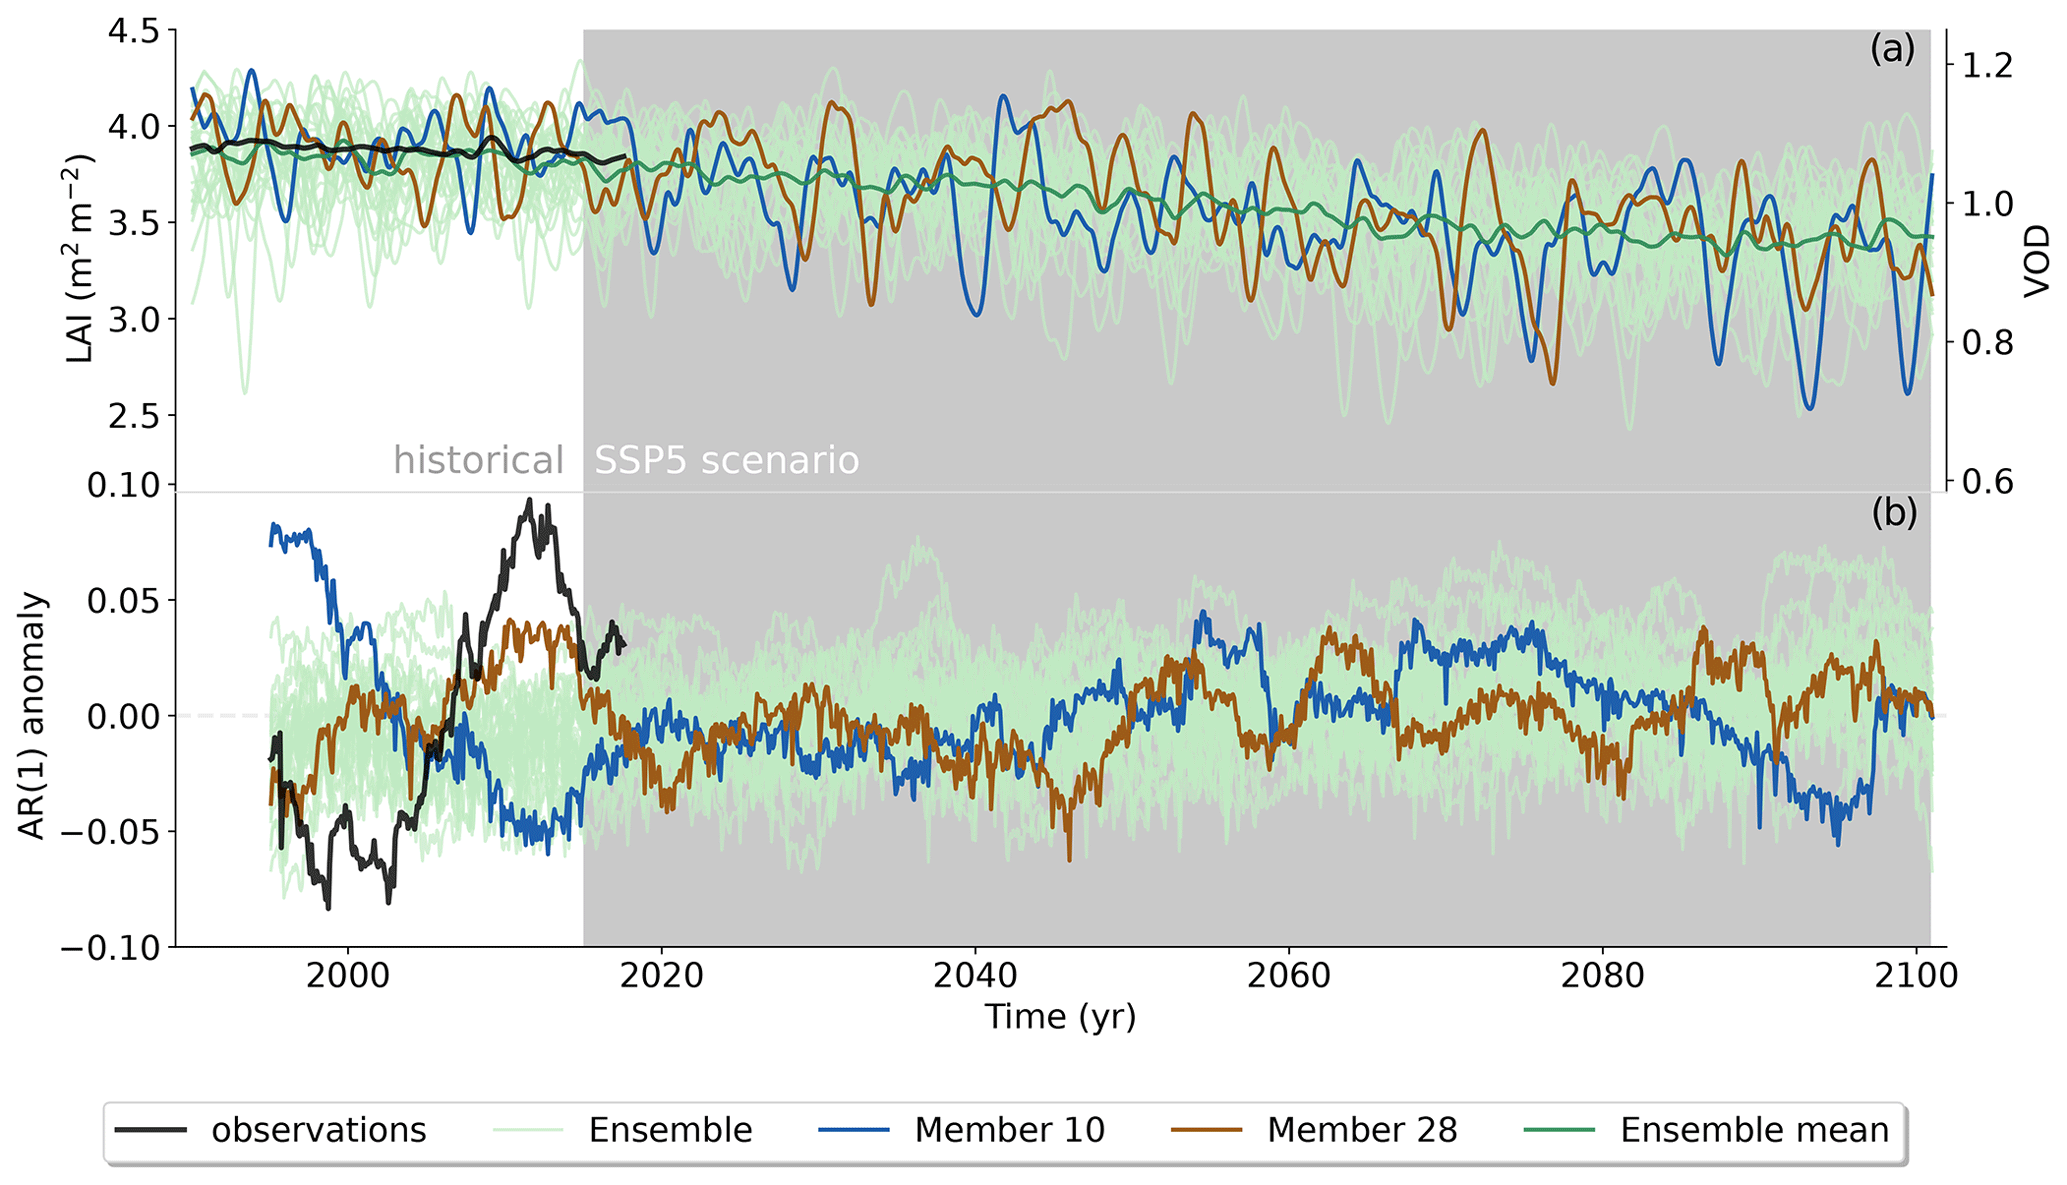
Figure 5Historical and SSP5-8.5 scenario of MPI-ESM1-2-LR LAI and the corresponding spatially averaged AR(1) trend compared to the observational VOD record. Panel (a) displays the STL trend component of LAI and VOD respectively, and panel (b) shows the AR(1) series of the STL residual plotted at the end of the 5-year sliding window. Ensemble member 28 is the best-agreeing member with observations in the historical period, while member 10 has the least agreement. Note that the dual vertical axes used in the upper panel are scaled to have the same relative range.
Not all models are equally fit for the purpose of simulating the Amazon rainforest dynamics in accordance with observations. To investigate this, we apply the Kolmogorov–Smirnov (KS) test (Sect. 2.2) on each ensemble member to test whether it could have been drawn from the same underlying distribution as the observations. The process is illustrated in Fig. 3. For the MPI-ESM1-2-LR model, the test identifies two ensemble members (5 and 28) that are statistically indistinguishable from the observed trend distribution. This implies that the observations lie within the range of model variability but on the edge of what the model is able to reproduce. We carry out the same procedure for all models and find that four of the nine models pass the test (Table 2) with CanESM5 (Fig. A3), ACCESS-ESM1-5 (Fig. A4), and MIROC-ES2L (Fig. A5), showing a closer affinity to observations than the MPI-ESM1-2-LR model which we have focused on thus far.
A drawback of applying the KS test method here is that some model ensembles may be too small, and therefore, simply by chance, none of the ensemble members passes the KS test, even if the model is capable of producing such a simulation. Indeed, we see that four of the five models that are not passing the KS test have 10 or fewer historical ensemble members. For example, MPI-ESM1-2-HR is physically very similar to MPI-ESM1-2-LR, with the main difference being applying a higher resolution resulting in fewer simulated members, i.e., 10 instead of 30. Therefore, it is plausible that this model is also fit for purpose, but it was not run enough times to demonstrate that. The only exception to this rule is IPSL-CM6A, which, with 33 ensemble members, is more unlikely to have a plausible representation of the Amazonian vegetation dynamics.
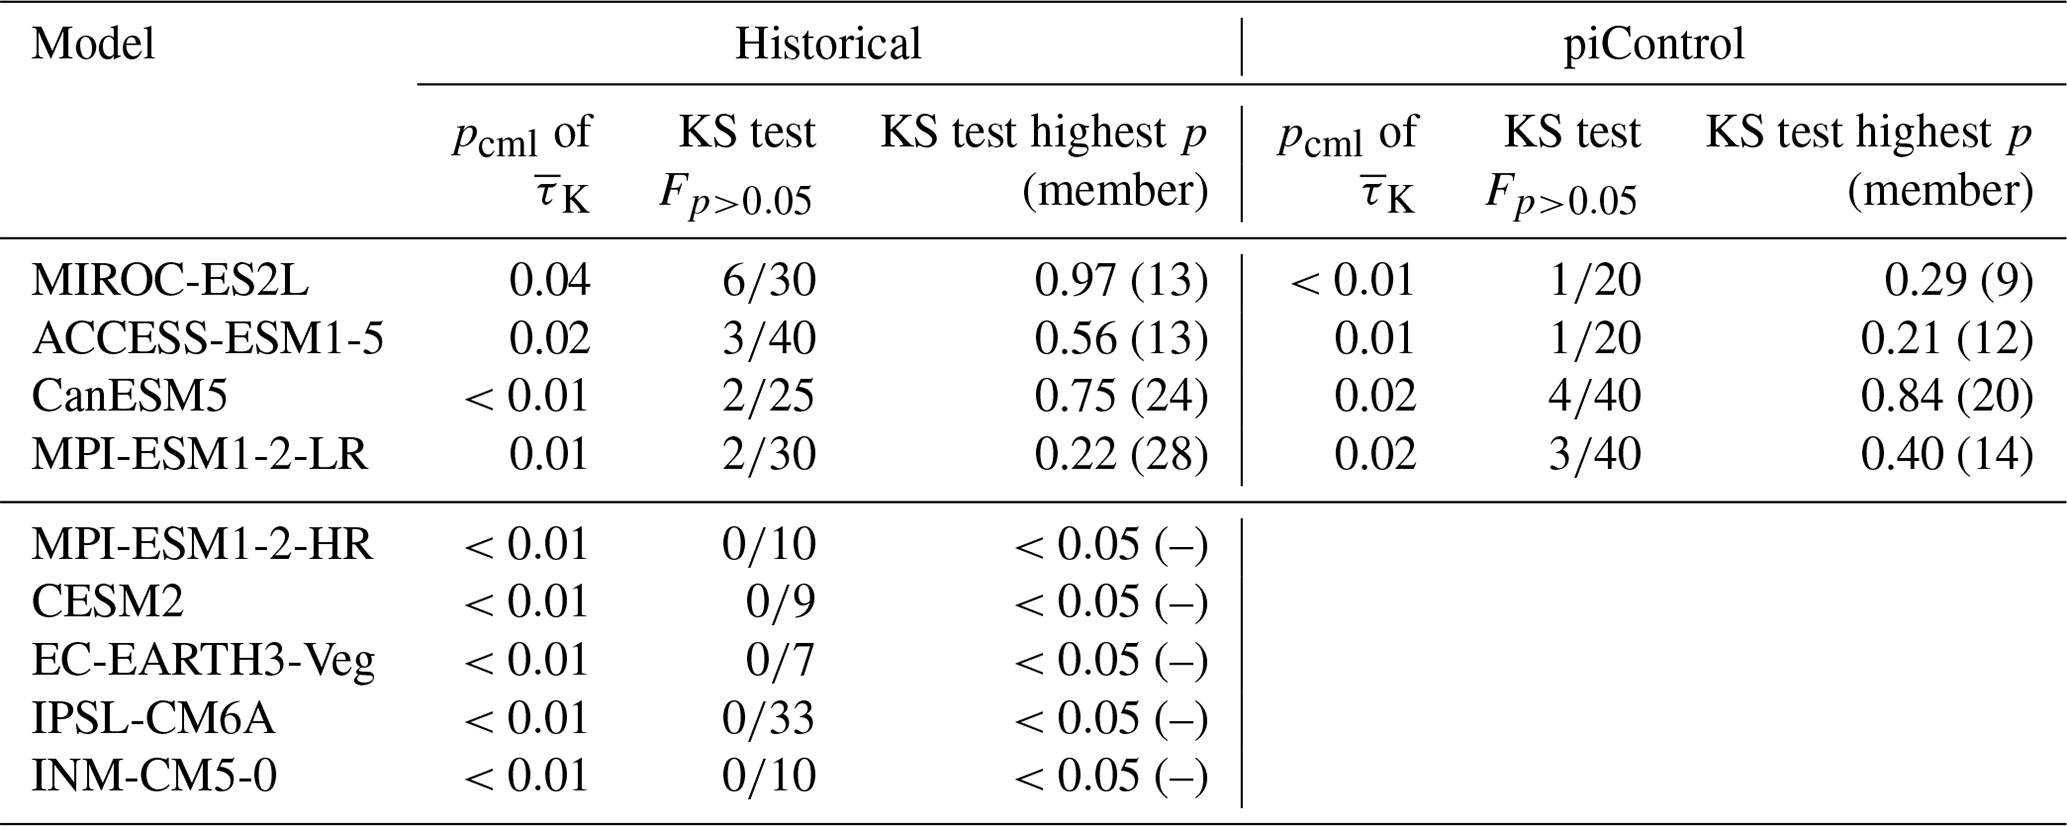
Table 2Observation percentiles pcml in the mean τK model distribution, the fraction of ensemble members Fp>0.05 that scored p>0.05 in the KS test, and highest KS test p value of each ensemble. The higher the p value, the more likely the member resembles the observations. pcml represents the fraction of the mean τK values of a model that are higher than the observational mean τK (see Fig. 4). Values are displayed for all nine historical ensembles and the control ensembles of the four well-agreeing historical ensembles. piControl ensembles are run under pre-industrial conditions. Ensembles that have good agreement have at least one member that does not significantly differ from the observations, according to the KS test.
Inspecting the Amazon mean trend of AR(1) for each of the ensemble members from the four models that passed the KS test, we find one model which displays a significant response to historical forcing (MIROC-ES2L; Fig. 4). To better show the shift between the pre-industrial control and historical simulations, we fit a bounded β distribution to the frequency distribution, and we use the α = 0.95 confidence interval to screen for significance. In all four models and for both simulations, the observed trend is on the edge of what is possible. In CanESM5, MPI-ESM1-2-LR, and ACCESS-ESM1-5, there is not a substantial difference between the forced and unforced simulations, but MIROC-ES2L shows a marked shift towards higher trends in the Amazon basin mean AR(1) when the model is exposed to historical boundary conditions.
We finally test the idea that an increasing AR(1) can be used as an early-warning signal of an eminent abrupt transition in the Amazon rainforest. This was done by inspecting the continuation of future projections of the two historical runs with largest positive and negative historical trends from MPI-ESM1-2-LR (Fig. 5). This is Shared Socioeconomic Pathway 5 with a radiative forcing of about 8.5 W m−2 at the end of the century (SSP5-8.5). Under this strong forcing future scenario, the model exhibits a slightly increasing trend in AR(1), along with a decreasing trend of LAI of on average −0.05 m2 m−2. Neither of the two extreme runs nor any other ensemble members exhibit an abrupt decline in LAI. In fact, we do not observe a regime shift in any of the other four models that passed the KS test. The linear deterioration of forest viability can be caused by a variety of factors including limited water availability or progressing land use change (Fig. A7). However, the changes induced by future forcing do not facilitate the bifurcation-like behavior of the system.
In this study, we have tested the idea that trends in the persistence of vegetation density anomalies can be used as an early-warning signal for the Amazonian rainforest. This is particularly concerning against the backdrop of a large observed trend since 1991, suggesting that the forest has undergone a pronounced loss of resilience (Boulton et al., 2022). The trend in the anomaly persistence is quantified through the lag-1-year correlation, AR(1).
To this end, we inspect simulations from nine Earth system model ensembles initialized with different initial conditions in 1850, such that variations within each ensemble are an expression of the internal variability simulated by that particular model. We find that four of the models have ensemble members that are statistically indistinguishable from the observed trend. Of the other models with 10 or fewer realizations, 4 did not have a matching realization, and 1 model with 33 realizations clearly underperformed. Of the four well-performing model ensembles, three of them also showed trends similar to the observations in their unforced control simulations. These results suggest that the observed trend could simply be an expression of the internal variability and that longer data records would be needed to show that the opposite is the case.
This result is further corroborated by the spatial distribution of the increasing trend in AR(1) in the model simulations. Here it is found that ensemble members with substantial positive or negative trends show these in relatively large regions but not necessarily in those regions with large anthropogenic deforestation. This suggests that such anomalies could be associated with large-scale weather events.
We finally check whether trends in AR(1) can be used as an early-warning signal by investigating the relationship between the recent past and the rainforest evolution in future strong warming scenario projections (SSP5-8.5). However, there is no such relationship, and furthermore, none of the future simulations exhibits rapid transitions.
It is worth noting that even if the results presented here suggest that the Amazon rainforest has not lost its resilience and is unlikely to undergo bifurcations in the future, it does not mean the forest is invulnerable to human-caused stresses from global warming, deforestation, and fires. On the contrary, the results presented here suggest that global warming, as a major historical and future forcing in models, plays a minor role in the observed rapid decline in rainforest extent. Mitigation strategies to limit future rainforest loss could therefore be most effective when focusing on other, human-induced stress factors.
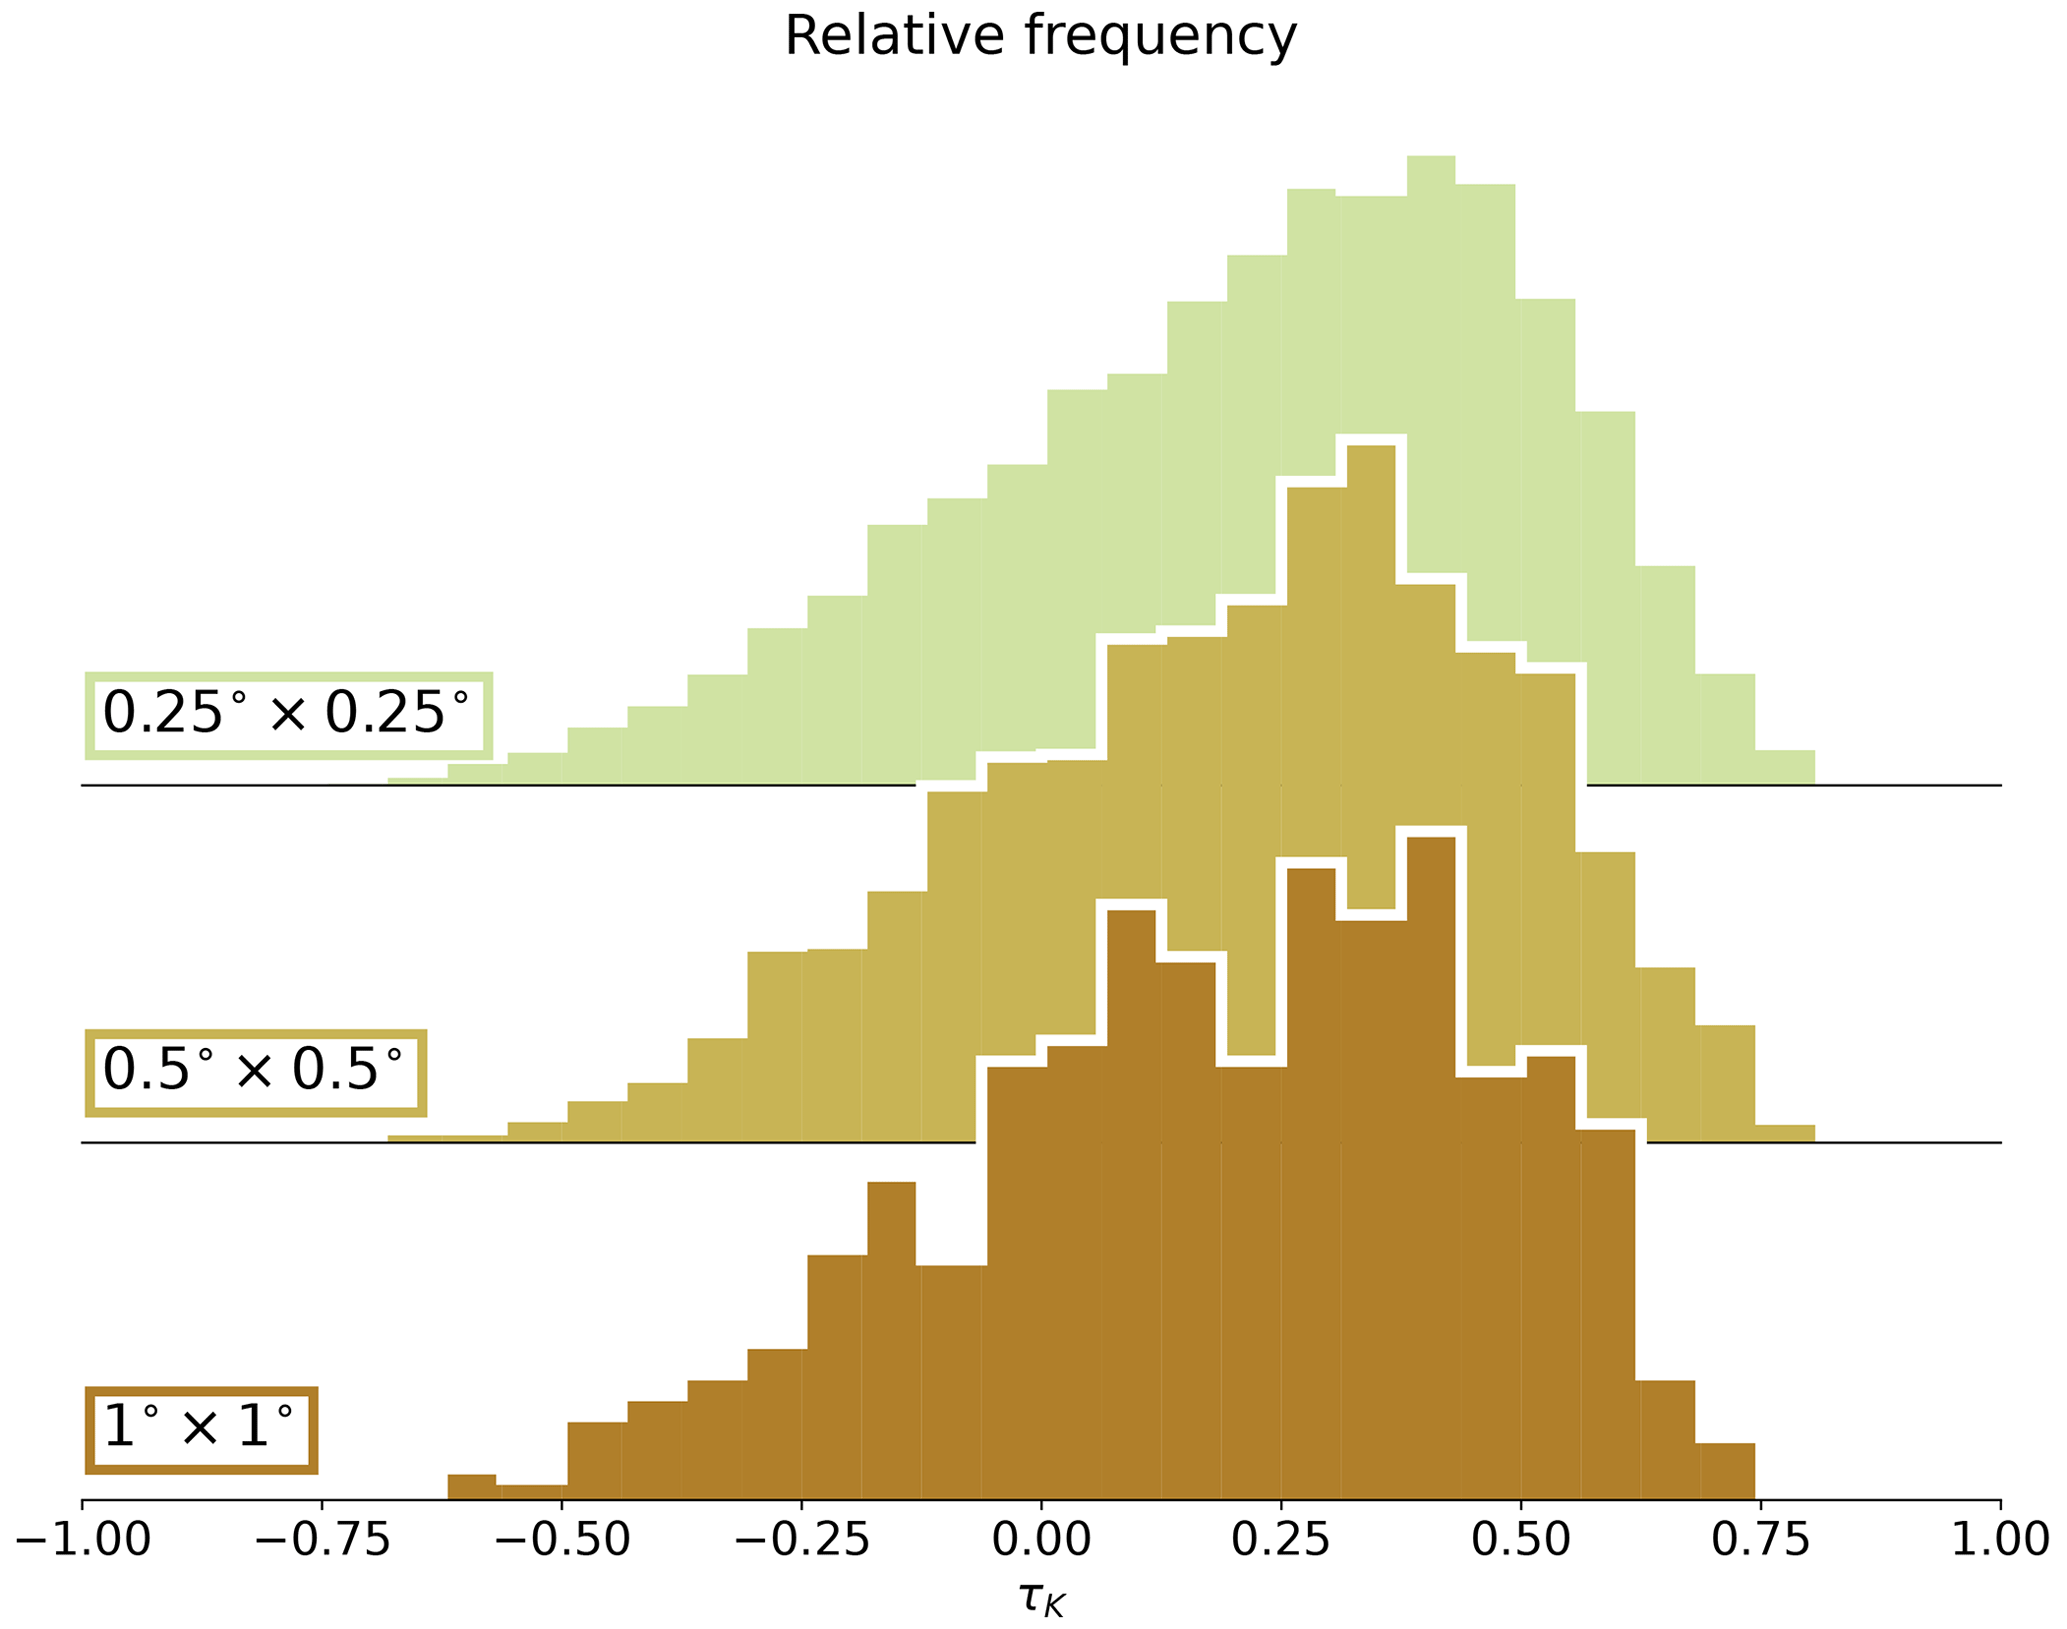
Figure A1Kendall's τK distributions for three different VOD resolutions (0.25°×0.25° original VODCA). The means of these histograms are, respectively, = 0.22, = 0.22, and = 0.21. We use the 1°×1° resolution for our analysis since it is the closest to the model resolutions.
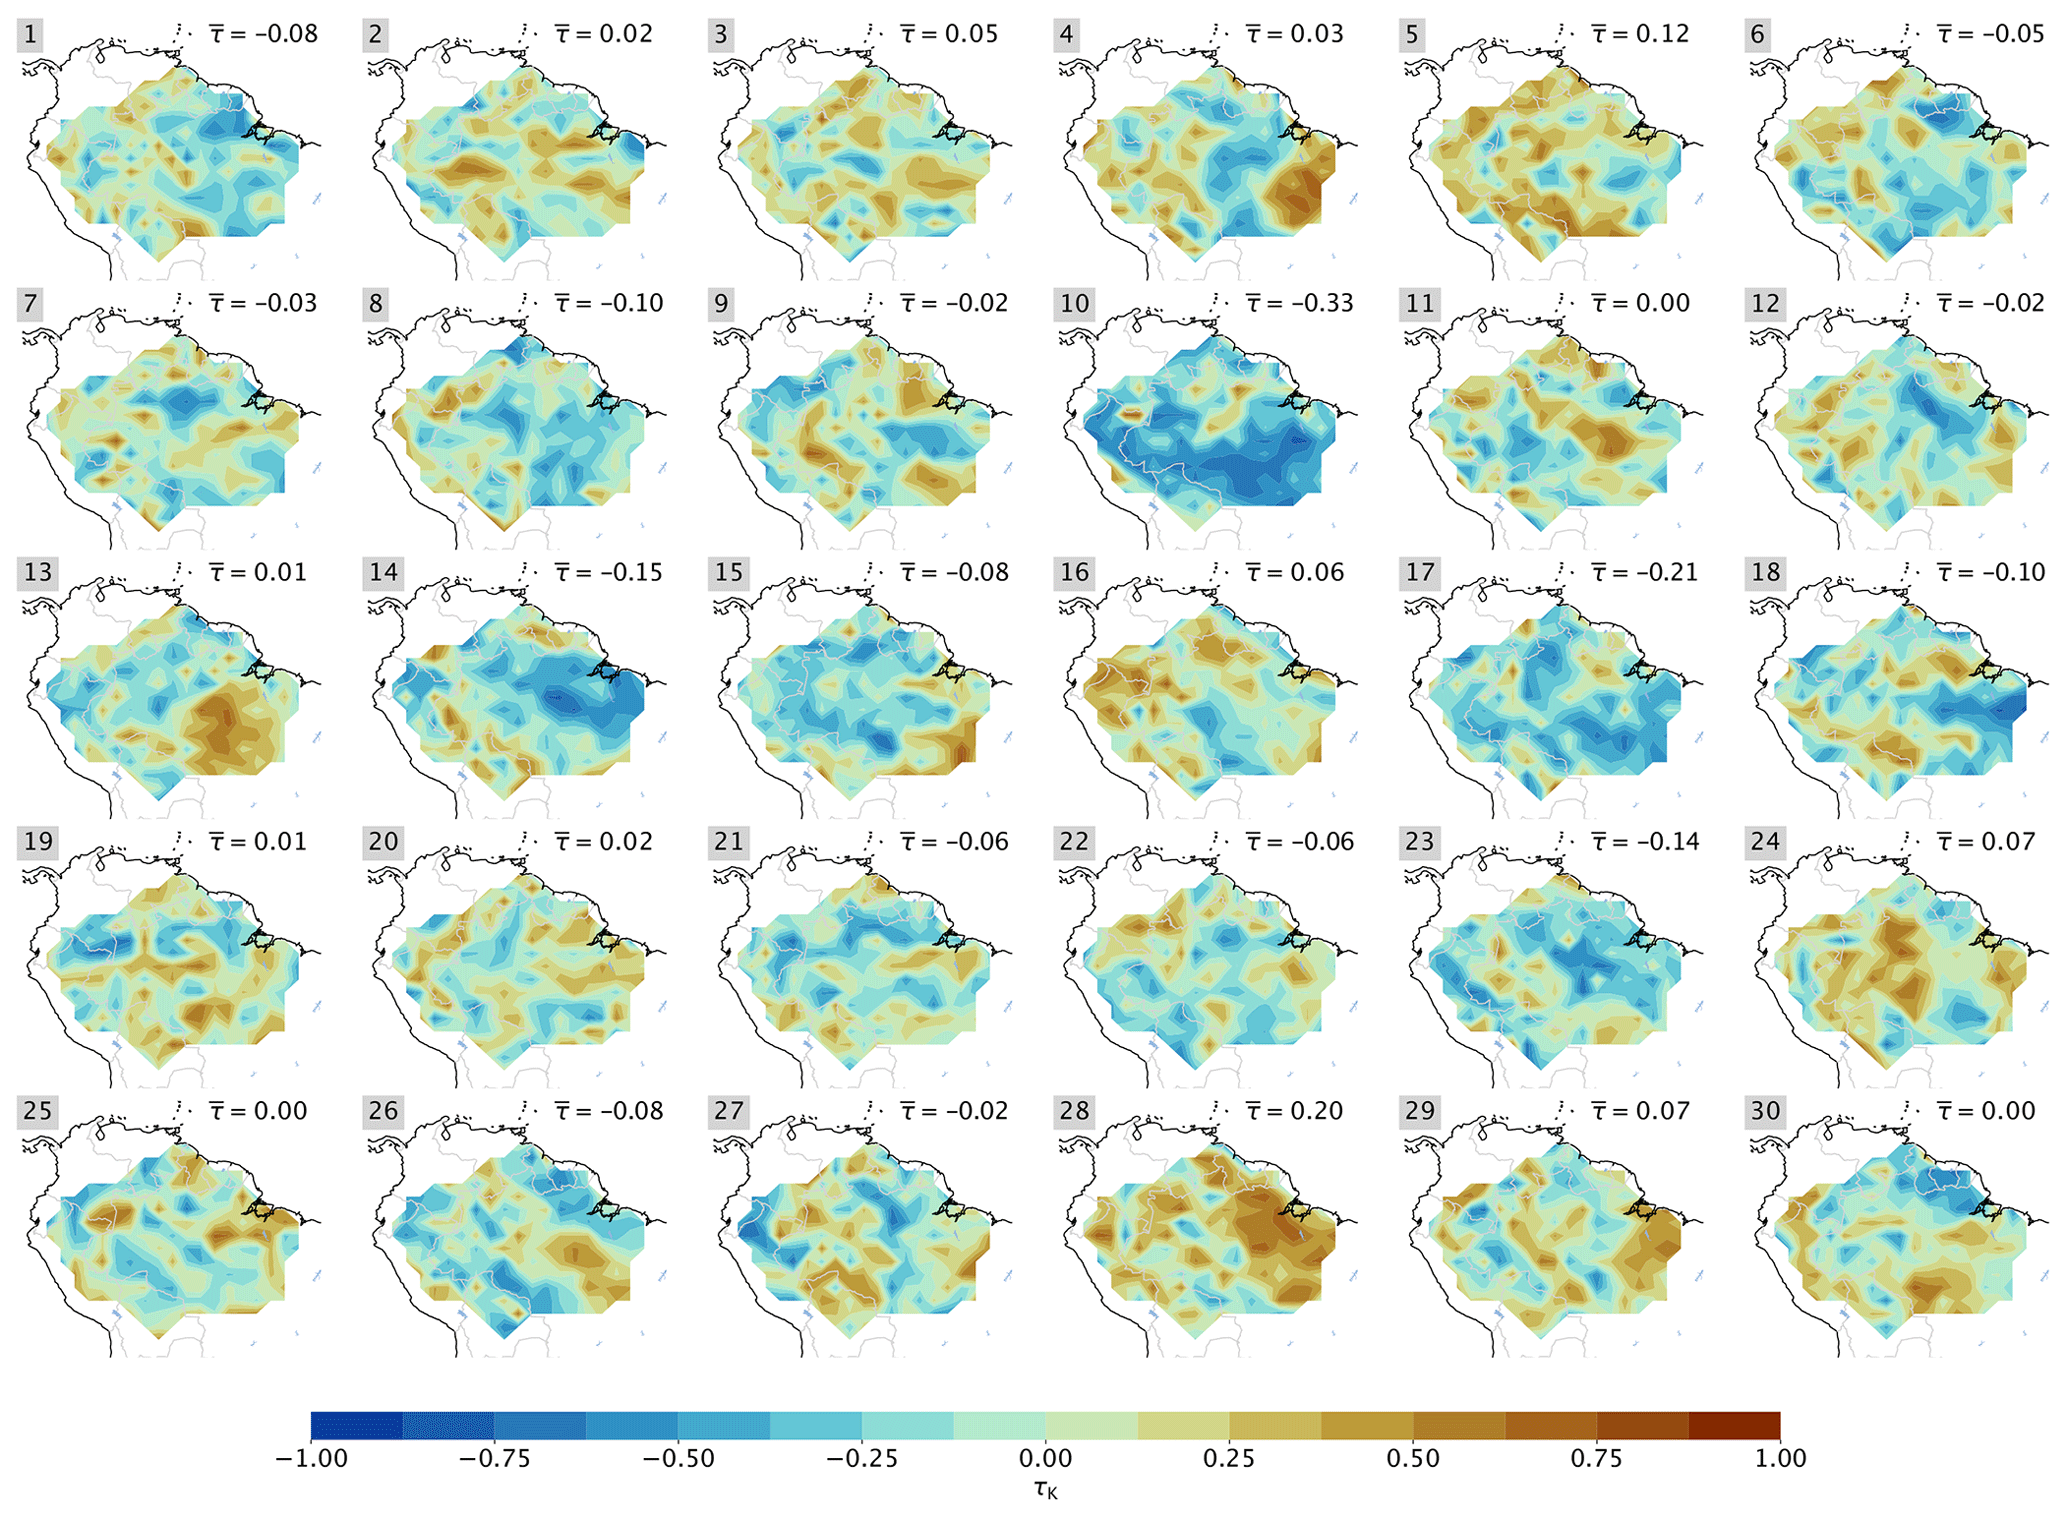
Figure A2Maps of τK of MPI-ESM1-2-LR members, according to Fig. 3. The spatial mean for each run is indicated, and the observational value is = 0.21 (resolution 1°×1°).
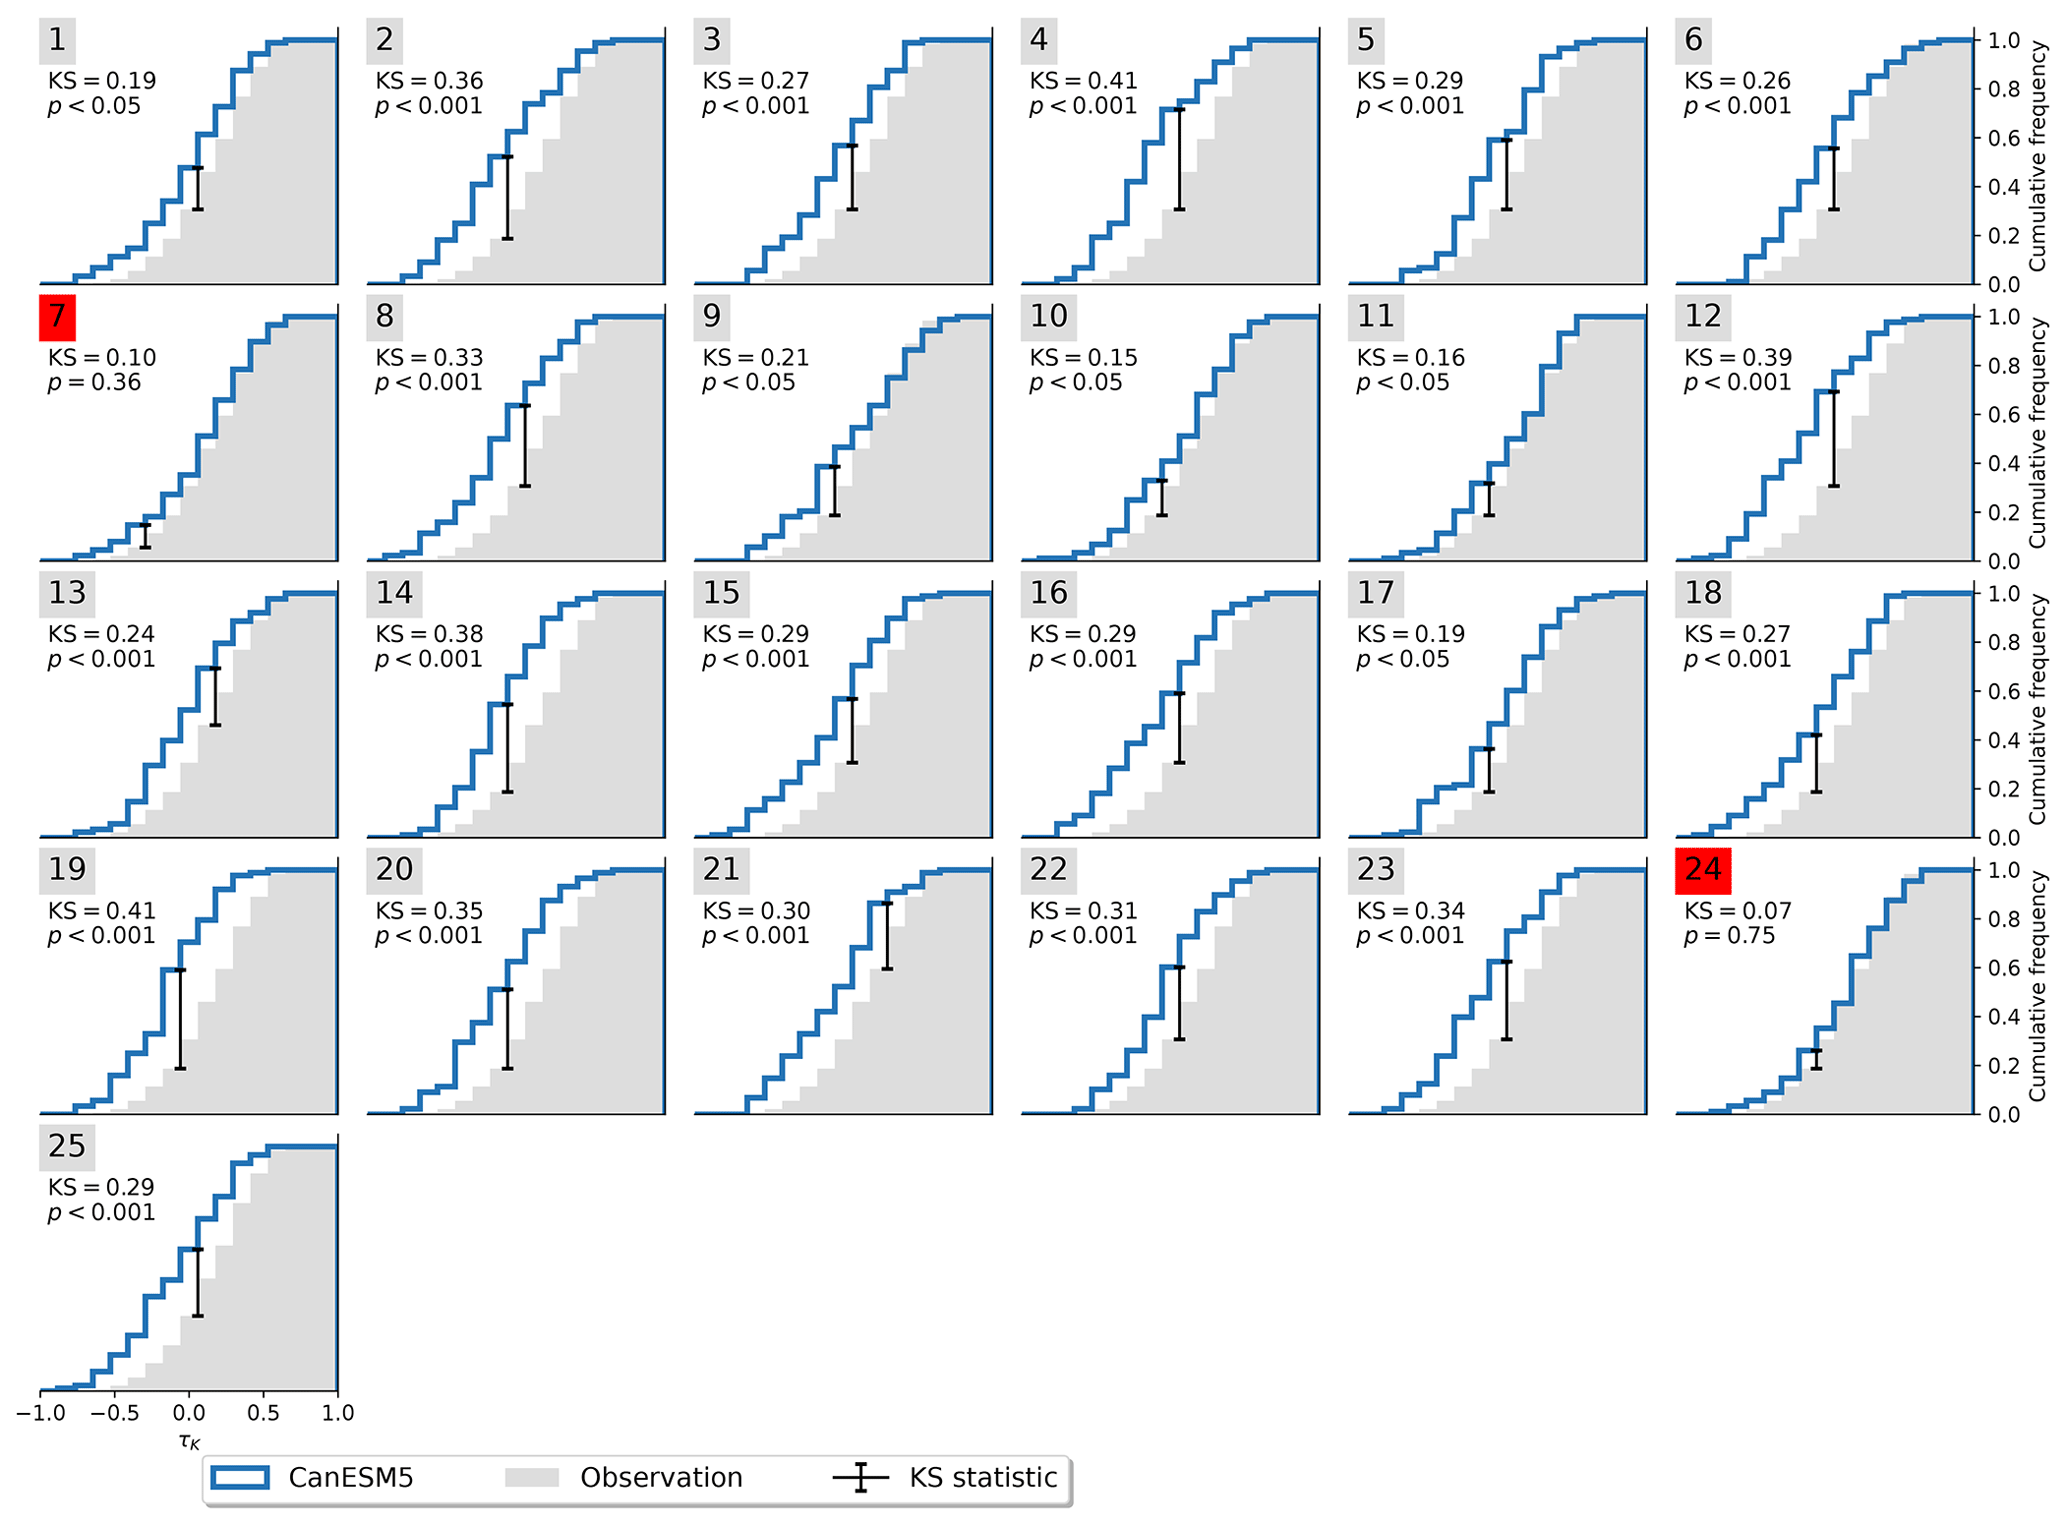
Figure A3Cumulative distribution functions of τK for observations and CanESM5. Significant resemblance (p>0.05) according to the KS test is marked in red.
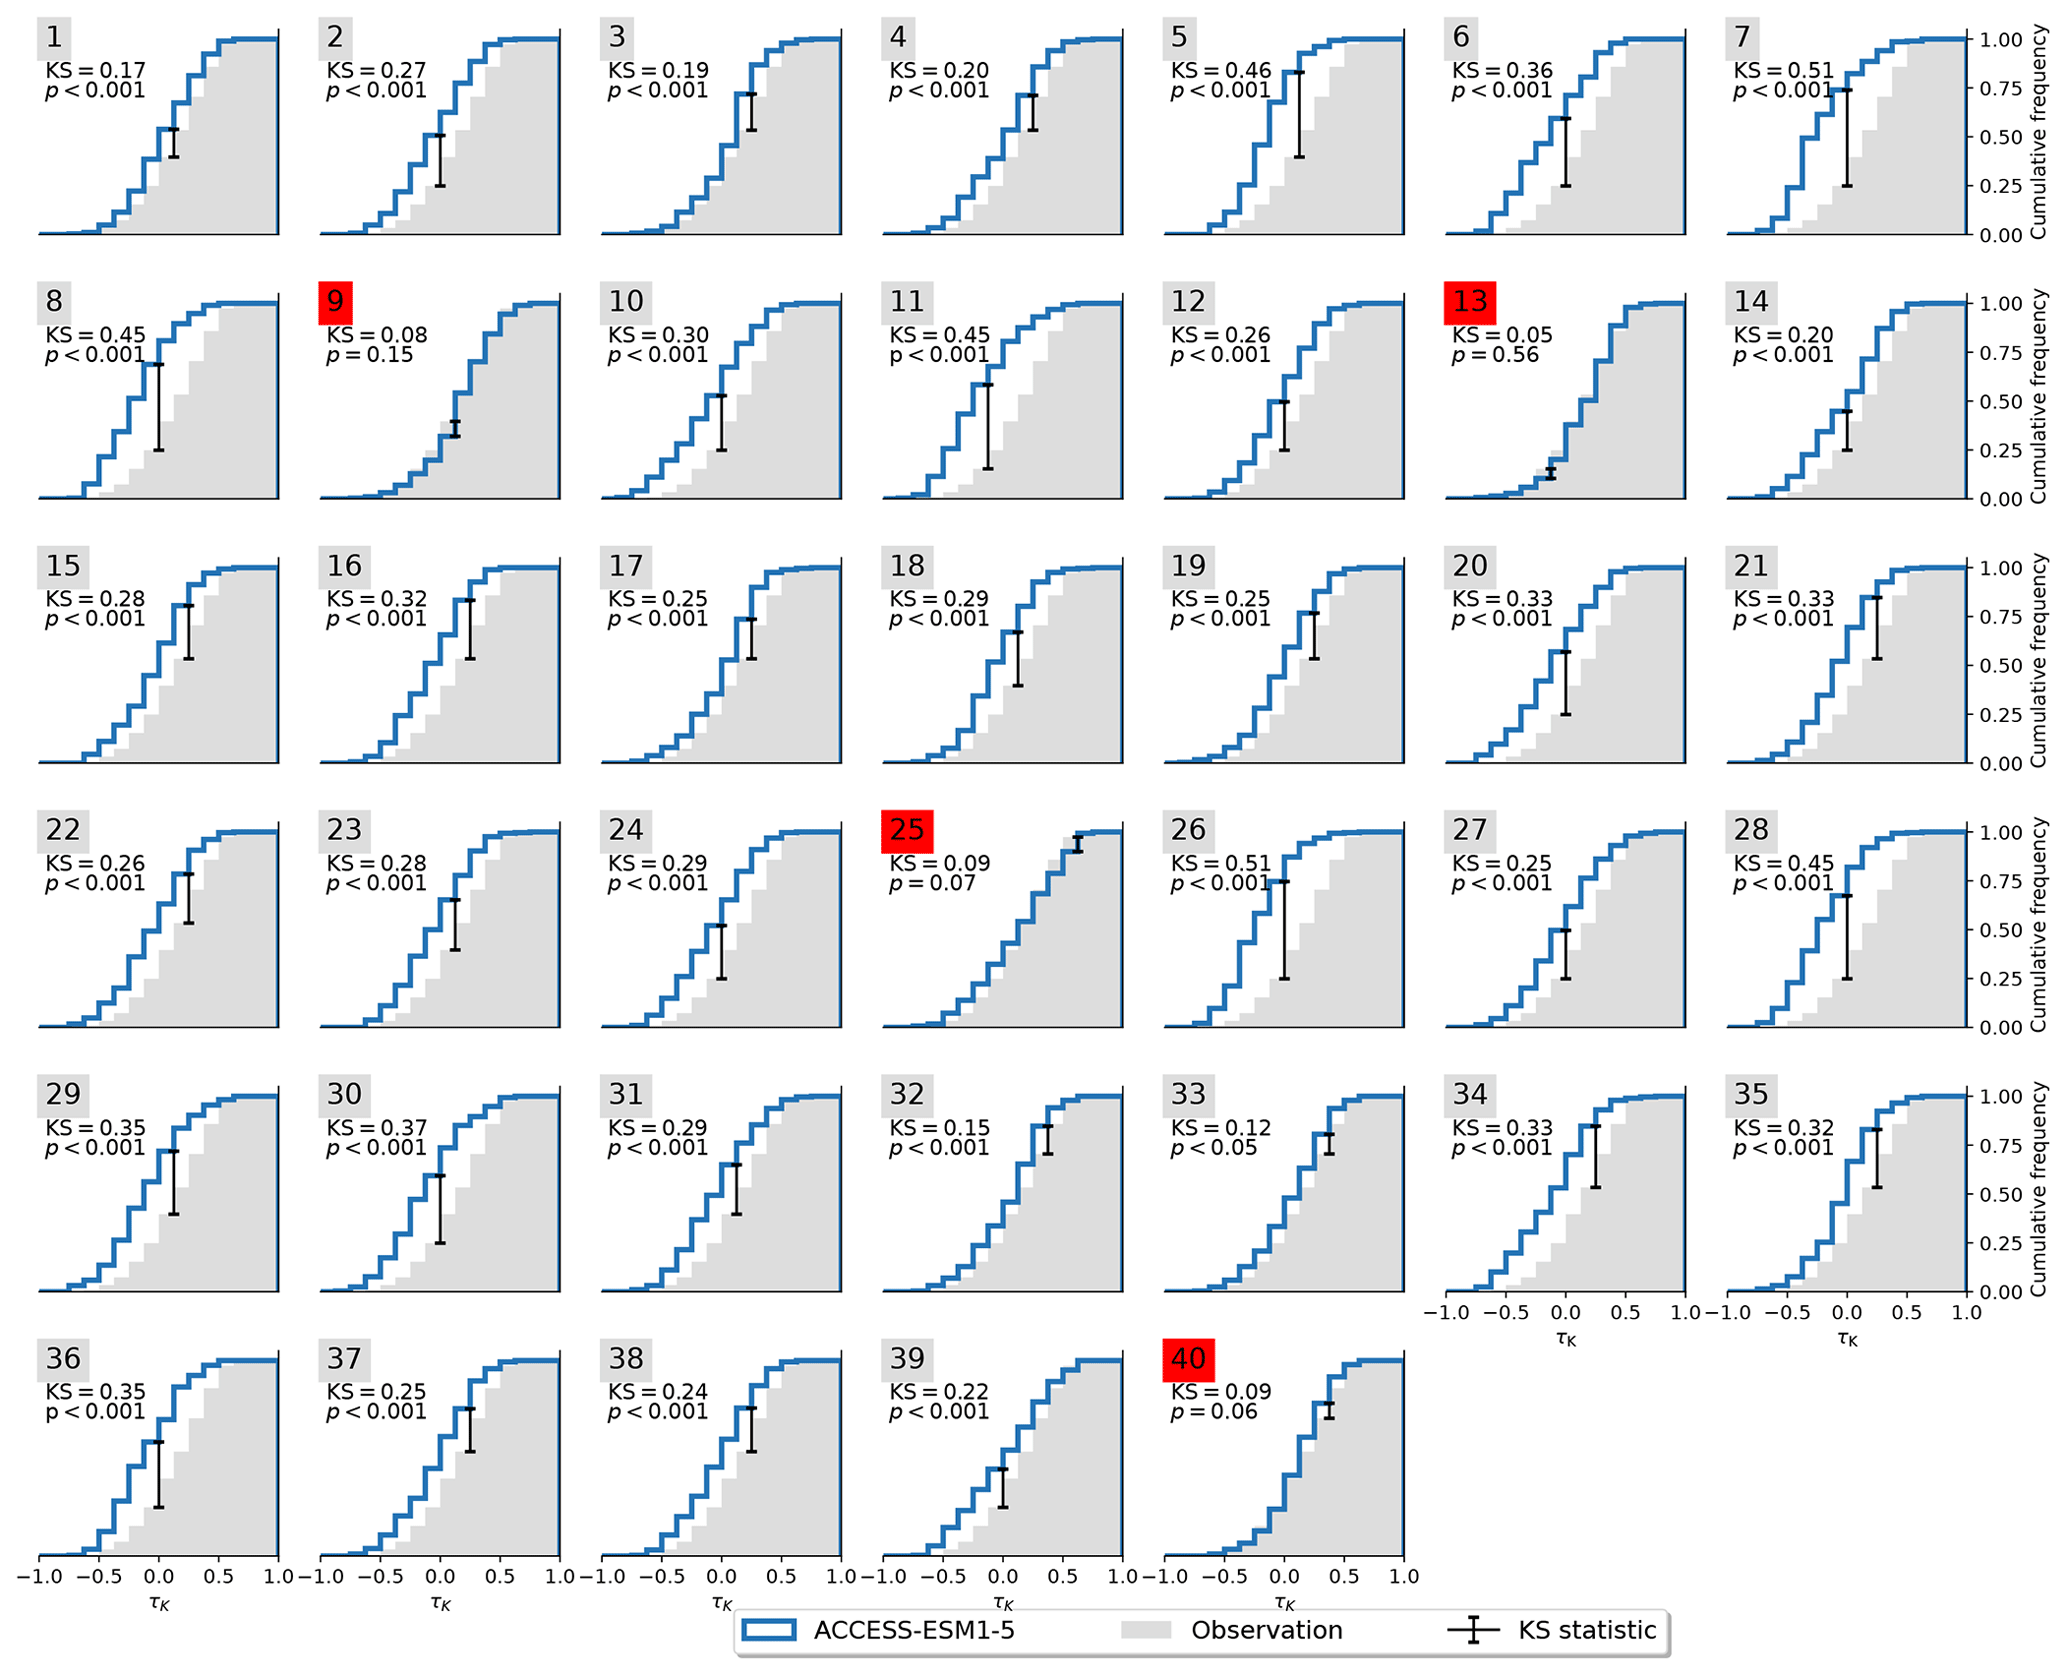
Figure A4Cumulative distribution functions of τK for observations and ACCESS-ESM1-5. Significant resemblance (p>0.05) according to the KS test is marked in red.
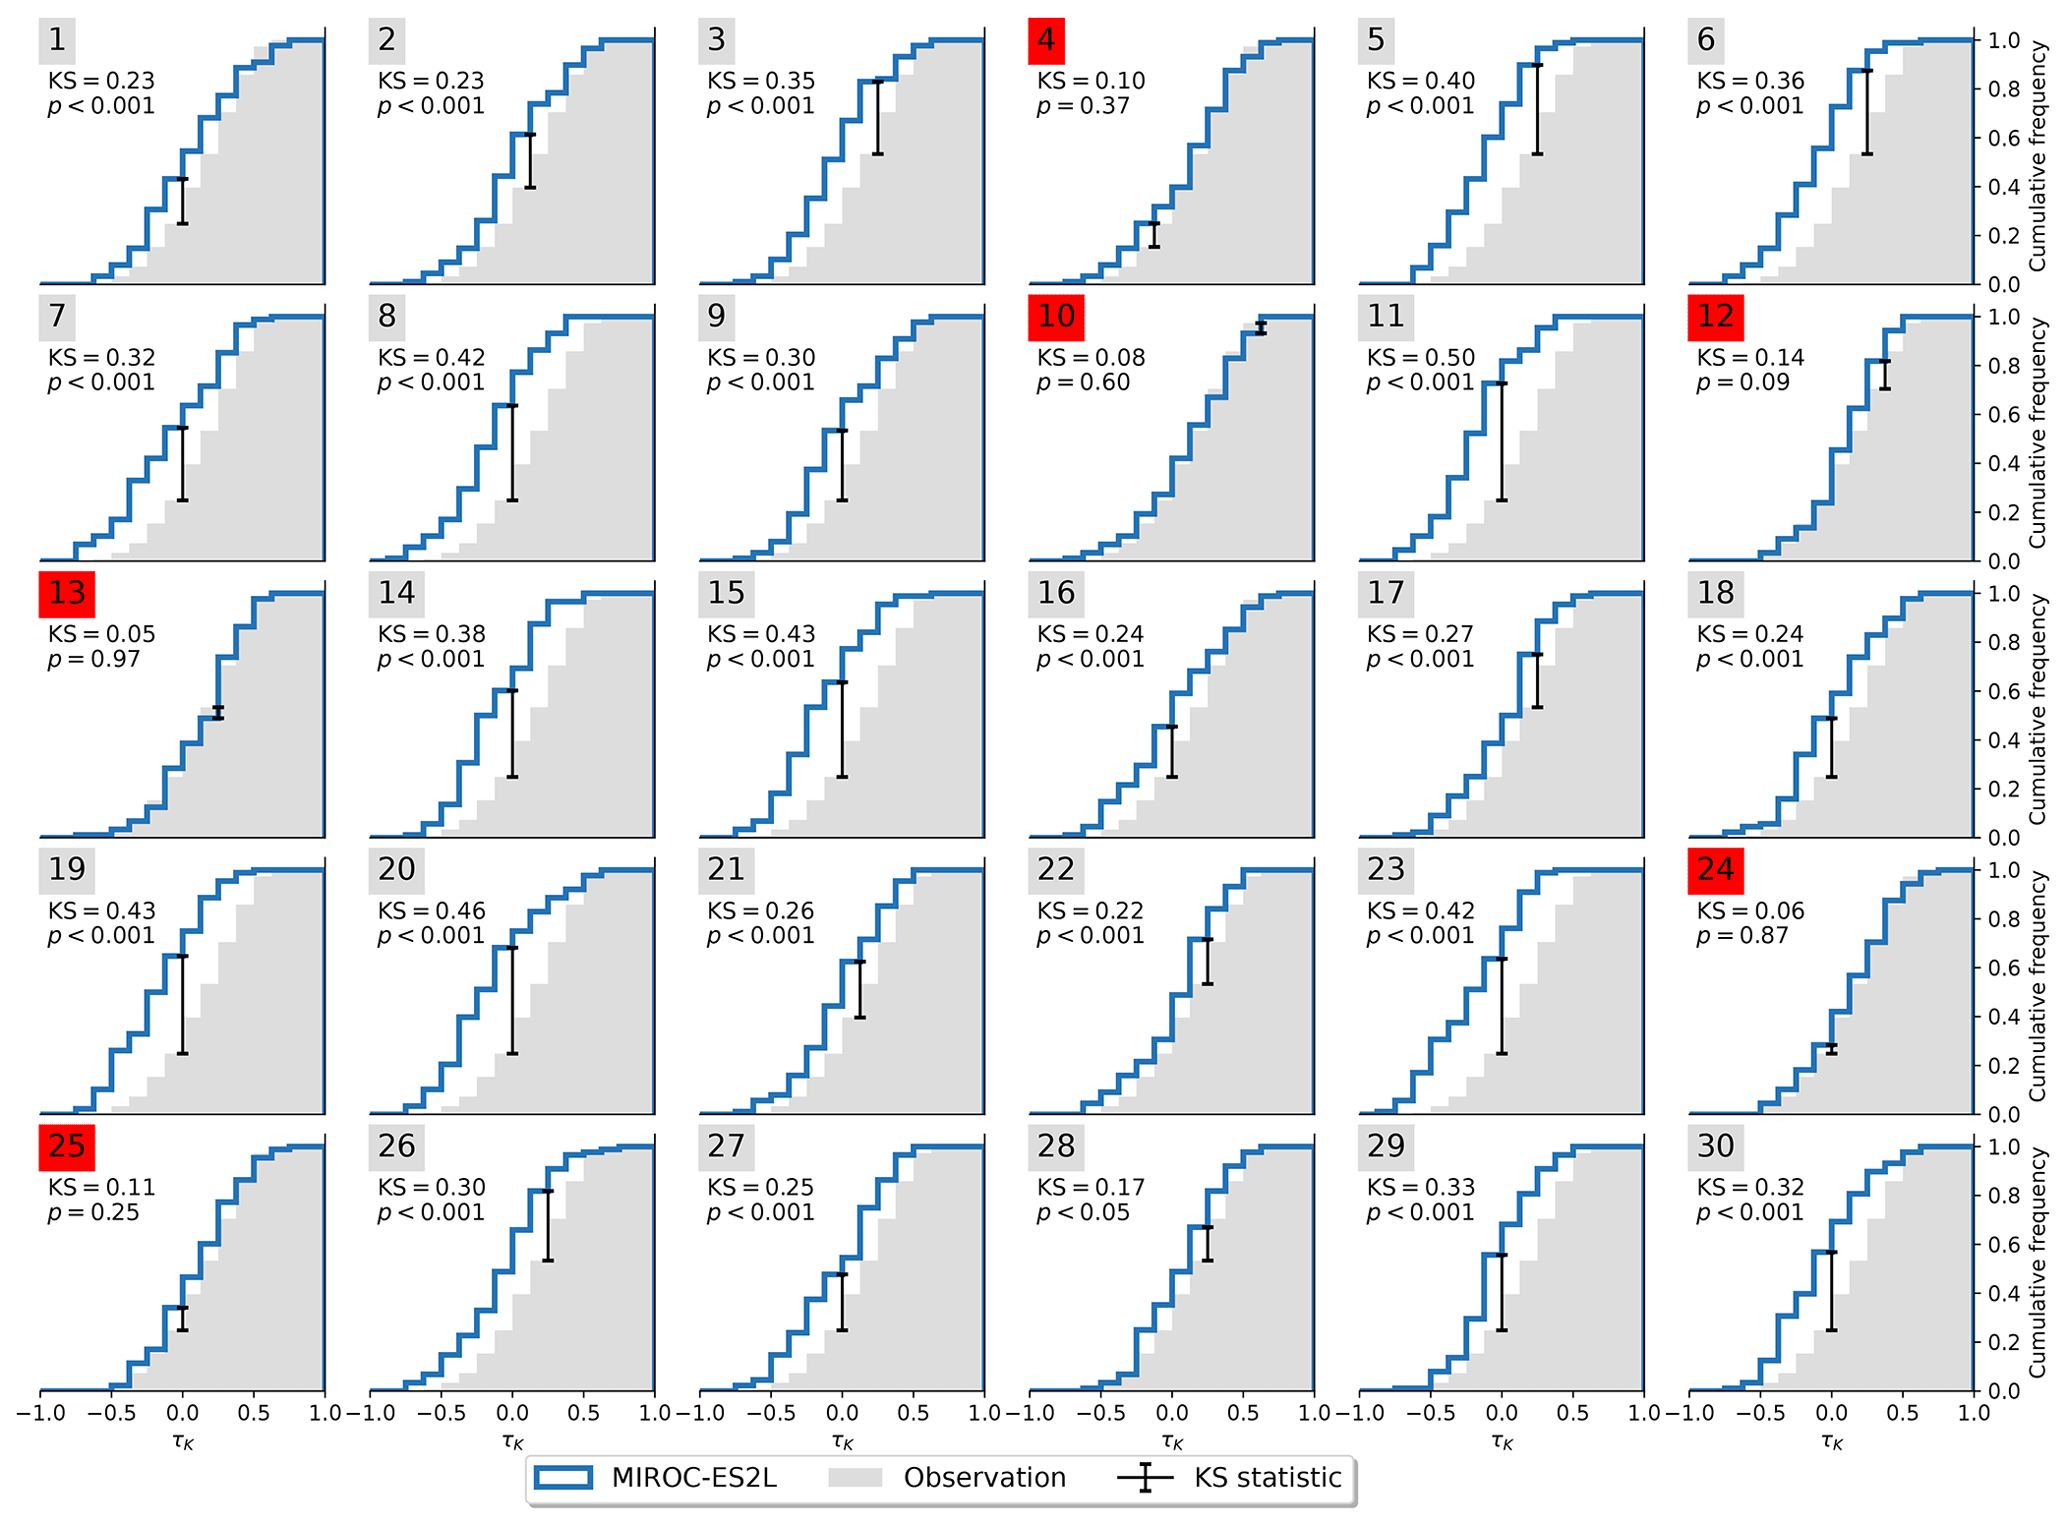
Figure A5Cumulative distribution functions of τK for observations and MIROC-ES2L. Significant resemblance (p>0.05) according to the KS test is marked in red.
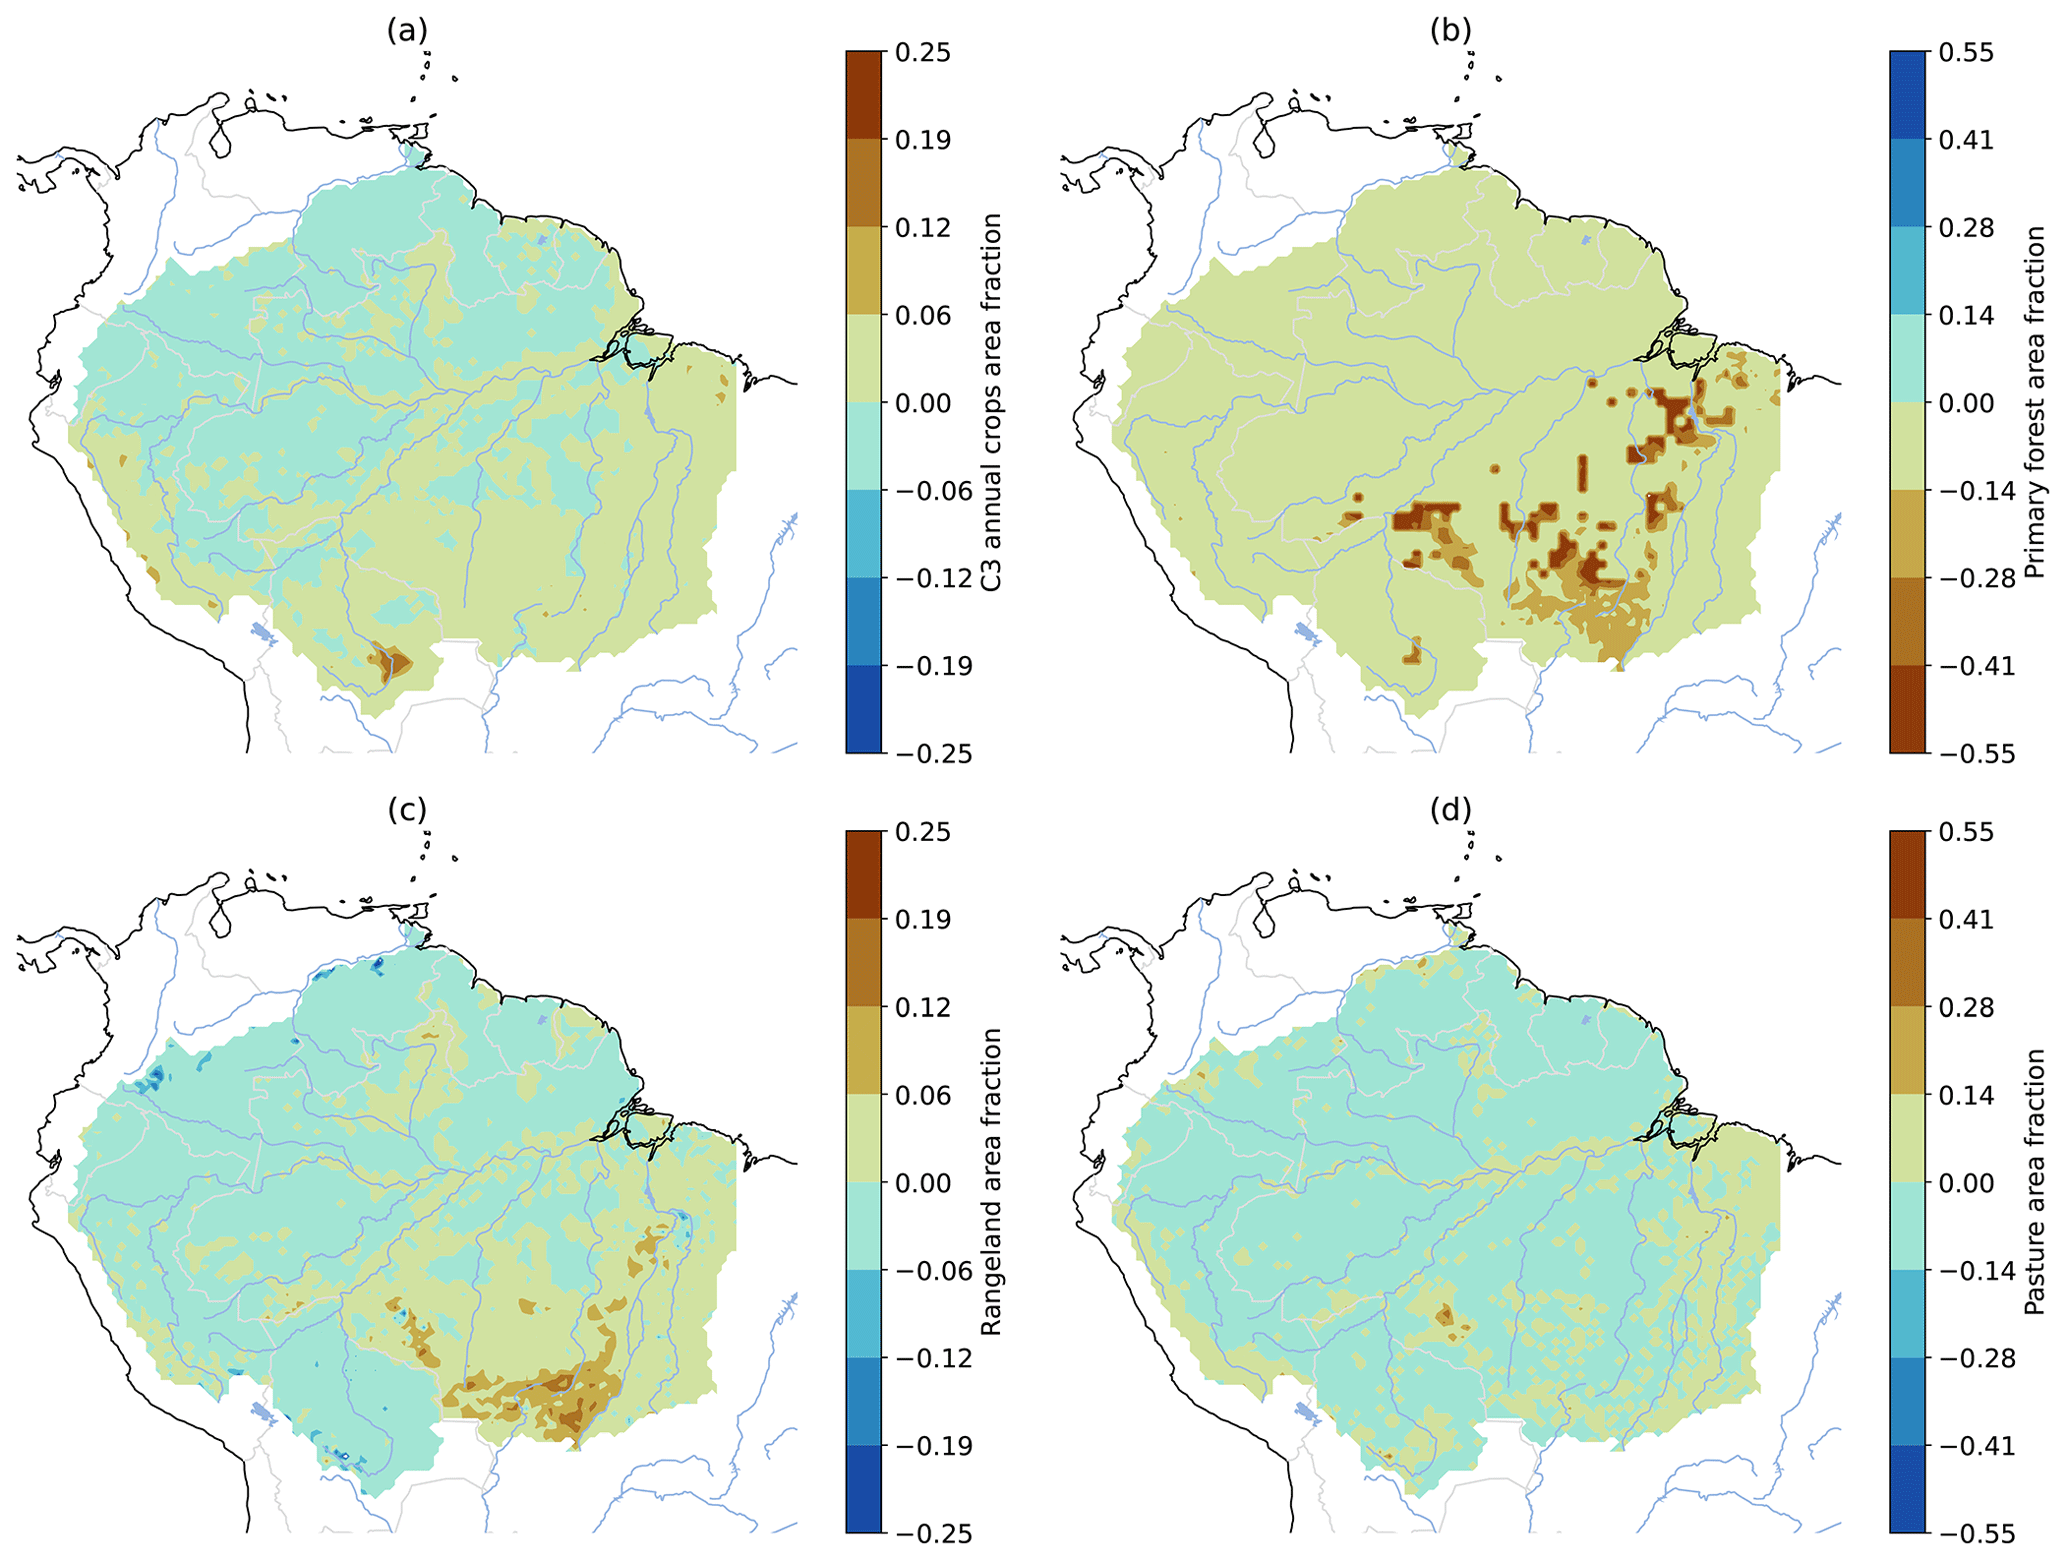
Figure A6LUCC difference between 2014 and 1990, as prescribed by LUH2 v2h (Hurtt et al., 2020), in CMIP6 models. (a) C3 annual crops (most small-seeded cereal crops), (b) primary forested land, (c) rangeland, and (d) pasture. Agricultural activity (a, c, d) increased particularly in the southeastern regions of the Amazon, while primary forested land (b) declined in the same areas.
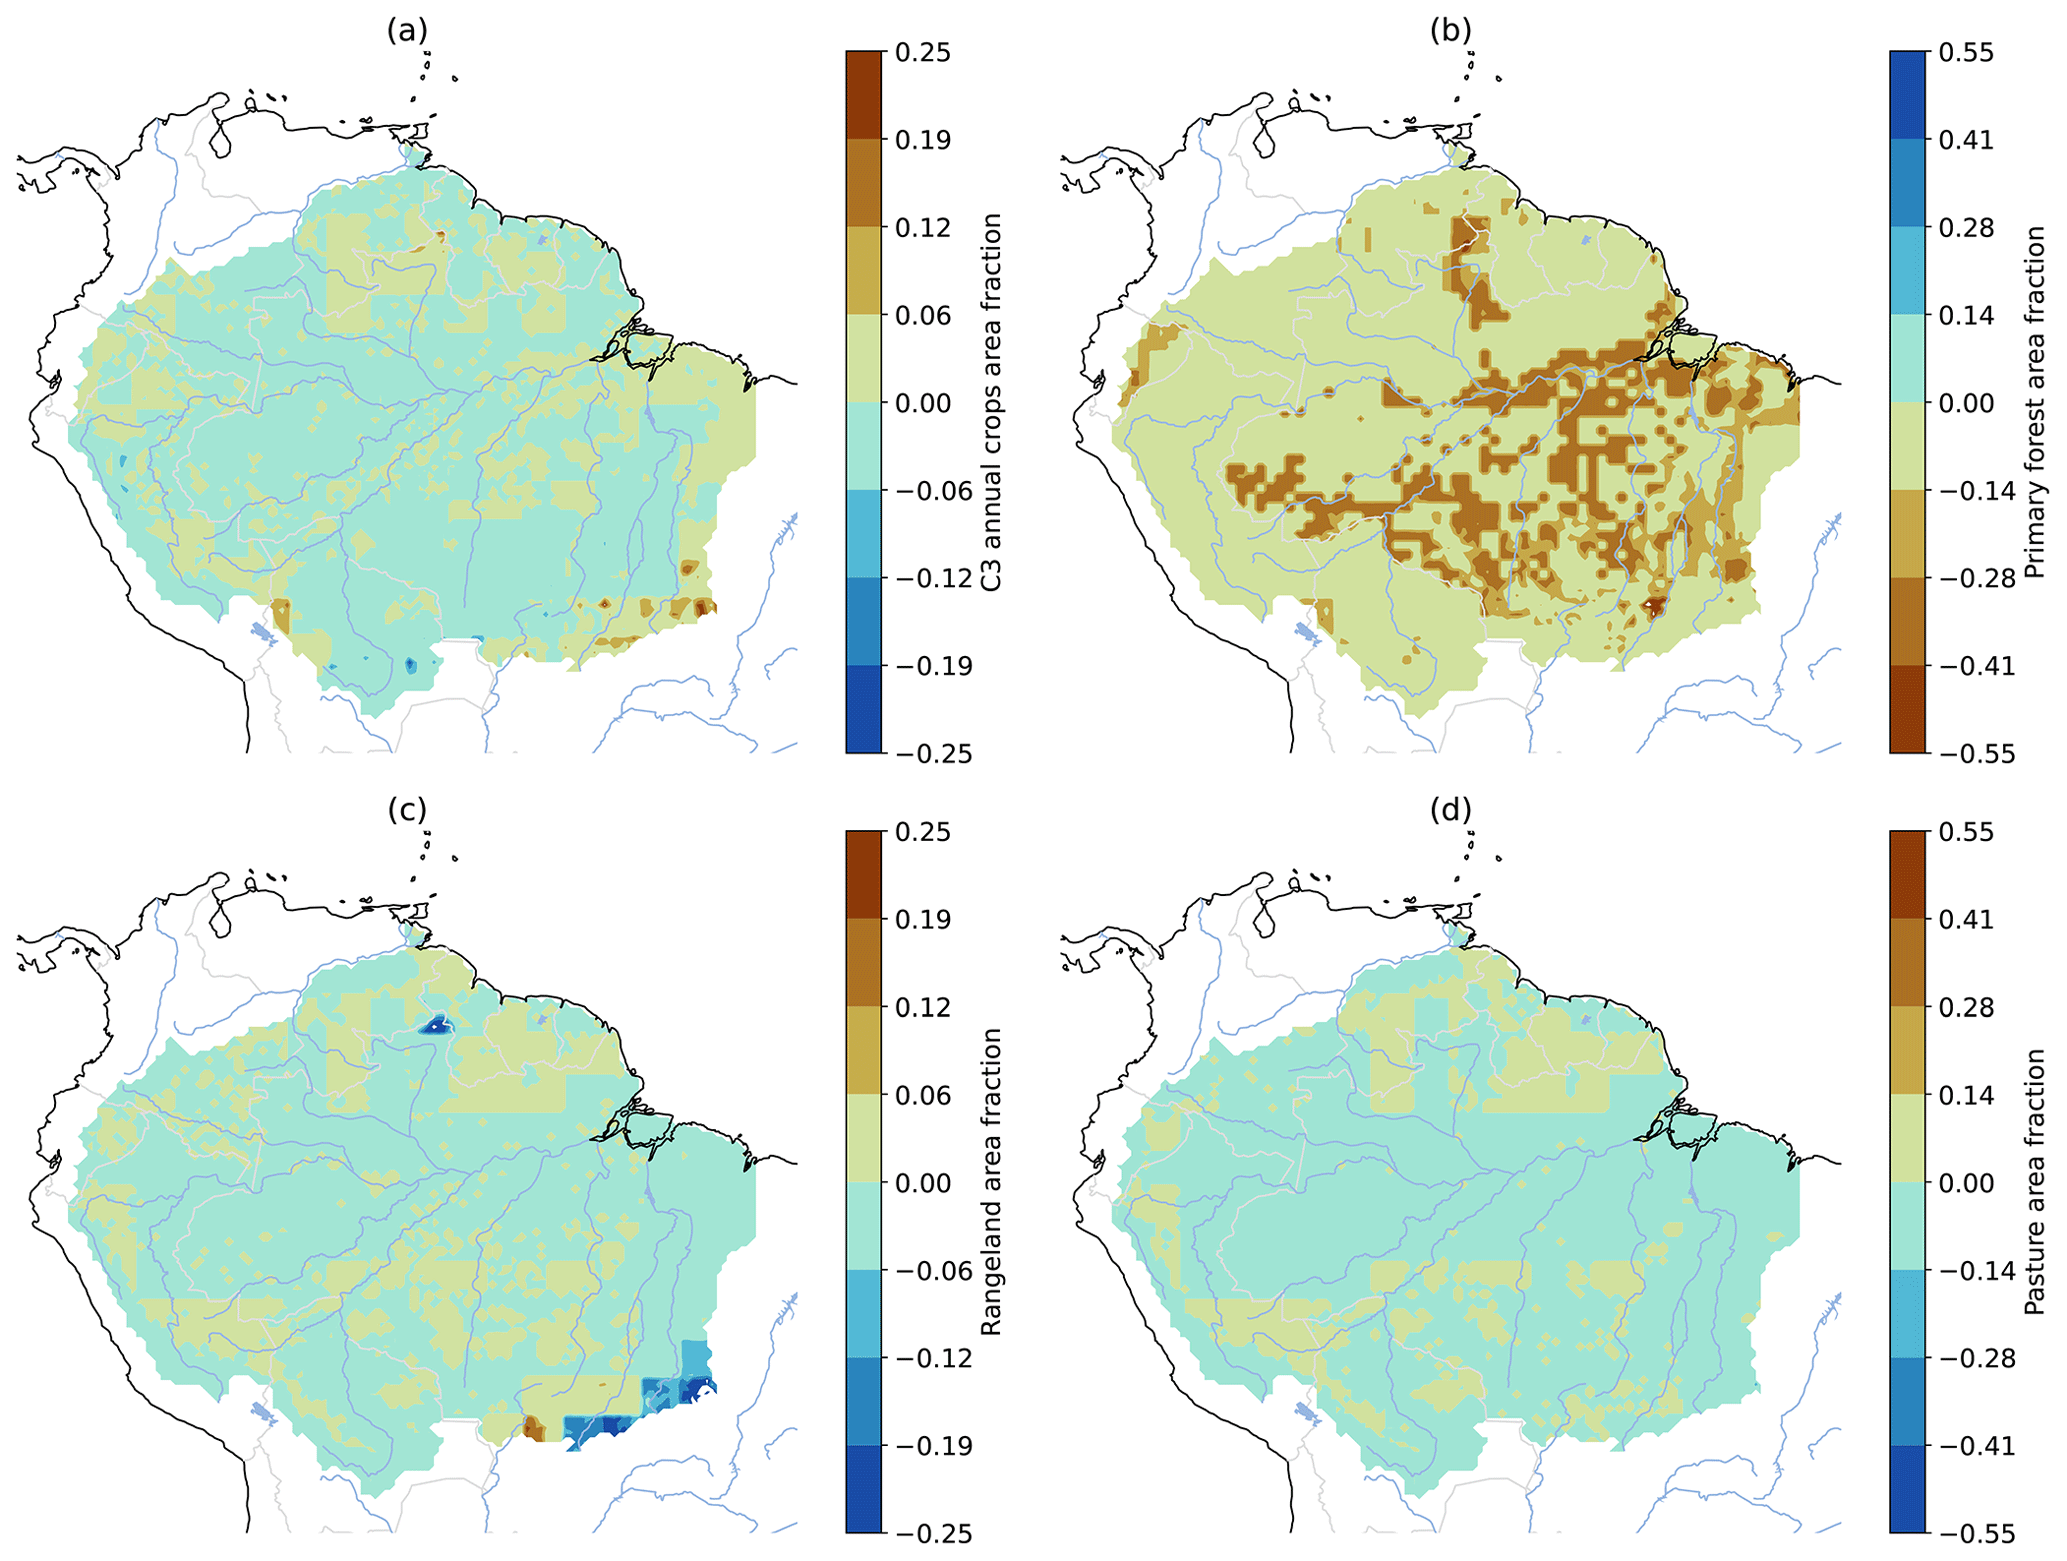
Figure A7LUCC difference between 2100 and 2015, as prescribed by LUH2 v2f SSP5 (Hurtt et al., 2020), in CMIP6 models. (a) C3 annual crops (most small-seeded cereal crops), (b) primary forested land, (c) rangeland, and (d) pasture. Particularly primary forested land reduction (b) effects increased in parts of the Amazon basin.
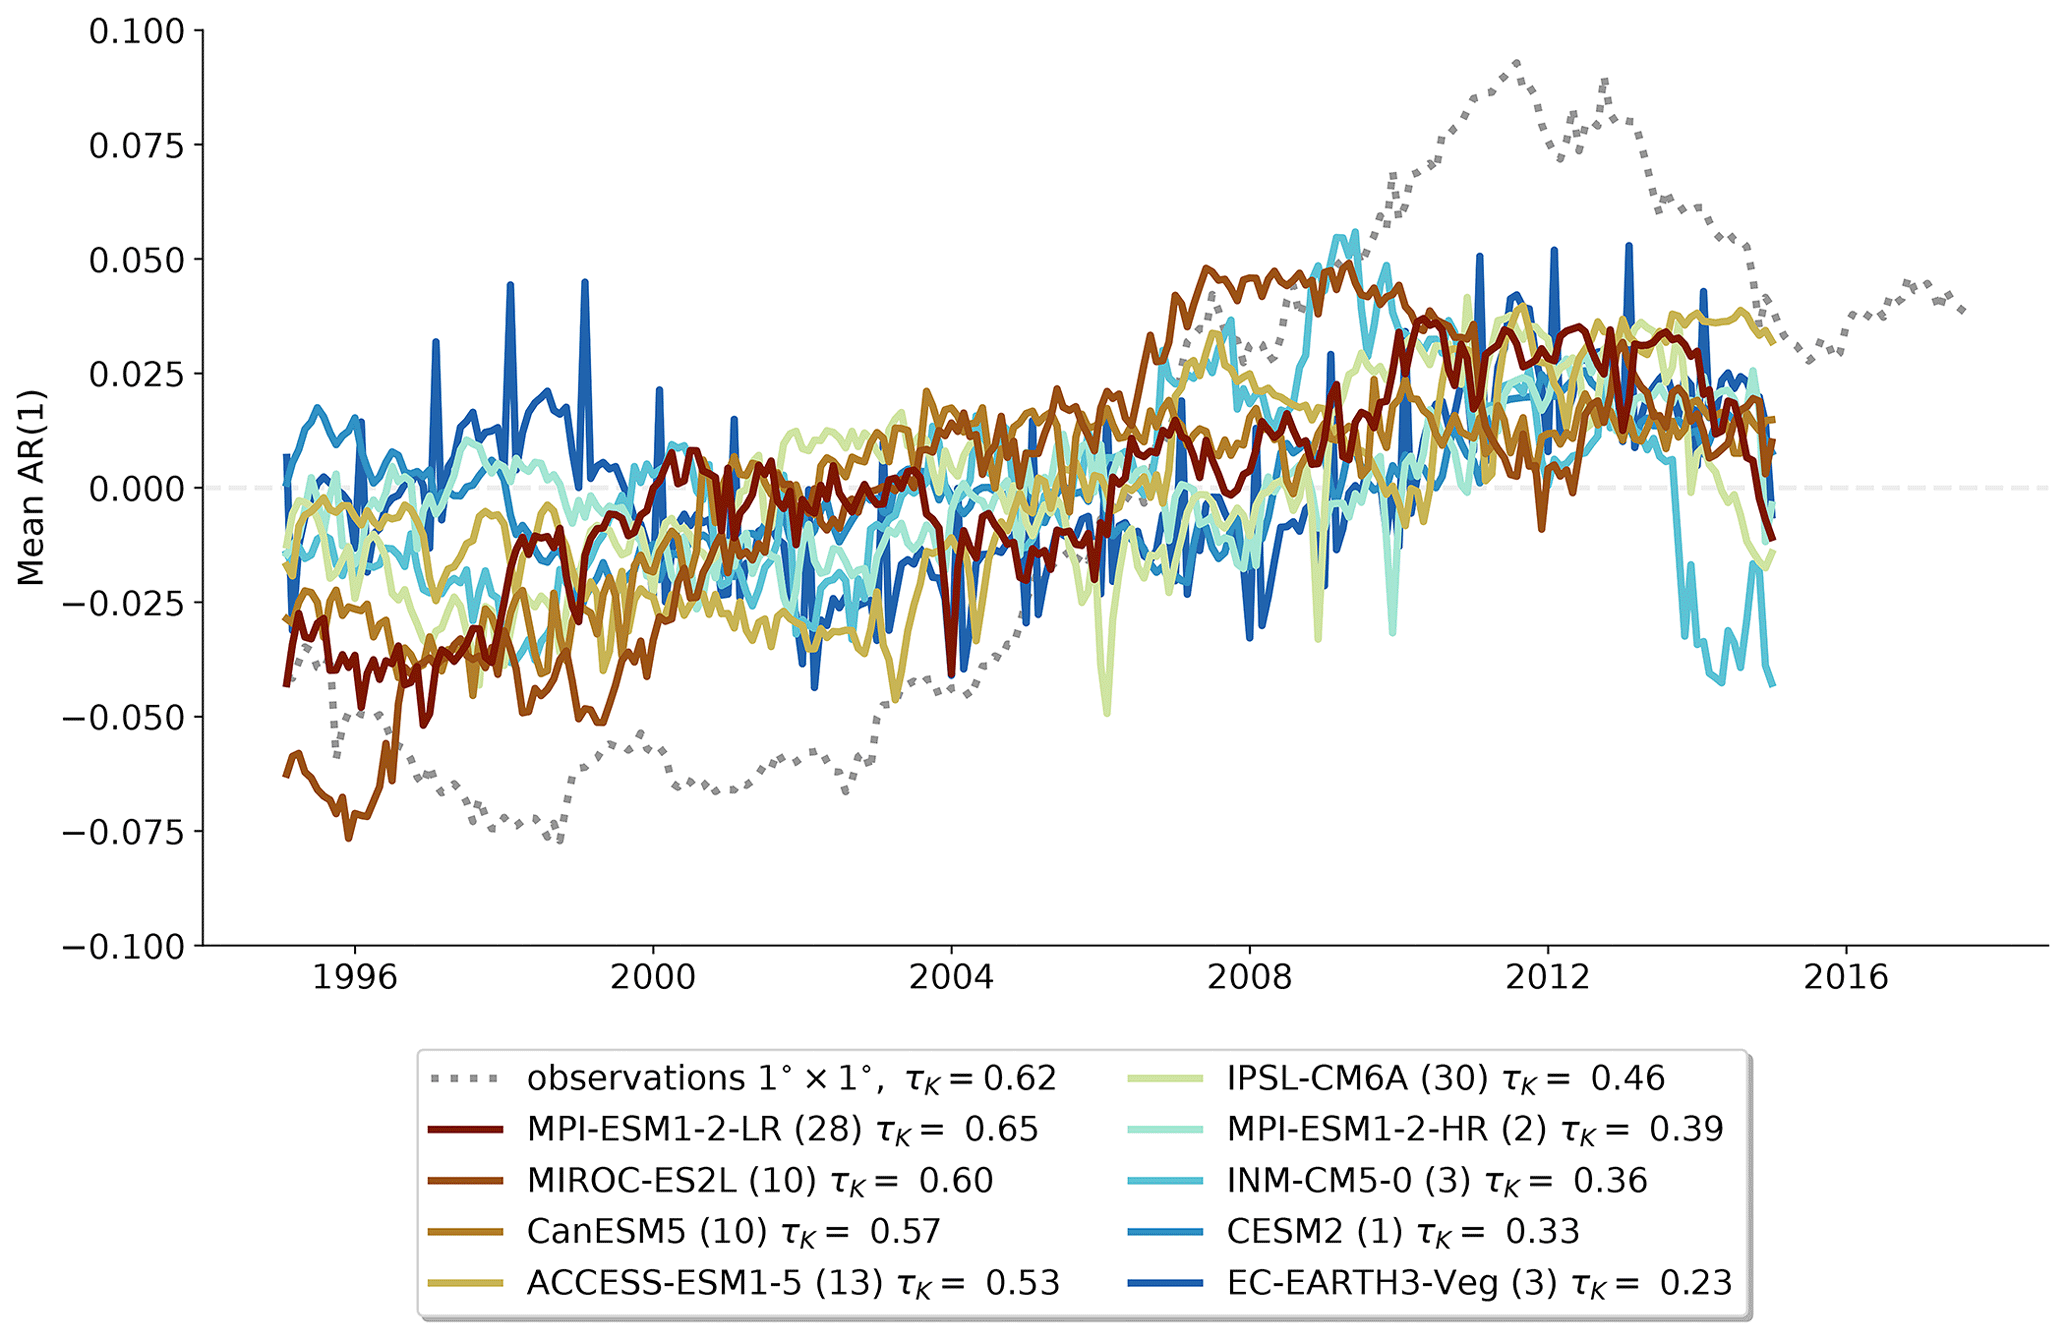
Figure A8Anomaly of the spatially averaged AR(1) series for observations and the best-agreeing member for each historical ensemble. The anomaly is computed by subtracting the temporal mean from the time series and is plotted at the end of the 5-year sliding window. The best-agreeing member is shown in parentheses behind the model (the member number shown here agrees with the realization number of the CMIP6 variant ID) and chosen according to its trend statistic τK.
The data of the CMIP6 models can be downloaded from the Earth System Grid Federation (ESGF) portal of the German Climate Computing Centre (DKRZ) at https://esgf-node.llnl.gov/projects/cmip6/ (last access: 15 May 2023, CMIP6_database, 2021). The observational VOD data are available at https://doi.org/10.5281/zenodo.2575599 (Moesinger et al., 2019, last access: 18 March 2023). Land use and land cover data can be found at https://luh.umd.edu/data.shtml (last access: 21 April 2023, LUH2_database, 2016). The outlines of the Amazon rainforest are taken from RAISG https://www.raisg.org/en/maps (last access: 10 March 2023, RAISG_data, 2023).
RG carried out the analysis and drafted the paper with inputs from MR and TM. All authors contributed to the study.
The contact author has declared that none of the authors has any competing interests.
Publisher’s note: Copernicus Publications remains neutral with regard to jurisdictional claims made in the text, published maps, institutional affiliations, or any other geographical representation in this paper. While Copernicus Publications makes every effort to include appropriate place names, the final responsibility lies with the authors.
We acknowledge the World Climate Research Program, which is in charge of the Coupled Model Intercomparison Project (CMIP), and we thank the climate modeling groups (listed in Table 1 in Sect. 2) for producing and publishing their model output. We also acknowledge Moesinger et al. (2020) for creating the global long-term VOD Climate Archive (VODCA) and making their data available.
This research has been supported by the European Research Council, FP7 Ideas: European Research Council (grant no. 770765), the European Research Council, H2020 European Research Council (grant nos. 820829 and 101003470), and the Swedish Research Council (VR; grant no. 2022-03262).
The publication of this article was funded by the Swedish Research Council, Forte, Formas, and Vinnova.
This paper was edited by Kira Rehfeld and reviewed by two anonymous referees.
Berger, V. W. and Zhou, Y.: Kolmogorov–Smirnov Test: Overview, in: Wiley StatsRef: Statistics Reference Online, John Wiley & Sons, Ltd., ISBN 978-1-118-44511-2, https://onlinelibrary.wiley.com/doi/abs/10.1002/9781118445112.stat06558 (last access: 6 August 2023), 2014. a
Boers, N. and Rypdal, M.: Critical slowing down suggests that the western Greenland Ice Sheet is close to a tipping point, P. Natl. Acad. Sci. USA, 118, e2024192118, https://doi.org/10.1073/pnas.2024192118, 2021. a
Boers, N., Marwan, N., Barbosa, H. M. J., and Kurths, J.: A deforestation-induced tipping point for the South American monsoon system, Sci. Rep., 7, 41489, https://doi.org/10.1038/srep41489, 2017. a, b
Boucher, O., Servonnat, J., Albright, A. L., Aumont, O., Balkanski, Y., Bastrikov, V., Bekki, S., Bonnet, R., Bony, S., Bopp, L., Braconnot, P., Brockmann, P., Cadule, P., Caubel, A., Cheruy, F., Codron, F., Cozic, A., Cugnet, D., D'Andrea, F., Davini, P., de Lavergne, C., Denvil, S., Deshayes, J., Devilliers, M., Ducharne, A., Dufresne, J.-L., Dupont, E., Éthé, C., Fairhead, L., Falletti, L., Flavoni, S., Foujols, M.-A., Gardoll, S., Gastineau, G., Ghattas, J., Grandpeix, J.-Y., Guenet, B., Guez, Lionel, E., Guilyardi, E., Guimberteau, M., Hauglustaine, D., Hourdin, F., Idelkadi, A., Joussaume, S., Kageyama, M., Khodri, M., Krinner, G., Lebas, N., Levavasseur, G., Lévy, C., Li, L., Lott, F., Lurton, T., Luyssaert, S., Madec, G., Madeleine, J.-B., Maignan, F., Marchand, M., Marti, O., Mellul, L., Meurdesoif, Y., Mignot, J., Musat, I., Ottlé, C., Peylin, P., Planton, Y., Polcher, J., Rio, C., Rochetin, N., Rousset, C., Sepulchre, P., Sima, A., Swingedouw, D., Thiéblemont, R., Traore, A. K., Vancoppenolle, M., Vial, J., Vialard, J., Viovy, N., and Vuichard, N.: Presentation and Evaluation of the IPSL-CM6A-LR Climate Model, J. Adv. Model. Earth Sy., 12, e2019MS002010, https://doi.org/10.1029/2019MS002010, 2020. a
Boulton, C. A., Good, P., and Lenton, T. M.: Early warning signals of simulated Amazon rainforest dieback, Theor. Ecol., 6, 373–384, https://doi.org/10.1007/s12080-013-0191-7, 2013. a
Boulton, C. A., Booth, B. B. B., and Good, P.: Exploring uncertainty of Amazon dieback in a perturbed parameter Earth system ensemble, Glob. Change Biol., 23, 5032–5044, https://doi.org/10.1111/gcb.13733, 2017. a
Boulton, C. A., Lenton, T. M., and Boers, N.: Pronounced loss of Amazon rainforest resilience since the early 2000s, Nat. Clim. Change, 12, 271–278, https://doi.org/10.1038/s41558-022-01287-8, 2022. a, b, c, d, e, f, g, h
Brando, P. M., Balch, J. K., Nepstad, D. C., Morton, D. C., Putz, F. E., Coe, M. T., Silvério, D., Macedo, M. N., Davidson, E. A., Nóbrega, C. C., Alencar, A., and Soares-Filho, B. S.: Abrupt increases in Amazonian tree mortality due to drought–fire interactions, P. Natl. Acad. Sci. USA, 111, 6347–6352, https://doi.org/10.1073/pnas.1305499111, 2014. a, b
Chai, Y., Martins, G., Nobre, C., von Randow, C., Chen, T., and Dolman, H.: Constraining Amazonian land surface temperature sensitivity to precipitation and the probability of forest dieback, npj Clim. Atmos. Sci., 4, 1–7, https://doi.org/10.1038/s41612-021-00162-1, 2021. a
Cleveland, W. S., McRae, J. E., and Terpenning, I.: STL: A seasonal-trend decomposition, J. Off. Stat., 6, 3–73, 1990. a
CMIP6_database: The Climate Model Intercomparison Project version 6 data ensemble, Earth System Grid Federation portal [data set], https://esgf-node.llnl.gov/projects/cmip6/ (last access: 15 May 2023), 2021.
Cox, P. M., Harris, P. P., Huntingford, C., Betts, R. A., Collins, M., Jones, C. D., Jupp, T. E., Marengo, J. A., and Nobre, C. A.: Increasing risk of Amazonian drought due to decreasing aerosol pollution, Nature, 453, 212–215, https://doi.org/10.1038/nature06960, 2008. a
Dakos, V., Scheffer, M., van Nes, E. H., Brovkin, V., Petoukhov, V., and Held, H.: Slowing down as an early warning signal for abrupt climate change, P. Natl. Acad. Sci. USA, 105, 14308–14312, https://doi.org/10.1073/pnas.0802430105, 2008. a
Danabasoglu, G., Lamarque, J.-F., Bacmeister, J., Bailey, D. A., DuVivier, A. K., Edwards, J., Emmons, L. K., Fasullo, J., Garcia, R., Gettelman, A., Hannay, C., Holland, M. M., Large, W. G., Lauritzen, P. H., Lawrence, D. M., Lenaerts, J. T. M., Lindsay, K., Lipscomb, W. H., Mills, M. J., Neale, R., Oleson, K. W., Otto-Bliesner, B., Phillips, A. S., Sacks, W., Tilmes, S., van Kampenhout, L., Vertenstein, M., Bertini, A., Dennis, J., Deser, C., Fischer, C., Fox-Kemper, B., Kay, J. E., Kinnison, D., Kushner, P. J., Larson, V. E., Long, M. C., Mickelson, S., Moore, J. K., Nienhouse, E., Polvani, L., Rasch, P. J., and Strand, W. G.: The Community Earth System Model Version 2 (CESM2), J. Adv. Model. Earth Sy., 12, e2019MS001916, https://doi.org/10.1029/2019MS001916, 2020. a
Doughty, C. E., Keany, J. M., Wiebe, B. C., Rey-Sanchez, C., Carter, K. R., Middleby, K. B., Cheesman, A. W., Goulden, M. L., da Rocha, H. R., Miller, S. D., Malhi, Y., Fauset, S., Gloor, E., Slot, M., Oliveras Menor, I., Crous, K. Y., Goldsmith, G. R., and Fisher, J. B.: Tropical forests are approaching critical temperature thresholds, Nature, 621, 105–111, https://doi.org/10.1038/s41586-023-06391-z, 2023. a
Döscher, R., Acosta, M., Alessandri, A., Anthoni, P., Arsouze, T., Bergman, T., Bernardello, R., Boussetta, S., Caron, L.-P., Carver, G., Castrillo, M., Catalano, F., Cvijanovic, I., Davini, P., Dekker, E., Doblas-Reyes, F. J., Docquier, D., Echevarria, P., Fladrich, U., Fuentes-Franco, R., Gröger, M., v. Hardenberg, J., Hieronymus, J., Karami, M. P., Keskinen, J.-P., Koenigk, T., Makkonen, R., Massonnet, F., Ménégoz, M., Miller, P. A., Moreno-Chamarro, E., Nieradzik, L., van Noije, T., Nolan, P., O'Donnell, D., Ollinaho, P., van den Oord, G., Ortega, P., Prims, O. T., Ramos, A., Reerink, T., Rousset, C., Ruprich-Robert, Y., Le Sager, P., Schmith, T., Schrödner, R., Serva, F., Sicardi, V., Sloth Madsen, M., Smith, B., Tian, T., Tourigny, E., Uotila, P., Vancoppenolle, M., Wang, S., Wårlind, D., Willén, U., Wyser, K., Yang, S., Yepes-Arbós, X., and Zhang, Q.: The EC-Earth3 Earth system model for the Coupled Model Intercomparison Project 6, Geosci. Model Dev., 15, 2973–3020, https://doi.org/10.5194/gmd-15-2973-2022, 2022. a
Feldpausch, T. R., Phillips, O. L., Brienen, R. J. W., Gloor, E., Lloyd, J., Lopez-Gonzalez, G., Monteagudo-Mendoza, A., Malhi, Y., Alarcón, A., Álvarez Dávila, E., Alvarez-Loayza, P., Andrade, A., Aragao, L. E. O. C., Arroyo, L., Aymard C., G. A., Baker, T. R., Baraloto, C., Barroso, J., Bonal, D., Castro, W., Chama, V., Chave, J., Domingues, T. F., Fauset, S., Groot, N., Honorio Coronado, E., Laurance, S., Laurance, W. F., Lewis, S. L., Licona, J. C., Marimon, B. S., Marimon-Junior, B. H., Mendoza Bautista, C., Neill, D. A., Oliveira, E. A., Oliveira dos Santos, C., Pallqui Camacho, N. C., Pardo-Molina, G., Prieto, A., Quesada, C. A., Ramírez, F., Ramírez-Angulo, H., Réjou-Méchain, M., Rudas, A., Saiz, G., Salomão, R. P., Silva-Espejo, J. E., Silveira, M., ter Steege, H., Stropp, J., Terborgh, J., Thomas-Caesar, R., van der Heijden, G. M. F., Vásquez Martinez, R., Vilanova, E., and Vos, V. A.: Amazon forest response to repeated droughts, Global Biogeochem. Cy., 30, 964–982, https://doi.org/10.1002/2015GB005133, 2016. a
Forkel, M., Drüke, M., Thurner, M., Dorigo, W., Schaphoff, S., Thonicke, K., von Bloh, W., and Carvalhais, N.: Constraining modelled global vegetation dynamics and carbon turnover using multiple satellite observations, Sci. Rep., 9, 18757, https://doi.org/10.1038/s41598-019-55187-7, 2019. a
Gatti, L. V., Basso, L. S., Miller, J. B., Gloor, M., Gatti Domingues, L., Cassol, H. L. G., Tejada, G., Aragão, L. E. O. C., Nobre, C., Peters, W., Marani, L., Arai, E., Sanches, A. H., Corrêa, S. M., Anderson, L., Von Randow, C., Correia, C. S. C., Crispim, S. P., and Neves, R. A. L.: Amazonia as a carbon source linked to deforestation and climate change, Nature, 595, 388–393, https://doi.org/10.1038/s41586-021-03629-6, 2021. a
Green, J. K., Konings, A. G., Alemohammad, S. H., Berry, J., Entekhabi, D., Kolassa, J., Lee, J.-E., and Gentine, P.: Regionally strong feedbacks between the atmosphere and terrestrial biosphere, Nat. Geosci., 10, 410–414, https://doi.org/10.1038/ngeo2957, 2017. a
Hajima, T., Watanabe, M., Yamamoto, A., Tatebe, H., Noguchi, M. A., Abe, M., Ohgaito, R., Ito, A., Yamazaki, D., Okajima, H., Ito, A., Takata, K., Ogochi, K., Watanabe, S., and Kawamiya, M.: Development of the MIROC-ES2L Earth system model and the evaluation of biogeochemical processes and feedbacks, Geosci. Model Dev., 13, 2197–2244, https://doi.org/10.5194/gmd-13-2197-2020, 2020. a
Hasselmann, K.: Multi-pattern fingerprint method for detection and attribution of climate change, Clim. Dynam., 13, 601–611, https://doi.org/10.1007/s003820050185, 1997. a
Hohenegger, C. and Stevens, B.: The role of the permanent wilting point in controlling the spatial distribution of precipitation, P. Natl. Acad. Sci. USA, 115, 5692–5697, https://doi.org/10.1073/pnas.1718842115, 2018. a
Huntingford, C., Zelazowski, P., Galbraith, D., Mercado, L. M., Sitch, S., Fisher, R., Lomas, M., Walker, A. P., Jones, C. D., Booth, B. B. B., Malhi, Y., Hemming, D., Kay, G., Good, P., Lewis, S. L., Phillips, O. L., Atkin, O. K., Lloyd, J., Gloor, E., Zaragoza-Castells, J., Meir, P., Betts, R., Harris, P. P., Nobre, C., Marengo, J., and Cox, P. M.: Simulated resilience of tropical rainforests to CO2-induced climate change, Nat. Geosci., 6, 268–273, https://doi.org/10.1038/ngeo1741, 2013. a
Hurtt, G. C., Chini, L., Sahajpal, R., Frolking, S., Bodirsky, B. L., Calvin, K., Doelman, J. C., Fisk, J., Fujimori, S., Klein Goldewijk, K., Hasegawa, T., Havlik, P., Heinimann, A., Humpenöder, F., Jungclaus, J., Kaplan, J. O., Kennedy, J., Krisztin, T., Lawrence, D., Lawrence, P., Ma, L., Mertz, O., Pongratz, J., Popp, A., Poulter, B., Riahi, K., Shevliakova, E., Stehfest, E., Thornton, P., Tubiello, F. N., van Vuuren, D. P., and Zhang, X.: Harmonization of global land use change and management for the period 850–2100 (LUH2) for CMIP6, Geosci. Model Dev., 13, 5425–5464, https://doi.org/10.5194/gmd-13-5425-2020, 2020. a, b, c, d
Kay, J. E., Deser, C., Phillips, A., Mai, A., Hannay, C., Strand, G., Arblaster, J. M., Bates, S. C., Danabasoglu, G., Edwards, J., Holland, M., Kushner, P., Lamarque, J.-F., Lawrence, D., Lindsay, K., Middleton, A., Munoz, E., Neale, R., Oleson, K., Polvani, L., and Vertenstein, M.: The Community Earth System Model (CESM) Large Ensemble Project: A Community Resource for Studying Climate Change in the Presence of Internal Climate Variability, Bull. Am. Meteorol. Soc., 96, 1333–1349, https://doi.org/10.1175/BAMS-D-13-00255.1, 2015. a
Kendall, M. G.: A New Measure of Rank Correlation, Biometrika, 30, 81–93, https://doi.org/10.1093/biomet/30.1-2.81, 1938. a
Kolby Smith, W., Reed, S. C., Cleveland, C. C., Ballantyne, A. P., Anderegg, W. R. L., Wieder, W. R., Liu, Y. Y., and Running, S. W.: Large divergence of satellite and Earth system model estimates of global terrestrial CO2 fertilization, Nat. Clim. Change, 6, 306–310, https://doi.org/10.1038/nclimate2879, 2016. a
Lenton, T. M., Livina, V. N., Dakos, V., van Nes, E. H., and Scheffer, M.: Early warning of climate tipping points from critical slowing down: comparing methods to improve robustness, Philos. T. R. Soc. A, 370, 1185–1204, https://doi.org/10.1098/rsta.2011.0304, 2012. a
LUH2_database: The Land Use Harmonization 2 data set for CMIP6 [data set], https://luh.umd.edu/data.shtml (last access: 21 April 2023), 2016.
Maher, N., Milinski, S., and Ludwig, R.: Large ensemble climate model simulations: introduction, overview, and future prospects for utilising multiple types of large ensemble, Earth Syst. Dynam., 12, 401–418, https://doi.org/10.5194/esd-12-401-2021, 2021. a
Malhi, Y., Phillips, O. L., Mayle, F. E., Beerling, D. J., Gosling, W. D., and Bush, M. B.: Responses of Amazonian ecosystems to climatic and atmospheric carbon dioxide changes since the last glacial maximum, Philos. T. R. Soc. Lond. Ser. B, 359, 499–514, https://doi.org/10.1098/rstb.2003.1434, 2004. a
Maslin, M., Malhi, Y., Phillips, O., and Cowling, S.: New views on an old forest: assessing the longevity, resilience and future of the Amazon rainforest, T. Brit. Geogr., 30, 477–499, https://doi.org/10.1111/j.1475-5661.2005.00181.x, 2005. a
Mauritsen, T., Bader, J., Becker, T., Behrens, J., Bittner, M., Brokopf, R., Brovkin, V., Claussen, M., Crueger, T., Esch, M., Fast, I., Fiedler, S., Fläschner, D., Gayler, V., Giorgetta, M., Goll, D. S., Haak, H., Hagemann, S., Hedemann, C., Hohenegger, C., Ilyina, T., Jahns, T., Jimenéz-de-la Cuesta, D., Jungclaus, J., Kleinen, T., Kloster, S., Kracher, D., Kinne, S., Kleberg, D., Lasslop, G., Kornblueh, L., Marotzke, J., Matei, D., Meraner, K., Mikolajewicz, U., Modali, K., Möbis, B., Müller, W. A., Nabel, J. E. M. S., Nam, C. C. W., Notz, D., Nyawira, S.-S., Paulsen, H., Peters, K., Pincus, R., Pohlmann, H., Pongratz, J., Popp, M., Raddatz, T. J., Rast, S., Redler, R., Reick, C. H., Rohrschneider, T., Schemann, V., Schmidt, H., Schnur, R., Schulzweida, U., Six, K. D., Stein, L., Stemmler, I., Stevens, B., von Storch, J.-S., Tian, F., Voigt, A., Vrese, P., Wieners, K.-H., Wilkenskjeld, S., Winkler, A., and Roeckner, E.: Developments in the MPI-M Earth System Model version 1.2 (MPI-ESM1.2) and Its Response to Increasing CO2, J. Adv. Model. Earth Sy., 11, 998–1038, https://doi.org/10.1029/2018MS001400, 2019. a, b
Moesinger, L., Dorigo, W., De Jeu, R., Van der Schalie, R., Scanlon, T., Teubner, I., and Forkel, M.: The Global Long-term Microwave Vegetation Optical Depth Climate Archive VODCA (1.0), Zenodo [data set], https://doi.org/10.5281/zenodo.2575599, 2019. a
Moesinger, L., Dorigo, W., de Jeu, R., van der Schalie, R., Scanlon, T., Teubner, I., and Forkel, M.: The global long-term microwave Vegetation Optical Depth Climate Archive (VODCA), Earth Syst. Sci. Data, 12, 177–196, https://doi.org/10.5194/essd-12-177-2020, 2020. a, b, c
Otto, F. E.: Attribution of Extreme Events to Climate Change, Annu. Rev. Env. Resour., 48, 813–828, https://doi.org/10.1146/annurev-environ-112621-083538, 2023. a
Owe, M., de Jeu, R., and Holmes, T.: Multisensor historical climatology of satellite-derived global land surface moisture, J. Geophys. Res.-Earth, 113, F01002, https://doi.org/10.1029/2007JF000769, 2008. a
Parry, I. M., Ritchie, P. D. L., and Cox, P. M.: Evidence of localised Amazon rainforest dieback in CMIP6 models, Earth Syst. Dynam., 13, 1667–1675, https://doi.org/10.5194/esd-13-1667-2022, 2022. a, b
RAISG_data: RAISG, Amazon Network of Georeferenced Socio-Environmental Information [data set], https://www.raisg.org/en/maps (last access: 10 March 2023), 2023.
Richardson, A. D., Keenan, T. F., Migliavacca, M., Ryu, Y., Sonnentag, O., and Toomey, M.: Climate change, phenology, and phenological control of vegetation feedbacks to the climate system, Agr. Forest Meteorol., 169, 156–173, https://doi.org/10.1016/j.agrformet.2012.09.012, 2013. a
Salati, E., Dall'Olio, A., Matsui, E., and Gat, J. R.: Recycling of water in the Amazon Basin: An isotopic study, Water Resour. Res., 15, 1250–1258, https://doi.org/10.1029/WR015i005p01250, 1979. a
Scheffer, M., Bascompte, J., Brock, W. A., Brovkin, V., Carpenter, S. R., Dakos, V., Held, H., van Nes, E. H., Rietkerk, M., and Sugihara, G.: Early-warning signals for critical transitions, Nature, 461, 53–59, https://doi.org/10.1038/nature08227, 2009. a
Silvério, D. V., Brando, P. M., Macedo, M. N., Beck, P. S. A., Bustamante, M., and Coe, M. T.: Agricultural expansion dominates climate changes in southeastern Amazonia: the overlooked non-GHG forcing, Environ. Res. Lett., 10, 104015, https://doi.org/10.1088/1748-9326/10/10/104015, 2015. a
Simmons, C. S., Walker, R., Aldrich, S., Arima, E., Pereira, R., Castro, E. M. R. d., Michelotti, F., Waylen, M., and Antunes, A.: Discipline and Develop: Destruction of the Brazil Nut Forest in the Lower Amazon Basin, Ann. Am. Assoc. Geogr., 109, 242–265, https://doi.org/10.1080/24694452.2018.1489215, 2019. a
Song, X., Wang, D.-Y., Li, F., and Zeng, X.-D.: Evaluating the performance of CMIP6 Earth system models in simulating global vegetation structure and distribution, Adv. Clim. Change Res., 12, 584–595, https://doi.org/10.1016/j.accre.2021.06.008, 2021. a
Swart, N. C., Cole, J. N. S., Kharin, V. V., Lazare, M., Scinocca, J. F., Gillett, N. P., Anstey, J., Arora, V., Christian, J. R., Hanna, S., Jiao, Y., Lee, W. G., Majaess, F., Saenko, O. A., Seiler, C., Seinen, C., Shao, A., Sigmond, M., Solheim, L., von Salzen, K., Yang, D., and Winter, B.: The Canadian Earth System Model version 5 (CanESM5.0.3), Geosci. Model Dev., 12, 4823–4873, https://doi.org/10.5194/gmd-12-4823-2019, 2019. a
Tao, S., Chave, J., Frison, P.-L., Le Toan, T., Ciais, P., Fang, J., Wigneron, J.-P., Santoro, M., Yang, H., Li, X., Labrière, N., and Saatchi, S.: Increasing and widespread vulnerability of intact tropical rainforests to repeated droughts, P. Natl. Acad. Sci. USA, 119, e2116626119, https://doi.org/10.1073/pnas.2116626119, 2022. a
Verbesselt, J., Umlauf, N., Hirota, M., Holmgren, M., Van Nes, E. H., Herold, M., Zeileis, A., and Scheffer, M.: Remotely sensed resilience of tropical forests, Nat. Clim. Change, 6, 1028–1031, https://doi.org/10.1038/nclimate3108, 2016. a
Volodin, E. and Gritsun, A.: Simulation of observed climate changes in 1850–2014 with climate model INM-CM5, Earth Syst. Dynam., 9, 1235–1242, https://doi.org/10.5194/esd-9-1235-2018, 2018. a
Zhu, Z., Piao, S., Myneni, R. B., Huang, M., Zeng, Z., Canadell, J. G., Ciais, P., Sitch, S., Friedlingstein, P., Arneth, A., Cao, C., Cheng, L., Kato, E., Koven, C., Li, Y., Lian, X., Liu, Y., Liu, R., Mao, J., Pan, Y., Peng, S., Peñuelas, J., Poulter, B., Pugh, T. A. M., Stocker, B. D., Viovy, N., Wang, X., Wang, Y., Xiao, Z., Yang, H., Zaehle, S., and Zeng, N.: Greening of the Earth and its drivers, Nat. Clim. Change, 6, 791–795, https://doi.org/10.1038/nclimate3004, 2016. a
Ziehn, T., Chamberlain, M. A., Law, R. M., Lenton, A., Bodman, R. W., Dix, M., Stevens, L., Wang, Y.-P., Srbinovsky, J., Ziehn, T., Chamberlain, M. A., Law, R. M., Lenton, A., Bodman, R. W., Dix, M., Stevens, L., Wang, Y.-P., and Srbinovsky, J.: The Australian Earth System Model: ACCESS-ESM1.5, J. South. Hemis. Earth Syst. Sc., 70, 193–214, https://doi.org/10.1071/ES19035, 2020. a