the Creative Commons Attribution 4.0 License.
the Creative Commons Attribution 4.0 License.
 | 24 Jun 2024
Global cropland expansion enhances cropping potential and reduces its inequality among countries
Xiaoxuan Liu
Shu Liu
Yong Wang
Zhenrong Du
Dailiang Peng
Ece Aksoy
Peng Gong
Global cropland expansion has been recognized as a key driver of food security. However, cropland-expansion-induced alterations in biophysical properties of the Earth's surface and greenhouse gas emissions may potentially impact the Earth's climate system. These changes could, in turn, affect cropland productivity and the potential distribution of croplands, although the underlying mechanisms remain relatively underexplored. In this study, a global climate model was employed to quantify the impact of global cropland expansion on cropping potential utilizing observed and derived cropland expansion data. Our findings reveal that since 10 000 BCE, a 28 % increase in cropland expansion has led to a 1.2 % enhancement in global cropping potential owing to more favorable precipitation and temperature conditions. This suggests that global cropland expansion yields dual benefits to crop production. However, in regions with low growth rates of cropping potential, cropland expansion proves to be an inefficient method for augmenting the yield of local crop potential. As croplands continue to expand worldwide, the capacity to support populations in different regions is altered, thereby reducing cropping potential inequality among nations.
- Article
(6073 KB) - Full-text XML
-
Supplement
(17108 KB) - BibTeX
- EndNote


Land use change is the fundamental result of human activities that disturb the Earth's surface, and it plays a crucial role in global change (Rockström et al., 2009; Foley et al., 2005; Sasmito et al., 2019). This change in land use is closely connected to climate change, ecological environmental change, the sustainable utilization of natural resources, and human health (Kates et al., 2001; Wall et al., 2015; Hasan et al., 2020). The growth of population and economic development has generated an increasing demand for land commodities, which accelerates a continuous expansion of global agricultural land through activities such as deforestation, reclamation of grasslands, and the conversion of cropland from lakes (Zabel et al., 2019; Foley et al., 2005). At present, approximately 40 % of the Earth's ice-free land surface is used for agricultural activities, totaling over 1500 million hectares (Mha) of cropland (Ramankutty et al., 2008; Ritchie and Roser, 2013; Potapov et al., 2022; Yu et al., 2013). Moreover, the expansion of cropland is projected to continue under all scenarios (Hurtt et al., 2020; Liu et al., 2017), emphasizing the importance of such expansion in ensuring food security and agricultural production in response to rapid population growth (Levers et al., 2016; Delzeit et al., 2017).
While existing research primarily focuses on the effects of cropland expansion on soil degradation, climate change, and biodiversity loss (Ortiz-Bobea et al., 2021; Searchinger et al., 2015), limited knowledge exists regarding the repercussions of this expansion on the croplands themselves. Previous studies examining the impacts of historical cropland expansion have often been complicated by land use changes unrelated to agricultural expansion and contraction (Lawrence and Chase, 2007; Sterling et al., 2013). Several studies have analyzed the effects of land cover changes on climate change. For example, Lawrence et al. (2007) used MODIS data to further our understanding of land cover changes and found that changes in soil cover led to local warming and drought near the ground (Lawrence and Chase, 2007). Yan et al. (2017) studied climate change caused by land cover from 1 to 2000 CE using an Earth system model and found that an increase in cropland and a decrease in forests corresponded to a downward trend in the global average annual temperature. Conversely, Sampaio et al. (2007) discovered that large-scale deforestation, resulting from rangeland and soybean expansion in the Amazon, significantly alters regional climate, leading to warming and dryness after deforestation. Additionally, Arora and Montenegro (2011), using climate models combined with the carbon cycle, found that if all or half of the world's agricultural land were allowed to revert to forest, temperatures would be 0.45 °C and 0.25 °C lower by 2100 compared to scenarios in which no reversion occurs. However, these studies generally consider changes in all land types, and, thus, the specific influence of cropland expansion on climate change remains under-quantified. Furthermore, cropland expansion often involves the encroachment of agricultural activities on other land types, such as deforested areas and grasslands (Liu et al., 2018; Bahar et al., 2020). However, due to the ongoing depletion of natural resources, sustainable intensification of cropland has emerged as a means of feeding a growing population while ensuring both human and environmental well-being (Cole et al., 2018; Godfray et al., 2010). This approach involves practices such as multiple cropping, fertilization, irrigation, and agricultural mechanization, all aimed at enhancing agricultural productivity within existing cropland (Mauser et al., 2015). These sustainable approaches are expected to play a substantial role in increasing future food production as more effective strategies (Wu et al., 2014; Folberth et al., 2020).
The dynamic changes in cropland, including its status and cropping potential, have significant impacts on global climate change, terrestrial ecosystems, biogeochemical cycle processes, and global land–ocean interactions (Bennett et al., 2001; Defries et al., 2004; Zhao et al., 2019; Steinfeld et al., 2006). Research on the potential of cropland is therefore of great importance in understanding and responding to changes in regional and global ecological environments (Hu et al., 2020). It can help fully explore the potential of cropland based on its existing extent, provide better guidance for land use planning, facilitate adjustments in agricultural structure, and coordinate grain trade (Parodi et al., 2018; Mehrabi et al., 2018). Moreover, changes in the spatial distribution of cropland can affect global climate change through atmospheric circulation, which, in turn, further affects cropland itself (Bonan et al., 1992; Brovkin et al., 2004; Iizumi and Ramankutty, 2015; Yang et al., 2015). Quantifying and understanding the impact of global cropland dynamics on the climate production potential of cropland can assist decision-makers in considering the sustainability of actions within evolving cropland landscapes (Fischer et al., 2005; J. Wang et al., 2018). This, in turn, can contribute to sustainable cropland development, serve the goals of sustainable agricultural development and food security, and contribute to the achievement of the United Nations Sustainable Development Goals (SDGs; UN, 2018).
In this study, we utilized an Earth system model to assess the influence of cropland-expansion-induced climate change on global cropping potential. Our model simulation incorporated observed and derived data on cropland expansion and contraction from 10 000 BCE to 2015, while keeping other land categories unaffected by these changes. Through Earth system model experiments, we examined the resulting temperature and precipitation conditions to assess the impact of global cropland expansion on total cropping potential using a cropping potential model. Subsequently, we analyzed regional changes in cropping potential and formulated specific policy recommendations for different geographical regions.
2.1 Cropland expansion datasets from HYDE
The History Database of the Global Environment (HYDE version 3.2) datasets are used to extract the cropland expansion distribution from 10 000 BCE to 2015 (Klein Goldewijk et al., 2017). For further use in our research, multiple land types in HYDE datasets are divided into six general types (i.e., bare land, cropland, grassland, ice/snow, urban area, and woodland) according to a general classification system of Finer Resolution Observation and Monitoring of Global Land Cover (FROM-GLC) based on Gong et al. (2013) and Liu et al. (2018; see Table S2 in the Supplement). Considering the HYDE datasets have no clear-cut distinctions between seminatural and treeless lands, wild lands, remote and treeless lands, and barren lands, a global potential vegetation dataset (PV) is introduced to discriminate the 10 000 BCE land cover. All the cropland expansion datasets for 10 000 BCE, 1850, 1990, and 2015 are shown in Fig. S1 in the Supplement, representing the land cover distribution derived from HYDE and PV. To ensure that only cropland expansion is retained in this research, we only keep areas with land cover changes in cropland, and other areas of variation are set the same as the base year of 2015 (see the example in Fig. S2). Then, to fit the resolution of the following climate model at ∼2°, we aggregated the original 1 km resolution into 2°×2° grid cells and calculated the area proportions of every land cover change type in each 2° grid cell (see the example in Fig. S3).
2.2 Global climate model
The global climate model (GCM) used in this study is the National Center for Atmospheric Research (NCAR) Community Earth System Model version 1.2.1 (CESM1.2.1), including atmosphere, land, ocean, and sea ice component models. The most relevant components for this study are the atmosphere and land components represented by the Community Atmosphere Model version 5.3 (CAM5.3) and the Community Land Model version 4 (CLM4), respectively. The reliability of the CESM has been confirmed in numerous previous studies, making it suitable for applications such as climate change simulation and climate model analysis (Hurrell et al., 2013; Kay et al., 2015). CAM5.3 uses a finite-volume dynamical core and a suite of parameterization schemes for representing various atmospheric physical and chemical processes (Neale et al., 2010). In the CLM4, including multiple land surface processes (Oleson et al., 2010), spatial land surface heterogeneity is represented as fractional coverages of multiple land types coexisting in each grid cell. The four cropland expansion datasets (10 000 BCE, 1850, 1990, and 2015) derived from HYDE are further handled to follow the land cover classification of the CLM4. Each cropland expansion dataset includes six types of land cover. The woodland land type could be further disaggregated into forest and shrubland according to the mean annual proportion of the European Space Agency Climate Change Initiative Land Cover (ESA CCI-LC) dataset (Defourny et al., 2017, 2009). The fractional coverage of bare land, cropland, ice/snow, and urban coverage types can be directly applied to the model. At the same time, those of the other land cover types need to be divided into corresponding subtypes in the CLM4 according to their relative ratios (Liu et al., 2021; Figs. S4–S7).
2.3 Experimental design
This study focuses on the climatic effects of the external forcing of cropland expansion. Therefore, four simulation groups are conducted: crop10000BCE, crop1850, crop1990, and crop2015, which are driven by different land surface data of 10 000 BCE, 1850, 1990, and 2015, respectively. These simulation experiments, only differing in cropland cover, were run in the Atmospheric Model Intercomparison Project (AMIP) type using fully prognostic atmosphere and land models with prescribed, seasonally varying present-day climatological (1981–2001 mean) sea surface temperatures and sea ice concentrations (Hurrell et al., 2013). Other external forcings, such as solar radiation, anthropogenic aerosol emissions, and greenhouse gas concentrations, were also fixed in the present-day climatological conditions (Eyring et al., 2016). This is because, taking into account the nonlinear responses of climate to external forcings (Rohrschneider et al., 2019), employing various external forcing levels would inevitably perturb the signal of the external forcing of cropland expansion. Each simulation group has 10 simulations, differing in their initial conditions by adding a random round-off level (order of 10−14 K) error to the initial air temperature fields, and these simulations are run for 15 years at a horizontal resolution of ∼2°. The first 10 years are regarded as spin-up, and the last 5 years of daily output are used for further analysis.
2.4 Diagnosis of surface air temperature and precipitation changes
Surface air temperature changes induced by cropland expansion are diagnosed by the thermodynamic energy equation in the pressure coordinate (Chemke et al., 2016; Lee et al., 2011), which is given by Eq. (1):
where δ denotes the differences between simulation experiments (here crop2015 minus crop10000BCE, crop1850, and crop1990) and the overbar denotes the mean time. T is the surface air temperature, and the right-hand side of the equation shows respective contributions to its changes. The first term is the horizontal temperature advection, in which Vh is horizontal wind. The second term is adiabatic warming/cooling, where Sp is the atmosphere stability parameter and ω is the vertical velocity in the pressure coordinate. The remaining four terms represent the shortwave radiative heating rate, surface downward longwave flux, surface sensible heat flux, and latent heat release plus vertical diffusion. The units of the six terms on the right-hand side are unified to W m−2 by multiplying the specific heat capacity of air and the air mass per unit area near the surface (Chemke et al., 2016). The influence of surface sensible and latent heat fluxes on air temperature changes encompasses the impacts of numerous biophysical factors, including surface albedo, surface emissivity, aerodynamic resistance, and surface resistance (Lee et al., 2011; Chen et al., 2020). This is because these biophysical factors directly affect surface temperature, thereby indirectly influencing near-surface air temperature through the near-surface turbulence of sensible and latent heat (Zeng et al., 2017; Li et al., 2020).
Precipitation changes induced by cropland expansion are examined by the atmospheric moisture budget equation (Y. Wang et al., 2018), which is given by Eq. (2):
where P denotes precipitation, W is the column-integrated precipitable water, V represents the total horizontal moisture transport normalized by the W, and E is the evaporation. Precipitation changes can be disentangled from moisture convergence, moisture advection, and evaporation on the right-hand side.
2.5 Bias correction of model simulations
We use the widely applied “delta method” for climate model bias correction (Diffenbaugh and Burke, 2019), in which model-simulated changes are applied to observations. AgERA5 (Agrometeorological ECMWF Reanalysis v5, Agrometeorological European Centre for Medium-Range Weather Forecasts Reanalysis v5) is used for corrections of surface air temperature and precipitation from the simulations. This dataset provides daily surface meteorological data from 1979 to the present as input for agriculture and agroecological studies. The averaged values from 2010 to 2019 of AgERA5 replace the simulation results of the crop2015 simulation. Those of the other three experiments are calculated as the AgERA5 added by their respective differences from the crop2015. Moreover, we verified the correctness of the corrected temperature and precipitation by analyzing spatial distributions and the PDF (probability density function) (Figs. S8–S11). The results show that the CESM can capture the spatial distributions and PDFs of temperature and precipitation in ERA5 well.
2.6 Climate cropping potential intensity model
Climate cropping potential denotes the utmost capacity for multi-cropping, which is achievable after thorough climate resource assessment. The climatological precipitation and temperature affect the climate cropping potential and set the upper limit. Based on this restriction, the Global Agroecological Zones (GAEZ) model is introduced here to assess the multiple cropping potential through matching both growth moisture and temperature requirements of individual suitable crops with the time available for crop growth (Fischer et al., 2021). Delineation of multiple cropping zones is solely based on agroclimatic attributes calculated during the GAEZ analysis. On the supply side, we introduced precipitation as a water indicator as Wu et al. (2018) used and the following climatic characteristics for each pixel at a global scale:
- a.
annual average temperature
- b.
total annual precipitation
- c.
TSt=0 accumulated temperature on days when mean daily temperature ≥0°
- d.
TSt=10 accumulated temperature on days when mean daily temperature ≥10°
- e.
LGPt=5 number of days with mean daily temperatures above 5°
- f.
LGPt=10 number of days with mean daily temperatures above 10°.
Tables S4 and S5 summarize the delineation criteria for cropping potential zones in the tropics and the subtropics/temperate zones, combining the GAEZ model and precipitation.
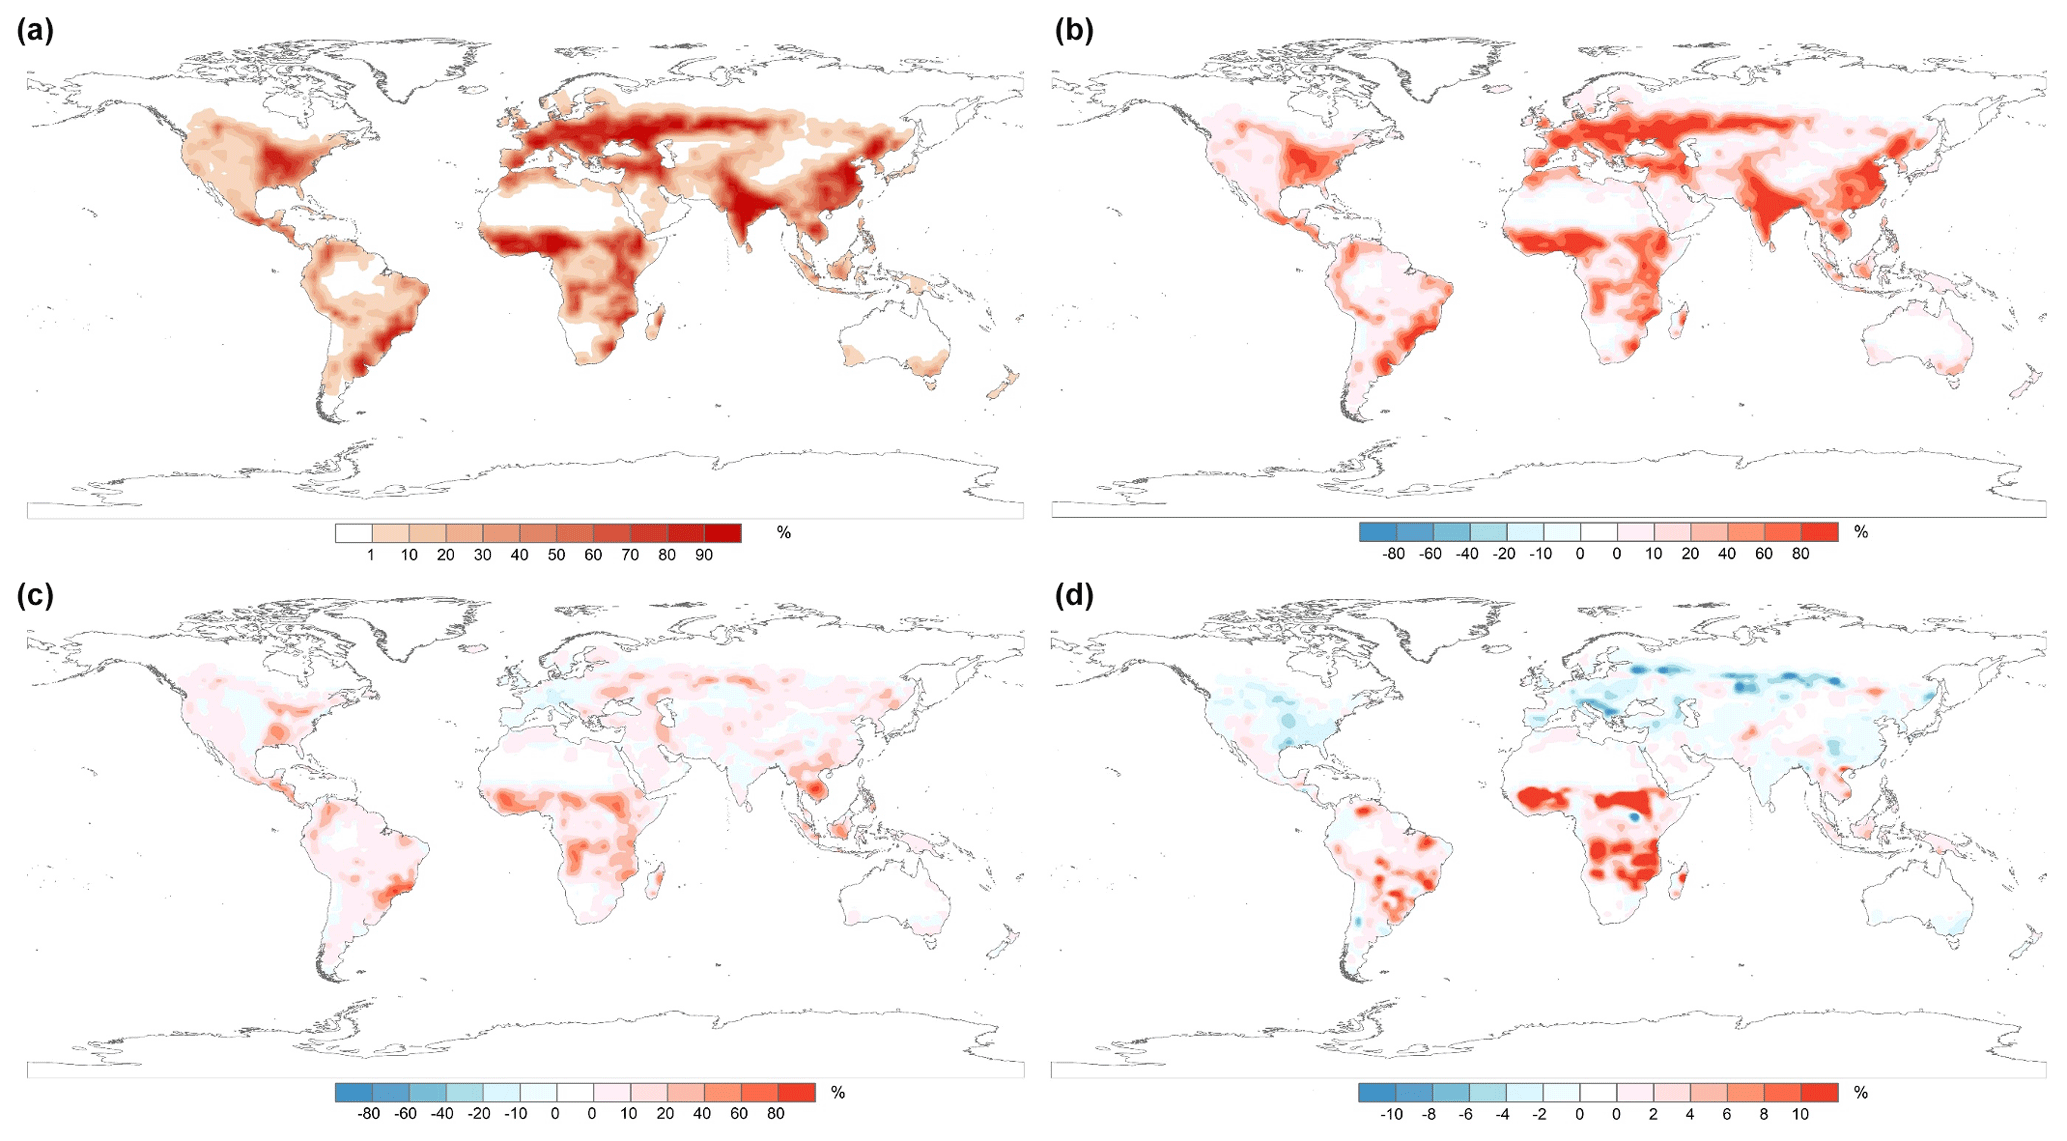
Figure 1Global distribution and fractional changes in cropland. (a) Cropland distribution in 2015. (b–d) Fractional changes in cropland relative to 2015 for 10 000 BCE (b), 1850 (c), and 1990 (d).
2.7 Cropland pressure index
To quantify cropland pressure driven by cropland expansion in different regions (Calvin et al., 2017) of Table S1, an index is introduced here. The current cropland potential area for each region is aggregated spatially based on HYDE 2015 cropland area weighted by the cropping potential. The cropland pressure index is calculated by dividing the total population by cropland potential area over the regions. The current population is estimated based on populations from 2015 (Worldpop2015, Lloyd et al., 2019), the same year as HYDE 2015. The global gap of cropland pressure index is based on the top 10 and bottom 10 regions, which is approximately the interquartile range.
3.1 Changes in croplands and associated climates
As shown in the History Database of the Global Environment (HYDE version 3.2) datasets for cropland distribution (Foley et al., 2005; Klein Goldewijk et al., 2017), the global mean cropland proportion increased from 0 % in 10 000 BCE to 28.5 % in 2015 (Fig. 1a). The historical development process (Fig. S12) reveals that prior to 10 000 BCE, there was no cropland, and the vegetation coverage was entirely natural. Subsequently, croplands gradually expanded until 1850 when rapid growth ensued. By 1990, cropland expansion reached a plateau, with negligible growth observed by 2015. Consequently, we selected key time points (10 000 BCE, 1850, 1990, and 2015) to represent the historical evolution of croplands. Global cropland expansion from 10 000 BCE to 2015 predominantly occurred in eastern America, Europe, central Africa, India, and China (Fig. 1b), with notable reductions in forests followed by declines in grasslands and shrublands (Fig. S13). From 1850 to 2015, croplands in America, Europe, Africa, and Asia continued to increase despite the encroachment of forests, grasslands, and shrublands. The rate of cropland expansion slowed due to the utilization of easily convertible land for crops and increased the yield per unit area resulting from industrial fertilization, ultimately leading to decreases in some areas (Fig. S14). Between 1990 and 2015, cropland coverage declined in America, Europe, and China, attributable to expansions in forests, grasslands, and urban areas. However, significant cropland expansions persisted in the Amazon and Africa (Fig. S15).
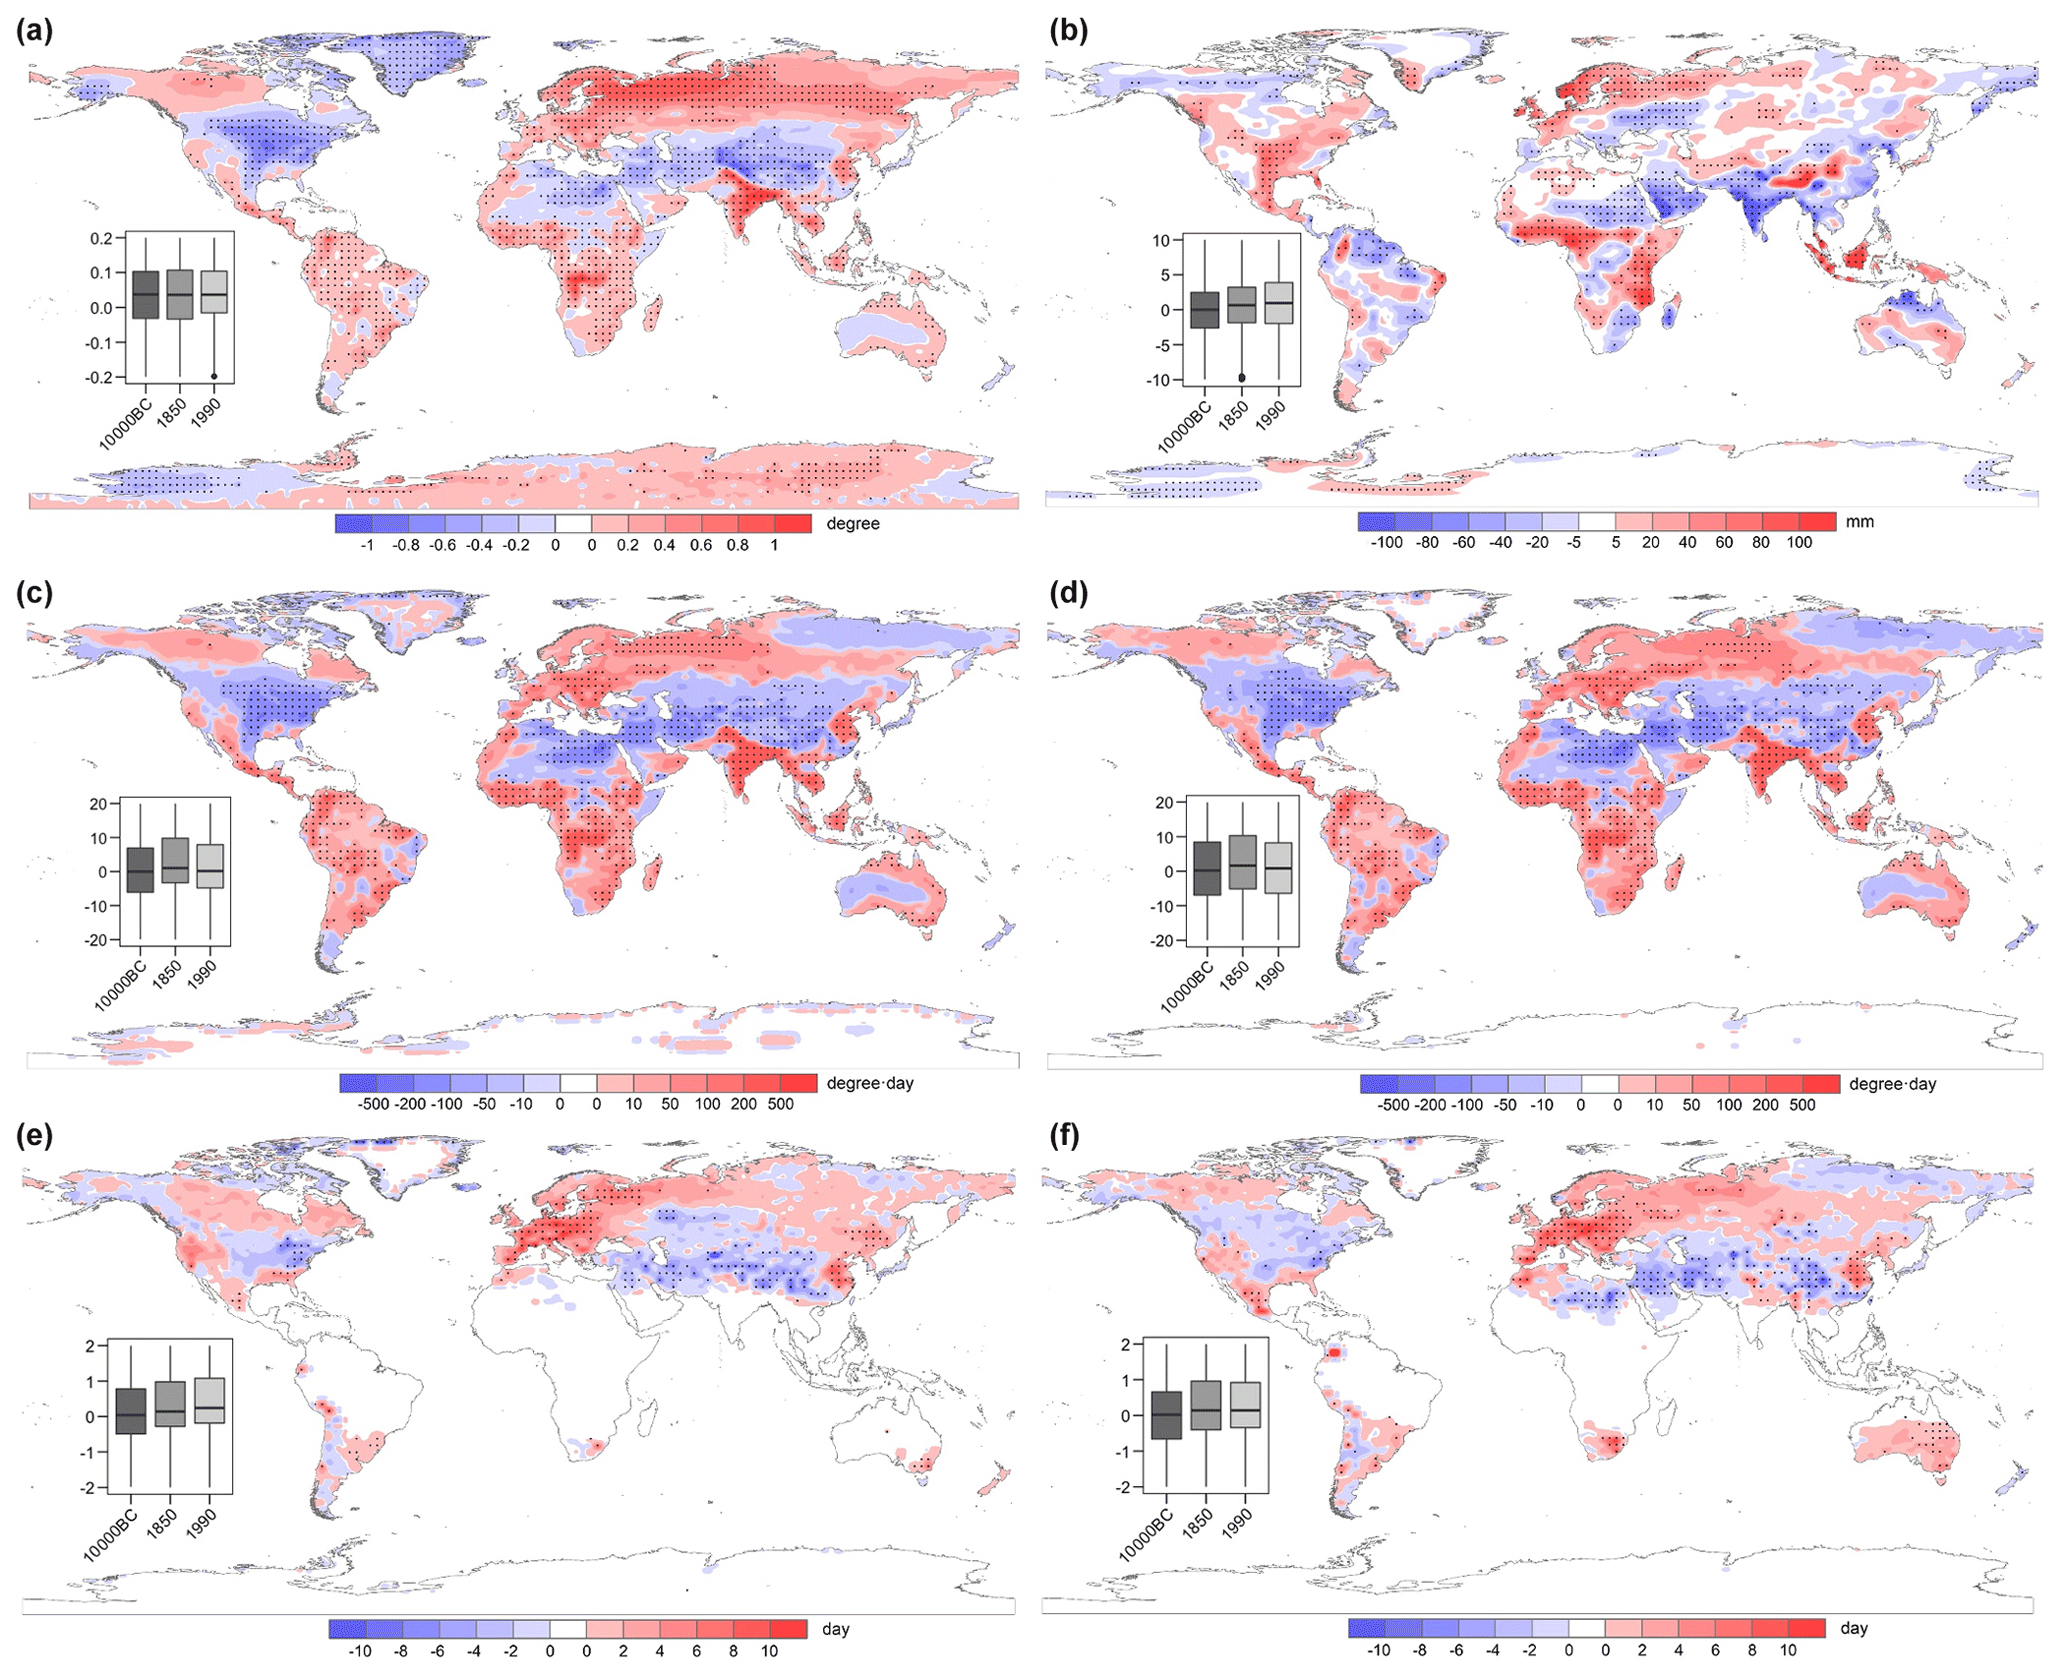
Figure 2Temperature and precipitation changes from 10 000 BCE to 2015 due to cropland change. (a) Annual mean temperature. (b) Annual mean precipitation. (c) TSt=0. (d) TSt=10. (e) LGPt=5. (f) LGPt=10. Inset box charts show the global mean value for each variable relative to 2015 for 10 000 BCE, 1850, and 1990. The solid black dots indicate the pixels passing a two-sample t test (95 % confidence level).
With observed land cover in 2015 and cropland-induced changes for 10 000 BCE, 1850, and 1990 (Figs. 1 and S12–S15), we performed four sets of experiments using the National Center for Atmospheric Research (NCAR) Community Earth System Model version 1.2.1 (CESM1.2.1) to obtain climates associated with the cropland states for 10 000 BCE, 1850, 1990, and 2015 (see Methods). The significant cropland expansion from 10 000 BCE to 2015 led to notable changes in surface air temperature and precipitation (Fig. 2a and b). The pronounced warming observed over northern Eurasia primarily resulted from warm air temperature advection due to modified atmospheric circulation and increased downwelling longwave radiation. The warming further leads to increased atmospheric heat storage and enhanced water vapor due to the greater atmospheric water-vapor-holding capacity. Therefore, the longwave downwelling flux is increased, contributing to the warming. The warming tendency in the low-latitude tropics is mainly associated with the warming effect of the reduced surface evaporation due to cropland expansion. The cooling tendency in the subtropics is dominated by the cool advection and decreased downwelling longwave radiation. The cooling effect over eastern North America can be ascribed to reduced surface sensible heat and decreased downwelling longwave radiation. The reduced sensible heat fluxes over eastern North America and Europe are due to the smaller surface roughness of cropland compared with the forest, enhancing aerodynamic resistance to sensible heat diffusion from the land surface to the atmosphere. Enhanced precipitation over Europe mainly arose from increased moisture advection, while diminished precipitation over India was linked to reduced moisture convergence and evaporation. The decreased precipitation over India further leads to increased concentration of absorptive aerosols, such as black carbon and dust, and it contributes to the warming there (Fig. S16d).
In addition to the annual surface air temperature and precipitation changes from 10 000 BCE to 2015 (Fig. 2a and b), the temperature-derived variables also used for the climate cropping potential intensity model (see Methods) are shown in Fig. 2c–f. The annual average temperature in high latitudes of North America, Eurasia, India, South America, central Africa, and South Africa is on the rise. At the same time, a significant cooling trend is shown in central and eastern Asia, the Middle East, North Africa, and most of the United States, resulting from the combined effects of reduced sensible heat fluxes, decreased longwave downwelling fluxes, and cool advection. TSt=0 (accumulated temperature on days when mean daily temperature ≥0°), TSt=10 (accumulated temperature on days when mean daily temperature ≥10°), LGPt=5 (number of days with mean daily temperatures above 5°), and LGPt=10 (number of days with mean daily temperatures above 10°) resemble the annual average temperature, except for LGP in the tropical zones. Similar changes for temperature and precipitation from 1850 to 2015 and 1990 to 2015 were also found (Figs. S18 and S19).
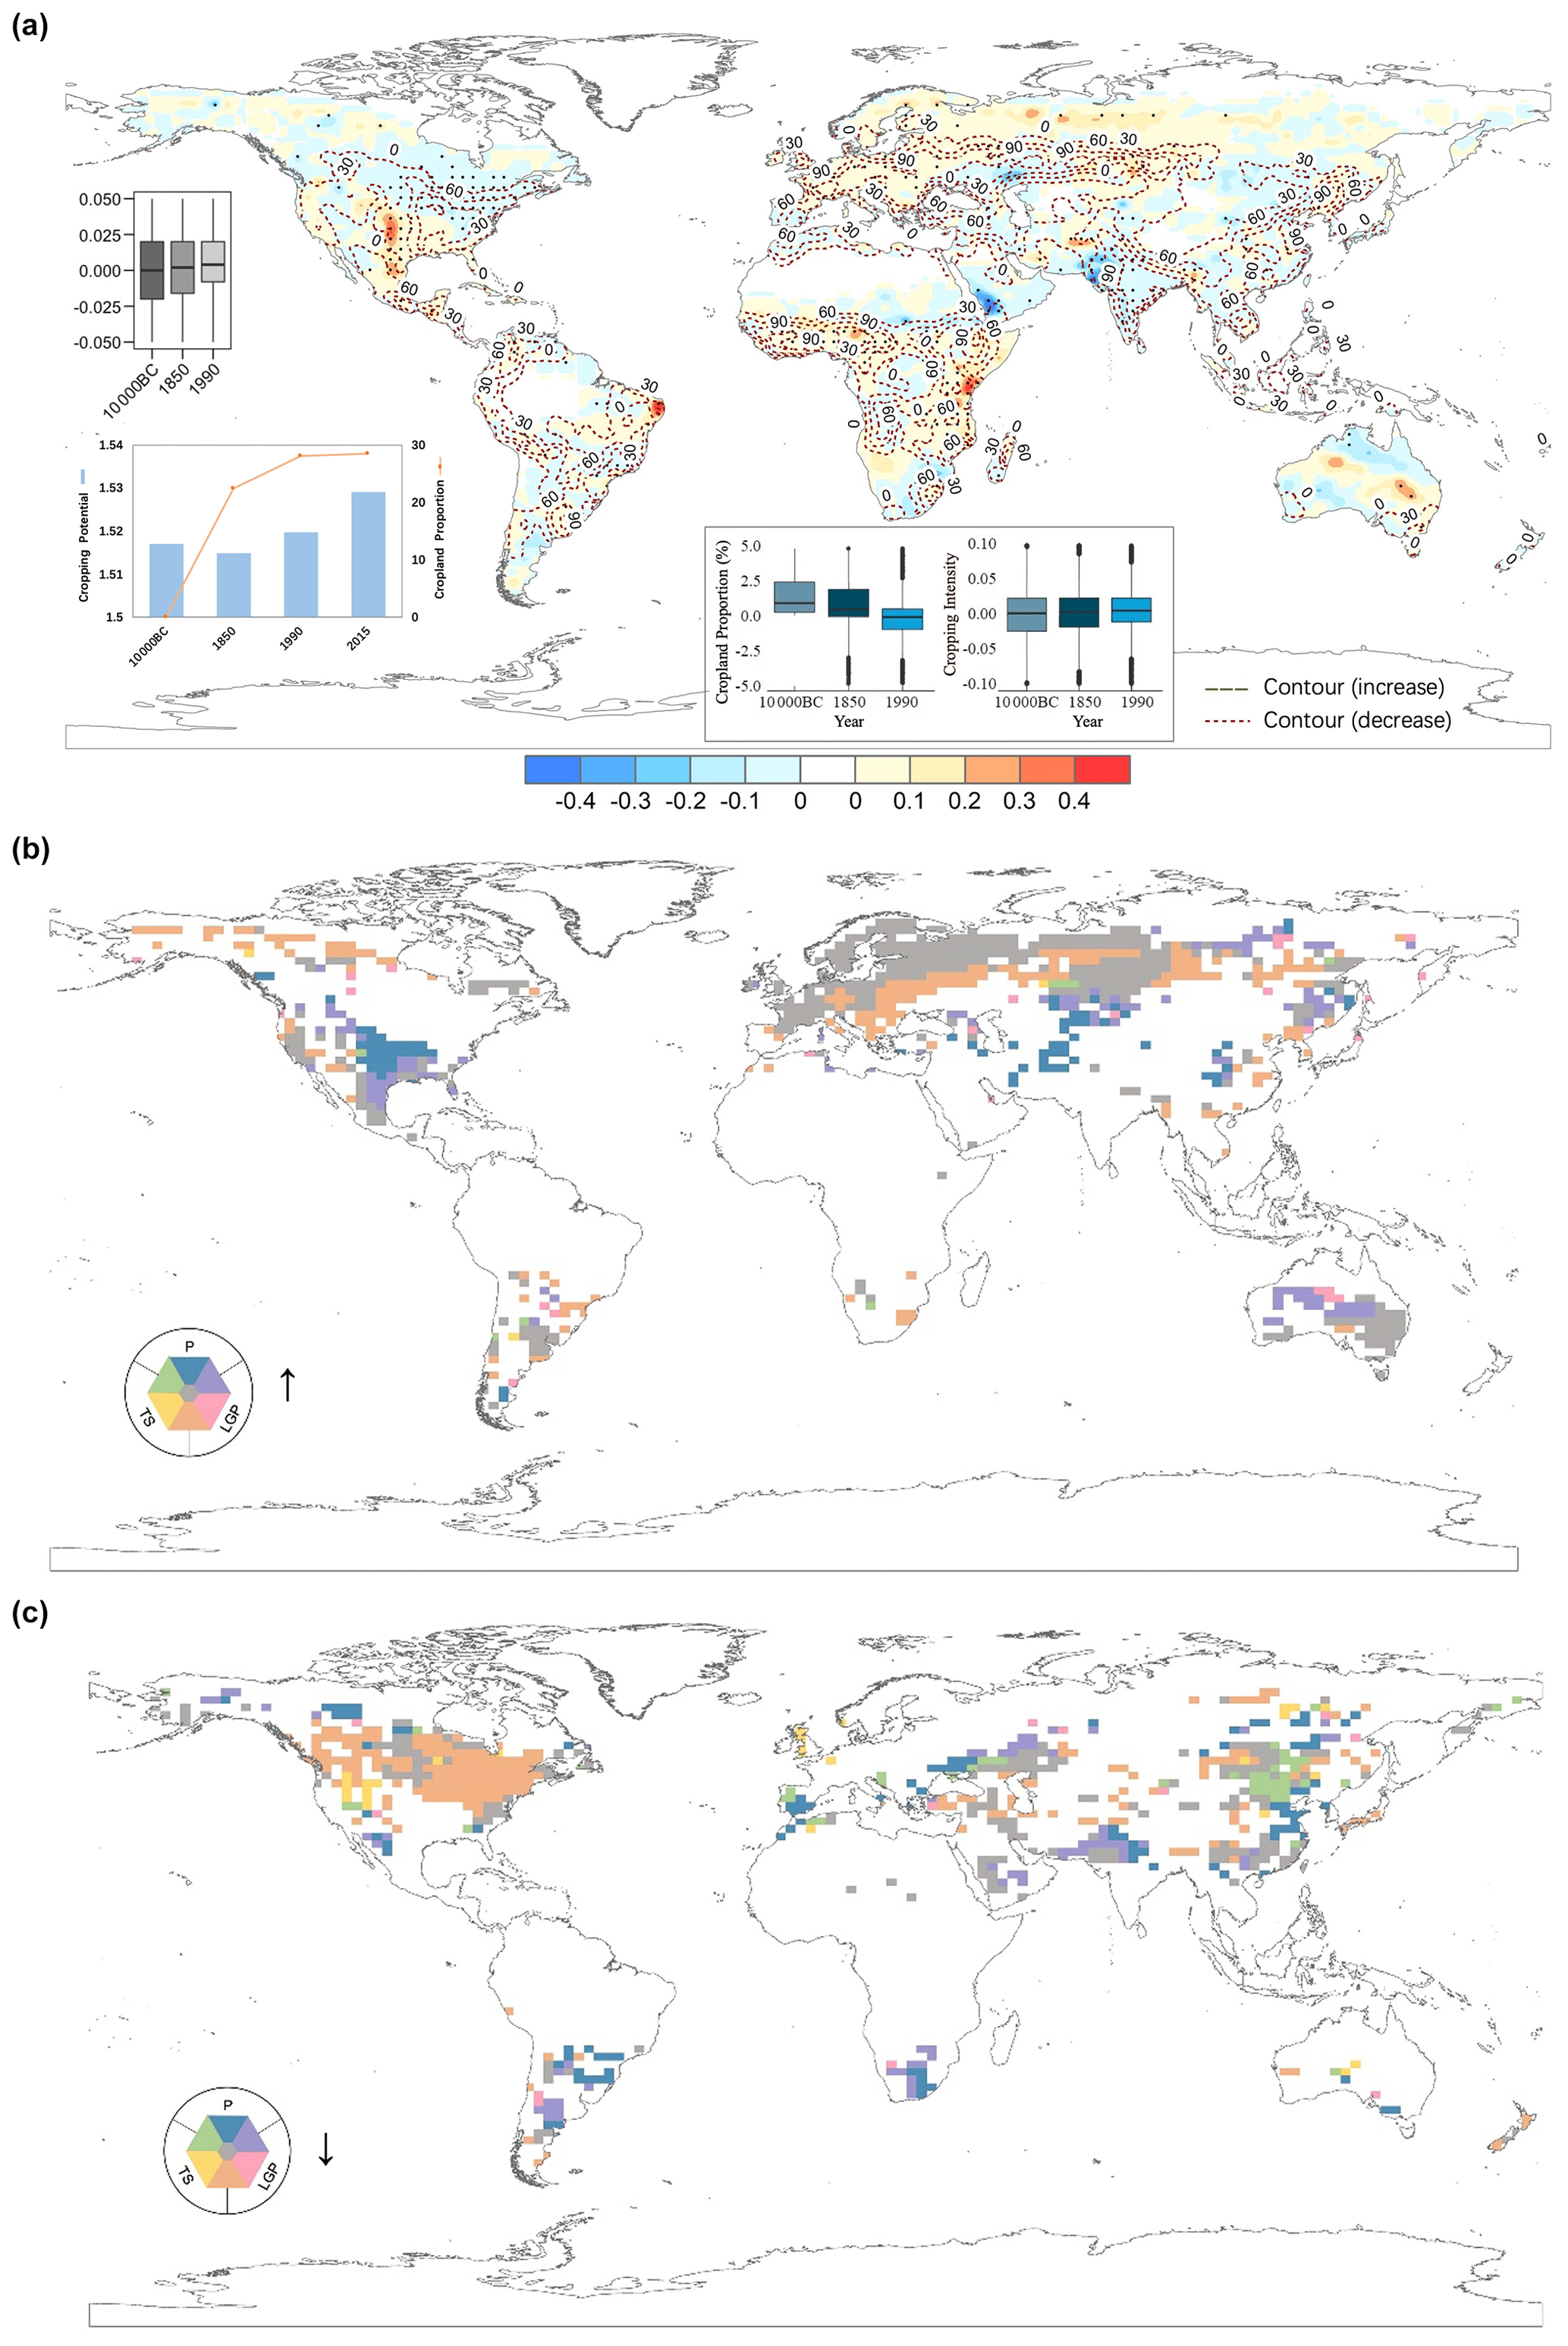
Figure 3Cropping potential changes and causes from 10 000 BCE to 2015. (a) Cropping potential distribution changes superposed by the cropland expansion fraction (contours). Inset box charts show the global mean cropping potential distribution changes (%) relative to 2015 for 10 000 BCE, 1850, and 1990. The inset bar chart represents the cropping potential from 10 000 BCE to 2015, and the line denotes the global mean cropland fraction. The solid black dots indicate the pixels passing a two-sample t test (95 % confidence level). (b, c) Global distributions of causes for increasing (b) and decreasing (c) cropping potential from 10 000 BCE to 2015. Increased cropping potential caused by precipitation is shown in blue, LGPt=5 or LGPt=10 in pink, and TSt=0 or TSt=10 in yellow. Combinations of the two factors are shown in purple (precipitation and LGPt=5 or LGPt=10; both factors promote the cropping potential growth), orange (LGPt=5 or LGPt=10 and TSt=0 or TSt=10), and green (precipitation and TSt=0 or TSt=10). Grey indicates the increase for all the three factors: precipitation, LGPt=5 or LGPt=10, and TSt=0 or TSt=10.
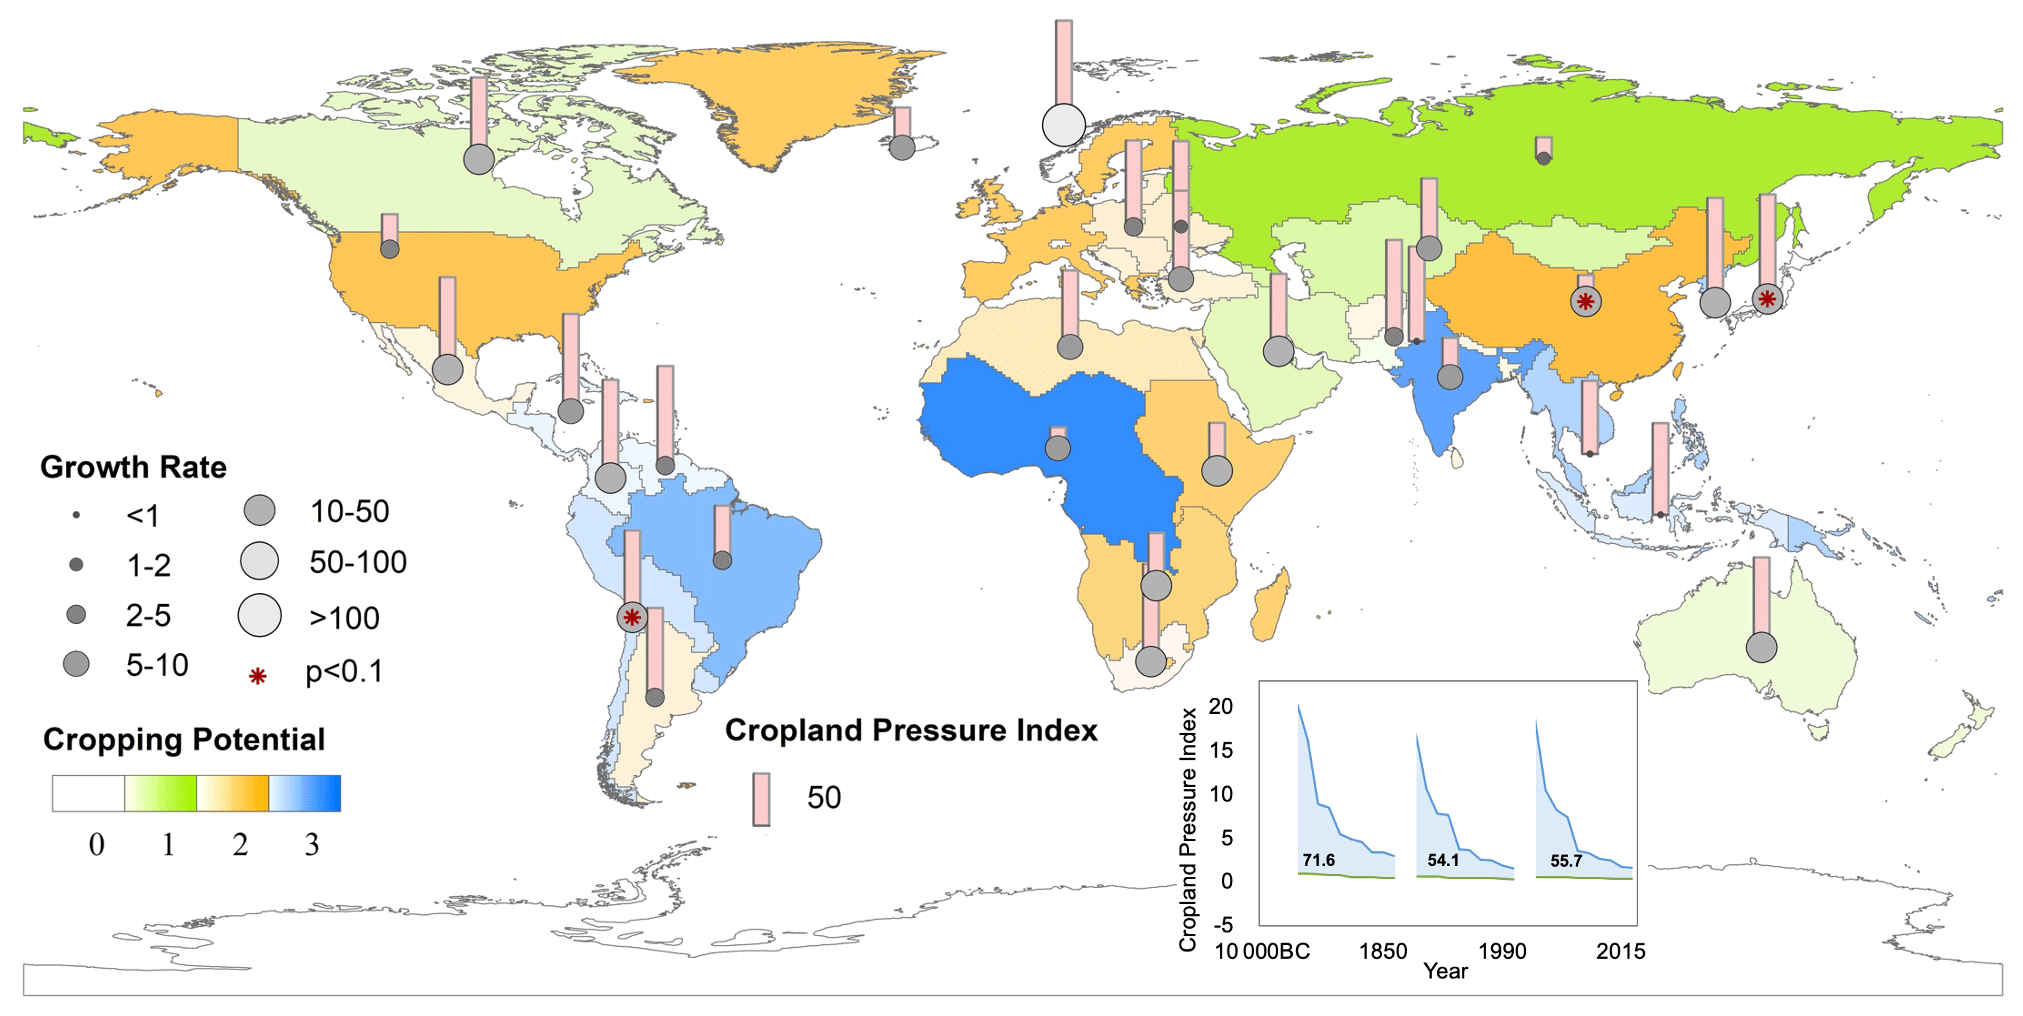
Figure 4Cropping potential inequality at regional scale from 10 000 BCE to 2015. The background color represents the cropping potential value in 2015, with the transparency indicating the cropland fraction in this region: the darker the color, the larger the fraction of cropland. The grey circle shows the cropping potential growth rate (×10 000) from 10 000 BCE to 2015, and the * in red means the region passed the significance test of 90 %. The red bar and the area chart display the crop pressure index in 2015 and the top 10 and bottom 10 regions from 10 000 BCE to 2015. In the inner plot, the x axis represents the top 10 countries of the “rich” (green line) cropland pressure index and the bottom 10 countries of the “poor” (blue line) cropland pressure index. The number in the blue area displays the cropland pressure index gap between rich and poor regions.
3.2 Increased cropping potential
To explain the effects of cropland expansion on cropping potential, we use the improved Global Agroecological Zones (GAEZ) model to calculate the cropping potential using bias-corrected hydrothermal conditions from simulations (see Methods). Our findings reveal that global expansion from 10 000 BCE to the present augments the total climate cropping potential, with a cumulative value of 0.006 across the entire period (Fig. 3a). Additionally, over the time from 10 000 BCE to 2015, the average increase in cropping potential was 0.0004 per 1 % expansion of cropland, 0.0024 per 1 % expansion from 1850 to 2015, and 0.0268 per 1 % expansion of cropland during 1990–2015, mirroring the slowed cropland expansion rate. A 1.2 % enhancement in global cropping potential was observed within the timeframe of 10 000 BCE to 2015 (see inset bar chart in Fig. 3a). That is, with the development of history, the rate of cropland expansion has slowed down, but the rate of increase in cropping potential caused by cropland expansion has increased significantly.
Consequently, the cropping potential attributable to the percentage of cropland expansion rises considerably. In general, cropland expansion contributes to an enhanced cropping potential, yielding a twofold increase in crop potential. This outcome signifies an elevated upper limit for planting and increased efficacy of irrigation for fertilization through strategic cropland expansion. Hence, regulated cropland expansion could prove advantageous for croplands by amplifying cropping potential.
From a spatial perspective, there are both upward and downward trends for cropping potential from 10 000 BCE to 2015 (Fig. 3a). Cropland expansion leads to different cropping potential changes among separate areas. There is a tendency to decrease the cropping potential in several major agricultural areas, particularly in Asia (central Asia, India, and China) and the northeastern United States, which belong to the temperate and subtropical east coast. The decline for central Asia and India is mainly from all the climate variables, and for China it is mainly from the precipitation and TS-related variables. In contrast, the temperature-related variables occupy the dominant position for the northeastern United States (Fig. 3c). While in Europe, South America, and South Africa, which belong to the tropical zones or close to the west coast zones, all agricultural areas are improving their cropping potential caused by the increase in temperature-related variables and precipitation in some cases (Fig. 3b). For areas that are not currently covered by cropland (out of the contour), e.g. the Middle East and north Australia, cropland has not expanded. Their cropping potential has declined due to the decrease in temperature and precipitation affected by cropland expansion in other areas. However, in northern Eurasia, the overall cropping potential for cropland, due to climate change caused by cropland expansion, is getting better, which demonstrates more favorable climatic conditions for crop growing as a result of cropland expansion elsewhere. Similar changes for temperature and precipitation from 1850 to 2015 and 1990 to 2015 were observed (Figs. S20 and S21).
3.3 Reduced cropping potential inequality
For further analysis of cropping potential inequality across the globe, an index called the cropland pressure index is introduced here. The cropland pressure index presents the pressure for cropping potential capacity (based on the cropland distribution) to carry the current population in each region (see Methods). The pressure for several leading agricultural powers is small, such as China, Russia, the United States, and India (Fig. 4). Even West Africa shows minimal pressure because of considerable cropping potential. At the same time, other regions are under great cropland pressure due to their high-density population on little cropland in places such as Japan or their inability to do anything about the potential of future cropland, such as the Middle East. The area chart from 10 000 BCE to 2015 is included here to quantify the inequality between regions (Fig. 4), indicating the cropland pressure index gap among the interquartile range (reduced by ≈20). Luckily, the cropland pressure index gap between rich and poor regions has narrowed, and inter-regional trade, such as the global trade in agricultural products, also narrows the gap.
From a historical development perspective, as the growth rate from 10 000 BCE to 2015 in Fig. 4 shows, the bigger and whiter the circle is, the faster the cropping potential growth rate, which means a huge potential for further cropland expansion. The figure shows that it nearly follows the trend of decreasing cropping potential growth from high latitudes to low latitudes (Chen, 2018; IPCC, 2014; Zhang and Ma, 2019). The region with the fastest growth potential is northern Europe (European Free in Table S1). The minimum potential growth rate is in Southeast Asia, indicating the higher latitudes have greater potential for improving hydrothermal conditions. The cropping potential growth rate in Africa, eastern Asia, and some Latin American countries is relatively rapid worldwide, with China, Japan, and Argentina passing the significance test, revealing the huge cropping potential of cropland expansion for these regions in the future. As for those regions with lower growth rates, the cropland expansion might be a low-efficiency way to increase the crop potential yield.
In conclusion, the study indicates that, spanning from 10 000 BCE to 2015, significant expansion of cropland has led to notable changes in near-surface temperature and precipitation patterns. Notably, average annual temperatures in high latitudes across regions like North America, northern Eurasia, India, South America, and central and southern Africa have been on the rise. Conversely, central and eastern Asia, the Middle East, northern Africa, and much of the United States have experienced a distinct cooling trend. Moreover, total annual precipitation has notably decreased in subtropical regions such as southern China, Thailand, India, the Middle East, and northern Africa, while tropical regions such East Africa, central Africa, and Southeast Asia have predominantly seen precipitation increases. These varied climate shifts have resulted in disparities in cropping potential across different regions.
Several major agricultural zones, notably in central Asia, India, China, and northeastern United States, have observed a decline in cropping potential. However, agricultural regions such as Europe, South America, and South Africa, where cropland is expanding, have witnessed an increase in cropping potential. Additionally, the growth rate of cropping potential generally follows a pattern of diminishing rates from high latitudes to low latitudes, indicating a greater cropping potential for improving hydrothermal conditions in higher latitudes. In regions with low potential growth rates of cropland, expanding cropland has minimal impact on enhancing local potential production.
When assessing current cropland pressure based on cropping potential, several major agricultural countries face minimal pressure, while other regions struggle with significant pressure due to population density on limited cropland or challenges in accessing cropping potential. Nevertheless, a positive observation is that the global disparity in cropland pressure has decreased, reflecting a reduction in inequality in cropping potential among regions. Overall, cropland expansion has led to an increase in cropping potential, highlighting the dual benefits of global cropland expansion for total crop production.
However, it is worth noting that all information presented is based on climate cropping potential, and experiments are conducted using only one climate model, which may be insufficient. Specific circumstances must also be determined based on factors such as soil conditions and altitude when implemented on the ground. Additionally, significant changes in cropping potential are globally observed only in prominent climate change regions. This study reveals the overall trend conclusion from a global perspective, and the accurate benefits brought by cropland expansion need to be analyzed based on specific regional conditions.
The CESM1.2.1 source code can be downloaded from the CESM official website at https://www.cesm.ucar.edu/models/cesm1.2/ (Hurrell et al., 2013).
The HYDE cropland distribution dataset is available through Klein Goldewijk et al. (2017). The CESM simulation data are available from the following figshare link: https://doi.org/10.6084/m9.figshare.26064403 (Liu, 2024).
The supplement related to this article is available online at: https://doi.org/10.5194/esd-15-817-2024-supplement.
XL drafted the manuscript with contributions from all the authors. XL and SL processed the data and finished the data analysis. LY and YW designed and guided the study. All authors participated in revising the manuscript.
The contact author has declared that none of the authors has any competing interests.
Publisher's note: Copernicus Publications remains neutral with regard to jurisdictional claims made in the text, published maps, institutional affiliations, or any other geographical representation in this paper. While Copernicus Publications makes every effort to include appropriate place names, the final responsibility lies with the authors.
This research has been supported by the National Key Research and Development Program of China (grant no. 2019YFA0606601), the Tsinghua University Initiative Scientific Research Program (grant no. 20223080017), the National Key Scientific and Technological Infrastructure project “Earth System Science Numerical Simulator Facility” (EarthLab), and the Laboratory fund of the Chinese Academy of Sciences (grant no. CXJJ-22S032).
This paper was edited by Zhenghui Xie and reviewed by two anonymous referees.
Arora, V. K. and Montenegro, A.: Small temperature benefits provided by realistic afforestation efforts, Nat. Geosci., 4, 514–518, 2011.
Bahar, N. H., Lo, M., Sanjaya, M., Van Vianen, J., Alexander, P., Ickowitz, A., and Sunderland, T.: Meeting the food security challenge for nine billion people in 2050: What impact on forests, Global Environ. Chang., 62, 102056, https://doi.org/10.1016/j.gloenvcha.2020.102056, 2020.
Bennett, E. M., Carpenter, S. R., and Caraco, N. F.: Human impact on erodable phosphorus and eutrophication: a global perspective: increasing accumulation of phosphorus in soil threatens rivers, lakes, and coastal oceans with eutrophication, BioScience, 51, 227–234, 2001.
Bonan, G. B., Pollard, D., and Thompson, S. L.: Effects of boreal forest vegetation on global climate, Nature, 359, 716–718, 1992.
Brovkin, V., Sitch, S., Von Bloh, W., Claussen, M., Bauer, E., and Cramer, W.: Role of land cover changes for atmospheric CO2 increase and climate change during the last 150 years, Glob. Change Biol., 10, 1253–1266, 2004.
Calvin, K., Bond-Lamberty, B., Clarke, L., Edmonds, J., Eom, J., Hartin, C., Kim, S., Kyle, P., Link, R., and Moss, R.: The SSP4: A world of deepening inequality, Global Environ. Chang., 42, 284–296, 2017.
Chemke, R., Kaspi, Y., and Halevy, I.: The thermodynamic effect of atmospheric mass on early Earth's temperature, Geophys. Res. Lett., 43, 11414–11422, 2016.
Chen, B.: Globally Increased Crop Growth and Cropping Intensity from the Long-Term Satellite-Based Observations, ISPRS Annals of Photogrammetry, Remote Sensing & Spatial Information Sciences, 4, 45–52, https://doi.org/10.5194/isprs-annals-IV-3-45-2018, 2018.
Chen, C., Li, D., Li, Y., Piao, S., Wang, X., Huang, M., Gentine, P., Nemani, R. R., and Myneni, R. B.: Biophysical impacts of Earth greening largely controlled by aerodynamic resistance, Science Adv., 6, eabb1981, https://doi.org/10.1126/sciadv.abb1981, 2020.
Cole, M. B., Augustin, M. A., Robertson, M. J., and Manners, J. M.: The science of food security, npj Science of Food, 2, 1–8, 2018.
Defourny, P., Schouten, L., Bartalev, S., Bontemps, S., Caccetta, P., De Wit, A., Di Bella, C. M., Gérard, B., Giri, P., and Gond, V.: Accuracy assessment of a 300 m global land cover map: The GlobCover experience, s.n.33rd International Symposium on Remote Sensing of Environment (ISRSE), 4–8 May 2009, Stresa, Italy, 2009.
Defourny, P., Bontemps, S., Lamarche, C., Brockmann, C., Boettcher, M., Wevers, J., and Kirches, G.: Land Cover CCI: Product User Guide Version 2.0., ESA. Land Cover CCI Product User Guide Version 2. Tech. Rep., https://maps.elie.ucl.ac.be/CCI/viewer/download/ESACCI-LC-Ph2-PUGv2_2.0.pdf (last access: 24 June 20224), 2017.
DeFries, R. S., Foley, J. A., and Asner, G. P.: Land-use choices: Balancing human needs and ecosystem function, Front. Ecol. Environ., 2, 249–257, 2004.
Delzeit, R., Zabel, F., Meyer, C., and Václavík, T.: Addressing future trade-offs between biodiversity and cropland expansion to improve food security, Reg. Environ. Change, 17, 1429–1441, 2017.
Diffenbaugh, N. S. and Burke, M.: Global warming has increased global economic inequality, P. Natl. Acad. Sci. USA, 116, 9808–9813, 2019.
Eyring, V., Bony, S., Meehl, G. A., Senior, C. A., Stevens, B., Stouffer, R. J., and Taylor, K. E.: Overview of the Coupled Model Intercomparison Project Phase 6 (CMIP6) experimental design and organization, Geosci. Model Dev., 9, 1937–1958, https://doi.org/10.5194/gmd-9-1937-2016, 2016.
Fischer, G., Shah, M., N. Tubiello, F., and Van Velhuizen, H.: Socio-economic and climate change impacts on agriculture: an integrated assessment, 1990–2080, Philos. T. Roy. Soc. B, 360, 2067–2083, 2005.
Fischer, G., Nachtergaele, F. O., van Velthuizen, H., Chiozza, F., Francheschini, G., Henry, M., Muchoney, D., and Tramberend, S.: Global Agro-ecological Zones (GAEZ v4)-Model Documentation, FAO & IIASA, Laxenburg, Austria; Rome, Italy, https://doi.org/10.4060/cb4744en, 2021.
Folberth, C., Khabarov, N., Balkovič, J., Skalský, R., Visconti, P., Ciais, P., Janssens, I. A., Peñuelas, J., and Obersteiner, M.: The global cropland-sparing potential of high-yield farming, Nat. Sustain., 3, 281–289, 2020.
Foley, J. A., DeFries, R., Asner, G. P., Barford, C., Bonan, G., Carpenter, S. R., Chapin, F. S., Coe, M. T., Daily, G. C., and Gibbs, H. K.: Global consequences of land use, Science, 309, 570–574, 2005.
Godfray, H. C. J., Beddington, J. R., Crute, I. R., Haddad, L., Lawrence, D., Muir, J. F., Pretty, J., Robinson, S., Thomas, S. M., and Toulmin, C.: Food security: the challenge of feeding 9 billion people, Science, 327, 812–818, 2010.
Gong, P., Wang, J., Yu, L., Zhao, Y., Zhao, Y., Liang, L., Niu, Z., Huang, X., Fu, H., and Liu, S.: Finer resolution observation and monitoring of global land cover: first mapping results with Landsat TM and ETM+ data, Int. J. Remote Sens., 34, 2607–2654, 2013.
Hasan, S. S., Zhen, L., Miah, M. G., Ahamed, T., and Samie, A.: Impact of land use change on ecosystem services: A review, Environmental Development, 34, 100527, https://doi.org/10.1016/j.envdev.2020.100527, 2020.
Hu, Q., Xiang, M., Chen, D., Zhou, J., Wu, W., and Song, Q.: Global cropland intensification surpassed expansion between 2000 and 2010: A spatio-temporal analysis based on GlobeLand30, Sci. Total Environ., 746, 141035, https://doi.org/10.1016/j.scitotenv.2020.141035, 2020.
Hurrell, J. W., Holland, M. M., Gent, P. R., Ghan, S., Kay, J. E., Kushner, P. J., Lamarque, J.-F., Large, W. G., Lawrence, D., and Lindsay, K.: The community earth system model: a framework for collaborative research, B. Am. Meteor. Soc., 94, 1339–1360, https://doi.org/10.1175/BAMS-D-12-00121.1, 2013 (code availbale at: https://www.cesm.ucar.edu/models/cesm1.2/, last access: 24 June 2024).
Hurtt, G. C., Chini, L., Sahajpal, R., Frolking, S., Bodirsky, B. L., Calvin, K., Doelman, J. C., Fisk, J., Fujimori, S., Klein Goldewijk, K., Hasegawa, T., Havlik, P., Heinimann, A., Humpenöder, F., Jungclaus, J., Kaplan, J. O., Kennedy, J., Krisztin, T., Lawrence, D., Lawrence, P., Ma, L., Mertz, O., Pongratz, J., Popp, A., Poulter, B., Riahi, K., Shevliakova, E., Stehfest, E., Thornton, P., Tubiello, F. N., van Vuuren, D. P., and Zhang, X.: Harmonization of global land use change and management for the period 850–2100 (LUH2) for CMIP6, Geosci. Model Dev., 13, 5425–5464, https://doi.org/10.5194/gmd-13-5425-2020, 2020.
Iizumi, T. and Ramankutty, N.: How do weather and climate influence cropping area and intensity?, Global Food Security, 4, 46–50, 2015.
IPCC: Climate change 2014: synthesis report. Contribution of Working Groups I, II and III to the fifth assessment report of the Intergovernmental Panel on Climate Change, hdl:10013/epic.45156.d001, 2014.
Kates, R. W., Clark, W. C., Corell, R., Hall, J. M., Jaeger, C. C., Lowe, I., McCarthy, J. J., Schellnhuber, H. J., Bolin, B., and Dickson, N. M.: Sustainability science, Science, 292, 641–642, 2001.
Kay, J. E., Deser, C., Phillips, A., Mai, A., Hannay, C., Strand, G., Arblaster, J. M., Bates, S., Danabasoglu, G., and Edwards, J.: The Community Earth System Model (CESM) large ensemble project: A community resource for studying climate change in the presence of internal climate variability, B. Am. Meteor. Soc., 96, 1333–1349, 2015.
Klein Goldewijk, K., Beusen, A., Doelman, J., and Stehfest, E.: Anthropogenic land use estimates for the Holocene – HYDE 3.2, Earth Syst. Sci. Data, 9, 927–953, https://doi.org/10.5194/essd-9-927-2017, 2017.
Lawrence, P. J. and Chase, T. N.: Representing a new MODIS consistent land surface in the Community Land Model (CLM 3.0), J. Geophys. Res.-Biogeo., 112, 0148–0227, https://doi.org/10.1029/2006JG000168, 2007.
Lee, S., Gong, T., Johnson, N., Feldstein, S. B., and Pollard, D.: On the possible link between tropical convection and the Northern Hemisphere Arctic surface air temperature change between 1958 and 2001, J. Climate, 24, 4350–4367, 2011.
Levers, C., Butsic, V., Verburg, P. H., Mueller, D., and Kuemmerle, T.: Drivers of changes in agricultural intensity in Europe, Land Use Policy, 58, 380–393, 2016.
Li, Y., Piao, S., Chen, A., Ciais, P., and Li, L. Z.: Local and teleconnected temperature effects of afforestation and vegetation greening in China, Nat. Sci. Rev., 7, 897–912, 2020.
Liu, X.: Global cropland expansion enhances cropping potential and reduces its inequality among countries, figshare [data set], https://doi.org/10.6084/m9.figshare.26064403.v1, 2024.
Liu, S., Liu, X., Yu, L., Wang, Y., Zhang, G. J., Gong, P., Huang, W., Wang, B., Yang, M., and Cheng, Y.: Climate response to introduction of the ESA CCI land cover data to the NCAR CESM, Clim. Dynam., 56, 4109–4127, https://doi.org/10.1007/s00382-021-05690-3, 2021.
Liu, X., Liang, X., Li, X., Xu, X., Ou, J., Chen, Y., Li, S., Wang, S., and Pei, F.: A future land use simulation model (FLUS) for simulating multiple land use scenarios by coupling human and natural effects, Landscape Urban Plan., 168, 94–116, 2017.
Liu, X., Yu, L., Si, Y., Zhang, C., Lu, H., Yu, C., and Gong, P.: Identifying patterns and hotspots of global land cover transitions using the ESA CCI Land Cover dataset, Remote Sens. Lett., 9, 972–981, 2018.
Lloyd, C. T., Chamberlain, H., Kerr, D., Yetman, G., Pistolesi, L., Stevens, F. R., Gaughan, A. E., Nieves, J. J., Hornby, G., and MacManus, K.: Global spatio-temporally harmonised datasets for producing high-resolution gridded population distribution datasets, Big Earth Data, 3, 108–139, 2019.
Mauser, W., Klepper, G., Zabel, F., Delzeit, R., Hank, T., Putzenlechner, B., and Calzadilla, A.: Global biomass production potentials exceed expected future demand without the need for cropland expansion, Nat. Commun., 6, 1–11, 2015.
Mehrabi, Z., Ellis, E. C., and Ramankutty, N.: The challenge of feeding the world while conserving half the planet, Nat. Sustain., 1, 409–412, https://doi.org/10.1038/s41893-018-0119-8, 2018.
Neale, R. B., Chen, C.-C., Gettelman, A., Lauritzen, P. H., Park, S., Williamson, D. L., Conley, A. J., Garcia, R., Kinnison, D., and Lamarque, J.-F.: Description of the NCAR community atmosphere model (CAM 5.0), NCAR Tech. Note NCAR/TN-486+ STR, 1, 1–12, https://doi.org/10.5065/wgtk-4g06, 2010.
Oleson, K. W., Lawrence, D. M., Gordon, B., Flanner, M. G., Kluzek, E., Peter, J., Levis, S., Swenson, S. C., Thornton, E., and Feddema, J.: Technical description of version 4.0 of the Community Land Model (CLM), https://doi.org/10.5065/D6FB50WZ, 2010.
Ortiz-Bobea, A., Ault, T. R., Carrillo, C. M., Chambers, R. G., and Lobell, D. B.: Anthropogenic climate change has slowed global agricultural productivity growth, Nat. Clim. Change, 11, 306–312, 2021.
Parodi, A., Leip, A., De Boer, I. J. M., Slegers, P. M., Ziegler, F., Temme, E. H. M., Herrero, M., Tuomisto, H., Valin, H., Van Middelaar, C. E., Van Loon, J. J. A., and Van Zanten, H. H. E.: The potential of future foods for sustainable and healthy diets, Nat. Sustain., 1, 782–789, https://doi.org/10.1038/s41893-018-0189-7, 2018.
Potapov, P., Turubanova, S., Hansen, M. C., Tyukavina, A., Zalles, V., Khan, A., Song, X.-P., Pickens, A., Shen, Q., and Cortez, J.: Global maps of cropland extent and change show accelerated cropland expansion in the twenty-first century, Nat. Food, 3, 19–28, 2022.
Ramankutty, N., Evan, A. T., Monfreda, C., and Foley, J. A.: Farming the planet: 1. Geographic distribution of global agricultural lands in the year 2000, Global Biogeochem. Cy., 22, GB1003, https://doi.org/10.1029/2007GB002952, 2008.
Ritchie, H. and Roser, M.: Land use, Our World in Data, https://ourworldindata.org/land-use (last access: 24 June 2024), 2013.
Rockström, J., Steffen, W., Noone, K., Persson, Å., Chapin, F. S., Lambin, E. F., Lenton, T. M., Scheffer, M., Folke, C., and Schellnhuber, H. J.: A safe operating space for humanity, Nature, 461, 472–475, 2009.
Rohrschneider, T., Stevens, B., and Mauritsen, T.: On simple representations of the climate response to external radiative forcing, Clim. Dynam., 53, 3131–3145, 2019.
Sampaio, G., Nobre, C., Costa, M. H., Satyamurty, P., Soares-Filho, B. S., and Cardoso, M.: Regional climate change over eastern Amazonia caused by pasture and soybean cropland expansion, Geophys. Res. Lett., 34, L17709, https://doi.org/10.1029/2007GL030612, 2007.
Sasmito, S. D., Taillardat, P., Clendenning, J. N., Cameron, C., Friess, D. A., Murdiyarso, D., and Hutley, L. B.: Effect of land-use and land-cover change on mangrove blue carbon: A systematic review, Glob. Change Biol., 25, 4291–4302, 2019.
Searchinger, T. D., Estes, L., Thornton, P. K., Beringer, T., Notenbaert, A., Rubenstein, D., Heimlich, R., Licker, R., and Herrero, M.: High carbon and biodiversity costs from converting Africa's wet savannahs to cropland, Nat. Clim. Change, 5, 481–486, 2015.
Steinfeld, H., Gerber, P., Wassenaar, T., Castel, V., Rosales, M., Rosales, M., and de Haan, C.: Livestock's long shadow: environmental issues and options, Food & Agriculture Org., https://www.fao.org/4/a0701e/a0701e00.htm (last access: 24 June 2024), 2006.
Sterling, S. M., Ducharne, A., and Polcher, J.: The impact of global land-cover change on the terrestrial water cycle, Nat. Clim. Change, 3, 385–390, 2013.
UN: Sustainable development goals (SDG), https://unstats.un.org/sdgs/report/2018 (last access: 24 June 2024), 2018.
Wall, D. H., Nielsen, U. N., and Six, J.: Soil biodiversity and human health, Nature, 528, 69–76, 2015.
Wang, J., Vanga, S. K., Saxena, R., Orsat, V., and Raghavan, V.: Effect of climate change on the yield of cereal crops: A review, Climate, 6, 41, 2018.
Wang, Y., Zhang, G. J., and Jiang, Y.: Linking stochasticity of convection to large-scale vertical velocity to improve Indian summer monsoon simulation in the NCAR CAM5, J. Climate, 31, 6985–7002, 2018.
Wu, W., Yu, Q., You, L., Chen, K., Tang, H., and Liu, J.: Global cropping intensity gaps: Increasing food production without cropland expansion, Land Use Policy, 76, 515–525, 2018.
Wu, W.-B., Yu, Q.-Y., Peter, V. H., YOU, L.-Z., Peng, Y., and Tang, H.-J.: How could agricultural land systems contribute to raise food production under global change?, J. Int. Agr., 13, 1432–1442, 2014.
Yan, M., Liu, J., and Wang, Z.: Global climate responses to land use and land cover changes over the past two millennia, Atmosphere, 8, 64, https://doi.org/10.3390/atmos8040064, 2017.
Yang, X., Chen, F., Lin, X., Liu, Z., Zhang, H., Zhao, J., Li, K., Ye, Q., Li, Y., and Lv, S.: Potential benefits of climate change for crop productivity in China, Agr. Forest Meteorol., 208, 76–84, 2015.
Yu, L., Wang, J., Clinton, N., Xin, Q., Zhong, L., Chen, Y., and Gong, P.: FROM-GC: 30 m global cropland extent derived through multisource data integration, Int. J. Digit. Earth, 6, 521–533, 2013.
Zabel, F., Delzeit, R., Schneider, J. M., Seppelt, R., Mauser, W., and Václavík, T.: Global impacts of future cropland expansion and intensification on agricultural markets and biodiversity, Nat. Commun., 10, 1–10, 2019.
Zeng, Z., Piao, S., Li, L. Z., Zhou, L., Ciais, P., Wang, T., Li, Y., Lian, X., Wood, E. F., and Friedlingstein, P.: Climate mitigation from vegetation biophysical feedbacks during the past three decades, Nat. Clim. Change, 7, 432–436, 2017.
Zhang, X. and Ma, X.: Misplaced optimism in agricultural land usage driven by newly available climate resources: A case study of estimated and realized cropping intensity in northern and northeastern China, Climate Risk Management, 25, 100194, https://doi.org/10.1016/j.crm.2019.100194, 2019.
Zhao, Y., Feng, D., Yu, L., Cheng, Y., Zhang, M., Liu, X., Xu, Y., Fang, L., Zhu, Z., and Gong, P.: Long-term land cover dynamics (1986–2016) of northeast china derived from a multi-temporal landsat archive, Remote Sens., 11, 599, https://doi.org/10.3390/rs11050599, 2019.