the Creative Commons Attribution 4.0 License.
the Creative Commons Attribution 4.0 License.
 | 29 Aug 2023
The global impact of the transport sectors on the atmospheric aerosol and the resulting climate effects under the Shared Socioeconomic Pathways (SSPs)
Johannes Hendricks
Sabine Brinkop
A global aerosol–climate model is applied to quantify the impact of the transport sectors (land transport, shipping, and aviation) on aerosol and climate. Global simulations are performed for the present day (2015), based on the emission inventory of the Climate Model Intercomparison Project Phase 6 (CMIP6), and for near-term (2030) and mid-term (2050) future projections, under the Shared Socioeconomic Pathways (SSPs). The results for the present day show that land transport emissions have a large impact on near-surface concentrations of black carbon and aerosol nitrate over the most populated areas of the globe, but with contrasting patterns in terms of relative contributions between developed and developing countries. In spite of the recently introduced regulations to limit the fuel sulfur content in the shipping sector, shipping emissions are still responsible for a considerable impact on aerosol sulfate near-surface concentrations, about 0.5 to 1 µg m−3 in the most travelled regions, with significant effects on continental air pollution and in the northern polar regions as well. Aviation impacts on aerosol mass are found to be quite small, of the order of a few nanograms per cubic metre, while this sector considerably affects particle number concentrations, contributing up to 20 %–30 % of the upper-tropospheric particle number concentration at the northern mid-latitudes. The transport-induced impacts on aerosol mass and number concentrations result in a present-day radiative forcing of −164, −145, and −64 mW m−2 for land transport, shipping, and aviation, respectively, with a dominating contribution by aerosol–cloud interactions. These forcings represent a marked offset to the CO2 warming from the transport sectors and are therefore very relevant for climate policy. The projections under the SSPs show that the impact of the transport sectors on aerosol and climate are generally consistent with the narratives underlying these scenarios: the lowest impacts of transport on both aerosol and climate are simulated under SSP1, especially for the land transport sector, while SSP3 is generally characterized by the largest effects. Notable exceptions to this picture, however, exist, as the emissions of other anthropogenic sectors also contribute to the overall aerosol concentrations and thus modulate the relevance of the transport sectors in the different scenarios, not always consistently with their underlying storyline. On a qualitative level, the results for the present day mostly confirm the findings of our previous assessment for the year 2000, which used a predecessor version of the same model and the CMIP5 emission data. Some important quantitative differences are found, which can mostly be ascribed to the improved representation of aerosol background concentrations in the present study.
- Article
(12265 KB) - Full-text XML
-
Supplement
(18449 KB) - BibTeX
- EndNote


With a share of 14 % (8.5 Pg) of the total CO2-equivalent emissions in 2018, the transport sectors are major contributors to climate change (Lamb et al., 2021). This share is dominated by land transport (including road and rail transport and inland navigation), which is responsible for 80.4 % of it, while international shipping and aviation (international and domestic) account for the remaining 8.4 % and 11.2 %, respectively. Moreover, the transport sectors are characterized by an approximately steady growth in emissions of greenhouse gases, at a rate of about 2 % per year in the last 3 decades, mostly driven by developed countries (North America and Europe) and, since the beginning of the century, by the fast-growing economies of eastern Asia (Lamb et al., 2021). Traffic volumes are projected to grow further in the coming decades (Girod et al., 2013; Sims et al., 2014), modulated by the current efforts to decarbonize this sector in order to achieve the goals of the Paris Agreement (Pietzcker et al., 2014; Creutzig et al., 2015; Esmeijer et al., 2020) and by the uncertain recovery path from the COVID-19 pandemic, which significantly affected the recent global emissions (Liu et al., 2020; Le Quéré et al., 2020).
Although the climate policies mostly target the emissions of CO2 and other greenhouse gases, the combustion processes powering vehicles, ships, and aircraft are also responsible for the emissions of several types of short-lived pollutants, such as nitrogen oxides (NOx = NO + NO2); carbon monoxide (CO); non-methane hydrocarbons (NMHCs); sulfur dioxide (SO2); and aerosol particles in form of black carbon (BC), organic carbon (OC), and primary aerosol sulfate (SO4). These compounds have a detrimental effect on the air quality and can also impact climate (Fiore et al., 2012; von Schneidemesser et al., 2015). For example, NOx and NMHCs are precursors of ozone, which is a well-known greenhouse gas (e.g. Stevenson et al., 2013; Mertens et al., 2018), while aerosols and their precursors can alter the planetary radiation balance via their direct interaction with solar radiation (absorption and scattering, leading to warming and cooling, respectively; Boucher et al., 2013). Perhaps most importantly, aerosol can further impact the climate by interacting with clouds and modifying their radiative properties, resulting in an overall cooling effect (Bellouin et al., 2020). Air pollution reduction measures targeting these compounds may therefore affect both air quality and climate, with beneficial effects for both in some cases (e.g. when targeting BC, which has a warming effect on climate and a detrimental impact on air quality; Bond et al., 2013) and trade-offs in other cases, like sulfur reduction policies, which improve air quality but reduce the cooling impact due to the aerosol indirect effect on clouds (Fuglestvedt et al., 2009). Furthermore, these policies are implemented at different scales, with land transport being mostly targeted at the national or regional (e.g. European) level, while shipping and aviation are regulated at the international level, via the International Maritime Organization (IMO) and the International Civil Aviation Organization (ICAO), respectively, although regional policies are also applied in shipping, for instance the implementation of the Sulfur Emissions Control Areas (SECAs; Buhaug et al., 2009; Smith et al., 2014). To fully characterize the impact of short-lived pollutants from the transport sectors it is therefore necessary to consistently account for changes in the atmospheric composition and climate impact and, at the same time, to address regional dependencies.
In this study, we focus on the impact of transport-induced aerosol and aerosol precursor species. We update the assessments of Righi et al. (2013, 2015, 2016) and improve them in three major aspects:
-
We use the recent CMIP6 emission inventory (Gidden et al., 2019; Feng et al., 2020), thus replacing the CMIP5 inventory (Lamarque et al., 2010) applied in our previous studies, and now consider the year 2015 instead of 2000 as a reference for present-day conditions.
-
We implement the Shared Socioeconomic Pathways (SSPs; O'Neill et al., 2017) for the future projections, which are a new generation of scenarios developed in support of the Intergovernmental Panel on Climate Change (IPCC) Sixth Assessment Report (Gidden et al., 2019). They are socioeconomic scenarios that include assumptions on several indicators (population, wealth, urbanization, etc.) to describe society's ability to cope with climate change and are further combined with the climate pathways based on the narratives of Representative Concentration Pathways (RCPs; van Vuuren et al., 2011) for climate policies, resulting in a matrix of possible futures.
-
We apply a newer version of the global chemistry–climate model EMAC (ECHAM-MESSy Atmospheric Chemistry; Jöckel et al., 2010), featuring an updated aerosol scheme (MADE3, i.e. the third version of the Modal Aerosol Dynamics for Europe adapted for global applications; Kaiser et al., 2014) and a state-of-the-art two-moment cloud scheme (Kuebbeler et al., 2014) accounting for aerosol–cloud interactions for all cloud phases (liquid, mixed phase, and ice). This model configuration has been thoroughly tuned and evaluated by Kaiser et al. (2019) and Righi et al. (2020), demonstrating its ability to represent key aspects of aerosol, cloud, and radiation processes.
Being key targets of decarbonization and air pollution control policies, the transport sectors are the subject of active research. Lund et al. (2014a) applied a global chemistry-transport model to quantify the effect of short-lived pollutants on climate when replacing conventional diesel fuels with biofuels in the EU road transport sector and found a 15 % and 80 % reduction in radiative forcing (RF) when replacing 20 % and 100 % of diesel with biofuels, respectively. Lund et al. (2014b) considered the climate impact of black carbon from road diesel engines in 2010 and 2050 following a current-legislation scenario and found that Europe gives the largest contribution in 2010, while southern and eastern Asia dominate in 2050, as a result of different implementations of reduction measures. The potential global relevance of local policies on land-based transport was highlighted by Hendricks et al. (2018), who estimated the climate impact of German land-based transport using a combination of modelling techniques and found that this is dominated by CO2, while the effect of short-lived pollutants is negligible. They also note, however, that this might be different in other regions or countries, depending on the specific composition of the land transport fleet and on its age as well as on the photochemical activity, which varies considerably around the globe. The climate impact of ozone from global land transport and shipping was quantified by Mertens et al. (2018), who applied an innovative tagging method to track the emissions from specific sectors in a global model simulation and thus isolated the climate impact with better accuracy than in standard perturbation approaches. This resulted in higher land-transport- and shipping-induced concentrations of surface-level ozone and in a RF of 92 and 62 mW m−2 for the two sectors, respectively. The shipping sector is particularly interesting due to the new regulations introduced by MARPOL 73/78 (the International Convention for the Prevention of Pollution from Ships) in its Annex VI to globally limit fuel sulfur content (FSC) in shipping (Buhaug et al., 2009), which took full effect in 2020. Sofiev et al. (2018), Kontovas (2020), and Bilsback et al. (2020) showed how reducing FSC leads to reduced SO2 emissions and lower shipping-induced aerosol concentrations: while this is beneficial for air quality and reduces premature mortality, it may also remove the cooling from the aerosol effects, hence accelerating global warming. Another policy-relevant issue is the opening of Arctic routes in the near future (Stephenson et al., 2018) and its impacts on the regional and global climate.
As shown in Righi et al. (2013, hereafter R13), FSC is also critical for the aviation sector, as sulfate particles produced in the aircraft exhaust plume could be transported downwards and potentially impact low-level clouds, resulting in a significant (albeit quite uncertain) aerosol indirect effect. R13 estimated this effect to be between −70 and −15 mW m−2, depending on the assumptions on the size of the emitted sulfate particles, but found no statistically significant effect when a low FSC was assumed for the aircraft fleet. This effect was also simulated by Gettelman and Chen (2013), who however considered generally smaller particle sizes for aerosol sulfate in their assumptions, thus finding a larger RF in the range of −164 to −23 mW m−2. A later study by Kapadia et al. (2016) supported these estimates and again found a reduction in the indirect effect under a scenario with low aviation FSC, while Matthes et al. (2021) showed that the impact of aviation aerosol on low clouds may be dependent on the cruise altitude of the global fleet. Aviation emissions of soot also potentially impact ice clouds (Hendricks et al., 2005, 2011; Penner et al., 2018), but this effect is very uncertain and strongly dependent on the assumed ice nucleating abilities of soot. In the model configuration adopted in the present study, we conservatively assume a very low ice-nucleating efficiency for aviation soot so that its impact on climate via the interaction with natural cirrus clouds may be considered negligible (Righi et al., 2021).
Despite active research on the impact of the transport sectors on the atmosphere and climate, the literature on the impact of specific sectors in the context of the SSPs is still limited, and a detailed analysis of the role of transport-induced aerosol is still lacking. Lund et al. (2019) assessed the anthropogenic aerosol forcing in a subset of the SSP scenarios until the end of the century, concluding that the air pollution control measures assumed in these scenarios span a much broader range of emissions than in the previous RCPs. Lund et al. (2020) used a climate response emulator to calculate the temperature response of various short-lived compounds under the SSPs and compared it to the one of CO2, showing that the role of short-lived compounds on climate is projected to remain relevant throughout the century, with strong regional variations. Hence, reassessing the impact of transport on aerosol concentrations, also with a focus on regional effects, is essential to understand the scope of the air pollution measures covered by the SSP narratives and the resulting climate impacts.
This paper is organized as follows: Sect. 2 briefly describes the EMAC model with the aerosol submodel MADE3 and the method used to estimate the impact of the transport sectors. A detailed analysis of the emission inventories for the present day and the future projections is provided in Sect. 3, focusing on the share of the three transport sectors in the total emissions of aerosol and precursors. The impact of transport on the aerosol concentration is discussed in Sect. 4, while Sect. 5 deals with the climate impacts. A summary of the conclusions of this study is provided in Sect. 6.
In this assessment we apply the global model EMAC with the aerosol submodel MADE3. EMAC is a chemistry and climate model featuring several submodels to simulate tropospheric and middle-atmospheric processes and their interaction with oceans, land, and human influences (Jöckel et al., 2010). EMAC is based on the second version of the Modular Earth Submodel System (MESSy) to link multi-institutional computer codes. The core atmospheric model is the ECHAM5 (fifth-generation European Centre Hamburg) general circulation model (Roeckner et al., 2006). Aerosol microphysics is represented by the aerosol submodel MADE3 (Kaiser et al., 2014), which considers aerosol sulfate, ammonium, nitrate, sea salt, particulate organic matter, black carbon, mineral dust, and aerosol water. These species are distributed among nine aerosol modes, resulting from the combination of three size classes (Aitken, accumulation, and coarse) with three particle mixing states (soluble, insoluble, and mixed particles). The representation of aerosol mass and number concentrations in MADE3 has been evaluated in detail in Kaiser et al. (2019), using observational data from various station networks around the globe, from aircraft campaigns, and from satellite observations.
For the present study, we apply the model configuration developed by Righi et al. (2020, 2021), which further includes an explicit representation of aerosol–radiation and aerosol–cloud interactions. Cloud microphysics and precipitation are dealt with by the CLOUD submodel, which in this configuration considers aerosol effects on warm, mixed-phase, and cirrus clouds based on the two-moment cloud scheme by Kuebbeler et al. (2014). Cloud–radiation and aerosol–radiation interactions are simulated by the submodels CLOUDOPT and RAD (Dietmüller et al., 2016), respectively. As the focus of this study lies in the radiative effects of aerosol and clouds, the concentrations of the radiatively active gases CO2, CH4, N2O, O3, and chlorofluorocarbons are prescribed using globally averaged values for the year 2015. The studies by Kaiser et al. (2019) and Righi et al. (2020) demonstrated the model's ability to reproduce the relevant observed aerosol properties both close to the surface and in the middle and upper troposphere, as well as the main cloud and radiative properties. This configuration of EMAC is therefore suited to the scope of the present study.
The chosen model resolution is T42L41, corresponding to a horizontal resolution of about 2.8∘ × 2.8∘ in latitude and longitude (roughly 300 km at the Equator), with 41 non-equidistant vertical levels from the ground to about 5 hPa, mostly centred within the troposphere. All simulations cover a period of 11 years, between 2005 and 2015, with the first year used as spin-up and hence not included in the analysis. The model meteorology (temperature, winds, and logarithm of the surface pressure) is nudged using the ERA-Interim reanalysis data for the same time period (Dee et al., 2011).
As in R13, the effects of the transport sectors are quantified using the perturbation approach, in which a reference simulation is compared to a sensitivity one where the emissions of a given sector are completely neglected. In the following sections, we show both the absolute change (A) due to the emissions from the given sector and their relative contribution (R) to a specific quantity (e.g. burden or concentration). Considering, for instance, the land transport sector, these are defined as
where REF is the reference simulation and NOLAND the sensitivity simulation with land transport emissions switched off. The same applies to the other two sectors, i.e. shipping and aviation. The statistical significance of A and R is verified by means of a two-tailed t test with respect to the interannual variability. We consider the results to be statistically significant when their confidence level is above 95 %.
As shown by R13, the perturbation method outlined above could lead to some inaccuracies in the estimated effects, due to the non-linearities in the involved processes, which in particular affect the secondary aerosol species. Alternative methods, such as for example tagging (Grewe, 2013; Rieger et al., 2018; Mertens et al., 2018), are hard to apply to the aerosol phase, especially for secondary species, due to the difficulties in tracking the chemical processes taking place in both the gas phase and the liquid phase (e.g. aerosol sulfate formation). Furthermore, the bulk of the climate effects estimated here are expected to result from aerosol interactions with clouds, which cannot be isolated with the tagging approach, due to the prominent role of feedbacks.
The model simulations performed in this study are driven by the anthropogenic and open-burning emission datasets developed in support of the CMIP6 project (Gidden et al., 2019; Feng et al., 2020). The emission data cover the historical period from the pre-industrial time (1750) to the present day (2014) and future projections until the year 2100 based on the SSPs (O'Neill et al., 2017). A harmonization procedure is applied to the scenarios to guarantee a smooth transition of the historical emission trajectories into the future projections (see Gidden et al., 2019, for details).
A series of specific assumptions lie behind each of the SSP narratives, concerning, for instance, population and economic growth, urbanization level, policy implementation, technological advancements, availability of resources, human and societal developments, etc. These assumptions are then elaborated by integrated assessment models to produce emission projections for greenhouse gases, short-lived gases, and aerosol particles. Note that in their reference version, the SSP storylines do not assume any implementation of climate policies. In the matrix framework of the SSPs (van Vuuren et al., 2014), climate policies are included at a later stage, when the reference scenarios are combined with mitigation scenarios using the same approach as in the RCPs (Moss et al., 2010; van Vuuren et al., 2011), i.e. targeting a given anthropogenic RF in the year 2100.
Here, we consider a present-day case (2015) and two projections, for a near- (2030) and mid-term (2050) future, both under three SSPs: SSP1 (van Vuuren et al., 2017), SSP2 (Fricko et al., 2017), and SSP3 (Fujimori et al., 2017). Among the nine available combinations of the SSPs with forcing pathways (Gidden et al., 2019), we choose here SSP1-1.9 (targeting an anthropogenic RF of 1.9 W m−2 in 2100 and matching the 1.5 ∘C goal of the Paris Agreement), SSP2-4.5 (RF of 4.5 W m−2 in 2100, close to the previous RCP4.5 scenario), and SSP3-7.0 (RF of 7.0 W m−2 in 2100). For simplicity, in the following we refer to the SSPs just by their number and skip the RF indication, as there is no ambiguity.
Although more SSPs are available in this inventory, the three SSPs analysed here are fairly representative of possible futures, including a sustainability scenario (SSP1) with strong technology development and environmental concerns; a middle-of-the-road scenario (SSP2) reflecting a continuation of historical trends in many aspects; and a regionally heterogeneous scenario (SSP3) characterized by slow economic growth and weak technology development as well as, most importantly for the present assessment, a high level of air pollutant emissions, including aerosol. We do not consider the long-term future after 2050, as the projections beyond this time horizon are affected by large uncertainties in their driving forces (such as demographic changes, economic growth, and technological development; see Bauer et al., 2017). The reason for choosing 2015 (from the SSP2 scenario) as the reference for the present day instead of the last year of the historical CMIP6 time series (2014) is to have consistent emissions from the same database, i.e. the SSPs. Note, however, that the small differences between 2014 and 2015 are negligible for the scope of the present assessment and that 2015 emissions are similar in all the scenarios thanks to the harmonization procedure mentioned above.
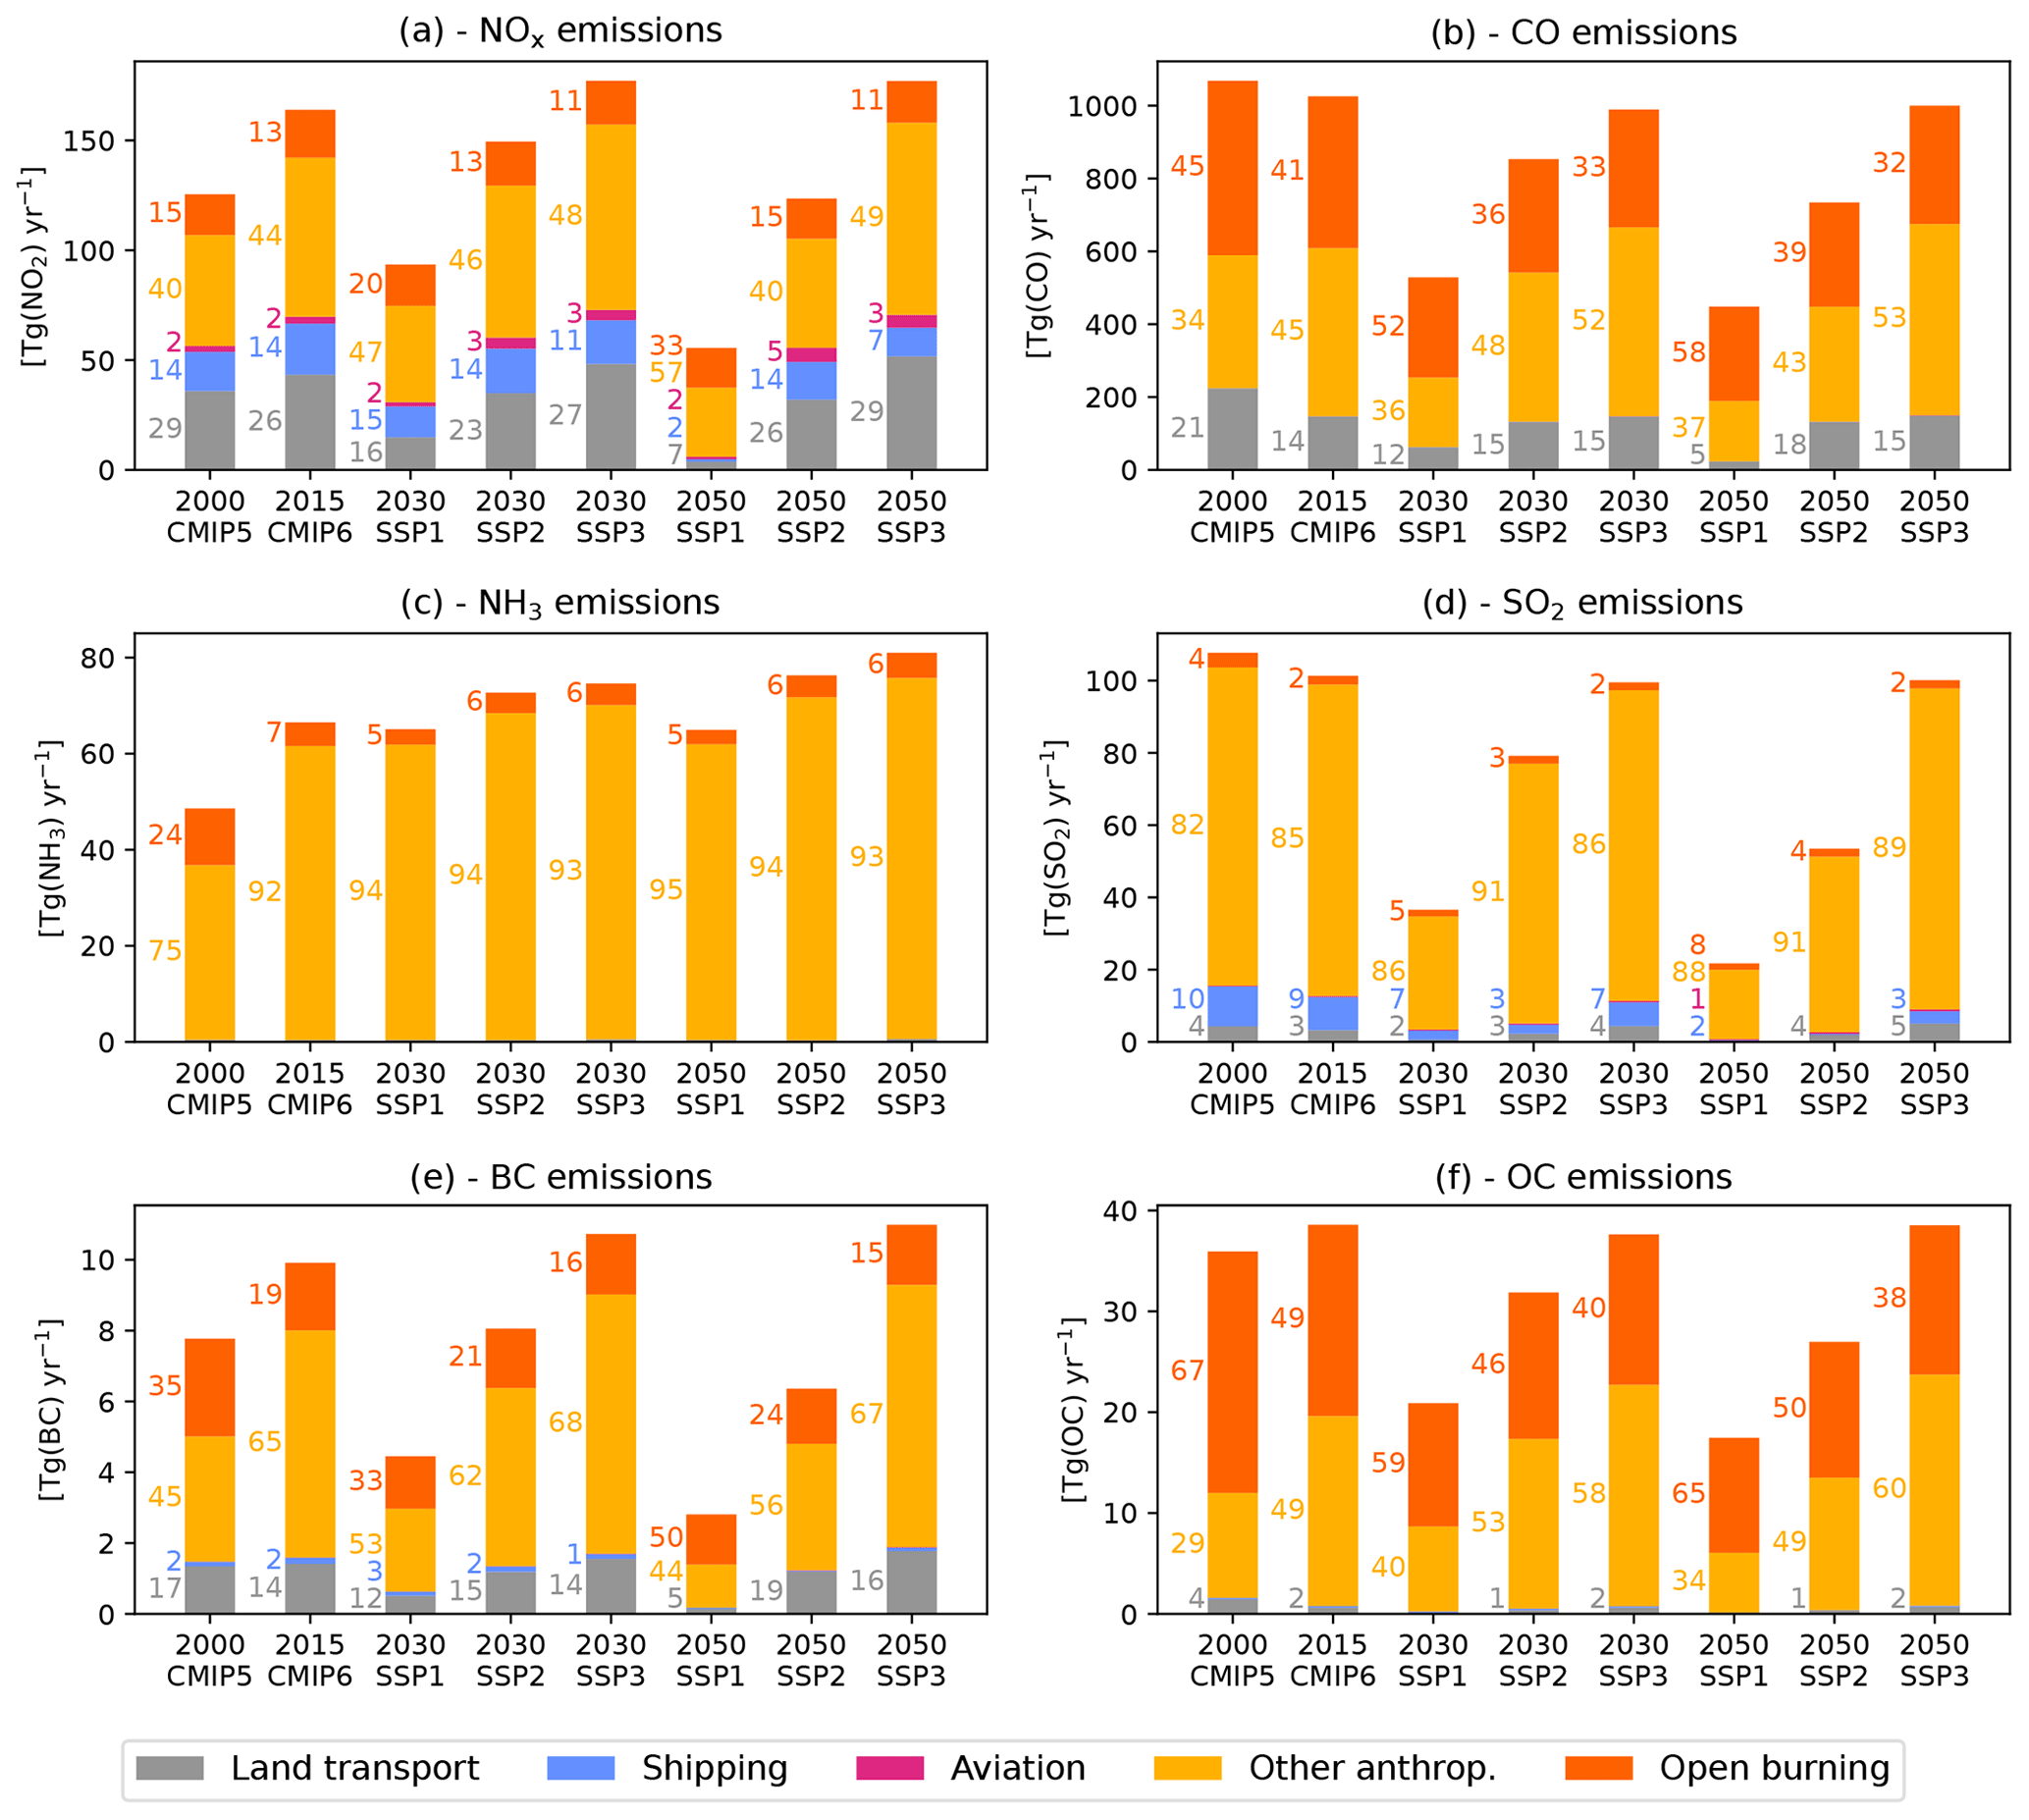
Figure 1Total emissions of each species from the different sectors in the CMIP6–SSP inventory, compared with emissions from the year 2000 from the CMIP5 inventory (Lamarque et al., 2010) used in Righi et al. (2013). The numbers on the left of each bar indicate the relative contribution (in percent) of each sector to the total (values smaller than 1 % are not shown). OC emissions are multiplied by a factor of 1.4 in the model to obtain particulate organic matter (POM) emissions, as required by the MADE3 aerosol submodel. Furthermore, a small fraction (∼2 %, depending on the sector) of the emitted SO2 mass is emitted as primary aerosol sulfate in the model (see Kaiser et al., 2019, for more details). Note that the vertical scales differ among the panels.
The total emissions of aerosol and precursor gases from all sectors in the CMIP6 inventory are summarized in Fig. 1 for the present day (2015) and the three SSPs for the years 2030 and 2050. The total emissions of the anthropogenic non-transport sectors (comprising energy, industry, residential and commercial, agriculture, solvent production and application, and waste) dominate the emission budget of all species in all scenarios, with relative contributions of over 90 % to NH3 emissions (Fig. 1c) mostly due to the agriculture sector. The transport sectors are particularly relevant for NOx emissions (Fig. 1a), with large relative contributions from land transport and shipping (mainly driven by emissions from diesel engines) and BC (Fig. 1e; especially for land transport). Shipping and aviation contributions are generally small, but one should note that ships and aircraft mostly travel in regions which are otherwise hardly affected by anthropogenic emissions; hence their local contribution to atmospheric aerosol concentrations can be relevant even though the emissions are low.
Future emissions in 2030 and 2050 strongly decrease with respect to the present day in SSP1, which is consistent with the narrative underlying this scenario. According to van Vuuren et al. (2017), SSP1 is characterized by a rapid decline in costs for clean technologies, favouring a rapid transition to electric vehicles, and by an increase in public transport and car sharing. It further assumes the worldwide implementation of strict air quality policies, currently only applied in Organisation for Economic Co-operation and Development (OECD) countries. The high share of electric vehicles (up to 75 %) leads to a strong decrease in NOx emissions in SSP1, whose contribution to the total is reduced from 26 % in 2015 to 16 % in 2030 and further down to 6.7 % in 2050, while the contribution of aviation remains constant, around 2 %, and the shipping one is only reduced in 2050, due to the known challenges in electrifying these sectors. A similar trend can be seen for the other species. The reduction in SO2 emissions is stronger than for other species in SSP1, mostly driven by the decrease in the non-traffic anthropogenic emissions, which, however, maintain a roughly constant share of around 85 %–90 % of the total. The shipping sector contribution to SO2 remains relatively high until 2030, decreasing only slightly from 9 % in 2015 to 7 % in 2030. This could be due to the phase-out of traditional (low-sulfur) biofuels in 2030 in this scenario and to the lack of alternative technologies before 2050, when the share is strongly reduced to 1.7 %.
In contrast to the optimistic SSP1 scenario, the SSP2 narrative (Fricko et al., 2017) assumes a significant use of fossil fuel in the future, combined with less stringent air pollution reduction measures. This leads to an only moderate reduction in the emissions of short-lived compounds in the future. The share of NOx emissions by land transport and shipping remains approximately constant until 2050 (around 25 % and 14 %, respectively), while for aviation it almost doubles by 2030 (from 1.9 % to 3.4 %) and triples by 2050 (5.3 %). This is related to the increase in air traffic volumes combined with the lack of efficient alternative technologies for emission reduction in this sector, which only in SSP1 is counteracted by a reduction in air traffic. Similar trends can be seen for the other species in Fig. 1, with the exception of SO2 for shipping. In this case, a very marked decrease in the share of this sector is evident in SSP2, decreasing from 9.1 % in 2015 to 3.1 % in 2030 and 0.4 % in 2050, representing the lowest share of this sector among the three investigated scenarios.
SSP3 represents a more pessimistic scenario, implementing weak air pollution reduction measures, combined with continued dependency on fossil fuels and slow implementation of new technologies (Fujimori et al., 2017). This scenario further considers a late saturation in transport demand, combined with a low electrification level (up to 10 %). This leads to an increase in the land transport share of NOx, which, together with the increase in the other non-traffic anthropogenic sources, drives the overall increase in NOx emissions in SSP3 in 2030. The total NOx emissions then remain approximately constant until 2050, thanks to the reduced share of the shipping sector and the shift to alternative fuels. Due to the rapid shift to high-speed modes of transport assumed in SSP3, the share of aviation increases as well, from 1.9 % in 2015 to 2.6 % in 2030 and 3.3 % in 2050, although this increase is less marked than in SSP2. An analogous trend is also evident for SO2, BC, and OC emissions, although the latter is partly compensated by a reduction in open-burning emissions in 2030 and 2050.
As mentioned above, various combinations of the SSPs with the forcing pathways until 2100 are available. For example, for SSP1 the SSP1-2.6 pathway is also available in addition to the SSP1-1.9 adopted here. These two pathways show a similar decreasing emission trend in the future, but with some differences in their total emissions: for NOx, SO2, and BC, for instance, the emissions in 2050 are about 52 %, 24 %, and 29 % larger in the SSP1-2.6 pathway. Similarly, for SSP3 a so-called LowNTCF pathway is also available, characterized by a strong decrease in the emissions of near-term climate forcers until 2050, followed by a slowly decreasing trend. With respect to the SSP3-7.0 case analysed in this study, the total emissions of NOx, SO2, and BC in 2050 are therefore significantly lower in this pathway, namely about 51 %, 46 %, and 54 %, respectively. Choosing a different pathway within a given SSP has of course an impact on the results. Nevertheless, the three pathways chosen for this assessment reasonably cover the range of possible future emission trends until 2050.
Since in the present work we use an updated inventory (CMIP6–SSP) with respect to our previous assessment (CMIP5–RCP; R13), in Fig. 1 we also compare the total emissions between these two inventories. Note that not only the inventory was updated, but we also considered a different baseline year for present-day conditions (2015 instead of 2000). A general increase in the total emissions can be seen, mostly driven by the anthropogenic non-transport sectors, while only the emissions of CO (Fig. 1b) and SO2 (Fig. 1d) slightly decrease. The transport sectors mostly show a decrease in emissions between 2000 and 2015, in both absolute and relative terms, with the notable exception of NOx (Fig. 1a) and BC (Fig. 1e), whose share, however, decreased from 29 % to 26 % and from 17 % to 14 %, respectively. This indicates that, although the overall growth of land transport volumes of course leads to an increase in emissions of these two highly relevant species for this sector, the introduction of air pollution control measures (e.g. on diesel engines) in developed countries helped to reduce the relative impact of the sector on the global emission budget. Another interesting case is SO2 (Fig. 1d) from shipping, which shows a decrease in both absolute and relative terms between 2000 and 2015. This is a consequence of the limits on shipping FSC introduced in 2010 in the MARPOL Annex VI (Buhaug et al., 2009). These measures also affected shipping NOx emissions, which however still grew between 2000 and 2015 (Fig. 1a) but kept a stable share of 14 % of the total. The emissions from the aviation sector increase for all species between 2000 and 2015, which is expected since emission reduction measures in this sector are overcompensated by the high growth rates in traffic volumes during this period. An important improvement in the CMIP6 inventory is the consideration of the emissions from more species in the aviation sector, while in CMIP5 only NOx and BC were available. In R13 we nevertheless included SO2 emissions from aviation, deriving them from BC emissions by scaling with the respective emission factors of the two species.
Table 1Summary of the emission set-up used for the model simulations in this study, together with the log-normal size distribution parameters applied to derive the number emission fluxes from the mass. MF is the mass fraction in the Aitken (akn) and accumulation (acc) mode. D (geometric mean diameter) and σ (standard deviation) are the parameters of the log-normal distribution. See Kaiser et al. (2019) and references therein for a detailed discussions about these parameters.
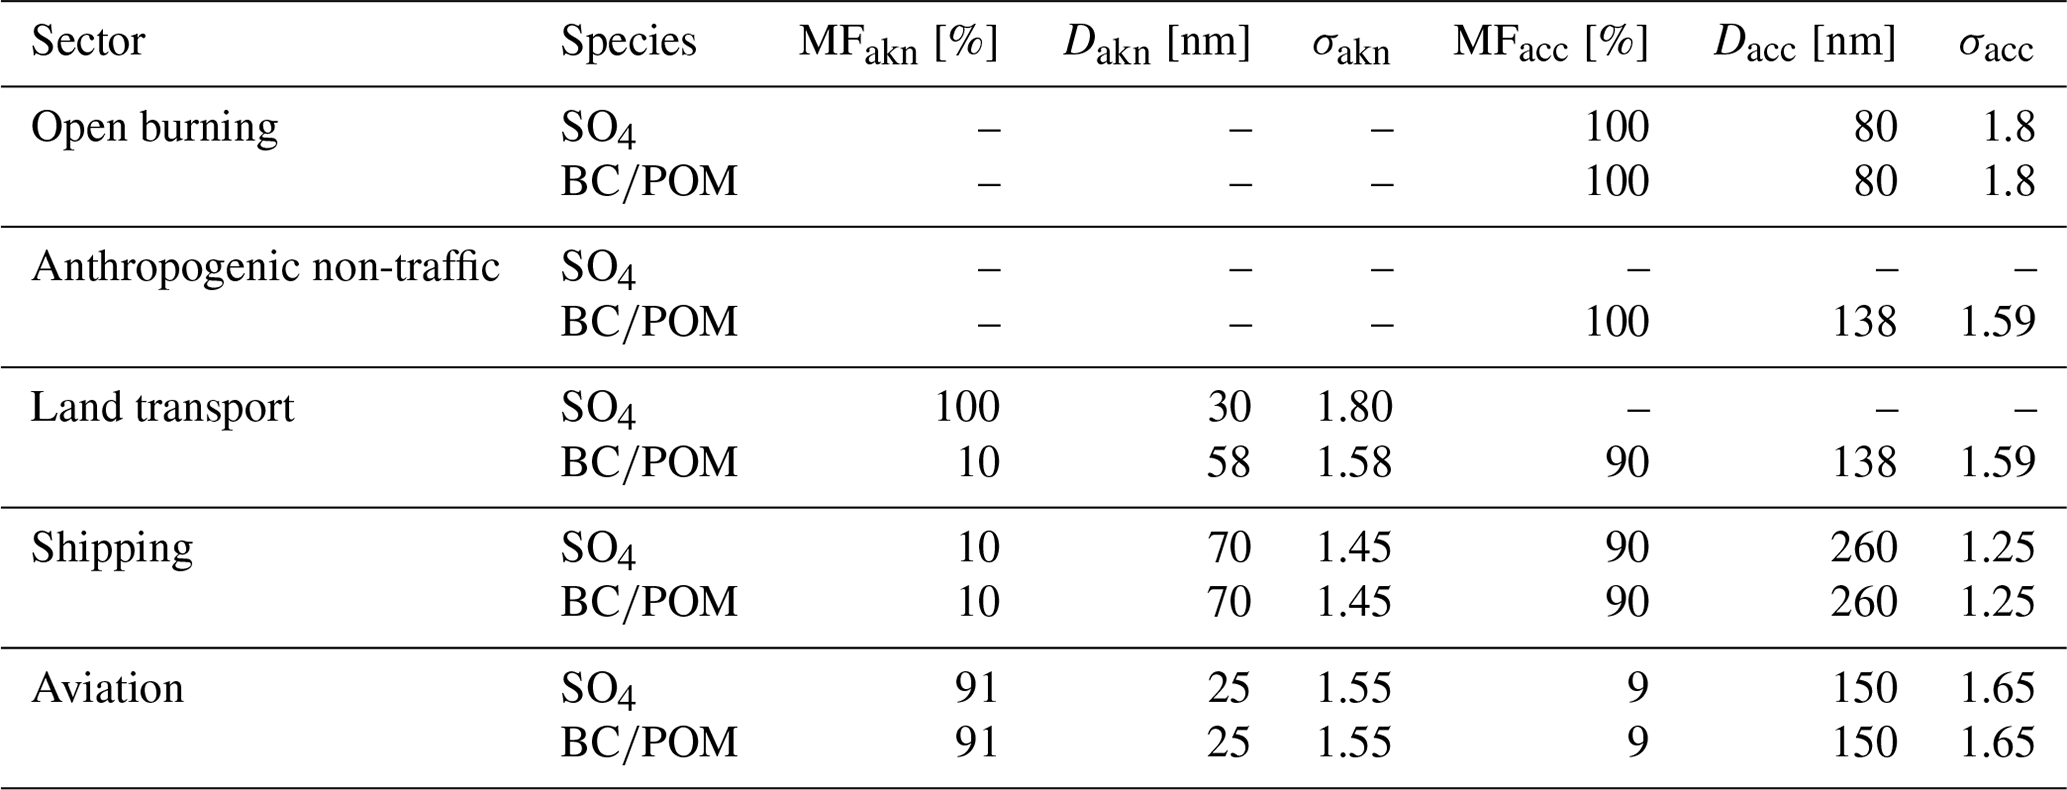
The emission inventories applied here only provide data for the emitted mass of each compound, whereas the MADE3 aerosol submodel requires emission fluxes for both mass and number. The latter is derived by assuming typical log-normal size distributions for the emitted particles in each sector based on measurements when available. Further assumptions are made to assign the emitted mass to the various modes of MADE3. This follows the same approach as Kaiser et al. (2019), summarized in Table 1. For the open-burning sector, we follow the AeroCom recommendations (Dentener et al., 2006) and assign the aerosol emissions of primary sulfate (SO4), BC, and OC to the accumulation mode. For the anthropogenic non-traffic sector, we use the parameters measured by Birmili et al. (2009) in the urban background of Berlin, hence assuming an aged aerosol population. This assigns the emissions to the accumulation mode only. Note that no primary SO4 emissions are considered for this sector. We use the same parameters for land transport as well, but in this case we assign 10 % of the emitted mass to the Aitken mode, representative of a fresh aerosol population in the urban areas close to the emission sources. Primary SO4 emissions from land transport again follow the AeroCom recommendations, assigning the emitted mass to Aitken mode only (note, however, that the land transport emissions of SO4 are relatively low due to the low sulfur content of gasoline and diesel fuels used for land transport vehicles in most regions of the world). For shipping, we used the parameters measured by Petzold et al. (2008) in ship plumes. As for the land transport sector, this assumes a 10 %/90 % split of emitted mass between Aitken and accumulation mode, respectively, but with much larger particles in the accumulation mode (260 nm vs. 138 nm). As noted by Petzold et al. (2008) and R13, due to a more efficient mixing, the ageing process is particularly effective in the marine boundary layer, leading to a relatively fast growth of particles in ship plumes. In situ measurements in actual plumes are also used to derive the parameters for the aviation emissions (Petzold et al., 1999). Due to the high burning efficiency of aircraft turbines, the emitted BC and OC particles are small, with an Aitken mode with a median diameter of 25 nm comprising about 90 % of the emitted mass. Here we conservatively assume the same size distribution for primary SO4 as well, although its actual size is much more uncertain, and some studies (e.g. Kärcher et al., 2007) show that small, nucleation-size sulfate particles of the order of a few nanometres are present in aircraft plumes during the dispersion phase.
The assumptions on the particle size distributions summarized in Table 1 are based on measurements performed in past years and are not necessarily representative of the future conditions. Under the SSP scenarios changes can be expected not only in terms of emission amounts, as discussed above, but also in terms of properties of the emitted particles, such as size distribution, chemical composition, and mixing state. A few studies, for example, show how these properties change when different fuel types are used in aviation (Petzold et al., 2005; Moore et al., 2017) and in shipping (Petzold et al., 2011). This might have an impact on not only the size and number concentration of the emitted particles, but also their chemical properties and mixing states, thus affecting their ability to act as cloud condensation nuclei and their resulting climate impacts. Ideally, different assumptions should be made for each scenario, depending, for instance, on the properties of the fleet and the fuel types implemented in them. This is an aspect that could be considered in the next generation of scenarios to better support modelling studies and assessments such as the one presented in this work.
Figure 2 shows the impact of land transport, shipping, and aviation on the burdens of various aerosol species and on aerosol particle number. To obtain more representative values, the burdens are calculated by integrating the aerosol concentrations over the domains relevant to the respective sector. For land transport and shipping, the two lowermost model layers (from the surface to an altitude of about 250 m) are considered over the continents and over the oceans, respectively. Aviation concentrations are integrated globally at typical cruise altitudes between about 8 and 12 km. This approach is consistent with the one adopted in R13, thus allowing for a direct comparison of the results. In the following, we analyse the impact of the emissions from the three sectors on the burdens and concentrations of relevant aerosol species for the present day (2015) and the three SSP scenarios in 2030 and 2050. We also compare with the results for the year 2000 obtained with the CMIP5 inventory assessed by R13. For a correct interpretation of the concentration values discussed in the following, it should be noted that these are large-scale mean concentrations, which are smaller than the peak concentrations occurring close to the emission sources (e.g. at the kerbside). Such peak values are highly relevant for assessing air pollution effects but cannot be resolved by large-scale climate models which rely on mean concentrations driving large-scale climate effects.
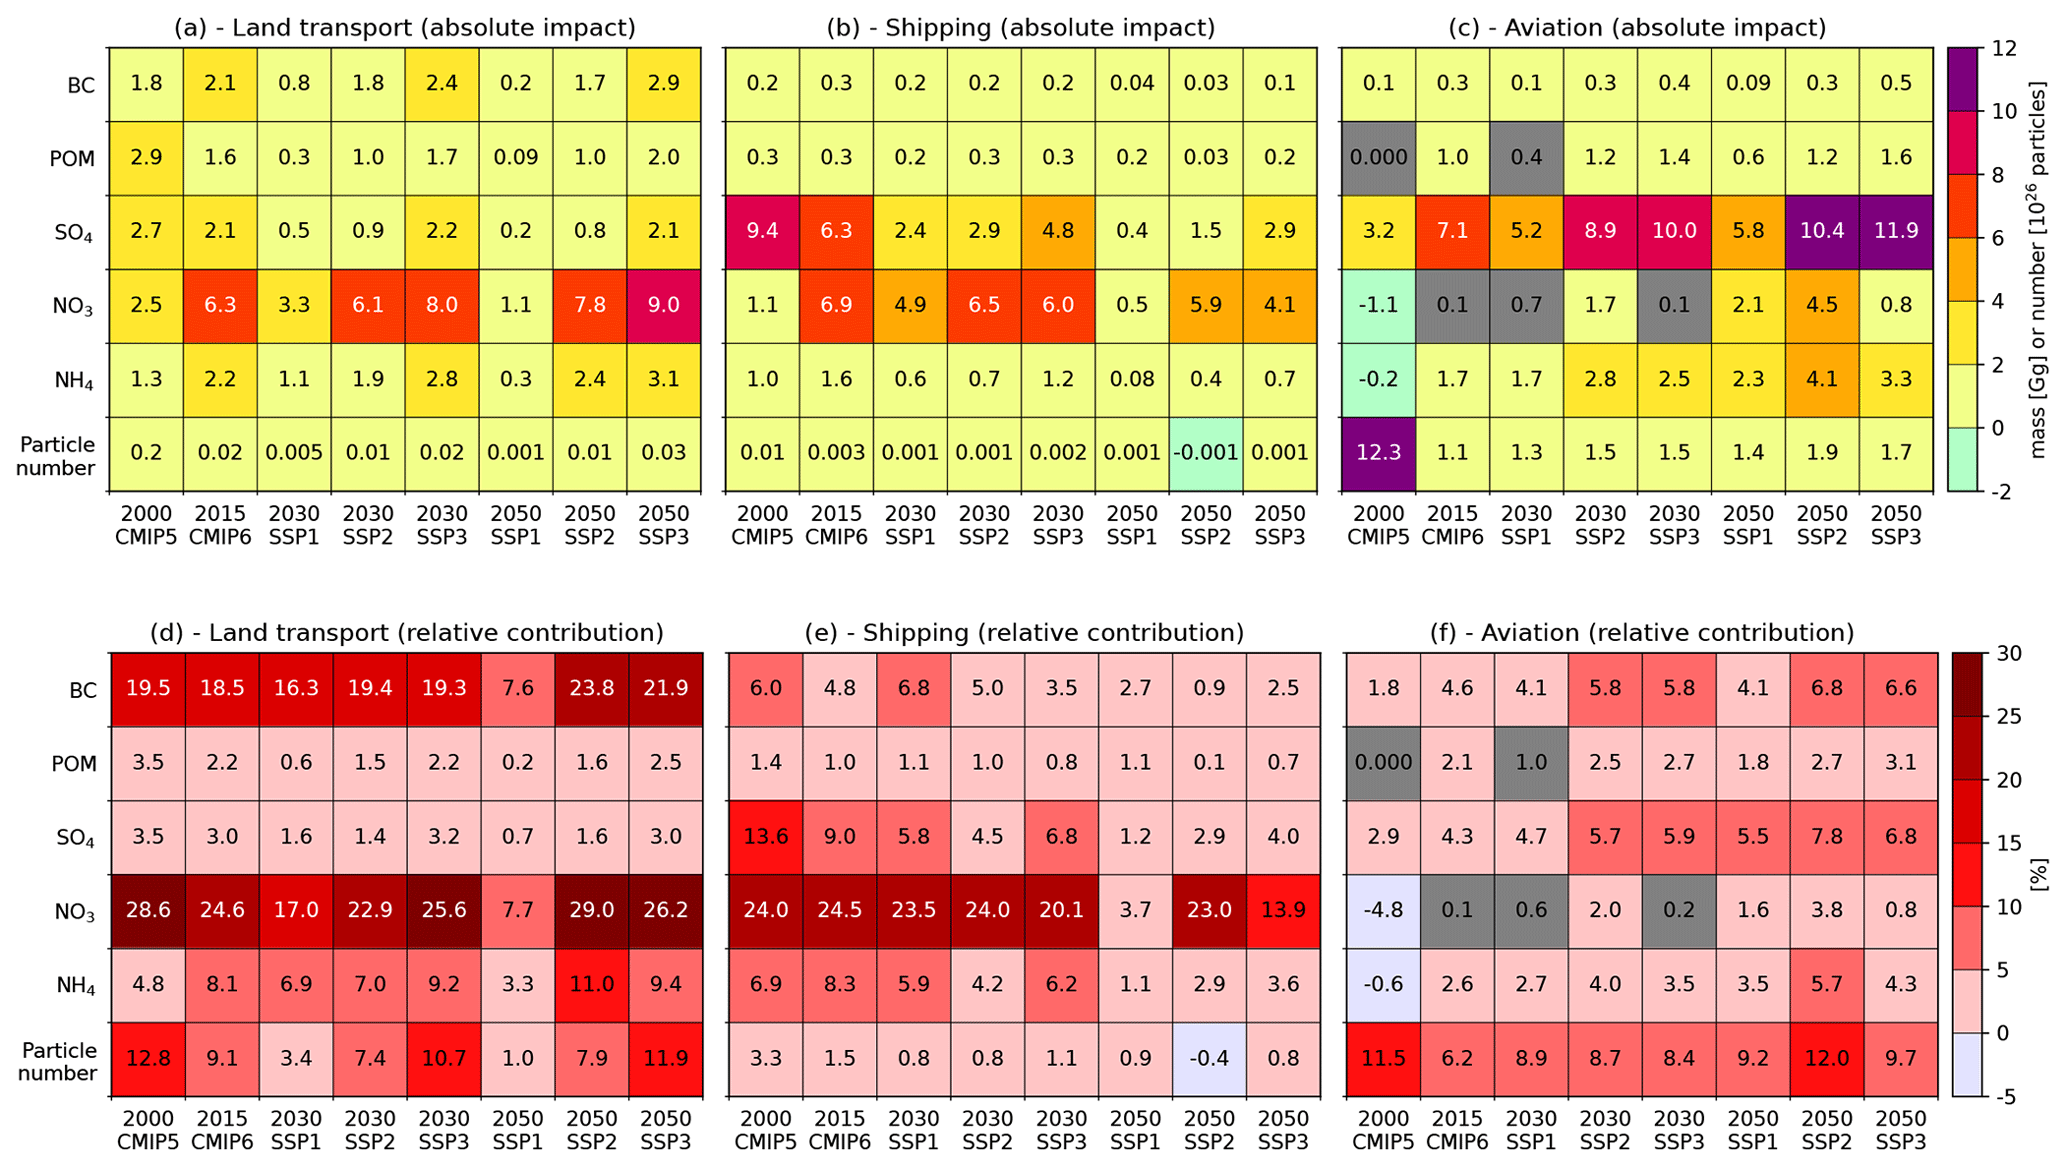
Figure 2Absolute impact (a–c) and relative contribution (d–f) of the three transport sectors to the burdens of various aerosol species and of particle number. The burdens are calculated integrating the concentrations in the two lowermost model layers (from the surface to an altitude of about 250 m) over the continents and over the oceans for land transport and shipping, respectively, while for aviation the concentrations are integrated globally at typical cruise altitudes between about 8 and 12 km. Changes which are not statistically significant at the 95 % confidence level are shown in grey. Note the different units for mass (Gg) and number burdens (1026 particles) in (a)–(c).
4.1 Land transport
The contribution of land transport to present-day aerosol burdens is particularly large for BC and aerosol nitrate (NO3); see Fig. 2a. The continental near-surface burden of BC is 2.1 Gg in 2015, contributing 19 % of the total, similar to the value for the year 2000. The nitrate burden from land transport, on the other hand, is larger in 2015 than in R13 (6.3 vs. 2.5 Gg), but its relative contribution is slightly lower (25 % vs. 29 %). This is consistent with the difference in NOx (a nitrate precursor) emissions between CMIP5 and CMIP6 (Fig. 1a).
In the future scenarios, the absolute impact of land transport on BC is strongly reduced in SSP1 and SSP2 in 2030 and further in 2050, but only in SSP1 does this correspond to a reduction in the relative contributions. On the one hand, this shows that the optimistic SSP1 scenario implements stringent air quality control policies that can effectively reduce land-transport-induced near-surface concentrations of BC. On the other hand, the higher degree of electrification of this sector in SSP1 (up to 75 %; van Vuuren et al., 2017) compared to SSP2 (up to 50 %; Fricko et al., 2017) implies strong reductions in BC from land transport, but not from other sectors, hence decreasing the relative contribution of land transport itself. Similar conclusions hold for nitrate, where again only SSP1 is successful in decreasing the land-transport-induced burden in both absolute and relative terms, with a very large decrease in 2050.
Transport-induced changes in particle number burden are relevant as well for not only air quality but also climate, since aerosol particles can act as cloud condensation nuclei in warm clouds if they grow to a sufficient size. An increase in their concentration can therefore lead to a change in the microphysical and radiative properties of these clouds (Boucher et al., 2013). Land transport provides a significant contribution to particle number, with 9 % of the near-surface particle number burden over the continents attributable to this sector in 2015. This is reduced in SSP1 and SSP2 in 2030 and 2050, while it keeps increasing in SSP3. Note that the impacts on land-transport-induced particle number concentrations are strongly related to the assumptions on the size distribution of emitted particles. As shown in R13, assuming size distribution parameters representative of either young or aged particle populations upon emissions can change the resulting impacts on number concentration by about 1 order of magnitude. As discussed in Sect. 1 and Table 1, here we assume an aged distribution for particles emitted by land transport, representative of air masses on large spatial scales and therefore more consistent with the representation in the coarse resolution of a global model.
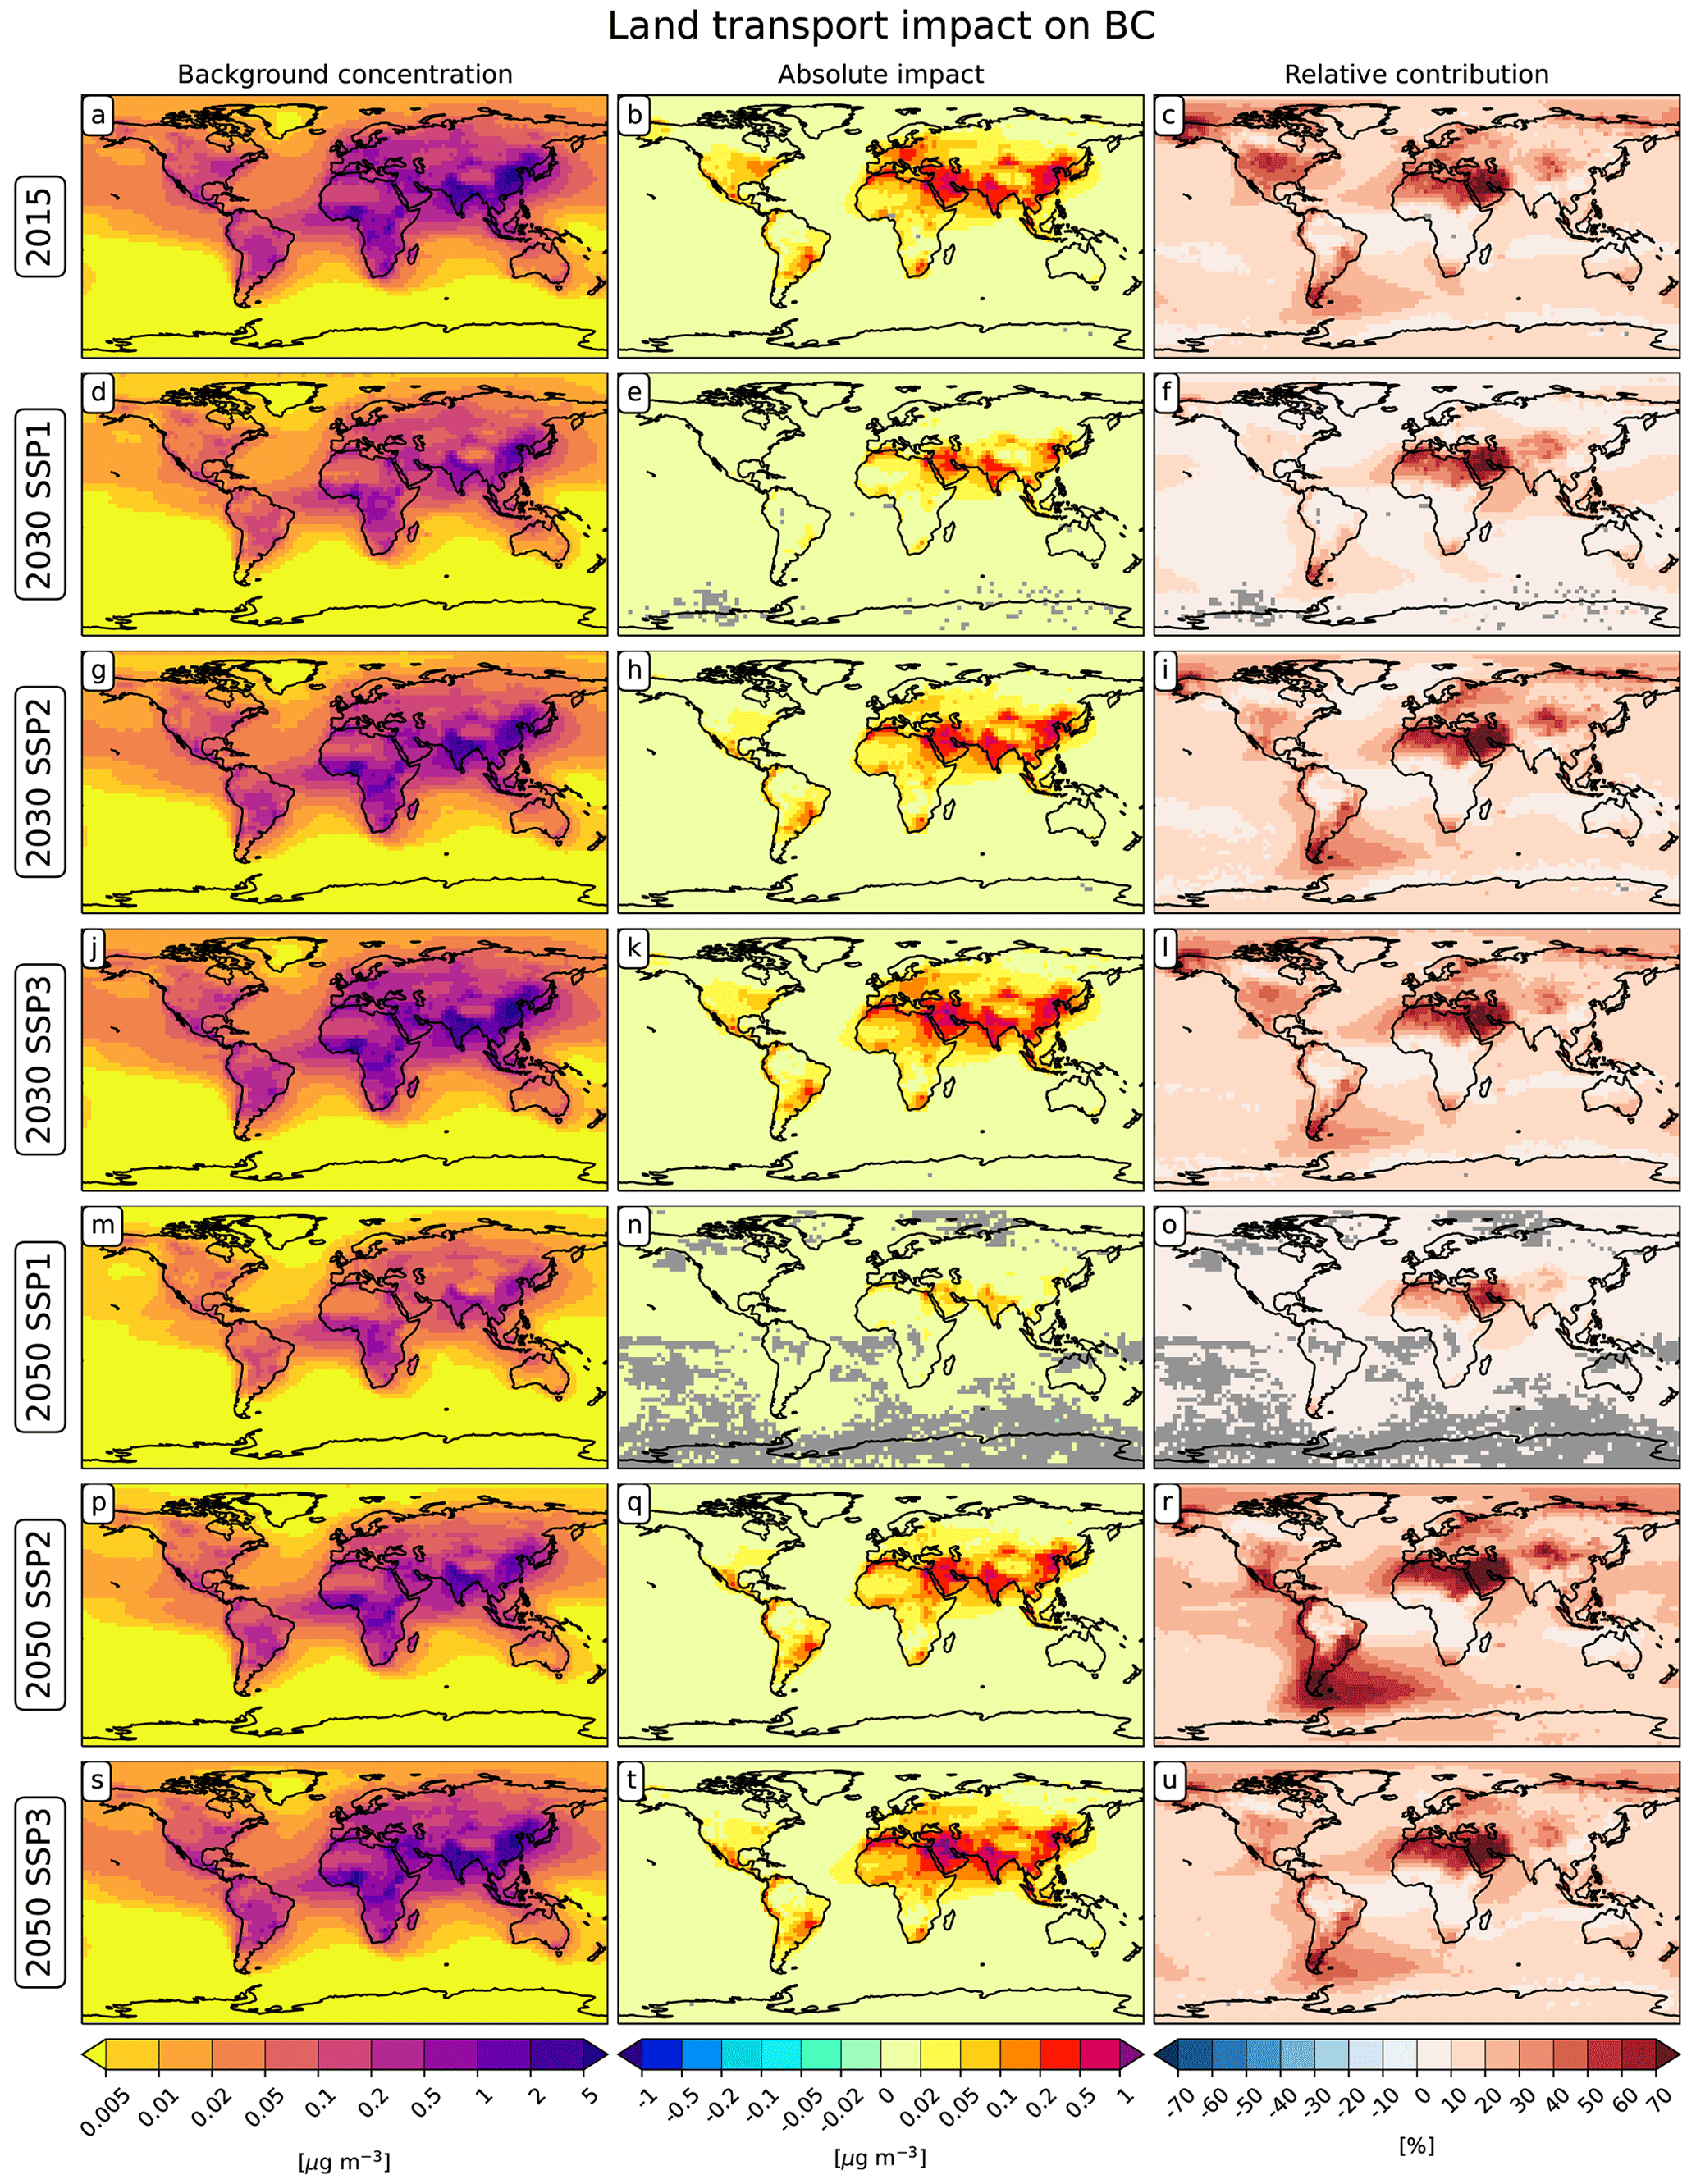
Figure 3Land transport impact on surface-level BC concentration. The left panel shows the background concentration for reference. The middle and right panels show the land-transport-induced absolute impacts (Eq. 1) and the relative contributions (Eq. 2), respectively. Grid points where the impacts are not significant at the 95 % confidence level are masked out in grey.
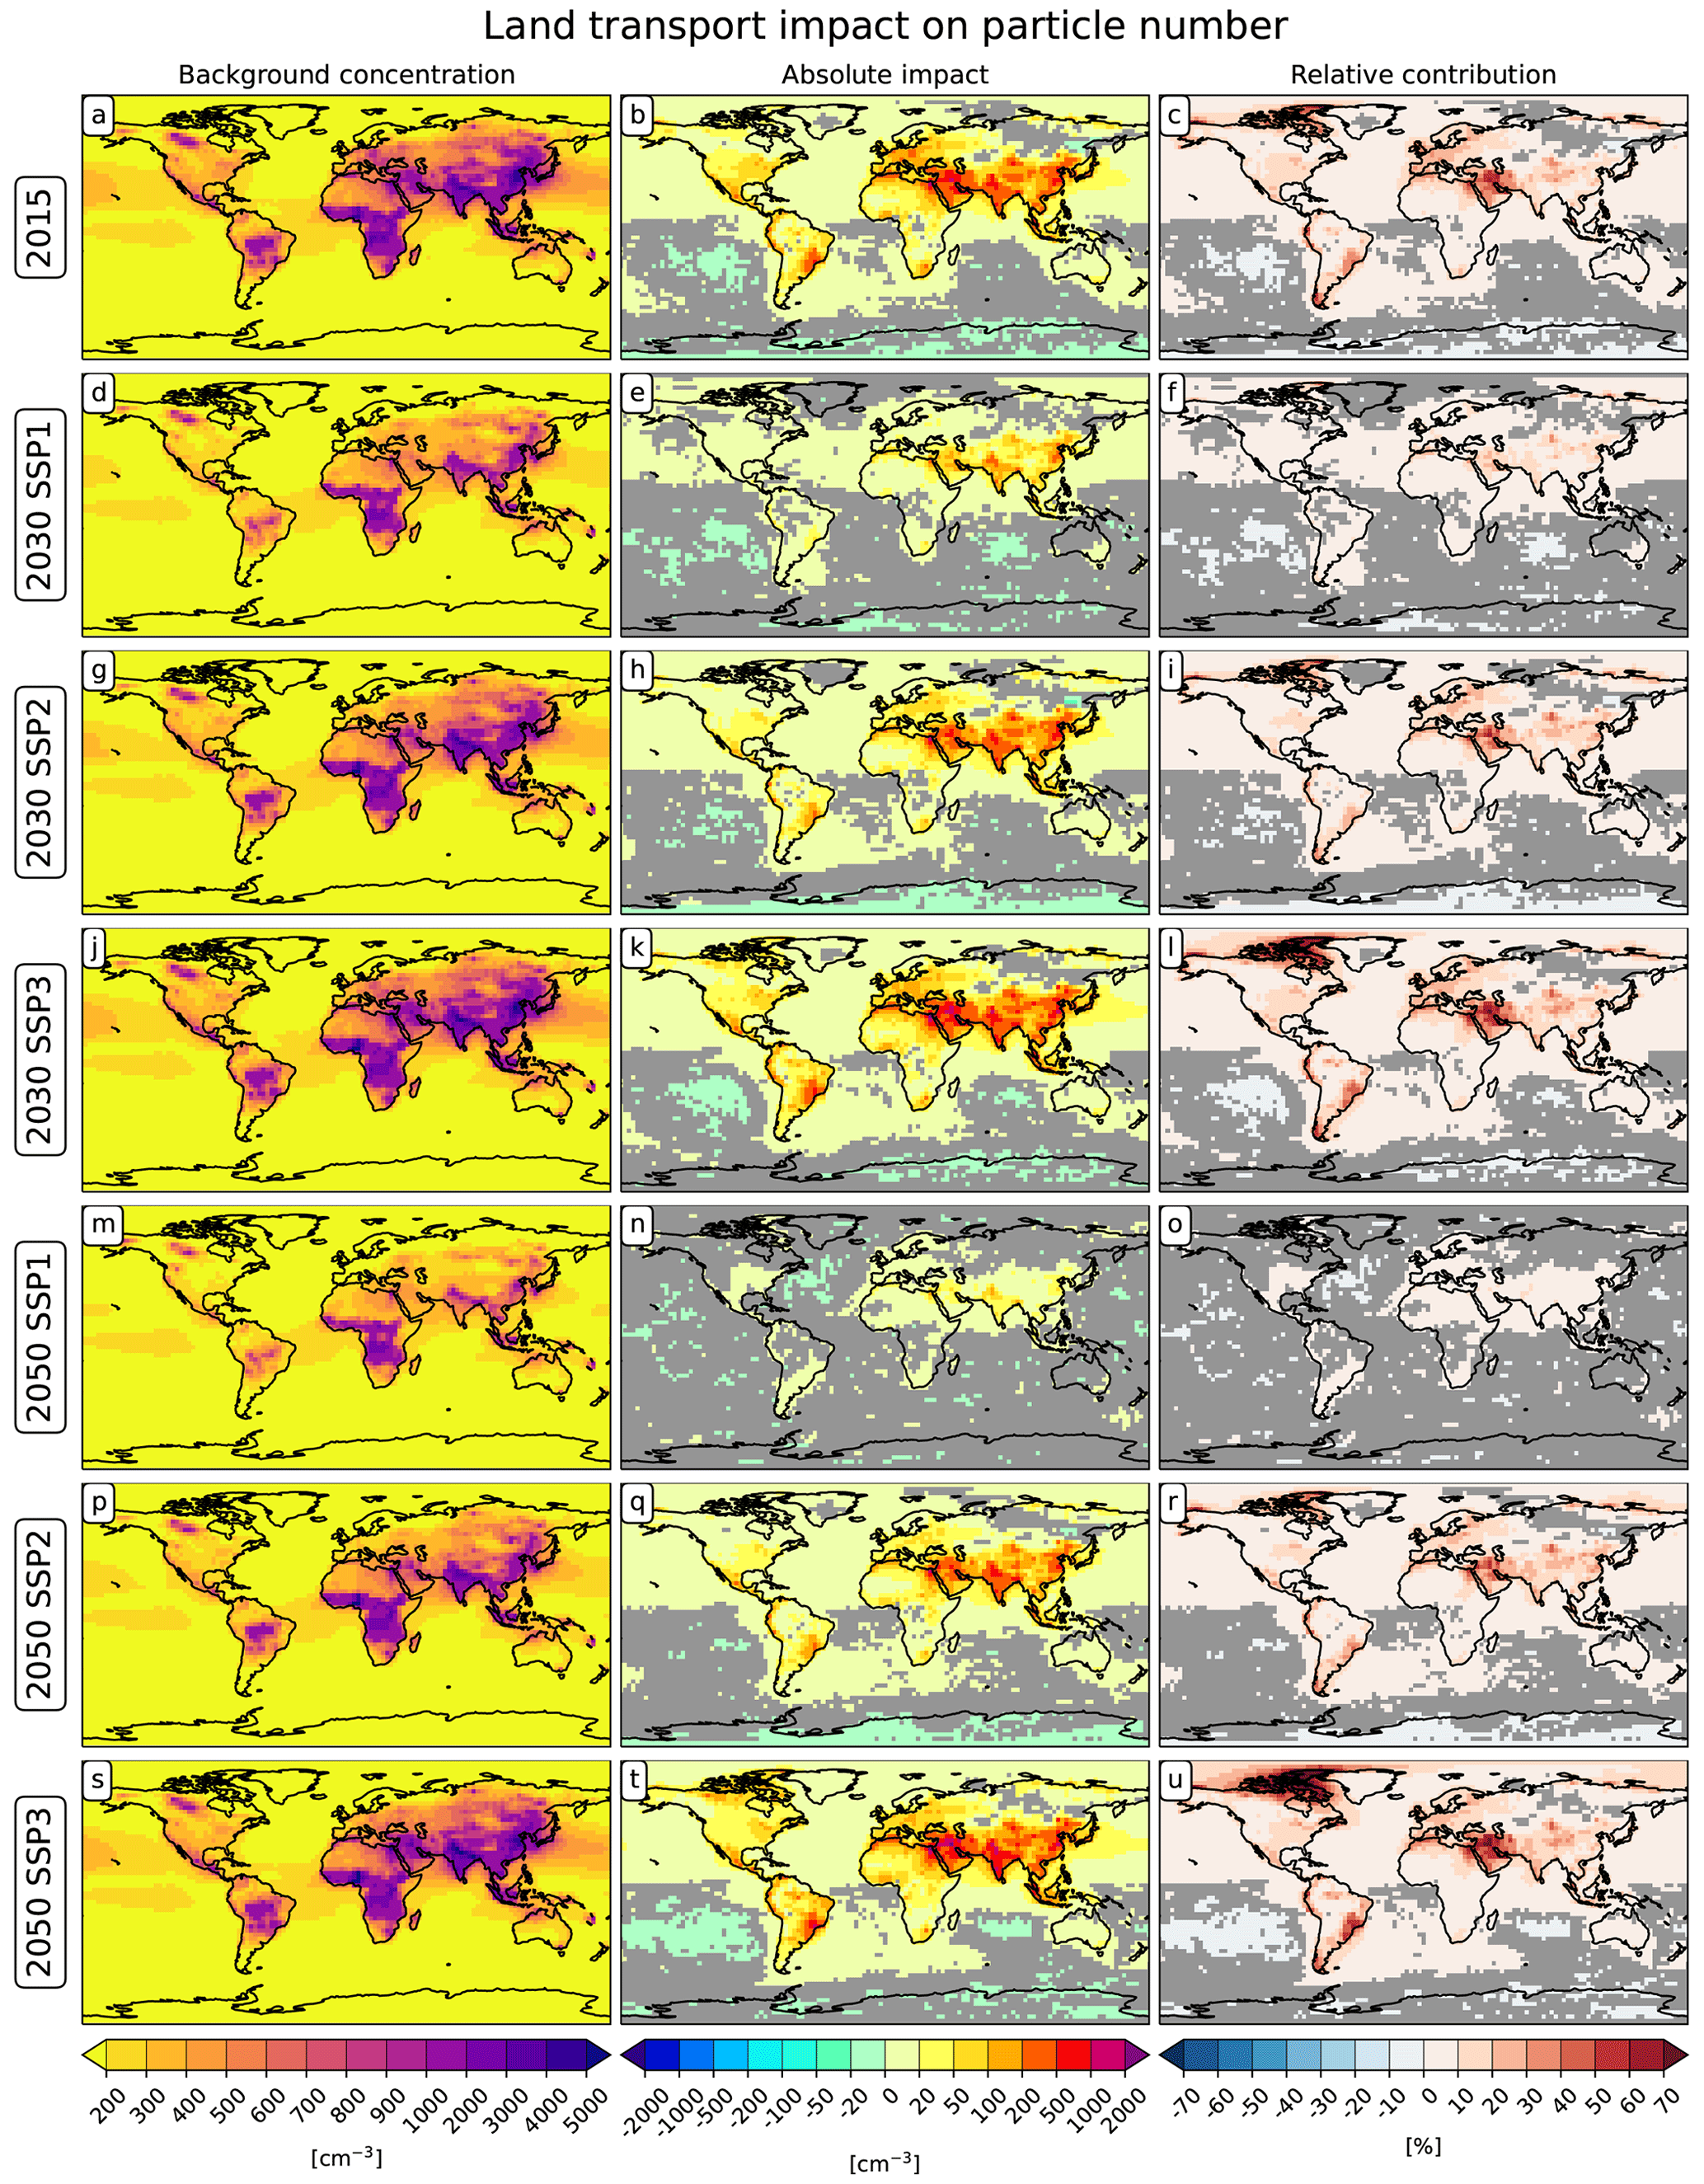
Figure 4As in Fig. 3, but for the land transport impact on surface-level particle number concentration.
The geographical distribution of land-transport-induced surface-level BC concentration is shown in Fig. 3. In 2015 (Fig. 3b), the largest absolute impacts are found over China, India, and the Arabian Peninsula, with concentration changes of about 1 µg m−3. Large values are also simulated over eastern Europe and in some spots in South Africa and South America, corresponding to the largest urban areas. Western Europe and the eastern US are characterized by generally lower land-transport-induced BC concentrations. This pattern roughly matches the results for 2000 with the CMIP5 inventory (R13), although with larger values, especially in the Middle East and in eastern and southern Asia. In relative terms (Fig. 3c), however, the contribution of land transport is confirmed to be relatively small in eastern and southern Asia, amounting to only 10 % to 20 % of the surface-level BC concentration in these countries, due to the prevalence of emissions from other sectors, like the energy production or household sectors. A somewhat opposite effect is the large relative contribution over the Arabian Peninsula, with 60 %–70 % of BC concentration due to land transport in these regions, following the comparatively low BC emissions from other sectors in this region. This sector remains quite relevant for air pollution in developed countries as well, with contributions of 30 % to 50 % in Europe and in the US. These numbers are lower than in 2000, also in terms of absolute land-transport-induced concentration changes, revealing the effectiveness of the air pollution control measures and the technical improvements in this sector over the 15 years. Figure 3c also reveals the importance of the long-range transport of polluted air masses from the continents to the oceans, especially in the subtropics and at southern mid-latitudes.
As expected, the land-transport-induced BC concentrations are strongly reduced in SSP1 in 2030 (Fig. 3e) and become almost negligible in 2050 (Fig. 3n), with only India and the Arabian Peninsula showing concentration changes larger than 0.05 µg m−3, although the relative contributions in the Arabian Peninsula still remain high (Fig. 3f, o). This is consistent with the narrative of this scenario, considering a worldwide transition to a more sustainable future with reduced inequality across countries. In SSP2, in contrast, only developed countries show a noticeable decrease in BC concentration in 2030 and 2050, in both absolute and relative terms, while developing countries remain at a similar level as in 2015 (Fig. 3h, i). In 2050, land transport is still the major source of BC pollution in many regions of the world, including the Arabian Peninsula, North Africa, and Central and South America (Fig. 3k, l). SSP3 shows no remarkable differences with respect to SSP2 in 2030 (Fig. 3q, r), whereas it is characterized by an increased land-transport-induced concentration in 2050 (Fig. 3t, u), which is again consistent with the storyline of this scenario, assuming large differences between developed and developing countries.
Similar conclusions can be drawn for the other species (Figs. S1–S6 in the Supplement), although in relative terms only nitrate (Fig. S1) and particle number concentrations (Fig. 4) were substantially impacted by land transport in 2015 and in the future projections. A remarkable feature is the land-transport-induced decrease in surface-level aerosol sulfate concentration over some parts of India and China (Fig. S3), which could be related to an enhanced aerosol removal via wet deposition. This effect, however, is small in relative terms (<10 %).
With respect to the RCP scenarios, the projections for the land transport sectors in the SSPs appear to be more coherent with their narratives in terms of short-lived pollutants, while this was not always the case in the RCPs. Righi et al. (2015), for instance, found that the RCP scenarios with the most stringent climate policies were often characterized by larger impacts on aerosol concentrations, hence showing an anti-correlation between their ranking and the resulting impact on short-lived species. This is not the case in the SSP scenarios: SSP1 is by far the greenest scenario in terms of air pollution impact, while SSP2 and SSP3 show only limited changes in 2030 and 2050 with respect to the present-day situation, consistent with their underlying storylines and long-term climate projection.
4.2 Shipping
As in the year 2000, the shipping sector is characterized by its large contributions to the burdens of nitrate and sulfate (SO4; see Fig. 2b) over the oceans. The impact of shipping on near-surface nitrate burden over the oceans in 2015 (6.9 Gg) is significantly larger than in R13 for the year 2000 (1.1 Gg), but it remains stable in relative terms at about 25 %. Sulfate pollution, on the other hand, is smaller than in 2000 (6.3 vs. 9.4 Gg), and its relative contribution is reduced to 9 % compared to the 14 % value reported in R13. As mentioned above, this can be related to the introduction of the MARPOL Annex VI regulations on the maximum FSC in shipping. Although fully implemented in 2020, a first step towards the reduction was taken in 2012, reducing the maximum allowed FSC by mass from 4.5 % to 3.5 % globally (Buhaug et al., 2009). Stricter limits were applied in the SECAs, reducing the cap from 1.5 % to 1 % in 2010 and to 0.1 % in 2015. This reduction trend appears to continue in the future scenarios, which are all characterized by a reduced impact of sulfate burden. In 2030, the relative contribution of shipping to near-surface oceanic sulfate burden is reduced to 6 %–7 % in all scenarios and further to 1 %–4 % in 2050, with the largest (smallest) decrease in SSP1 (SSP3), hence consistent with the scenario narratives. MARPOL also introduced emission limits on NOx for all new ship engines built after the year 2000 and above a certain power output. These regulations, however, seem to have a limited impact on the resulting nitrate burdens, which are only slightly reduced in 2030 for all scenarios. Stronger reductions in near-surface nitrate burden become effective in 2050, especially in SSP1 (4 %) and SSP3 (14 %), while they remain high (23 %) in SSP2, consistent with the high share of shipping NOx emissions in this scenario (Fig. 1). The shipping impact on particle number burden is quite small, about 1.5 % in 2015, in line with the results of R13. Such a low impact is a consequence of the very efficient take-up of ultra-fine particles by larger aerosol in ship plumes, which occurs within a timescale of the order of only 1 h (Petzold et al., 2008; Righi et al., 2011). This process is implicitly considered in our assumptions on the size distribution of ship-emitted particles (see Sect. 1 and Table 1), with 90 % of shipping emissions released in the accumulation mode, and leads to small impacts on particle burden. These are further reduced in the future scenarios, in line with the reductions in the mass burden of the most relevant species from this sector.
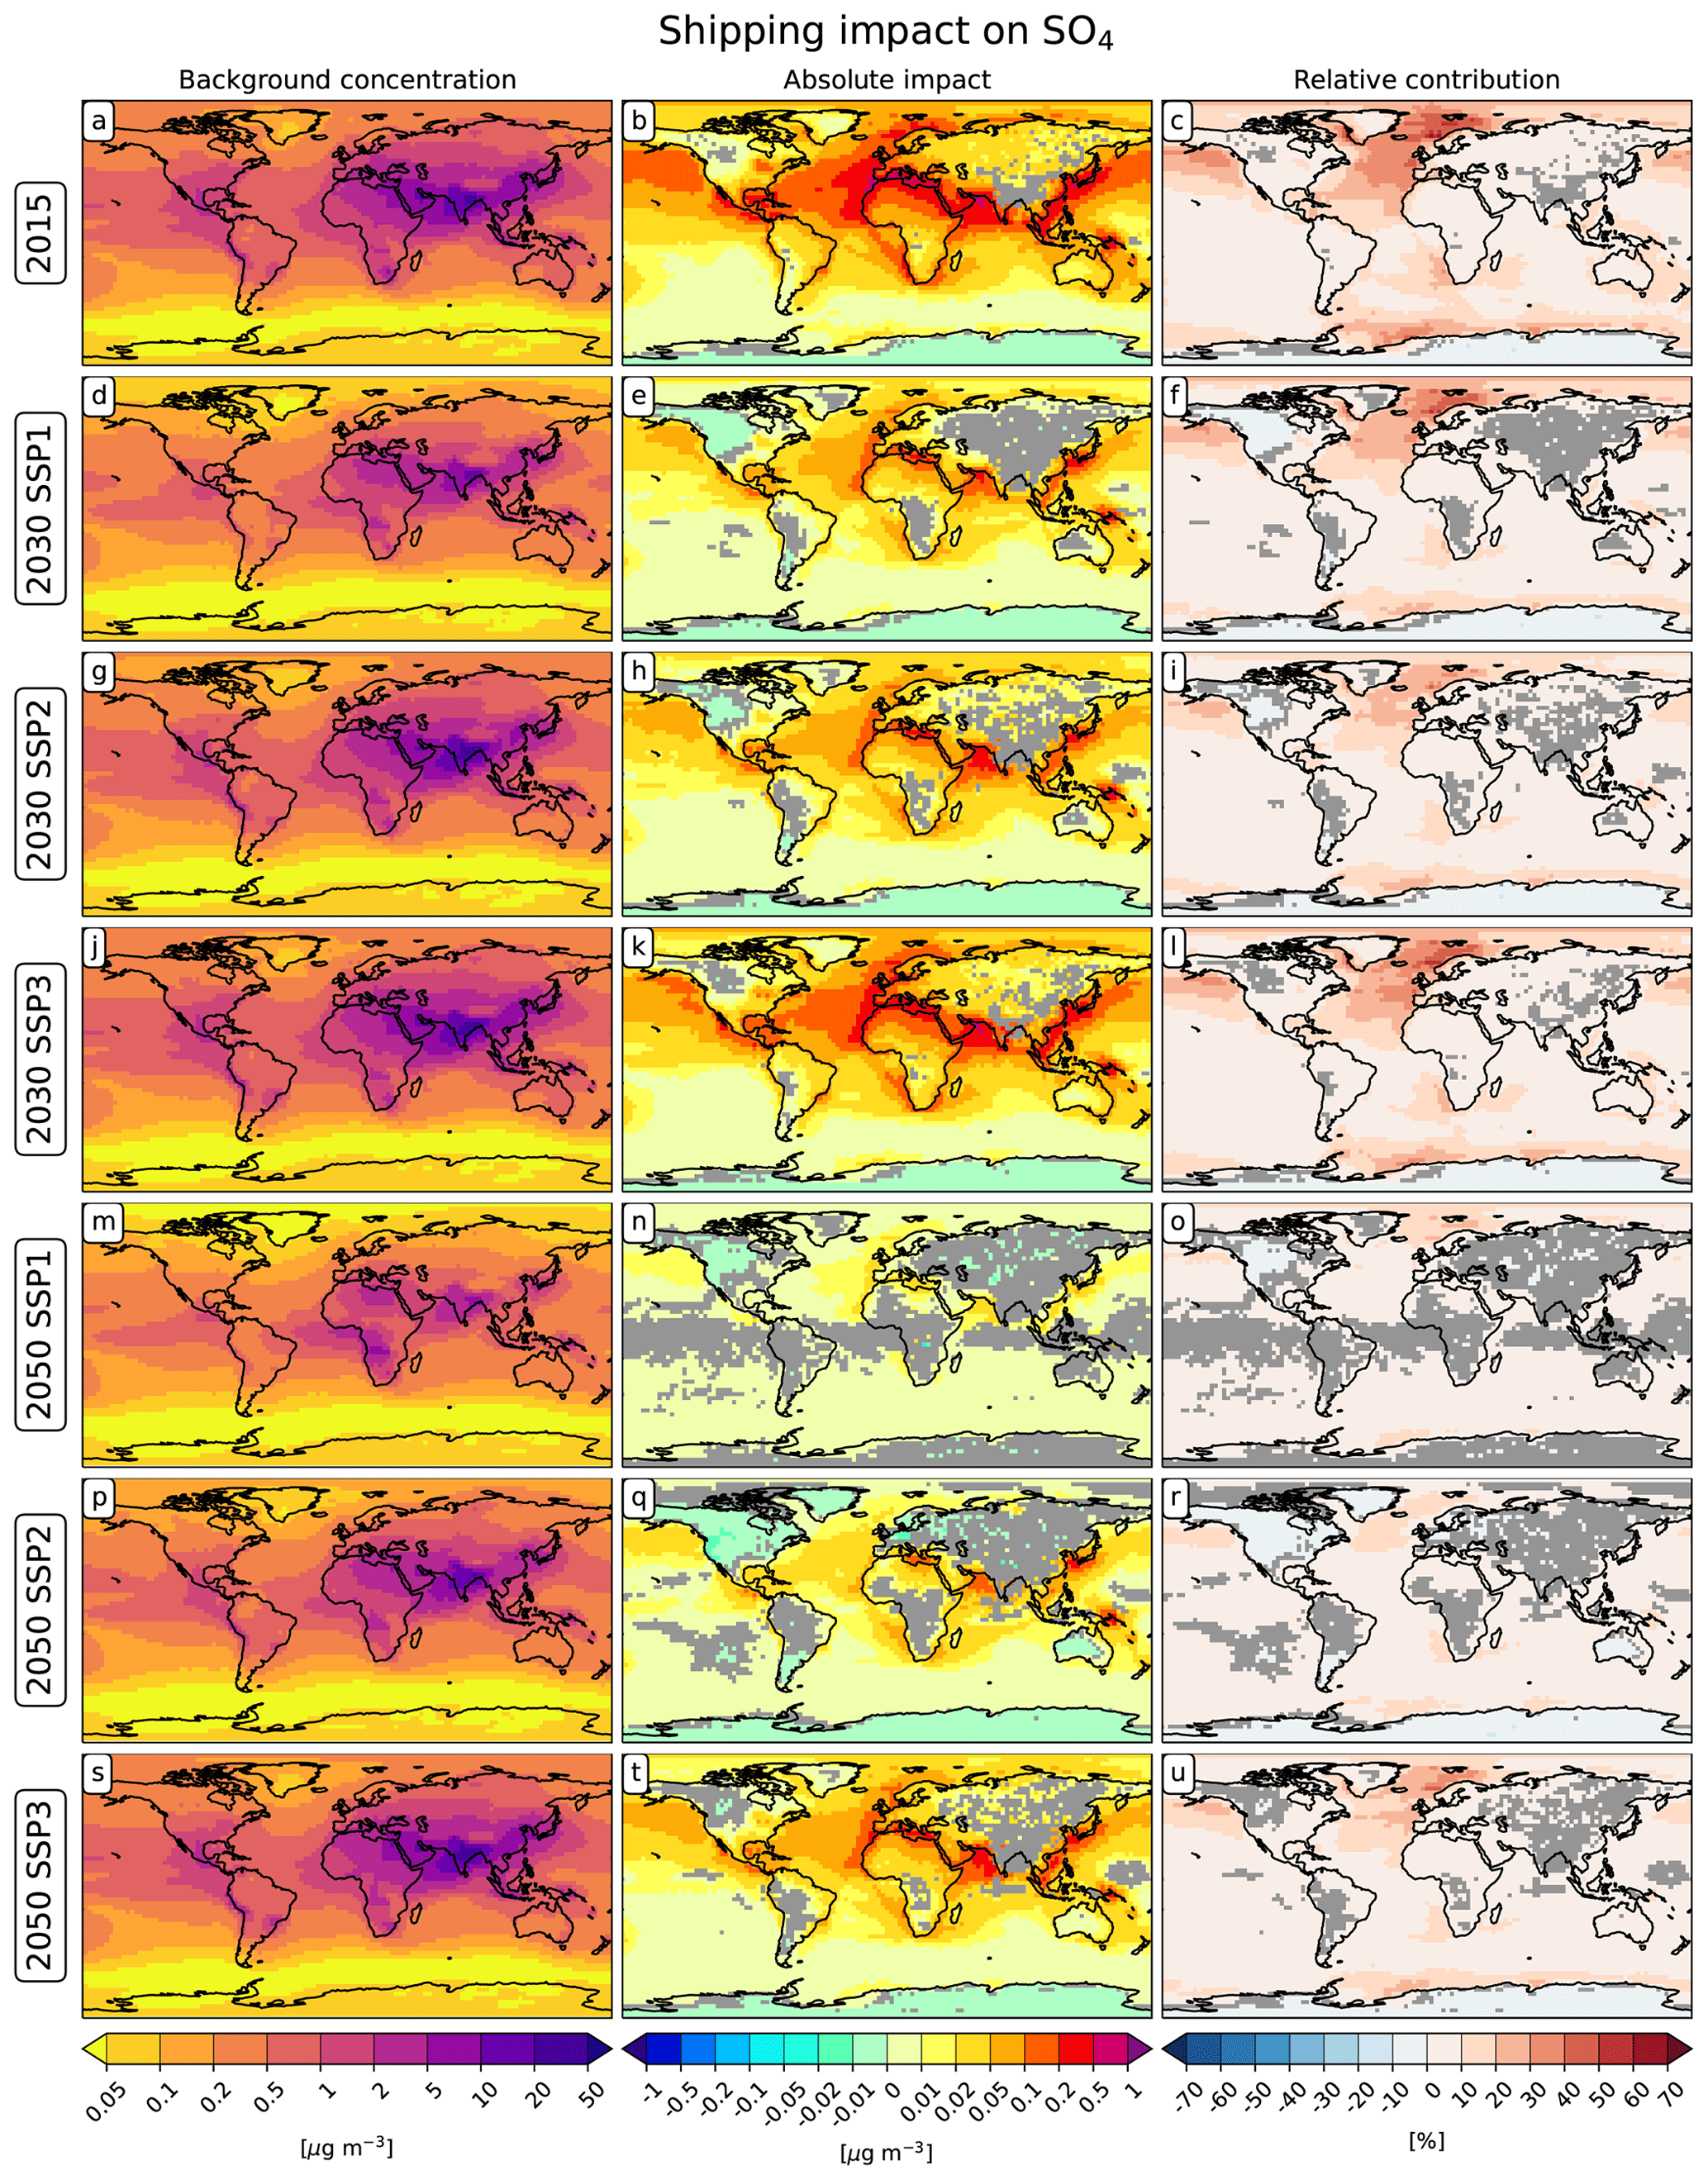
Figure 5As in Fig. 3, but for the shipping impact on surface-level SO4 concentration.
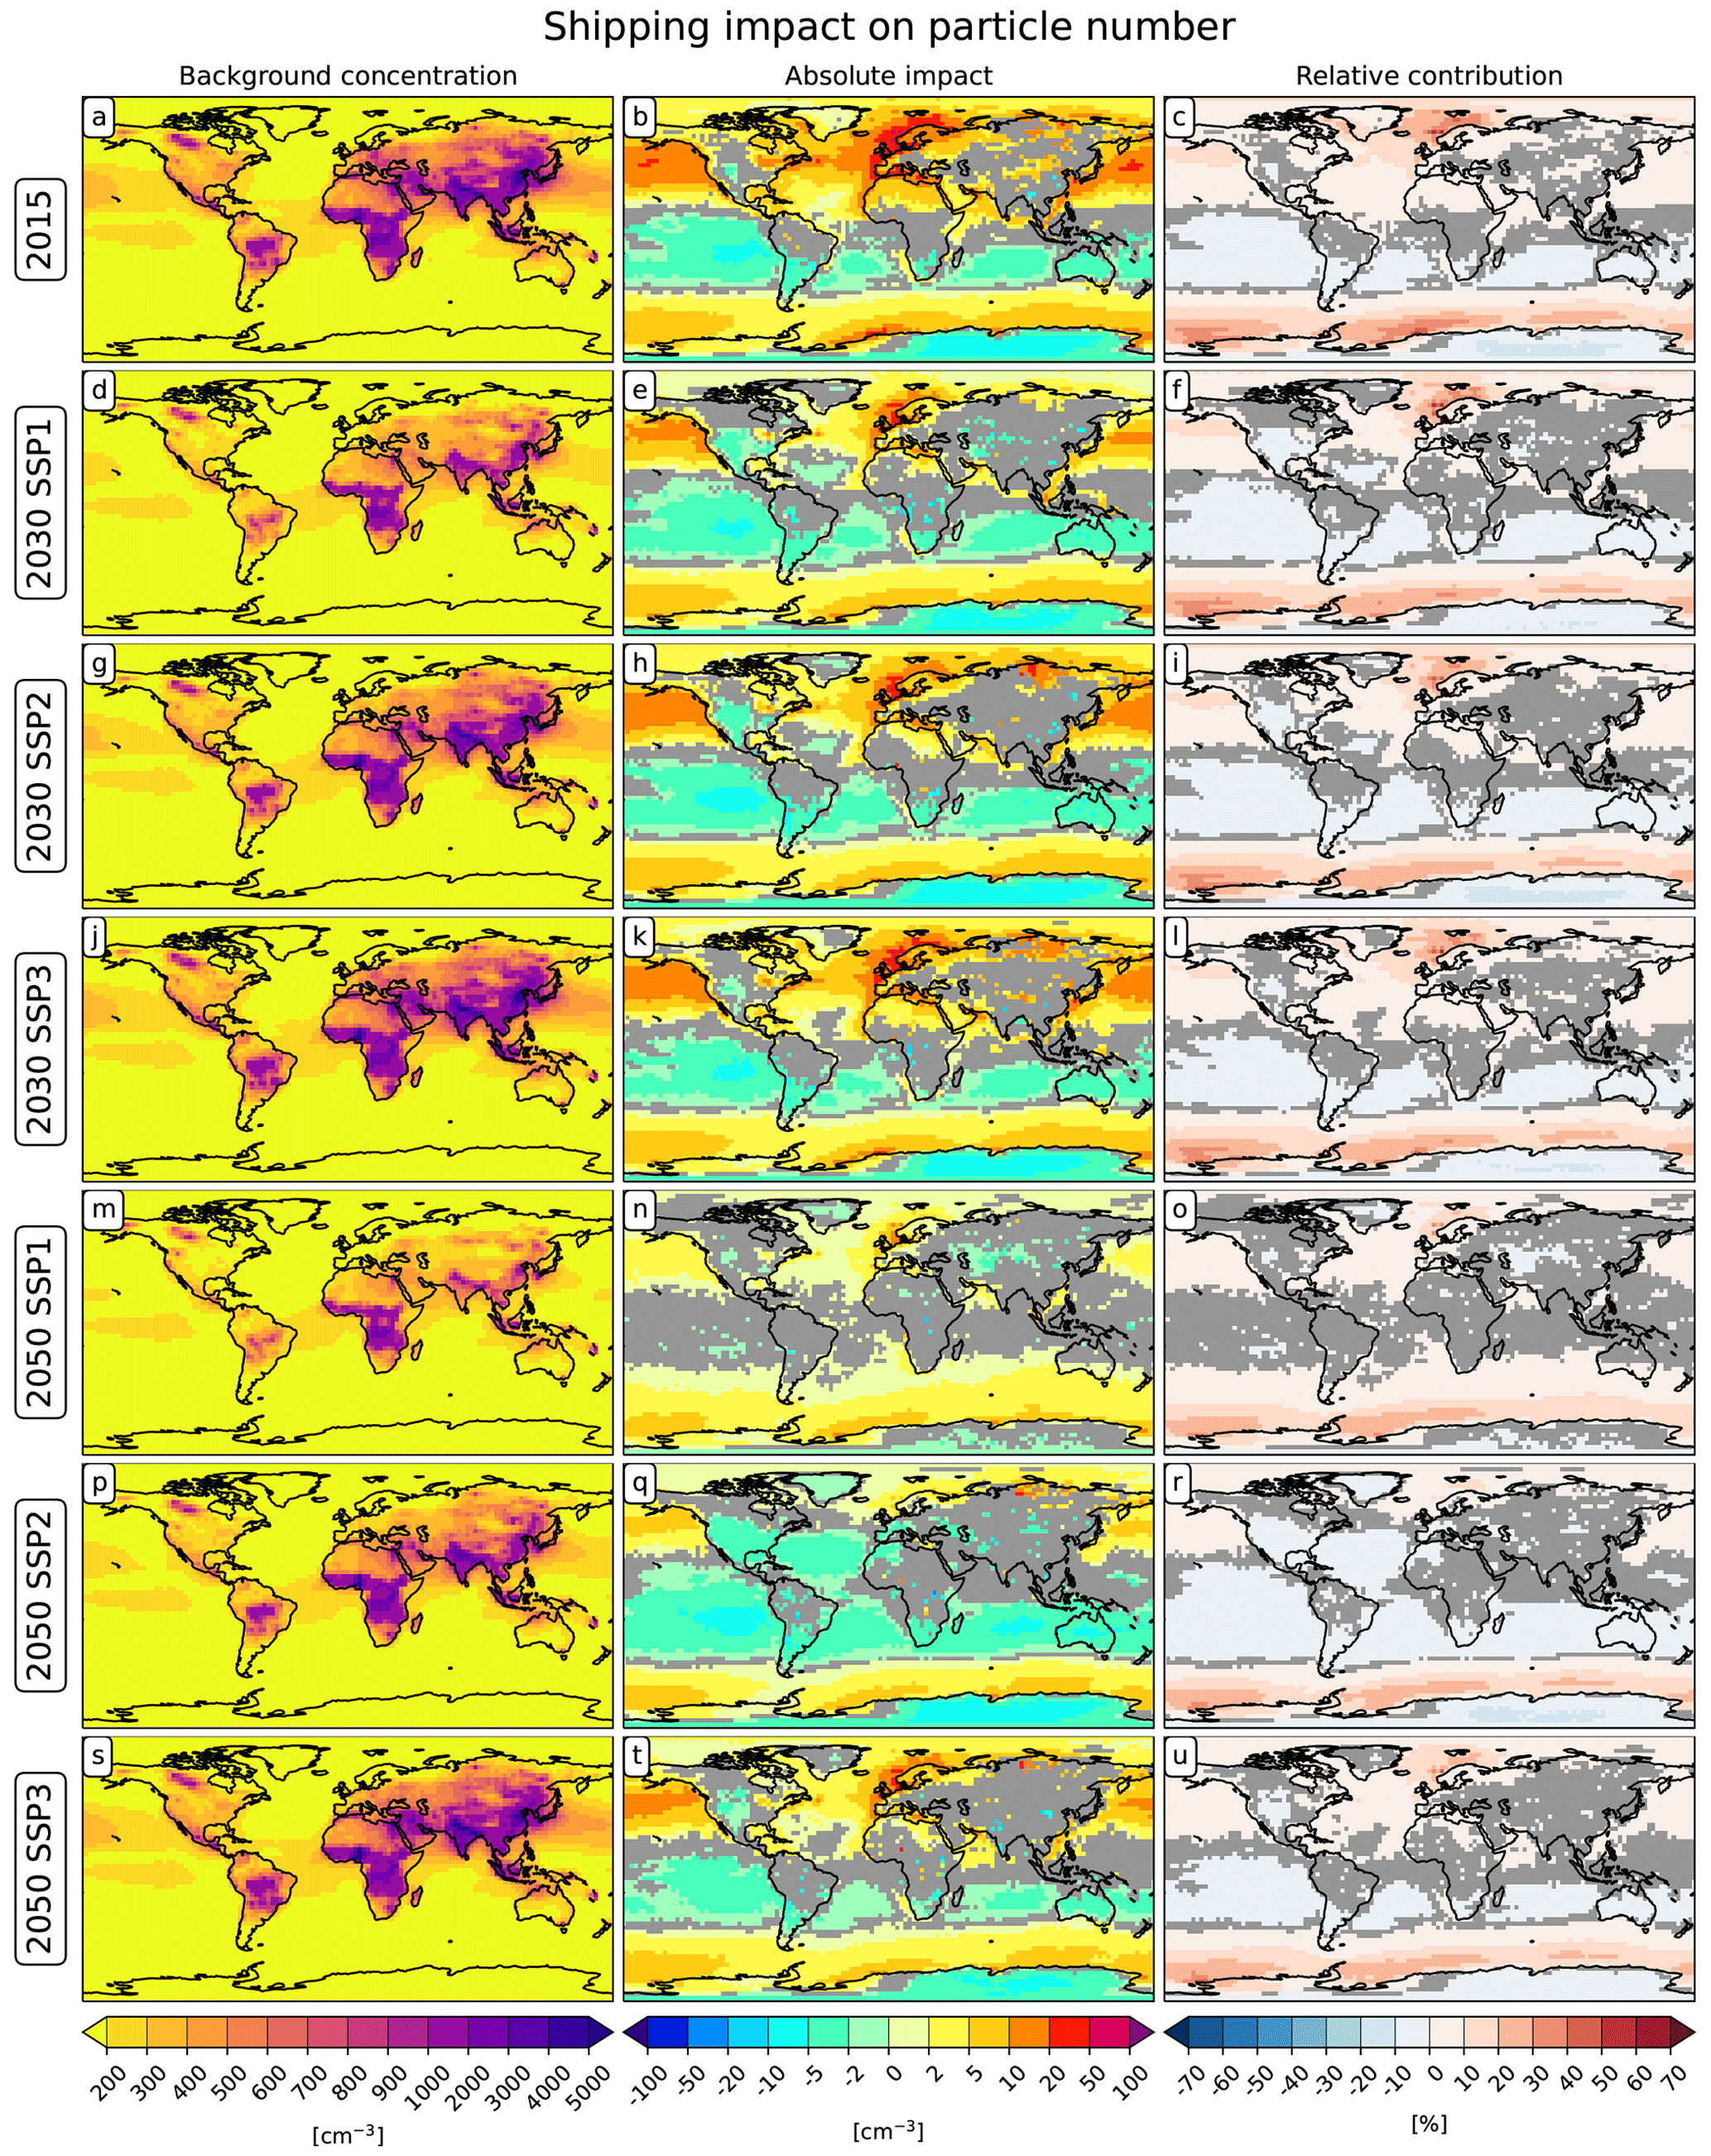
Figure 6As in Fig. 3, but for the shipping impact on surface-level particle number concentration.
Figure 5 depicts the geographical distributions of shipping-induced near-surface sulfate concentrations. In 2015 (Fig. 5b), the largest ship-induced concentrations are simulated over the Northern Hemisphere, especially in the eastern Atlantic Ocean, in the northern Indian Ocean, and in the Mediterranean, with values around 1 µg m−3. Significant changes of 0.05–0.1 µg m−3 are also simulated over land in many coastal regions of the Northern Hemisphere, confirming the relevance of this sector for continental air pollution (Eyring et al., 2010). This pattern closely matches the distribution simulated in R13 for the year 2000. The relative contribution of shipping to surface-level sulfate concentration (Fig. 5c), however, is generally lower than in R13. In particular, lower contributions are found over the northern Pacific Ocean (20 %–40 %, due to the lower absolute impact of shipping in this region than in R13) and over the southern Atlantic (10 %–30 %, due to the higher background concentration of sulfate in this region than in R13). An interesting feature is the large contribution of shipping to the sulfate concentration over the northern Atlantic Ocean, between the coasts of Greenland and Scandinavia: this is due to the increased emissions in the polar regions in the CMIP6 dataset for 2015 compared to CMIP5 for 2000, in particular along the Northern Sea Route, which has become more travelled in recent years following the depletion of the Arctic ice.
The shipping impacts are reduced in 2030 in all scenarios, although the geographical distribution remains essentially the same. This is because the SSPs do not consider any significant change in the route displacement but just apply a scaling of the traffic activity across the existing routes according to a global spatial matrix (Feng et al., 2020). SSP1 and SSP2 (Fig. 5e, h) project similar ship-induced concentrations, with the highest values reduced to 0.2–0.5 µg m−3. In relative terms, however, this translates to a higher impact in SSP1, due to the cleaner background following the reductions in the emissions from other anthropogenic sectors. In SSP3 (Fig. 5k), the concentration changes in 2030 are still relatively high compared to 2015, although with a smaller relative contribution (Fig. 5l). The shipping sector has only a negligible impact on sulfate pollution in 2050 in SSP1 and SSP2 (Fig. 5n, o, q, r), while it remains relevant in SSP3, with large induced concentrations, around 0.2–0.5 µg m−3, in the northern Indian Ocean and around the Mediterranean, but with a relative contribution reduced to a maximum of 20 % over the northern Atlantic Ocean and northern Pacific Ocean (Fig. 5t, u).
The impact on nitrate (Fig. S7) shows a similar geographic distribution, but a much different future evolution. The shipping-induced nitrate concentrations remain considerably high through 2030 and 2050, with very large relative contributions around and above 70 % over most of the northern-hemispheric oceans and along the major southern-hemispheric routes. This reveals the challenges in reducing the emissions from NOx in the shipping sectors, contrary to the sulfate, which can be more effectively controlled by reducing the shipping FSC. Nitrate impacts are effectively reduced only in the green SSP1 scenario in 2050. Another aspect to be taken into account is the competition between the formation pathways of ammonium sulfate and ammonium nitrate for available ammonia in the lower troposphere, with ammonium sulfate formation being favoured. A reduction in sulfate concentration makes more ammonia available for the formation of ammonium nitrate, leading to enhanced nitrate formation, hence partly compensating the reduction in sulfate. Being the largest contributors to shipping pollution, sulfate and nitrate also influence the impact of this sector on particle number concentrations (Fig. 6). Here again the largest impacts are found over the northern-hemispheric oceans and in the southern high-latitude regions, progressively reducing in 2030 and 2050. Over the southern extra-tropics shipping induces a reduction in the particle number in most scenarios: this could be due to the relatively large size of ship-induced particles inhibiting the nucleation of new particles typical of the pristine environments of these regions and thus limiting or removing a key source of particle number.
4.3 Aviation
Compared to the other two sectors, the impact of aviation on mass burdens is small (Fig. 2c), even though this is calculated in the altitude range of 8 to 12 km, where most of the aviation emissions are released. Aviation contributes 0.3 Gg to the upper-tropospheric BC burden in 2015, almost 3 times more than in R13. The contribution is also larger in relative terms (5 % versus 2 %). This could be due to an increase in BC emissions between 2000 and 2015, but also to the improved model vertical resolution adopted in the present study (41 levels) with respect to R13 (19 levels). The L41 resolution has been specifically designed to resolve the upper troposphere and the related process in higher detail and has been shown to be suitable in several modelling studies targeting this region (Dietmüller et al., 2014; Bock and Burkhardt, 2016; Righi et al., 2020). The coarse vertical resolution used in R13 may therefore have resulted in an underestimated impact of aviation-induced BC in the upper troposphere. This appears to also be the case for sulfate, which shows an aviation-induced upper-tropospheric burden of 7.1 Gg, larger than in R13 by more than a factor of 2. This is also larger in relative terms (4 % vs. 3 %). Despite the increased aviation impact on the mass burden, the impact on number is lower than in R13 (1.1×1026 vs. 1.2×1027 particles) by about 1 order of magnitude and by about half in relative terms (6 % vs. 12 %), although identical size distributions for the emitted particles have been assumed in the two studies. Besides the aforementioned improvement in the vertical resolution, the improved representation of the aerosol dynamics in the new version of the MADE aerosol submodel adopted here (MADE3; Kaiser et al., 2019) could explain these differences, as revealed, for instance, by the much lower background concentration of aerosol particles (Fig. 8a) with respect to the previous assessment. The EMAC model system has also been updated with respect to the previous assessment and now uses the second version of the MESSy interface, comprising numerous updates in several key submodels, such as for example the scavenging submodel SCAV (Tost et al., 2006). Aviation-induced upper-tropospheric BC burden keeps growing until 2030 in SSP2 and SSP3 and grows further in 2050 for SSP3. Aviation-induced BC burden decreases only in the SSP1 scenarios, with a reduction of a factor of more than 2 in 2030 and more in 2050. In relative terms these changes are less marked, due to the corresponding changes in background BC concentrations. The sulfate burden follows a similar path, with a weak decrease in SSP1 and a steady increase in SSP2 and SSP3. This shows that the desulfurization of the aviation sector is not considered to be an emission reduction measure in these scenarios, although it is relatively easy to implement, as it does not require technical modifications nor does it need to cope with the long lifetime of the commercial fleet (e.g. Unger, 2011; Moore et al., 2017).
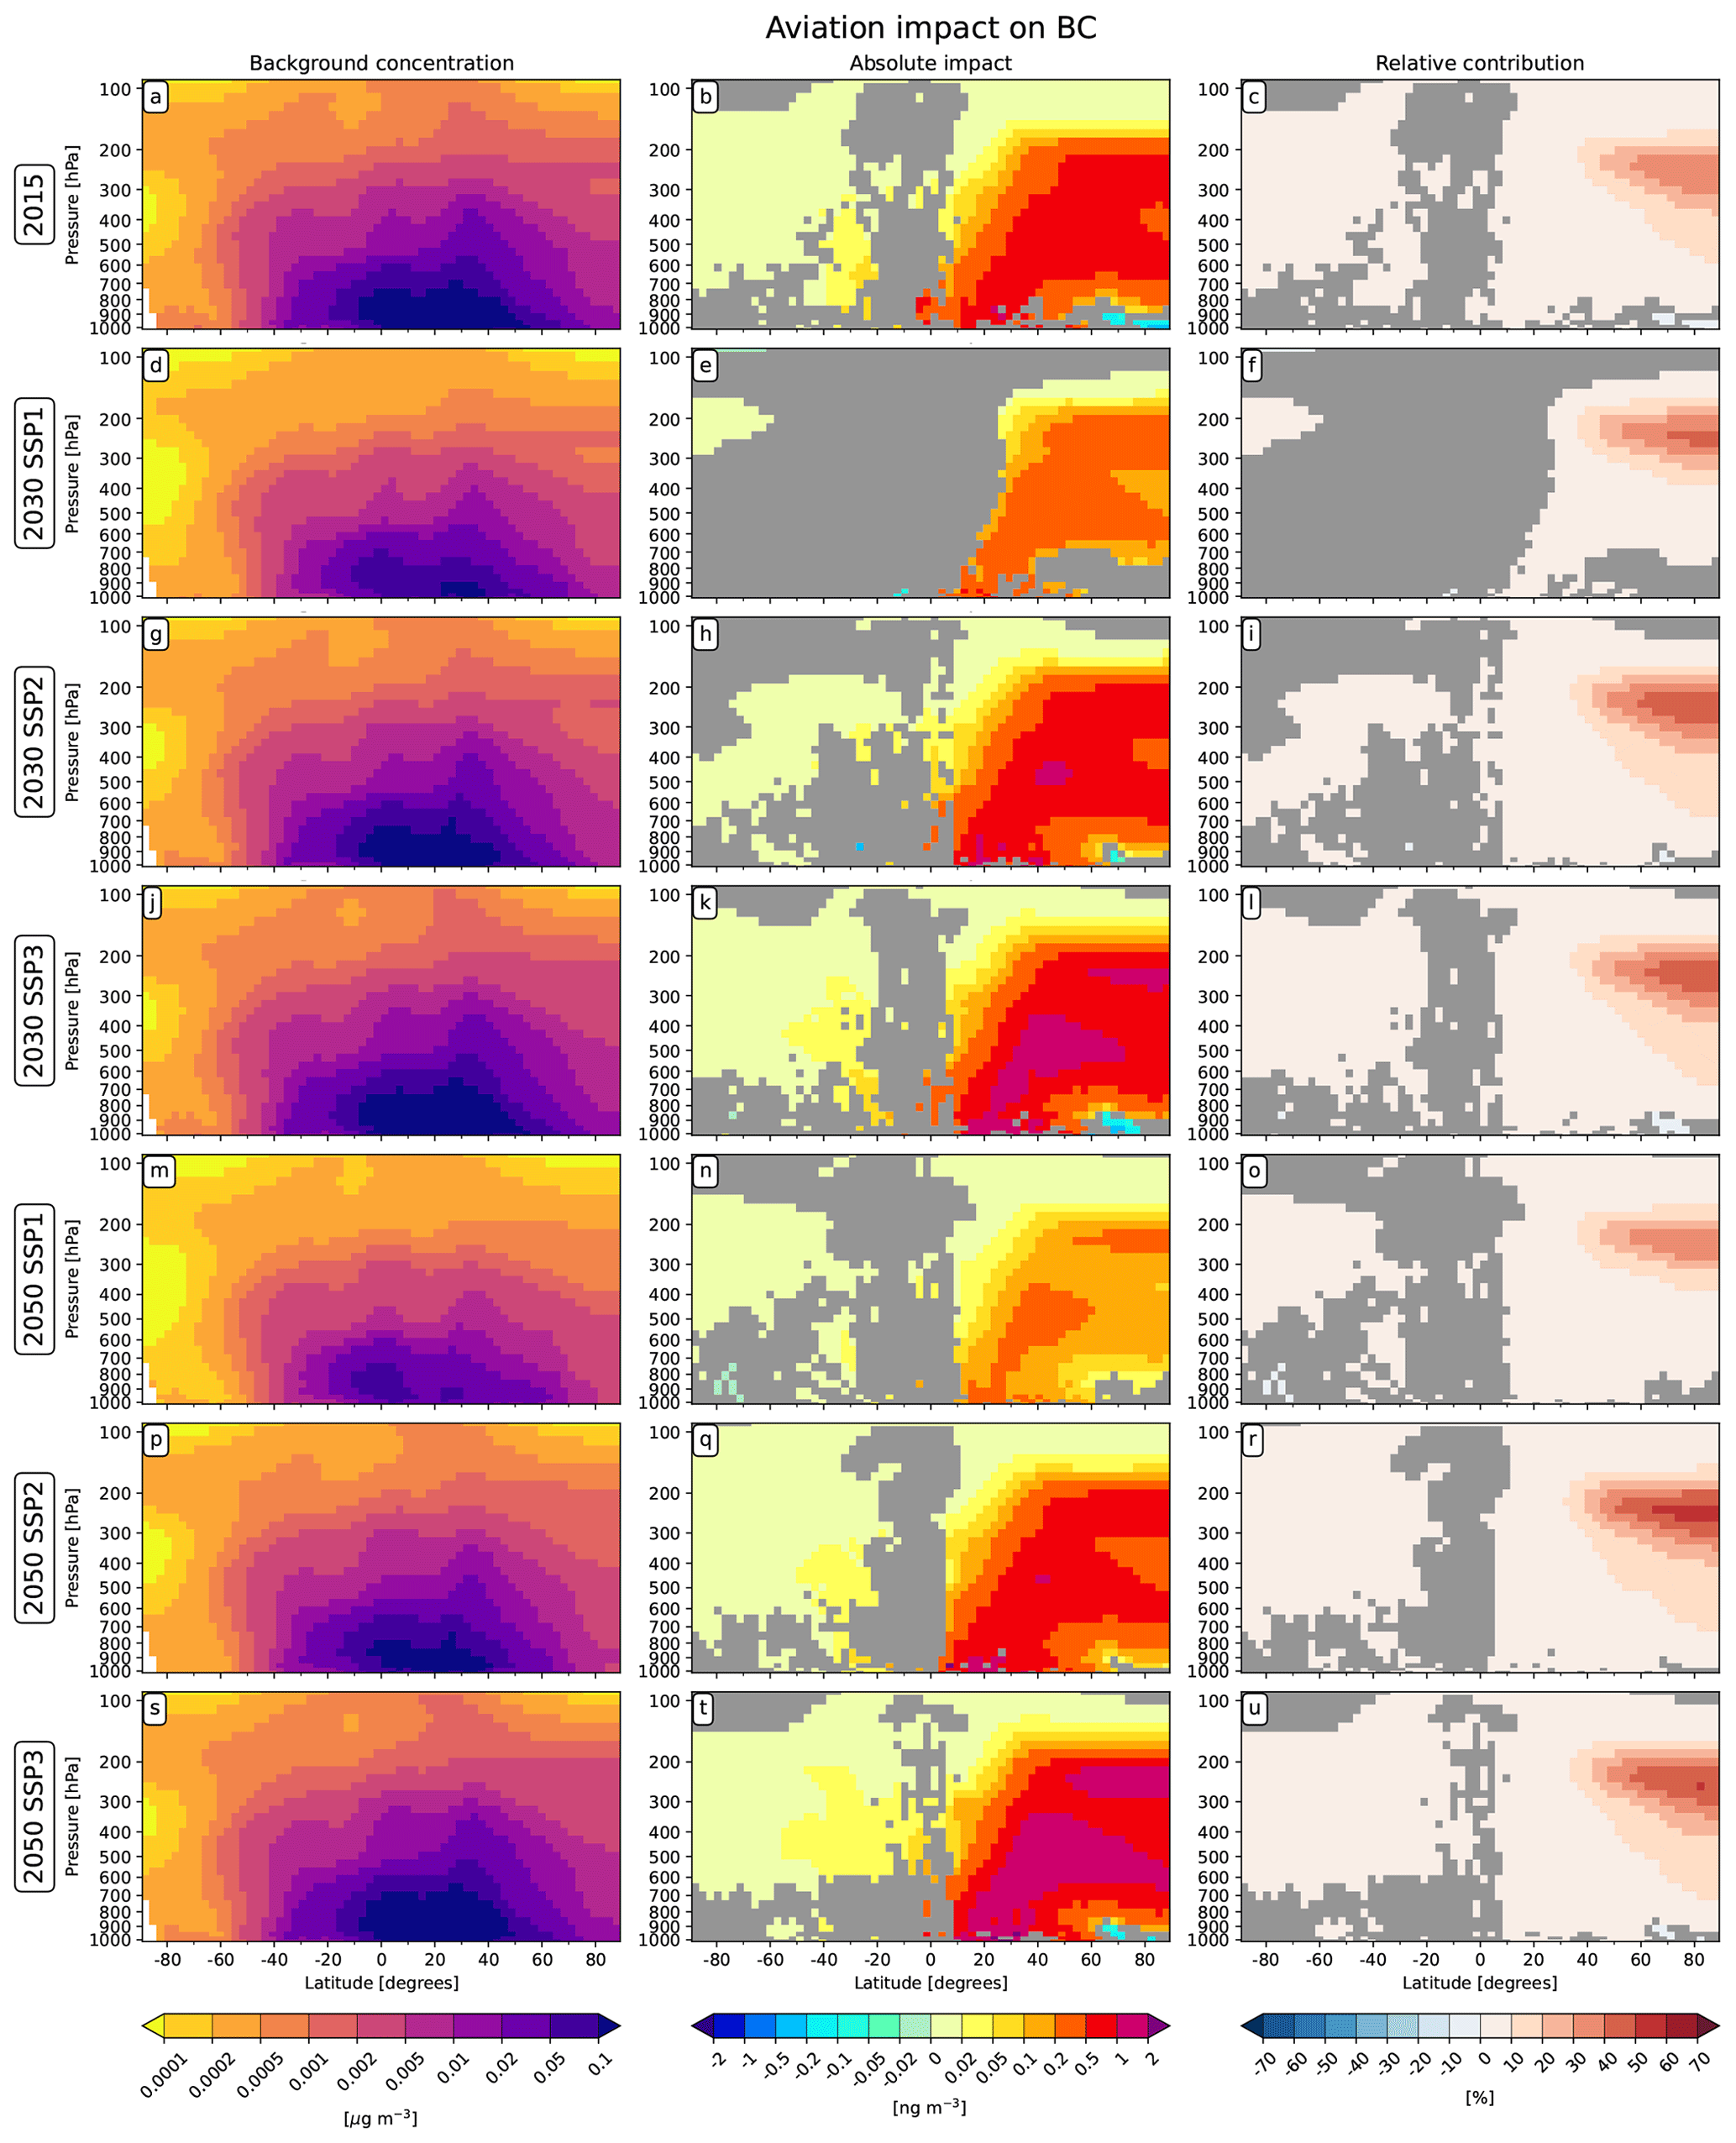
Figure 7Aviation impact on zonally averaged BC concentration. The left panel shows the background concentration for reference. The middle and right panels show the land-transport-induced absolute impacts and the relative contributions, respectively. Grid points where the differences are not significant at the 95 % confidence level are masked out in grey. Note that, in contrast to the other figures, the units of the absolute changes are nanograms per cubic metre.
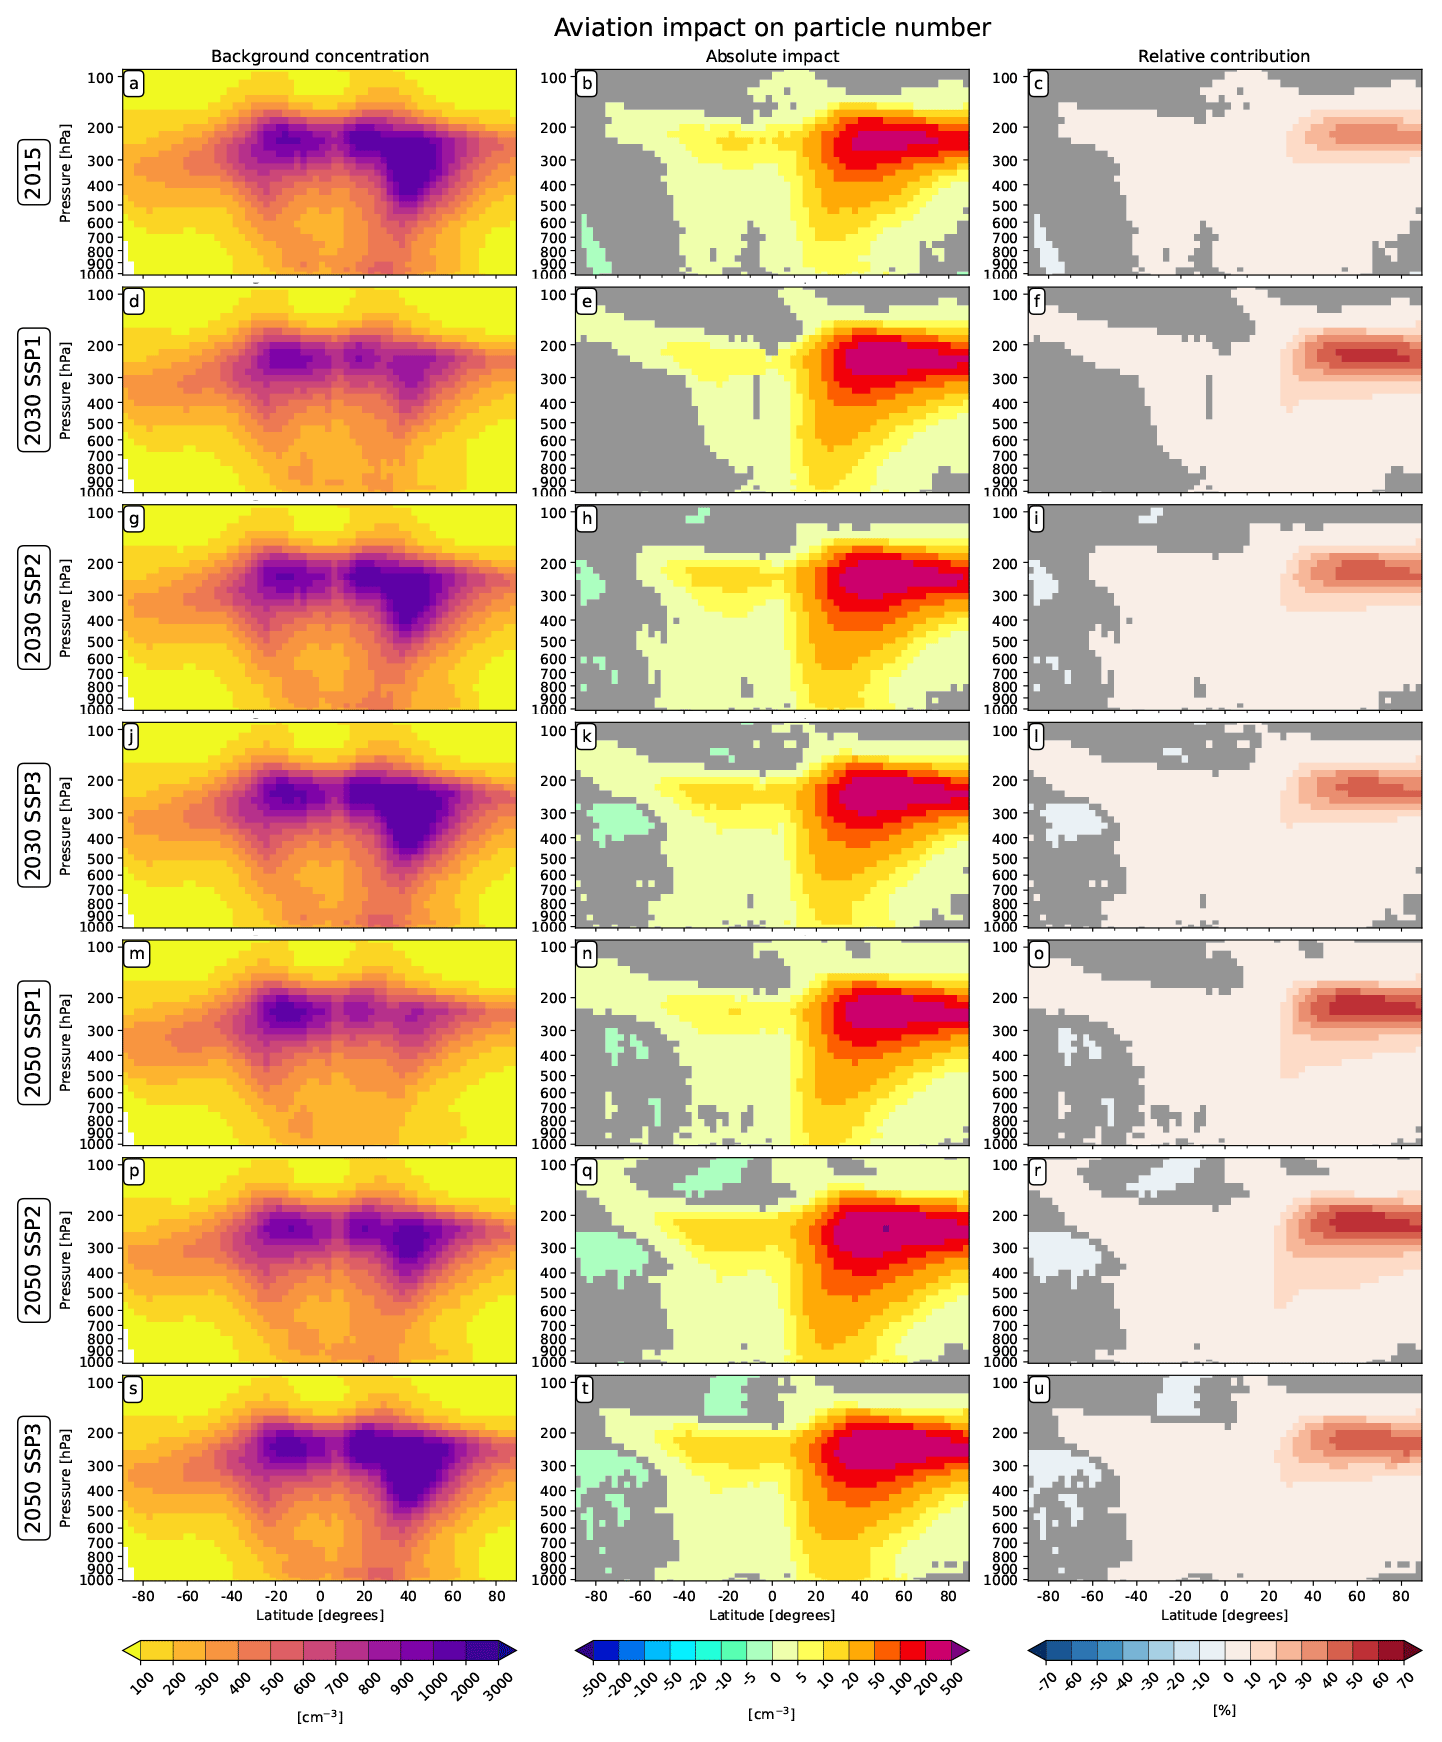
Figure 8As in Fig. 7, but for the aviation impact on zonally averaged particle number concentration.
The spatial distributions of aviation-induced BC concentrations are depicted in Fig. 7 as zonal-mean maps. In 2015 (Fig. 7b), the largest changes (0.5–1 ng m−3) are simulated for the Northern Hemisphere at latitudes >40∘ N at typical cruise levels of 200–350 hPa. Similarly high concentrations are simulated at lower levels, possibly driven by short- and medium-range flights over the continents, and close to the surface at mid-latitudes, related to landing and take-off and airport activities. The Southern Hemisphere concentrations are only weakly affected by aviation, with induced changes in BC concentrations below 0.05 ng m−3. As inferred from the analysis of the burdens, these values are significantly higher than those reported in R13. This is also the case for the relative contribution of aviation to BC concentration (Fig. 7c), peaking at 30 %–40 % at high latitude in the Northern Hemisphere at 200–300 hPa. This is higher than the ∼5 % value reported in R13 and shifted northward, although the overall pattern is still comparable. The future aviation impacts decrease only in the SSP1 scenario while maintaining a similar zonal distribution. Aviation-induced BC concentrations are reduced to 0.2–0.5 ng m−3 in 2030 and further down to 0.1 ng m−3 over most of the northern latitudes in this scenario (Fig. 7e, n), with minor changes in relative terms (Fig. 7f, o). In SSP2, the absolute impact remains approximately constant until 2050 (Fig. 7h, q), while it increases in relative terms (Fig. 7i, l), up to 50 %–60 % in 2050. This is the scenario with the highest relative contribution in the future: even though SSP3 shows much higher absolute impacts (around 1–2 ng m−3; Fig. 7k, t), the cleanest background emissions in SSP2 make the aviation sector more impactful in this scenario. Similar considerations can be made for the aviation-induced impacts on sulfate (Fig. S15), while the nitrate impacts (Fig. S13) show an interesting dual structure, with concentration increases between 5 and 20 ng m−3 throughout the whole troposphere in northern mid-latitudes and significant increases in the upper troposphere at latitudes above 40∘ N. As mentioned in Sect. 4.2, this is due to the competition between ammonium sulfate and ammonium nitrate for available ammonia, which is particularly distinct in the upper troposphere due to the low availability of ammonia (e.g. Unger et al., 2013).
Despite the relatively small impact on mass concentrations, of the order of a few nanograms per cubic metre, the aviation sector significantly increases the particle number concentration in the upper troposphere. This is due to the high efficiency of the combustion processes in aircraft engines, which lead to the formation of smaller BC particles compared to other sectors (Petzold et al., 1999). Furthermore, sulfur dioxide in aircraft plumes can drive efficient new particle formation in the upper troposphere, contributing to particle number concentrations. Aviation-induced particle number concentrations as high as 200–500 cm−3 are found in the upper-tropospheric northern mid-latitudes in 2015 (Fig. 8b). This is about 1 order of magnitude lower than in R13. The aviation impact also propagates to lower levels, with induced changes of tens of particles per cubic centimetre, with potential impacts on low-level clouds. The strongest relative contribution of aviation to particle number concentration, however, remains confined in the upper troposphere at mid-latitudes, with values of 20 %–30 %, in line with R13. This means that both the aviation impact and the background are lower in this study than in R13. This could be due to the improved representation of the nucleation process in MADE3, which assumes a larger size of 10 nm for newly formed particles with respect to its predecessor version in order to better reproduce the observations in the upper troposphere (Kaiser et al., 2019). As a consequence, the nucleation process leads to the formation of a lower number of particles (see again Fig. 8a).
The aviation impact on particle number concentrations remains large in all future scenarios. The impacts in the lower troposphere, in particular, increase to values larger than 10 cm−3 in all SSPs, with potential consequences for the aerosol interactions with low clouds. Interestingly, the relative contribution shows a counterintuitive development, with the highest values in SSP1 and SSP2 (>60 %) and smaller values in SSP3. This can be explained by the relatively long lifetime of the fleet in the aviation sector, leading to a slower implementation of technical and policy measures in this sector, which therefore reacts less promptly than the other sectors in determining the background concentrations. In SSP1, for example, background concentrations are very efficiently reduced in 2030 and 2050 (Fig. 8d, m), while aviation follows a less efficient reduction path (Fig. 8e, n), resulting in a higher relative contribution to overall pollution in the future than in SSP3 (Fig. 8f, o). Note that, according to Feng et al. (2020), the geographical distribution of aviation emissions in the CMIP6 inventory remains the same as in 2015 in all SSPs and is simply scaled to match the global emissions.
To quantify the climate impacts we apply the well-known RF metric (Ramaswamy et al., 2019). More specifically, the climate impact of the transport sectors is estimated as the difference in the radiative fluxes between a reference and a sensitivity simulation, the latter completely neglecting the emissions of the given sector (see also Sect. 2). Given that we are using an aerosol–cloud coupled model, the radiative fluxes and the resulting forcings calculated here explicitly consider the impact of cloud adjustments; hence the RF values presented in the following can be regarded as effective radiative forcings. Furthermore, the model is able to diagnose both the all-sky and the clear-sky aerosol RF: the first considers the changes in radiative fluxes in both cloudy and cloud-free model grid boxes in each model time step, whereas the latter is a diagnostic quantity calculated ignoring the effect of clouds on the radiative fluxes. The difference between these two quantities can be regarded as a proxy for the RF due to aerosol–cloud interactions. Note, however, that the clear-sky RF cannot be ascribed to the aerosol–radiation interactions only, as it may include other forcings too (e.g, the ones due to changes in water vapour or to the semi-direct effect). These caveats should be kept in mind when interpreting the results discussed in this section.
Aerosol from the land transport sector accounts for a RF of −164 mW m−2 in 2015 (Fig. 9a), representing the largest impact among the three sectors. This estimate is considerably larger than the value of −12 mW m−2 reported in R13. Although both studies assume the same size distribution for the particles emitted by land transport (based on Birmili et al., 2009), here we further assume that primary sulfate aerosol particles from land transport are emitted in the Aitken mode with a geometric mean diameter of 30 nm (see Table 1). This results in a larger land-transport-induced impact on particle number concentration (Fig. 4b, c) than in R13, especially in relative terms, with land transport contributions to particle number well above 20 %–30 % in several regions of the world. This is also due to a different representation of the aerosol particle background in the present study, which is generally lower than in R13 (Fig. 4a) and in better agreement with observations (Kaiser et al., 2019). The zonal profiles show that the effect is particularly strong in the northern mid-latitudes (Fig. S19a), where most emissions are released. The RFs simulated in the future scenarios clearly match the narratives underlying the SSPs. In SSP1, the land transport RF is strongly reduced (in absolute terms) to −28 mW m−2 in 2030 and becomes statistically non-significant in 2050. A less marked reduction in the climate impact of land transport characterizes SSP2, with a RF of −122 mW m−2 in 2030 and −106 mW m−2 in 2050. Consistent with the narrative of the SSP3 scenario, an increase in RF is simulated here, with a stronger land-transport-induced cooling effect of −194 mW m−2 in 2030 and −205 mW m−2 in 2050. In all cases, the all-sky RF dominates over the clear-sky component, revealing that the land-transport-induced climate impact mostly results from the interactions between aerosol and clouds, thus confirming the results of R13 and Righi et al. (2015).
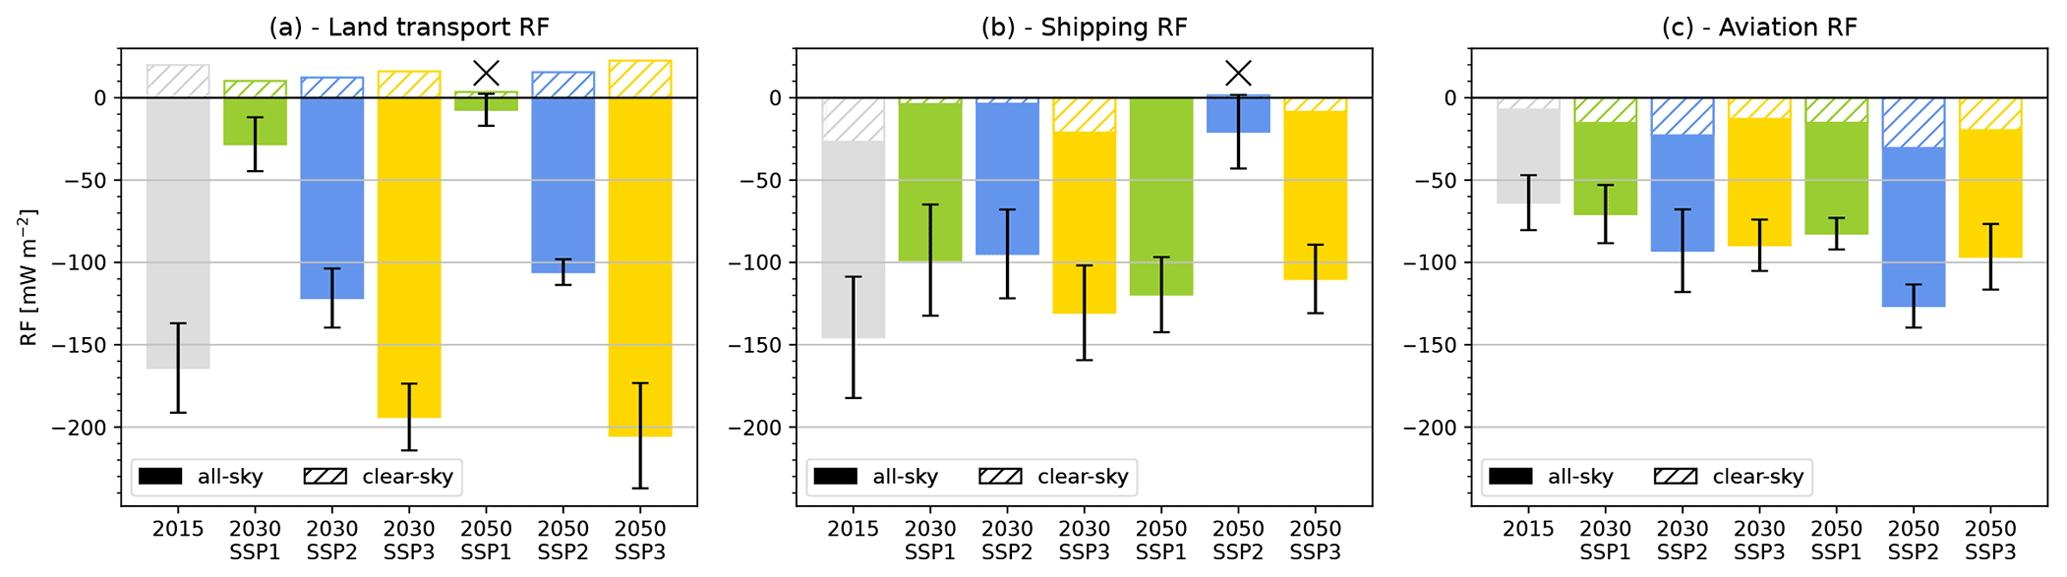
Figure 9All-sky (solid) and clear-sky (hatched) RF of land transport, shipping, and aviation in the year 2015 and for the three SSP scenarios in 2030 and 2050. The error bars represent the 95 % confidence interval of the all-sky RF. The confidence interval is calculated using a two-tailed t test. The crosses indicate non-significant results.
Aerosol from shipping exerts a RF of −145 mW m−2 in the year 2015 (Fig. 9b), which is slightly smaller than the RF of −181 mW m−2 found in R13. This is a consequence of the assumption of the size distribution of ship-emitted particles in this study: although we use the same size distribution parameters by Petzold et al. (2008), we assigned only 10 % of the emitted mass to the Aitken mode rather than 20 % as in R13, hence assuming a more aged population. This reduces the number of emitted particles and in turn the impact of these particles on clouds and the RF. Another reason, as discussed in Sect. 4.2, is the lower shipping-induced aerosol sulfate in this study, following the introduction of the MARPOL regulations of FSC starting from 2010. Since sulfate has a remarkable contribution to cloud condensation nuclei, its reduction affects the RF impact via the aerosol indirect effect. As for land transport, the shipping RF is significant at the northern mid-latitudes (Fig. S19b) but has an additional very strong component in the Southern Hemisphere, where ship traffic is still relevant along a few routes, and, most importantly, aerosol and precursors are released in a pristine background (Fig. 6a), where the cloud susceptibility can be high. The shipping-induced negative RF is reduced in all scenarios in 2030, mostly for SSP1 and SSP2 (from −145 to −99 and −95 mW m−2, respectively), while in SSP3 the reduction is marginal (to −131 mW m−2). In 2050, the greenest SSP1 scenario has the largest climate impact (−120 mW m−2), comparable to SSP3 (−110 mW m−2). This might appear counterintuitive but can be explained with the much lower particle number background in this clean scenario (Fig. 6d), such that even a relatively small number of shipping-induced particles leads to a large RF effect. SSP2, in contrast, projects a non-significant aerosol–climate effect from shipping in this year, consistent with the large reductions in shipping SO2 emissions in this scenario (see Sect. 3 and Fig. 1d) and still-relevant background sulfate pollution (Fig. 5p).
The impact of aviation-induced aerosol in 2015 is quantified as −64 mW m−2, larger than the estimate in R13 by a factor of about 4 (−15 mW m−2). As discussed above, this is due to the larger relative impacts of aviation on particle number concentration in the current study, following an improved representation of background particles, in particular the ones generated by the new-particle-formation process (Kaiser et al., 2019). Although other modelling groups have confirmed these large aviation RFs (Gettelman and Chen, 2013; Kapadia et al., 2016), the effect of aviation-induced aerosol on liquid clouds is still considered quite speculative (Lee et al., 2021), as large uncertainties exist in the size distribution of emitted particles and in the effectiveness of the downward transport of aviation-induced particles from typical flight altitudes (8–12 km) to the lower atmospheric layers, where they could potentially impact liquid-phase clouds by acting as condensation nuclei. All SSPs project a steadily increasing impact of the aviation RF, with the strongest growth in SSP2, reaching a RF of −126 mW m−2 in 2050. As argued in Righi et al. (2016), the long lifetime of the aviation fleet and the tight constraints on safety and costs make the introduction of mitigation measures in aviation more challenging than in other sectors. In all scenarios the mitigation measures do not lead to a reduction in the overall aviation emissions, which are instead only modulated by different growth rates in overall traffic volumes.
In this study, the global impact of the transport sectors (land transport, shipping, and aviation) on aerosol and the resulting climate effects for the present day (2015) and three future projections for 2030 and 2050 are assessed using the recent CMIP6 emission inventory and the SSP scenarios as an input to a state-of-the-art global aerosol–climate model, including detailed aerosol microphysics and an explicit representation of aerosol–radiation and aerosol–cloud interactions. The results are compared with the findings of our previous assessments (Righi et al., 2013, 2015, 2016), which used a predecessor version of the same model and the earlier CMIP5 emission data for the year 2000 combined with the RCP projections for 2030.
In the simulations for present-day (2015) conditions, black carbon and nitrate are found to be highly relevant pollutants from land transport, which contributes 15 %–20 % of the near-surface concentrations of these species. The shipping sector is also an important source of nitrate pollution, responsible for more than 20 % of its near-surface concentration over the oceans, and still contributes significantly to aerosol sulfate pollution, despite the introduction of control measures for fuel sulfur content in shipping by MARPOL in 2010. The aviation contribution to the aerosol mass concentrations in the upper troposphere is generally small (below 5 %), while it is larger for the particle number (5 %–10 %). The results for the transport-induced aerosol mass concentrations generally confirm the findings of R13, although some major differences exist, especially in the geographical distribution of the transport impacts. These are essentially due to the updated emission inventory used as an input to the model simulations and the different year under investigation (2015 vs. 2000) but also to the improvement of the model. Substantial differences, on the other hand, are found in terms of simulated transport-induced impacts on aerosol number concentration. This is because the new MADE3 model version adopted here is characterized by a generally lower background concentration of particles as a result of different assumptions on the particle size distribution upon emissions by anthropogenic sources (including transport) and an improved representation of the ageing of newly formed particles via the nucleation process. The extensive evaluation performed by Kaiser et al. (2019) and Righi et al. (2020) shows that the new model version provides a better representation of the aerosol background and the climate mean state of the key cloud and radiation variables compared with observations. This results in larger RF effects for land transport and aviation with respect to the previous assessment, while a smaller RF is simulated for shipping, thanks also to the reduced sulfate impacts following the MARPOL regulations on fuel sulfur content.
The mid- and long-term projections of the transport effects under the SSPs are generally consistent with the narratives underlying the scenarios. SSP1 is characterized by the lowest impacts, with a strong decrease in the land transport effects, a slight decrease for shipping, and a lower increase than the other scenarios for aviation. The climate impacts of shipping and aviation in this scenario are still relatively high despite a strong reduction in their emissions, which can be ascribed to the very low background concentrations, which are mostly controlled by the emissions of the other anthropogenic sectors. The results for the SSP2 scenario confirm its middle-of-the-road nature, which is evident especially in the impacts of the land transport sector. A peculiarity of this scenario is the low climate impact of shipping, due to low emissions from this sector combined with still-elevated aerosol levels induced by other sectors, and the relatively large impact of aviation, whose emissions in this scenario are still high compared to other sectors. The strong growth of pollution characterizing SSP3 is remarkable, showing steadily growing impacts in 2030 and 2050 with respect to 2015, especially in the land transport sector. These results show that the impacts of the transport sectors under the SSPs are more consistent with the respective storylines than in the predecessor RCP scenarios used in Righi et al. (2015, 2016).
From the analysis of the simulations in this study we can conclude that the challenges in quantifying the impact of the transport sectors on aerosol and climate are twofold. On the one hand, reliable emission inventories are essential for a correct quantification of the resulting impacts: this concerns not only the total emitted mass, but also its geographical distribution. On the other hand, the representation of the aerosol concentration background in the model can play a significant role in characterizing the impact of the perturbation introduced by the emissions of the specific sectors. This is particularly the case when analysing the scenario projections, as the potential reduction in the emissions for a given sector needs to be set in the context of the emission changes in other sectors. Policy measures cannot therefore be evaluated only focusing on a single sector but have to be considered as part of a larger picture. The representation of the background is also a modelling challenge, and our results suggest that an accurate representation of the aerosol background concentrations is important and can significantly affect the estimated impacts, as is clear when comparing the outcome of the present study with the results of the previous assessment obtained with a predecessor version of the same model. The prominent role of the background has further consequences for the development and application of climate response models (e.g. Grewe and Stenke, 2008; Wild et al., 2012; Dahlmann et al., 2016; Rieger and Grewe, 2022) to assess the transportation impacts of aerosol, implying that the global model simulations for training these models should be performed with varying background conditions in the region of interest.
On the policy side, a further challenge is posed by the trade-offs connected with the implementation of specific measures. One prominent example is the reduction in fuel sulfur content in shipping to improve air quality along the coastlines, which at the same time leads to a reduction in the ship-induced cooling via the aerosol indirect effect, in turn reducing the offset of greenhouse warming (Quaas et al., 2022). Future modelling studies will also need to deal with the growing impacts of alternative fuels and their consequences for the atmospheric composition, for example hydrogen, ammonia, and methanol (Popa et al., 2015; McKinlay et al., 2021; Wen et al., 2023), and new particle types resulting from non-combustion processes (Grigoratos and Martini, 2014; Timmers and Achten, 2016), whose impact is projected to become increasingly important with the progressive electrification of the land transport sector.
This paper focuses on the impact of the transport sectors on aerosol and the related climate effects in the SSPs. Two companion studies are currently ongoing to address the transport impact on ozone and the overall impacts of the transport sectors (comparing CO2 and non-CO2 effects), respectively.
MESSy is continuously developed and applied by a consortium of institutions. MESSy and the source code are licensed to all affiliates of institutions which are members of the MESSy Consortium. Institutions can become members of the MESSy Consortium by signing the MESSy Memorandum of Understanding. More information can be found on the MESSy Consortium website (http://www.messy-interface.org, last access: 15 June 2023). The model configuration discussed in this paper is based on EMAC version 2.55. The exact set-up used to produce the results of this paper is archived at the German Climate Computing Center (DKRZ) and can be made available to members of the MESSy community upon request. The output of the model simulations discussed in this paper is available at https://doi.org/10.5281/zenodo.8134336 (Righi, 2023).
The supplement related to this article is available online at: https://doi.org/10.5194/esd-14-835-2023-supplement.
MR conceived the study, designed and performed the simulations, analysed the data, and wrote the paper. JH conceived the study and contributed to the simulation design and to the text. SB prepared the CMIP6–SSP emission data used to drive the model simulations and contributed to the text.
The contact author has declared that none of the authors has any competing interests.
Publisher’s note: Copernicus Publications remains neutral with regard to jurisdictional claims in published maps and institutional affiliations.
We are grateful to Axel Lauer (DLR) for his valuable comments on an earlier version of this paper and to Christof Beer, Patrick Jöckel, and Mariano Mertens (DLR) for helpful suggestions. The constructive comments by the two anonymous referees are kindly acknowledged. The processing of the CMIP6–SSP emissions for usage in EMAC has greatly benefited from the efforts of Markus Kunze (Leibniz Institute of Atmospheric Physics) and Phoebe Graf (DLR). Mattia Righi would also like to thank Manuel Schlund (DLR) for his competent help with the matplotlib Python library. The model simulations and data analysis for this work used the resources of the Deutsches Klimarechenzentrum (DKRZ) granted by its Scientific Steering Committee (WLA) under project ID bd0080.
This study was supported by the DLR transport research programme (TraK and DATAMOST projects).
The article processing charges for this open-access publication were covered by the German Aerospace Center (DLR).
This paper was edited by Kirsten Zickfeld and reviewed by two anonymous referees.
Bauer, N., Calvin, K., Emmerling, J., Fricko, O., Fujimori, S., Hilaire, J., Eom, J., Krey, V., Kriegler, E., Mouratiadou, I., de Boer, H. S., van den Berg, M., Carrara, S., Daioglou, V., Drouet, L., Edmonds, J. E., Gernaat, D., Havlik, P., Johnson, N., Klein, D., Kyle, P., Marangoni, G., Masui, T., Pietzcker, R. C., Strubegger, M., Wise, M., Riahi, K., and van Vuuren, D. P.: Shared Socio-Economic Pathways of the Energy Sector – Quantifying the Narratives, Global Environ. Chang., 42, 316–330, https://doi.org/10.1016/j.gloenvcha.2016.07.006, 2017. a
Bellouin, N., Quaas, J., Gryspeerdt, E., Kinne, S., Stier, P., Watson-Parris, D., Boucher, O., Carslaw, K. S., Christensen, M., Daniau, A.-L., Dufresne, J.-L., Feingold, G., Fiedler, S., Forster, P., Gettelman, A., Haywood, J. M., Lohmann, U., Malavelle, F., Mauritsen, T., McCoy, D. T., Myhre, G., Mülmenstädt, J., Neubauer, D., Possner, A., Rugenstein, M., Sato, Y., Schulz, M., Schwartz, S. E., Sourdeval, O., Storelvmo, T., Toll, V., Winker, D., and Stevens, B.: Bounding Global Aerosol Radiative Forcing of Climate Change, Rev. Geophys., 58, e2019RG000660, https://doi.org/10.1029/2019rg000660, 2020. a
Bilsback, K. R., Kerry, D., Croft, B., Ford, B., Jathar, S. H., Carter, E., Martin, R. V., and Pierce, J. R.: Beyond SOx reductions from shipping: assessing the impact of NOx and carbonaceous-particle controls on human health and climate, Environ. Res. Lett., 15, 124046, https://doi.org/10.1088/1748-9326/abc718, 2020. a
Birmili, W., Alaviippola, B., Hinneburg, D., Knoth, O., Tuch, T., Borken-Kleefeld, J., and Schacht, A.: Dispersion of traffic-related exhaust particles near the Berlin urban motorway – estimation of fleet emission factors, Atmos. Chem. Phys., 9, 2355–2374, https://doi.org/10.5194/acp-9-2355-2009, 2009. a, b
Bock, L. and Burkhardt, U.: The temporal evolution of a long-lived contrail cirrus cluster: Simulations with a global climate model, J. Geophys. Res.-Atmos., 121, 3548–3565, https://doi.org/10.1002/2015jd024475, 2016. a
Bond, T. C., Doherty, S. J., Fahey, D. W., Forster, P. M., Berntsen, T., DeAngelo, B. J., Flanner, M. G., Ghan, S., Kärcher, B., Koch, D., Kinne, S., Kondo, Y., Quinn, P. K., Sarofim, M. C., Schultz, M. G., Schulz, M., Venkataraman, C., Zhang, H., Zhang, S., Bellouin, N., Guttikunda, S. K., Hopke, P. K., Jacobson, M. Z., Kaiser, J. W., Klimont, Z., Lohmann, U., Schwarz, J. P., Shindell, D., Storelvmo, T., Warren, S. G., and Zender, C. S.: Bounding the role of black carbon in the climate system: A scientific assessment, J. Geophys. Res.-Atmos., 118, 5380–5552, https://doi.org/10.1002/jgrd.50171, 2013. a
Boucher, O., Randall, D., Artaxo, P., Bretherton, C., Feingold, G., Forster, P., Kerminen, V.-M., Kondo, Y., Liao, H., Lohmann, U., Rasch, P., Satheesh, S., Sherwood, S., Stevens, B., and Zhang, X.: Clouds and Aerosols, in: Climate Change 2013: The Physical Science Basis. Contribution of Working Group I to the Fifth Assessment Report of the Intergovernmental Panel on Climate Change, edited by: Stocker, T., Qin, D., Plattner, G.-K., Tignor, M., Allen, S., Boschung, J., Nauels, A., Xia, Y., Bex, V., and Midgley, P., 571–658, Cambridge University Press, https://doi.org/10.1017/cbo9781107415324.016, 2013. a, b
Buhaug, O., Corbett, J. J., Endresen, O., Eyring, V., Faber, J., Hanayama, S., Lee, D. S., Lee, D., Lindstad, H., Markowska, A. Z., Mjelde, A., Nelissen, D., Nilsen, J., Pålsson, C., Winebrake, J. J., Wu, W.-Q., and Yoshida, K.: Second IMO Greenhouse Gas Study 2009, Tech. rep., International Maritime Organization, London, UK, 2009. a, b, c, d
Creutzig, F., Jochem, P., Edelenbosch, O. Y., Mattauch, L., v. Vuuren, D. P., McCollum, D., and Minx, J.: Transport: A roadblock to climate change mitigation?, Science, 350, 911–912, https://doi.org/10.1126/science.aac8033, 2015. a
Dahlmann, K., Grewe, V., Frömming, C., and Burkhardt, U.: Can we reliably assess climate mitigation options for air traffic scenarios despite large uncertainties in atmospheric processes?, Transport Res. D-Tr. E., 46, 40–55, https://doi.org/10.1016/j.trd.2016.03.006, 2016. a
Dee, D. P., Uppala, S. M., Simmons, A. J., Berrisford, P., Poli, P., Kobayashi, S., Andrae, U., Balmaseda, M. A., Balsamo, G., Bauer, P., Bechtold, P., Beljaars, A. C. M., van de Berg, L., Bidlot, J., Bormann, N., Delsol, C., Dragani, R., Fuentes, M., Geer, A. J., Haimberger, L., Healy, S. B., Hersbach, H., Hólm, E. V., Isaksen, L., Kållberg, P., Köhler, M., Matricardi, M., McNally, A. P., Monge-Sanz, B. M., Morcrette, J.-J., Park, B.-K., Peubey, C., de Rosnay, P., Tavolato, C., Thépaut, J.-N., and Vitart, F.: The ERA-Interim reanalysis: configuration and performance of the data assimilation system, Q. J. Roy. Meteor. Soc., 137, 553–597, https://doi.org/10.1002/qj.828, 2011. a
Dentener, F., Kinne, S., Bond, T., Boucher, O., Cofala, J., Generoso, S., Ginoux, P., Gong, S., Hoelzemann, J. J., Ito, A., Marelli, L., Penner, J. E., Putaud, J.-P., Textor, C., Schulz, M., van der Werf, G. R., and Wilson, J.: Emissions of primary aerosol and precursor gases in the years 2000 and 1750 prescribed data-sets for AeroCom, Atmos. Chem. Phys., 6, 4321–4344, https://doi.org/10.5194/acp-6-4321-2006, 2006. a
Dietmüller, S., Ponater, M., and Sausen, R.: Interactive ozone induces a negative feedback in CO2-driven climate change simulations, J. Geophys. Res.-Atmos., 119, 1796–1805, https://doi.org/10.1002/2013jd020575, 2014. a
Dietmüller, S., Jöckel, P., Tost, H., Kunze, M., Gellhorn, C., Brinkop, S., Frömming, C., Ponater, M., Steil, B., Lauer, A., and Hendricks, J.: A new radiation infrastructure for the Modular Earth Submodel System (MESSy, based on version 2.51), Geosci. Model Dev., 9, 2209–2222, https://doi.org/10.5194/gmd-9-2209-2016, 2016. a
Esmeijer, K., den Elzen, M., and van Soest, H.: Analysing international shipping and aviation emission projections, Tech. Rep. PBL publication number: 4076, PBL Netherlands Environmental Assessment Agency, The Hague, 2020. a
Eyring, V., Isaksen, I. S., Berntsen, T., Collins, W. J., Corbett, J. J., Endresen, O., Grainger, R. G., Moldanova, J., Schlager, H., and Stevenson, D. S.: Transport impacts on atmosphere and climate: Shipping, Atmos. Environ., 44, 4735–4771, https://doi.org/10.1016/j.atmosenv.2009.04.059, 2010. a
Feng, L., Smith, S. J., Braun, C., Crippa, M., Gidden, M. J., Hoesly, R., Klimont, Z., van Marle, M., van den Berg, M., and van der Werf, G. R.: The generation of gridded emissions data for CMIP6, Geosci. Model Dev., 13, 461–482, https://doi.org/10.5194/gmd-13-461-2020, 2020. a, b, c, d
Fiore, A. M., Naik, V., Spracklen, D. V., Steiner, A., Unger, N., Prather, M., Bergmann, D., Cameron-Smith, P. J., Cionni, I., Collins, W. J., DalsØren, S., Eyring, V., Folberth, G. A., Ginoux, P., Horowitz, L. W., Josse, B., Lamarque, J.-F., MacKenzie, I. A., Nagashima, T., O'Connor, F. M., Righi, M., Rumbold, S. T., Shindell, D. T., Skeie, R. B., Sudo, K., Szopa, S., Takemura, T., and Zeng, G.: Global air quality and climate, Chem. Soc. Rev., 41, 6663–6683, https://doi.org/10.1039/c2cs35095e, 2012. a
Fricko, O., Havlik, P., Rogelj, J., Klimont, Z., Gusti, M., Johnson, N., Kolp, P., Strubegger, M., Valin, H., Amann, M., Ermolieva, T., Forsell, N., Herrero, M., Heyes, C., Kindermann, G., Krey, V., McCollum, D. L., Obersteiner, M., Pachauri, S., Rao, S., Schmid, E., Schoepp, W., and Riahi, K.: The marker quantification of the Shared Socioeconomic Pathway 2: A middle-of-the-road scenario for the 21st century, Global Environ. Chang., 42, 251–267, https://doi.org/10.1016/j.gloenvcha.2016.06.004, 2017. a, b, c
Fuglestvedt, J., Berntsen, T., Eyring, V., Isaksen, I., Lee, D. S., and Sausen, R.: Shipping Emissions: From Cooling to Warming of Climate–and Reducing Impacts on Health, Environ. Sci. Technol., 43, 9057–9062, https://doi.org/10.1021/es901944r, 2009. a
Fujimori, S., Hasegawa, T., Masui, T., Takahashi, K., Herran, D. S., Dai, H., Hijioka, Y., and Kainuma, M.: SSP3: AIM implementation of Shared Socioeconomic Pathways, Global Environ. Chang., 42, 268–283, https://doi.org/10.1016/j.gloenvcha.2016.06.009, 2017. a, b
Gettelman, A. and Chen, C.: The climate impact of aviation aerosols, Geophys. Res. Lett., 40, 2785–2789, https://doi.org/10.1002/grl.50520, 2013. a, b
Gidden, M. J., Riahi, K., Smith, S. J., Fujimori, S., Luderer, G., Kriegler, E., van Vuuren, D. P., van den Berg, M., Feng, L., Klein, D., Calvin, K., Doelman, J. C., Frank, S., Fricko, O., Harmsen, M., Hasegawa, T., Havlik, P., Hilaire, J., Hoesly, R., Horing, J., Popp, A., Stehfest, E., and Takahashi, K.: Global emissions pathways under different socioeconomic scenarios for use in CMIP6: a dataset of harmonized emissions trajectories through the end of the century, Geosci. Model Dev., 12, 1443–1475, https://doi.org/10.5194/gmd-12-1443-2019, 2019. a, b, c, d, e
Girod, B., van Vuuren, D. P., Grahn, M., Kitous, A., Kim, S. H., and Kyle, P.: Climate impact of transportation A model comparison, Climatic Change, 118, 595–608, https://doi.org/10.1007/s10584-012-0663-6, 2013. a
Grewe, V.: A generalized tagging method, Geosci. Model Dev., 6, 247–253, https://doi.org/10.5194/gmd-6-247-2013, 2013. a
Grewe, V. and Stenke, A.: AirClim: an efficient tool for climate evaluation of aircraft technology, Atmos. Chem. Phys., 8, 4621–4639, https://doi.org/10.5194/acp-8-4621-2008, 2008. a
Grigoratos, T. and Martini, G.: Brake wear particle emissions: a review, Environ. Sci. Pollut. R., 22, 2491–2504, https://doi.org/10.1007/s11356-014-3696-8, 2014. a
Hendricks, J., Kärcher, B., Lohmann, U., and Ponater, M.: Do aircraft black carbon emissions affect cirrus clouds on the global scale?, Geophys. Res. Lett., 32, L12814, https://doi.org/10.1029/2005gl022740, 2005. a
Hendricks, J., Kärcher, B., and Lohmann, U.: Effects of ice nuclei on cirrus clouds in a global climate model, J. Geophys. Res.-Atmos., 116, D18206, https://doi.org/10.1029/2010jd015302, 2011. a
Hendricks, J., Righi, M., Dahlmann, K., Gottschaldt, K.-D., Grewe, V., Ponater, M., Sausen, R., Heinrichs, D., Winkler, C., Wolfermann, A., Kampffmeyer, T., Friedrich, R., Klötzke, M., and Kugler, U.: Quantifying the climate impact of emissions from land-based transport in Germany, Transport Res. D-Tr. E., 65, 825–845, https://doi.org/10.1016/j.trd.2017.06.003, 2018. a
Jöckel, P., Kerkweg, A., Pozzer, A., Sander, R., Tost, H., Riede, H., Baumgaertner, A., Gromov, S., and Kern, B.: Development cycle 2 of the Modular Earth Submodel System (MESSy2), Geosci. Model Dev., 3, 717–752, https://doi.org/10.5194/gmd-3-717-2010, 2010. a, b
Kaiser, J. C., Hendricks, J., Righi, M., Riemer, N., Zaveri, R. A., Metzger, S., and Aquila, V.: The MESSy aerosol submodel MADE3 (v2.0b): description and a box model test, Geosci. Model Dev., 7, 1137–1157, https://doi.org/10.5194/gmd-7-1137-2014, 2014. a, b
Kaiser, J. C., Hendricks, J., Righi, M., Jöckel, P., Tost, H., Kandler, K., Weinzierl, B., Sauer, D., Heimerl, K., Schwarz, J. P., Perring, A. E., and Popp, T.: Global aerosol modeling with MADE3 (v3.0) in EMAC (based on v2.53): model description and evaluation, Geosci. Model Dev., 12, 541–579, https://doi.org/10.5194/gmd-12-541-2019, 2019. a, b, c, d, e, f, g, h, i, j, k
Kapadia, Z. Z., Spracklen, D. V., Arnold, S. R., Borman, D. J., Mann, G. W., Pringle, K. J., Monks, S. A., Reddington, C. L., Benduhn, F., Rap, A., Scott, C. E., Butt, E. W., and Yoshioka, M.: Impacts of aviation fuel sulfur content on climate and human health, Atmos. Chem. Phys., 16, 10521–10541, https://doi.org/10.5194/acp-16-10521-2016, 2016. a, b
Kärcher, B., Möhler, O., DeMott, P. J., Pechtl, S., and Yu, F.: Insights into the role of soot aerosols in cirrus cloud formation, Atmos. Chem. Phys., 7, 4203–4227, https://doi.org/10.5194/acp-7-4203-2007, 2007. a
Kontovas, C. A.: Integration of air quality and climate change policies in shipping: The case of sulphur emissions regulation, Mar. Pol., 113, 103815, https://doi.org/10.1016/j.marpol.2020.103815, 2020. a
Kuebbeler, M., Lohmann, U., Hendricks, J., and Kärcher, B.: Dust ice nuclei effects on cirrus clouds, Atmos. Chem. Phys., 14, 3027–3046, https://doi.org/10.5194/acp-14-3027-2014, 2014. a, b
Lamarque, J.-F., Bond, T. C., Eyring, V., Granier, C., Heil, A., Klimont, Z., Lee, D., Liousse, C., Mieville, A., Owen, B., Schultz, M. G., Shindell, D., Smith, S. J., Stehfest, E., Van Aardenne, J., Cooper, O. R., Kainuma, M., Mahowald, N., McConnell, J. R., Naik, V., Riahi, K., and van Vuuren, D. P.: Historical (1850–2000) gridded anthropogenic and biomass burning emissions of reactive gases and aerosols: methodology and application, Atmos. Chem. Phys., 10, 7017–7039, https://doi.org/10.5194/acp-10-7017-2010, 2010. a, b
Lamb, W. F., Wiedmann, T., Pongratz, J., Andrew, R., Crippa, M., Olivier, J. G. J., Wiedenhofer, D., Mattioli, G., Khourdajie, A. A., House, J., Pachauri, S., Figueroa, M., Saheb, Y., Slade, R., Hubacek, K., Sun, L., Ribeiro, S. K., Khennas, S., de la Rue du Can, S., Chapungu, L., Davis, S. J., Bashmakov, I., Dai, H., Dhakal, S., Tan, X., Geng, Y., Gu, B., and Minx, J.: A review of trends and drivers of greenhouse gas emissions by sector from 1990 to 2018, Environ. Res. Lett., 16, 073005, https://doi.org/10.1088/1748-9326/abee4e, 2021. a, b
Le Quéré, C., Jackson, R. B., Jones, M. W., Smith, A. J. P., Abernethy, S., Andrew, R. M., De-Gol, A. J., Willis, D. R., Shan, Y., Canadell, J. G., Friedlingstein, P., Creutzig, F., and Peters, G. P.: Temporary reduction in daily global CO2 emissions during the COVID-19 forced confinement, Nat. Clim. Change, 10, 647–653, https://doi.org/10.1038/s41558-020-0797-x, 2020. a
Lee, D., Fahey, D., Skowron, A., Allen, M., Burkhardt, U., Chen, Q., Doherty, S., Freeman, S., Forster, P., Fuglestvedt, J., Gettelman, A., León, R. D., Lim, L., Lund, M., Millar, R., Owen, B., Penner, J., Pitari, G., Prather, M., Sausen, R., and Wilcox, L.: The contribution of global aviation to anthropogenic climate forcing for 2000 to 2018, Atmos. Environ., 244, 117834, https://doi.org/10.1016/j.atmosenv.2020.117834, 2021. a
Liu, Z., Ciais, P., Deng, Z., Lei, R., Davis, S. J., Feng, S., Zheng, B., Cui, D., Dou, X., Zhu, B., Guo, R., Ke, P., Sun, T., Lu, C., He, P., Wang, Y., Yue, X., Wang, Y., Lei, Y., Zhou, H., Cai, Z., Wu, Y., Guo, R., Han, T., Xue, J., Boucher, O., Boucher, E., Chevallier, F., Tanaka, K., Wei, Y., Zhong, H., Kang, C., Zhang, N., Chen, B., Xi, F., Liu, M., Bréon, F.-M., Lu, Y., Zhang, Q., Guan, D., Gong, P., Kammen, D. M., He, K., and Schellnhuber, H. J.: Near-real-time monitoring of global CO2 emissions reveals the effects of the COVID-19 pandemic, Nat. Commun., 11, 5172, https://doi.org/10.1038/s41467-020-18922-7, 2020. a
Lund, M. T., Berntsen, T. K., and Fuglestvedt, J. S.: Climate Impacts of Short-Lived Climate Forcers versus CO2 from Biodiesel: A Case of the EU on-Road Sector, Environ. Sci. Technol., 48, 14445–14454, https://doi.org/10.1021/es505308g, 2014a. a
Lund, M. T., Berntsen, T. K., Heyes, C., Klimont, Z., and Samset, B. H.: Global and regional climate impacts of black carbon and co-emitted species from the on-road diesel sector, Atmos. Environ., 98, 50–58, https://doi.org/10.1016/j.atmosenv.2014.08.033, 2014b. a
Lund, M. T., Myhre, G., and Samset, B. H.: Anthropogenic aerosol forcing under the Shared Socioeconomic Pathways, Atmos. Chem. Phys., 19, 13827–13839, https://doi.org/10.5194/acp-19-13827-2019, 2019. a
Lund, M. T., Aamaas, B., Stjern, C. W., Klimont, Z., Berntsen, T. K., and Samset, B. H.: A continued role of short-lived climate forcers under the Shared Socioeconomic Pathways, Earth Syst. Dynam., 11, 977–993, https://doi.org/10.5194/esd-11-977-2020, 2020. a
Matthes, S., Lim, L., Burkhardt, U., Dahlmann, K., Dietmüller, S., Grewe, V., Haslerud, A. S., Hendricks, J., Owen, B., Pitari, G., Righi, M., and Skowron, A.: Mitigation of Non-CO2 Aviation's Climate Impact by Changing Cruise Altitudes, Aerospace, 8, 36, https://doi.org/10.3390/aerospace8020036, 2021. a
McKinlay, C. J., Turnock, S. R., and Hudson, D. A.: Route to zero emission shipping: Hydrogen, ammonia or methanol?, Int. J. Hydrogen. Energ., 46, 28282–28297, https://doi.org/10.1016/j.ijhydene.2021.06.066, 2021. a
Mertens, M., Grewe, V., Rieger, V. S., and Jöckel, P.: Revisiting the contribution of land transport and shipping emissions to tropospheric ozone, Atmos. Chem. Phys., 18, 5567–5588, https://doi.org/10.5194/acp-18-5567-2018, 2018. a, b, c
Moore, R. H., Thornhill, K. L., Weinzierl, B., Sauer, D., D'Ascoli, E., Kim, J., Lichtenstern, M., Scheibe, M., Beaton, B., Beyersdorf, A. J., Barrick, J., Bulzan, D., Corr, C. A., Crosbie, E., Jurkat, T., Martin, R., Riddick, D., Shook, M., Slover, G., Voigt, C., White, R., Winstead, E., Yasky, R., Ziemba, L. D., Brown, A., Schlager, H., and Anderson, B. E.: Biofuel blending reduces particle emissions from aircraft engines at cruise conditions, Nature, 543, 411–415, https://doi.org/10.1038/nature21420, 2017. a, b
Moss, R. H., Edmonds, J. A., Hibbard, K. A., Manning, M. R., Rose, S. K., van Vuuren, D. P., Carter, T. R., Emori, S., Kainuma, M., Kram, T., Meehl, G. A., Mitchell, J. F. B., Nakicenovic, N., Riahi, K., Smith, S. J., Stouffer, R. J., Thomson, A. M., Weyant, J. P., and Wilbanks, T. J.: The next generation of scenarios for climate change research and assessment, Nature, 463, 747–756, https://doi.org/10.1038/nature08823, 2010. a
O'Neill, B. C., Kriegler, E., Ebi, K. L., Kemp-Benedict, E., Riahi, K., Rothman, D. S., van Ruijven, B. J., van Vuuren, D. P., Birkmann, J., Kok, K., Levy, M., and Solecki, W.: The roads ahead: Narratives for shared socioeconomic pathways describing world futures in the 21st century, Global Environ. Chang., 42, 169–180, https://doi.org/10.1016/j.gloenvcha.2015.01.004, 2017. a, b
Penner, J. E., Zhou, C., Garnier, A., and Mitchell, D. L.: Anthropogenic Aerosol Indirect Effects in Cirrus Clouds, J. Geophys. Res.-Atmos., 123, https://doi.org/10.1029/2018jd029204, 2018. a
Petzold, A., Döpelheuer, A., Brock, C. A., and Schröder, F.: In situ observations and model calculations of black carbon emission by aircraft at cruise altitude, J. Geophys. Res.-Atmos., 104, 22171–22181, https://doi.org/10.1029/1999jd900460, 1999. a, b
Petzold, A., Gysel, M., Vancassel, X., Hitzenberger, R., Puxbaum, H., Vrochticky, S., Weingartner, E., Baltensperger, U., and Mirabel, P.: On the effects of organic matter and sulphur-containing compounds on the CCN activation of combustion particles, Atmos. Chem. Phys., 5, 3187–3203, https://doi.org/10.5194/acp-5-3187-2005, 2005. a
Petzold, A., Hasselbach, J., Lauer, P., Baumann, R., Franke, K., Gurk, C., Schlager, H., and Weingartner, E.: Experimental studies on particle emissions from cruising ship, their characteristic properties, transformation and atmospheric lifetime in the marine boundary layer, Atmos. Chem. Phys., 8, 2387–2403, https://doi.org/10.5194/acp-8-2387-2008, 2008. a, b, c, d
Petzold, A., Lauer, P., Fritsche, U., Hasselbach, J., Lichtenstern, M., Schlager, H., and Fleischer, F.: Operation of Marine Diesel Engines on Biogenic Fuels: Modification of Emissions and Resulting Climate Effects, Environ. Sci. Technol., 45, 10394–10400, https://doi.org/10.1021/es2021439, 2011. a
Pietzcker, R. C., Longden, T., Chen, W., Fu, S., Kriegler, E., Kyle, P., and Luderer, G.: Long-term transport energy demand and climate policy: Alternative visions on transport decarbonization in energy-economy models, Energy, 64, 95–108, https://doi.org/10.1016/j.energy.2013.08.059, 2014. a
Popa, M., Segers, A., van der Gon, H. D., Krol, M., Visschedijk, A., Schaap, M., and Röckmann, T.: Impact of a future H2 transportation on atmospheric pollution in Europe, Atmos. Environ., 113, 208–222, https://doi.org/10.1016/j.atmosenv.2015.03.022, 2015. a
Quaas, J., Jia, H., Smith, C., Albright, A. L., Aas, W., Bellouin, N., Boucher, O., Doutriaux-Boucher, M., Forster, P. M., Grosvenor, D., Jenkins, S., Klimont, Z., Loeb, N. G., Ma, X., Naik, V., Paulot, F., Stier, P., Wild, M., Myhre, G., and Schulz, M.: Robust evidence for reversal of the trend in aerosol effective climate forcing, Atmos. Chem. Phys., 22, 12221–12239, https://doi.org/10.5194/acp-22-12221-2022, 2022. a
Ramaswamy, V., Collins, W., Haywood, J., Lean, J., Mahowald, N., Myhre, G., Naik, V., Shine, K. P., Soden, B., Stenchikov, G., and Storelvmo, T.: Radiative Forcing of Climate: The Historical Evolution of the Radiative Forcing Concept, the Forcing Agents and their Quantification, and Applications, Meteorol. Monogr., 59, 14.1–14.101, https://doi.org/10.1175/amsmonographs-d-19-0001.1, 2019. a
Rieger, V. S. and Grewe, V.: TransClim (v1.0): a chemistry–climate response model for assessing the effect of mitigation strategies for road traffic on ozone, Geosci. Model Dev., 15, 5883–5903, https://doi.org/10.5194/gmd-15-5883-2022, 2022. a
Rieger, V. S., Mertens, M., and Grewe, V.: An advanced method of contributing emissions to short-lived chemical species (OH and HO2): the TAGGING 1.1 submodel based on the Modular Earth Submodel System (MESSy 2.53), Geosci. Model Dev., 11, 2049–2066, https://doi.org/10.5194/gmd-11-2049-2018, 2018. a
Righi, M.: Model simulation data used in “The global impact of the transport sectors on the atmospheric aerosol and the resulting climate effects under the Shared Socioeconomic Pathways (SSPs)” (Righi et al., Earth Syst. Dynam., 2023), Zenodo [data set], https://doi.org/10.5281/zenodo.8134336, 2023. a
Righi, M., Klinger, C., Eyring, V., Hendricks, J., Lauer, A., and Petzold, A.: Climate Impact of Biofuels in Shipping: Global Model Studies of the Aerosol Indirect Effect, Environ. Sci. Technol., 45, 3519–3525, https://doi.org/10.1021/es1036157, 2011. a
Righi, M., Hendricks, J., and Sausen, R.: The global impact of the transport sectors on atmospheric aerosol: simulations for year 2000 emissions, Atmos. Chem. Phys., 13, 9939–9970, https://doi.org/10.5194/acp-13-9939-2013, 2013. a, b, c, d
Righi, M., Hendricks, J., and Sausen, R.: The global impact of the transport sectors on atmospheric aerosol in 2030 – Part 1: Land transport and shipping, Atmos. Chem. Phys., 15, 633–651, https://doi.org/10.5194/acp-15-633-2015, 2015. a, b, c, d, e
Righi, M., Hendricks, J., and Sausen, R.: The global impact of the transport sectors on atmospheric aerosol in 2030 – Part 2: Aviation, Atmos. Chem. Phys., 16, 4481–4495, https://doi.org/10.5194/acp-16-4481-2016, 2016. a, b, c, d
Righi, M., Hendricks, J., Lohmann, U., Beer, C. G., Hahn, V., Heinold, B., Heller, R., Krämer, M., Ponater, M., Rolf, C., Tegen, I., and Voigt, C.: Coupling aerosols to (cirrus) clouds in the global EMAC-MADE3 aerosol–climate model, Geosci. Model Dev., 13, 1635–1661, https://doi.org/10.5194/gmd-13-1635-2020, 2020. a, b, c, d, e
Righi, M., Hendricks, J., and Beer, C. G.: Exploring the uncertainties in the aviation soot–cirrus effect, Atmos. Chem. Phys., 21, 17267–17289, https://doi.org/10.5194/acp-21-17267-2021, 2021. a, b
Roeckner, E., Brokopf, R., Esch, M., Giorgetta, M., Hagemann, S., Kornblueh, L., Manzini, E., Schlese, U., and Schulzweida, U.: Sensitivity of Simulated Climate to Horizontal and Vertical Resolution in the ECHAM5 Atmosphere Model, J. Climate, 19, 3771–3791, https://doi.org/10.1175/jcli3824.1, 2006. a
Sims, R., Schaeffer, R., Creutzig, F., Cruz-Nùñez, X., D’Agosto, M., Dimitriu, D., Meza, M. J. F., Fulton, L., Kobayashi, S., Lah, O., McKinnon, A., Newman, P., Ouyang, M., Schauer, J. J., Sperling, D., and Tiwari, G.: Transport, in: Climate Change 2014: Mitigation of Climate Change. Contribution of Working Group III to the Fifth Assessment Report of the Intergovernmental Panel on Climate Change, edited by: Edenhofer, O., Pichs-Madruga, R., Sokona, Y., Farahani, E., Kadner, S., Seyboth, K., Adler, A., Baum, I., Brunner, S., Eickemeier, P., Kriemann, B., Savolainen, J., Schlömer, S., von Stechow, C., Zwickel, T., and Minx, J., 599–670, Cambridge University Press, https://doi.org/10.1017/cbo9781107415324.007, 2014. a
Smith, T. W. P., Jalkanen, J. P., Anderson, B. A., Corbett, J. J., Faber, J., Hanayama, S., O'Keeffe, E., Parker, S., Johansson, L., Aldous, L., Raucci, C., Traut, M., Ettinger, S., Nelissen, D., Lee, D. S., Ng, S., Agrawal, A., Winebrake, J. J., Hoen, M., Chesworth, S., and Pandey, A.: Third IMO Greenhouse Gas Study 2014, Tech. rep., International Maritime Organization, London, UK, 2014. a
Sofiev, M., Winebrake, J. J., Johansson, L., Carr, E. W., Prank, M., Soares, J., Vira, J., Kouznetsov, R., Jalkanen, J.-P., and Corbett, J. J.: Cleaner fuels for ships provide public health benefits with climate tradeoffs, Nat. Commun., 9, 406, https://doi.org/10.1038/s41467-017-02774-9, 2018. a
Stephenson, S. R., Wang, W., Zender, C. S., Wang, H., Davis, S. J., and Rasch, P. J.: Climatic Responses to Future Trans-Arctic Shipping, Geophys. Res. Lett., 45, 9898–9908, https://doi.org/10.1029/2018gl078969, 2018. a
Stevenson, D. S., Young, P. J., Naik, V., Lamarque, J.-F., Shindell, D. T., Voulgarakis, A., Skeie, R. B., Dalsoren, S. B., Myhre, G., Berntsen, T. K., Folberth, G. A., Rumbold, S. T., Collins, W. J., MacKenzie, I. A., Doherty, R. M., Zeng, G., van Noije, T. P. C., Strunk, A., Bergmann, D., Cameron-Smith, P., Plummer, D. A., Strode, S. A., Horowitz, L., Lee, Y. H., Szopa, S., Sudo, K., Nagashima, T., Josse, B., Cionni, I., Righi, M., Eyring, V., Conley, A., Bowman, K. W., Wild, O., and Archibald, A.: Tropospheric ozone changes, radiative forcing and attribution to emissions in the Atmospheric Chemistry and Climate Model Intercomparison Project (ACCMIP), Atmos. Chem. Phys., 13, 3063–3085, https://doi.org/10.5194/acp-13-3063-2013, 2013. a
Timmers, V. R. and Achten, P. A.: Non-exhaust PM emissions from electric vehicles, Atmos. Environ., 134, 10–17, https://doi.org/10.1016/j.atmosenv.2016.03.017, 2016. a
Tost, H., Jöckel, P., Kerkweg, A., Sander, R., and Lelieveld, J.: Technical note: A new comprehensive SCAVenging submodel for global atmospheric chemistry modelling, Atmos. Chem. Phys., 6, 565–574, https://doi.org/10.5194/acp-6-565-2006, 2006. a
Unger, N.: Global climate impact of civil aviation for standard and desulfurized jet fuel, Geophys. Res. Lett., 38, L20803, https://doi.org/10.1029/2011gl049289, 2011. a
Unger, N., Zhao, Y., and Dang, H.: Mid-21st century chemical forcing of climate by the civil aviation sector, Geophys. Res. Lett., 40, 641–645, https://doi.org/10.1002/grl.50161, 2013. a
van Vuuren, D. P., Edmonds, J., Kainuma, M., Riahi, K., Thomson, A., Hibbard, K., Hurtt, G. C., Kram, T., Krey, V., Lamarque, J.-F., Masui, T., Meinshausen, M., Nakicenovic, N., Smith, S. J., and Rose, S. K.: The representative concentration pathways: an overview, Climatic Change, 109, 5–31, https://doi.org/10.1007/s10584-011-0148-z, 2011. a, b
van Vuuren, D. P., Kriegler, E., O'Neill, B. C., Ebi, K. L., Riahi, K., Carter, T. R., Edmonds, J., Hallegatte, S., Kram, T., Mathur, R., and Winkler, H.: A new scenario framework for Climate Change Research: scenario matrix architecture, Climatic Change, 122, 373–386, https://doi.org/10.1007/s10584-013-0906-1, 2014. a
van Vuuren, D. P., Stehfest, E., Gernaat, D. E., Doelman, J. C., van den Berg, M., Harmsen, M., de Boer, H. S., Bouwman, L. F., Daioglou, V., Edelenbosch, O. Y., Girod, B., Kram, T., Lassaletta, L., Lucas, P. L., van Meijl, H., Müller, C., van Ruijven, B. J., van der Sluis, S., and Tabeau, A.: Energy, land-use and greenhouse gas emissions trajectories under a green growth paradigm, Global Environ. Chang., 42, 237–250, https://doi.org/10.1016/j.gloenvcha.2016.05.008, 2017. a, b, c
von Schneidemesser, E., Monks, P. S., Allan, J. D., Bruhwiler, L., Forster, P., Fowler, D., Lauer, A., Morgan, W. T., Paasonen, P., Righi, M., Sindelarova, K., and Sutton, M. A.: Chemistry and the Linkages between Air Quality and Climate Change, Chem. Rev., 115, 3856–3897, https://doi.org/10.1021/acs.chemrev.5b00089, 2015. a
Wen, Y., Zhang, S., Wu, Y., and Hao, J.: Vehicular ammonia emissions: an underappreciated emission source in densely populated areas, Atmos. Chem. Phys., 23, 3819–3828, https://doi.org/10.5194/acp-23-3819-2023, 2023. a
Wild, O., Fiore, A. M., Shindell, D. T., Doherty, R. M., Collins, W. J., Dentener, F. J., Schultz, M. G., Gong, S., MacKenzie, I. A., Zeng, G., Hess, P., Duncan, B. N., Bergmann, D. J., Szopa, S., Jonson, J. E., Keating, T. J., and Zuber, A.: Modelling future changes in surface ozone: a parameterized approach, Atmos. Chem. Phys., 12, 2037–2054, https://doi.org/10.5194/acp-12-2037-2012, 2012. a
- Abstract
- Introduction
- Model and model simulations
- Emissions of aerosol and precursors from the transport sectors
- Transport impact on aerosol concentrations
- Climate impacts
- Conclusions and outlook
- Code and data availability
- Author contributions
- Competing interests
- Disclaimer
- Acknowledgements
- Financial support
- Review statement
- References
- Supplement