the Creative Commons Attribution 4.0 License.
the Creative Commons Attribution 4.0 License.
 | 30 Jun 2023
Modelling the effect of aerosol and greenhouse gas forcing on the South Asian and East Asian monsoons with an intermediate-complexity climate model
Lucy G. Recchia
Valerio Lucarini
The South Asian and East Asian summer monsoons are globally significant meteorological features, creating a strongly seasonal pattern of precipitation, with the majority of the annual precipitation falling between June and September. The stability the monsoons is of extreme importance for a vast range of ecosystems and for the livelihoods of a large share of the world's population. Simulations are performed with an intermediate-complexity climate model in order to assess the future response of the South Asian and East Asian monsoons to changing concentrations of aerosols and greenhouse gases. The radiative forcing associated with absorbing aerosol loading consists of a mid-tropospheric warming and a compensating surface cooling, which is applied to India, Southeast Asia, and eastern China both concurrently and independently. The primary effect of increased absorbing aerosol loading is a decrease in summer precipitation in the vicinity of the applied forcing, although the regional responses vary significantly. The decrease in precipitation is not ascribable to a decrease in the precipitable water and instead derives from a reduction in the precipitation efficiency due to changes in the stratification of the atmosphere. When the absorbing aerosol loading is added in all regions simultaneously, precipitation in eastern China is most strongly affected, with a quite distinct transition to a low precipitation regime as the radiative forcing increases beyond 60 W m−2. The response is less abrupt as we move westward, with precipitation in southern India being least affected. By applying the absorbing aerosol loading to each region individually, we are able to explain the mechanism behind the lower sensitivity observed in India and attribute it to remote absorbing aerosol forcing applied over eastern China. Additionally, we note that the effect on precipitation is approximately linear with the forcing. The impact of doubling carbon dioxide levels is to increase precipitation over the region while simultaneously weakening the circulation. When the carbon dioxide and absorbing aerosol forcings are applied at the same time, the carbon dioxide forcing partially offsets the surface cooling and reduction in precipitation associated with the absorbing aerosol response. Assessing the relative contributions of greenhouse gases and aerosols is important for future climate scenarios, as changes in the concentrations of these species has the potential to impact monsoonal precipitation.
- Article
(11424 KB) - Full-text XML
-
Supplement
(6783 KB) - BibTeX
- EndNote


The South Asian and East Asian monsoon systems are of key importance for the region's economy, agriculture, and industry. The monsoons bring the majority of the annual rainfall over the summer months. The seasonality of rainfall is a major controlling factor for agricultural activities and for natural ecosystems. Significant deviations from the normal onset dates and amount of summer rainfall associated with the monsoon have far-reaching consequences, especially for farmers (Krishna Kumar et al., 2004). Crop production, which contributes substantially to the regions gross domestic product, is particularly adversely affected during deficit rainfall years (Gadgil and Gadgil, 2006; Zhang et al., 2017). The occurrence of flooding (Francis and Gadgil, 2006; Wang and Gu, 2016; Mishra, 2021) or droughts (Gadgil et al., 2002; Hazra et al., 2013; Francis and Gadgil, 2010; Krishnamurti et al., 2010; Zhang and Zhou, 2015), typically linked to strong or weak monsoon years, also has widespread socio-economic impacts and is expected to become more frequent in the future (Intergovermental Panel on Climate Change, IPCC, 2021).
There remains considerable uncertainty in how the monsoons will evolve in a changing climate, both in terms of the response of the monsoons to an applied forcing and in the nature of future climate forcing itself. Despite many improvements to state-of-the-art global climate models (GCMs) (Choudhury et al., 2022; Khadka et al., 2022; Gusain et al., 2020; Xin et al., 2020; Jiang et al., 2020; Ogata et al., 2014; Sperber et al., 2013), difficulties persist in accurately portraying the physical processes and interactions associated with the South Asian and East Asian monsoon systems (Ul Hasson et al., 2016). Variability between models remains an issue, with large inter-model spreads reducing the confidence in future climate projections. The multi-model mean usually performs better than any single model (Khadka et al., 2022; Gusain et al., 2020; Xin et al., 2020; Jiang et al., 2020). Systematic biases in GCMs typically arise from poor representations of orographic rainfall and the various oceanic phenomena affecting sea surface temperature (Wang et al., 2014; Annamalai et al., 2017; McKenna et al., 2020; Choudhury et al., 2022). Precipitation over northern India and the Yangtze River valley is underestimated, while precipitation on the leeward side of the Western Ghats and the mountainous eastern Indian states is overestimated (Konda and Vissa, 2023; Gusain et al., 2020; Xin et al., 2020). Biases in precipitation are linked with biases in the moisture transport; models typically have too much moisture over the southern Indian peninsula and too little moisture over central India (Boschi and Lucarini, 2019; Konda and Vissa, 2023). The role of irrigation is largely ignored, despite its importance in determining the strength and spatial extent of local-scale precipitation (Chou et al., 2018). It is widely accepted that a reasonable representation of the large-scale circulation is required for accurate simulation of precipitation (Xin et al., 2020; Khadka et al., 2022).
In general, it is agreed upon that in the future monsoonal precipitation in the Northern Hemisphere will increase, with more frequent extreme rainfall events, despite a weakening of the large-scale circulation (Intergovermental Panel on Climate Change, IPCC, 2021; Wang et al., 2021; Krishnan et al., 2020; Wester et al., 2019). Changes to forcings, such as greenhouse gases and aerosols, can have significant impacts on local moisture availability and affect the hydrology. In combination with a strong extratropical event, such as prolonged atmospheric blocking or advection of a low-pressure system, this can lead to extreme floods and heat waves (Lau and Nath, 2012; Boschi and Lucarini, 2019; Galfi and Lucarini, 2021). In the near-term future, internal variability is expected to remain the dominant mode in modulating the monsoonal precipitation, but by the end of the 21st century, the effects of external forcing will become prevalent. The main components of external forcing are greenhouse gases and aerosols, which impact the optical properties of the atmosphere over a variety of spectral ranges. Phenomena contributing to the internal variability on annual–decadal timescales include the Indian Ocean Dipole, the El Niño–Southern Oscillation (ENSO), the Pacific decadal oscillation, and the Atlantic multidecadal oscillation. ENSO is the most important contributor on interannual timescales, and it is expected that the precipitation variability due to ENSO will increase (Intergovermental Panel on Climate Change, IPCC, 2021; Wang et al., 2021). Here, we focus on the South Asian and East Asian monsoon responses to external forcing, specifically to globally increased greenhouse gas concentration and regional absorbing aerosol loading.
In terms of the Asian monsoons, aerosols and greenhouse gases have competing effects. Greenhouse gases act to warm the surface, enhancing the contrast between land and sea temperatures and enabling greater moisture uptake (e.g. Douville et al., 2000; Ueda et al., 2006; Held and Soden, 2006; Cherchi et al., 2011; Samset et al., 2018; Cao et al., 2022). This leads to stronger monsoons and increased precipitation, despite a weakening of the large-scale circulation (Turner and Annamalai, 2012; Lau and Kim, 2017; Swaminathan et al., 2022; Intergovermental Panel on Climate Change, IPCC, 2021). Generally, aerosols have a stabilising effect on the atmosphere through cooling the surface, increasing the stratification of the atmosphere, and causing a drying trend that results in a weaker monsoon (Li et al., 2016; Wilcox et al., 2020; Ayantika et al., 2021; Cao et al., 2022). Historically, aerosol forcing has dominated, linked with a declining rainfall trend over the latter half of 20th century (Bollasina et al., 2011; Polson et al., 2014; Li et al., 2015; Undorf et al., 2018; Dong et al., 2019; Ramarao et al., 2023), but moving forward, greenhouse gas forcing is expected to dominate, which is associated with a likely increase in monsoonal rainfall in the Northern Hemisphere (Monerie et al., 2022). In the near term, changes in aerosol concentrations over the Asian region will continue to impact the monsoons, with increases in anthropogenic emissions acting to weaken the large-scale circulation and hydrological cycle, thus weakening the monsoons, while decreases in emissions, perhaps through the enforcement of air quality policies, will likely intensify the monsoons.
Aerosols are often referred to as scattering or absorbing, depending on how the aerosol interacts with shortwave radiation. Scattering aerosols, such as sulfates, cause surface cooling through scattering radiation, which weakens the land–sea temperature gradient. This inhibits moisture advection from the Arabian Sea and reduces low-level southwesterly wind speeds, resulting in decreased precipitation (Sherman et al., 2021). Absorbing aerosols, the most important of which is black carbon, cause both surface cooling and localised mid-level heating by absorbing some of the incoming radiation. The effect of black carbon on the South Asian and East Asian monsoons is debated. Meehl et al. (2008) found that while black carbon contributed to increased precipitation during the pre-monsoon period, there was a decrease in monsoonal precipitation. In partial agreement, Lau and Kim (2006) also found a link between increased black carbon (and dust) loading and pre-monsoon precipitation but that subsequent precipitation decreased over India and increased over East Asia. Kovilakam and Mahajan (2016) noted a near-linear relationship between black carbon loading and summer precipitation in the South Asian monsoon, with enhanced monsoonal circulation, stronger meridional tropospheric gradient, and increased precipitable water as the levels of black carbon are raised. Others have found that black carbon weakens the Asian monsoons (Chakraborty et al., 2004; Liu et al., 2009) or that the results are inconclusive (Sanap and Pandithurai, 2015; Sherman et al., 2021). Although Guo et al. (2016) suggest that sulfates are the dominant aerosol species for impacting South Asian monsoon rainfall, further work is needed to unify the individual effects of different aerosol species on the vertical profile of the atmosphere and the interactions between them (Lu et al., 2020).
The COVID-19 pandemic in 2020 offered an unprecedented opportunity to observe the effects of reduced aerosol loading, resulting from nationwide lockdowns, on the South Asian and East Asian monsoons. The decrease in aerosols was found to correspond to a 4 W m−2 increase in surface solar radiation (Fadnavis et al., 2021), resulting in warmer surface temperatures over land. The heightened contrast in land–sea temperature and stronger low-level winds enhanced moisture inflow to the monsoon system, leading to increased precipitation and a more intense monsoon (Fadnavis et al., 2021; Lee et al., 2021; Kripalani et al., 2022; He et al., 2022). In particular, spatial coherence between reduced aerosol loading and precipitation has been noted over western and central India and the Yangtze River valley (Kripalani et al., 2022).
The South Asian summer monsoon has been identified as a possible tipping point (Lenton et al., 2008), highlighting the importance of investigating the impact of changing radiative forcing. Radiation plays a major role in the evolution of the monsoon, with seasonal changes in temperature and circulation triggering monsoon onset. The onset itself can be considered a regime change, with a simplified model able to reproduce the transition from low to high relative humidity as the low-level wind speed is increased (Recchia et al., 2021). Modelling of the Indian monsoon by Zickfeld et al. (2005) suggested that an abrupt transition to a low rainfall regime with a destabilised circulation is plausible given changes to the planetary albedo, the insolation, and/or the carbon dioxide (CO2) concentration. The possibility of an abrupt transition (on intraseasonal timescales) is supported by Levermann et al. (2009), who used a similar conceptual model based on heat and moisture conservation to show the bistability of the monsoon system given net radiative influx above a critical threshold. Schewe et al. (2012) took this conceptual model a step further so that it can be applied on orbital timescales and demonstrate a series of abrupt transitions of the East Asian monsoon that correspond to a proxy record of the penultimate glacial period. In contrast, Boos and Storelvmo (2016) used a simplified energetic theory in combination with GCM simulations to show that the intensity of summer monsoons in the tropics has a near-linear dependence on a range of radiative forcings. They argue that previous tipping point theory neglected the static stability of the troposphere and that no threshold response to large radiative forcings is observed in a GCM simulation on decadal timescales. Kovilakam and Mahajan (2016) also found no abrupt transitions of the South Asian monsoon in GCM simulations with very high black carbon loading despite significant surface cooling and a decrease in global precipitation.
The main goal of this study is to understand the impact of absorbing aerosol forcing on the monsoon in India, Southeast Asia, and eastern China, focusing on the precipitation and the large-scale circulation using a simplified modelling framework. We will investigate the level of radiative forcing required for a breakdown of the monsoon circulation and capture the transition from a high-precipitation regime to a low-precipitation regime. Additionally, we wish to explore the combined effect of regional absorbing aerosol forcing with globally increased carbon dioxide concentration on the South Asian and East Asian monsoons. The so-called Silk Road pattern indicates the presence of westward-propagating signal linking the Indian monsoon with atmospheric patterns over China as a result of Rossby waves (Enomoto et al., 2003; Ding and Wang, 2005; Chakraborty et al., 2014; Boers et al., 2019). We will also consider whether localised forcings applied in each of the regions of interest have noticeable remote impacts.
We use an intermediate-complexity climate model, the Planet Simulator (PLASIM) (Fraedrich et al., 2005; Lunkeit et al., 2011), to simulate the response of the South Asian and East Asian monsoons to forcing scenarios with differing levels of carbon dioxide and absorbing aerosols. Details of the experiment set-up and design are given in Sect. 2. There are several studies using idealised models based on conservation of heat and moisture (Zickfeld et al., 2005; Levermann et al., 2009; Schewe et al., 2012; Boos and Storelvmo, 2016) to investigate the occurrence of regime transitions in the monsoons, and a multitude of literature using complex GCMs to simulate future climate response to different forcings scenarios (Katzenberger et al., 2021; Almazroui et al., 2020; Varghese et al., 2020; Wang et al., 2016; Ogata et al., 2014; Song et al., 2014), but little using intermediate-complexity models (Wang et al., 2016; Herbert et al., 2022). Intermediate-complexity models are able to reproduce large-scale climate features with a fair degree of accuracy, while maintaining the flexibility to perform long simulations at low computational cost and to allow for parametric exploration. However, they are unable to capture small-scale convection or oceanic processes such as ENSO. Our goal is to help bridge the gap between conceptual and complex models. The results of the simulations are presented in Sects. 3 and 4, with the former focusing on the response of key variables such as precipitation and circulation to absorbing aerosol forcing, while the latter considers the combined effect of carbon dioxide and absorbing aerosol forcing on the South Asian and East Asian monsoons. Additionally, we consider the relationship between the added forcing and regionally averaged summer precipitation, trying to capture the signature of abrupt transitions. In Sect. 5 we show the results of applying absorbing aerosol forcing individually to regions of India, Southeast Asia, and eastern China rather than simultaneously (as in Sects. 3 and 4), which allows attribution of responses to local and remote forcing within the Asian region. Furthermore, we can compare the linear combination of response due to local-scale absorbing aerosol forcing to the response from regional-scale forcing in the spirit of linear response theory (Ragone et al., 2016; Lucarini et al., 2017; Ghil and Lucarini, 2020).
The PLASIM model (Lunkeit et al., 2011; Fraedrich et al., 2005) is an intermediate-complexity global climate model, with a dynamical core and parameterised physical processes. It includes parameterisation schemes for land–surface interactions, radiation, and convection. There are several versions of the PLASIM model, where adaptions have been made to allow inclusion of additional climatic components such as vegetation, sea ice, and ocean (Holden et al., 2016; Platov et al., 2017). We use the version developed by Shifter et al. (2020), which features a large-scale geostrophic ocean component. Vertically there are 10 atmospheric levels, and horizontally the spectral resolution is T42, which approximately corresponds to 2.8∘. When focusing on the large-scale features over long timescales, the PLASIM model is an invaluable tool for investigating various future scenarios at a low computational cost.
The PLASIM model has previously been used to investigate regime transitions on a range of timescales, including the arid-to-hyperarid transition of the Atacama Desert (Garreaud et al., 2010) and the effect of a permanent El Niño state on susceptible tipping elements like the Amazon rainforest and the Sahel Belt (Duque-Villegas et al., 2019). PLASIM has also been used to simulate global-scale transitions between a warm (current climate) and a snowball state (Boschi et al., 2013; Lucarini et al., 2013), which has helped to advance understanding of the multistability properties of the Earth's climate system (Lucarini et al., 2010; Gómez-Leal et al., 2018; Margazoglou et al., 2021). In terms of future climate projections, the PLASIM model has been used as an emulator (Holden et al., 2014; Tran et al., 2016) and to support the application of Ruelle's response theory (Ragone et al., 2016; Lucarini et al., 2017).
There are multiple precedents for using both PLASIM and other models of a similar complexity for climate simulations regarding the Asian monsoons (Wang et al., 2016; Thomson et al., 2021; Herbert et al., 2022). In terms of lower-complexity models, Zickfeld et al. (2005) use a box model of the tropical atmosphere to investigate the stability of the South Asian monsoon to changes in planetary albedo and carbon dioxide concentration. For higher-complexity models, there is an abundance of literature where CMIP5 and CMIP6 standard models are used to explore the response of the South Asian and East Asian monsoons to future climate scenarios (Menon et al., 2013; Li et al., 2015; Kitoh, 2017; Swapna et al., 2018; Varghese et al., 2020; Krishnan et al., 2020; Almazroui et al., 2020; Chen et al., 2020; Moon and Ha, 2020; Wang et al., 2020, 2021; Swaminathan et al., 2022; Intergovermental Panel on Climate Change, IPCC, 2013, 2021). Here, we use PLASIM to quantify the responses of the South Asian and East Asian monsoons to a range of future climate scenarios entailing different levels of CO2 concentration and localised aerosol forcings.
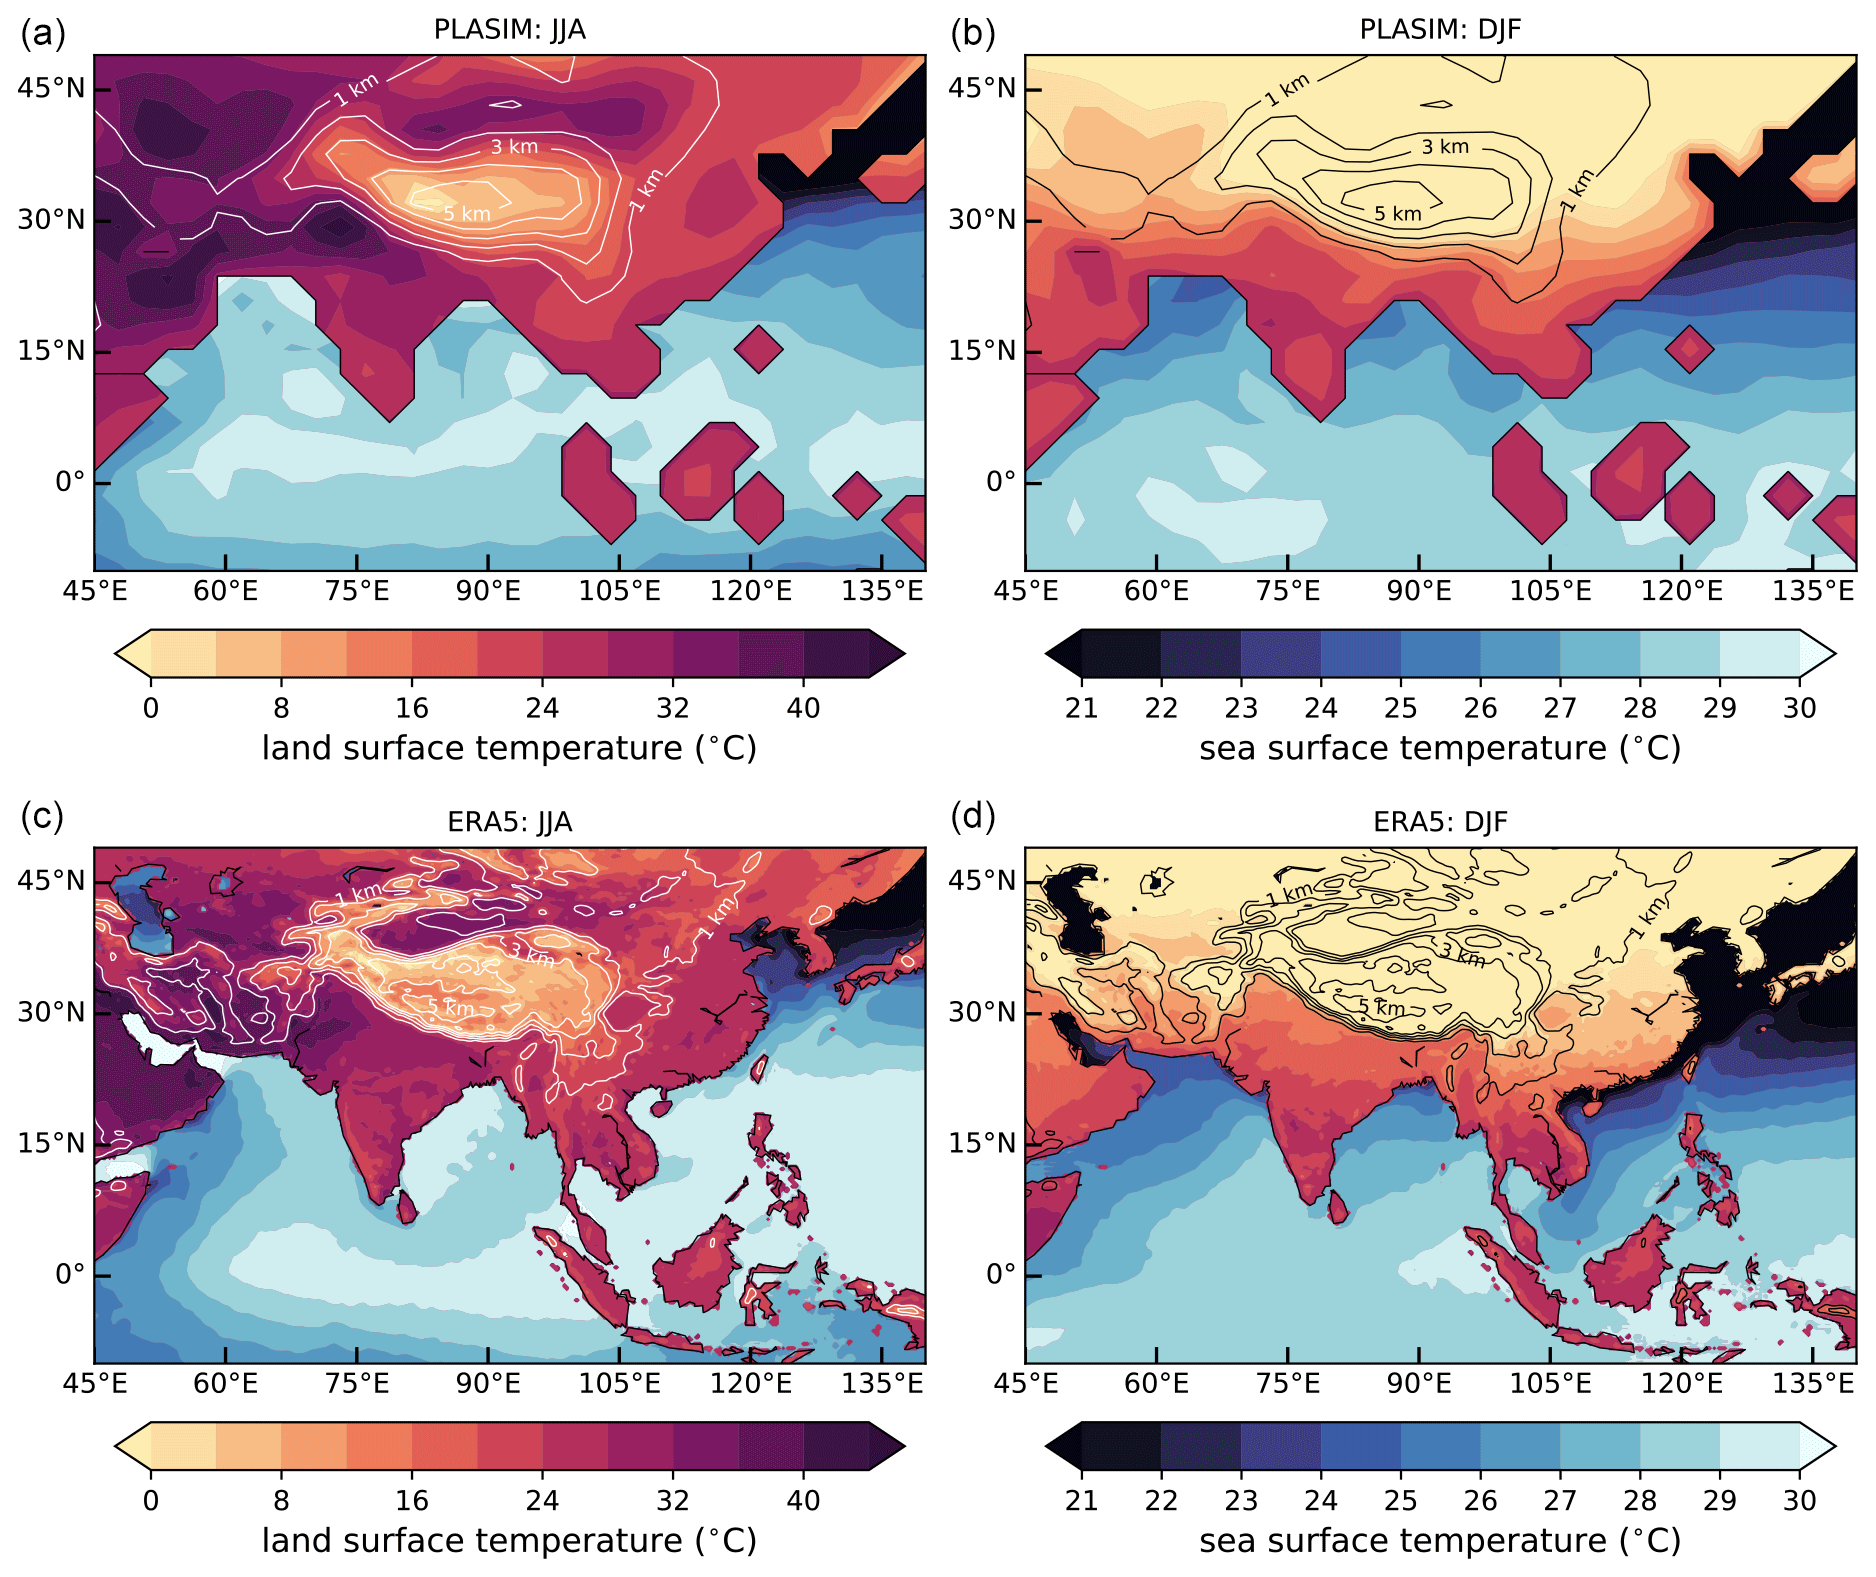
Figure 1Land and sea surface temperature (shading) and terrain height (white and black contours) averaged over June–July–August (a, c) and December–January–February (b, d). Panels (a) and (b) show data from the 100-year PLASIM control run. Panels (c) and (d) show data from ERA5 reanalysis (Copernicus Climate Change Service, 2017) for the period 1988–2017.
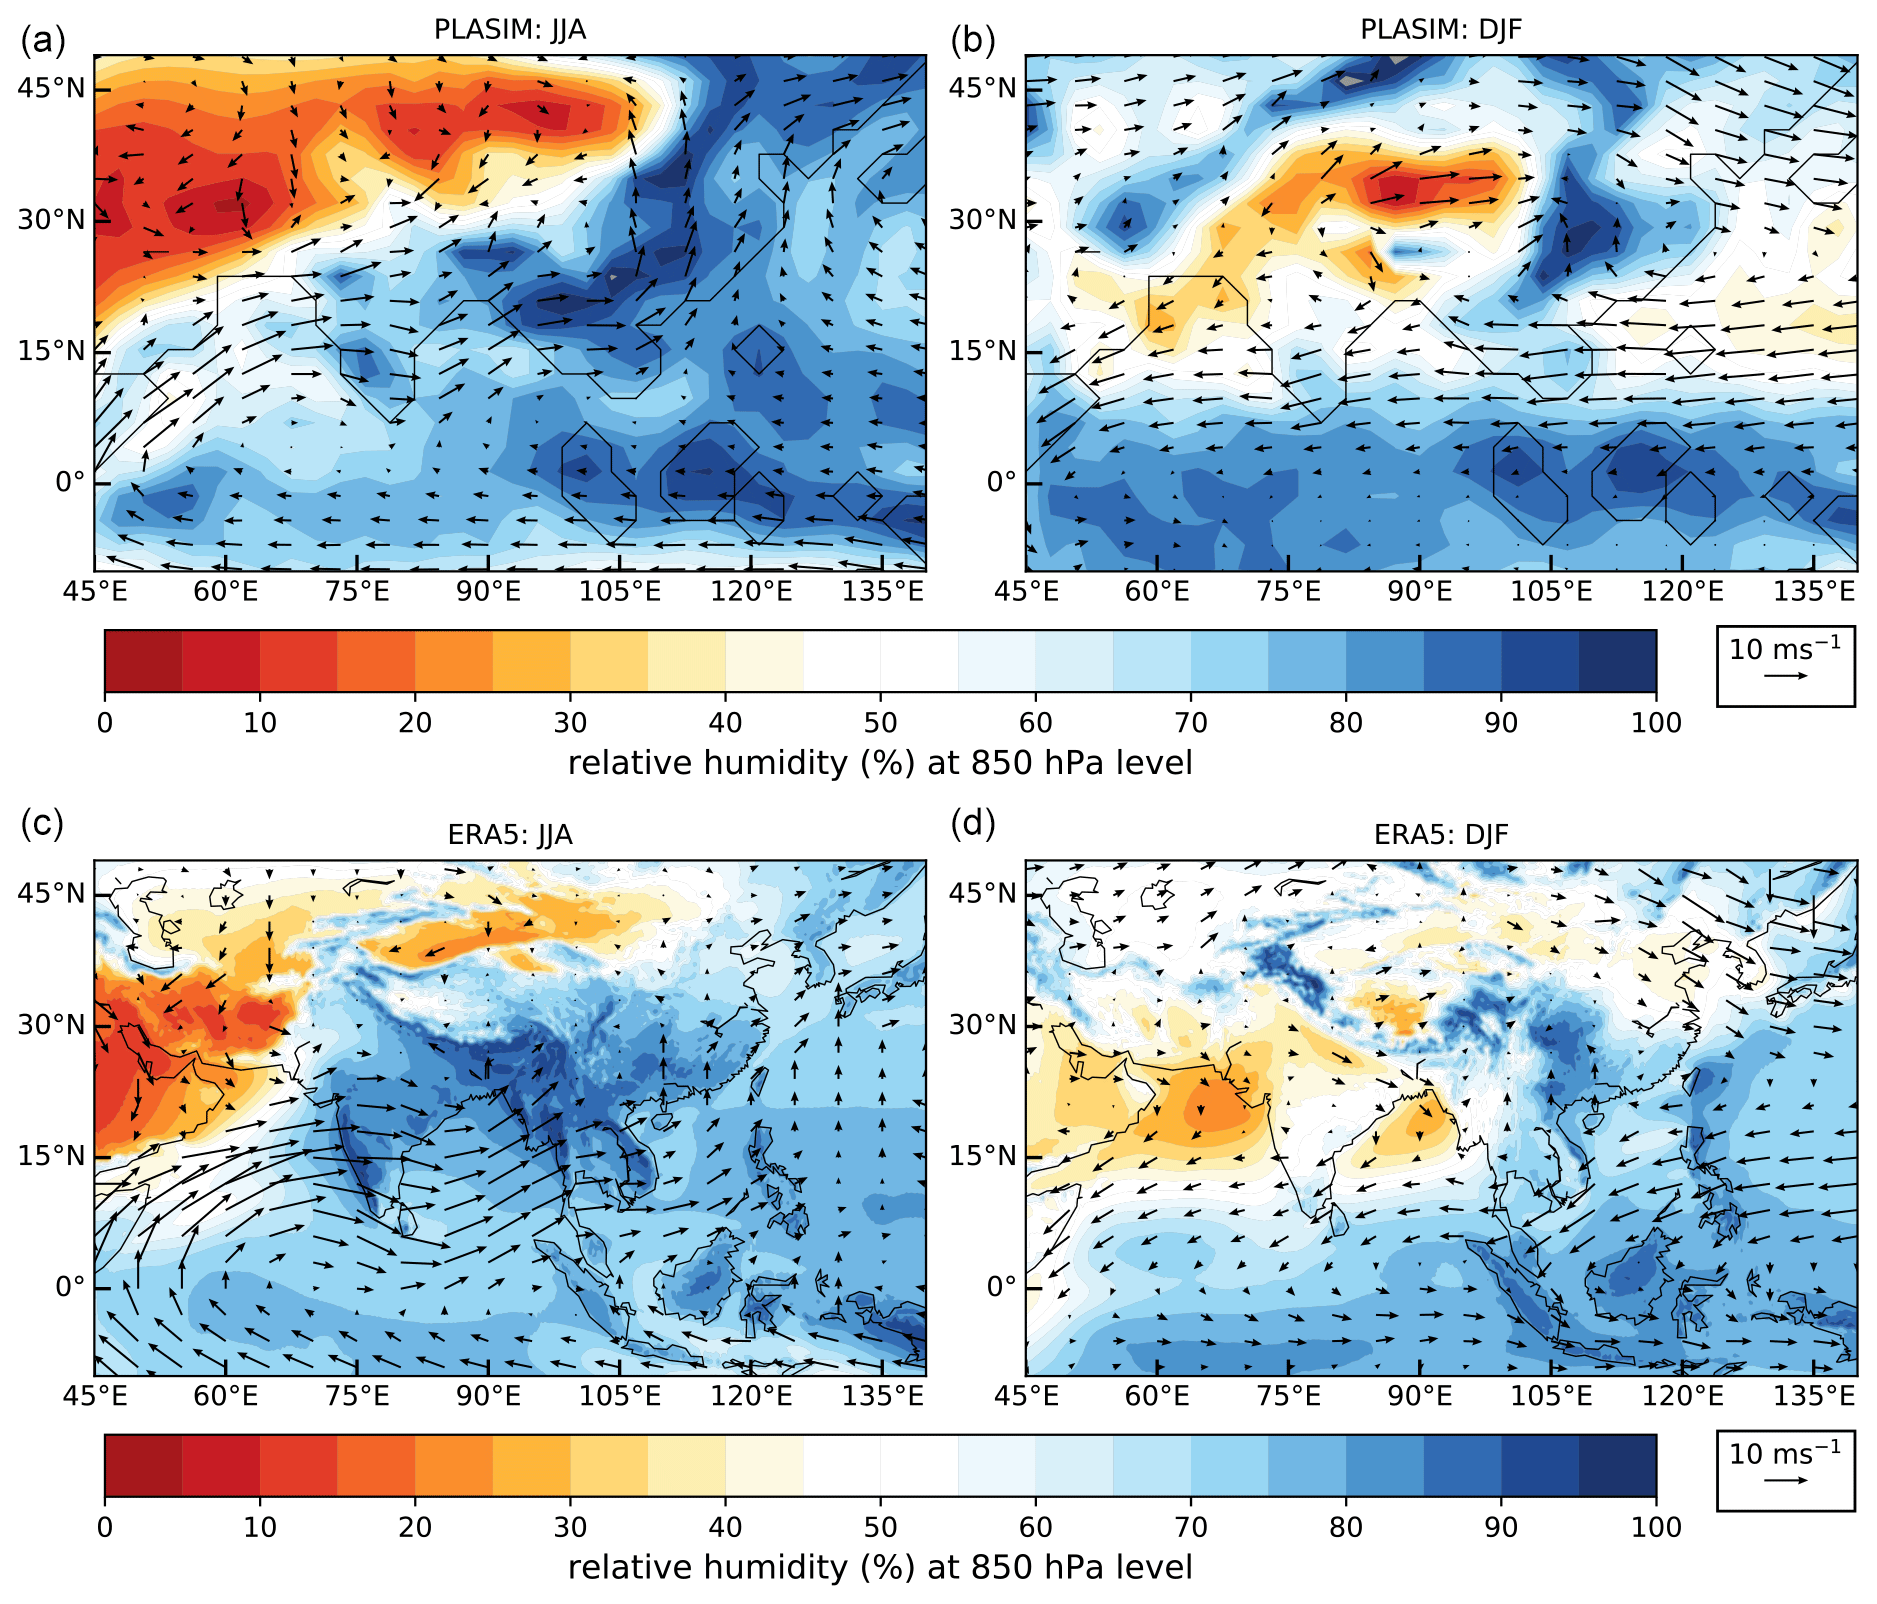
Figure 2Relative humidity (shading) and wind speed and direction (vectors) at the 850 hPa level, averaged over June–July–August (a, c) and December–January–February (b, d). Panels (a) and (b) show data from the 100-year PLASIM control run. Panels (c) and (d) show data from ERA5 reanalysis (Copernicus Climate Change Service, 2017) for the period 1988–2017. Data have been extrapolated below ground.
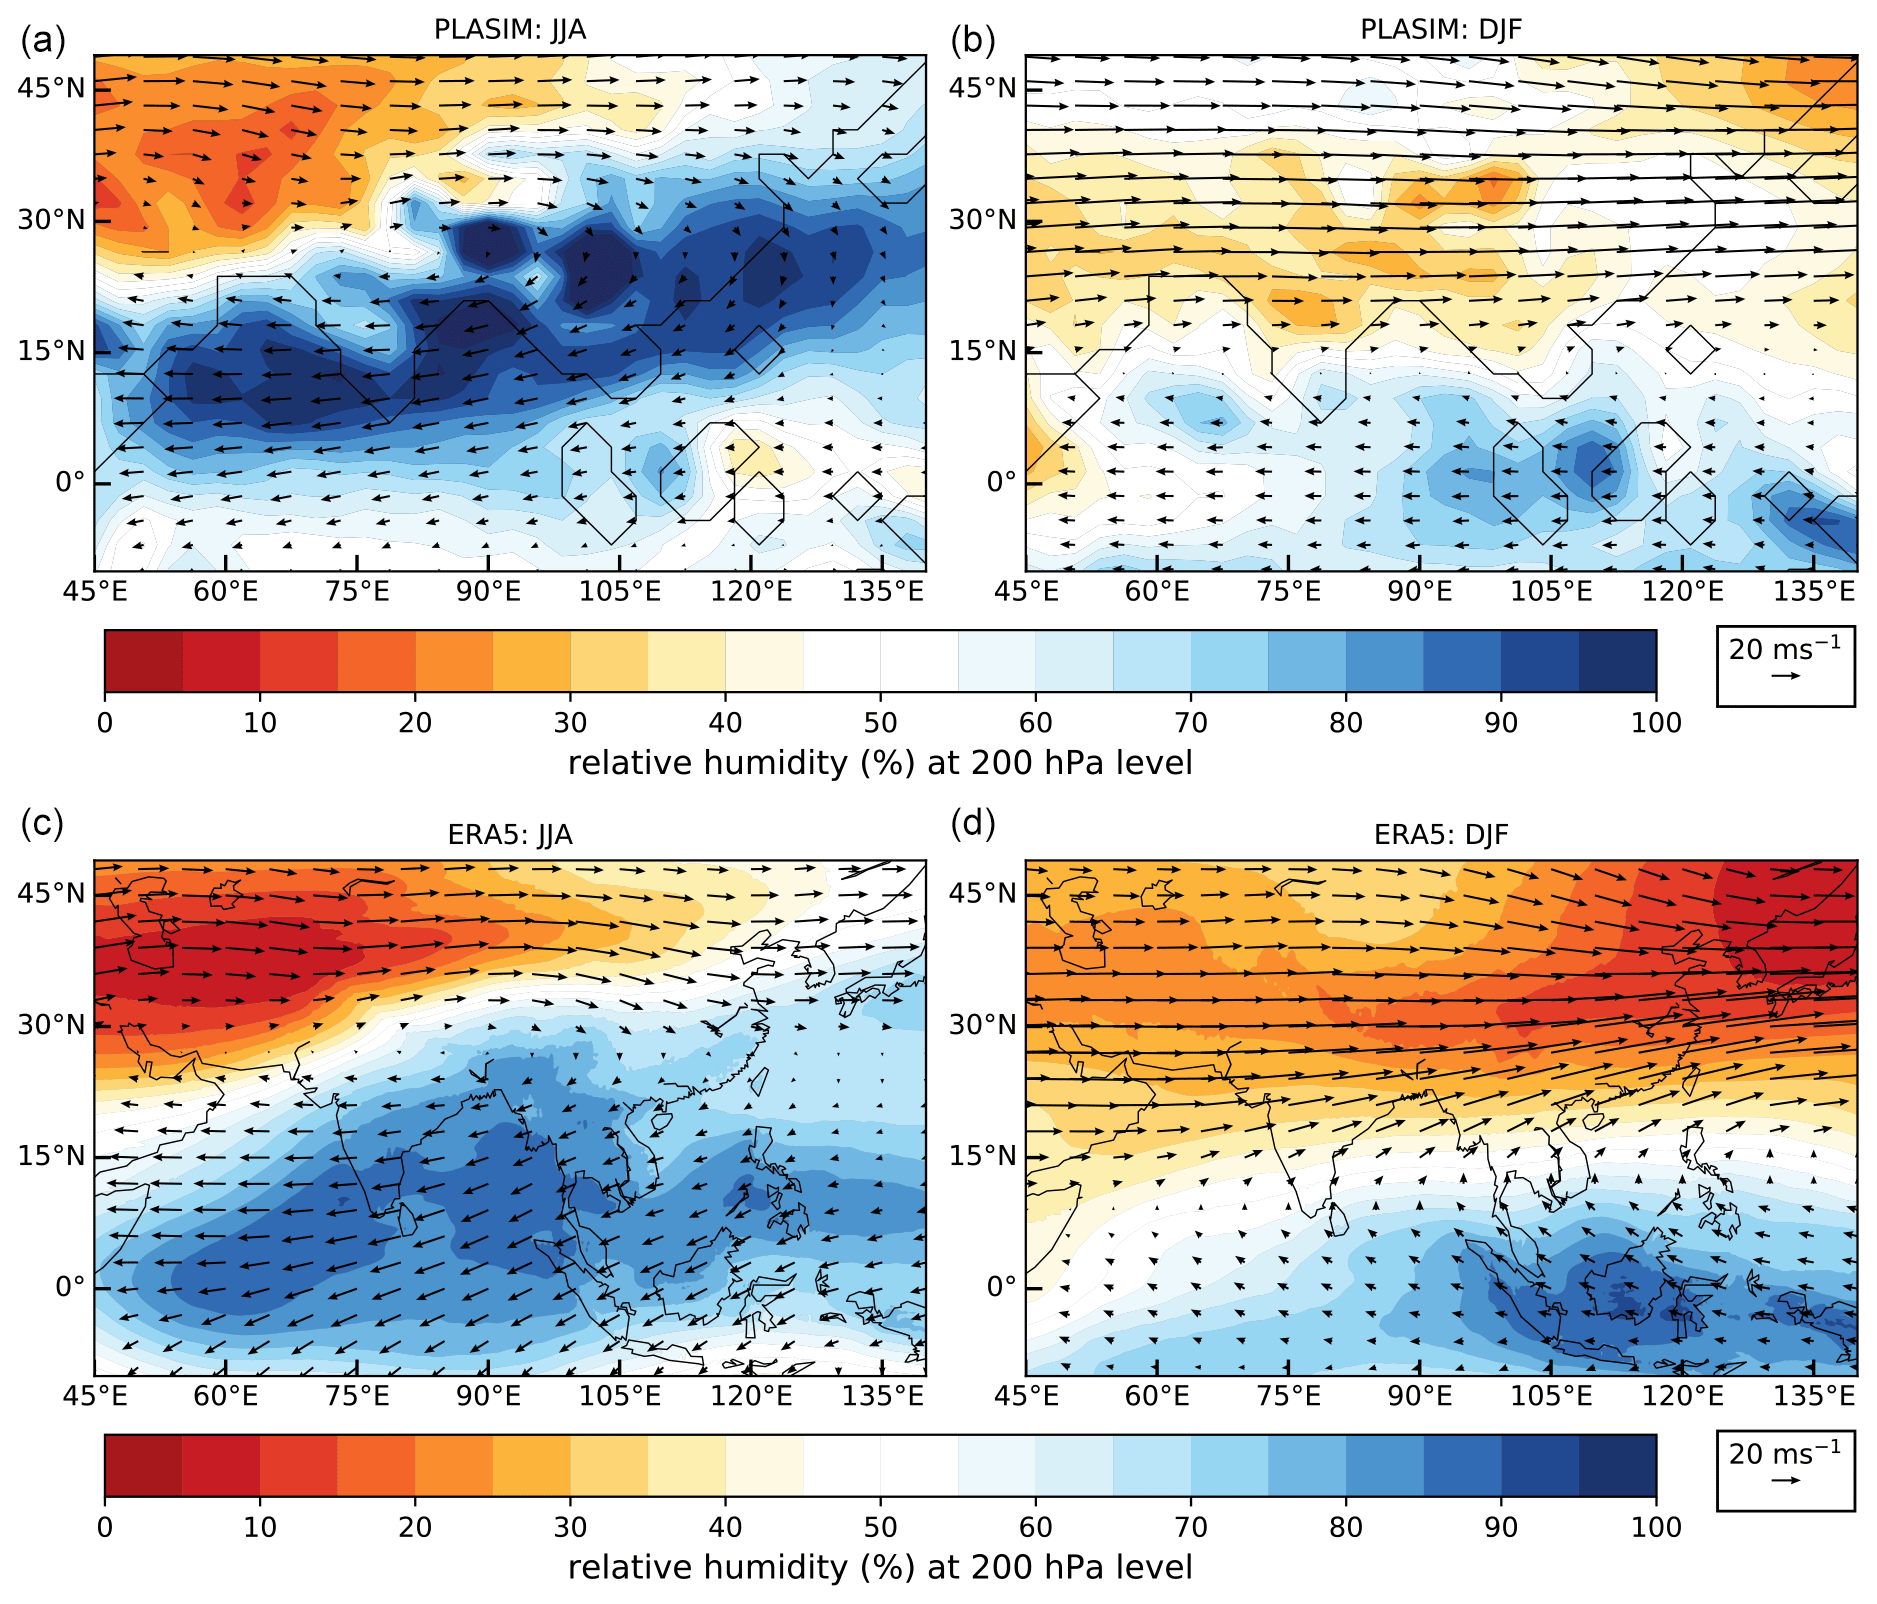
Figure 3Relative humidity (shading) and wind speed and direction (vectors) at the 200 hPa level, averaged over June–July–August (a, c) and December–January–February (b, d). Panels (a) and (b) show data from the 100-year PLASIM control run. Panels (c) and (d) show data from ERA5 reanalysis (Copernicus Climate Change Service, 2017) for the period 1988–2017. Data have been extrapolated below ground.
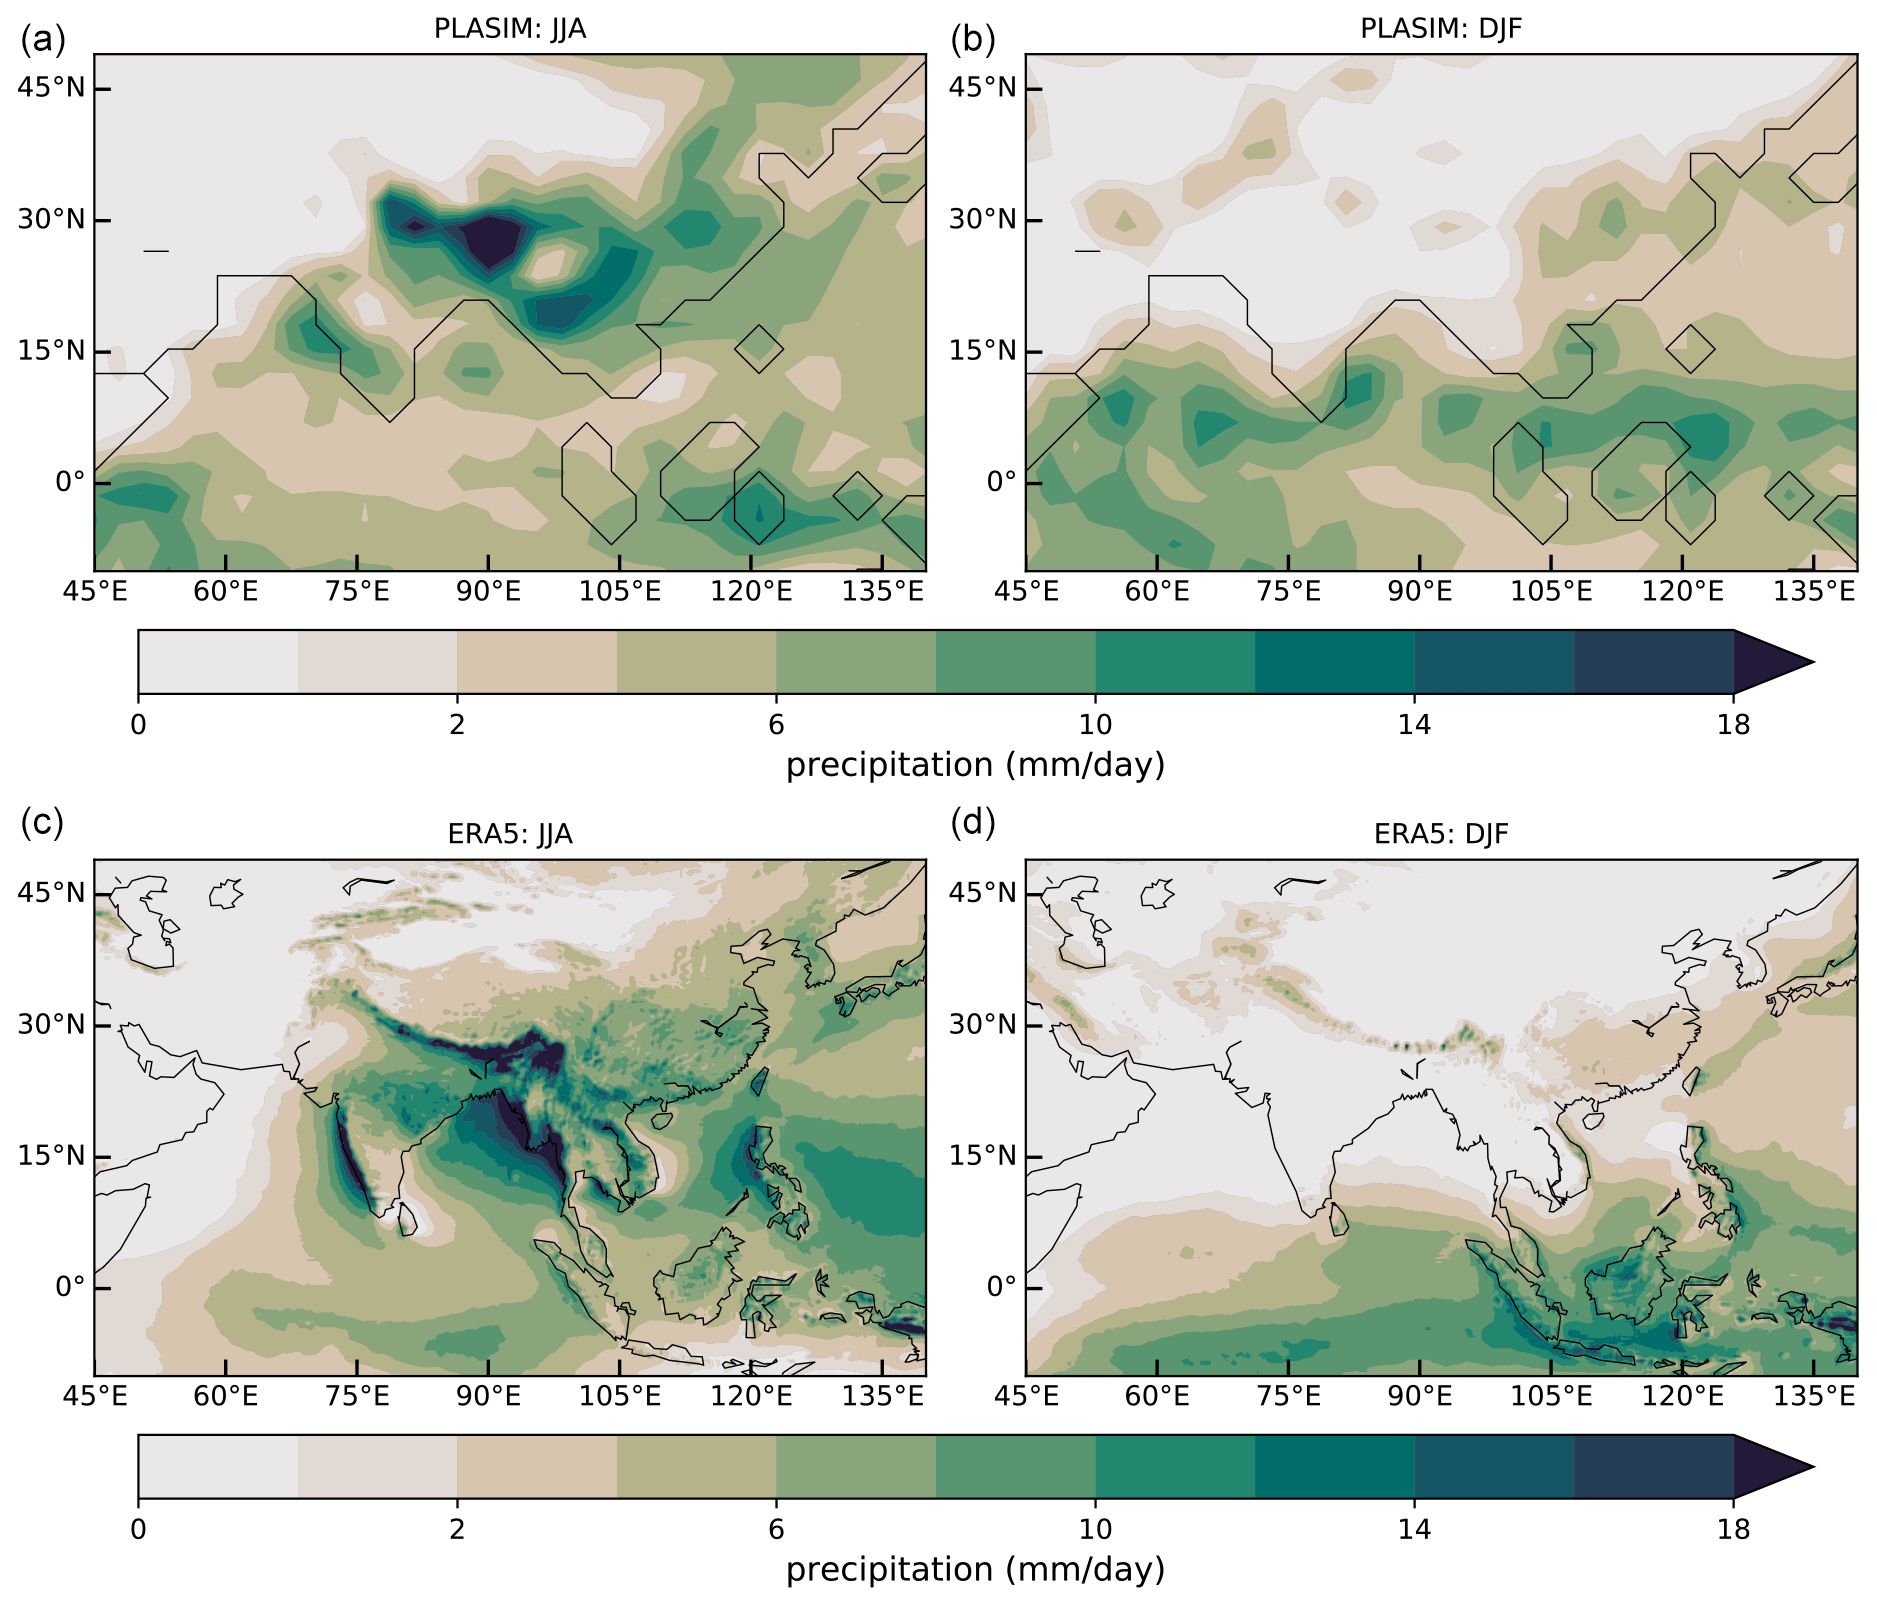
Figure 4Precipitation averaged over June–July–August (a, c) and December–January–February (b, d). Panels (a) and (b) show data from the 100-year PLASIM control run. Panels (c) and (d) show data from ERA5 reanalysis (Copernicus Climate Change Service, 2017) for the period 1988–2017.
2.1 Model validation
A brief evaluation of the PLASIM model is conducted in order to show that the model is capable of reproducing the key features of the South Asian and East Asian monsoons to a sufficient degree of accuracy for our purposes. Similar versions of the PLASIM model have been shown to perform well in climate simulations (Holden et al., 2016; Platov et al., 2017). Figures 1–4 and S1 show the performance of a 100-year control simulation against ERA5 reanalysis data averaged over years 1988–2017 (Copernicus Climate Change Service, 2017) for key variables of surface temperature, relative humidity, circulation, vertically integrated moisture transport, and precipitation. The PLASIM control simulation has no absorbing aerosol forcing and uses a reference carbon dioxide concentration of 360 ppmv. The left column shows the June–July–August (JJA) average, and the right column shows the December–January–February (DJF) average.
There is a clear difference between summer (JJA) and winter (DJF) in Figs. 1–4 and S1, with the PLASIM model capturing the strong seasonality in the Asian region and in fair agreement with ERA5 reanalysis data. Figure 1 shows the increase in surface temperature of the Eurasian landmass in summer, creating a thermal contrast with the relatively cooler ocean. North of the Himalayas, the accelerated heating of the Tibetan Plateau can be seen, which plays a pivotal role in the development of the South Asian and East Asian monsoons.
The seasonal reversal in low-level winds is distinctly visible in Fig. 2. In winter, the 850 hPa winds over South Asia are easterly, but in summer they are westerly. PLASIM overestimates the dryness to the north and west of India in summer but underestimates the westerly winds over South Asia, compared to ERA5 reanalysis data. During winter, PLASIM has higher easterly wind speeds at 10–15∘ N for the 850 hPa level than ERA5 reanalysis data. At 200 hPa (Fig. 3), the tropical easterly jet is present over the summer months. The formation of the tropical easterly jet is linked with the area of high pressure over the Tibetan Plateau and the resulting anticyclone. Figure 3 also shows the migration of the westerly subtropical jet from south of the Tibetan Plateau in winter to north of the Tibetan Plateau in summer. The subtropical jet is shown with lower wind speeds in summer for PLASIM than ERA5 reanalysis, although the wind speeds are more comparable between the datasets in winter. The relative humidity at high levels over the Asian continent is lower in ERA5 reanalysis than PLASIM, particularly during winter.
Warmer temperatures in summer are associated with drier air inland and more humid conditions in coastal regions (Fig. S1). The subtropical jet brings dry air at mid-high levels towards East Asia (Fig. 3). In summer, a convergence line forms along the India–Pakistan border where the dry air mass from the Eurasian continent meets the moist monsoonal air mass. There is a significant contrast in low-level relative humidity over South Asia and East Asia between summer and winter (Fig. 2) and an even greater contrast in the precipitation (Fig. 4). The majority of South Asia receives only a few millimetres of rain per day in winter, whereas most of the annual precipitation occurs in the summer months.
Despite PLASIM's low resolution and simplified physics, the precipitation over land is in reasonable agreement with ERA5 reanalysis data. PLASIM underestimates the amount of summer rainfall along the west coast of India and over central India compared to ERA5 reanalysis but captures the regions of highest precipitation – Bhutan and eastern states of India – well. There is a fair degree of similarity between PLASIM and ERA5 for the vertically integrated moisture flux and the vertically integrated moisture flux convergence during summer (Fig. S1). The large-scale features of the monsoons, including the characteristically strong seasonality, are also well represented.
2.2 Experiment design
To analyse the roles of absorbing aerosols and greenhouse gases, which have contrasting effects, on the South Asian and East Asian monsoons, we implement two forcing scenarios: “aerosol only” and “aerosol-with-2 × CO2”. The aerosol-only simulation features increasing absorbing aerosol forcing, while the aerosol-with-2 × CO2 simulation features doubled carbon dioxide levels (720 ppmv) to represent higher levels of greenhouse gases and increasing absorbing aerosol forcing. This is a substantially simplified version of the IPCC 6 forcing scenario SSP3-7.0 (Intergovermental Panel on Climate Change, IPCC, 2021).
PLASIM has no explicit treatment of aerosol interactions, so we need to resort to a simplified representation of their effects on the radiation budget of the atmosphere. Along the lines of Chakraborty et al. (2004), we emulate the effect of absorbing aerosol loading by applying a varying mid-level tropospheric heating, say H, over three vertical levels, approximately corresponding to 550–750 hPa. Thus, each of the three vertical levels has an applied forcing of intensity . The absorbing aerosol forcing is applied simultaneously over three regions: India, Southeast Asia, and eastern China, as per Fig. 5. We also consider the impact of forcing in each of these regions separately (see Sect. 5). To the first approximation, the effect of absorbing aerosols is to redistribute the absorption of solar radiation in the atmospheric column and at the surface (e.g. Sarangi et al., 2018). Hence, the surface is cooled by applying a compensating forcing of the same intensity as the mid-tropospheric heating, −H, which accounts for less solar radiation reaching the surface.
All simulations begin from steady-state conditions, which have been obtained by discarding the transient portion of the runs. For both simulations, aerosol only and aerosol-with-2 × CO2, the absorbing aerosol forcing is gradually increased from 0 to 150 W m−2, and then decreased back to 0 W m−2. In order to make sure that the system remains sufficiently close to steady state at all times, this takes place over a simulation length of 900 years. We consider 30 W m−2 to be low forcing, 60 W m−2 to be medium forcing, and 90 W m−2 to be high forcing. These values are within observed ranges of radiative forcings due to aerosol loading of the atmosphere (Kumar and Devara, 2012; Vaishya et al., 2018). Absorbing aerosol forcing above 100 W m−2 is deemed unrealistic in real-world terms, but such forcing values are considered in order to cover a parametric range of forcings, which includes the possibility of a breakdown or substantial weakening of the monsoon systems. The absorbing aerosol forcing does not follow seasonal modulation, in contrast to real-world scenarios and other studies (e.g. Herbert et al., 2022). We anticipate that there will be no noticeable hysteresis in the model's behaviour as a result of the of applied forcing.
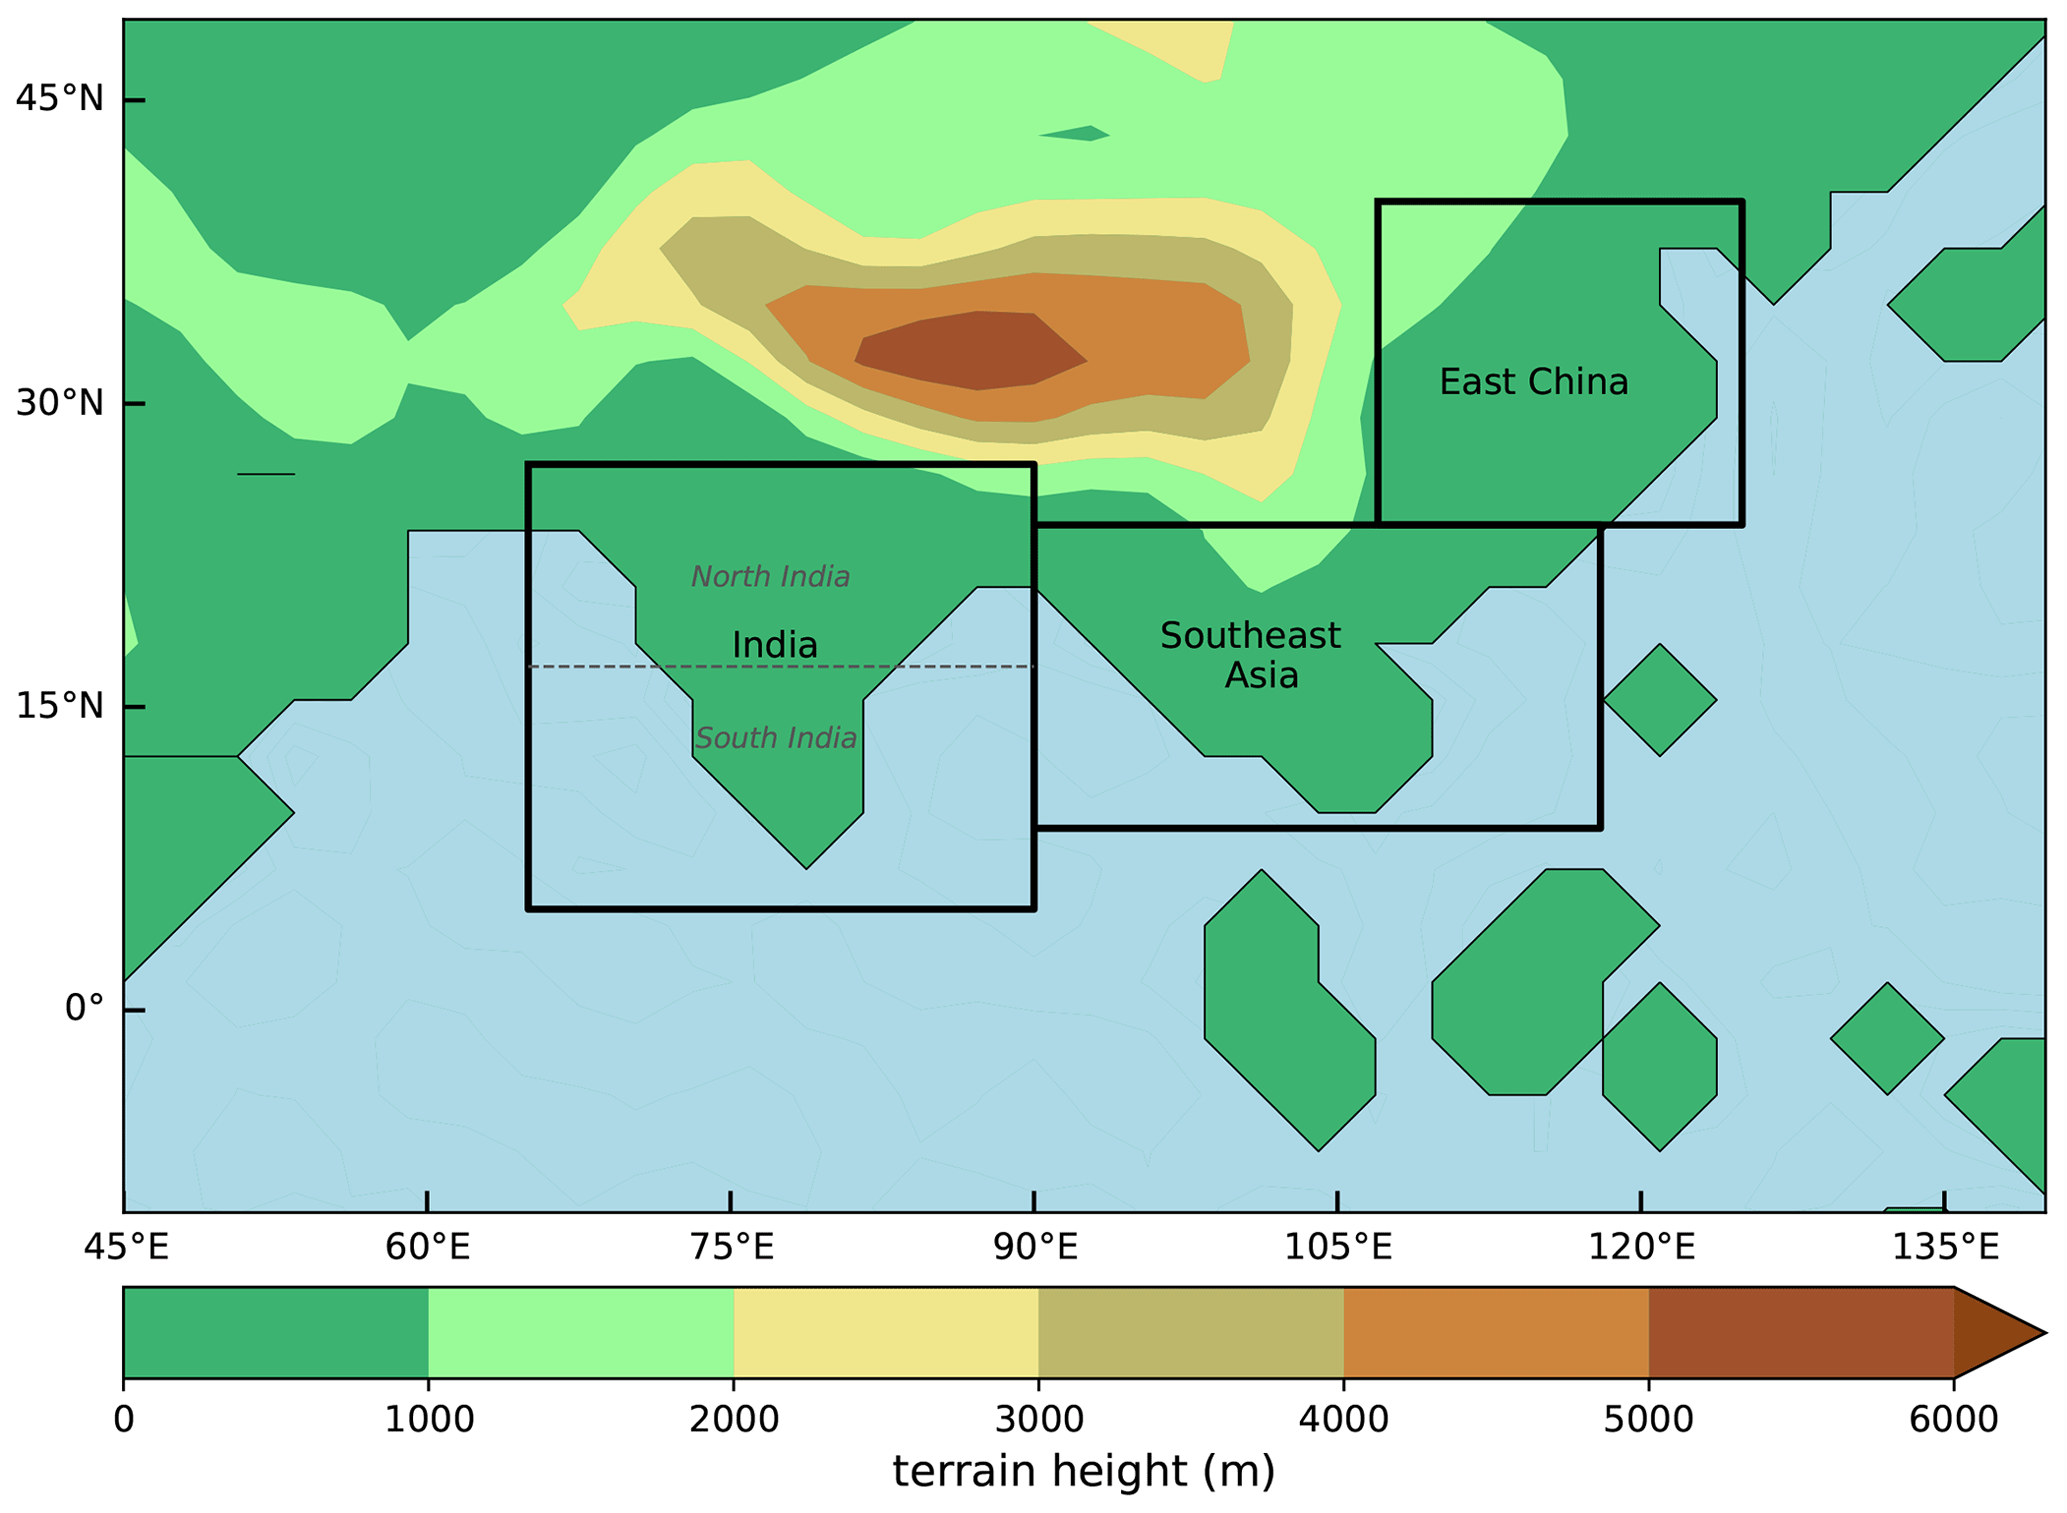
Figure 5Regions showing where absorbing aerosol forcing has been applied. Shading indicates terrain height (m).
The added absorbing aerosol forcing causes the surface to cool in the regions where the forcing is applied and also causes a warm anomaly around 700 hPa. The increased stratification of the atmosphere and the reduction of the land–sea temperature contrast suppresses precipitation and weakens the large-scale circulation. As the absorbing aerosol forcing is increased, the response of the monsoons becomes more pronounced.
Figures 6–8 (and Figs. S2–S7) are presented as panels of two rows by three columns for each variable, with the top-left panel showing the state of the system at approximately 30 W m−2 of forcing. The remaining five panels show the anomaly with respect to the control simulation (aerosol only – control) at forcings of approximately 30, 60, 90, 120, and 150 W m−2. With the exception of 150 W m−2, each panel in the figures is produced using the average of the two 10-year means centred around the respective forcing values. The panel for 150 W m−2 represents the single 10-year period centred on 150 W m−2. Since there is no significant hysteresis in the simulations, the average over both the ascending branch with forcing 0 to 150 W m−2 and the descending branch with forcing 150 to 0 W m−2 is taken. Stippling is added to show statistically significant changes, defined as where the anomaly (aerosol only – control) is greater than double the JJA interannual variability of the aerosol-only simulation. In the following text, we discuss the response of the system by looking at the mean summer (JJA) precipitation, evaporation, surface temperature, and winds at 850 and 200 hPa. Areas of high orography will be masked in grey for certain pressure levels.
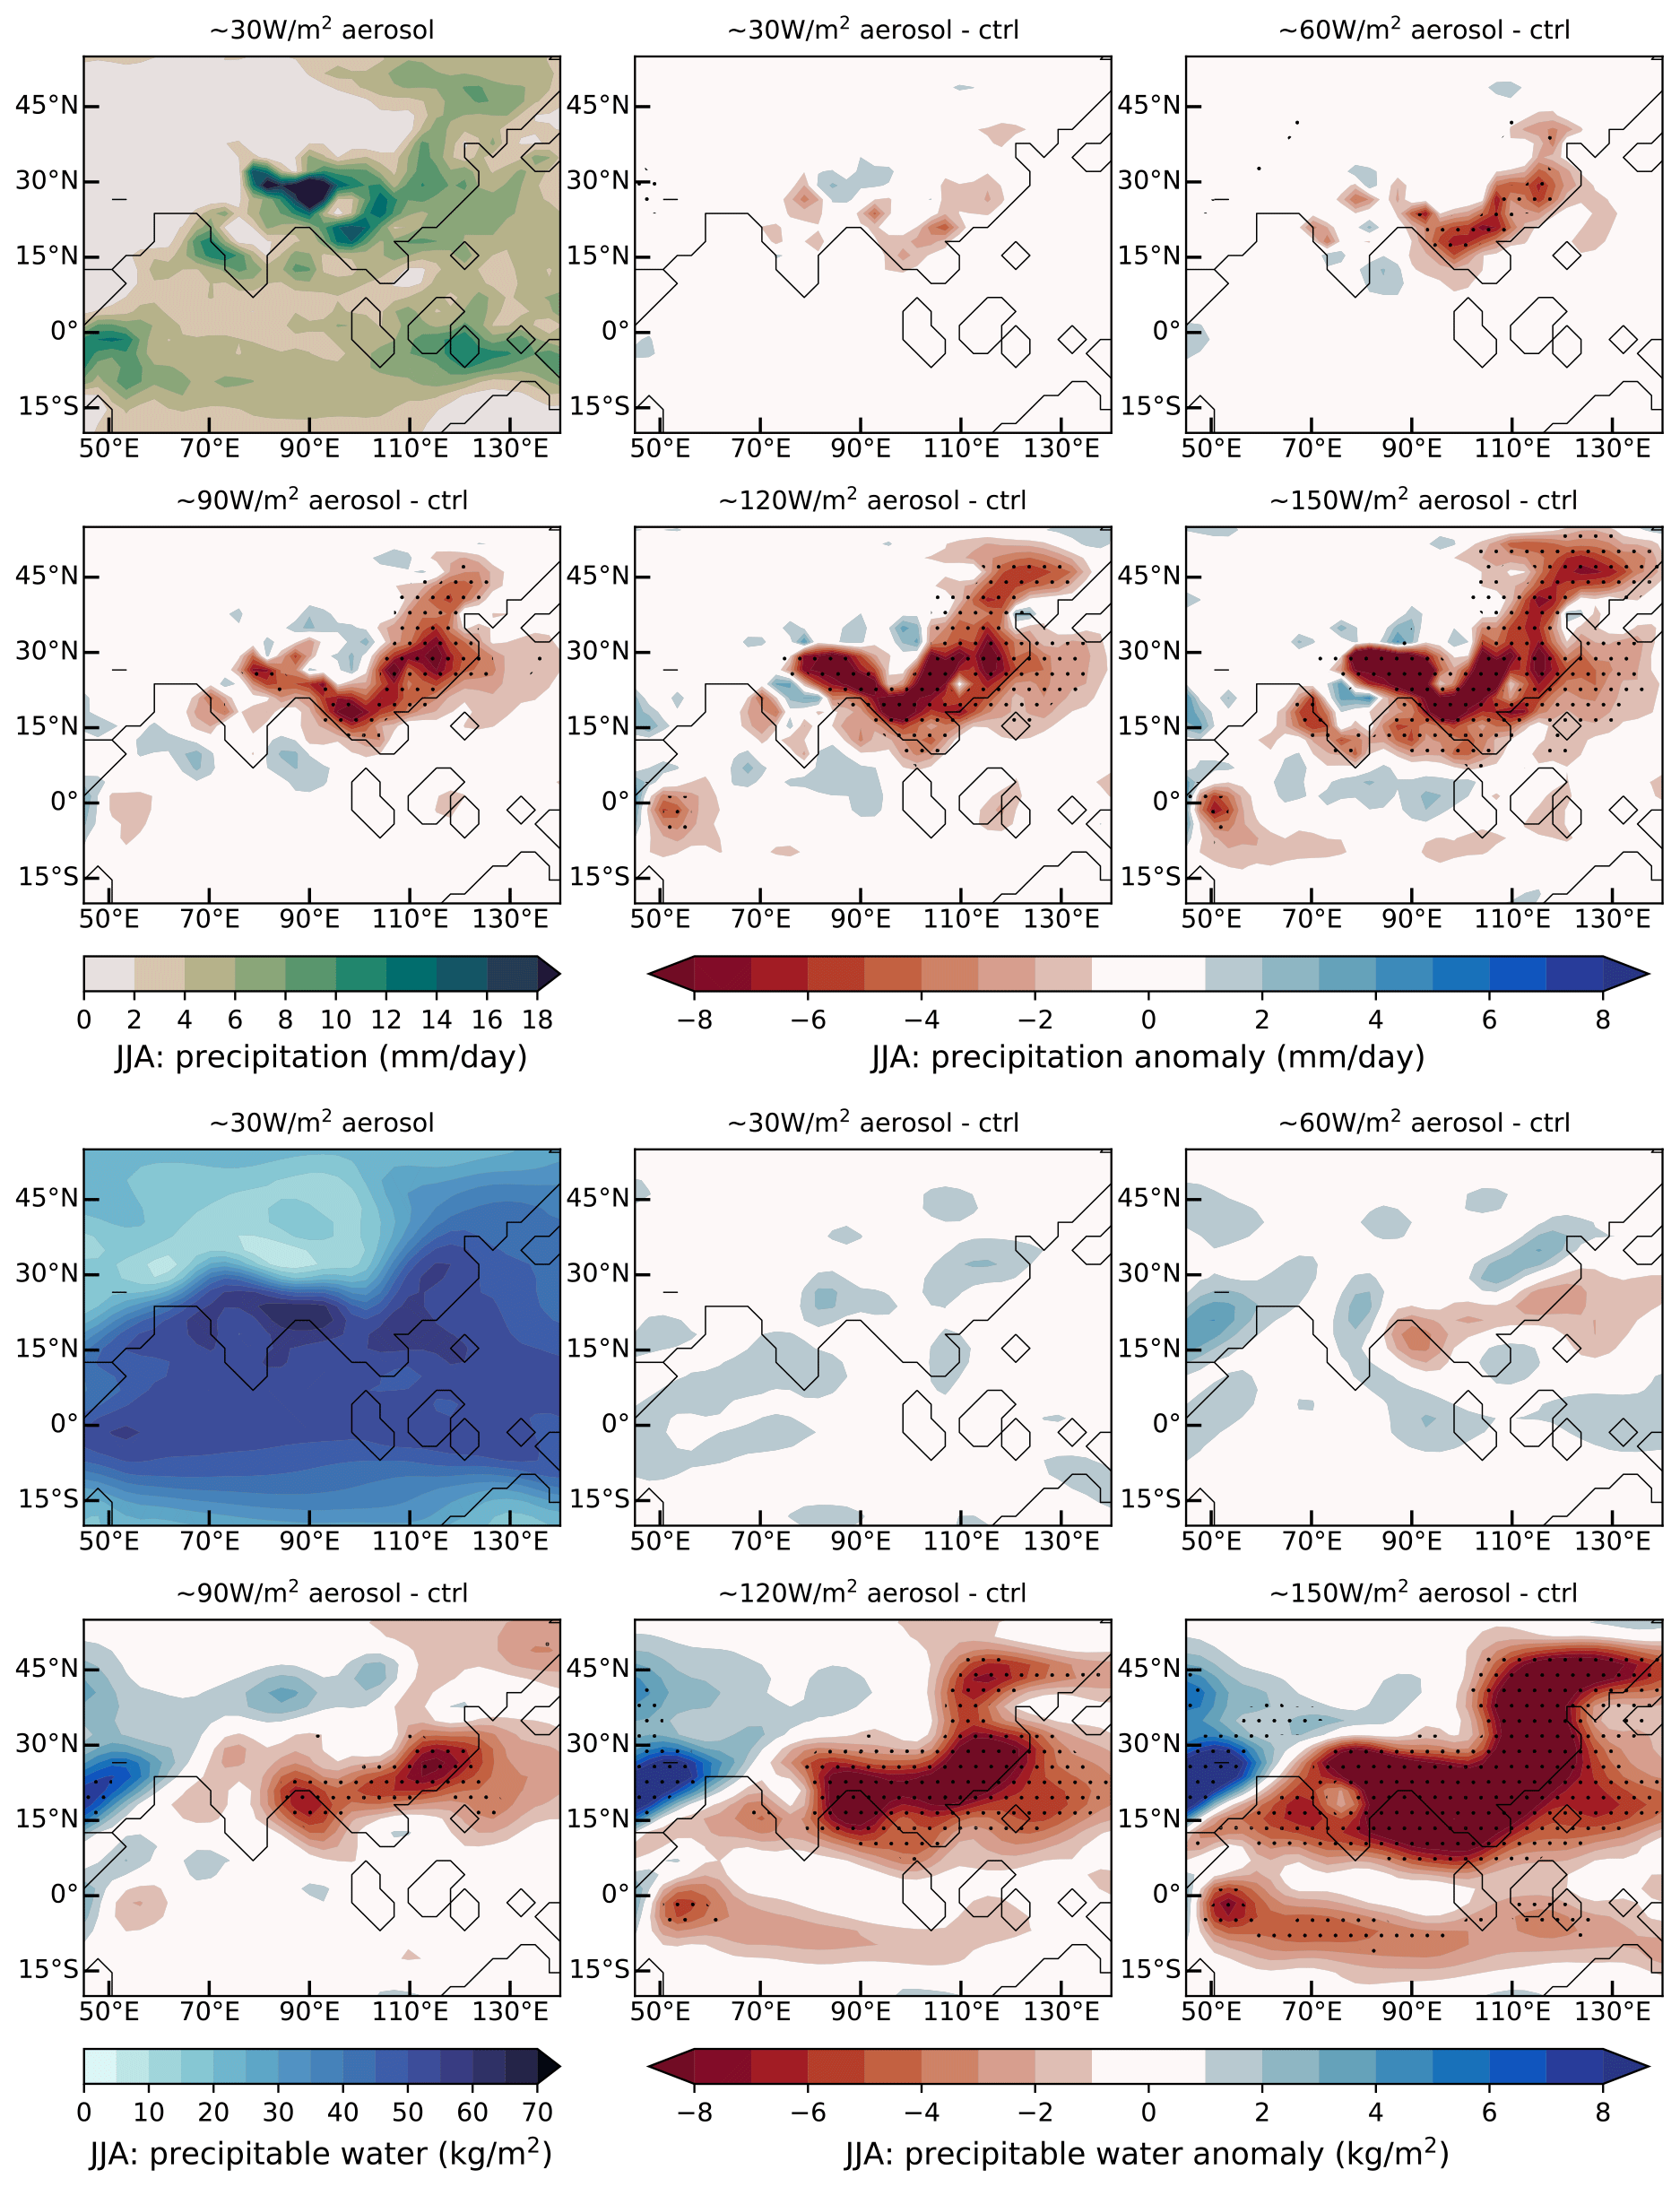
Figure 6Aerosol-only simulation. Contours showing mean decadal June–July–August precipitation and precipitation anomaly (top two rows), and mean decadal June–July–August precipitable water and precipitable water anomaly (bottom two rows) compared to the control run (anomaly being aerosol only – control) for a range of absorbing aerosol forcing values. Stippling shows where the anomaly exceeds double the JJA interannual variability.
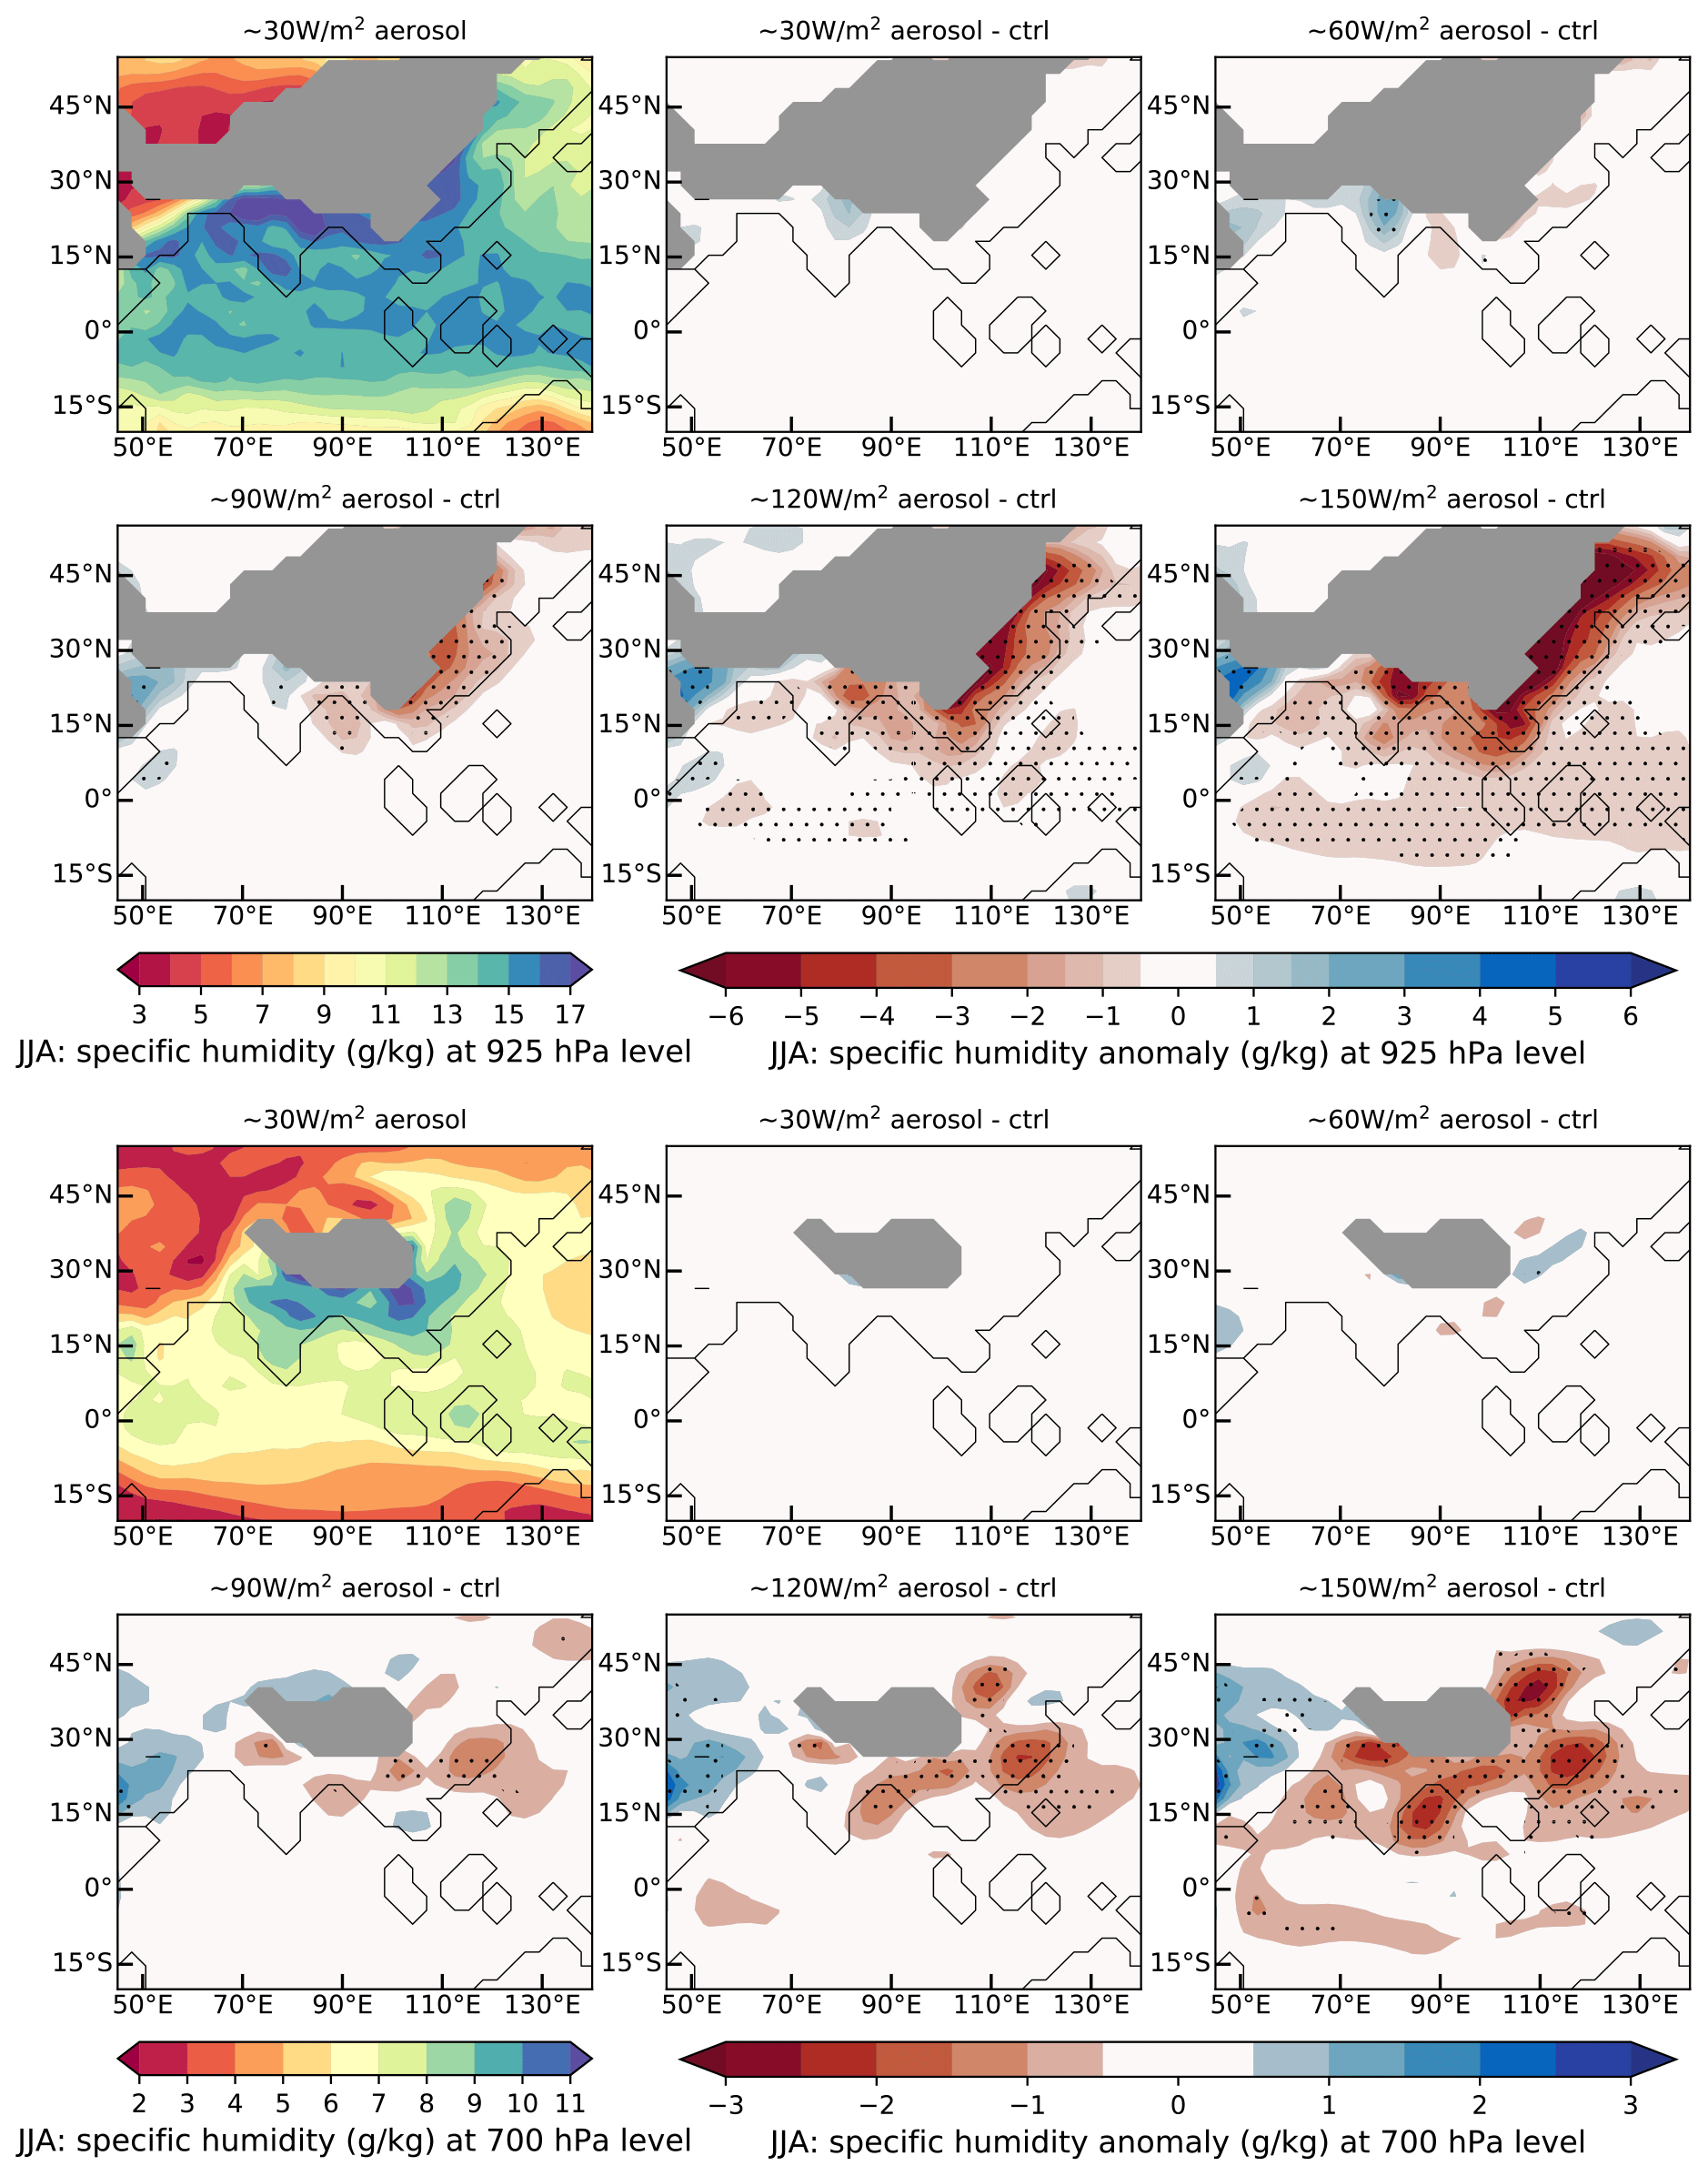
Figure 7Aerosol only simulation. Contours showing mean decadal June–July–August specific humidity and mean decadal June–July–August specific humidity anomaly compared to the control run (anomaly being aerosol only – control) for a range of aerosol forcing values. The top two rows are at 925 hPa, and the bottom two rows are at 700 hPa. Areas of high orography are masked in grey. Stippling shows where the anomaly exceeds double the JJA interannual variability.
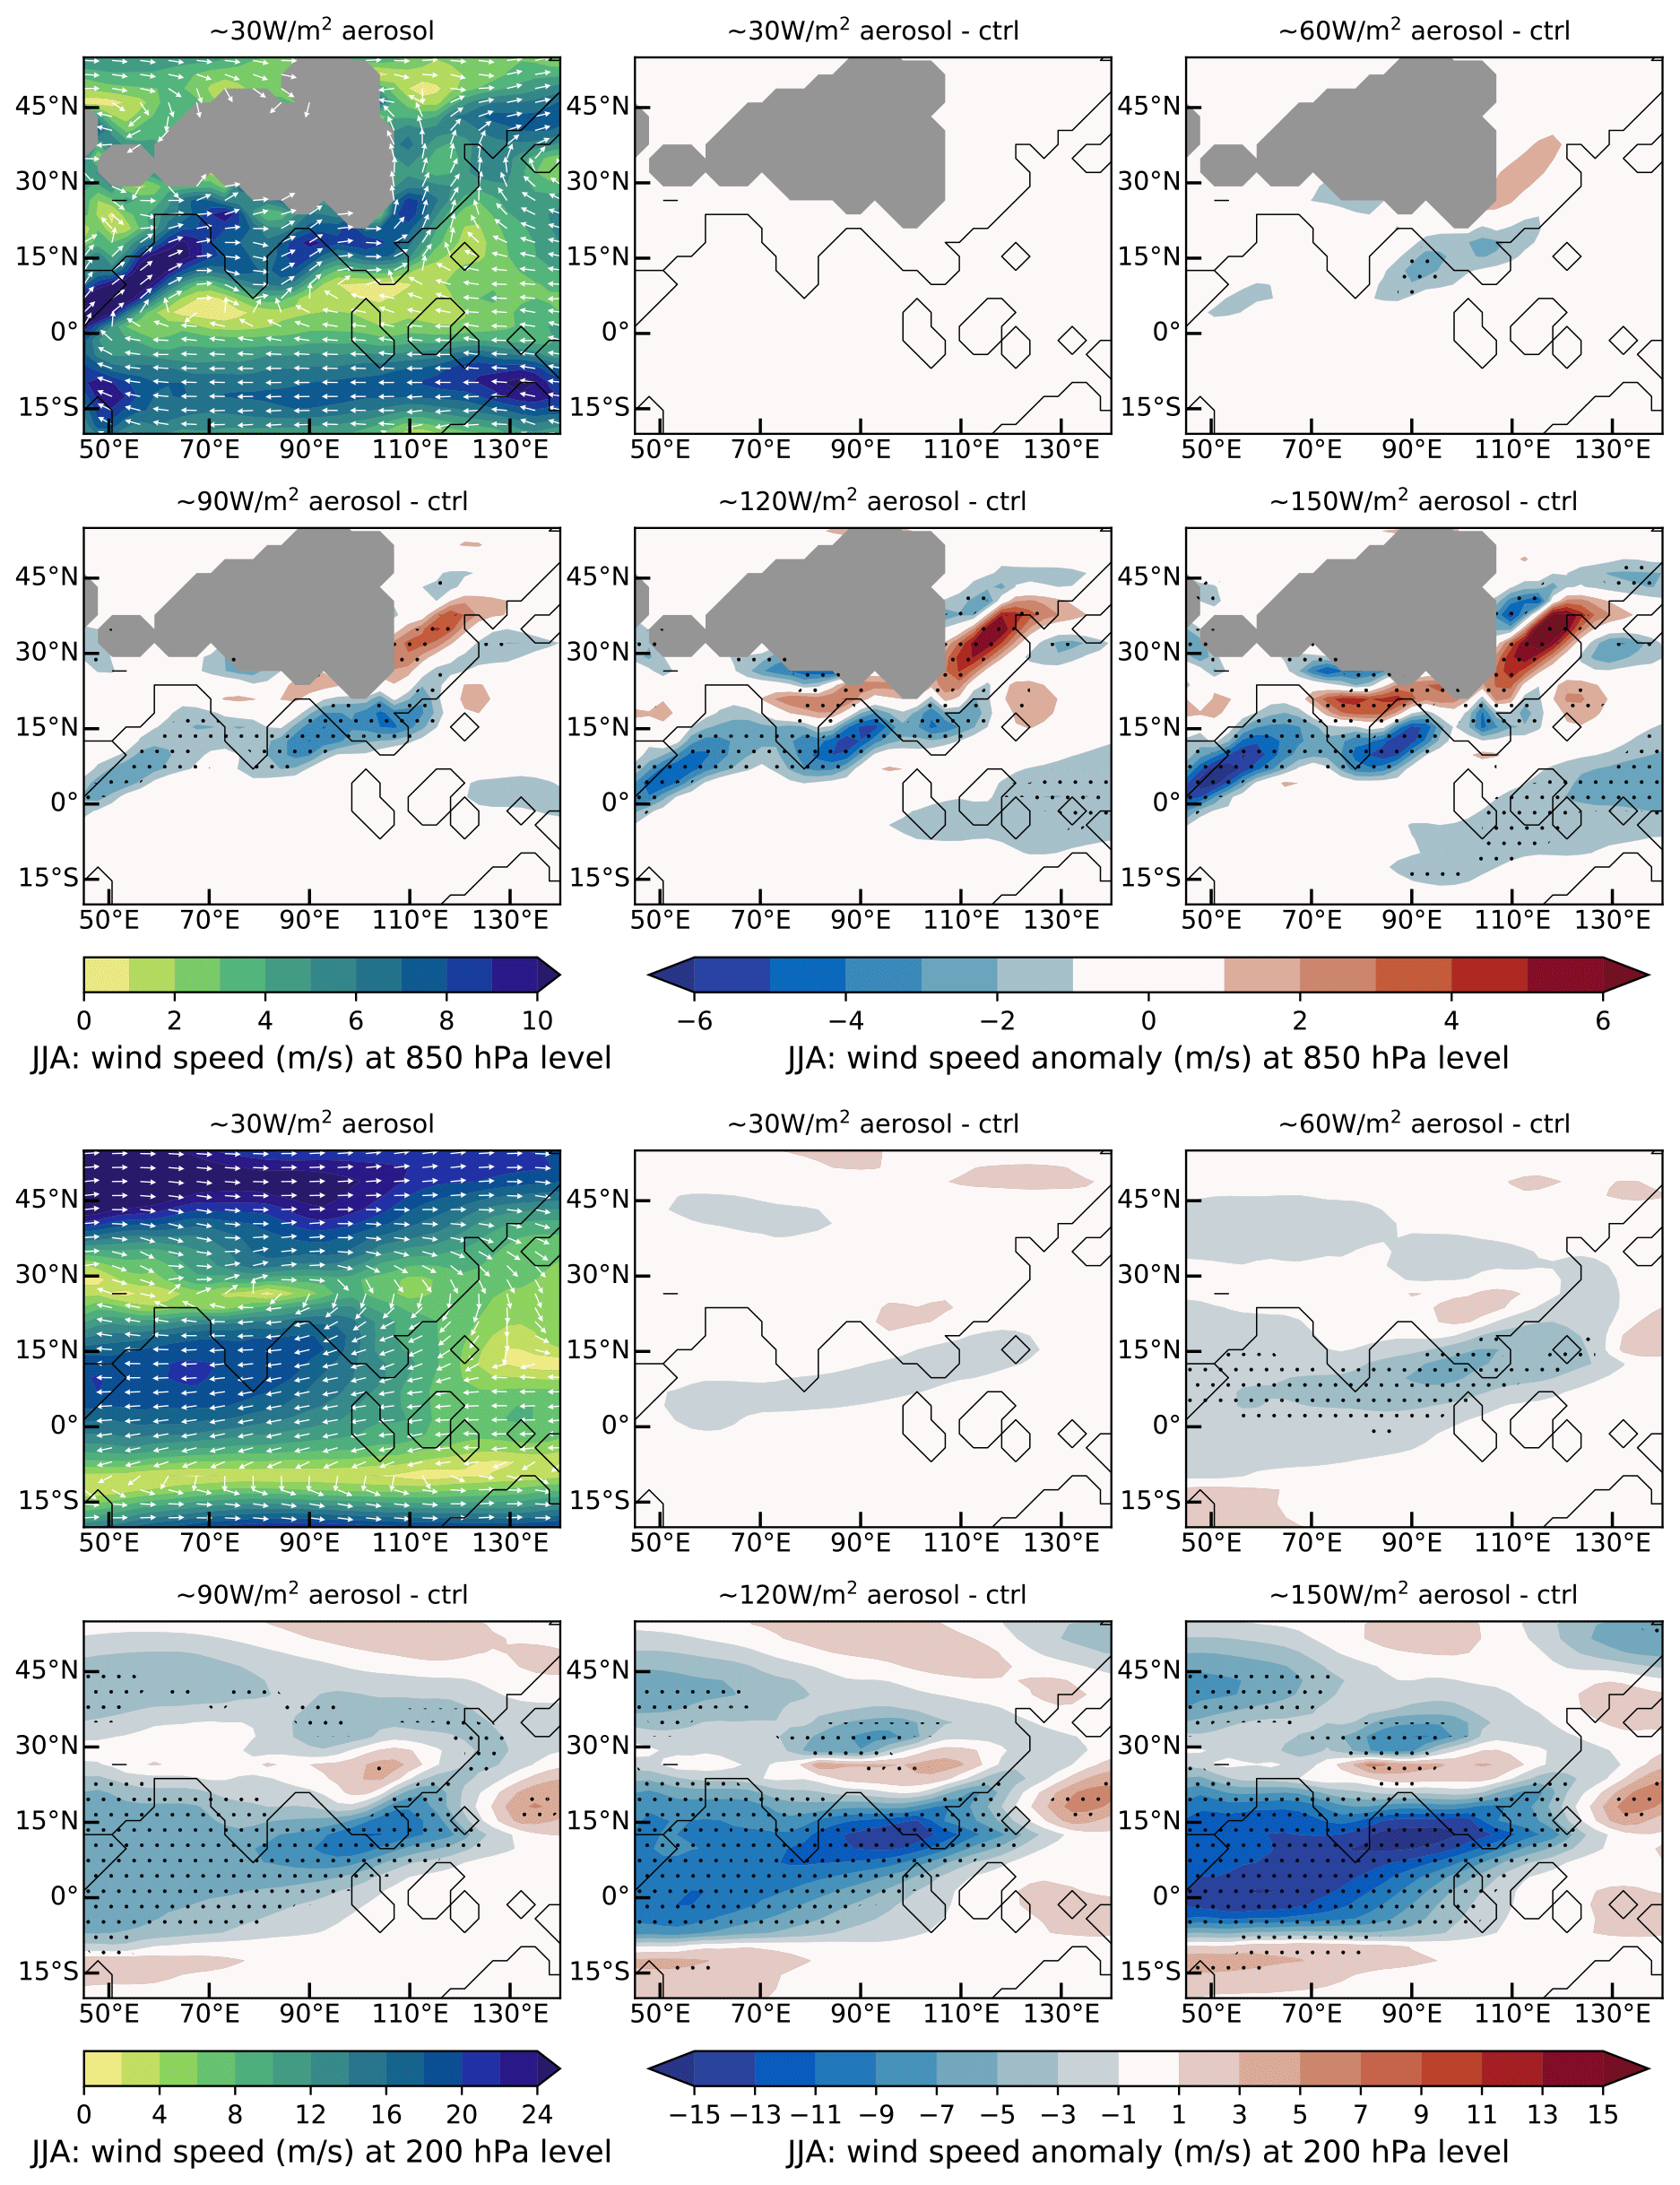
Figure 8Aerosol only simulation. Contours showing mean decadal June–July–August wind speed and direction (shading and vectors) and mean decadal June–July–August wind speed anomaly (shading) compared to the control run (anomaly being aerosol only – control) for a range of absorbing aerosol forcing values. The top two rows are at 850 hPa, and the bottom two rows are at 200 hPa. Areas of high orography are masked in grey. Stippling shows where the anomaly exceeds double the JJA interannual variability.
The application of the radiative forcing associated with absorbing aerosols leads to surface cooling and mid-level warming where the forcing is applied (Fig. S2). When the intensity of absorbing aerosol forcing reaches approximately 90 W m−2, some areas of India and South East Asia have cooled by 10 ∘C. Above 90 W m−2, the surface temperature drops more rapidly and becomes unrealistically cool at −15 ∘C in parts of eastern China when the forcing is close to 150 W m−2. The intense surface cooling is primarily responsible for activating the ice–albedo effect, which is a positive feedback that enhances surface cooling as sea ice and snow cover increases, causing a greater amount of radiation to be reflected back into space. The result is similar to the establishment of a nuclear winter, albeit via a different mechanism. In our modelling strategy, the effect of absorbing aerosols is emulated by vertically redistributing the heating, rather than removing it from the atmospheric column. At the 700 hPa level (Fig. S2, bottom two rows), a statistically significant warm anomaly develops over eastern China, which becomes stronger as the forcing increases. There is little change in 700 hPa temperature across northern India and Myanmar, with only the southern peninsula areas of India and Southeast Asia showing cool anomalies at high to extreme levels of forcing. The areas showing moderate temperature change at the 700 hPa level, namely northwestern India, eastern India–Myanmar, and eastern China, are also associated with anomalous high pressure (Fig. S3). The monsoon trough, a low-pressure region to the north of India that is associated with the formation of the Indian monsoon, intensifies as the forcing increases beyond 90 W m−2. When the absorbing aerosol forcing is greater than 90 W m−2, a statistically significant cold anomaly develops over the Middle East, creating an east–west temperature dipole. In general, the combination of surface cooling and mid-level warming, clearly seen in vertical cross sections of temperature (Fig. S5), leads to a strong temperature inversion and an increase in the static stability of the atmosphere, which suppresses moist convective processes and thus reduces precipitation.
Figure 6 (top two rows) illustrates the change in precipitation. The eastern China and Southeast Asia regions are the most affected and feature strong reduction in the precipitation. With the exception of the west coast and northeastern states, i.e. areas of higher orography, the majority of India does not follow the same trend of declining rainfall. At high to extreme levels of forcing, eastern Siberia experiences a reduction in precipitation, despite being outside the area where forcing is applied. To understand the variation in the precipitation response to absorbing aerosol forcing, other variables such as the vertically integrated precipitable water, specific humidity, evaporation, and circulation are considered.
Figure 6 (bottom two rows), showing the change in precipitable water with absorbing aerosol forcing, highlights a moist anomaly over the Middle East and dry anomalies over northeastern India, Southeast Asia, and eastern China. These anomalies only become statistically significant at 90 W m−2 forcing and above; this is in contrast to the changes in the precipitation, which become significant from 60 W m−2. The fact that the precipitation decreases at a faster rate than the precipitable water is primarily attributed to a reduction in precipitation efficiency, which is due to the increase in the static stability of the lower levels of the atmosphere, as opposed to a reduction in the moisture availability of the atmospheric column.
There is a slight moist anomaly over India up to 60 W m−2 forcing. Beyond 60 W m−2 forcing, there remains a region in central India that does not experience the significant reduction in precipitable water seen over Southeast Asia and eastern China. Similarly, looking at Fig. 7, the specific humidity at 925 hPa is higher over northern India up to 90 W m−2 forcing, and thereafter the specific humidity reduces significantly in the area of applied forcing, except for a small region in western central India. A vertical cross section of specific humidity along 20∘ N (Fig. S6, top two rows) also highlights the moist anomaly over northern India (70–90∘ E) at 30 and 60 W m−2 and the moist anomaly over the Middle East (around 50∘ E).
Figures 7 and S6 show that the greatest decline in specific humidity occurs near the surface, which corresponds with a reduction in the evaporation (Fig. S4). The absorbing aerosol forcing leads to a decrease in the evaporation because of the reduction of the solar radiation reaching the surface (Ramarao et al., 2023). There is a greater decrease in evaporation over eastern central and southern India than over northwestern India, in agreement with observed evapotranspiration trends in the period 1979–2008 (Ramarao et al., 2023).
Another key effect of the applied radiative forcing is to weaken the large-scale circulation. At low levels (Fig. 8, top two rows), there is a reduction in the strength of the southwesterly wind in the band 0–20∘ N, which is a key driver of both the South Asian and East Asian monsoons. With approximately 60 W m−2 of heating, the wind speed is reduced by 2–3 m s−1, and with 90 W m−2 heating, there is a 4–5 m s−1 reduction in wind speed. When the maximum forcing is applied, the speed of the southwesterly monsoon wind becomes close to zero. Stronger radiative forcing causes more pronounced surface cooling, weakening the land–sea temperature gradient and thus weakening the low-level monsoon flow.
There is a strengthening of the low-level wind in eastern China (20–40∘ N), causing more dry air to be advected from southwest to northeast towards eastern Siberia and corresponding to a reduction in precipitation in the region. The mid-level wind field (not shown) experiences changes of a similar magnitude to the low-level wind field. A narrow region stretching from northwestern India to Bangladesh and continuing northeastwards features increased wind speeds, a process associated with the formation of three atmospheric highs (Fig. S3).
At higher levels (Fig. 8, bottom two rows), from Southeast Asia to the eastern coast of Somalia there is a significant reduction in the speed of the tropical easterly jet. Higher absorbing aerosol forcing corresponds with greater declines in easterly wind speeds. Additionally, there is a slight weakening of the westerly subtropical jet, located north of India, at high forcing rates (>90 W m−2).
With light (30 W m−2) absorbing aerosol forcing, there is vertical ascent over land for the regions of southern India, Southeast Asia, and eastern China (Fig. S7), corresponding to the locations of peak convective rainfall (Fig. S7 – dotted lines). Note that Fig. S7 shows the vertical velocity in pressure coordinates (ω), meaning that negative vertical velocity corresponds to ascent and positive vertical velocity to descent. As the absorbing aerosol forcing increases, the upwards vertical velocity is reduced. This is consistent with increased atmospheric stratification and increased static stability, leading to suppression of convective precipitation.
In Fig. S7 (top two rows), there is an area of vertical ascent around 20∘ N, 70–80∘ E, which becomes stronger as the absorbing aerosol forcing increases. Although there is not an equivalent increase in the convective precipitation, in Fig. 6 there is a slight increase in total precipitation for central India at high and extreme levels of forcing. Thus, the anomalous precipitation over central India comes from large-scale rather than convective processes and is linked to changes in the circulation, likely related to non-local effects (explored further in Sect. 5).
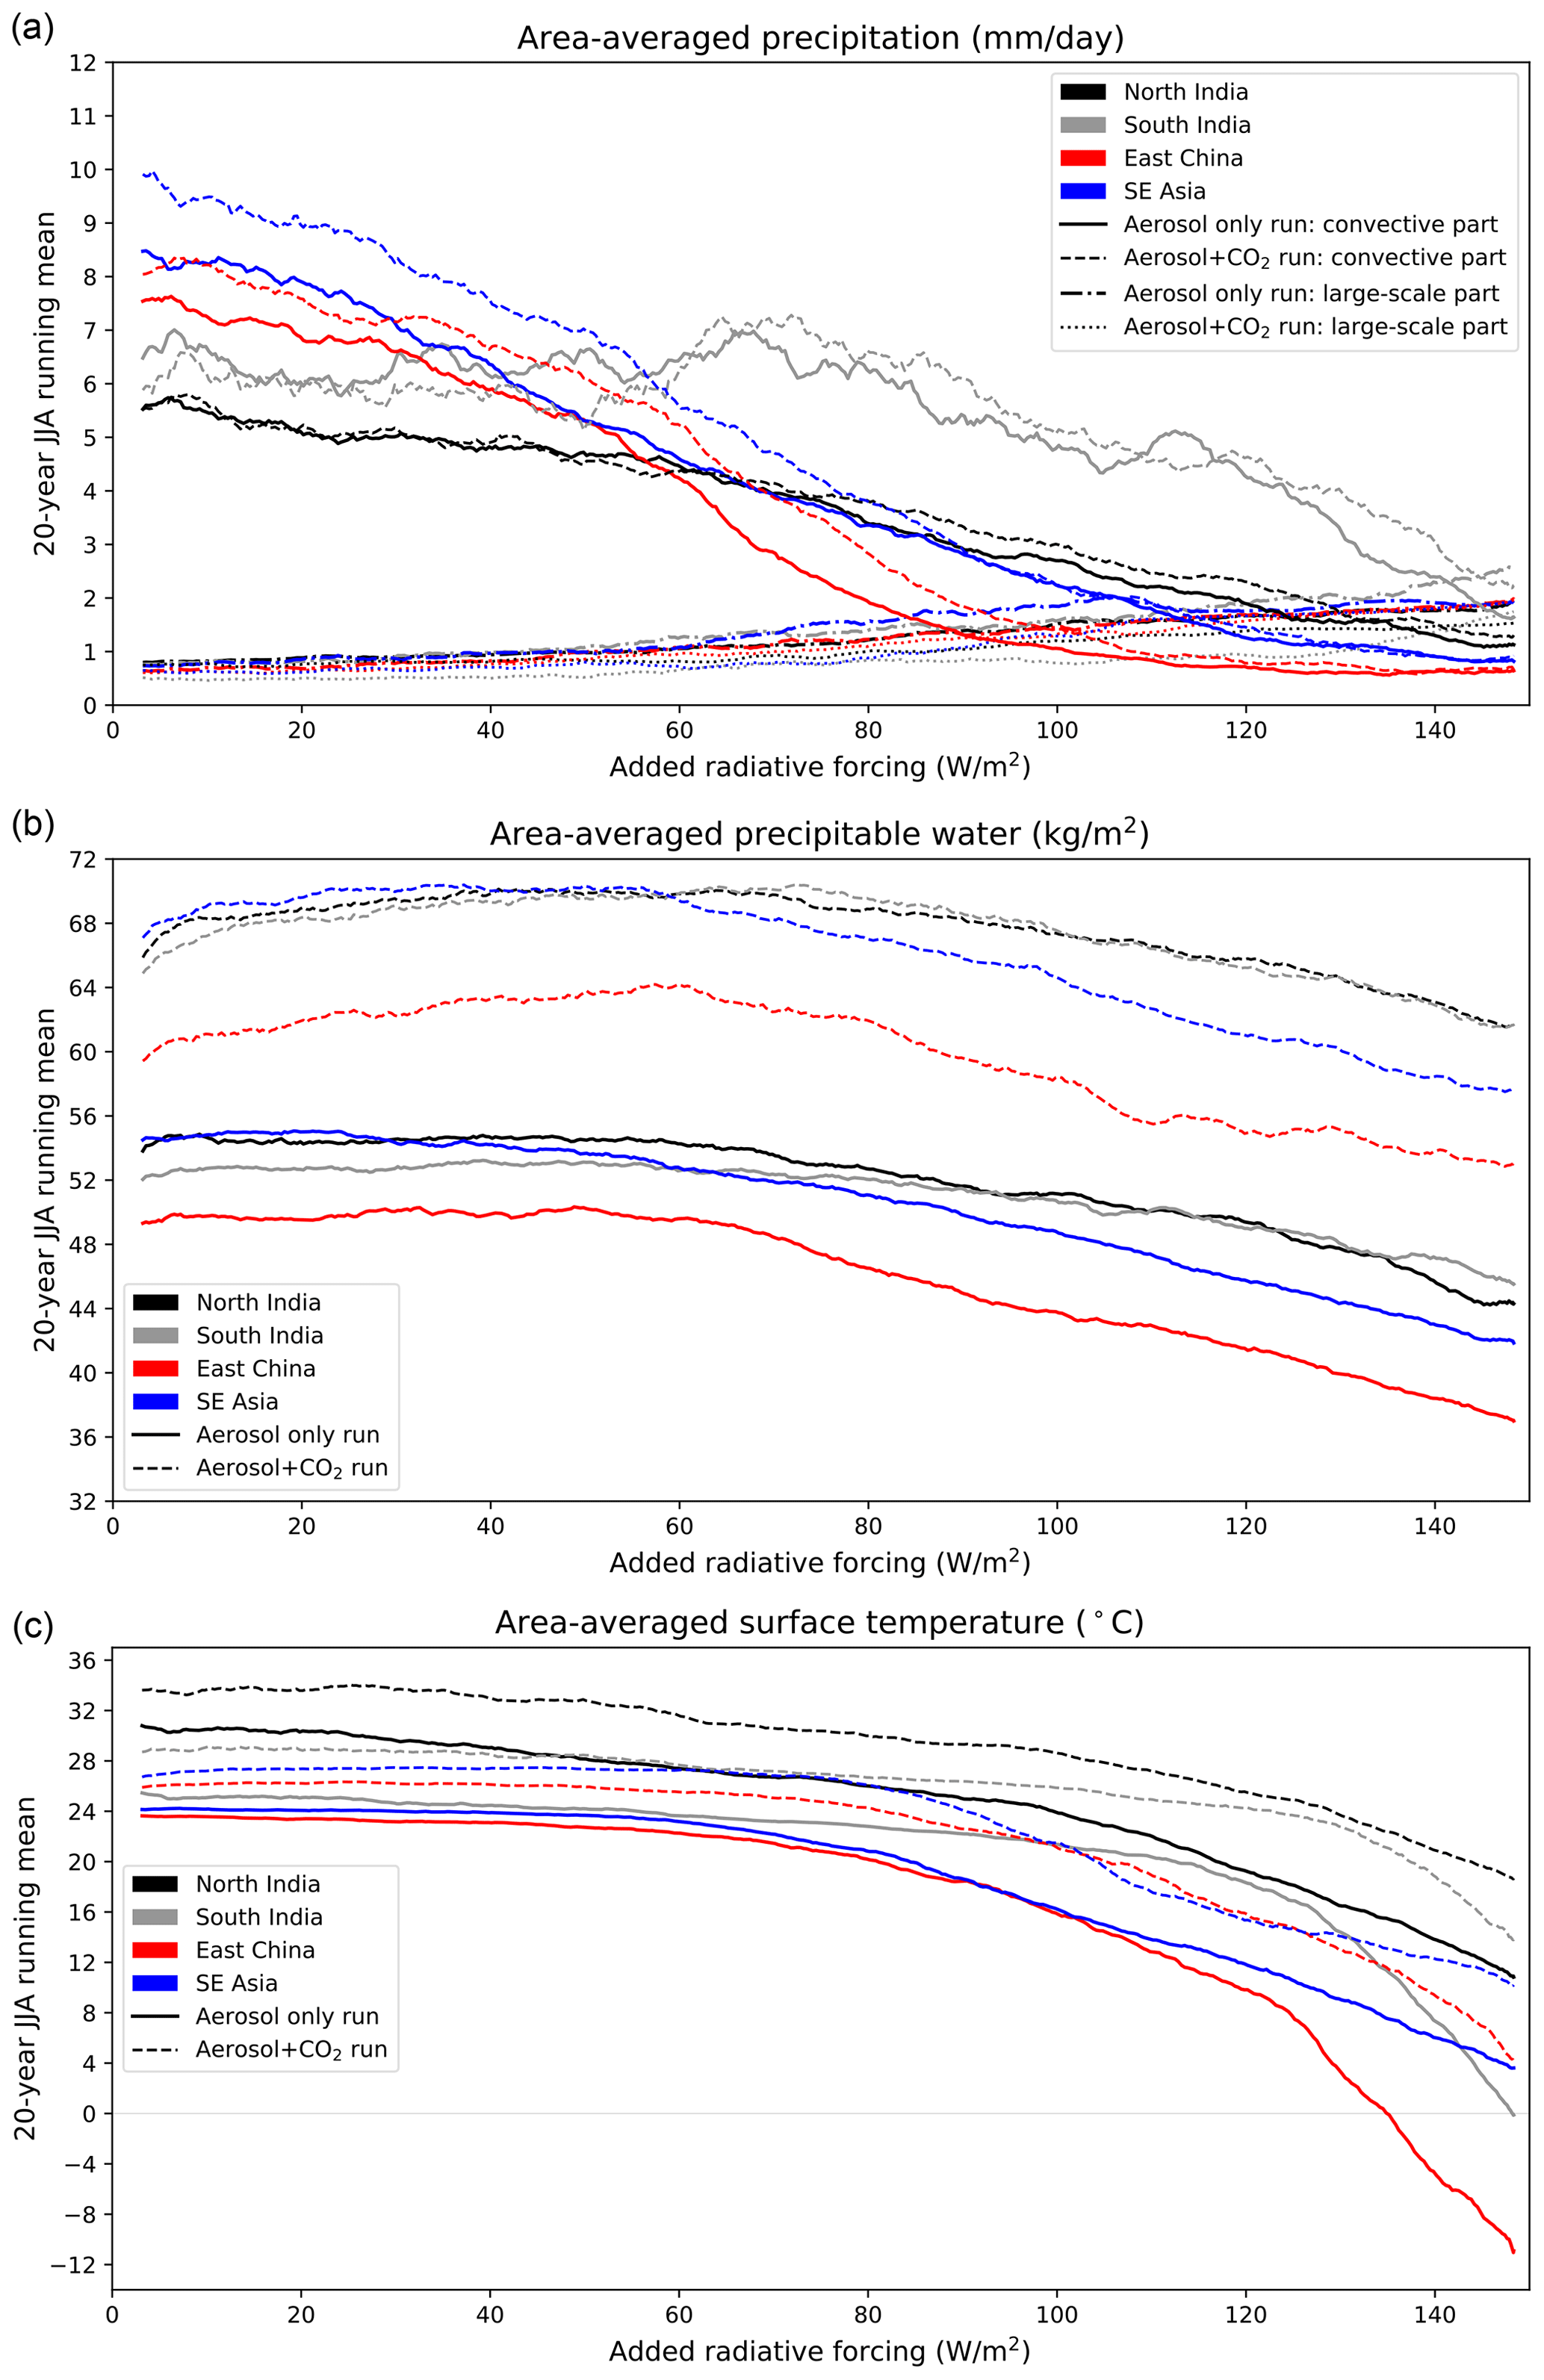
Figure 9Precipitation (a), precipitable water (b), and surface temperature (c), averaged over the regions indicated (following the marked boxes in Fig. 5), for aerosol-only and aerosol-with-2 × CO2 runs, against the absorbing aerosol forcing. Precipitation is separated into convective and large-scale components. Variables are taken as a running 20-year June–July–August mean.
3.1 Relationship between forcing and precipitation
Here we consider the behaviour of the precipitation, averaged over key regions of northern India, southern India, eastern China, and Southeast Asia, as the radiative forcing increases. India is separated into northern and southern regions as the responses are significantly different in the two sub-regions. The precipitation is split into large-scale and convective components. The regionally averaged, vertically integrated precipitable water and the regionally averaged surface temperature are also investigated to understand if changes in precipitation correlate with changes in the precipitable water or surface temperature. Note that the area averages refer to land points only.
Looking firstly at the precipitation (Fig. 9a), we can see that the convective component dominates. As the forcing increases, the convective precipitation reduces; however, the large-scale precipitation slightly increases. There is significant variation in convective precipitation response between the regions, with eastern China showing the most abrupt decline and southern India being the least impacted. The response of southern India (solid grey line) to the applied radiative forcing is partially mitigated by advection of moisture from the surrounding oceans. For northern India (solid black line), there is a nearly linear decline in convective precipitation as the forcing increases. As noted above, eastern China (solid red line) experiences an abrupt decline at approximately 60 W m−2 forcing, after which the convective precipitation drops to a negligible amount. The behaviour of the convective precipitation in Southeast Asia (solid blue line) is somewhere between that of eastern China and northern India: it decreases more sharply than northern India but without the abrupt transition at around 60 W m−2. The large-scale precipitation simulated by the model is only weakly affected by the absorbing aerosol forcing, and its response partially compensates the severe decrease of the convective precipitation.
The regional variation in area-averaged precipitable water (Fig. 9b) is less than that of precipitation. There is a transition in the precipitable water for all regions, from approximately constant to linearly declining, as the forcing increases past 60 W m−2. We note again that between 0 and 60 W m−2 forcing, although the convective precipitation is gradually reducing, the precipitable water does not correspondingly decline. This is attributed to a reduction in the precipitation efficiency associated with changes in the dynamics of the atmosphere.
The area-averaged surface temperature (Fig. 9c) initially follows the same pattern as precipitable water, remaining roughly constant as the radiative forcing increases from 0 to 60 W m−2. For weak (<60 W m−2) absorbing aerosol forcing, the suppression of evaporative and convective processes appears to offset the surface cooling associated with the presence of absorbing aerosols. Beyond 60 W m−2, the surface temperature declines with increasing forcing at a near-linear rate for northern India and Southeast Asia. For eastern China and southern India, the rate of surface cooling increases at around 120–130 W m−2, which is linked with triggering ice–albedo feedback. For the range of absorbing aerosol forcing 0–80 W m−2, the surface temperature is only weakly sensitive to the forcing, whereas the precipitation is highly sensitive. Beyond 80 W m−2, the sensitivity reverses, with surface temperature being strongly affected by increasing forcing.
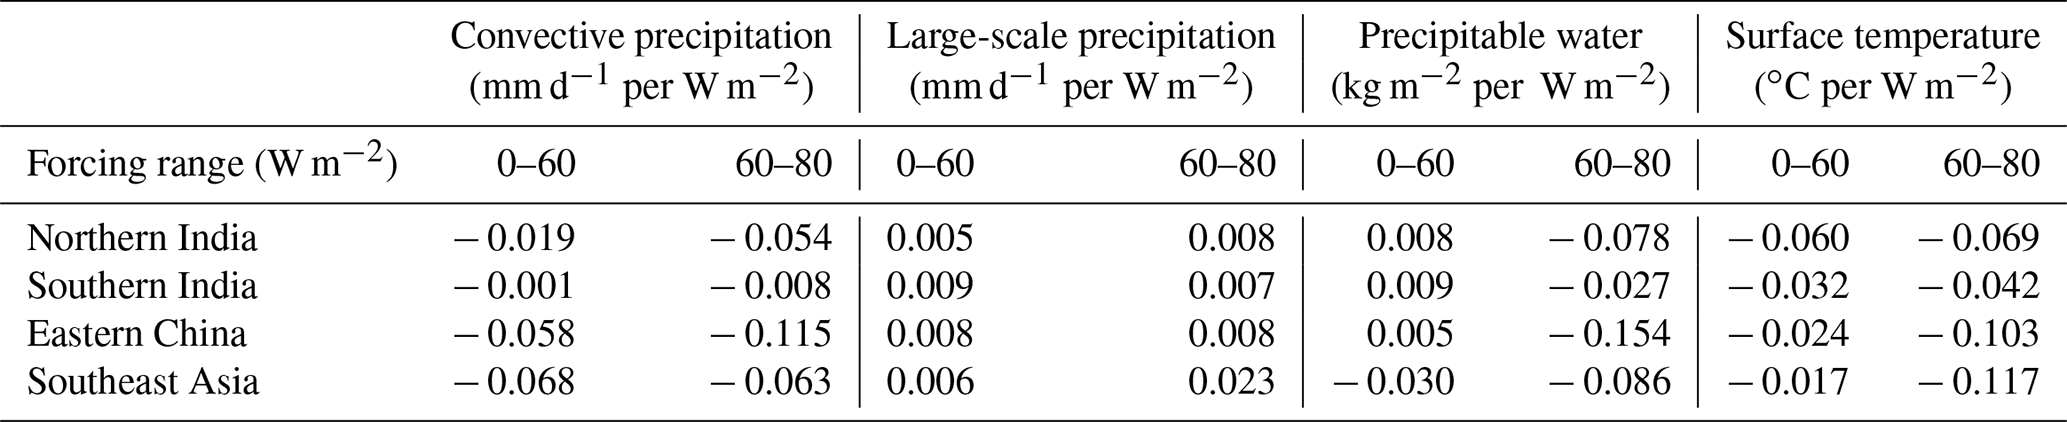
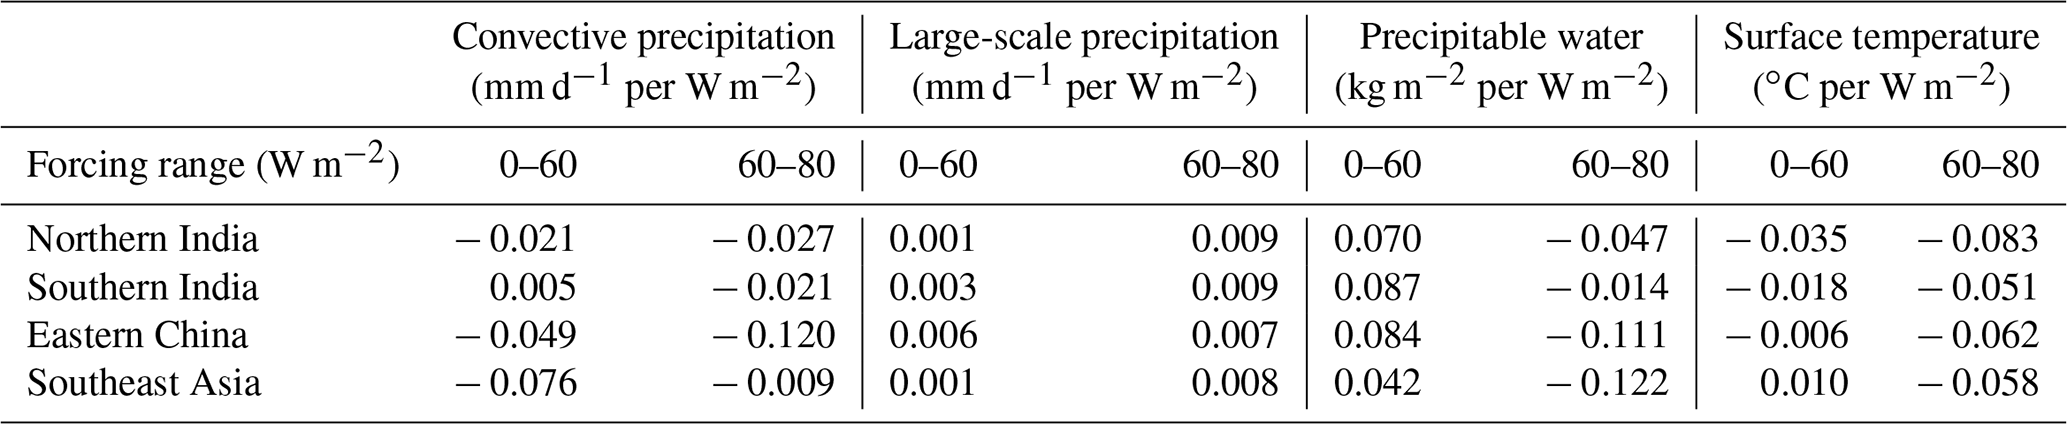
Table 1Slopes for Fig. 9, taken as a linear fit for the ranges 0–60 and 60–80 W m−2 absorbing aerosol forcing, for the aerosol-only simulation.
3.2 Summary and discussion
In summary, applying a regional absorbing aerosol forcing consisting of a mid-tropospheric heating and an equivalent surface cooling results in suppression of precipitation and a weakening of the large-scale circulation in the region. Areas of high pressure form, most prominently over eastern China. Some effects, such as the reduction in precipitation, extend to eastern Siberia. There is a much greater decline in precipitation over Southeast Asia and eastern China, than over India. The weakening of both the South Asian and East Asian monsoons in response to absorbing aerosol forcing has been observed and modelled (e.g. Lau and Kim, 2010; Bollasina et al., 2011; Ganguly et al., 2012; Song et al., 2014; Dong et al., 2019). Our simulation results are in agreement with the results of CMIP5 and CMIP6 standard models (Song et al., 2014), in particular with Ayantika et al. (2021) and their historic simulations with the IITM Earth System Model (version 2).
A more quantitative angle can be taken regarding the sensitivity of the monsoon characteristics with respect to the intensity of the absorbing aerosol forcing by considering Fig. 9 and Table 1 and focusing on the area-averaged precipitation, area-averaged precipitable water, and area-averaged surface temperature. As the radiative forcing is increased from 0 to 150 W m−2, there is a monotonic decrease in the convective precipitation for the regions of northern India and Southeast Asia, with the decrease being slightly more pronounced for Southeast Asia than for northern India. Eastern China shows the highest sensitivity to absorbing aerosol forcing and experiences the greatest rate change of convective precipitation from −0.058 at 0–60 W m−2 to −0.115 at 60–80 W m−2 (from Table 1). After 80 W m−2, the convective precipitation drops to almost zero. This is essentially a breakdown of the monsoon system.
In contrast to the convective precipitation, the amount of precipitable water is only weakly affected by the absorbing aerosol forcing in the range 0–60 W m−2, as indicated by the small slope values in Table 1, and thereafter monotonically decreases with larger forcing. The surface temperature is also only weakly affected by low- to medium-intensity absorbing aerosol forcing. There is little change in the rate of surface temperature between 0–60 and 60–80 W m−2 for northern and southern India, but a greater rate of decline is noted for eastern China and Southeast Asia (Table 1). Beyond 80 W m−2, the surface temperature declines rapidly with increasing forcing, with evidence of the ice–albedo feedback activating in eastern China and southern India at 120–130 W m−2. This analysis further confirms that the dramatic reduction in the precipitation is not due to a drying of the atmospheric column.
Enhanced carbon dioxide levels lead to higher surface temperatures, higher absolute humidity levels and weakening of the large-scale circulation (Held and Soden, 2006), as discussed in Sect. 1. Here, we investigate the response of the South Asian and East Asian monsoons to combined absorbing aerosol and carbon dioxide forcing and whether doubling the carbon dioxide levels is sufficient to offset the aerosol effects of surface cooling and reduced precipitation.
Doubling the carbon dioxide levels leads to warmer surface temperatures, with regions of South Asia being several degrees warmer in the aerosol-with-2 × CO2 simulation than in the aerosol-only simulation (Fig. S8, top row); however, for absorbing aerosol forcing over 60 W m−2, the net effect of combined absorbing aerosol and carbon dioxide forcing is a surface cooling. At the 700 hPa level (Fig. S8, bottom row), the higher level of carbon dioxide also leads to several degrees of warming compared to absorbing aerosol forcing alone (aerosol-only simulation). From Fig. S10, the warming from enhanced carbon dioxide levels is greater at mid-levels than at the surface relative to the aerosol-only simulation.
Given the warmer surface temperatures in the aerosol-with-2 × CO2 simulation, we would expect to see greater atmospheric moisture content and higher rates of evaporation and precipitation, compared to the aerosol-only simulation. Both the precipitable water and specific humidity are significantly greater when carbon dioxide levels are doubled (Fig. 10d–f, Figs. S9 and S11). The change in specific humidity is most pronounced close to the surface (Figs. S9 and S11) and over the Middle East (around 20∘ N, 50∘ E), enhancing the moist anomaly there. In contrast, there is no significant change in the rate of evaporation (not shown) over land for the aerosol-with-2 × CO2 simulation compared to aerosol only. There is an increase in both the evaporation (significant) and the precipitation (moderate) over the Indian Ocean when carbon dioxide levels are doubled.
In terms of the precipitation, there are some differences in the spatial pattern between the aerosol-with-2 × CO2 and aerosol-only simulations. Areas of high orography such as the Western Ghats and the Himalayas experience slightly less rainfall under combined absorbing aerosol and carbon dioxide forcing than with absorbing aerosol forcing alone (Fig. 10a–c). Moreover, the leeward side of the Himalayas receives slightly more rainfall, suggesting a downwind shift of precipitation in response to carbon-dioxide-induced warming (Siler and Roe, 2014). For absorbing aerosol forcing larger than 60 W m−2, in combination with the doubled carbon dioxide concentration, the absolute response of the precipitation is to decrease.
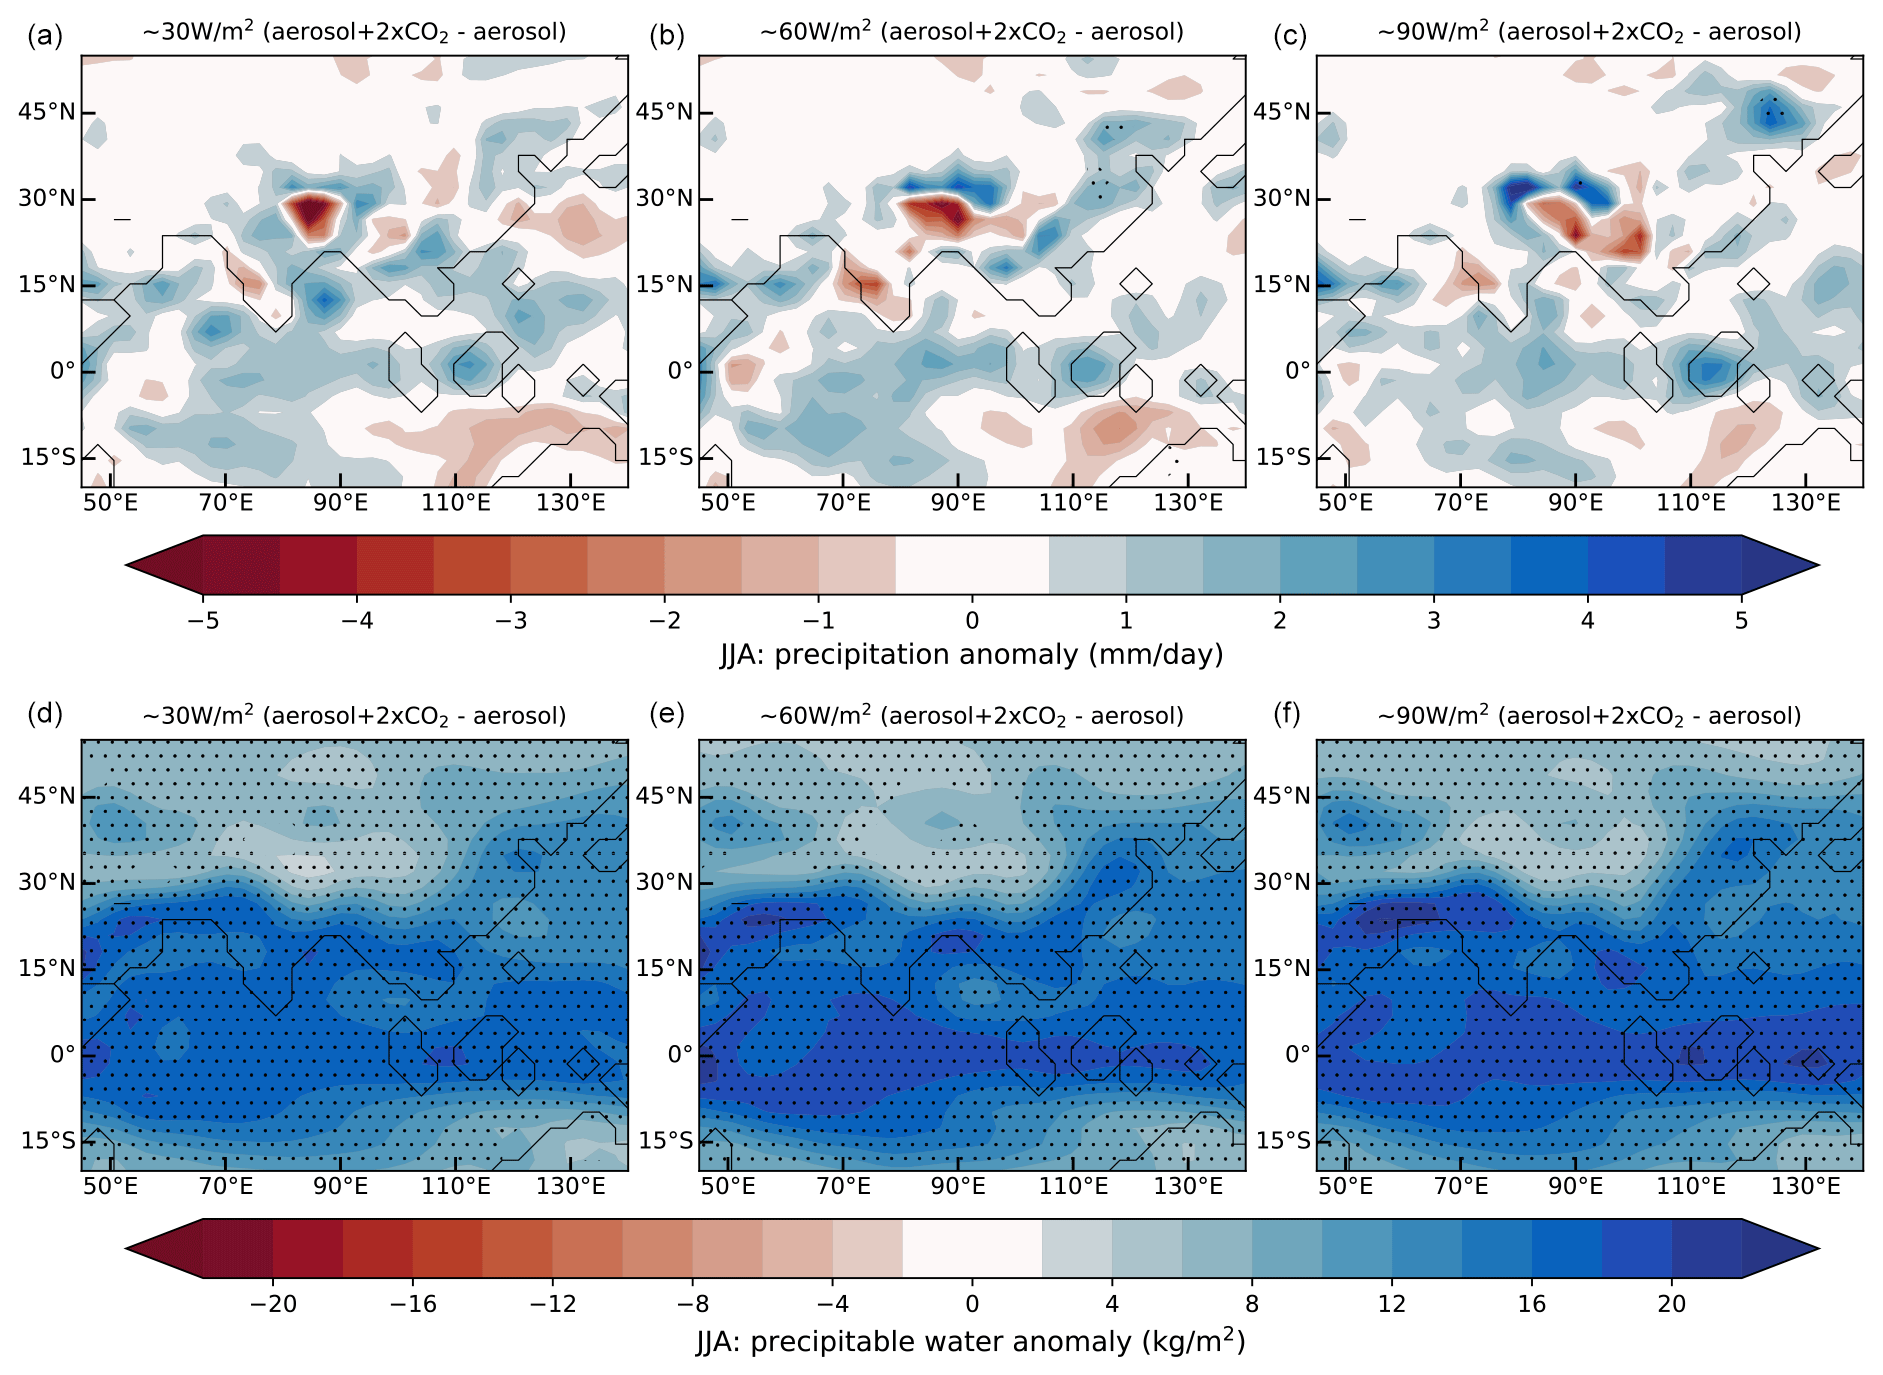
Figure 10Aerosol-with-2 × CO2 simulation. Contours showing mean decadal June–July–August precipitation anomaly (a–c) and precipitable water anomaly (d–f), compared to the aerosol-only run (anomaly being aerosol-with-2 × CO2 – aerosol only), for a range of absorbing aerosol forcing values. Stippling shows where the anomaly exceeds double the JJA interannual variability.
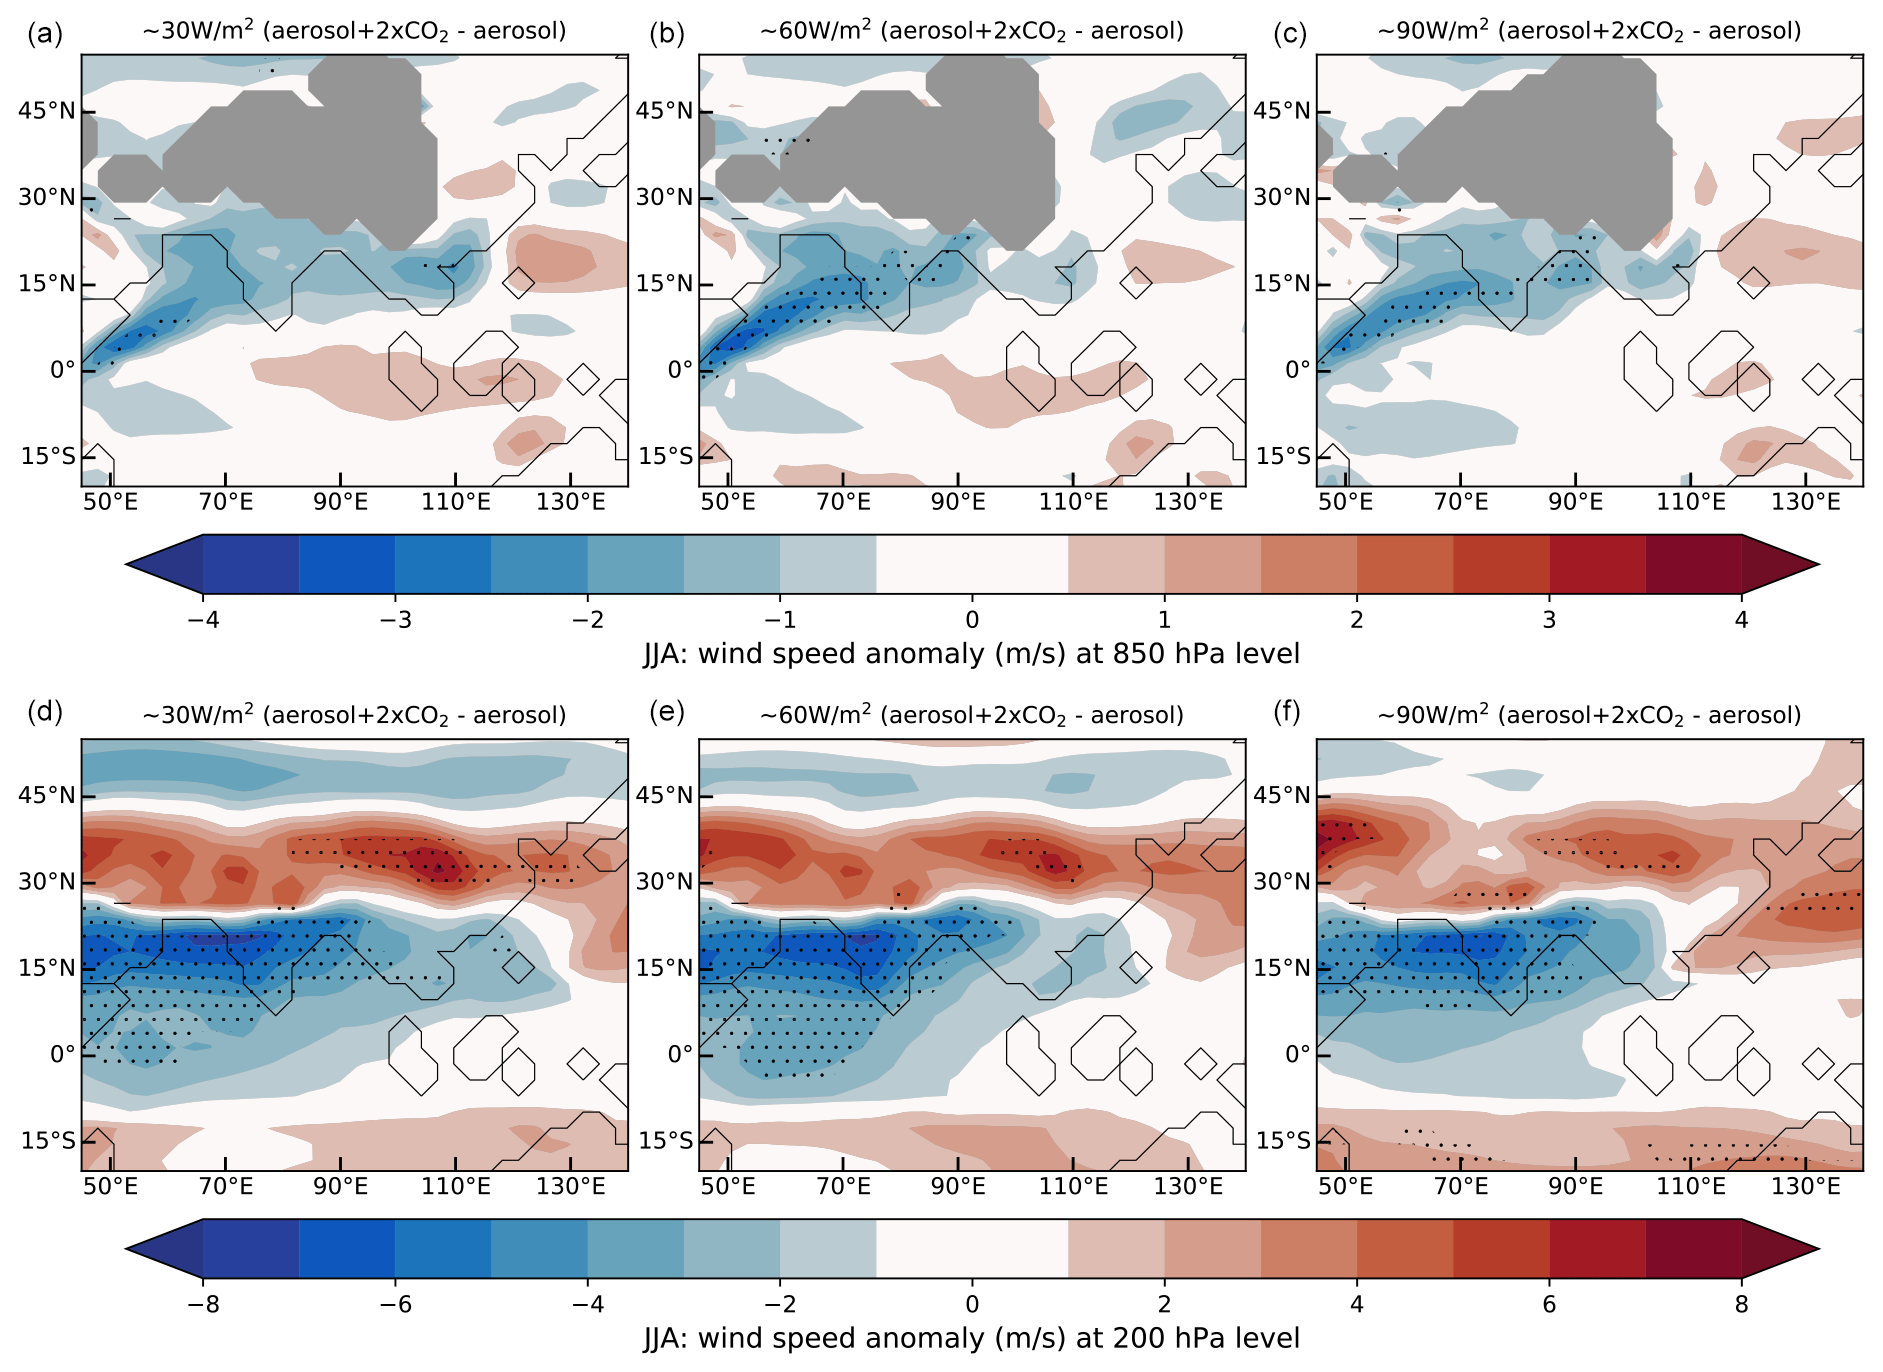
Figure 11Aerosol-with-2 × CO2 simulation. Contours showing mean decadal June–July–August 850 hPa (a–c) and 200 hPa (d–f) wind speed anomaly, compared to the aerosol-only run (anomaly being aerosol-with-2 × CO2 – aerosol only), for a range of absorbing aerosol forcing values. Areas of high orography are masked in grey. Stippling shows where the anomaly exceeds double the JJA interannual variability.
The effect of the combined forcing is to further weaken the large-scale circulation with respect to the aerosol-only run. In particular, there is a additional weakening of the low-level southwesterly wind (Fig. 11a–c), reducing the moisture influx from the Arabian Sea to India. At mid-levels (not shown), the anti-cyclonic wind over the Middle East is stronger in the aerosol-with-2 × CO2 simulation than the aerosol-only simulations, corresponding to an area of high pressure. Figure 11d–f, for the high level wind field, shows a further weakening of the tropical easterly jet compared to the aerosol-only run. On the other hand, there is a slight strengthening of the westerly subtropical jet (located between 30–45∘ N), likely related to the warmer mid-tropospheric temperatures in the aerosol-with-2 × CO2 simulation and associated increase in meridional temperature gradient in the upper troposphere/lower stratosphere. There are no statistically significant changes in the vertical velocity for the aerosol-with-2 × CO2 simulation compared to the aerosol-only simulation, as shown by the lack of stippling in Fig. S12.
4.1 Summary and discussion
In general, greenhouse gases act to warm the surface temperature, enabling greater moisture uptake of the atmosphere and leading to enhanced rainfall (e.g. Douville et al., 2000; Ueda et al., 2006; Held and Soden, 2006; Cherchi et al., 2011; Samset et al., 2018; Cao et al., 2022), while aerosols are responsible for cooling and drying trends (Monerie et al., 2022; Cao et al., 2022). We find that enhanced carbon dioxide levels act to partially mitigate the effect of imposed absorbing aerosol forcing, although the effects of the absorbing aerosol forcing dominate, in agreement with Cao et al. (2022). Compared to the aerosol-only simulation, the aerosol-with-2 × CO2 simulation is warmer at the surface and aloft, has a significantly higher amount of precipitable water and slightly higher precipitation, weaker low-level winds and tropical easterly jet, but a stronger westerly subtropical jet.
Table 2Slopes for Fig. 9, taken as a linear fit for the ranges 0–60 and 60–80 W m−2 absorbing aerosol forcing, for the aerosol-with-2 × CO2 simulation.
Referring back to Fig. 9, the area-averaged convective precipitation in the aerosol-with-2 × CO2 simulation (dashed lines) is slightly higher than in the aerosol-only simulation, but otherwise follows a similar pattern, with eastern China showing the highest sensitivity to the combined forcing and greatest rate change between 0–60 and 60–80 W m−2 (Table 2). On the other hand, the amount of precipitable water is much greater when the carbon dioxide levels are doubled. The precipitable water increases slightly between 0–60 and 60–80 W m−2 absorbing aerosol forcing (Table 2) for the aerosol-with-2 × CO2 run. Once again, we highlight the discrepancy between the precipitable water and the precipitation, noting that the elevated levels of precipitable water under combined absorbing aerosol and carbon dioxide forcing do not correspond to comparable increases in convective precipitation due to a reduction in the convective precipitation efficiency and the corresponding increase in static stability of the lower troposphere.
Another finding is that the difference between the two simulations, aerosol-with-2 × CO2 and aerosol only, depends only weakly on the value of the absorbing aerosol forcing. Considering Figs. 10 and 11 (and Figs. S8–S12), there is little difference in the three columns, which represent approximate forcings of 30, 60, and 90 W m−2. This indicates a fairly linear behaviour.
The competition between aerosol and greenhouse gas forcing with respect to the South Asian and East Asian monsoons has been explored in a range of modelling experiments (Samset et al., 2018; Wilcox et al., 2020; Zhou et al., 2020; Ayantika et al., 2021; Swaminathan et al., 2022; Monerie et al., 2022), yet the uncertainty in the forcing itself limits the degree to which the response can be constrained. Our results suggest that in the future the anticipated reduction in anthropogenic aerosol concentration may have a greater impact on monsoonal precipitation than the increase in greenhouse gases.
The previous experiments (Sects. 3 and 4) involved applying a radiative forcing simultaneously across three regions: India, Southeast Asia, and eastern China (as per Fig. 5). Several aspects of the monsoon response, such as the anomalous summer precipitation over northern India, merit further investigation. The method employed here is to apply the radiative forcing to each region separately in order to decompose the local and non-local effects of the forcing. This allows better understanding and attribution of the different spatial responses to specific areas of applied forcing. The focus is on an absorbing aerosol forcing value of 60 W m−2, which corresponds to an intense, yet not physically unreasonable, forcing.
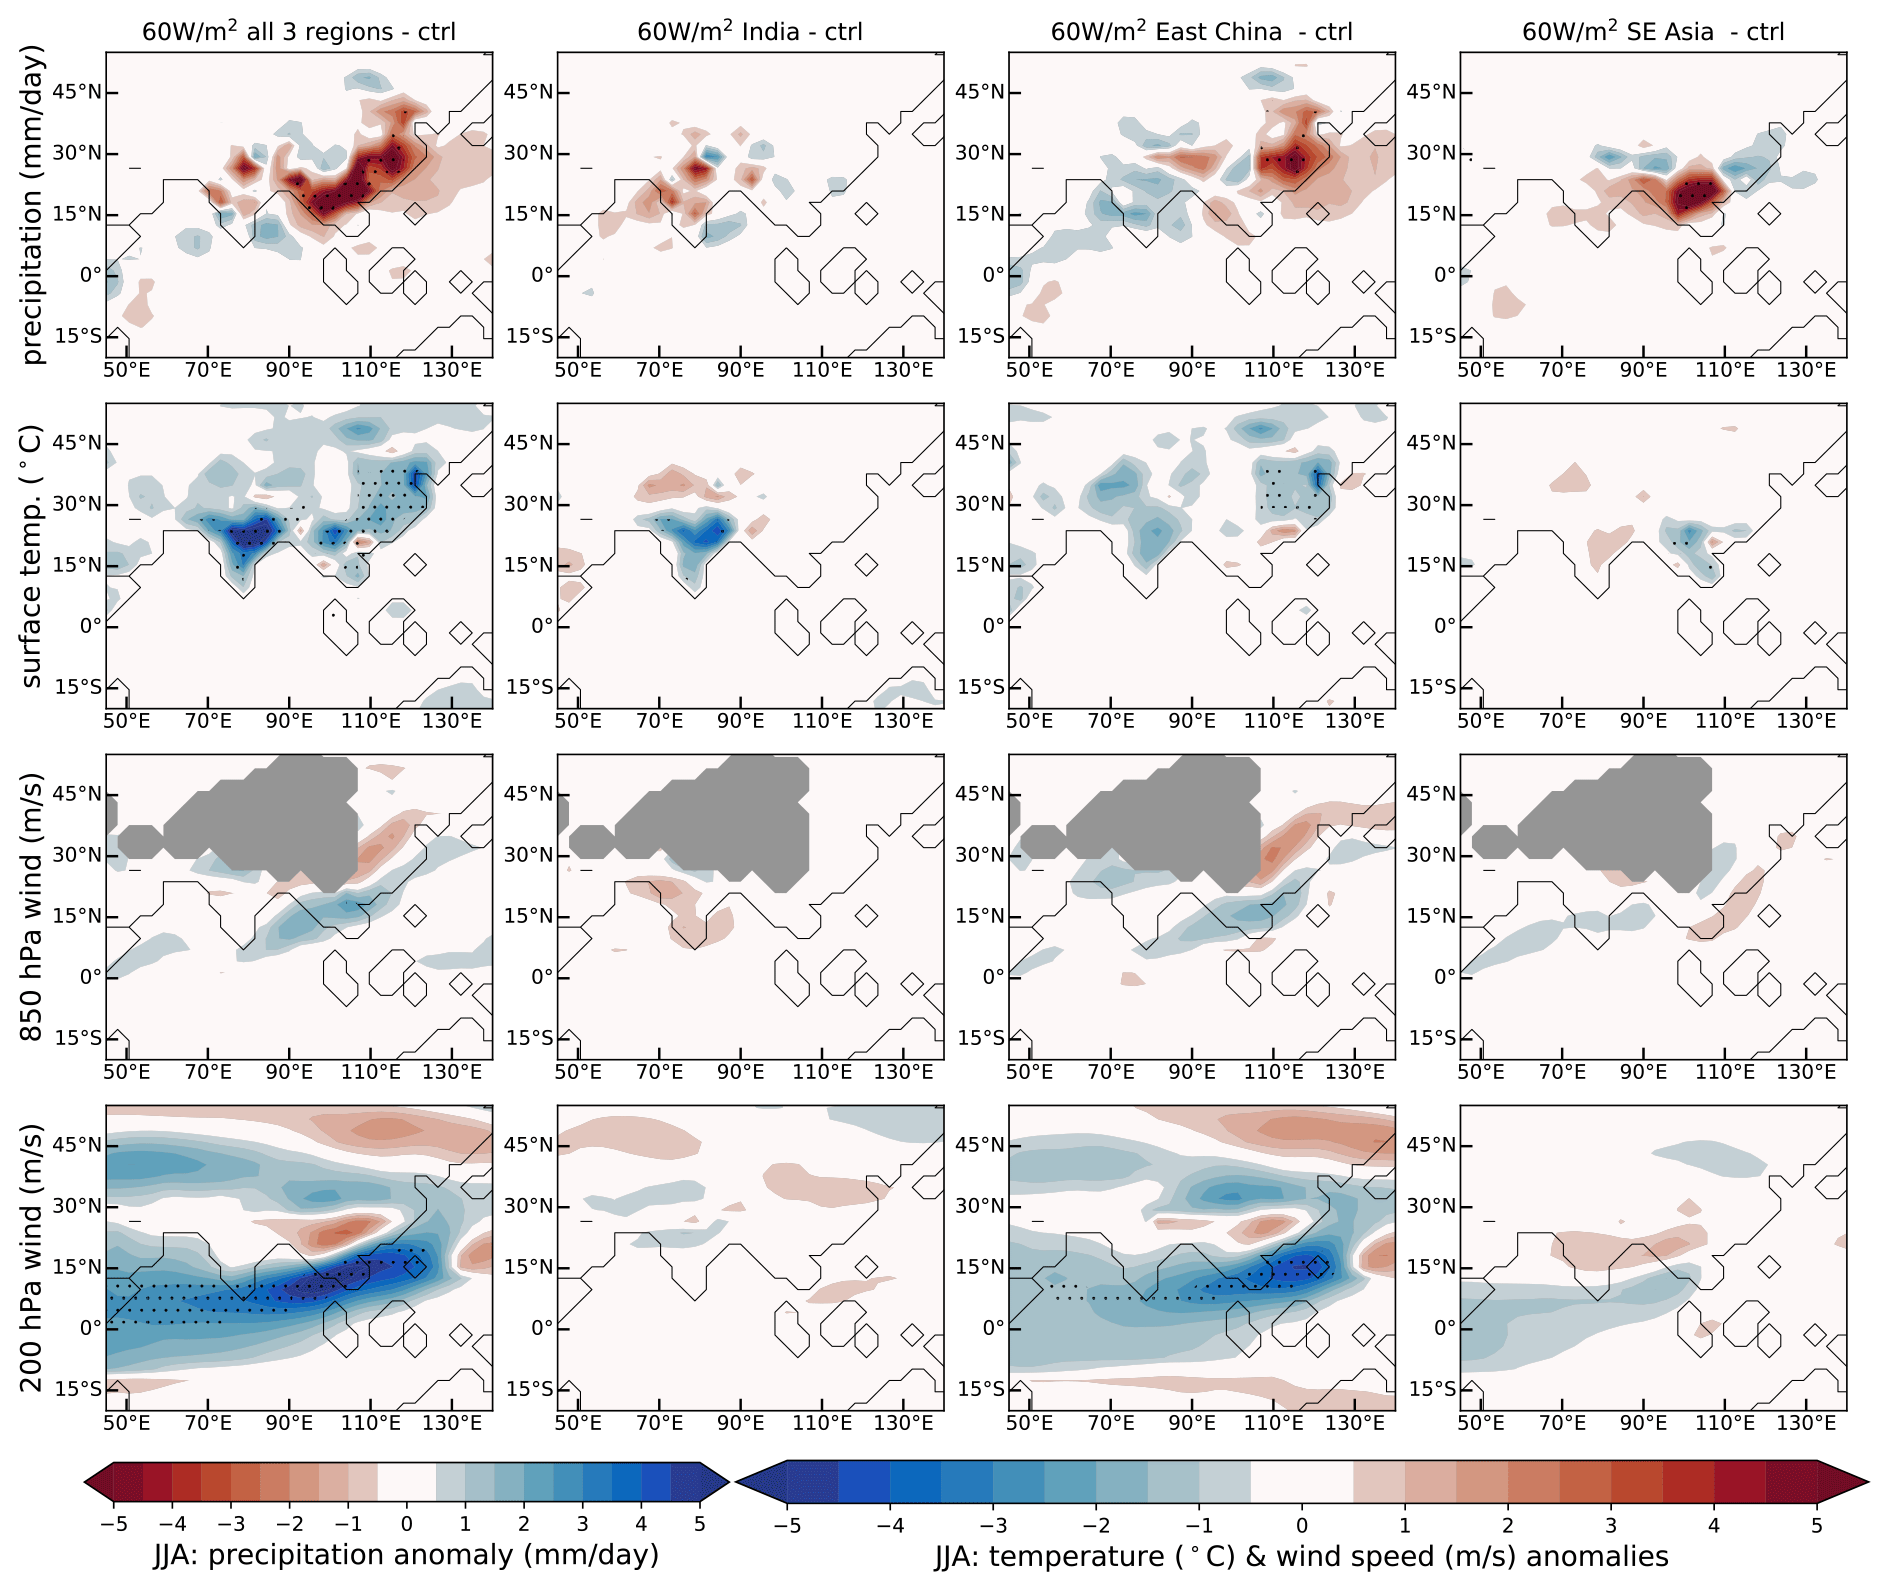
Figure 12Impact of applying 60 W m−2 absorbing aerosol forcing in turn to regions of India, Southeast Asia, and eastern China. The 100-year June–July–August mean anomaly of labelled variables compared to the control run is shown. Areas of high orography are masked in grey. Stippling shows where the anomaly exceeds double the JJA interannual variability.
Figure 12 shows the precipitation, surface temperature, and wind speed anomalies with respect to the control run for simulations with forcing applied to all regions (first column), India (second column), eastern China (third column), and Southeast Asia (fourth column). The JJA results are averaged over a 100-year period. The local effects of applying the absorbing aerosol forcing are similar for each region; namely, cooler surface temperatures and a reduction in precipitation. Over eastern China and Southeast Asia, the changes in precipitation are statistically significant, while the local reduction in surface temperature is statistically significant for all regions. Although there is a reduction in precipitation over India under locally applied forcing, it does not show as significant due to the high interannual variability of summer rainfall for the Indian region.
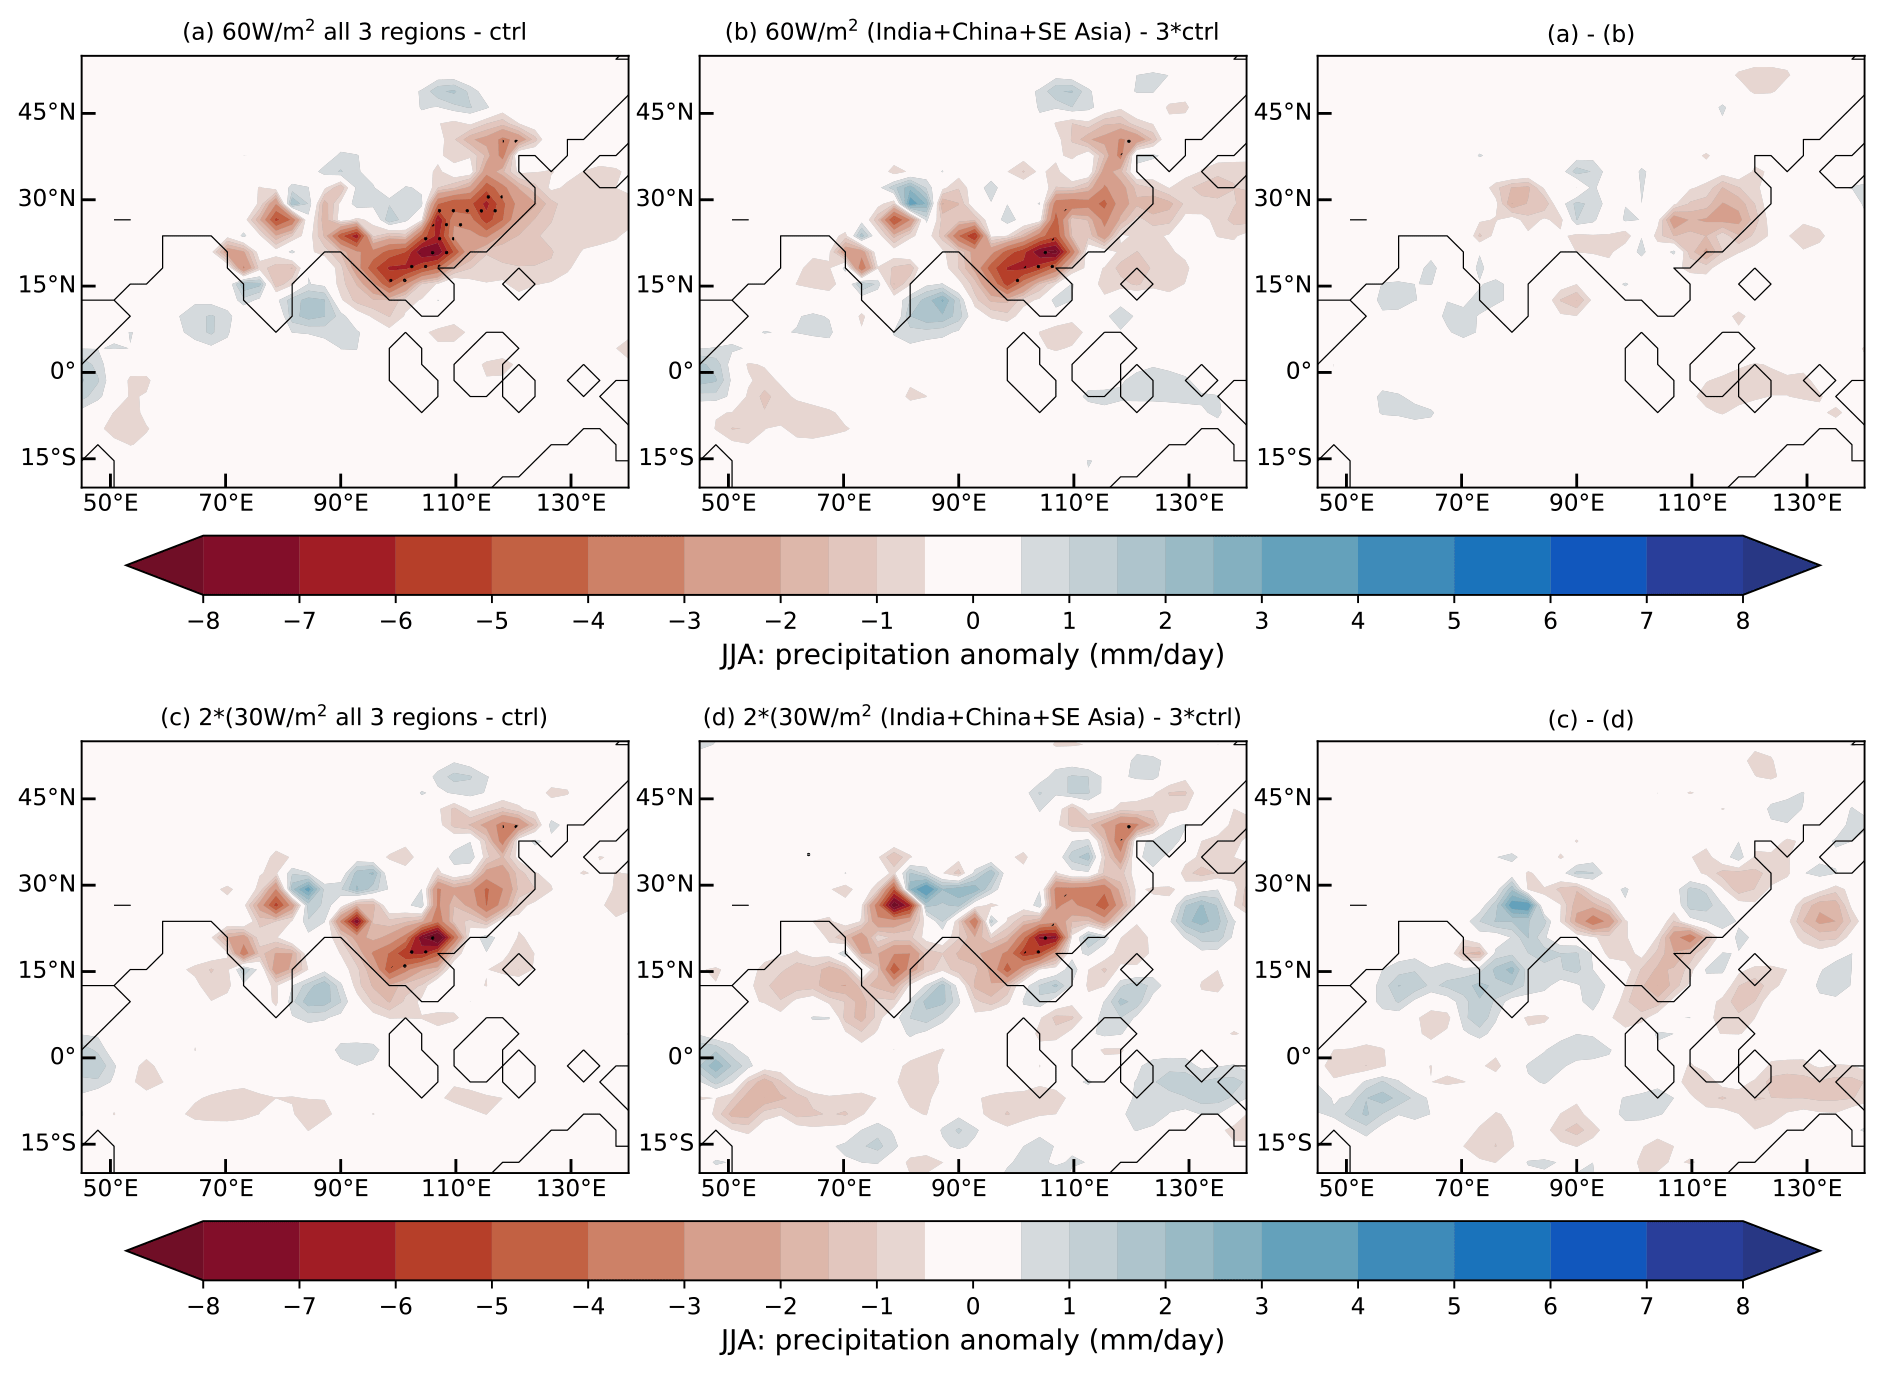
Figure 13Precipitation, taken as 100-year June–July–August average, for 60 W m−2 (a, b) and 30 W m−2 (c, d) absorbing aerosol forcing, where the latter has been scaled by a factor of 2. Panels (a, c) are the anomaly against control of simultaneously forcing all three regions. Panels (b, d) are the anomaly against control of the linear combination of separately forced regions (India, East China and Southeast Asia). Panels (a)–(b) and (c)–(d) are the differences between simultaneously forced regions (a, c) and a linear combination of individually forced regions (b, d). Stippling is where the anomaly exceeds double the JJA interannual variability of the control simulation.
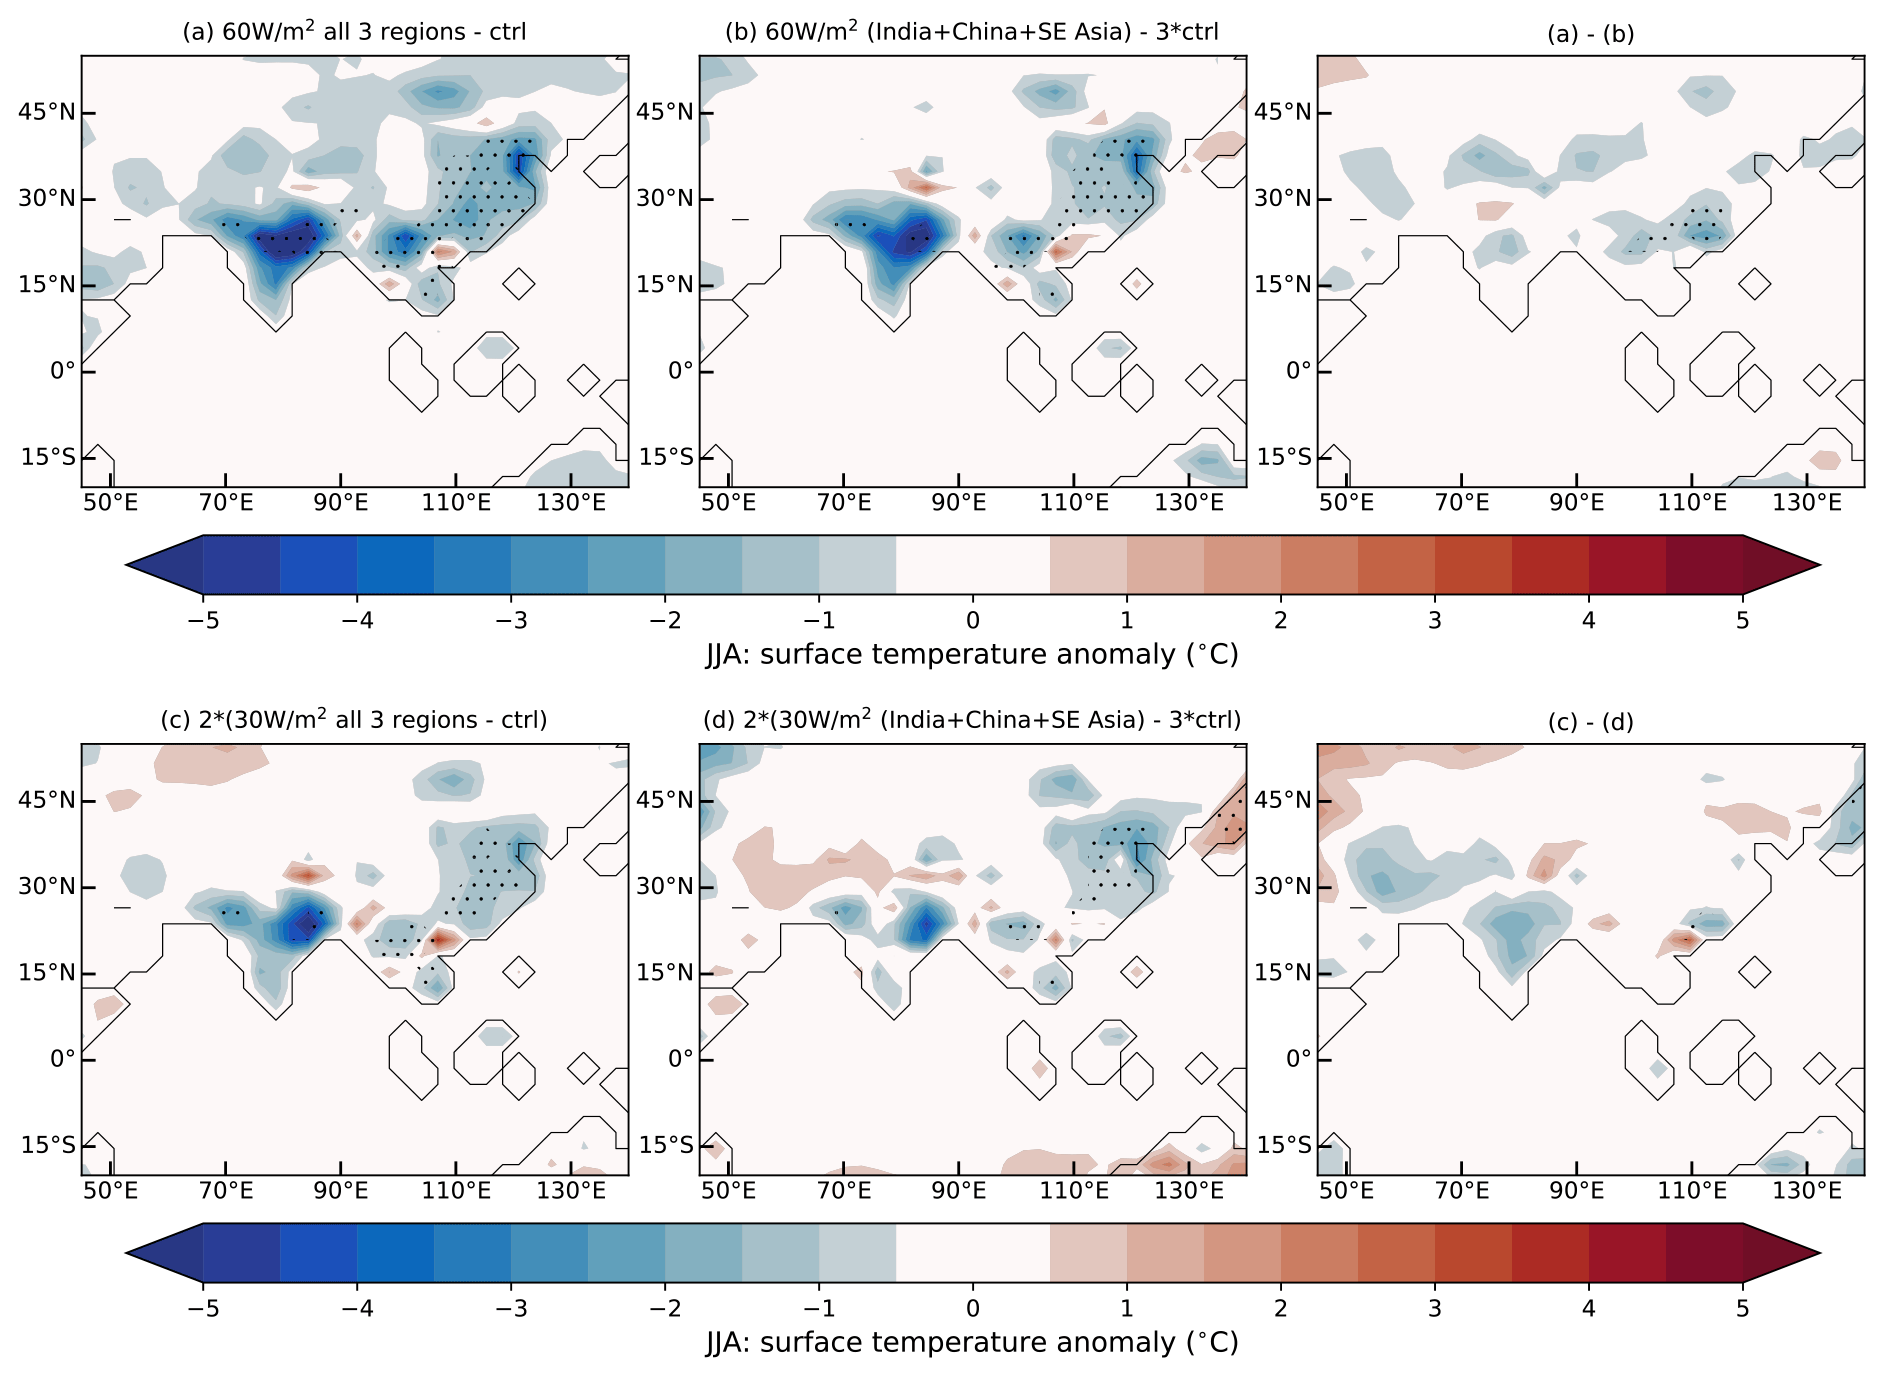
Figure 14Surface temperature, taken as 100-year June–July–August average, for 60 W m−2 (a, b) and 30 W m−2 (c, d) absorbing aerosol forcing, where the latter has been scaled by a factor of 2. Panels (a, c) are the anomaly against control of simultaneously forcing all three regions. Panels (b, d) are the anomaly against control of the linear combination of separately forced regions (India, East China and Southeast Asia). Panels (a)–(b) and (c)–(d) are the differences between simultaneously forced regions (a, c) and a linear combination of individually forced regions (b, d). Stippling is where the anomaly exceeds double the JJA interannual variability of the control simulation.
The strongest non-local effects are observed when applying forcing over eastern China, which leads to a slight reduction in surface temperature and a slight increase in precipitation over India (Fig. 12, top two rows). The precipitation response of India to forcing applied over eastern China is nearly as strong as when the forcing is applied locally, albeit with opposing trends. This results in net change of nearly zero for the precipitation over India at 60 W m−2 forcing, as seen in Fig. 6 (top row) and discussed in Sect. 3. Similar asymmetry in the teleconnection between eastern China and India in relation to local absorbing aerosol forcing has been shown in Herbert et al. (2022). There is a reasonably well-established link between the Indian monsoon and China, via the Silk Road pattern, which is associated with eastward-propagating upper-level Rossby waves (Enomoto et al., 2003; Ding and Wang, 2005; Chakraborty et al., 2014; Boers et al., 2019). However, our case seems to be the reverse, with the effects from forcing over eastern China propagating westwards towards India. Thus, further study is required to fully understand the underlying mechanisms.
In terms of the low-level circulation (Fig. 12, third row), applying forcing to India leads to a slight increase in wind speed from the west coast to central India. Applying forcing to Southeast Asia causes a slight reduction in the low-level monsoon flow from the Arabian Sea to India, while applying forcing to eastern China causes a reduction in the low-level flow from the Bay of Bengal to Southeast Asia and an increase from eastern China to northeastern China. At high levels (Fig. 12, fourth row), forcing in Southeast Asia or eastern China induces an increase in the westerly subtropical jet speed and a decrease in the tropical easterly jet wind speed. The change in the tropical easterly jet is statistically significant when applying the forcing to eastern China.
Generally, the local response to regionally applied absorbing aerosol forcing is consistent with the response to the large-scale forcing (Sect. 3). India is the most sensitive to remote forcing, with the local precipitation, surface temperature, and circulation being affected when forcing is applied to eastern China. We find that for Southeast Asia and eastern China, applying the absorbing aerosol forcing locally gives the greatest response, while for India, the responses to local and remote forcing are comparable. This is in agreement with Sherman et al. (2021) and Chakraborty et al. (2014), who note the importance of both Chinese and Indian emissions on precipitation over India, but in disagreement with Bollasina et al. (2014) and Undorf et al. (2018), who suggest prioritising the influence of local aerosol sources. On the other hand, Guo et al. (2016) find that the biggest contributors to precipitation changes over India are from remote sources. Uncertainty in future emissions scenarios, in terms of location and intensity, remains a barrier to predicting the response of the South Asian and East Asian monsoons.
Table 3Values of area-averaged surface temperature anomalies (∘C) at 30 and 60 W m−2 absorbing aerosol forcing for different regions (rows) and model simulations (columns). Values are taken as 100-year June–July–August averages.
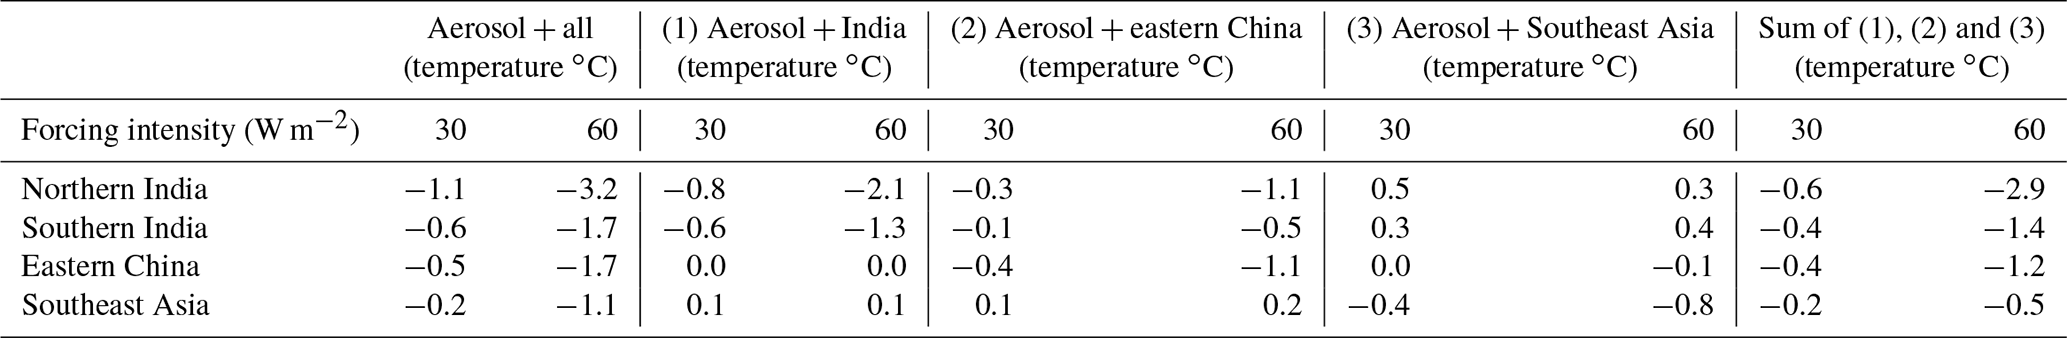
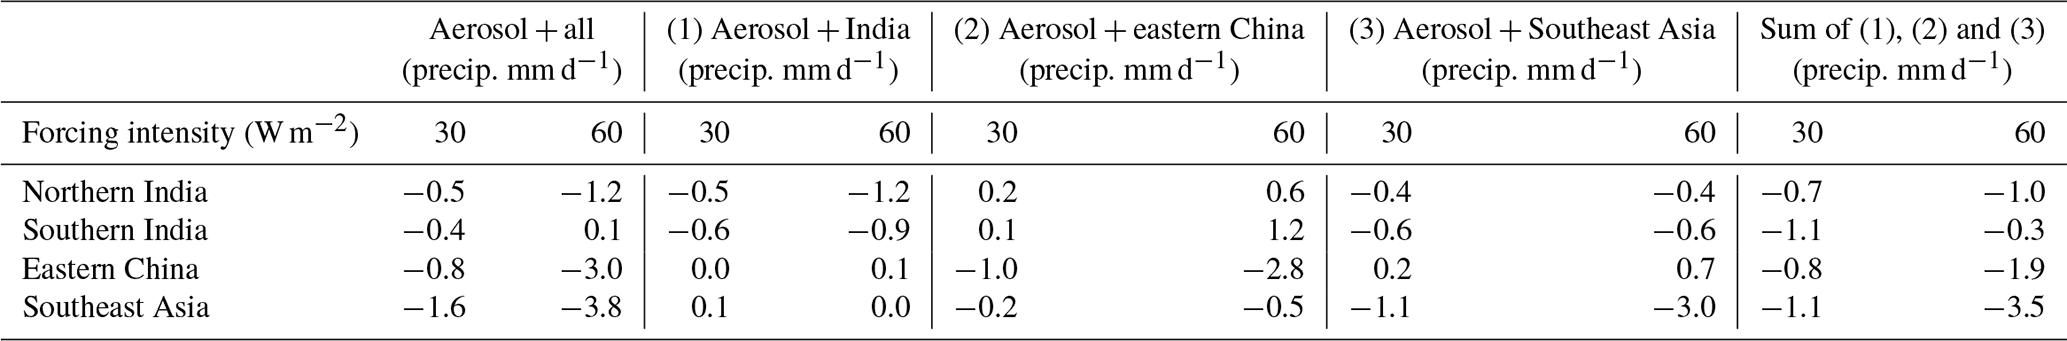
Table 4Values of area-averaged precipitation anomalies (mm d−1) at 30 and 60 W m−2 absorbing aerosol forcing for different regions (rows) and model simulations (columns). Values are taken as 100-year June–July–August averages.
5.1 Linearity of the response
We investigate the response to linearly combining the separately forced regions of India, Southeast Asia, and eastern China, (Sect. 5) against the response to forcing all regions simultaneously. Absorbing aerosol forcings of intensity 60 W m−2 (medium) and 30 W m−2 (low) are considered, where the latter has been scaled by a factor of 2 for easier visual comparison.
Looking at Figs. 13 and 14, the first two columns (60 W m−2) and the first two rows (2×30 W m−2), are qualitatively similar. Tables 3 and 4 further quantify the linearity of the response, presenting the regionally averaged JJA surface temperature anomalies (Table 3) and regionally averaged JJA precipitation anomalies (Table 4). We can compare values from the simulation with 60 W m−2 absorbing aerosol loading across all regions simultaneously against the simulations where the 60 W m−2 absorbing aerosol forcing was applied to a single region at a time. The response of simultaneously forced regions is marginally stronger, with slightly cooler surface temperatures and less precipitation than the linear combination of the responses to forcing each region independently. Statistically, there is little difference in the precipitation response between simultaneously forced and linearly combined independently forced regions (shown by lack of stippling in third column of Fig. 13). Similarly, there is little difference in the response between 60 W m−2 and 2×30 W m−2. In Sect. 4, we noted that the response of variables between 30, 60, and 90 W m−2 was comparable. Generally, there is a fair degree of linearity in the response in terms of forcing intensity and combinations of forcing regions.
These results are in contrast to Herbert et al. (2022), who found a non-linear response when northern India and eastern China were forced separately, compared to being forced simultaneously. Their experiments were also conducted using an intermediate-complexity climate model, with an approximate treatment of scattering and absorbing aerosols, but considered the effects of removing them rather than adding them. The differences are likely related to the areas of applied forcing; Herbert et al. (2022) apply aerosol forcing to a limited region along the north boundary of India, while we apply aerosol forcing across the entirety of India. The limited region of application by Herbert et al. (2022) may elicit stronger orographic and advective effects, leading to a greater degree of non-linearity in the response. On the other hand, Shindell et al. (2012) noted generally linear responses of summer precipitation to forcing combinations involving aerosols and greenhouse gases across zonally averaged latitudinal bands. Similarly, on a global scale, Gillett et al. (2004) find no evidence of non-linearity in the combination of responses to greenhouse gases and sulfate aerosols with the HadCM2 model. Guo et al. (2016) find that the reduction in precipitation across Southeast Asia due to higher global sulfur dioxide emissions is comparable to the linear combination of precipitation from simulations that consider local and remote sources of sulfur dioxide independently. However, a similar linearity is not observed in the response to increases in black carbon aerosols. Further work is required to quantify the linearity in response to aerosol forcing across different models and how model biases can impact the results.
The strength of the South Asian and East Asian monsoons is largely determined by processes affecting the sea surface temperature, greenhouse gases, and aerosols. Here, we have conducted a parametric study with an intermediate-complexity climate model to assess the roles of absorbing aerosol and greenhouse gas forcing on the South Asian and East Asian monsoons. In addition, we have identified the level of regional forcing at which the monsoon system breaks down in terms of a significant reduction in precipitation.
Absorbing aerosol forcing, which we apply through a combination of mid-tropospheric heating and surface cooling in our model, causes decreasing surface temperatures, mid-level warming, weakening circulation, and a reduction in (convective) precipitation. As the forcing increases, the precipitation declines much faster than the precipitable water, indicating that it is due to a lack of precipitation efficiency related to changes in the stratification of the atmosphere, rather than due to a lack of moisture. Advection of dry air from eastern China leads to a reduction in precipitation in eastern Siberia, which is outside of the area being forced. On removal of the absorbing aerosol forcing, we find that the monsoon system recovers fully, indicating that there is no hysteresis in our model simulations. Doubling carbon dioxide concentration partially mitigates the effects of the absorbing aerosol forcing, through warmer surface temperatures enabling greater moisture take-up, but further weakens the large-scale circulation. We find that, when considering realistic ranges of applied forcings, the precipitation response is more sensitive to absorbing aerosol than greenhouse gas forcing, highlighting the importance of air quality policies and the impact they can have on the future state of the South Asian and East Asian monsoons.
The strongest regional responses, particularly in regards to the circulation, are attributed to absorbing aerosol loading over eastern China. Although the precipitation decline for each region directly corresponds to applying forcing to that region, there is a remote connection between eastern China and India. Forcing applied to eastern China leads to a slight increase in precipitation over India, which is in contrast with the response when forcing is applied to India. When both regions are forced simultaneously, there is a reduction in precipitation over India, but the reduction is much less than for Southeast Asia or eastern China. Comparing simulations where the regions have been forced separately to the simulation where the regions have been forced simultaneously, the results are qualitatively similar, indicating a fair degree of linearity in the response.
We have characterised regional regimes in terms of area-averaged precipitation, precipitable water, and surface temperature. India is separated into northern and southern regions due to the significant variance in their responses. Southern India is the least affected region, likely due to its peninsular nature. The precipitation response of northern India and Southeast Asia to increasing absorbing aerosol forcing is an approximately linear decline, with Southeast Asia showing a stronger negative sensitivity than northern India. For eastern China, there is an sharp transition at around 60 W m−2 to a regime where the precipitation is close to zero, indicating tipping behaviour. In terms of the precipitable water, it remains relatively constant for all regions until 60 W m−2; thereafter the precipitable water linearly declines with further increases in forcing. The surface temperature behaves similarly to the precipitable water but becomes much more sensitive to the forcing beyond 60 W m−2 and declines non-linearly.
We note the importance of aerosol loading over eastern China and the competition between aerosol loading over India in determining the response of the Indian region to future climate scenarios. At approximately 60 W m−2 of absorbing aerosol forcing, there is a clear transition from a high-precipitation regime to a low-precipitation regime for the eastern China region, while Southeast Asia and southern India show a more gradual linear decline in precipitation with increasing forcing. There is a compensating effect from eastern China absorbing aerosol forcing on precipitation over India, resulting in a lesser decline of precipitation over India compared with Southeast Asia or eastern China. For area-averaged precipitable water and surface temperature, there is transition at around 60 W m−2 for all regions from near-constant to decreasing levels. To maintain a safe operating space for the South Asian and East Asian monsoons, our results suggest keeping the absorbing aerosol forcing below 60 W m−2 through air quality policies and collaboration between Asian countries.
Our results are limited by the low resolution and lack of explicit aerosol interactions and chemistry, but future work will aim to address these issues by repeating similar experiments using a more complex global climate model. We would consider the effects of scattering aerosols and absorbing aerosols, both in combination and in isolation. Additionally, we would like to investigate the impact of applying forcing over a shorter seasonal period rather than perennially, particularly with regard to pre-monsoon conditions and the frequency of extreme weather events.
The model version used in this paper is available on GitHub (not including the aerosol forcing modifications): https://github.com/jhardenberg/PLASIM (last access: 22 June 2023; https://doi.org/10.5281/zenodo.4041462, Shifter et al., 2020).
The model data used to make the figures in this paper are publicly available on Figshare: https://doi.org/10.6084/m9.figshare.23554896.v1 (Recchia and Lucarini, 2023).
The supplement related to this article is available online at: https://doi.org/10.5194/esd-14-697-2023-supplement.
LGR and VL wrote the paper. VL designed the simulations, and LGR and performed the analysis.
The contact author has declared that neither of the authors has any competing interests.
Publisher's note: Copernicus Publications remains neutral with regard to jurisdictional claims in published maps and institutional affiliations.
We thank Frank Lunkeit, Shabeh ul Hasson, Milind Mujumdar, and Laura Wilcox for their contributions and insight. We thank Thomas F. Stocker for suggesting this line of research, and we thank the three reviewers for their constructive comments, which have substantially improved this paper.
This project is TiPES contribution no. 186. This project has received funding from the European Union's Horizon 2020 research and innovation programme under grant agreement no. 820970. Valerio Lucarini was also supported by the EPSRC through grant no. EP/T018178/1.
This paper was edited by Gabriele Messori and reviewed by three anonymous referees.
Almazroui, M., Saeed, S., Saeed, F., Islam, M. N., and Ismail, M.: Projections of precipitation and temperature over the South Asian countries in CMIP6, Earth Systems and Environment, 4, 297–320, https://doi.org/10.1007/s41748-020-00157-7, 2020. a, b
Annamalai, H., Taguchi, B., McCreary, J. P., Nagura, M., and Miyama, T.: Systematic Errors in South Asian Monsoon Simulation: Importance of Equatorial Indian Ocean Processes, J. Climate, 30, 8159–8178, https://doi.org/10.1175/JCLI-D-16-0573.1, 2017. a
Ayantika, D. C., Krishnan, R., Singh, M., Swapna, P., Sandeep, N., Prajeesh, A. G., and Vellore, R.: Understanding the combined effects of global warming and anthropogenic aerosol forcing on the South Asian monsoon, Clim. Dynam., 56, 1643–1662, https://doi.org/10.1007/s00382-020-05551-5, 2021. a, b, c
Boers, N., Goswami, B., Rheinwalt, A., Bookhagen, B., Hoskins, B., and Kurths, J.: Complex networks reveal global pattern of extreme-rainfall teleconnections, Nature, 566, 373–377, https://doi.org/10.1038/s41586-018-0872-x, 2019. a, b
Bollasina, M. A., Ming, Y., and Ramaswamy, V.: Anthropogenic aerosols and the weakening of the South Asian summer monsoon, Science, 334, 502–505, https://doi.org/10.1126/science.1204994, 2011. a, b
Bollasina, M. A., Ming, Y., Ramaswamy, V., Schwarzkopf, M. D., and Naik, V.: Contribution of local and remote anthropogenic aerosols to the twentieth century weakening of the South Asian Monsoon, Geophys. Res. Lett., 41, 680–687, https://doi.org/10.1002/2013GL058183, 2014. a
Boos, W. R. and Storelvmo, T.: Near-linear response of mean monsoon strength to a broad range of radiative forcings, P. Natl. Acad. Sci. USA, 113, 1510–1515, https://doi.org/10.1073/pnas.1517143113, 2016. a, b
Boschi, R. and Lucarini, V.: Water Pathways for the Hindu-Kush-Himalaya and an Analysis of Three Flood Events, Atmosphere, 10, 489, https://doi.org/10.3390/atmos10090489, 2019. a, b
Boschi, R., Lucarini, V., and Pascale, S.: Bistability of the climate around the habitable zone: A thermodynamic investigation, Icarus, 226, 1724–1742, https://doi.org/10.1016/j.icarus.2013.03.017, 2013. a
Cao, J., Wang, H., Wang, B., Zhao, H., Wang, C., and Zhu, X.: Higher Sensitivity of Northern Hemisphere Monsoon to Anthropogenic Aerosol Than Greenhouse Gases, Geophys. Res. Lett., 49, e2022GL100270, https://doi.org/10.1029/2022GL100270, 2022. a, b, c, d, e
Chakraborty, A., Satheesh, S. K., Nanjundiah, R. S., and Srinivasan, J.: Impact of absorbing aerosols on the simulation of climate over the Indian region in an atmospheric general circulation model, Ann. Geophys., 22, 1421–1434, https://doi.org/10.5194/angeo-22-1421-2004, 2004. a, b
Chakraborty, A., Nanjundiah, R. S., and Srinivasan, J.: Local and remote impacts of direct aerosol forcing on Asian monsoon, Int. J. Climatol., 34, 2108–2121, https://doi.org/10.1002/joc.3826, 2014. a, b, c
Chen, Z., Zhou, T., Zhang, L., Chen, X., Zhang, W., and Jiang, J.: Global Land Monsoon Precipitation Changes in CMIP6 Projections, Geophys. Res. Lett., 47, e2019GL086902, https://doi.org/10.1029/2019GL086902, 2020. a
Cherchi, A., Alessandri, A., Masina, S., and Navarra, A.: Effects of increased CO2 levels on monsoons, Clim. Dynam., 37, 83–101, https://doi.org/10.1007/s00382-010-0801-7, 2011. a, b
Chou, C., Ryu, D., Lo, M.-H., Wey, H.-W., and Malano, H. M.: Irrigation-Induced Land–Atmosphere Feedbacks and Their Impacts on Indian Summer Monsoon, J. Climate, 31, 8785–8801, https://doi.org/10.1175/JCLI-D-17-0762.1, 2018. a
Choudhury, B. A., Rajesh, P. V., Zahan, Y., and Goswami, B. N.: Evolution of the Indian summer monsoon rainfall simulations from CMIP3 to CMIP6 models, Clim. Dynam., 58, 2637–2662, https://doi.org/10.1007/s00382-021-06023-0, 2022. a, b
Copernicus Climate Change Service: ERA5: Fifth generation of ECMWF atmospheric reanalyses of the global climate, Copernicus Climate Change Service Climate Data Store (CDS), https://cds.climate.copernicus.eu/cdsapp#!/home (last access: 5 May 2020), 2017. a, b, c, d, e
Ding, Q. and Wang, B.: Circumglobal Teleconnection in the Northern Hemisphere Summer, J. Climate, 18, 3483–3505, https://doi.org/10.1175/JCLI3473.1, 2005. a, b
Dong, B., Wilcox, L. J., Highwood, E. J., and Sutton, R. T.: Impacts of recent decadal changes in Asian aerosols on the East Asian summer monsoon: roles of aerosol-radiation and aerosol-cloud interactions, Clim. Dynam., 53, 3235–3256, https://doi.org/10.1007/s00382-019-04698-0, 2019. a, b
Douville, H., Royer, J. F., Polcher, J., Cox, P., Gedney, N., D. B., S., and P. J., V.: Impact of CO2 Doubling on the Asian Summer Monsoon: Robust Versus Model-Dependent Responses, J. Meteorol. Soc. Jpn Ser. II, 78, 421–439, https://doi.org/10.2151/jmsj1965.78.4_421, 2000. a, b
Duque-Villegas, M., Salazar, J. F., and Rendón, A. M.: Tipping the ENSO into a permanent El Niño can trigger state transitions in global terrestrial ecosystems, Earth Syst. Dynam., 10, 631–650, https://doi.org/10.5194/esd-10-631-2019, 2019. a
Enomoto, T., Hoskins, B. J., and Matsuda, Y.: The formation mechanism of the Bonin high in August, Q. J. Roy. Meteor. Soc., 129, 157–178, https://doi.org/10.1256/qj.01.211, 2003. a, b
Fadnavis, S., Sabin, T. P., Rap, A., Müller, R., Kubin, A., and Heinold, B.: The impact of COVID-19 lockdown measures on the Indian summer monsoon, Environ. Res. Lett., 16, 074054, https://doi.org/10.1088/1748-9326/ac109c, 2021. a, b
Fraedrich, K., Jansen, H., Kirk, E., Luksch, U., and Lunkeit, F.: The Planet Simulator: Towards a user friendly model, Meteorologische Z., 14, 299–304, https://doi.org/10.1127/0941-2948/2005/0043, 2005. a, b
Francis, P. A. and Gadgil, S.: Intense rainfall events over the west coast of India, Meteorol. Atmos. Phys., 94, 27–42, https://doi.org/10.1007/s00703-005-0167-2, 2006. a
Francis, P. A. and Gadgil, S.: Towards understanding the unusual Indian monsoon in 2009, J. Earth Syst. Sci., 119, 397–415, https://doi.org/10.1007/s12040-010-0033-6, 2010. a
Gadgil, S. and Gadgil, S.: The Indian Monsoon, GDP and Agriculture, Econ. Polit. Weekly, 41, 4887–4895, 2006. a
Gadgil, S., Srinivasan, J., Nanjundiah, R. S., Krishna Kumar, K., Munot, A. A., and Rupa Kumar, K.: On forecasting the Indian summer monsoon: the intriguing season of 2002, Current Science, 83, 394–403, 2002. a
Galfi, V. M. and Lucarini, V.: Fingerprinting Heatwaves and Cold Spells and Assessing Their Response to Climate Change Using Large Deviation Theory, Phys. Rev. Lett., 127, 058701, https://doi.org/10.1103/PhysRevLett.127.058701, 2021. a
Ganguly, D., Rasch, P. J., Wang, H., and Yoon, J.-h.: Fast and slow responses of the South Asian monsoon system to anthropogenic aerosols, Geophys. Res. Lett., 39, L18804, https://doi.org/10.1029/2012GL053043, 2012. a
Garreaud, R. D., Molina, A., and Farias, M.: Andean uplift, ocean cooling and Atacama hyperaridity: A climate modeling perspective, Earth Planet. Sci. Lett., 292, 39–50, https://doi.org/10.1016/j.epsl.2010.01.017, 2010. a
Ghil, M. and Lucarini, V.: The physics of climate variability and climate change, Rev. Mod. Phys., 92, 035002, https://doi.org/10.1103/RevModPhys.92.035002, 2020. a
Gillett, N. P., Wehner, M. F., Tett, S. F. B., and Weaver, A. J.: Testing the linearity of the response to combined greenhouse gas and sulfate aerosol forcing, Geophys. Res. Lett., 31, L14201, https://doi.org/10.1029/2004GL020111, 2004. a
Gómez-Leal, I., Kaltenegger, L., Lucarini, V., and Lunkeit, F.: Climate Sensitivity to Carbon Dioxide and the Moist Greenhouse Threshold of Earth-like Planets under an Increasing Solar Forcing, The Astrophysical Journal, 869, 129, https://doi.org/10.3847/1538-4357/aaea5f, 2018. a
Guo, L., Turner, A. G., and Highwood, E. J.: Local and remote impacts of aerosol species on Indian summer monsoon rainfall in a GCM, J. Climate, 29, 6937–6955, https://doi.org/10.1175/JCLI-D-15-0728.1, 2016. a, b, c
Gusain, A., Ghosh, S., and Karmakar, S.: Added value of CMIP6 over CMIP5 models in simulating Indian summer monsoon rainfall, Atmos. Res., 232, 104680, https://doi.org/10.1016/j.atmosres.2019.104680, 2020. a, b, c
Hazra, A., Taraphdar, S., Halder, M., Pokhrel, S., Chaudhari, H. S., Salunke, K., Mukhopadhyay, P., and Rao, S. A.: Indian summer monsoon drought 2009: role of aerosol and cloud microphysics, Atmos. Sci. Lett., 14, 181–186, https://doi.org/10.1002/asl2.437, 2013. a
He, C., Zhou, W., Li, T., Zhou, T., and Wang, Y.: East Asian summer monsoon enhanced by COVID-19, Clim. Dynam., 59, 2965–2978, https://doi.org/10.1007/s00382-022-06247-8, 2022. a
Held, I. M. and Soden, B. J.: Robust Responses of the Hydrological Cycle to Global Warming, J. Climate, 19, 5686–5699, https://doi.org/10.1175/JCLI3990.1, 2006. a, b, c
Herbert, R., Wilcox, L. J., Joshi, M., Highwood, E., and Frame, D.: Nonlinear response of Asian summer monsoon precipitation to emission reductions in South and East Asia, Environ. Res. Lett., 17, 014005, https://doi.org/10.1088/1748-9326/ac3b19, 2022. a, b, c, d, e, f, g
Holden, P. B., Edwards, N. R., Garthwaite, P. H., Fraedrich, K., Lunkeit, F., Kirk, E., Labriet, M., Kanudia, A., and Babonneau, F.: PLASIM-ENTSem v1.0: a spatio-temporal emulator of future climate change for impacts assessment, Geosci. Model Dev., 7, 433–451, https://doi.org/10.5194/gmd-7-433-2014, 2014. a
Holden, P. B., Edwards, N. R., Fraedrich, K., Kirk, E., Lunkeit, F., and Zhu, X.: PLASIM–GENIE v1.0: a new intermediate complexity AOGCM, Geosci. Model Dev., 9, 3347–3361, https://doi.org/10.5194/gmd-9-3347-2016, 2016. a, b
Intergovermental Panel on Climate Change (IPCC): IPCC Climate Change 2013: The Physical Science Basis. Contribution of Working Group I to the Fifth Assessment Report of the Intergovernmental Panel on Climate Change, edited by: Stocker, T. F., Qin, D., Plattner, G.-K., Tignor, M., Allen, S. K., Boschung, J., Nauels, A., Xia, Y., Bex, V., and Midgley, P. M., Cambridge University Press, https://www.ipcc.ch/report/ar5/wg1/ (last access: 4 Januar 2021), 2013. a
Intergovermental Panel on Climate Change (IPCC): IPCC, 2021: Climate Change 2021: The Physical Science Basis. Contribution of Working Group I to the Sixth Assessment Report of the Intergovernmental Panel on Climate Change, edited by: Masson-Delmotte, V., Zhai, P., Pirani, A., Connors, S. L., Péan, C., Berger, S., Caud, N., Chen, Y., Goldfarb, L., Gomis, M. I., Huang, M., Leitzell, K., Lonnoy, E., Matthews, J. B. R., Maycock, T. K., Waterfield, T., Yelekçi, O., Yu, R., and Zhou, B., Cambridge University Press, https://www.ipcc.ch/report/ar6/wg1/ (last access: 6 January 2022), 2021. a, b, c, d, e, f
Jiang, D., Hu, D., Tian, Z., and Lang, X.: Differences between CMIP6 and CMIP5 Models in Simulating Climate over China and the East Asian Monsoon, Adv. Atmos. Sci., 37, 1102–1118, https://doi.org/10.1007/s00376-020-2034-y, 2020. a, b
Katzenberger, A., Schewe, J., Pongratz, J., and Levermann, A.: Robust increase of Indian monsoon rainfall and its variability under future warming in CMIP6 models, Earth Syst. Dynam., 12, 367–386, https://doi.org/10.5194/esd-12-367-2021, 2021. a
Khadka, D., Babel, M. S., Abatan, A. A., and Collins, M.: An evaluation of CMIP5 and CMIP6 climate models in simulating summer rainfall in the Southeast Asian monsoon domain, Int. J. Climatol., 42, 1181–1202, https://doi.org/10.1002/joc.7296, 2022. a, b, c
Kitoh, A.: The Asian Monsoon and its Future Change in Climate Models: A Review, J. Meteorol. Soc. Jpn. Ser. II, 95, 7–33 https://doi.org/10.2151/jmsj.2017-002, 2017. a
Konda, G. and Vissa, N. K.: Evaluation of CMIP6 models for simulations of surplus/deficit summer monsoon conditions over India, Clim. Dynam., 60, 1023–1042, https://doi.org/10.1007/s00382-022-06367-1, 2023. a, b
Kovilakam, M. and Mahajan, S.: Confronting the “Indian summer monsoon response to black carbon aerosol” with the uncertainty in its radiative forcing and beyond, J. Geophys. Res.-Atmos., 121, 7833–7852, https://doi.org/10.1002/2016JD024866, 2016. a, b
Kripalani, R., Ha, K.-J., Ho, C.-H., Oh, J.-H., Preethi, B., Mujumdar, M., and Prabhu, A.: Erratic Asian summer monsoon 2020: COVID-19 lockdown initiatives possible cause for these episodes?, Clim. Dynam., 59, 1339–1352, https://doi.org/10.1007/s00382-021-06042-x, 2022. a, b
Krishna Kumar, K., Rupa Kumar, K., Ashrit, R. G., Deshpande, N. R., and Hansen, J. W.: Climate impacts on Indian agriculture, Int. J. Climatol., 24, 1375–1393, https://doi.org/10.1002/joc.1081, 2004. a
Krishnamurti, T. N., Thomas, A., Simon, A., and Kumar, V.: Desert air incursions, an overlooked aspect, for the dry spells of the Indian summer monsoon, J. Atmos. Sci., 67, 3423–3441, https://doi.org/10.1175/2010JAS3440.1, 2010. a
Krishnan, R., Sanjay, J., Gnanaseelan, C., Mujumdar, M., Kulkarni, A., and Chakraborty, S.: Assessment of Climate Change over the Indian Region: A Report of the Ministry of Earth Sciences (MoES), Government of India, Springer Nature, https://doi.org/10.1007/978-981-15-4327-2, 2020. a, b
Kumar, S. and Devara, P. C. S.: A long-term study of aerosol modulation of atmospheric and surface solar heating over Pune, India, Tellus B, 64, 18420, https://doi.org/10.3402/tellusb.v64i0.18420, 2012. a
Lau, N.-C. and Nath, M. J.: A model study of the air–sea interaction associated with the climatological aspects and interannual variability of the south Asian summer monsoon development, J. Climate, 25, 839–857, https://doi.org/10.1175/JCLI-D-11-00035.1, 2012. a
Lau, W. K. M. and Kim, K.-M.: Observational relationships between aerosol and Asian monsoon rainfall, and circulation, Geophys. Res. Lett., 33, L21810, https://doi.org/10.1029/2006GL027546, 2006. a
Lau, W. K. M. and Kim, K.-M.: Fingerprinting the impacts of aerosols on long-term trends of the Indian summer monsoon regional rainfall, Geophys. Res. Lett., 37, L16705, https://doi.org/10.1029/2010GL043255, 2010. a
Lau, W. K.-M. and Kim, K.-M.: Competing influences of greenhouse warming and aerosols on Asian summer monsoon circulation and rainfall, Asia-Pacific J. Atmos. Sci., 53, 181–194, https://doi.org/10.1007/s13143-017-0033-4, 2017. a
Lee, S.-S., Chu, J.-E., Timmermann, A., Chung, E.-S., and Lee, J.-Y.: East Asian climate response to COVID-19 lockdown measures in China, Sci. Rep., 11, 1–9, https://doi.org/10.1038/s41598-021-96007-1, 2021. a
Lenton, T. M., Held, H., Kriegler, E., Hall, J. W., Lucht, W., Rahmstorf, S., and Schellnhuber, H. J.: Tipping elements in the Earth's climate system, P. Natl. Acad. Sci. USA, 105, 1786–1793, https://doi.org/10.1073/pnas.0705414105, 2008. a
Levermann, A., Schewe, J., Petoukhov, V., and Held, H.: Basic mechanism for abrupt monsoon transitions, P. Natl. Acad. Sci. USA, 106, 20572–20577, https://doi.org/10.1073/pnas.0901414106, 2009. a, b
Li, X., Ting, M., Li, C., and Henderson, N.: Mechanisms of Asian Summer Monsoon Changes in Response to Anthropogenic Forcing in CMIP5 Models, J. Climate, 28, 4107–4125, https://doi.org/10.1175/JCLI-D-14-00559.1, 2015. a, b
Li, Z., Lau, W. K.-M., Ramanathan, V., Wu, G., Ding, Y., Manoj, M. G., Liu, J., Qian, Y., Li, J., Zhou, T., Fan, J., Rosenfeld, D., Ming, Y., Wang, Y., Huang, J., Wang, B., Xu, X., Lee, S.-S., Cribb, M., Zhang, F., Yang, X., Zhao, C., Takemura, T., Wang, K., Xia, X., Yin, Y., Zhang, H., Guo, J., Zhai, P. M., Sugimoto, N., Babu, S. S., and Brasseur, G. P.: Aerosol and monsoon climate interactions over Asia, Rev. Geophys., 54, 866–929, https://doi.org/10.1002/2015RG000500, 2016. a
Liu, Y., Sun, J., and Yang, B.: The effects of black carbon and sulphate aerosols in China regions on East Asia monsoons, Tellus B, 61, 642–656, https://doi.org/10.1111/j.1600-0889.2009.00427.x, 2009. a
Lu, Q., Liu, C., Zhao, D., Zeng, C., Li, J., Lu, C., Wang, J., and Zhu, B.: Atmospheric heating rate due to black carbon aerosols: Uncertainties and impact factors, Atmos. Res., 240, 104891, https://doi.org/10.1016/j.atmosres.2020.104891, 2020. a
Lucarini, V., Fraedrich, K., and Lunkeit, F.: Thermodynamics of climate change: generalized sensitivities, Atmos. Chem. Phys., 10, 9729–9737, https://doi.org/10.5194/acp-10-9729-2010, 2010. a
Lucarini, V., Pascale, S., Boschi, R., Kirk, E., and Iro, N.: Habitability and Multistability in Earth-like Planets, Astron. Nachr., 334, 576–588, https://doi.org/10.1002/asna.201311903, 2013. a
Lucarini, V., Ragone, F., and Lunkeit, F.: Predicting Climate Change Using Response Theory: Global Averages and Spatial Patterns, J. Stat. Phys., 166, 1036–1064, https://doi.org/10.1007/s10955-016-1506-z, 2017. a, b
Lunkeit, F., Borth, H., Bottinger, M., Fraedrich, K., Jansen, H., Kirk, E., Kleidon, A., Luksch, U., Paiewonsky, P., Schubert, S., Sielmann, F., and Wan, H.: Planet Simulator Reference Manual, Version 16, Meteorological Institute of the University of Hamburg, Hamburg, Germany, https://www.mi.uni-hamburg.de/en/arbeitsgruppen/theoretische-meteorologie/modelle/plasim.html (last access: 5 April 2022), 2011. a, b
Margazoglou, G., Grafke, T., Laio, A., and Lucarini, V.: Dynamical landscape and multistability of a climate model, P. R. Soc. A, 477, 20210019, https://doi.org/10.1098/rspa.2021.0019, 2021. a
McKenna, S., Santoso, A., Gupta, A. S., Taschetto, A. S., and Cai, W.: Indian Ocean Dipole in CMIP5 and CMIP6: characteristics, biases, and links to ENSO, Sci. Rep., 10, 1–13, https://doi.org/10.1038/s41598-020-68268-9, 2020. a
Meehl, G. A., Arblaster, J. M., and Collins, W. D.: Effects of black carbon aerosols on the Indian monsoon, J. Climate, 21, 2869–2882, https://doi.org/10.1175/2007JCLI1777.1, 2008. a
Menon, A., Levermann, A., Schewe, J., Lehmann, J., and Frieler, K.: Consistent increase in Indian monsoon rainfall and its variability across CMIP-5 models, Earth Syst. Dynam., 4, 287–300, https://doi.org/10.5194/esd-4-287-2013, 2013. a
Mishra, A. K.: Observing a severe flooding over southern part of India in monsoon season of 2019, J. Earth Syst. Sci., 130, 1–8, https://doi.org/10.1007/s12040-020-01509-7, 2021. a
Monerie, P.-A., Wilcox, L. J., and Turner, A. G.: Effects of Anthropogenic Aerosol and Greenhouse Gas Emissions on Northern Hemisphere Monsoon Precipitation: Mechanisms and Uncertainty, J. Climate, 35, 2305–2326, https://doi.org/10.1175/JCLI-D-21-0412.1, 2022. a, b, c
Moon, S. and Ha, K.-J.: Future changes in monsoon duration and precipitation using CMIP6, npj Climate and Atmospheric Science, 3, 1–7, https://doi.org/10.1038/s41612-020-00151-w, 2020. a
Ogata, T., Ueda, H., Inoue, T., Hayasaki, M., Yoshida, A., Watanabe, S., Kira, M., Ooshiro, M., and Kumai, A.: Projected Future Changes in the Asian Monsoon: A Comparison of CMIP3 and CMIP5 Model Results, J. Meteorol. Soc. Jpn Ser. II, 92, 207–225, https://doi.org/10.2151/jmsj.2014-302, 2014. a, b
Platov, G., Krupchatnikov, V., Martynova, Y., Borovko, I., and Golubeva, E.: A new earth’s climate system model of intermediate complexity, PlaSim-ICMMG-1.0: description and performance, in: IOP Conference Series: Earth and Environmental Science, vol. 96, p. 012005, IOP Publishing, https://doi.org/10.1088/1755-1315/96/1/012005, 2017. a, b
Polson, D., Bollasina, M., Hegerl, G. C., and Wilcox, L. J.: Decreased monsoon precipitation in the Northern Hemisphere due to anthropogenic aerosols, Geophys. Res. Lett., 41, 6023–6029, https://doi.org/10.1002/2014GL060811, 2014. a
Ragone, F., Lucarini, V., and Lunkeit, F.: A new framework for climate sensitivity and prediction: a modelling perspective, Clim. Dynam., 46, 1459–1471, https://doi.org/10.1007/s00382-015-2657-3, 2016. a, b
Ramarao, M. V. S., Ayantika, D. C., Krishnan, R., Sanjay, J., Sabin, T. P., Mujumdar, M., and Singh, K. K.: Signatures of aerosol-induced decline in evapotranspiration over the Indo-Gangetic Plain during the recent decades, MAUSAM, 74, 297–310, https://doi.org/10.54302/mausam.v74i2.6031, 2023. a, b, c
Recchia, L. G. and Lucarini, V.: Supplementary material for Recchia & Lucarini 2023, Figshare [data set], https://doi.org/10.6084/m9.figshare.23554896.v1, 2023. a
Recchia, L. G., Griffiths, S. D., and Parker, D. J.: Controls on propagation of the Indian monsoon onset in an idealised model, Q. J. Roy. Meteor. Soc., 147, 4010–4031, https://doi.org/10.1002/qj.4165, 2021. a
Samset, B. H., Sand, M., Smith, C. J., Bauer, S. E., Forster, P. M., Fuglestvedt, J. S., Osprey, S., and Schleussner, C.-F.: Climate Impacts From a Removal of Anthropogenic Aerosol Emissions, Geophys. Res. Lett., 45, 1020–1029, https://doi.org/10.1002/2017GL076079, 2018. a, b, c
Sanap, S. D. and Pandithurai, G.: The effect of absorbing aerosols on Indian monsoon circulation and rainfall: A review, Atmos. Res., 164, 318–327, https://doi.org/10.1016/j.atmosres.2015.06.002, 2015. a
Sarangi, C., Kanawade, V. P., Tripathi, S. N., Thomas, A., and Ganguly, D.: Aerosol-induced intensification of cooling effect of clouds during Indian summer monsoon, Nat. Commun., 9, 1–9, https://doi.org/10.1038/s41467-018-06015-5, 2018. a
Schewe, J., Levermann, A., and Cheng, H.: A critical humidity threshold for monsoon transitions, Clim. Past, 8, 535–544, https://doi.org/10.5194/cp-8-535-2012, 2012. a, b
Sherman, P., Gao, M., Song, S., Archibald, A. T., Abraham, N. L., Lamarque, J.-F., Shindell, D., Faluvegi, G., and McElroy, M. B.: Sensitivity of modeled Indian monsoon to Chinese and Indian aerosol emissions, Atmos. Chem. Phys., 21, 3593–3605, https://doi.org/10.5194/acp-21-3593-2021, 2021. a, b, c
Shifter, B., von Hardenberg, J., Borth, H., and Lunkeit, F.: jhardenberg/PLASIM: Plasim-LSG TNG (1.0), Zenodo [code], https://doi.org/10.5281/zenodo.4041462, 2020. a, b
Shindell, D. T., Voulgarakis, A., Faluvegi, G., and Milly, G.: Precipitation response to regional radiative forcing, Atmos. Chem. Phys., 12, 6969–6982, https://doi.org/10.5194/acp-12-6969-2012, 2012. a
Siler, N. and Roe, G.: How will orographic precipitation respond to surface warming? An idealized thermodynamic perspective, Geophys. Res. Lett., 41, 2606–2613, https://doi.org/10.1002/2013GL059095, 2014. a
Song, F., Zhou, T., and Qian, Y.: Responses of East Asian summer monsoon to natural and anthropogenic forcings in the 17 latest CMIP5 models, Geophys. Res. Lett., 41, 596–603, https://doi.org/10.1002/2013GL058705, 2014. a, b, c
Sperber, K. R., Annamalai, H., Kang, I.-S., Kitoh, A., Moise, A., Turner, A., Wang, B., and Zhou, T.: The Asian summer monsoon: an intercomparison of CMIP5 vs. CMIP3 simulations of the late 20th century, Clim. Dynam., 41, 2711–2744, https://doi.org/10.1007/s00382-012-1607-6, 2013. a
Swaminathan, R., Parker, R. J., Jones, C. G., Allan, R. P., Quaife, T., Kelley, D. I., De Mora, L., and Walton, J.: The Physical Climate at Global Warming Thresholds as Seen in the U.K. Earth System Model, J. Climate, 35, 29–48, https://doi.org/10.1175/JCLI-D-21-0234.1, 2022. a, b, c
Swapna, P., Krishnan, R., Sandeep, N., Prajeesh, A. G., Ayantika, D. C., Manmeet, S., and Vellore, R.: Long-Term Climate Simulations Using the IITM Earth System Model (IITM-ESMv2) With Focus on the South Asian Monsoon, J. Adv. Model. Earth Sy., 10, 1127–1149, https://doi.org/10.1029/2017MS001262, 2018. a
Thomson, J. R., Holden, P. B., Anand, P., Edwards, N. R., Porchier, C. A., and Harris, N. B. W.: Tectonic and climatic drivers of Asian monsoon evolution, Nat. Commun., 12, 1–10, https://doi.org/10.1038/s41467-021-24244-z, 2021. a
Tran, G. T., Oliver, K. I. C., Sóbester, A., Toal, D. J. J., Holden, P. B., Marsh, R., Challenor, P., and Edwards, N. R.: Building a traceable climate model hierarchy with multi-level emulators, Advances in Statistical Climatology, Meteorology and Oceanography, 2, 17–37, https://doi.org/10.5194/ascmo-2-17-2016, 2016. a
Turner, A. G. and Annamalai, H.: Climate change and the South Asian summer monsoon, Nat. Clim. Change, 2, 587–595, https://doi.org/10.1038/nclimate1495, 2012. a
Ueda, H., Iwai, A., Kuwako, K., and Hori, M. E.: Impact of anthropogenic forcing on the Asian summer monsoon as simulated by eight GCMs, Geophys. Res. Lett., 33, L06703, https://doi.org/10.1029/2005GL025336, 2006. a, b
Ul Hasson, S., Pascale, S., Lucarini, V., and Böhner, J.: Seasonal cycle of precipitation over major river basins in South and Southeast Asia: A review of the CMIP5 climate models data for present climate and future climate projections, Atmos. Res., 180, 42–63, https://doi.org/10.1016/j.atmosres.2016.05.008, 2016. a
Undorf, S., Polson, D., Bollasina, M. A., Ming, Y., Schurer, A., and Hegerl, G. C.: Detectable Impact of Local and Remote Anthropogenic Aerosols on the 20th Century Changes of West African and South Asian Monsoon Precipitation, J. Geophys. Res.-Atmos., 123, 4871–4889, https://doi.org/10.1029/2017JD027711, 2018. a, b
Vaishya, A., Babu, S. N. S., Jayachandran, V., Gogoi, M. M., Lakshmi, N. B., Moorthy, K. K., and Satheesh, S. K.: Large contrast in the vertical distribution of aerosol optical properties and radiative effects across the Indo-Gangetic Plain during the SWAAMI–RAWEX campaign, Atmos. Chem. Phys., 18, 17669–17685, https://doi.org/10.5194/acp-18-17669-2018, 2018. a
Varghese, S. J., Surendran, S., Rajendran, K., and Kitoh, A.: Future projections of Indian Summer Monsoon under multiple RCPs using a high resolution global climate model multiforcing ensemble simulations, Clim. Dynam., 54, 1315–1328, https://doi.org/10.1007/s00382-019-05059-7, 2020. a, b
Wang, B., Jin, C., and Liu, J.: Understanding Future Change of Global Monsoons Projected by CMIP6 Models, J. Climate, 33, 6471–6489, https://doi.org/10.1175/JCLI-D-19-0993.1, 2020. a
Wang, B., Biasutti, M., Byrne, M. P., Castro, C., Chang, C.-P., Cook, K., Fu, R., Grimm, A. M., Ha, K.-J., Hendon, H., Kitoh, A., Krishnan, R., Lee, J.-Y., Li, J., Liu, J., Moise, A., Pascale, S., Roxy, M. K., Seth, A., Sui, C.-H., Turner, A., Yang, S., Yun, K.-S., Zhang, L., and Zhou, T.: Monsoons Climate Change Assessment, B. Am. Meteorol. Soc., 102, E1–E19, https://doi.org/10.1175/BAMS-D-19-0335.1, 2021. a, b, c
Wang, C., Zhang, L., Lee, S.-K., Wu, L., and Mechoso, C. R.: A global perspective on CMIP5 climate model biases, Nat. Clim. Change, 4, 201–205, https://doi.org/10.1038/nclimate2118, 2014. a
Wang, L. and Gu, W.: The Eastern China flood of June 2015 and its causes, Sci. Bull., 61, 178–184, https://doi.org/10.1007/s11434-015-0967-9, 2016. a
Wang, Z., Zhang, H., and Zhang, X.: Projected response of East Asian summer monsoon system to future reductions in emissions of anthropogenic aerosols and their precursors, Clim. Dynam., 47, 1455–1468, https://doi.org/10.1007/s00382-015-2912-7, 2016. a, b, c
Wester, P., Mishra, A., Mukherji, A., and Shrestha, A. B., eds.: The Hindu Kush Himalaya assessment: Mountains, Climate Change, Sustainability and People, Springer Nature, https://doi.org/10.1007/978-3-319-92288-1, 2019. a
Wilcox, L. J., Liu, Z., Samset, B. H., Hawkins, E., Lund, M. T., Nordling, K., Undorf, S., Bollasina, M., Ekman, A. M. L., Krishnan, S., Merikanto, J., and Turner, A. G.: Accelerated increases in global and Asian summer monsoon precipitation from future aerosol reductions, Atmos. Chem. Phys., 20, 11955–11977, https://doi.org/10.5194/acp-20-11955-2020, 2020. a, b
Xin, X., Wu, T., Zhang, J., Yao, J., and Fang, Y.: Comparison of CMIP6 and CMIP5 simulations of precipitation in China and the East Asian summer monsoon, Int. J. Climatol., 40, 6423–6440, https://doi.org/10.1002/joc.6590, 2020. a, b, c, d
Zhang, L. and Zhou, T.: Drought over East Asia: A Review, J. Climate, 28, 3375–3399, https://doi.org/10.1175/JCLI-D-14-00259.1, 2015. a
Zhang, X., Obringer, R., Wei, C., Chen, N., and Niyogi, D.: Droughts in India from 1981 to 2013 and Implications to Wheat Production, Sci. Rep., 7, 1–12, https://doi.org/10.1038/srep44552, 2017. a
Zhou, T., Zhang, W., Zhang, L., Zhang, X., Qian, Y., Peng, D., Ma, S., and Dong, B.: The dynamic and thermodynamic processes dominating the reduction of global land monsoon precipitation driven by anthropogenic aerosols emission, Science China Earth Sciences, 63, 919–933, https://doi.org/10.1007/s11430-019-9613-9, 2020. a
Zickfeld, K., Knopf, B., Petoukhov, V., and Schellnhuber, H. J.: Is the Indian summer monsoon stable against global change?, Geophys. Res. Lett., 32, L15707, https://doi.org/10.1029/2005GL022771, 2005. a, b, c
- Abstract
- Introduction
- Data and methods
- Response to absorbing aerosol forcing
- Response to combined absorbing aerosol and greenhouse gas forcing
- Sensitivity to area of applied forcing
- Conclusions
- Code availability
- Data availability
- Author contributions
- Competing interests
- Disclaimer
- Acknowledgements
- Financial support
- Review statement
- References
- Supplement