the Creative Commons Attribution 4.0 License.
the Creative Commons Attribution 4.0 License.
 | 16 May 2023
Continental heat storage: contributions from the ground, inland waters, and permafrost thawing
Francisco José Cuesta-Valero
Hugo Beltrami
Almudena García-García
Gerhard Krinner
Moritz Langer
Andrew H. MacDougall
Jan Nitzbon
Jian Peng
Karina von Schuckmann
Sonia I. Seneviratne
Wim Thiery
Inne Vanderkelen
Tonghua Wu
Heat storage within the Earth system is a fundamental metric for understanding climate change. The current energy imbalance at the top of the atmosphere causes changes in energy storage within the ocean, the atmosphere, the cryosphere, and the continental landmasses. After the ocean, heat storage in land is the second largest term of the Earth heat inventory, affecting physical processes relevant to society and ecosystems, such as the stability of the soil carbon pool. Here, we present an update of the continental heat storage, combining for the first time the heat in the land subsurface, inland water bodies, and permafrost thawing. The continental landmasses stored 23.8 ± 2.0 × 10²¹ J during the period 1960–2020, but the distribution of heat among the three components is not homogeneous. The sensible diffusion of heat through the ground accounts for ∼90 % of the continental heat storage, with inland water bodies and permafrost degradation (i.e. latent heat) accounting for ∼0.7 % and ∼9 % of the continental heat, respectively. Although the inland water bodies and permafrost soils store less heat than the solid ground, we argue that their associated climate phenomena justify their monitoring and inclusion in the Earth heat inventory.
- Article
(2368 KB) - Full-text XML
-
Supplement
(809 KB) - BibTeX
- EndNote


Anthropogenic changes in atmospheric composition have contributed to sustaining the positive radiative imbalance measured at the top of the atmosphere, leading to an accumulation of heat within the Earth system (Levitus et al., 2005; Church et al., 2011; Hansen et al., 2011; von Schuckmann et al., 2020; Forster et al., 2021). The ocean, atmosphere, cryosphere, and continental landmasses have shown a marked increase in heat storage since the 1960s, with the ocean accounting for about 89 % of the total heat storage, the continental subsurface accounting for 6 %, the cryosphere (glaciers, ice caps, sea ice, ice shelves) accounting for 4 %, and the atmosphere accounting for 1 % (von Schuckmann et al., 2020). Continental heat storage has ranked as the second largest term of the Earth heat inventory, only after the ocean in previous works, showing similar values to the heat uptake by the cryosphere (Levitus et al., 2005; Church et al., 2011; Hansen et al., 2011; von Schuckmann et al., 2020). These previous analyses included estimates of heat storage within the global subsurface retrieved from inversions of temperature–depth profiles measured around the world (Beltrami et al., 2002; Cuesta-Valero et al., 2021c). Subsurface temperature profiles record long-term changes in the surface energy balance as perturbations of subsurface temperatures (Beltrami, 2002). If heat diffusion through the ground occurs in a conductive regime, the original changes in ground heat flux at the surface can be retrieved by inverting the measured temperature profiles (Beltrami, 2001; Beltrami et al., 2002; Cuesta-Valero et al., 2021c), from which the ground heat storage can be estimated. Nevertheless, these inversions of subsurface temperature profiles only capture changes in the subsurface thermal regime due to conductive heat diffusion, and other processes should be considered in order to estimate the total continental heat storage.
Phase change in permafrost soils involves the latent heat of the fusion of ice and frozen rocks, and it is not captured in inversions of subsurface temperature profiles; thus, the heat used to thaw ground ice could be a relevant contributor to continental heat storage, at least at higher latitudes. Estimates of permafrost extent, based on current climate conditions, underline 11 % of the global exposed land surface (Obu, 2021), with continuous (cold) permafrost warming by 0.39 ± 0.15 ∘C and permafrost in the discontinuous zone (warm permafrost) warming by 0.20 ± 0.10 ∘C between 2007 and 2016 (Biskaborn et al., 2019; Fox-Kemper et al., 2021). Colder permafrost has been warming faster (0.4–0.6 ∘C per decade) than warmer permafrost (0.17 ∘C) since 1978 (Gulev et al., 2021). Active-layer thickness is also increasing at most measurement locations around the world (Smith et al., 2022b). Additionally, global climate simulations project a decrease of 10 % to more than 80 % in near-surface permafrost (upper 3 m of the subsurface) extent and a decrease of 25 ± 5 % in total permafrost volume due to thawing by the end of the 21st century, depending on future greenhouse gas emissions (Koven et al., 2013; Slater and Lawrence, 2013; Burke et al., 2020; Hermoso de Mendoza et al., 2020; Fox-Kemper et al., 2021; Steinert et al., 2021). Consequently, substantial latent heat uptake due to ground ice thawing in permafrost-underlain areas is expected for the following decades.
Similarly, a large amount of energy is required to warm lakes, rivers, and artificial reservoirs due to the high heat capacity of water, which may constitute another relevant contributor to continental heat storage not included in previous analyses. Inland surface water bodies extend through a considerable part of the land surface. For instance, natural lakes cover ∼2 % (2 662 040 km2) of the global continental surface (Messager et al., 2016; Vanderkelen et al., 2020). Rivers and lakes have warmed by 1 and 0.45 ∘C per decade, respectively, in the last 3 decades, resulting in an a reduction of ∼25 % in ice cover, and there is high confidence that these trends are going to continue throughout the 21st century according to the IPCC Sixth Assessment Report (Douville et al., 2021). Furthermore, previous estimates of heat flux in global inland surface water bodies from a multimodel ensemble of simulations yielded ∼121 mW m−2 (1 mW m W m−2) for the period 1991–2020 (Vanderkelen et al., 2020), which is similar to the ground heat flux determined from subsurface temperature profiles.
Here, we quantify the continental heat storage by combining ground heat storage, heat uptake by inland water bodies, and heat used for thawing permafrost. Heat storage from these three components is estimated from 1960 to 2020 and is compared to previous estimates of the Earth heat inventory. These estimates of continental heat storage will contribute to updating the global Earth heat inventory defined in von Schuckmann et al. (2020). We also argue about the importance of monitoring all three components of continental heat storage in the future due to the implications of the changes in heat content within these subsystems for society and ecosystems.
2.1 Estimates of ground heat storage
Ground heat fluxes are estimated from deep subsurface temperature profiles, consisting of measurements of temperature with depth usually performed in holes that were drilled for mining prospecting campaigns and that are, thus, unevenly distributed across the global land surface. These profiles are typically described by the following two components: a quasi-equilibrium temperature profile and the propagation of recent variations in the surface energy balance (Beltrami, 2002). The quasi-equilibrium profile corresponds to the temperature profile in an equilibrium state, that is, with a constant surface temperature and geothermal gradient. Heat flow from the Earth interior is constant at temporal scales of millions of years; thus, the local geothermal gradient can be considered to be constant (Jaupard and Mareschal, 2010). However, recent changes in total radiation reaching the land surface (Wild et al., 2015) ensure that local surface temperatures are not constant in the long term. A common approach to estimating the quasi-equilibrium profile consists of performing a linear regression analysis of the deepest part of each profile, as this is the part least affected by recent changes in surface conditions (Cuesta-Valero et al., 2019). Thereby, the geothermal gradient is assumed to correspond to the slope of this regression line, while the extrapolation of the fitted line to the surface is considered to be the long-term past surface temperature. Variations of the surface energy balance are assumed to propagate into the ground following the one-dimensional heat diffusion equation, and these are recorded in the profile as alterations to the quasi-equilibrium profile (Carslaw and Jaeger, 1959). Therefore, this signature of changes in surface conditions on subsurface temperatures can be estimated by subtracting the quasi-equilibrium profile from the measured log, obtaining an anomaly profile. Ground heat flux histories retrieved in this analysis are based on inverting the anomaly profile of each individual subsurface temperature profile.
We invert subsurface temperature profiles from the Xibalbá dataset (Cuesta-Valero et al., 2021c, a) to estimate the global long-term ground heat flux history. The Xibalbá dataset consists of 1079 subsurface temperature profiles measured around the world, with a larger number of profiles in the middle latitudes of the Northern Hemisphere. The Xibalbá profiles have been screened by eye to remove logs including non-climatic signals due to processes such as water advection (Cuesta-Valero et al., 2021c). The logs have also been harmonized to include temperature records from depths of 15 to 300 m. Ensuring that all logs are truncated at the same depth is crucial to obtaining temperature and heat flux estimates relative to the same temporal reference, which, in this analysis, approximates the period 1300–1700. This period of reference arises from the depth range (in this case, 200–300 m) used to perform the linear regression analysis from which the corresponding quasi-equilibrium temperature profile from each individual log is determined. Additionally, a homogeneous subsurface with a constant thermal diffusivity of m2 s−1 is considered in order to derive this temporal reference (see Cuesta-Valero et al., 2019, for details about the relationship between depth range and the period of reference). Once the quasi-equilibrium profile is estimated, the corresponding anomaly profile is retrieved as explained above.
Ground surface temperature histories are estimated from individual Xibalbá profiles using a singular value decomposition (SVD) algorithm (Lanczos, 1961) to invert each anomaly profile. Inversions performed by this SVD algorithm are common in the literature (Beltrami and Mareschal, 1992; Mareschal and Beltrami, 1992; Clauser and Mareschal, 1995; Beltrami et al., 2015; Jaume-Santero et al., 2016; Pickler et al., 2016) and have shown robust results in experiments designed to test their ability to retrieve past changes in global surface temperature (González-Rouco et al., 2006, 2009; García-García et al., 2016; Melo-Aguilar et al., 2018). Ground heat flux histories are then retrieved from each ground surface temperature history using the technique developed in Wang and Bras (1999) from a half-order derivative approach:
with α being the thermal diffusivity of the medium, λ being the thermal conductivity, G(tN) being the ground heat flux at the time tN, Tk being the ground surface temperature history at the k-th time step, and tk being the time at the k-th time step. This approach has been used extensively in the literature to derive global ground heat flux histories and has shown good results when compared to other techniques (Beltrami, 2001; Beltrami et al., 2002; Bennett et al., 2008; Cuesta-Valero et al., 2021c). Here, we consider thermal diffusivities ranging from to m2 s−1 and thermal conductivities between 2.5 and 3.5 W m−1 K−1 to perform the inversions and to estimate ground heat flux histories, which are typical values in the literature.
These SVD inversions are combined with a bootstrap sampling strategy to retrieve the 2.5th, 50th, and 97.5th percentiles of the spatially aggregated heat flux histories (Efron, 1987; DiCiccio and Efron, 1996; Davison and Hinkley, 1997). The bootstrap method consists of estimating global mean ground heat fluxes from populations of 1079 elements (i.e. the number of Xibalbá profiles), with each element being a ground heat flux history from a Xibalbá profile retrieved using randomly selected values for thermal diffusivity and thermal conductivity (see ranges above), as well as a random quasi-equilibrium temperature profile. This random quasi-equilibrium profile is chosen from the Gaussian distribution of long-term mean surface temperature and geothermal gradient retrieved from the linear regression analysis performed in the deepest 100 m of the corresponding profile, as explained above. This process is repeated 1000 times to obtain an ensemble of global heat flux averages, considering the 50th percentile of the ensemble to be the best estimate of global ground heat flux and the 2.5th and 97.5th percentiles to be the 95 % confidence interval. A detailed description of the bootstrapping sampling approach combined with the SVD algorithm can be found in Cuesta-Valero et al. (2022).
Ground heat storage is estimated as the accumulated heat flux since 1960 considering the global land area without Greenland and Antarctica (1.34×10¹⁴ m2), as there are no measured profiles in these areas. As indicated in Cuesta-Valero et al. (2021c), removing other land areas such as northern and middle Africa, South America, and the Middle East does not affect the results much. Furthermore, several studies have shown that the current spatial distribution of subsurface temperature profiles is enough to capture the global change in surface conditions (González-Rouco et al., 2009; García-García et al., 2016; Melo-Aguilar et al., 2020; Cuesta-Valero et al., 2021c). Since the number of measured profiles decreases sharply after 2000, we extrapolate the trend of ground heat flux for the period 1970–2000 to fill the period 2000–2020 with data, as in von Schuckmann et al. (2020).
2.2 Estimates of permafrost heat storage
Heat storage within the continental subsurface is also used for ground ice melting as permafrost temperatures approach 0 ∘C. However, estimates of ground heat storage from subsurface temperature profiles cannot recover the latent heat flux used for permafrost thawing. These estimates of latent heat flux, permafrost heat flux hereinafter, are physically and methodologically different to estimates of sensible heat flux, referred as ground heat flux in this article. Latent heat stored in permafrost due to melting of ground ice is estimated from extensive parameter ensemble simulations using the CryoGridLite permafrost model (Langer et al., 2022; Nitzbon et al., 2022). The model uses an implicit, iterative, backward Euler scheme to solve the heat transfer equation with phase change in mixed enthalpy form (Swaminathan and Voller, 1992). Daily average enthalpy and liquid water content profiles are calculated to a depth of 550 m with a spatial resolution of 1∘ (per grid cell) for the Arctic permafrost region. The surface temperature offset caused by snow insulation is represented by a dedicated snow scheme accounting for regional snow characteristics (Sturm et al., 2010). Ground stratigraphies which determine both the thermal properties of the ground and the amount and location of ground ice are derived based on soil stratigraphy parameterizations developed for the SURFEX land surface model (Masson et al., 2013). Required input data are extracted from multiple global datasets, such as the percentage of sand and clay in the soil (Masson et al., 2003; Faroux et al., 2013), the soil organic carbon content (Hugelius et al., 2013), and the soil thickness (Pelletier et al., 2016).
Uncertainties in soil stratigraphies affecting latent heat storage are primarily determined by the amount and distribution of ground ice. Such uncertainties are accounted for by ensemble parameter simulations (N=100) using a Monte Carlo approach that randomly varies soil thickness and the thickness of soil layers with different levels of ice saturation (Langer et al., 2022; Nitzbon et al., 2022). The presence of excess ice was considered by increasing the ground ice content for 50 % of the ensemble members according to the information provided in the map by Brown et al. (1997). Specifically, we increased the ground ice content in the uppermost 10 to 20 m uniformly by an amount according to the low, medium, and high ice content classes given in the map (see Nitzbon et al., 2022, for details). The climate forcing of the simulations performed is based on daily mean surface temperatures and daily snowfall amounts. The climate forcing used is a synthetic time series combining Commonwealth Scientific and Industrial Research Organisation (CSIRO) paleoclimate simulations (500 CE–1979) based on the Mk3L climate system model (Phipps et al., 2013) with reanalysis data (1979–2019) based on ERA-Interim (Dee et al., 2011). Both climate time series are harmonized using an anomaly approach to extend the last decade of the reanalysis data into the past. The lower boundary condition at 550 m depth is set to a local geothermal heat flux according to the global map of solid earth surface heat flow (Davies, 2013). Here, the period from 500 CE to 1960 is considered sufficient to bring the model to dynamic equilibrium after initialization with steady-state conditions (averaged for 500 to 600 CE).
The results of the simulations are analysed by integrating the daily liquid soil water content profiles with depth to obtain the total average annual liquid water content per square metre. Multiplying this water content by the volumetric latent heat of fusion of water (334×106 kJ m−3) yields the average annual latent heat uptake per square metre, which is multiplied with the land area (excluding the surface water area) contained within each model grid cell. The uncertainties caused by uncertain ground ice distributions are provided as average standard deviation calculated from the ensemble. The CryoGridLittle model has been previously evaluated against measurements of ground surface temperatures at 82 different stations of the Global Terrestrial Network for Permafrost (GTN-P) covering the period 2007–2016 (Langer et al., 2022). The root mean squared error between the simulated and measured temperatures is 2.2 ∘C for the entire dataset, with a warm bias of 0.6 ∘C, a performance comparable to or better than other model analyses (Langer et al., 2022).
Subin et al. (2012)Goudsmit et al. (2002)Tan et al. (2015)Sachse et al. (2014)Table 1Overview of global lake models used. Detailed descriptions of the models and modelling setup can be found in Golub et al. (2022).
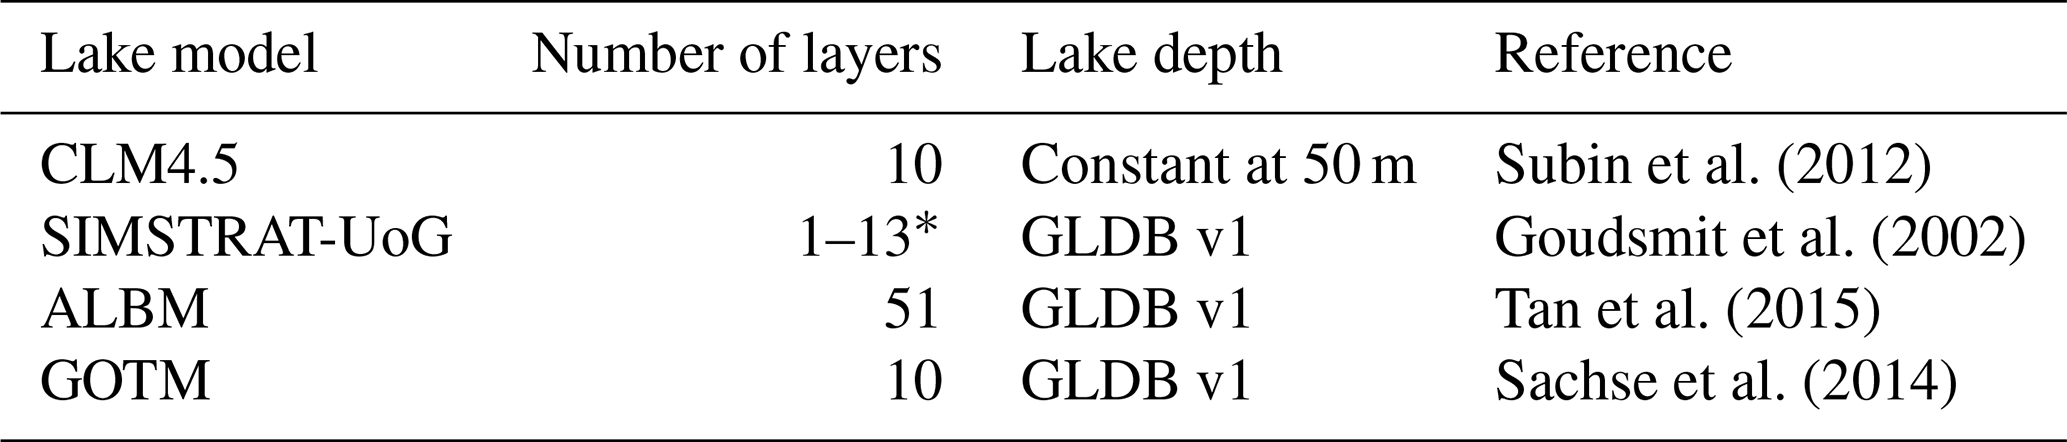
∗ The number of lake layers used in SIMSTRAT-UoG varies spatially and depends on the mean lake depth of the grid cell.
2.3 Estimates of inland-water heat storage
The heat storage by inland waters, including natural lakes, reservoirs, and rivers, is estimated for the period 1900–2021 by combining water temperature anomalies with volume estimates. To this end, we use a combination of global-scale lake models, global hydrological models, and Earth system model (ESM) simulations from the Inter-Sectoral Impact Model Intercomparison Project phase 2b (ISIMIP2b, Frieler et al., 2017; Golub et al., 2022), with the methods described in Vanderkelen et al. (2020). To derive lake temperature profiles, we expand the global lake model ensemble consisting of three global lake models (CLM45, ALBM, and Simstrat-UoG), each providing simulations driven by bias-adjusted atmospheric forcing from four ESMs (GFDL-ESM2M, HadGEM2-ES, IPSL-CM5A-LR, and MIROC5), with four simulations using an additional global lake model, the General Ocean Turbulence Model (GOTM; Sachse et al., 2014), driven by the same ESMs. In total, the ensemble contains 16 global lake simulations, providing lake temperature profiles (Table 1) for the period 1900 to 2021 on a 0.5∘ by 0.5∘ grid. These simulations are combined with global gridded lake depths from the Global Lake Database v.3 (GLDB; Choulga et al., 2019) rasterized global lake and reservoir area from HydroLAKES and GRanD databases (Messager et al., 2016; Lehner et al., 2011), as described in Vanderkelen et al. (2020).
Differently from the cylindrical-lake assumption of Vanderkelen et al. (2020), in which the grid cell lake volume is calculated by multiplying lake area and depth, we determine lake and reservoir volumes by estimating lake morphometry with the volume development parameter (Vd), which is a well-established geometric approach (Håkanson, 1977; Johansson et al., 2007). The Vd parameter represents the extent to which the lake volume deviates from the volume of a cylinder, thereby indicating whether the lake morphometry is concave or convex. We employ a global constant Vd value of 1.19, which is the median Vd derived from the 1 427 688 lake polygons in the GLOBathy dataset (Khazaei et al., 2022) using their mean and maximum depths . Per grid cell, the lake volume is calculated as a “reversed wedding cake” by multiplying the thickness of every discrete lake layer of the lake model with the average area at the layer depth A(z), calculated following Johansson et al. (2007) as follows:
and
with Amax (m2) being the surface lake area calculated based on the gridded HydroLAKES distribution; drel (m) being the relative lake layer depth , where zmax (m) is given by the GLDB lake depth; and finally, Vd (−) being the volume development parameter, taken as constant at 1.19.
Then, the lake heat content of every grid cell is calculated by combining the volume of every lake layer with the layer temperature and integrating it over the whole lake column. Next, the heat storage is computed from the globally aggregated lake heat content values relative to the year 1960. To estimate heat uptake by reservoirs, we not only account for warming temperatures but also include the increase in water volume through reservoir construction by using transient reservoir area, in which reservoirs appear in their year of construction given by GRanD (Vanderkelen et al., 2021, 2022). Finally, heat flux estimates are derived from the heat content time series by calculating the difference in heat content between 2 consecutive years divided by the total lake and reservoir area for the corresponding years.
The provided best estimate and uncertainty range for inland-water heat storage and heat flux is given as the mean and standard deviation of the multimodel ensemble of the 16 simulations described above.
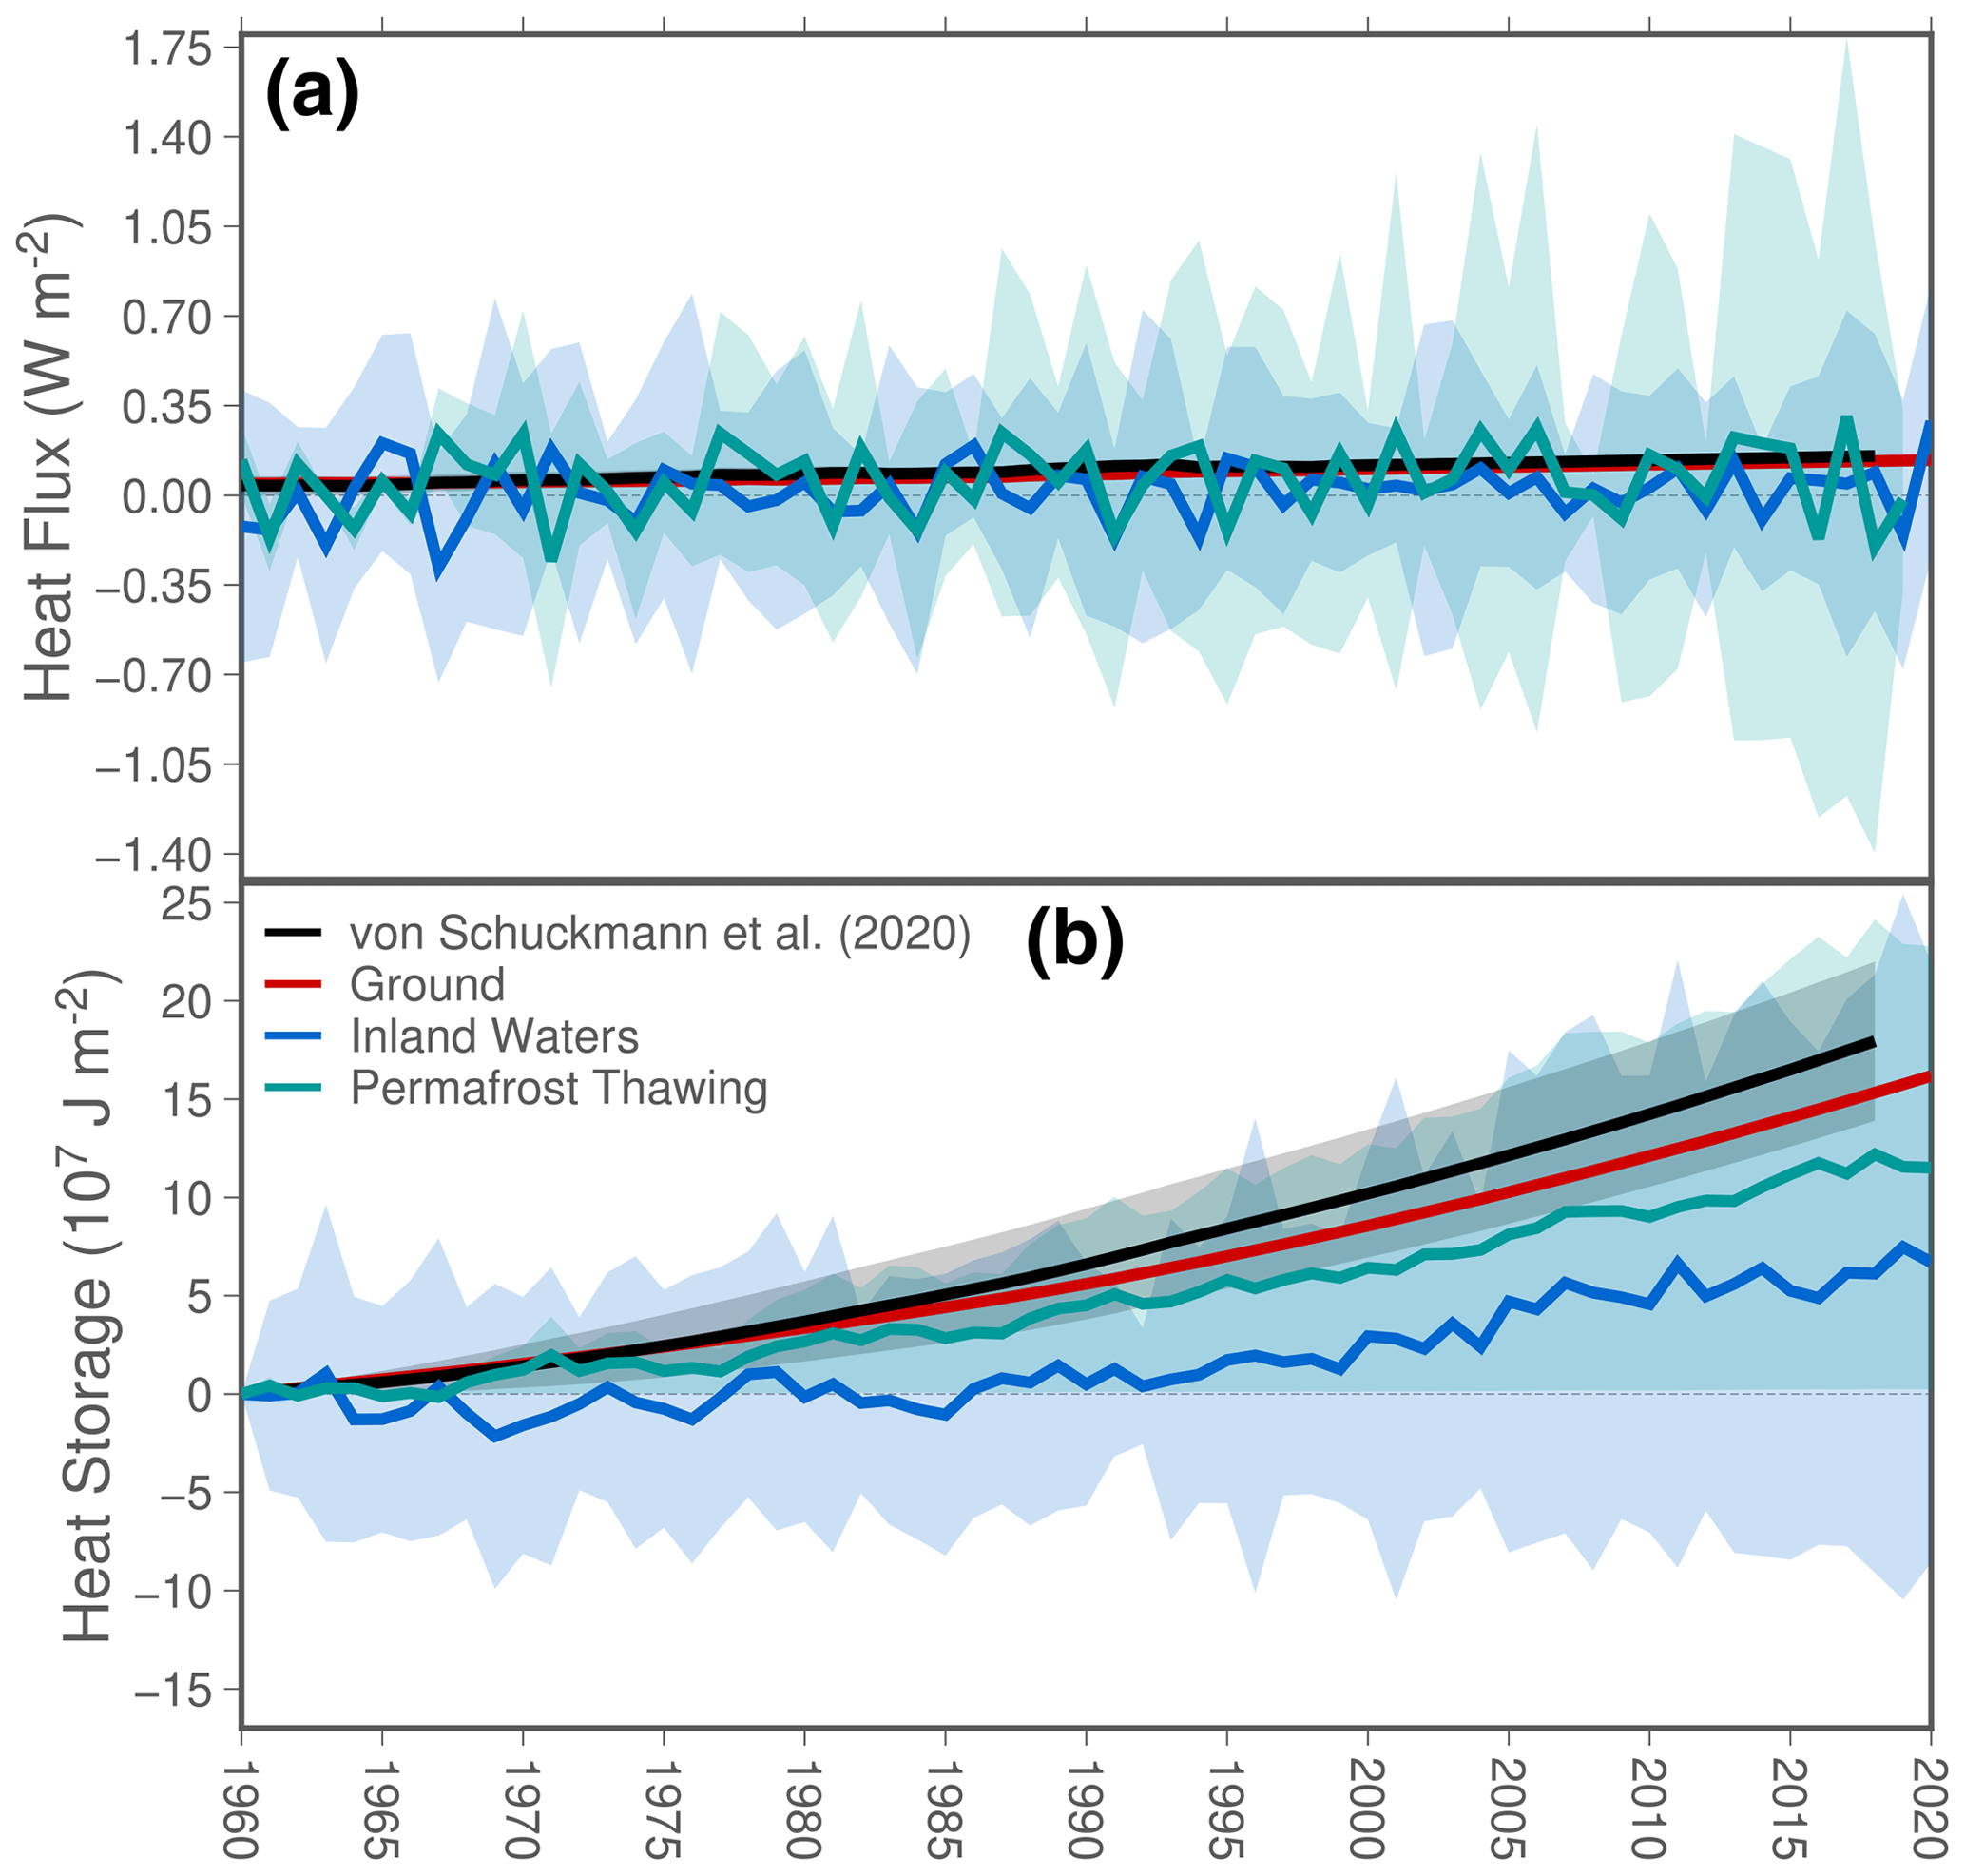
Figure 1Global heat flux (a) and global heat storage per unit of area (b) from the ground (red lines), inland water bodies (blue line), and permafrost thawing (green line) for the period 1960–2020. Black lines indicate ground heat fluxes and ground heat storage from von Schuckmann et al. (2020). Please, note that ground estimates consist of long-term changes of heat flux and heat storage and do not include interannual variability.
Estimates of ground heat flux by the new bootstrapping technique described above present smaller values and a narrower uncertainty range than the results from previous estimates using the Xibalbá dataset (von Schuckmann et al., 2020; Cuesta-Valero et al., 2021c). Previous analyses presented a global heat flux of 97±6 mW m−2 for 1960–2018 in comparison with 84.8±0.8 mW m−2 for the period 1960–2020 in this study (Fig. 1a). Both heat flux estimates consider the same subsurface temperature profiles and the same singular value decomposition algorithm to produce inversions of individual logs. Nevertheless, the new bootstrap method used to aggregate inversions from individual profiles is conceptually different from the aggregation method used in von Schuckmann et al. (2020), which leads to slightly different values of global ground heat flux and to a narrower 95 % confidence interval (Cuesta-Valero et al., 2022). The large difference between the previous and the new uncertainty estimates arise due to the incorrect aggregation technique used in previous studies, which was flawed towards unrealistically large values. The singular value decomposition method in von Schuckmann et al. (2020) is based on deriving two extremal inversions from each individual profile and then considering the global uncertainty as the average of these extremal inversions. The bootstrap approach, nevertheless, derives a set of 1000 different global averages from individual profiles considering a different quasi-equilibrium profile and a different thermal diffusivity each time, retrieving the 2.5th, 50th, and 97.5th percentiles of these global averages. The new bootstrap approach, therefore, should be considered to be a better method for aggregating inversions from different temperature profiles. A more detailed comparison between these two aggregation techniques can be consulted in Cuesta-Valero et al. (2022). The ground heat fluxes from the bootstrap inversion technique are also higher than those from Beltrami et al. (2002), which presented 39.1 mW m−2 for 1950–2000. These large differences between our results and those from Beltrami et al. (2002) arise from the use of different inversion methods and from the higher number of more recent subsurface temperature profiles in the Xibalbá dataset than in Beltrami et al. (2002), thus including the recent warming of the continental subsurface. Heat flux for inland water bodies reaches 16±27 mW m−2 for 1960–2020, displaying a large interannual variability and multimodel spread (Fig. 1a). This large interannual variability in comparison with estimates of ground heat flux and permafrost heat flux is explained by the smaller surface of global lakes and reservoirs in comparison with the global land and permafrost areas, concretely 2 and 1 orders of magnitude smaller than the land and permafrost areas. Permafrost heat flux estimates for the Arctic region yield 60±80 mW m−2 for the period 1960–2020, thus being lower than that of the ground and higher than that of inland water bodies during the same period of time. All three components present positive heat flux trends, with ground heat flux presenting a trend of 1.7 mW m−2 yr−1, inland water bodies showing a trend of 1.3 mW m−2 yr−1, and the trend for permafrost heat flux amounting to 0.9 mW m−2 yr−1. Ground heat flux data after the year 2000 are an extrapolation of the 1970–2000 trend, which could imply an underestimation of the trend for the whole period due to the fast change in global surface temperatures in recent times (Gulev et al., 2021).
Estimates of heat storage per unit of area show large differences in the capacity of each subsystem to gain heat (Fig. 1b), with the ground displaying a heat storage of 161.9±0.7 MJ m−2 (1 MJ = 106 J), inland water bodies displaying a heat gain of 67±76 MJ m−2, and permafrost soils displaying a heat gain of 115±56 MJ m−2 at the end of the period 1960–2020 (Fig. 1b). There are also spatial differences in the retrieved heat storage per unit of area, with a general heat gain in inland water bodies and subsurface temperature profiles around the globe but with most permafrost heat gains arising from southern Arctic latitudes (Fig. 2). Subsurface temperature profiles show a general increase of heat content in the ground, although with individual logs displaying heat losses at certain locations (Fig. 2a). However, individual profiles are sensitive to microclimate conditions (e.g. Taylor and Wang, 2008); thus, signals at individual locations may vary in comparison with the regional pattern. Regional differences appear in the heat storage per unit of area in inland water bodies (Fig. 2b), showing a general heat gain except in Southeast Asia and in the southwestern shore of Hudson Bay in Canada. After examining these two areas more in detail and after a literature review, we cannot provide an explanation for these heat loses in inland waters heat storage at this moment. Permafrost soils display small changes in terms of heat content in northern Canada, northern Alaska, and most of Siberia in contrast to a strong heat gain in the southern part of the Arctic region in North America and Asia (Fig. 2c).
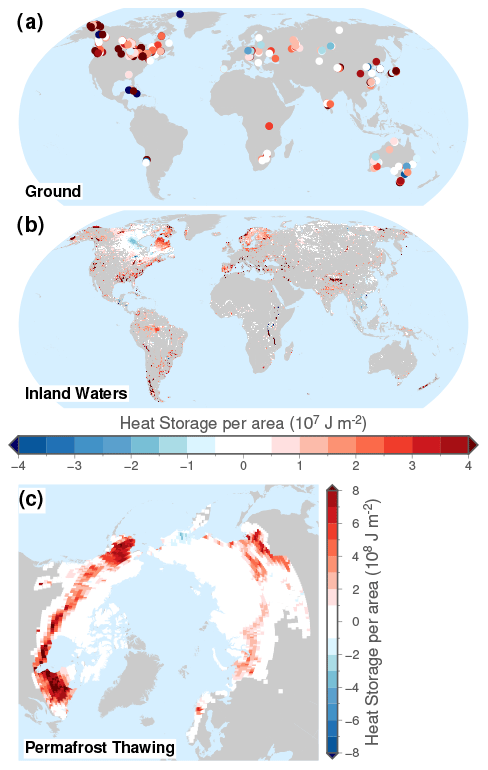
Figure 2Spatial distribution of heat storage per unit of area since 1960 for (a) ground heat storage from subsurface temperature profiles measured after 1990, (b) heat storage from inland water bodies, and (c) heat storage from permafrost thawing. Please note the different scale for permafrost heat storage.
The estimates of heat flux and heat storage per unit of area for inland water bodies are derived from the total heat storage for natural lakes and reservoirs, similarly to Vanderkelen et al. (2020). These heat storage time series for natural lakes represent the changing water temperatures, which show a positive trend from the 1990s onwards (Fig. 3a). Our estimates, 0.18±0.19 ZJ for 2011 to 2020 relative to past times (1900–1929), are lower compared to previous estimates (0.29 ± 0.2 ZJ for the same period; Vanderkelen et al., 2020). This difference can be attributed to the additional simulations with the global lake model GOTM and the refined volume estimates. Contrary to the other simulations, the GOTM simulations forced by HadGEM2-ES and MIROC5 do not show an upward trend (Fig. S1 in the Supplement). Using the Vd parameter as a measure for lake morphometry to calculate lake layer volumes results in lower volumes compared to using the cylindrical approach. A sensitivity analysis comparing heat storage for natural lakes with different global mean Vd values and the cylindrical approach shows that heat storage increases with increasing Vd values, while the cylindrical bathymetry results in distinctly larger values (Fig. S2 in the Supplement). This can be explained by the different lake volumes which are higher for concave-shaped bathymetries (Vd>1) than for more convex-shaped bathymetries (Vd<1; Johansson et al., 2007). The cylindrical approach results in the highest lake volumes and therefore the largest heat storage. Reservoir heat storage is an order of magnitude smaller compared to natural lakes with estimates of 0.21±0.17 ZJ for 2011 to 2020, relative to past times (Fig. 3b). The steady increase originates from both reservoir construction, which accelerated in the years 1950–1970, and the increasing water temperatures. Finally, Vanderkelen et al. (2020) report river heat storage estimates of −0.36 ± 1.2 ZJ for 2011 to 2020, relative to past times, based on water storage simulations by two global hydrological models within the ISIMIP2b framework and river temperatures derived from surface temperatures of the GCMs. These estimates are characterized by a large uncertainty, which originates from a high variability in water storage, masking the positive temperature trend (Vanderkelen et al., 2020).
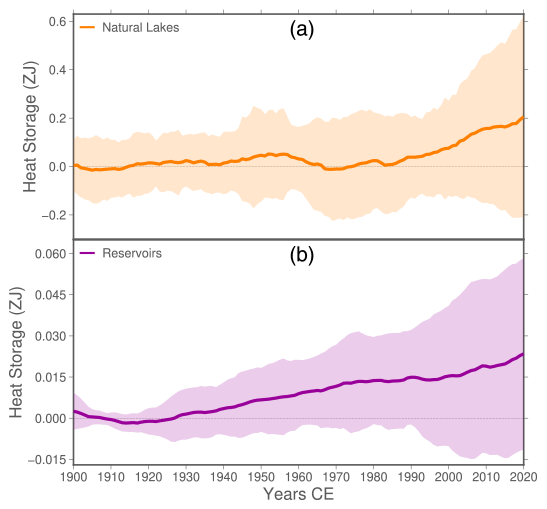
Figure 3Heat storage by natural lakes (a) and reservoirs (b). Shown are 6-year moving averages relative to the 1900–1929 reference period. Note the different y-axis scales. Colour shades represent the uncertainty range shown as the standard deviation of the used simulations (16 for lake and reservoir heat storage).
The total continental heat storage since 1960 reaches 23.8 ZJ (1 ZJ = 1021 J) with a two-σ value of 2.0 ZJ. The uncertainty for permafrost heat storage arises mainly from the unknown soil stratigraphies in the Arctic, with the uncertainty for inland waters heat storage arising mostly due to structural differences in the models considered to derive the estimates. Nevertheless, the uncertainty ranges from the different continental subsystems include markedly different factors due to the different sources of information considered in the analysis. The uncertainty for ground heat storage arises from unknown subsurface thermal properties and from the determination of the quasi-equilibrium profile at each location. The uncertainty for permafrost heat storage arises mainly from the unknown soil stratigraphies in the Arctic, with the uncertainty for inland waters heat storage arising mostly due to structural differences in the models considered to derive the estimates. Therefore, we cannot provide a robust uncertainty estimate for the total continental heat storage, and future iterations of this analysis should focus on harmonizing the estimates of uncertainty in the individual components in order to enhance the total uncertainty in continental heat storage.
The total continental heat storage is distributed over the different components as follows: 21.6±0.2 ZJ is stored in the ground, 0.2±0.4 ZJ is stored in inland water bodies, and 2±2 ZJ is used to thaw permafrost during the period 1960–2020. This value of continental heat storage, including the storage in the ground, in water bodies, and in permafrost thawing, is nevertheless similar to the previous value of ∼24 ZJ published in von Schuckmann et al. (2020) for the period 1960–2018. This similar value is reached due to the inclusion of permafrost heat storage and inland waters heat storage, since the ground heat storage estimated here is smaller than the value reported in von Schuckmann et al. (2020), as discussed above (see Cuesta-Valero et al., 2022, for a detailed analysis). In any case, the new estimate is within the 95 % confidence interval provided in von Schuckmann et al. (2020). Ground heat storage accounts for the majority of continental heat, representing more than 90 % of the continental heat storage for the period 1960–2020 (Fig. 4); inland water bodies store ∼0.7 %, and permafrost thawing accounts for approximately 9 %. Nevertheless, our estimates of permafrost heat storage do not include the thawing of ground ice in the Tibetan Plateau; thus, the percentage corresponding to permafrost in Fig. 4 is probably larger than the value presented here.
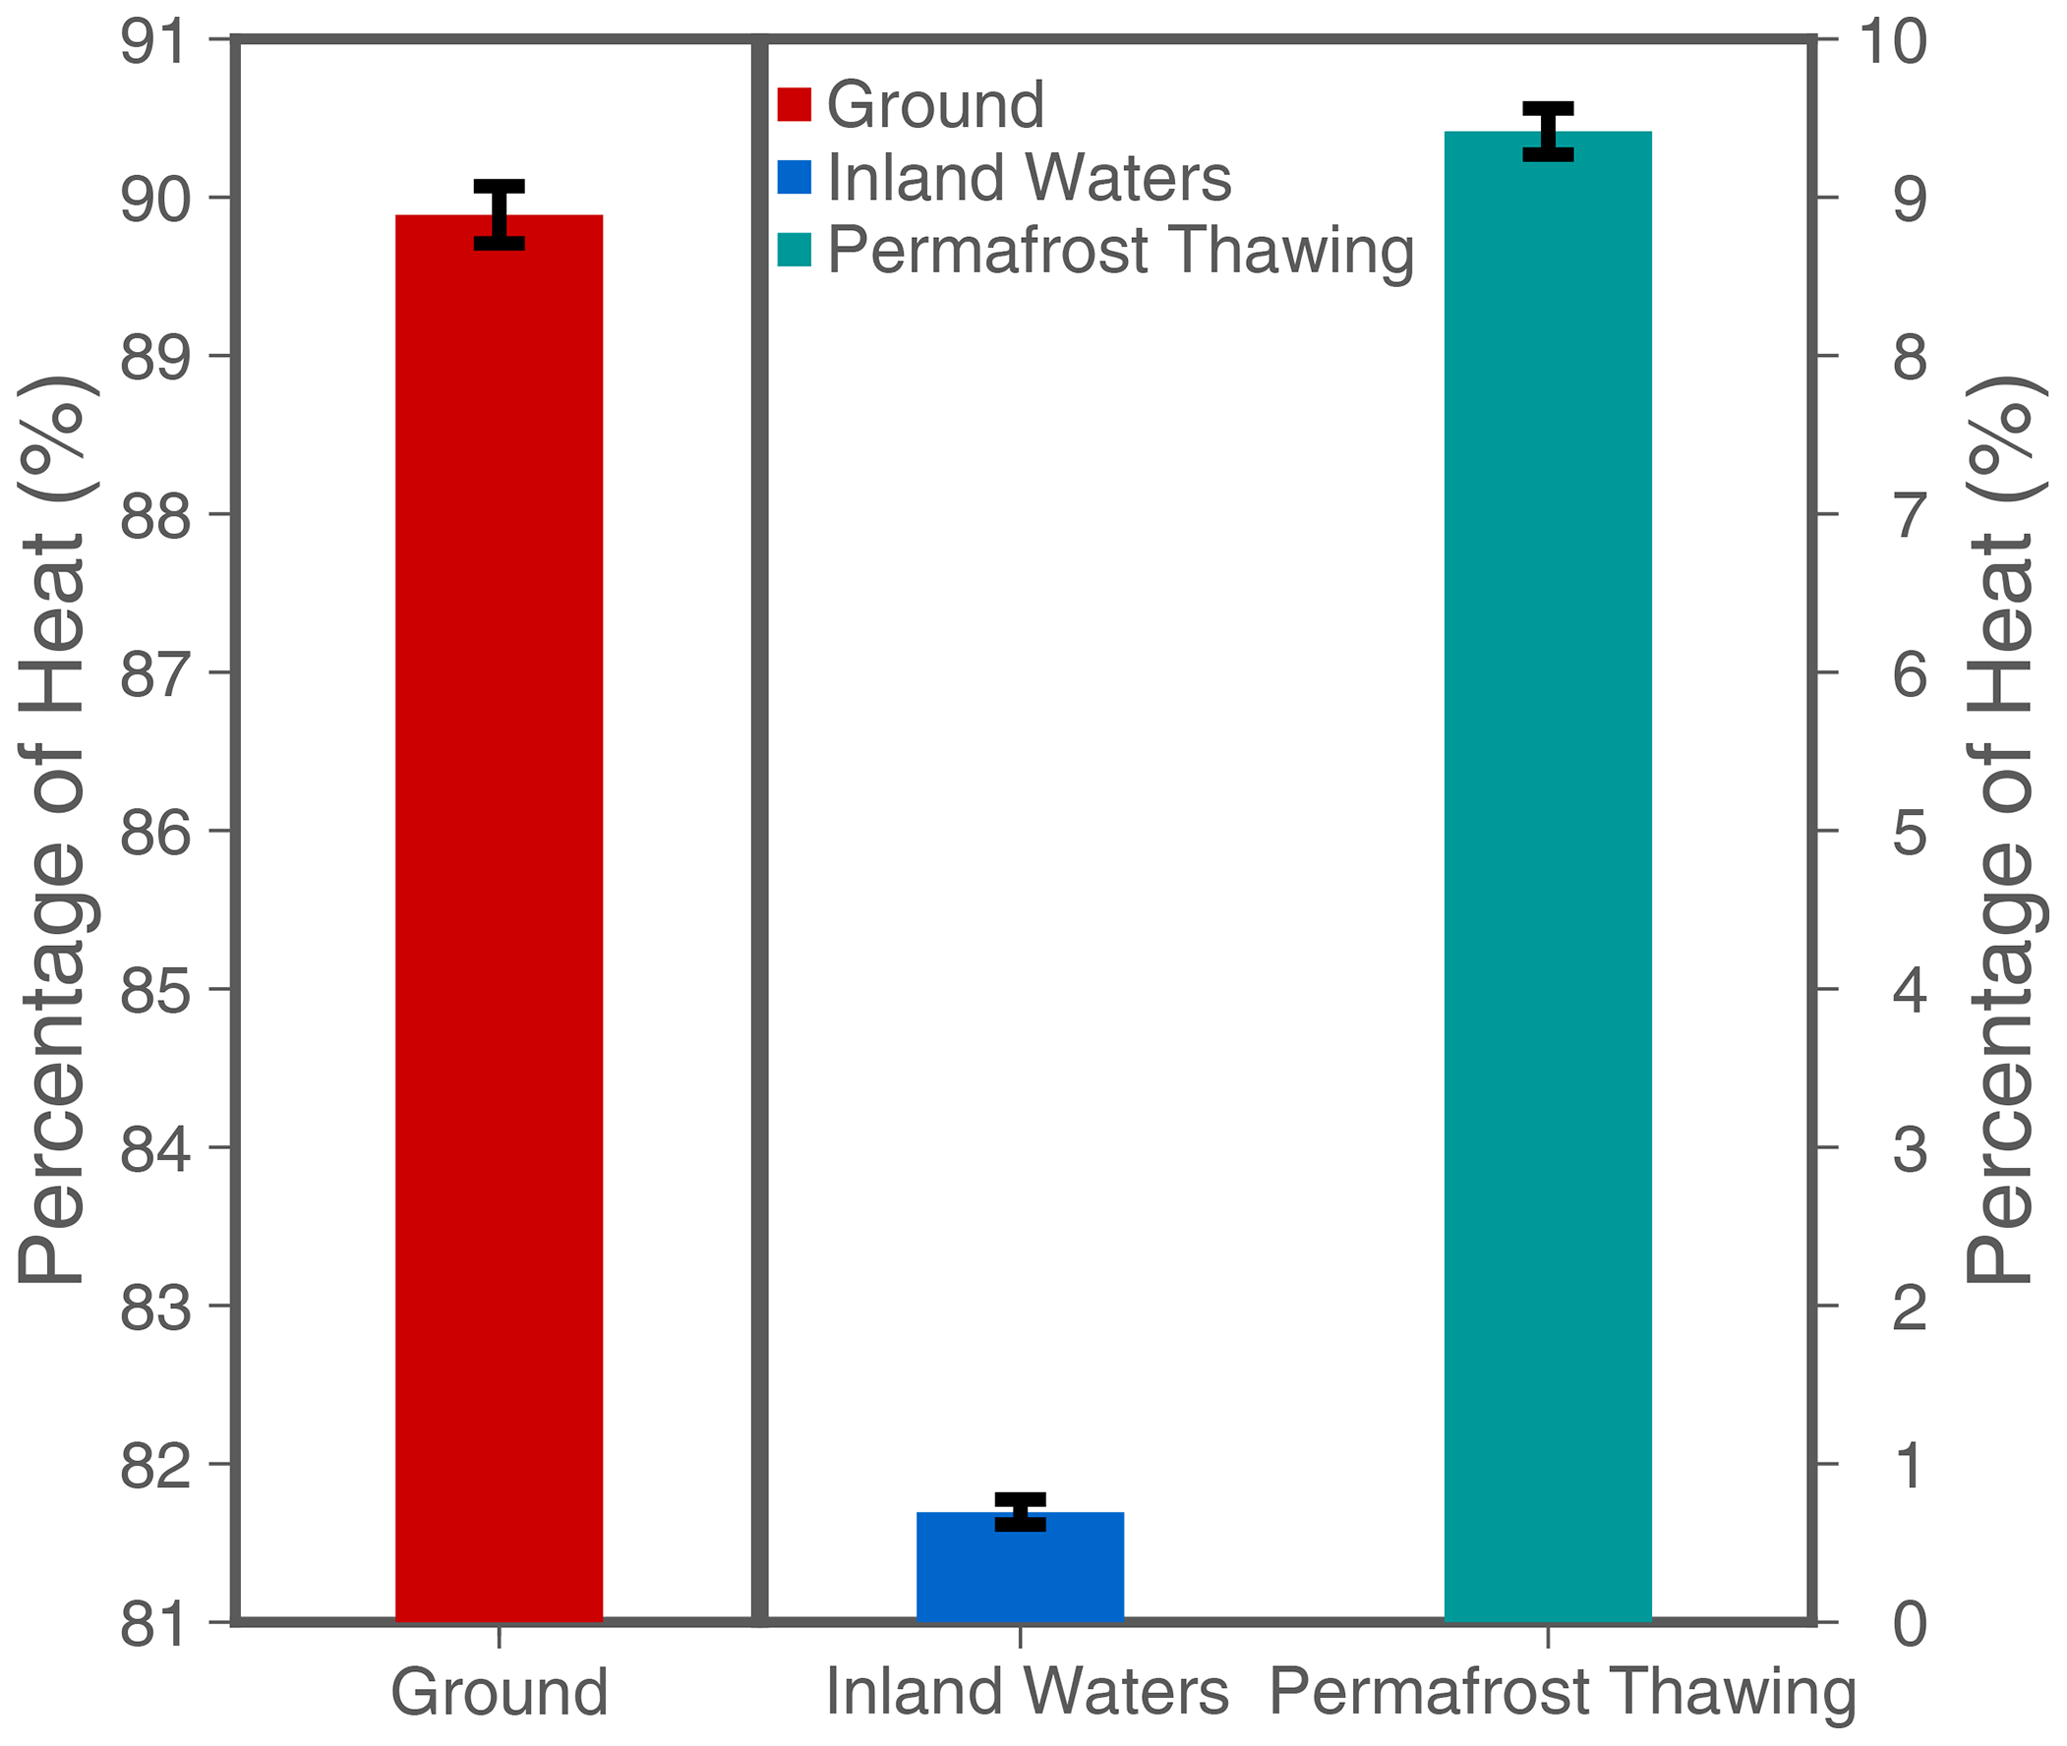
Figure 4Percentage (%) of the continental heat storage within each analysed land component for the period 1960–2020: ground (red), inland water bodies (blue), and permafrost thawing (green). The left axis corresponds to ground results, and the right axis corresponds to results for permafrost soils and inland water bodies.
Global climate models project a warming of the Earth system in the near future, even under low-emission scenarios (Tokarska et al., 2020; IPCC, 2021). These projections imply an increase in the amount of continental heat storage together with an amplification of a series of impacts on society and ecosystems (Fig. 5). Energy exchanges between the lower atmosphere and the shallow subsurface determine the energy balance at the land surface, which connects the changes in net radiation, sensible heat flux, latent heat flux, and ground heat flux (Bonan, 2002). As part of the land surface energy balance, and despite being the smallest term in most situations (Bonan, 2002; Purdy et al., 2016), ground heat flux needs to be determined in order to close the energy balance at the surface and to minimize uncertainties in the rest of the components. A complete knowledge of the surface energy balance, together with soil conditions, is fundamental to understanding the evolution of land–atmosphere interactions affecting important climate and meteorological phenomena, such as surface temperature increases, surface temperature variability, and extreme temperature events (Seneviratne et al., 2006; Fischer et al., 2007; Seneviratne et al., 2013; Thiery et al., 2017; Vogel et al., 2017; Ma et al., 2018; Wang et al., 2022; Parmesan et al., 2022).
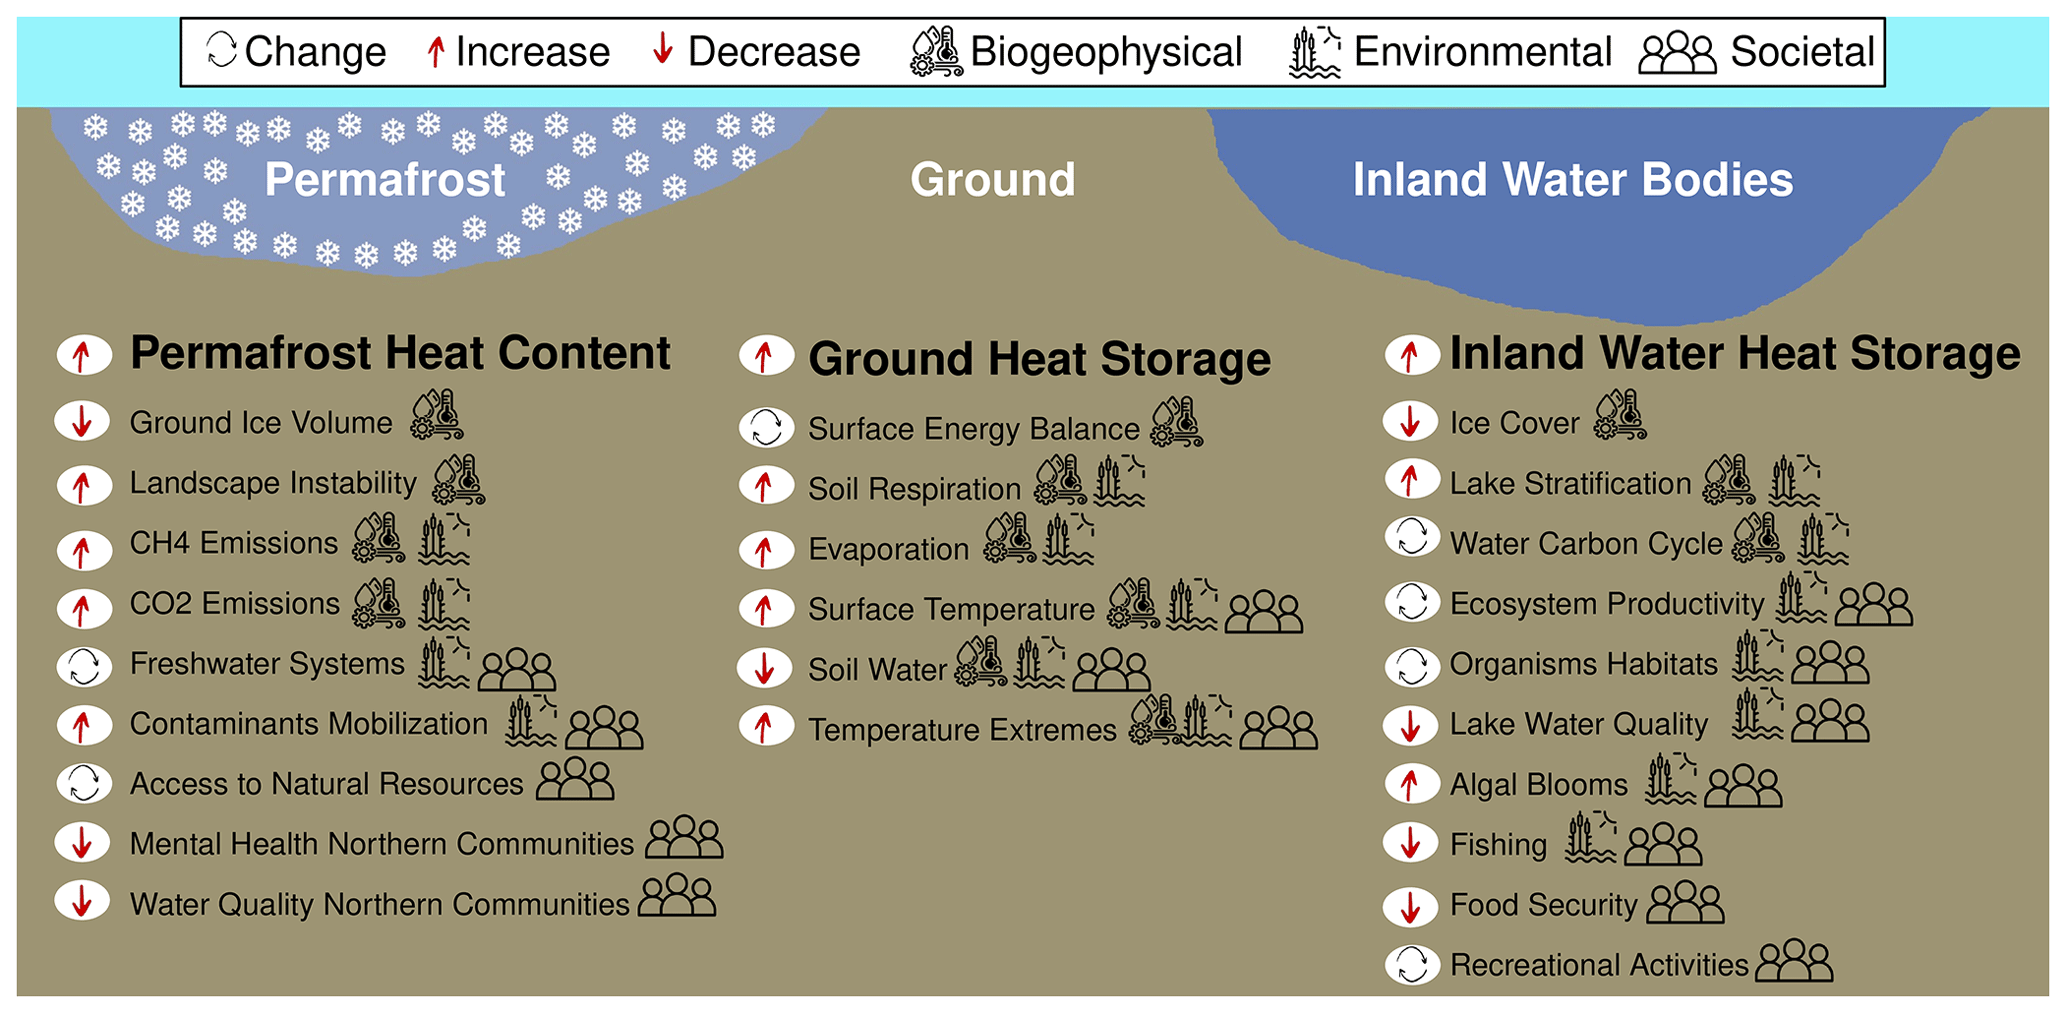
Figure 5Environmental processes and societal implications affected by changes in heat storage within the continental subsurface (ground), inland water bodies, and permafrost soils. Arrows indicate the direction of change for each process according to the increases in heat storage in the corresponding component of the continental heat storage. See Sect. 4 for more details.
Increases in ground heat storage also produce a warmer subsurface, which threatens the stability of the soil carbon pool by enhancing heterotrophic soil respiration and permafrost thawing, thus increasing emissions of greenhouse gases such as carbon dioxide and methane, particularly from northern soils (Koven et al., 2011; MacDougall et al., 2012; Schädel et al., 2014; Schuur et al., 2015; Hicks Pries et al., 2017; McGuire et al., 2018). Although permafrost heat storage is just 9 % of the continental heat storage, the heat used to thaw permafrost during 1994–2017 (1.49±0.31 ZJ) is comparable to the heat used to melt ground ice in Greenland (1.33±0.11 ZJ) and in ice shelf calving globally (1.24±0.29 ZJ) during the same period of time (Slater et al., 2021). Permafrost heat storage is larger than the heat used to melt Antarctic sea ice and Antarctic ground ice, but it is smaller than the heat uptake by global glaciers and Arctic sea ice melting during 1994–2017. Permafrost thawing is also associated with a powerful biogeochemical feedback, the permafrost carbon feedback, that will add additional greenhouse gases into the atmosphere at a pace of 18 PgC per degree Celsius of global warming by 2100 according to the IPCC 6th Assessment Report (Canadell et al., 2021), affecting the fulfilment of the temperature targets of the 2015 Paris Agreement (Natali et al., 2021). Furthermore, the risk of sudden thawing for carbon-rich zones in the Arctic subsurface, like the Yedoma region and peatland-rich regions, has increased in recent decades (Strauss et al., 2013; Nitzbon et al., 2020; Fewster et al., 2022). The abrupt thaw of ice-rich permafrost, mediated by pond formation and the associated collapse of material around the ponds, may constitute a tipping point for the climate system, mostly due to the release of carbon dioxide and methane and the long lifetime of carbon dioxide in the atmosphere (Lenton, 2012; Turetsky et al., 2019). Although the IPCC Special Report on the Ocean and Cryosphere in a Changing Climate indicates low to medium confidence in surpassing this tipping point in the 21st century (Collins et al., 2019), the consequences of crossing this dangerous threshold for the Earth system could be severe (Lenton et al., 2019). Freshwater systems may be altered by the movement of previously frozen water and associated dissolved contaminant materials, including changes in groundwater storage and in river discharge (Bense et al., 2009; Muskett and Romanovsky, 2009). The health of northern communities can thus be affected by the degradation of this previously stable frozen layer, as contaminants such as radon and others can be released into the local freshwater systems (Furgal and Seguin, 2006; Cochand et al., 2019; Teufel and Sushama, 2019; Ji et al., 2021; Miner et al., 2021; Mohammed et al., 2021; Berry and Schnitter, 2022; Glover and Blouin, 2022). Permafrost thawing is also altering the Arctic landscape due to thermokarst processes, including ground subsidence, ponding of water, slope instability, riverbank instability, and channel widening (Jorgenson and Grosse, 2016; Ardelean et al., 2020). Furthermore, changes in landscape hamper travelling (Gädeke et al., 2021) and increase the maintenance costs of buildings, damaging the mental health of northern communities (Lebel et al., 2022) and threatening industrial structures for the retrieval of natural resources (Buslaev et al., 2021).
Heat uptake by inland water bodies and the associated increase in water temperatures are causing changes in lake ice cover duration and lake stratification, ultimately changing the thermal habitats of organisms and evaporation rates (Wang et al., 2018; Woolway et al., 2020; Grant et al., 2021; Kraemer et al., 2021; Woolway et al., 2021b; Zhao et al., 2022). These changes in the thermal state of inland freshwater systems are affecting ecosystem dynamics by degrading water quality, altering the carbon cycle, and producing algal blooms that alter oxygen concentrations and primary productivity, which in turn threatens the food security of communities relying on freshwater fisheries and other ecosystem services, like recreational activities (McIntyre et al., 2016; Woolway et al., 2020, 2021a; Parmesan et al., 2022).
Therefore, it is clear that all three components of the continental heat storage are relevant for understanding the implications of climate change, independently of the different levels of heat storage estimated here. An analogous situation arises from the analysis of the global Earth heat inventory (von Schuckmann et al., 2020), where the ocean is the leading reservoir of heat, accounting for ∼89 % of the total heat gain in the Earth system. However, changes in heat storage in the continental landmasses, the atmosphere, and the cryosphere are also important due to the associated repercussions for society and ecosystems. For instance, changes in cryosphere heat content account for just 4 % of the total heat gain in the system, but accurately quantifying future heat increases in this climate subsystem is critical for projecting sea level rise. In the same way, permafrost heat storage may be just 9 % of the continental heat storage, but thawing of permafrost soils is a potentially large source of greenhouse gases due to its associated permafrost carbon feedback (Miner et al., 2022). Therefore, it is important to monitor all three components of the continental heat storage.
Table 2Continental heat storage (CHS) from this analysis and from von Schuckmann et al. (2020) (vS20) in ZJ (1 ZJ = 1021 J). Results for ground heat storage (GHS), permafrost heat storage (PHS), and inland waters heat storage (IWHS) are also displayed.
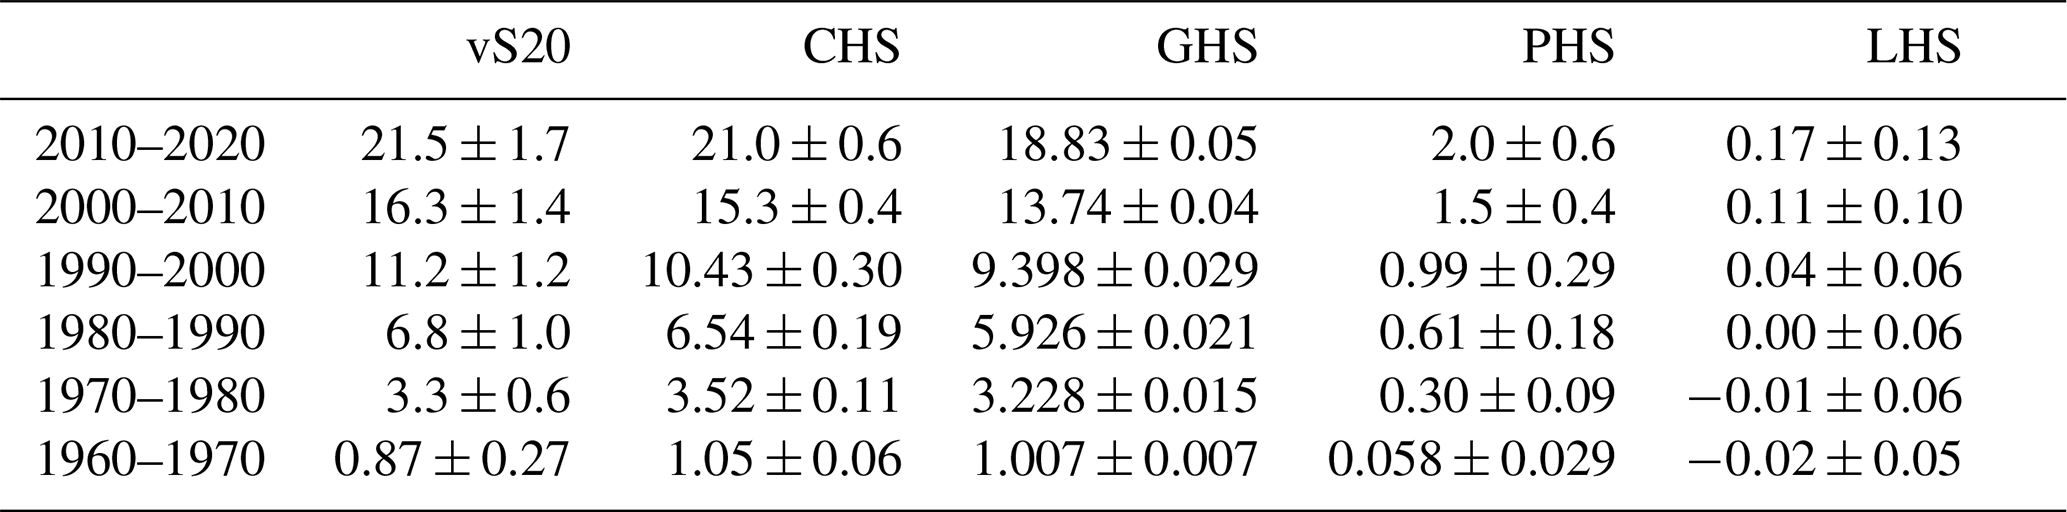
Continental heat storage has been estimated here by considering, for the first time, inland water bodies and permafrost thawing in addition to the land subsurface. All three components present heat gains during the period 1960–2020, with total heat storage increasing more in the last decades of this period (Table 2). Determining the continental heat storage from all land components is important to accurately quantify the Earth heat inventory, which is the critical magnitude informing us about future warming and climate change (von Schuckmann et al., 2020), as well as to provide us with an indicator of the heat-dependent impacts on society and ecosystems (Fig. 5). Monitoring the evolution of continental heat storage and its three subsystems is, therefore, important, and periodic updates of this analysis are planned at a frequency of 2–3 years in order to incorporate new data and techniques.
Certain aspects of the analysis presented here should be improved in future iterations. New measurements of subsurface temperature profiles are crucial to providing ground heat flux estimates for the last 2 decades of the period of interest. Values of ground heat flux from 2000 to 2020 in this analysis consist of an extrapolation due to the lack of sufficient profiles measured after the year 2000. Also, new measurements in the Southern Hemisphere and the Middle East are necessary to characterize areas without coverage in the global network of subsurface temperature profiles. Ideally, an international organization should gather a copy of all available measured subsurface temperature profiles to ensure the maintenance and accessibility of these valuable records in future decades. Such a safe copy of all logs should lead to less-fragmented datasets, harmonizing the archiving practices and metadata requirements for all records, in contrast to current practices in which individual researchers are responsible for measuring, curating, storing, and distributing the data.
Several limitations are also present in our estimate of permafrost heat storage. The primary source of uncertainty in this analysis is the lack of accurate information about the amount and distribution of ground ice in permafrost regions. Additionally, the Tibetan Plateau, the Alpine regions, and the Southern Hemisphere are not included in the analysis; thus, the heat storage by melting of ground ice is probably slightly larger than the values presented here. Since it can be assumed that there is substantially more ground ice in the Arctic region than in the other regions (Zhang et al., 2008), only a small portion of the permafrost heat reservoir is likely to be missing. Among the limitations of the permafrost model are neglected modes of permafrost thaw, such as thermokarst and thermo-erosion. Furthermore, the model does not represent ground subsidence, a dynamic ground hydrology, and processes occurring at subgrid resolution. The absence of these processes affects the representation of the insulating capacity of the active-layer thickness and likely leads to an underestimation of permafrost thaw (Lee et al., 2014; Rodenhizer et al., 2020; Smith et al., 2022a). Most of these limitations arise from the need to perform long-term simulations of permafrost evolution. Therefore, the computational effort, the availability of input data, and the process representation have to be balanced. Including the Tibetan Plateau and the permafrost zones of Antarctica should be possible in the near future, as those require a modest increase in computational resources and input data to derive soil stratigraphies.
Estimates of continental heat storage can potentially be used to constrain and evaluate transient climate simulations performed by global climate models. The Earth heat inventory has already been used to evaluate historical simulations from the fifth phase of the Coupled Model Intercomparison Project (CMIP5), showing that these models present issues in terms of representing a realistic distribution of stored heat among the different climate subsystems, as well as some energy conservation issues (Cuesta-Valero et al., 2021b). The same analysis indicates that the shallow continental subsurface represented in the land surface model (LSM) components is one of the main reasons for their biased representation of the heat inventory. Such a result is in agreement with previous analyses comparing ground heat flux and ground heat storage from subsurface temperature profiles and climate simulations, which has lead to the development of deeper LSMs (MacDougall et al., 2008, 2010; Cuesta-Valero et al., 2016). Furthermore, this deeper subsurface in LSMs has also improved the representation of permafrost dynamics, showing how the ground heat storage retrieved from measurements of subsurface temperature profiles has informed the development of land surface model components for global climate models (Alexeev et al., 2007; Nicolsky et al., 2007; Hermoso de Mendoza et al., 2020; González-Rouco et al., 2021; Steinert et al., 2021). Another approach may be to use the retrieved estimates of continental heat storage as a reference to constraint projections of climate change (Tokarska et al., 2020; Ribes et al., 2021). That is, climate models could be classified depending on how well the models reproduce the change in heat storage in the different components, as it is done with surface temperature increases and other variables (Schmidt et al., 2014; Harrison et al., 2015; Eyring et al., 2019). However, the potential of continental heat storage as a reference may be hampered by the use of models to determine the evolution of heat storage in permafrost soils and inland water bodies, as observations are preferred for evaluating climate simulations.
There are several steps that can be implemented for improving future estimates of ground heat storage. Expanding the number of estimates of ground heat flux has a high priority, as the ground heat storage is the largest term of the continental heat storage. New measurements of subsurface temperature profiles in areas not well represented in the current global database, regions such as northern and central Africa, South America, the Middle East, and southeastern Asia, are important for improving the spatial coverage of the current subsurface temperature dataset. Furthermore, strengthening the global network of subsurface profiles by repeating measurements at previously measured sites would reduce uncertainties for the warming of the continental subsurface in the last decades. Flux estimates from other datasets can be also considered, such as from FluxNet towers and from satellite remote sensing data. Indeed, there is an increasing population of satellites providing information about land surface conditions and changes in land cover, and several methods are also being developed to obtain accurate estimates of climate variables from satellite remote sensing observations in combination with land observational networks and numerical models (Balsamo et al., 2018).
Expanding the permafrost areas considered here, particularly the inclusion of the Tibetan Plateau, would be a priority in the next iterations of this analysis. Further sources of information to retrieve estimates of permafrost heat storage should also be considered in order to increase the confidence of the results obtained here. Ideally, monitoring of liquid water content in permafrost soils along with borehole temperature measurements would form a complementary dataset besides modelling for estimating permafrost heat storage. However, the current observational networks in the Arctic and on the Tibetan Plateau are not equipped to perform such measurements, and their spatial coverage should be expanded to include currently unmeasured zones in the Canadian Arctic and Eurasia (Biskaborn et al., 2015). Monitoring sites tend to be near inhabited locations, existing infrastructure, and resource development sites, leaving large areas without coverage (Smith et al., 2022b). These ground temperature measurements, nevertheless, could be used to inform us about subsurface warming and ground heat storage in future studies. Multimodel simulations using land surface models that represent permafrost, such as those from the sixth phase of the Coupled Model Intercomparison Project (CMIP6), may be considered for including the uncertainty due to different model structures in the analysis. However, direct use of the simulated ice content and soil temperatures from the CMIP simulations is not currently possible because the represented soil column in the models is too shallow to assess the evolution of the thermal state of the ground beyond the near-surface permafrost (Koven et al., 2013; Slater and Lawrence, 2013; Burke et al., 2020; Hermoso de Mendoza et al., 2020; Steinert et al., 2021). Furthermore, these land surface model components do not represent excess ice in the ground or ground subsidence, which bias the represented permafrost thawing (Lee et al., 2014; Rodenhizer et al., 2020). Some ongoing efforts are trying to mitigate this lack of information (e.g. O'Neill et al., 2019; Smith et al., 2022a), which could be incorporated into a future version of this analysis. Replacing ERA-Interim forcing with ERA5 data and forcing for the last decades of the 20th century and the first decades of the 21st century should also be considered.
The inland waters heat storage estimates could be refined using spatially varying morphometry characteristics to determine lake volumes per grid cell. The availability of new datasets like GLOBathy (Khazaei et al., 2022) and new insights from the upcoming Surface Water and Ocean Topography (SWOT) mission would allow such an approach. Using this lake morphology together with an updated lake mask in the global lake model simulations would further improve the lake temperature trends. Such simulations will become available in the upcoming ISIMIP3 round (Golub et al., 2022). In addition, emerging remote sensing products of lake surface temperatures can be used to better calibrate and validate the global lake models, which will further improve the simulated temperature profiles (Golub et al., 2022). Finally, to improve the estimates of heat stored in rivers, better estimates of the water volumes in rivers are required in addition to explicitly modelled river temperatures (Wanders et al., 2019). These will be included in ISIMIP3, as process-based global hydrological models now also simulate river temperatures.
The final goal of this collaboration consists of quantifying continental heat storage at the global scale from observations. Nevertheless, obtaining such an estimate is challenging due to the lack of appropriate observational datasets. Given the amount of time and the resources required to set up observing systems or to expand existing ones, together with the challenges associated with long-term maintenance and data continuity, an intermediate solution based on including more remote sensing and reanalysis datasets in the analysis should be explored in the near term. Relevant variables derived from satellite observations or assimilated in reanalysis products, such as land surface temperature, leaf area index, or snow cover, could drive the modelling frameworks used here, increasing the role of observations in estimates of continental heat storage. Furthermore, the near-global coverage of remote sensing satellite observations and the homogeneity of reanalysis products, together with the relatively long periods included in the datasets, would allow the derivation of estimates useful for climate studies without waiting for years or decades for observational recording.
The subsurface temperature profiles from the Xibalbá dataset were used to derive ground heat fluxes and are available in Cuesta-Valero et al. (2021a). All ISIMIP2b global lake simulations used are publicly available through the ISIMIP repository (https://doi.org/10.48364/ISIMIP.931371, Marcé et al., 2022). The HydroLAKES dataset is available at https://doi.org/10.1038/ncomms13603 (Messager et al., 2016), the GRanD dataset is available at https://doi.org/10.1890/100125 (Lehner et al., 2011), and the GLDB dataset is available at https://doi.org/10.3402/tellusa.v66.21295 (Choulga et al., 2014). The scripts used for the inland-water heat storage calculations are available at https://doi.org/10.5281/zenodo.7837996 (Vanderkelen et al., 2023).
The supplement related to this article is available online at: https://doi.org/10.5194/esd-14-609-2023-supplement.
The overall coordination of this initiative was driven by FJCV and KvS. The estimates of ground heat flux and ground heat storage were provided by FJCV. The estimates of permafrost heat storage were provided by JN and ML. The estimates of heat flux and heat storage from inland water bodies were provided by IV and WT. All the authors contributed to the analysis of results and the list of implications. FJCV wrote the paper with continuous input from all the authors.
The contact author has declared that none of the authors has any competing interests.
Publisher’s note: Copernicus Publications remains neutral with regard to jurisdictional claims in published maps and institutional affiliations.
Francisco José Cuesta-Valero is an Alexander von Humboldt Research Fellow at the Helmholtz-Centre for Environmental Research (UFZ). Hugo Beltrami was supported by grants from the National Sciences and Engineering Research Council of Canada Discovery (grant no. NSERC DG 140576948), the Canada Research Chairs Program (grant no. CRC 230687), and the Canadian Foundation for Innovation and the Digital Research Alliance of Canada (Compute Canada, AceNet). Hugo Beltrami holds a Canada Research Chair in Climate Dynamics. Moritz Langer and Jan Nitzbon were supported by a grant from the German Federal Ministry of Education and Research (BMBF, project PermaRisk, grant no. 01LN1709A). Inne Vanderkelen is a research fellow at the Research Foundation Flanders (grant no. FWOTM920). The resources and services used in this work were provided by the VSC (Flemish Supercomputer Center) and were funded by the Research Foundation – Flanders (FWO) and the Flemish Government.
This research has been supported by
the Alexander von Humboldt-Stiftung (grant no. Research Fellowship), the Natural
Sciences and Engineering Research Council of Canada (grant no. DG 140576948), the
Canada Research Chairs Program (grant no. CRC 230687), the Canadian Foundation for
Innovation and the Digital Research Alliance of Canada (Compute Canada, AceNet), the
Bundesministerium für Bildung und Forschung (grant no. 01LN1709A), and the Fonds
Wetenschappelijk Onderzoek (grant no. FWOTM920).
The article processing charges for this open-access publication were covered by the Helmholtz Centre for Environmental Research – UFZ.
This paper was edited by Fubao Sun and reviewed by three anonymous referees.
Alexeev, V. A., Nicolsky, D. J., Romanovsky, V. E., and Lawrence, D. M.: An evaluation of deep soil configurations in the CLM3 for improved representation of permafrost, Geophys. Res. Lett., 34, l09502, https://doi.org/10.1029/2007GL029536, 2007. a
Ardelean, F., Onaca, A., Chețan, M.-A., Dornik, A., Georgievski, G., Hagemann, S., Timofte, F., and Berzescu, O.: Assessment of Spatio-Temporal Landscape Changes from VHR Images in Three Different Permafrost Areas in the Western Russian Arctic, Remote Sens., 12, 3999, https://doi.org/10.3390/rs12233999, 2020. a
Balsamo, G., Agusti-Panareda, A., Albergel, C., Arduini, G., Beljaars, A., Bidlot, J., Blyth, E., Bousserez, N., Boussetta, S., Brown, A., Buizza, R., Buontempo, C., Chevallier, F., Choulga, M., Cloke, H., Cronin, M. F., Dahoui, M., Rosnay, P. D., Dirmeyer, P. A., Drusch, M., Dutra, E., Ek, M. B., Gentine, P., Hewitt, H., Keeley, S. P., Kerr, Y., Kumar, S., Lupu, C., Mahfouf, J.-F., McNorton, J., Mecklenburg, S., Mogensen, K., Muñoz-Sabater, J., Orth, R., Rabier, F., Reichle, R., Ruston, B., Pappenberger, F., Sandu, I., Seneviratne, S. I., Tietsche, S., Trigo, I. F., Uijlenhoet, R., Wedi, N., Woolway, R. I., and Zeng, X.: Satellite and In Situ Observations for Advancing Global Earth Surface Modelling: A Review, Remote Sens., 10, 2038, https://doi.org/10.3390/rs10122038, 2018. a
Beltrami, H.: Surface heat flux histories from inversion of geothermal data: Energy balance at the Earth's surface, J. Geophys. Res.-Sol. Ea., 106, 21979–21993, https://doi.org/10.1029/2000JB000065, 2001. a, b
Beltrami, H.: Earth's Long-Term Memory, Science, 297, 206–207, https://doi.org/10.1126/science.1074027, 2002. a, b
Beltrami, H. and Mareschal, J.-C.: Ground temperature histories for central and eastern Canada from geothermal measurements: Little Ice Age signature, Geophys. Res. Lett., 19, 689–692, https://doi.org/10.1029/92GL00671, 1992. a
Beltrami, H., Smerdon, J. E., Pollack, H. N., and Huang, S.: Continental heat gain in the global climate system, Geophys. Res. Lett., 29, 1–3, https://doi.org/10.1029/2001GL014310, 2002. a, b, c, d, e, f
Beltrami, H., Matharoo, G. S., and Smerdon, J. E.: Ground surface temperature and continental heat gain: uncertainties from underground, Environ. Res. Lett., 10, 014009, https://doi.org/10.1088/1748-9326/10/1/014009, 2015. a
Bennett, W. B., Wang, J., and Bras, R. L.: Estimation of Global Ground Heat Flux, J. Hydrometeorol., 9, 744–759, https://doi.org/10.1175/2008JHM940.1, 2008. a
Bense, V. F., Ferguson, G., and Kooi, H.: Evolution of shallow groundwater flow systems in areas of degrading permafrost, Geophys. Res. Lett., 36, L22401, https://doi.org/10.1029/2009gl039225, 2009. a
Berry, P. and Schnitter, R.: Health of Canadians in a Changing Climate: Advancing our Knowledge for Action, Government of Canada, Ottawa, ON, https://changingclimate.ca/health-in-a-changing-climate/, last access: 17 February 2022. a
Biskaborn, B. K., Lanckman, J.-P., Lantuit, H., Elger, K., Streletskiy, D. A., Cable, W. L., and Romanovsky, V. E.: The new database of the Global Terrestrial Network for Permafrost (GTN-P), Earth Syst. Sci. Data, 7, 245–259, https://doi.org/10.5194/essd-7-245-2015, 2015. a
Biskaborn, B. K., Smith, S. L., Noetzli, J., Matthes, H., Vieira, G., Streletskiy, D. A., Schoeneich, P., Romanovsky, V. E., Lewkowicz, A. G., Abramov, A., Allard, M., Boike, J., Cable, W. L., Christiansen, H. H., Delaloye, R., Diekmann, B., Drozdov, D., Etzelmüller, B., Grosse, G., Guglielmin, M., Ingeman-Nielsen, T., Isaksen, K., Ishikawa, M., Johansson, M., Johannsson, H., Joo, A., Kaverin, D., Kholodov, A., Konstantinov, P., Kröger, T., Lambiel, C., Lanckman, J.-P., Luo, D., Malkova, G., Meiklejohn, I., Moskalenko, N., Oliva, M., Phillips, M., Ramos, M., Sannel, A. B. K., Sergeev, D., Seybold, C., Skryabin, P., Vasiliev, A., Wu, Q., Yoshikawa, K., Zheleznyak, M., and Lantuit, H.: Permafrost is warming at a global scale, Nat. Commun., 10, 264, https://doi.org/10.1038/s41467-018-08240-4, 2019. a
Bonan, G. B.: Ecological Climatology: concepts and applications, Cambridge University Press, ISBN 110761905X, 2002. a, b
Brown, J., Ferrians, O., Heginbottom, J., and Melnikov, E.: Circum-Arctic Map of Permafrost and Ground-Ice Conditions, Version 2, National Snow and Ice Data Center, https://doi.org/10.7265/skbg-kf16, 1997. a
Burke, E. J., Zhang, Y., and Krinner, G.: Evaluating permafrost physics in the Coupled Model Intercomparison Project 6 (CMIP6) models and their sensitivity to climate change, The Cryosphere, 14, 3155–3174, https://doi.org/10.5194/tc-14-3155-2020, 2020. a, b
Buslaev, G., Tsvetkov, P., Lavrik, A., Kunshin, A., Loseva, E., and Sidorov, D.: Ensuring the Sustainability of Arctic Industrial Facilities under Conditions of Global Climate Change, Resources, 10, 128, https://doi.org/10.3390/resources10120128, 2021. a
Canadell, J., Monteiro, P., Costa, M., Cotrim da Cunha, L., Cox, P., Eliseev, A., Henson, S., Ishii, M., Jaccard, S., Koven, C., Lohila, A., Patra, P., Piao, S., Rogelj, J., Syampungani, S., Zaehle, S., and Zickfeld, K.: Global Carbon and other Biogeochemical Cycles and Feedbacks, Cambridge University Press, Cambridge, United Kingdom and New York, NY, USA, 673–816, https://doi.org/10.1017/9781009157896.007, 2021. a
Carslaw, H. S. and Jaeger, J. C.: Conduction of Heat in Solids, Clarendon Press, Oxford, ISBN 0198533683, 1959. a
Choulga, M., Kourzeneva, E., Zakharova, E., and Doganovsky, A.: Estimation of the mean depth of boreal lakes for use in numerical weather prediction and climate modelling, [date set], Tellus A, 66, 21295, https://doi.org/10.3402/tellusa.v66.21295, 2014. a
Choulga, M., Kourzeneva, E., Balsamo, G., Boussetta, S., and Wedi, N.: Upgraded global mapping information for earth system modelling: an application to surface water depth at the ECMWF, Hydrol. Earth Syst. Sci., 23, 4051–4076, https://doi.org/10.5194/hess-23-4051-2019, 2019. a
Church, J. A., White, N. J., Konikow, L. F., Domingues, C. M., Cogley, J. G., Rignot, E., Gregory, J. M., van den Broeke, M. R., Monaghan, A. J., and Velicogna, I.: Revisiting the Earth's sea-level and energy budgets from 1961 to 2008, Geophys. Res. Lett., 38, l18601, https://doi.org/10.1029/2011GL048794, 2011. a, b
Clauser, C. and Mareschal, J.-C.: Ground temperature history in central Europe from borehole temperature data, Geophys. J. Int., 121, 805–817, https://doi.org/10.1111/j.1365-246X.1995.tb06440.x, 1995. a
Cochand, M., Molson, J., and Lemieux, J.-M.: Groundwater hydrogeochemistry in permafrost regions, Permafrost Periglac., 30, 90–103, https://doi.org/10.1002/ppp.1998, 2019. a
Collins, M., Sutherland, M., Bouwer, L., Cheong, S.-M., Frölicher, T., Jacot Des Combes, H., Koll Roxy, M., Losada, I., McInnes, K., Ratter, B., Rivera-Arriaga, E., Susanto, R., Swingedouw, D., and Tibig, L.: Extremes, Abrupt Changes and Managing Risk, in: IPCC Special Report on the Ocean and Cryosphere in a Changing Climate, edited by: Pörtner, H.-O., Roberts, D., Masson-Delmotte, V., Zhai, P., Tignor, M., Poloczanska, E., Mintenbeck, K., Alegría, A., Nicolai, M., Okem, A., Petzold, J., Rama, B., and Weyer, N., chap. 6, https://www.ipcc.ch/site/assets/uploads/sites/3/2019/11/ 10_SROCC_Ch06_FINAL.pdf (last access: 17 April 2023), 2019. a
Cuesta-Valero, F. J., García-García, A., Beltrami, H., and Smerdon, J. E.: First assessment of continental energy storage in CMIP5 simulations, Geophys. Res. Lett., 43, 5326–5335, https://doi.org/10.1002/2016GL068496, 2016. a
Cuesta-Valero, F. J., García-García, A., Beltrami, H., Zorita, E., and Jaume-Santero, F.: Long-term Surface Temperature (LoST) database as a complement for GCM preindustrial simulations, Clim. Past, 15, 1099–1111, https://doi.org/10.5194/cp-15-1099-2019, 2019. a, b
Cuesta-Valero, F. J., Beltrami, H., García-García, A., González-Rourco, J. F., and García-Bustamante, E.: Xibalbá: Underground Temperature Database, https://doi.org/10.6084/m9.figshare.13516487.v4, 2021a. a, b
Cuesta-Valero, F. J., García-García, A., Beltrami, H., and Finnis, J.: First assessment of the earth heat inventory within CMIP5 historical simulations, Earth Syst. Dynam., 12, 581–600, https://doi.org/10.5194/esd-12-581-2021, 2021b. a
Cuesta-Valero, F. J., García-García, A., Beltrami, H., González-Rouco, J. F., and García-Bustamante, E.: Long-term global ground heat flux and continental heat storage from geothermal data, Clim. Past, 17, 451–468, https://doi.org/10.5194/cp-17-451-2021, 2021c. a, b, c, d, e, f, g, h
Cuesta-Valero, F. J., Beltrami, H., Gruber, S., García-García, A., and González-Rouco, J. F.: A new bootstrap technique to quantify uncertainty in estimates of ground surface temperature and ground heat flux histories from geothermal data, Geosci. Model Dev., 15, 7913–7932, https://doi.org/10.5194/gmd-15-7913-2022, 2022. a, b, c, d
Davies, J. H.: Global map of solid Earth surface heat flow, Geochem. Geophys. Geosys., 14, 4608–4622, https://doi.org/10.1002/ggge.20271, 2013. a
Davison, A. C. and Hinkley, D. V.: Bootstrap Methods and their Application, Cambridge University Press, Cambridge, United Kingdom, ISBN 0521573912, 1997. a
Dee, D. P., Uppala, S. M., Simmons, A. J., Berrisford, P., Poli, P., Kobayashi, S., Andrae, U., Balmaseda, M. A., Balsamo, G., Bauer, P., Bechtold, P., Beljaars, A. C. M., van de Berg, L., Bidlot, J., Bormann, N., Delsol, C., Dragani, R., Fuentes, M., Geer, A. J., Haimberger, L., Healy, S. B., Hersbach, H., Hólm, E. V., Isaksen, L., Kållberg, P., Köhler, M., Matricardi, M., McNally, A. P., Monge-Sanz, B. M., Morcrette, J.-J., Park, B.-K., Peubey, C., de Rosnay, P., Tavolato, C., Thépaut, J.-N., and Vitart, F.: The ERA-Interim reanalysis: configuration and performance of the data assimilation system, Q. J. Roy. Meteor. Soc., 137, 553–597, https://doi.org/10.1002/qj.828, 2011. a
DiCiccio, T. J. and Efron, B.: Bootstrap confidence intervals, Stat. Sci., 11, 189–228, https://doi.org/10.1214/ss/1032280214, 1996. a
Douville, H., Raghavan, K., Renwick, J., Allan, R., Arias, P., Barlow, M., Cerezo-Mota, R., Cherchi, A., Gan, T., Gergis, J., Jiang, D., Khan, A., Pokam Mba, W., Rosenfeld, D., Tierney, J., and Zolina, O.: Water Cycle Changes, Cambridge University Press, Cambridge, United Kingdom and New York, NY, USA, 1055–1210, https://doi.org/10.1017/9781009157896.010, 2021. a
Efron, B.: Better Bootstrap Confidence Intervals, J. Am. Stat. Assoc., 82, 171–185, https://doi.org/10.1080/01621459.1987.10478410, 1987. a
Eyring, V., Cox, P. M., Flato, G. M., Gleckler, P. J., Abramowitz, G., Caldwell, P., Collins, W. D., Gier, B. K., Hall, A. D., Hoffman, F. M., Hurtt, G. C., Jahn, A., Jones, C. D., Klein, S. A., Krasting, J. P., Kwiatkowski, L., Lorenz, R., Maloney, E., Meehl, G. A., Pendergrass, A. G., Pincus, R., Ruane, A. C., Russell, J. L., Sanderson, B. M., Santer, B. D., Sherwood, S. C., Simpson, I. R., Stouffer, R. J., and Williamson, M. S.: Taking climate model evaluation to the next level, Nat. Clim. Change, 9, 102–110, https://doi.org/10.1038/s41558-018-0355-y, 2019. a
Faroux, S., Kaptué Tchuenté, A. T., Roujean, J.-L., Masson, V., Martin, E., and Le Moigne, P.: ECOCLIMAP-II/Europe: a twofold database of ecosystems and surface parameters at 1 km resolution based on satellite information for use in land surface, meteorological and climate models, Geosci. Model Dev., 6, 563–582, https://doi.org/10.5194/gmd-6-563-2013, 2013. a
Fewster, R. E., Morris, P. J., Ivanovic, R. F., Swindles, G. T., Peregon, A. M., and Smith, C. J.: Imminent loss of climate space for permafrost peatlands in Europe and Western Siberia, Nat. Clim. Change, 12, 373–379, https://doi.org/10.1038/s41558-022-01296-7, 2022. a
Fischer, E. M., Seneviratne, S. I., Vidale, P. L., Lüthi, D., and Schär, C.: Soil Moisture–Atmosphere Interactions during the 2003 European Summer Heat Wave, J. Climate, 20, 5081–5099, https://doi.org/10.1175/JCLI4288.1, 2007. a
Forster, P., Storelvmo, T., Armour, K., Collins, W., Dufresne, J.-L., Frame, D., Lunt, D., Mauritsen, T., Palmer, M., Watanabe, M., Wild, M., and Zhang, H.: The Earth’s Energy Budget, Climate Feedbacks, and Climate Sensitivity, Cambridge University Press, Cambridge, United Kingdom and New York, NY, USA, 923–1054, https://doi.org/10.1017/9781009157896.009, 2021. a
Fox-Kemper, B., Hewitt, H., Xiao, C., Aðalgeirsdóttir, G., Drijfhout, S., Edwards, T., Golledge, N., Hemer, M., Kopp, R., Krinner, G., Mix, A., Notz, D., Nowicki, S., Nurhati, I., Ruiz, L., Sallée, J.-B., Slangen, A., and Yu, Y.: Ocean, Cryosphere and Sea Level Change, Cambridge University Press, Cambridge, United Kingdom and New York, NY, USA, 1211–1362, https://doi.org/10.1017/9781009157896.011, 2021. a, b
Frieler, K., Lange, S., Piontek, F., Reyer, C. P. O., Schewe, J., Warszawski, L., Zhao, F., Chini, L., Denvil, S., Emanuel, K., Geiger, T., Halladay, K., Hurtt, G., Mengel, M., Murakami, D., Ostberg, S., Popp, A., Riva, R., Stevanovic, M., Suzuki, T., Volkholz, J., Burke, E., Ciais, P., Ebi, K., Eddy, T. D., Elliott, J., Galbraith, E., Gosling, S. N., Hattermann, F., Hickler, T., Hinkel, J., Hof, C., Huber, V., Jägermeyr, J., Krysanova, V., Marcé, R., Müller Schmied, H., Mouratiadou, I., Pierson, D., Tittensor, D. P., Vautard, R., van Vliet, M., Biber, M. F., Betts, R. A., Bodirsky, B. L., Deryng, D., Frolking, S., Jones, C. D., Lotze, H. K., Lotze-Campen, H., Sahajpal, R., Thonicke, K., Tian, H., and Yamagata, Y.: Assessing the impacts of 1.5 ∘C global warming – simulation protocol of the Inter-Sectoral Impact Model Intercomparison Project (ISIMIP2b), Geosci. Model Dev., 10, 4321–4345, https://doi.org/10.5194/gmd-10-4321-2017, 2017. a
Furgal, C. and Seguin, J.: Climate change, health, and vulnerability in Canadian northern Aboriginal communities, Environ. Health Persp., 114, 1964–1970, 2006. a
Gädeke, A., Langer, M., Boike, J., Burke, E. J., Chang, J., Head, M., Reyer, C. P. O., Schaphoff, S., Thiery, W., and Thonicke, K.: Climate change reduces winter overland travel across the Pan-Arctic even under low-end global warming scenarios, Environ. Res. Lett., 16, 024049, https://doi.org/10.1088/1748-9326/abdcf2, 2021. a
García-García, A., Cuesta-Valero, F. J., Beltrami, H., and Smerdon, J. E.: Simulation of air and ground temperatures in PMIP3/CMIP5 last millennium simulations: implications for climate reconstructions from borehole temperature profiles, Environ. Res. Lett., 11, 044022, https://doi.org/10.1088/1748-9326/11/4/044022, 2016. a, b
Glover, P. and Blouin, M.: Increased Radon Exposure from Thawing of Permafrost Due to Climate Change, Earth's Future, 10, e2021EF002598, https://doi.org/10.1029/2021EF002598, 2022. a
Golub, M., Thiery, W., Marcé, R., Pierson, D., Vanderkelen, I., Mercado-Bettin, D., Woolway, R. I., Grant, L., Jennings, E., Kraemer, B. M., Schewe, J., Zhao, F., Frieler, K., Mengel, M., Bogomolov, V. Y., Bouffard, D., Côté, M., Couture, R.-M., Debolskiy, A. V., Droppers, B., Gal, G., Guo, M., Janssen, A. B. G., Kirillin, G., Ladwig, R., Magee, M., Moore, T., Perroud, M., Piccolroaz, S., Raaman Vinnaa, L., Schmid, M., Shatwell, T., Stepanenko, V. M., Tan, Z., Woodward, B., Yao, H., Adrian, R., Allan, M., Anneville, O., Arvola, L., Atkins, K., Boegman, L., Carey, C., Christianson, K., de Eyto, E., DeGasperi, C., Grechushnikova, M., Hejzlar, J., Joehnk, K., Jones, I. D., Laas, A., Mackay, E. B., Mammarella, I., Markensten, H., McBride, C., Özkundakci, D., Potes, M., Rinke, K., Robertson, D., Rusak, J. A., Salgado, R., van der Linden, L., Verburg, P., Wain, D., Ward, N. K., Wollrab, S., and Zdorovennova, G.: A framework for ensemble modelling of climate change impacts on lakes worldwide: the ISIMIP Lake Sector, Geosci. Model Dev., 15, 4597–4623, https://doi.org/10.5194/gmd-15-4597-2022, 2022. a, b, c, d
González-Rouco, J. F., Beltrami, H., Zorita, E., and von Storch, H.: Simulation and inversion of borehole temperature profiles in surrogate climates: Spatial distribution and surface coupling, Geophys. Res. Lett., 33, l01703, https://doi.org/10.1029/2005GL024693, 2006. a
González-Rouco, J. F., Beltrami, H., Zorita, E., and Stevens, M. B.: Borehole climatology: a discussion based on contributions from climate modeling, Clim. Past, 5, 97–127, https://doi.org/10.5194/cp-5-97-2009, 2009. a, b
González-Rouco, J. F., J.Steinert, N., E.García-Bustamante, Hagemann, S., de Vreseand J. H. Jungclaus, P., Lorenz, S. J., Melo-Aguilar, C., García-Pereira, F., and Navarro, J.: Increasing the Depth of a Land Surface Model. Part I: Impacts on the Subsurface Thermal Regime and Energy Storage, J. Hydrometeorol., 22, 3211–3230, https://doi.org/10.1175/JHM-D-21-0024.1, 2021. a
Goudsmit, G.-H., Burchard, H., Peeters, F., and Wüest, A.: Application of κ-ϵ turbulence models to enclosed basins: The role of internal seiches, J. Geophys. Res.-Oceans, 107, 1–13, https://doi.org/10.1029/2001jc000954, 2002. a
Grant, L., Vanderkelen, I., Gudmundsson, L., Tan, Z., Perroud, M., Stepanenko, V. M., Debolskiy, A. V., Droppers, B., Janssen, A. B. G., Woolway, R. I., Choulga, M., Balsamo, G., Kirillin, G., Schewe, J., Zhao, F., del Valle, I. V., Golub, M., Pierson, D., Marcé, R., Seneviratne, S. I., and Thiery, W.: Attribution of global lake systems change to anthropogenic forcing, Nat. Geosci., 14, 849–854, https://doi.org/10.1038/s41561-021-00833-x, 2021. a
Gulev, S., Thorne, P., Ahn, J., Dentener, F., Domingues, C., Gerland, S., Gong, D., Kaufman, D., Nnamchi, H., Quaas, J., Rivera, J., Sathyendranath, S., Smith, S., Trewin, B., von Schuckmann, K., and Vose, R.: Changing State of the Climate System, Cambridge University Press, Cambridge, United Kingdom and New York, NY, USA, 287–422, https://doi.org/10.1017/9781009157896.004, 2021. a, b
Hansen, J., Sato, M., Kharecha, P., and von Schuckmann, K.: Earth's energy imbalance and implications, Atmos. Chem. Phys., 11, 13421–13449, https://doi.org/10.5194/acp-11-13421-2011, 2011. a, b
Harrison, S. P., Bartlein, P. J., Izumi, K., Li, G., Annan, J., Hargreaves, J., Braconnot, P., and Kageyama, M.: Evaluation of CMIP5 palaeo-simulations to improve climate projections, Nat. Clim. Change, 5, 735–743, https://doi.org/10.1038/nclimate2649, 2015. a
Hermoso de Mendoza, I., Beltrami, H., MacDougall, A. H., and Mareschal, J.-C.: Lower boundary conditions in land surface models – effects on the permafrost and the carbon pools: a case study with CLM4.5, Geosci. Model Dev., 13, 1663–1683, https://doi.org/10.5194/gmd-13-1663-2020, 2020. a, b, c
Hicks Pries, C. E., Castanha, C., Porras, R. C., and Torn, M. S.: The whole-soil carbon flux in response to warming, Science, 355, 1420–1423, https://doi.org/10.1126/science.aal1319, 2017. a
Hugelius, G., Bockheim, J. G., Camill, P., Elberling, B., Grosse, G., Harden, J. W., Johnson, K., Jorgenson, T., Koven, C. D., Kuhry, P., Michaelson, G., Mishra, U., Palmtag, J., Ping, C.-L., O'Donnell, J., Schirrmeister, L., Schuur, E. A. G., Sheng, Y., Smith, L. C., Strauss, J., and Yu, Z.: A new data set for estimating organic carbon storage to 3 m depth in soils of the northern circumpolar permafrost region, Earth Syst. Sci. Data, 5, 393–402, https://doi.org/10.5194/essd-5-393-2013, 2013. a
Håkanson, L.: On Lake Form, Lake Volume and Lake Hypsographic Survey, Geografiska Annaler. Series A, Phys. Geogr., 59, 1–30, https://doi.org/10.2307/520579, 1977. a
IPCC: Climate Change 2021: The Physical Science Basis. Contribution of Working Group I to the Sixth Assessment Report of the Intergovernmental Panel on Climate Change, Cambridge University Press, Cambridge, United Kingdom and New York, NY, USA, https://doi.org/10.1017/9781009157896, 2021. a
Jaume-Santero, F., Pickler, C., Beltrami, H., and Mareschal, J.-C.: North American regional climate reconstruction from ground surface temperature histories, Clim. Past, 12, 2181–2194, https://doi.org/10.5194/cp-12-2181-2016, 2016. a
Jaupard, C. and Mareschal, J. C.: Heat generation and transport in the Earth, Cambridge University Press, New York, ISBN 978-0-521-89488-3, 2010. a
Ji, X., Abakumov, E., Polyakov, V., and Xie, X.: Mobilization of Geochemical Elements to Surface Water in the Active Layer of Permafrost in the Russian Arctic, Water Resour. Res., 57, e2020WR028269, https://doi.org/10.1029/2020WR028269, 2021. a
Johansson, H., Brolin, A. A., and Håkanson, L.: New Approaches to the Modelling of Lake Basin Morphometry, Environ. Model. Assess., 12, 213–228, https://doi.org/10.1007/s10666-006-9069-z, 2007. a, b, c
Jorgenson, M. T. and Grosse, G.: Remote Sensing of Landscape Change in Permafrost Regions, Permafrost Periglac., 27, 324–338, https://doi.org/10.1002/ppp.1914, 2016. a
Khazaei, B., Read, L. K., Casali, M., Sampson, K. M., and Yates, D. N.: GLOBathy, the global lakes bathymetry dataset, Sci. Data, 9, 36, https://doi.org/10.1038/s41597-022-01132-9, 2022. a, b
Koven, C. D., Ringeval, B., Friedlingstein, P., Ciais, P., Cadule, P., Khvorostyanov, D., Krinner, G., and Tarnocai, C.: Permafrost carbon-climate feedbacks accelerate global warming, P. Natl. Acad. Sci. USA, 108, 14769–14774, https://doi.org/10.1073/pnas.1103910108, 2011. a
Koven, C. D., Riley, W. J., and Stern, A.: Analysis of Permafrost Thermal Dynamics and Response to Climate Change in the CMIP5 Earth System Models, J. Climate, 26, 1877–1900, https://doi.org/10.1175/JCLI-D-12-00228.1, 2013. a, b
Kraemer, B. M., Pilla, R. M., Woolway, R. I., Anneville, O., Ban, S., Colom-Montero, W., Devlin, S. P., Dokulil, M. T., Gaiser, E. E., Hambright, K. D., Hessen, D. O., Higgins, S. N., Jöhnk, K. D., Keller, W., Knoll, L. B., Leavitt, P. R., Lepori, F., Luger, M. S., Maberly, S. C., Müller-Navarra, D. C., Paterson, A. M., Pierson, D. C., Richardson, D. C., Rogora, M., Rusak, J. A., Sadro, S., Salmaso, N., Schmid, M., Silow, E. A., Sommaruga, R., Stelzer, J. A. A., Straile, D., Thiery, W., Timofeyev, M. A., Verburg, P., Weyhenmeyer, G. A., and Adrian, R.: Climate change drives widespread shifts in lake thermal habitat, Nat. Clim. Change, 11, 521–529, https://doi.org/10.1038/s41558-021-01060-3, 2021. a
Lanczos, C.: Linear differential operators, Van Nostrand, New York, ISBN 0-89871-370-6, 1961. a
Langer, M., Nitzbon, J., Groenke, B., Assmann, L.-M., Schneider von Deimling, T., Stuenzi, S. M., and Westermann, S.: The evolution of Arctic permafrost over the last three centuries, EGUsphere [preprint], https://doi.org/10.5194/egusphere-2022-473, 2022. a, b, c, d
Lebel, L., Paquin, V., Kenny, T.-A., Fletcher, C., Nadeau, L., Chachamovich, E., and Lemire, M.: Climate change and Indigenous mental health in the Circumpolar North: A systematic review to inform clinical practice, Transcult. Psych., 59, 312–336, https://doi.org/10.1177/13634615211066698, 2022. a
Lee, H., Swenson, S. C., Slater, A. G., and Lawrence, D. M.: Effects of excess ground ice on projections of permafrost in a warming climate, Environ. Res. Lett., 9, 124006, https://doi.org/10.1088/1748-9326/9/12/124006, 2014. a, b
Lehner, B., Liermann, C. R., Revenga, C., Vörösmarty, C., Fekete, B., Crouzet, P., Döll, P., Endejan, M., Frenken, K., Magome, J., Nilsson, C., Robertson, J. C., Rödel, R., Sindorf, N., and Wisser, D.: High-resolution mapping of the world's reservoirs and dams for sustainable river-flow management, [data set], Front. Ecol. Environ., 9, 494–502, https://doi.org/10.1890/100125, 2011. a, b
Lenton, T. M.: Arctic Climate Tipping Points, AMBIO, 41, 10–22, https://doi.org/10.1007/s13280-011-0221-x, 2012. a
Lenton, T. M., Rockström, J., Gaffney, O., Rahmstorf, S., Richardson, K., Steffen, W., and Schellnhuber, H. J.: Climate tipping points – too risky to bet against, Nature, 575, 592–595, https://doi.org/10.1038/d41586-019-03595-0, 2019. a
Levitus, S., Antonov, J., and Boyer, T.: Warming of the world ocean, 1955–2003, Geophys. Res. Lett., 32, l02604, https://doi.org/10.1029/2004GL021592,2005. a, b
Ma, H.-Y., Klein, S. A., Xie, S., Zhang, C., Tang, S., Tang, Q., Morcrette, C. J., Van Weverberg, K., Petch, J., Ahlgrimm, M., Berg, L. K., Cheruy, F., Cole, J., Forbes, R., Gustafson Jr, W. I., Huang, M., Liu, Y., Merryfield, W., Qian, Y., Roehrig, R., and Wang, Y.-C.: CAUSES: On the Role of Surface Energy Budget Errors to the Warm Surface Air Temperature Error Over the Central United States, J. Geophys. Res.-Atmos., 123, 2888–2909, https://doi.org/10.1002/2017JD027194, 2018. a
MacDougall, A. H., González-Rouco, J. F., Stevens, M. B., and Beltrami, H.: Quantification of subsurface heat storage in a GCM simulation, Geophys. Res. Lett., 35, L13702, https://doi.org/10.1029/2008GL034639, 2008. a
MacDougall, A. H., Beltrami, H., González-Rouco, J. F., Stevens, M. B., and Bourlon, E.: Comparison of observed and general circulation model derived continental subsurface heat flux in the Northern Hemisphere, J. Geophys. Res.-Atmos., 115, D12109, https://doi.org/10.1029/2009JD013170, 2010. a
MacDougall, A. H., Avis, C. A., and Weaver, A. J.: Significant contribution to climate warming from the permafrost carbon feedback, Nat. Geosci., 5, 719–721, https://doi.org/10.1038/ngeo1573, 2012. a
Marcé, R., Pierson, D., Mercado-Bettin, D., Thiery, W., Tan, Z., Seneviratne, S., Golub, M., Debolskiy, A., Stepanenko, V., Perroud, M., Droppers, B., and Schewe, J.: ISIMIP2b Simulation Data from the Global Lakes Sector (v1.0). ISIMIP Repository [data set], https://doi.org/10.48364/ISIMIP.931371, 2022. a
Mareschal, J.-C. and Beltrami, H.: Evidence for recent warming from perturbed geothermal gradients: examples from eastern Canada, Clim. Dynam., 6, 135–143, https://doi.org/10.1007/BF00193525, 1992. a
Masson, V., Champeaux, J.-L., Chauvin, F., Meriguet, C., and Lacaze, R.: A Global Database of Land Surface Parameters at 1-km Resolution in Meteorological and Climate Models, J. Climate, 16, 1261–1282, https://doi.org/10.1175/1520-0442(2003)16<1261:AGDOLS>2.0.CO;2, 2003. a
Masson, V., Le Moigne, P., Martin, E., Faroux, S., Alias, A., Alkama, R., Belamari, S., Barbu, A., Boone, A., Bouyssel, F., Brousseau, P., Brun, E., Calvet, J.-C., Carrer, D., Decharme, B., Delire, C., Donier, S., Essaouini, K., Gibelin, A.-L., Giordani, H., Habets, F., Jidane, M., Kerdraon, G., Kourzeneva, E., Lafaysse, M., Lafont, S., Lebeaupin Brossier, C., Lemonsu, A., Mahfouf, J.-F., Marguinaud, P., Mokhtari, M., Morin, S., Pigeon, G., Salgado, R., Seity, Y., Taillefer, F., Tanguy, G., Tulet, P., Vincendon, B., Vionnet, V., and Voldoire, A.: The SURFEXv7.2 land and ocean surface platform for coupled or offline simulation of earth surface variables and fluxes, Geosci. Model Dev., 6, 929–960, https://doi.org/10.5194/gmd-6-929-2013, 2013. a
McGuire, A. D., Lawrence, D. M., Koven, C., Clein, J. S., Burke, E., Chen, G., Jafarov, E., MacDougall, A. H., Marchenko, S., Nicolsky, D., Peng, S., Rinke, A., Ciais, P., Gouttevin, I., Hayes, D. J., Ji, D., Krinner, G., Moore, J. C., Romanovsky, V., Schädel, C., Schaefer, K., Schuur, E. A. G., and Zhuang, Q.: Dependence of the evolution of carbon dynamics in the northern permafrost region on the trajectory of climate change, P. Natl. Acad. Sci. USA, 115, 3882–3887, https://doi.org/10.1073/pnas.1719903115, 2018. a
McIntyre, P. B., Liermann, C. A. R., and Revenga, C.: Linking freshwater fishery management to global food security and biodiversity conservation, P. Natl. Acad. Sci. USA, 113, 12880–12885, https://doi.org/10.1073/pnas.1521540113, 2016. a
Messager, M. L., Lehner, B., Grill, G., Nedeva, I., and Schmitt, O.: Estimating the volume and age of water stored in global lakes using a geo-statistical approach, [data set], Nat. Commun., 7, 13603, https://doi.org/10.1038/ncomms13603, 2016. a
Melo-Aguilar, C., González-Rouco, J. F., García-Bustamante, E., Navarro-Montesinos, J., and Steinert, N.: Influence of radiative forcing factors on ground–air temperature coupling during the last millennium: implications for borehole climatology, Clim. Past, 14, 1583–1606, https://doi.org/10.5194/cp-14-1583-2018, 2018. a
Melo-Aguilar, C., González-Rouco, J. F., García-Bustamante, E., Steinert, N., Jungclaus, J. H., Navarro, J., and Roldán-Gómez, P. J.: Methodological and physical biases in global to subcontinental borehole temperature reconstructions: an assessment from a pseudo-proxy perspective, Clim. Past, 16, 453–474, https://doi.org/10.5194/cp-16-453-2020, 2020. a
Messager, M. L., Lehner, B., Grill, G., Nedeva, I., and Schmitt, O.: Estimating the volume and age of water stored in global lakes using a geo-statistical approach, Nat. Commun., 7, 13603, https://doi.org/10.1038/ncomms13603, 2016. a, b
Miner, K. R., D'Andrilli, J., Mackelprang, R., Edwards, A., Malaska, M. J., Waldrop, M. P., and Miller, C. E.: Emergent biogeochemical risks from Arctic permafrost degradation, Nature Climate Change, 11, 809–819, https://doi.org/10.1038/s41558-021-01162-y, 2021. a
Miner, K. R., Turetsky, M. R., Malina, E., Bartsch, A., Tamminen, J., McGuire, A. D., Fix, A., Sweeney, C., Elder, C. D., and Miller, C. E.: Permafrost carbon emissions in a changing Arctic, Nat. Rev. Earth Environ., 3, 55–67, https://doi.org/10.1038/s43017-021-00230-3, 2022. a
Mohammed, A. A., Bense, V. F., Kurylyk, B. L., Jamieson, R. C., Johnston, L. H., and Jackson, A. J.: Modeling Reactive Solute Transport in Permafrost-Affected Groundwater Systems, Water Resour. Res., 57, e2020WR028771, https://doi.org/10.1029/2020WR028771, 2021. a
Muskett, R. R. and Romanovsky, V. E.: Groundwater storage changes in arctic permafrost watersheds from GRACE and in situ measurements, Environ. Res. Lett., 4, 045009, https://doi.org/10.1088/1748-9326/4/4/045009, 2009. a
Natali, S. M., Holdren, J. P., Rogers, B. M., Treharne, R., Duffy, P. B., Pomerance, R., and MacDonald, E.: Permafrost carbon feedbacks threaten global climate goals, P. Natl. Acad. Sci. USA, 118, e2100163118, https://doi.org/10.1073/pnas.2100163118, 2021. a
Nicolsky, D. J., Romanovsky, V. E., Alexeev, V. A., and Lawrence, D. M.: Improved modeling of permafrost dynamics in a GCM land-surface scheme, Geophys. Res. Lett., 34, l08501, https://doi.org/10.1029/2007GL029525, 2007. a
Nitzbon, J., Westermann, S., Langer, M., Martin, L. C. P., Strauss, J., Laboor, S., and Boike, J.: Fast response of cold ice-rich permafrost in northeast Siberia to a warming climate, Nat. Commun., 11, 2201, https://doi.org/10.1038/s41467-020-15725-8, 2020. a
Nitzbon, J., Krinner, G., Deimling, T. S., von, Werner, M., and Langer, M.: Quantifying the Permafrost Heat Sink in Earth’s Climate System, Earth and Space Science Open Archive [preprint], https://doi.org/10.1002/essoar.10511600.1, 2022. a, b, c
Obu, J.: How Much of the Earth's Surface is Underlain by Permafrost?, J. Geophys. Res.-Earth, 126, e2021JF006123, https://doi.org/10.1029/2021JF006123, 2021. a
O'Neill, H. B., Wolfe, S. A., and Duchesne, C.: New ground ice maps for Canada using a paleogeographic modelling approach, The Cryosphere, 13, 753–773, https://doi.org/10.5194/tc-13-753-2019, 2019. a
Parmesan, C., Morecroft, M., Trisurat, Y., Adrian, R., Anshari, G., Arneth, A., Gao, Q., Gonzalez, P., Harris, R., Price, J., Stevens, N., and Talukdarr, G.: Terrestrial and Freshwater Ecosystems and Their Services, Cambridge University Press, Cambridge, UK and New York, USA, 197–378, https://doi.org/10.1017/9781009325844.004.198, 2022. a, b
Pelletier, J. D., Broxton, P. D., Hazenberg, P., Zeng, X., Troch, P. A., Niu, G.-Y., Williams, Z., Brunke, M. A., and Gochis, D.: A gridded global data set of soil, intact regolith, and sedimentary deposit thicknesses for regional and global land surface modeling, J. Adv. Model. Earth Sy., 8, 41–65, https://doi.org/10.1002/2015MS000526, 2016. a
Phipps, S. J., McGregor, H. V., Gergis, J., Gallant, A. J. E., Neukom, R., Stevenson, S., Ackerley, D., Brown, J. R., Fischer, M. J., and van Ommen, T. D.: Paleoclimate Data–Model Comparison and the Role of Climate Forcings over the Past 1500 Years, J. Climate, 26, 6915–6936, https://doi.org/10.1175/JCLI-D-12-00108.1, 2013. a
Pickler, C., Beltrami, H., and Mareschal, J.-C.: Laurentide Ice Sheet basal temperatures during the last glacial cycle as inferred from borehole data, Clim. Past, 12, 115–127, https://doi.org/10.5194/cp-12-115-2016, 2016. a
Purdy, A. J., Fisher, J. B., Goulden, M. L., and Famiglietti, J. S.: Ground heat flux: An analytical review of 6 models evaluated at 88 sites and globally, J. Geophys. Res.-Biogeo., 121, 3045–3059, https://doi.org/10.1002/2016JG003591, 2016. a
Ribes, A., Qasmi, S., and Gillett, N. P.: Making climate projections conditional on historical observations, Sci. Adv., 7, eabc0671, https://doi.org/10.1126/sciadv.abc0671, 2021. a
Rodenhizer, H., Ledman, J., Mauritz, M., Natali, S. M., Pegoraro, E., Plaza, C., Romano, E., Schädel, C., Taylor, M., and Schuur, E.: Carbon Thaw Rate Doubles When Accounting for Subsidence in a Permafrost Warming Experiment, J. Geophys. Res.-Biogeo., 125, e2019JG005528, https://doi.org/10.1029/2019jg005528, 2020. a, b
Sachse, R., Petzoldt, T., Blumstock, M., Moreira, S., Pätzig, M., Rücker, J., Janse, J. H., Mooij, W. M., and Hilt, S.: Extending one-dimensional models for deep lakes to simulate the impact of submerged macrophytes on water quality, Environ. Model. Softw., 61, 410–423, https://doi.org/10.1016/j.envsoft.2014.05.023, 2014. a, b
Schädel, C., Schuur, E. A. G., Bracho, R., Elberling, B., Knoblauch, C., Lee, H., Luo, Y., Shaver, G. R., and Turetsky, M. R.: Circumpolar assessment of permafrost C quality and its vulnerability over time using long-term incubation data, Global Change Biol., 20, 641–652, https://doi.org/10.1111/gcb.12417, 2014. a
Schmidt, G. A., Annan, J. D., Bartlein, P. J., Cook, B. I., Guilyardi, E., Hargreaves, J. C., Harrison, S. P., Kageyama, M., LeGrande, A. N., Konecky, B., Lovejoy, S., Mann, M. E., Masson-Delmotte, V., Risi, C., Thompson, D., Timmermann, A., Tremblay, L.-B., and Yiou, P.: Using palaeo-climate comparisons to constrain future projections in CMIP5, Clim. Past, 10, 221–250, https://doi.org/10.5194/cp-10-221-2014, 2014. a
Schuur, E. A. G., McGuire, A. D., Schadel, C., Grosse, G., Harden, J. W., Hayes, D. J., Hugelius, G., Koven, C. D., Kuhry, P., Lawrence, D. M., Natali, S. M., Olefeldt, D., Romanovsky, V. E., Schaefer, K., Turetsky, M. R., Treat, C. C., and Vonk, J. E.: Climate change and the permafrost carbon feedback, Nature, 520, 171–179, https://doi.org/10.1038/nature14338, 2015. a
Seneviratne, S. I., Lüthi, D., Litschi, M., and Schär, C.: Land-atmosphere coupling and climate change in Europe, Nature, 443, 205–209, https://doi.org/10.1038/nature05095, 2006. a
Seneviratne, S. I., Wilhelm, M., Stanelle, T., van den Hurk, B., Hagemann, S., Berg, A., Cheruy, F., Higgins, M. E., Meier, A., Brovkin, V., Claussen, M., Ducharne, A., Dufresne, J.-L., Findell, K. L., Ghattas, J., Lawrence, D. M., Malyshev, S., Rummukainen, M., and Smith, B.: Impact of soil moisture-climate feedbacks on CMIP5 projections: First results from the GLACE-CMIP5 experiment, Geophys. Res. Lett., 40, 5212–5217, https://doi.org/10.1002/grl.50956, 2013. a
Slater, A. G. and Lawrence, D. M.: Diagnosing Present and Future Permafrost from Climate Models, J. Climate, 26, 5608–5623, https://doi.org/10.1175/JCLI-D-12-00341.1, 2013. a, b
Slater, T., Lawrence, I. R., Otosaka, I. N., Shepherd, A., Gourmelen, N., Jakob, L., Tepes, P., Gilbert, L., and Nienow, P.: Review article: Earth's ice imbalance, The Cryosphere, 15, 233–246, https://doi.org/10.5194/tc-15-233-2021, 2021. a
Smith, N. D., Burke, E. J., Schanke Aas, K., Althuizen, I. H. J., Boike, J., Christiansen, C. T., Etzelmüller, B., Friborg, T., Lee, H., Rumbold, H., Turton, R. H., Westermann, S., and Chadburn, S. E.: Explicitly modelling microtopography in permafrost landscapes in a land surface model (JULES vn5.4_microtopography), Geosci. Model Dev., 15, 3603–3639, https://doi.org/10.5194/gmd-15-3603-2022, 2022a. a, b
Smith, S. L., O’Neill, H. B., Isaksen, K., Noetzli, J., and Romanovsky, V. E.: The changing thermal state of permafrost, Nat. Rev. Earth Environ., 3, 10–23, https://doi.org/10.1038/s43017-021-00240-1, 2022b. a, b
Steinert, N., González-Rouco, J., de Vrese, P., García-Bustamante, E., Hagemann, S., Melo-Aguilar, C., Jungclaus, J., and Lorenz, S.: Increasing the Depth of a Land Surface Model. Part II: Temperature Sensitivity to Improved Subsurface Thermodynamics and Associated Permafrost Response, J. Hydrometeorol., 22, 3231–3254, https://doi.org/10.1175/JHM-D-21-0023.1, 2021. a, b, c
Strauss, J., Schirrmeister, L., Grosse, G., Wetterich, S., Ulrich, M., Herzschuh, U., and Hubberten, H.-W.: The deep permafrost carbon pool of the Yedoma region in Siberia and Alaska, Geophys. Res. Lett., 40, 6165–6170, https://doi.org/10.1002/2013GL058088, 2013. a
Sturm, M., Taras, B., Liston, G. E., Derksen, C., Jonas, T., and Lea, J.: Estimating Snow Water Equivalent Using Snow Depth Data and Climate Classes, J. Hydrometeorol, 11, 1380–1394, https://doi.org/10.1175/2010JHM1202.1, 2010. a
Subin, Z. M., Riley, W. J., and Mironov, D.: An improved lake model for climate simulations: Model structure, evaluation, and sensitivity analyses in CESM1, J. Adv. Model. Earth Sy., 4, M02001, https://doi.org/10.1029/2011ms000072, 2012. a
Swaminathan, C. R. and Voller, V. R.: A general enthalpy method for modeling solidification processes, Metall. Trans. B, 23, 651–664, https://doi.org/10.1007/BF02649725, 1992. a
Tan, Z., Zhuang, Q., and Anthony, K. W.: Modeling methane emissions from arctic lakes: Model development and site-level study, J. Adv. Model. Earth Sy., 7, 459–483, https://doi.org/10.1002/2014ms000344, 2015. a
Taylor, A. E. and Wang, K.: Geothermal inversion of Canadian Arctic ground temperatures and effect of permafrost aggradation at emergent shorelines, Geochem. Geophy. Geosy., 9, Q07019, https://doi.org/10.1029/2008GC002064, 2008. a
Teufel, B. and Sushama, L.: Abrupt changes across the Arctic permafrost region endanger northern development, Nat. Clim. Change, 9, 858–862, https://doi.org/10.1038/s41558-019-0614-6, 2019. a
Thiery, W., Davin, E. L., Lawrence, D. M., Hirsch, A. L., Hauser, M., and Seneviratne, S. I.: Present-day irrigation mitigates heat extremes, J. Geophys. Res.-Atmos., 122, 1403–1422, https://doi.org/10.1002/2016JD025740, 2017. a
Tokarska, K. B., Stolpe, M. B., Sippel, S., Fischer, E. M., Smith, C. J., Lehner, F., and Knutti, R.: Past warming trend constrains future warming in CMIP6 models, Sci. Adv., 6, eaaz9549, https://doi.org/10.1126/sciadv.aaz9549, 2020. a, b
Turetsky, M. R., Abbott, B. W., Jones, M. C., Walter Anthony, K., Olefeldt, D., Schuur, E. A., Koven, C., McGuire, A. D., Grosse, G., Kuhry, P., Hugelius, G., Lawrence, D. M., Gibson, C., and Sannel, A. B. K.: Permafrost collapse is accelerating carbon release, Nature, 569, 32–34, https://doi.org/10.1038/d41586-019-01313-4, 2019. a
Vanderkelen, I., van Lipzig, N. P. M., Lawrence, D. M., Droppers, B., Golub, M., Gosling, S. N., Janssen, A. B. G., Marcé, R., Schmied, H. M., Perroud, M., Pierson, D., Pokhrel, Y., Satoh, Y., Schewe, J., Seneviratne, S. I., Stepanenko, V. M., Tan, Z., Woolway, R. I., and Thiery, W.: Global Heat Uptake by Inland Waters, Geophys. Res. Lett., 47, e2020GL087867, https://doi.org/10.1029/2020GL087867, 2020. a, b, c, d, e, f, g, h, i
Vanderkelen, I., van Lipzig, N. P. M., Sacks, W. J., Lawrence, D. M., Clark, M. P., Mizukami, N., Pokhrel, Y., and Thiery, W.: Simulating the Impact of Global Reservoir Expansion on the Present-Day Climate, J. Geophys. Res.-Atmos., 126, e2020JD034485, https://doi.org/10.1029/2020JD034485, 2021. a
Vanderkelen, I., Gharari, S., Mizukami, N., Clark, M. P., Lawrence, D. M., Swenson, S., Pokhrel, Y., Hanasaki, N., van Griensven, A., and Thiery, W.: Evaluating a reservoir parametrization in the vector-based global routing model mizuRoute (v2.0.1) for Earth system model coupling, Geosci. Model Dev., 15, 4163–4192, https://doi.org/10.5194/gmd-15-4163-2022, 2022. a
Vanderkelen, I., van Lipzig, N. P. M., Lawrence, D. M., Droppers, B., Golub, M., Gosling, S. N., Janssen, A. B., G., Marcé R., Müller Schmied, H., Perroud, M., Pierson, D., Pokhrel, Y., Satoh, Y., Schewe, J., Seneviratne, S. I., Stepanenko, V. M., Woolway, R. I., and Thiery, W.: Inland water heat uptake, Zenodo [code], https://doi.org/10.5281/zenodo.7837996, 2023. a
Vogel, M. M., Orth, R., Cheruy, F., Hagemann, S., Lorenz, R., van den Hurk, B. J. J. M., and Seneviratne, S. I.: Regional amplification of projected changes in extreme temperatures strongly controlled by soil moisture-temperature feedbacks, Geophys. Res. Lett., 44, 1511–1519, https://doi.org/10.1002/2016GL071235, 2017. a
von Schuckmann, K., Cheng, L., Palmer, M. D., Hansen, J., Tassone, C., Aich, V., Adusumilli, S., Beltrami, H., Boyer, T., Cuesta-Valero, F. J., Desbruyères, D., Domingues, C., García-García, A., Gentine, P., Gilson, J., Gorfer, M., Haimberger, L., Ishii, M., Johnson, G. C., Killick, R., King, B. A., Kirchengast, G., Kolodziejczyk, N., Lyman, J., Marzeion, B., Mayer, M., Monier, M., Monselesan, D. P., Purkey, S., Roemmich, D., Schweiger, A., Seneviratne, S. I., Shepherd, A., Slater, D. A., Steiner, A. K., Straneo, F., Timmermans, M.-L., and Wijffels, S. E.: Heat stored in the Earth system: where does the energy go?, Earth Syst. Sci. Data, 12, 2013–2041, https://doi.org/10.5194/essd-12-2013-2020, 2020. a, b, c, d, e, f, g, h, i, j, k, l, m, n, o
Wanders, N., Vliet, M. T. H., Wada, Y., Bierkens, M. F. P., and Beek, L. P. H. R.: High-Resolution Global Water Temperature Modeling, Water Resour. Res., 55, 2760–2778, https://doi.org/10.1029/2018wr023250, 2019. a
Wang, J. and Bras, R.: Ground heat flux estimated from surface soil temperature, J. Hydrol., 216, 214–226, https://doi.org/10.1016/S0022-1694(99)00008-6, 1999. a
Wang, R., Gentine, P., Li, L., Chen, J., Ning, L., Yuan, L., and Lü, G.: Observational Evidence of Regional Increasing Hot Extreme Accelerated by Surface Energy Partitioning, J. Hydrometeorol., 23, 491–501, https://doi.org/10.1175/JHM-D-21-0114.1, 2022. a
Wang, W., Lee, X., Xiao, W., Liu, S., Schultz, N., Wang, Y., Zhang, M., and Zhao, L.: Global lake evaporation accelerated by changes in surface energy allocation in a warmer climate, Nat. Geosci., 11, 410–414, https://doi.org/10.1038/s41561-018-0114-8, 2018. a
Wild, M., Folini, D., Hakuba, M. Z., Schär, C., Seneviratne, S. I., Kato, S., Rutan, D., Ammann, C., Wood, E. F., and König-Langlo, G.: The energy balance over land and oceans: an assessment based on direct observations and CMIP5 climate models, Clim. Dynam., 44, 3393–3429, https://doi.org/10.1007/s00382-014-2430-z, 2015. a
Woolway, R. I., Kraemer, B. M., Lenters, J. D., Merchant, C. J., O’Reilly, C. M., and Sharma, S.: Global lake responses to climate change, Nat. Rev. Earth Environ., 1, 388–403, https://doi.org/10.1038/s43017-020-0067-5, 2020. a, b
Woolway, R. I., Jennings, E., Shatwell, T., Golub, M., Pierson, D. C., and Maberly, S. C.: Lake heatwaves under climate change, Nature, 589, 402–407, https://doi.org/10.1038/s41586-020-03119-1, 2021a. a
Woolway, R. I., Sharma, S., Weyhenmeyer, G. A., Debolskiy, A., Golub, M., Mercado-Bettín, D., Perroud, M., Stepanenko, V., Tan, Z., Grant, L., Ladwig, R., Mesman, J., Moore, T. N., Shatwell, T., Vanderkelen, I., Austin, J. A., DeGasperi, C. L., Dokulil, M., Fuente, S. L., Mackay, E. B., Schladow, S. G., Watanabe, S., Marcé, R., Pierson, D. C., Thiery, W., and Jennings, E.: Phenological shifts in lake stratification under climate change, Nat. Commun., 12, https://doi.org/10.1038/s41467-021-22657-4, 2021b. a
Zhang, T., Barry, R. G., Knowles, K., Heginbottom, J. A., and Brown, J.: Statistics and characteristics of permafrost and ground-ice distribution in the Northern Hemisphere, Polar Geogr., 31, 47–68, https://doi.org/10.1080/10889370802175895, 2008. a
Zhao, G., Li, Y., Zhou, L., and Gao, H.: Evaporative water loss of 1.42 million global lakes, Nat. Commun., 13, 3686, https://doi.org/10.1038/s41467-022-31125-6, 2022. a