the Creative Commons Attribution 4.0 License.
the Creative Commons Attribution 4.0 License.
 | 17 Nov 2023
The effects of diachronous surface uplift of the European Alps on regional climate and the oxygen isotopic composition of precipitation
Daniel Boateng
Sebastian G. Mutz
Armelle Ballian
Maud J. M. Meijers
Katharina Methner
Svetlana Botsyun
Andreas Mulch
Todd A. Ehlers
This study presents the simulated response of regional climate and the oxygen isotopic composition of precipitation (δ18Op) to different along-strike topographic evolution scenarios. These simulations are conducted to determine if the previously hypothesized diachronous surface uplift in the Western and Eastern Alps would produce δ18Op signals in the geologic record that are sufficiently large and distinct to be detected using stable isotope paleoaltimetry. We present a series of topographic sensitivity experiments conducted with the water-isotope-tracking atmospheric general circulation model (GCM) ECHAM5-wiso. The topographic scenarios are created from the variation of two free parameters, (1) the elevation of the Western–Central Alps and (2) the elevation of the Eastern Alps. The results indicate Δδ18Op values (i.e., the difference between δ18Op values at the low- and high-elevation sites) of up to −8 ‰ along the strike of the Alps for the diachronous uplift scenarios, primarily due to changes in orographic precipitation and adiabatic lapse rate driven localized changes in near-surface variables. These simulated magnitudes of Δδ18Op values suggest that the expected isotopic signal would be significant enough to be preserved and measured in geologic archives. Moreover, the simulated slight δ18Op differences of 1 ‰–2 ‰ across the low-elevation sites support the use of the δ–δ paleoaltimetry approach and highlight the importance of sampling far-field low-elevation sites to differentiate between the different surface uplift scenarios. The elevation-dependent rate of change in δ18Op (“isotopic lapse rate”) varies depending on the topographic configuration and the extent of the surface uplift. Most of the changes are significant (e.g., −1.04 ‰ km−1 change with slope error of ±0.09 ‰ km−1), while others were within the range of the statistical uncertainties (e.g., −0.15 ‰ km−1 change with slope error of ±0.13 ‰ km−1). The results also highlight the plausible changes in atmospheric circulation patterns and associated changes in moisture transport pathways in response to changes in the topography of the Alps. These large-scale atmospheric dynamics changes can complicate the underlying assumption of stable isotope paleoaltimetry and therefore require integration with paleoclimate modeling to ensure accurate reconstruction of the paleoelevation of the Alps.
- Article
(16783 KB) - Full-text XML
-
Supplement
(7294 KB) - BibTeX
- EndNote


The topographic evolution of orogens over geological time is controlled by geodynamic processes (e.g., crustal thickening, lower crustal flow, subduction erosion, and lithospheric delamination) and climate-driven surface processes (e.g., erosion, denudation, and other earth surface processes) (e.g., Valla et al., 2021; Whipple, 2009; Ehlers and Poulsen, 2009). Knowledge of past topography contributes to the understanding of climate–tectonic interactions, the tectonic evolution of collisional domains, and the distribution of biodiversity (Allen, 2008; Clark, 2007; Mulch, 2016; Rowley and Garzione, 2007; Antonelli et al., 2018; Mulch et al., 2018). Paleoelevations have been reconstructed for numerous high mountain ranges such as the Himalayas and the Tibetan Plateau (e.g., Garzione et al., 2000; Quade et al., 2011; Gébelin et al., 2013; Rowley and Currie, 2006; Ding et al., 2022; Spicer et al., 2021), the North American Cordillera (e.g., Huntington et al., 2010; Chamberlain et al., 2012; Mulch et al., 2006), the Andean Plateau (e.g., Garzione et al., 2008, 2014; Barnes and Ehlers, 2009; Mulch et al., 2010; Pingel et al., 2016; Sundell et al., 2019), and areally smaller orogens such as the Pyrenees (Huyghe et al., 2012), the Sierra Nevada Mountains of California (e.g., Mulch et al., 2006, 2008), the Southern Alps of New Zealand (Chamberlain et al., 1999), the Taurides of Turkey (Meijers et al., 2018), and the European Alps (Campani et al., 2012; Fauquette et al., 2015; Krsnik et al., 2021). Past surface elevations have been inferred using a variety of methods, such as foliar physiognomy (Forest et al., 1999), stomatal density in fossil leaves (McElwain, 2004), vesicularity of basaltic flows (Sahagian and Maus, 1994), and water isotopologues from lacustrine and pedogenic carbonates and authigenic minerals (e.g., Kohn and Dettman, 2007; Quade et al., 2007; Rowley and Garzione, 2007; Mulch and Chamberlain, 2007). Among these techniques, stable isotope paleoaltimetry is the most widely used due to the robust systematic inverse relationships between elevation and oxygen (δ18O) and hydrogen (δD) isotopic composition of meteoric waters reflected in geologic archives such as paleosol carbonates. This δ18O–elevation relationship (or isotopic lapse rate) is commonly attributed to the preferential rainout of heavy isotopologues of water from air masses ascending over topography and is described physically as Rayleigh distillation (Gat, 1996). However, numerous climatic processes, such as surface recycling, aridity, vapor mixing, variability in moisture source, and precipitation dynamics, can also influence the isotopic lapse rate and thus complicate stable isotope paleoaltimetry estimates (Ehlers and Poulsen, 2009; Insel et al., 2010; Feng et al., 2013; Lee and Fung, 2008; Risi et al., 2013; Botysun and Ehlers, 2021). Furthermore, studies of surface uplift in orogens, such as the Andes, Himalayas, and Tibet, have demonstrated the impacts of topographic evolution on atmospheric circulation patterns and the spatial distribution of δ18O in precipitation (δ18Op) in a more complicated way than single-site stable isotope paleoaltimetry studies commonly assume (e.g., Takahashi and Battisti, 2007; Yao et al., 2013; Mulch, 2016). This highlights the need for a better quantitative understanding of how topography and regional climate influence the variations of the isotopic composition of ancient waters (Ehlers and Poulsen, 2009; Botsyun et al., 2020; Insel et al., 2012). This study comprises a series of climate model experiments that address this need for the European Alps.
The European Alps have been extensively studied, but only a few studies have addressed the reconstruction of its surface uplift histories with stable isotope paleoaltimetry (e.g., Sharp et al., 2005; Campani et al., 2012; Krsnik et al., 2021). Recent studies have suggested that the Alps experienced diachronous surface uplift in response to the post-collisional slab break-off and continuing rollback of the lithosphere and its associated mantle delamination (Schlunegger and Kissling, 2018; Handy et al., 2015). Stable-isotope-based reconstructions of past surface topography can help to constrain such subsurface processes, given that surface elevation is primarily an expression of mantle and lithospheric dynamics. However, whether such geodynamic processes would yield (spatial) differences in δ18Op values by a magnitude that would be detectable in the geologic record remains an open question. Resolving such a question would justify the use of stable isotope paleoaltimetry reconstructions across the Alps to understand their topographic evolution.
In this study, we simulate changes in regional climate and the oxygen isotopic composition of precipitation (δ18Op) that would occur in response to diachronous, along-strike surface uplift variations of the Eastern and Western–Central Alps. We address the question of to what extent (and where) different scenarios of differentiated west-to-east surface uplift would be reflected in δ18O of meteoric water. In answering these questions, we test two hypotheses. We hypothesize that different topographic configurations for the Eastern and Western–Central Alps result in regional climate and δ18Op patterns that are significantly different from (1) those of today and (2) those produced by scenarios of bulk surface uplift of the entire Alps. We test these hypotheses through a series of sensitivity experiments with two free parameters including variations in the elevation of the Western–Central Alps and the elevation of the Eastern Alps. The experiments are conducted with the isotopic-tracking atmospheric general circulation model (GCM) ECHAM5-wiso and provide quantitative estimates of the expected δ18Op signal that could be recorded in geological archives used in stable isotope paleoaltimetry. The simulated δ18Op signal can help determine if the changes are significant enough to be reflected in paleoaltimetry records, which would ultimately help to reconstruct the geodynamic evolution of the Alps. The study therefore also represents an important step toward answering the question of whether the eastward propagation of surface uplift (or different east–west topographic configurations) would be detectable in paleo-δ18Op records.
2.1 Geodynamics of the European Alps
The European Alps are a midlatitude orogenic belt extending over a longitudinal area (∼1000 km2) subdivided into the Western, Central, and Eastern Alps (Schmid et al., 2004). The onset of their topographic development is attributed to the continent–continent collision of the European and Adriatic plates in the late Eocene. This event was followed by protracted convergence and subduction of oceanic lithosphere (Frisch, 1979; McCann, 2008; Schmid et al., 1996; Stampfli et al., 1998). Major rock exhumation started ∼35 Ma or earlier, predominantly in response to crustal thickening and associated erosion (Kuhlemann et al., 2002; Schmid et al., 2004, 1996) and drainage reorganization (Lu et al., 2018). Recent modeling studies have suggested additional geodynamic processes that may have influenced the surface uplift history (Kissling and Schlunegger, 2018; Schlunegger and Kissling, 2015). These processes include slab break-off (∼30 Ma) and slab rollback of the subducting lithosphere, as well as lithospheric mantle removal that may have contributed to west-to-east variations in surface uplift as proposed for the Central Alps (Davies and von Blanckenburg, 1995; Schlunegger and Castelltort, 2016; Ustaszewski et al., 2008). Subsequently, it has been suggested that slab break-off (∼20 Ma) occurred under the Eastern Alps (Handy et al., 2015). Based on previous studies, current tectonic and geodynamic reconstructions suggest that the entire Alps did not rise monotonically but through diachronous surface uplift across different sections of the orogen. This study explores such a scenario and evaluates changes in δ18Op values that would be expected to be preserved in the geologic record within the region.
2.2 Paleoaltimetry estimates of the European Alps
Few studies have attempted to quantify the surface elevation history of the Alps. Pollen data suggest that the southwestern Alps reached their maximum mean elevation of more than ∼1900 m at the early stage after the collision in the early Oligocene (ca. 30 Ma) (Fauquette et al., 2015). Stable-isotope-based paleoelevation estimates for the middle Miocene Central Alps range from 2.5 to 6 km (e.g., Campani et al., 2012; Kocsis et al., 2007; Sharp et al., 2005), and the higher end of these estimates for the Central Alps was confirmed recently with surface elevations of >4 km being attained not later than the middle Miocene (Krsnik et al., 2021). Collectively, these reconstructions suggest that the Western and Central Alps were already at high elevations in the middle Miocene, and surface uplift must have occurred in the Oligocene to Miocene. In contrast, no long-term quantitative past surface elevation estimates are available for the Eastern Alps. However, geodynamic modeling and geomorphic analysis suggest that the orogenic development of the Eastern Alps initiated only during the middle Miocene (∼15–10 Ma), with a major phase at ∼5 Ma (Bartosch et al., 2017; Hergarten et al., 2010). These previous findings suggest that surface uplift in the Central Alps predates surface uplift in the Eastern Alps. If the isotopic signal created by west-to-east surface uplift propagation is preserved in geological materials (e.g., pedogenic carbonates or hydrous shear zone silicates) and deemed detectable according to the climate modeling studies, then stable isotope paleoaltimetry may be used to address this research gap. Therefore, we use different topographic configurations in sensitivity experiments to quantify the expected isotopic signal. With a present-day mean elevation of peaks of ca. 2500 m across the Alps, increasing their elevation by 200 % would reflect the paleoelevation reconstructions across the Western–Central Alps in the middle Miocene (Campani et al., 2012; Krsnik et al., 2021). However, due to the lack of quantitative paleoelevation estimates across the Eastern Alps, we conduct a stepwise increase in the elevation across that transect to explore all the potential surface uplift magnitudes back in time (see Sect. 3.2 for more details about topographic configuration).
2.3 Climate of the Alps
The interannual and seasonal variability of regional climate in Europe is predominantly controlled by large-scale circulation patterns (Bartolini et al., 2009; Hurrell, 1995). The topography of the Alps greatly impacts mesoscale temperature, precipitation, moisture transport, wind, and other atmospheric elements (e.g., Schmidli et al., 2002). The Alps act as an orographic barrier, which affects convective and orographic precipitation formation and the associated spatial effects like leeward rain shadows (Bartolini et al., 2009; Beniston, 2005). Today, the Alps experience maximum precipitation rates in summer due to (1) the shifting of pressure fronts to the south and (2) high convective heat transport from oceanic sources and continental evapotranspiration (Schmidli et al., 2002). Most atmospheric moisture received across the Alps, especially over the northern flanks, is transported via the westerlies from the North Atlantic. Regional precipitation histories can thus be explained primarily by variations in atmospheric circulation patterns over the North Atlantic and western Europe (Baldini et al., 2008; Comas-Bru et al., 2016; Langebroek et al., 2011; Rozanski et al., 1982). Therefore, δ18O values in ancient meteoric waters can only be quantitatively evaluated with knowledge about the dominant large-scale atmospheric flows and the locations of associated pressure systems (i.e., quasi-stable systems with high and low sea level pressure), which can shift over time (e.g., Deininger et al., 2016) due to global and regional paleoenvironment changes, such as topography.
Advances in climate modeling allow the use of high-resolution isotope-tracking atmospheric general circulation models (AGCMs) to investigate the impacts of topography and regional climate change on δ18Op values (e.g., Botsyun et al., 2020, 2019; Botsyun and Ehlers, 2021; Li et al., 2016; Mutz et al., 2016; Sturm et al., 2010). AGCMs are developed based on atmospheric physical processes. They can simulate climates that are in dynamic equilibrium with prescribed orbital, environmental, and topographic boundary conditions. While GCMs have some deficiencies in predicting precipitation in mountain regions due to model-specific parameterization (e.g., cloud microphysics and the hydrostatic approximation), they have been shown to adequately reproduce important patterns of climate and precipitation δ18O values over orogens, including the Alps (e.g., Botsyun et al., 2020; Werner et al., 2011). Previous studies have used GCMs to perform topographic sensitivity experiments to help improve paleoaltimetry estimates (e.g., Botsyun et al., 2019; Shen and Poulsen, 2019; Ehlers and Poulsen, 2009; Poulsen et al., 2010; Feng et al., 2013; Feng and Poulsen, 2016; Huyghe et al., 2018; Insel et al., 2012). More recently, Botsyun et al. (2020) performed GCM experiments designed to estimate the δ18Op response to bulk surface elevation changes in the whole Alps. This study builds on their findings by considering diachronous surface uplift (stepwise surface uplift from west to east) as different topographic scenarios.
3.1 General circulation model (ECHAM5-wiso)
The hypotheses tested in this study are addressed with a series of experiments conducted with the isotope-tracking climate model ECHAM5-wiso. ECHAM5 is the fifth version of a well-established atmospheric GCM that is developed and maintained by the Max Planck Institute for Meteorology (MPIM) based on the spectral weather forecast model of the European Centre for Medium-Range Weather Forecasts (ECMWF) (Roeckner et al., 2003). ECHAM5 has been expanded to include an isotope-tracking module that simulates the isotopic composition of water at every step of the simulated hydrological cycle in the model (Werner et al., 2011). The water isotopologues (i.e., HO, HO, and HDO) are treated as independent tracers (Hoffmann et al., 1998; Werner et al., 2011) that undergo kinetic and equilibrium fractionation during phase transitions in the atmosphere (e.g., snow, vapor, clouds). The semi-Lagrangian advection scheme is used for the transport of the passive tracers through all the water components (Lin and Rood, 1996). The resulting isotope-tracking GCM (ECHAM5-wiso) has been demonstrated to reproduce global- and regional-scale isotopic observations well, including for present-day δ18Op values across Europe (Botsyun et al., 2020; Werner et al., 2011; Langebroek et al., 2011). Compared to its predecessor, the version applied in this study has an improved representation of the land surface and considers orographic drag forces. However, the model does not track isotopic fractionations from surface waters (Hagemann et al., 2006). The model simulates clouds using the stratiform cloud scheme that consists of the prognostic equations of all the water phase dynamics, bulk cloud microphysics by Lorenz and Lohmann (2004), and statistical cloud cover parameterization by Tompkins (2002). Comprehensive details about the model physics and parameterization are described in Werner et al. (2011) and Roeckner et al. (2003).
3.2 Topography experiments
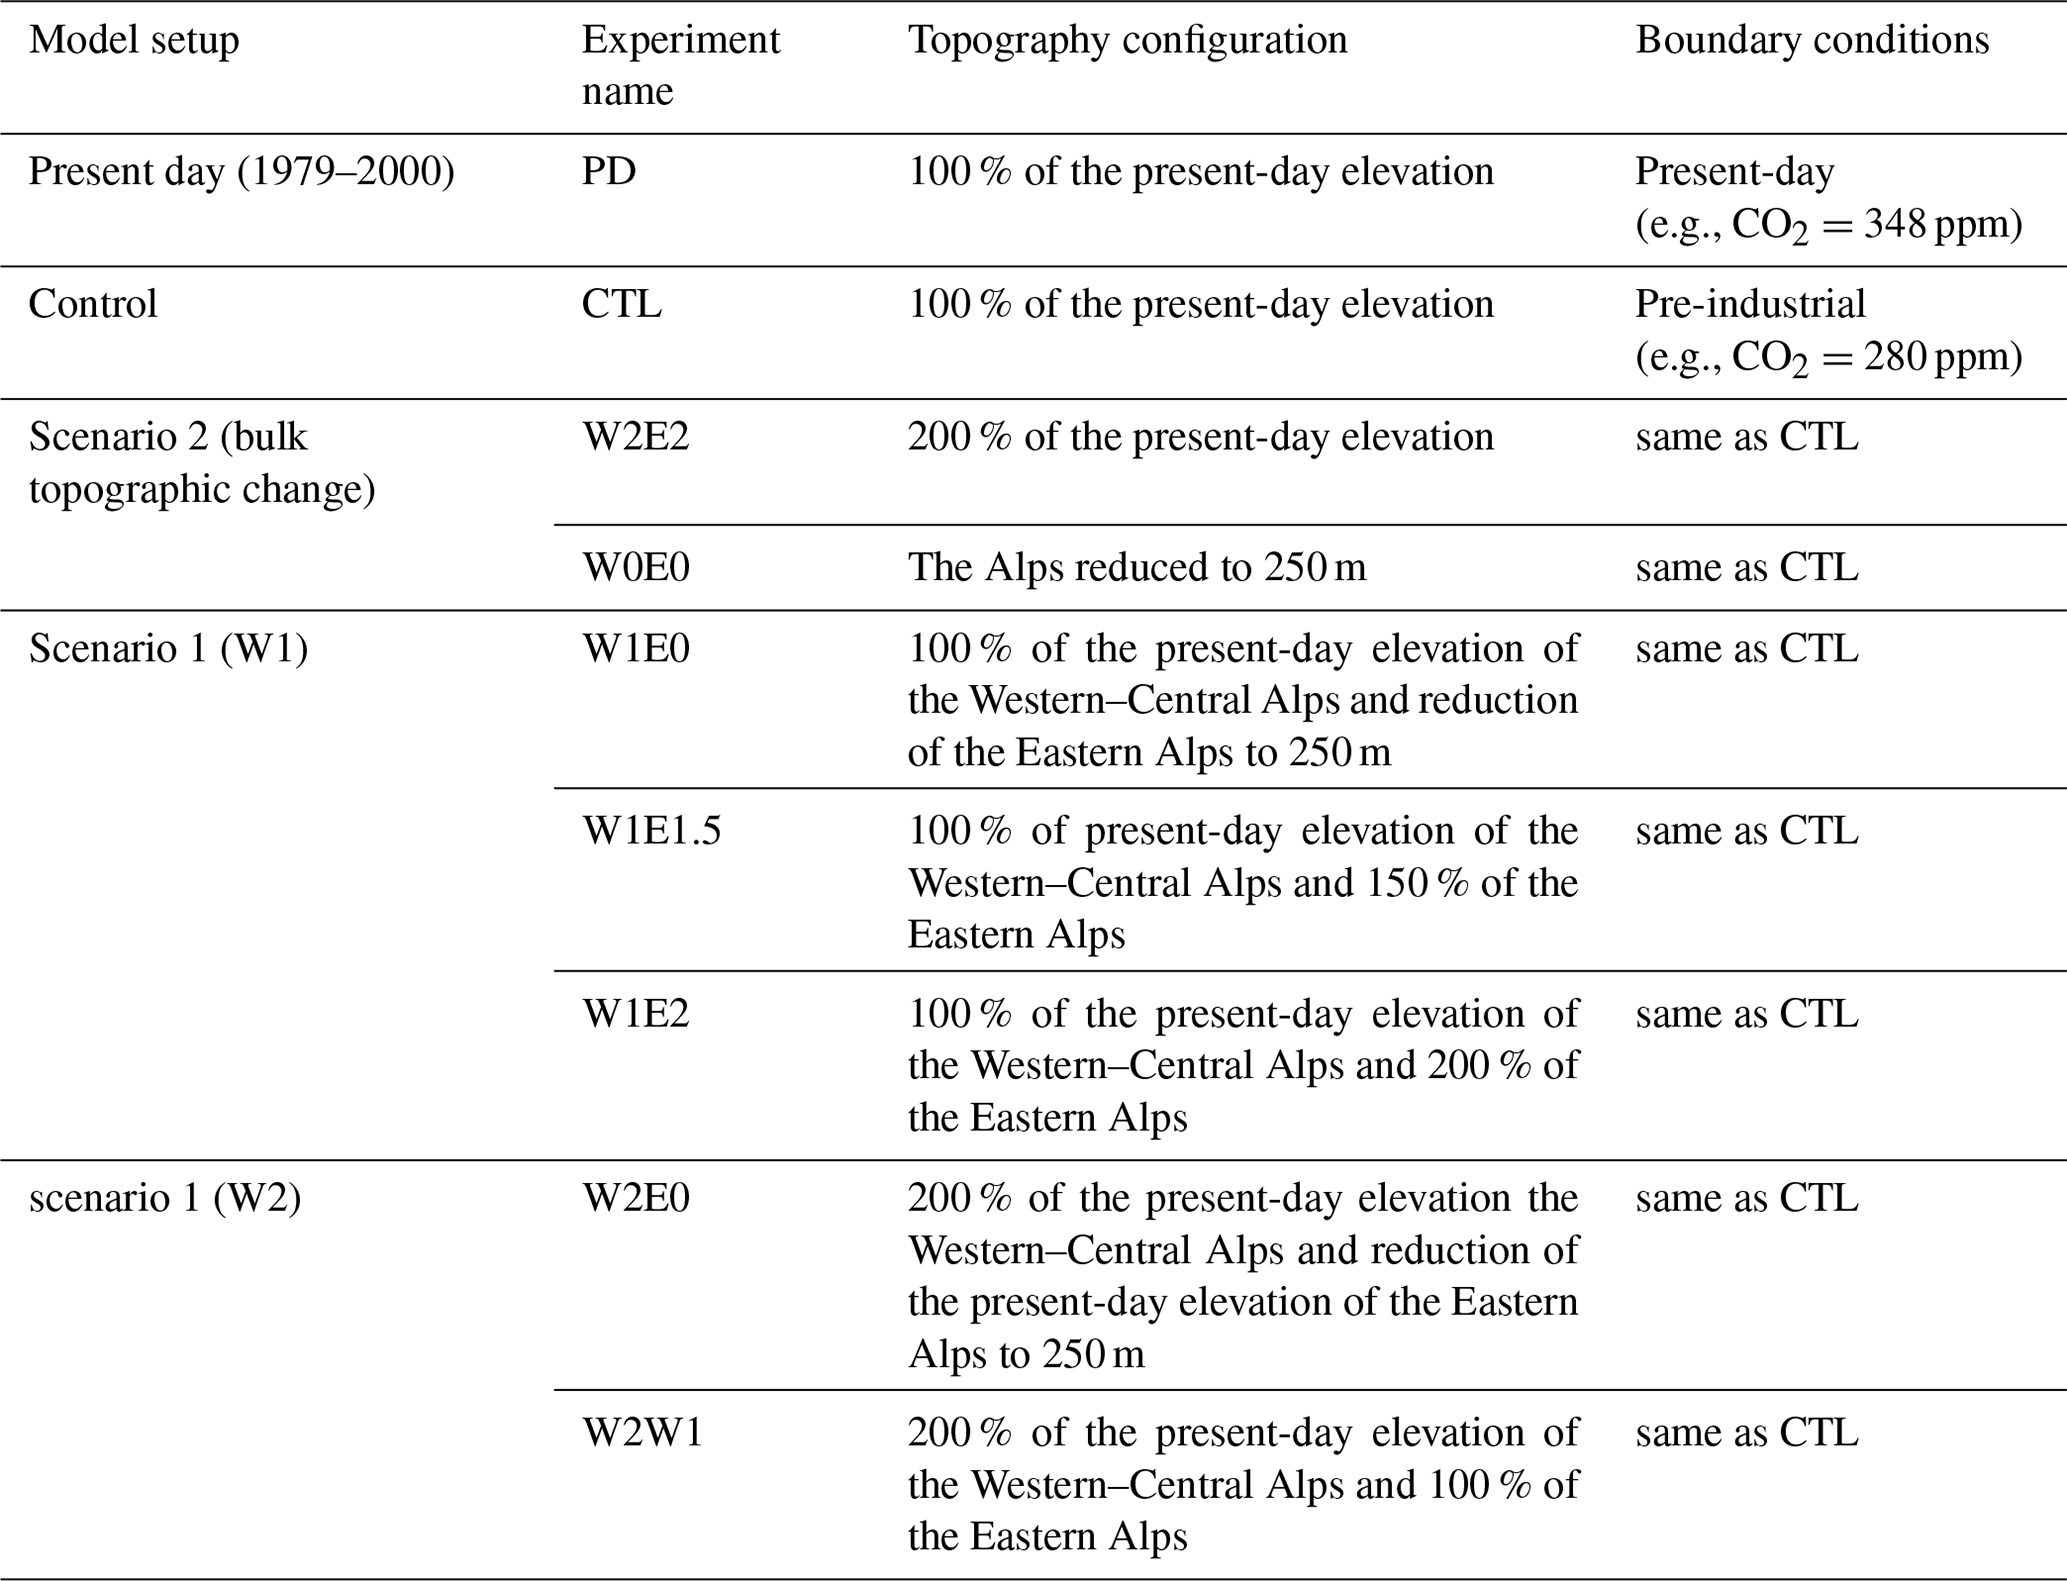
We investigate the effects of specific topographic configurations on δ18Op values and regional climate by performing sensitivity experiments with two free parameters, (1) the elevation of the Western–Central Alps (43–48∘ N, 5–10∘ E) and (2) the elevation of the Eastern Alps (45–48∘ N, 10–17∘ E). For brevity, a two-part notation is used in this study for individual topographic configurations: the first part denotes the elevation of the Western–Central Alps and assumes the form Wx, where x expresses the elevation as a fraction of its present-day value. The second part analogously expresses the elevation of the Eastern Alps in the form of Ex. The topographic configuration W2E0, for example, therefore consists of the Western–Central and Eastern Alps set to 200 % and 0 % of their modern elevation, respectively. The configurations with 0 % topography use 250 m as a mean minimum topography to avoid unrealistic artifacts in the simulations, such as extreme wind speeds due to a completely flat low-elevation surface. The topographic boundary conditions for the different experiments are prepared as follows: we modify the GTOPO30 digital elevation model (DEM) provided by the US Geological Survey, which has a resolution of 30 arcsec (ca. 1 km). Afterward, the modified high-resolution DEMs are interpolated to the ECHAM5-wiso model resolution (i.e., T159, horizontal resolution of ∼80 km). The associated subgrid orographic variables are calculated from the higher-resolution DEM. These variables include orographic standard deviation (i.e., the variability of the heights of the mountain range), anisotropy, peak elevations, valley elevation, mean slope, and orientation within a grid cell. Such related information is used for the subgrid-scale parameterization that estimates the effect of mountain-induced wave drag on the atmosphere and mountain blocking in the model (Stevens et al., 2013; Roeckner et al., 2003).
We elaborate on two topographic scenarios, each consisting of several topographic configurations (see Table 1 for a complete overview).
Scenario 1. The first scenario considers the diachronous west-to-east surface uplift hypothesized from tectonic reconstructions of the Alps (e.g., Bartosch et al., 2017; Fauquette et al., 2015; Handy et al., 2015). Consequently, the Western–Central and Eastern Alps are varied separately. First, the elevation of the Western–Central Alps was kept at its present-day value (W1), and the elevation of the Eastern Alps was incrementally increased from 0 % to 200 % of its present-day value. Following this, the Western–Central Alps were set to 200 % (W2) of their present-day elevation, and the Eastern Alps were raised incrementally again. W2 was chosen to represent a plausible middle Miocene altitude of more than 4000 m, which is close to 200 % of the modern mean elevation of the Central Alps (Krsnik et al., 2021). However, the resolution of the model underrepresents the magnitude of the orographic mean elevation due to dampening of maximum peak elevations across the Alps in the interpolation process.
Scenario 2. For the second scenario, the topography of the entire Alps, including the Western–Central and Eastern Alps, was increased to 200 % (W2E2) and reduced to 0 % (W0E0) of its present-day height. These topographic configurations allow for a comparison of the climatic response to diachronous surface uplift (scenario 1) and bulk surface uplift. Since the W1E1 configuration simply represents modern topography, it is used as the control experiment and given the special designation CTL.
Table 1Summary of ECHAM5-wiso sensitivity experiments and their topographic configurations and boundary conditions.
3.3 Model setup and boundary conditions
All experiments were performed for 18 model years on a high-spatial-resolution grid to represent the Alps' topography adequately. Specifically, the T159 spectral resolution (which corresponds to ∼0.75∘ or ∼80 km in latitude and longitude) and 31 vertical pressure levels (up to 10 hPa) were used for the simulations. The output frequency was set to 6 model hours to allow the performance of a trajectory analysis (Sect. 3.6). We only consider the last 15 years of the model output and remove the first 3 years of the simulation to account for the spin-up period, i.e., the time needed for the simulated climate to reach dynamic equilibrium. Since this study aims to quantify and isolate the effects of different topographic configurations (Sect. 3.2) on regional climate and δ18Op values, all other boundary conditions are kept constant at pre-industrial (PI) levels. These include orbital configurations, greenhouse gas concentrations, sea surface variables, and insolation. For model validation purposes, we additionally conduct a present-day (PD) simulation of 43 model years and analyze the last 30 years (1979–2014). We use the annual mean variations of the sea surface temperature (SSTs) and sea ice concentrations (SICs) from the Atmospheric Model Intercomparison Project (AMIP) as boundary conditions. The simulated PD climate and isotopic patterns are compared with observed values across Europe. The reader is referred to Mutz et al. (2016, 2018) for more details about the PD and PI boundary conditions used in this study.
3.4 Model–data comparison
Modern station-based δ18Op data from the Global Network of Isotopes in Precipitation (GNIP) in Europe (accessible at https://www.iaea.org, last access: 5 November 2023) are used as our first validation dataset (Edwards et al., 2002). The precipitation-weighted δ18Op values from GNIP stations were compared to the PD simulation to assess the performance of ECHAM5-wiso. Specifically, we compute and compare long-term annual means of precipitation-weighted δ18Op for the period covered by the GNIP station measurements across the European continent. The ERA5 climate reanalysis, produced and managed by the ECMWF, is our second validation dataset. The reanalysis is a state-of-the-art, globally gridded dataset produced from both physical models and observations (e.g., ocean buoys, aircraft, and other platforms) that is dynamically interpolated using the four-dimensional variational (4D-Var) data assimilation scheme (Hersbach et al., 2020). Compared to its predecessor ERA-Interim (Dee et al., 2011), the dataset has improved in both temporal (hourly throughout) and spatial resolution (31 km or TL639) and expanded its data coverage from 1950 onwards (Bell et al., 2021). We use this dataset to construct Northern Hemisphere teleconnection patterns and compare them to their equivalents constructed from topographic scenarios simulations.
3.5 Postprocessing and analysis of simulation
Long-term seasonal and annual arithmetic means were calculated from the 6 h model output. The deviations of these means from the CTL mean were calculated by subtracting the CTL mean from the topography scenarios. The resulting anomalies are referred to as “ID–CTL mean differences” hereafter, where ID is an experiment ID such as W2E1 (see Sect. 3.2 and Table 1 for an overview). Two-tailed Student's t tests with a defined confidence interval threshold of 95 % were applied to assess the statistical significance of these differences against simulated interannual climate variability. In this study, we mainly discuss summer (JJA) estimates since numerous studies use pedogenic carbonates, which are preferentially formed during soil drying when evaporation exceeds precipitation (e.g., Gallagher et al., 2019; Breecker et al., 2009; Zamanian et al., 2016) as a proxy for stable isotope paleoaltimetry. However, since there are uncertainties about the extent of the seasonal bias in pedogenic carbonate formation (e.g., Kelson et al., 2020), the annual means are also provided. The elevation–δ18Op relationships, further referred to as the isotopic lapse rates (ILRs), were estimated for different geographic areas around the Alps (Fig. 1a) by performing ordinary least-squares (OLS) linear regressions on the grid point values within each region. We use the notation −1 ‰ km−1 (instead of 1 ‰ km−1) to report a decrease of 1 ‰ for an elevation increase of 1 km. We highlight that the aim of the analysis is to determine if the elevation–δ18Op relationship over a specific transect would change in response to the different topographic configurations. The estimated lapse rates are not intended to serve as a predictive model for calculating paleoelevation but as a comparison among the topographic configurations to highlight the need to consider the potential changes in lapse rate through space and time. This is because the estimated lapse rates only reflect the scenarios of changes in surface uplift through time without changes in the associated global climate and are therefore not realistic enough to constrain past vertical changes of the Alps. The statistical uncertainties of the calculated lapse rate are determined using the 95 % confidence interval around the calculated OLS slope using a t distribution with n−2 degrees of freedom where the standard deviation of the slope is the point estimate for n data points. Additionally, the coefficient of determination (R2), a measure of the fraction of the variability of the δ18Op values that can be explained by the best-fitted OLS estimates, is also reported. We further show the 95 % confidence and prediction interval around the regression-fitted model to highlight the uncertainties around the individual topographic configuration if it was meant to be used to calculate the paleoelevation for reconstructed δ18Op values under the assumption of no changes in global climate over time. In such a case, however, it would not be appropriate to compare the error limits around the regression line for the different scenarios, since their estimates are based on samples from different distributions. We refer the reader to Montgomery and Runger (2010) for more details about the mathematical derivation of the reported metrics.
The prominent Northern Hemisphere teleconnection patterns (i.e., North Atlantic Oscillation – NAO, as well as the East Atlantic – EA, Scandinavian – SCAN, and East Atlantic–Western Russia – EA/WR – patterns) were extracted from the model output to investigate the influence of surface uplift on synoptic-scale atmospheric variability, which in turn affects atmospheric moisture transport and δ18Op values. These were captured by conducting a principal component analysis (PCA) or empirical orthogonal function (EOF) analysis (e.g., von Storch and Zwiers, 2001; Hannachi et al., 2007) on the summer (JJA) mean sea level pressure (slp) fields in the North Atlantic–European domain (20–80∘ N, 80∘ W–40∘ E). Before the EOF analysis, a spatial weighting of the latitude of the pressure anomalies was applied to equalize the atmospheric field geographically, as North et al. (1982) recommended. The patterns extracted from present-day ERA5 mean sea level pressure data were used as a reference to help group the modes of variability from the topography experiments.
For further analysis of the effects of changing topography on regional climate across the orogen, we extracted variations in vertical wind velocity (omega), cloud cover, and relative humidity along-strike (west to east) of the Alps. Since the position of the Alps is approximately parallel to the present-day prevailing wind direction, along-strike variations in these climate elements can provide insight into the potential evolution of air parcels originating from the west. This analysis is complemented by trajectory analyses (see Sect. 3.6).
3.6 Trajectory analysis
Kinetic back-trajectory analyses were performed to investigate the impacts of the topography scenarios on moisture sources and transport across the Alps. Specifically, the Lagrangian analysis tool LAGRANTO (Sprenger and Wernli, 2015) was used with the three-dimensional wind fields (i.e., zonal u, meridional v, and vertical – omega – wind velocities) of the 6 h model outputs for the trajectory analysis. The tool uses a robust numerical scheme with efficient spatial interpolation (bilinear and linear interpolation for the horizontal and vertical directions, respectively). The trajectories were backtracked for 5 d from a receptor point at the 850 hPa vertical level defined at four different locations (i.e., Graz at 47.06∘ N, 15.44∘ E; Munich at 48.14∘ N, 11.53∘ E; Bologna at 44.49∘ N, 11.38∘ E; Lyon at 45.81∘ N, 4.82∘ E).
This section summarizes the simulated changes in regional climate and δ18Op values in response to the different topographic configurations across the Alps (Sect. 3.2, Fig. S1 in the Supplement). More specifically, the presentation of results focuses on δ18Op values, isotopic lapse rate, precipitation amount, near-surface temperature, moisture transport, and atmospheric circulation patterns. The section comprises present-day model validation with observed δ18Op values (Sect. 4.1), a summary of the CTL experiment (Sect. 4.2), and the changes mentioned above relative to the CTL simulation (Sect. 4.3–4.10). Unless stated otherwise, the results are presented for the summer (JJA) season. The annual-scale changes are included in the Supplement to this paper.
4.1 Present-day (PD) simulation and model validation
The simulated annual mean δ18Op values decrease from the North Atlantic Ocean towards eastern Europe and over the Alps by 10 ‰ to 12 ‰ and deviate from the observed GNIP data slightly (∼1–2 ‰; Fig. 1b). The annual means of near-surface temperature and precipitation across the Alps are 0–4 ∘C and ∼150–200 mm month−1, respectively. Low-level winds originating from the North Atlantic travel toward Europe and show slight deflections across the Alps (Fig. 1d). Overall, comparing the annual long-term means of the model outputs to observed GNIP stations δ18Op values and observed PD precipitation and temperature patterns indicates that the model reasonably represents δ18Op values and the regional climate across Europe. The topography used as an input parameter for the model moderately represents the topography of the Alps with a dampened elevation of the highest peaks (Fig. 1a).
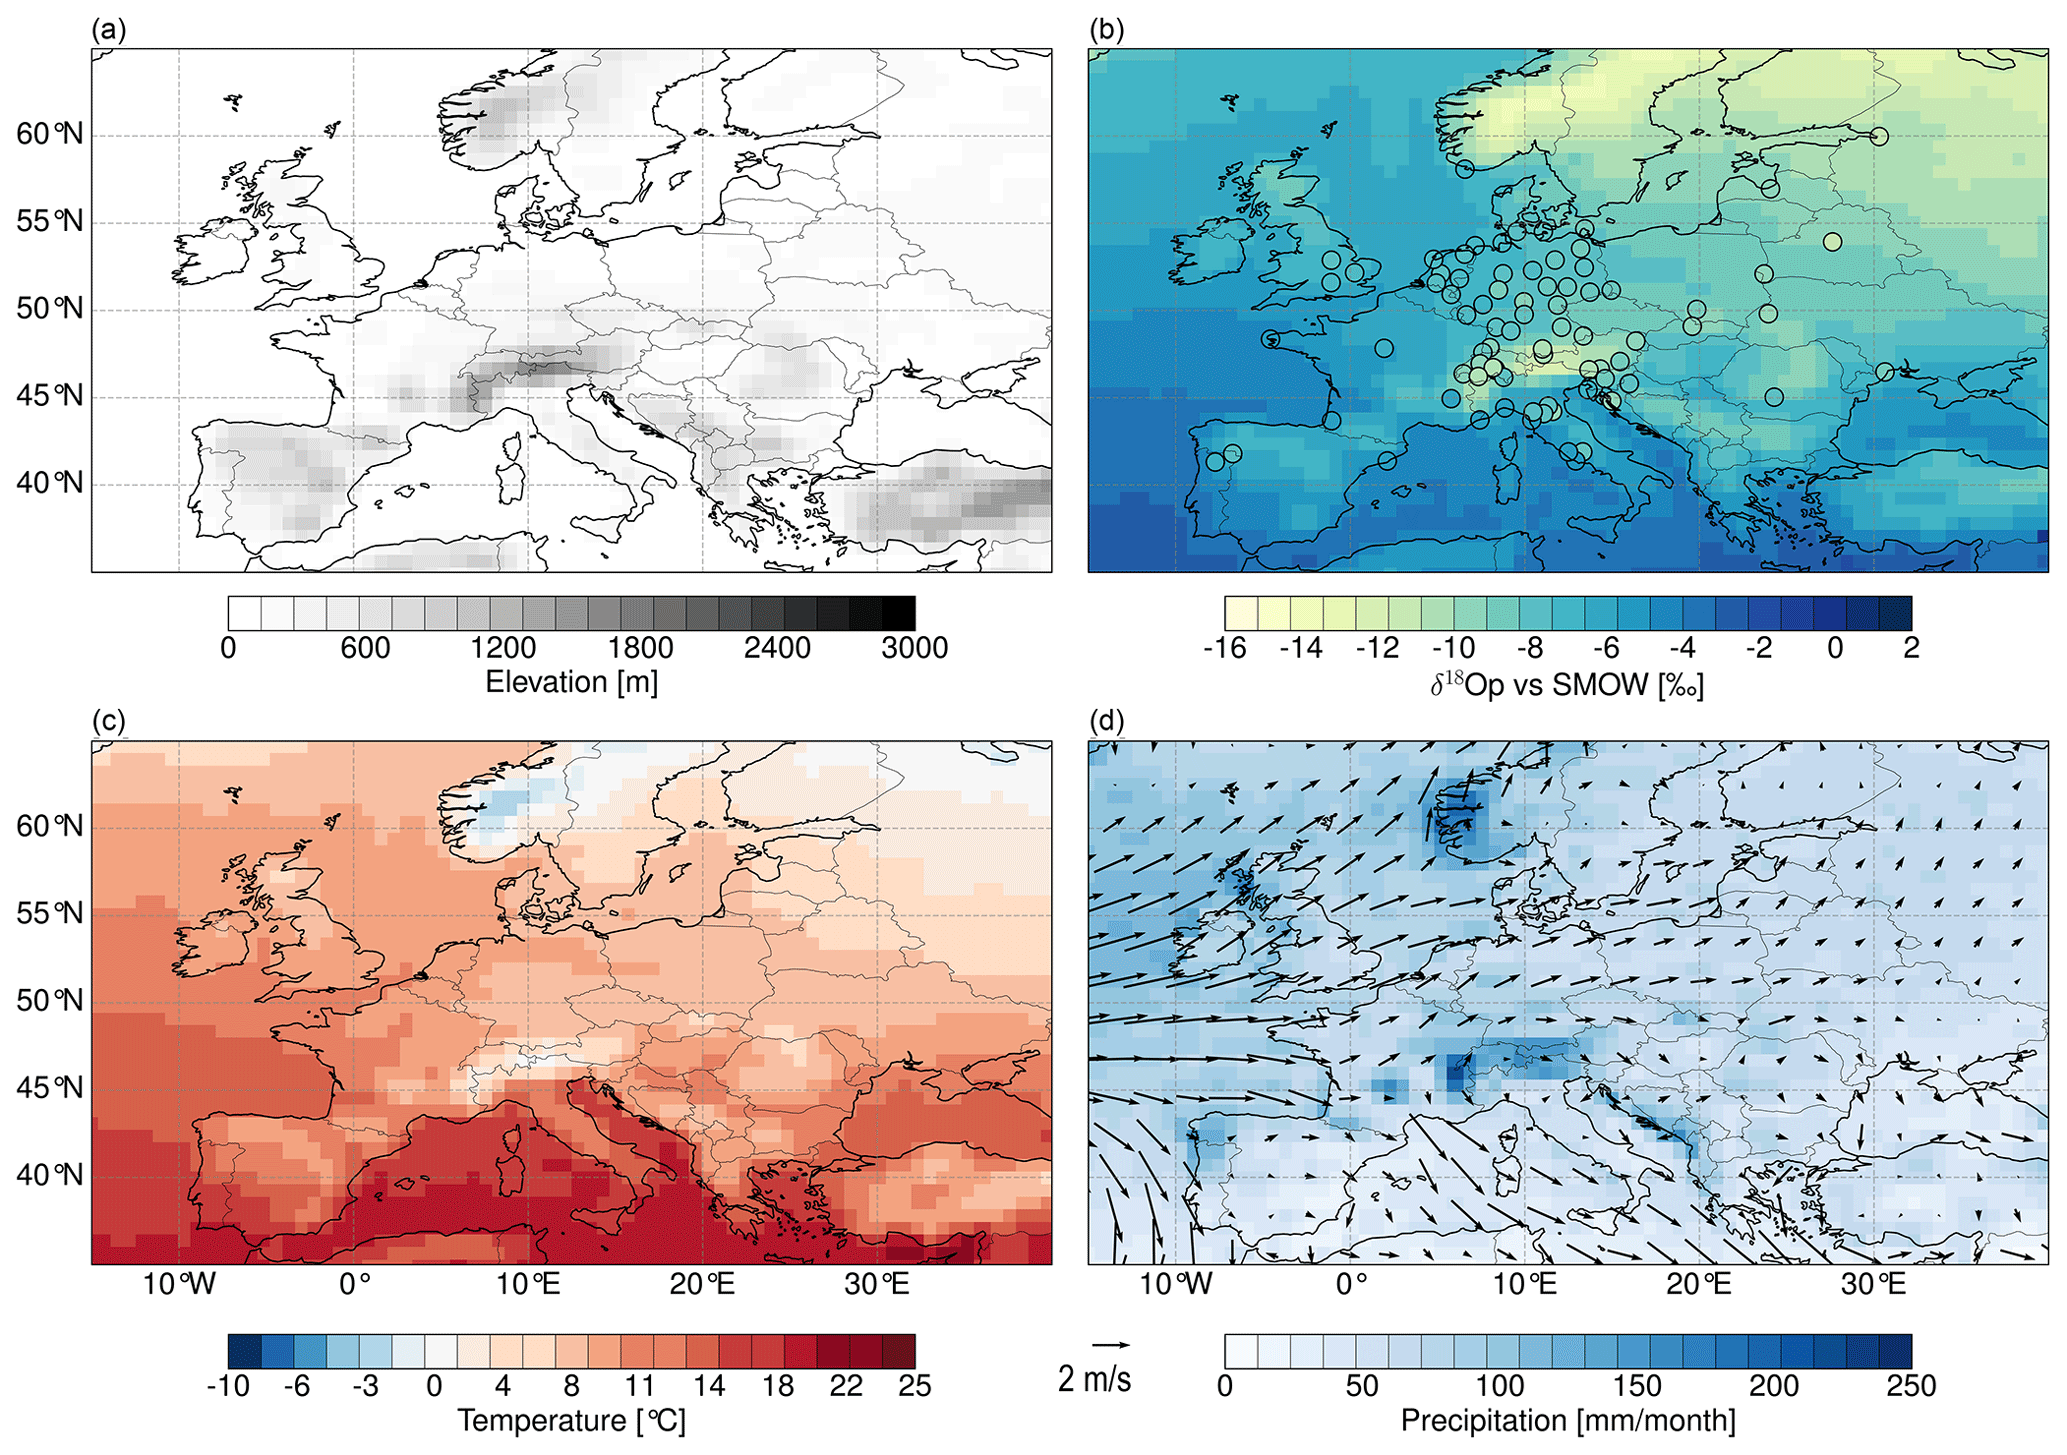
Figure 1Present-day (PD) simulation topography (a) with simulated (shading on map) and observed (circles) annual means of δ18Op values. Colored circles represent observed δ18Op values obtained from GNIP stations (b), simulated near-surface temperature (c), and precipitation amount (colored shading) with near-surface wind patterns (arrows: length of arrows indicates wind speed, m s−1) (d).
4.2 Control simulation (CTL) δ18Op values, near-surface temperature, and precipitation
The simulation with pre-industrial (PI) boundary conditions and PD topography did not show a significant difference in predicted δ18Op values compared to the PD simulation. Overall, the CTL experiment shows decreasing patterns of summer δ18Op values towards northeastern Europe and predicts 18O-depleted δ18Op values in the range of −10 ‰ to −12 ‰ across the Alps (Fig. 2a). However, the δ18Op values slightly increase towards the east of the Alps (∼20∘ E), yielding values from −10 ‰ to −6 ‰. Near-surface temperatures are estimated to be more than 10 ∘C across Europe, with minimum values across the Alps (2–6 ∘C) and a cooling gradient towards the north (Fig. 3a). Moreover, the predicted patterns show maximum near-surface temperatures across the Mediterranean region. The simulated precipitation patterns decrease towards the south, with the Mediterranean region having the driest climate (Fig. 4a). However, the topography of the Alps coincides with higher precipitation (an average of summer months of ∼125 mm month−1) compared to estimates across central Europe. On the western flanks of the Alps, low-level westerly winds are deflected in a north–south bifurcation pattern (Fig. 4a).
4.3 Changes in δ18Op values for the different topographic scenarios
The simulated regional patterns of δ18Op values show significant changes in response to the different topography scenarios, especially in regions of modified topography. Overall, the δ18Op values decrease with increasing elevation. This decrease is accentuated when the topography of the Western–Central Alps is higher (i.e., for the W2 configurations of scenario 1). More specifically, the W2E1 experiment predicts a significant decrease in δ18Op values across the Alps in the range of 2 ‰ to 8 ‰ with minimum δ18Op values in the Western–Central Alps (Fig. 2b). The W2E0 experiment predicts a more localized significant decrease of 2 to 6 ‰ in the Western–Central Alps (Fig. 2d). In contrast, the W1E2 configuration results in a decrease of 2 to 6 ‰ over the extended east flank of the Alps (Fig. 2e), and the W1E0 simulation does not predict any statistically significant changes in δ18Op values across the orogen (Fig. 2c). The W2E2 configuration (of scenario 2) results in a decrease in δ18Op values in the range of 2 ‰ to 6 ‰ across the Alps and the adjacent low-elevation regions (Fig. 2f). However, the W2E2 experiment also predicts a substantial increase in δ18Op values across northwestern Europe (i.e., over Ireland and the United Kingdom – UK). The experiment with no Alps (W0E0) predicts an increase in δ18Op up to 8 ‰ (not shown) and is similar to the results presented in Botsyun et al. (2020). We do not further discuss this result and refer the reader to Botsyun et al. (2020) for more details. All experiments predict changes in δ18Op values of 1 ‰ to 2 ‰ across Europe independent of direct topographic changes. However, these independent changes are only statistically significant for the W2 experiments. On the annual scale, the predictions show similar patterns, but changes are more localized and reduced in magnitude by ∼2 ‰ (Fig. S5).
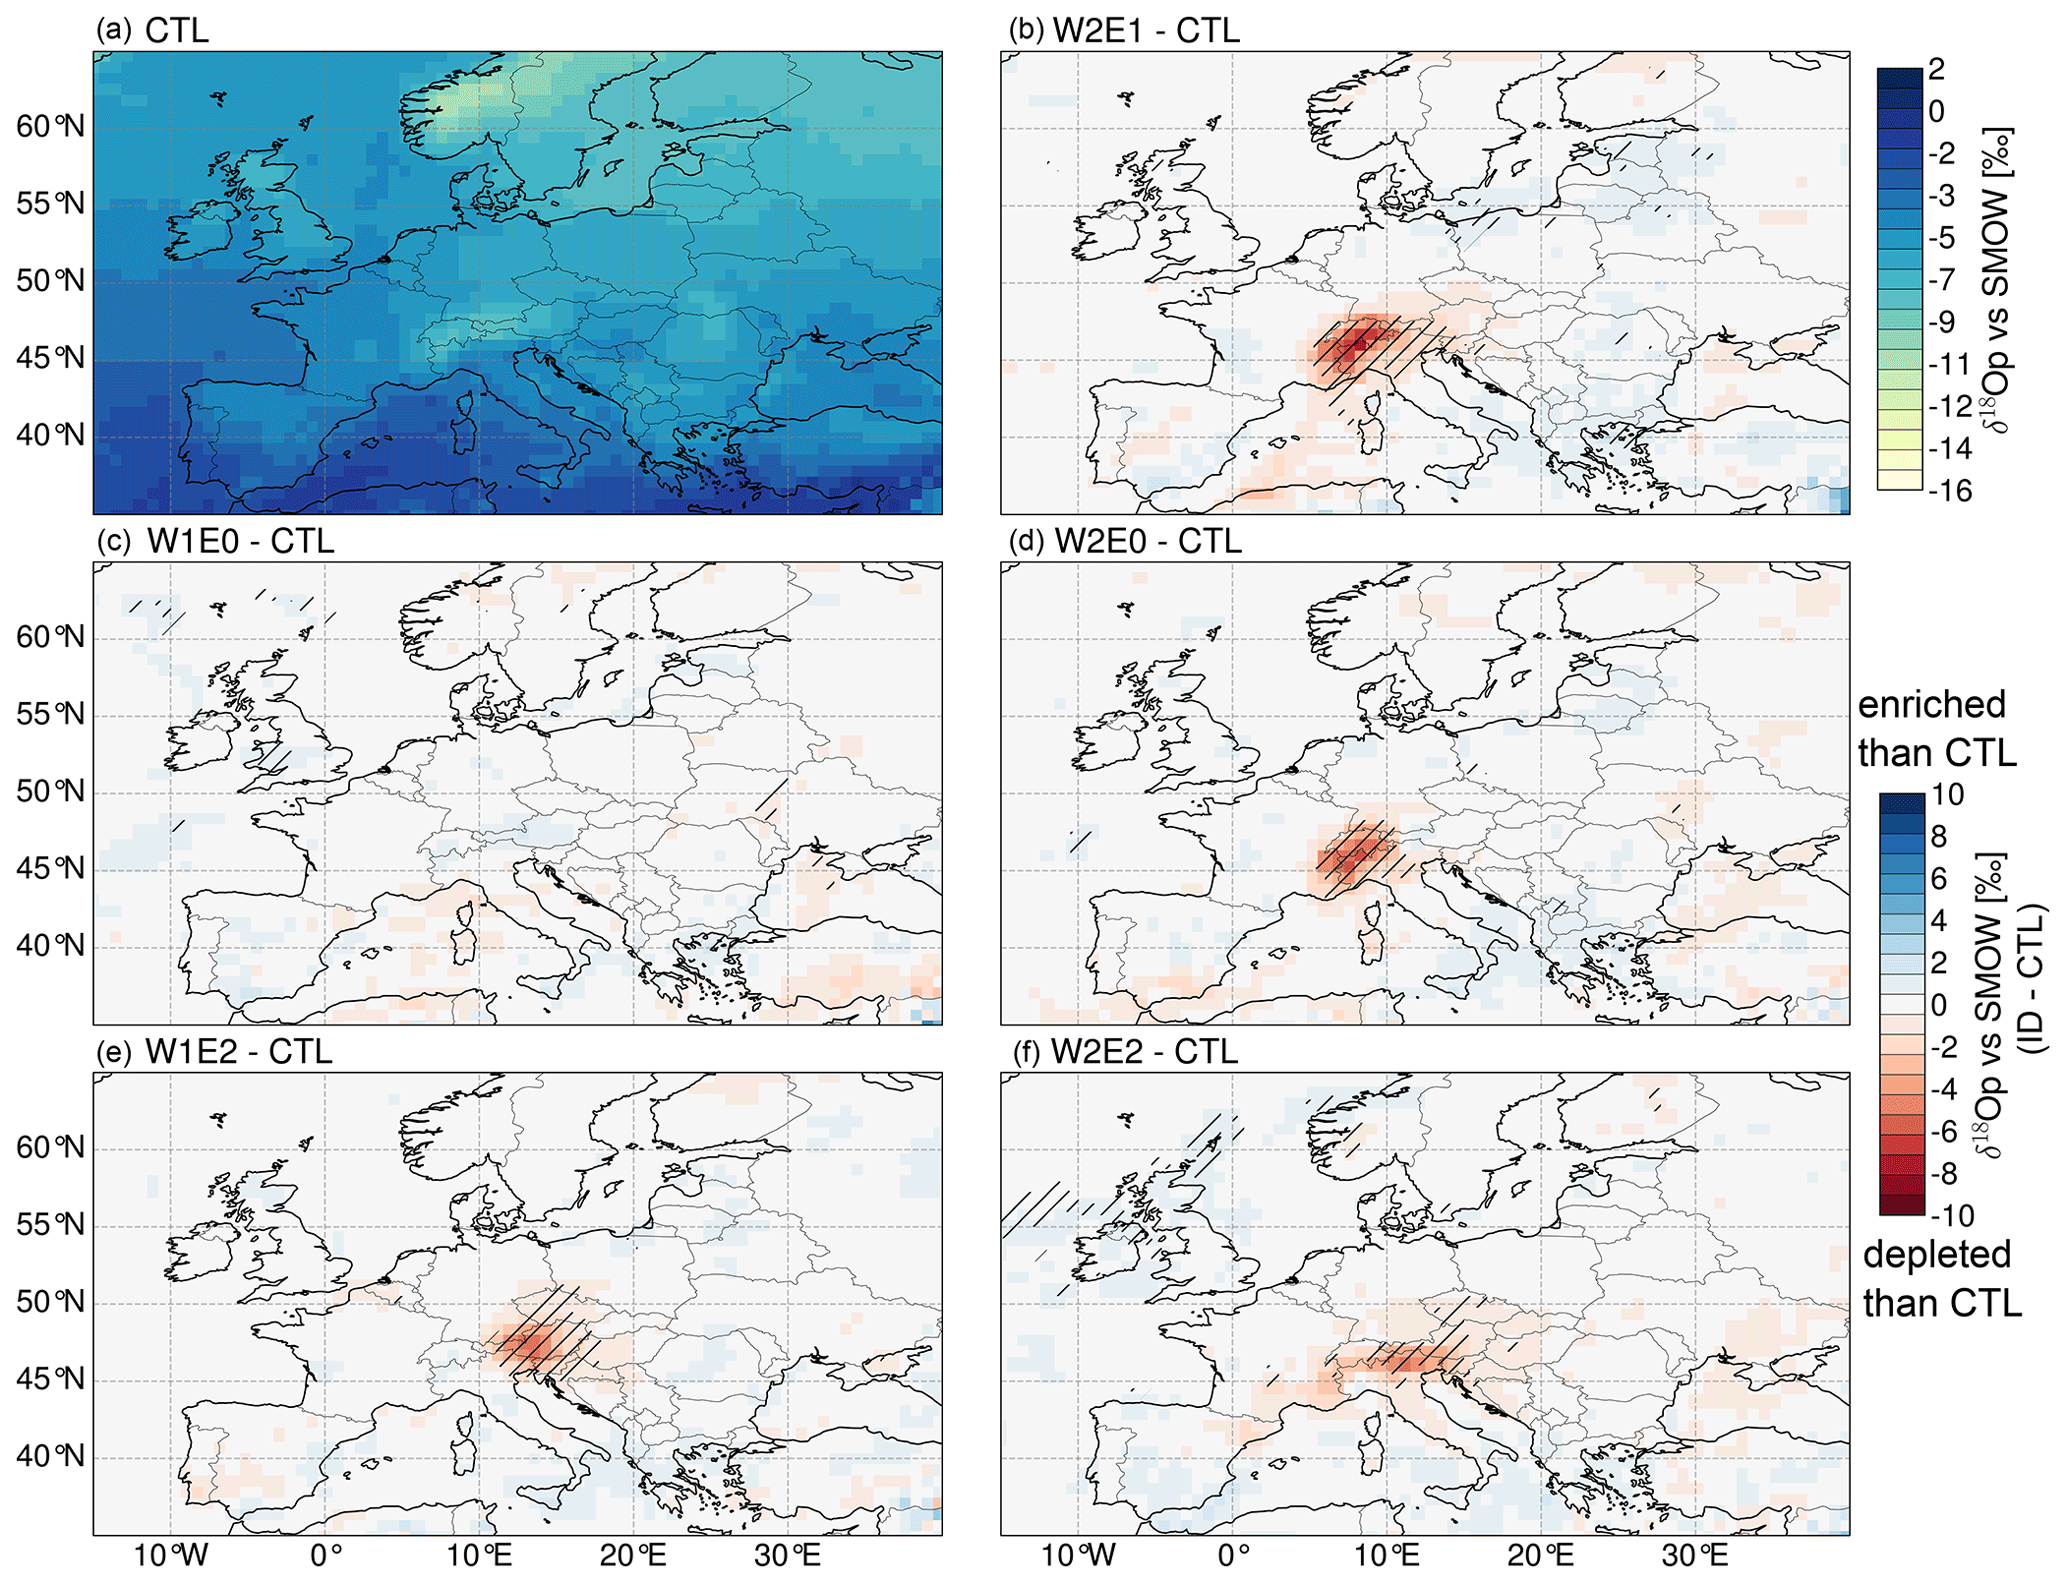
Figure 2Seasonal (JJA) long-term mean of δ18Op values of the CTL experiment (a) and seasonal (JJA) mean difference of δ18Op values for the different topography scenarios, i.e., W2E1-CTL (b), W1E0-CTL (c), W2E0-CTL (d), W1E2-CTL (e), and W2E2-CTL (f). Red color ranges represent heavy isotope depletion, and blue color ranges represent an enrichment in heavy isotopes relative to the CTL experiment. Regions that experience changes that are statistically significant, as indicated by a Student's t-test analysis with a 95 % confidence level, are marked with black slashed stippling.
4.4 Changes in near-surface temperature for the topographic scenarios
The topographic scenarios predict significant localized cooling or warming where the topography is raised or lowered, respectively. The W2E1 experiment predicts a significant decrease of 5 to 12 ∘C in the Western–Central Alps (Fig. 3b). The W2E0 simulation predicts similar changes in the Western–Central Alps, but with a corresponding increase of ∼5 ∘C in the Eastern Alps in response to the reduced elevation (Fig. 3d). On the other hand, the W1E2 simulation predicts a significant decrease in near-surface temperature by 2 to 7 ∘C in the Eastern Alps and shows a slight increase of ∼1 ∘C over southeastern Europe (Fig. 3e). The W1E0 experiment also estimates an increase of 2 to 5 ∘C in the Eastern Alps (Fig. 3c). In total, the topographic configurations with a steeper gradient across the Alps (e.g., W2E0 and W1E0) result in a decrease in near-surface temperatures of ∼1 ∘C in parts of northeastern Europe. The W2E2 configuration (of scenario 2) results in a significant temperature decrease of 5 to 10 ∘C across the Alps from west to east and shows larger affected low-elevation areas around the Alps (Fig. 3f). Specifically, the changes show a decreasing pattern towards the eastern flank of the Alps. The simulated patterns on the annual scale are very similar to the summer estimates (Fig. S6).
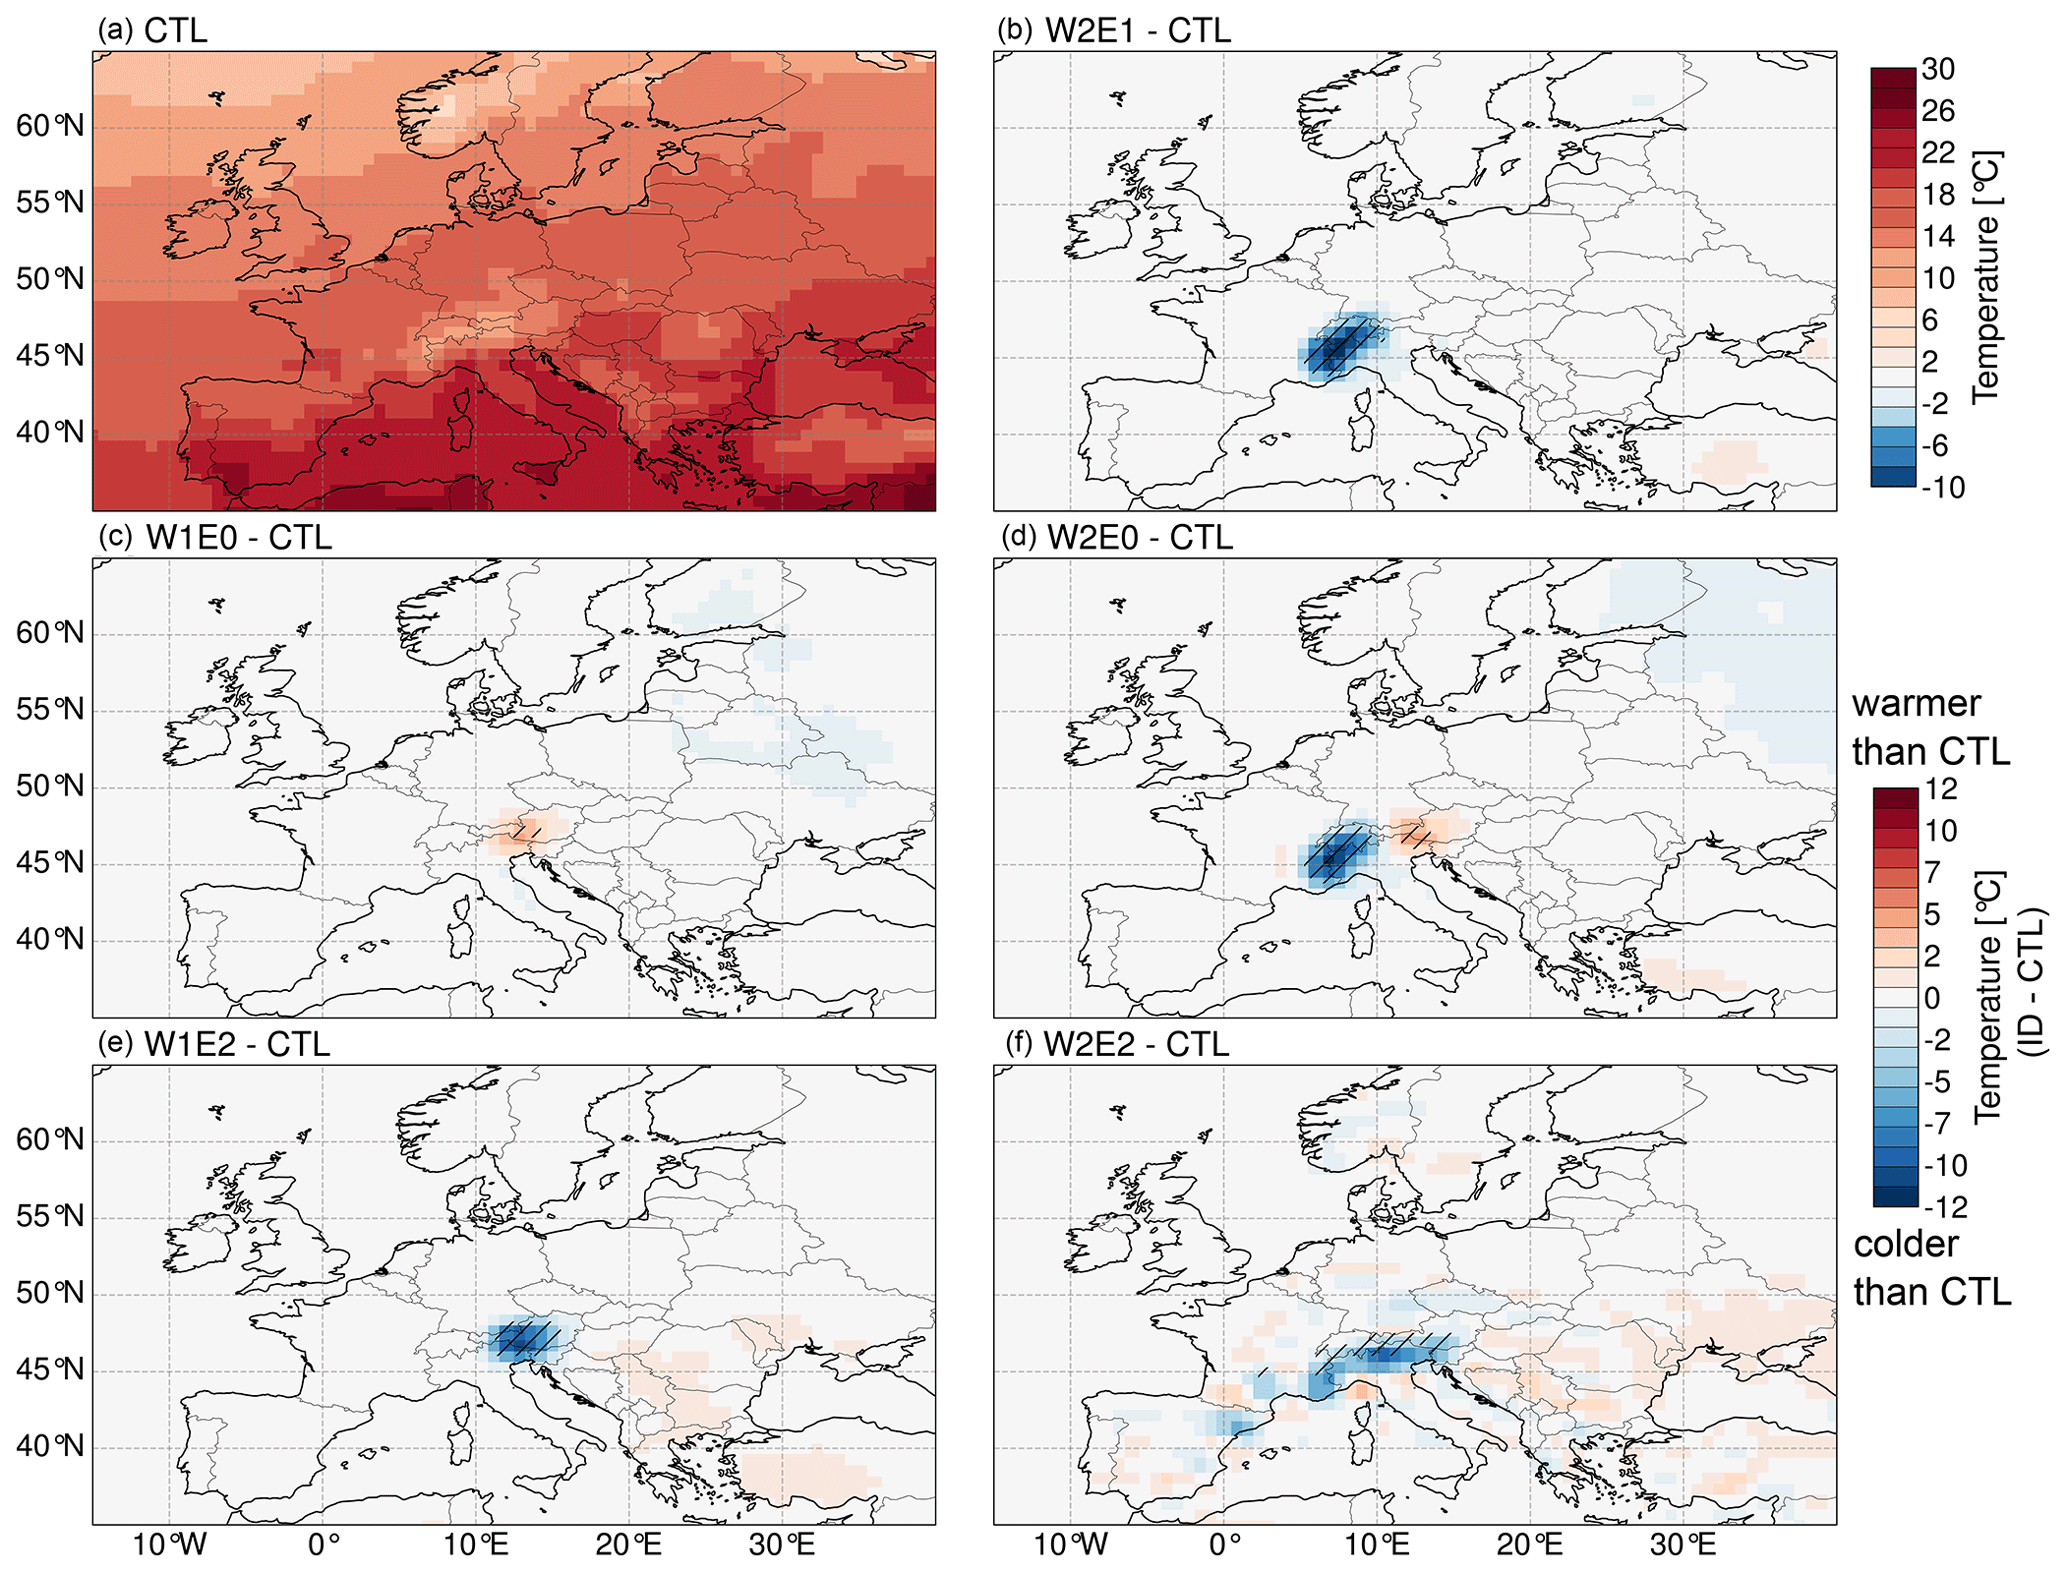
Figure 3Seasonal (JJA) long-term mean of the near-surface temperature of the CTL experiment (a) and seasonal (JJA) mean difference of near-surface temperature for the different topography scenarios, i.e., W2E1-CTL (b), W1E0-CTL (c), W2E0-CTL (d), W1E2-CTL (e), and W2E2-CTL (f). Red color ranges represent warmer temperatures, and blue color ranges represent colder temperatures than in the CTL experiment. Regions that experience changes that are statistically significant, as indicated by a Student's t-test analysis with a 95 % confidence level, are marked with black slashed stippling.
4.5 Changes in precipitation for the topographic scenarios
For all scenarios, an increase in elevation results in an increase in precipitation across the orogen. The W2 experiments of scenario 1 predict more important changes in the orogen and other parts of Europe than the W1 experiments. The W2E1 experiment predicts a significant increase in precipitation of up to 125 mm month−1 across the Alps and a decrease of 25 mm month−1 over eastern and central Europe around the Alps (Fig. 4b). Moreover, the W2E0 experiment predicts an increase of up to 100 mm month−1 in the Western–Central Alps and shows a more widespread decrease in the surrounding regions (Fig. 4d). In contrast, the W1E2 experiment estimates an increase of <80 mm month−1 across the Alps from the west, which peaks in the Eastern Alps (Fig. 4e), and the W1E0 experiment predicts a decrease of ∼25 mm month−1 in the Eastern Alps (Fig. 4c). The W2E2 configuration of scenario 2 results in a significant increase of up to 125 mm month−1 across the Alps from west to east and a decrease toward northern and eastern Europe (Fig. 4f). However, only precipitation increases in northwestern Russia and northern Europe for experiments W2E1 and W2E0, respectively, are notable and statistically significant changes far from the orogen. Over annual timescales, changes are more localized and restricted to regions with modified topography (Fig. S7).
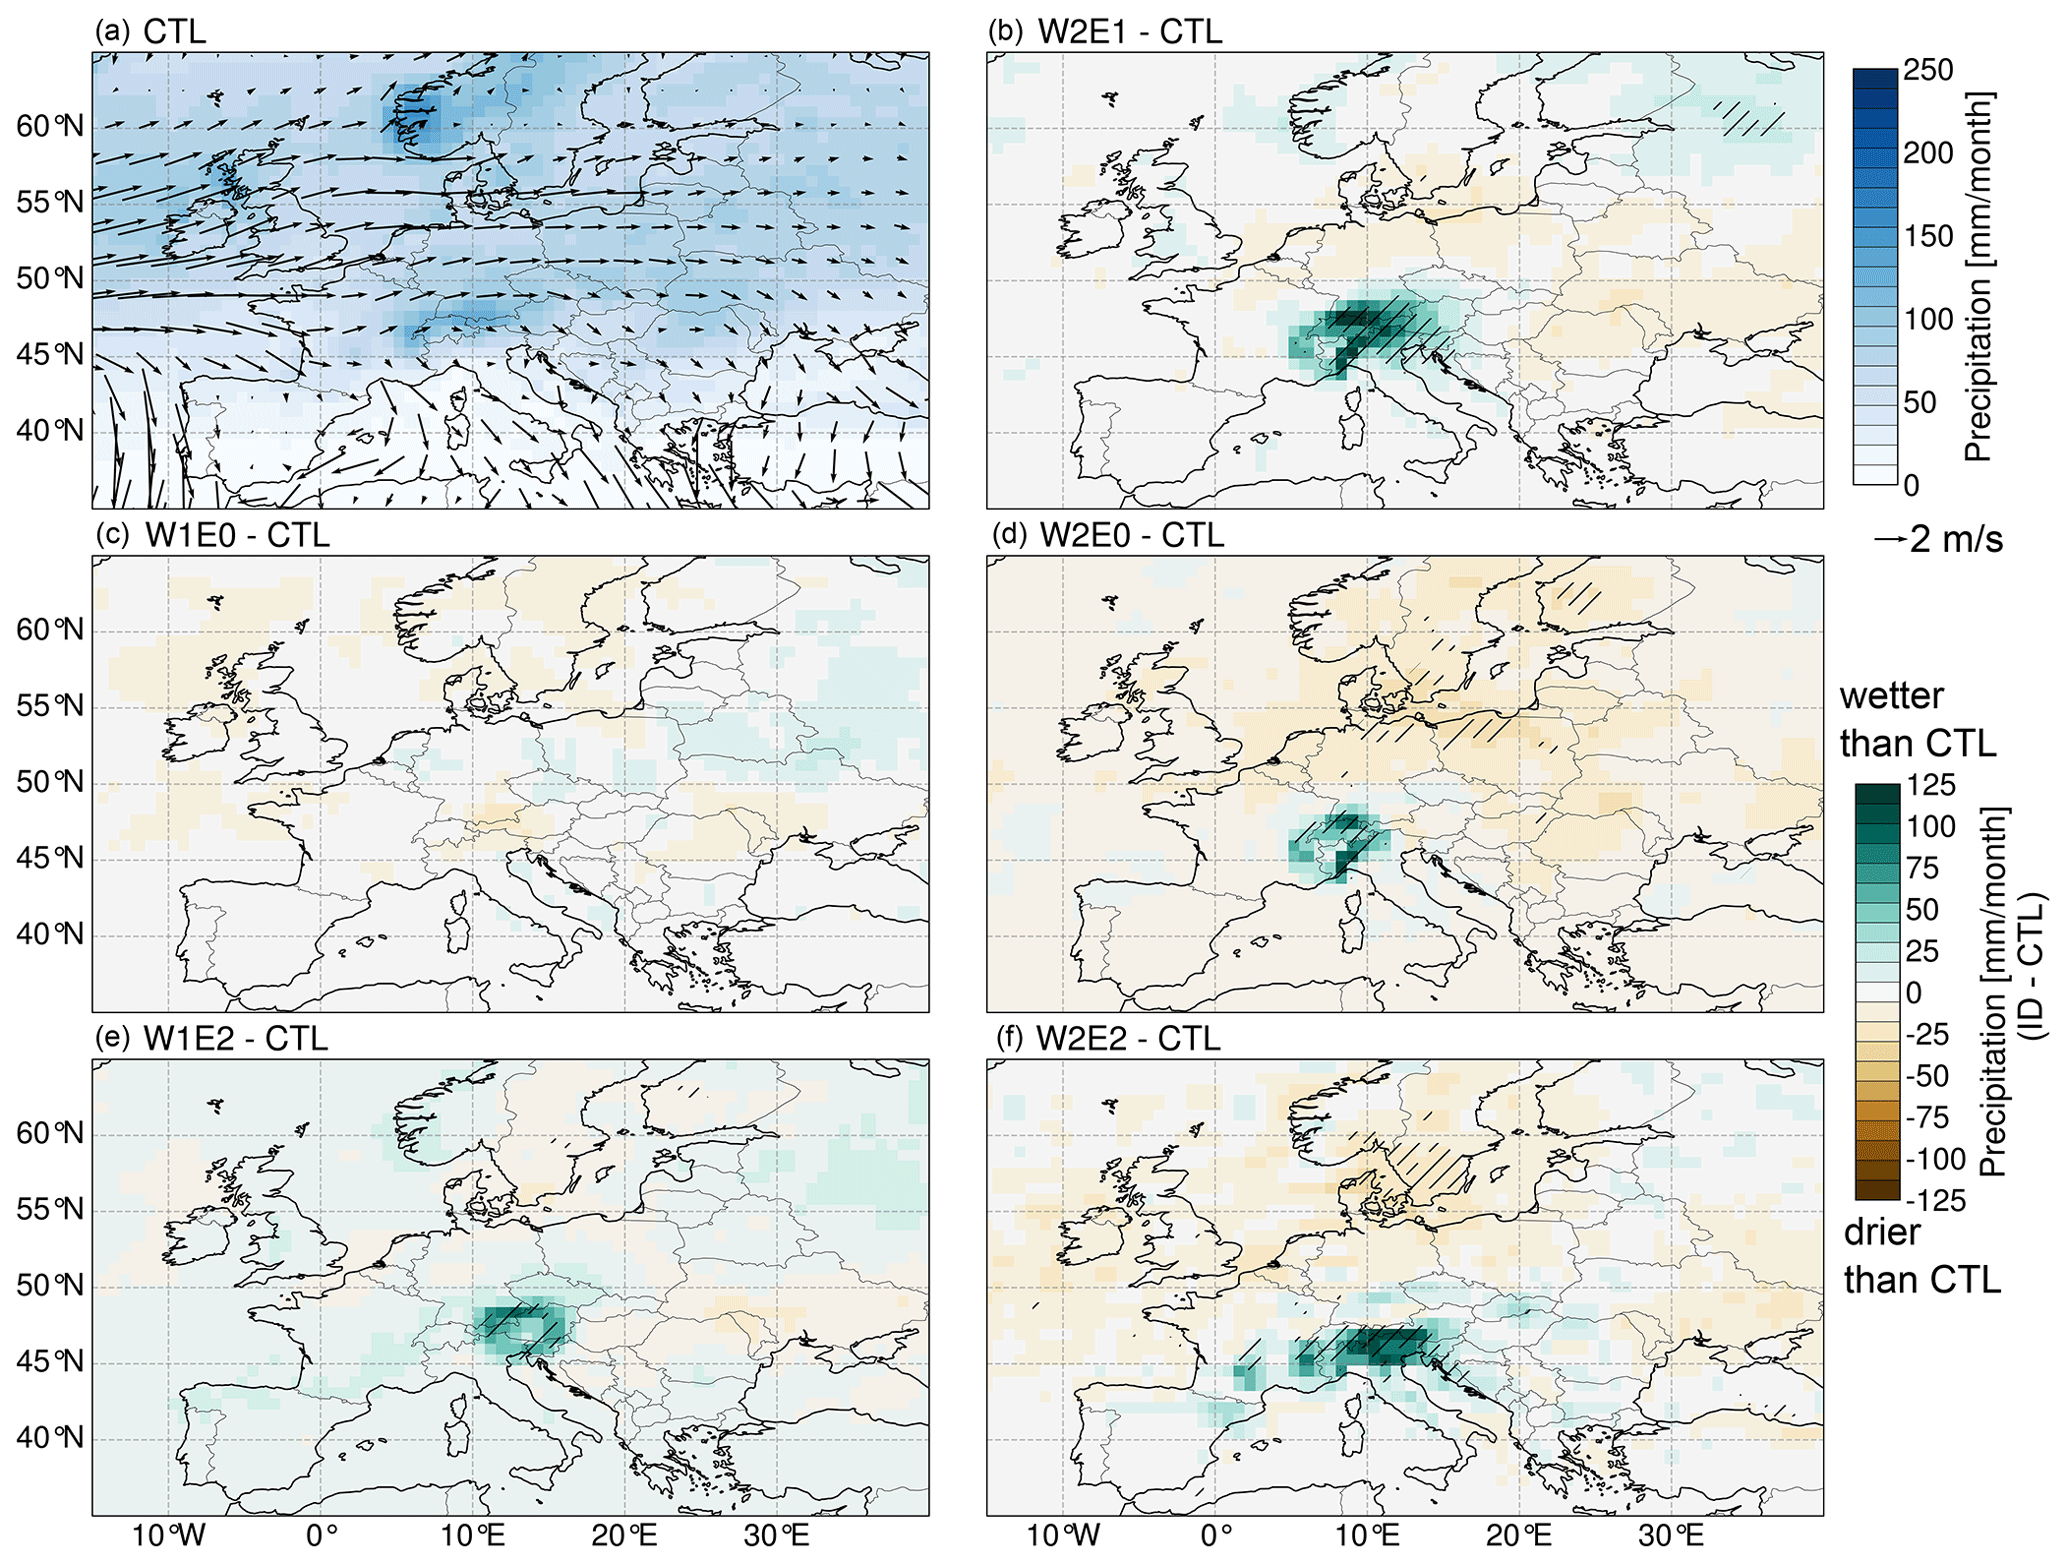
Figure 4Seasonal (JJA) long-term mean of precipitation amount (shading) with near-surface wind patterns (arrows) of the CTL experiment (a) and mean difference of precipitation amount for the different topography scenarios, i.e., W2E1-CTL (b), W1E0-CTL (c), W2E0-CTL (d), W1E2-CTL (e), and W2E2-CTL (f). Green color ranges represent wetter conditions, and brown color ranges represent drier conditions than in the CTL experiment. Regions that experience changes that are statistically significant, as indicated by a Student's t-test analysis with a 95 % confidence level, are marked with black slashed stippling.
4.6 Spatial profiles of δ18Op values across the Alps
Spatial mean oxygen isotopic profiles across the Alps in the longitudinal (46–47∘ N) and latitudinal (11–15∘ E) directions reveal varied responses to the different topographic scenarios. Overall, the isotopic profiles show a decrease in δ18Op values across the Alps from west to east and from south to north. The difference in δ18Op values along the profiles is estimated to be less than −2 ‰ in low-elevation regions adjacent to the mountains and up to −8 ‰ between the low- and high-elevation ( Δδ18Op) regions of the modified topography experiments (Fig. 5). The W1E2, W1E1.5, and W1E0 configurations of scenario 1 result in locally low δ18Op values down to −11 ‰, −9 ‰, and −6 ‰, in the Eastern Alps, respectively (Fig. 5a, b). However, the W1 experiments predict no significant changes in the Western–Central Alps and the north–south direction. In contrast, the W2E1 and W2E0 experiments of scenario 1 predict a decrease down to −14 ‰ in the Western–Central Alps. The isotopic values gradually increase up to −8 ‰ and −6 ‰ in the Eastern Alps for W2E1 and W2E0, respectively.
The comparison of the isotopic profiles for scenarios 1 and 2 (i.e., between the diachronous and bulk surface uplift experiments) reveals a significant difference along the strike of the Alps. The differences in response to the topographic forcing of both scenarios are more visible across the Eastern Alps. They are greater by −0.5 ‰ to −2 ‰ for scenario 2 (Fig. S8a). However, the scenario 2 experiments show less negative δ18Op values across the Western–Central Alps (Fig. S8b).
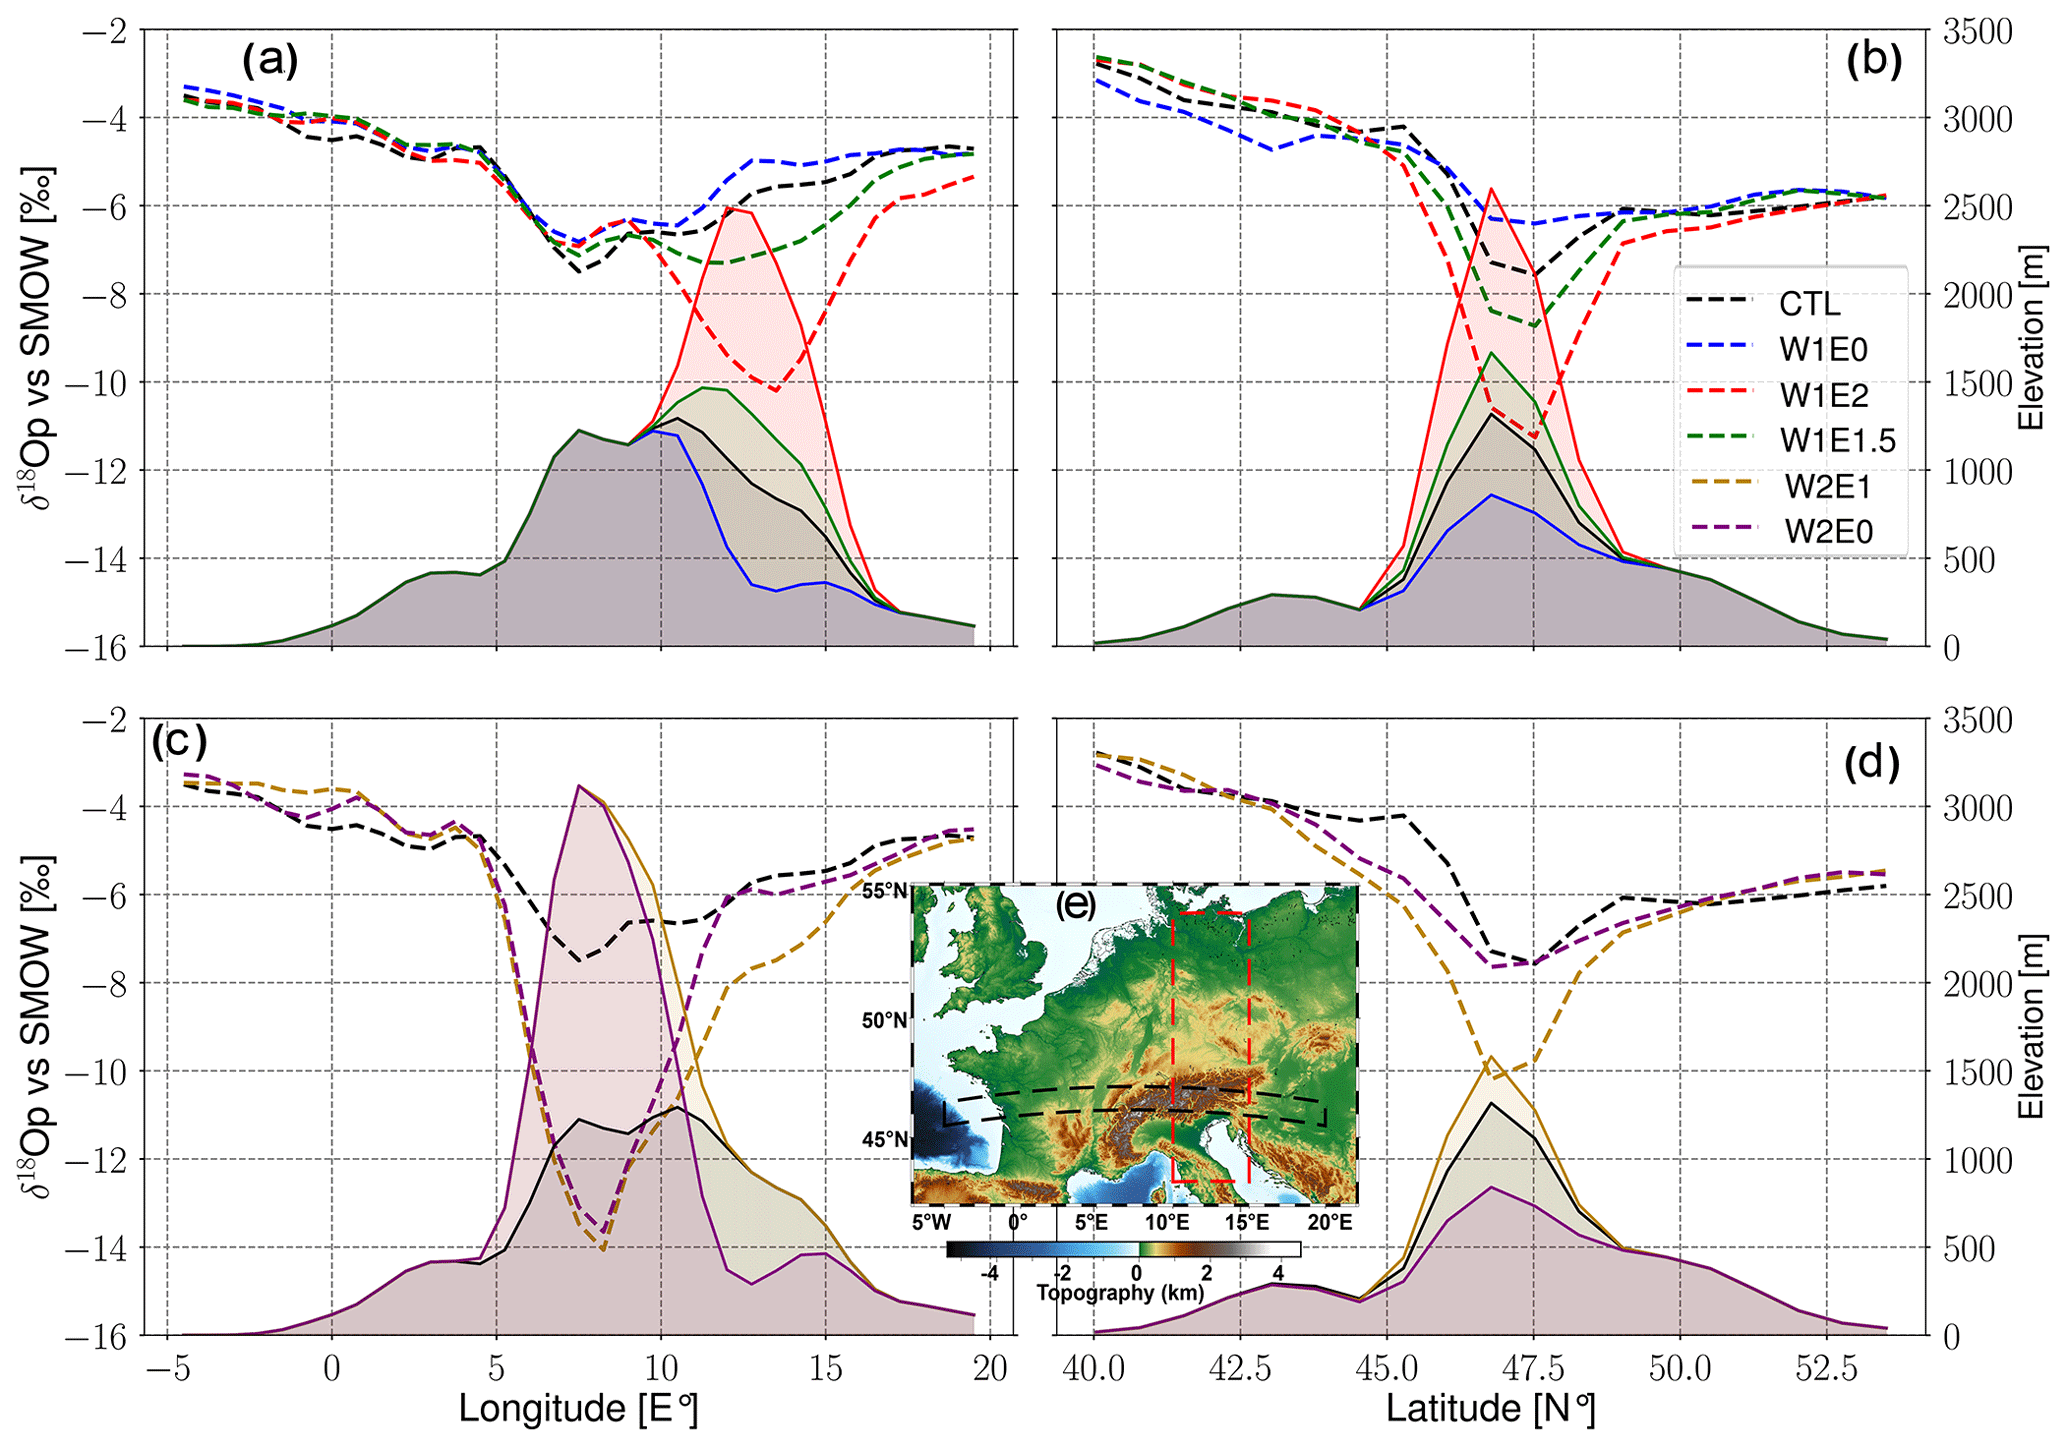
Figure 5Regional seasonal (JJA) means of spatial δ18Op values across the Alps in the longitudinal (averaged between 46 and 47∘ N) (a, c) and latitudinal (averaged between 11 and 15∘ E) (b, d) direction in response to different topographic scenarios (CTL in black, W1E0 in blue, W1E2 in red, W1E1.5 in green, W2E1 in gold, and W2E2 in purple). Colored shading represents topography profiles extracted from the W1 (a, b) and W2 (c, d) scenario 1 experiments. The latitudinal and longitudinal transects are indicated on the original topography used for the topographic modifications (e).
4.7 Changes in isotopic lapse rate in response to different scenarios
The isotopic lapse rates (ILRs) estimated for the different geographical windows around the Alps (Fig. 1a) show varied responses to the different topographic configurations. In relation to CTL experiment ILR estimates (i.e., −2.32 ‰ km−1, −2.18 ‰ km−1, and −3.11 ‰ km−1 with uncertainties ranging from 0.11 ‰ km−1–0.24 ‰ km−1 for the west, north, and south transects, respectively), the W1 experiments predict a decrease in ILRs for the western and southern transects (Fig. 6), and the W2 experiments predict an increase in the west and north transects (Fig. 7). Note that the W1E0 experiment estimates a dampened ILR due to the simultaneous increase in δ18Op values of the low-elevation areas (i.e., −2.08 (±0.22) ‰ km−1 for the west, −2.01 (±0.14) ‰ km−1 for the north, and −2.17 (±0.13) ‰ km−1 for the south transect) (Fig. 6). The W1E2 simulation predicts a steeper ILR for the north (−2.61 (±0.12) ‰ km−1) and a shallower ILR for the west (−1.83 (±0.24) ‰ km−1) and south (−2.96 (±0.13) ‰ km−1) transects (Fig. 6). The W2E1 and W2E0 experiments predict steeper ILRs for both the western (−2.78 (±0.15) and −2.68 (±0.14) ‰ km−1) and northern (−3.37 (±0.09) and −3.22 (±0.09) ‰ km−1) flanks and a dampened ILR for the south (−2.91 (±0.13) and −2.88 (±0.11) ‰ km−1) transect (Fig. 7). On the other hand, the W2E2 experiment estimated a shallower ILR of −1.49 (±0.23) ‰ km−1 for the west and −2.39 (±0.16) ‰ km−1 for the south transect but a steeper ILR of −2.59 (±0.14) ‰ km−1 for the north transect (Fig. 7). The r2 values associated with the ILRs exceeded 0.85. The estimated ILR changes using annual means are comparable to the patterns of summer means but with generally steeper gradients (see Figs. S9 and S10 in the Supplement).
4.8 Changes in moisture source and transport
The back-trajectory analyses demonstrate that the topographic scenarios have a significant influence on air (and therefore moisture) transport towards target regions on the eastern and southern flanks of the Alps. Therefore, the presentation of results (and the associated discussion in Sect. 5) focuses on regions around the cities of Graz (Fig. 8) and Bologna (Fig. 9), which represent locations in the east and south, respectively. The reader is referred to the Supplement for the back trajectories for the regions around Lyon (in the west) and Munich (to the north) (Figs. S11 and S12).
Overall, the model tracks most summer air masses back to the North Atlantic and some to a continental moisture source in western Europe, depending on the topography scenario and target location. The W2 experiments of scenario 1 (i.e., W2E1 and W2E0) show moisture ascending over the Western–Central Alps at a higher vertical level before finally descending to the target location in Graz (Fig. 8b, d). Moreover, the W2 experiments also show slight moisture sources from the southern flank of the Alps and predict a shorter moisture transport distance from the North Atlantic relative to the CTL experiment. However, the W1E0 experiment trajectories deviate slightly from the CTL experiment (Fig. 8c). Overall, the W1E2 and W2E2 trajectories toward Graz (Fig. 8e, f) show significant deviations from the CTL trajectories (Fig. 8a). W1E2 and W2E2 backtrack low-level air masses over northwestern Europe, showing a gradual ascent over the Alps towards the east at a shorter distance. However, the W1E2 trajectories show air mass transport at a higher level (∼700 hPa) directly from the North Atlantic to the target region on the east flank of the Alps without any orographic barrier deflection (Fig. 8e).
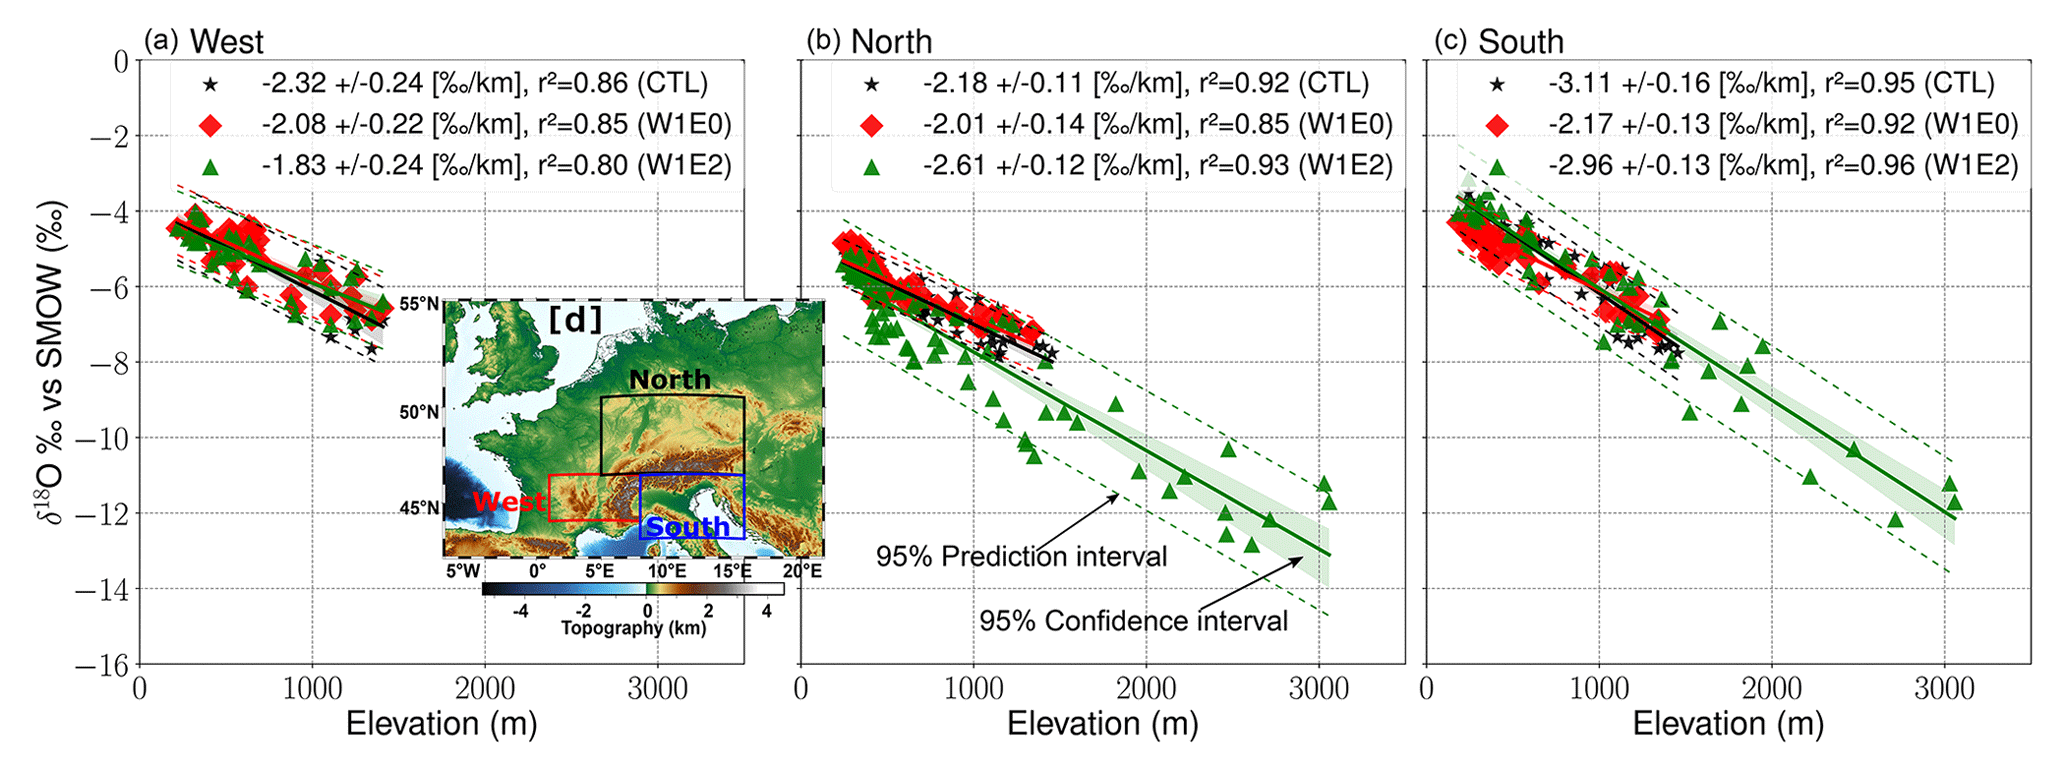
Figure 6Summer isotopic lapse rate (ILR) estimates for the W1 topography scenario (i.e., W1E0 in red, W1E2 in green, and CTL in black) experiments for the different transects around the Alps as shown in panel (d) (west: 44–47∘ N, 1–8∘ E; south: 43–47∘ N, 8–15∘ E; north: 47–50∘ N, 5–16∘ E). The ILRs are estimated as the δ18Op elevation gradients using linear regression. The lapse rate uncertainties are determined using the 95 % confidence interval around the calculated OLS slope using a t distribution with n−2 degrees of freedom where the standard deviation of the slope is the point estimate, the coefficient of determination (r2) is the measure of the fraction of the variability of the δ18Op values that can be explained by the best-fitted OLS estimates, and the 95 % confidence and prediction intervals around the regression-fitted model highlight the uncertainties around the individual topographic configuration if it was meant to be used to calculate the paleoelevation for reconstructed δ18Op values.
For the CTL experiment, the air mass transport and distance to the southern location (i.e., Bologna, Fig. 9a) are similar to the results for Graz, but the moisture originates from a higher atmospheric level. The W2 experiments of scenario 1 also predict a significant influence on air mass trajectories to the southern flanks of the Alps. Specifically, the air masses from experiments W2E1 and W2E0 originate from the North Atlantic at a higher atmospheric level (∼750 hPa or less) and then divert towards the southeast at the western flank of the Alps before being transported to Bologna (Fig. 9b, d). Moreover, part of the air mass is transported across the Northern Alps and then diverted downwards through the eastern flank to the receptor location in the south. The W2E0 experiment shows a shorter moisture transport distance than the W2E1 trajectories. For the W1 experiments, W1E0 shows no significant difference in moisture transport compared to the CTL trajectories (Fig. 9c). W1E2 predicts a longer moisture transport distance from the North Atlantic at a higher atmospheric level and an ascent over the Alps towards the southern flanks (Fig. 9e). On the other hand, the results from the W2E2 experiment show air masses from western Europe descending towards the south (Fig. 9f). Moreover, the W2E2 experiment also shows some trajectories from the eastern side of the Alps for the calculated 5 d back trajectories. Overall, the target regions at the north and west flanks show fewer significant changes in air mass transport and source in response to the different topographic forcings (Figs. S11 and S12).
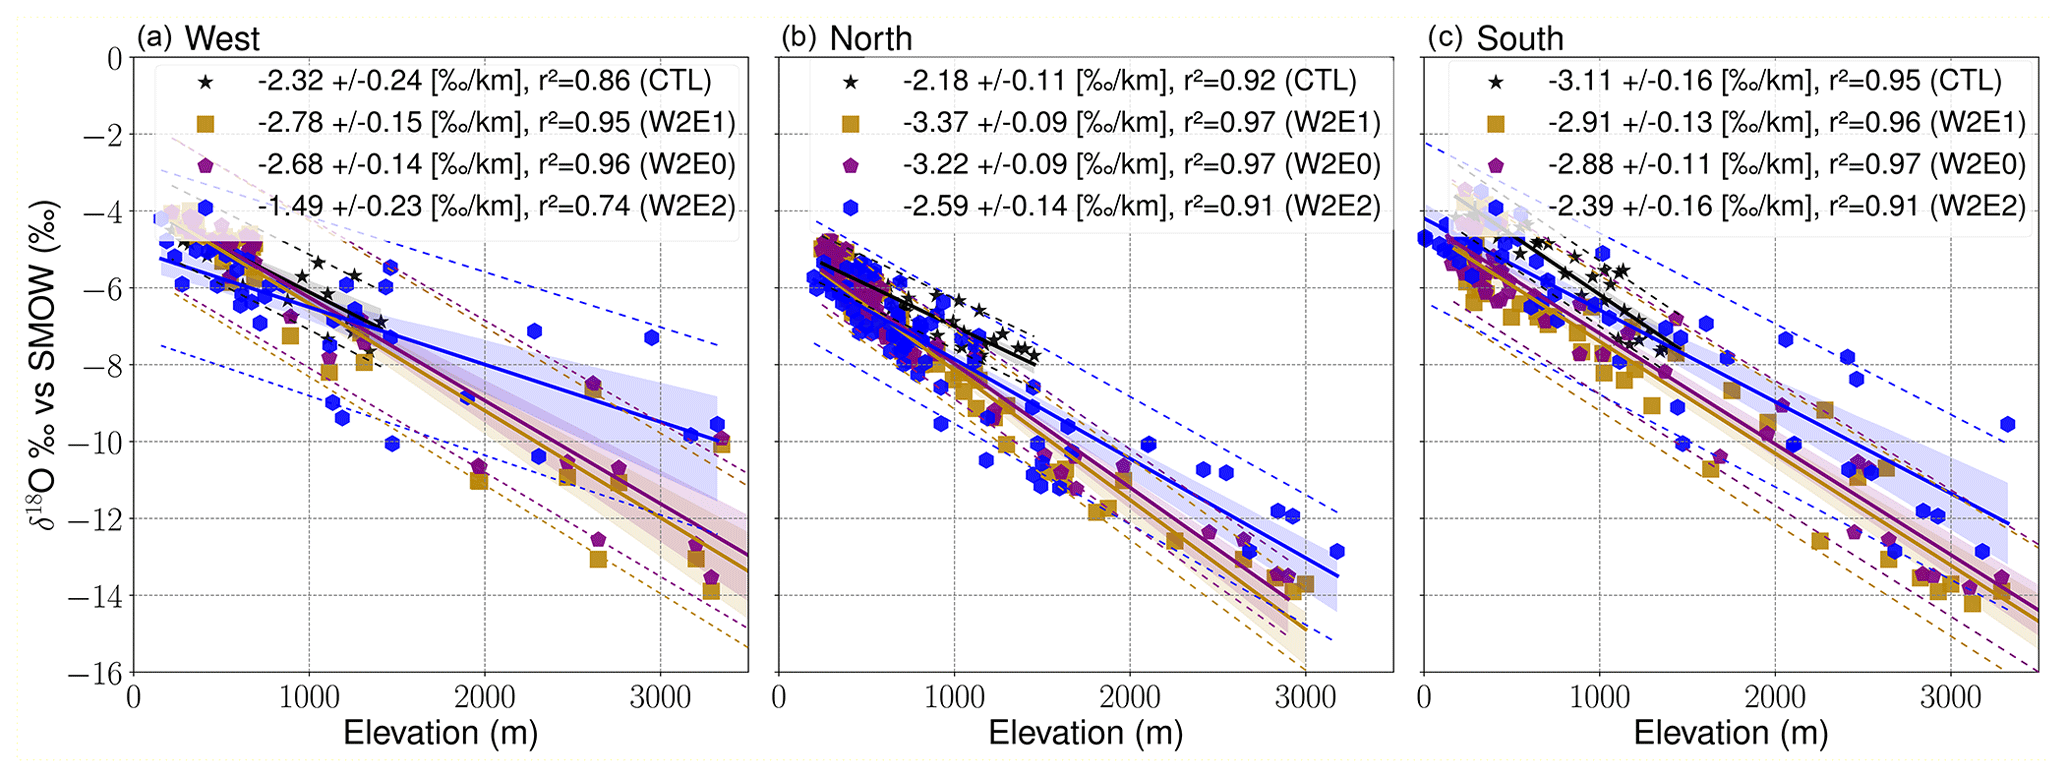
Figure 7Summer isotopic lapse rate (ILR) estimates for the W2 topography scenario (i.e., W2E0 in purple, W2E1 in gold, CTL in black, and W2E2 in blue) experiments for the different transects around the Alps as shown in Fig. 6e (west: 44–47∘ N, 1–8∘ E; south: 43–47∘ N, 8–15∘ E; north: 47–50∘ N, 5–16∘ E). The ILRs are estimated as the δ18Op elevation gradients using linear regression. The lapse rate uncertainties are determined using the 95 % confidence interval around the calculated OLS slope using a t distribution with n−2 degrees of freedom where the standard deviation of the slope is the point estimate, the coefficient of determination (r2) is the measure of the fraction of the variability of the δ18Op values that can be explained by the best-fitted OLS estimates, and the 95 % confidence and prediction intervals around the regression-fitted model highlight the uncertainties around the individual topographic configuration if it was meant to be used to calculate the paleoelevation for reconstructed δ18Op values.
4.9 Vertical structure of vertical wind velocity, cloud cover, and relative humidity across the Alps
The vertical cross-sections of the Alps reveal important changes in the tropospheric climate structure in response to the different topographic configurations. The CTL experiment shows negative omega values, indicating wind directions away from the ground, up to the ∼600 hPa atmospheric level in the Western–Central Alps and positive omega values towards the Eastern Alps (Fig. 10a). These regions of updraft (and subsidence) coincide with regions of high (and low) cloud formation (Fig. 10d). Moreover, the CTL experiment predicts a general decrease in relative humidity from low to high altitude levels (and from west to east) across the Alps but also predicts more humidity near the tropopause (Fig. 10g). Overall, the W1E0 experiment simulates a similar atmospheric structure in the Western–Central Alps (Fig. 10b, e, and h). However, the W1E2 atmospheric structure shows alternating moisture ascent and subsidence across the Alps. More specifically, another area of ascent is introduced over the elevated peak of the Eastern Alps (Fig. 10c). Cloud formation and relative humidity mimic this pattern, with high cloud cover and high relative humidity coinciding with negative omega (Fig. 10e, i). The W2 experiments show a more significant influence on the vertical atmospheric structure than the W1 experiments, especially at the upper-tropospheric levels (Fig. 11). The W2E1 and W2E0 cross-sections show a strong ascent velocity in the Western–Central Alps up to the upper troposphere and low-level subsidence in the Eastern Alps (Fig. 11a, b). A vertically extended region of strong cloud formation and high relative humidity spatially coincides with the area of ascent over the Western–Central Alps (Fig. 11d, e, g, and h). The high topography in scenario 2 (W2E2) results in an alternating pattern of positive and negative omega values that correspond to topographic troughs and peaks, respectively (Fig. 11c). Ascent (subsidence) spatially coincides with strong (weak) cloud formation and high (low) relative humidity (Fig. 11f, i).
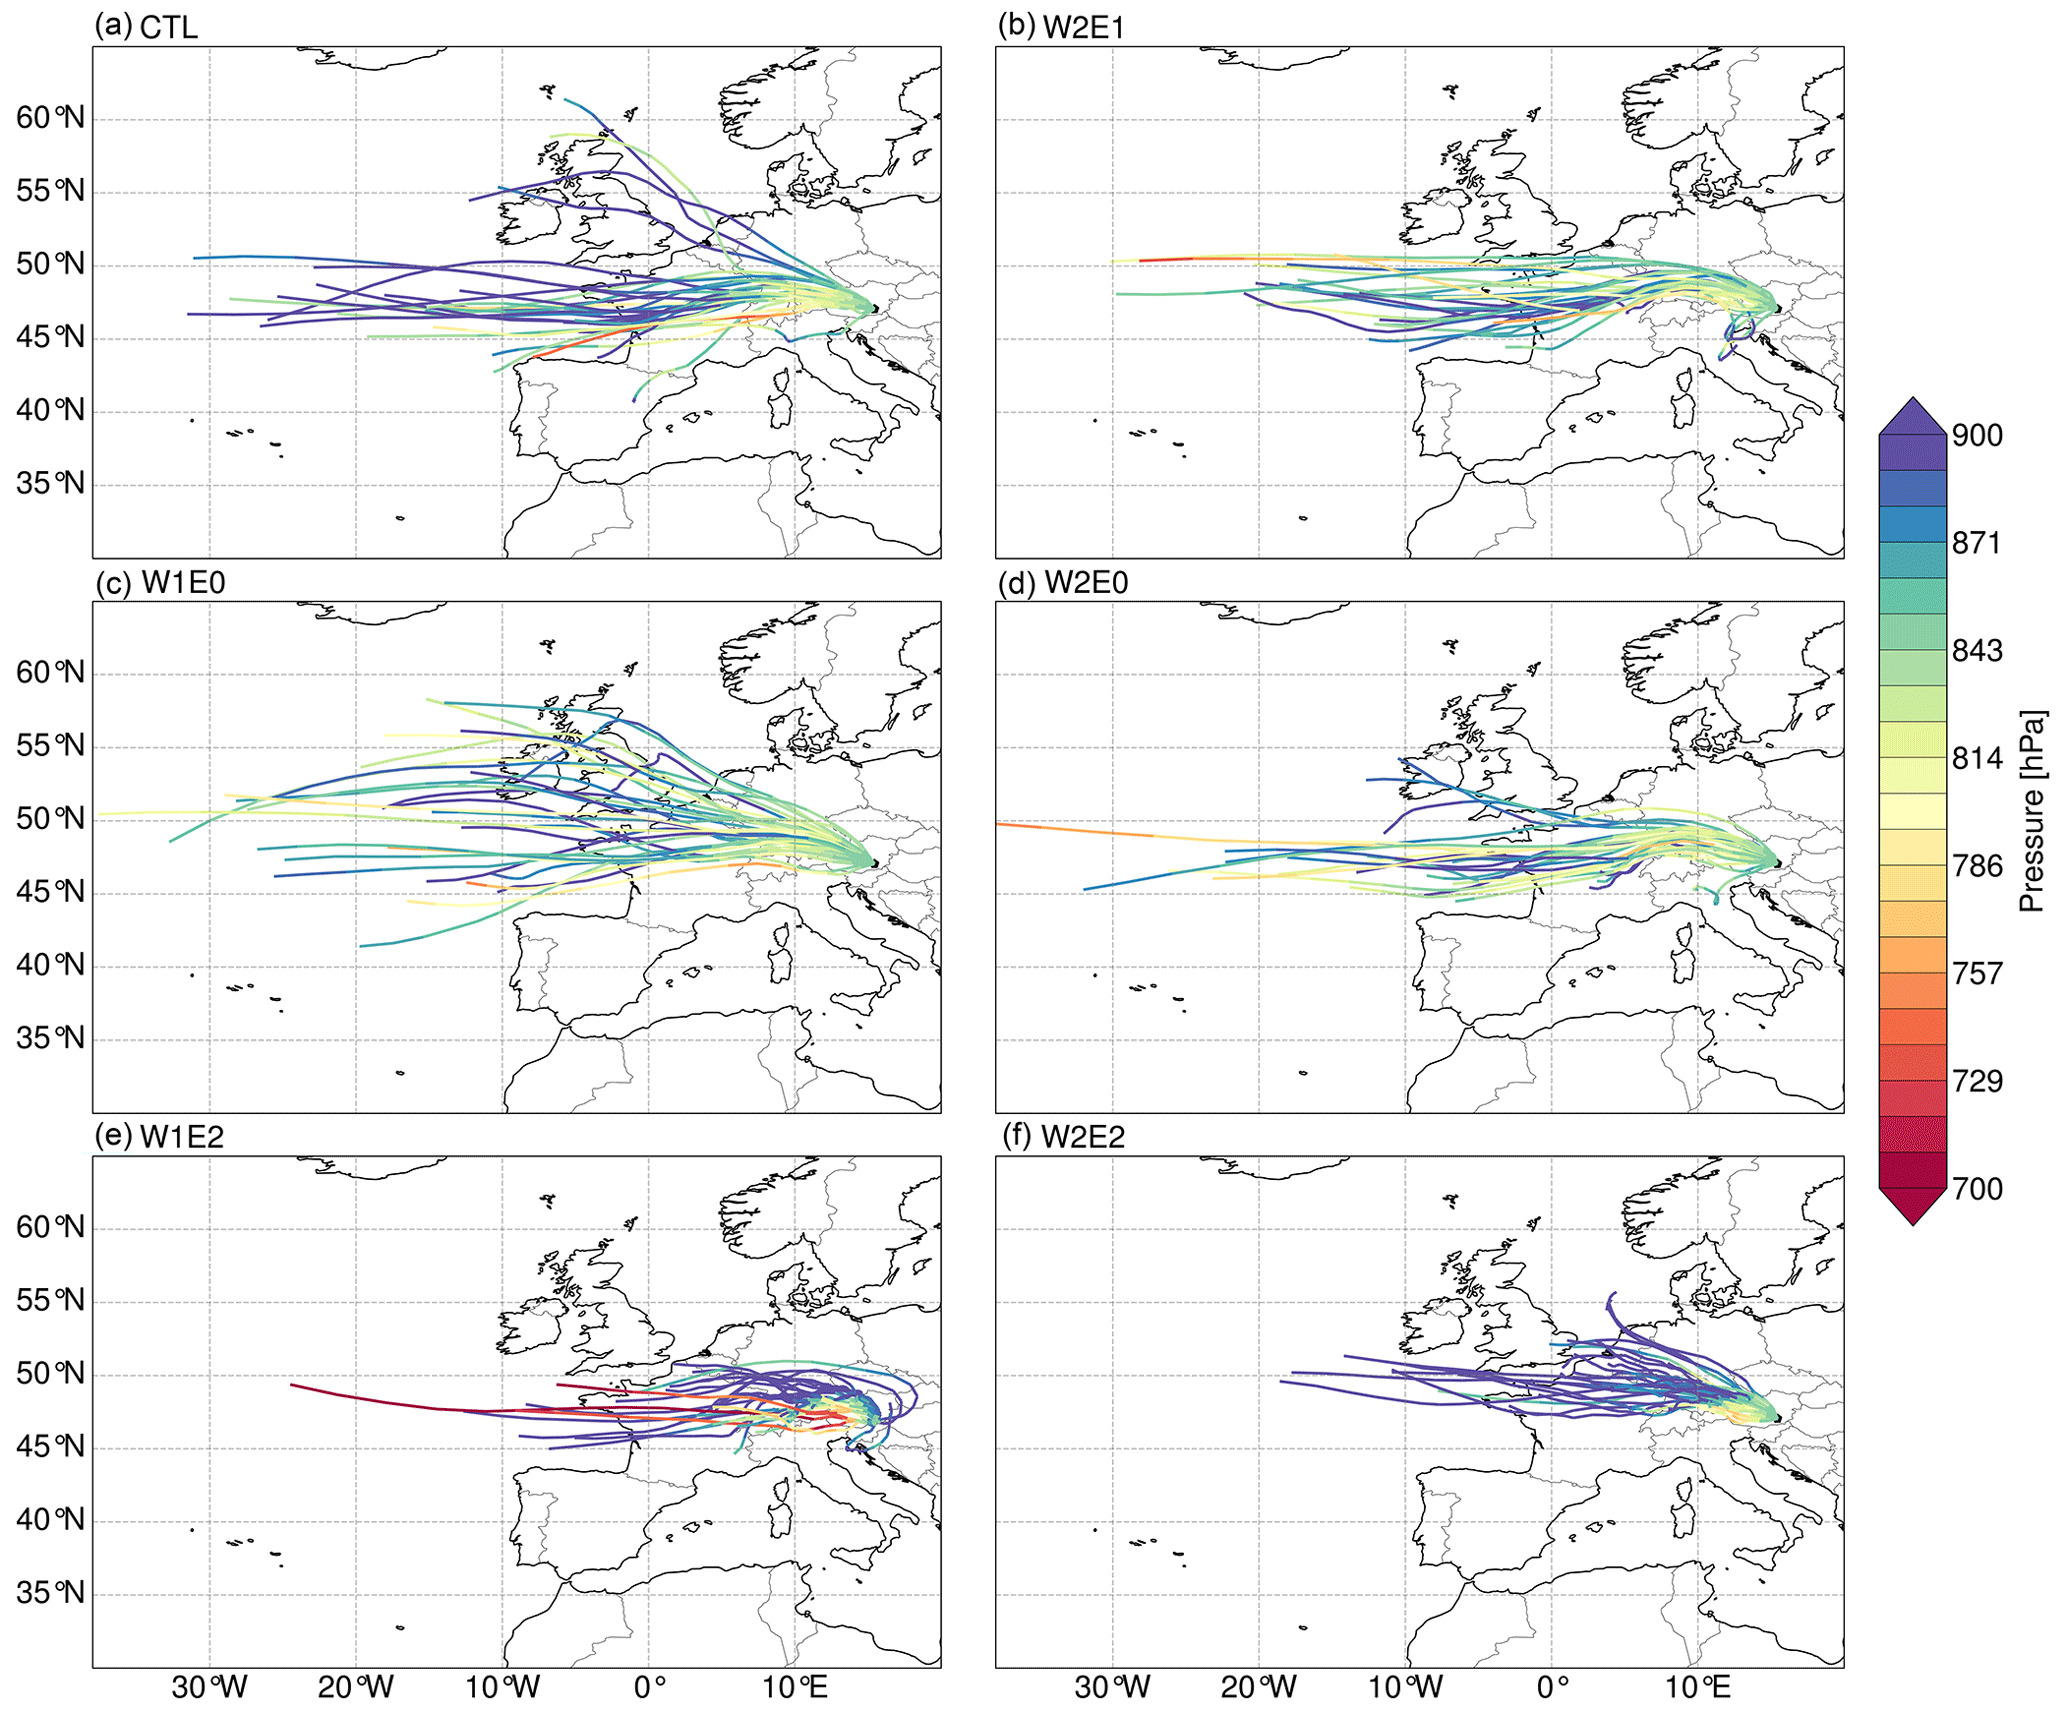
Figure 85 d summer back trajectories with the receptor location set to the 850 hPa level above Graz (47.06∘ N, 15.44∘ E). The colored lines represent the vertical pressure level of the trajectories. The trajectories were estimated with the 6 h wind fields (i.e., u, v, and omega) from the topographic experiments using the LAGRANTO tool.
4.10 Changes in atmospheric pressure systems in response to different topographic scenarios
Overall, the different topographic configurations explored in this study impact Northern Hemisphere atmospheric teleconnection patterns. These impacts include geographical shifts and changes in the intensity of quasi-stationary pressure systems (centers of action). The leading mode of atmospheric pressure variability, determined by empirical orthogonal function (EOF) analyses, explains 22 %–35 % of the total pressure variance and is characterized by negative anomalies across Iceland and Greenland, a strong positive anomaly in the midlatitude North Atlantic Ocean near the Azores, and a weak positive anomaly over midlatitude continental Europe. (Fig. 12). These north–south dipole patterns are comparable to the leading mode constructed from ERA5 data (see Fig. S13a in the Supplement). The topographic configurations with high elevation gradients (i.e., W1E0 and W2E0) result in maximum positive anomalies over continental Europe (Fig. 12b, d). The W1E2 experiment shifts the main centers of action of the positive anomaly eastwards by ∼20∘ E and the nodal line of the dipole axis (i.e., the line that separates the positive and negative pressure anomalies) northward by ∼10∘ N (Fig. 12c). W2E1 and W2E2 show two well-defined regions of maximum pressure positive anomalies over the North Atlantic and northeastern Europe (Fig. 12e, f). In summary, topographic configurations with high topography in the Western–Central Alps (i.e., W1E0, W2E0, W2E1) result in an intensification of positive anomalies over continental Europe, while experiments forced with higher topography in the Eastern Alps (i.e., W1E2) shift the maximum positive anomalies region to the eastern Atlantic (Fig. 12c).
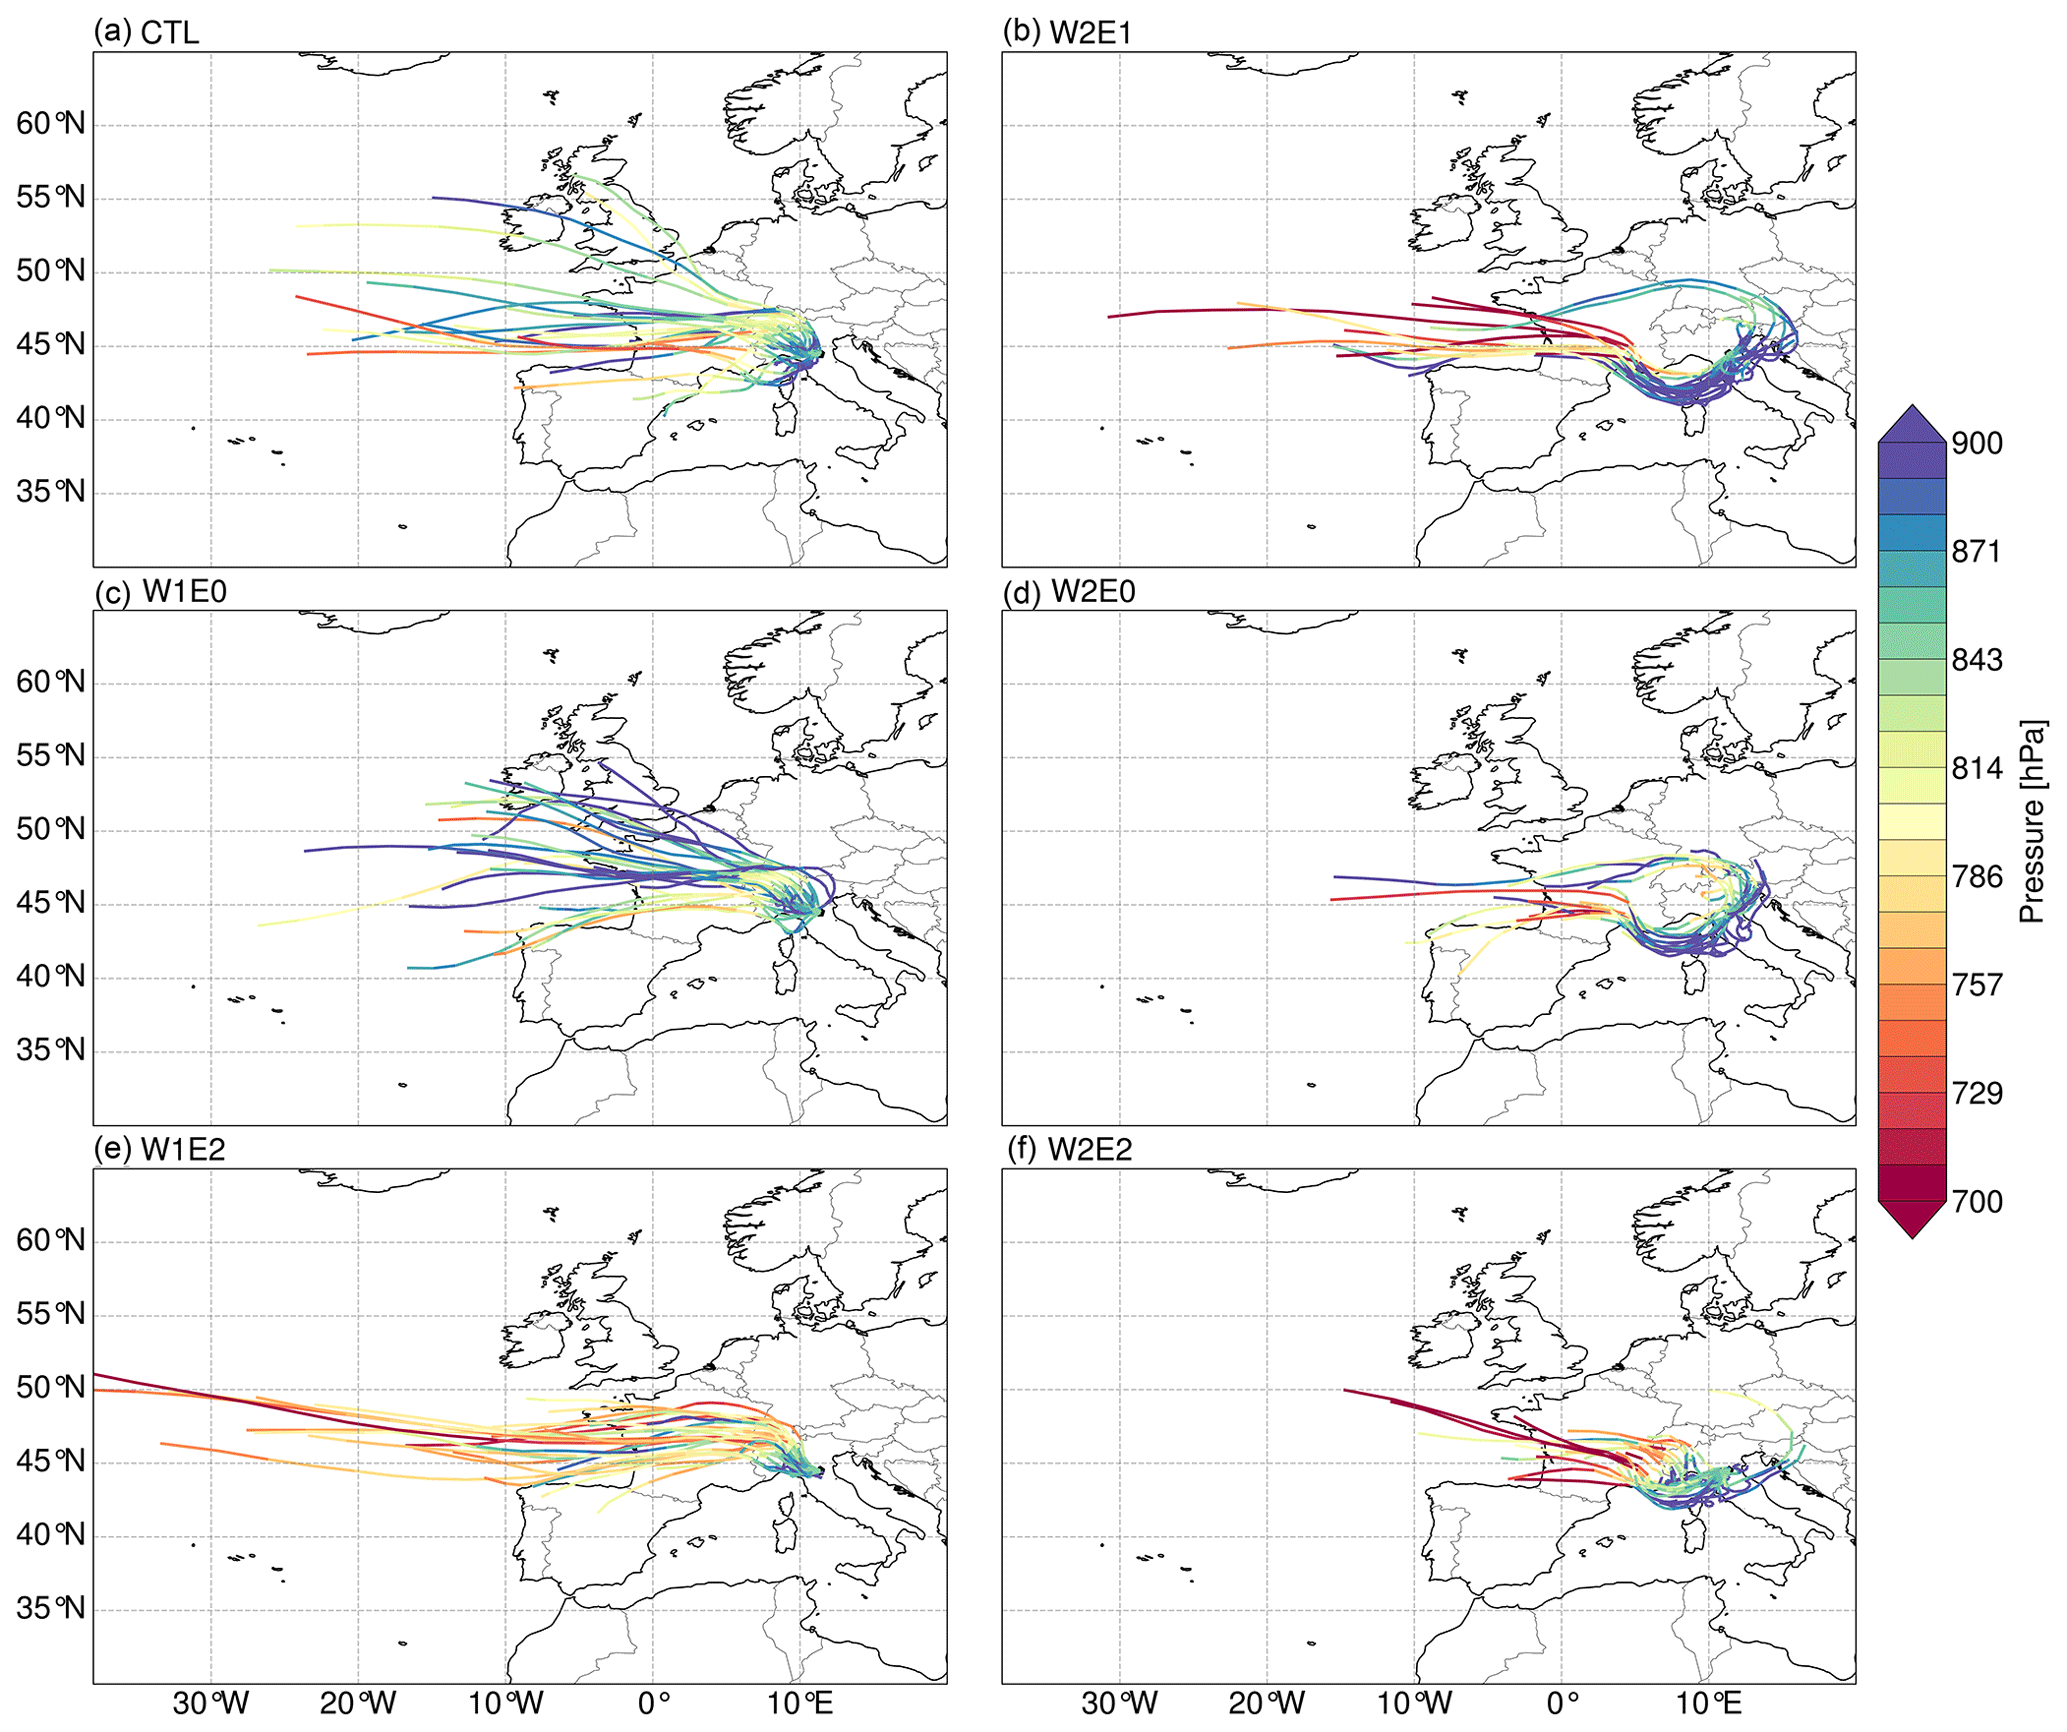
Figure 95 d summer back trajectories with the receptor location set to the 850 hPa level above Bologna (44.49∘ N, 11.38∘ E). The colored lines represent the vertical pressure level of the trajectories. The trajectories were estimated with the 6 h wind fields (i.e., u, v, and omega) from the topographic experiments using the LAGRANTO tool.
The pressure systems with the second mode of variability show a monopole pattern of positive anomalies spread across northern (>50∘ N) Europe for most of the topographic configurations. This is comparable to the second EOF pattern extracted from ERA5 data (Fig. S13b). The CTL experiment shows two well-defined regions of maximum positive anomalies over the North Atlantic, western Russia, and the Baltic states (Fig. 13a). The W1E0 simulation predicts a similar spatial pattern as the CTL experiment but intensifies the eastern anomaly (Fig. 13b). The W1E2 and W2E0 configurations significantly intensify the positive anomalies over the eastern Atlantic (Fig. 13c, d). The W2E1 and W2E2 experiments predict a slight (∼5∘) northward shift of the band of positive anomalies over the eastern Atlantic Ocean and western Europe. Additionally, the W2E2 experiment also results in a northward shift of positive anomalies in eastern Europe. The spatial patterns of the third and fourth EOFs are similar to the ERA5 patterns but are not as clearly defined or sensitive to changes in topographic forcing (Figs. S14 and S15).
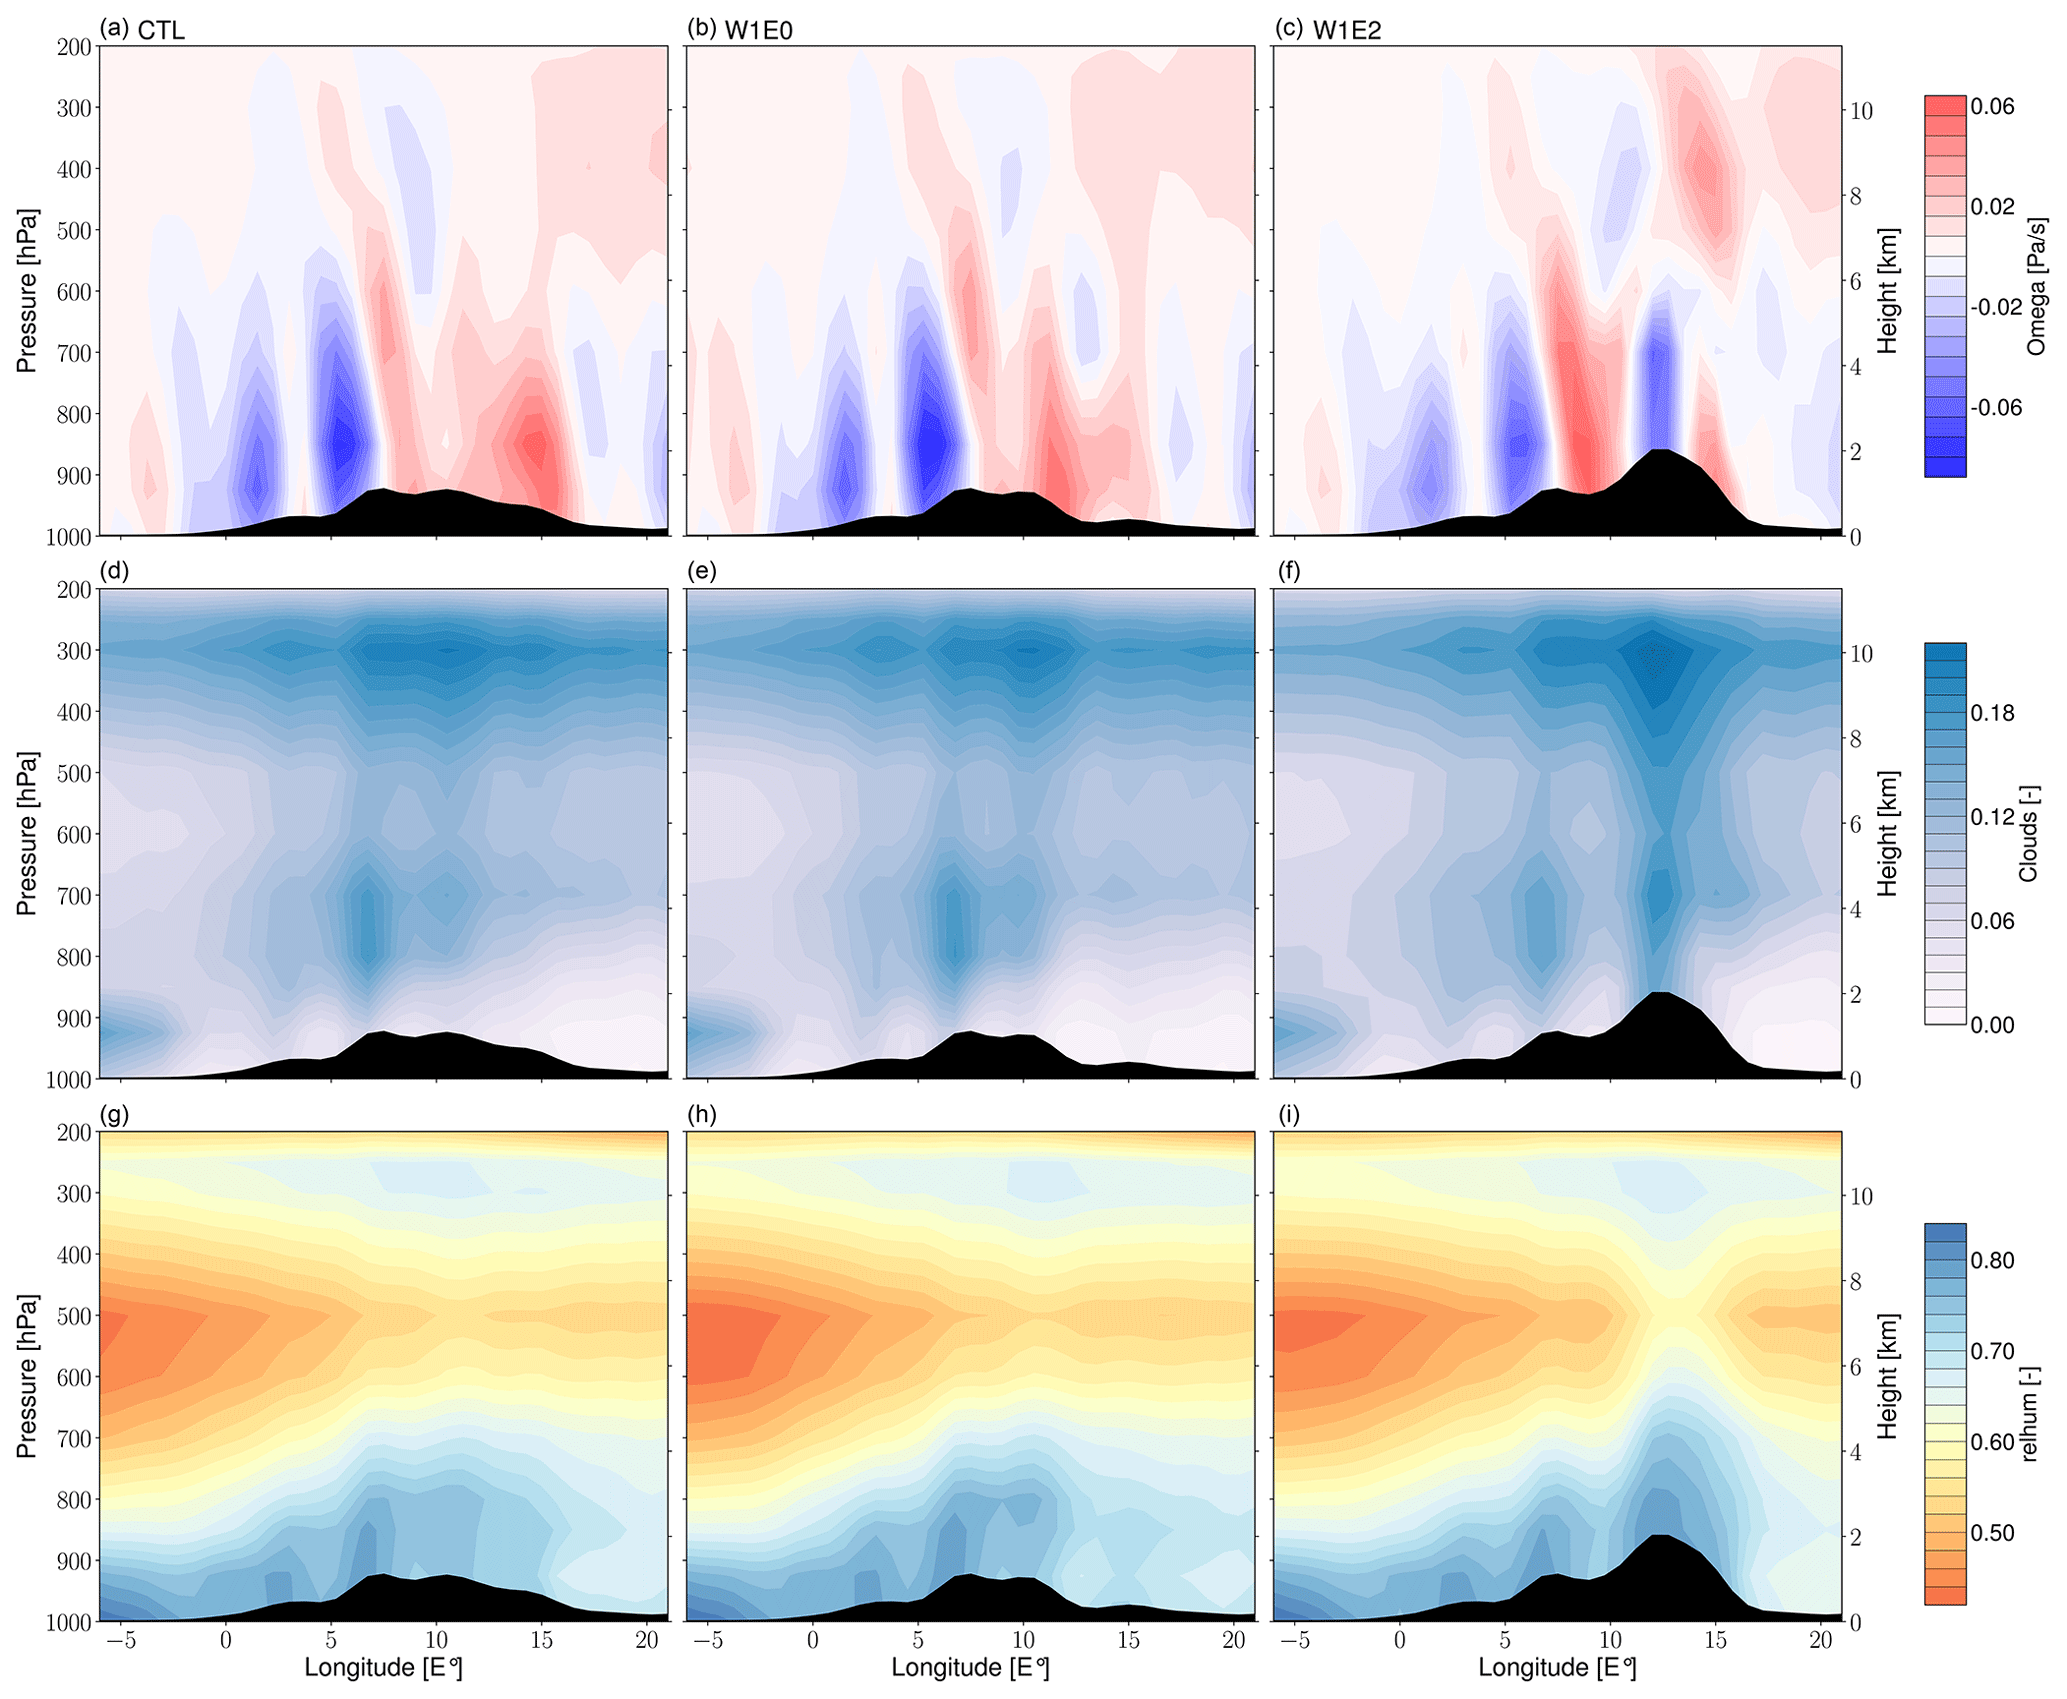
Figure 10Seasonal (JJA) means of vertical wind velocity (omega) (a–c), cloud cover (d–f), and relative humidity (g–i) averaged between 45 and 48∘ N across the Alps for the W1 (i.e., W1E0, W1E2) and CTL experiments. The black shading represents the cross-section of topography for each scenario. The omega values represent the speed of air motion in the upward or downward direction. Since vertical pressure decreases with height, negative values indicate upward or ascent velocity, and positive values indicate downward or subsidence velocity.
In the following sections, the impacts of diachronous surface uplift on regional climate (e.g., near-surface temperature, precipitation dynamics, moisture transport, low-level circulation patterns) and their implications for δ18Op values and isotopic lapse rates (ILRs) are discussed. While the δ18Op response is created by the combined effects of all the climate variables previously discussed, we discuss the individual impacts to disentangle the total signal and explain plausible processes for each signal component. Finally, we highlight the study's limitations and implications for stable isotope paleoaltimetry across the Alps (Sect. 5.6 and 5.7).
5.1 Impacts of diachronous surface uplift on near-surface temperatures
The topography sensitivity experiments show significant localized changes in the near-surface temperature. For all topographic configurations, maximum changes were estimated for regions of modified topography, while changes in regions farther from the orogen are less pronounced. The less pronounced regional changes farther from the modified topography areas might be due to associated large-scale atmospheric changes and therefore caused by a non-adiabatic mechanism. However, these small and insignificant temperature differences may simply be due to modeling artifacts. On the other hand, the significant changes in regions of modified topography can mainly be attributed to the adiabatic temperature lapse rate, which defines how temperature changes with altitude. Although previous studies have indicated the possibility of non-adiabatic mechanisms (e.g., changes in tropospheric dynamics, local atmospheric humidity, and atmospheric circulation patterns) contributing to changes in addition to the adiabatic lapse rate changes (Ehlers and Poulsen, 2009; Feng and Poulsen, 2016; Kattel et al., 2015), an in-depth quantification of the relative contributions would be required to confidently attribute the changes to non-adiabatic processes.
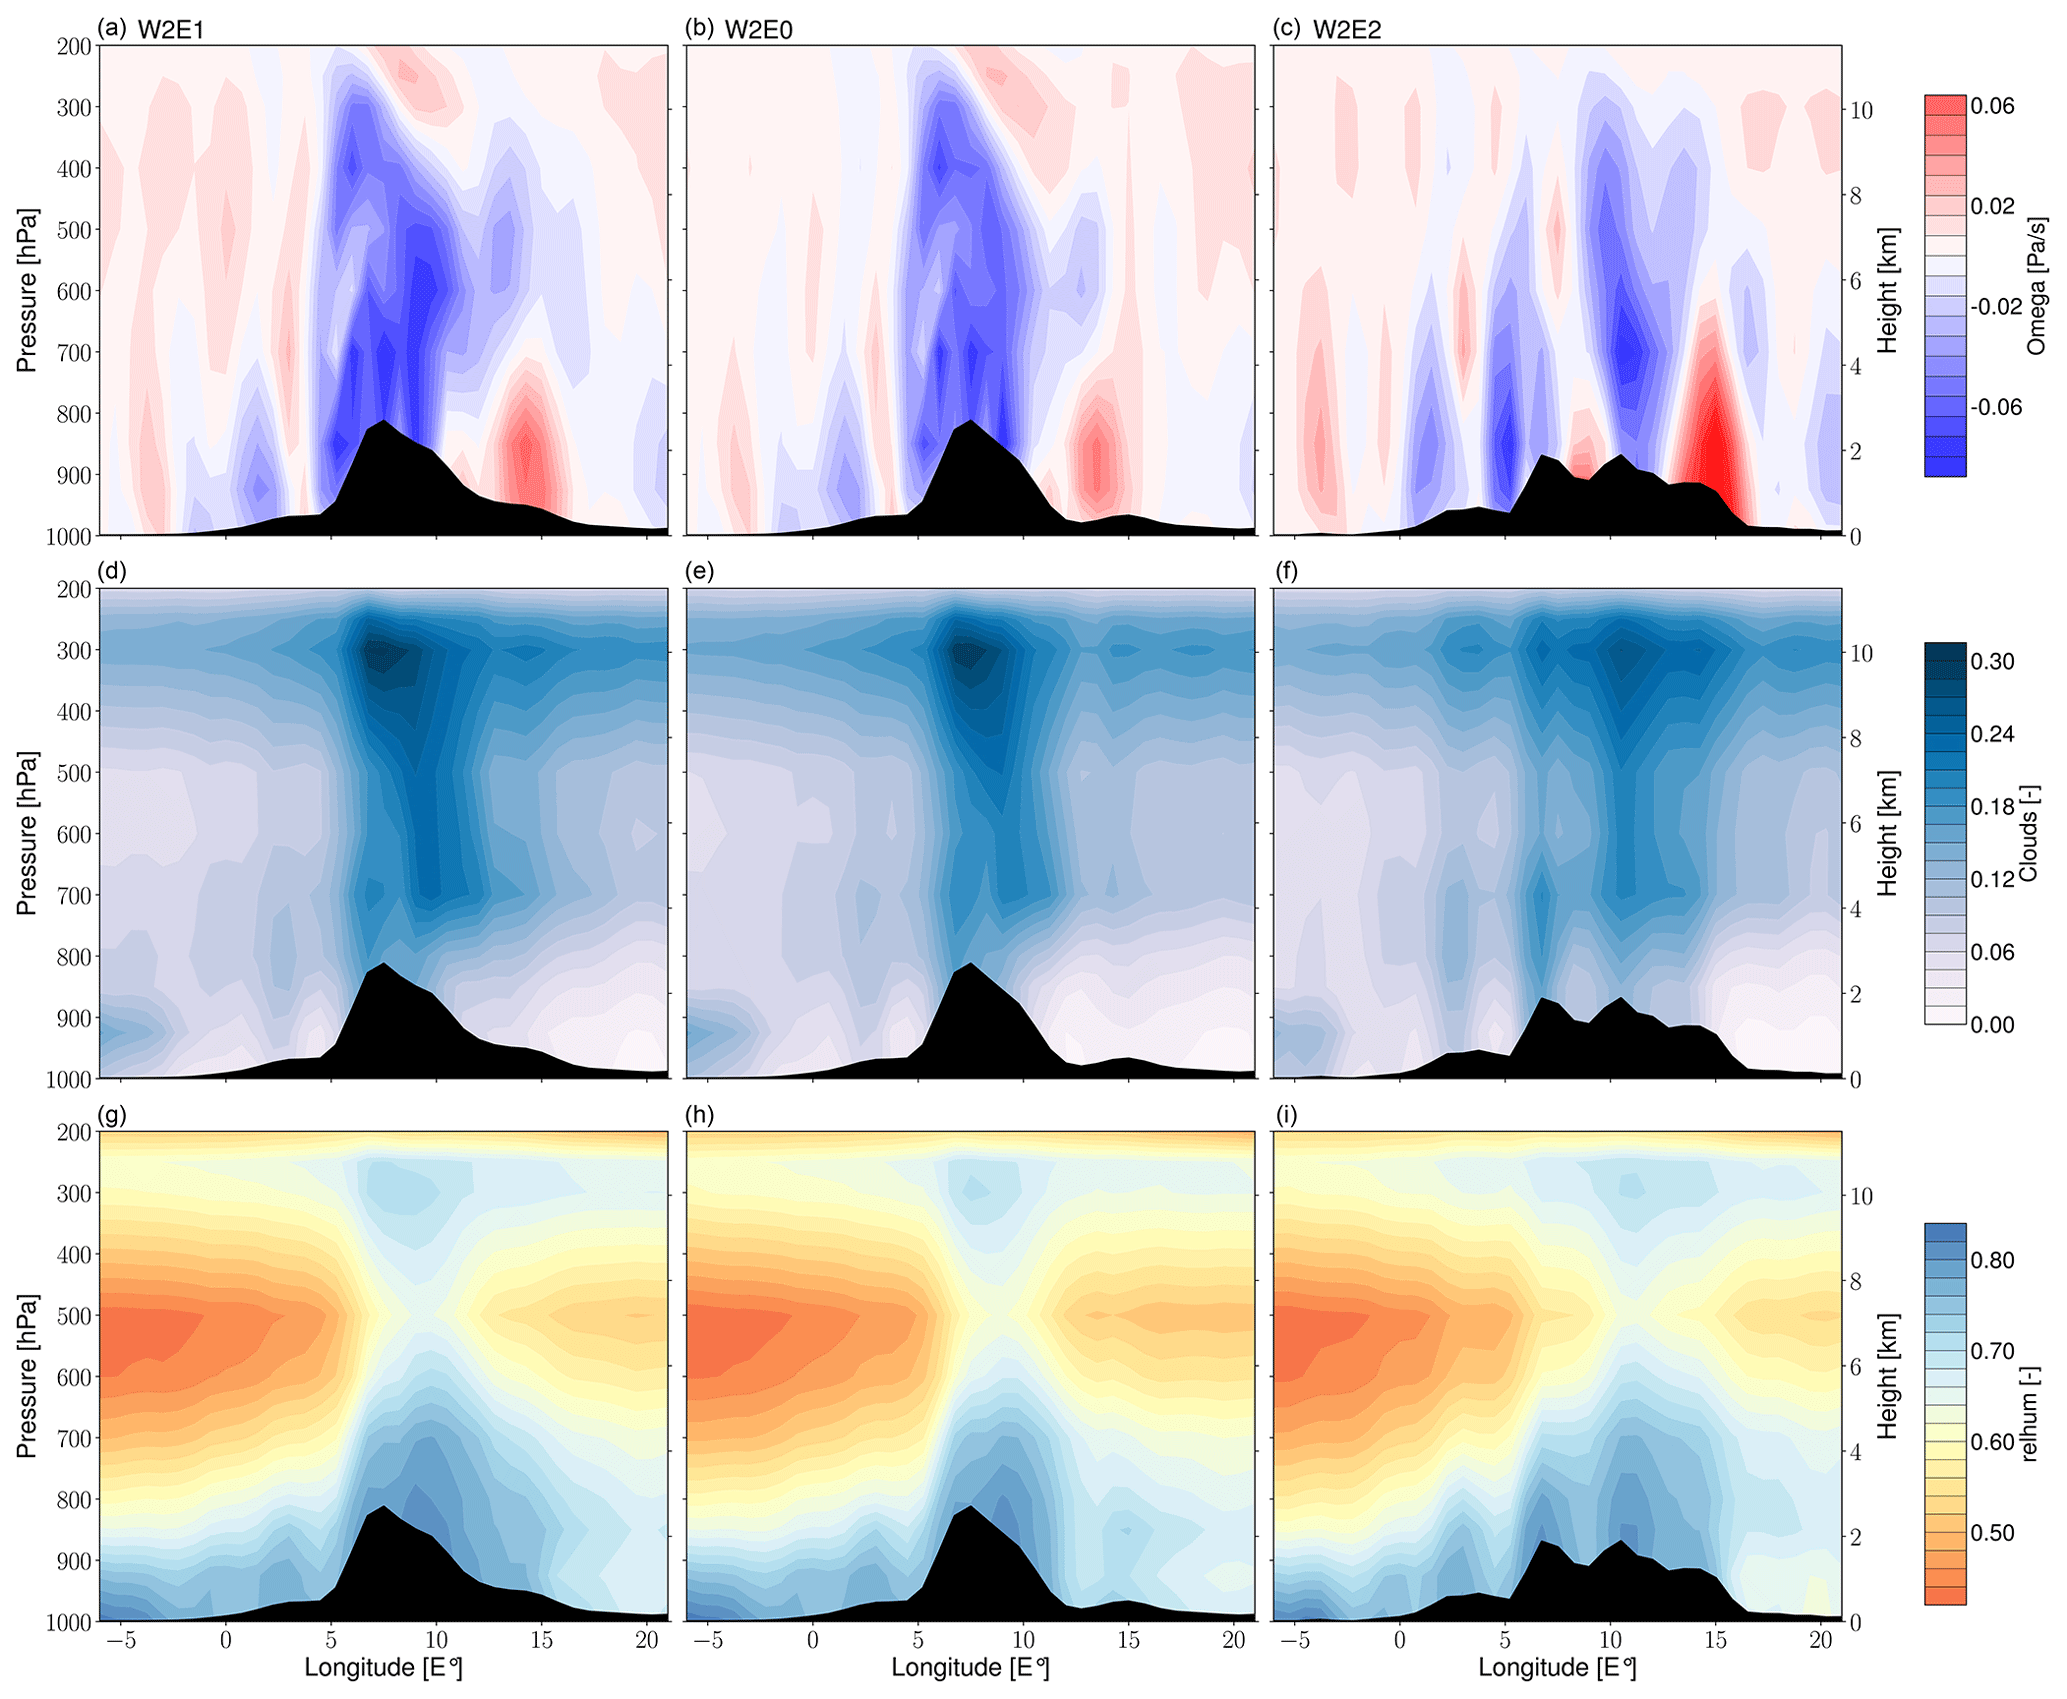
Figure 11Seasonal (JJA) means of vertical wind velocity (omega) (a–c), cloud cover (d–f), and relative humidity (g–i) averaged between 45 and 48∘ N across the Alps for W2 of scenario 1 (i.e., W2E1, W2E1), scenario 2 (i.e., W2E2), and CTL experiments. The black shading represents the cross-section of topography for each scenario. The omega values represent the speed of air motion in the upward or downward direction. Since vertical pressure decreases with height, negative values indicate upward or ascent velocity, and positive values indicate downward or subsidence velocity.
5.2 Impacts of diachronous surface uplift on precipitation
Topography affects the environment in which precipitation occurs in response to thermodynamic and atmospheric dynamics changes (Beniston, 2005; Houze, 2012; Insel et al., 2010; Poulsen et al., 2010). Our results indicate a systematic increase in precipitation amount in response to surface uplift due to orographic airlifting and associated cloud formation and condensation. For instance, the high-elevation scenarios on the Western–Central Alps focus precipitation on the western flank of the Alps and show a decreasing trend towards the Eastern Alps. Moreover, our results also show a threshold of the magnitude of elevation change (i.e., ca. 200 % of modern topography increase) that triggers significant regional changes across Europe. More specifically, our W2 experiments of scenario 1 show significant changes (drier conditions) across northern Europe and an extension of a rain shadow region on the eastern flanks of the Alps, whereas changes in the W1 experiments are comparatively mild. These spatial patterns are expected since the rainout on the western flanks of the Alps extracts moisture from the vapor masses on the windward slopes and leads to drier air masses crossing to the northern and eastern flanks of the Alps. The Alps are a relatively small orogen, positioned parallel to moisture transport, which should lead to more moist air mass spill-over and flow around the Alps to the east and less distinct changes in precipitation amount (Sturm et al., 2010). Nevertheless, our calculations of vertical wind velocities (omega), relative humidity, and cloud cover (Figs. 10 and 11) suggest that our uplift scenarios induce enough orographic lifting to create notable updrafts that lead to the formation of thick clouds in the troposphere (Houze, 2012). The higher along-strike terrain created by bulk surface uplift in the W2E2 experiment even results in a clearly defined ∼500 km wavelength pattern of interchanging moisture uplift and subsidence, which corresponds to high and low cloud cover and relative humidity (Fig. 11c, f, and i). Note that the local precipitation changes induced by varying the topography of the Eastern Alps are very different from those induced by varying the topography of the Western–Central Alps (e.g., Fig. 4e vs. Fig. 4b). In summary, due to the size and orientation of the Alpine orogen with respect to the dominant wind fields, the regional precipitation response to diachronous surface uplift is unique and highly sensitive to the altitude of the Western–Central Alps in particular.
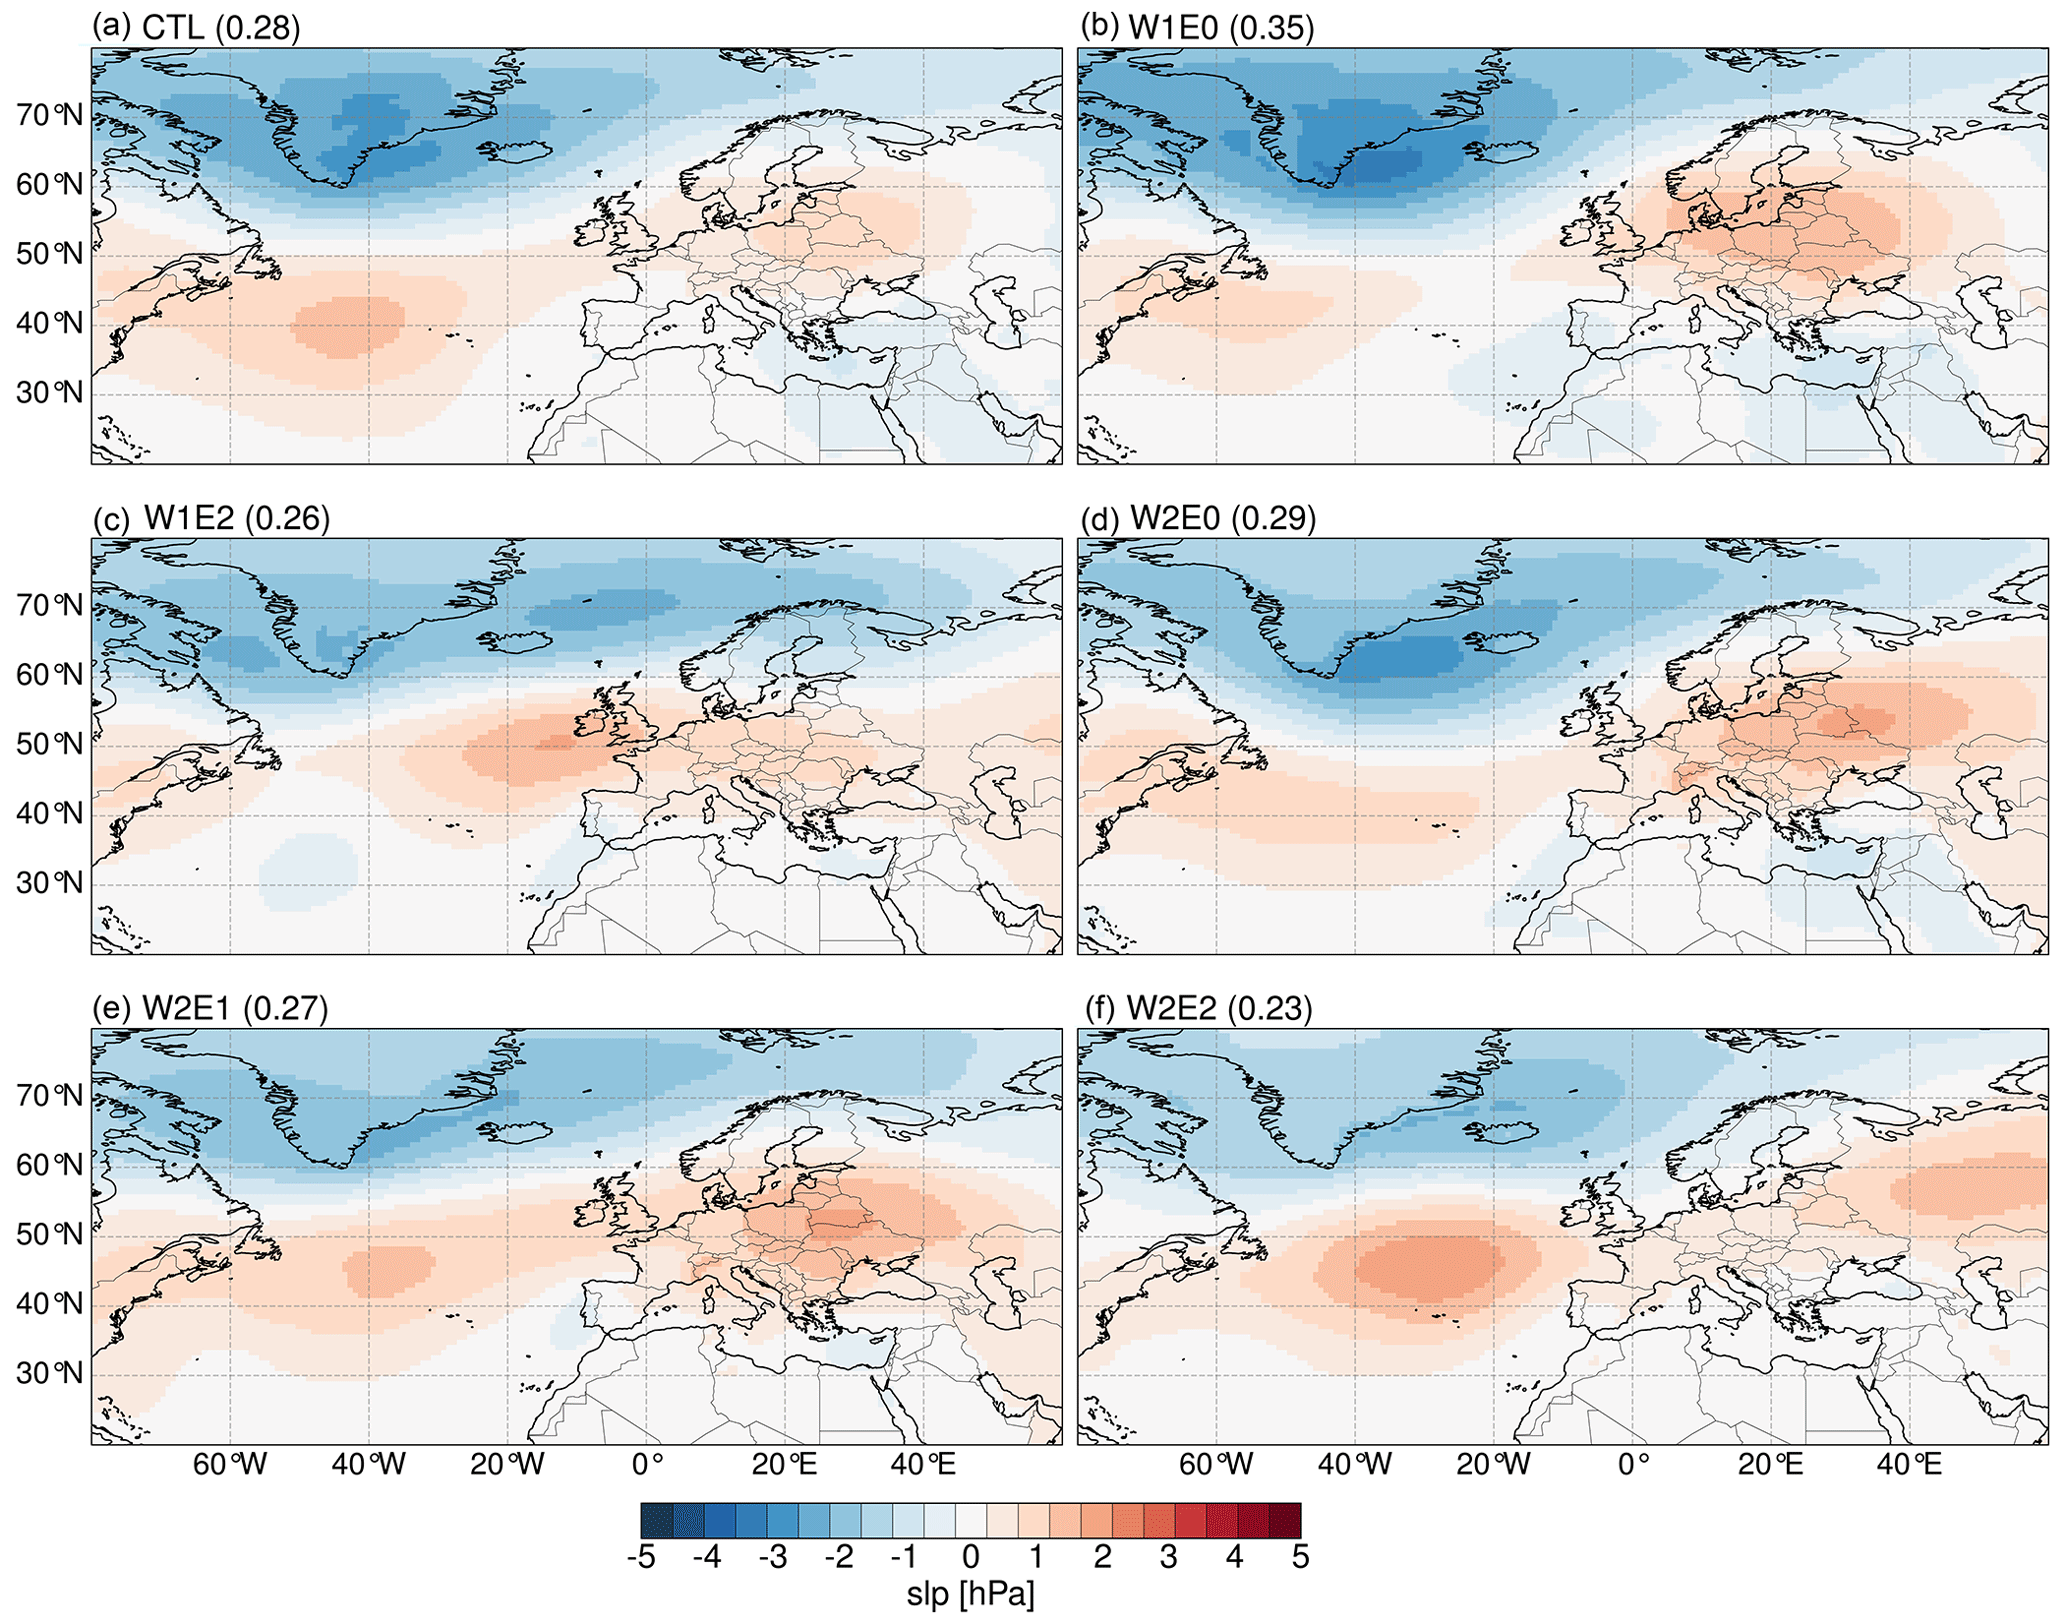
Figure 12The spatial patterns and explained variance of the first empirical orthogonal function (EOF) extracted from the topography experiments. These resemble the leading mode of variability extracted from the ERA5 data (see Fig. S13 in the Supplement) and the patterns associated with the North Atlantic Oscillation. The patterns are calculated from summer mean sea level pressure (slp) anomalies and represent the covariance matrix of the principal component time series and the EOFs.
5.3 Impacts of diachronous surface uplift on moisture source and transport
The back-trajectory analyses for the topography experiments reveal notable changes in air mass transport distance and pathways even though the predominant moisture source remains the North Atlantic Ocean (Rozanski et al., 1982). Our simulations demonstrate that diachronous surface uplift impacts the target regions located on the southern and eastern flanks of the Alps in particular compared to western and northern localities. More specifically, the air mass trajectories towards the eastern flank of the Alps tend to travel a shorter distance when the topography of the Eastern Alps is higher (Fig. 8e, f) but travel a longer distance towards the southern flank (Fig. 9e). On the other hand, the trajectories towards the eastern flank originate from higher atmospheric levels when the surface topography of the Western–Central Alps is raised due to the increased orographic barrier but with slight changes in transport distance. For example, our trajectory analysis for the city of Graz in the W2 experiments (i.e., W2E1 and W2E0) indicates that moisture originates at higher atmospheric levels over the east of the North Atlantic and travels a shorter path to its destination (Fig. 8b, d). On the other hand, the W1E2 and W2E2 configurations significantly shorten the moisture transport distance and originate from lower altitudes (Fig. 8e, f). This indicates that the air mass would most likely experience less rainout due to the shorter period to reach condensation, yielding slightly higher δ18Op values compared to long-distance air mass transport. Furthermore, the W2 experiments deflect moisture from the Atlantic to the Mediterranean region before redirecting it to the Southern Alps. These changes in vapor transport are not surprising since mountain barriers would force the air to rise, and, depending on the strength of the flow, the cross-barrier flow would be blocked or deflected towards the regions of precipitation (Colle, 2004; Grossman and Durran, 1984). The atmospheric conditions of the moisture source region would also influence the precipitation type and amount in the target regions (Feng et al., 2013). Therefore, our results stress the importance of considering the unique impacts of different topographic configurations on the moisture source and pathways when investigating past changes in precipitation (or δ18Op).
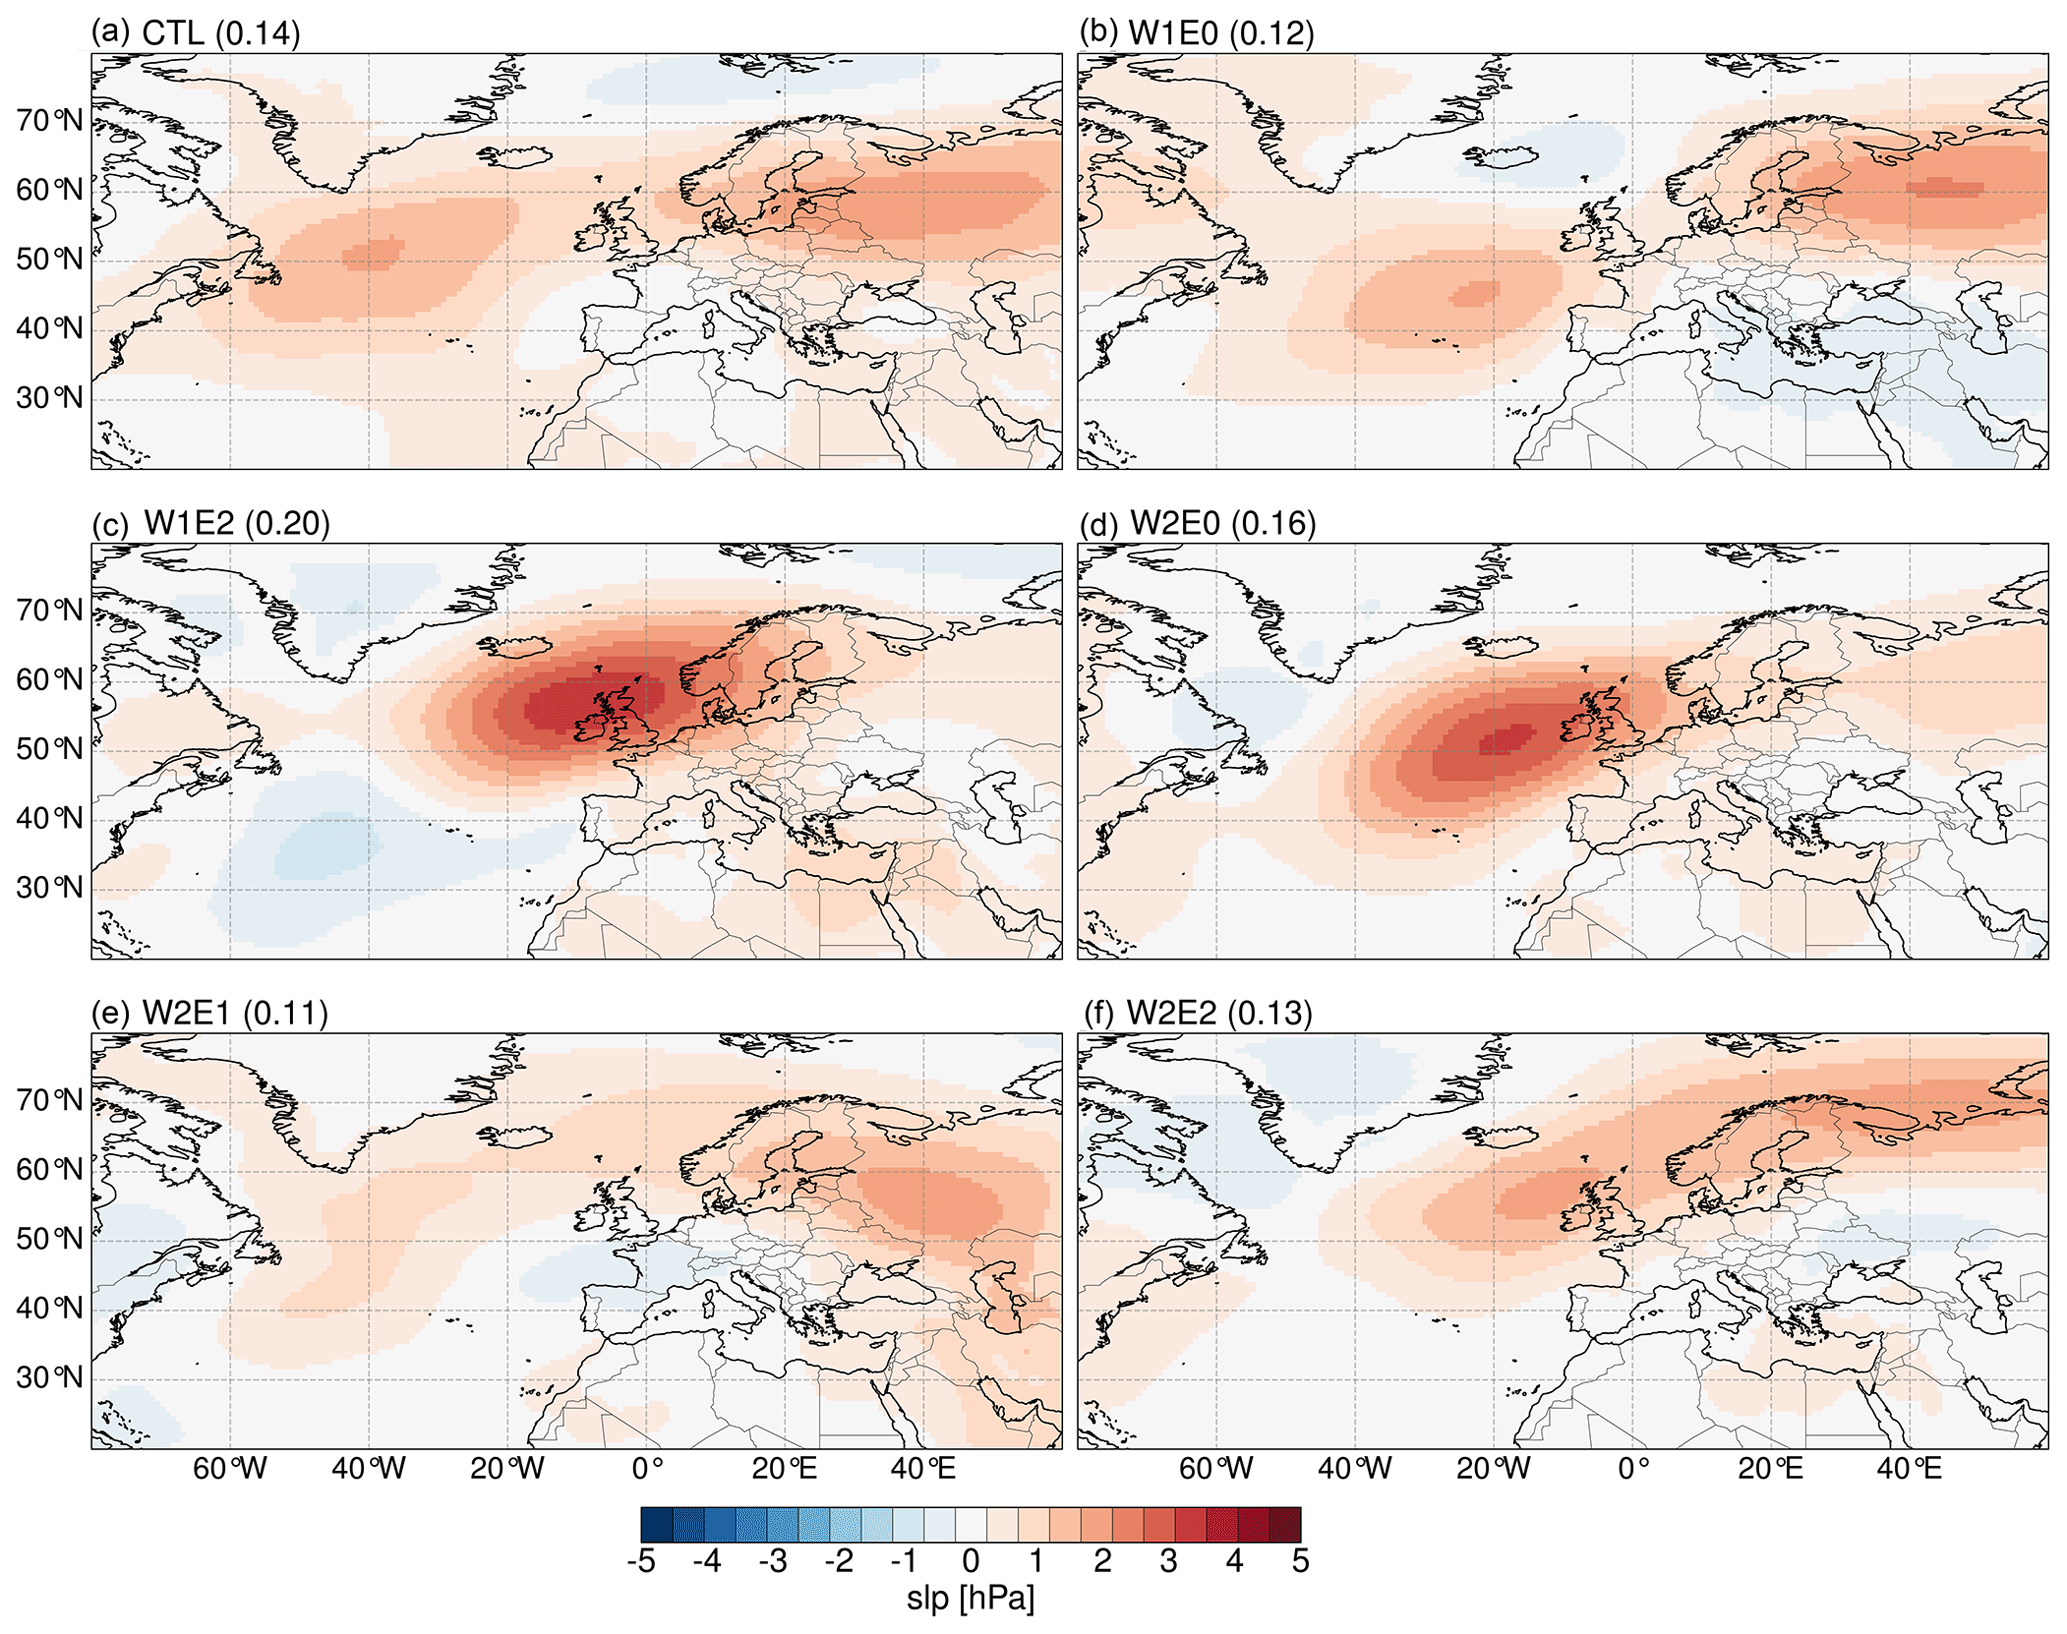
Figure 13The spatial patterns and explained variance of the empirical orthogonal functions (EOFs) that resemble the second mode of variability extracted from the ERA5 data (see Fig. S13 in the Supplement). The patterns are calculated from summer mean sea level pressure (slp) anomalies and represent the covariance matrix of the principal component time series and the EOFs.
5.4 Impacts of the diachronous surface uplift on atmospheric flow and pressure systems
Atmospheric teleconnections control much of the synoptic-scale atmospheric variability that is also important for the climate in mountain ranges (Barnston and Livezey, 1987; Rogers, 1990; Wallace and Gutzler, 1981). These patterns influence climate over a large geographic area and affect processes such as precipitation dynamics, storm tracks, jet stream location, atmospheric waves, and temperature (Hurrell, 1995; Woollings et al., 2010). Giorgi et al. (1997) indicate that altitude plays a significant role in determining the regional climate response to large-scale patterns like the North Atlantic Oscillation (NAO). Moreover, Wallace and Gutzler (1981) suggest that the high-pressure anomalies that persisted across the Alps during the 1980s were due to shifting of the upper-level jet stream (i.e., the north–south dipole axis associated with the polar front) to the north. Therefore, the nonstationarity of these recurrent pressure patterns (especially in summer) (Deininger et al., 2016) requires that any attempt to reconstruct past hydrological cycles quantitatively be done with knowledge about the potential changes in atmospheric pressure patterns.
Our simulation results indicate a persistent leading mode of variability that is consistent with the NAO (Fig. 12) (Hurrell, 1995; Hurrell and Van Loon, 1997). The modern (non-simulated) NAO exists in all seasons (Craig and Allan, 2022) but is more prominent and stable in winter. A well-developed dipole pressure gradient between the Icelandic Low and Azores High in its positive phase induces strong westerlies and northerly storm tracks that transport air masses from the eastern Atlantic towards central Europe. Such a pressure system drives colder and drier conditions across western Greenland and the Mediterranean region and warmer and wetter conditions across northern Europe and some portions of the Scandinavia region. During its negative phase, the pressure gradient is reduced, which causes a decrease in the strength of the westerlies and a southward shift of the storm tracks. This mechanism leads to more precipitation across southern Europe and the Mediterranean and colder and drier climates across northern Europe (Barnston and Livezey, 1987; Hurrell and Van Loon, 1997). Overall, our topography experiments suggest a northeastward shift of the positive anomaly center of the action close to Ireland and the UK when the Eastern Alps (W1E2) are uplifted and more eastward stretch with intensification across eastern Europe when the Western–Central Alps are at a maximum elevation (e.g., W2E1). The shifts of the NAO dipole axis, intensification, and location of the center of action in response to topography changes would alter the moisture and heat transport pathways, wind patterns, and the intensity of storms and precipitation patterns across the North Atlantic and its surrounding continents. For instance, the eastward shift and intensification of the positive anomalies over central Europe in response to higher topography in the Western–Central Alps would likely lead to a reduction of rainfall across the central and southern parts of Europe due to the northward flow of moisture.
The pressure patterns of the second mode of variability in response to the topography changes resemble the East Atlantic (EA) pattern, as originally identified by Wallace and Gutzler (1981). The exact nature of the EA pattern is still debated. While some studies define it as a southward shift of the NAO, showing the north–south dipole pressure gradient with centers of action across the North Atlantic from east to west (Bastos et al., 2016; Chafik et al., 2017), others define it as a well-defined monopole pressure anomaly close to Ireland (Comas-Bru and McDermott, 2014; Josey and Marsh, 2005; Moore et al., 2013; Zubiate et al., 2017). Our simulated pattern matches the latter description best. Such a pattern would lead to wetter conditions across eastern Europe and a drier climate over western Europe (Barnston and Livezey, 1987). The E0 configurations (Fig. 13b, d) result in the most significant changes to the second mode of variability, which highlights the potentially significant impact of delayed Eastern Alps uplift on atmospheric pressure patterns and associated changes in precipitation across Europe. An example of such an influence on precipitation is the extensive drying across eastern Europe in response to the W2E0 topography configuration (Fig. 4d)
The second and third modes of variability show some similarity to the Scandinavian (SCAN) pattern and the East Atlantic–Western Russia (EA/WR) pattern as described in other studies (Barnston and Livezey, 1987; Comas-Bru and McDermott, 2014; Ionita, 2014; Lim, 2015). The simulated patterns do not show any clear trends or large and systematic changes in response to the different topographic forcings.
In summary, our results suggest that different topographic configurations, including those describing diachronous surface uplift, can induce significant changes to synoptic-scale atmospheric pressure systems in the Northern Hemisphere. Quantifying the impacts of these changes on regional climate would require an in-depth investigation of atmospheric dynamics and scale interactions in the region and is beyond the scope of this study. Our results highlight plausible changes in atmospheric pressure patterns that would significantly affect the spatial distribution of precipitation across Europe and change the source region and pathways for moisture carried onto the continent. However, we acknowledge that changes in such a decadal mode of variability would not be reflected in such low-resolution geologic archives used for stable isotope paleoaltimetry. Nevertheless, assessing the role of topography in changing the atmospheric dynamics of such large-scale circulation patterns sheds light on the possibility of its impact on the spatial variability and distribution of δ18Op. For instance, this has been highlighted by Methner et al. (2020) regarding the possibility of the reorganization of the midlatitude atmospheric circulation in the middle Miocene that led to seasonal changes in the timing of carbonate formation across central Europe.
5.5 Impact of regional climate changes on δ18Op and isotopic lapse rates
The sensitivity experiments show that the topographic configurations describing diachronous surface uplift (scenario 1) affect δ18Op values across the Alps. Specifically, the W2 experiments predict a decrease in δ18Op values of ∼8 ‰ on the western flanks of the Alps and a less significant change of ∼1 ‰ to 2 ‰ in the adjacent low-elevation regions around the Alps (Fig. 2). Moreover, the simulations predict an expansion of the area of low δ18Op values (adjacent to the western side of the orogen) when a high elevation (W2) is assumed for the Western–Central Alps (or the complete orogen). This is not surprising since the predominant moisture transport from west to east would be blocked or deflected by the steeper topography, creating an “isotopic rain shadow.” In contrast, the moderate (present-day) height allows more spill-over of moisture over and around the Western Alps, especially since the Alps are positioned parallel to wind trajectories (Sturm et al., 2010). The decrease in δ18Op values over the Northern Alps, on the other hand, could be a result of the cross-over flow of moisture transported from the Mediterranean Sea. However, our trajectory analysis did not indicate a plausible moisture source from the Mediterranean in summer, which might be due to the limited model resolution to capture all the relevant air mass sources. Nevertheless, the Late Cretaceous to Paleogene closure of the Tethys Ocean, which led to the surface uplift of the Alps, might have influenced the transport of moisture from the Mediterranean in a past climate. Botsyun et al. (2022) simulate the global climate with middle Miocene paleoenvironment conditions while considering the Paratethys Sea extent in their land–sea mask to determine the impacts of the marine transgression on the regional climate. Their results indicate an increase in precipitation up to 400 mm yr−1 around the regions adjacent to the Paratethys Sea with anticyclonic circulation situated over the Mediterranean in the winter season. Note, however, that a fully coupled ocean–atmosphere GCM would be needed for a realistic assessment of the contribution of ocean circulation to the distribution of δ18Op patterns across Europe.
In general, the modeled differences in δ18Op values in response to changes in topography can be attributed to changes in orographic precipitation and adiabatic-lapse-rate-driven near-surface temperature. These can, in turn, be explained by direct altitude-related differences between our topographic scenarios, as well as by indirect effects related to changes in the wind trajectories, changes in the vertical tropospheric structure in an orogen located in a westerlies-dominated wind field, and changes in synoptic-scale atmospheric dynamics (Sect. 5.1–5.4). These changes differ significantly between the topographic configurations and ultimately result in different ILRs. More specifically, the annual ILRs are more negative (steeper) than the summer ILRs (Figs. S9 and S10). These changes in ILRs are likely due to two effects: (1) the increase in isotopic fractionation with decreasing temperature (Dansgaard, 1964; Gat, 1996) affects the winter (and thus the annual) ILR, and (2) evaporative recycling of warmer surface waters in the summer leads to a different isotopic composition of the continental moisture source (Risi et al., 2013).
Overall, this study's experiments outline the fact that diachronous surface uplift (i.e., the west-to-east surface uplift propagation) across the Alps would have produced distinct spatial profiles of δ18Op due to both direct (altitudinal) and indirect climatic effects. If the magnitude of change in δ18Op values presented here for different topographic scenarios is preserved in geologic archives such as paleosol carbonate nodules or hydrous silicates, then the stable isotope record of these changes holds the potential to reconstruct the hypothesized diachronous surface uplift history of the Alps. We highlight that a magnitude of Δδ18Op value of −8 ‰, which is significant enough to be preserved in geologic archives, would only be achieved when the mean topography is higher than the modern Alps. Furthermore, our results suggest that the ILR, which for the lack of tracking it through time is often assumed to be constant in stable isotope paleoaltimetry studies, may change across the Alps depending on the specific topographic configuration. For instance, the W2E1 topographic configuration, which best matches the paleoelevation reconstruction in the middle Miocene by Krsnik et al. (2021), would correspond to an increase of 0.46 (±0.15–0.24) and 1.19 (±0.09–0.11) ‰ km−1 across the western and northern flanks (Fig. 7a, b) compared to present-day topography. However, the estimated difference between W2E1 and the CTL across the southern flank is 0.2 (±0.13–0.16) ‰ km−1 (Fig. 7c). This indicates that the impact on the isotopic lapse rate changes depends on the topographic rise and configuration, as well as the transect considered. In this scenario, the northern transect lapse rates estimate a higher magnitude of change in lapse rate since the higher topography established across the Western–Central Alps redistributes precipitation due to the orographic barrier to the moisture trajectory paths from the North Atlantic, which cause dryness toward the north (Fig. 4b).
5.6 Model limitations and implications
The modeled present-day climate conditions are in good agreement with observational data and the expected climate patterns across Europe, as also indicated by other studies (Langebroek et al., 2011; Werner et al., 2011). The slight deviations across the Alps are likely a result of the model's underrepresentation of the subgrid topographic features (e.g., ridges and slopes in the Alps). Nevertheless, the reader should carefully consider further limitations of the model and this study. ECHAM5-wiso, like other GCMs, has several deficiencies in parameterization schemes and simplifications of the underlying physics (Roeckner et al., 2003; Werner et al., 2011). Most importantly for this study, the model simplifies complex topography by smoothing high-elevation peaks, which leads to an underestimation of δ18Op values at higher elevations. Furthermore, it uses the hydrostatic approximation, which generally results in a relatively poor representation of precipitation dynamics in mountain regions with steep topographic gradients (e.g., Steppeler et al. 2003). On top of that, ECHAM5-wiso does not simulate the oceanic variables dynamically but uses prescribed sea surface temperatures (SSTs) and sea ice concentrations (SICs) from a coupled ocean–atmosphere GCM, which complicates our EOF analysis to construct the atmospheric teleconnections. The model underestimates summer precipitation across the European Alps due to the parameterization of convective processes that contribute to summer rainfall (Langbroeck et al., 2011). Moreover, ECHAM5-wiso has a simple land surface scheme that does not allow for proper consideration of the isotopic fractionation of surface waters (Werner et al., 2011). Since water vapor from evaporative recycling of surface waters and evapotranspiration influence the δ18Op values across Europe (Rozanski et al., 1982), the reader is advised to consider this limitation when applying our model results. Furthermore, we note that the trajectory analyses of this study track air masses by disregarding their moisture content. Therefore, changes in air mass trajectories do not inherently lead to significant changes in δ18Op if, for example, all changes in atmospheric transport only affect air masses that are moisture-depleted. The reader is also made aware that this study uses fixed pre-industrial paleoenvironmental boundary conditions for the GCM topographic sensitivity experiments to isolate the topography-related δ18Op signal of simplified diachronous surface uplift scenarios for the Alps. The reader is advised that these conditions do not represent the realistic global paleoclimate condition of the time of the Cenozoic major surface uplift, which is why we refer to our results as a sensitivity analysis of potential signals. However, despite these limitations, the results of this sensitivity analysis indicate good potential for detecting and reconstructing a diachronous elevation history in the Alps. Given this, future time-intensive efforts such as stable-isotope-based paleoaltimetry data collection and more paleogeographically realistic GCM studies are considered likely to be worthy endeavors.
5.7 Implications for paleoaltimetry reconstructions and hypothesis evaluation
Stable isotope paleoaltimetry exploits the systematic relationship between δ18Op and elevation to infer past elevation across orogens (e.g., Chamberlain et al., 1999; Kohn and Dettman, 2007; Mulch, 2016; Quade et al., 2007; Rowley and Garzione, 2007; Sharp et al., 2005). The present-day δ18Op lapse rate in the Central Alps is ∼0.2 ‰ 100 m−1 (Campani et al., 2012). The present study estimates a similar range of δ18Op lapse rates across the western and northern flanks of the Alps for present-day topography conditions (−0.23 ‰ 100 m−1 and −0.22 ‰ 100 m−1, respectively) and a higher value (−0.31 ‰ 100 m−1) for the southern flanks (Fig. 6). The W2E1 scenario is the closest to a plausible, albeit very simplified, scenario for the Miocene since the Alps are suggested to have reached their maximum peaks during that period. The simulation for this topography scenario estimates δ18Op lapse rates of −0.28 ‰ 100 m−1, 0.34 ‰ 100 m−1, and −0.29 ‰ 100 m−1 for the west, north, and south transects, respectively (Fig. 7). These results differ from our predictions of lapse rates produced by bulk surface uplift experiments (i.e., W2E2). In other words, the diachronous surface uplift of the Western–Central and Eastern Alps (scenario 1) creates distinct isotopic patterns that differ from those produced by the control simulation (CTL) or the bulk surface uplift (scenario 2) experiments. We can therefore accept our hypotheses that (1) different topographic configurations for the Eastern and Western–Central Alps result in regional climates and spatial distributions of δ18Op that are significantly different from those of today and that (2) different topographic configurations for the Eastern and Western–Central Alps result in regional climate and spatial distributions of δ18Op that are significantly different from those produced by scenarios of bulk surface uplift of the whole Alps. Therefore, if the signals produced by diachronous surface uplift are preserved in the geological record, diachronous surface uplift should be reflected in the associated δ18Op values. This suggests that hypothesized west-to-east surface uplift propagation could be reconstructed with stable isotope paleoaltimetry that takes advantage of these archives.
The topographic changes produce less pronounced δ18Op values changes at low-elevation sites adjacent to the Alps, which is consistent with findings from experiments presented by Botsyun et al. (2020). The affected area of 18O depletion expands geographically when high elevation is assumed on the western flanks of the Alps. Since the δ–δ paleoaltimetry approach is based on the premise that low-elevation sites record background climate change unrelated to topographic changes, our results stress the importance of also sampling low-elevation regions at some distance from the orogen, especially for times when the orogen had likely reached significant elevation. However, sampling at low elevation near the orogenic front may underestimate rather than overestimate the past elevation (because of low-elevation δ18Op values that are lower than far-field sampling sites unaffected by nearby Alpine topography). Therefore, we recommend that this study's δ18Op maps be consulted when devising a sampling strategy to ensure that the target low-elevation sampling location lies outside the region in which topographic changes significantly impact δ18Op values. Paleoclimate modeling with realistic paleoenvironmental conditions may provide important support for future paleoaltimetry studies. Due to the demonstrated link between topographic configurations and the atmospheric teleconnection patterns governing European climate, estimates of past climate and δ18Op lapse rates should also consider the hypothesized uplift scenarios as part of the paleogeographic and paleoelevation boundary conditions for climate models (e.g., Zhang et al., 2015).
The European Alps are hypothesized to have experienced diachronous surface uplift in response to post-collisional process such as slab break-off. Understanding the geodynamic and geomorphic evolution of the Alps requires knowledge of its surface uplift history. This study employs a model-based sensitivity analysis to investigate the response of regional climatic and δ18Op values to diachronous surface uplift across the Alps. Overall, our results let us accept the hypotheses that the diachronous surface uplift of the Western–Central and Eastern Alps would result in distinct regional climates and meteoric δ18Op patterns that differ from (1) present-day conditions and (2) conditions produced when the whole Alps are uplifted. If this signal is not lost during the formation of geological proxy material like paleosol carbonates, these records can be used in a stable isotope paleoaltimetry approach to test the hypothesis of eastward propagation of surface uplift in the Alps. We summarize the results as follows.
-
The diachronous surface uplift across the Alps significantly decreases δ18Op values up to ∼8 ‰ over the modified areas, mainly due to an increase in orographic precipitation and adiabatic temperature lapse rate. The topographic scenarios with higher elevations in the Western–Central Alps produce a greater decrease in δ18Op values and an expansion of the affected geographical domain surrounding the Alps when compared to present-day topography. The different topographic scenarios resulted in a less significant change in δ18Op values of 1 ‰–2 ‰ over the adjacent low-elevation areas around the Alps.
-
The δ18Op value changes were predominantly driven by the significant increase in precipitation amount of up to ∼125 mm month−1 in response to surface uplift due to orographic airlifting and changes in precipitation dynamics. The surface uplift scenarios with higher topography in the Western–Central Alps resulted in significantly drier conditions (rain shadow) over northern Europe and towards the eastern flanks.
-
Surface uplift resulted in a localized decrease in near-surface temperature that also contributed to the decrease in δ18Op values. The temperature changes were only significant over the modified topographic areas, where they can be primarily explained by adiabatic temperature lapse rates. Smaller changes of up to −2 ∘C over regions farther from the Alps may be attributed to non-adiabatic processes, such as changes in atmospheric circulation.
-
The changes in elevation–δ18Op relationship (i.e., isotopic lapse rate) among the different topographic scenarios depend on the transect around the Alps and the magnitude of elevation changes. Some changes were small and within the statistical uncertainty range. The differences in isotopic lapse rates are in the ranges of −0.24 to −0.83 (with the highest uncertainty of ±0.24), −0.17 to −1.19 (±0.14), and −0.15 to −0.94 (±0.16) ‰ km−1 for the western, northern, and southern transect, respectively. The differences in these estimates might be attributed to a different redistribution of precipitation and changes in moisture transport distance and pathways along specific transects.
Note that this study only quantifies the topographic signal while keeping paleoenvironmental conditions constant. Further experiments are needed to investigate the synergistic effects of combined topographic and paleoenvironmental changes and move towards plausible reconstructions of the topography and paleoclimate of Alps at specific times in the past. Furthermore, the next logical step to close the gap between the predicted meteoric δ18O response and isotopic ratios extracted from archives is to employ proxy system models to investigate the signal transformation that takes place between these steps. This would allow for a more accurate back transformation that can ultimately refine paleoelevation estimates for the Alps.
The ECHAM5 model is available under the MPI-M Software License Agreement (https://code.mpimet.mpg.de/attachments/download/26986/MPI-ESM_SLA_v3.4.pdf, last access: 5 November 2023), and the isotope-tracking implementation part (ECHAM5-wiso) is available upon request from the Alfred Wegner Institute (AWI), Germany (https://gitlab.awi.de/mwerner/mpi-esm-wiso, last access: 5 November 2023). The LAGRANTO model used for the back-trajectory analysis can be downloaded from https://iacweb.ethz.ch/staff/sprenger/lagranto/ (last access: 5 November 2023). The scripts used for postprocessing, data analysis, and visualization are based on a Python package (pyClimat) available at https://doi.org/10.5281/zenodo.7143044 (Boateng, 2022).
The processed model output variables (i.e., near-surface temperature, precipitation-weighted δ18Op, precipitation amount, elevation, near-surface meridional, and zonal wind velocity single-level variables, as well as vertical wind velocity, cloud cover, and relative humidity at pressure levels) used in this study for the different topographic scenarios are available in NetCDF format at https://doi.org/10.5281/zenodo.7143487 (Boateng et al., 2022).
The supplement related to this article is available online at: https://doi.org/10.5194/esd-14-1183-2023-supplement.
DB: conceptualization, model simulation, data analysis, visualization, and writing of the original paper. SGM, TAE: conceptualization, supervision, funding acquisition, paper review and editing. AM, MJMM, KM: funding acquisition and paper review and editing. AB, SB: paper review and editing. All authors contributed to the discussion of the results.
At least one of the (co-)authors is a member of the editorial board of Earth System Dynamics. The peer-review process was guided by an independent editor, and the authors also have no other competing interests to declare.
Publisher's note: Copernicus Publications remains neutral with regard to jurisdictional claims made in the text, published maps, institutional affiliations, or any other geographical representation in this paper. While Copernicus Publications makes every effort to include appropriate place names, the final responsibility lies with the authors.
This research was supported by the German Science Foundation (DFG) priority research program Mountain Building Processes in Four Dimensions (4D-MB; SPP 2017) through grants EH 329/19-1 and EH329/23-1 (to Todd A. Ehlers), MU4188/1-1 and MU4188/3-1 (to Sebastian G. Mutz), MU2845/6-1 and MU2845/7-1 (to Andreas Mulch), Me4955/1-1 (to Katharina Methner), and ME5579/1-1 (to Maud J. M. Meijers). We thank Joel Saylor and the anonymous reviewer for their constructive reviews.
This research has been supported by the Deutsche Forschungsgemeinschaft (Mountain Building Processes in Four Dimensions – 4D-MB, SPP 2017; grants EH 329/19-1 and EH329/23-1 to Todd A. Ehlers, MU4188/1-1 and MU4188/3-1 to Sebastian G. Mutz, MU2845/6-1 and MU2845/7-1 to Andreas Mulch, Me4955/1-1 to Katharina Methner, and ME5579/1-1 to Maud J. M. Meijers).
This open-access publication was funded by the University of Tübingen.
This paper was edited by Gabriele Messori and reviewed by Joel Saylor and one anonymous referee.
Allen, P. A.: From landscapes into geological history, Nature, 451, 274–276, https://doi.org/10.1038/nature06586, 2008.
Antonelli, A., Kissling, W. D., Flantua, S. G. A., Bermúdez, M. A., Mulch, A., Muellner-Riehl, A. N., Kreft, H., Linder, H. P., Badgley, C., Fjeldså, J., Fritz, S. A., Rahbek, C., Herman, F., Hooghiemstra, H., and Hoorn, C.: Geological and climatic influences on mountain biodiversity, Nat. Geosci., 11, 718–725, https://doi.org/10.1038/s41561-018-0236-z, 2018.
Baldini, L. M., McDermott, F., Foley, A. M., and Baldini, J. U. L.: Spatial variability in the European winter precipitation δ18O-NAO relationship: Implications for reconstructing NAO-mode climate variability in the Holocene, Geophys. Res. Lett., 35, L04709, https://doi.org/10.1029/2007GL032027, 2008.
Barnston, A. G. and Livezey, R. E.: Classification, Seasonality and Persistence of Low-Frequency Atmospheric Circulation Patterns, Mon. Weather Rev., 115, 1083–1126, https://doi.org/10.1175/1520-0493(1987)115< 1083:CSAPOL>2.0.CO;2, 1987.
Bartolini, E., Claps, P., and D'Odorico, P.: Interannual variability of winter precipitation in the European Alps: relations with the North Atlantic Oscillation., Hydrol. Earth Syst. Sci., 13, 17–25, https://doi.org/10.5194/hess-13-17-2009, 2009.
Bartosch, Stüwe, K., and Robl, J.: Topographic evolution of the Eastern Alps: The influence of strike-slip faulting activity, Lithosphere, 9, 384–398, https://doi.org/10.1130/L594.1, 2017.
Bastos, A., Janssens, I. A., Gouveia, C. M., Trigo, R. M., Ciais, P., Chevallier, F., Peñuelas, J., Rödenbeck, C., Piao, S., Friedlingstein, P., and Running, S. W.: European land CO2 sink influenced by NAO and East-Atlantic Pattern coupling, Nat. Commun., 7, 10315, https://doi.org/10.1038/ncomms10315, 2016.
Bell, B., Hersbach, H., Simmons, A., Berrisford, P., Dahlgren, P., Horányi, A., Muñoz-Sabater, J., Nicolas, J., Radu, R., Schepers, D., Soci, C., Villaume, S., Bidlot, J.-R., Haimberger, L., Woollen, J., Buontempo, C., and Thépaut, J.-N.: The ERA5 global reanalysis: Preliminary extension to 1950, Q. J. Roy. Meteor. Soc., 147, 4186–4227, https://doi.org/10.1002/qj.4174, 2021.
Beniston, M.: Mountain Climates and Climatic Change: An Overview of Processes Focusing on the European Alps, Pure Appl. Geophys., 162, 1587–1606, https://doi.org/10.1007/s00024-005-2684-9, 2005.
Boateng, D.: A functional based python module for processing, analysis and visualization of climate model output (pyClimat) (0.0.1), Zenodo [code], https://doi.org/10.5281/zenodo.7143044, 2022.
Boateng, D., Mutz, G. S., Ballian, A., Meijers, J. M. M., Methner, K., Botsyun, S., Mulch, A., and Ehlers, A. T.: Processed model output of the climate simulation in the study: The effects of diachronous surface uplift of the European Alps on regional climate and the isotopic composition of precipitation (δ18Op) [Boateng et al.] (1.0.0), Zenodo [data set], https://doi.org/10.5281/zenodo.7143487, 2022.
Botsyun, S. and Ehlers, T. A.: How Can Climate Models Be Used in Paleoelevation Reconstructions?, Front. Earth Sci., 9, 624542, https://doi.org/10.3389/feart.2021.624542, 2021.
Botsyun, S., Ehlers, T. A., Koptev, A., Böhme, M., Methner, K., Risi, C., Stepanek, C., Mutz, S. G., Werner, M., Boateng, D., and Mulch, A.: Middle Miocene Climate and Stable Oxygen Isotopes in Europe Based on Numerical Modeling, Paleoceanogr. Paleoclimatol., 37, e2022PA004442, https://doi.org/10.1029/2022PA004442, 2022.
Botsyun, S., Sepulchre, P., Donnadieu, Y., Risi, C., Licht, A., and Caves Rugenstein, J. K.: Revised paleoaltimetry data show low Tibetan Plateau elevation during the Eocene, Science, 363, eaaq1436, https://doi.org/10.1126/science.aaq1436, 2019.
Botsyun, S., Ehlers, T. A., Mutz, S. G., Methner, K., Krsnik, E., and Mulch, A.: Opportunities and Challenges for Paleoaltimetry in “Small” Orogens: Insights From the European Alps, Geophys. Res. Lett., 47, e2019GL086046, https://doi.org/10.1029/2019GL086046, 2020.
Breecker, D. O., Sharp, Z. D., and McFadden, L. D.: Seasonal bias in the formation and stable isotopic composition of pedogenic carbonate in modern soils from central New Mexico, USA, GSA Bull., 121, 630–640, https://doi.org/10.1130/B26413.1, 2009.
Campani, M., Mulch, A., Kempf, O., Schlunegger, F., and Mancktelow, N.: Miocene paleotopography of the Central Alps, Earth Planet. Sc. Lett., 337, 174–185, https://doi.org/10.1016/j.epsl.2012.05.017, 2012.
Chafik, L., Nilsen, J., and Dangendorf, S.: Impact of North Atlantic Teleconnection Patterns on Northern European Sea Level, J. Mar. Sci. Eng., 5, 43, https://doi.org/10.3390/jmse5030043, 2017.
Chamberlain, C. P., Poage, M. A., Craw, D., and Reynolds, R. C.: Topographic development of the Southern Alps recorded by the isotopic composition of authigenic clay minerals, South Island, New Zealand, Chem. Geol., 155, 279–294, https://doi.org/10.1016/S0009-2541(98)00165-X, 1999.
Chamberlain, C. P., Mix, H. T., Mulch, A., Hren, M. T., Kent-Corson, M. L., Davis, S. J., Horton, T. W., and Graham, S. A.: The Cenozoic climatic and topographic evolution of the western North American Cordillera, Am. J. Sci., 312, 213–262, https://doi.org/10.2475/02.2012.05, 2012.
Clark, M. K.: The Significance of Paleotopography, Rev. Mineral. Geochem., 66, 1–21, https://doi.org/10.2138/rmg.2007.66.1, 2007.
Colle, B. A.: Sensitivity of Orographic Precipitation to Changing Ambient Conditions and Terrain Geometries: An Idealized Modeling Perspective, J. Atmos. Sci., 61, 588–606, https://doi.org/10.1175/1520-0469(2004)061< 0588:SOOPTC>2.0.CO;2, 2004.
Comas-Bru, L. and McDermott, F.: Impacts of the EA and SCA patterns on the European twentieth century NAO–winter climate relationship, Q. J. Roy. Meteor. Soc., 140, 354–363, https://doi.org/10.1002/qj.2158, 2014.
Comas-Bru, L., McDermott, F., and Werner, M.: The effect of the East Atlantic pattern on the precipitation δ18O-NAO relationship in Europe, Clim. Dynam., 47, 2059–2069, https://doi.org/10.1007/s00382-015-2950-1, 2016.
Craig, P. M. and Allan, R. P.: The role of teleconnection patterns in the variability and trends of growing season indices across Europe, Int. J. Climatol., 42, 1072–1091, https://doi.org/10.1002/joc.7290, 2022.
Dansgaard, W.: Stable isotopes in precipitation, Tellus, 16, 436–468, https://doi.org/10.3402/tellusa.v16i4.8993, 1964.
Dee, D. P., Uppala, S. M., Simmons, A. J., Berrisford, P., Poli, P., Kobayashi, S., Andrae, U., Balmaseda, M. A., Balsamo, G., Bauer, P., Bechtold, P., Beljaars, A. C. M., van de Berg, L., Bidlot, J., Bormann, N., Delsol, C., Dragani, R., Fuentes, M., Geer, A. J., Haimberger, L., Healy, S. B., Hersbach, H., Hólm, E. V., Isaksen, L., Kållberg, P., Köhler, M., Matricardi, M., McNally, A. P., Monge-Sanz, B. M., Morcrette, J.-J., Park, B.-K., Peubey, C., de Rosnay, P., Tavolato, C., Thépaut, J.-N., and Vitart, F.: The ERA-Interim reanalysis: configuration and performance of the data assimilation system, Q. J. Roy. Meteor. Soc., 137, 553–597, https://doi.org/10.1002/qj.828, 2011.
Deininger, M., Werner, M., and McDermott, F.: North Atlantic Oscillation controls on oxygen and hydrogen isotope gradients in winter precipitation across Europe; implications for palaeoclimate studies, Clim. Past, 12, 2127–2143, https://doi.org/10.5194/cp-12-2127-2016, 2016.
Ding, L., Kapp, P., Cai, F., Garzione, C. N., Xiong, Z., Wang, H., and Wang, C.: Timing and mechanisms of Tibetan Plateau uplift, Nat. Rev. Earth Environ., 3, 1–16, https://doi.org/10.1038/s43017-022-00318-4, 2022.
Edwards, T. W. D., Birks, S. J., and Gibson, J. J.: Isotope tracers in global water and climate studies of the past and present, International Atomic Energy Agency (IAEA), ISSN 1563-0153, 2002.
Ehlers, T. A. and Poulsen, C. J.: Influence of Andean uplift on climate and paleoaltimetry estimates, Earth Planet. Sc. Lett., 281, 238–248, https://doi.org/10.1016/j.epsl.2009.02.026, 2009.
Fauquette, S., Bernet, M., Suc, J.-P., Grosjean, A.-S., Guillot, S., van der Beek, P., Jourdan, S., Popescu, S.-M., Jiménez-Moreno, G., Bertini, A., Pittet, B., Tricart, P., Dumont, T., Schwartz, S., Zheng, Z., Roche, E., Pavia, G., and Gardien, V.: Quantifying the Eocene to Pleistocene topographic evolution of the southwestern Alps, France and Italy, Earth Planet. Sc. Lett., 412, 220–234, https://doi.org/10.1016/j.epsl.2014.12.036, 2015.
Feng, R., Poulsen, C. J., Werner, M., Chamberlain, C. P., Mix, H. T., and Mulch, A.: Early Cenozoic evolution of topography, climate, and stable isotopes in precipitation in the North American Cordillera, Am. J. Sci., 313, 613–648, https://doi.org/10.2475/07.2013.01, 2013.
Feng, R. and Poulsen, C. J.: Refinement of Eocene lapse rates, fossil-leaf altimetry, and North American Cordilleran surface elevation estimates, Earth Planet. Sc. Lett., 436, 130–141, https://doi.org/10.1016/j.epsl.2015.12.022, 2016.
Forest, C. E., Wolfe, J. A., Molnar, P., and Emanuel, K. A.: Paleoaltimetry incorporating atmospheric physics and botanical estimates of paleoclimate, Geol. Soc. Am. Bull., 111, 497–511, https://doi.org/10.1130/0016-7606(1999)111< 0497:PIAPAB>2.3.CO;2, 1999.
Frisch, W.: Tectonic progradation and plate tectonic evolution of the Alps, Tectonophysics, 60, 121–139, https://doi.org/10.1016/0040-1951(79)90155-0, 1979.
Gallagher, T. M., Hren, M., and Sheldon, N. D.: The effect of soil temperature seasonality on climate reconstructions from paleosols, Am. J. Sci., 319, 549–581, https://doi.org/10.2475/07.2019.02, 2019.
Garzione, C. N., Quade, J., DeCelles, P. G., and English, N. B.: Predicting paleoelevation of Tibet and the Himalaya from δ18O vs. altitude gradients in meteoric water across the Nepal Himalaya, Earth Planet. Sc. Lett., 183, 215–229, https://doi.org/10.1016/S0012-821X(00)00252-1, 2000.
Garzione, C. N., Hoke, G. D., Libarkin, J. C., Withers, S., MacFadden, B., Eiler, J., Ghosh, P., and Mulch, A.: Rise of the Andes, Science, 320, 1304–1307, https://doi.org/10.1126/science.1148615, 2008.
Garzione, C. N., Auerbach, D. J., Jin-Sook Smith, J., Rosario, J. J., Passey, B. H., Jordan, T. E., and Eiler, J. M.: Clumped isotope evidence for diachronous surface cooling of the Altiplano and pulsed surface uplift of the Central Andes, Earth Planet. Sc. Lett., 393, 173–181, https://doi.org/10.1016/j.epsl.2014.02.029, 2014.
Gat, J. R.: Oxygen and Hydrogen Isotopes in the Hydrologic Cycle, Annual Rev. Earth Planet. Sci., 24, 225–262, https://doi.org/10.1146/annurev.earth.24.1.225, 1996.
Gébelin, A., Mulch, A., Teyssier, C., Jessup, M. J., Law, R. D., and Brunel, M.: The Miocene elevation of Mount Everest, Geology, 41, 799–802, https://doi.org/10.1130/G34331.1, 2013.
Ghosh, P., Garzione, C. N., and Eiler, J. M.: Rapid Uplift of the Altiplano Revealed Through 13C–18O Bonds in Paleosol Carbonates, Science, 311, 511–515, https://doi.org/10.1126/science.1119365, 2006.
Giorgi, F., Hurrell, J. W., Marinucci, M. R., and Beniston, M.: Elevation Dependency of the Surface Climate Change Signal: A Model Study, J. Climate, 10, 288–296, https://doi.org/10.1175/1520-0442(1997)010< 0288:EDOTSC>2.0.CO;2, 1997.
Grossman, R. L. and Durran, D. R.: Interaction of Low-Level Flow with the Western Ghat Mountains and Offshore Convection in the Summer Monsoon, Mon. Weather Rev., 112, 652–672, https://doi.org/10.1175/1520-0493(1984)112< 0652:IOLLFW>2.0.CO;2, 1984.
Hagemann, S., Arpe, K., and Roeckner, E.: Evaluation of the Hydrological Cycle in the ECHAM5 Model, J. Climate, 19, 3810–3827, https://doi.org/10.1175/JCLI3831.1, 2006.
Handy, M. R., Ustaszewski, K., and Kissling, E.: Reconstructing the Alps–Carpathians–Dinarides as a key to understanding switches in subduction polarity, slab gaps and surface motion, Int. J. Earth. Sci., 104, 1–26, https://doi.org/10.1007/s00531-014-1060-3, 2015.
Hannachi, A., Jolliffe, I. T., and Stephenson, D. B.: Empirical orthogonal functions and related techniques in atmospheric science: A review, Int. J. Climatol., 27, 1119–1152, https://doi.org/10.1002/joc.1499, 2007.
Hergarten, S., Wagner, T., and Stüwe, K.: Age and Prematurity of the Alps Derived from Topography, Earth Planet. Sc. Lett., 297, 453–460, https://doi.org/10.1016/j.epsl.2010.06.048, 2010.
Hersbach, H., Bell, B., Berrisford, P., Hirahara, S., Horányi, A., Muñoz-Sabater, J., Nicolas, J., Peubey, C., Radu, R., Schepers, D., Simmons, A., Soci, C., Abdalla, S., Abellan, X., Balsamo, G., Bechtold, P., Biavati, G., Bidlot, J., Bonavita, M., De Chiara, G., Dahlgren, P., Dee, D., Diamantakis, M., Dragani, R., Flemming, J., Forbes, R., Fuentes, M., Geer, A., Haimberger, L., Healy, S., Hogan, R. J., Hólm, E., Janisková, M., Keeley, S., Laloyaux, P., Lopez, P., Lupu, C., Radnoti, G., de Rosnay, P., Rozum, I., Vamborg, F., Villaume, S., and Thépaut, J.-N.: The ERA5 global reanalysis, Q. J. Roy. Meteor. Soc., 146, 1999–2049, https://doi.org/10.1002/qj.3803, 2020.
Hoffmann, G., Werner, M., and Heimann, M.: Water isotope module of the ECHAM atmospheric general circulation model: A study on timescales from days to several years, J. Geophys. Res.-Atmos., 103, 16871–16896, https://doi.org/10.1029/98JD00423, 1998.
Houze, R. A.: Orographic effects on precipitating clouds, Rev. Geophys., 50, RG1001, https://doi.org/10.1029/2011RG000365, 2012.
Huntington, K. W., Wernicke, B. P., and Eiler, J. M.: Influence of climate change and uplift on Colorado Plateau paleotemperatures from carbonate clumped isotope thermometry, Tectonics, 29, https://doi.org/10.1029/2009TC002449, 2010.
Hurrell, J. W.: Decadal Trends in the North Atlantic Oscillation: Regional Temperatures and Precipitation, Science, 269, 676–679, https://doi.org/10.1126/science.269.5224.676, 1995.
Hurrell, J. W. and Van Loon, H.: Decadal Variations in Climate Associated with the North Atlantic Oscillation, in: Climatic Change at High Elevation Sites, edited by: Diaz, H. F., Beniston, M., and Bradley, R. S., Springer Netherlands, Dordrecht, 69–94, https://doi.org/10.1007/978-94-015-8905-5_ 4, 1997.
Huw Davies, J. and von Blanckenburg, F.: Slab breakoff: A model of lithosphere detachment and its test in the magmatism and deformation of collisional orogens, Earth Planet. Sc. Lett., 129, 85–102, https://doi.org/10.1016/0012-821X(94)00237-S, 1995.
Huyghe, D., Mouthereau, F., and Emmanuel, L.: Oxygen isotopes of marine mollusc shells record Eocene elevation change in the Pyrenees, Earth Planet. Sc. Lett., 345, 131–141, https://doi.org/10.1016/j.epsl.2012.06.035, 2012.
Huyghe, D., Mouthereau, F., Sébilo, M., Vacherat, A., Ségalen, L., Richard, P., Biron, P., and Bariac, T.: Impact of topography, climate and moisture sources on isotopic composition (δ18O & δD) of rivers in the Pyrenees: Implications for topographic reconstructions in small orogens, Earth Planet. Sc. Lett., 484, 370–384, https://doi.org/10.1016/j.epsl.2017.12.035, 2018.
Insel, N., Poulsen, C. J., and Ehlers, T. A.: Influence of the Andes Mountains on South American moisture transport, convection, and precipitation, Clim. Dynam., 35, 1477–1492, https://doi.org/10.1007/s00382-009-0637-1, 2010.
Insel, N., Poulsen, C. J., Ehlers, T. A., and Sturm, C.: Response of meteoric δ18O to surface uplift – Implications for Cenozoic Andean Plateau growth, Earth Planet. Sc. Lett., 317, 262–272, https://doi.org/10.1016/j.epsl.2011.11.039, 2012.
Ionita, M.: The Impact of the East Atlantic/Western Russia Pattern on the Hydroclimatology of Europe from Mid-Winter to Late Spring, Climate, 2, 296–309, https://doi.org/10.3390/cli2040296, 2014.
Josey, S. A.: Surface freshwater flux variability and recent freshening of the North Atlantic in the eastern subpolar gyre, J. Geophys. Res., 110, C05008, https://doi.org/10.1029/2004JC002521, 2005.
Kattel, D. B., Yao, T., Yang, W., Gao, Y., and Tian, L.: Comparison of temperature lapse rates from the northern to the southern slopes of the Himalayas, Int. J. Climatol., 35, 4431–4443, https://doi.org/10.1002/joc.4297, 2015.
Kelson, J. R., Huntington, K. W., Breecker, D. O., Burgener, L. K., Gallagher, T. M., Hoke, G. D., and Petersen, S. V.: A proxy for all seasons?, A synthesis of clumped isotope data from Holocene soil carbonates, Quat. Sci. Rev., 234, 106259, https://doi.org/10.1016/j.quascirev.2020.106259, 2020.
Kissling, E. and Schlunegger, F.: Rollback Orogeny Model for the Evolution of the Swiss Alps, Tectonics, 37, 1097–1115, https://doi.org/10.1002/2017TC004762, 2018.
Kocsis, L., Vennemann, T. W., and Fontignie, D.: Migration of sharks into freshwater systems during the Miocene and implications for Alpine paleoelevation, Geology, 35, 451–454, https://doi.org/10.1130/G23404A.1, 2007.
Kohn, M. J. and Dettman, D. L.: Paleoaltimetry from Stable Isotope Compositions of Fossils, Rev. Mineral. Geochem., 66, 119–154, https://doi.org/10.2138/rmg.2007.66.5, 2007.
Krsnik, E., Methner, K., Campani, M., Botsyun, S., Mutz, S. G., Ehlers, T. A., Kempf, O., Fiebig, J., Schlunegger, F., and Mulch, A.: Miocene high elevation in the Central Alps, Solid Earth, 12, 2615–2631, https://doi.org/10.5194/se-12-2615-2021, 2021.
Kuhlemann, J., Frisch, W., Székely, B., Dunkl, I., and Kázmér, M.: Post-collisional sediment budget history of the Alps: tectonic versus climatic control, Int. J. Earth Sci., 91, 818–837, https://doi.org/10.1007/s00531-002-0266-y, 2002.
Langebroek, P. M., Werner, M., and Lohmann, G.: Climate information imprinted in oxygen-isotopic composition of precipitation in Europe, Earth Planet. Sc. Lett., 311, 144–154, https://doi.org/10.1016/j.epsl.2011.08.049, 2011.
Lee, J.-E. and Fung, I.: “Amount effect” of water isotopes and quantitative analysis of post-condensation processes, Hydrol. Process., 22, 1–8, https://doi.org/10.1002/hyp.6637, 2008.
Li, J., Ehlers, T. A., Mutz, S. G., Steger, C., Paeth, H., Werner, M., Poulsen, C. J., and Feng, R.: Modern precipitation δ18O and trajectory analysis over the Himalaya-Tibet Orogen from ECHAM5-wiso simulations: Tibetan modern precipitation δ18O, J. Geophys. Res.-Atmos., 121, 10432–10452, https://doi.org/10.1002/2016JD024818, 2016.
Lim, Y.-K.: The East Atlantic/West Russia (EA/WR) teleconnection in the North Atlantic: climate impact and relation to Rossby wave propagation, Clim. Dynam., 44, 3211–3222, https://doi.org/10.1007/s00382-014-2381-4, 2015.
Lin, S.-J. and Rood, R. B.: Multidimensional Flux-Form Semi-Lagrangian Transport Schemes, Mon. Weather Rev., 124, 2046–2070, https://doi.org/10.1175/1520-0493(1996)124<2046:MFFSLT>2.0.CO;2, 1996.
Lorenz, S. J. and Lohmann, G.: Acceleration technique for Milankovitch type forcing in a coupled atmosphere-ocean circulation model: method and application for the Holocene, Clim. Dynam., 23, 727–743, https://doi.org/10.1007/s00382-004-0469-y, 2004.
Lu, G., Winkler, W., Rahn, M., von Quadt, A., and Willett, S. D.: Evaluating igneous sources of the Taveyannaz formation in the Central Alps by detrital zircon U–Pb age dating and geochemistry, Swiss J. Geosci., 111, 399–416, https://doi.org/10.1007/s00015-018-0302-y, 2018.
McCann, T.: The Geology of Central Europe: Mesozioc and cenozoic, Geological Society of London, 760 pp., 2008.
McElwain, J. C.: Climate-independent paleoaltimetry using stomatal density in fossil leaves as a proxy for CO2 partial pressure, Geology, 32, 1017–1020, https://doi.org/10.1130/G20915.1, 2004.
Meijers, M. J. M., Brocard, G. Y., Cosca, M. A., Lüdecke, T., Teyssier, C., Whitney, D. L., and Mulch, A.: Rapid late Miocene surface uplift of the Central Anatolian Plateau margin, Earth Planet. Sc. Lett., 497, 29–41, https://doi.org/10.1016/j.epsl.2018.05.040, 2018.
Merlivat, L. and Jouzel, J.: Global climatic interpretation of the deuterium-oxygen 18 relationship for precipitation, J. Geophys. Res.-Oceans, 84, 5029–5033, https://doi.org/10.1029/JC084iC08p05029, 1979.
Methner, K., Fiebig, J., Wacker, U., Umhoefer, P., Chamberlain, C. P., and Mulch, A.: Eocene-Oligocene proto-Cascades topography revealed by clumped (Δ47) and oxygen isotope (δ18O) geochemistry (Chumstick Basin, WA, USA), Tectonics, 35, 546–564, https://doi.org/10.1002/2015TC003984, 2016.
Methner, K., Campani, M., Fiebig, J., Löffler, N., Kempf, O., and Mulch, A.: Middle Miocene long-term continental temperature change in and out of pace with marine climate records, Sci. Rep., 10, 7989, https://doi.org/10.1038/s41598-020-64743-5, 2020.
Moore, G. W. K., Renfrew, I. A., and Pickart, R. S.: Multidecadal Mobility of the North Atlantic Oscillation, J. Climate, 26, 2453–2466, https://doi.org/10.1175/JCLI-D-12-00023.1, 2013.
Mulch, A.: Stable isotope paleoaltimetry and the evolution of landscapes and life, Earth Planet. Sc. Lett., 433, 180–191, https://doi.org/10.1016/j.epsl.2015.10.034, 2016.
Mulch, A. and Chamberlain, C. P.: Stable Isotope Paleoaltimetry in Orogenic Belts – The Silicate Record in Surface and Crustal Geological Archives, Rev. Mineral. Geochem., 66, 89–118, https://doi.org/10.2138/rmg.2007.66.4, 2007.
Mulch, A., Graham, S. A., and Chamberlain, C. P.: Hydrogen Isotopes in Eocene River Gravels and Paleoelevation of the Sierra Nevada, Science, 313, 87–89, https://doi.org/10.1126/science.1125986, 2006.
Mulch, A., Sarna-Wojcicki, A. M., Perkins, M. E., and Chamberlain, C. P.: A Miocene to Pleistocene climate and elevation record of the Sierra Nevada (California), P. Natl. Acad. Sci. USA, 105, 6819–6824, https://doi.org/10.1073/pnas.0708811105, 2008.
Mulch, A., Uba, C. E., Strecker, M. R., Schoenberg, R., and Chamberlain, C. P.: Late Miocene climate variability and surface elevation in the central Andes, Earth Planet. Sc. Lett., 290, 173–182, https://doi.org/10.1016/j.epsl.2009.12.019, 2010.
Mulch, A., Chamberlain, C. P., Cosca, M. A., Teyssier, C., Methner, K., Hren, M. T., and Graham, S. A.: Rapid change in high-elevation precipitation patterns of western North America during the Middle Eocene Climatic Optimum (MECO), Am. J. Sci., 315, 317–336, https://doi.org/10.2475/04.2015.02, 2015.
Mulch, A., Chamberlain, C. P., Hoorn, C., Perrigo, A., and Antonelli, A.: Stable isotope paleoaltimetry: paleotopography as a key element in the evolution of landscapes and life, Mountains, Climate and Biodiversity, Hoboken, NJ, Wiley-Blackwell, 81–93, 2018.
Mutz, S. G., Ehlers, T. A., Li, J., Steger, C., Paeth, H., Werner, M., and Poulsen, C. J.: Precipitation δ18O over the Himalaya-Tibet orogen from ECHAM5-wiso simulations: Statistical analysis of temperature, topography and precipitation, J. Geophys. Res.-Atmos., 121, 9278–9300, https://doi.org/10.1002/2016JD024856, 2016.
Mutz, S. G., Ehlers, T. A., Werner, M., Lohmann, G., Stepanek, C., and Li, J.: Estimates of late Cenozoic climate change relevant to Earth surface processes in tectonically active orogens, Earth Surf. Dynam., 6, 271–301, https://doi.org/10.5194/esurf-6-271-2018, 2018.
North, G. R., Bell, T. L., Cahalan, R. F., and Moeng, F. J.: Sampling Errors in the Estimation of Empirical Orthogonal Functions, Mon. Weather Rev., 110, 699–706, https://doi.org/10.1175/1520-0493(1982)110< 0699:SEITEO>2.0.CO;2, 1982.
Pingel, H., Mulch, A., Alonso, R. N., Cottle, J., Hynek, S. A., Poletti, J., Rohrmann, A., Schmitt, A. K., Stockli, D. F., and Strecker, M. R.: Surface uplift and convective rainfall along the southern Central Andes (Angastaco Basin, NW Argentina), Earth Planet. Sc. Lett., 440, 33–42, https://doi.org/10.1016/j.epsl.2016.02.009, 2016.
Poulsen, C. J., Ehlers, T. A., and Insel, N.: Onset of Convective Rainfall During Gradual Late Miocene Rise of the Central Andes, Science, 328, 490–493, https://doi.org/10.1126/science.1185078, 2010.
Quade, J., Garzione, C., and Eiler, J.: Paleoelevation Reconstruction using Pedogenic Carbonates, Rev. Mineral. Geochem., 66, 53–87, https://doi.org/10.2138/rmg.2007.66.3, 2007.
Quade, J., Breecker, D. O., Daëron, M., and Eiler, J.: The paleoaltimetry of Tibet: An isotopic perspective, Am. J. Sci., 311, 77–115, https://doi.org/10.2475/02.2011.01, 2011.
Risi, C., Noone, D., Frankenberg, C., and Worden, J.: Role of continental recycling in intraseasonal variations of continental moisture as deduced from model simulations and water vapor isotopic measurements: Continental Recycling and Water Isotopes, Water Resour. Res., 49, 4136–4156, https://doi.org/10.1002/wrcr.20312, 2013.
Roeckner, E., Bäuml, G., Bonaventura, L., Brokopf, R., Esch, M., Giorgetta, M., Hagemann, S., Kirchner, I., Kornblueh, L., Manzini, E., Rhodin, A., Schlese, U., Schulzweida, U., and Tompkins, A.: The atmospheric general circulation model ECHAM 5, Part I: Model description, https://doi.org/10.17617/2.995269, 2003.
Rogers, J. C.: Patterns of Low-Frequency Monthly Sea Level Pressure Variability (1899–1986) and Associated Wave Cyclone Frequencies, J. Climate, 3, 1364–1379, https://doi.org/10.1175/1520-0442(1990)003< 1364:POLFMS>2.0.CO;2, 1990.
Rosenberg, C. L., Berger, A., Bellahsen, N., and Bousquet, R.: Relating orogen width to shortening, erosion, and exhumation during Alpine collision, Tectonics, 34, 1306–1328, https://doi.org/10.1002/2014TC003736, 2015.
Rowley, D. B. and Currie, B. S.: Palaeo-altimetry of the late Eocene to Miocene Lunpola basin, central Tibet, Nature, 439, 677–681, https://doi.org/10.1038/nature04506, 2006.
Rowley, D. B. and Garzione, C. N.: Stable Isotope-Based Paleoaltimetry, Annu. Rev. Earth Planet. Sci., 35, 463–508, https://doi.org/10.1146/annurev.earth.35.031306.140155, 2007.
Rowley, D. B., Pierrehumbert, R. T., and Currie, B. S.: A new approach to stable isotope-based paleoaltimetry: implications for paleoaltimetry and paleohypsometry of the High Himalaya since the Late Miocene, Earth Planet. Sc. Lett., 188, 253–268, https://doi.org/10.1016/S0012-821X(01)00324-7, 2001.
Rozanski, K., Sonntag, C., and Münnich, K. O.: Factors controlling stable isotope composition of European precipitation, Tellus, 34, 142–150, https://doi.org/10.1111/j.2153-3490.1982.tb01801.x, 1982.
Sahagian, D. L. and Maus, J. E.: Basalt vesicularity as a measure of atmospheric pressure and palaeoelevation, Nature, 372, 449–451, https://doi.org/10.1038/372449a0, 1994.
Schlunegger, F. and Castelltort, S.: Immediate and delayed signal of slab breakoff in Oligo/Miocene Molasse deposits from the European Alps, Sci. Rep., 6, 31010, https://doi.org/10.1038/srep31010, 2016.
Schlunegger, F. and Kissling, E.: Slab rollback orogeny in the Alps and evolution of the Swiss Molasse basin, Nat. Commun., 6, 1–10, https://doi.org/10.1038/ncomms9605, 2015.
Schmid, S. M., Pfiffner, O. A., Froitzheim, N., Schönborn, G., and Kissling, E.: Geophysical-geological transect and tectonic evolution of the Swiss-Italian Alps, Tectonics, 15, 1036–1064, https://doi.org/10.1029/96TC00433, 1996.
Schmid, S. M., Fügenschuh, B., Kissling, E., and Schuster, R.: Tectonic map and overall architecture of the Alpine orogen, Eclogae Geol. Helv., 97, 93–117, https://doi.org/10.1007/s00015-004-1113-x, 2004.
Schmidli, J., Schmutz, C., Frei, C., Wanner, H., and Schär, C.: Mesoscale precipitation variability in the region of the European Alps during the 20th century: Alpine precipitation variability, Int. J. Climatol., 22, 1049–1074, https://doi.org/10.1002/joc.769, 2002.
Sharp, Z. D., Masson, H., and Lucchini, R.: Stable isotope geochemistry and formation mechanisms of quartz veins; extreme paleoaltitudes of the Central Alps in the Neogene, Am. J. Sci., 305, 187–219, https://doi.org/10.2475/ajs.305.3.187, 2005.
Shen, H. and Poulsen, C. J.: Precipitation δ18O on the Himalaya–Tibet orogeny and its relationship to surface elevation, Clim. Past, 15, 169–187, https://doi.org/10.5194/cp-15-169-2019, 2019.
Spicer, R. A., Su, T., Valdes, P. J., Farnsworth, A., Wu, F.-X., Shi, G., Spicer, T. E. V., and Zhou, Z.: Why “the uplift of the Tibetan Plateau” is a myth, Nat. Sci. Rev., 8, nwaa091, https://doi.org/10.1093/nsr/nwaa091, 2021.
Sprenger, M. and Wernli, H.: The LAGRANTO Lagrangian analysis tool – version 2.0, Geosci. Model Dev., 8, 2569–2586, https://doi.org/10.5194/gmd-8-2569-2015, 2015.
Stampfli, G. M., Mosar, J., Marquer, D., Marchant, R., Baudin, T., and Borel, G.: Subduction and obduction processes in the Swiss Alps, Tectonophysics, 296, 159–204, https://doi.org/10.1016/S0040-1951(98)00142-5, 1998.
Steppeler, J., Doms, G., Schättler, U., Bitzer, H. W., Gassmann, A., Damrath, U., and Gregoric, G.: Meso-gamma scale forecasts using the nonhydrostatic model LM, Met. Atmos. Phys., 82, 75–96, https://doi.org/10.1007/s00703-001-0592-9, 2003.
Stevens, B., Giorgetta, M., Esch, M., Mauritsen, T., Crueger, T., Rast, S., Salzmann, M., Schmidt, H., Bader, J., Block, K., Brokopf, R., Fast, I., Kinne, S., Kornblueh, L., Lohmann, U., Pincus, R., Reichler, T., and Roeckner, E.: Atmospheric component of the MPI-M Earth System Model: ECHAM6, J. Adv. Model. Earth Sy., 5, 146–172, https://doi.org/10.1002/jame.20015, 2013.
Storch, H. and von Zwiers, F. W.: Statistical Analysis in Climate Research, Cambridge University Press, 995 pp., 2002.
Sturm, C., Zhang, Q., and Noone, D.: An introduction to stable water isotopes in climate models: benefits of forward proxy modelling for paleoclimatology, Clim. Past, 6, 115–129, https://doi.org/10.5194/cp-6-115-2010, 2010.
Sundell, K. E., Saylor, J. E., Lapen, T. J., and Horton, B. K.: Implications of variable late Cenozoic surface uplift across the Peruvian central Andes, Sci. Rep., 9, 4877, https://doi.org/10.1038/s41598-019-41257-3, 2019.
Takahashi, K. and Battisti, D. S.: Processes Controlling the Mean Tropical Pacific Precipitation Pattern, Part I: The Andes and the Eastern Pacific ITCZ, J. Climate, 20, 3434–3451, https://doi.org/10.1175/JCLI4198.1, 2007.
Tompkins, A. M.: A Prognostic Parameterization for the Subgrid-Scale Variability of Water Vapor and Clouds in Large-Scale Models and Its Use to Diagnose Cloud Cover, J. Atmos. Sci., 59, 1917–1942, https://doi.org/10.1175/1520-0469(2002)059< 1917:APPFTS>2.0.CO;2, 2002.
Ustaszewski, K., Schmid, S. M., Fügenschuh, B., Tischler, M., Kissling, E., and Spakman, W.: A map-view restoration of the Alpine-Carpathian-Dinaridic system for the Early Miocene, Swiss J. Geosci., 101, 273–294, https://doi.org/10.1007/s00015-008-1288-7, 2008.
Valla, P. G., Sternai, P., and Fox, M.: How Climate, Uplift and Erosion Shaped the Alpine Topography, Elements, 17, 41–46, https://doi.org/10.2138/gselements.17.1.41, 2021.
Wallace, J. M. and Gutzler, D. S.: Teleconnections in the Geopotential Height Field during the Northern Hemisphere Winter, Mon. Weather Rev., 109, 784–812, https://doi.org/10.1175/1520-0493(1981)109<0784:TITGHF>2.0.CO;2, 1981.
Werner, M., Langebroek, P. M., Carlsen, T., Herold, M., and Lohmann, G.: Stable water isotopes in the ECHAM5 general circulation model: Toward high-resolution isotope modeling on a global scale, J. Geophys. Res., 116, D15109, https://doi.org/10.1029/2011JD015681, 2011.
Wernli, H.: A Lagrangian-based analysis of extratropical cyclones, II: A detailed case-study, Q. J. Roy. Meteor. Soc., 123, 1677–1706, https://doi.org/10.1002/qj.49712354211, 1997.
Whipple, K. X.: The influence of climate on the tectonic evolution of mountain belts, Nat. Geosci., 2, 97–104, https://doi.org/10.1038/ngeo413, 2009.
Woollings, T., Hannachi, A., and Hoskins, B.: Variability of the North Atlantic eddy-driven jet stream, Q. J. Roy. Meteor. Soc., 136, 856–868, https://doi.org/10.1002/qj.625, 2010.
Zamanian, K., Pustovoytov, K., and Kuzyakov, Y.: Pedogenic carbonates: Forms and formation processes, Earth-Sci. Rev., 157, 1–17, https://doi.org/10.1016/j.earscirev.2016.03.003, 2016.
Zhang, R., Jiang, D., Zhang, Z., and Yu, E.: The impact of regional uplift of the Tibetan Plateau on the Asian monsoon climate, Palaeogeography, Palaeoclimatology, Palaeoecology, 417, 137–150, https://doi.org/10.1016/j.palaeo.2014.10.030, 2015.
Zubiate, L., McDermott, F., Sweeney, C., and O'Malley, M.: Spatial variability in winter NAO–wind speed relationships in western Europe linked to concomitant states of the East Atlantic and Scandinavian patterns, Q. J. Roy. Meteor. Soc., 143, 552–562, https://doi.org/10.1002/qj.2943, 2017.