the Creative Commons Attribution 4.0 License.
the Creative Commons Attribution 4.0 License.
 | 13 Apr 2022
Impact of bioenergy crop expansion on climate–carbon cycle feedbacks in overshoot scenarios
Irina Melnikova
Olivier Boucher
Patricia Cadule
Katsumasa Tanaka
Thomas Gasser
Tomohiro Hajima
Yann Quilcaille
Hideo Shiogama
Roland Séférian
Kaoru Tachiiri
Nicolas Vuichard
Tokuta Yokohata
Philippe Ciais
Stringent mitigation pathways frame the deployment of second-generation bioenergy crops combined with carbon capture and storage (CCS) to generate negative CO2 emissions. This bioenergy with CCS (BECCS) technology facilitates the achievement of the long-term temperature goal of the Paris Agreement. Here, we use five state-of-the-art Earth system models (ESMs) to explore the consequences of large-scale BECCS deployment on the climate–carbon cycle feedbacks under the CMIP6 SSP5-3.4-OS overshoot scenario keeping in mind that all these models use generic crop vegetation to simulate BECCS. First, we evaluate the land cover representation by ESMs and highlight the inconsistencies that emerge during translation of the data from integrated assessment models (IAMs) that are used to develop the scenario. Second, we evaluate the land-use change (LUC) emissions of ESMs against bookkeeping models. Finally, we show that an extensive cropland expansion for BECCS causes ecosystem carbon loss that drives the acceleration of carbon turnover and affects the CO2 fertilization effect- and climate-change-driven land carbon uptake. Over the 2000–2100 period, the LUC for BECCS leads to an offset of the CO2 fertilization effect-driven carbon uptake by 12.2 % and amplifies the climate-change-driven carbon loss by 14.6 %. A human choice on land area allocation for energy crops should take into account not only the potential amount of the bioenergy yield but also the LUC emissions, and the associated loss of future potential change in the carbon uptake. The dependency of the land carbon uptake on LUC is strong in the SSP5-3.4-OS scenario, but it also affects other Shared Socioeconomic Pathway (SSP) scenarios and should be taken into account by the IAM teams. Future studies should further investigate the trade-offs between the carbon gains from the bioenergy yield and losses from the reduced CO2 fertilization effect-driven carbon uptake where BECCS is applied.
- Article
(5305 KB) - Full-text XML
-
Supplement
(693 KB) - BibTeX
- EndNote


All stringent future socio-economic mitigation scenarios have negative emissions that rely on carbon dioxide removal (CDR) technologies (Fuss et al., 2021; Rogelj et al., 2018). CDR is important especially in overshoot scenarios, in which temperature temporarily exceeds the given target, e.g., the Paris Agreement temperature target, before ramping down as CO2 is withdrawn artificially from the atmosphere (Jones et al., 2016a; Keller et al., 2018; Tanaka et al., 2021).
Bioenergy with carbon capture and storage (BECCS) is one of the most cost-effective CDR technologies (Jones and Albanito, 2020; Babin et al., 2021). In BECCS, atmospheric CO2 is captured from biomass growth, and the harvested biomass is then converted into bioenergy or directly combusted and a fraction of the carbon contained in the CO2 produced is recuperated and is stored in geological reservoirs without being released back to the atmosphere (Canadell and Schulze, 2014). BECCS is a nascent CDR technology that has not been proven at large spatial scales. Its potential advantages include technical feasibility and a relatively low discounted cost in future decades that allows spreading mitigation efforts over a longer period (Anderson and Peters, 2016; Dooley et al., 2018).
The limitations of BECCS are the requirement of potentially large land areas, a loss of biodiversity, and the need for extra water and nutrients (Heck et al., 2018; Séférian et al., 2018; Li et al., 2021). Besides, BECCS may lead to a large amount of carbon emissions from land-use change (LUC), when bioenergy crops are grown over high-carbon content ecosystems such as grassland and forest (Clair et al., 2008; Gibbs et al., 2008; Schueler et al., 2013; Smith et al., 2016; Harper et al., 2018; Whitaker et al., 2018). The LUC emissions released due to land conversion to bioenergy crops include immediate (direct) greenhouse gas (GHG) emissions associated with the destruction of biomass and slash during LUC but also delayed (indirect) emissions from the decay of stumps and soil carbon. These emissions are termed as “carbon debt” (Clair et al., 2008; Fargione et al., 2008; Gibbs et al., 2008; Krause et al., 2018) because for BECCS to be carbon neutral, this loss of carbon must be paid back by several cycles of BECCS harvest followed by carbon geological storage, assumed to substitute with fossil carbon emissions. Using low-productivity marginal or degraded lands for the deployment of second-generation bioenergy crops (such as Miscanthus or switchgrass) reduces the carbon debt because such lands have less carbon to lose. Further, soil carbon sequestration, in the long run, may even be achieved with BECCS if non-harvested residues of BECCS crops exceed the carbon input to the soil of the native ecosystems they substitute (Campbell et al., 2008; Gibbs et al., 2008; Mohr and Raman, 2013; Whitaker et al., 2018).
The issue with putting second-generation bioenergy crops in low-productivity lands is a need to invest large areas of land (Jones et al., 2016a; Smith et al., 2016). Currently, some land ecosystems act as a carbon sink primarily driven by the CO2 fertilization effect on photosynthesis and the carbon turnover in ecosystems. As croplands, unlike other ecosystems, have limited potential to store additional carbon because the biomass is harvested regularly, and as the new croplands have a lower soil carbon stock with a short turnover time for soil carbon, the large-scale BECCS deployment must affect the land carbon uptake, although this has not been specifically looked at in Earth system model (ESM) simulation results. No study to date has estimated the effects of BECCS deployment on the terrestrial carbon cycle under an overshoot scenario.
In this study, we estimate the impact of large-scale BECCS deployment on the carbon–climate feedbacks under the Shared Socioeconomic Pathway (SSP) overshoot scenario named SSP5-3.4-OS that includes mitigation policies via an increase in the land area covered by second-generation bioenergy crops for CDR (Hurtt et al., 2020). We use simulations from five Coupled Model Intercomparison Project 6 (CMIP6) ESMs to estimate LUC impacts on the changes in land carbon uptake and carbon–climate feedbacks.
2.1 SSP5-3.4-OS scenario
The SSP5-3.4-OS follows the high-emission SSP5-8.5 scenario and branches from it in 2040 when aggressive mitigation policies are implemented (O'Neill et al., 2016; Meinshausen et al., 2020). The delayed mitigation leads to an overshoot of the Paris Agreement 2 ∘C temperature limit. In addition to a decline in fossil fuel emissions, mitigation efforts after 2040 include the expansion of second-generation bioenergy crops (for BECCS) at the cost mainly of pasture lands (Hurtt et al., 2020). There is no deforestation assumed after 2010, in order to preserve the areas with high carbon content. Second-generation bioenergy crops account for most of the new cropland areas deployed after 2040.
2.2 CMIP6 ESMs
We use five CMIP6 ESMs that simulate the SSP5-3.4-OS (Table 1). In addition to fully coupled simulations (COU), biogeochemically (BGC) coupled simulations, where only changes in the atmospheric CO2 concentration, and not the temperature, affect the carbon–cycle processes, are also provided as part of the Coupled Climate–Carbon Cycle Model Intercomparison Project (C4MIP) (Jones et al., 2016b). The combination of COU and BGC simulations allows us to study carbon–climate feedbacks. The BGC simulation outputs indicate the changes in the carbon fluxes driven by the CO2 fertilization effect; the difference between COU and BGC simulations indicates the changes in the carbon fluxes driven by climate change.
Table 1Major characteristics of the Earth system models.

∗ DOIs of simulations by each ESM are provided in Table S1.
The LUC emissions in the ESMs can be estimated as the difference in net biome production (NBP) between simulations with and without land-use change that is between the “historical” and “hist-noLu” simulations for the historical period. However, simulation pairs for future scenarios such as SSP5-3.4-OS are not usually available. The “fLuc” (net carbon mass flux into the atmosphere due to LUC) variable provided by some ESMs enables an alternative way to incompletely quantify direct LUC emissions that include deforestation (biomass loss during deforestation), wood harvest, and the release of CO2 by harvested wood products, but they exclude forest regrowth and legacy soil carbon decay or gains. Three models, IPSL-CM6A-LR, CNRM-ESM2-1, and UKESM1-0-LL under consideration, provide the variable “fLuc” (Table 1).
Gridded CMIP6 data, with the exception of the “fLuc” variable, were adjusted by subtracting the long-term pre-industrial linear trend from the control (piControl) experiment at a grid level. We used the anomalies relative to the branching year values (indicated in Table S1 in the Supplement) for changes in carbon pools and long-term mean piControl values for changes in carbon fluxes.
2.3 Methodology
ESMs do not provide necessary outputs to diagnose the specific carbon fluxes generated from the transitions to bioenergy crops: (1) they do not treat energy crops explicitly but rather use a generic “crop” vegetation type, itself being a grass with a higher photosynthesis rate in some models, (2) crops only cover a fraction (tile) of a model grid box, and (3) the soil carbon pool is usually not split into tiles for each vegetation type in land surface models. Hence there is no perfect way to diagnose such fluxes. We pragmatically decompose the global changes in land carbon uptake to the contributions that are LUC- and noLUC-induced by using three different approaches described below.
In the “fLuc” approach (1), we exploit the “fLuc” variable provided by most models in CMIP6.
The global carbon flux, NBP that includes changes in ecosystems both with LUC and noLUC effects, cumulated over time, approximates the changes in the land carbon pool. Thus, cumulative NBP + fLuc (because NBP and fLuc have opposite sign conventions with NBP positive sink to land) approximates the changes in the land carbon pool of noLUC ecosystems.
In the “cropland threshold” approach (2), we divide the global land area into energy-crop-concentrated and no-energy-crop (not energy-crop-concentrated) grid cells by taking into account their evolution after 2015. Hurtt et al. (2020) reported that after 2040, cropland areas expanded “mainly due to large-scale deployment of second-generation bioenergy crops”. We carry out a sensitivity study (Appendix A) to label the given grid cell as crop-concentrated if the cropland fraction of the grid cell is larger than a given threshold. In the sensitivity analysis, we examine a range of post-2015 cropland fraction thresholds of the grid box area and select the (ESM-specific) thresholds that best approximate the total cropland area change in 2015–2100 diagnosed by each ESM.
Under this approach, the treatment of LUC and noLUC lands and the attribution of the LUC effects on the carbon uptake that are relevant to BECCS are both spatially explicit. The disadvantage of this approach is that by sampling an arbitrary fraction of crop-concentrated grid cells, we inevitably omit some carbon changes in cropland or encroach carbon belonging to non-crop vegetation.
In the “two simulations” approach (3), we performed additional SSP5-3.4-OS scenario simulations by IPSL-CM6A-LR and MIROC-ES2L. In addition to standard SSP5-3.4-OS and SSP5-3.4-OS-BGC simulations, we performed simulations in which land use is held constant corresponding to the 1850 usage (SSP5-3.4-OS-noLUC1850 and SSP5-3.4-OS-noLUC1850-BGC). In addition, using IPSL-CM6A-LR, we performed simulations with 2040 land cover usage (SSP5-3.4-OS-noLUC2040 and SSP5-3.4-OS-noLUC2040-BGC). The difference in NBP between simulations with and without LUC indicates LUC emissions, which are dominated by bioenergy crops area expansion after 2040. Unlike in approaches (1) and (2), the term LUC here incorporates a carbon source called the “loss of additional sink capacity” (LASC) relative to the reference years 1850 and 2040 (Gasser and Ciais, 2013; Pongratz et al., 2014). LASC is a change in carbon flux, or a foregone sink, in response to environmental changes on managed land compared to potential natural vegetation. The approach (3) accounts for the indirect LUC emissions while the approaches (1) and (2) do not.
The SSP5-3.4-OS is a concentration-driven scenario based on the implementation of SSP5 in the REMIND-MAgPIE integrated assessment model (IAM) (Kriegler et al., 2017; Meinshausen et al., 2020). Bauer et al. (2017), Popp et al. (2017), and Riahi et al. (2017) provided additional details on the changes in energy and land use. Hurtt et al. (2020) provided the changes in land use in a coherent gridded format required for ESMs in the Harmonization of Global Land-Use Change and Management version 2 (LUH2) project. In LUH2, the historical data (up to the year 2014) based on the History of the Global Environment database (HYDE) and future scenarios (2015–2300) based on IAM are harmonized to minimize the differences between the end of historical reconstruction and IAM initial conditions (Hurtt et al., 2020). The harmonization process, however, is expected to result in some mismatches between LUH2 and the IAM during the early stage of the post-2014 period. First, we check the consistency of the global and regional cropland and other land-state areas reported by REMIND-MAgPIE, LUH2, and CMIP6 ESMs. Second, we evaluate global and regional historical LUC estimates by CMIP6 ESMs against three bookkeeping approaches.
3.1 Consistency of cropland area between REMIND-MAgPIE, LUH2, and ESMs
Under the SSP5-3.4-OS pathway, the cropland area increases by 8.1×10⁶ km2 (∼50 %) from the 2010 level in the 21st century to 2100 (Hurtt et al., 2020). The global cropland area modeled by REMIND-MAgPIE and downscaled by LUH2 increases due to the expansion of second-generation bioenergy crops. The global cropland areas by REMIND-MAgPIE and LUH2 are largely consistent with a slightly larger area of crops by REMIND-MAgPIE till the 2050s (reaching 0.6×10⁶ km2 in the year 2050) and a larger area of crops by LUH2 in 2060–2090s (Fig. 1a). Unlike the REMIND-MAgPIE, LUH2 simulates a slight reduction of forest area (by 1.3×10⁶ km2 in 2100 from 2010 level). The global cropland area in LUH2 is less than in REMIND-MAgPIE by 0.3×10⁶ km2 in 2015, and larger by 2.9×10⁶ km2 in 2060 that is 14 % of the total cropland area of 20.7×10⁶ km2 by LUH2 in 2060 (and corresponds to a 43.4 % increase from the 2015 level) and may cause additional uncertainty in estimates of the BECCS area and LUC. Further, ESMs implement the global and regional gridded cropland fractions following LUH2 and using their own land cover map (Fig. 1b), with an exception of UKESM1-0-LL that reports an evolution of the global cropland area smaller than those of other ESMs. This deviation of UKESM1-0-LL may occur because of its specifications in the treatment of croplands and the model's dry bias (precipitation deficit) in India and the Sahel (Sellar et al., 2019). While the model uses the LUH2 data to prescribe an area available for crops to grow in, this area is covered by the crop plant functional types (PFTs) only if the model's climate is suitable for the grass PFTs, otherwise, the area remains bare soil.

Figure 1Time series of (a) the changes in the area of croplands, pastures, and forests according to REMIND-MAgPIE and LUH2, and (b) the area of croplands in LUH2, REMIND-MAgPIE, and five CMIP6 ESMs under the SSP5-3.4-OS pathway. In panel (a), pastures and rangelands of LUH2 are treated together as pastures.
Aside from the deviations in total areas of land cover types between REMIND-MAgPIE, LUH2, and ESMs listed above, a discrepancy arises from the implementation of LUH2's land cover types to the ESM's plant functional types (PFTs). Nevertheless, most CMIP6 ESMs produce cropland areas consistent with LUH2. However, the other vegetation classes of LUH2 (e.g., forested lands, non-forested lands, pastures) do not match the PFTs of ESMs because most ESMs decided to use their own land cover map rather than using the LUH2 one for these ecosystems. First, spatial distributions of vegetation classes are tightly associated with climate and biogeochemical processes, and thus, the replacement of the vegetation covers in ESMs would lead to large changes in the model performances. Second, some models that include dynamic vegetation, like UKESM1-0-LL, predict the vegetation distribution change, and sometimes the predicted distribution does not coincide with the one prescribed by LUH2. Besides, the pastures of REMIND-MAgPIE are translated to two land-use states in LUH2: pastures and rangelands. While they are treated predominantly as low-productivity areas in REMIND-MAgPIE, this may not be a case in ESMs, where pastures and rangelands may correspond to grasslands and perhaps to shrublands (if this land cover exists in an ESM). Some ESMs do not distinguish pastures and rangelands because of the ambiguity in their definitions. Likewise, the SSP5-3.4-OS scenario involves large-scale second-generation bioenergy crops whose benefit is the capability to grow in so-called “marginal” lands (Krause et al., 2018). The ambiguity and inconsistency in the definition of land-use and land-cover tiles between IAM, LUH2, and ESMs may have implications for the interpretation of the scenario.
We shed light on an issue of inconsistency when translating LUC from IAMs into LUH2 and, then, into ESMs. Overall, implementation of the LUC scenario of REMIND-MAgPIE to first LUH2 and then ESMs leads to a consistency loss of simulated scenario during the harmonization process. Further, the land cover representation in ESMs is subjective and different from the IAM and LUH2 mainly because of ambiguity in the correspondence between land-use and vegetation type definitions. This problem requires thorough attention, especially in ESM and IAM intercomparison studies.
3.2 Evaluation of land-use change emissions
The global and regional LUC emissions estimated by ESMs were evaluated against three bookkeeping models for the historical period, namely BLUE (Hansis et al., 2015), HN2017 (Houghton and Nassikas, 2017), and OSCAR (Gasser et al., 2020a). The models differ in the spatial units (spatially explicit, country level, region level), parametrization, and process representations (Friedlingstein et al., 2020; Gasser et al., 2020a). Unlike other bookkeeping models, OSCAR also reported LASC in LUC estimates but the utilized version did not include peat emissions.
Unlike the difference in NBP between simulations with and without LUC, the “fLuc” variable accounts only for the direct LUC emissions and does not account for all the fluxes reported by bookkeeping models, e.g., forest regrowth and slash and soil organic matter decay, as well as for shifting cultivation and degradation (Houghton and Nassikas, 2017). Thus, its values are expected to be lower. We use an average of multiple realizations when provided by the model teams (details in Table S1). The evaluation targets estimating LUC emissions in “fLuc” and “two simulations” approaches.
We found that ESMs tend to estimate lower global LUC emissions than bookkeeping models by both “fLuc” variable and “two simulations” approaches (Fig. 2). This is remarkable in the three tropical regions that have dominated global LUC emissions since the 1960s, and particularly South and Southeast Asia (Fig. S1 in the Supplement). In 1960–2014, on average, bookkeeping models estimate that three tropical regions account for 56.8 %±2.3 % of global LUC emissions, while ESMs estimate that they account for 35 %±10 % based on simulations with and without LUC and 40 %±15 % based on the “fLUC” variable.
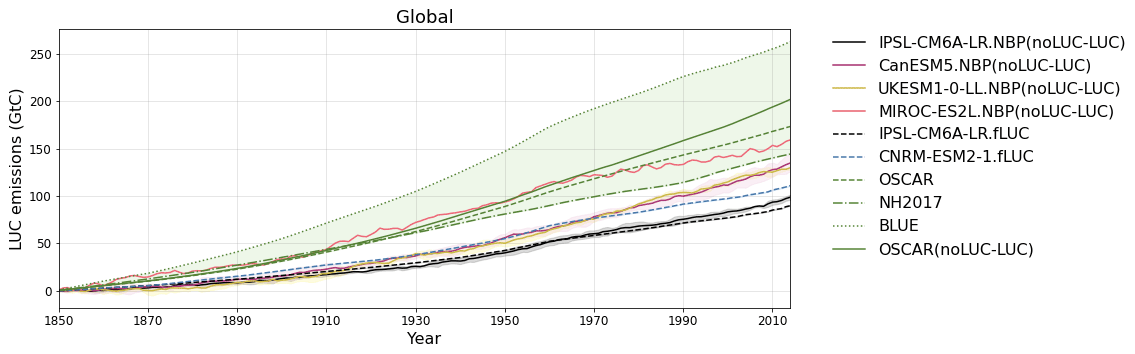
Figure 2Evaluation of cumulative global LUC emissions by ESMs against three bookkeeping models. LUC emissions are defined by two methods: (1) the difference in NBP between simulations with and without LUC (solid lines) and (2) the “fLuc” variable provided in CMIP6 (dashed lines). The estimates of the bookkeeping approach using OSCAR are shown for cases with (noLUC-LUC) and without LASC. The range of bookkeeping models is shaded green.
LUC emission estimates by MIROC-ES2L (for which only LUC emissions derived from simulations with and without LUC were available) are the most consistent with the estimates of bookkeeping models among considered ESMs (see also Liddicoat et al., 2021). We excluded the estimates of LUC emissions by CNRM-ESM2-1 based on simulations with and without LUC and by UKESM1-0-LL based on “fLuc” from the analysis. CNRM-ESM2-1 estimates much lower LUC emissions derived from simulations with and without LUC than other ESMs, possibly because the CMIP6 version of the model does not include a harvest module, i.e., croplands are modeled as natural grasslands (Séférian et al., 2019), and cropland soils continue to be loaded by harvest inputs. UKESM1-0-LL estimates implausibly low LUC emissions derived from the “fLuc” variable.
The LUC emissions estimated by the two approaches differ remarkably due to inconsistent “fLuc” definitions among models (Gasser and Ciais, 2013). We call for a clearer and more rigorous definition of this variable in future CMIPs so that model outputs can be compared on the same basis. As some examples for improvement, we suggest that model teams provide explicit detail of processes that contribute to “fLuc”, e.g., direct deforestation and wood harvest emissions, decomposition flux, as well as indirect emissions, e.g., per each PFT.
3.3 Evaluation of land-use change emissions from BECCS deployment
The increased LUC emissions to account for BECCS are a part of total carbon budget calculations in the IAM scenario. We compared LUC emissions by different approaches using ESMs with LUC of REMIND-MAgPIE (Fig. S2). While the IAMs design the scenario in a way that the benefits of BECCS exceed the carbon losses from LUC, the ability of IAM to accurately estimate LUC emissions including legacy emissions is questionable. In the SSP5-3.4-OS scenario, the REMIND-MAgPIE estimates lower LUC emission compared ESMs.
BECCS dominates negative emissions in the SSP5-3.4-OS pathway. We confirmed that BECCS is predominantly deployed in low-carbon uptake areas by comparing the changes in carbon pools and NBP globally and crop-concentrated areas (Fig. S3). Because bioenergy crops are deployed in low-carbon uptake areas and they dominate LUC emissions in the 21st century, the NBP over crop-concentrated areas derived by the “cropland threshold” approach approximates global LUC emissions. The comparison of NBP in crop-concentrated grids with the original LUC emissions of the REMIND-MAgPIE IAM scenario confirms a similar trend between IAM-based global LUC emissions and ESMs-based global temporal NBP changes in the crop-concentrated areas after 2040. The strong correlation is evident in three ESMs, namely CanESM5, UKESM1-0-LL, and MIROC-ES2L (correlation coefficient is 0.72 for the 2015–2100 period). The carbon loss in the crop-concentrated areas over the 21st century period averaged over these three ESMs reaches 37.8±30.3 Gt C. Two models, IPSL-CM6A-LR and CNRM-ESM2-1, however, do not capture the increased carbon loss after 2040 perhaps due to low estimates of LUC emissions from crop expansion (especially CNRM-ESM2-1) or overestimated uptake by no-LUC areas (Figs. 2 and S1). Besides, IPSL-CM6A-LR simulates the lowest ecosystem carbon pool, especially in soils (Arora et al., 2020) that may lead to relatively small LUC-induced carbon losses when cropland areas expand. Thus, the estimates of LUC impact on carbon–climate feedbacks from IPSL-CM6A-LR and CNRM-ESM2-1 need to be considered with the above-mentioned caveats.
4.1 Differences in LUC impact on carbon uptake estimated by three approaches
We use the estimates of the LUC impacts on global carbon uptake by IPSL-CM6A-LR and MIROC-ES2L to compare the three approaches described in Sect. 2.3. The estimates of both models and three approaches show that the LUC impacts lead to a loss of carbon fluxes (Fig. 3). The losses from LUC surpass the benefits from the CO2 fertilization effect, so that the LUC ecosystems become a carbon source to the atmosphere. The “cropland threshold”, unlike the other two approaches, separates cropland-concentrated and no-crop contributions spatially. Thus, the estimated changes in carbon uptake are areal cumulative under the “cropland threshold” approach. In the other two approaches, in contrast, the changes in carbon fluxes are calculated in each grid cell for both LUC-dominated and noLUC ecosystems, so that carbon change of these two land-use categories may partly offset each other.
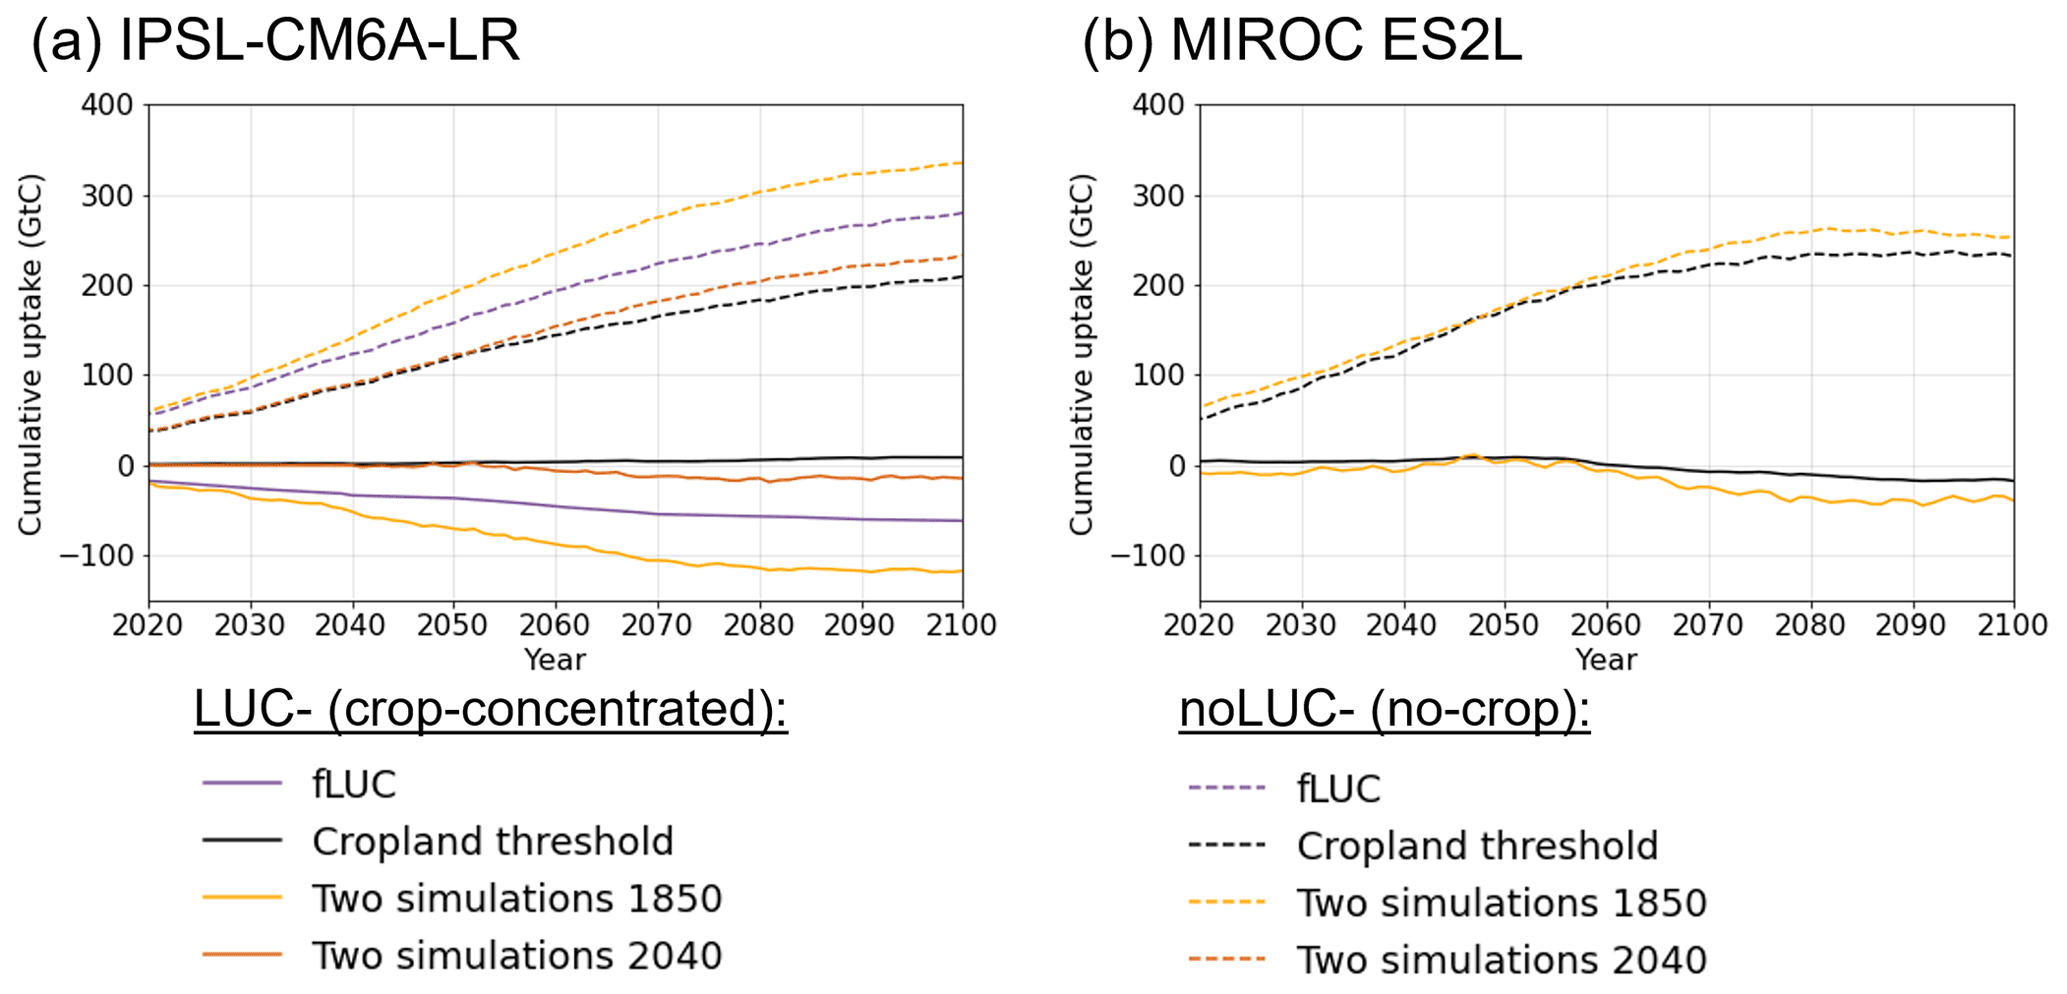
Figure 3Cumulative land carbon uptake from the year 2000 in LUC-concentrated (solid lines) and noLUC (dashed lines) ecosystems estimated by three approaches by (a) IPSL-CM6A-LR and (b) MIROC-ES2L.
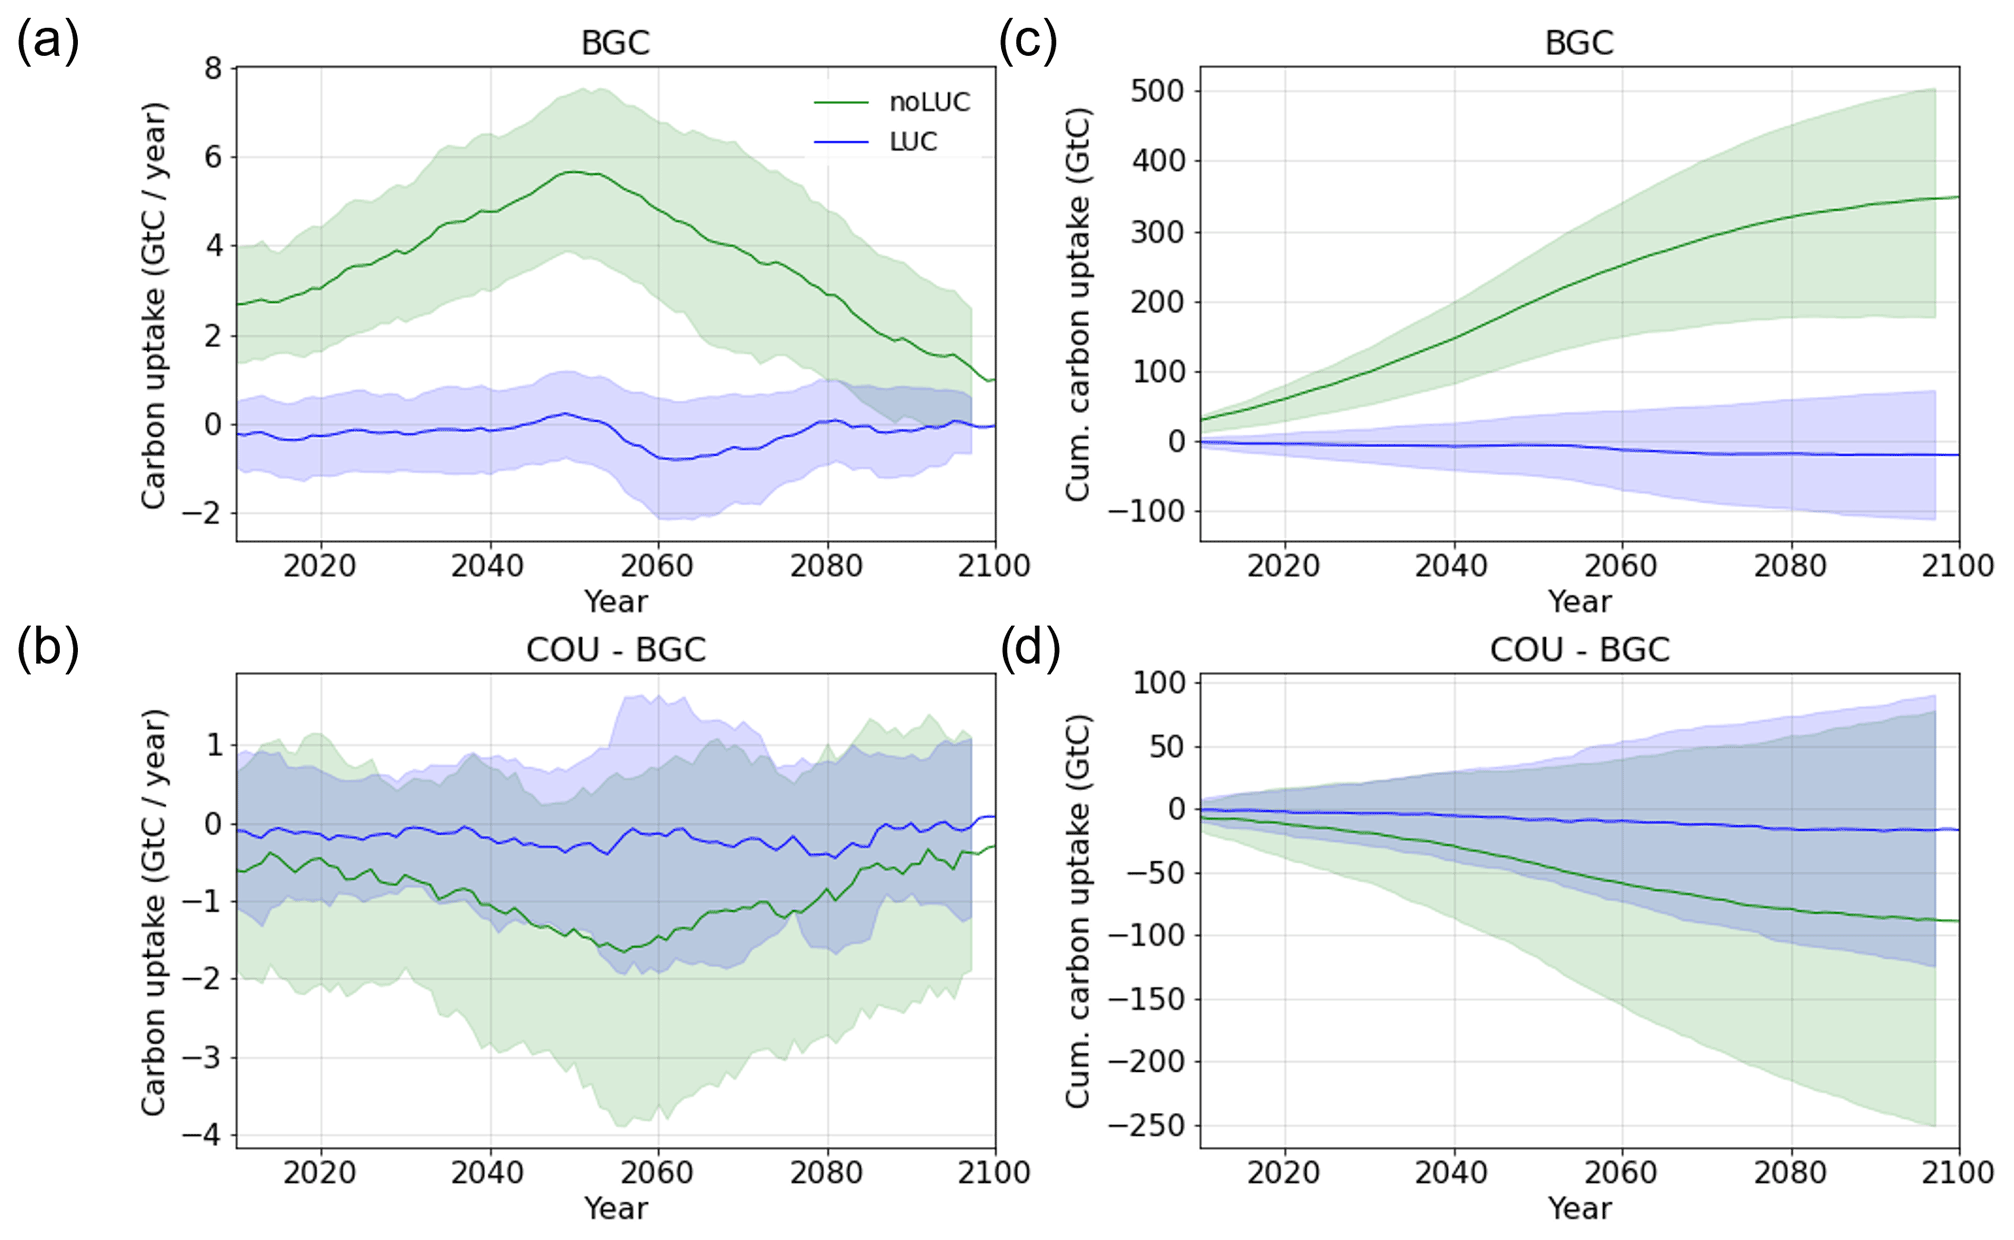
Figure 4Interannual variation of global (a, b) land carbon uptake and (c, d) cumulative carbon uptake in LUC-concentrated and noLUC ecosystems given as mean and standard deviation (shaded area) of five ESMs and three approaches. Panels (a) and (c) show BGC simulation outputs, and panels (b) and (d) show the difference in COU and BGC simulation outputs.
A larger loss is seen in “two simulations since 1850” because these simulations include LASC and legacy soil emissions (Fig. 3a). Intermediate loss is from “fLUC” because this approach includes only immediate (direct) carbon loss. Lower carbon losses correspond to the “cropland threshold” approach that also includes a carbon sink in natural ecosystems over selected grid cells and misses initial carbon loss, and to “two simulations since 2040” that miss legacy emissions of activities before 2040. The larger carbon losses in the “two simulations since 1850” than in the “two simulations since 2040” estimates also reveal the long-term effects of LUC.
In the case of IPSL-CM6A-LR, the “cropland threshold” and “two simulations since 2040” approaches produce similar estimates of LUC impact on cumulative land carbon uptake because these two methods target the changes in the carbon fluxes, particularly due to cropland expansion for BECCS in the 21st century. MIROC-ES2L that accounts for gross LUC emissions (Liddicoat et al., 2021) produces similar estimates of LUC impact by “cropland threshold” and “two simulations since 1850” approaches.
4.2 Temporal impacts of LUC on global carbon uptake
Figure 4 illustrates the attribution of global carbon fluxes to LUC (or crop-concentrated) and no-LUC (no-crop) ecosystems by five ESMs and three approaches (see Fig. S4 for the results, specific for each ESM and approach). The large-scale deployment of bioenergy crops even on low carbon-uptake areas causes a carbon loss from the ecosystem. The negative values of the carbon flux in the CO2 concentration-only simulation indicate the domination of the LUC losses over the CO2 fertilization effect-driven carbon gains in the ecosystems.
For the “cropland threshold” approach, the majority of ESM simulations, excluding IPSL-CM6A-LR and CNRM-ESM2-1 (see Sect. 3.3), agree that cropland expansion causes a decrease in global CO2 fertilization effect-driven carbon uptake, especially in crop-concentrated grids which lose carbon from LUC. Cropland expansion for BECCS may also contribute to the global climate change-driven carbon loss. However, these changes are small in the “cropland threshold” and absent in “fLUC” estimates. We speculate this occurs because the “fLuc” variable involves only direct LUC changes such as deforestation, wood harvest, and soil carbon decay. On top of it, earlier findings show that the ESMs do not realistically represent the dynamics of soil and litter carbon after LUC (Boysen et al., 2021). The LUC carbon losses for BECCS deployment cannot be overridden by the increased CO2 effects, but they contribute to the carbon losses driven by climate change. Overall, the three approaches and five ESMs demonstrate that the BECCS expansion under the SSP5-3.4-OS pathway results in 42.55±41.08 Gt C loss that corresponds to 12.2 % of noLUC CO2 fertilization-driven uptake and to an additional 13.00±12.27 Gt C loss that corresponds to 14.6 % of noLUC climate change-driven loss over the 2000–2100 period (Table S2).
4.3 Spatial variation of impacts of LUC on global carbon uptake
We investigated the spatial variation of LUC impact on the land carbon cycle using simulations with and without LUC by MIROC-ES2L and IPSL-CM6A-LR (Fig. 5). Two models show that the carbon uptake decreases in the BECCS areas due to LUC emissions. Even though the SSP5-3.4-OS scenario is designed so that BECCS utilizes low carbon areas to cause the least possible impact on the carbon sink in unmanaged lands, these BECCS areas lose their CO2 fertilization-driven carbon uptake potential but do not escape climate change-driven carbon losses. In the SSP5-3.4-OS scenario, second-generation biofuel cropland areas estimated by LUH2 reach nearly 6 % of global land (potentially vegetated) area in 2100. Assigning such vast areas to bioenergy crops – even if they correspond to low-carbon content ecosystems – affects the land carbon uptake and the global carbon cycle feedbacks. The decision on the assignment of these areas for energy crops requires assessment of both the current state of the ecosystem, e.g., the carbon content in vegetation and soil, and the future potential increase in the carbon uptake. The impact of LUC on the carbon cycle should be accounted for in developing future mitigation pathways so that the benefits of BECCS are not minimized by the carbon losses.
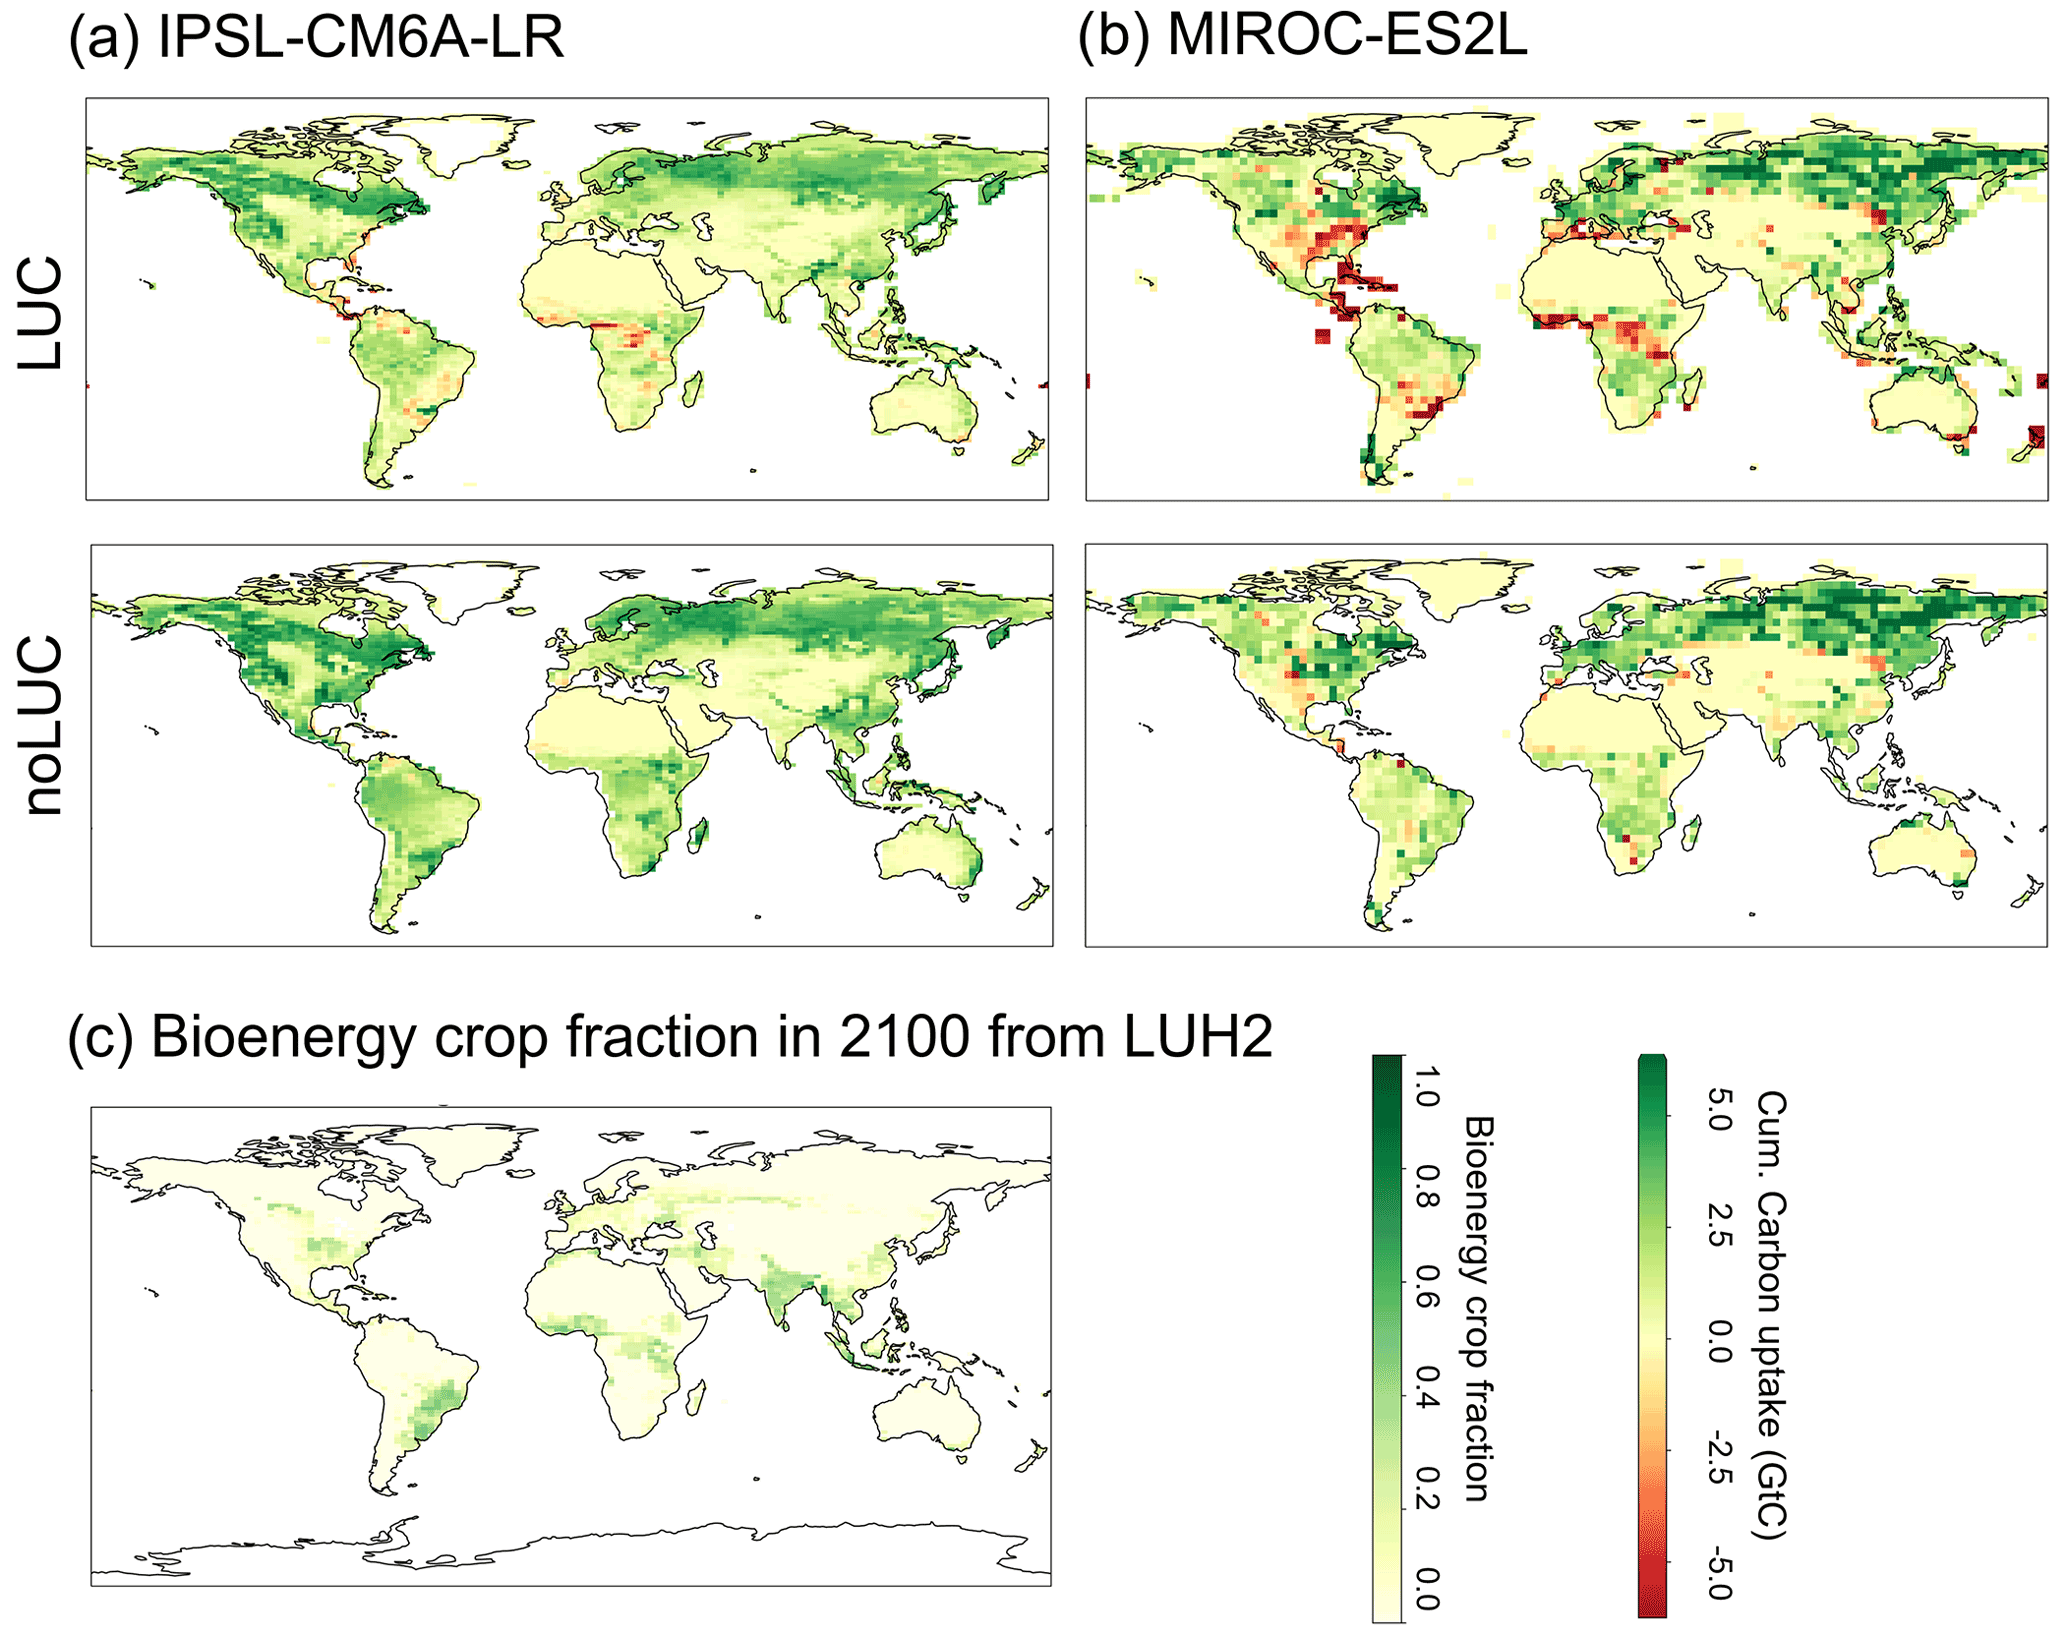
Figure 5Spatial variations of the cumulative over 2040–2100 period carbon uptake by (a) IPSL-CM6A-LR and (b) MIROC-ES2L given for the fully coupled simulations with and without LUC. The negative values indicate less sink/larger source from land to atmosphere. (c) The bioenergy crop area in 2100 from LUH2.
The CO2 fertilization effect- and climate-change-driven changes in the carbon fluxes and storages may be expressed as β and γ feedback parameters per unit changes in the global atmospheric CO2 concentration (ΔCO2) and surface air temperature (ΔT), respectively (Jones et al., 2016b; Friedlingstein et al., 2020; Zhang et al., 2021).
Here the temperature change is taken as a proxy for the response of the ecosystem carbon storage to climate change. The carbon–concentration β (Gt C ppm−1) and carbon–climate γ () feedback parameters can be estimated using BGC and COU simulation outputs (Friedlingstein et al., 2006; Gregory et al., 2009; Jones et al., 2016a; Melnikova et al., 2021; Zhang et al., 2021):
where ΔCBGC and ΔCCOU indicate the changes in the land carbon pool (or cumulative uptake) in BGC and COU simulations, respectively, and ΔCO2 and ΔT (from COU runs) indicate the changes in the global CO2 concentration and mean surface air temperature, respectively, all reported changes being relative to pre-industrial level (piControl).
The carbon cycle feedback framework is often compared between ESMs in idealized scenarios (such as 1 % CO2 increase), and the β and γ feedback parameters/metrics are assumed to be a pure response to the CO2 concentration and temperature changes. Applying this framework to non-idealized and more socially relevant scenarios provides another perspective for understanding the changes in the carbon fluxes under more realistic evolutions. Previously, Melnikova et al. (2021) applied the β and γ framework to the SSP5-3.4-OS scenario and showed an amplification of the feedback parameters after the CO2 concentration and temperature peaks due to inertia of the Earth system. Here we performed an estimation of the β and γ feedback parameters to investigate the impacts of the LUC on the behavior of the feedback parameters.
Note, in the case of the overshoot scenarios, if the CO2 concentration and temperature changes during the ramp-down period went to zero, the definitions described in Eqs. (1) and (2) would become invalid. Although because in this study, the change in CO2 concentration and the temperature never goes to zero (in the SSP5-3.4-OS before 2300), and the feedbacks parameters can safely be calculated, the limitation should be taken into account.
The land carbon uptake and the β and γ feedback parameters are affected by LUC, so that they are lower in the simulations with LUC (Fig. 6). Moreover, the difference in the β parameter estimated by IPSL-CM6A-LR in simulations with LUC and without LUC after the year 2040 suggests that even only LUC for bioenergy crop expansion affects the hysteresis behavior of the carbon cycle feedback parameters under declining CO2 concentration and temperature.
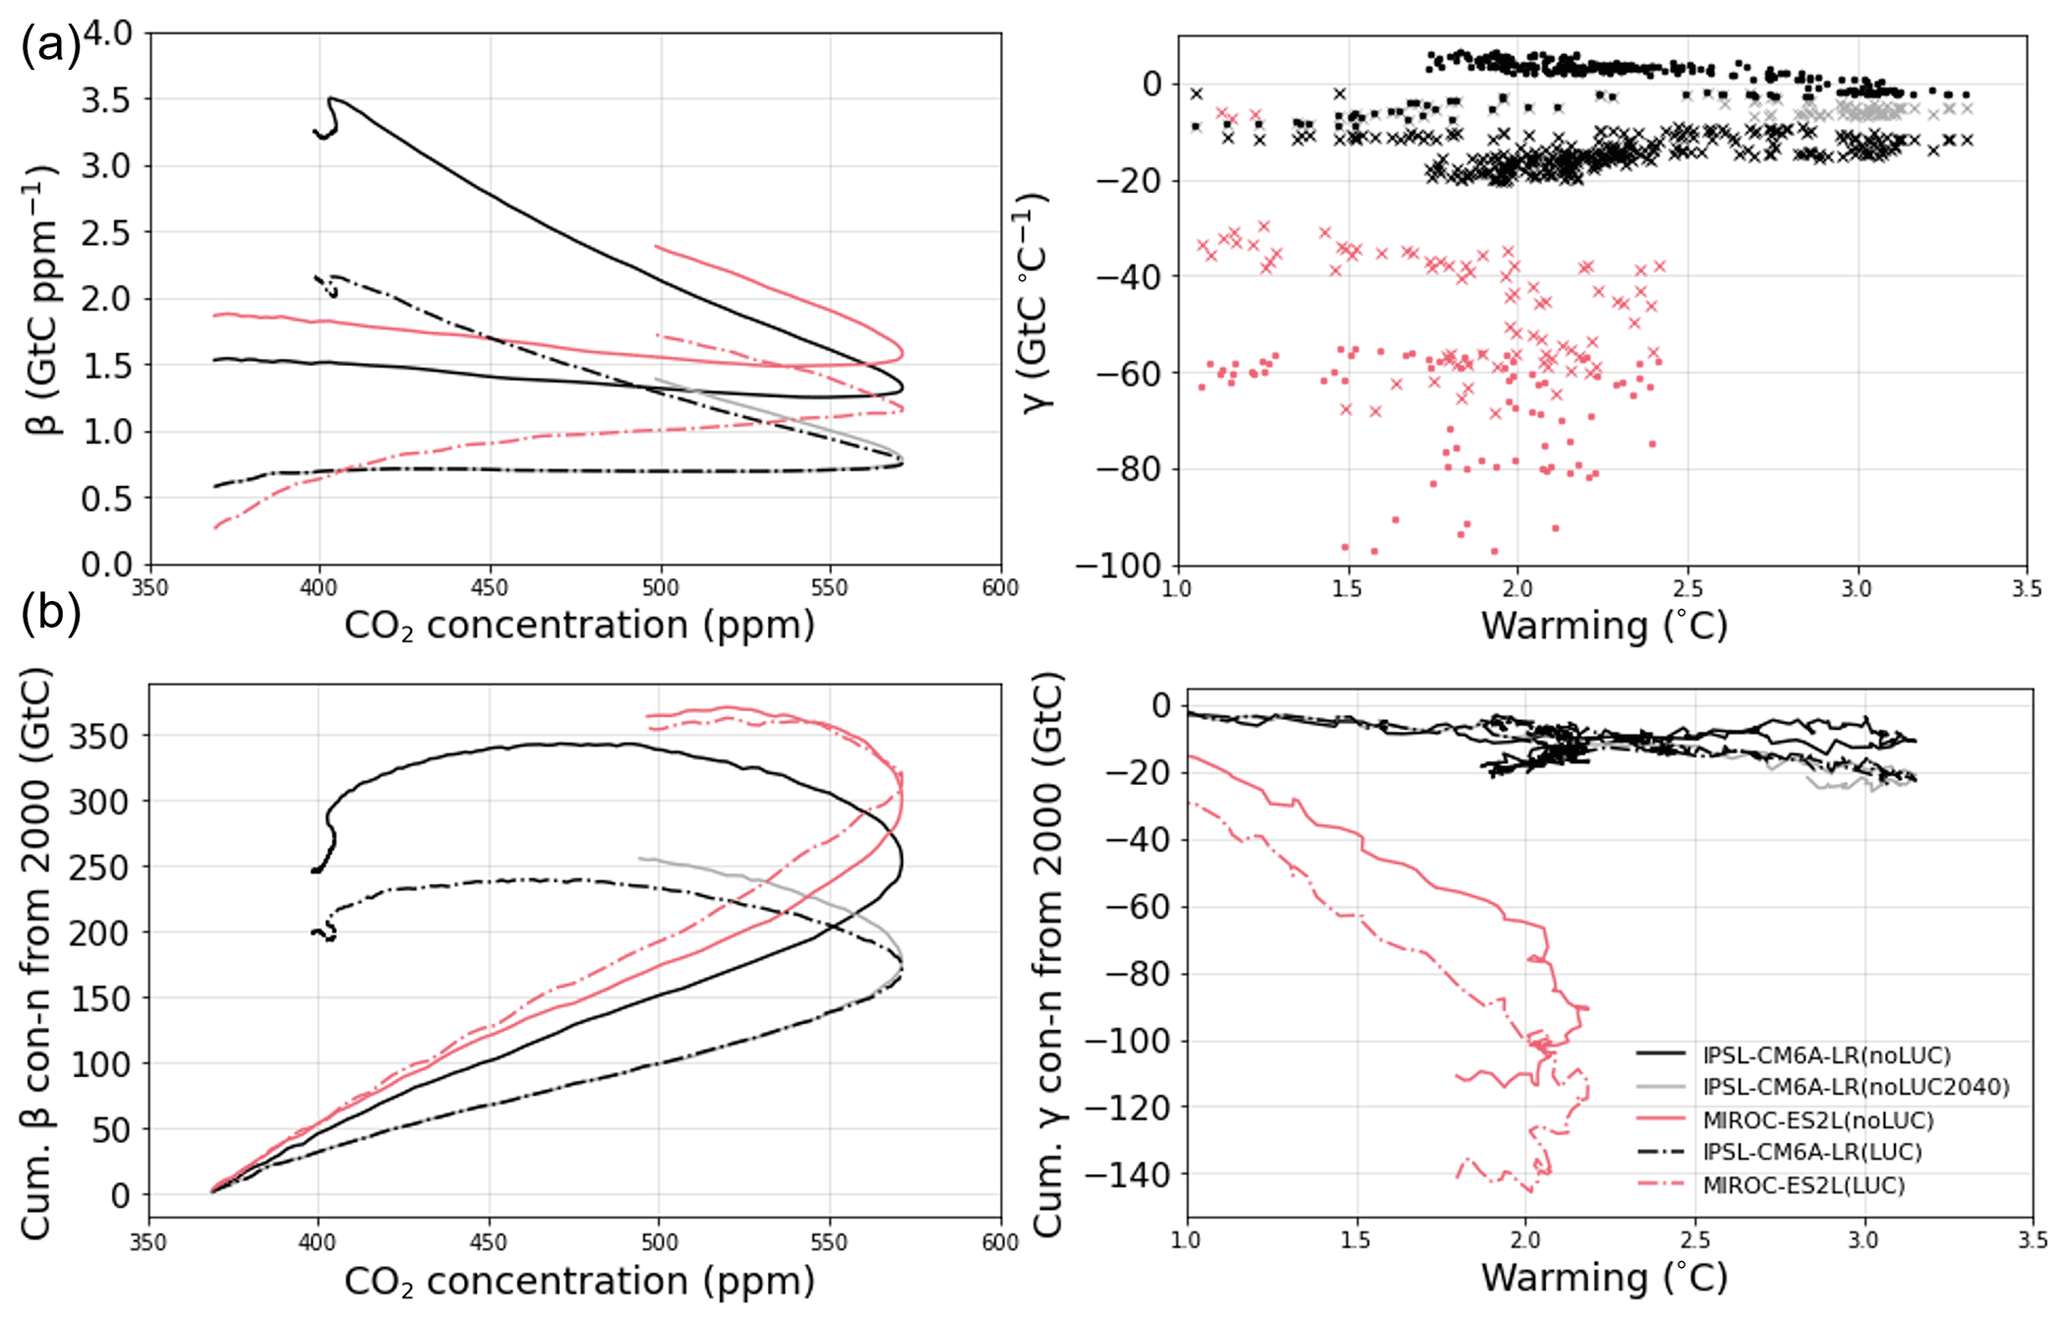
Figure 6The variation of (a) global βland (Gt C ppm−1) and γland (), and (b) cumulative over 2000–2300 (for IPSL-CM6A-LR) and over 2000–2100 (for MIROC-ES2L) β- and γ-driven land carbon uptakes with and without LUC. The changes in LUC are given as 9-year moving averages; negative value corresponds to a land sink.
To date, the LUC impacts on the carbon cycle have not been included into the β and γ feedback framework, and the LUC emissions are discussed as an anthropogenic forcing separately from the feedbacks of land ecosystems to the changed CO2 and climate. However, the β and γ parameters cannot be decoupled either from the state of the land use, or from the pre-industrial state of land cover, or from other model structural parts, leading to a value for equilibrium carbon stock. There is an interplay between land cover and the model's response to CO2 (and climate) that has been demonstrated mathematically in Gasser and Ciais (2013) and defined as LASC. Gasser et al. (2020a) quantified it as a foregone sink of about 30 Gt C over the historical period. But this value can only increase as future CO2 will be much higher than in the past.
In a broader sense, the land-cover- and land-use-associated differences in the initial conditions of ESMs simulations influence the estimates of global carbon cycle feedback parameters even under idealized pathways. The divergences in the pre-industrial land covers among ESMs lead to spatial differences in the ecosystem carbon stocks (e.g., ESM with larger forest cover has larger land carbon pool size). Furthermore, the pre-industrial levels of ecosystem carbon stock vary among models even for identical land-cover types. The estimated global β and γ feedback parameters involve these land-cover-related uncertainties. Future studies should address the issue by benchmarking the sets of idealized experiments with different types of land-cover and land-use changes.
In this study, we investigated the impacts of bioenergy crop deployment on the carbon cycle under an overshoot pathway. In the evaluation part of this study, we highlighted some inconsistencies in the land-use states and their temporal transitions between the REMIND-MAgPIE, LUH2, and ESMs. These differences arise from differences in process representations and initial conditions, as well as land-use and land-cover tiles definitions across models. The inconsistencies should be taken into account in comparative studies of IAMs and ESMs. Further work will be required to address the issue of the level of inconsistency between the IAMs, LUH2, and ESMs that should be tolerated to have confidence that ESMs and IAMs describe the same scenario.
We exploit five ESMs and three approaches to show that cropland expansion for BECCS causes a carbon loss even in low-carbon uptake lands and reduces the future potential increase in the global carbon uptake via LUC impact on the carbon stock, and the carbon–concentration and carbon–climate feedbacks. Under the SSP5-3.4-OS, the LUC emissions from BECCS deployment cause a decrease in global CO2 fertilization effect-driven carbon uptake and increase the climate change-driven carbon loss.
Our results are consistent with the IPCC special report on climate change and land (Shukla et al., 2019) and highlight the need for considering trade-offs in BECCS deployment and other land-uses but, to some extent, they go beyond this assessment by considering the implication of carbon cycle feedbacks. Our work shows that areas best suited for BECCS should also be assessed both in terms of their potential amount of the bioenergy yield and potential future impact on the carbon–climate feedbacks. Future studies need to further investigate the potential of BECCS to provide negative carbon emissions with little loss of storage from the LUC.
Neither IAMs nor ESMs provide BECCS-related LUC emissions. Separating BECCS-related emissions from all other LUC emissions is virtually impossible due to spatial heterogeneity and many complex factors that affect the bioenergy crop deployment.
ESMs do not distinguish second-generation bioenergy crops from other crops in CMIP6. Moreover, the cropland area in ESMs is defined at a sub-grid scale (i.e., on a fraction or tile of a grid box). Because land-use states (e.g., forest, crops, pastures) vary in productivity and, thus, carbon uptakes and because modeling teams do not provide NBP estimates at the sub-grid level, to estimate the area and carbon fluxes of the biofuel crops in ESMs, we assume that all croplands deployed after the 2040s are for second-generation biofuel crops (Fig. A1). We label the given grid of CMIP6 simulation outputs as crop-concentrated if the cropland fraction of the grid is larger than a given threshold derived via a sensitivity analysis (Fig. A1).

Figure A1A schematic presentation of the sensitivity study for estimating the carbon–climate feedback parameters over the energy-crop-concentrated and no-energy-crop grids.

Figure A2(a) The cropland-fraction thresholds ranging from 25 % to 45 % of the grid box area analyzed in the sensitivity study and (b) the selected (resultant) range of thresholds for identifying the energy-crop-concentrated area with the selected range for each ESM indicated in the table. Panel (c) shows the cumulative NBP of the areas corresponding to the range of cropland thresholds from 1 % to 100 % (left dark to right light color) in three periods.
We examined time-invariant cropland fraction thresholds ranging from 25 % to 45 % of the grid box area and selected a range of thresholds that best approximate the change in the total cropland area of each ESM in 2015–2100 (Fig. A2). Here we choose the fitting period of 2015–2100 because a shorter period (2040–2100) would result in a lower threshold during the 2050–2060 period with a large global cropland increase. More specifically, we selected a range of thresholds with a 1 % step so that they intersect at least once either the global cropland area estimated by ESM itself or LUH2 data set from 2015 to 2100. Although the selected ensembles of thresholds are time-invariant, the resultant cropland area increases. We find that for a later period (end of the 21st century), a higher threshold is required because both the spatial coverage (the number of grid boxes that have crops) and cropland concentration (a grid fraction of cropland) increase (Fig. A2).
We confirmed the spatial distribution of the minimum and maximum selected thresholds of energy-crop-concentrated grids against sub-grid-scale ESM and the LUH2 estimates of cropland area (Fig. A3).

Figure A3Spatial variation of (a) grid cropland fraction (b) and second-generation bioenergy cropland fraction by LUH2. Panel (c) shows the spatial variation of grid cropland fraction estimated by CMIP6 ESMs. The spatial variation of the selected (d) minimum and (e) maximum thresholds (which intersect at least once either the global cropland area estimated by ESM itself or LUH2 data set from 2015 to 2100 as shown in Fig. A1) for estimating crop-concentrated grids in 2100.
The data from the CMIP6 simulations are available from the CMIP6 archive: https://esgf-node.llnl.gov/search/cmip6 (WCRP, 2022), the LUH2 data from https://luh.umd.edu/data.shtml (UoM, 2022), and the IIASA database via https://tntcat.iiasa.ac.at/SspDb/dsd?Action=htmlpage&page=20 (IIASA, 2022). We obtained LUC emission data of bookkeeping approaches from the modeling teams and http://pure.iiasa.ac.at/id/eprint/17551/ (Gasser et al., 2020b) for OSCAR.
The supplement related to this article is available online at: https://doi.org/10.5194/esd-13-779-2022-supplement.
OB, PCi, KTan, and IM initiated the study, and all co-authors provided input into developing the study ideas. IM performed data analysis and wrote the initial draft. TH (MIROC-ES2L) and PCa (IPSL-CM6A-LR) performed additional ESM simulations. All authors contributed to writing and commenting on the paper.
At least one of the (co-)authors is a member of the editorial board of Earth System Dynamics. The peer-review process was guided by an independent editor, and the authors also have no other competing interests to declare.
Publisher's note: Copernicus Publications remains neutral with regard to jurisdictional claims in published maps and institutional affiliations.
We acknowledge the World Climate Research Programme, which, through its Working Group on Coupled Modelling, coordinated and promoted CMIP6. We thank the climate modeling groups for producing and making available their model output, the Earth System Grid Federation (ESGF) for archiving the data and providing access, and the multiple funding agencies who support CMIP6 and ESGF. We thank Richard Houghton of Woodwell Climate Research Center for providing the regional annual fluxes for LUC from HN2017, Eddy Robertson of Met Office, and Vivek Arora of Canadian Centre for Climate Modelling and Analysis for providing additional information on the LUC implementation in ESMs. The IPSL-CM6 experiments were performed using the HPC resources of TGCC under the allocation 2020-A0080107732 (project gencmip6) provided by GENCI (Grand Equipement National de Calcul Intensif). This study benefited from state assistance managed by the National Research Agency in France under the Programme d'Investissements d'Avenir under the reference ANR-19-MPGA-0008. Our study was also supported by the European Union's Horizon 2020 research and innovation programme under grant agreement number 820829 for the “Constraining uncertainty of multi-decadal climate projections (CONSTRAIN)” project, by a grant from the French Ministry of the Ecological Transition as part of the Convention on financial support for climate services. Roland Séférian and Thomas Gasser acknowledge innovation programme under grant agreement no. 101003536 (ESM2025 – Earth System Models for the Future). Roland Séférian acknowledges the European Union's Horizon 2020 research and the support of the team in charge of the CNRM-CM climate model. Supercomputing time was provided by the Météo-France/DSI supercomputing center.
This research has been supported by the Agence Nationale de la Recherche (grant no. ANR-19-MPGA-0008), Horizon 2020 (CONSTRAIN (grant no. 820829)), the Agence de la transition écologique (convention on financial support for climate services), the Ministry of Education, Culture, Sports, Science and Technology (grant no. JPMXD0717935715), and the Environmental Restoration and Conservation Agency (grant no. JPMEERF20192004).
This paper was edited by Ning Zeng and reviewed by Vivek Arora and Wang Xiaobo.
Anderson, K. and Peters, G.: The trouble with negative emissions, Science, 354, 182, https://doi.org/10.1126/science.aah4567, 2016.
Arora, V. K., Katavouta, A., Williams, R. G., Jones, C. D., Brovkin, V., Friedlingstein, P., Schwinger, J., Bopp, L., Boucher, O., Cadule, P., Chamberlain, M. A., Christian, J. R., Delire, C., Fisher, R. A., Hajima, T., Ilyina, T., Joetzjer, E., Kawamiya, M., Koven, C. D., Krasting, J. P., Law, R. M., Lawrence, D. M., Lenton, A., Lindsay, K., Pongratz, J., Raddatz, T., Séférian, R., Tachiiri, K., Tjiputra, J. F., Wiltshire, A., Wu, T., and Ziehn, T.: Carbon–concentration and carbon–climate feedbacks in CMIP6 models and their comparison to CMIP5 models, Biogeosciences, 17, 4173–4222, https://doi.org/10.5194/bg-17-4173-2020, 2020.
Babin, A., Vaneeckhaute, C., and Iliuta, M. C.: Potential and challenges of bioenergy with carbon capture and storage as a carbon-negative energy source: A review, Biomass Bioenerg., 146, 105968, https://doi.org/10.1016/j.biombioe.2021.105968, 2021.
Bauer, N., Calvin, K., Emmerling, J., Fricko, O., Fujimori, S., Hilaire, J., Eom, J., Krey, V., Kriegler, E., Mouratiadou, I., de Boer, H. S., van den Berg, M., Carrara, S., Daioglou, V., Drouet, L., Edmonds, J. E., Gernaat, D., Havlik, P., Johnson, N., Klein, D., Kyle, P., Marangoni, G., Masui, T., Pietzcker, R. C., Strubegger, M., Wise, M., Riahi, K., and van Vuuren, D. P.: Shared Socio-Economic Pathways of the Energy Sector – Quantifying the Narratives, Global Environ. Chang., 42, 316–330, https://doi.org/10.1016/j.gloenvcha.2016.07.006, 2017.
Boucher, O., Servonnat, J., Albright, A. L., Aumont, O., Balkanski, Y., Bastrikov, V., Bekki, S., Bonnet, R., Bony, S., Bopp, L., Braconnot, P., Brockmann, P., Cadule, P., Caubel, A., Cheruy, F., Codron, F., Cozic, A., Cugnet, D., D'Andrea, F., Davini, P., de Lavergne, C., Denvil, S., Deshayes, J., Devilliers, M., Ducharne, A., Dufresne, J.-L., Dupont, E., Éthé, C., Fairhead, L., Falletti, L., Flavoni, S., Foujols, M.-A., Gardoll, S., Gastineau, G., Ghattas, J., Grandpeix, J.-Y., Guenet, B., Guez, L. E., Guilyardi, E., Guimberteau, M., Hauglustaine, D., Hourdin, F., Idelkadi, A., Joussaume, S., Kageyama, M., Khodri, M., Krinner, G., Lebas, N., Levavasseur, G., Lévy, C., Li, L., Lott, F., Lurton, T., Luyssaert, S., Madec, G., Madeleine, J.-B., Maignan, F., Marchand, M., Marti, O., Mellul, L., Meurdesoif, Y., Mignot, J., Musat, I., Ottlé, C., Peylin, P., Planton, Y., Polcher, J., Rio, C., Rochetin, N., Rousset, C., Sepulchre, P., Sima, A., Swingedouw, D., Thiéblemont, R., Traore, A. K., Vancoppenolle, M., Vial, J., Vialard, J., Viovy, N., and Vuichard, N.: Presentation and Evaluation of the IPSL-CM6A-LR Climate Model, J. Adv. Model. Earth Sy., 12, e2019MS002010, https://doi.org/10.1029/2019MS002010, 2020.
Boysen, L. R., Brovkin, V., Wårlind, D., Peano, D., Lansø, A. S., Delire, C., Burke, E., Poeplau, C., and Don, A.: Evaluation of soil carbon dynamics after forest cover change in CMIP6 land models using chronosequences, Environ. Res. Lett., 16, 074030, https://doi.org/10.1088/1748-9326/ac0be1, 2021.
Campbell, J. E., Lobell, D. B., Genova, R. C., and Field, C. B.: The global potential of bioenergy on abandoned agriculture lands, Environ. Sci. Technol., 42, 5791–5794, https://doi.org/10.1021/es800052w, 2008.
Canadell, J. G. and Schulze, E. D.: Global potential of biospheric carbon management for climate mitigation, Nat. Commun., 5, 1–12, https://doi.org/10.1038/ncomms6282, 2014.
Clair, S. S., Hillier, J., and Smith, P.: Estimating the pre-harvest greenhouse gas costs of energy crop production, Biomass Bioenerg., 32, 442–452, https://doi.org/10.1016/j.biombioe.2007.11.001, 2008.
Dooley, K., Christoff, P., and Nicholas., K. A.: Co-Producing Climate Policy and Negative Emissions: Trade-Offs for Sustainable Land-Use, Global Sustainabil., 1, e3, https://doi.org/10.1017/sus.2018.6, 2018.
Fargione, J., Hill, J., Tilman, D., Polasky, S., and Hawthorne, P.: Land Clearing and the Biofuel Carbon Debt, Science, 319, 1235, https://doi.org/10.1126/science.1152747, 2008.
Friedlingstein, P., Cox, P., Betts, R., Bopp, L., von Bloh, W., Brovkin, V., Cadule, P., Doney, S., Eby, M., Fung, I., Bala, G., John, J., Jones, C., Joos, F., Kato, T., Kawamiya, M., Knorr, W., Lindsay, K., Matthews, H. D., Raddatz, T., Rayner, P., Reick, C., Roeckner, E., Schnitzler, K.-G., Schnur, R., Strassmann, K., Weaver, A. J., Yoshikawa, C., and Zeng, N.: Climate–Carbon Cycle Feedback Analysis: Results from the C4MIP Model Intercomparison, J. Climate, 19, 3337–3353, https://doi.org/10.1175/JCLI3800.1, 2006.
Friedlingstein, P., O'Sullivan, M., Jones, M. W., Andrew, R. M., Hauck, J., Olsen, A., Peters, G. P., Peters, W., Pongratz, J., Sitch, S., Le Quéré, C., Canadell, J. G., Ciais, P., Jackson, R. B., Alin, S., Aragão, L. E. O. C., Arneth, A., Arora, V., Bates, N. R., Becker, M., Benoit-Cattin, A., Bittig, H. C., Bopp, L., Bultan, S., Chandra, N., Chevallier, F., Chini, L. P., Evans, W., Florentie, L., Forster, P. M., Gasser, T., Gehlen, M., Gilfillan, D., Gkritzalis, T., Gregor, L., Gruber, N., Harris, I., Hartung, K., Haverd, V., Houghton, R. A., Ilyina, T., Jain, A. K., Joetzjer, E., Kadono, K., Kato, E., Kitidis, V., Korsbakken, J. I., Landschützer, P., Lefèvre, N., Lenton, A., Lienert, S., Liu, Z., Lombardozzi, D., Marland, G., Metzl, N., Munro, D. R., Nabel, J. E. M. S., Nakaoka, S.-I., Niwa, Y., O'Brien, K., Ono, T., Palmer, P. I., Pierrot, D., Poulter, B., Resplandy, L., Robertson, E., Rödenbeck, C., Schwinger, J., Séférian, R., Skjelvan, I., Smith, A. J. P., Sutton, A. J., Tanhua, T., Tans, P. P., Tian, H., Tilbrook, B., van der Werf, G., Vuichard, N., Walker, A. P., Wanninkhof, R., Watson, A. J., Willis, D., Wiltshire, A. J., Yuan, W., Yue, X., and Zaehle, S.: Global Carbon Budget 2020, Earth Syst. Sci. Data, 12, 3269–3340, https://doi.org/10.5194/essd-12-3269-2020, 2020.
Fuss, S., Canadell, J. G., Peters, G. P., Tavoni, M., Andrew, R. M., Ciais, P., Jackson, R. B., Jones, C. D., Kraxner, F., Nakicenovic, N., and Le Quéré, C.: Betting on negative emissions, Nat. Clim. Change, 4, 850–853, https://doi.org/10.1038/nclimate2392, 2021.
Gasser, T. and Ciais, P.: A theoretical framework for the net land-to-atmosphere CO2 flux and its implications in the definition of “emissions from land-use change”, Earth Syst. Dynam., 4, 171–186, https://doi.org/10.5194/esd-4-171-2013, 2013.
Gasser, T., Crepin, L., Quilcaille, Y., Houghton, R. A., Ciais, P., and Obersteiner, M.: Historical CO2 emissions from land use and land cover change and their uncertainty, Biogeosciences, 17, 4075–4101, https://doi.org/10.5194/bg-17-4075-2020, 2020a.
Gasser, T., Crepin, L., Quilcaille, Y., Houghton, R. A., Ciais, P., and Obersteiner, M.: Historical CO2 emissions from land-use and land-cover change and their uncertainty, IIASA [data set], http://pure.iiasa.ac.at/id/eprint/17551/ (last access: 7 April 2022), 2020b.
Gibbs, H. K., Johnston, M., Foley, J. A., Holloway, T., Monfreda, C., Ramankutty, N., and Zaks, D.: Carbon payback times for crop-based biofuel expansion in the tropics: the effects of changing yield and technology, Environ. Res. Lett., 3, 034001, https://doi.org/10.1088/1748-9326/3/3/034001, 2008.
Gregory, J. M., Jones, C. D., Cadule, P., and Friedlingstein, P.: Quantifying Carbon Cycle Feedbacks, J. Climate, 22, 5232–5250, https://doi.org/10.1175/2009JCLI2949.1, 2009.
Hajima, T., Watanabe, M., Yamamoto, A., Tatebe, H., Noguchi, M. A., Abe, M., Ohgaito, R., Ito, A., Yamazaki, D., Okajima, H., Ito, A., Takata, K., Ogochi, K., Watanabe, S., and Kawamiya, M.: Development of the MIROC-ES2L Earth system model and the evaluation of biogeochemical processes and feedbacks, Geosci. Model Dev., 13, 2197–2244, https://doi.org/10.5194/gmd-13-2197-2020, 2020.
Hansis, E., Davis, S. J., and Pongratz, J.: Relevance of methodological choices for accounting of land use change carbon fluxes, Global Biogeochem. Cy., 29, 1230–1246, https://doi.org/10.1002/2014GB004997, 2015.
Harper, A. B., Powell, T., Cox, P. M., House, J., Huntingford, C., Lenton, T. M., Sitch, S., Burke, E., Chadburn, S. E., Collins, W. J., Comyn-Platt, E., Daioglou, V., Doelman, J. C., Hayman, G., Robertson, E., van Vuuren, D., Wiltshire, A., Webber, C. P., Bastos, A., Boysen, L., Ciais, P., Devaraju, N., Jain, A. K., Krause, A., Poulter, B., and Shu, S.: Land-use emissions play a critical role in land-based mitigation for Paris climate targets, Nat. Commun., 9, 2938, https://doi.org/10.1038/s41467-018-05340-z, 2018.
Heck, V., Gerten, D., Lucht, W., and Popp, A.: Biomass-based negative emissions difficult to reconcile with planetary boundaries, Nat. Clim. Change, 8, 151–155, https://doi.org/10.1038/s41558-017-0064-y, 2018.
Houghton, R. A. and Nassikas, A. A.: Global and regional fluxes of carbon from land use and land cover change 1850–2015, Global Biogeochem. Cy., 31, 456–472, https://doi.org/10.1002/2016GB005546, 2017.
Hurtt, G. C., Chini, L., Sahajpal, R., Frolking, S., Bodirsky, B. L., Calvin, K., Doelman, J. C., Fisk, J., Fujimori, S., Klein Goldewijk, K., Hasegawa, T., Havlik, P., Heinimann, A., Humpenöder, F., Jungclaus, J., Kaplan, J. O., Kennedy, J., Krisztin, T., Lawrence, D., Lawrence, P., Ma, L., Mertz, O., Pongratz, J., Popp, A., Poulter, B., Riahi, K., Shevliakova, E., Stehfest, E., Thornton, P., Tubiello, F. N., van Vuuren, D. P., and Zhang, X.: Harmonization of global land use change and management for the period 850–2100 (LUH2) for CMIP6, Geosci. Model Dev., 13, 5425–5464, https://doi.org/10.5194/gmd-13-5425-2020, 2020.
IIASA: SSP Database – Version 2.0, IIASA [data set], https://tntcat.iiasa.ac.at/SspDb/dsd?Action=htmlpage&page=20, last access: 7 April 2022.
Jones, C. D., Arora, V., Friedlingstein, P., Bopp, L., Brovkin, V., Dunne, J., Graven, H., Hoffman, F., Ilyina, T., John, J. G., Jung, M., Kawamiya, M., Koven, C., Pongratz, J., Raddatz, T., Randerson, J. T., and Zaehle, S.: C4MIP – The Coupled Climate–Carbon Cycle Model Intercomparison Project: experimental protocol for CMIP6, Geosci. Model Dev., 9, 2853–2880, https://doi.org/10.5194/gmd-9-2853-2016, 2016a.
Jones, C. D., Ciais, P., Davis, S. J., Friedlingstein, P., Gasser, T., Peters, G. P., Rogelj, J., van Vuuren, D. P., Canadell, J. G., Cowie, A., Jackson, R. B., Jonas, M., Kriegler, E., Littleton, E., Lowe, J. A., Milne, J., Shrestha, G., Smith, P., Torvanger, A., and Wiltshire, A.: Simulating the Earth system response to negative emissions, Environ. Res. Lett., 11, 095012, https://doi.org/10.1088/1748-9326/11/9/095012, 2016b.
Jones, M. B. and Albanito, F.: Can biomass supply meet the demands of bioenergy with carbon capture and storage (BECCS)?, Glob. Change Biol., 26, 5358–5364, https://doi.org/10.1111/gcb.15296, 2020.
Keller, D. P., Lenton, A., Scott, V., Vaughan, N. E., Bauer, N., Ji, D., Jones, C. D., Kravitz, B., Muri, H., and Zickfeld, K.: The Carbon Dioxide Removal Model Intercomparison Project (CDRMIP): rationale and experimental protocol for CMIP6, Geosci. Model Dev., 11, 1133–1160, https://doi.org/10.5194/gmd-11-1133-2018, 2018.
Krause, A., Pugh, T. A. M., Bayer, A. D., Li, W., Leung, F., Bondeau, A., Doelman, J. C., Humpenöder, F., Anthoni, P., Bodirsky, B. L., Ciais, P., Müller, C., Murray-Tortarolo, G., Olin, S., Popp, A., Sitch, S., Stehfest, E., and Arneth, A.: Large uncertainty in carbon uptake potential of land-based climate-change mitigation efforts, Glob. Change Biol., 24, 3025–3038, https://doi.org/10.1111/gcb.14144, 2018.
Kriegler, E., Bauer, N., Popp, A., Humpenöder, F., Leimbach, M., Strefler, J., Baumstark, L., Bodirsky, B. L., Hilaire, J., Klein, D., Mouratiadou, I., Weindl, I., Bertram, C., Dietrich, J.-P., Luderer, G., Pehl, M., Pietzcker, R., Piontek, F., Lotze-Campen, H., Biewald, A., Bonsch, M., Giannousakis, A., Kreidenweis, U., Müller, C., Rolinski, S., Schultes, A., Schwanitz, J., Stevanovic, M., Calvin, K., Emmerling, J., Fujimori, S., and Edenhofer, O.: Fossil-fueled development (SSP5): An energy and resource intensive scenario for the 21st century, Global Environ. Chang., 42, 297–315, https://doi.org/10.1016/j.gloenvcha.2016.05.015, 2017.
Li, W., Ciais, P., Han, M., Zhao, Q., Chang, J., Goll, D. S., Zhu, L., and Wang, J.: Bioenergy Crops for Low Warming Targets Require Half of the Present Agricultural Fertilizer Use, Environ. Sci. Technol., 55, 10654–10661, https://doi.org/10.1021/acs.est.1c02238, 2021.
Liddicoat, S. K., Wiltshire, A. J., Jones, C. D., Arora, V. K., Brovkin, V., Cadule, P., Hajima, T., Lawrence, D. M., Pongratz, J., and Schwinger, J.: Compatible Fossil Fuel CO2 Emissions in the CMIP6 Earth System Models' Historical and Shared Socioeconomic Pathway Experiments of the Twenty-First Century, J. Climate, 34, 2853–2875, https://doi.org/10.1175/JCLI-D-19-0991.1, 2021.
Meinshausen, M., Nicholls, Z. R. J., Lewis, J., Gidden, M. J., Vogel, E., Freund, M., Beyerle, U., Gessner, C., Nauels, A., Bauer, N., Canadell, J. G., Daniel, J. S., John, A., Krummel, P. B., Luderer, G., Meinshausen, N., Montzka, S. A., Rayner, P. J., Reimann, S., Smith, S. J., van den Berg, M., Velders, G. J. M., Vollmer, M. K., and Wang, R. H. J.: The shared socio-economic pathway (SSP) greenhouse gas concentrations and their extensions to 2500, Geosci. Model Dev., 13, 3571–3605, https://doi.org/10.5194/gmd-13-3571-2020, 2020.
Melnikova, I., Boucher, O., Cadule, P., Ciais, P., Gasser, T., Quilcaille, Y., Shiogama, H., Tachiiri, K., Yokohata, T., and Tanaka, K.: Carbon cycle response to temperature overshoot beyond 2 ∘C – an analysis of CMIP6 models, Earths Future, 9, e2020EF001967, https://doi.org/10.1029/2020EF001967, 2021.
Mohr, A. and Raman, S.: Lessons from first generation biofuels and implications for the sustainability appraisal of second generation biofuels, Energ. Policy, 63, 114–122, https://doi.org/10.1016/j.enpol.2013.08.033, 2013.
O'Neill, B. C., Tebaldi, C., van Vuuren, D. P., Eyring, V., Friedlingstein, P., Hurtt, G., Knutti, R., Kriegler, E., Lamarque, J.-F., Lowe, J., Meehl, G. A., Moss, R., Riahi, K., and Sanderson, B. M.: The Scenario Model Intercomparison Project (ScenarioMIP) for CMIP6, Geosci. Model Dev., 9, 3461–3482, https://doi.org/10.5194/gmd-9-3461-2016, 2016.
Pongratz, J., Reick, C. H., Houghton, R. A., and House, J. I.: Terminology as a key uncertainty in net land use and land cover change carbon flux estimates, Earth Syst. Dynam., 5, 177–195, https://doi.org/10.5194/esd-5-177-2014, 2014.
Popp, A., Calvin, K., Fujimori, S., Havlik, P., Humpenöder, F., Stehfest, E., Bodirsky, B. L., Dietrich, J. P., Doelmann, J. C., Gusti, M., Hasegawa, T., Kyle, P., Obersteiner, M., Tabeau, A., Takahashi, K., Valin, H., Waldhoff, S., Weindl, I., Wise, M., Kriegler, E., Lotze-Campen, H., Fricko, O., Riahi, K., and van Vuuren, D. P.: Land-use futures in the shared socio-economic pathways, Global Environ. Chang., 42, 331–345, https://doi.org/10.1016/j.gloenvcha.2016.10.002, 2017.
Riahi, K., van Vuuren, D. P., Kriegler, E., Edmonds, J., O'Neill, B. C., Fujimori, S., Bauer, N., Calvin, K., Dellink, R., Fricko, O., Lutz, W., Popp, A., Cuaresma, J. C., Samir, K. C., Leimbach, M., Jiang, L., Kram, T., Rao, S., Emmerling, J., Ebi, K., Hasegawa, T., Havlik, P., Humpenöder, F., Silva, L. A. D., Smith, S., Stehfest, E., Bosetti, V., Eom, J., Gernaat, D., Masui, T., Rogelj, J., Strefler, J., Drouet, L., Krey, V., Luderer, G., Harmsen, M., Takahashi, K., Baumstark, L., Doelman, J. C., Kainuma, M., Klimont, Z., Marangoni, G., Lotze-Campen, H., Obersteiner, M., Tabeau, A., and Tavoni, M.: The Shared Socioeconomic Pathways and their energy, land use, and greenhouse gas emissions implications: An overview, Global Environ. Chang., 42, 153–168, https://doi.org/10.1016/j.gloenvcha.2016.05.009, 2017.
Rogelj, J., Shindell, D., Jiang, K., Fifita, S., Forster, P., Ginzburg, V., Handa, C., Kheshgi, H., Kobayashi, S., Kriegler, E., Mundaca, L., Séférian, R., Vilarino, M. V., Calvin, K., de Oliveira de Portugal Pereira, J. C., Edelenbosch, O., Emmerling, J., Fuss, S., Gasser, T., Gillett, N., He, C., Hertwich, E., Höglund-Isaksson, L., Huppmann, D., Luderer, G., Markandya, A., Meinshausen, M., McCollum, D., Millar, R., Popp, A., Purohit, P., Riahi, K., Ribes, A., Saunders, H., Schädel, C., Smith, C., Smith, P., Trutnevyte, E., Xu, Y., Zhou, W., and Zickfeld, K.: Mitigation Pathways Compatible with 1.5 ∘C in the Context of Sustainable Development, in: Global warming of 1.5 ∘C (IPCC Special Report), edited by: Masson-Delmotte, V., Zhai, P., Pörtner, H. O., Roberts, D., Skea, J., Shukla, P. R., Pirani, A., Moufouma-Okia, W., Péan, C., Pidcock, R., Connors, S., Matthews, J. B. R., Chen, Y., Zhou, X., Zhou, M. I., Lonnoy, E., Maycock, T., Tignor, M., and Waterfield, T., Intergovernmental Panel on Climate Change, Geneva, 93–174, https://www.ipcc.ch/site/assets/uploads/sites/2/2019/05/SR15_Chapter2_Low_Res.pdf (last access: 7 April 2022), 2018.
Schueler, V., Weddige, U., Beringer, T., Gamba, L., and Lamers, P.: Global biomass potentials under sustainability restrictions defined by the European Renewable Energy Directive 2009/28/EC, GCB Bioenergy, 5, 652–663, https://doi.org/10.1111/gcbb.12036, 2013.
Séférian, R., Rocher, M., Guivarch, C., and Colin, J.: Constraints on biomass energy deployment in mitigation pathways: the case of water scarcity, Environ. Res. Lett., 13, 054011, https://doi.org/10.1088/1748-9326/aabcd7, 2018.
Séférian, R., Nabat, P., Michou, M., Saint-Martin, D., Voldoire, A., Colin, J., Decharme, B., Delire, C., Berthet, S., Chevallier, M., Sénési, S., Franchisteguy, L., Vial, J., Mallet, M., Joetzjer, E., Geoffroy, O., Guérémy, J.-F., Moine, M.-P., Msadek, R., Ribes, A., Rocher, M., Roehrig, R., Salas-y-Mélia, D., Sanchez, E., Terray, L., Valcke, S., Waldman, R., Aumont, O., Bopp, L., Deshayes, J., Éthé, C., and Madec, G.: Evaluation of CNRM Earth System Model, CNRM-ESM2–1: Role of Earth System Processes in Present-Day and Future Climate, J. Adv. Model. Earth Sy., 11, 4182–4227, https://doi.org/10.1029/2019MS001791, 2019.
Sellar, A. A., Jones, C. G., Mulcahy, J. P., Tang, Y., Yool, A., Wiltshire, A., O'Connor, F. M., Stringer, M., Hill, R., Palmieri, J., Woodward, S., de Mora, L., Kuhlbrodt, T., Rumbold, S. T., Kelley, D. I., Ellis, R., Johnson, C. E., Walton, J., Abraham, N. L., Andrews, M. B., Andrews, T., Archibald, A. T., Berthou, S., Burke, E., Blockley, E., Carslaw, K., Dalvi, M., Edwards, J., Folberth, G. A., Gedney, N., Griffiths, P. T., Harper, A. B., Hendry, M. A., Hewitt, A. J., Johnson, B., Jones, A., Jones, C. D., Keeble, J., Liddicoat, S., Morgenstern, O., Parker, R. J., Predoi, V., Robertson, E., Siahaan, A., Smith, R. S., Swaminathan, R., Woodhouse, M. T., Zeng, G., and Zerroukat, M.: UKESM1: Description and Evaluation of the U. K. Earth System Model, J. Adv. Model. Earth Sy., 11, 4513–4558, https://doi.org/10.1029/2019MS001739, 2019.
Shukla, P. R., Skea, J., Calvo Buendia, E., Masson-Delmotte, V., Pörtner, H. O., Roberts, D. C., Zhai, P., Slade, R., Connors, S., and Van Diemen, R.: Climate Change and Land: an IPCC special report on climate change, desertification, land degradation, sustainable land management, food security, and greenhouse gas fluxes in terrestrial ecosystems, IPCC, https://www.ipcc.ch/site/assets/uploads/2019/11/SRCCL-Full-Report-Compiled-191128.pdf (last access: 7 April 2022), 2019.
Smith, P., Davis, S. J., Creutzig, F., Fuss, S., Minx, J., Gabrielle, B., Kato, E., Jackson, R. B., Cowie, A., and Kriegler, E.: Biophysical and economic limits to negative CO2 emissions, Nat. Clim. Change, 6, 42–50, https://doi.org/10.1038/nclimate2870, 2016.
Swart, N. C., Cole, J. N. S., Kharin, V. V., Lazare, M., Scinocca, J. F., Gillett, N. P., Anstey, J., Arora, V., Christian, J. R., Hanna, S., Jiao, Y., Lee, W. G., Majaess, F., Saenko, O. A., Seiler, C., Seinen, C., Shao, A., Sigmond, M., Solheim, L., von Salzen, K., Yang, D., and Winter, B.: The Canadian Earth System Model version 5 (CanESM5.0.3), Geosci. Model Dev., 12, 4823–4873, https://doi.org/10.5194/gmd-12-4823-2019, 2019.
Tanaka, K., Boucher, O., Ciais, P., Johansson, D. J. A., and Morfeldt, J.: Cost-effective implementation of the Paris Agreement using flexible greenhouse gas metrics, Sci. Adv., 7, eabf9020, https://doi.org/10.1126/sciadv.abf9020, 2021.
UoM – University of Maryland, Global Ecology Laboratory: LUH2, UoM [data set], https://luh.umd.edu/data.shtml, last access: 7 April 2022.
WCRP – World Climate Research Programme: CMIP6, WCRP [data set], https://esgf-node.llnl.gov/search/cmip6/, last access: 7 April 2022.
Whitaker, J., Field, J. L., Bernacchi, C. J., Cerri, C. E. P., Ceulemans, R., Davies, C. A., DeLucia, E. H., Donnison, I. S., McCalmont, J. P., Paustian, K., Rowe, R. L., Smith, P., Thornley, P., and McNamara, N. P.: Consensus, uncertainties and challenges for perennial bioenergy crops and land use, GCB Bioenergy, 10, 150–164, https://doi.org/10.1111/gcbb.12488, 2018.
Zhang, X., Wang, Y. P., Rayner, P. J., Ciais, P., Huang, K., Luo, Y., Piao, S., Wang, Z., Xia, J., Zhao, W., and Zheng, X.: A small climate-amplifying effect of climate-carbon cycle feedback, Nat. Commun., 12, 1–11, https://doi.org/10.1038/s41467-021-22392-w, 2021.
- Abstract
- Introduction
- Data and methods
- Evaluation and data consistency
- The impact of LUC from bioenergy crop expansion on the carbon uptake
- The carbon cycle feedback framework perspective
- Conclusions
- Appendix A: Sensitivity study for deriving the crop-concentrated grid thresholds
- Data availability
- Author contributions
- Competing interests
- Disclaimer
- Acknowledgements
- Financial support
- Review statement
- References
- Supplement