the Creative Commons Attribution 4.0 License.
the Creative Commons Attribution 4.0 License.
 | 07 Nov 2022
On the additivity of climate responses to the volcanic and solar forcing in the early 19th century
Shih-Wei Fang
Claudia Timmreck
Johann Jungclaus
Kirstin Krüger
Hauke Schmidt
The early 19th century was the coldest period over the past 500 years, when strong tropical volcanic events and a solar minimum coincided. The 1809 unidentified eruption and the 1815 Tambora eruption happened consecutively during the Dalton minimum of solar irradiance; however, the relative role of the two forcing (volcano and solar) agents is still unclear. In this study, we examine the responses from a set of early 19th century simulations with combined and separated volcanic and solar forcing agents, as suggested in the protocol for the past1000 experiment of the Paleoclimate Modelling Intercomparison Project – Phase 4 (PMIP4). From 20-member ensemble simulations with the Max Planck Institute Earth system model (MPI-ESM1.2-LR), we find that the volcano- and solar-induced surface cooling is additive in the global mean/large scale, regardless of combining or separating the forcing agents. The two solar reconstructions (SATIRE (Spectral and Total Irradiance REconstruction-Millennia model) and PMOD (Physikalisch-Meteorologisches Observatorium Davos)) contribute to a cooling before and after 1815 of ∼0.05 and ∼0.15 K monthly average near-surface air cooling, respectively, indicating a limited solar contribution to the early 19th century cold period. The volcanic events provide the main cooling contributions, inducing a surface cooling that peaks at ∼0.82 K for the 1809 event and ∼1.35 K for Tambora. After the Tambora eruption, the temperature in most regions increases toward climatology largely within 5 years, along with the reduction of volcanic forcing. In the northern extratropical oceans, the temperature increases slowly at a constant rate until 1830, which is related to the reduction of seasonality and the concurrent changes in Arctic sea-ice extent. The albedo feedback of Arctic sea ice is found to be the main contributor to the Arctic amplification of the cooling signal. Several non-additive responses to solar and volcanic forcing happen on regional scales. In the atmosphere, the stratospheric polar vortex tends to strengthen when combining both volcano and solar forcing, even though the two forcing agents separately induce opposite-sign changes in stratospheric temperatures and zonal winds. In the ocean, when combining the two forcings, additional surface cold water propagates to the northern extratropics from the additional solar cooling in the tropics, which results in regional cooling along the propagation. Overall, this study not only quantifies the surface responses from combinations of the volcano and solar forcing, but also highlights the components that cannot be simply added from the responses of the individual forcing agents, indicating that a relatively small forcing agent (such as solar in early 19th century) can impact the response from the large forcing (such as the 1815 Tambora eruption) when considering regional climates.
- Article
(24480 KB) - Full-text XML
- BibTeX
- EndNote


Being the coldest period over the past 500 years, the early 19th century is a crucial period for studying the climate impacts from natural external forcing such as volcanoes and solar irradiance (Cole-Dai et al., 2009; Brönnimann et al., 2019). With limited impacts from anthropogenic greenhouse gas, the on-average low temperature in the early 19th century is believed to be caused mainly by the coincidental existence of strong tropical eruptions (the unidentified 1809 and the 1815 Tambora eruptions; Self et al., 2004; Cole-Dai et al., 2009) and the lower solar irradiance (Dalton minimum from 1790–1830; Usoskin et al., 2002; Silverman and Hayakawa, 2021). Studies have investigated the climate impacts from the 1809 unidentified (Timmreck et al., 2021) and the 1815 Tambora eruptions (Raible et al., 2016; Schurer et al., 2019; Zanchettin et al., 2019), and the Dalton minimum (Anet et al., 2014). For example, Zanchettin et al. (2019) examined how different strengths of the unidentified 1809 eruption could have altered the cooling caused by the following 1815 Tambora eruption. However, studies on the interplay between the solar- and volcanic-induced climate responses in the early 19th century are rare. Wagner and Zorita (2005) found that volcanoes are the main contribution to the winter surface cooling in the early 19th century, but no winter cooling is found with the solar-only simulations. On the other hand, Anet et al. (2014) argued that the volcanic forcing alone cannot reproduce the long-lasting cooling found in the reconstructions and the solar forcing is essential for the post-volcano cooling. Both modeling studies considered only three ensemble members, resulting in not only the lack of quantification of the individual contributions from volcanic and solar forcing but also an inability to identify potential non-additive responses when combining both forcings.
For the quantification of the solar and volcanic forcing in the early 19th century, the uncertainty of the reconstructions used for forcing agents is a challenge. For instance, reconstructions of total solar irradiance (TSI) and spectral solar irradiance (SSI) can be calculated by various proxies, such as the sunspot number, solar modulation potential, and cosmogenic isotope concentrations of 14C and 10Be from tree rings and ice cores (Usoskin, 2017). Depending on the method, the estimated ultraviolet irradiance can differ by up to 15 % (Shapiro et al., 2011). As a result, two solar reconstructions and one volcano forcing are recommended in the protocol of the experiments covering the Common Era (Jungclaus et al., 2017) in the Paleoclimate Modelling Intercomparison Project – Phase 4 (PMIP4; Kageyama et al., 2018). This protocol provides a more consistent way for quantifying the early 19th century climates and further examining the interplay between the volcanic and solar forcing. The two solar reconstructions, SATIRE (the updated Spectral and Total Irradiance REconstruction-Millennia model; Vieira et al., 2011; Wu et al., 2018) and PMOD (Physikalisch-Meteorologisches Observatorium Davos; Shapiro et al., 2011; Egorova et al., 2018) may allow estimating possible boundaries of how much the solar forcing may contribute to the past climates as PMOD has a larger variability and can be considered as an upper limit for the reduction of solar radiation (Schmidt et al., 2012; Jungclaus et al., 2017).
The interplay of volcano- and solar-induced impacts may not be straightforward since both volcanic aerosol and lower solar irradiance can induce surface temperature changes along two pathways: bottom-up and top-down. The bottom-up processes caused by the two forcing agents cool the surface temperature with the reduction of incoming solar radiation at the surface due to the lower solar irradiance (Meehl et al., 2009; Misios and Schmidt, 2012) and the blocking of incoming solar radiation from the volcanic aerosols (Robock, 2000; Timmreck, 2012; Swingedouw et al., 2017). In contrast, the top-down processes for the two forcings are opposite: the reduced solar radiation can cool the lower stratosphere, reduce the meridional temperature gradient, and weaken the polar vortex (Scaife et al., 2013; Maycock et al., 2015), while the volcanic aerosols can warm the lower tropical stratosphere causing a strengthening of the polar vortex (Robock, 2000; Timmreck, 2012; Swingedouw et al., 2017). These opposite polar vortex responses may result in distinct regional and seasonal surface responses, especially at high latitudes. A question is, when both solar and volcanic forcing are included in the system, can the top-down and bottom-up processes of both forcings be simply additive? And how will the surface temperature cooling respond to the combination of both forcings and both processes?
Besides, Arctic amplification (AA) is a possible factor creating the latitudinal difference of surface air cooling on Earth as AA is well known for the latitudinal difference of warming (Graversen et al., 2008; Serreze et al., 2009; Previdi et al., 2021). Under global warming, the Arctic region is observed and expected to warm faster than other regions and to reduce the seasonality due to a stronger AA in winter. In fact, AA may also exist when the system undergoes a surface cooling. For example, Stjern et al. (2019) show that solar irradiance change has a similar AA strength as other drivers (such as CO2). Liu et al. (2018) state that no volcano-induced AA is found due to the large temperature changes in the tropics, which may also be related to the latitudinal distribution of volcanic forcing, while others have found that the northern extratropics encounter a larger cooling a few years after eruptions (Zanchettin et al., 2019). This means that the extent of AA for volcanic and solar forcing is not well understood and the combination of both has not yet been studied.
The paper is structured as follows: Sect. 2 discusses the data, method, and experiment design; Sect. 3 describes the impacts from solar and volcano forcing separately; Sect. 4 investigates the additivity between the volcanic and solar signals at the surface, atmosphere, and ocean; Sect. 5 studies the AA during the solar- and volcanic-forced cooling with a feedback separation; and Sect. 6 summarizes the paper and discusses potential follow-up studies.
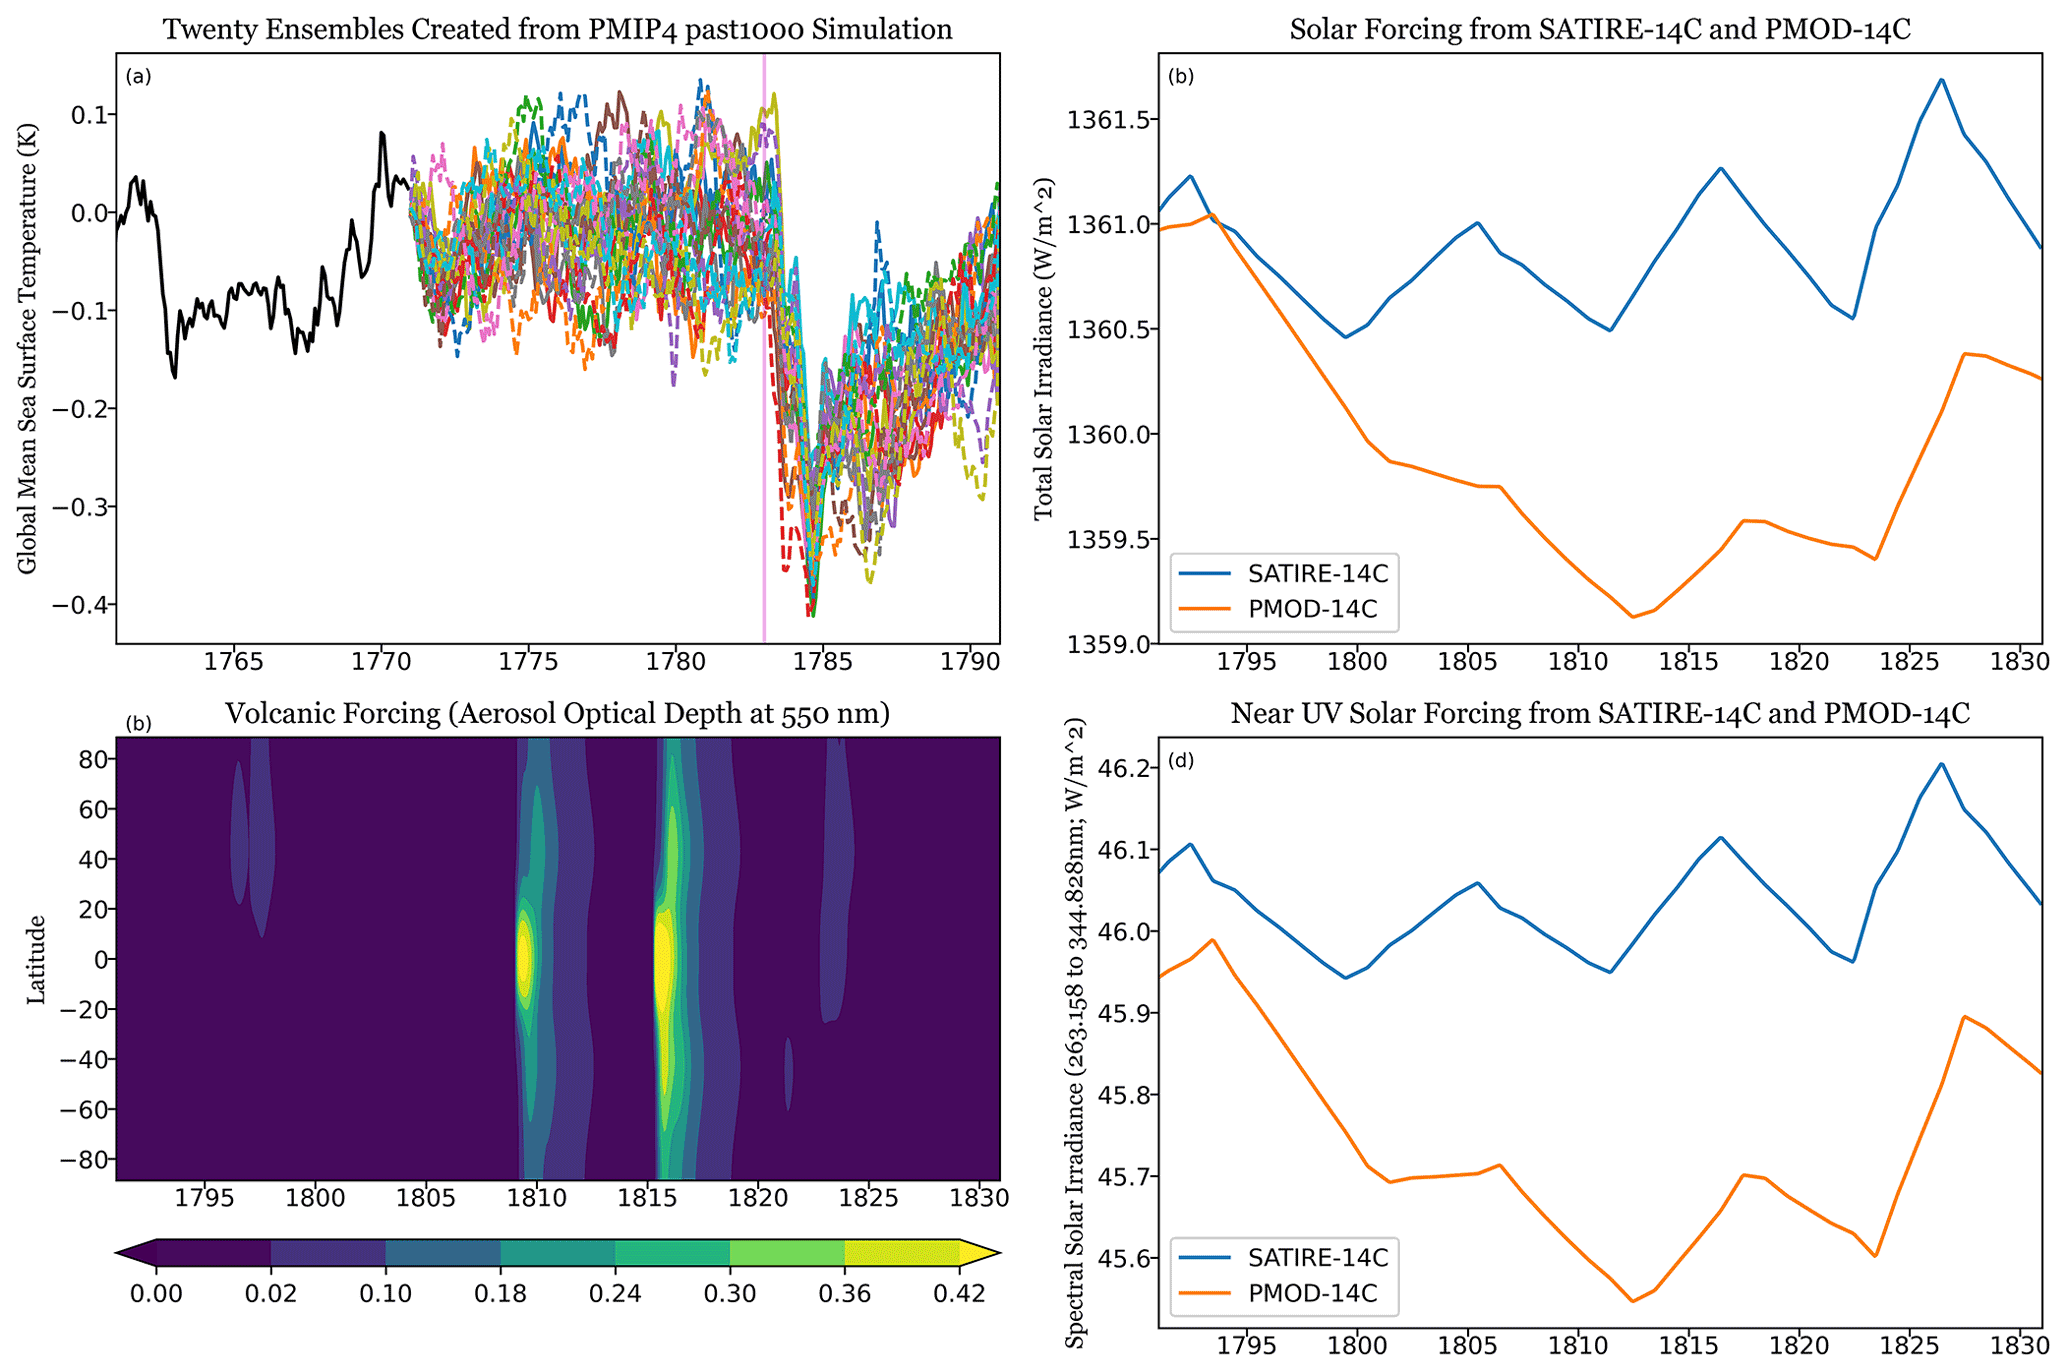
Figure 1(a) Global mean sea surface temperature anomalies (K) of past2k simulation (black) and the perturbed 19 ensemble members. The vertical magenta line indicates the 1783 Laki eruption. (b) Total solar irradiance (W m−2) for the solar forcing of SATIRE-14C and PMOD-14C. (c) Aerosol optical depth at 550 nm (unitless) for the volcanic forcing. (d) Near UV spectral solar irradiance (263.158 to 344.828 nm; W m−2) for the solar forcing of SATIRE-14C and PMOD-14C.
In this study, the Max Planck Institute for Meteorology Earth System Model version 1.2 at low resolution (MPI-ESM1.2-LR), which is the CMIP6/PMIP4 version of MPI-ESM (Mauritsen et al., 2019), is used for our simulations. The MPI-ESM1.2-LR is a state of the art climate model composed by the ECHAM6.3 atmospheric model, JSBACH3.2 land model, the MPIOM1.6 ocean model, the HAMOCC6 ocean biogeochemistry model, and the OASIS3-MCT coupler. The atmospheric component is using the T63 atmospheric triangular truncation (∼200 km horizontal resolution) with 47 vertical levels (0.01 hPa or 80 km on average for the top), and the ocean grid is the GR1.5 grid (∼150 km nominal horizontal resolution) with 40 vertical levels. For solar forcing, the SSI is interpolated to 14 wavelength bands with the lowest bound at 120 nm. The stratospheric aerosol forcing is prescribed with monthly zonal mean aerosol optical properties and without interactive chemistry. It is noted that the quasi-biennial oscillation (QBO) is not simulated in this version of MPI-ESM due to the relatively low vertical resolution (Krismer et al., 2013). This may impact our results as the QBO is known to affect the Arctic Oscillation (Holten and Tan, 1980; Garfinkel et al., 2012; Labe et al., 2019). For instance, Stenchikov et al. (2004) show that the easterly phase of QBO right after the 1991 Pinatubo eruption tends to weaken the polar vortex, while the westerly phase of QBO in 1992–1993 can enhance the aerosol effect on the AO.
Four sets of ensemble experiments, each consisting of 20 members, are conducted in this study (Table 1). All experiments are carried out from the year 1791 to year 1830 for 40 years. The 20 ensemble members are created by perturbing the atmosphere with slight changes (0.99990 to 1.00009) in the stratospheric horizontal diffusion during 1771 from the past2k run (van Dijk et al., 2022; Fang et al., 2021) and simulations are run from 1771–1790 to obtain distinct ocean states (Fig. 1a). Besides the volcanic aerosol and solar activity (including the ozone concentration in the upper atmosphere), all other boundary conditions of the experiments are the same as in the past2k simulation.
Table 1Description of the four experiments used in this study.

The first two experiments, Basic and SolarStrong, are simulated with the SATIRE-14C (Usoskin et al., 2016) and the PMOD-14C (Shapiro et al., 2011; Egorova et al., 2018) solar reconstructions formulated in the PMIP4 past1000 protocol (Jungclaus et al., 2017). The reason to use two solar reconstructions is because no prior research, to our knowledge, has quantified the possible range of solar impacts in the early 19th century with two different reconstructions along with volcano eruptions. The PMOD reconstruction has a larger variability with lower solar radiation in the early 19th century than the SATIRE reconstruction (Fig. 1b) due to their distinct assumptions of the proxy: the solar modulation potential and the photospheric magnetic field changes, respectively. This entails why the PMIP4 protocol provides two reconstructions since the PMOD reconstruction can be considered as an upper limit of the possible secular variability as it shows larger long-term changes in solar irradiance than other reconstructions (Schmidt et al., 2012; Jungclaus et al., 2017). Specifically, we use the 14C version of the reconstructions calculated from the cosmogenic isotope concentrations of 14C. The prescribed ozone concentration is calculated based on solar irradiance (not including the volcanic impacts) following the PMIP past1000 protocol (Jungclaus et al., 2017; Matthes et al., 2017), as the solar irradiance can alter the stratospheric and mesospheric ozone concentration (Haigh, 1994). For instance, the zonal average ozone concentration in the stratosphere calculated from the PMOD is roughly 2 % different compared to the SATIRE ozone in 1815. The solar effects on ozone for the past1000 experiment are scaled using the averaged solar UV irradiance (from 200 to 320 nm; Fig. 1d) because the 10.7 cm radio flux (F10.7) used for the CMIP6 historical simulation is not available for the past1000 time period.
The other two experiments are Volcano (volcanic aerosol + SATIRE) and Volcano & SolarStrong (volcanic aerosol + PMOD) experiments, which include the same volcanic aerosols but different solar reconstructions to disentangle the interaction between the solar and volcanic cooling in the early 19th century. Following the PMIP4 past1000 protocol, the time-varying aerosol optical depth (AOD) for volcanic forcing is calculated with the EVA (Easy Volcanic Aerosol) module (Toohey et al., 2016) using the eVolv2k dataset (Toohey and Sigl, 2017) as input. Two strong volcanic eruptions occur during the experiment period: the 1809 and the 1815 Tambora eruptions (Fig. 1c). With the combinations of with/without volcanic aerosol and strong/weak solar irradiance, we aim to better understand the possible contributions of different forcings to the early 19th cooling.
The anomalies in this study are calculated based on the ensemble mean of the seasonal cycle of the Basic experiments (anomalies = each ensemble member minus the ensemble mean climatology of Basic). This is because the Basic experiment has the smallest forcing of surface cooling (SATIRE-14C and no volcanic aerosol).
Several climate indices are used in this study. The Niño3.4 index is defined as the regional mean sea surface temperature (SST) anomalies over 5∘ S to 5∘ N and 170 to 120∘ W. The relative Niño3.4 index, which represents the ENSO responses without impacts from global volcanic cooling, follows Khodri et al. (2017) by removing the tropical mean (20∘ S to 20∘ N) SST anomalies from the Niño3.4 index. The North Atlantic Oscillation (NAO) index (Wanner et al., 2001) is calculated by the difference of sea level pressure anomalies between the Azores (36 to 40∘ N and 28 to 20∘ W) and the Icelandic low (63 to 70∘ N and 25 to 16∘ W). The Arctic Oscillation (AO; Thompson and Wallace, 1998) index is obtained by the normalized first principal component (PC) of the empirical orthogonal function (EOF) of northern extratropical sea level pressure anomalies (20 to 90∘ N). The Southern Annular Mode (SAM; Marshall, 2003) index is computed by the zonal mean sea level pressure anomalies between 40 and 65∘ S. The Pacific Decadal Oscillation (PDO; Mantua and Hare, 2002) is obtained by the normalized first PC of the northern extratropical Pacific SST anomalies (20 to 50∘ N and 120∘ E to 110∘ W) EOF. The Atlantic multi-decadal variability (AMV; Enfield et al., 2001) is the 10-year running mean of the North Atlantic SST anomalies (0 to 60∘ N and 80 to 0∘ W) and the Atlantic meridional overturning circulation (AMOC) is defined as the maximum Atlantic meridional overturning streamfunction at 30∘ N below 1000 m depth. For the significance of each month of indices for an experiment, the 20 ensemble members of an experiment are compared with the 20 ensemble members of the Basic experiment by the student t-test with a 5 % significance level.
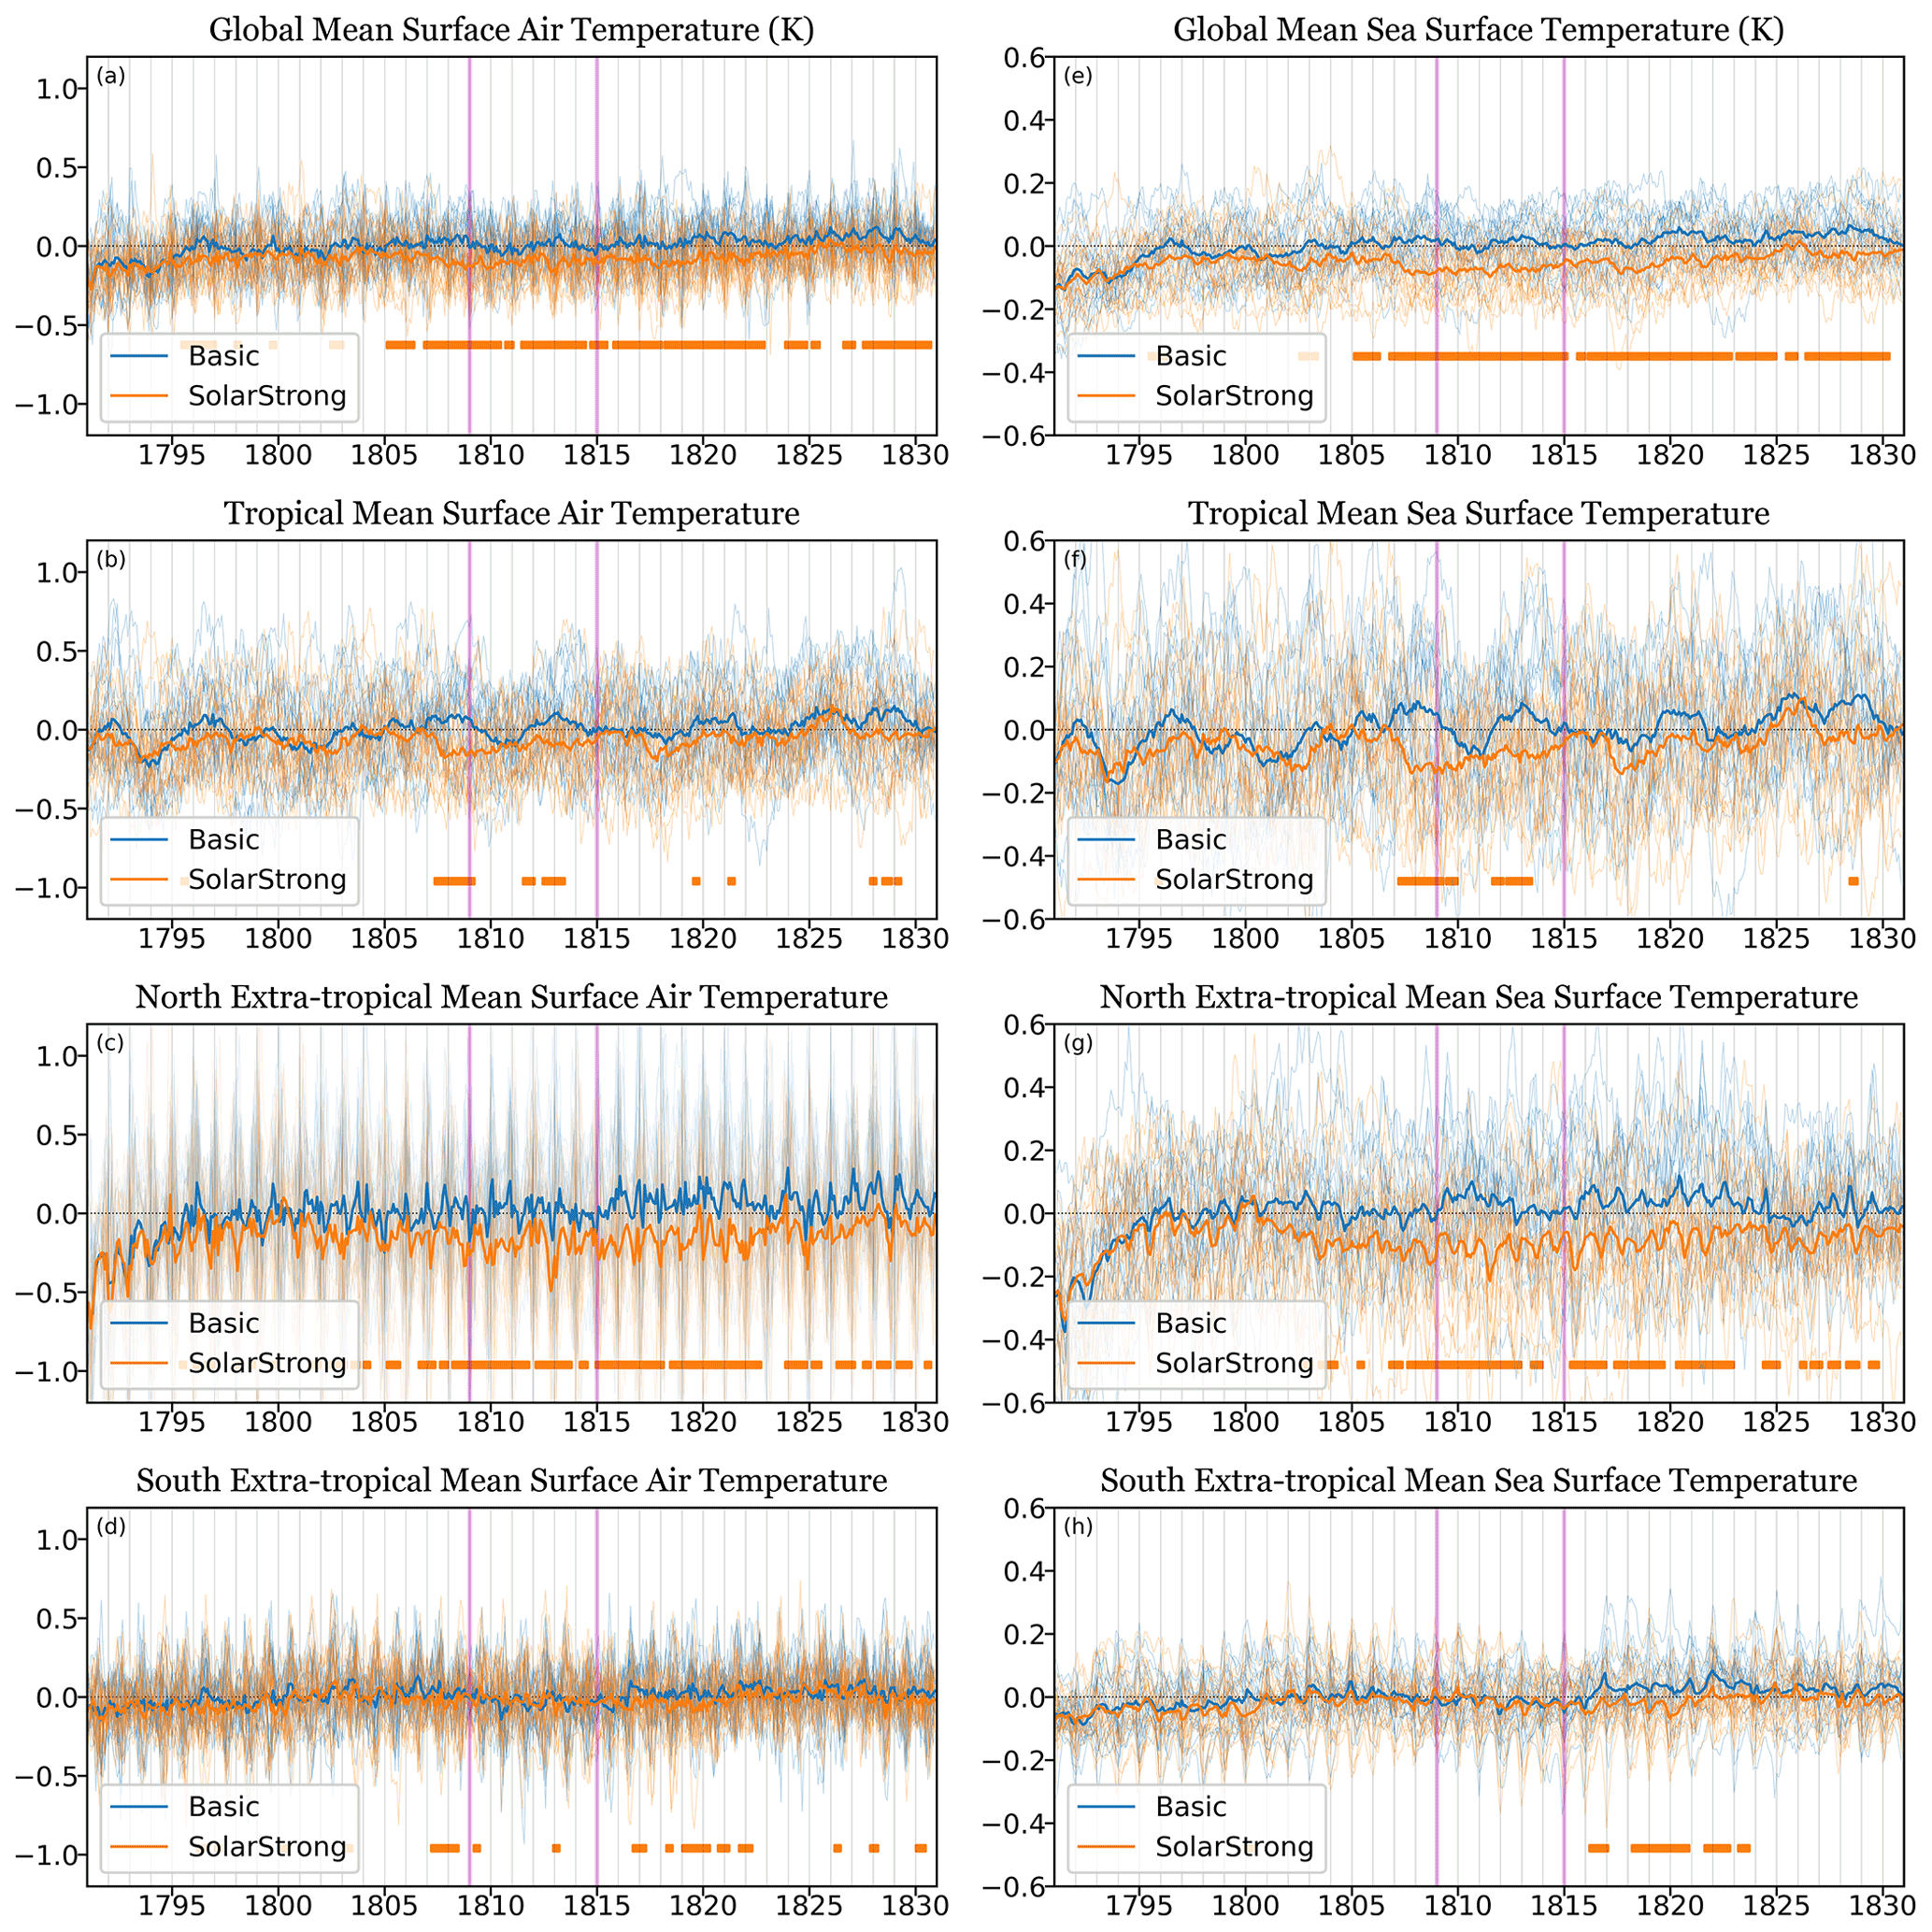
Figure 2(a) Global mean SAT (K) anomalies of the Basic (blue) and SolarStrong (orange). (b) Tropical mean (30∘ S to 30∘ N), (c) northern extratropical mean (30 to 90∘ N), and (d) southern extratropical mean (90 to 30∘ S). (e)–(h) are for SST (K) and the same regions. The thick lines are the ensemble mean. The orange boxes below indicate periods during which the ensemble means of SolarStrong are significantly different (see Sect. 2 for details) to the Basic experiment. The magenta vertical lines indicate the year of 1809 and 1815 Tambora eruptions, other gray vertical lines are the January for each year.
To investigate what process contributes the most to AA cooling, we use the rapid adjustment (Marshall et al., 2020) that disentangles the radiative contributions of each feedback in the Arctic and Tropics. The reason we used the rapid adjustment is that our forcing agents (solar and volcano) change over time and we consider a shorter period compared to general methods of radiative kernels (decades). The rapid adjustment is computed with two steps: (1) obtain the radiative kernel (Block and Mauritsen, 2013) from the piControl run simulation of the same model (MPI-ESM1.2-LR), which is how much radiation will change when the climate deviates (e.g., how much Planck feedback will change when surface air temperature change); and (2) multiply the kernel with the difference between the experiments and piControl run of corresponding variables for the feedback to estimate the radiative changes of each process (e.g., multiply the kernel for Planck feedback with the surface air temperature difference between the experiments and piCotronl). As a result, the amount of heat change in the system can be obtained (e.g., surface cooling will cause the Planck feedback to release less heat to the system, meaning more heat in the system).
Figure 2a and e shows the global mean surface air temperature (SAT) and SST of the Basic and SolarStrong experiments. As a baseline for the other experiments, the Basic experiment (blue) has small temperature changes over this period, where the temperature bounces back to normal between 1795–1800 from the Icelandic Laki eruption in 1783, which is inherited from the initial conditions (Fig. 1a). Also, the weaker (stronger) solar radiation before (after) 1815 causes a slightly lower (higher) temperature, meaning the SATIRE solar forcing during the Dalton minimum results in less than a monthly average of 0.03 K global SST cooling by comparing before and after 1815 (>0.05 K for SAT) in the MPI-ESM1.2-LR. The spatial averages of different regions (Fig. 2b–d) also show similar temperature variations, but the tropical region (30∘ S to 30∘ N) exhibits a weaker temperature change compared to the southern extratropics (90 to 30∘ S) and the northern extratropics (30 to 90∘ N).
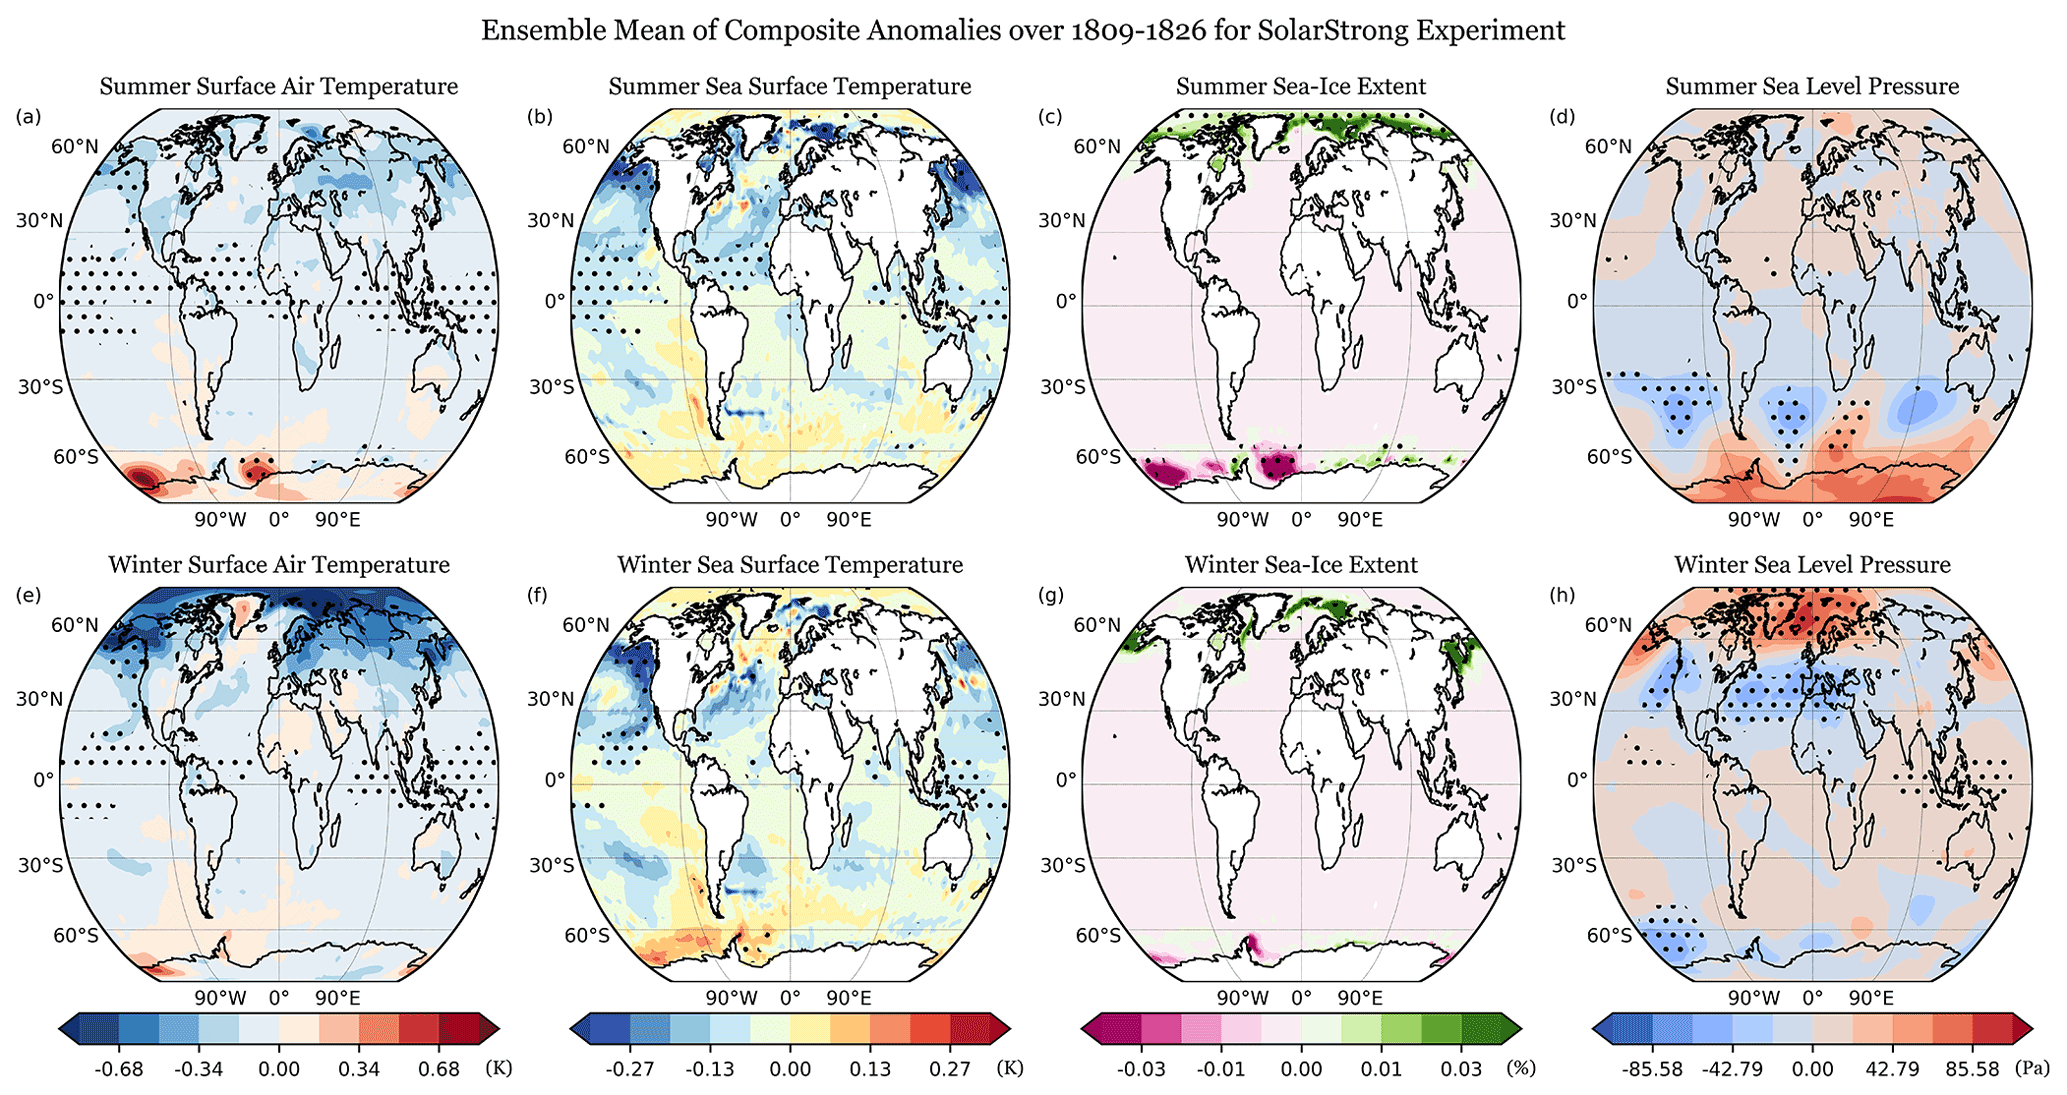
Figure 3Ensemble mean of composite of summer (a) SAT (K), (b) SST (K), and (c) sea ice as fraction (%), and (d) sea level pressure (Pa) anomalies over 1809–1826 for the SolarStrong experiment. (e)–(h) are for winter. The black dots represent the significant grid points (see Sect. 2 for details).
The SolarStrong experiment (orange) includes lower incoming solar radiation than the Basic experiment after 1795. Their TSI difference increases after 1795, peaks around 1815, and reduces afterward (Fig. 1b). Compared to Basic, the global mean SSTs in SolarStrong are significantly different after 1805 with a ∼0.07 K SST (∼0.1 K SAT) difference throughout the period (1809–1826; Fig. 2a and e). The significant cooling (based on student t tests between the 20 ensemble members of Basic and SolarStrong; shown in the orange rectangle below the time series) is mainly found in the northern extratropics (Fig. 2c and g) while the tropical (Fig. 2b and f) and southern extratropical (Fig. 2d and h) regions have limited differences. Maximum differences in solar irradiance and surface temperature do not coincide instantaneously. The solar irradiance shows the strongest difference in 1815, while the strongest temperature differences occur around 1812 and 1820, when the tropics and southern extratropics (90 to 30∘ S) exhibit significant differences compared to Basic. This indicates that the solar forcing does not exhibit clear instantaneous responses throughout the globe and the small cooling responses can easily be hidden by the internal variability if small ensembles are considered.
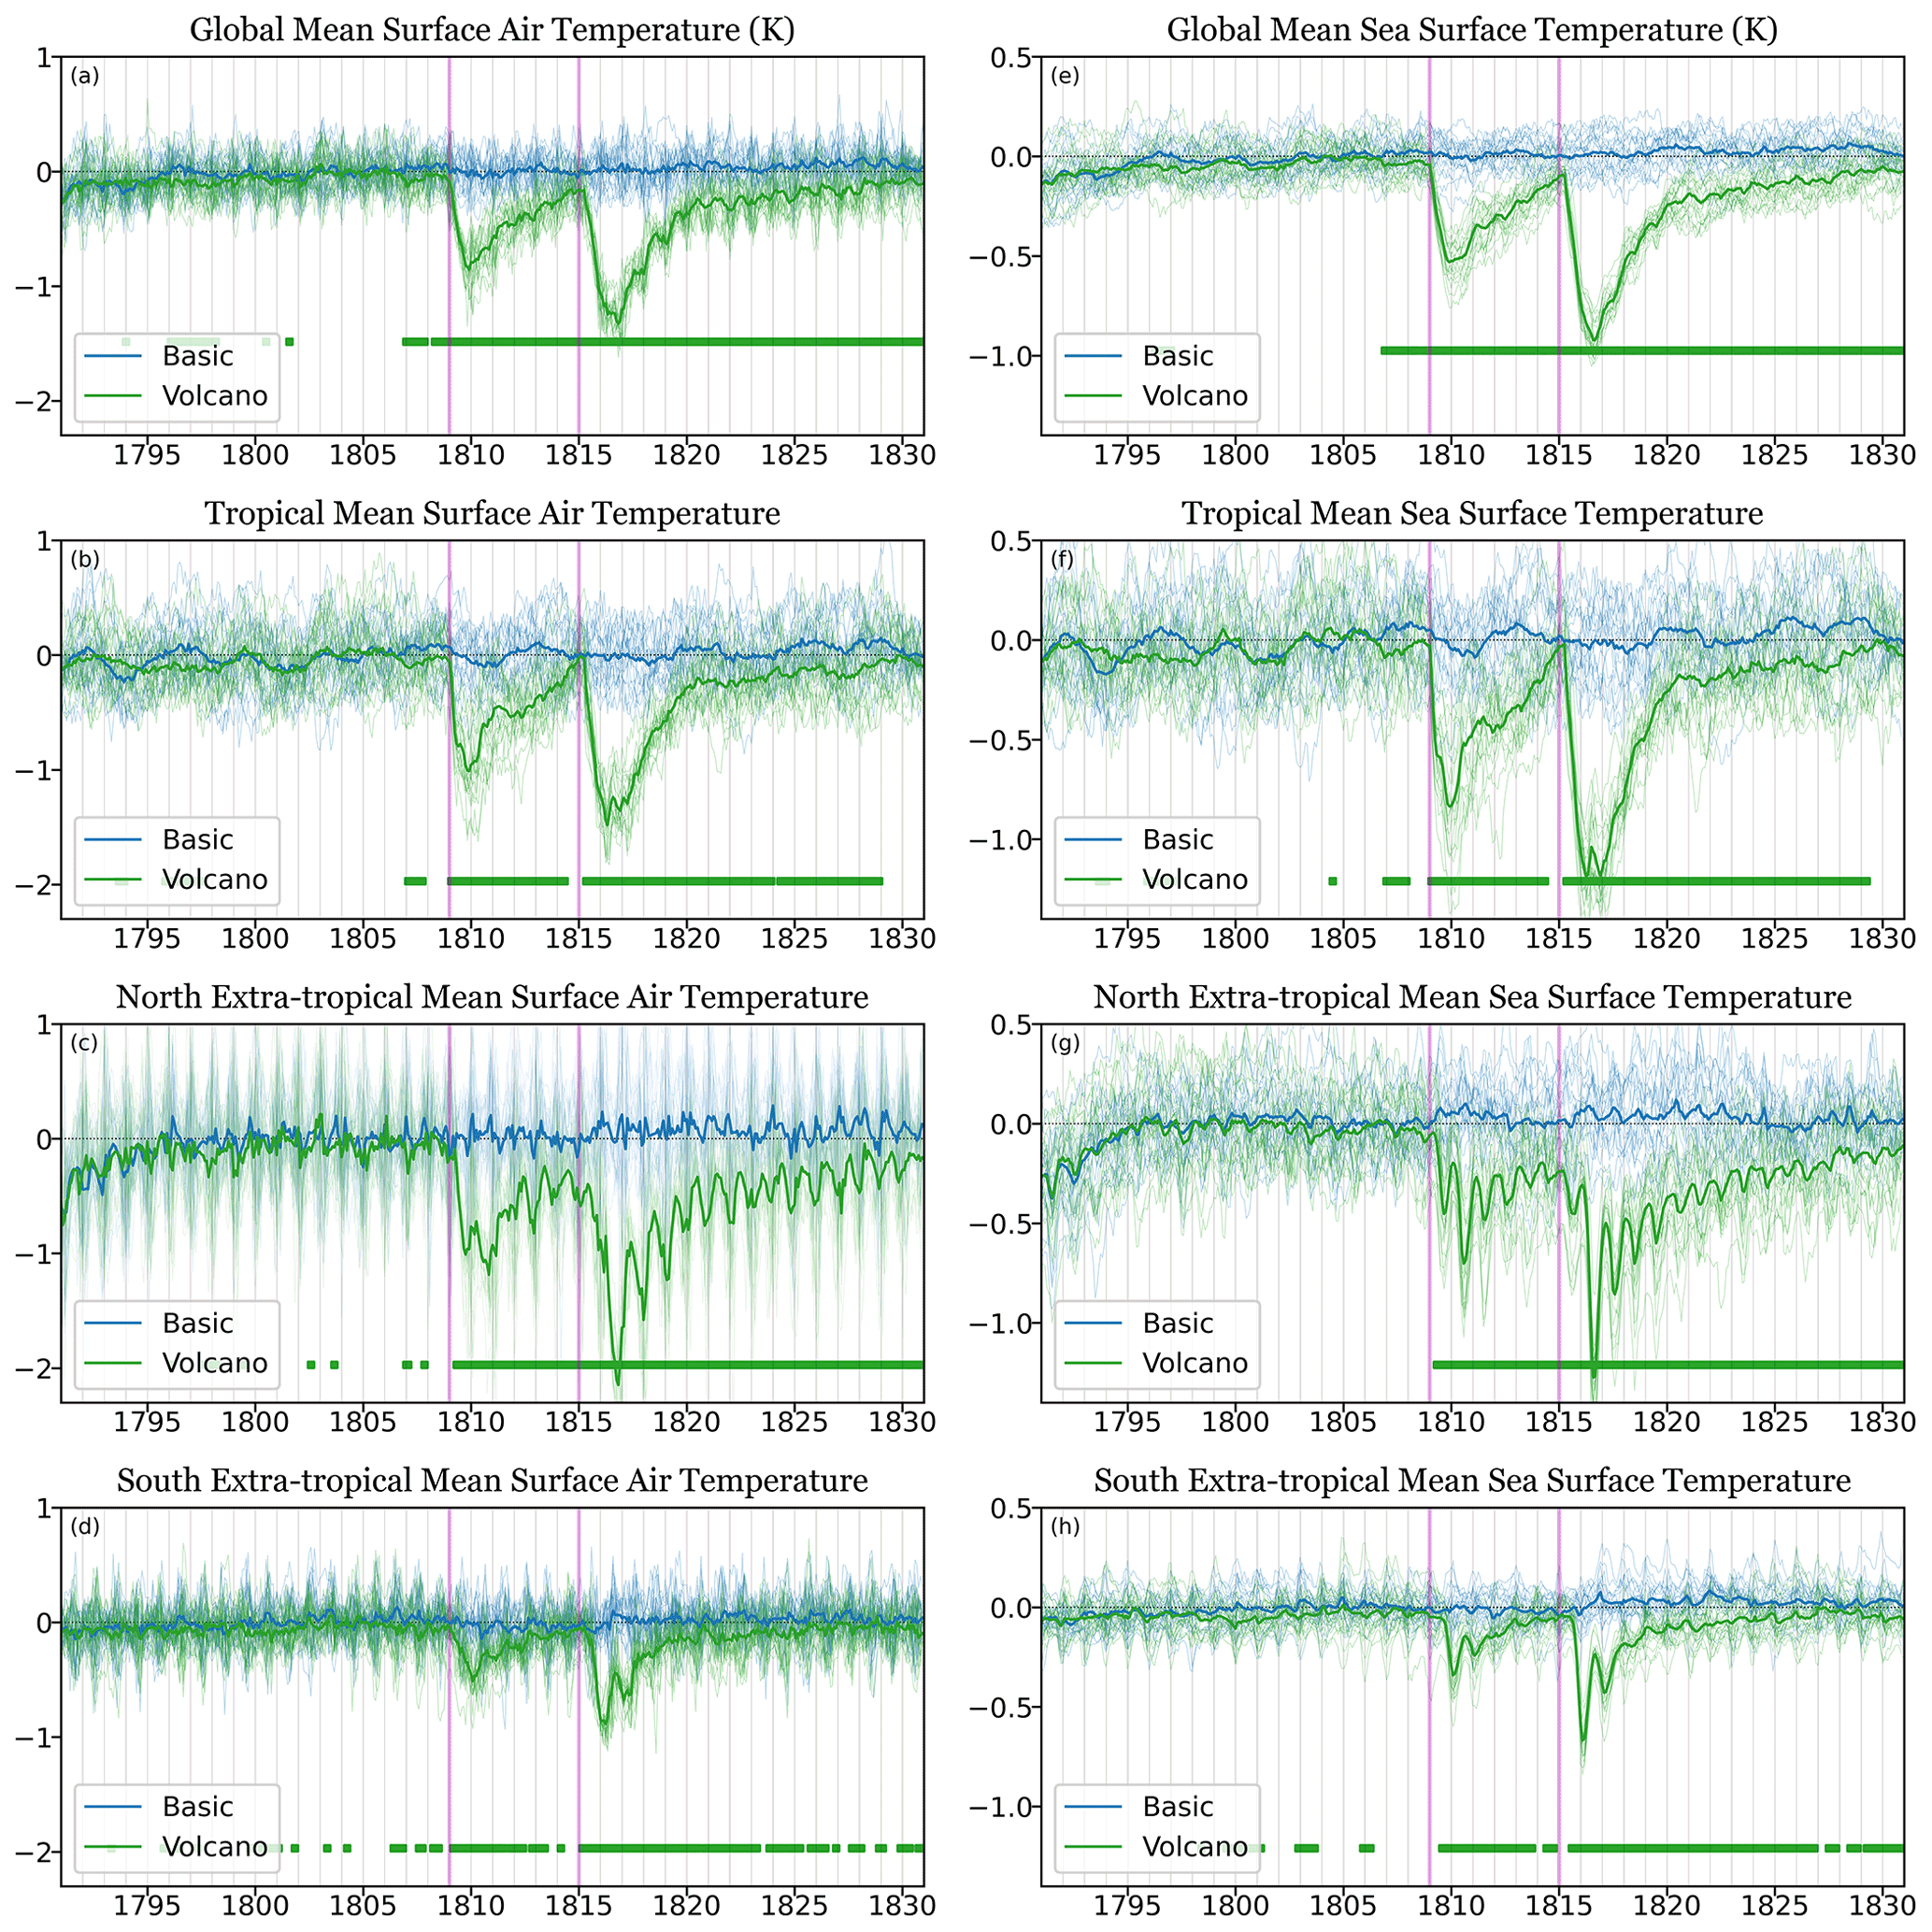
Figure 3a and e shows the spatial structure of the mean SAT anomalies in winter and summer from SolarStrong over 1809–1826. This period will be used for the rest of the analyses since it covers the largest solar irradiance difference (∼1815), the 1809 and 1815 eruptions, and the post-eruption responses (1821–1826). The largest temperature difference to Basic is found in the Arctic region in winter as a result of AA. The large temperature change however is not significant due to the large variabilities in the Arctic. Significant differences for individual grid points are mainly simulated in the tropical region but rarely in the extratropics even though the northern extratropical means (Fig. 2c) differ most significantly. This indicates the difficulty of detecting surface cooling responses from the reduced solar forcing in specific regions. Even for the northern extratropical cooling that is significant in the spatial average (Fig. 2c), the cooling is not persistently located in specific regions but varies between the realizations. In fact, significant regions in SST and SAT are often collocated (Fig. 3b and f), indicating the control of SST on SAT in these regions. For the SST, the Northern Hemisphere shows mostly negative values except in the Gulf Stream and Kuroshio regions, echoing the stronger cooling signatures in the northern extratropics. The positive anomalies in the Gulf Stream and Kuroshio and the strong cooling in the north-east of the Pacific and Atlantic basins manifest the weakening of the wind-driven circulation, which may be due to the weaker westerly winds (Kwon and Joyce, 2013) and the reduced freshwater flux from Arctic sea ice changes (Zanchettin et al., 2012). The weaker westerlies are associated with a negative phase of the AO (Fig. 3h) in boreal winter, but not in summer (Fig. 3d), even though the SST cooling patterns show not much difference. The increase of the Arctic sea-ice extent is found in all seasons (Fig. 3c and g) with a smaller increase in the summer than in winter. We interpret this stronger seasonality of Arctic sea-ice extent under solar forcing to be related to the smaller SST seasonality, where less heat is stored in the summer ocean, leading to the stronger sea-ice formation in winter (Carton et al., 2015). The reduction of the westerlies may also be caused by the weakening of the stratospheric polar vortex due to the reduction in the meridional temperature gradient in the lower stratosphere, which we will discuss in Sect. 4.2. In contrast, the Southern Ocean is characterized by a mix of warming and cooling signatures where the Antarctic sea-ice extent also decreases and increases, respectively. This entails why not much surface cooling is found in the region-averaged southern extratropics.
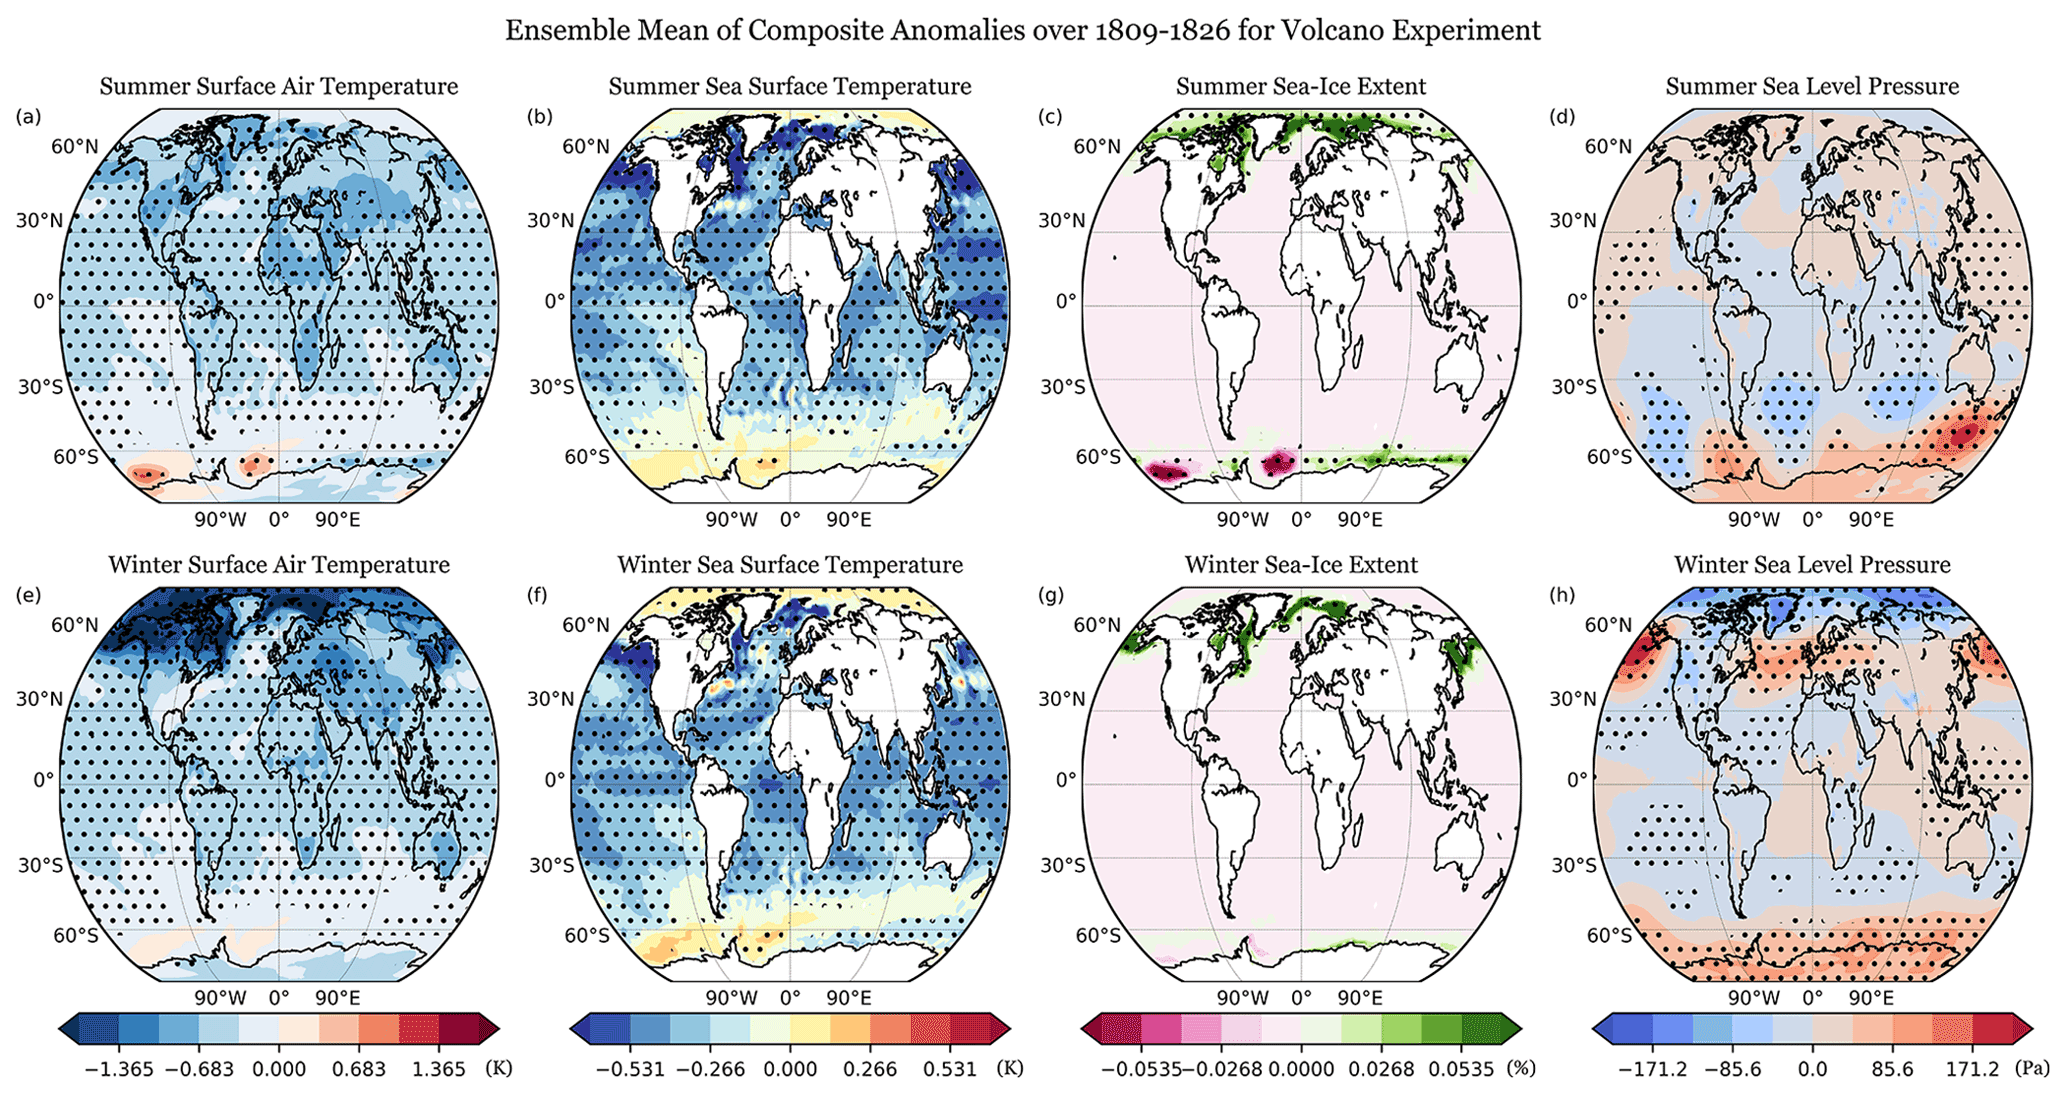
Figure 5As in Fig. 3 but for the Volcano experiment with two times larger color scales.
The Volcano experiment (green lines; Fig. 4a and e) shows clear surface temperature decreases immediately after the 1809 and 1815 eruptions with a maximum of ensemble mean SST cooling around −0.53 and −0.94 K (−0.82 and −1.36 K for SAT), respectively. As indicated in Fig. 1c with the AOD changes, the effect of the prescribed volcanic radiative forcing is mostly removed after 3–4 years; however, the temperature in all regions is not only significantly different right after the eruptions compared to Basic after 1809, but the negative anomalies continue even when the direct volcanic effect is strongly reduced 5–6 years after the eruption. The tropical region (Fig. 4b and f) mainly shapes the global cooling signature in the first 3–5 years, when volcanic forcing exists, while the northern extratropics (Fig. 4c and g) contribute comparatively more to the cooling afterward. Weaker (larger) seasonal variations in the northern extratropics are observed in the SST (SAT). Directly responding to the aerosol forcing, the tropical cooling has a sharp increase followed by a decrease in the first few years after the eruptions, and the SST cooling maintains at ∼0.2 K afterward. This is because the cooling is stored in the upper ocean and slowly diffuses and is transported to the entire ocean.
For the northern extratropics (Fig. 4c and g), SAT and SST show a distinct response. After the direct responses to volcanic eruptions, the SST cooling slowly reduces by ∼0.1 K yr−1, while the SAT returns to around −0.5 K rapidly with the same pace as other regions along with the diminishing volcanic forcing (even clearer if considering land only). We interpret this slower retrieval of SST to be related to interactions with the sea-ice extent as mentioned in solar-induced cooling (Carton et al. 2015), where the SST cooling is stored in the mixed layer during summer to impede the summer sea ice loss and to enhance the winter sea ice formation. In addition, a sea ice–ocean–atmosphere feedback, in which the sea ice (particularly in the Barents Sea) can be maintained by the change of ocean inflow and associated heat transport can contribute to the prolonged cooling (Lehner et al., 2013). The similar reduced SST seasonality with the colder summer and the steady retrieval of the cooling is found in the Southern Hemisphere only the first few years after eruptions, as the Antarctic sea ice shows both increases and decreases depending on the region.
The cooling pattern of the Volcano experiment is similar to the SolarStrong experiment in general (Fig. 5), where the AA results in larger SAT cooling at high latitudes in winter. The sea ice-related regions, such as the Gulf of Alaska and the Labrador Sea, exhibit the most apparent SST cooling. Differences can be found in the sea-ice extent and sea level pressure. The Volcano experiment shows more sea ice extending to lower latitudes in both summer and winter due to the stronger cooling from volcanic forcing. A positive AO (i.e., low pressure in the Arctic and high pressure in the midlatitude) is found in boreal winter in the Volcano experiment, while SolarStrong has a negative AO with high pressure in the Arctic (Fig. 3). This different AO response is related to the distinct stratospheric responses from volcanic aerosol forcing and reduced solar irradiance, which will be further discussed in Sect. 4.2. That is, although differences are found between the Volcano and SolarStrong experiments, such as a more southward extension of the sea-ice extent, opposite surface pressure patterns, and the cooling magnitudes, the response patterns of surface temperature are similar. This similarity indicates that the top-down mechanism via the AO has limited impacts and the surface is more dominated by the bottom-up direct radiative cooling.
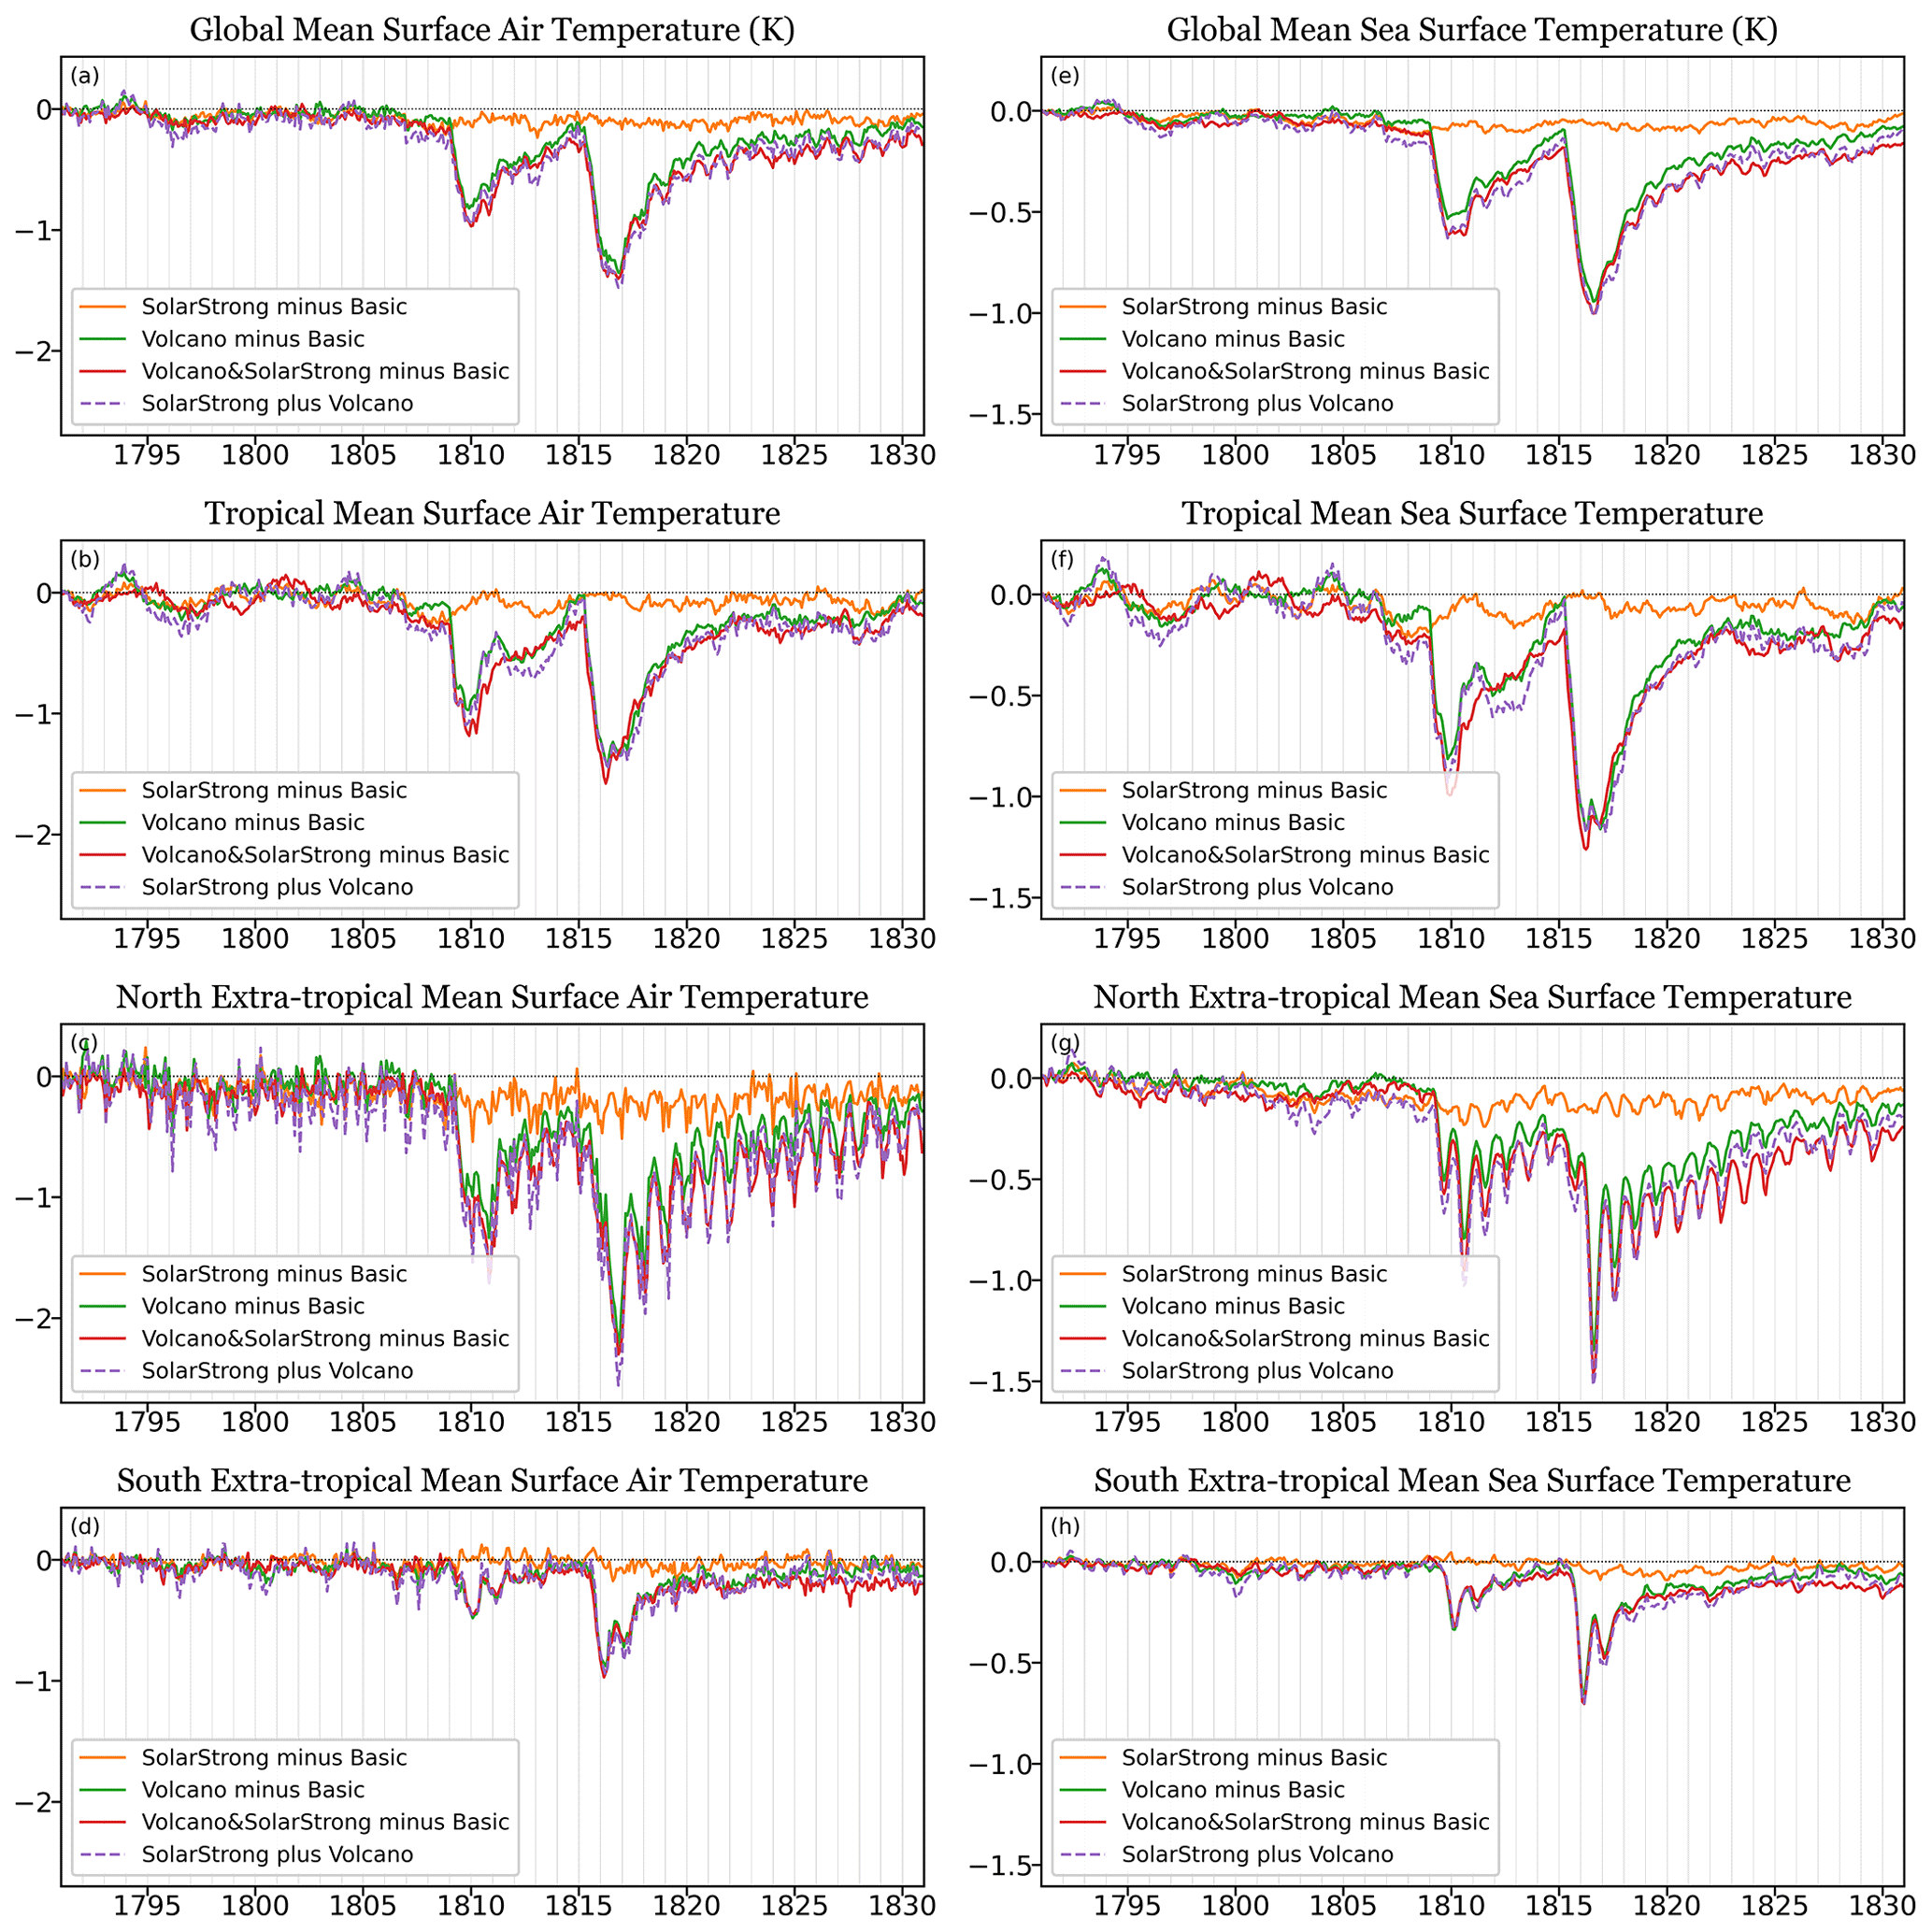
Figure 6(a) Ensemble mean global mean SAT (K) anomalies of the SolarStrong (orange), Volcano (green), and Volcano & SolarStrong (red) minus the Basic experiment. The purple dashed line is the sum of SolarStrong and Volcano (minus Basic) experiment. The gray vertical lines are the January for each year. (b) Tropical mean, (c) northern extratropical mean, and (d) southern extratropical mean. (e)–(h) are for SST (K).
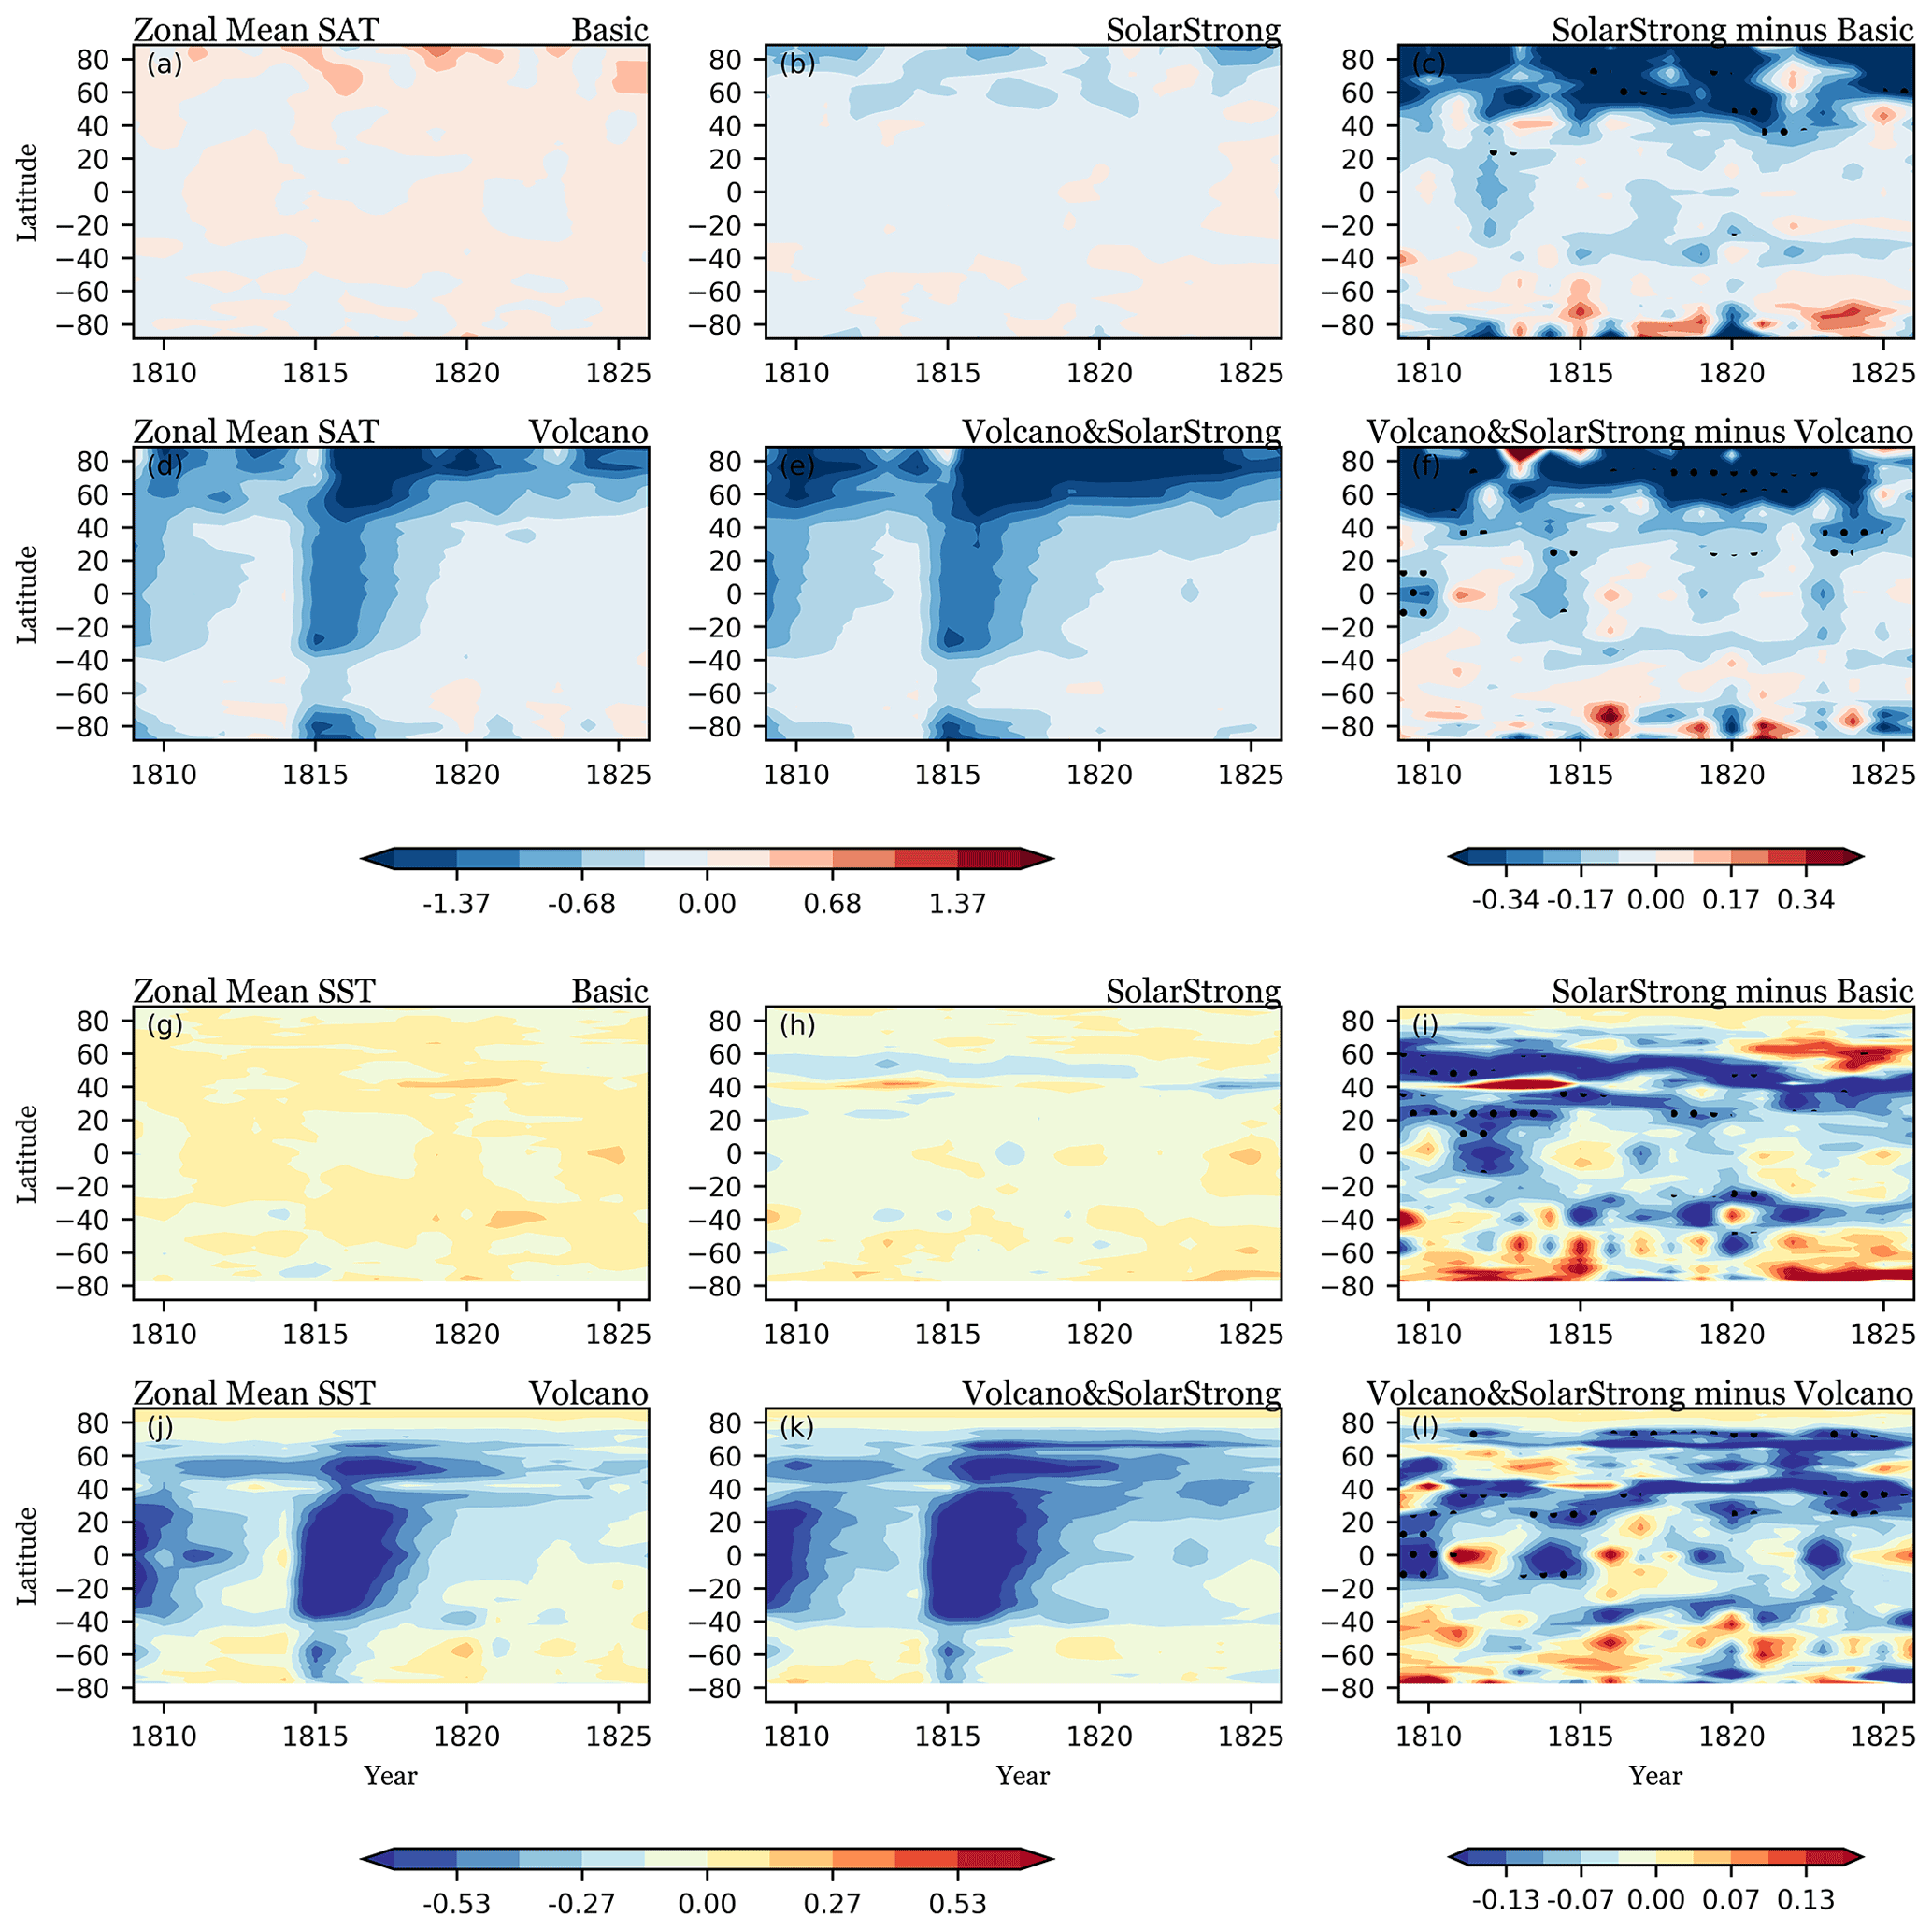
Figure 7(a) Hovmöller plot for zonal mean winter SAT anomaly (K) for the Basic experiment. (b) The SolarStrong, (c) SolarStrong minus Basic. The black dots illustrate the significance (see Sect. 2 for details). (d) Volcano, (e) Volcano & SolarStrong, and (f) Volcano & SolarStrong minus Volcano. (g)–(l) are for SST (K).
4.1 The interplay at the surface
The Volcano & SolarStrong experiment is conducted to analyze the combined response of the stronger solar forcing and the volcanic aerosols. We find that the global average surface temperature response is, in general, additive when separately or together imposing the volcanic and solar forcing, even for the seasonality changes in the northern extratropics and the slow return of the northern extra-tropical SST. This additivity is clearly illustrated in Fig. 6a–h by the similar values of the added SolarStrong and Volcano signals (purple dashed lines) in comparison to the Volcano & SolarStrong experiment (red solid lines) after the eruptions. The SST changes match even 7 years after the 1815 Tambora eruption with the Volcano & SolarStrong experiment. To further study whether the additivity also exists spatially on a regional scale, Fig. 7 shows the zonal mean Hovmöller plot of the winter surface temperature difference of solar signals (Volcano & SolarStrong minus Volcano and SolarStrong minus Basic). The SAT responses are similar in the polar region (Fig. 7c and f). The AA dominates the cooling response when the reduced solar radiation is imposed on both cases with/without volcanic forcing, while the SST has a distinct response. The reduced solar radiation in the case without volcanic forcing causes the largest SST cooling steadily remaining at around 50∘ N (Fig. 7i) and over time echoes the large cooling at the Gulf of Alaska and the Labrador Sea in the SolarStrong experiment. On the other hand, when imposing the solar forcing in the case with volcanic forcing, a large cooling signature for the Northern Hemisphere is found mainly south of 50∘ N (Fig. 7l), with additional cooling related to the two eruptions. Around 1815, additional cooling exists in the western tropical Pacific and Atlantic (Fig. 8d), and then propagates to the higher latitudes through the ocean circulation of the western boundary currents (Fig. 8d–f). Large cooling can also be found in the Arctic (Norwegian Sea), related to the expansion of sea ice with reduced solar irradiance. These differences in spatial SST responses indicate that the regional response is different when solar forcing interacts with the volcanic forcing even though the large-scale average responses are additive.
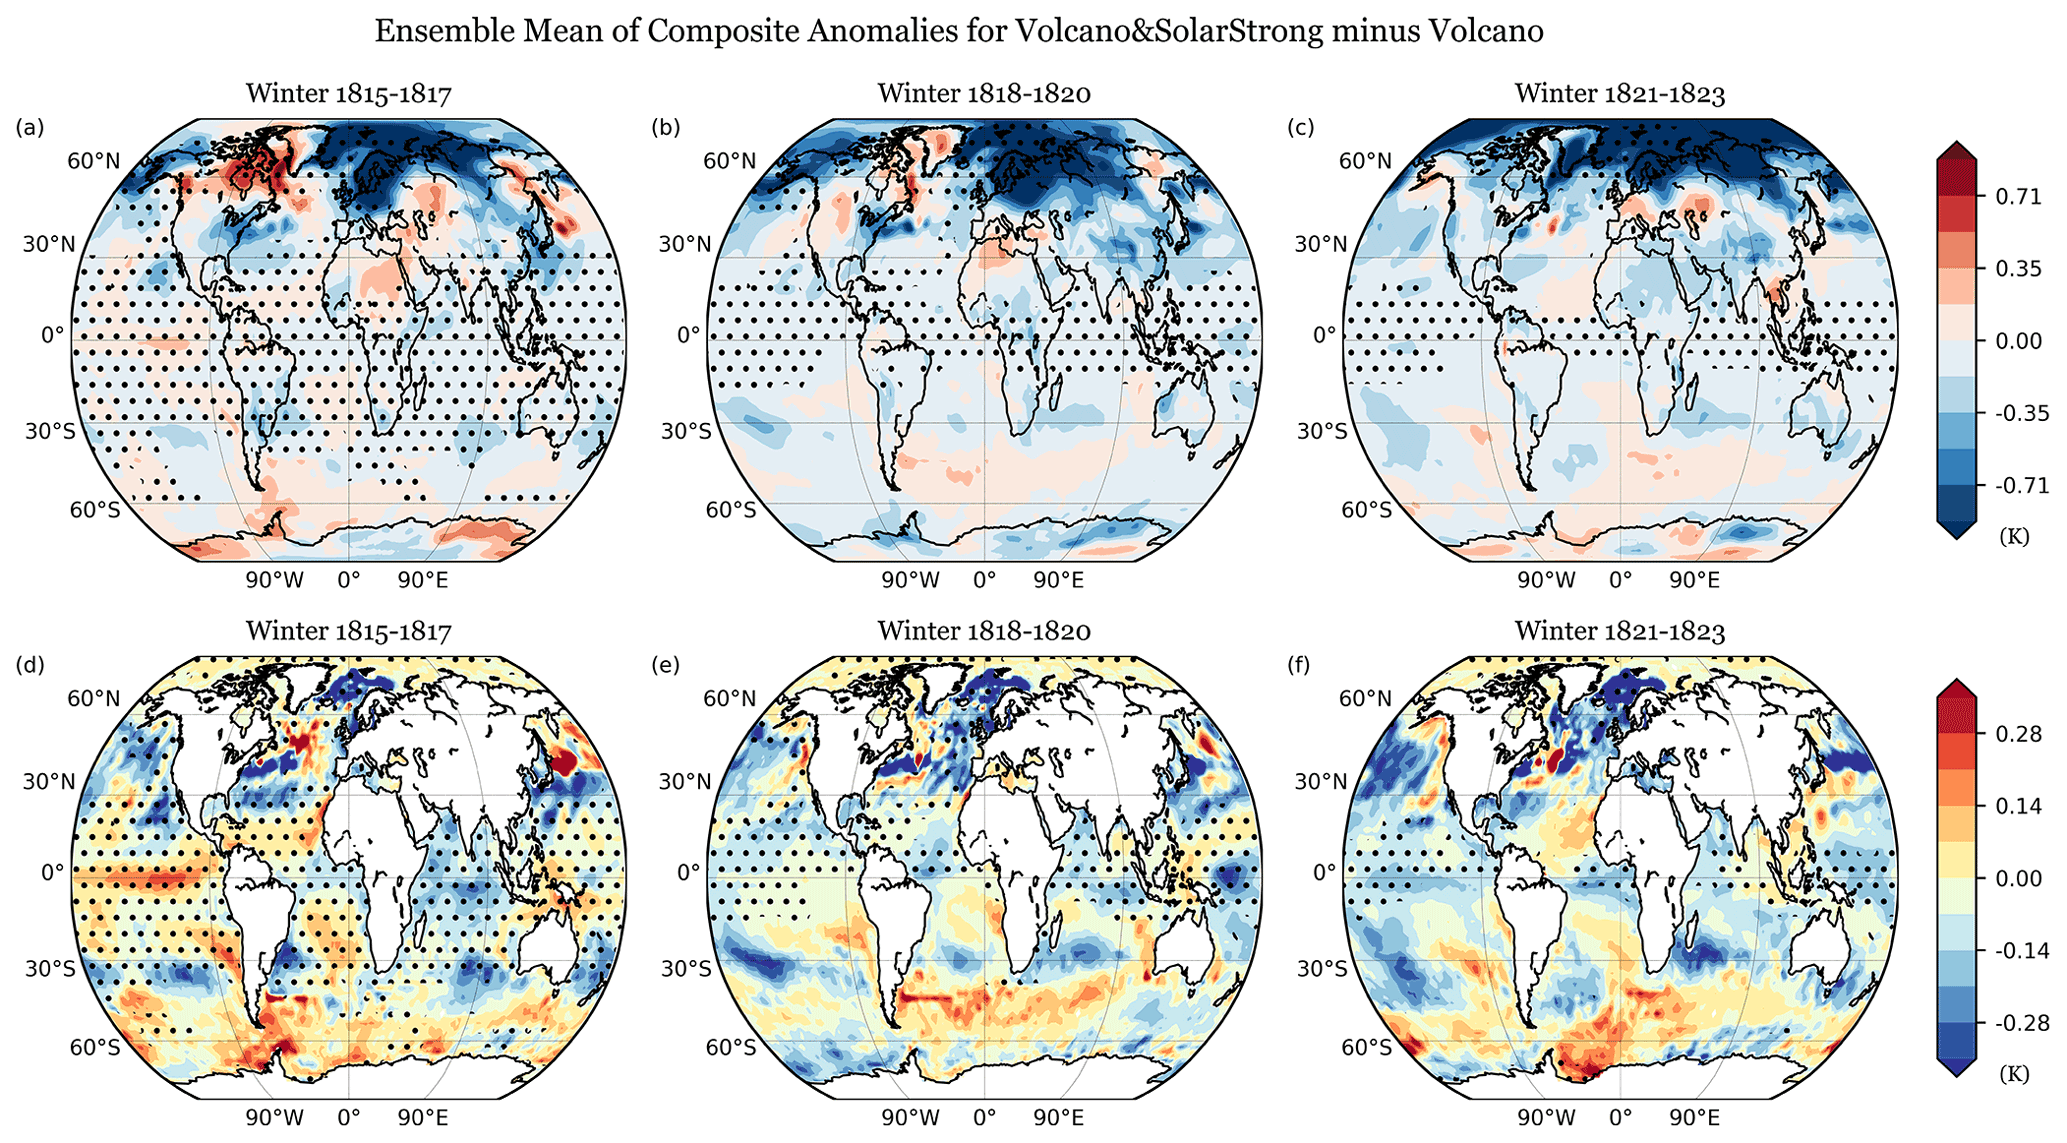
Figure 8(a) Composite of ensemble mean winter SAT (K) over 1815–1817 for the Volcano & SolarStrong experiment minus the Volcano experiment. And the block dots show the grid points with significant difference (5 % level) between the Volcano & SolarStrong and Volcano experiment with t test from 20 ensembles. (b) and (c) are for 1818–1820 and 1821–1823, respectively. (d)–(f) are for the SST (K). The color scale is the same as in Fig. 3.
4.2 The interplay in the atmosphere
Here, we further investigate the atmospheric responses to the volcanic and solar forcings by inspecting the zonal means of air temperature and zonal wind anomalies (Fig. 9) for the volcano (1809–1820) and the post-volcano (1821–1826) periods. In the SolarStrong experiment (Fig. 9a) over the volcano period, the reduced solar irradiance leads to an insignificant weaker polar vortex (shading) in the winter hemisphere due to the weaker meridional temperature gradient (contour). The easterly anomalies in the subpolar region can be found throughout the troposphere and stratosphere and reduce towards the surface to almost zero. That is, the reduced solar radiation can warm the high-latitude atmosphere through the top-down mechanism (though not significantly), but a limited response is found at the surface with no tendency for a negative AO index (Fig. 10d) even though a weak AO pattern can be observed in the sea level pressure (Fig. 3h). For the Volcano experiment, the direct responses from volcanic aerosols can be found in 1809–1820 (Fig. 9b). The warming in the tropical lower stratosphere from aerosol absorption enhances the meridional temperature gradient, leads to westerly anomalies around 25 to 50∘ N, strengthens the polar vortex, and cools the polar stratosphere in the winter hemisphere. From the Volcano & SolarStrong experiment (Fig. 9c), we can see that the impacts from volcanic aerosol forcing overwhelms the cooling induced by the reduced solar irradiance plus ozone in this period due to the relatively larger magnitude of the volcanic forcing.
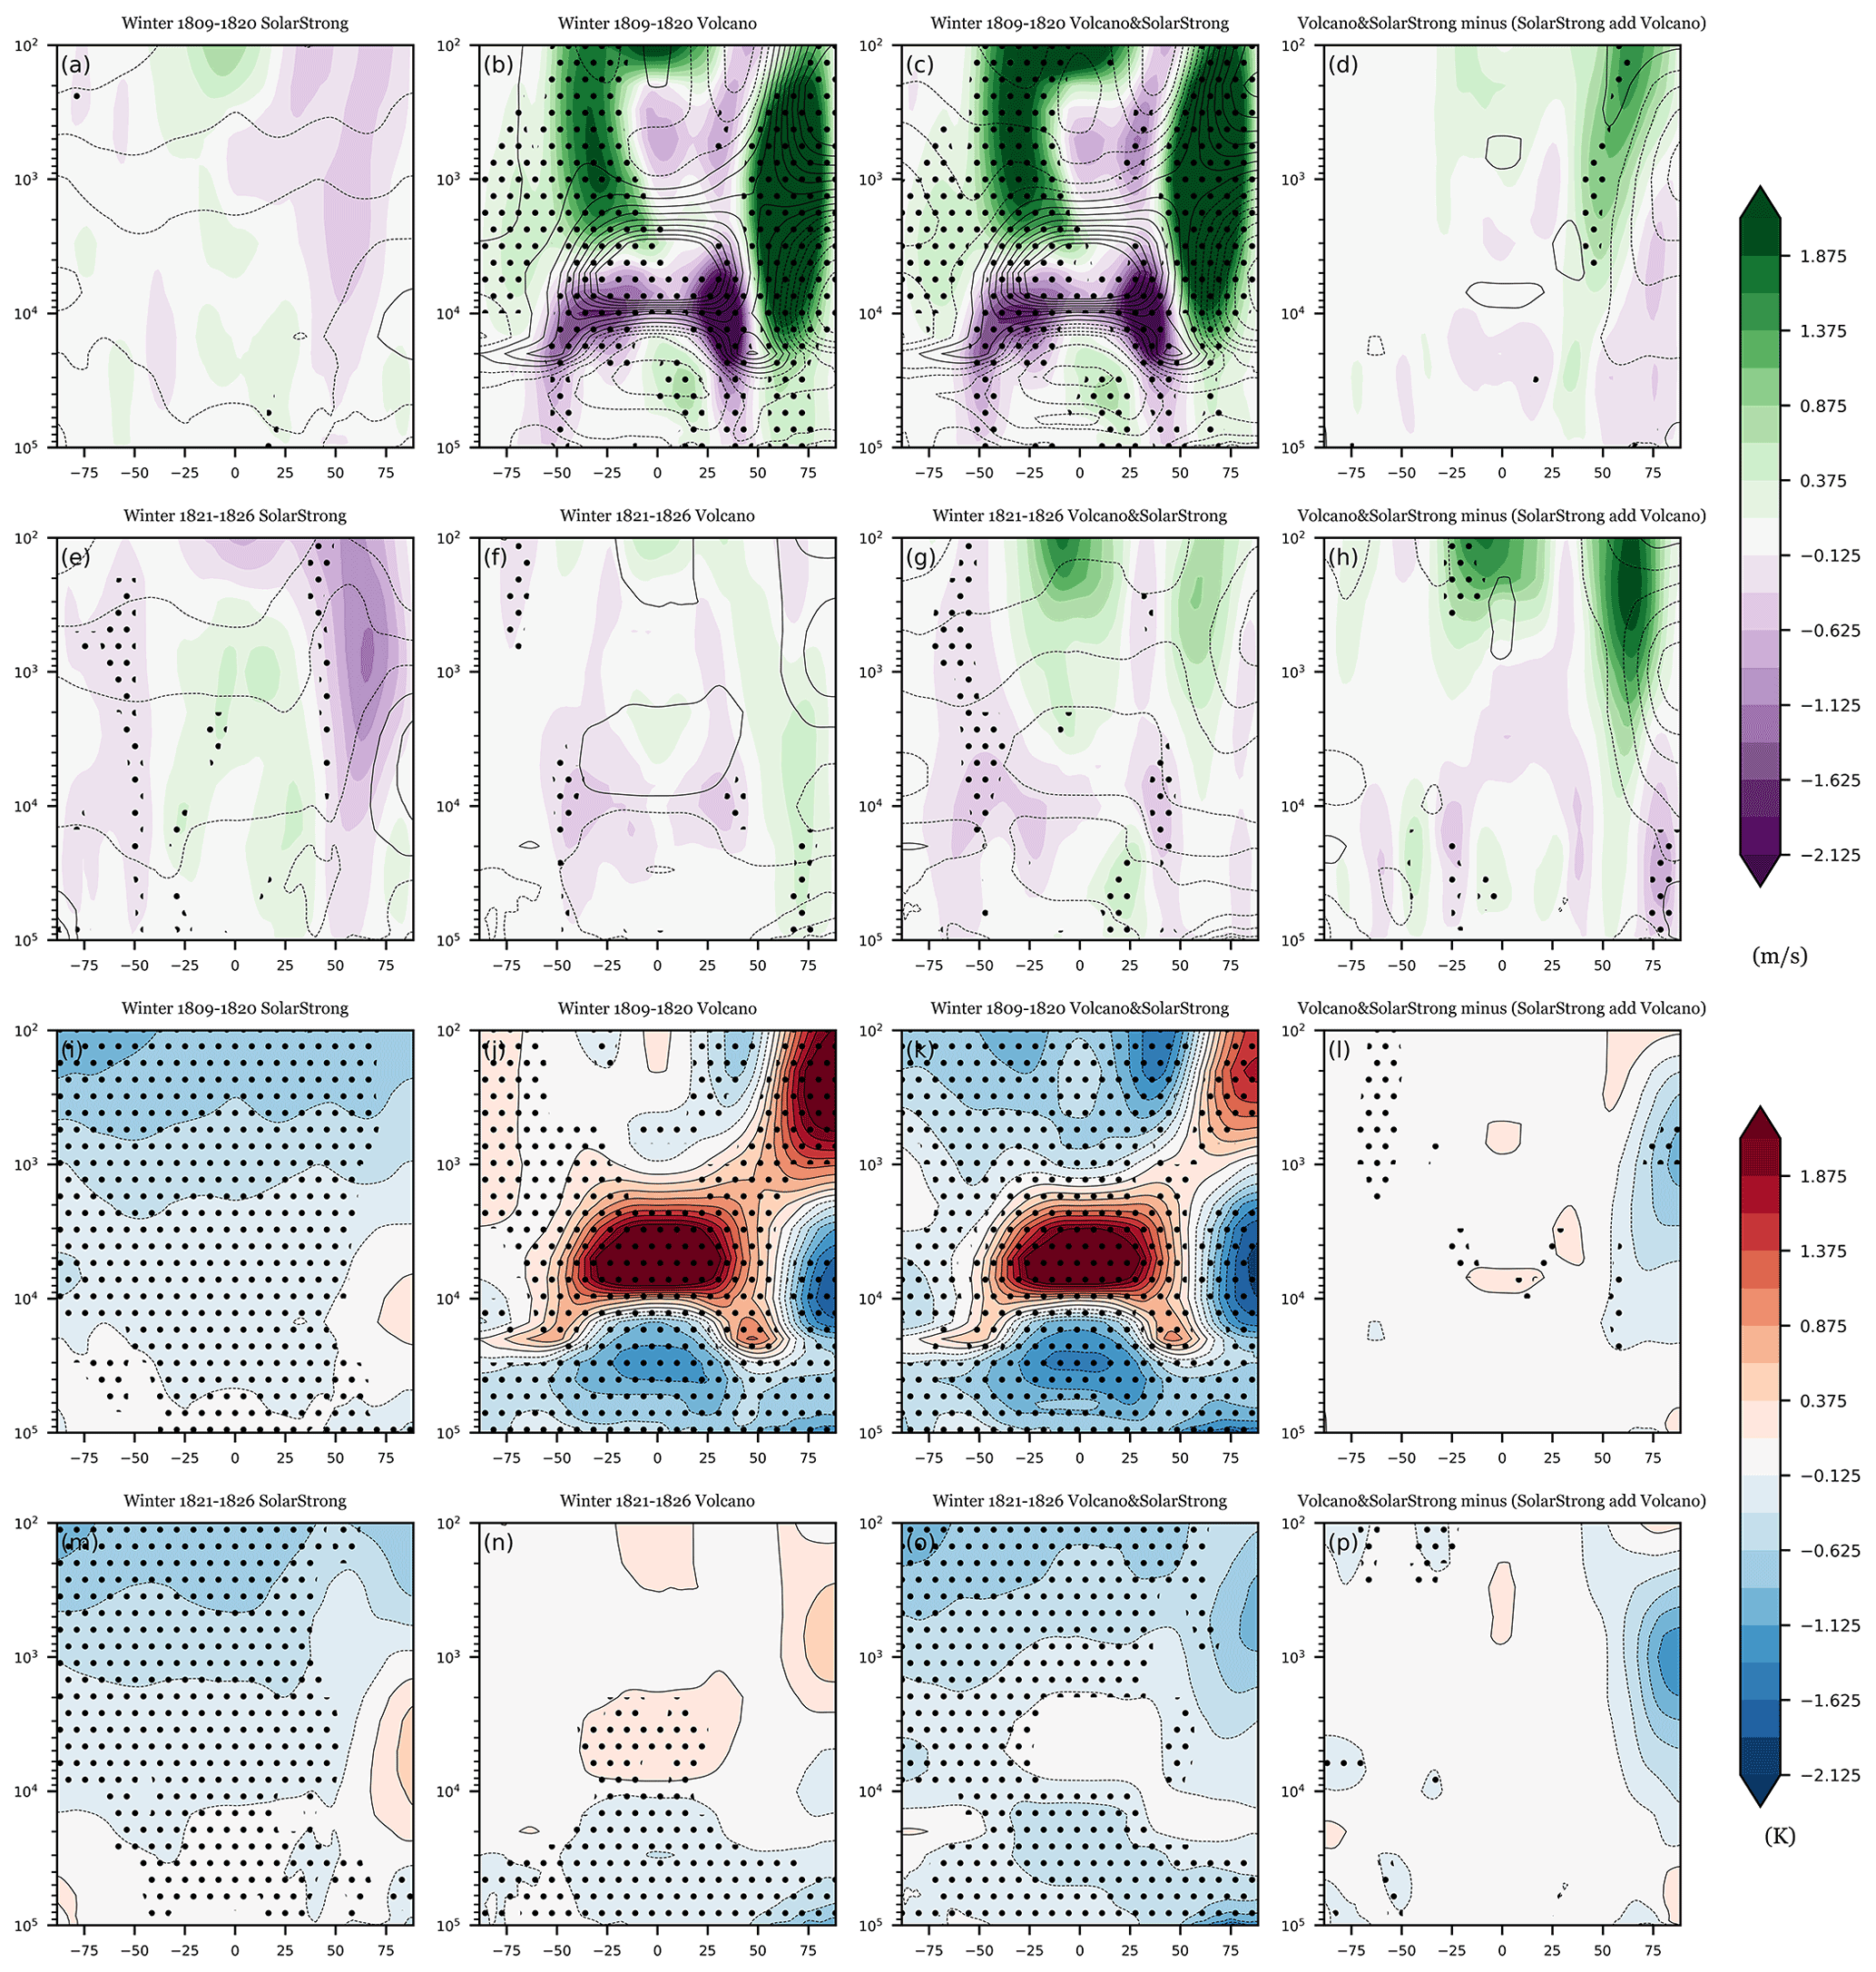
Figure 9(a) Ensemble mean of composite zonal mean temperature (K; contour with internal 0.25 K) and zonal winds (m s−1; shading) anomalies over 1809–1820 winters for SolarStrong experiment. (b) Volcano, (c) Volcano & SolarStrong, and (d) Volcano & SolarStrong minus (SolarStrong plus Volcano). The black dots in (a)–(c) show the grid points with significant differences (5 % level) of zonal mean zonal winds compared to the Basic experiment, while in (d) shows the significant differences between the Volcano & SolarStrong and SolarStrong plus Volcano. (e)–(h) are for 1821–1826 winters. (i)–(p) are for zonal mean temperature, and also the black dots.
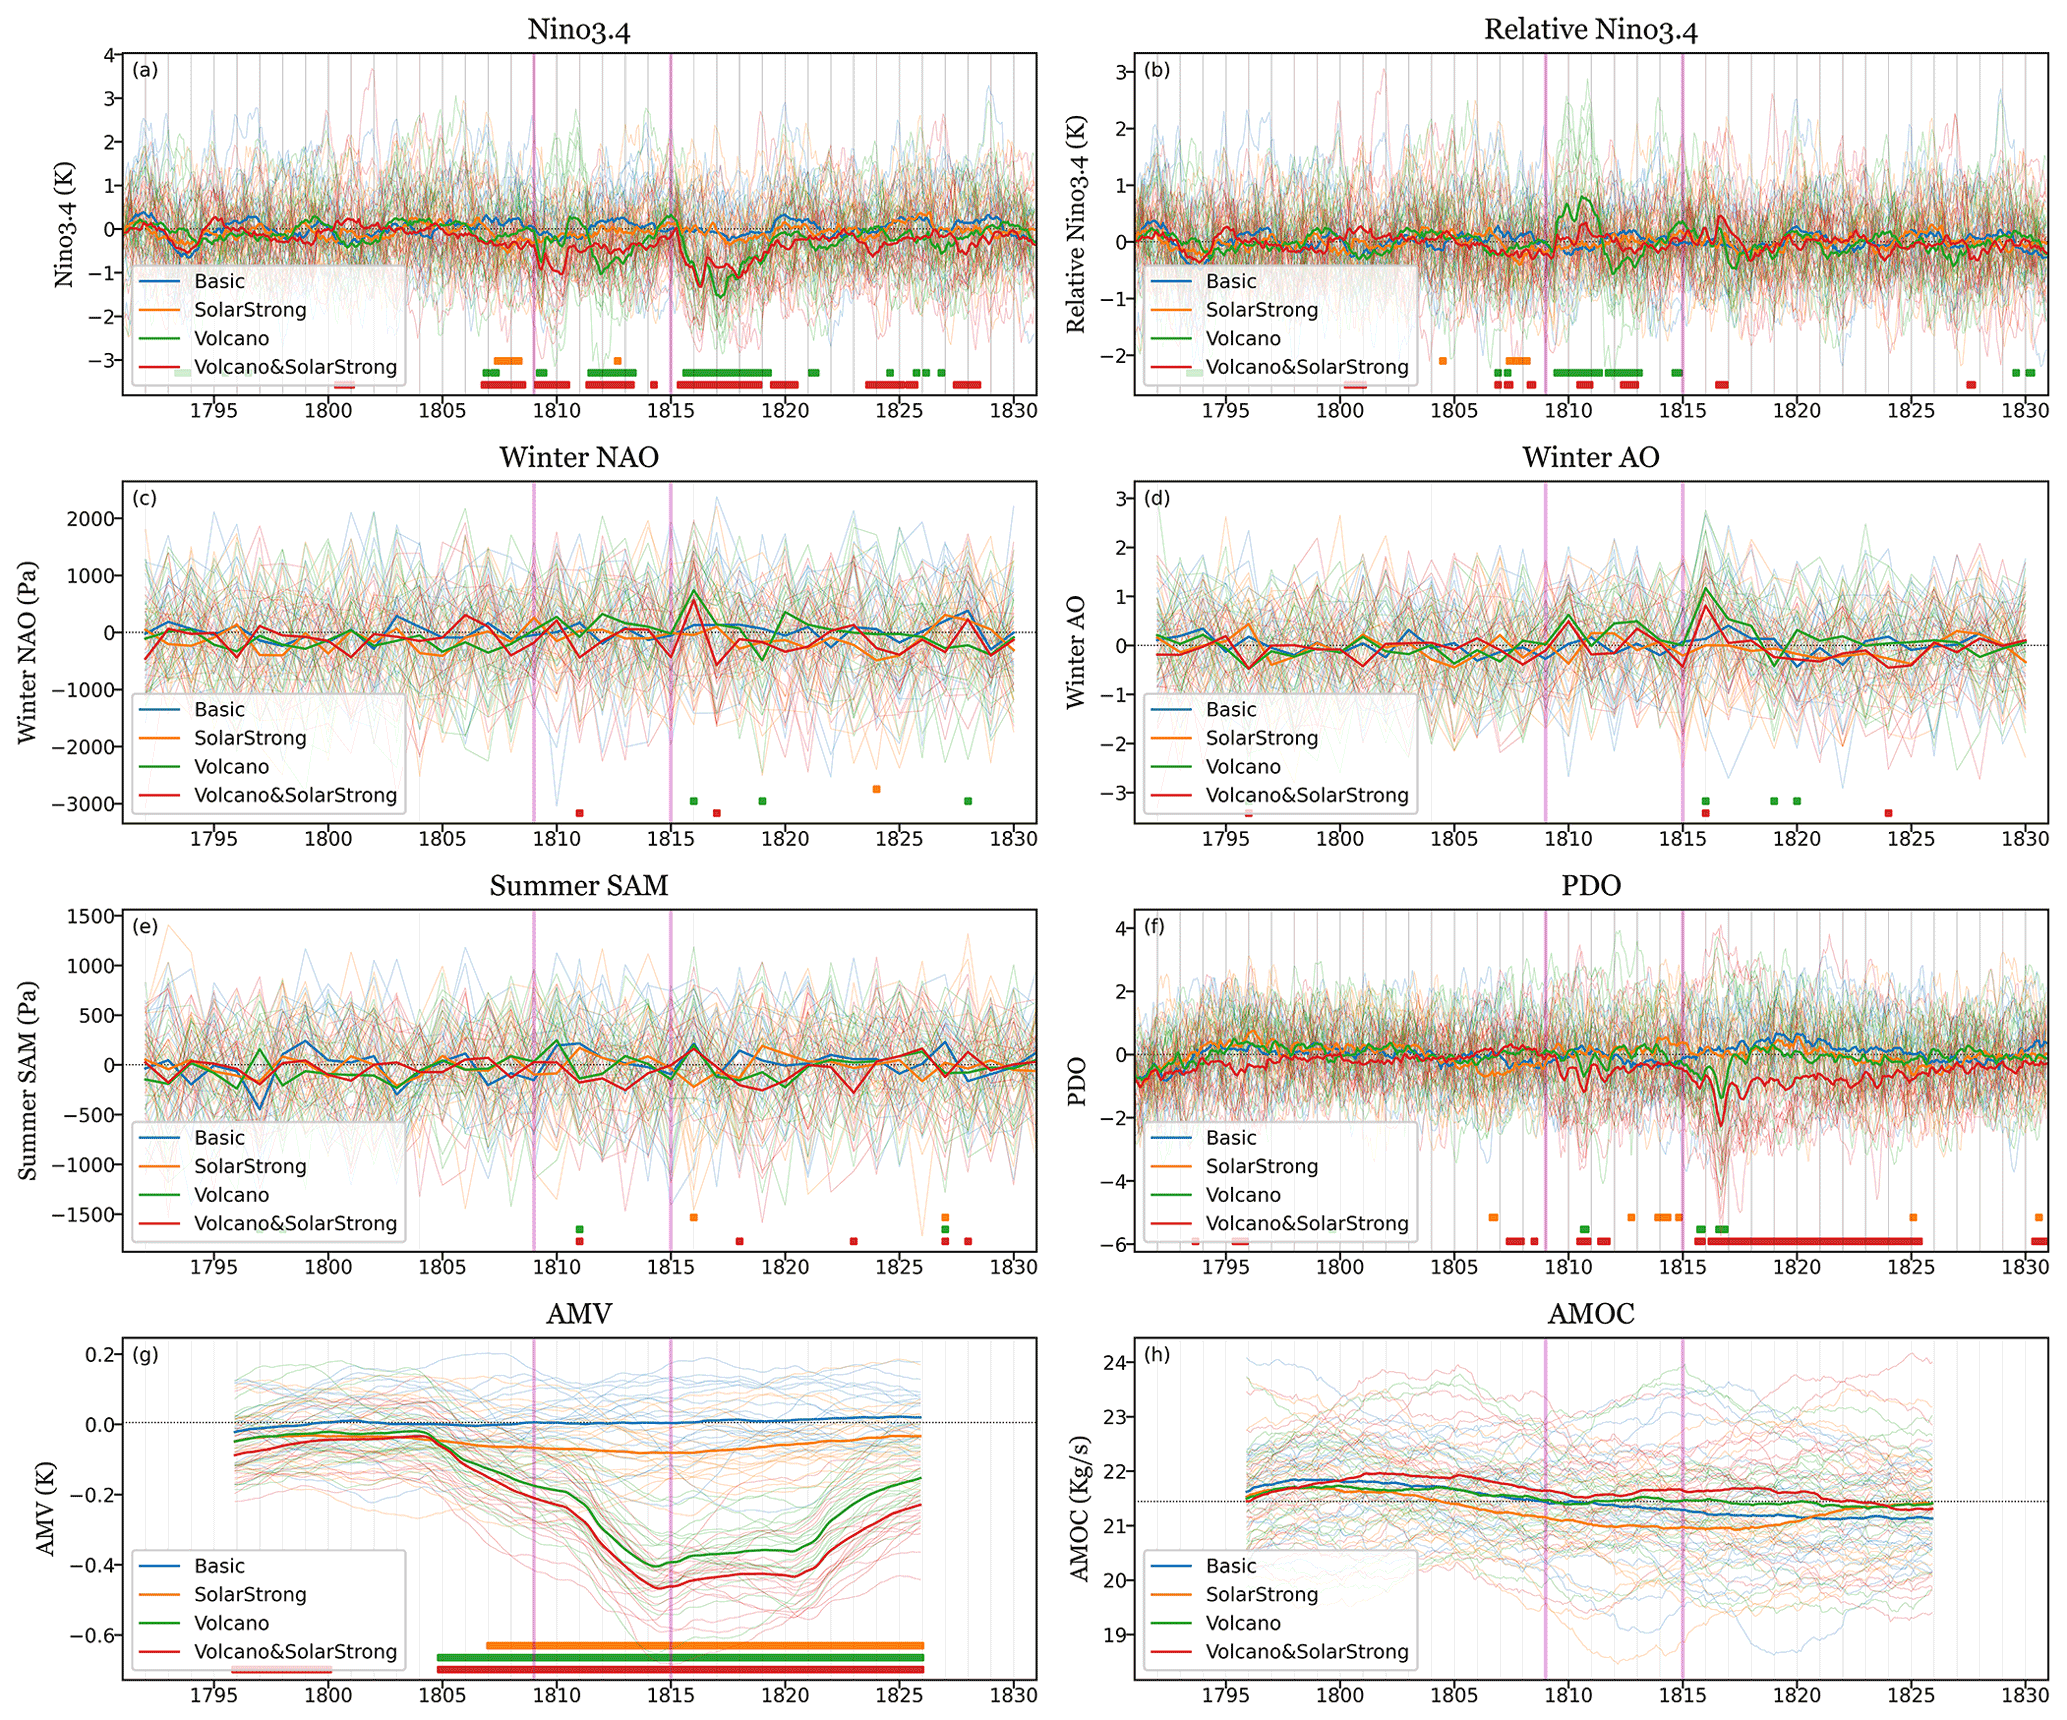
Figure 10As in Fig. 2, but for (a) the Niño3.4 index (K), (b) relative Niño3.4 index (K), (c) winter NAO index (Pa), (d) winter AO index, (e) summer SAM index (Pa), (f) PDO index, (g) AMV index (K), and (h) AMOC index (kg s−1). The Basic experiment is in blue, SolarStrong is in orange, Volcano is in green, and Volcano & SolarStrong is in red.
To further investigate whether the responses are additive, Fig. 9d shows the difference between the Volcano & SolarStrong and the addition of the SolarStrong and Volcano experiments. The additional westerly anomalies in the middle to upper stratosphere illustrate an even stronger polar vortex in the Volcano & SolarStrong experiment accompanied with a cooler polar stratosphere. This entails that the reduced solar radiation may contribute to a stronger polar vortex in the middle stratosphere (although we can identify only a few significant grid points) or be overwhelmed by the volcanic eruptions when strong volcanic eruptions occur. Further detailed studies will need much larger ensemble members due to the strong internal variability in the Arctic climates (Liang et al., 2020).
For the post-volcano period (1821–1826), the direct impact from the volcanic aerosol becomes weaker and the responses are comparable with the solar forcing. In the tropical lower stratosphere and upper troposphere, the temperature responses in Volcano & SolarStrong (Fig. 9g) show negative values, which is similar to the combination of the SolarStrong (Fig. 9e) and Volcano experiments (Fig. 9f). This may explain why no apparent response is found in the polar vortex and polar air temperature in the Volcano & SolarStrong experiment since the tropical stratospheric temperature changes from solar and volcanic forcing balance each other. In fact, if we inspect their difference (Fig. 9h), similar strengthening of the polar vortex and colder air temperature in the middle stratosphere is observed (though not significant) as in the previous period (Fig. 9d). This additional strengthening of the polar vortex when combining solar and volcanic forcing needs to be further examined. In addition, significant results are found in the polar troposphere between the difference in the later period (Fig. 9h), which is related to a corresponding response in the same region in the Volcano experiment (Fig. 9f). This indicates that the volcanic response may be impacted by easterly responses from the solar forcing, even though we cannot assign statistical significance to that. To be noticed, the MPI-ESM1.2-LR used in this study has a prescribed ozone (not interacting with volcanic aerosol changes) and no QBO is simulated, which may impact our results, especially in the stratosphere (Anet et al., 2013). In our simulations, there is on average 2 % difference in the stratospheric ozone between the calculations from SATIRE and PMOD reconstructions, which is within the observed variability (Fioletov et al., 2002) and should not have statistically detectable temperature changes.
4.3 The interplay in the ocean and in climate indices
The subsurface ocean responses are additive in global mean/large scale (not shown) as they are related to the surface ocean changes, which are also additive when separately and/or together including solar and volcanic forcing. Despite the additivity in most regions, the El Niño–Southern Oscillation (ENSO) shows a distinct response when combining the solar- and volcano-induced responses. The SolarStrong experiment has no apparent tendency of the Niño3.4 index, while the Volcano and Volcano & SolarStrong experiments have negative values after volcanic eruptions (Fig. 10a). These negative values are, in fact, not a La Niña response but a global cooling signature from the eruptions. The actual ENSO activities can be estimated by the relative Niño3.4 index (Fig. 10b). By removing the tropical mean SST, an El Niño response after an eruption is often found in model simulations (Khodri et al., 2017). In the Volcano experiment, the 1809 eruption is followed by strong El Niño signatures for two consecutive years, while no apparent ENSO activity is found after the 1815 Tambora. This is because there is an El Niño signature in 1814/1815 that tends to trigger a La Niña in the 1815 winter and suppress the El Niño tendency after Tambora. On the other hand, the Volcano & SolarStrong experiment has only weak and nonsignificant El Niño responses for 2 years (the two small spikes) after both the 1809 and 1815 eruptions, indicating that the lower solar irradiance may reduce the tendency toward El Niño after the 1809 eruption.
We further investigate the solar- and volcano-induced responses for other climate indices. The higher latitudes are characterized by the NAO, AO, and SAM. Positive NAO (Fig. 10c) and AO (Fig. 10d) phases are simulated right after the volcanic eruption, signals which are often also observed in the first winter after eruptions (Christiansen, 2008). Limited significant signal however is simulated for the 1810 winter and the 1816 winter, and no significance is found afterward, showing that the large internal variability dominates in the northern extratropical region. These limited signatures explain the weak response of sea level pressure composited over a longer period (Figs. 3h and 5h), and indicate the limited impact from the top-down mechanism in the MPI-ESM-LR1.2. For the Southern Hemisphere, small positives (non-significant) of austral summer SAM are found right after the eruptions (Fig. 10e), which is consistent with the high pressure sitting in the Antarctic and no signature is found afterward.
Multi-decadal-scale responses can be observed for the PDO, AMV, and AMOC. The PDO does not respond significantly to the solar forcing, while volcanic forcing leads the PDO to a negative phase right after the eruptions (Fig. 10f). However, the Volcano & SolarStrong experiment leads to a stronger and longer lasting negative phase after volcanic eruptions compared to the Volcano experiment, especially for the Tambora eruption. This indicates that the solar forcing can enhance the PDO response from volcanic forcing, echoing the additional SST cooling transport to the northern extratropics found in the Volcano & SolarStrong experiment (Sect. 4.1; Fig. 7). The AMV has clear negative signatures from all forcings as expected (Fig. 10g), but whether this cooling response is truly an AMV signal is still under debate since the negative AMV may include the global volcanic cooling signature (Fang et al., 2021). No apparent signature is found in the AMOC (Fig. 10h) except a weak reduction tendency is found in the SolarStrong experiment.
In this section, we investigate the AA response to solar and volcanic forcing. Figure 11a shows the strength of AA cooling over 1809–1826 as approximated by the ratio between the polar surface temperature and the global surface temperature. The SolarStrong experiment has a stronger ensemble mean AA cooling (3.2) compared to the Volcano (1.9) and Volcano & SolarStrong (2.1) experiments over 1809–1826. This difference is however not significant since a large spread is found in SolarStrong. This is because the global cooling is weak and unstable in individual ensemble members, which is also true in the Basic experiment. If we only consider the post-volcano period (1821–1826), the AA in the Volcano and Volcano & SolarStrong experiments increases, and so does the intra-ensemble spread and shows similar values as in the SolarStrong experiment. That is, the strength of AA caused by solar and volcano is comparable (despite differences in absolute global mean cooling) after the direct volcanic forcing diminishes, while only weak AA is found when strong tropical cooling exists in the first 3–5 years corresponding to the direct volcanic forcing.
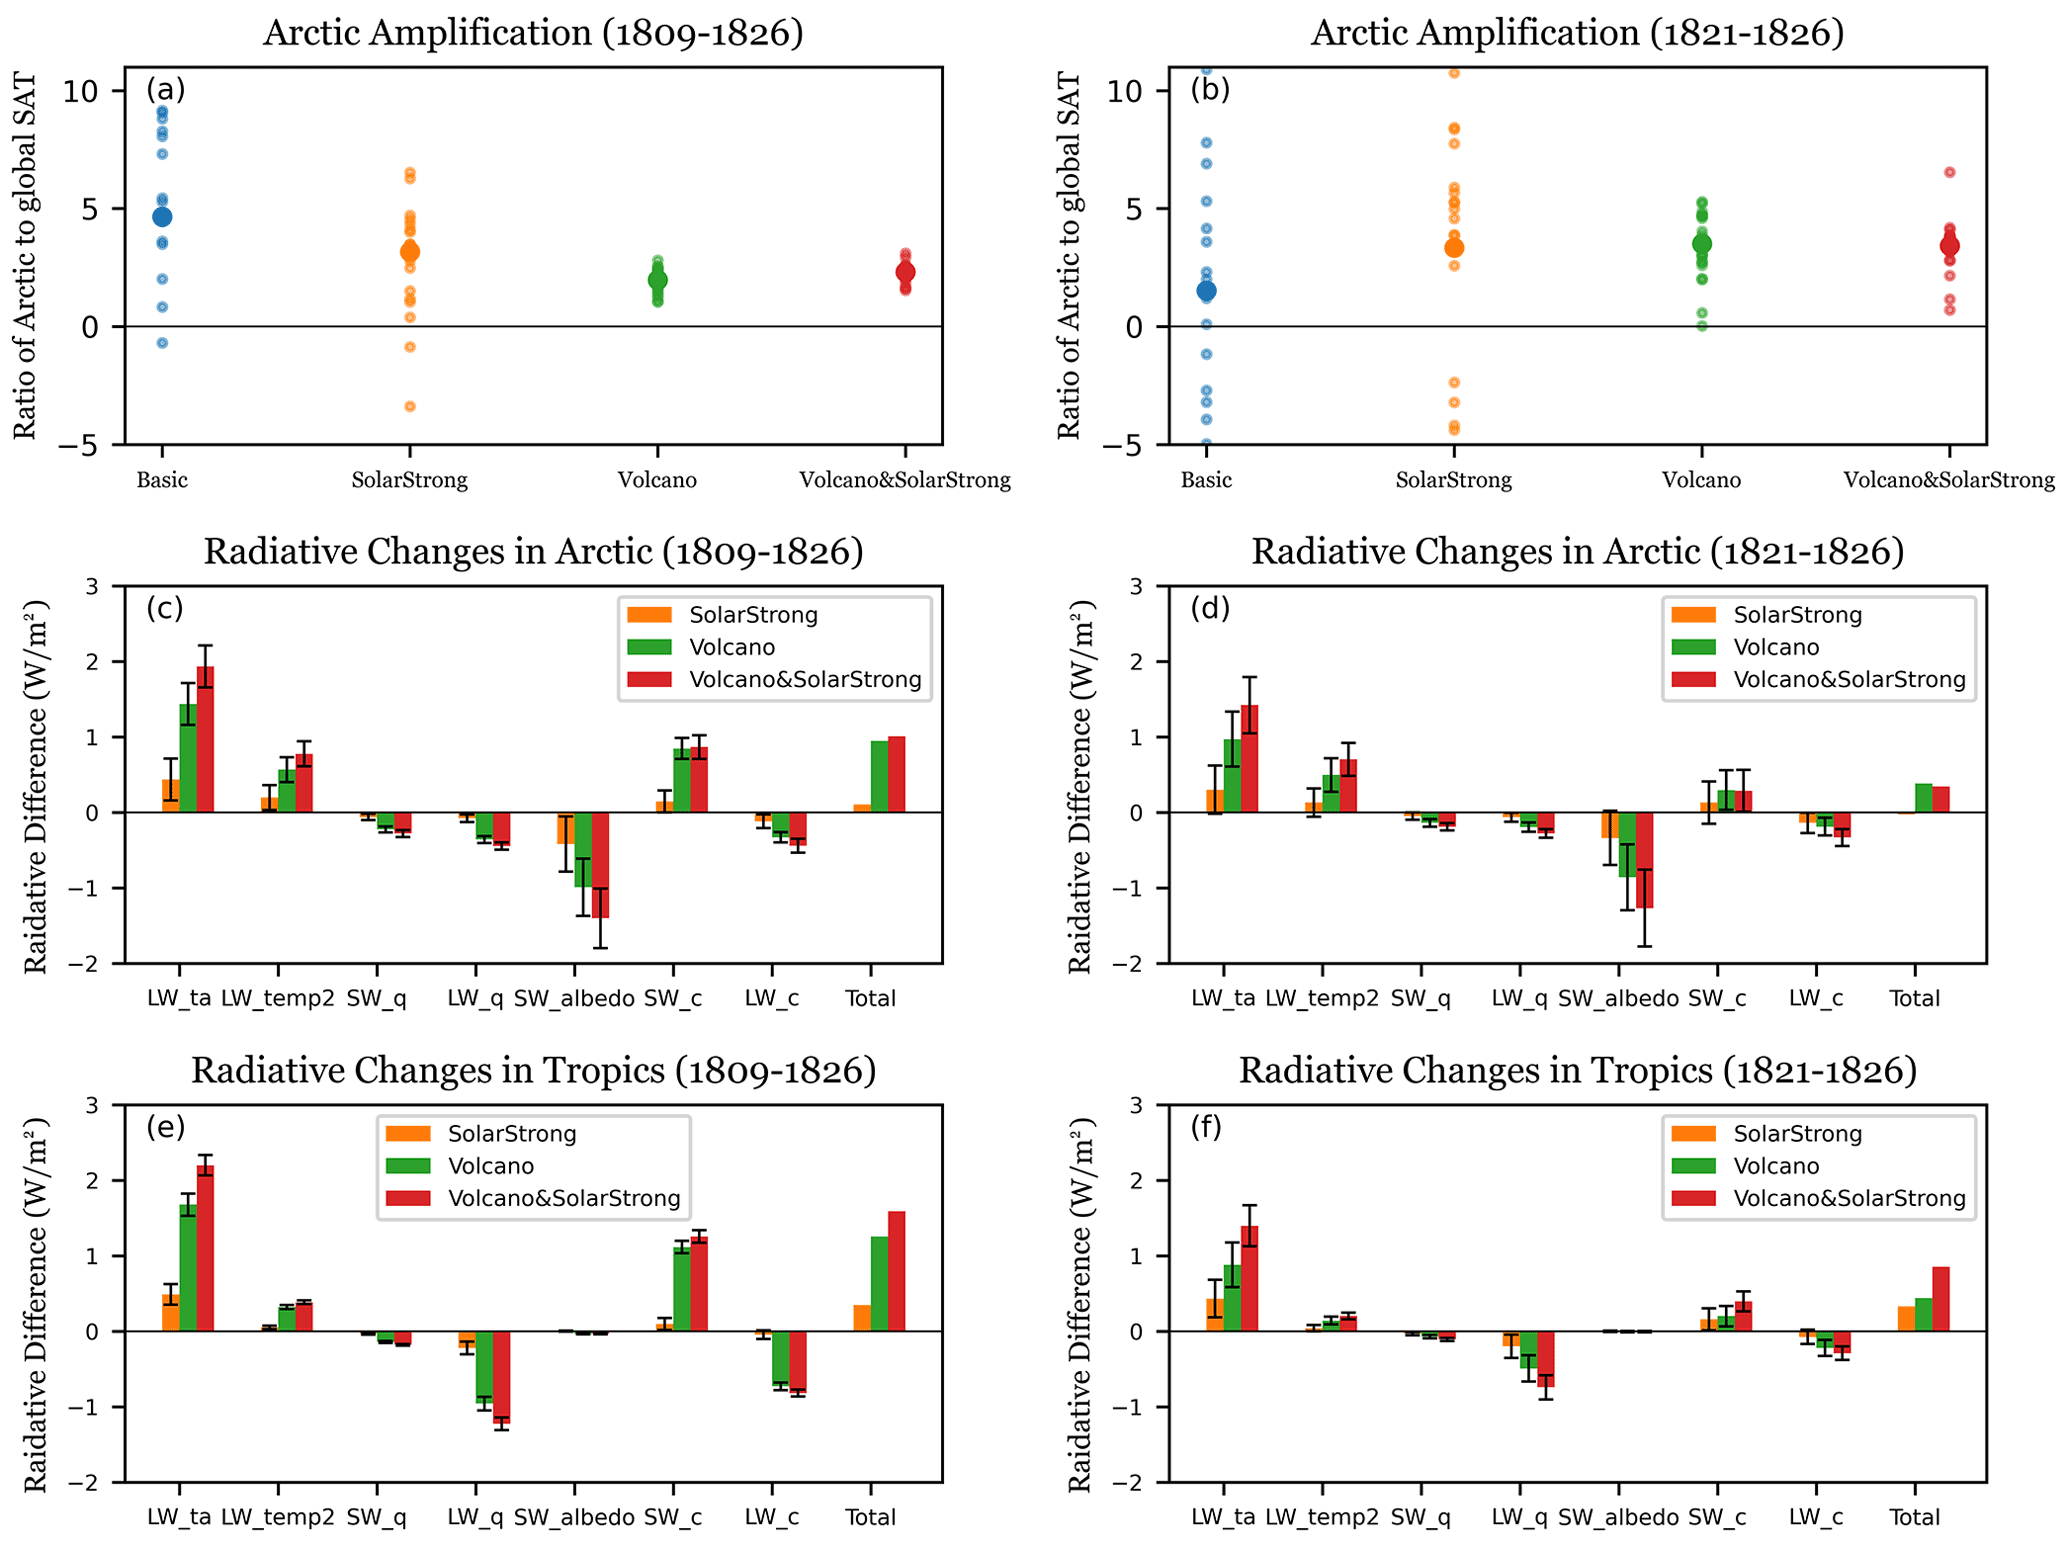
Figure 11(a) Ratio of Arctic SAT anomalies (67 to 90∘ N) to global mean SAT anomalies over 1809–1826 for each ensemble in the Basic, SolarStrong, Volcano, and Volcano & SolarStrong experiment. The larger dot is the ensemble mean (ensemble mean Arctic SAT anomaly/ensemble mean global SAT anomaly). (b) 1821–1826. (c) The difference between the Arctic (67 to 90∘ N) radiative change (W m−2) of each experiment to the radiative change of the Basic experiment over 1809–1826. (d) 1821–1826. (e) and (f) are for the tropics (30∘ S to 30∘ N). The SW and LW mean shortwave and longwave radiation changes, respectively; and ta is air temperature difference; temp2 is surface air temperature; q is water vapor; albedo is albedo; c is cloud; total is the summation of the seven radiation changes.
To understand whether the AAs from solar and volcanic forcings are related to the same processes, we use the rapid adjustment (Marshall et al., 2020) of each process over the period. This method obtains the radiative changes (W m−2) in the system caused by each process (or feedback) by multiplying the radiative kernel with the difference to the reference model (see Method section for details). For instance, the albedo feedback is positive feedback, meaning surface cooling results in more albedo, which increases the outgoing shortwave radiation at top of the atmosphere and thus reduces heat in the system (see SW_albedo). That is, with surface cooling, the rapid adjustment is negative meaning the heat in the system will further reduce. On the other hand, the temperature feedback is negative feedback that increases the heat in the system (positive values; see LW_ta and LW_temp2) by releasing less longwave radiation at top of the atmosphere. Figure 11c–f shows the differences of rapid adjustments between the solar and/or volcano forcing experiment and the Basic experiment for the tropics and the Arctic averaged over two periods. The total increase of radiative difference in the Arctic over 1809–1826 is smaller than the respective change in the tropics for all experiments, indicating a weaker recovery from the cooling in the Arctic. For SolarStrong, the albedo feedback is the most crucial process that compensates for the temperature feedback in the Arctic (Fig. 11c), while the compensation with longwave water vapor change is relatively small in the tropics (Fig. 11e). Sea-ice increase (and partly snow) contributes mainly to the AA in SolarStrong. For the Volcano experiment, besides the temperature feedback, the shortwave cloud radiative changes also contribute to warming the Arctic, which is suggested to be associated with the reduction of high-level clouds (Marshall et al., 2020). Although half of the changes are compensated by the longwave cloud feedback, the total cloud feedback is an additional strong negative feedback that helps the system return to its climatology. If we only consider the post-volcano period (1821–1826), we can see that the cloud feedback contributes little (Fig. 11d and f). Instead, the radiative changes from the albedo are maintained at ∼70 % of the period right after volcanic eruptions (Fig. 11d), which is the main feedback that keeps the Arctic colder than the tropics.
We conduct a set of early 19th century simulations with 20 ensemble members of MPI-ESM1.2 model from combinations of forcing agents of one volcanic forcing and two solar reconstructions. The solar forcing from the SATIRE solar reconstruction (Basic experiment) contributes less than a monthly average of 0.05 K SAT cooling before and after 1815, while the forcing with the PMOD solar reconstruction (SolarStrong experiment) contributes an additional 0.1 K SAT cooling (1809–1826). The 1809 unknown and 1815 Tambora eruptions contribute 0.82 and 1.36 K SAT cooling at their peak. The cooling then rapidly returns to ∼0.35 K around the year 1820 and the temperature slowly approaches the climatological value. The cooling signatures are strongest in the northern extratropics due to Arctic amplification, except during the first few years after eruptions when the prescribed volcanic forcing directly cools the tropics. In addition, the SST cooling in the northern extratropics is characterized by a larger slow recovery after the direct volcano-induced cooling compared to the SAT and other regions. This slow recovery from the SST cooling is interpreted as a connection with the slow reduction of the Arctic sea-ice extent and is accompanied by a smaller SST seasonality.
The additivity of the climate responses to the volcanic and solar forcing is studied by a set of simulations with combined and separated volcanic and solar forcing agents. We find that the global mean/large-scale surface climate responses are additive, but the responses on the regional scale can be non-additive. In the middle stratosphere, the reduced solar radiation and volcanic aerosol separately cause opposite sign changes in stratospheric temperatures and thus the NH polar vortex, but the response in combined simulations shows a strengthening of the polar vortex of a similar or somewhat stronger magnitude to that in a volcanic simulation alone, although the significance of this finding is limited due to large internal variability. This suggests that the solar forcing may have little impact on, or even enhance, the volcano-induced strengthening of the polar vortex. Besides the strong internal variability of the polar vortex, it is noticed that ozone is not included interactively and no QBO is simulated in this version of MPI-ESM. As both ozone (Shindell et al., 1999; Oehrlein et al., 2020) and QBO (Holten and Tan, 1980; Garfinkel et al., 2012; Labe et al., 2019) can impact the polar vortex, these processes may lead to more complex interactions between solar and volcanic forcing, which is not considered in our study.
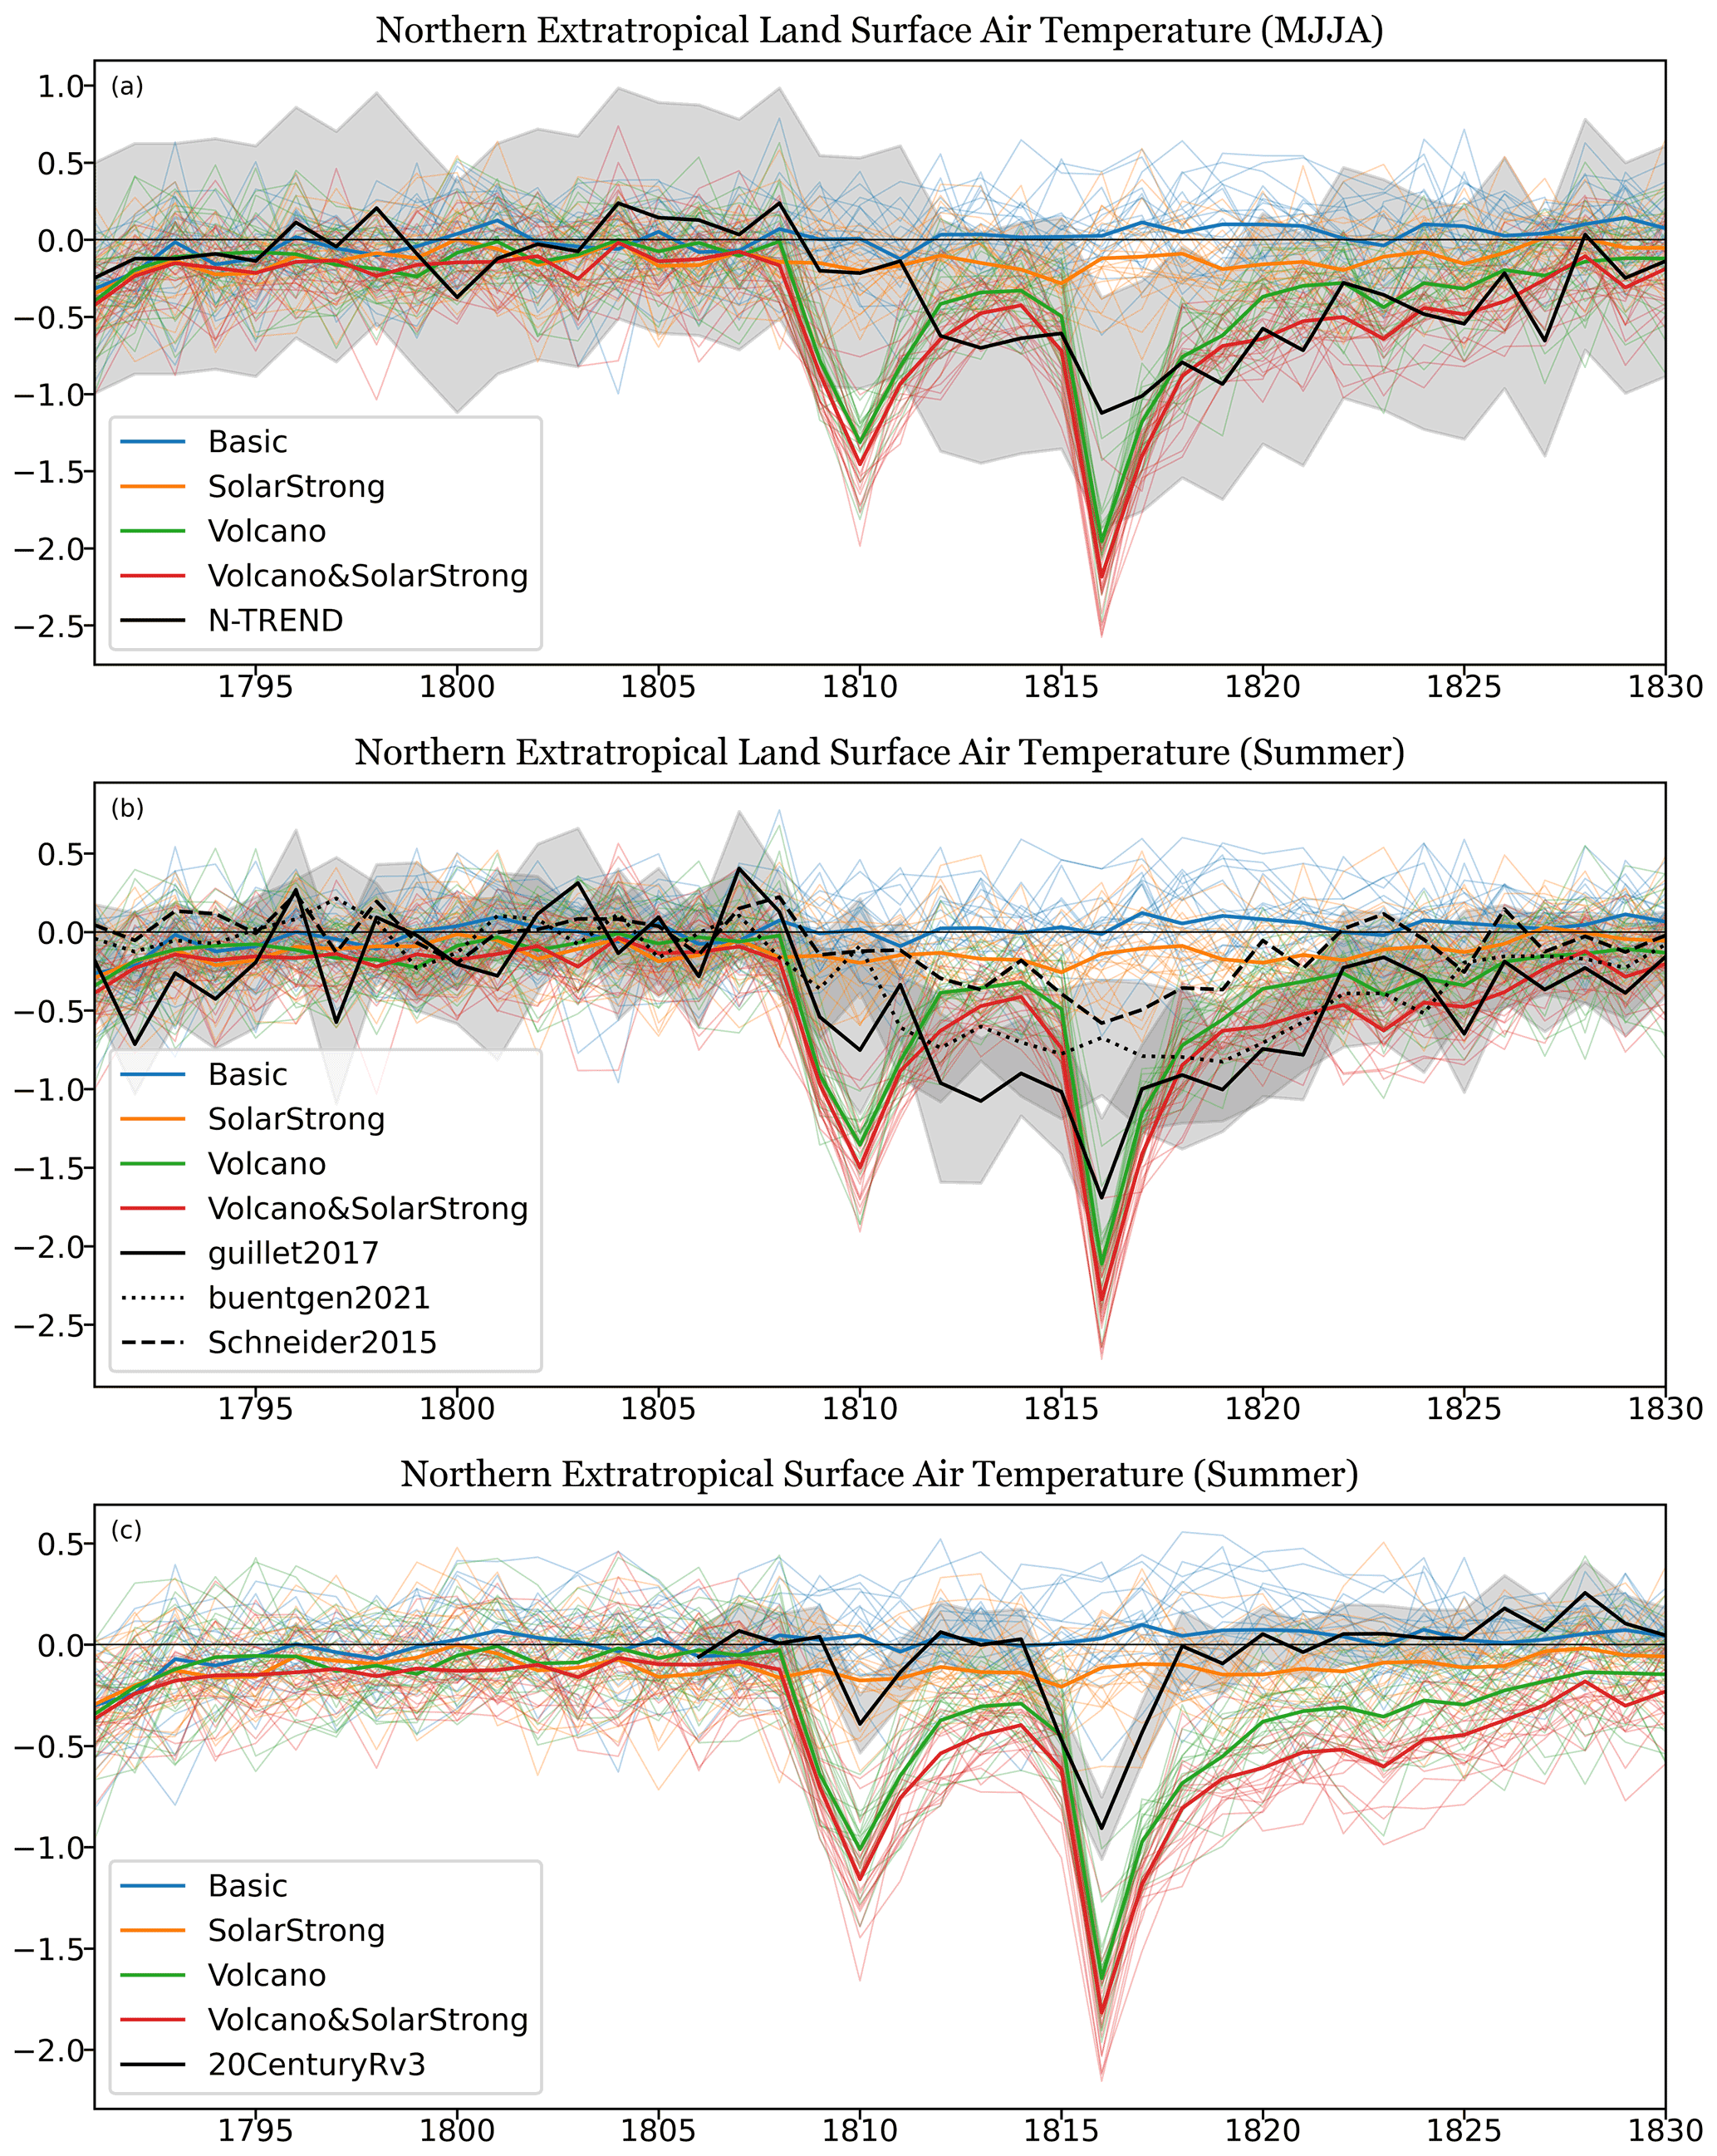
Figure 12(a) Northern extratropical (30 to 90∘ N) May to August land surface air temperature anomalies for Basic (blue), SolarStrong (orange), Volcano (green), and Volcano & SolarStrong (red) experiments, (b) for northern extratropical summer land surface air temperature and (c) for northern extratropical summer surface air temperature. The black lines are for the anomalies from reconstruction projects and the gray shadings are the uncertainties. The reconstruction anomalies are offset with the difference from the ensemble mean of the Basic experiment over 1800–1808 for lining with the Basic experiment. In (a), the uncertainty of the N-TREND (Wilson et al., 2016) is provided in the dataset. In (b), the uncertainty of guillet2017 (solid; Guillet et al., 2017) is provided in the dataset and the uncertainty for the buentgen2021 is calculated by the one standard deviation of the 15 ensemble members (R1 to R15; dotted; Büntgen et al., 2021). Schneider2015 is dashed (Schneider et al., 2015). In (c), the spread of 20th Century Reanalysis v3 (20CenturyRv3) is calculated by the one standard deviation of the 80 ensemble members.
Model simulations generally show an El Niño signature right after tropical volcanic eruptions (Khodri et al., 2017); however, in our simulations, the El Niño tendency is found to be weaker when including the solar forcing (though not significantly). This may be related to the La Niña tendency found during solar minimum (Lin et al., 2021) but no such tendency is found in our solar forcing-only simulations. That is, the solar irradiance may contribute to the tendency of ENSO events after eruptions and give a hint on why no consistent ENSO responses from volcanoes have been found over the past centuries (Dee et al., 2020). The non-additive responses, including the Arctic atmosphere and tropical surface ocean, cannot be distinguished statistically from the strong internal variability in those regions. This indicates a much larger ensemble size may need for studying the regional additivities. For example, the Arctic climate is suggested to be studied with more than 60 ensemble members (Liang et al., 2020), and different ensemble sizes (can be larger than 50 members) are needed for each ENSO characteristic and model (Lee et al., 2021).
Furthermore, when imposing reduced solar radiation in the volcano experiment, an additional tropical cooling is simulated right after the eruptions and then further propagates to the northern extratropics through ocean circulation and reduces the near-surface air temperature along the propagation. This indicates that solar forcing may have an additional impact on regional temperature change caused by volcanic eruptions, which further enhances the difficulty when combining or interpreting the proxy reconstruction originating from different regions. A large spread is found when comparing the model simulations to the proxy reconstructions and an experimental period of reanalysis (Fig. 12). Depending on the product, large differences are found across reconstructions and reanalysis and across their internal uncertainties. Consistent with Wagner and Zorita (2005), the early 19th century cooling is mainly a result of volcanic eruptions in our simulations. The long-lasting cooling found in reconstructions in the northern extratropics can be explained largely also by the post-volcano responses or partly by the solar forcing (Anet et al., 2014) when using the PMOD reconstruction. The large spread of the reconstructions and our ensemble simulations however cannot confirm the necessity to include solar forcing even when solar forcing (with PMOD reconstruction) can contribute to cooling in the post-volcano period.
Lastly, the Arctic amplification response to volcano- and solar-forced global cooling is investigated in this study. A colder Arctic compared to the globe is rarely discussed since the warming perspective is generally the focus, such as Arctic amplification responses to global warming. We find that the albedo feedback is the main positive feedback (cooling causing further cooling) that slows the Arctic temperature from returning to climatology after volcanic eruptions. Since the sea-ice extent does not depend directly on the air temperature, and is related to the interaction with SST (Carton et al., 2015) and the surface ocean circulation (Lehner et al., 2013), the sea-ice albedo feedback remains at roughly 70 % in the post-volcano period, indicating the importance of Arctic sea ice for the post-volcanic cooling.
This study shows that the comparably small solar forcing cannot be ignored for understanding the regional climate of the early 19th century, even though it has small global impacts compared to the two large volcanoes. This indicates that other small disturbances may also contribute to regional climate anomalies after strong tropical volcanic eruptions. For instance, small-to-moderate eruptions, which are not included in the EVA volcano forcing from the PMIP4 past1000 protocol, may also play a role in regional changes.
This study investigates how much each of the volcanic and solar forcing can separately contribute to the well-known early 19th century cooling and examines the combined climate responses from the two forcing agents with 20-member ensemble simulations from the MPI-ESM1.2 model. To our knowledge, this is the first study comparing the two solar reconstructions from the PMIP4 past1000 protocol as well as examining the interactions of solar and volcanic signals in the early 19th century with a large number (20) of ensemble members. The 1809 (unknown location) and the 1815 Tambora eruptions are found to be the main contributor to the early 19th century cooling. Depending on the reconstructions, the solar forcing contributes to slightly enhancing the cooling before 1815 (with SATIRE) or the long-lasting cooling after the 1815 Tambura eruption (with PMOD). We find that the solar- and volcano-induced cooling are additive in global mean/large scale, even for the northern extratropics, which have a longer-lasting cooling. Besides the additivity of the responses, regional impacts (such as polar vortex and surface temperature propagations) can be non-additive when together or separately imposing the solar and volcanic forcing. However, these non-additive responses may not be separated with the internal variability with statistical significance. Furthermore, an Arctic amplification associated with global cooling, which is rarely discussed in literatures, is found in both solar and volcanic impacts, revealing the importance of the albedo feedback (or sea-ice change) in controlling the post-volcano surface cooling in the early 19th century.
The Python code for generating the figures can be accessed at MPG.PuRe at https://hdl.handle.net/21.11116/0000-000B-5E0D-F (Fang, 2022a).
The processed data of the variables for each experiment can be accessed at Zenodo with https://doi.org/10.5281/zenodo.6567188 (Fang, 2022b).
SWF performed the model runs and the statistical analyses and wrote the paper. CT, JJ, and HS designed the study. CT, JJ, KK, and HS contributed to writing the paper. All authors contributed to the discussion and finalization of the article.
The contact author has declared that none of the authors has any competing interests.
Publisher's note: Copernicus Publications remains neutral with regard to jurisdictional claims in published maps and institutional affiliations.
We thank Ewa Bednarz and one anonymous reviewer for their valuable comments, and Andrea Schneidereit who gave valuable comments on an earlier version of this paper. The research is funded by the German Federal Ministry of Education and Research (BMBF), research programme “ROMIC-II, ISOVIC” (FKZ:01LG1909B). Claudia Timmreck is funded by the DFG research unit FOR 2820: Revisiting The Volcanic Impact on Atmosphere and Climate-Preparations for the Next Big Volcanic Eruption (VolImpact, grant number: 398006378). Kirstin Krüger acknowledges the contribution to this study by the Research Council Norway TOPPFORSK project VIKINGS (grant number #275191), which developed during her scientific guest stay at MPI-M financed by the Faculty of Mathematics and Natural Sciences of the University of Oslo. The computations, analysis, and model data storage were mainly performed on the computer of the Deutsches Klima Rechenzentrum (DKRZ) using resources granted by its Scientific Steering Committee (WLA) under project ID bb1171. We acknowledge the World Climate Research Programme's Working Group on Coupled Modeling, which is responsible for PMIP. Support for the Twentieth Century Reanalysis Project version 3 dataset is provided by the US Department of Energy, Office of Science Biological and Environmental Research (BER), by the National Oceanic and Atmospheric Administration Climate Program Office, and by the NOAA Physical Sciences Laboratory. The analyses were performed using Python.
This research has been supported by the Bundesministerium für Bildung und Forschung (grant no. FKZ:01LG1909B), the Deutsche Forschungsgemeinschaft (grant no. 398006378), and the Norges Forskningsråd (grant no. 275191).
The article processing charges for this open-access publication were covered by the Max Planck Society.
This paper was edited by Ben Kravitz and reviewed by Ewa Bednarz and one anonymous referee.
Anet, J. G., Muthers, S., Rozanov, E., Raible, C. C., Peter, T., Stenke, A., Shapiro, A. I., Beer, J., Steinhilber, F., Brönnimann, S., Arfeuille, F., Brugnara, Y., and Schmutz, W.: Forcing of stratospheric chemistry and dynamics during the Dalton Minimum, Atmos. Chem. Phys., 13, 10951–10967, https://doi.org/10.5194/acp-13-10951-2013, 2013.
Anet, J. G., Muthers, S., Rozanov, E. V., Raible, C. C., Stenke, A., Shapiro, A. I., Brönnimann, S., Arfeuille, F., Brugnara, Y., Beer, J., Steinhilber, F., Schmutz, W., and Peter, T.: Impact of solar versus volcanic activity variations on tropospheric temperatures and precipitation during the Dalton Minimum, Clim. Past, 10, 921–938, https://doi.org/10.5194/cp-10-921-2014, 2014.
Block, K. and Mauritsen, T.: Forcing and feedback in the MPI-ESM-LR coupled model under abruptly quadrupled CO2, J. Adv. Modeling Earth Syst., 5, 676–691, https://doi.org/10.1002/jame.20041, 2013.
Brönnimann, S., Franke, J., Nussbaumer, S. U., Zumbühl, H. J., Steiner, D., Trachsel, M., Hegerl, G. C., Schurer, A., Worni, M., Malik, A., Flückiger, J., and Raible, C. C.: Last phase of the Little Ice Age forced by volcanic eruptions, Nat. Geosci., 12, 650–656, https://doi.org/10.1038/s41561-019-0402-y, 2019.
Büntgen, U., Allen, K., Anchukaitis, K. J., Arseneault, D., Boucher, É., Bräuning, A., Chatterjee, S., Cherubini, P., Churakova (Sidorova), O. V., Corona, C., Gennaretti, F., Grießinger, J., Guillet, S., Guiot, J., Gunnarson, B., Helama, S., Hochreuther, P., Hughes, M. K., Huybers, P., Kirdyanov, A. V., Krusic, P. J., Ludescher, J., Meier, W. J.-H., Myglan, V. S., Nicolussi, K., Oppenheimer, C., Reinig, F., Salzer, M. W., Seftigen, K., Stine, A. R., Stoffel, M., St. George, S., Tejedor, E., Trevino, A., Trouet, V., Wang, J., Wilson, R., Yang, B., Xu, G., and Esper, J.: The influence of decision-making in tree ring-based climate reconstructions, Nat. Commun., 12, 3411, https://doi.org/10.1038/s41467-021-23627-6, 2021.
Carton, J. A., Ding, Y., and Arrigo, K. R.: The seasonal cycle of the Arctic Ocean under climate change, Geophys. Res. Lett., 42, 7681–7686, https://doi.org/10.1002/2015GL064514, 2015.
Christiansen, B.: Volcanic Eruptions, Large-Scale Modes in the Northern Hemisphere, and the El Niño–Southern Oscillation, J. Climate, 21, 910–922, https://doi.org/10.1175/2007JCLI1657.1, 2008.
Cole-Dai, J., Ferris, D., Lanciki, A., Savarino, J., Baroni, M., and Thiemens, M. H.: Cold decade (AD 1810–1819) caused by Tambora (1815) and another (1809) stratospheric volcanic eruption, Geophys. Res. Lett., 36, L22703, https://doi.org/10.1029/2009GL040882, 2009.
Dee, S. G., Cobb, K. M., Emile-Geay, J., Ault, T. R., Edwards, R. L., Cheng, H., and Charles, C. D.: No consistent ENSO response to volcanic forcing over the last millennium, Science, 367, 1477–1481, https://doi.org/10.1126/science.aax2000, 2020.
Egorova, T., Schmutz, W., Rozanov, E., Shapiro, A. I., Usoskin, I., Beer, J., Tagirov, R. V., and Peter, T.: Revised historical solar irradiance forcing, Astron. Astrophys., 615, A85, https://doi.org/10.1051/0004-6361/201731199, 2018.
Enfield, D. B., Mestas-Nuñez, A. M., and Trimble, P. J.: The Atlantic Multidecadal Oscillation and its relation to rainfall and river flows in the continental U.S., Geophys. Res. Lett., 28, 2077–2080, https://doi.org/10.1029/2000GL012745, 2001.
Fang, S.-W., Khodri, M., Timmreck, C., Zanchettin, D., and Jungclaus, J.: Disentangling Internal and External Contributions to Atlantic Multidecadal Variability Over the Past Millennium, Geophys. Res. Lett., 48, e2021GL095990, https://doi.org/10.1029/2021GL095990, 2021.
Fang, S.-W.: On the Additivity of Climate Responses to the Volcanic and Solar Forcing in the Early 19th Century, MPG.PuRe [code], https://hdl.handle.net/21.11116/0000-000B-5E0D-F (last access: 3 November 2022), 2022a.
Fang, S.-W.: On the Additivity of Climate Responses to the Volcanic and Solar Forcing in the Early 19th Century, Zenodo [data set], https://doi.org/10.5281/zenodo.7233754, 2022b.
Fioletov, V. E., Bodeker, G. E., Miller, A. J., McPeters, R. D., and Stolarski, R.: Global and zonal total ozone variations estimated from ground-based and satellite measurements: 1964–2000, J. Geophys. Res.-Atmos., 107, ACH 21-1–ACH 21-14, https://doi.org/10.1029/2001JD001350, 2002.
Garfinkel, C. I., Shaw, T. A., Hartmann, D. L., and Waugh, D. W.: Does the Holton–Tan Mechanism Explain How the Quasi-Biennial Oscillation Modulates the Arctic Polar Vortex?, J. Atmos. Sci., 69, 1713–1733, https://doi.org/10.1175/JAS-D-11-0209.1, 2012.
Graversen, R. G., Mauritsen, T., Tjernström, M., Källén, E., and Svensson, G.: Vertical structure of recent Arctic warming, Nature, 451, 53–56, https://doi.org/10.1038/nature06502, 2008.
Guillet, S., Corona, C., Stoffel, M., Khodri, M., Lavigne, F., Ortega, P., Eckert, N., Sielenou, P. D., Daux, V., Churakova (Sidorova), O. V., Davi, N., Edouard, J.-L., Zhang, Y., Luckman, B. H., Myglan, V. S., Guiot, J., Beniston, M., Masson-Delmotte, V., and Oppenheimer, C.: Climate response to the Samalas volcanic eruption in 1257 revealed by proxy records, Nat. Geosci., 10, 123–128, https://doi.org/10.1038/ngeo2875, 2017.
Haigh, J. D.: The role of stratospheric ozone in modulating the solar radiative forcing of climate, Nature, 370, 544–546, https://doi.org/10.1038/370544a0, 1994.
Holton, J. R. and Tan, H.-C.: The Influence of the Equatorial Quasi-Biennial Oscillation on the Global Circulation at 50 mb, J. Atmos. Sci., 37, 2200–2208, https://doi.org/10.1175/1520-0469(1980)037<2200:TIOTEQ>2.0.CO;2, 1980.
Jungclaus, J. H., Bard, E., Baroni, M., Braconnot, P., Cao, J., Chini, L. P., Egorova, T., Evans, M., González-Rouco, J. F., Goosse, H., Hurtt, G. C., Joos, F., Kaplan, J. O., Khodri, M., Klein Goldewijk, K., Krivova, N., LeGrande, A. N., Lorenz, S. J., Luterbacher, J., Man, W., Maycock, A. C., Meinshausen, M., Moberg, A., Muscheler, R., Nehrbass-Ahles, C., Otto-Bliesner, B. I., Phipps, S. J., Pongratz, J., Rozanov, E., Schmidt, G. A., Schmidt, H., Schmutz, W., Schurer, A., Shapiro, A. I., Sigl, M., Smerdon, J. E., Solanki, S. K., Timmreck, C., Toohey, M., Usoskin, I. G., Wagner, S., Wu, C.-J., Yeo, K. L., Zanchettin, D., Zhang, Q., and Zorita, E.: The PMIP4 contribution to CMIP6 – Part 3: The last millennium, scientific objective, and experimental design for the PMIP4 past1000 simulations, 10, 4005–4033, https://doi.org/10.5194/gmd-10-4005-2017, 2017.
Kageyama, M., Braconnot, P., Harrison, S. P., Haywood, A. M., Jungclaus, J. H., Otto-Bliesner, B. L., Peterschmitt, J.-Y., Abe-Ouchi, A., Albani, S., Bartlein, P. J., Brierley, C., Crucifix, M., Dolan, A., Fernandez-Donado, L., Fischer, H., Hopcroft, P. O., Ivanovic, R. F., Lambert, F., Lunt, D. J., Mahowald, N. M., Peltier, W. R., Phipps, S. J., Roche, D. M., Schmidt, G. A., Tarasov, L., Valdes, P. J., Zhang, Q., and Zhou, T.: The PMIP4 contribution to CMIP6 – Part 1: Overview and over-arching analysis plan, 11, 1033–1057, https://doi.org/10.5194/gmd-11-1033-2018, 2018.
Khodri, M., Izumo, T., Vialard, J., Janicot, S., Cassou, C., Lengaigne, M., Mignot, J., Gastineau, G., Guilyardi, E., Lebas, N., Robock, A., and McPhaden, M. J.: Tropical explosive volcanic eruptions can trigger El Niño by cooling tropical Africa, Nat. Commun., 8, 778, https://doi.org/10.1038/s41467-017-00755-6, 2017.
Krismer, T. R., Giorgetta, M. A., and Esch, M.: Seasonal aspects of the quasi-biennial oscillation in the Max Planck Institute Earth System Model and ERA-40, J. Adv. Model. Earth Syst., 5, 406–421, https://doi.org/10.1002/jame.20024, 2013.
Kwon, Y.-O. and Joyce, T. M.: Northern Hemisphere Winter Atmospheric Transient Eddy Heat Fluxes and the Gulf Stream and Kuroshio–Oyashio Extension Variability, J. Climate, 26, 9839–9859, https://doi.org/10.1175/JCLI-D-12-00647.1, 2013.
Labe, Z., Peings, Y., and Magnusdottir, G.: The Effect of QBO Phase on the Atmospheric Response to Projected Arctic Sea Ice Loss in Early Winter, Geophys. Res. Lett., 46, 7663–7671, https://doi.org/10.1029/2019GL083095, 2019.
Lee, J., Planton, Y. Y., Gleckler, P. J., Sperber, K. R., Guilyardi, E., Wittenberg, A. T., McPhaden, M. J., and Pallotta, G.: Robust Evaluation of ENSO in Climate Models: How Many Ensemble Members Are Needed?, Geophys. Res. Lett., 48, e2021GL095041, https://doi.org/10.1029/2021GL095041, 2021.
Lehner, F., Born, A., Raible, C. C., and Stocker, T. F.: Amplified Inception of European Little Ice Age by Sea Ice–Ocean–Atmosphere Feedbacks, J. Climate, 26, 7586–7602, https://doi.org/10.1175/JCLI-D-12-00690.1, 2013.
Liang, Y.-C., Kwon, Y.-O., Frankignoul, C., Danabasoglu, G., Yeager, S., Cherchi, A., Gao, Y., Gastineau, G., Ghosh, R., Matei, D., Mecking, J. V., Peano, D., Suo, L., and Tian, T.: Quantification of the Arctic Sea Ice-Driven Atmospheric Circulation Variability in Coordinated Large Ensemble Simulations, Geophys. Res. Lett., 47, e2019GL085397, https://doi.org/10.1029/2019GL085397, 2020.
Lin, Y.-F., Yu, J.-Y., Wu, C.-R., and Zheng, F.: The Footprint of the 11-Year Solar Cycle in Northeastern Pacific SSTs and Its Influence on the Central Pacific El Niño, Geophys. Res. Lett., 48, e2020GL091369, https://doi.org/10.1029/2020GL091369, 2021.
Liu, F., Zhao, T., Wang, B., Liu, J., and Luo, W.: Different Global Precipitation Responses to Solar, Volcanic, and Greenhouse Gas Forcings, J. Geophys. Res.-Atmos., 123, 4060–4072, https://doi.org/10.1029/2017JD027391, 2018.
Mantua, N. J. and Hare, S. R.: The Pacific Decadal Oscillation, J. Oceanogr., 58, 35–44, https://doi.org/10.1023/A:1015820616384, 2002.
Marshall, G. J.: Trends in the Southern Annular Mode from Observations and Reanalyses, J. Climate, 16, 4134–4143, https://doi.org/10.1175/1520-0442(2003)016<4134:TITSAM>2.0.CO;2, 2003.
Marshall, L. R., Smith, C. J., Forster, P. M., Aubry, T. J., Andrews, T., and Schmidt, A.: Large Variations in Volcanic Aerosol Forcing Efficiency Due to Eruption Source Parameters and Rapid Adjustments, Geophys. Res. Lett., 47, e2020GL090241, https://doi.org/10.1029/2020GL090241, 2020.
Matthes, K., Funke, B., Andersson, M. E., Barnard, L., Beer, J., Charbonneau, P., Clilverd, M. A., Dudok de Wit, T., Haberreiter, M., Hendry, A., Jackman, C. H., Kretzschmar, M., Kruschke, T., Kunze, M., Langematz, U., Marsh, D. R., Maycock, A. C., Misios, S., Rodger, C. J., Scaife, A. A., Seppälä, A., Shangguan, M., Sinnhuber, M., Tourpali, K., Usoskin, I., van de Kamp, M., Verronen, P. T., and Versick, S.: Solar forcing for CMIP6 (v3.2), Geosci. Model Dev., 10, 2247–2302, https://doi.org/10.5194/gmd-10-2247-2017, 2017.
Mauritsen, T., Bader, J., Becker, T., Behrens, J., Bittner, M., Brokopf, R., Brovkin, V., Claussen, M., Crueger, T., Esch, M., Fast, I., Fiedler, S., Fläschner, D., Gayler, V., Giorgetta, M., Goll, D. S., Haak, H., Hagemann, S., Hedemann, C., Hohenegger, C., Ilyina, T., Jahns, T., Jimenéz-de-la-Cuesta, D., Jungclaus, J., Kleinen, T., Kloster, S., Kracher, D., Kinne, S., Kleberg, D., Lasslop, G., Kornblueh, L., Marotzke, J., Matei, D., Meraner, K., Mikolajewicz, U., Modali, K., Möbis, B., Müller, W. A., Nabel, J. E. M. S., Nam, C. C. W., Notz, D., Nyawira, S.-S., Paulsen, H., Peters, K., Pincus, R., Pohlmann, H., Pongratz, J., Popp, M., Raddatz, T. J., Rast, S., Redler, R., Reick, C. H., Rohrschneider, T., Schemann, V., Schmidt, H., Schnur, R., Schulzweida, U., Six, K. D., Stein, L., Stemmler, I., Stevens, B., von Storch, J.-S., Tian, F., Voigt, A., Vrese, P., Wieners, K.-H., Wilkenskjeld, S., Winkler, A., and Roeckner, E.: Developments in the MPI-M Earth System Model version 1.2 (MPI-ESM1.2) and Its Response to Increasing CO2, J. Adv. Model. Earth Syst., 11, 998–1038, https://doi.org/10.1029/2018MS001400, 2019.
Maycock, A. C., Ineson, S., Gray, L. J., Scaife, A. A., Anstey, J. A., Lockwood, M., Butchart, N., Hardiman, S. C., Mitchell, D. M., and Osprey, S. M.: Possible impacts of a future grand solar minimum on climate: Stratospheric and global circulation changes, J. Geophys. Res.-Atmos., 120, 9043–9058, https://doi.org/10.1002/2014JD022022, 2015.
Meehl, G. A., Arblaster, J. M., Matthes, K., Sassi, F., and van Loon, H.: Amplifying the Pacific Climate System Response to a Small 11-Year Solar Cycle Forcing, Science, 325, 1114–1118, https://doi.org/10.1126/science.1172872, 2009.
Misios, S. and Schmidt, H.: Mechanisms Involved in the Amplification of the 11-yr Solar Cycle Signal in the Tropical Pacific Ocean, J. Climate, 25, 5102–5118, https://doi.org/10.1175/JCLI-D-11-00261.1, 2012.
Oehrlein, J., Chiodo, G., and Polvani, L. M.: The effect of interactive ozone chemistry on weak and strong stratospheric polar vortex events, Atmos. Chem. Phys., 20, 10531–10544, https://doi.org/10.5194/acp-20-10531-2020, 2020.
Previdi, M., Smith, K. L., and Polvani, L. M.: Arctic amplification of climate change: a review of underlying mechanisms, Environ. Res. Lett., 16, 093003, https://doi.org/10.1088/1748-9326/ac1c29, 2021.
Raible, C. C., Brönnimann, S., Auchmann, R., Brohan, P., Frölicher, T. L., Graf, H.-F., Jones, P., Luterbacher, J., Muthers, S., Neukom, R., Robock, A., Self, S., Sudrajat, A., Timmreck, C., and Wegmann, M.: Tambora 1815 as a test case for high impact volcanic eruptions: Earth system effects, WIREs Clim. Change, 7, 569–589, https://doi.org/10.1002/wcc.407, 2016.
Robock, A.: Volcanic eruptions and climate, Rev. Geophys., 38, 191–219, https://doi.org/10.1029/1998RG000054, 2000.
Scaife, A. A., Ineson, S., Knight, J. R., Gray, L., Kodera, K., and Smith, D. M.: A mechanism for lagged North Atlantic climate response to solar variability, Geophys. Res. Lett., 40, 434–439, https://doi.org/10.1002/grl.50099, 2013.
Schmidt, G. A., Jungclaus, J. H., Ammann, C. M., Bard, E., Braconnot, P., Crowley, T. J., Delaygue, G., Joos, F., Krivova, N. A., Muscheler, R., Otto-Bliesner, B. L., Pongratz, J., Shindell, D. T., Solanki, S. K., Steinhilber, F., and Vieira, L. E. A.: Climate forcing reconstructions for use in PMIP simulations of the Last Millennium (v1.1), Geosci. Model Dev., 5, 185–191, https://doi.org/10.5194/gmd-5-185-2012, 2012.
Schneider, L., Smerdon, J. E., Büntgen, U., Wilson, R. J. S., Myglan, V. S., Kirdyanov, A. V., and Esper, J.: Revising midlatitude summer temperatures back to A.D. 600 based on a wood density network, Geophys. Res. Lett., 42, 4556–4562, https://doi.org/10.1002/2015GL063956, 2015.
Schurer, A. P., Hegerl, G. C., Luterbacher, J., Brönnimann, S., Cowan, T., Tett, S. F. B., Zanchettin, D., and Timmreck, C.: Disentangling the causes of the 1816 European year without a summer, Environ. Res. Lett., 14, 094019, https://doi.org/10.1088/1748-9326/ab3a10, 2019.
Self, S., Gertisser, R., Thordarson, T., Rampino, M. R., and Wolff, J. A.: Magma volume, volatile emissions, and stratospheric aerosols from the 1815 eruption of Tambora, Geophys. Res. Lett., 31, L20608, https://doi.org/10.1029/2004GL020925, 2004.
Serreze, M. C., Barrett, A. P., Stroeve, J. C., Kindig, D. N., and Holland, M. M.: The emergence of surface-based Arctic amplification, The Cryosphere, 3, 11–19, https://doi.org/10.5194/tc-3-11-2009, 2009.
Shapiro, A. I., Schmutz, W., Rozanov, E., Schoell, M., Haberreiter, M., Shapiro, A. V., and Nyeki, S.: A new approach to the long-term reconstruction of the solar irradiance leads to large historical solar forcing, Astron. Astrophys., 529, A67, https://doi.org/10.1051/0004-6361/201016173, 2011.
Shindell, D., Rind, D., Balachandran, N., Lean, J., and Lonergan, P.: Solar Cycle Variability, Ozone, and Climate, Science, 284, 305–308, https://doi.org/10.1126/science.284.5412.305, 1999.
Silverman, S. M. and Hayakawa, H.: The Dalton Minimum and John Dalton's Auroral Observations, J. Space Weather Space Clim., 11, 17, https://doi.org/10.1051/swsc/2020082, 2021.
Stenchikov, G., Hamilton, K., Robock, A., Ramaswamy, V., and Schwarzkopf, M. D.: Arctic oscillation response to the 1991 Pinatubo eruption in the SKYHI general circulation model with a realistic quasi-biennial oscillation, J. Geophys. Res.-Atmos., 109, D03112, https://doi.org/10.1029/2003JD003699, 2004.
Stjern, C. W., Lund, M. T., Samset, B. H., Myhre, G., Forster, P. M., Andrews, T., Boucher, O., Faluvegi, G., Fläschner, D., Iversen, T., Kasoar, M., Kharin, V., Kirkevåg, A., Lamarque, J.-F., Olivié, D., Richardson, T., Sand, M., Shawki, D., Shindell, D., Smith, C. J., Takemura, T., and Voulgarakis, A.: Arctic Amplification Response to Individual Climate Drivers, J. Geophys. Res.-Atmos., 124, 6698–6717, https://doi.org/10.1029/2018JD029726, 2019.
Swingedouw, D., Mignot, J., Ortega, P., Khodri, M., Menegoz, M., Cassou, C., and Hanquiez, V.: Impact of explosive volcanic eruptions on the main climate variability modes, Global Planet. Change, 150, 24–45, https://doi.org/10.1016/j.gloplacha.2017.01.006, 2017.
Thompson, D. W. J. and Wallace, J. M.: The Arctic oscillation signature in the wintertime geopotential height and temperature fields, Geophys. Res. Lett., 25, 1297–1300, https://doi.org/10.1029/98GL00950, 1998.
Timmreck, C.: Modeling the climatic effects of large explosive volcanic eruptions, WIREs Clim. Change, 3, 545–564, https://doi.org/10.1002/wcc.192, 2012.
Timmreck, C., Toohey, M., Zanchettin, D., Brönnimann, S., Lundstad, E., and Wilson, R.: The unidentified eruption of 1809: a climatic cold case, Clim. Past, 17, 1455–1482, https://doi.org/10.5194/cp-17-1455-2021, 2021.
Toohey, M. and Sigl, M.: Volcanic stratospheric sulfur injections and aerosol optical depth from 500 BCE to 1900 CE, Earth Syst. Sci. Data, 9, 809–831, https://doi.org/10.5194/essd-9-809-2017, 2017.
Toohey, M., Stevens, B., Schmidt, H., and Timmreck, C.: Easy Volcanic Aerosol (EVA v1.0): an idealized forcing generator for climate simulations, Geosci. Model Dev., 9, 4049–4070, https://doi.org/10.5194/gmd-9-4049-2016, 2016.
Usoskin, I. G.: A history of solar activity over millennia, Living Rev. Sol. Phys., 14, 3, https://doi.org/10.1007/s41116-017-0006-9, 2017.
Usoskin, I. G., Mursula, K., and Kovaltsov, G. A.: Lost sunspot cycle in the beginning of Dalton minimum: New evidence and consequences, Geophys. Res. Lett., 29, 36-1–36-4, https://doi.org/10.1029/2002GL015640, 2002.
Usoskin, I. G., Gallet, Y., Lopes, F., Kovaltsov, G. A., and Hulot, G.: Solar activity during the Holocene: the Hallstatt cycle and its consequence for grand minima and maxima, Astron. Astrophys., 587, A150, https://doi.org/10.1051/0004-6361/201527295, 2016.
van Dijk, E., Jungclaus, J., Lorenz, S., Timmreck, C., and Krüger, K.: Was there a volcanic-induced long-lasting cooling over the Northern Hemisphere in the mid-6th–7th century?, Clim. Past, 18, 1601–1623, https://doi.org/10.5194/cp-18-1601-2022, 2022.
Vieira, L. E. A., Solanki, S. K., Krivova, N. A., and Usoskin, I.: Evolution of the solar irradiance during the Holocene, Astron. Astrophys., 531, A6, https://doi.org/10.1051/0004-6361/201015843, 2011.
Wagner, S. and Zorita, E.: The influence of volcanic, solar and CO2 forcing on the temperatures in the Dalton Minimum (1790–1830): a model study, Clim. Dynam., 25, 205–218, https://doi.org/10.1007/s00382-005-0029-0, 2005.
Wanner, H., Brönnimann, S., Casty, C., Gyalistras, D., Luterbacher, J., Schmutz, C., Stephenson, D. B., and Xoplaki, E.: North Atlantic Oscillation – Concepts And Studies, Surv. Geophys., 22, 321–381, https://doi.org/10.1023/A:1014217317898, 2001.
Wilson, R., Anchukaitis, K., Briffa, K. R., Büntgen, U., Cook, E., D'Arrigo, R., Davi, N., Esper, J., Frank, D., Gunnarson, B., Hegerl, G., Helama, S., Klesse, S., Krusic, P. J., Linderholm, H. W., Myglan, V., Osborn, T. J., Rydval, M., Schneider, L., Schurer, A., Wiles, G., Zhang, P., and Zorita, E.: Last millennium northern hemisphere summer temperatures from tree rings: Part I: The long term context, Quaternary Sci. Rev., 134, 1–18, https://doi.org/10.1016/j.quascirev.2015.12.005, 2016.
Wu, C.-J., Krivova, N. A., Solanki, S. K., and Usoskin, I. G.: Solar total and spectral irradiance reconstruction over the last 9000 years, Astron. Astrophys., 620, A120, https://doi.org/10.1051/0004-6361/201832956, 2018.
Zanchettin, D., Timmreck, C., Graf, H.-F., Rubino, A., Lorenz, S., Lohmann, K., Krüger, K., and Jungclaus, J. H.: Bi-decadal variability excited in the coupled ocean–atmosphere system by strong tropical volcanic eruptions, Clim. Dynam., 39, 419–444, https://doi.org/10.1007/s00382-011-1167-1, 2012.
Zanchettin, D., Timmreck, C., Toohey, M., Jungclaus, J. H., Bittner, M., Lorenz, S. J., and Rubino, A.: Clarifying the Relative Role of Forcing Uncertainties and Initial-Condition Unknowns in Spreading the Climate Response to Volcanic Eruptions, Geophys. Res. Lett., 46, 1602–1611, https://doi.org/10.1029/2018GL081018, 2019.
- Abstract
- Introduction
- Datasets and methods
- The surface impacts from solar and volcano forcing
- The additivity of volcanic and solar forcing
- The Arctic amplification from solar and volcanic forcings
- Summary and discussion
- Conclusion
- Code availability
- Data availability
- Author contributions
- Competing interests
- Disclaimer
- Acknowledgements
- Financial support
- Review statement
- References