the Creative Commons Attribution 4.0 License.
the Creative Commons Attribution 4.0 License.
 | 14 Apr 2021
Robust increase of Indian monsoon rainfall and its variability under future warming in CMIP6 models
Anja Katzenberger
Jacob Schewe
Julia Pongratz
Anders Levermann
The Indian summer monsoon is an integral part of the global climate system. As its seasonal rainfall plays a crucial role in India's agriculture and shapes many other aspects of life, it affects the livelihood of a fifth of the world's population. It is therefore highly relevant to assess its change under potential future climate change. Global climate models within the Coupled Model Intercomparison Project Phase 5 (CMIP5) indicated a consistent increase in monsoon rainfall and its variability under global warming. Since the range of the results of CMIP5 was still large and the confidence in the models was limited due to partly poor representation of observed rainfall, the updates within the latest generation of climate models in CMIP6 are of interest. Here, we analyze 32 models of the latest CMIP6 exercise with regard to their annual mean monsoon rainfall and its variability. All of these models show a substantial increase in June-to-September (JJAS) mean rainfall under unabated climate change (SSP5-8.5) and most do also for the other three Shared Socioeconomic Pathways analyzed (SSP1-2.6, SSP2-4.5, SSP3-7.0). Moreover, the simulation ensemble indicates a linear dependence of rainfall on global mean temperature with a high agreement between the models independent of the SSP if global warming is the dominant forcing of the monsoon dynamics as it is in the 21st century; the multi-model mean for JJAS projects an increase of 0.33 mm d−1 and 5.3 % per kelvin of global warming. This is significantly higher than in the CMIP5 projections. Most models project that the increase will contribute to the precipitation especially in the Himalaya region and to the northeast of the Bay of Bengal, as well as the west coast of India. Interannual variability is found to be increasing in the higher-warming scenarios by almost all models. The CMIP6 simulations largely confirm the findings from CMIP5 models, but show an increased robustness across models with reduced uncertainties and updated magnitudes towards a stronger increase in monsoon rainfall.
- Article
(11247 KB) - Full-text XML
-
Supplement
(261 KB) - BibTeX
- EndNote


As one of the integral components of the global climate system, the Indian monsoon provides water to the densely populated region of South Asia. About 80 % of the annual precipitation over India occurs during the summer period, supplying water to the crops during the prime agricultural season (Bollasina, 2014). The crop yields (especially rice, which is dominant in the region) are highly sensitive to the monsoon rainfall variability (Prasanna, 2014; DeFries et al., 2016). As agriculture contributes to about 20 % of the gross domestic product (Zaveri et al., 2016), the monsoon's rainfall also has an effect on India's economy (Gadgil and Gadgil, 2006). Therefore, there is an inextricable link between the Indian summer monsoon and the health as well as the socioeconomic wellbeing of people. Thus, understanding the response of the Indian summer monsoon and its interannual variability to different global warming scenarios is critical for designing management strategies of water resources and agricultural policies in the future.
In order to understand future projections about potential changes in the monsoon rainfall, it is crucial to understand historic changes and their underlying forcings. In this context, it is important to distinguish between external and internal drivers. External drivers can be of natural (insolation changes due to changes in orbital parameters, volcanic aerosols) and anthropogenic (greenhouse gases – GHGs, aerosols, land use change) origin, whereas internal drivers refer to variations based on the interaction within the climate system (air, sea, sea ice, land) (Seth et al., 2019). While orbital forcing mainly shaped the changes of monsoon rainfall on multi-millennial paleoclimatic timescales, anthropogenic forcings competed during the 20th century, and since the early 21st century, GHGs have been dominating as an external forcing (P. Wang et al., 2005; Ming et al., 2020; Seth et al., 2019).
Multi-millennial paleorecords indicate strong changes both in the Indian and East Asian summer monsoons. These paleoclimatic changes have been revealed by, e.g., oxygen isotope analysis from different caves in Asia for the past several thousand years (Wang et al., 2008; Zhang et al., 2008, 2019; Y. Wang et al., 2005), analyzing marine sediment records for the Neogene and Quaternary (P. Wang et al., 2005), as well as other methods (Li et al., 2017; Wang et al., 2017; Ming et al., 2020; Wang et al., 2020). Most studies link the paleoclimatic changes of monsoon rainfall predominantly to solar insolation variations in the Northern Hemisphere affecting the Intertropical Convergence Zone (ITCZ) position due to orbital forcing changes (P. Wang et al., 2005; Y. Wang et al., 2005; Wang et al., 2008; Zhang et al., 2008, 2019; Ming et al., 2020).
Especially to explain abrupt nonlinear monsoon transitions as observed in the Holocene in the Tibetan Plateau, gradual insolation changes are not sufficient, and thus internal feedback mechanisms seem to be at play (Schewe et al., 2012; Herzschuh et al., 2014; Boos and Korty, 2016; Wang et al., 2020). The moisture-advection feedback (Levermann et al., 2009) might be such an internal mechanism that is able to provoke abrupt transitions and might be responsible for the abrupt Tibetan Plateau transitions in the Holocene (Herzschuh et al., 2014). Other amplifying effects might have occurred due to water vapor and cloud feedback (Jalihal et al., 2019).
Observations of the Indian summer monsoon in central India have revealed a decreasing rainfall trend in the second half of the 20th century (Ramanathan et al., 2005; Bollasina et al., 2011; Mishra et al., 2012, 2014b; Shah and Mishra, 2016; Jin and Wang, 2017). Since orbital forcing is playing a negligible role in external forcing in the current centuries (Seth et al., 2019), the competing effects of external anthropogenic forcings dominate these long-term trends: anthropogenic forcings are firstly the effect of GHGs and secondly the effect of sulfate aerosols and land-surface changes (Singh et al., 2019). The weakening trend of the Indian monsoon is associated with the GHG-induced warming of the Indian Ocean sea surface and the fact that the concurrent warming over the Indian subcontinent was dampened due to aerosols and land-cover changes (Zhou et al., 2008; Deser et al., 2010; Seth et al., 2019). The dampening effect over land results from the steep rise of anthropogenic emissions including sulfate aerosols in India and neighboring regions as well as enormous changes in land cover since the 1950s due to the strong expansion of industry and the population growth (Acharya and Sreekesh, 2013; Krishna Moorthy et al., 2013). The Indian Ocean warming has been linked to anomalies in the lower and upper troposphere due to enhanced latent heat uplift resulting from convection over the ocean (Danielsen, 1993; Dai et al., 2013). The warming of the Indian Ocean could intensify the convection over the ocean which is compensated by the subsidence of air masses over land. By preventing the convection over the subcontinent, the Hadley cell is modulated in such a way that a drying trend over the region is introduced (Roxy et al., 2015). Another significant aspect contributing to the rainfall decrease is discussed to be the narrowing of the ITCZ and, correspondingly, the decrease of the associated belt of intense rainfall (Byrne and Schneider, 2016).
The declining trend has been reversed in various datasets since the beginning of the 21st century, except in the Indian Meteorological Department dataset where a stabilization was captured (Jin and Wang, 2017). The revival of the rainfall in central and northern India might be explained by the emerging land warming due to GHG emissions dominating over the effect of sulfate aerosols and land-cover change. The compensating effect of aerosols in particular has declined and is expected to further decline due to policy interventions (Seth et al., 2019; Allan et al., 2020). The decreased ocean evaporation in the Arabian Sea leads to a decrease of moisture transport to India and thus fewer low clouds, which results in a warming of the Indian subcontinent. The rising land-surface temperature increases the meridional temperature gradient in the lower troposphere, enhancing the Hadley circulation and summer monsoon rainfall (Jin and Wang, 2017). Therefore, the magnitude of future monsoon rainfall may depend on where temperature rises faster – on the sea surface or land masses (Singh et al., 2019). Since this goes back to the competing influence of GHGs and aerosol forcing over land, the task of modeling the future monsoon rainfall coincides with projecting the magnitude of the different forcing mechanisms and capturing the monsoon's sensitivity to it.
Within the latest studies using global coupled models, there is a widespread consensus that the Indian monsoon rainfall will increase due to climate change in the 21st century (Chaturvedi et al., 2012; Menon et al., 2013; Lee and Wang, 2014; Asharaf and Ahrens, 2015; Mei et al., 2015; Sharmila et al., 2015; Varghese et al., 2020). This trend is found for various Coupled Model Intercomparison Project phase 5 (CMIP5) models (Menon et al., 2013), the multi-model mean (Chaturvedi et al., 2012), the mean of only the four best models (Lee and Wang, 2014) or the model with the best deep convection scheme (Varghese et al., 2020). Under Representative Concentration Pathway 8.5 (RCP8.5), CMIP5 models project a median increase in Indian monsoon rainfall of 2.3 % K−1 (Menon et al., 2013). Also under RCP8.5, the amount of rainfall over India is projected to increase by 18.7 % by the end of the 21st century compared to 1961–1999 (Chaturvedi et al., 2012). This trend is expected to be the consequence of the warming of the Indian Ocean enhancing atmospheric moisture content and thus moisture flux convergence arising from changes in moisture which generally follow the Clausius–Clapeyron relation (Cherchi et al., 2011; Seth et al., 2013; Mei et al., 2015; Sooraj et al., 2015; D'Agostino et al., 2019). This so-called thermodynamic effect dominates over the dynamic effect, which refers to weaker winds and a reduced monsoon circulation due to a weakened tropical overturning circulation and an expected decrease of rainfall (Vecchi et al., 2006; Mei et al., 2015; Sooraj et al., 2015; D'Agostino et al., 2019). Besides, the interannual variability is projected to increase in most models under the strongly forced scenarios as well as in models with good performance in capturing the mean seasonal cycle in the present climate (Kitoh et al., 1997; Menon et al., 2013; Jayasankar et al., 2015; Sharmila et al., 2015; Kitoh, 2017).
The capabilities of climate models in simulating the Indian monsoon have improved over time, such that more accurate projections can be expected from the latest update of the climate models in CMIP6. Several studies found a broad range of improvements between CMIP3 and CMIP5 in simulating the 20th century monsoon (Sperber et al., 2013; Ogata et al., 2014; Ramesh and Goswami, 2014), though one study, based on a small subset of models, however, disagrees (Shashikanth et al., 2014). Gusain et al. (2020) found a significant improvement between CMIP5 and CMIP6 in simulating the Indian summer monsoon rainfall for the period 1951–2005. Models in CMIP5 still struggled with various issues including displaying the decrease in rainfall in the second half of the 20th century (Saha et al., 2014; Sabeerali et al., 2015; Ashfaq et al., 2017) and capturing observed trends in the extremes (Mishra et al., 2014a) and seasonality indices (Ul Hasson et al., 2016). With the new generation, models' capacities in capturing the spatiotemporal pattern of Indian summer monsoon, especially in the Western Ghats and the northeast foothills of Himalaya mountains, have undergone significant progress (Gusain et al., 2020). While global coupled models in CMIP5 failed to capture the influence of topography, land-surface feedback and land use change due to their coarse spatial resolution, the general higher resolution in CMIP6 contributes to an improved simulation of Indian monsoon dynamics (Singh et al., 2019; Gusain et al., 2020). Further improvements have been achieved by updating deep convective schemes, modifying parameterization on microphysical scale, integrating indirect effects of aerosols in cloud formation and advancing ocean-ice models (Gusain et al., 2020).
Here, we aim to update the CMIP projections for the Indian monsoon rainfall and its interannual variability for the 21st century by using 32 models of the latest climate model generation. For this purpose, we use the Shared Socioeconomic Pathways (SSPs) and possible corresponding forcing levels as a scenario framework (O'Neill et al., 2017). Section 2 gives a brief overview of the data used and processed. In Sect. 3.1, we evaluate the participating models according to their capacity of modeling the Indian summer monsoon in historic periods. Section 3.2 presents the results of the mean summer monsoon precipitation, while Sect. 3.3 focuses on the long-term trend of interannual variability. The results are discussed in Sect. 4.
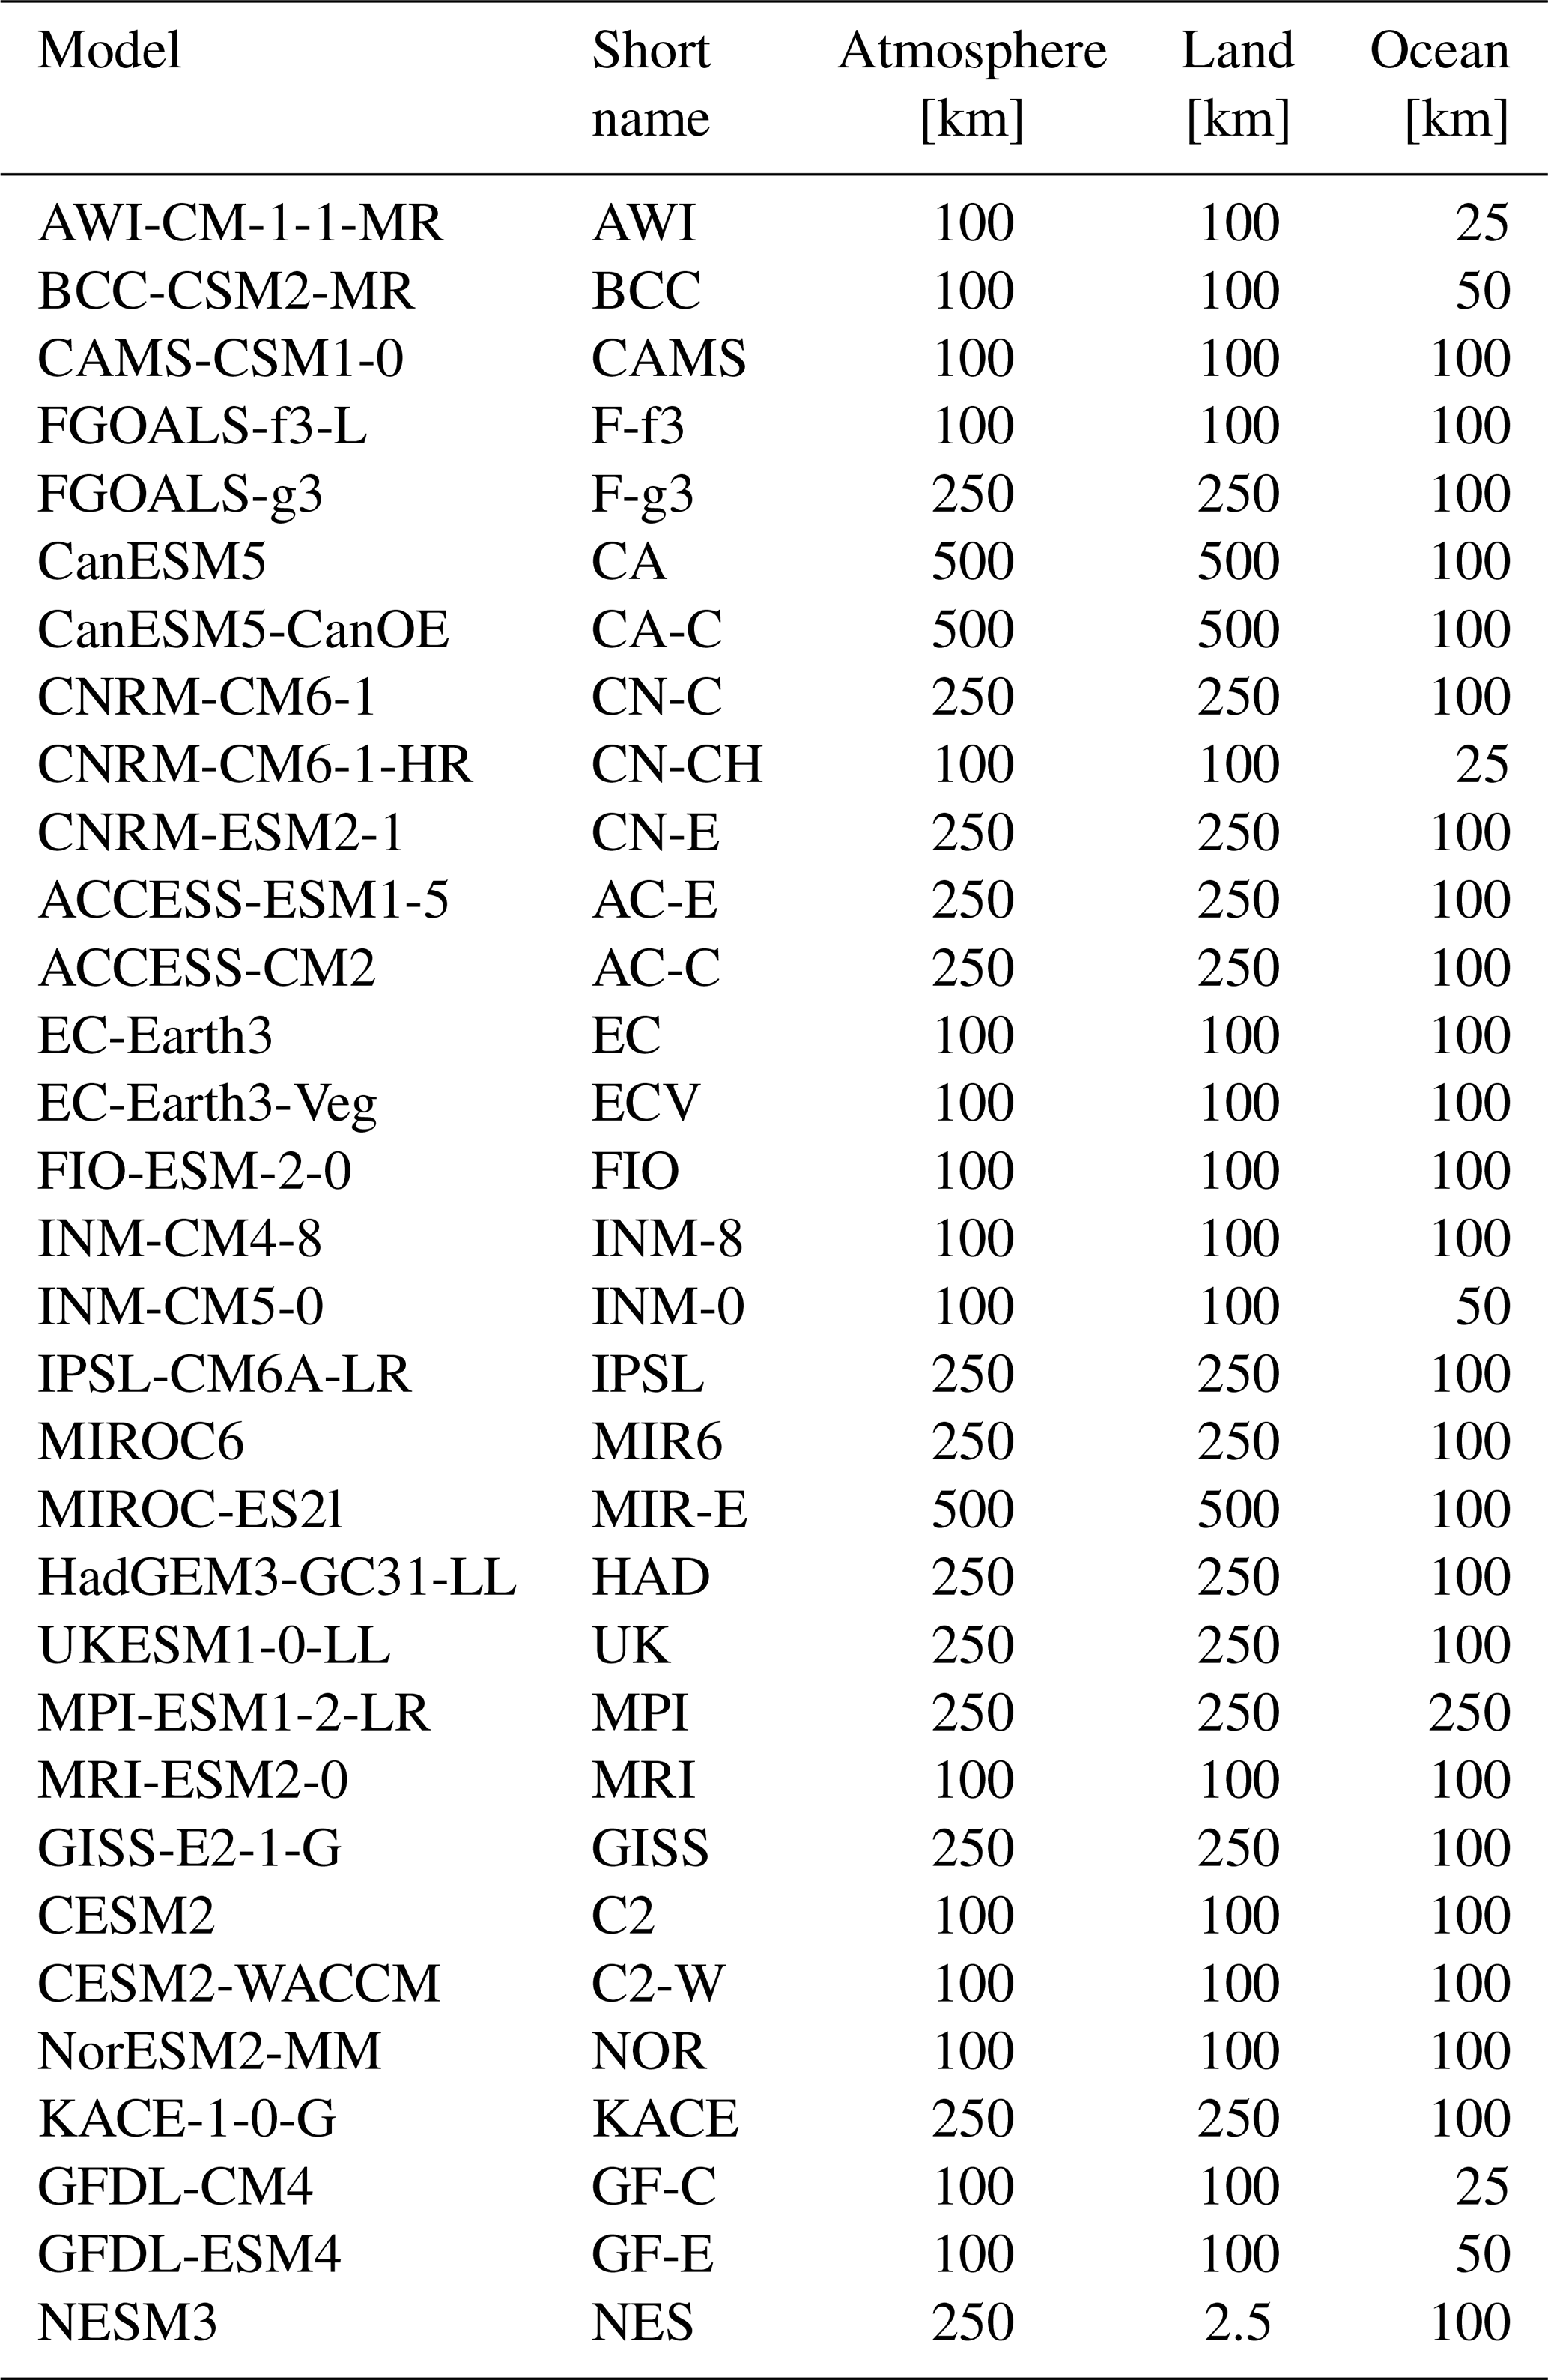
In this study, we investigate the mean Indian summer monsoon rainfall and its interannual variability under four different scenarios using 32 global climate models that participated in CMIP6. The four scenarios (SSP1-2.6, SSP2-4.5, SSP3-7.0 and SSP5-8.5) are based on different socioeconomic scenarios and combined with the resultant forcing level (Van Vuuren et al., 2014; O'Neill et al., 2017). The models are chosen according to their data availability for the historic period (1850–2015) and the future period (2015–2100) under SSP5-8.5 in the Scenario Model Intercomparison Project (ScenarioMIP) (Tebaldi et al., 2021). For each model, for consistency, we use one ensemble member (if available: r1i1p1f1) even if more are available. An overview of modeling centers and data availability for the different scenarios is given in Table 1. The short names of the models used in this study can be found in Table 2. We select the land area with latitude 6–36∘ N and longitude 67.5–98∘ E, comprising India and neighboring regions. The land area is obtained by using land–sea masks for each model that are based on the percentage of the grid cells occupied by land (see Fig. 3 for each model). The resolution strongly differs between the models ranging over land from about 100 to 500 km (see Table 2). Mean rainfall is obtained by averaging the monthly rainfall data from June–September over the region of interest. For comparison of models to observational data, we use precipitation over land from global reanalysis data at 0.5∘ spatial resolution. The WFDE5 (Forcing Data methodology applied to ERA5 reanalysis data) dataset (Cucchi et al., 2020) is used for the period 1985–2015, while for the pre-satellite era period 1900–1930, we use the GSWP3 (Global Soil Wetness Project Phase 3) dataset (Kim, 2017). Both datasets are based on Global Precipitation Climatology Centre (GPCC) monthly precipitation rates (Schneider et al., 2018; Lange, 2019). For calculating the change in interannual variability, we apply the singular spectrum analysis method (Golyandina and Zhigljavsky, 2013) with a window size of 20 years to extract the nonlinear trend.
Table 1Overview of data availability for the 32 models used in the study (precipitation/temperature). Only those models are selected for which data for historic period and SSP5-8.5 were available at the time of the study. Y: available; N: not available.
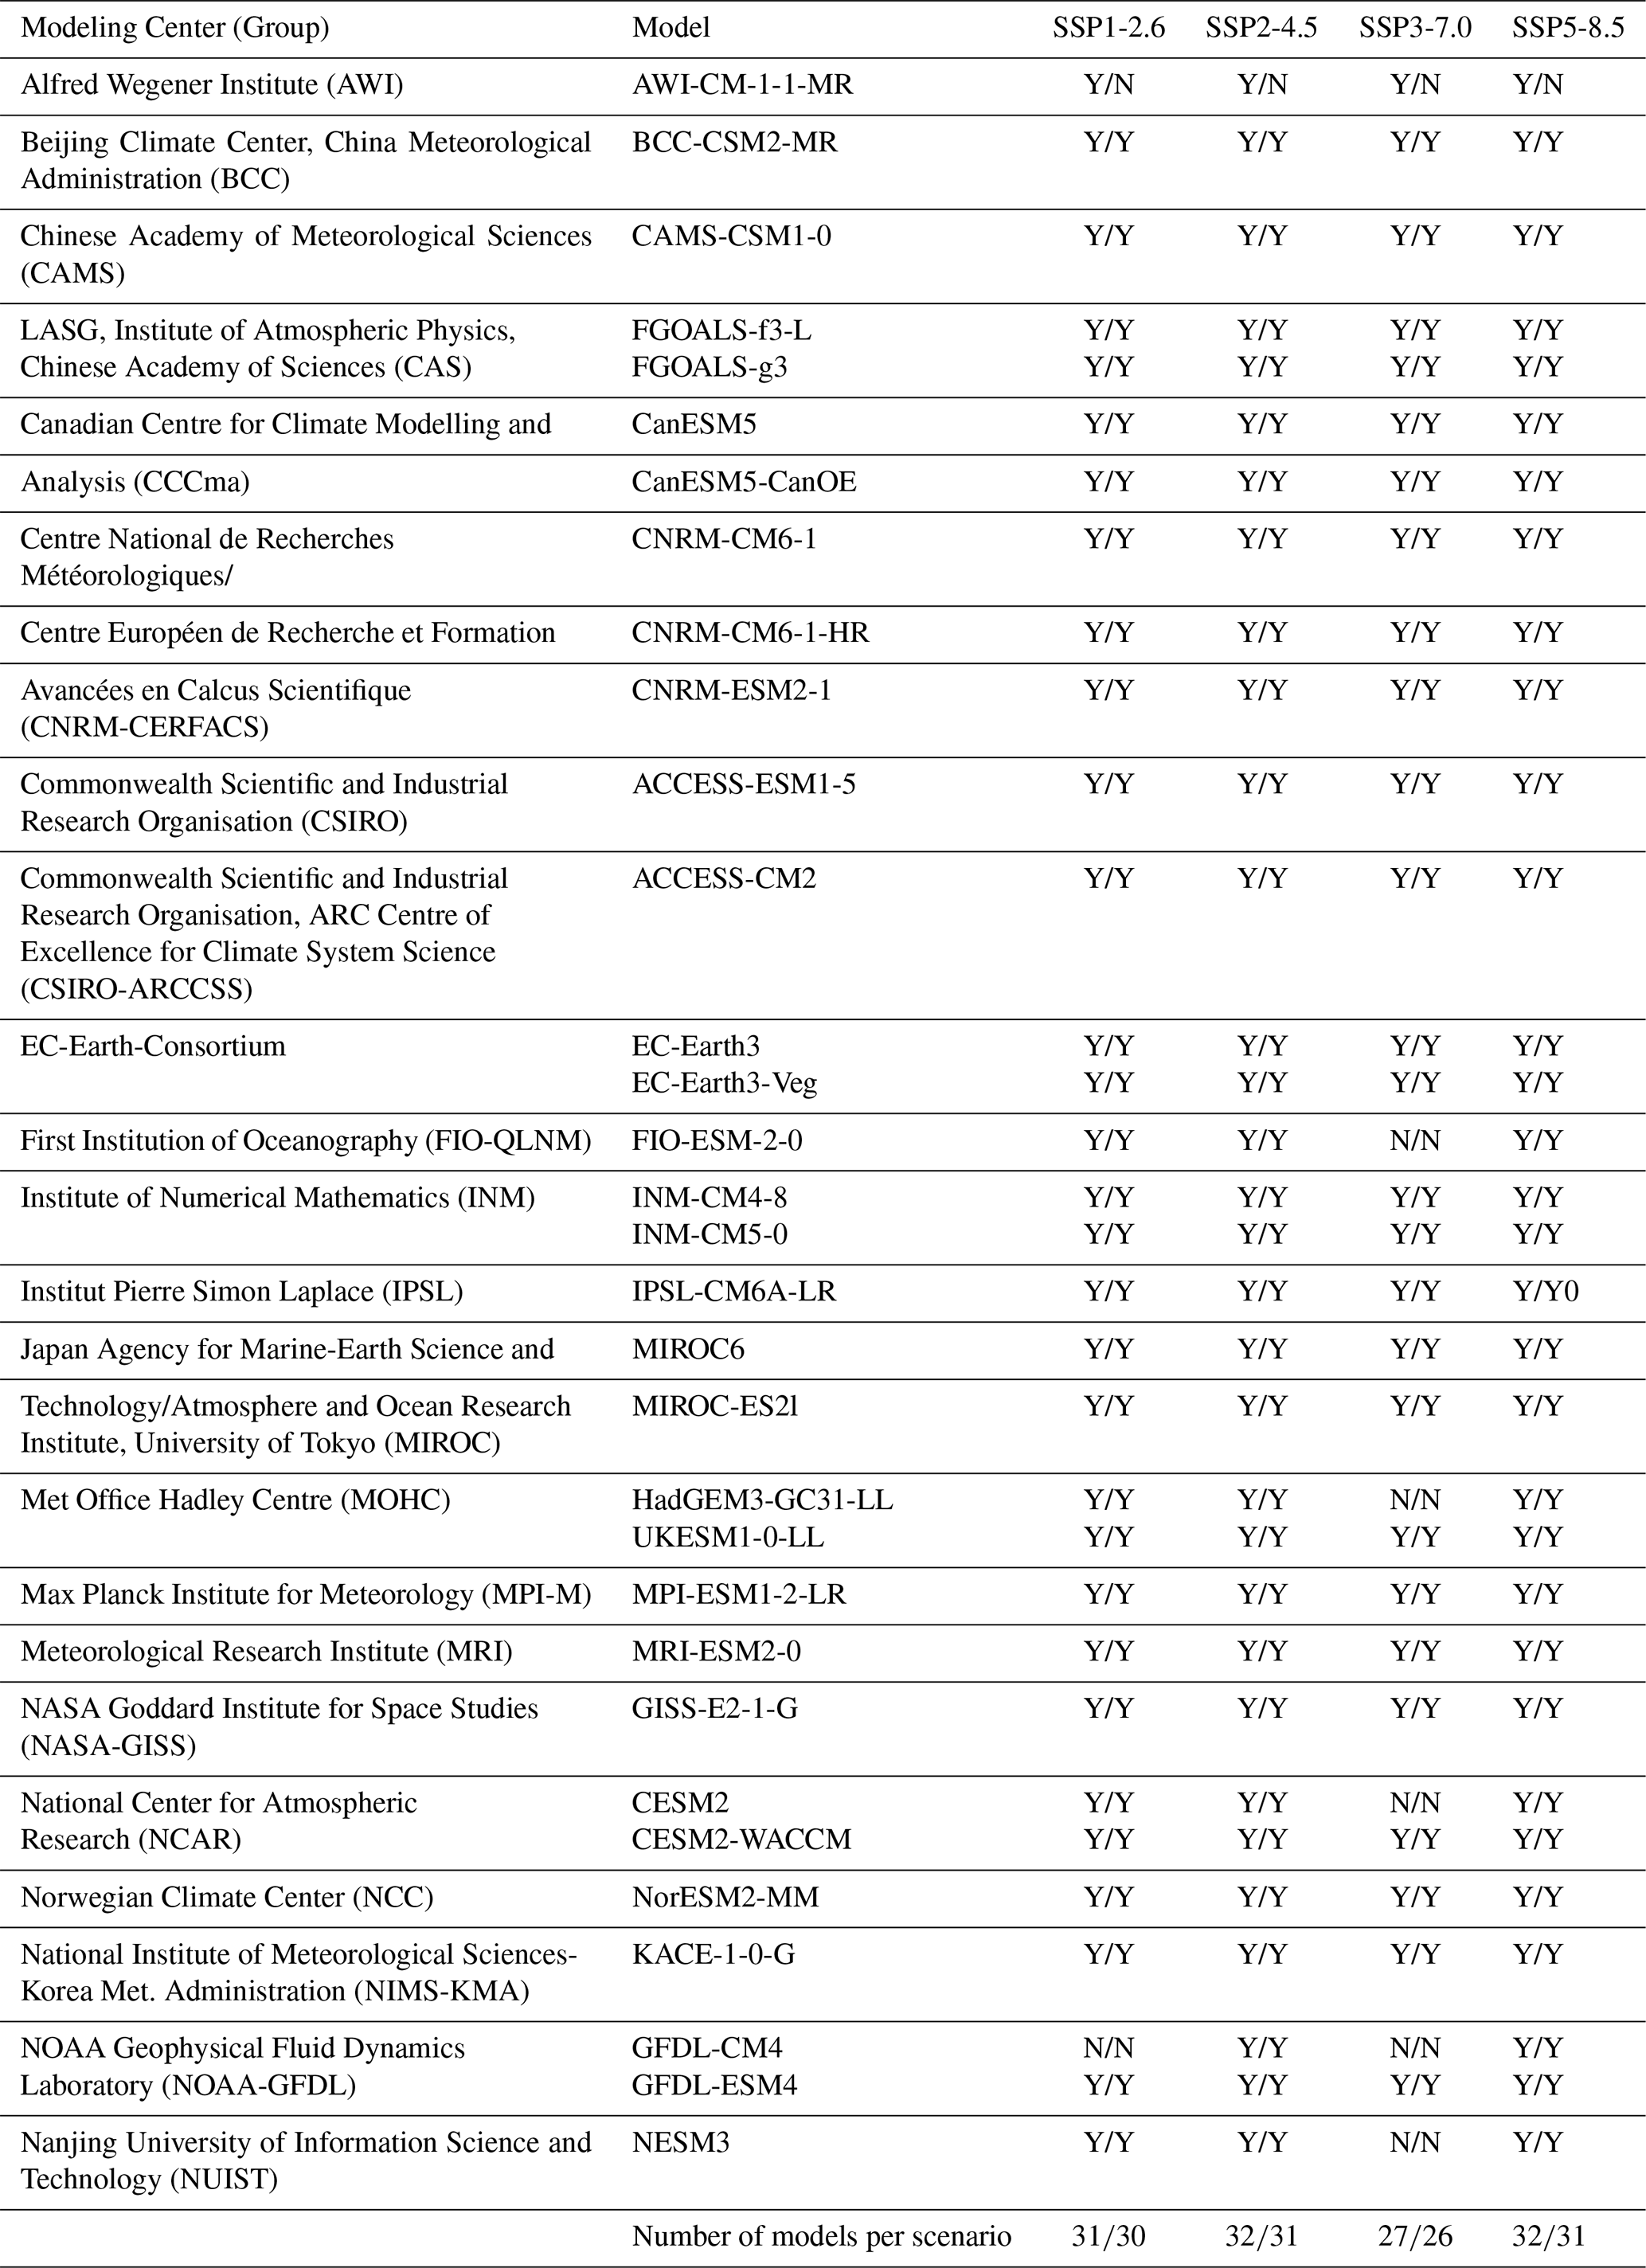
Table 2Overview of short names used in this study and resolution in which the 32 models were run.
3.1 Model comparison
To evaluate the models' quantitative capacities of capturing the Indian monsoon rainfall, we compare their projected seasonal mean rainfall with WFDE5 reanalysis data over land (Cucchi et al., 2020) for two 30-year periods in the past (1900–1930, 1985–2015). We choose these periods to obtain a model evaluation for a historic period as well as for a period close to present. The seasonal mean rainfall from the reanalysis data is 6.1 mm d−1 with a standard deviation of 0.5 mm d−1 for 1900–1930 and 6.1±0.4 mm d−1 for 1985–2015 (Fig. 1). For both periods, about half of the models capture the quantitative June-to-September (JJAS) rainfall within twice the standard deviation (dashed lines in Fig. 1). The standard deviation of the models ranges from 0.3 to 0.8 mm d−1 for 1900–1930 and 0.3 to 1.0 mm d−1 in 1985–2015 (error bars in Fig. 1). The models INM-CM4-8 and FIO-ESM-2-0 overestimate the annual rainfall for both periods; the mean value of BCC-CSM2-MR exceeds the upper threshold in 1985–2015. Several models underestimate the seasonal mean rainfall, especially the models of the Canadian Centre for Climate Modeling and Analysis (CanESM5-CanOE, CanESM5) which capture just about half of the reanalysis rainfall amount. All models that underestimate the rainfall for 1900–1930 show rainfall means below the lower threshold in 1985–2015, too. GFDL-CM4 for 1900–1930 and GISS-E2-1-G for 1985–2015 capture the seasonal rainfall quantitatively best. The other models that are closest to the reanalysis mean overlap for both periods, e.g., CNRM-CM6-1, NorESM2-MM and FGOALS-f3-L. For the two chosen time periods, models that capture, over- or underestimate the mean rainfall within twice the standard deviation mostly have the same tendency for both periods. The multi-model mean for 1900–1930 is 5.6±1.1 and 5.7±1.1 mm d−1 for 1985–2015.

Figure 1Indian summer monsoon mean rainfall (mm d−1) over the region displayed in Fig. 3 from 32 different models for the period 1985–2015 (red) and 1900–1930 (black). The vertical line represents the mean monsoon rainfall from WFDE5 and GSWP3 reanalysis data for the same periods; the dashed lines show plus/minus twice the standard deviation across the 30-year time period. Circles with error bars represent mean and mean plus/minus 1 standard deviation for each CMIP6 model in the same region and the same period.
In order to identify models with a potentially realistic representation of the Indian monsoon rainfall, we also analyze the spatial precipitation distribution for 1985–2015. We choose this period since it is closer to the present and therefore closer to the simulated time period in the future. As a reference dataset, we use WFDE5 reanalysis data again. The distribution is dominated by rainfall over the Western Ghats, the Himalaya region, the west coast of the Bay of Bengal, the northeast of India and the north of Myanmar, partly even exceeding 20 mm d−1 averaged over JJAS and the 30-year period. The east of central India reaches rainfall values above 10 mm d−1 (Fig. 2). The spatial rainfall pattern for the CMIP6 models in 1985–2015 is shown in Fig. 3. Models that captured the rainfall quantitatively well mostly simulate a spatial pattern close to the reference distribution, e.g., NorESM2-MM, CNRM-CM6-1, FGOALS-f3-L. FIO-ESM-2-0 overestimates the rainfall in the Himalaya region. The models with the tendency to underestimate the rainfall, such as ACCESS-CM2, CanESM5-CanOE, and CanESM5, mostly are not able to capture the spatial pattern. Especially the southwest coast of India and the Himalaya region are not reproduced according to the reanalysis data by most of these models. Exemptions for the models with low rainfall values are the models of the EC-Earth consortium (EC-Earth3, EC-Earth3-Veg), which simulate a pattern very close to the reference distribution.
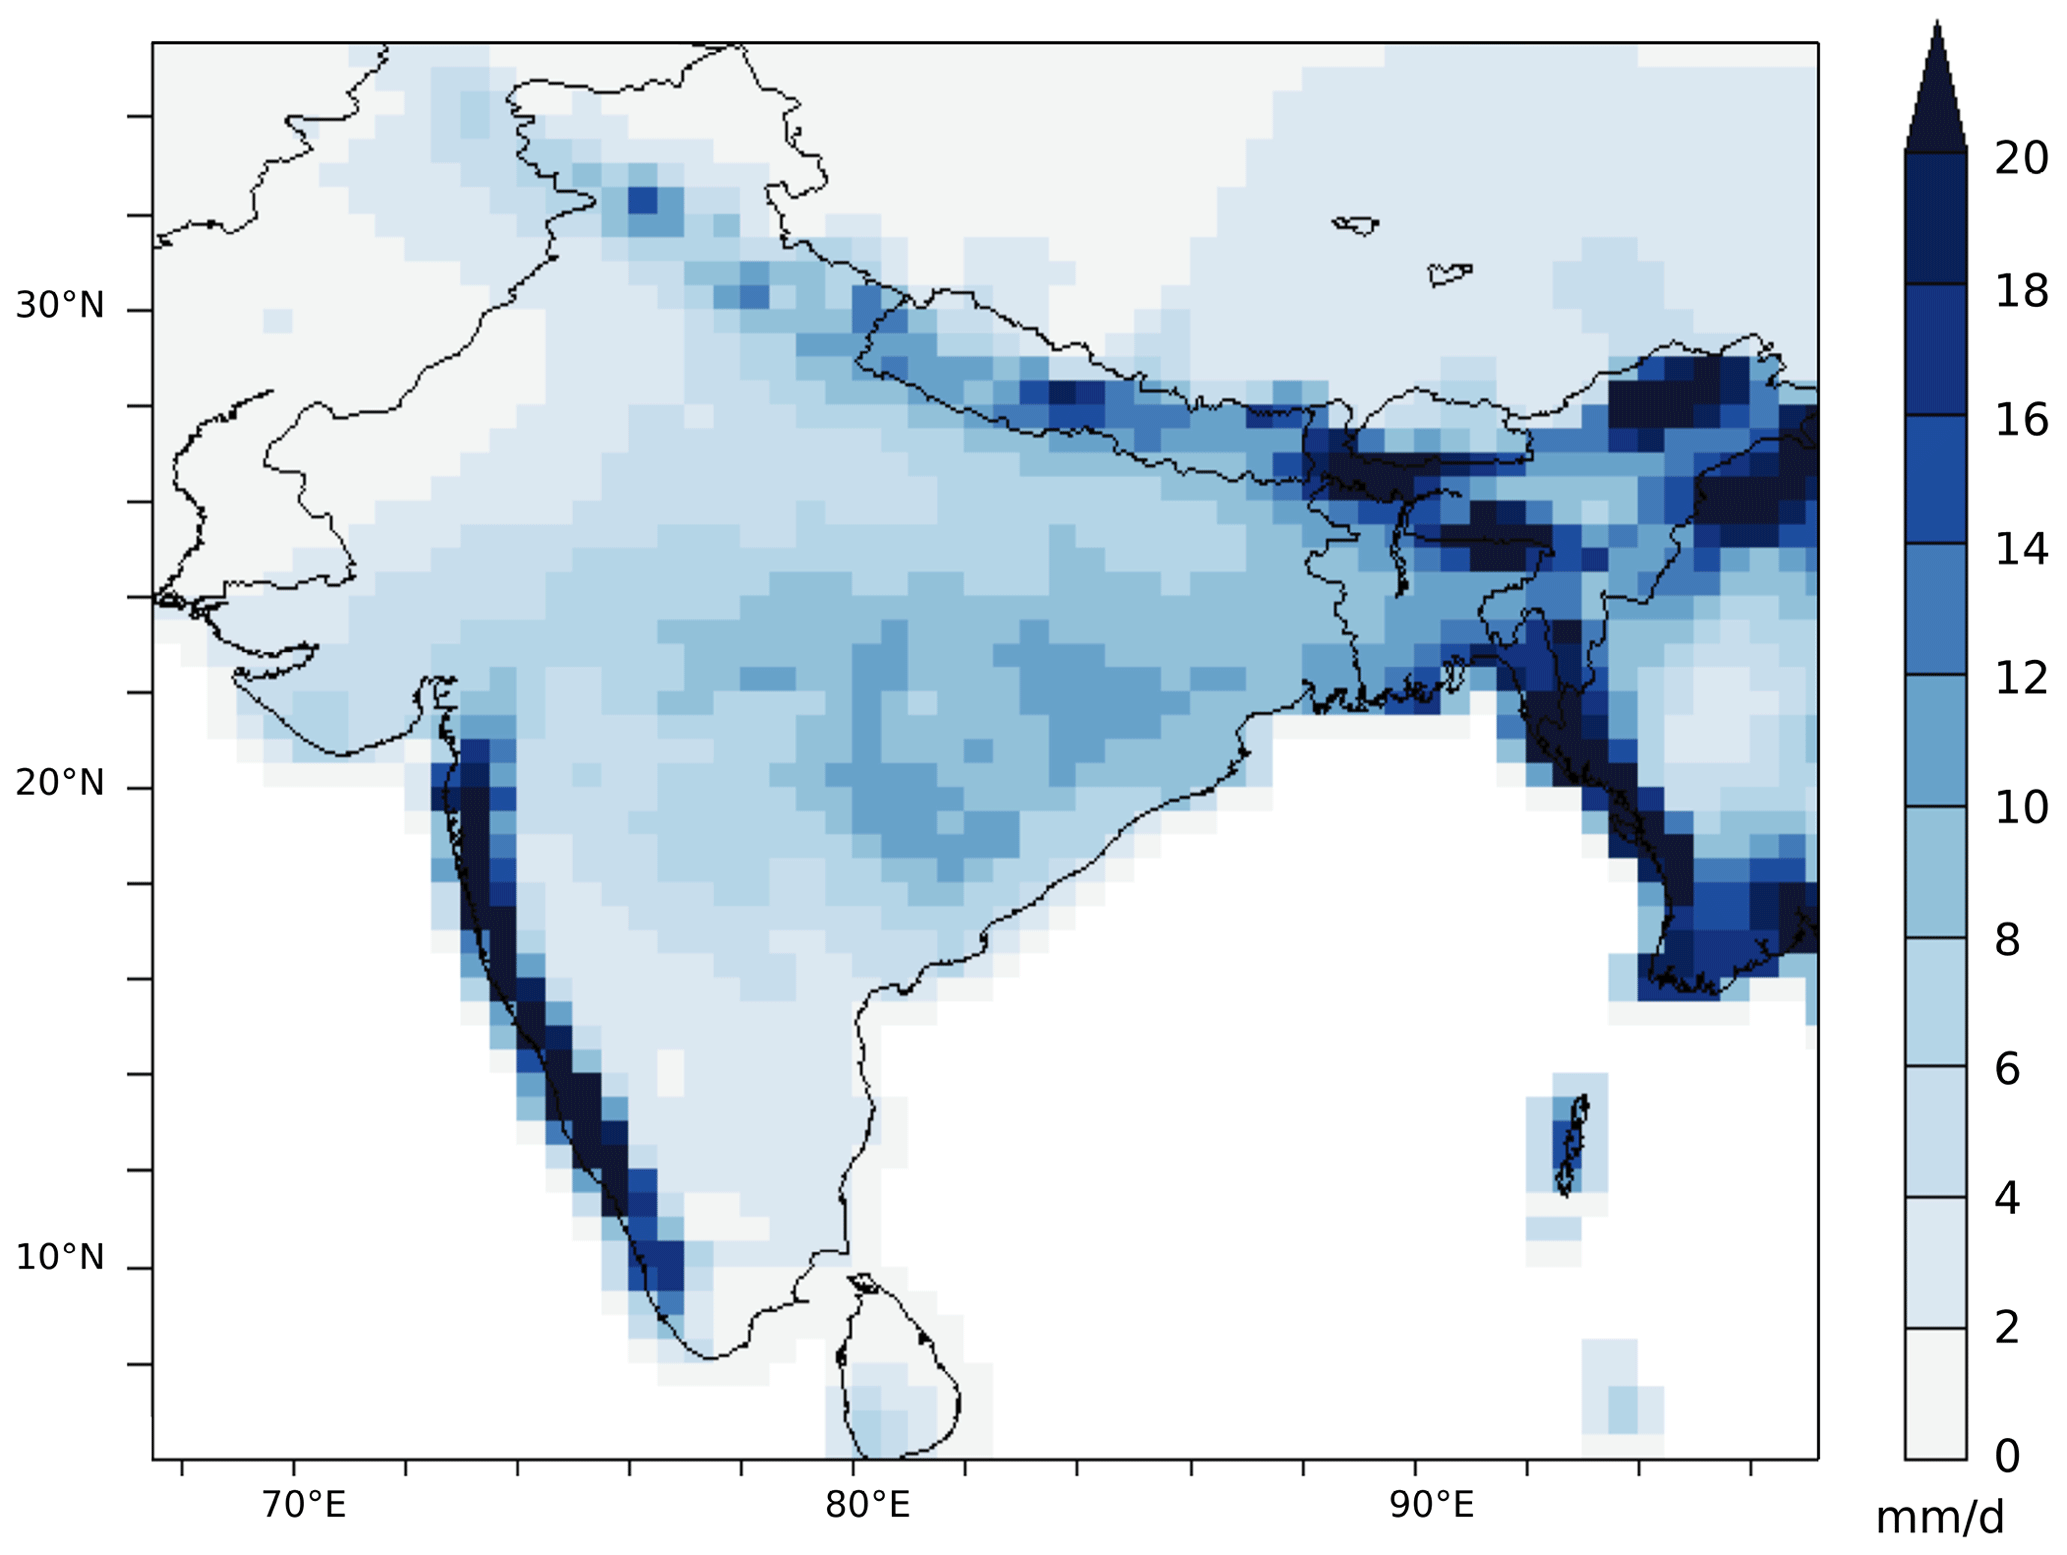
Figure 2Spatial distribution of Indian summer monsoon rainfall (mm d−1) averaged over the period 1985–2015 from WFDE5 reanalysis data.
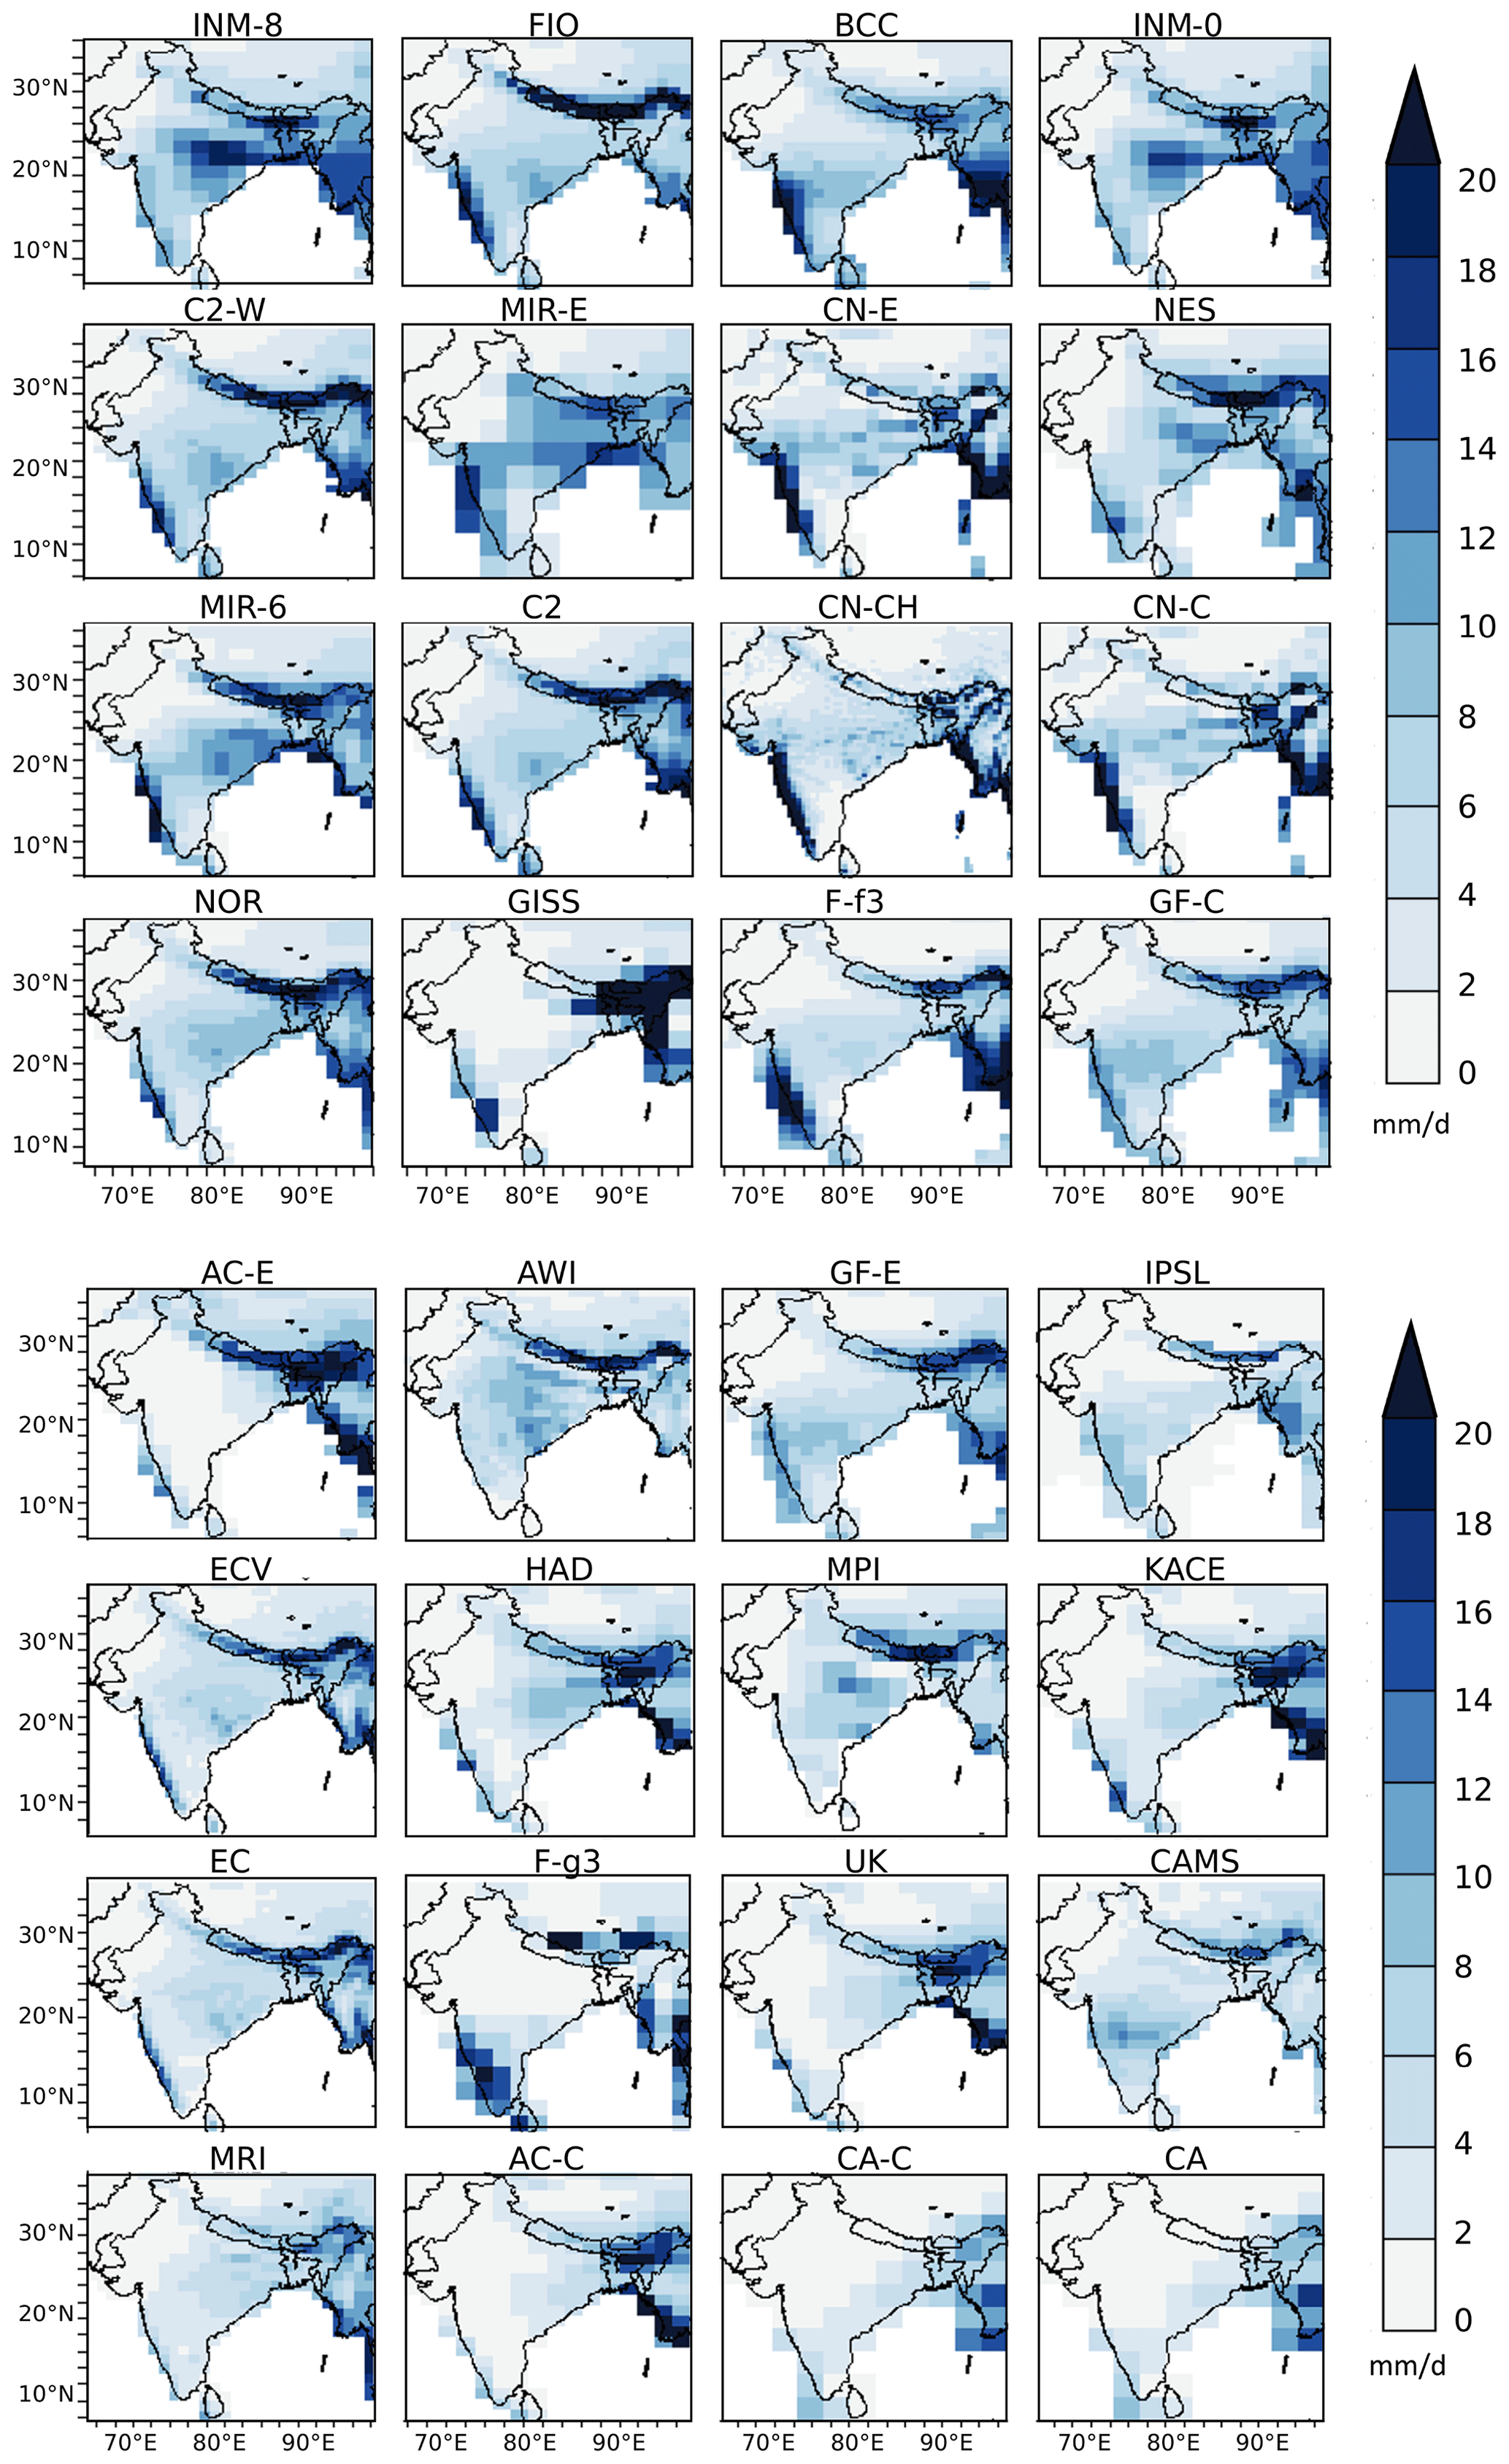
Figure 3Spatial distribution of Indian summer monsoon mean rainfall (mm d−1) averaged over the period 1985–2015. The models are shown in the same order as in Fig. 1.
For presenting and discussing the results of this study, we decided to focus on the models within mean plus/minus twice the standard deviation which also deliver a reasonable spatial rainfall pattern. Nevertheless, we will provide information for all 32 models.
3.2 Trend in Indian summer monsoon mean rainfall for the end of the 21st century
In order to determine the long-term trend in Indian monsoon rainfall, we first analyze the temporal time series between 1850–2100 for all models under SSP5-8.5 (Fig. 4). All available models show a clear positive long-term trend. The models exceed the envelope of the baselines variability (gray vertical lines in Fig. 4) between 2014 (HadGEM3-GC31-LL) and 2088 (CESM2), on average over all models in 2045. For the other SSPs, the evolution in time as well as the magnitude of change by the end of the 21st century is indicated as the model mean in Fig. 5.

Figure 4Time series of Indian summer monsoon mean rainfall (mm d−1) for the period 1850–2100 from the 32 climate models under SSP5-8.5. The underlying area is in accordance with the displayed region in Fig. 3. Red shadings represent the yearly values; red lines represent the nonlinear trend obtained from a singular spectrum analysis with a window size of 20 years according to the method in Golyandina and Zhigljavsky (2013). The horizontal black lines represent mean ±1 SD (standard deviation) for each model for the period 1850–2015. The order is done according to Fig. 1. For the multi-model mean under SSP5-8.5 and other scenarios, refer to Fig. 5.
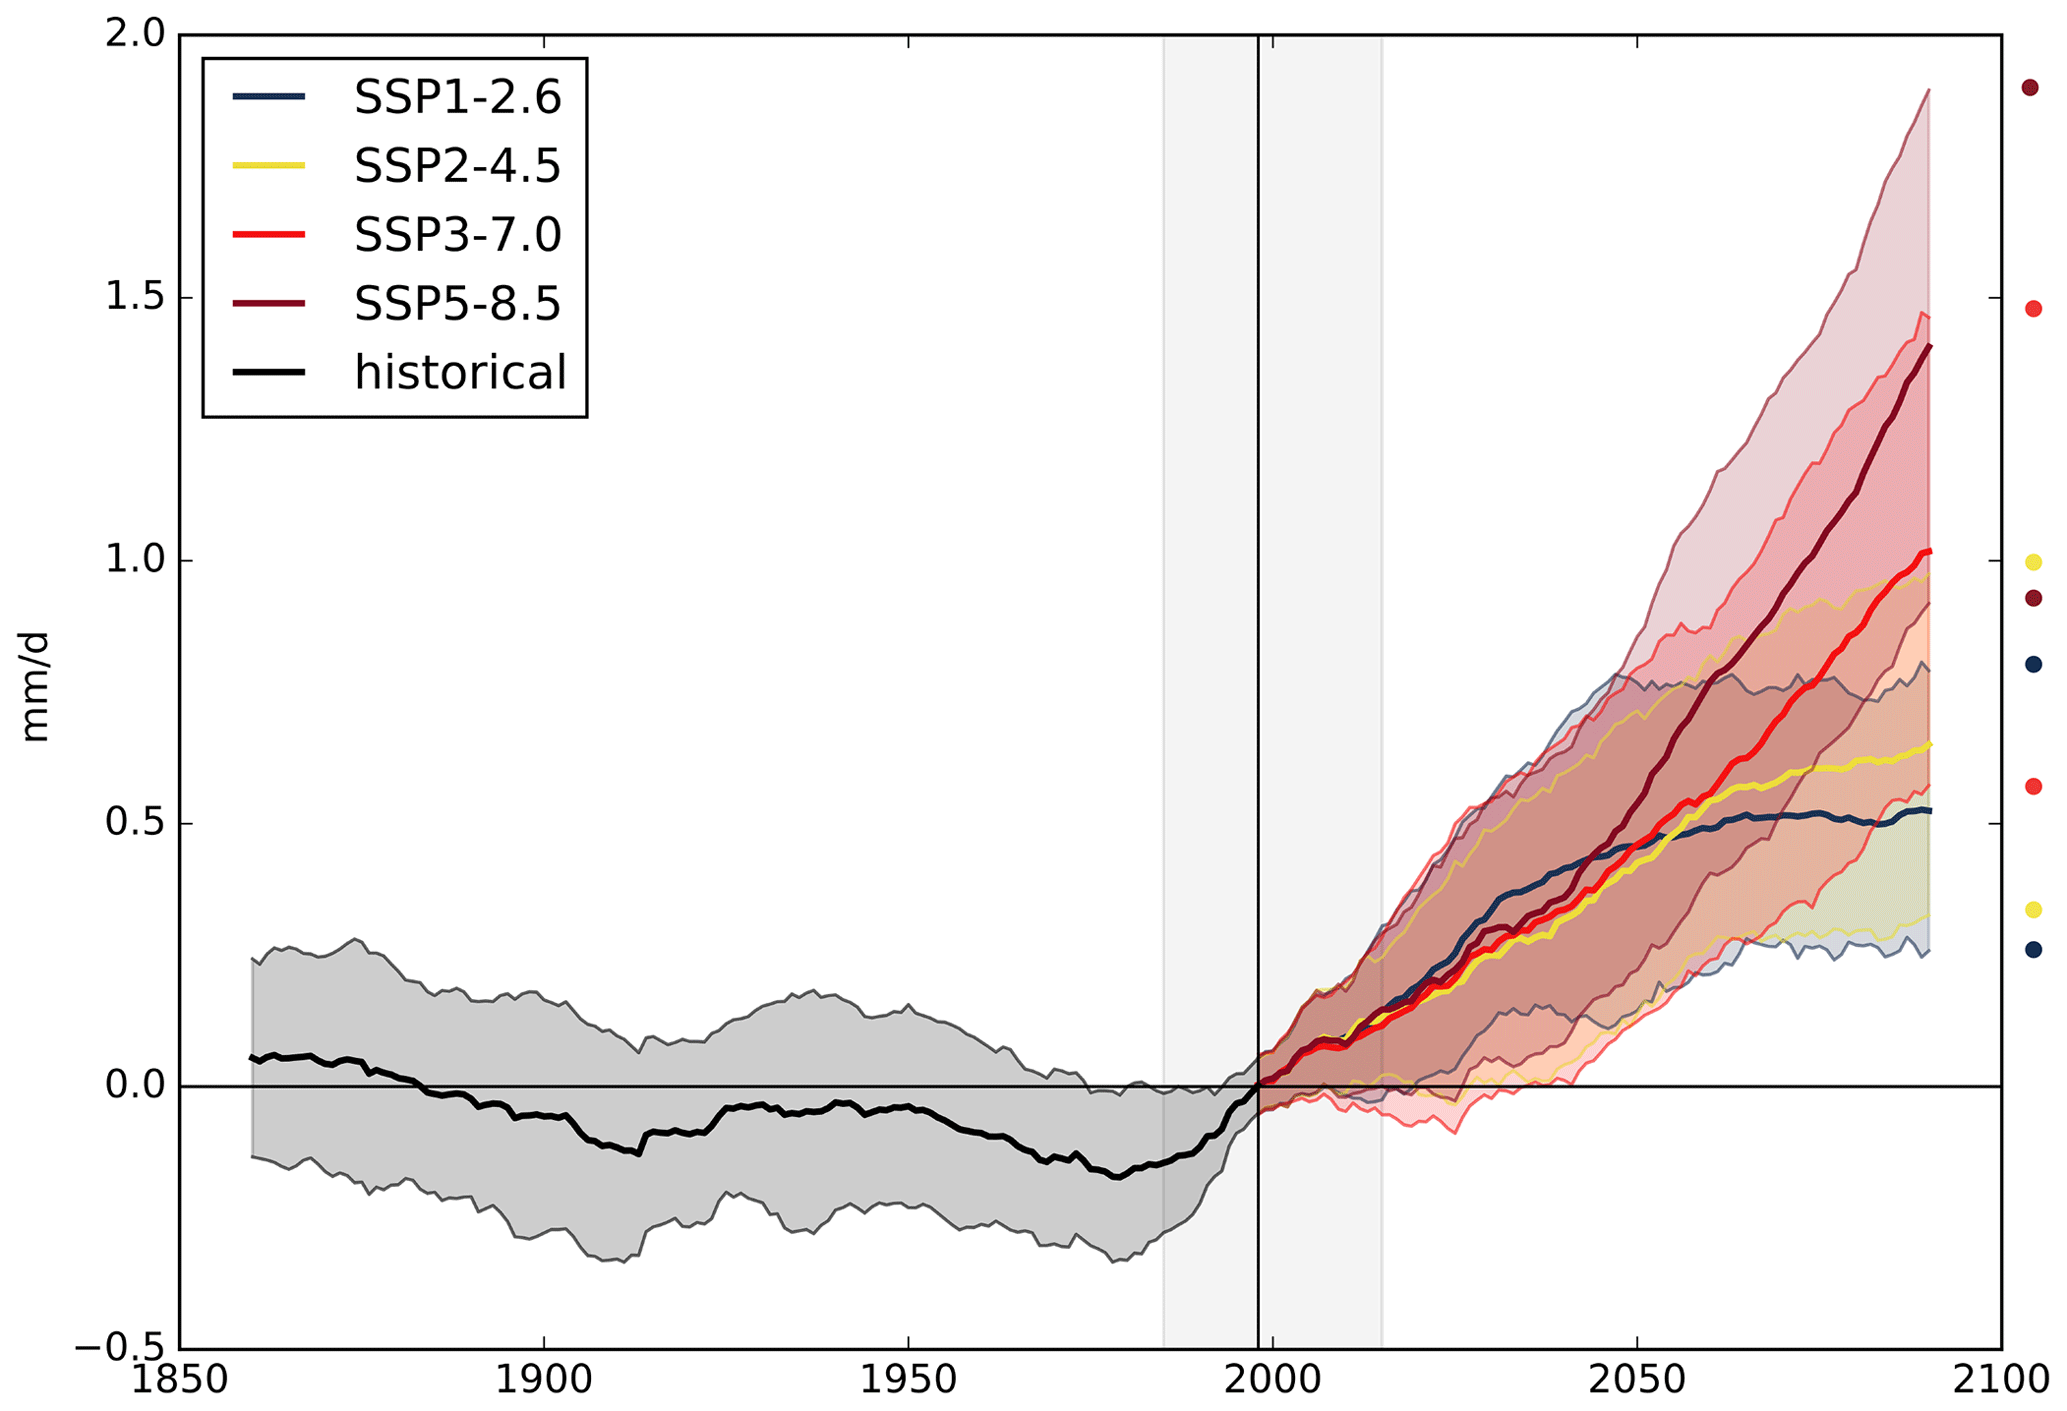
Figure 5Multi-model mean of Indian summer monsoon rainfall (mm d−1) over the displayed area in Fig. 3 for 1860–2090 relative to the mean (horizontal black line) in 1985–2015 (gray background) for the four scenarios (SSP1-2.6, SSP2-4.5, SSP3-7.0 and SSP5-8.5). The 20-year smoothed time series of one ensemble member per model was used to calculate the multi-model mean. Shading in the time series represents the range of mean plus/minus 1 standard deviation marked with circles on the right side of the figure. Availability of the models is in accordance with Table 1.
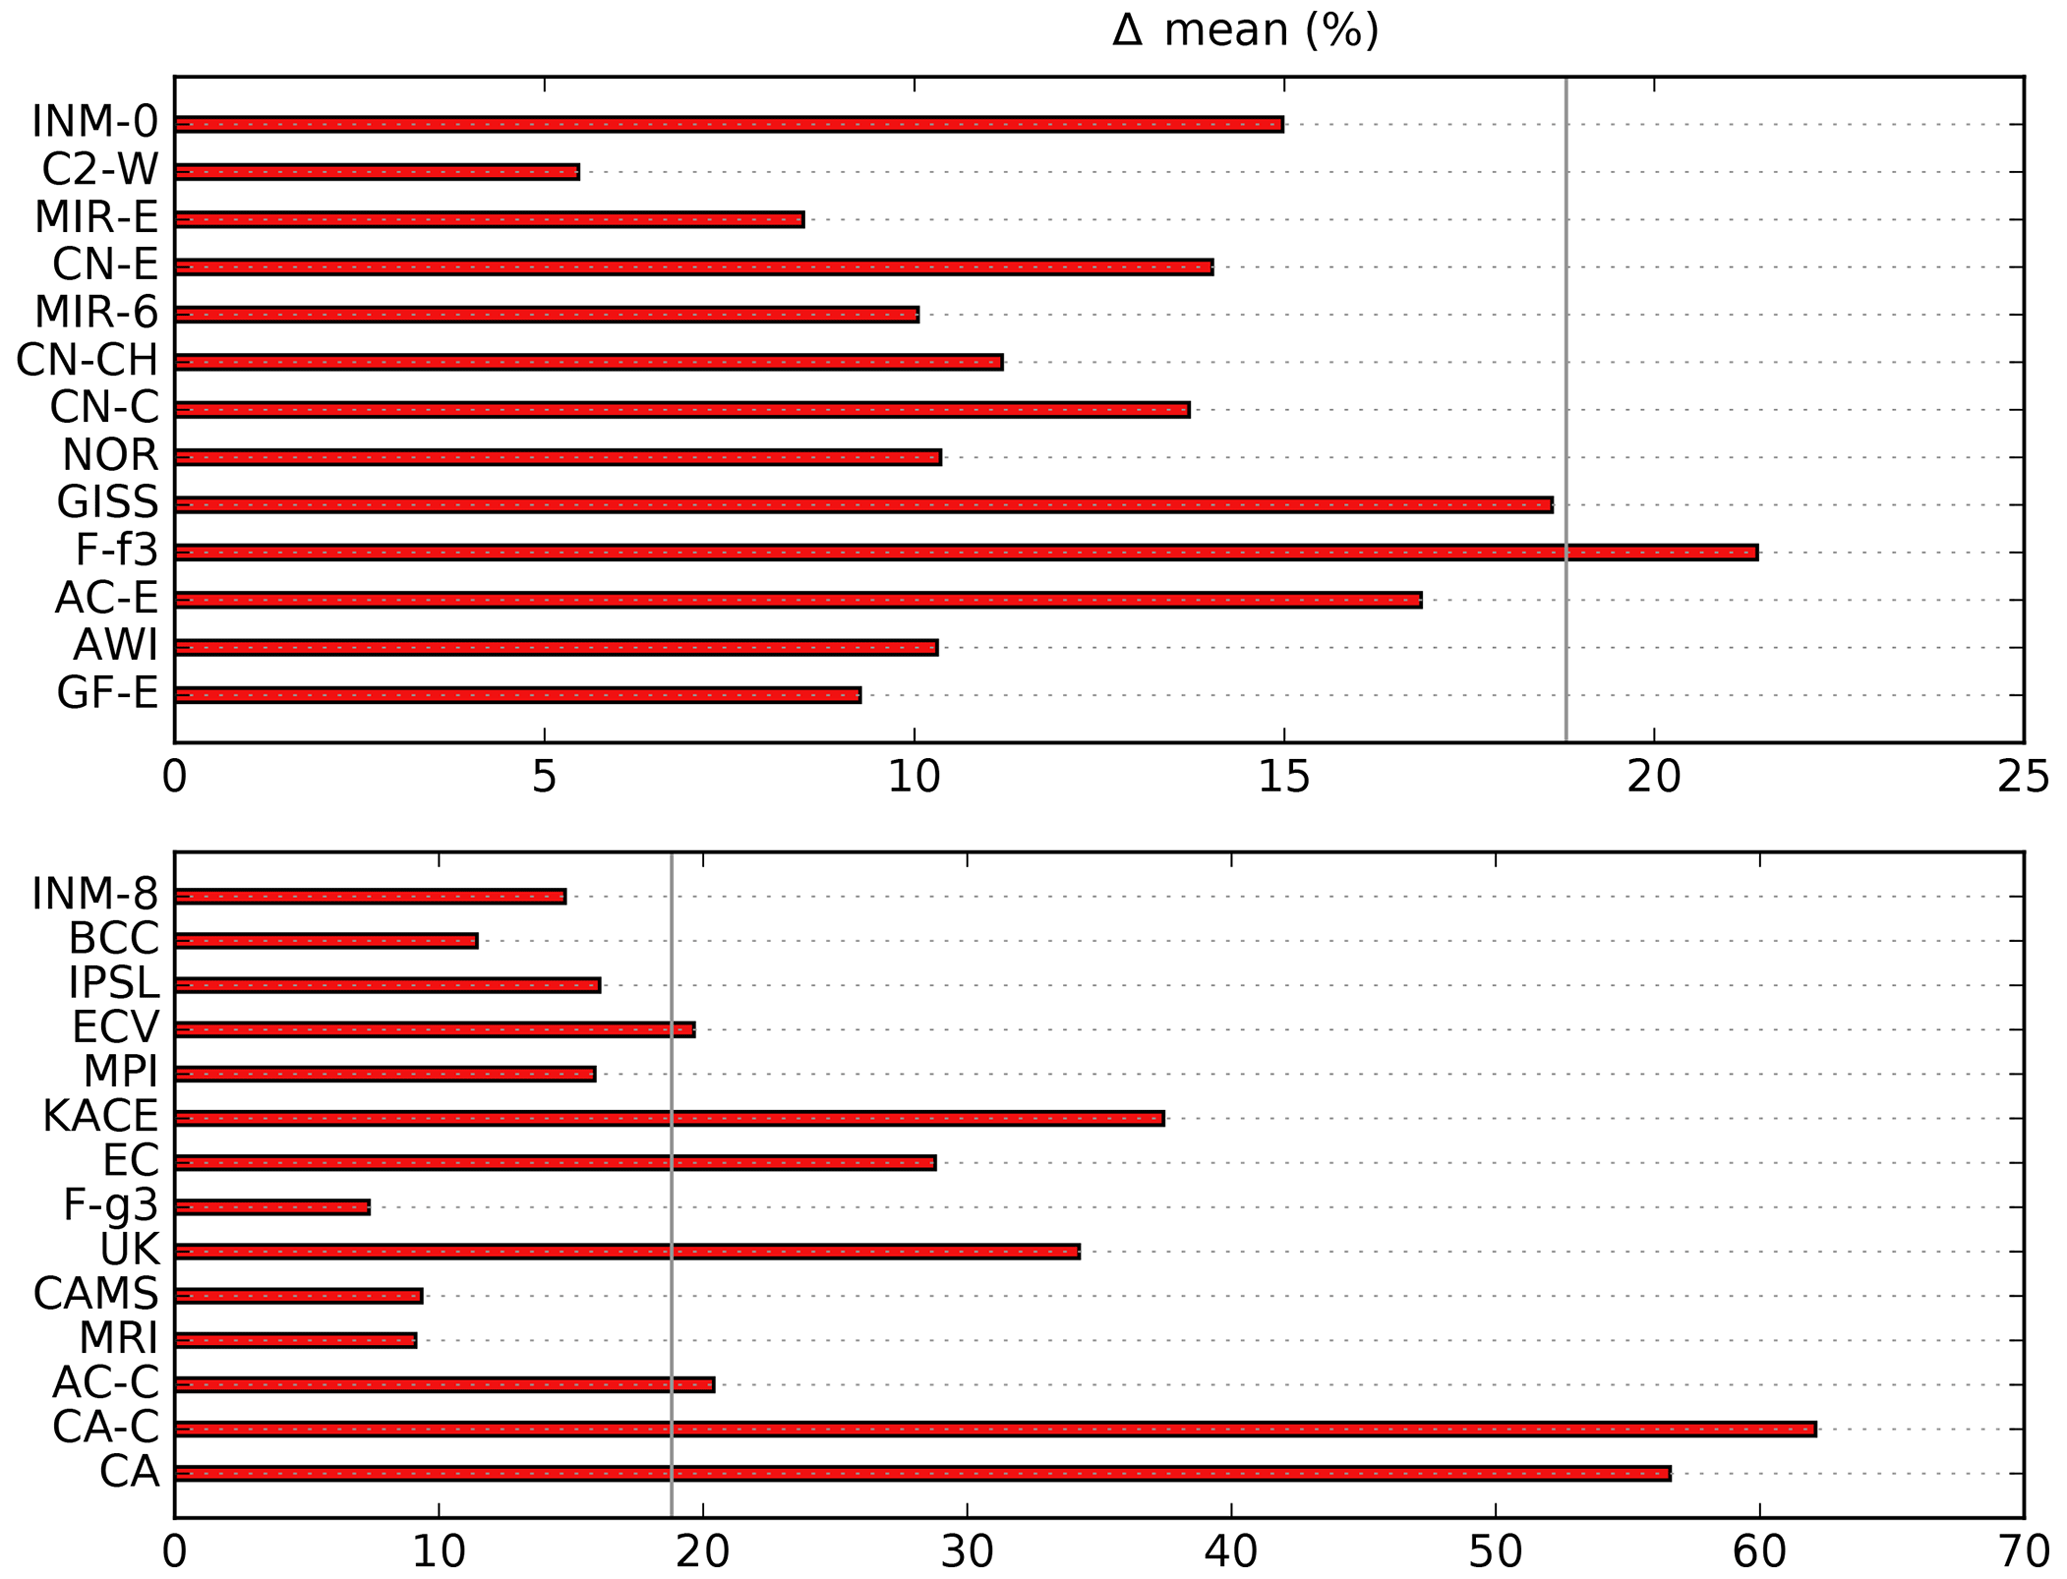
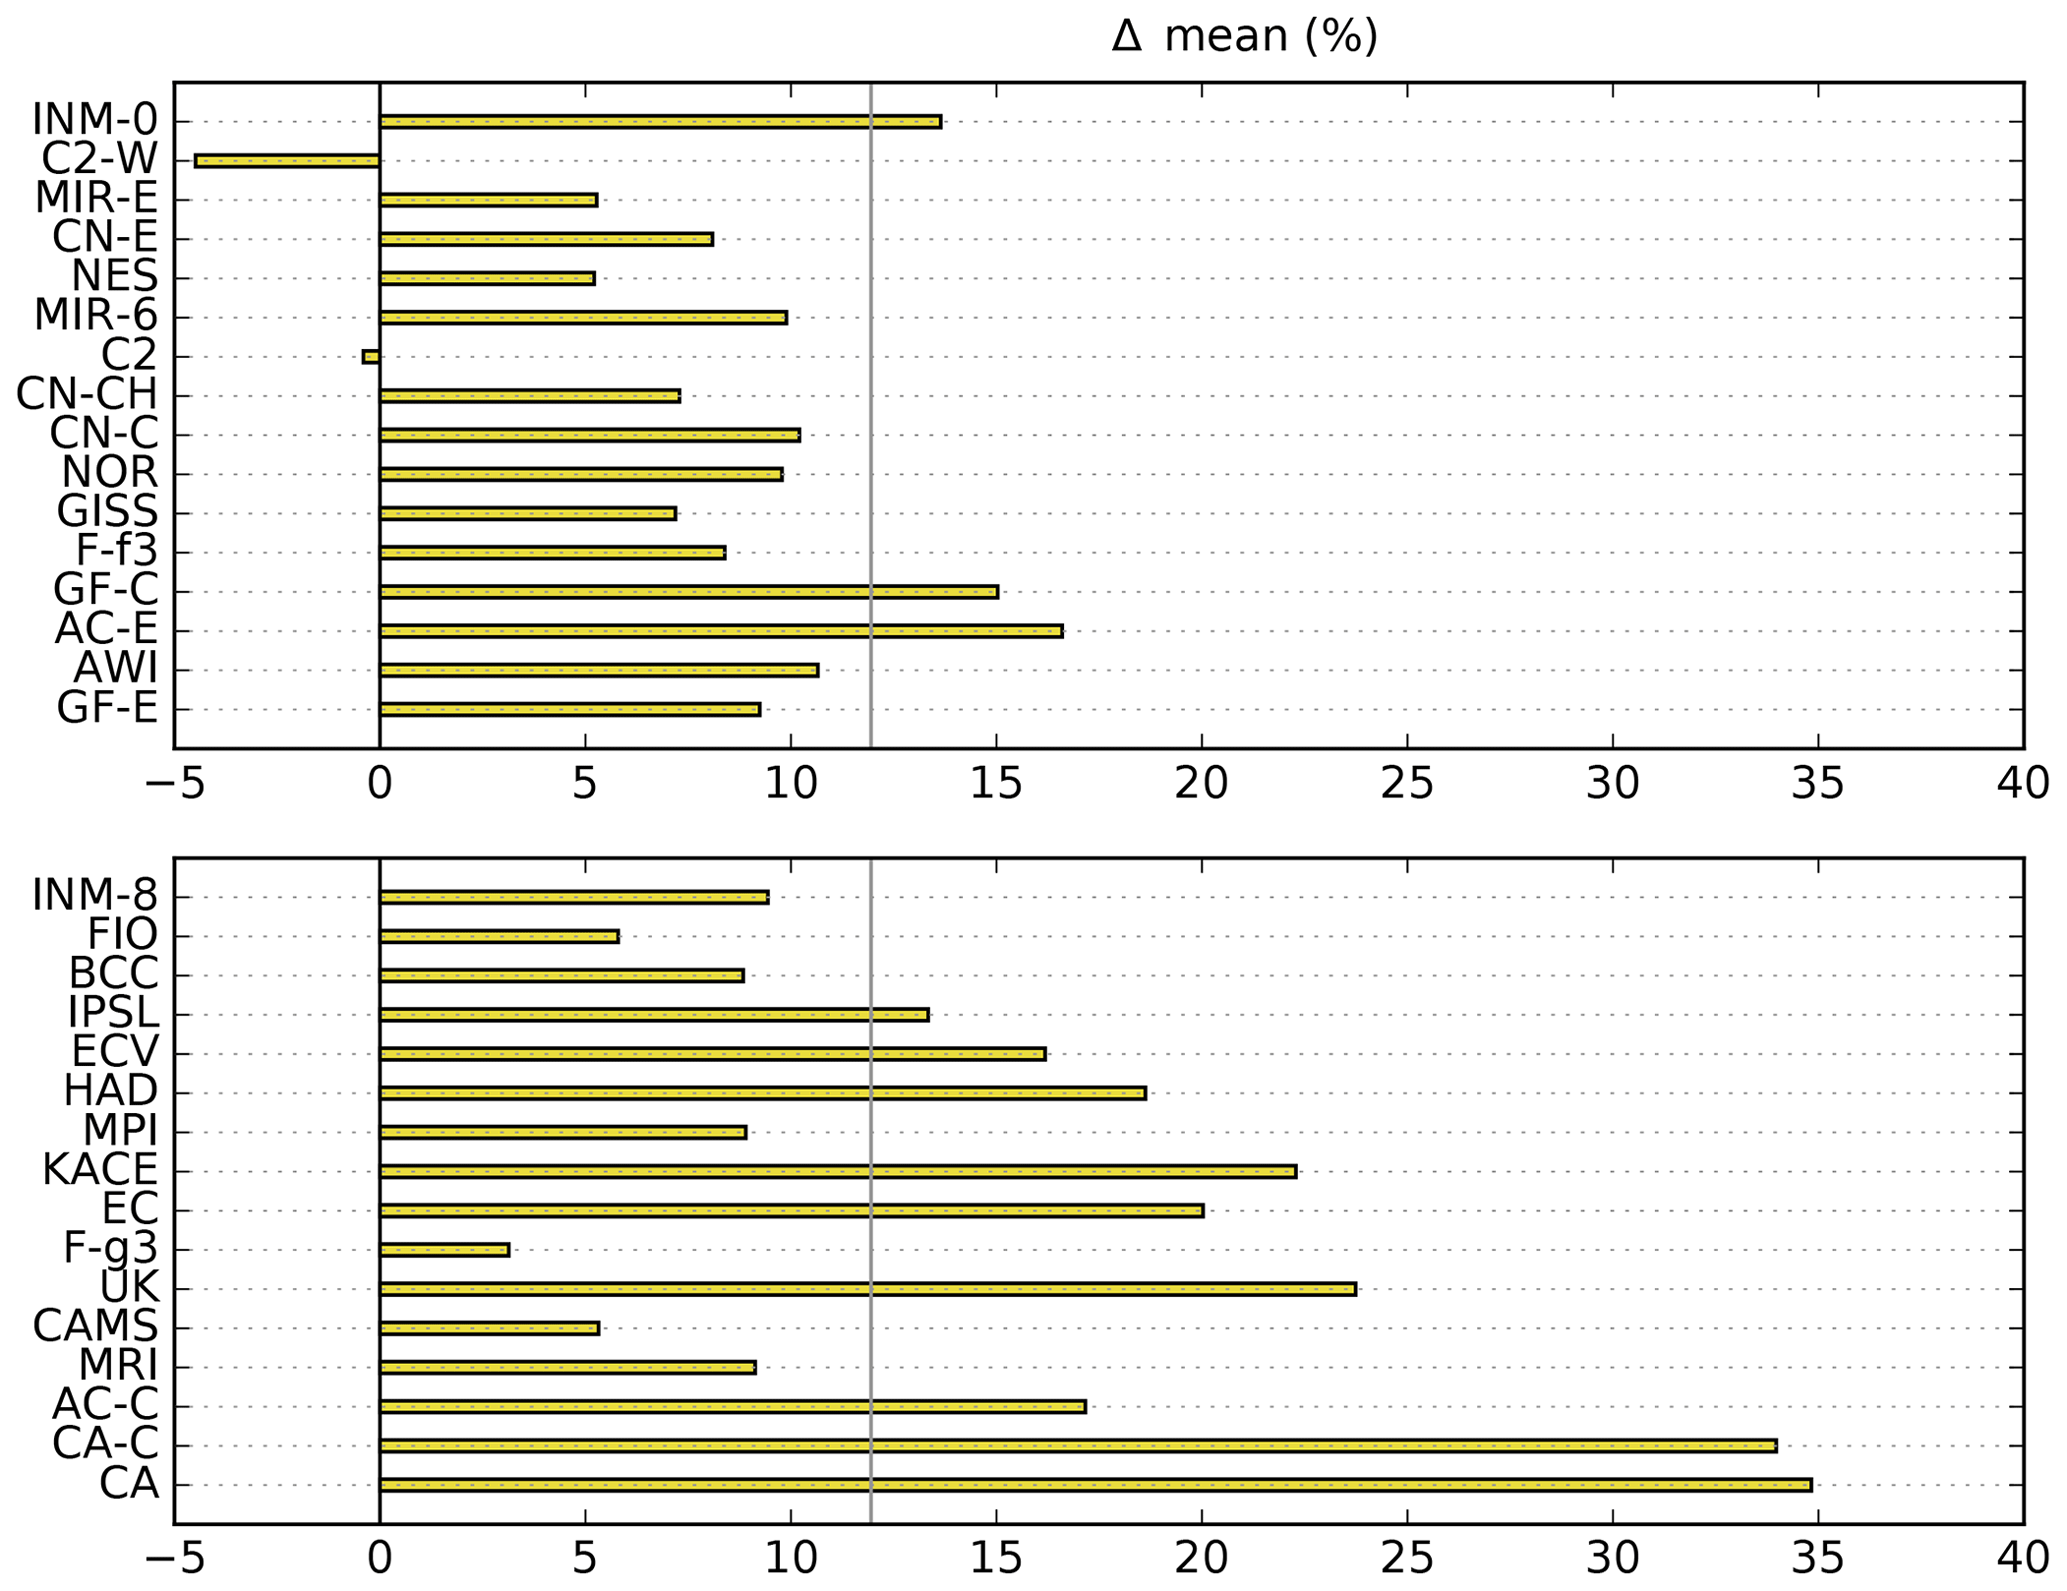
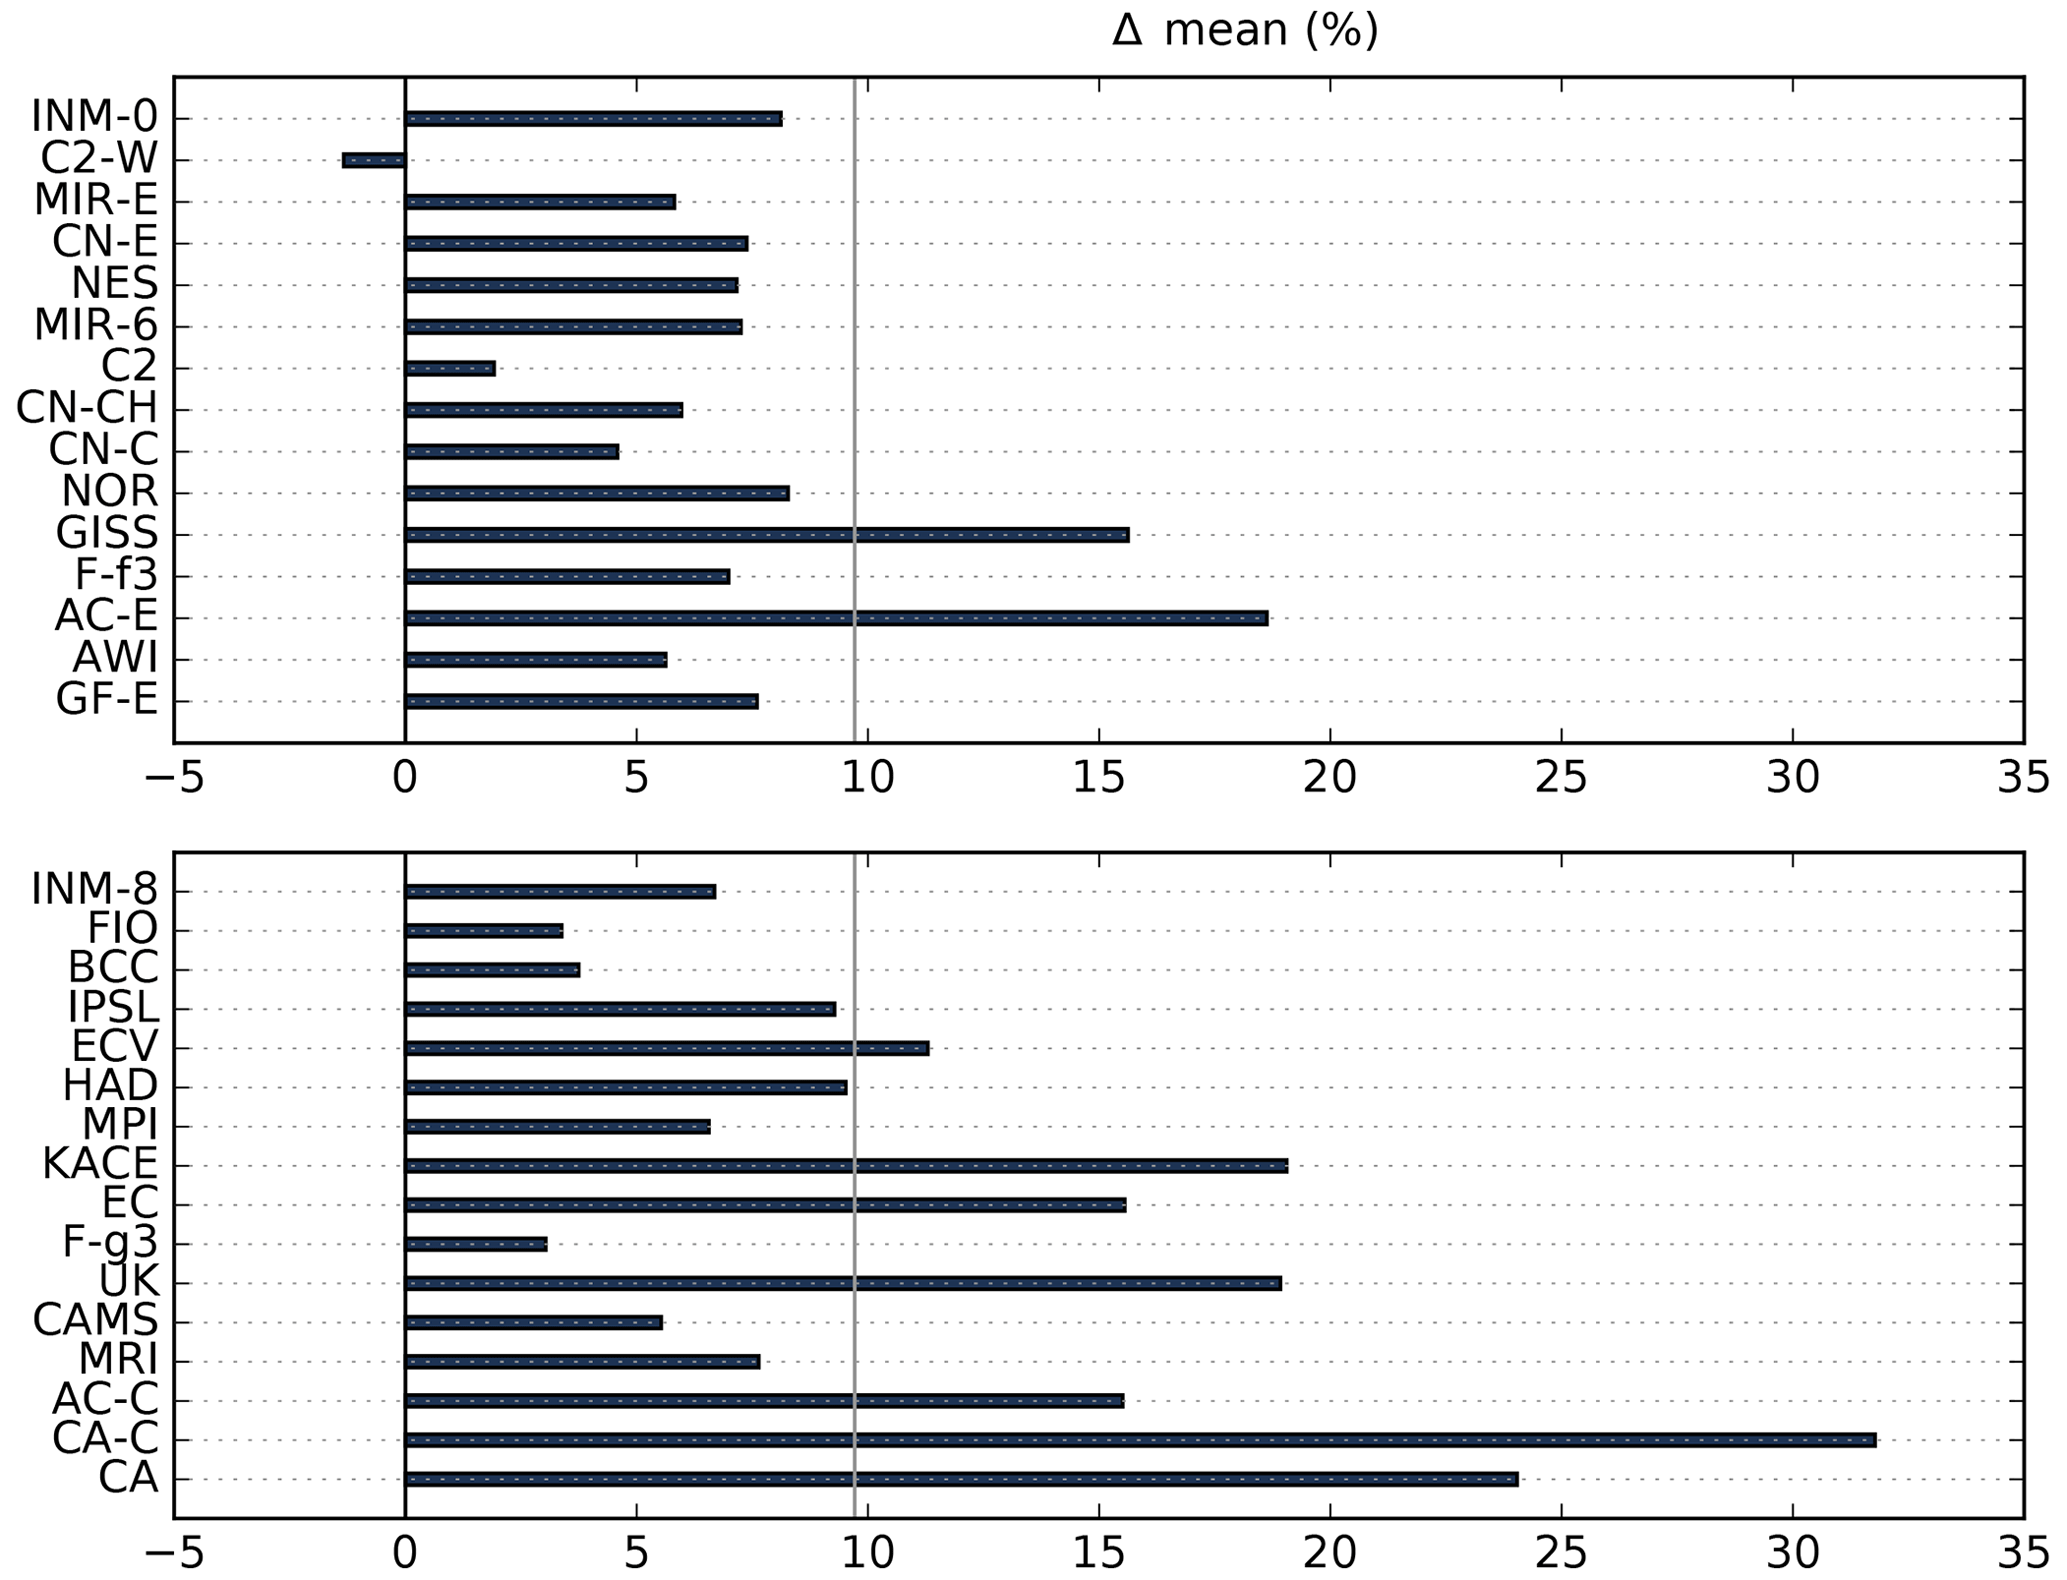
To analyze the change in mean seasonal rainfall until the end of the 21st century, we calculate the difference between the periods 2070–2100 and 1985–2015 for the four SSPs. In the stronger forced scenarios (SSP3-7.0 and SSP5-8.5), all models project an increase of precipitation. In the scenarios with less forcing (SSP1-2.6 and SSP2-4.5), the clear majority of models project an increasing trend, too. The only models to project a decrease are the models of the National Center for Atmospheric Research (CESM2-WACCM in SSP1-2.5 and SSP2-4.5 and CESM2 in SSP2-4.5). On average, over all models, an increase of 24.3 % is projected under SSP5-8.5 (Fig. 6) and of +18.6 % in SSP3-7.0 (Appendix Fig. A1), +11.9 % in SSP2-4.5 (Fig. B1) and +9.7 % in SSP1-2.6 (Fig. C1). CanESM5 and CanESM5-CanOE show the maximum relative increase in all scenarios by the end of the 21st century. But as shown in Figs. 1 and 3, they clearly underestimate the rainfall and do not capture a realistic pattern of the rainfall distribution. CESM2-WACCM shows the minimal increase of 7.8 % under SSP5-8.5. This model was able to capture the mean rainfall in 1985–2015 within twice the standard deviation and is able to capture a reasonable pattern of the rainfall. Focusing on the models that captured the mean rainfall in 1985–2015 within twice the standard deviation (upper panel in Fig. 6), the relative increase is 17.4 % under SSP5-8.5, i.e., slightly less than the average over all models. Also in the other scenarios, the trend is less for these models compared to the average over all models. In summary, a robust increase of seasonal rainfall between 1985–2015 and 2070–2100 can be derived under global warming.
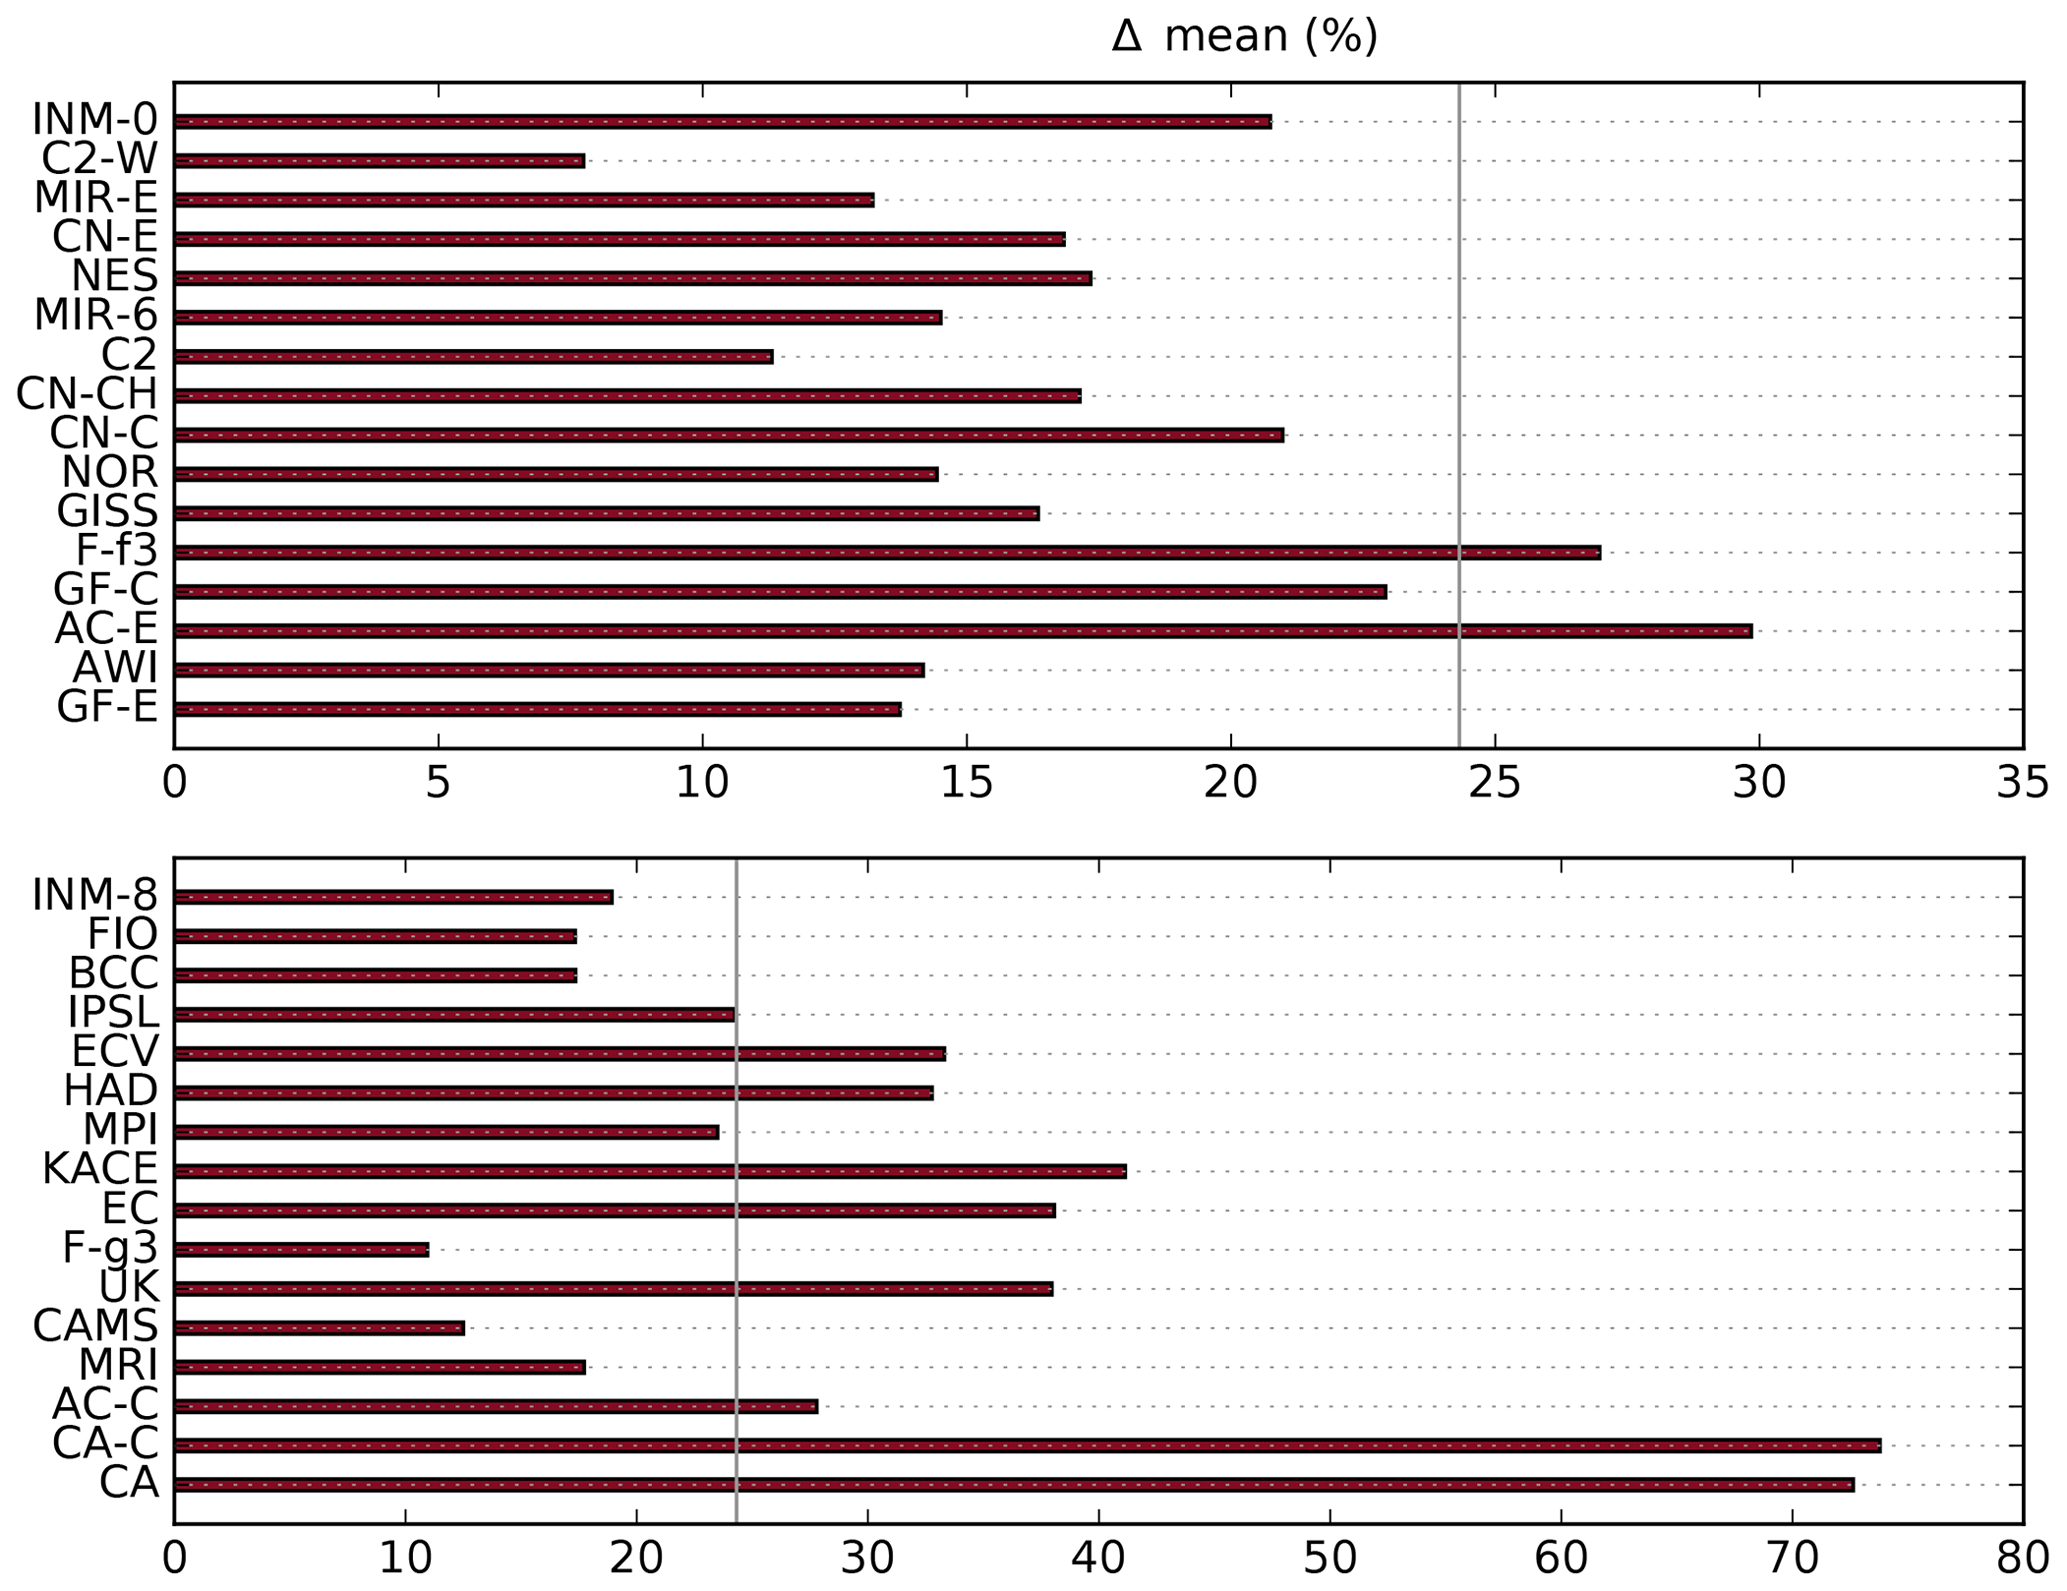
Figure 6Percentage change in Indian summer monsoon mean rainfall for SSP5-8.5 for all 32 models over the area displayed in Fig. 3. Relative change is calculated as the change in mean rainfall for the period 2070–2100 with respect to the period 1985–2015. The gap separates models with rainfall values for 1985–2015 within twice the standard deviation of the reanalysis mean as in Fig. 1 from those outside that range. Please notice the different scales in the two panels. The mean over all models is +24.3 % (vertical gray line).
Most models project that this increase will contribute to the precipitation especially in the Himalaya region and to the northeast of the Bay of Bengal, as well as the Western Ghats (Fig. 7). Individual models indicate decreasing rainfall along the southwest coast of India and around Myanmar.
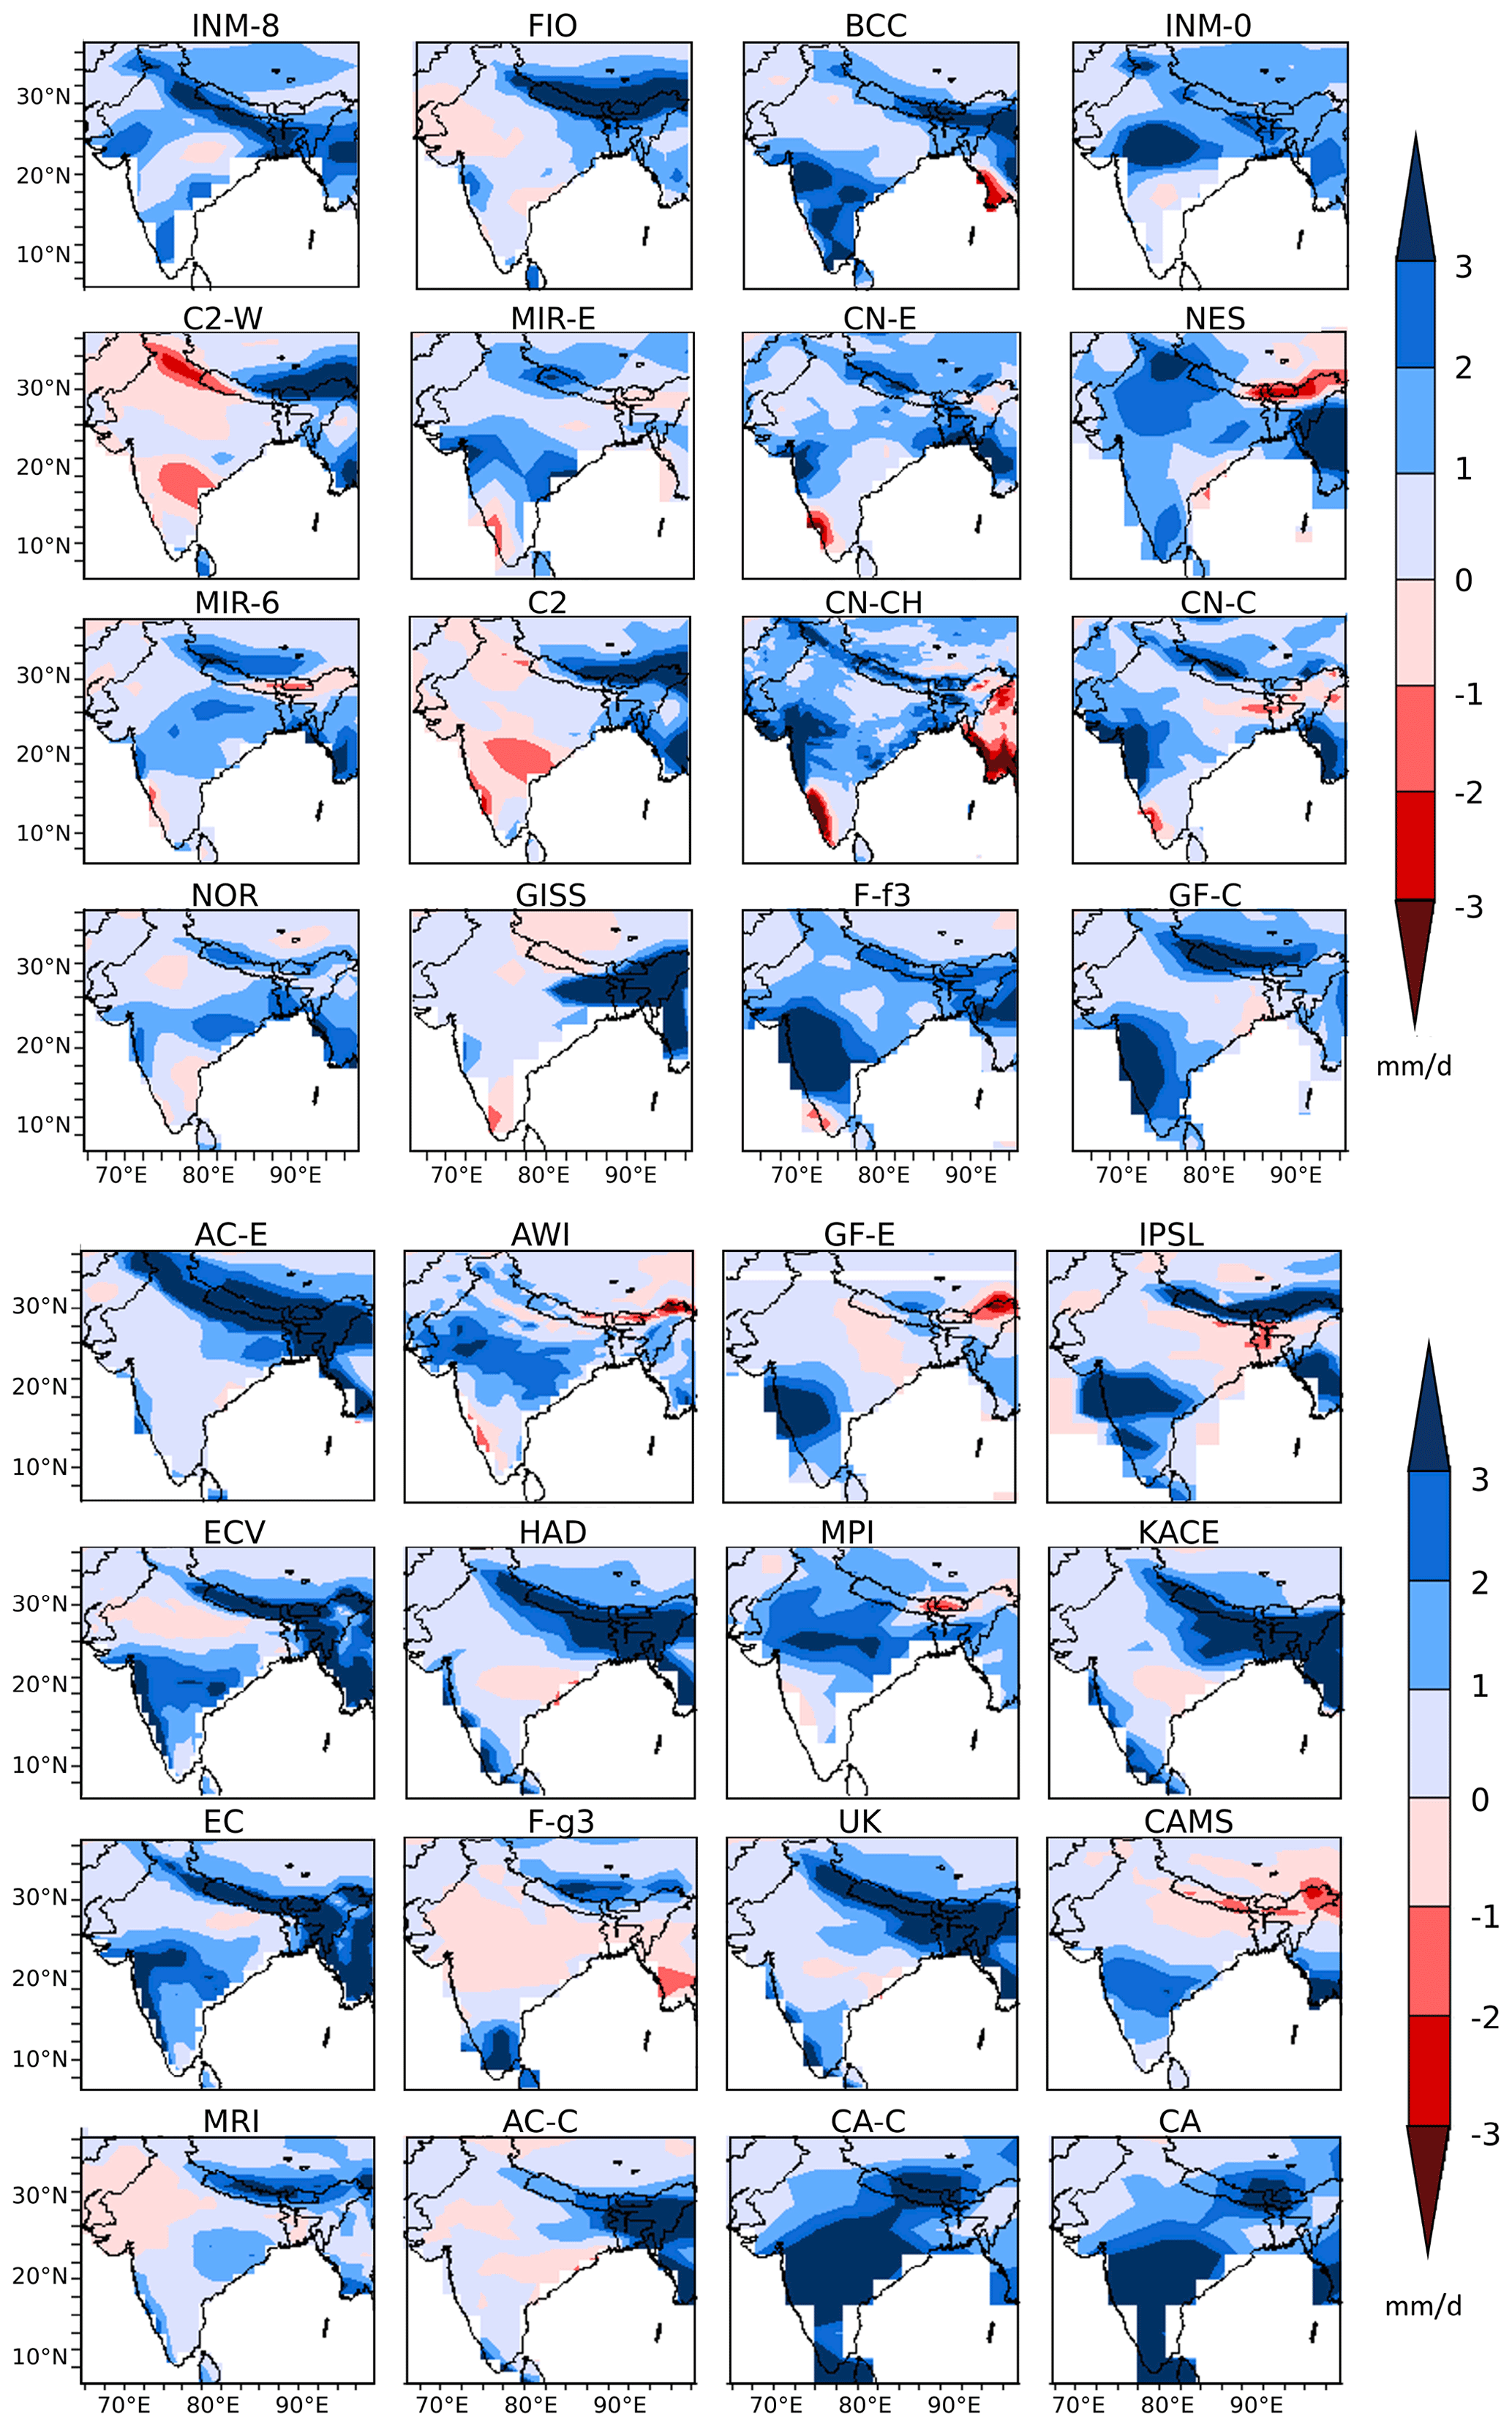
Figure 7Difference in Indian summer monsoon mean rainfall (mm d−1) for the period 2070–2100 under SSP5-8.5 in comparison to 1985–2015.
Furthermore, we analyzed the dependence of rainfall on global mean temperature (GMT; Fig. 8). The simulation ensemble indicates a linear dependence of rainfall on GMT, with a high agreement between models and independent of the scenarios if global warming is the dominant forcing of the monsoon dynamics as it is in the 21st century. The multi-model mean indicates an increase of 0.33 mm d−1 ranging from 0.11 to 0.54 mm d−1. The relative dependence is 5.3 % per kelvin of global warming ranging from 1.7 % K−1 to 13.4 % K−1 for SSP5-8.5 across models. Considering only the more realistic models, the projected mean change is 6.1 % K−1 for SSP5-8.5.
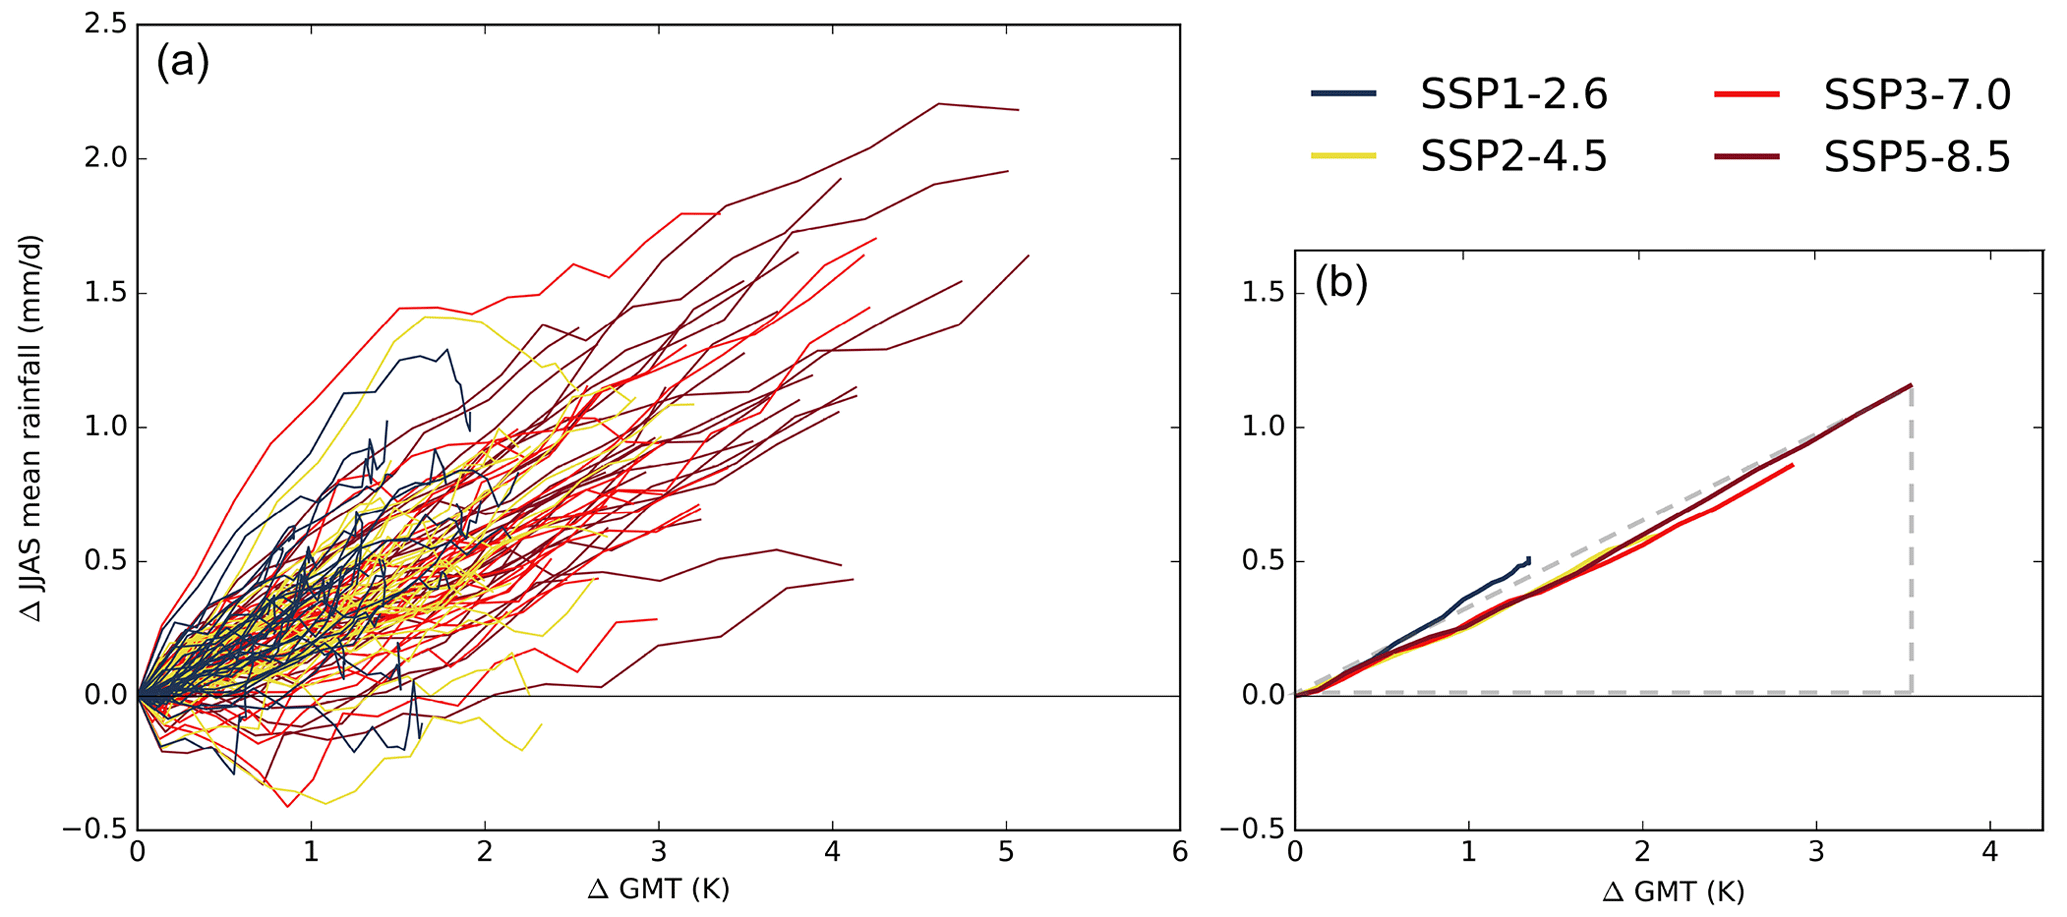
Figure 8Change of Indian summer monsoon mean rainfall (mm d−1) depending on change in global mean temperature (K) until the end of the 21st century relative to the period 1985–2015 for four scenarios. Underlying regions are as in Fig. 3. Means are calculated over decadal periods starting in 2005 and overlapping by five years (2005–2014, 2010–2019, up to 2090–2099). (a) Each line represents a different model (one ensemble member per model). (b) Each line represents a multi-model mean for one scenario. Model availability for global temperature in different scenarios can be seen in Table 1. Dashed gray lines indicate the slope (the hydrological sensitivity) for SSP5-8.5.
3.3 Long-term trend of interannual variability
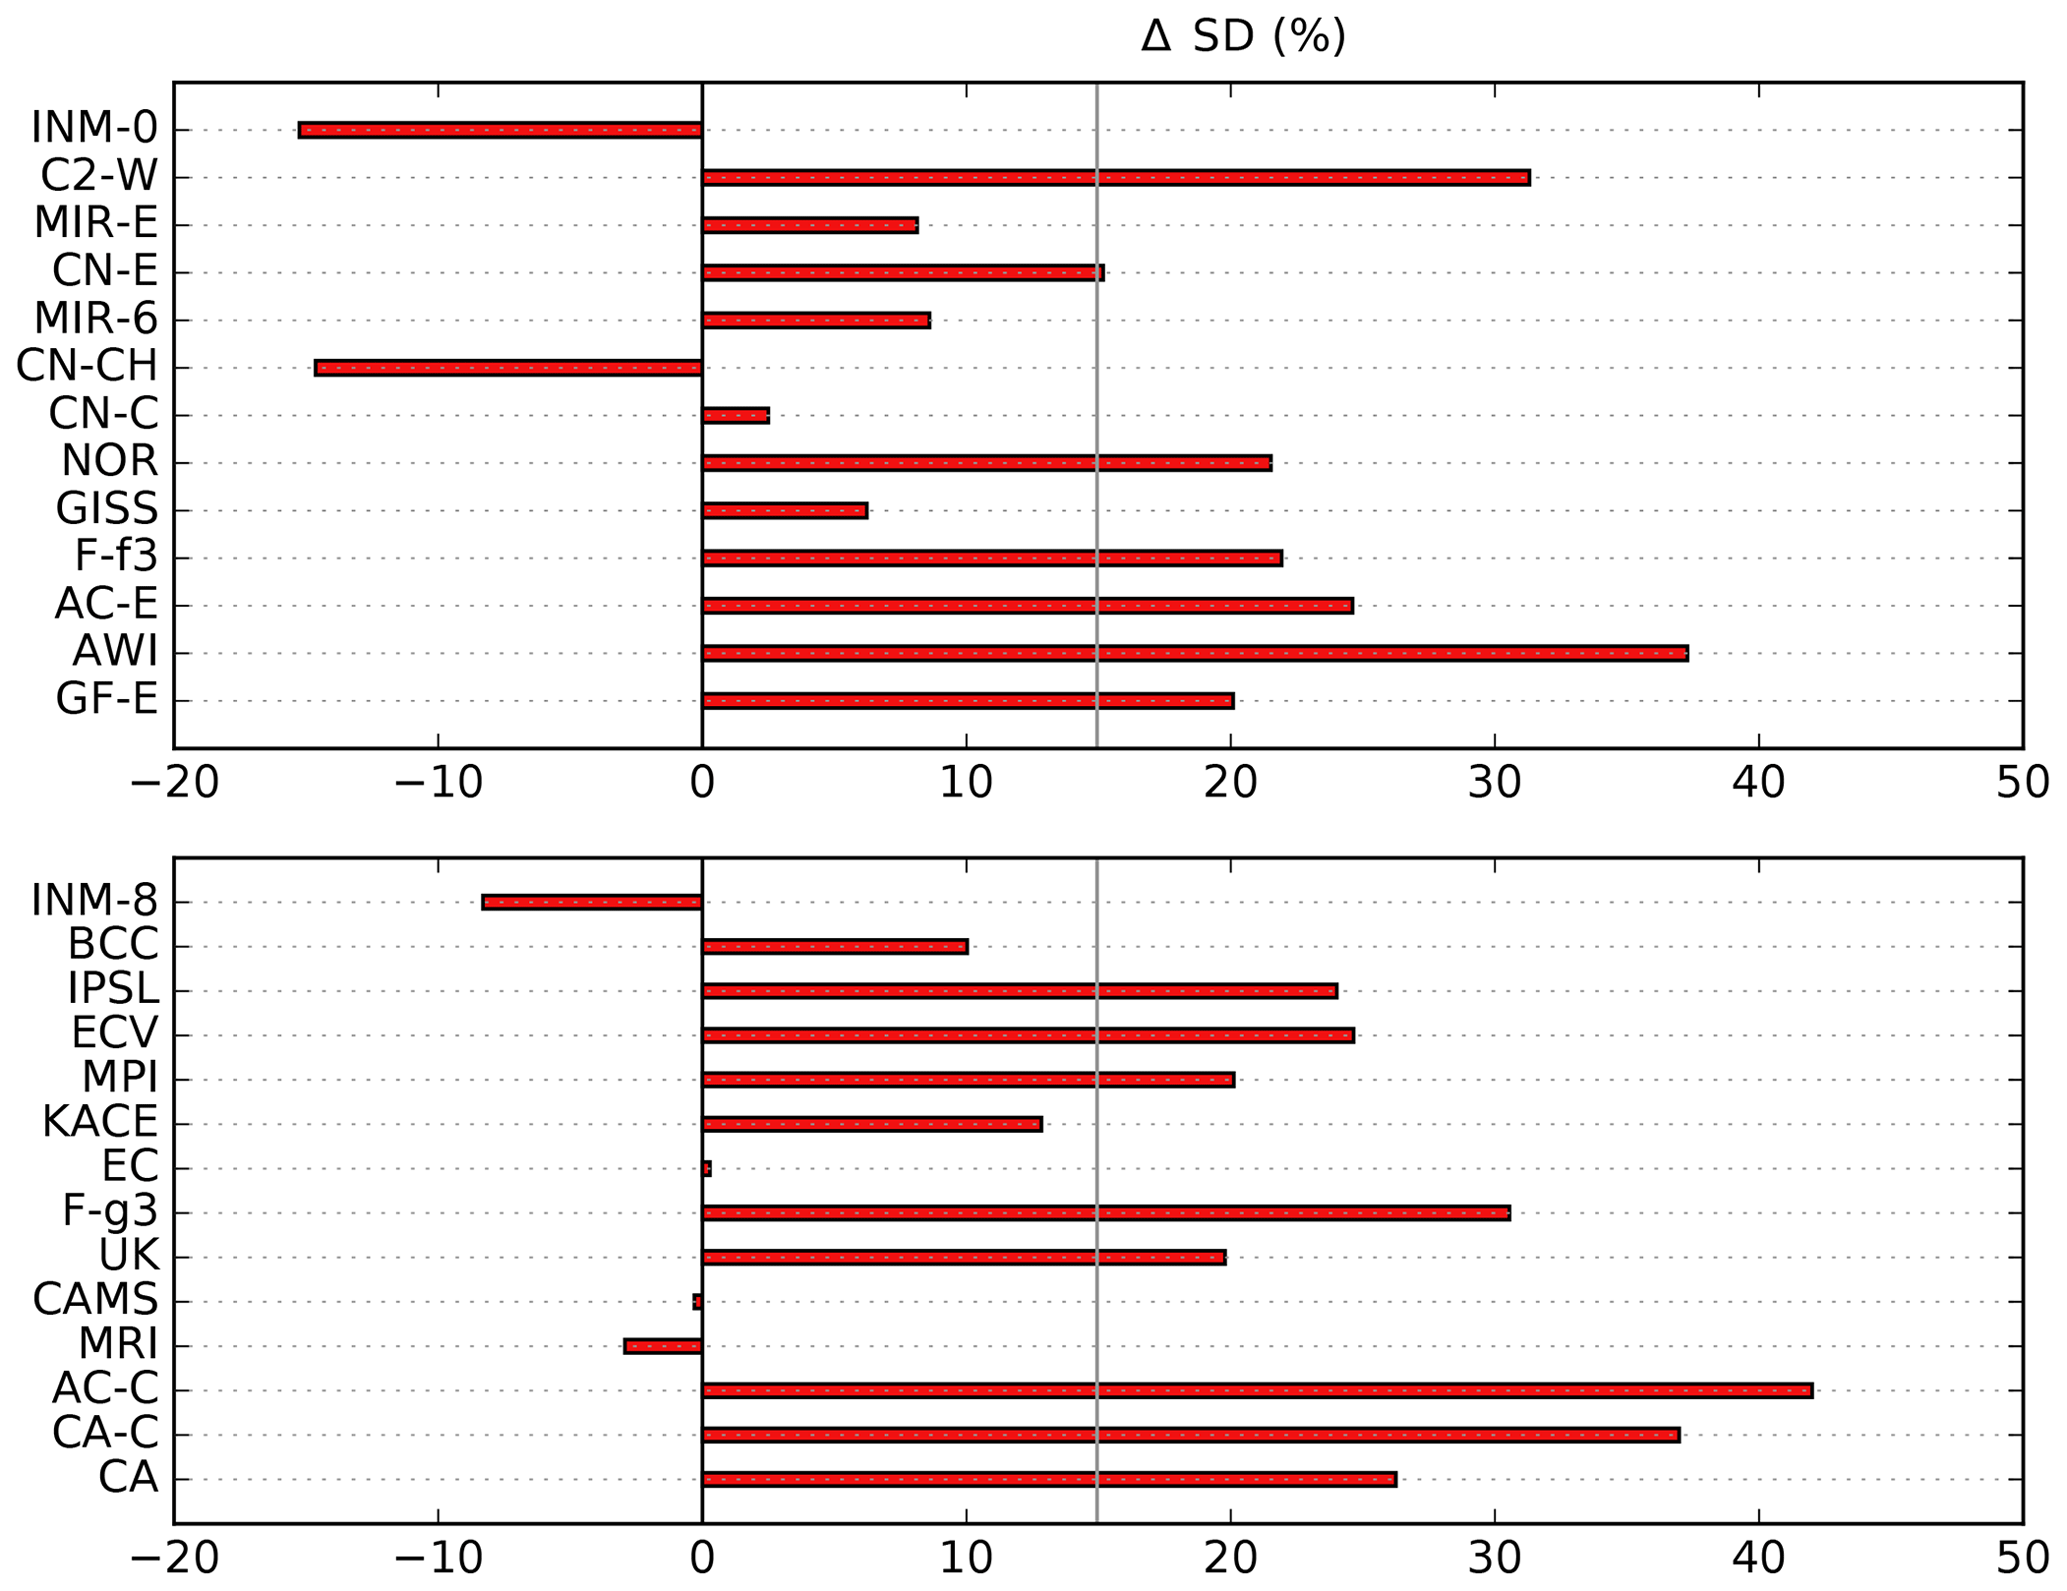
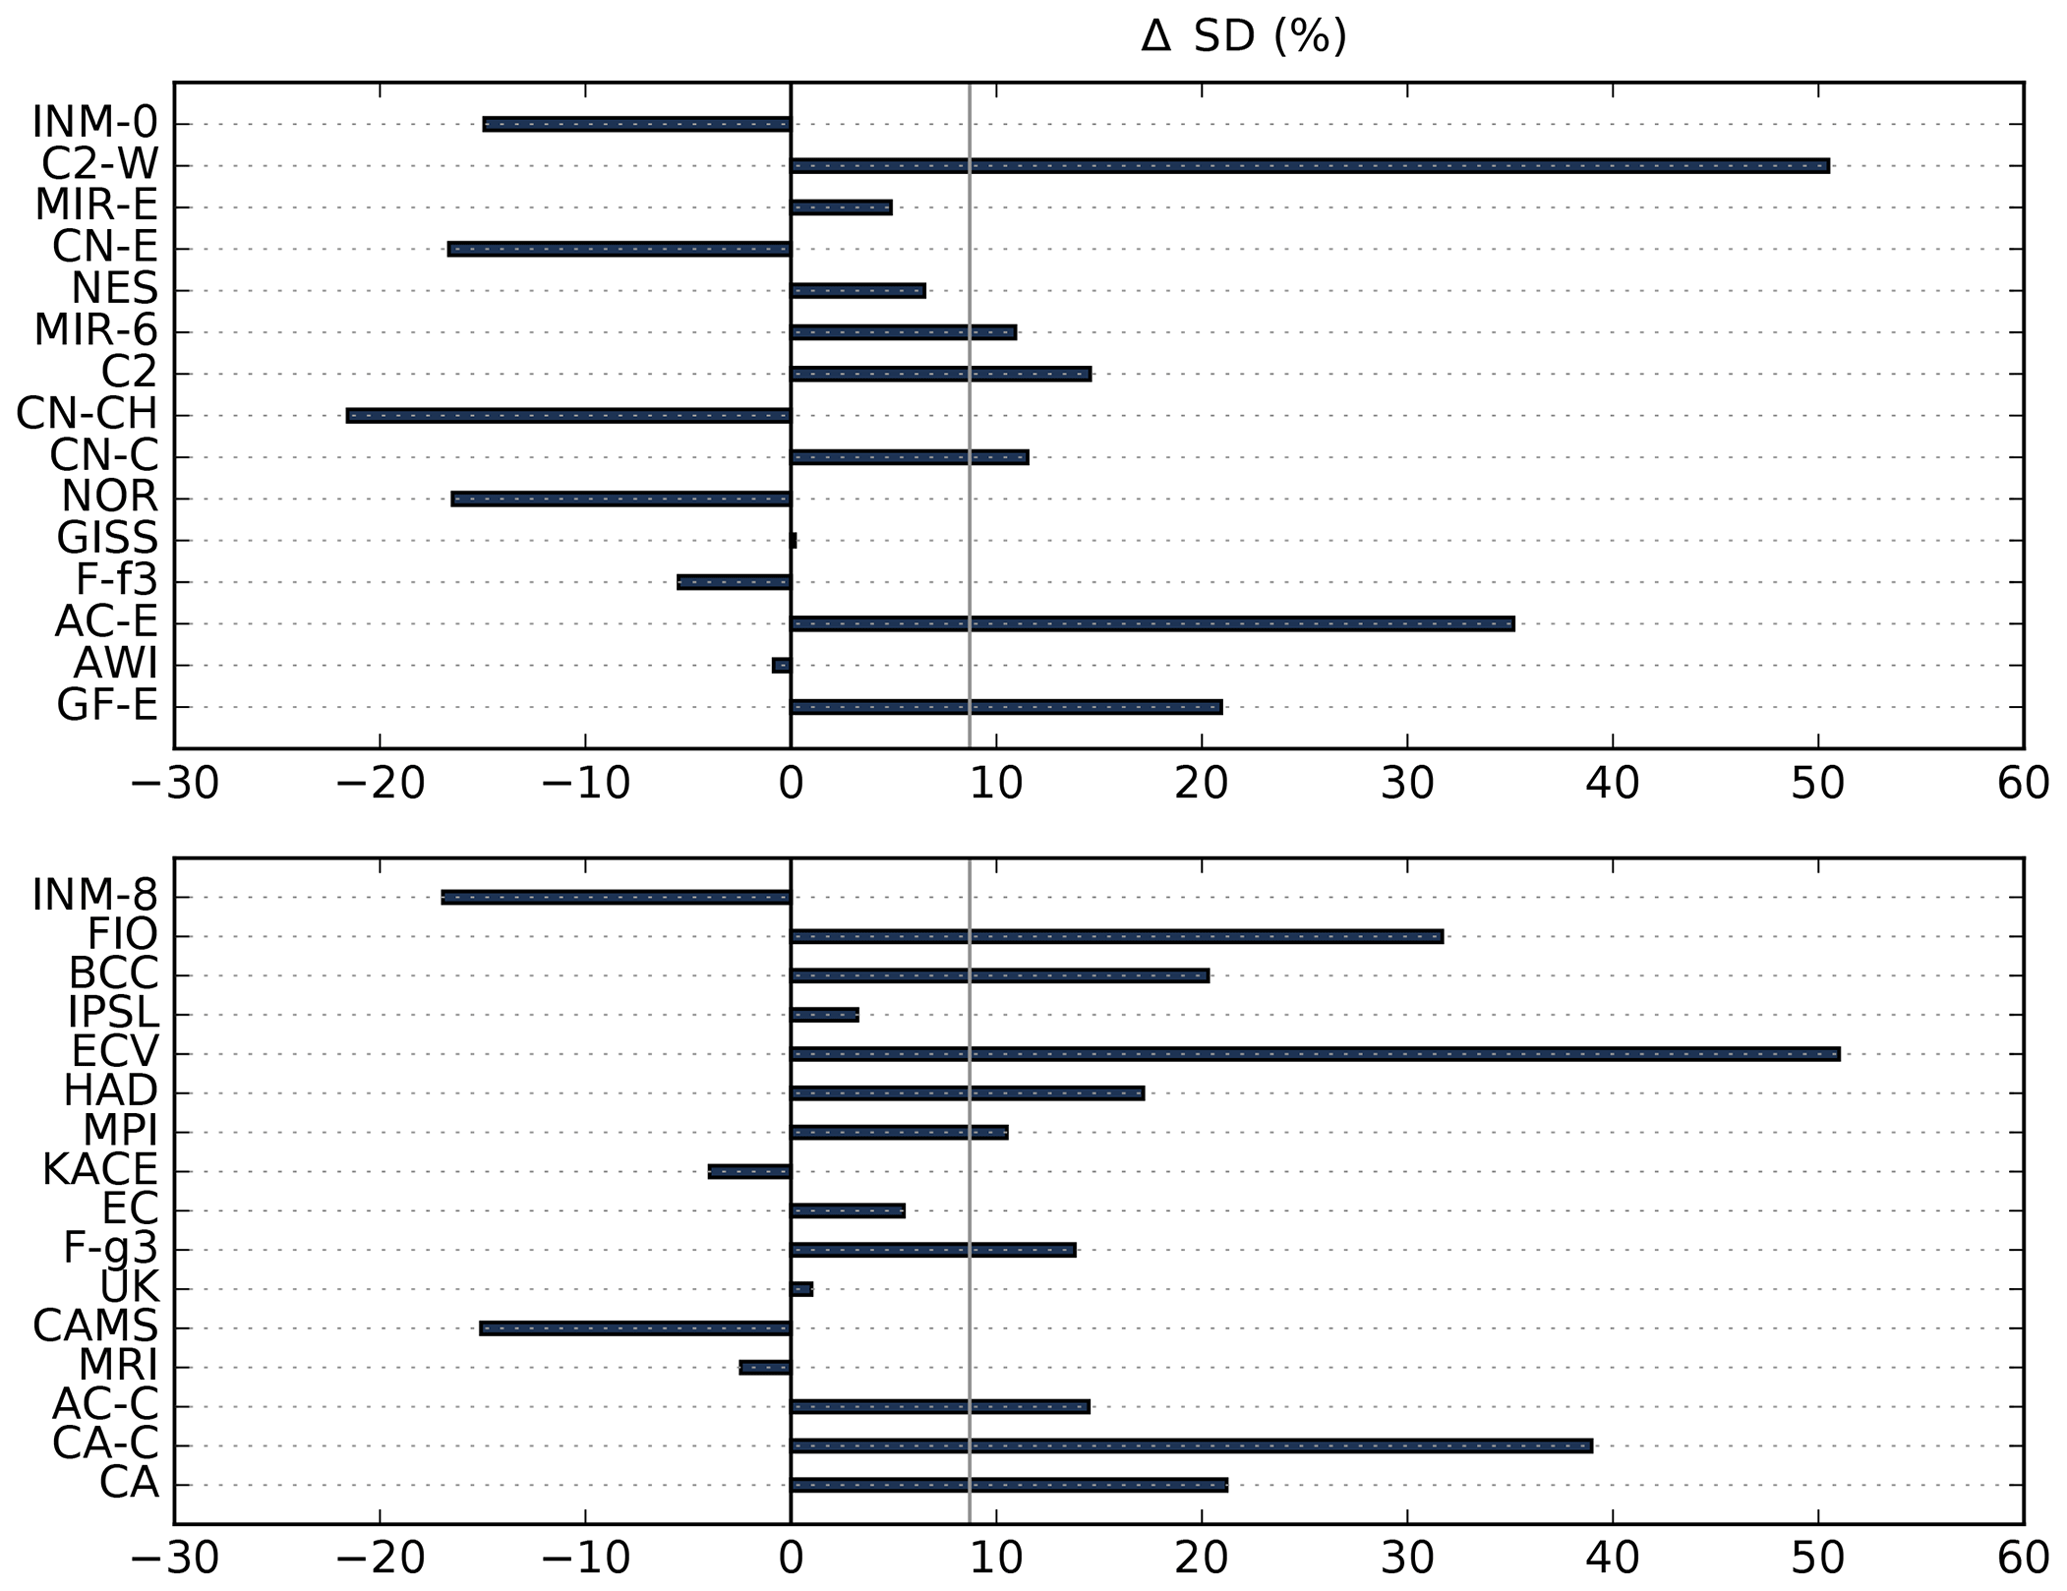
In order to analyze the future evolution of interannual variability, we removed the nonlinear trend obtained by a singular spectrum analysis from the rainfall data as displayed in Fig. 4 and use the percentage changes in standard deviation for the period 2050–2100 with respect to 1900–1950. Under SSP5-8.5, 28 of 32 models indicate an increase of interannual variability (Fig. 9); the multi-model mean in this scenario indicates an increase of 21.3 %. The strongest increase of 56.2 % is simulated by EC-Earth3-Veg, which is a model that does not capture the quantitative rainfall of the Indian summer monsoon well. Four models simulate a decrease in SSP5-8.5: both models from INM (INM-CM4-8, INM-CM5-0) and two models from CNRM-CERFACS (CNRM-CM6-1-HR, CNRM-ESM2-1) project a decrease in interannual variability. Even if two of the four models projecting a decrease under SSP5-8.5 show a relatively small decrease of less than 5 %, it has to be noted that all of these four except INM-CM4-8 captured the rainfall in 1985–2015 within twice the standard deviation, making them more reliable in projecting the Indian summer monsoon than some other models. Nevertheless, among the 16 models within twice the standard deviation, 13 project an increase in interannual variability. In SSP3-7.0, 22 out of the available 27 models project an increase of interannual variability (see Fig. D1). The signal in the scenarios with less forcing is less clear (see Figs. E1 and F1), but even in SSP1-2.6 still 21 out of 31 available models project an increase in interannual variability until the second half of the 21st century. For the purpose of comparison, we also calculated the change without removing the trend and found that for SSP5-8.5 all models project an increase in interannual variability (on average 39.9 %). Figure 10 shows the dependence of interannual variability on global mean temperature for all available models (after removing the trend). As the global mean temperature change grows with stronger forcing, the positive trend in interannual variability becomes clearer.
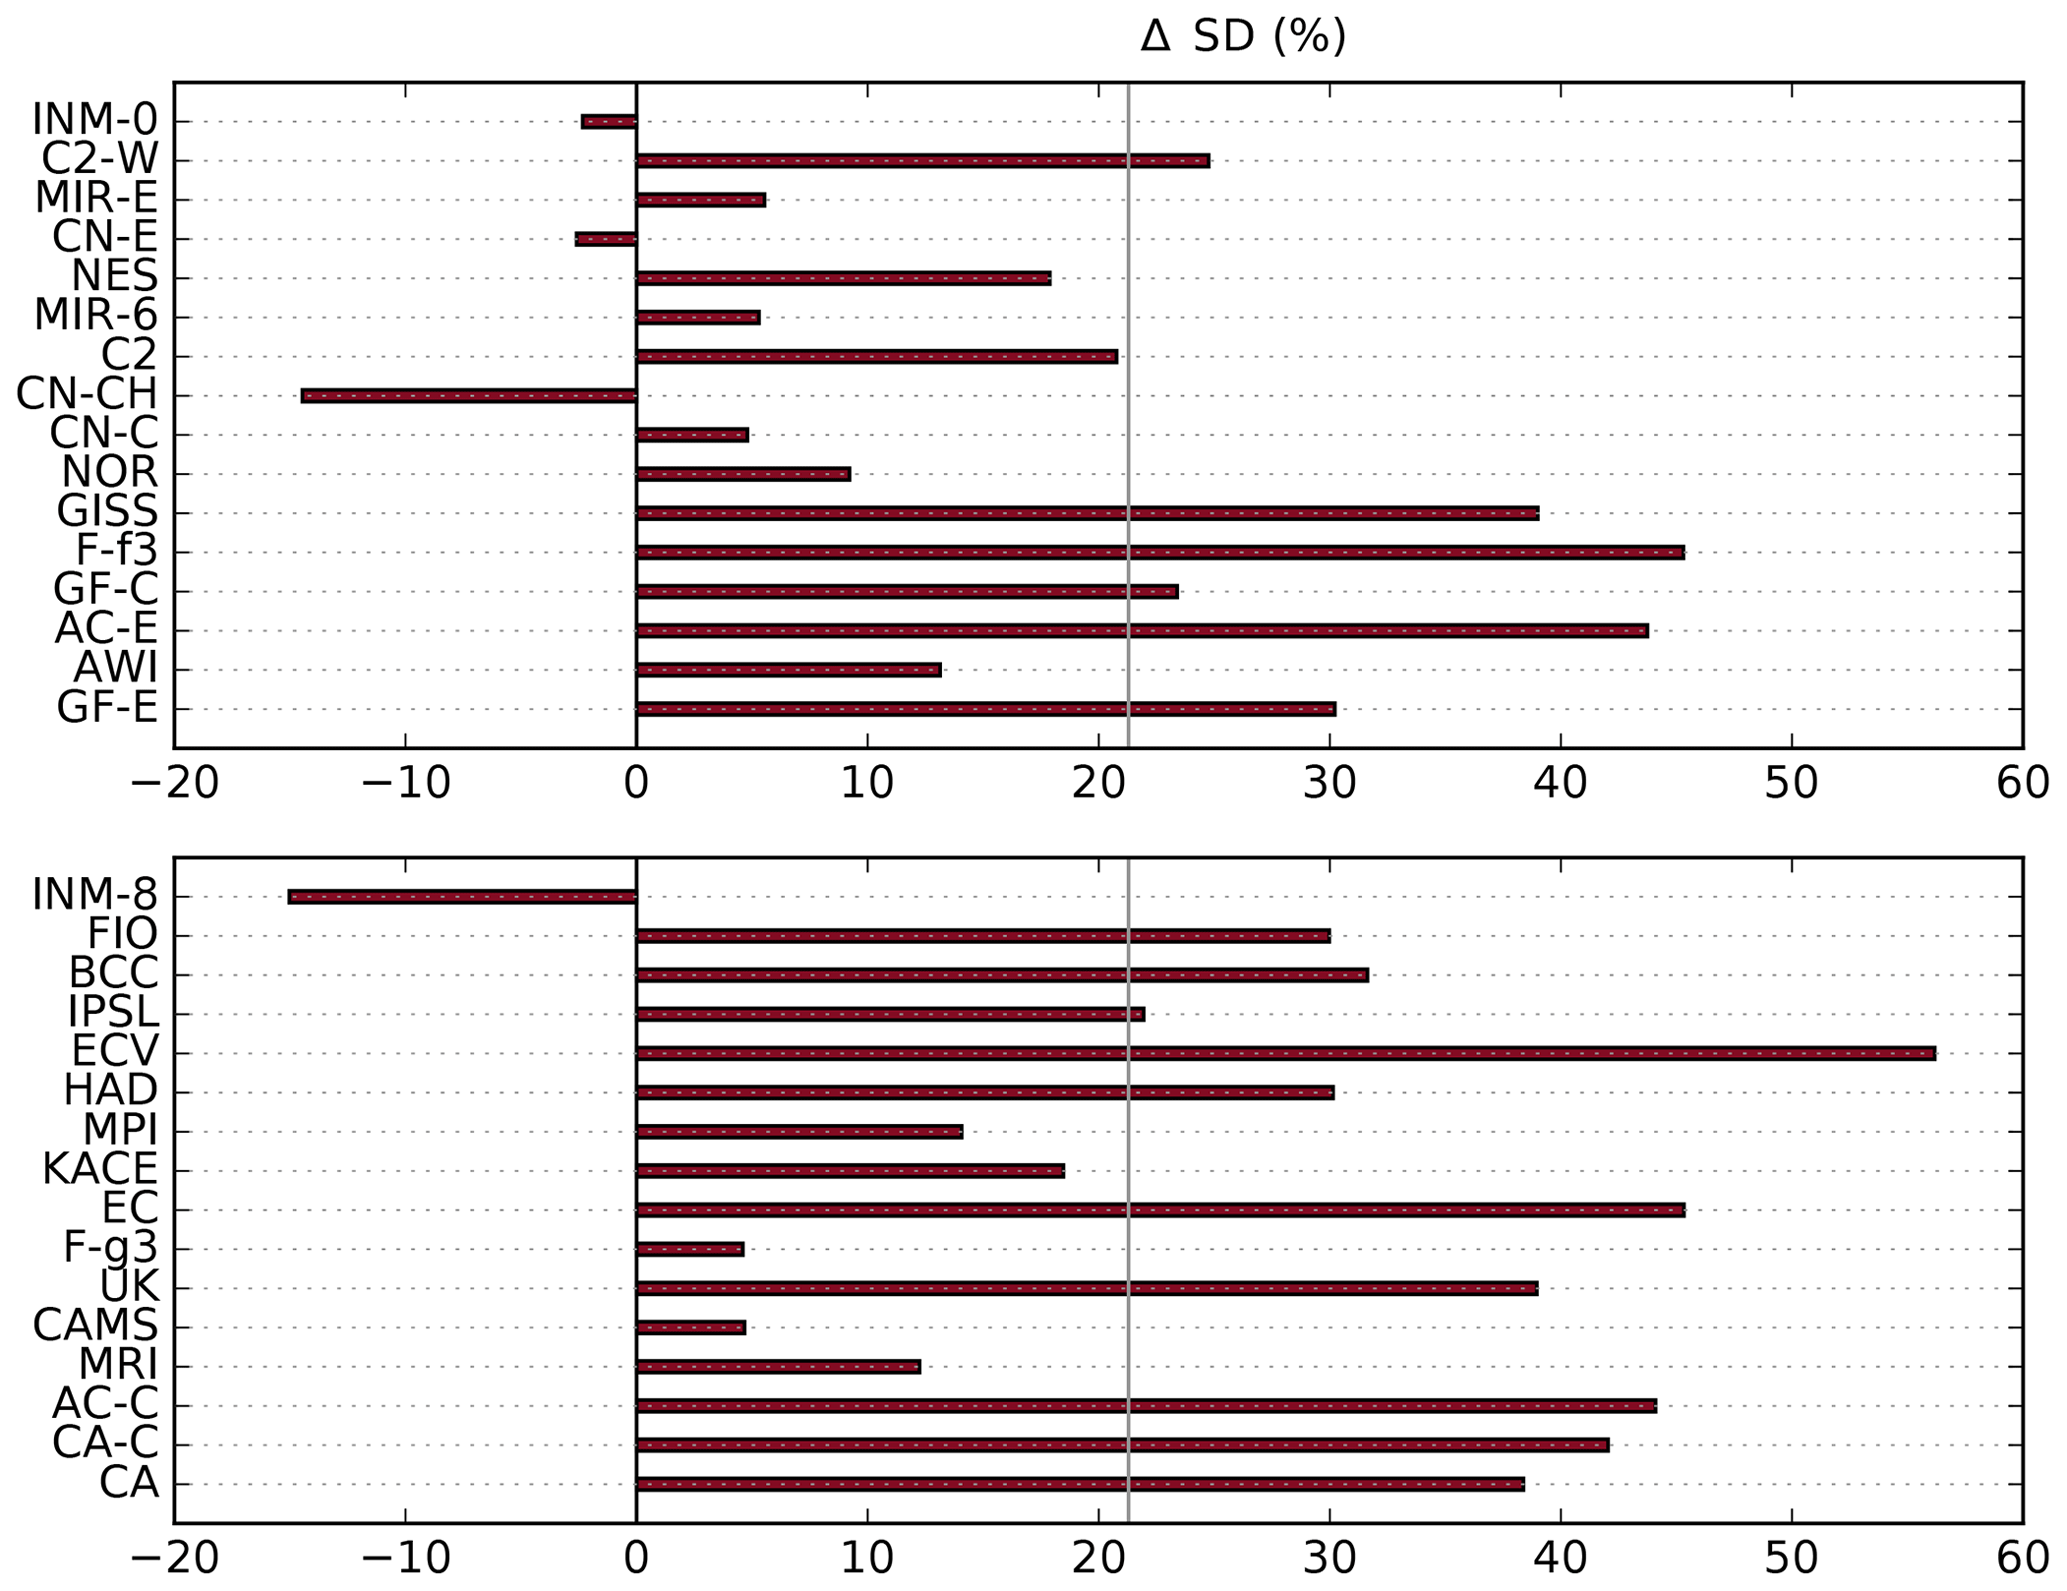
Figure 9The percentage change of standard deviation between the second half of the 21st century to the standard deviation from 1900–1950 under SSP5-8.5. For the underlying area, refer to Fig. 3. We used a singular spectrum analysis algorithm (Golyandina and Zhigljavsky, 2013) to remove the nonlinear trend according to Fig. 4. The mean percentage change in this scenario is 21.3 %. The gap separates models as in Fig. 1 according to their capacity of capturing the monsoon rainfall in 1985–2015.
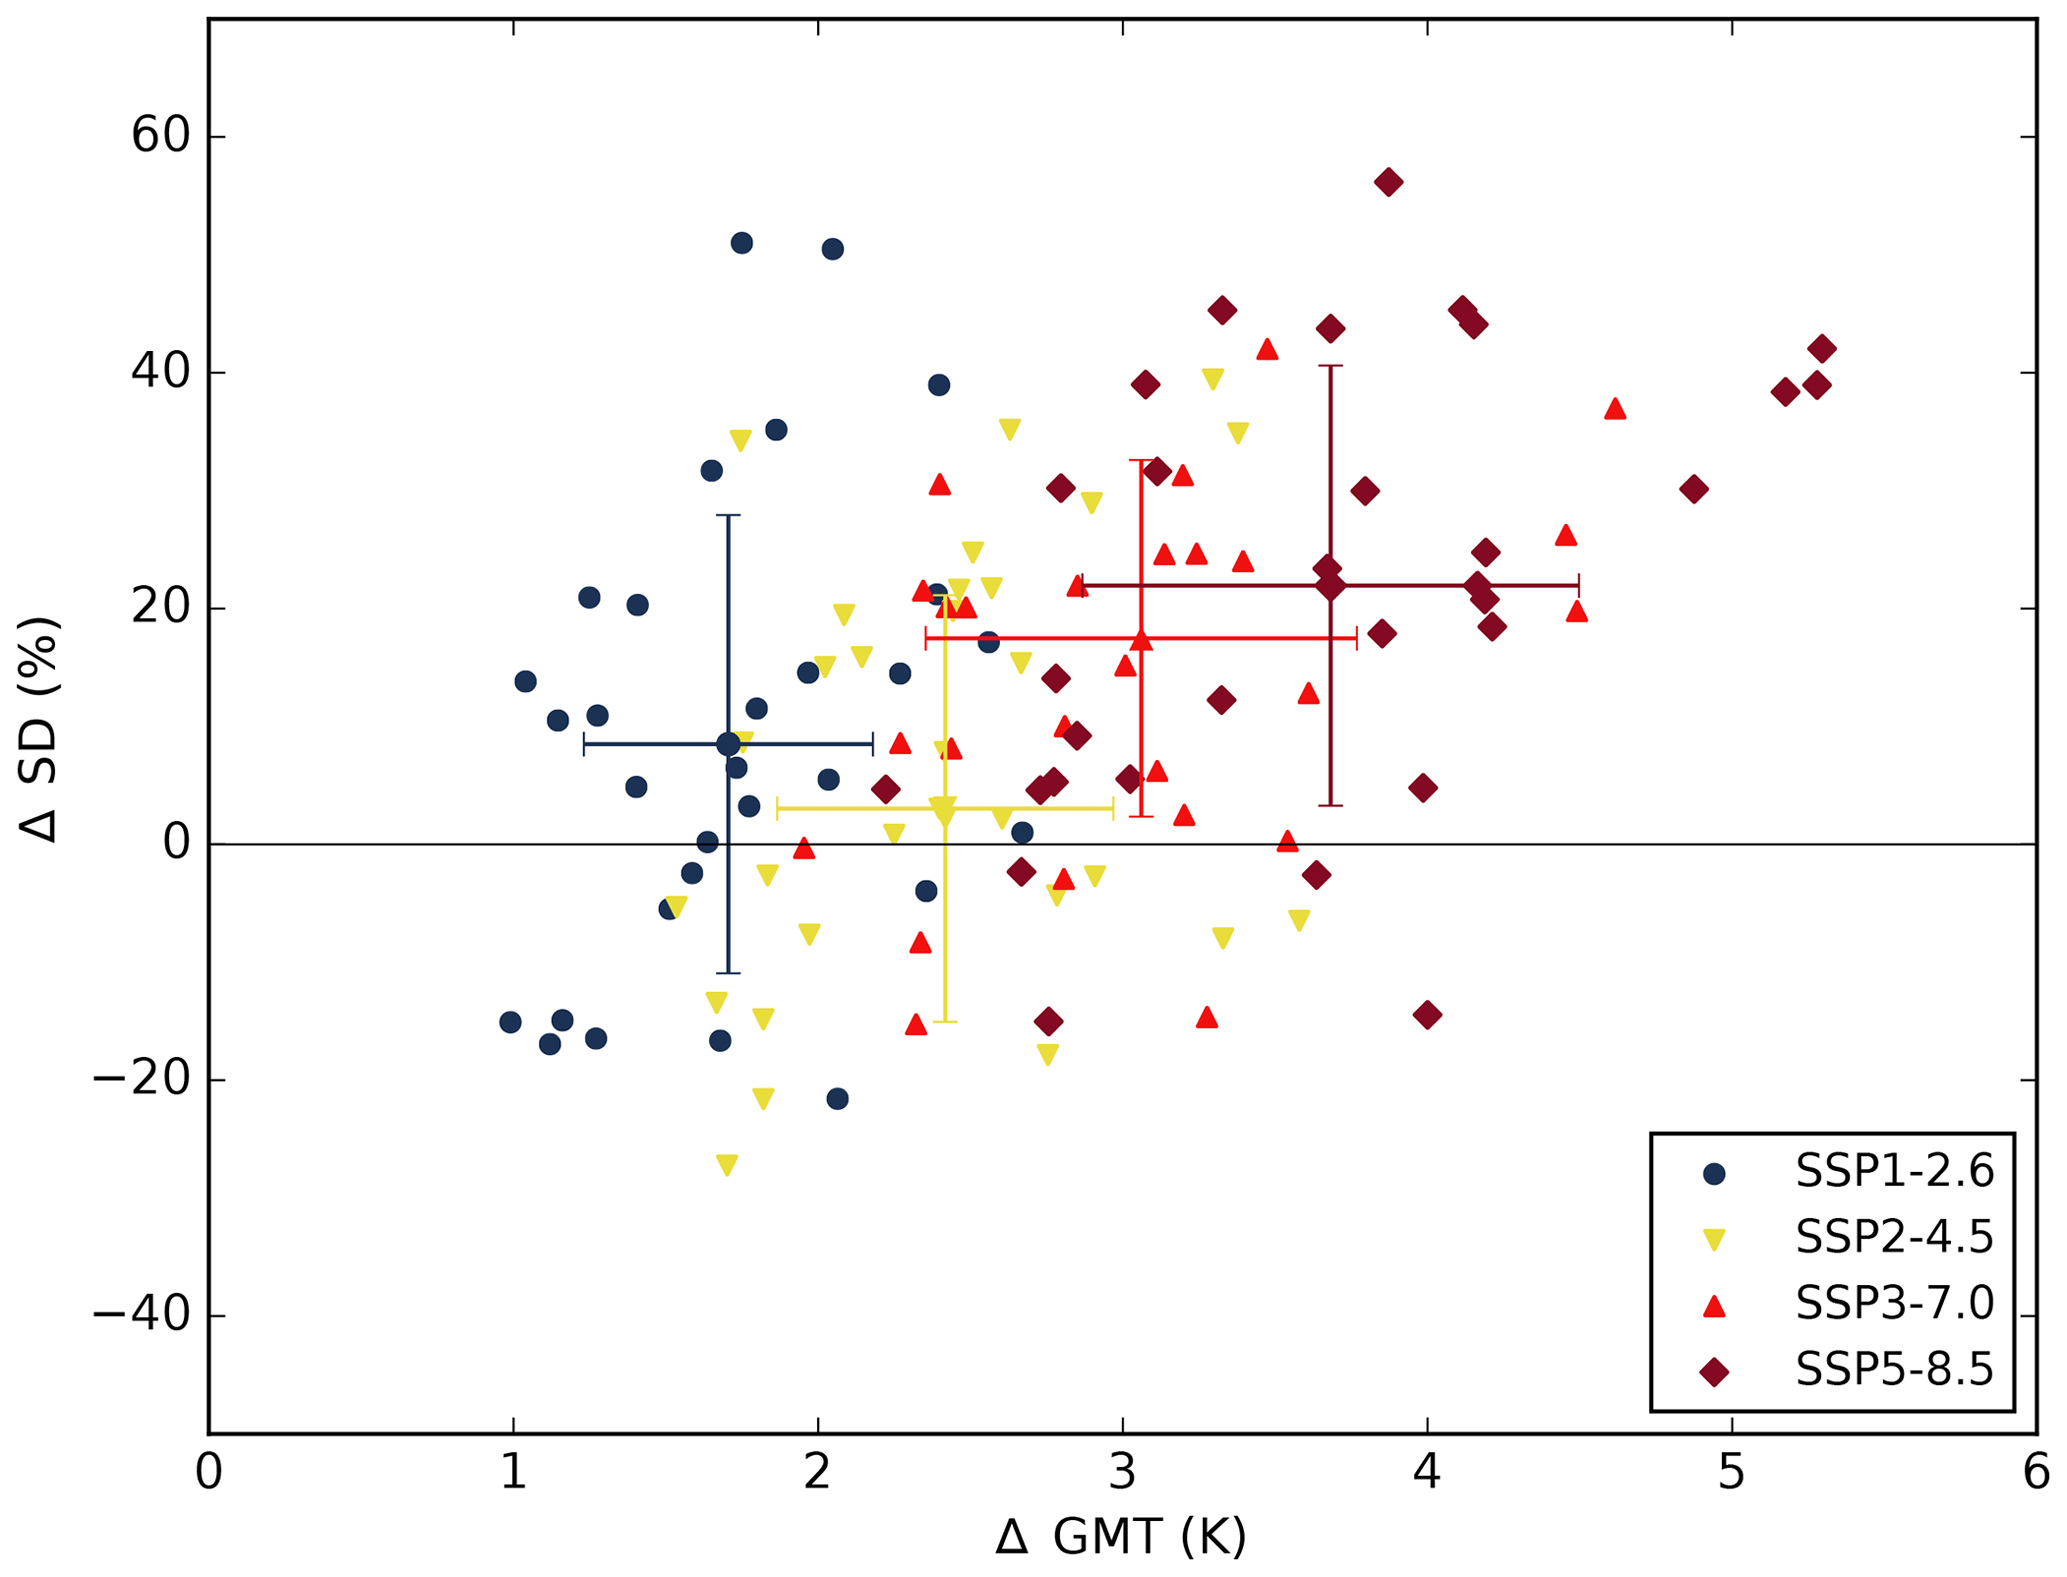
Figure 10Scatterplot of percent change in standard deviation (%) and change in global mean temperature (K) between 2050–2100 and 1950–2000 for four scenarios. The symbols with error range represent the median plus/minus the standard deviation in each scenario. The underlying area can be seen in Fig. 3. The trend was removed before using a singular spectrum analysis algorithm (Golyandina and Zhigljavsky, 2013). Availability of models for different scenarios can be seen in Table 1.
In this study, the long-term trend of the Indian summer monsoon and its variability have been analyzed based on the latest global coupled model simulations under the SSP scenarios. Our approach addresses the question of whether the results from earlier studies can be confirmed or need to be adapted in their sign or magnitude.
By comparing the CMIP6 projection results with the WFDE5 reanalysis data, we classified some models as probably more capable of simulating a realistic representation of the monsoon rainfall. The share of models that capture the reference rainfall within twice the standard deviation has slightly increased in CMIP6 (16 out of 32) in comparison to the precursor models in CMIP5 (9 out of 20) (Menon et al., 2013). But it has to be noted that the validation period and the used reanalysis data differ between Menon et al. (2013) and this study. The observation of quantitatively measurable improvement between CMIP5 and CMIP6 coincides with the results of Gusain et al. (2020). While all the models that were out of the 2 standard deviation range underestimated the mean in CMIP5, thus revealing a very clear general tendency of underestimation, the 16 models outside of the range in CMIP6 partly underestimated (13 models) and party overestimated (3 models) the observed mean in 1985–2015. Modeling centers whose models underestimated the rainfall within 2 standard deviations in our study mostly underestimated the rainfall already in CMIP5. Some models with realistic patterns in CMIP6 are updates from CMIP5 that already revealed a pattern relatively similar to reanalysis data, e.g., NorESM2-MM. As in CMIP5, models with the tendency to underestimate the rainfall in the evaluation period are also mostly not capable of capturing the spatial rainfall pattern in CMIP6. But there are also various models that improved their capacity in capturing the Indian monsoon, such as the models from Centre National de Recherches Métérologiques (CNRM-CM6-1, CNRM-CM6-1-HR, CNRM-ESM2-1). This observed inconsistency among models in improving their spatial representation of the Indian monsoon was already noted by Gusain et al. (2020). Besides, the capacity of capturing the rainfall pattern over the Western Ghats has improved, which also coincides with the results of Gusain et al. (2020).
The CMIP6 models project a robust intensification of the Indian summer monsoon rainfall under climate change. All of the 32 available models exceed the envelope of baseline variability from 1850–2015 until 2100 under SSP5-8.5, while just 17 out of 20 exceeded the natural variability threshold under RCP8.5 in a previous study based on CMIP5 (Menon et al., 2013). Additionally, we calculated the average multi-model trend of projected change in mean rainfall by the end of the 21st century. As some modeling centers provide several models and some of them are based on overlapping model components, the models cannot be regarded as independent from each other (see, e.g., Knutti et al., 2017). The results have to be interpreted against this background. The average multi-model trend found in CMIP6 with an increase of +24.3 % by 2100 seems stronger in comparison to CMIP5 (Chaturvedi et al., 2012; Menon et al., 2013).
Chaturvedi et al. (2012) found an increase of 18.7 % in RCP8.5 by 2099 compared to the period 1961–1990 in CMIP5 models. But because of the used time periods as well as the different study area of India without adjacent regions, this study is not directly comparable to ours. An intensification of the Indian monsoon rainfall has also been found in other studies using CMIP5 (Lee and Wang, 2014; Mei et al., 2015; Sharmila et al., 2015; Varghese et al., 2020). There is a widespread agreement that a reason for the intensification of the South Asian monsoon rainfall is an increase in moisture flux convergence (Singh et al., 2019). This enhanced thermodynamic effect dominates over the dynamic effect which refers to the decreasing monsoon circulation. D'Agostino et al. (2019) quantified the increase of the thermodynamic component of the moisture budget for the Indian monsoon with about 0.7 mm d−1 and the decrease of the dynamic component with 0.4 mm d−1 using nine CMIP5 models in RCP8.5 determining the positive sign of the change in monsoon rainfall (D'Agostino et al., 2019; Sooraj et al., 2015).
We found that the monsoon rainfall is linearly dependent on the GMT. This is not in contradiction with the observed decline in monsoon rainfall during the second half of the 20th century: while between the 1950s and 1970s, approximately, high aerosol loadings led to subdued warming and a weakened land–sea thermal gradient, greenhouse-gas-induced warming has dominated since then and is the dominant forcing in the 21st century projections. The projected increase in rainfall is 0.33 mm d−1 per kelvin of global warming. The agreement between models and the independence of the scenario is remarkable. The median dependence of relative change in precipitation on GMT taking into account all models has increased from 3.2 % K−1 in CMIP5 to 5.3 % K−1 in CMIP6. Considering only the models with a more realistic representation of the monsoon, the increase is even more noticeable from 2.3 % K−1 in CMIP5 to 6.1 % K−1 in CMIP6. It also has to be mentioned that the range of projected sensitivities has decreased remarkably from 1 % K−1–19 % K−1 in CMIP5 to 2 % K−1–13 % K−1 in the latest generation of climate models; i.e., the uncertainty in hydrological sensitivity has decreased with the model updates. Similar tendencies have been found for the equilibrium climate sensitivity in CMIP6 (Zelinka et al., 2020; Wyser et al., 2020). Which of the updated processes between CMIP5 and CMIP6 described by Gusain et al. (2020) dominate in causing the increased sensitivity of the monsoon to global warming needs further investigation.
The increase in rainfall is projected to contribute to the precipitation in the Himalaya region, the northeast Bay of Bengal and the northwest coast of India. These regions coincide to a large extent with the existing monsoon rainfall pattern, leading to a “wet-regions-get-wetter” pattern during JJAS monsoon rainfall. The distribution of regions with projected increasing precipitation in CMIP6 confirms the projection of previous studies using CMIP5 models (Chaturvedi et al., 2012; Menon et al., 2013; Sharmila et al., 2015). Furthermore, the increasing pattern is shared by a larger percentage of available models in CMIP6 compared to CMIP5. But our projection of increased rainfall over the Western Ghats does not coincide with the study of Varghese et al. (2020) projecting a decrease in this region. By focusing on high-resolution models with the best deep convection scheme, their study reveals decreasing precipitation on the southwest coast of India, which is only captured by one-third of the CMIP6 models in our study, including the CNRM-CM6-1-HR model. A finer resolution seems to be necessary to capture this trend, which is not given for all CMIP6 models.
From the 32 available models, 28 models project an increase in interannual variability. This result is not directly comparable to the study of Menon et al. (2013) since the removal of the trend in our study has a relevant influence on the results. Without the removal of the trend, i.e., following the method of Menon et al. (2013), all 32 models project an increase in interannual variability, which shows that the signal has become clearer in comparison to the results in CMIP5 models. The projected increase in interannual variability coincides with other studies (Kitoh et al., 1997; Jayasankar et al., 2015; Sharmila et al., 2015; Kitoh, 2017). A dominant role in shaping the interannual variability is taken by the El Niño–Southern Oscillation (ENSO) (Turner and Annamalai, 2012). As El Niño events typically coincide with dry monsoon years and La Niña years are often accompanied by strong monsoon rainfall (Kumar et al., 2006), changes in the emergence of these events have a relevant impact on the Indian summer monsoon. Azad and Rajeevan (2016) applied spectral analysis and found a shortening of the spectral periods of ENSO which might lead to a shift in the relationship of ENSO and monsoon rainfall.
We used 32 CMIP6 models to analyze the Indian summer monsoon's response to climate change. In order to identify models with a good representation of the Indian monsoon, we compared the models' simulations in the past to WFDE5 reanalysis data. We found that there are 16 out of 32 models that are able to capture the monsoon rainfall within twice the standard deviation in the period 1985–2015. This is a slight increase compared to CMIP5. The models outside that range in CMIP6 still have a tendency to underestimate the amount of precipitation in this period. This was already observed in CMIP5, where all of the models out of the range underestimated the rainfall. In our analysis, we focused on the models with the more realistic representation of the Indian monsoon. We found that all models show an increase in mean summer monsoon rainfall under SSP5-8.5 and SSP3-7.0 by the end of the 21st century. An increase also was found in SSP2-4.5 and SSP1-2.6 by all models apart from two models in SSP2-4.5 and one model in SSP1-2.6. Under SSP5-8.5, the models exceed the envelope of the baseline's variability on average in 2045. An multi-model mean increase of rainfall of 24.3 % is projected under SSP5-8.5 and of +18.6 % in SSP3-7.0, +11.9 % in SSP2-4.5 and +9.7 % in SSP1-2.6. The majority of models project that the increase will contribute to the precipitation especially in the Himalaya region, the northeast of the Bay of Bengal and to the west coast of India. Besides, the simulation ensemble indicates a linear dependence of rainfall on global mean temperature independent of the SSP in the 21st century; the multi-model mean for JJAS projects an increase of 0.33 mm d−1 and 5.3 % per kelvin of global warming. Furthermore, under SSP5-8.5, a majority (28 out of 32 models) project an increase in interannual variability by the end of the 21st century after removing the trend with singular spectrum analysis.
We have seen in this study that low-resolution models did not capture the spatial pattern of the monsoon rainfall in historic periods well. Small-scale topography and its atmosphere feedback influence the rainfall to a relevant extent. Thus, the ongoing effort to improve the resolution of the individual CMIP models should be continued. Since other rainfall features such as extremes and the variability of rainfall on a subseasonal scale are beyond the scope of this study, they need to be analyzed in further studies due to their high relevance, e.g., for high-risk flooding events.
The projected increase in summer monsoon rainfall in combination with the projected long-term increase in interannual variability will be accompanied by an increased number of extremely wet years and potentially more high-rainfall events (Turner and Slingo, 2009; Sharmila et al., 2015). While crops need water especially in the initial growing period, high-rainfall events during other growing states can harm the plants (Revadekar and Preethi, 2012). Thus, the projected development might have serious consequences for the agriculture in India and neighboring regions. Since the change differs from the decreasing tendency in the second half of the 20th century, the development of adaptation strategies for the 21st century is required.

The code and corresponding data except for the CMIP6 data are permanently available at https://github.com/AnjaKatzenberger/CMIP6-Indian-Monsoon.git (last access: 31 March 2021) (Katzenberger, 2021).
The datasets from CMIP6 simulations are available via the CMIP6 Search Interface: https://esgf-node.llnl.gov/search/cmip6/ (last access: 31 March 2021) (WCRP, 2021). We also used the WFDE5 reanalysis data that are publicly available through the Climate Data Store of the Copernicus Climate Change Service: https://doi.org/10.24381/cds.20d54e34 (CDS2021, 2021). In addition, we used the GSWP3 dataset provided by the Institute of Industrial Science of the University of Tokyo in this study. This dataset was collected and provided under the Data Integration and Analysis System (DIAS, project no. JPMXD0716808999), which has been developed and operated by the Ministry of Education, Culture, Sports, Science and Technology (MEXT). The data can be downloaded at https://doi.org/10.20783/DIAS.501 (DIAS, 2021).
The supplement related to this article is available online at: https://doi.org/10.5194/esd-12-367-2021-supplement.
AL conceived of the idea of the standard analysis of the Indian summer monsoon. AK performed the analysis in consultation with JS. All authors discussed the results and provided critical feedback. AK wrote the paper with contributions from all authors.
The authors declare that they have no conflict of interest.
We acknowledge the World Climate Research Programme's Working Group on Coupled Modelling, which is responsible for CMIP, and we thank the climate modeling groups (listed in Table 1) for producing and making available their model output. We also thank the Copernicus Climate Change Service for providing the WFDE5 reanalysis dataset and the University of Tokyo for providing access to the GSWP3 reanalysis data.
This project has received funding from the European Union's Horizon 2020 research and innovation program under grant agreement no. 820712 (RECEIPT).
The publication of this article was funded by the Open Access Fund of the Leibniz Association.
This paper was edited by Daniel Kirk-Davidoff and reviewed by two anonymous referees.
Acharya, P. and Sreekesh, S.: Seasonal variability in aerosol optical depth over India: a spatio-temporal analysis using the MODIS aerosol product, Int. J. Remote Sens., 34, 4832–4849, https://doi.org/10.1080/01431161.2013.782114, 2013. a
Allan, R., Barlow, M., Byrne, M. P., Cherchi, A., Douville, H., Fowler, H. J., Gan, T. Y., Pendergrass, A. G., Rosenfeld, D., Swann, A. L., Wilcox, L. J., and Zolina, O.: Advances in understanding large-scale responses of the water cycle to climate change, Ann. NY. Acad. Sci., 1472, 1–27, https://doi.org/10.1111/nyas.14337, 2020. a
Asharaf, S. and Ahrens, B.: Indian summer monsoon rainfall processes in climate change scenarios, J. Climate, 28, 5414–5429, https://doi.org/10.1175/JCLI-D-14-00233.1, 2015. a
Ashfaq, M., Rastogi, D., Mei, R., Touma, D., and Leung, L. R.: Sources of errors in the simulation of south Asian summer monsoon in the CMIP5 GCMs, Clim. Dynam., 49, 193–223, https://doi.org/10.1007/s00382-016-3337-7, 2017. a
Azad, S. and Rajeevan, M.: Possible shift in the ENSO-Indian monsoon rainfall relationship under future global warming, Scient. Rep., 6, 20145, https://doi.org/10.1038/srep20145, 2016. a
Bollasina, M. A.: Hydrology: Probing the monsoon pulse, Nature Clim. Change, 4, 422–423, https://doi.org/10.1038/nclimate2243, 2014. a
Bollasina, M. A., Ming, Y., and Ramaswamy, V.: Anthropogenic aerosols and the weakening of the South Asian summer monsoon, Science, 334, 502–505, https://doi.org/10.1126/science.1204994, 2011. a
Boos, W. R. and Korty, R. L.: Regional energy budget control of the intertropical convergence zone and application to mid-Holocene rainfall, Nat. Geosci., 9, 892–897, https://doi.org/10.1038/ngeo2833, 2016. a
Byrne, M. P. and Schneider, T.: Narrowing of the ITCZ in a warming climate: Physical mechanisms, Geophys. Res. Lett., 43, 11–350, https://doi.org/10.1002/2016GL070396, 2016. a
CDS: Near surface meteorological variables from 1979 to 2018 derived from bias-corrected reanalysis, https://doi.org/10.24381/cds.20d54e34, 2021 a
Chaturvedi, R. K., Joshi, J., Jayaraman, M., Bala, G., and Ravindranath, N.: Multi-model climate change projections for India under representative concentration pathways, Curr. Sci., 103, 791–802, 2012. a, b, c, d, e, f
Cherchi, A., Alessandri, A., Masina, S., and Navarra, A.: Effects of increased CO2 levels on monsoons, Clim. Dynam., 37, 83–101, https://doi.org/10.1007/s00382-010-0801-7, 2011. a
Cucchi, M., Weedon, G. P., Amici, A., Bellouin, N., Lange, S., Müller Schmied, H., Hersbach, H., and Buontempo, C.: WFDE5: bias-adjusted ERA5 reanalysis data for impact studies, Earth Syst. Sci. Data, 12, 2097–2120, https://doi.org/10.5194/essd-12-2097-2020, 2020. a, b
D'Agostino, R., Bader, J., Bordoni, S., Ferreira, D., and Jungclaus, J.: Northern Hemisphere Monsoon Response to Mid-Holocene Orbital Forcing and Greenhouse Gas-Induced Global Warming, Geophys. Res. Lett., 46, 1591–1601, https://doi.org/10.1029/2018GL081589, 2019. a, b, c, d
Dai, A., Li, H., Sun, Y., Hong, L.-C., Chou, C., and Zhou, T.: The relative roles of upper and lower tropospheric thermal contrasts and tropical influences in driving Asian summer monsoons, J. Geophys. Res.-Atmos., 118, 7024–7045, https://doi.org/10.1002/jgrd.50565, 2013. a
Danielsen, E. F.: In situ evidence of rapid, vertical, irreversible transport of lower tropospheric air into the lower tropical stratosphere by convective cloud turrets and by larger-scale upwelling in tropical cyclones, J. Geophys. Res.-Atmos., 98, 8665–8681, https://doi.org/10.1029/92JD02954, 1993. a
DeFries, R., Mondal, P., Singh, D., Agrawal, I., Fanzo, J., Remans, R., and Wood, S.: Synergies and trade-offs for sustainable agriculture: Nutritional yields and climate-resilience for cereal crops in Central India, Global Food Secur., 11, 44–53, https://doi.org/10.1016/j.gfs.2016.07.001, 2016. a
Deser, C., Phillips, A. S., and Alexander, M. A.: Twentieth century tropical sea surface temperature trends revisited, Geophys. Res. Lett., 37, 1–6, https://doi.org/10.1029/2010GL043321, 2010. a
DIAS: Global Soil Wetness Project Phase 3 Atmospheric Boundary Conditions (Experiment 1), https://doi.org/10.20783/DIAS.501, 2021. a
Gadgil, S. and Gadgil, S.: The Indian monsoon, GDP and agriculture, Economic and political weekly, Econ. Polit. Weekly, 41, 4887–4895, 2006. a
Golyandina, N. and Zhigljavsky, A.: Singular Spectrum Analysis for time series, Springer Science & Business Media, Berlin, Heidelberg, 2013. a, b, c, d
Gusain, A., Ghosh, S., and Karmakar, S.: Added value of CMIP6 over CMIP5 models in simulating Indian summer monsoon rainfall, Atmos. Res., 232, 104680, https://doi.org/10.1016/j.atmosres.2019.104680, 2020. a, b, c, d, e, f, g, h
Herzschuh, U., Borkowski, J., Schewe, J., Mischke, S., and Tian, F.: Moisture-advection feedback supports strong early-to-mid Holocene monsoon climate on the eastern Tibetan Plateau as inferred from a pollen-based reconstruction, Palaeogeogr. Palaeocl., 402, 44–54, https://doi.org/10.1016/j.palaeo.2014.02.022, 2014. a, b
Jalihal, C., Srinivasan, J., and Chakraborty, A.: Modulation of Indian monsoon by water vapor and cloud feedback over the past 22,000 years, Nat. Commun., 10, 1–8, https://doi.org/10.1038/s41467-019-13754-6, 2019. a
Jayasankar, C., Surendran, S., and Rajendran, K.: Robust signals of future projections of Indian summer monsoon rainfall by IPCC AR5 climate models: Role of seasonal cycle and interannual variability, Geophys. Res. Lett., 42, 3513–3520, https://doi.org/10.1002/2015GL063659, 2015. a, b
Jin, Q. and Wang, C.: A revival of Indian summer monsoon rainfall since 2002, Nat. Clim. Change, 7, 587–594, https://doi.org/10.1038/nclimate3348, 2017. a, b, c
Katzenberger, A.: CMIP6-Indian-Monsoon, GitHub, available at: https://github.com/AnjaKatzenberger/CMIP6-Indian-Monsoon.git, last access: 31 March 2021. a
Kim, H.: Global Soil Wetness Project Phase 3 Atmospheric Boundary Conditions (Experiment 1) [Data set], Data Integration and Analysis System (DIAS), https://doi.org/10.20783/DIAS.501, 2017. a
Kitoh, A.: The Asian monsoon and its future change in climate models: A review, J. Meteorol. Soc. Jpn. Ser. II, 95, 7–33, https://doi.org/10.2151/jmsj.2017-002, 2017. a, b
Kitoh, A., Yukimoto, S., Noda, A., and Motoi, T.: Simulated changes in the Asian summer monsoon at times of increased atmospheric CO2, J. Meteorol. Soc. Jpn. Ser. II, 75, 1019–1031, https://doi.org/10.2151/jmsj1965.75.6_1019, 1997. a, b
Knutti, R., Sedláček, J., Sanderson, B. M., Lorenz, R., Fischer, E. M., and Eyring, V.: A climate model projection weighting scheme accounting for performance and interdependence, Geophys. Res. Lett., 44, 1909–1918, https://doi.org/10.1002/2016GL072012, 2017. a
Krishna Moorthy, K., Suresh Babu, S., Manoj, M., and Satheesh, S.: Buildup of aerosols over the Indian Region, Geophys. Res. Lett., 40, 1011–1014, https://doi.org/10.1002/grl.50165, 2013. a
Kumar, K. K., Rajagopalan, B., Hoerling, M., Bates, G., and Cane, M.: Unraveling the mystery of Indian monsoon failure during El Niño, Science, 314, 115–119, https://doi.org/10.1126/science.1131152, 2006. a
Lange, S.: Trend-preserving bias adjustment and statistical downscaling with ISIMIP3BASD (v1.0), Geosci. Model Dev., 12, 3055–3070, https://doi.org/10.5194/gmd-12-3055-2019, 2019. a
Lee, J.-Y. and Wang, B.: Future change of global monsoon in the CMIP5, Clim. Dynam., 42, 101–119, https://doi.org/10.1007/s00382-012-1564-0, 2014. a, b, c
Levermann, A., Schewe, J., Petoukhov, V., and Held, H.: Basic mechanism for abrupt monsoon transitions, P. Natl. Acad. Sci. USA, 106, 20572–20577, https://doi.org/10.1073/pnas.0901414106, 2009. a
Li, K., Liu, X., Wang, Y., Herzschuh, U., Ni, J., Liao, M., and Xiao, X.: Late Holocene vegetation and climate change on the southeastern Tibetan Plateau: Implications for the Indian Summer Monsoon and links to the Indian Ocean Dipole, Quaternary Sci. Rev., 177, 235–245, https://doi.org/10.1016/j.quascirev.2017.10.020, 2017. a
Mei, R., Ashfaq, M., Rastogi, D., Leung, L. R., and Dominguez, F.: Dominating controls for wetter South Asian summer monsoon in the twenty-first century, J. Climate, 28, 3400–3419, https://doi.org/10.1175/JCLI-D-14-00355.1, 2015. a, b, c, d
Menon, A., Levermann, A., Schewe, J., Lehmann, J., and Frieler, K.: Consistent increase in Indian monsoon rainfall and its variability across CMIP-5 models, Earth Syst. Dynam., 4, 287–300, https://doi.org/10.5194/esd-4-287-2013, 2013. a, b, c, d, e, f, g, h, i, j, k
Ming, G., Zhou, W., Cheng, P., Wang, H., Xian, F., Fu, Y., Wu, S., and Du, H.: Lacustrine record from the eastern Tibetan Plateau associated with Asian summer monsoon changes over the past 6 ka and its links with solar and ENSO activity, Clim. Dynam., 55, 1075–1086, https://doi.org/10.1007/s00382-020-05312-4, 2020. a, b, c
Mishra, V., Smoliak, B. V., Lettenmaier, D. P., and Wallace, J. M.: A prominent pattern of year-to-year variability in Indian Summer Monsoon Rainfall, P. Natl. Acad. Sci. USA, 109, 7213–7217, https://doi.org/10.1073/pnas.1119150109, 2012. a
Mishra, V., Kumar, D., Ganguly, A. R., Sanjay, J., Mujumdar, M., Krishnan, R., and Shah, R. D.: Reliability of regional and global climate models to simulate precipitation extremes over India, J. Geophys. Res.-Atmos., 119, 9301–9323, https://doi.org/10.1002/2014JD021636, 2014a. a
Mishra, V., Shah, R., and Thrasher, B.: Soil moisture droughts under the retrospective and projected climate in India, J. Hydrometeorol., 15, 2267–2292, https://doi.org/10.1175/JHM-D-13-0177.1, 2014b. a
Ogata, T., Ueda, H., Inoue, T., Hayasaki, M., Yoshida, A., Watanabe, S., Kira, M., Ooshiro, M., and Kumai, A.: Projected future changes in the Asian monsoon: a comparison of CMIP3 and CMIP5 model results, J. Meteorol. Soc. Jpn. Ser. II, 92, 207–225, https://doi.org/10.2151/jmsj.2014-302, 2014. a
O'Neill, B. C., Kriegler, E., Ebi, K. L., Kemp-Benedict, E., Riahi, K., Rothman, D. S., van Ruijven, B. J., Van Vuuren, D. P., Birkmann, J., Kok, K., Levy, M., and Solecki, W.: The roads ahead: Narratives for shared socioeconomic pathways describing world futures in the 21st century, Global Environ. Change, 42, 169–180, https://doi.org/10.1016/j.gloenvcha.2015.01.004, 2017. a, b
Prasanna, V.: Impact of monsoon rainfall on the total foodgrain yield over India, J. Earth Syst. Sci., 123, 1129–1145, https://doi.org/10.1007/s12040-014-0444-x, 2014. a
Ramanathan, V., Chung, C., Kim, D., Bettge, T., Buja, L., Kiehl, J. T., Washington, W. M., Fu, Q., Sikka, D. R., and Wild, M.: Atmospheric brown clouds: Impacts on South Asian climate and hydrological cycle, P. Natl. Acad. Sci. USA, 102, 5326–5333, https://doi.org/10.1073/pnas.0500656102, 2005. a
Ramesh, K. and Goswami, P.: Assessing reliability of regional climate projections: the case of Indian monsoon, Scient. Rep., 4, 1–9, https://doi.org/10.1038/srep04071, 2014. a
Revadekar, J. and Preethi, B.: Statistical analysis of the relationship between summer monsoon precipitation extremes and foodgrain yield over India, Int. J. Climatol., 32, 419–429, https://doi.org/10.1002/joc.2282, 2012. a
Roxy, M. K., Ritika, K., Terray, P., Murtugudde, R., Ashok, K., and Goswami, B.: Drying of Indian subcontinent by rapid Indian Ocean warming and a weakening land-sea thermal gradient, Na. Commun., 6, 1–10, https://doi.org/10.1038/ncomms8423, 2015. a
Sabeerali, C., Rao, S. A., Dhakate, A., Salunke, K., and Goswami, B.: Why ensemble mean projection of south Asian monsoon rainfall by CMIP5 models is not reliable?, Clim. Dynam., 45, 161–174, https://doi.org/10.1007/s00382-014-2269-3, 2015. a
Saha, A., Ghosh, S., Sahana, A., and Rao, E.: Failure of CMIP5 climate models in simulating post-1950 decreasing trend of Indian monsoon, Geophys. Res. Lett., 41, 7323–7330, https://doi.org/10.1002/2014GL061573, 2014. a
Schewe, J., Levermann, A., and Cheng, H.: A critical humidity threshold for monsoon transitions, Clim.e Past, 8, 535–544, https://doi.org/10.5194/cp-8-535-2012, 2012. a
Schneider, U., Becker, A., Finger, P., Meyer-Christoffer, A., and Ziese, M.: GPCC Full Data Monthly Product Version 2018 at 0.5∘: Monthly land-surface precipitation from rain-gauges built on GTS-based and historical data, https://doi.org/10.5676/DWD_GPCC/FD_M_V2018_050, 2018. a
Seth, A., Rauscher, S. A., Biasutti, M., Giannini, A., Camargo, S. J., and Rojas, M.: CMIP5 projected changes in the annual cycle of precipitation in monsoon regions, J. Climate, 26, 7328–7351, https://doi.org/10.1175/JCLI-D-12-00726.1, 2013. a
Seth, A., Giannini, A., Rojas, M., Rauscher, S. A., Bordoni, S., Singh, D., and Camargo, S. J.: Monsoon responses to climate changes—connecting past, present and future, Curr. Clim. Change Rep., 5, 63–79, https://doi.org/10.1007/s40641-019-00125-y, 2019. a, b, c, d, e
Shah, H. L. and Mishra, V.: Hydrologic changes in Indian subcontinental river basins (1901–2012), J. Hydrometeorol., 17, 2667–2687, https://doi.org/10.1175/JHM-D-15-0231.1, 2016. a
Sharmila, S., Joseph, S., Sahai, A. K., Abhilash, S., and Chattopadhyay, R.: Future projection of Indian summer monsoon variability under climate change scenario: An assessment from CMIP5 climate models, Global Planet. Change, 124, 62–78, https://doi.org/10.1016/j.gloplacha.2014.11.004, 2015. a, b, c, d, e, f
Shashikanth, K., Salvi, K., Ghosh, S., and Rajendran, K.: Do CMIP5 simulations of Indian summer monsoon rainfall differ from those of CMIP3?, Atmos. Sci. Lett., 15, 79–85, https://doi.org/10.1002/asl2.466, 2014. a
Singh, D., Ghosh, S., Roxy, M. K., and McDermid, S.: Indian summer monsoon: Extreme events, historical changes, and role of anthropogenic forcings, Wiley Interdisciplin. Rev.: Clim. Change, 10, 1–35, https://doi.org/10.1002/wcc.571, 2019. a, b, c, d
Sooraj, K., Terray, P., and Mujumdar, M.: Global warming and the weakening of the Asian summer monsoon circulation: assessments from the CMIP5 models, Clim. Dynam., 45, 233–252, https://doi.org/10.1007/s00382-014-2257-7, 2015. a, b, c
Sperber, K. R., Annamalai, H., Kang, I.-S., Kitoh, A., Moise, A., Turner, A., Wang, B., and Zhou, T.: The Asian summer monsoon: an intercomparison of CMIP5 vs. CMIP3 simulations of the late 20th century, Clim. Dynam., 41, 2711–2744, https://doi.org/10.1007/s00382-012-1607-6, 2013. a
Tebaldi, C., Debeire, K., Eyring, V., Fischer, E., Fyfe, J., Friedlingstein, P., Knutti, R., Lowe, J., O'Neill, B., Sanderson, B., van Vuuren, D., Riahi, K., Meinshausen, M., Nicholls, Z., Tokarska, K. B., Hurtt, G., Kriegler, E., Lamarque, J.-F., Meehl, G., Moss, R., Bauer, S. E., Boucher, O., Brovkin, V., Byun, Y.-H., Dix, M., Gualdi, S., Guo, H., John, J. G., Kharin, S., Kim, Y., Koshiro, T., Ma, L., Olivié, D., Panickal, S., Qiao, F., Rong, X., Rosenbloom, N., Schupfner, M., Séférian, R., Sellar, A., Semmler, T., Shi, X., Song, Z., Steger, C., Stouffer, R., Swart, N., Tachiiri, K., Tang, Q., Tatebe, H., Voldoire, A., Volodin, E., Wyser, K., Xin, X., Yang, S., Yu, Y., and Ziehn, T.: Climate model projections from the Scenario Model Intercomparison Project (ScenarioMIP) of CMIP6, Earth Syst. Dynam., 12, 253–293, https://doi.org/10.5194/esd-12-253-2021, 2021. a
Turner, A. G. and Annamalai, H.: Climate change and the South Asian summer monsoon, Nat. Clim. Change, 2, 587–595, https://doi.org/10.1038/nclimate1495, 2012. a
Turner, A. G. and Slingo, J. M.: Subseasonal extremes of precipitation and active-break cycles of the Indian summer monsoon in a climate-change scenario, Q. J. Roy. Meteorol. Soc., 135, 549–567, https://doi.org/10.1002/qj.401, 2009. a
Ul Hasson, S., Pascale, S., Lucarini, V., and Böhner, J.: Seasonal cycle of precipitation over major river basins in South and Southeast Asia: a review of the CMIP5 climate models data for present climate and future climate projections, Atmos. Res., 180, 42–63, https://doi.org/10.1016/j.atmosres.2016.05.008, 2016. a
Van Vuuren, D. P., Kriegler, E., O'Neill, B. C., Ebi, K. L., Riahi, K., Carter, T. R., Edmonds, J., Hallegatte, S., Kram, T., Mathur, R., et al.: A new scenario framework for climate change research: scenario matrix architecture, Climatic Change, 122, 373–386, 2014. a
Varghese, S. J., Surendran, S., Rajendran, K., and Kitoh, A.: Future projections of Indian Summer Monsoon under multiple RCPs using a high resolution global climate model multiforcing ensemble simulations, Clim. Dynam., 54, 1315–1328, https://doi.org/10.1007/s00382-019-05059-7, 2020. a, b, c, d
Vecchi, G. A., Soden, B. J., Wittenberg, A. T., Held, I. M., Leetmaa, A., and Harrison, M. J.: Weakening of tropical Pacific atmospheric circulation due to anthropogenic forcing, Nature, 441, 73–76, https://doi.org/10.1038/nature04744, 2006. a
Wang, P., Clemens, S., Beaufort, L., Braconnot, P., Ganssen, G., Jian, Z., Kershaw, P., and Sarnthein, M.: Evolution and variability of the Asian monsoon system: state of the art and outstanding issues, Quaternary Sci. Rev., 24, 595–629, https://doi.org/10.1016/j.quascirev.2004.10.002, 2005. a, b, c
Wang, Y., Cheng, H., Edwards, R. L., He, Y., Kong, X., An, Z., Wu, J., Kelly, M. J., Dykoski, C. A., and Li, X.: The Holocene Asian monsoon: links to solar changes and North Atlantic climate, Science, 308, 854–857, https://doi.org/10.1126/science.1106296, 2005. a, b
Wang, Y., Cheng, H., Edwards, R. L., Kong, X., Shao, X., Chen, S., Wu, J., Jiang, X., Wang, X., and An, Z.: Millennial-and orbital-scale changes in the East Asian monsoon over the past 224,000 years, Nature, 451, 1090–1093, https://doi.org/10.1038/nature06692, 2008. a, b
Wang, Y., Bekeschus, B., Handorf, D., Liu, X., Dallmeyer, A., and Herzschuh, U.: Coherent tropical-subtropical Holocene see-saw moisture patterns in the Eastern Hemisphere monsoon systems, Quaternary Sci. Rev., 169, 231–242, https://doi.org/10.1016/j.quascirev.2017.06.006, 2017. a
Wang, Y., Shen, J., Wang, Y., Liu, X., Cao, X., and Herzschuh, U.: Abrupt mid-Holocene decline in the Indian Summer Monsoon caused by tropical Indian Ocean cooling, Clim. Dynam., 55, 1961–1977, https://doi.org/10.1007/s00382-020-05363-7, 2020. a, b
WCRP: CMIP6, available at: https://esgf-node.llnl.gov/search/cmip6/, last access: 31 March 2021. a
Wyser, K., van Noije, T., Yang, S., von Hardenberg, J., O'Donnell, D., and Döscher, R.: On the increased climate sensitivity in the EC-Earth model from CMIP5 to CMIP6, Geosci. Model Dev., 13, 3465–3474, https://doi.org/10.5194/gmd-13-3465-2020, 2020. a
Zaveri, E., Grogan, D. S., Fisher-Vanden, K., Frolking, S., Lammers, R. B., Wrenn, D. H., Prusevich, A., and Nicholas, R. E.: Invisible water, visible impact: groundwater use and Indian agriculture under climate change, Environ. Res. Lett., 11, 084005, https://doi.org/10.1088/1748-9326/11/8/084005, 2016. a
Zelinka, M. D., Myers, T. A., McCoy, D. T., Po-Chedley, S., Caldwell, P. M., Ceppi, P., Klein, S. A., and Taylor, K. E.: Causes of higher climate sensitivity in CMIP6 models, Geophys. Res. Lett., 47, e2019GL085782, https://doi.org/10.1029/2019GL085782, 2020. a
Zhang, P., Cheng, H., Edwards, R. L., Chen, F., Wang, Y., Yang, X., Liu, J., Tan, M., Wang, X., Liu, J., An, C., Dai, Z., Zhou, J., Zhang, D., Jia, J., Jin, L., and Johnson, K. R.: A test of climate, sun, and culture relationships from an 1810-year Chinese cave record, Science, 322, 940–942, https://doi.org/10.1126/science.1163965, 2008. a, b
Zhang, W., Zhang, Z., Liao, Z., Wang, Y., Chen, S., Shao, Q., and Wang, Y.: Changes in the Asian monsoon climate during the late last interglacial recorded in oxygen isotopes of a stalagmite from the Yongxing Cave, central China, J. Asian Earth Sci., 179, 211–218, https://doi.org/10.1016/j.jseaes.2019.04.024, 2019. a, b
Zhou, T., Yu, R., Li, H., and Wang, B.: Ocean forcing to changes in global monsoon precipitation over the recent half-century, J. Climate, 21, 3833–3852, https://doi.org/10.1175/2008JCLI2067.1, 2008. a