the Creative Commons Attribution 4.0 License.
the Creative Commons Attribution 4.0 License.
 | 22 Dec 2021
Balanced estimate and uncertainty assessment of European climate change using the large EURO-CORDEX regional climate model ensemble
Samuel Somot
Benoit Hingray
Large multiscenario multimodel ensembles (MMEs) of regional climate model (RCM) experiments driven by global climate models (GCMs) are made available worldwide and aim at providing robust estimates of climate changes and associated uncertainties. Due to many missing combinations of emission scenarios and climate models leading to sparse scenario–GCM–RCM matrices, these large ensembles, however, are very unbalanced, which makes uncertainty analyses impossible with standard approaches. In this paper, the uncertainty assessment is carried out by applying an advanced statistical approach, called QUALYPSO, to a very large ensemble of 87 EURO-CORDEX climate projections, the largest MME based on regional climate models ever produced in Europe. This analysis provides a detailed description of this MME, including (i) balanced estimates of mean changes for near-surface temperature and precipitation in Europe, (ii) the total uncertainty of projections and its partition as a function of time, and (iii) the list of the most important contributors to the model uncertainty. For changes in total precipitation and mean temperature in winter (DJF) and summer (JJA), the uncertainty due to RCMs can be as large as the uncertainty due to GCMs at the end of the century (2071–2099). Both uncertainty sources are mainly due to a small number of individual models clearly identified. Due to the highly unbalanced character of the MME, mean estimated changes can drastically differ from standard average estimates based on the raw ensemble of opportunity. For the RCP4.5 emission scenario in central–eastern Europe for instance, the difference between balanced and direct estimates is up to 0.8 ∘C for summer temperature changes and up to 20 % for summer precipitation changes at the end of the century.
- Article
(37175 KB) - Full-text XML
-
Supplement
(1949 KB) - BibTeX
- EndNote


Climate change studies usually rely on multiscenario multimodel multimember ensembles (MMEs) of transient climate projections. Large MMEs are now available and exploited to assess mean changes and related uncertainties. Among these MMEs, many dynamical downscaled ensembles rely on regional climate models (RCMs), which are used to downscale global climate model (GCM) projection simulations for a given set of scenarios. The added value of regional projections has been demonstrated in many studies (Herrmann et al., 2011; Giorgi and Gutowski, 2015; Rummukainen, 2016; Fantini et al., 2018), particularly in mountainous and complex coastline areas, as well as for local wind systems and extreme precipitation events.
The European part of the COordinated Regional Downscaling EXperiment (EURO-CORDEX) has led to a very large MME at 0.11∘ horizontal resolution, which is so far the largest ensemble ever produced with regional climate models (Jacob et al., 2014; Kotlarski et al., 2014; Coppola et al., 2020; Vautard et al., 2020). As a result of this long-standing effort of the regional climate modeling community, strengthened estimates of future meteorological changes at regional scales can be assessed over Europe, and possible impacts of future climate change can be explored at high resolution. The EURO-CORDEX ensemble also allows disentangling the different uncertainty sources in projections, namely uncertainties due to the emission scenario, model diversity, and natural climate variability (Déqué et al., 2007; Hawkins and Sutton, 2009; Déqué et al., 2012). For regional projections, model uncertainty combines GCM uncertainty (for the same radiative forcing, different GCMs produce different forced responses) and RCM uncertainty (different RCMs forced by the same GCM produce different regional responses). As such, the EURO-CORDEX ensemble provides a good opportunity to estimate the relative contributions of GCMs and RCMs to model uncertainty and thus to identify the largest uncertainty sources and where modeling forces could be preferentially allocated in the coming years.
The statistical treatment of large MMEs is challenging for different reasons, and MMEs composed of EURO-CORDEX climate projections are no exception. Some GCMs are over-represented, with a few GCMs being selected by almost all regional climate modeling groups, while other GCMs are used for a few experiments only. A similar configuration is found for RCMs. If a few RCMs are used to downscale a large number of GCMs, most RCMs will be applied to small (and often different) GCM subsets. The same applies for emission scenarios. There are about 2 times more GCM–RCM chains produced for RCP8.5 than for RCP4.5 and RCP2.6.
The unbalanced nature of the EURO-CORDEX ensemble and of all MMEs in general is obviously a side effect of the very large computational efforts needed to produce high-resolution simulations. As a consequence, RCP × GCM × RCM matrices of MMEs are always very incomplete, with missing experiments for many different RCP–GCM–RCM combinations. In the EURO-CORDEX MME considered in this study, for instance, 13 RCMs have been used to downscale projections of 9 CMIP5 GCMs for 3 RCP scenarios. From the possible RCP–GCM–RCM combinations, only 87 were available in August 2020. This number is continuously increasing, but the matrix of possible RCP–GCM–RCM combinations will never fill up entirely.
Due to the incomplete nature of MMEs, uncertainty analyses cannot be performed with standard analysis of variance (ANOVA) approaches. However, this incompleteness issue is usually ignored, and mean climate changes are typically estimated by the average of available projections (Jacob et al., 2014; Kjellström et al., 2018; Coppola et al., 2020; Vautard et al., 2020), while Evin et al. (2019) demonstrate that it can lead to incorrect estimates of the mean changes and of the different uncertainty sources. As an alternative solution, other studies subsample the MME to obtain a balanced subset of available chains (Tramblay and Somot, 2018; Christensen and Kjellström, 2020). In the analysis of Christensen and Kjellström (2020), for instance, a nearly full submatrix of 19 EURO-CORDEX experiments, made of 5×4 GCM–RCM combinations available for RCP8.5, has been considered. The other model combinations and scenarios were thus disregarded. Subsampling MMEs obviously leads to a dramatic waste of information (only 20 % of available chains were considered in the previous example) and under-representative estimates.
A correct uncertainty assessment of unbalanced MMEs is not straightforward, but a few works have been proposed in the last years to tackle this challenging “incompleteness” issue. Northrop and Chandler (2014) propose a random-effects ANOVA model which considers the MME to be a sample of a wider population. Other approaches make use of data reconstruction or augmentation techniques (Déqué et al., 2007, 2012; Evin et al., 2019). In the present paper, QUALYPSO, an advanced statistical approach presented in Evin et al. (2019), is applied to EURO-CORDEX projections in order to estimate the mean changes in winter–summer temperature and precipitation over Europe. QUALYPSO applies the “time series” approach (Hawkins and Sutton, 2009; Hingray and Saïd, 2014), which consists of separating the forced climate response from the internal variability using a trend model. Hingray et al. (2019) show that the precision of all uncertainty estimates is higher with this approach than with the “single time” approach (Yip et al., 2011), i.e., when multiple members are used and exploited to assess the different uncertainties for each future time window. We also estimate the related total uncertainty, the different sources of uncertainties, and the individual contribution of each climate model (GCMs and RCMs) to their corresponding uncertainties. In contrast to many previous studies, a large MME of 87 EURO-CORDEX experiments is analyzed, and all uncertainty sources associated with the ensemble are considered: scenario uncertainty, GCM uncertainty, RCM uncertainty, climate internal variability, and the uncertainty related to the different interactions (RCM–GCM, RCM–scenario, GCM–scenario).
The objectives of this paper are thus threefold. For the largest MME based on regional climate models ever produced, the aim is to
-
provide robust estimates of climate precipitation and temperature changes at high resolution in Europe for the next decades,
-
provide a robust estimate of total uncertainty and of its different components, and
-
identify the individual climate models which contribute the most to model uncertainty.
It is important to underline that, as in almost all previous climate impacts analyses, all the analyses and results are conditional on the available ensemble of opportunity. Other estimates of mean changes and uncertainty components would be obtained with a different MME. The term “robust” indicates that, for the same set of scenarios and climate models, results are expected to be only slightly sensitive to the available RCP–GCM–RCM experiments. In other words, another set of experiments and combinations produced with the same scenarios and climate models would be expected to give similar estimates of mean changes and uncertainty components. The use of the term robust here must not be confused with the notion of statistical robustness, which aims at providing estimates that are less sensitive to outliers or departures from standard assumptions (e.g., normality).
Section 2 presents the MME composed of EURO-CORDEX climate projections used in this study. Section 3 describes the methodology proposed for estimating mean projected changes and partitioning climate change uncertainties. Sections 4 and 5 show mean changes and related uncertainties for illustrative regions and for all of Europe, respectively. In Sects. 6 and 7, we focus on the contributions of the main sources of uncertainty and the individual climate models. Section 8 discusses these results. Section 9 concludes.
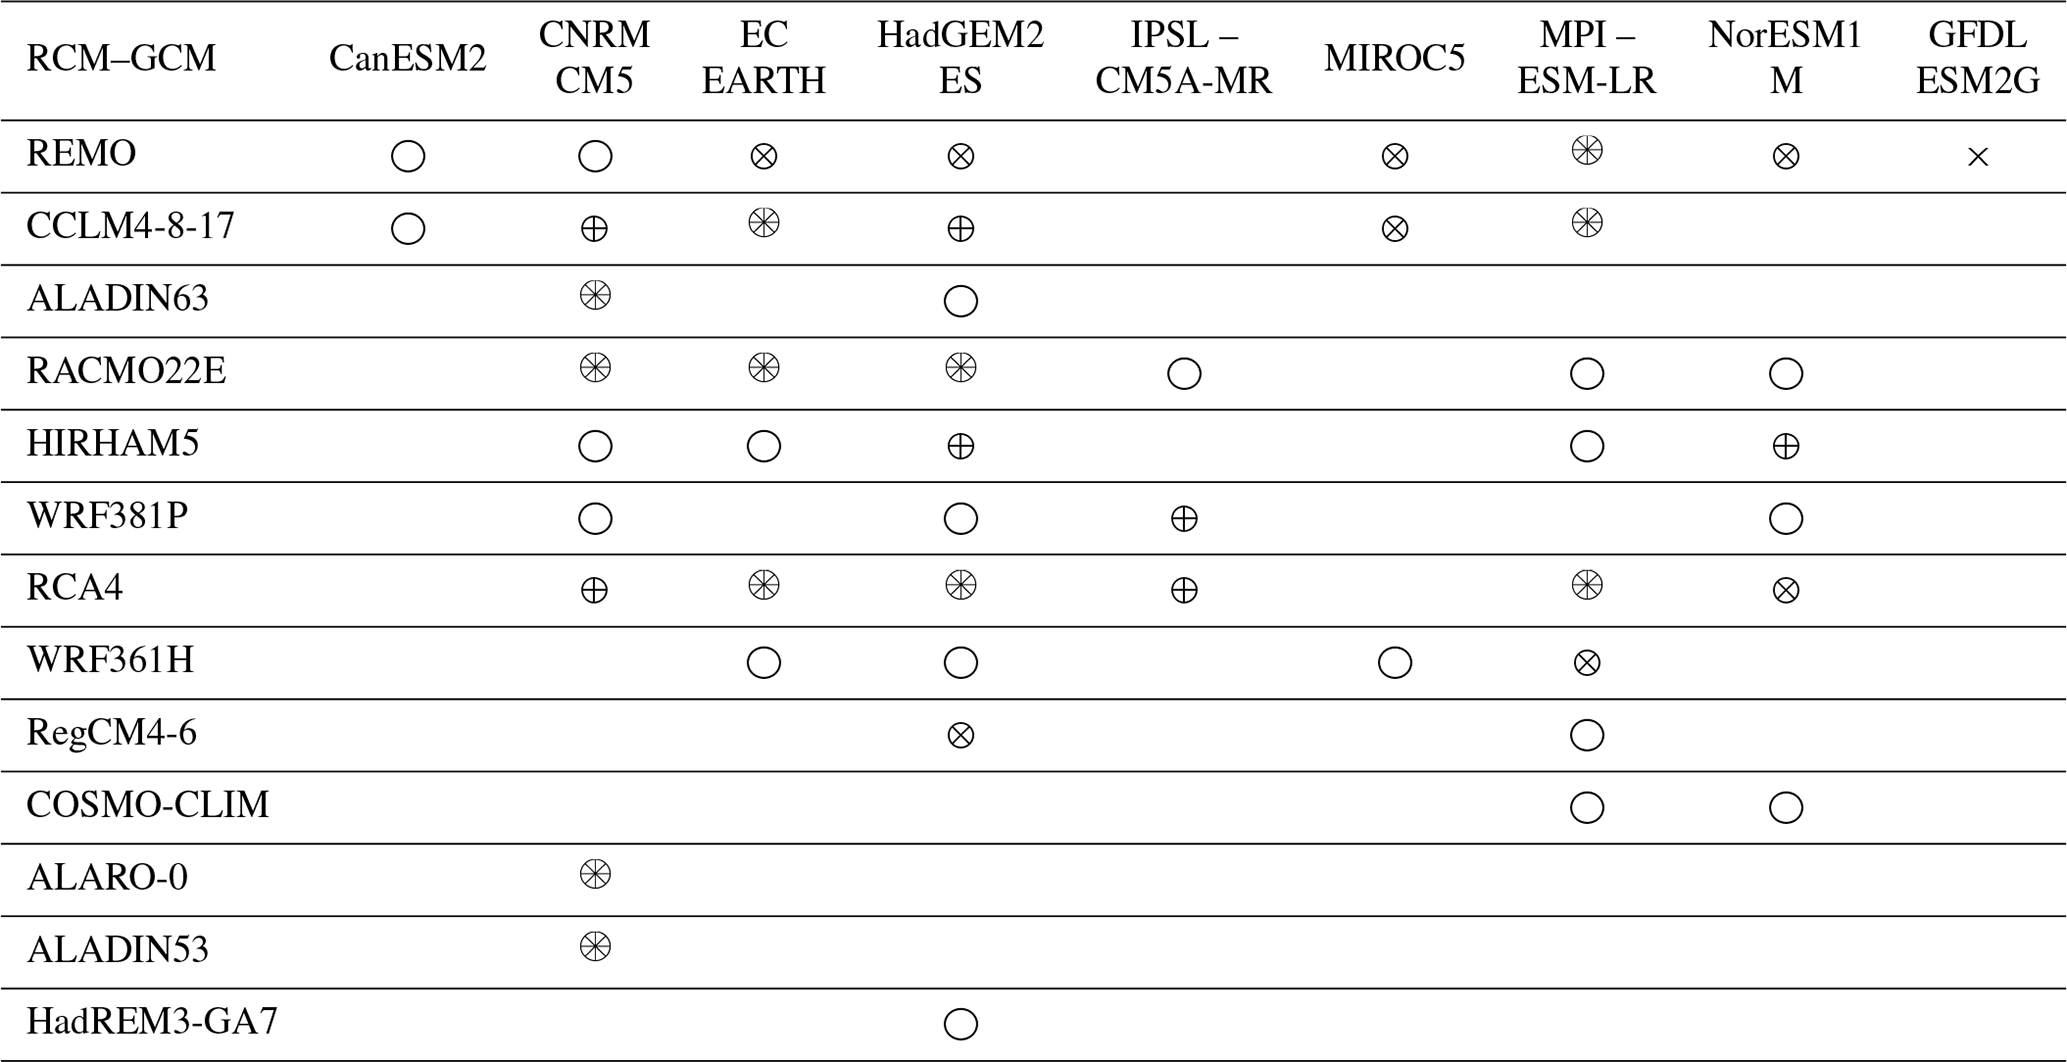
This study exploits the outputs of the EURO-CORDEX initiative (Jacob et al., 2014, 2020), which is composed of climate experiments obtained from 13 RCMs forced over Europe by 9 CMIP5 GCMs (Taylor et al., 2011) for the historical, RCP2.6, RCP4.5, and RCP8.5 emission scenarios (Moss et al., 2010). Most historical runs cover the period 1950–2005, and runs obtained with the different RCPs cover the period 2006–2099. Table 1 lists the 87 RCP–GCM–RCM modeling chains available in August 2020 that are used in the present study (see also the full characteristics of the scenarios in Table S1 in the Supplement). A total of 21 chains have been obtained with the RCP2.6, 19 with the RCP4.5, and 47 with the RCP8.5. For each chain, time series of mean temperature and total precipitation aggregated at seasonal (DJF and JJA) scales, averaged over 30-year moving windows, and at a 0.11∘ resolution (which corresponds to grid points) have been extracted.
Note that we consider REMO2009 and REMO2015 to be only one RCM but both versions of ALADIN and CCLM to be different RCMs as advised by Vautard et al. (2020). An error has been detected in the atmosphere lateral boundary condition files initially provided for the simulation historical_r1i1p1 of the CNRM-CM5 CMIP5 model. The atmosphere data at the 6-hourly frequency on the model level (6hLev) used for driving the regional climate models do not come from the member r1i1p1, whereas the sea surface temperature (SST) does. The RCMs ALADIN53, CCLM4-8-17, RCA, REMO, and ALARO-0 use the erroneous CNRM-CM5 lateral boundary conditions, whereas the RCMs ALADIN63, RACMO22E, HIRHAM5, and WRF381P use the corrected version. This error likely has no significant effect on the multi-annual climate change signal. As a consequence, following Vautard et al. (2020), this study considers all the runs obtained with the CNRM-CM5 CMIP5 model. Other known issues in EURO-CORDEX simulations can be found in the corresponding errata page (https://www.euro-cordex.net/078730/index.php.en, last access: 17 December 2021).
Table 1Combination of available GCM and RCM pairs with the scenarios RCP2.6 (×), RCP4.5 (+), and RCP8.5 (◦).
Mean changes and associated uncertainty components for the available MME are estimated with the QUALYPSO approach described in Evin et al. (2019). Scenario and model uncertainties are obtained with a fixed-effects analysis of variance (ANOVA) applied to the ensemble of climate change responses estimated for the different chains. The time evolution of the forced climate response of any given chain is assumed to be gradual and smooth, with the higher-frequency variations of the time series being attributed to internal variability of the studied variable (the so-called quasi-ergodicity assumption; see Hingray and Saïd, 2014). The forced response of a particular simulation chain for a given emission scenario is thus considered to correspond to the long-term trend of the climate projections. In order to assess mean changes and related uncertainties in incomplete MMEs, the QUALYPSO approach applies a data augmentation technique which consists of simulating missing climate change responses according to the additive ANOVA model. For a detailed description of the QUALYPSO method, we refer to Evin et al. (2019) and to Sect. S2 in the Supplement. The different steps are illustrated in Fig. 1. They can be summarized as follows.
-
Forced climate response. The forced climate response for RCM i, GCM j, and emission scenario k at time (year) t is estimated for each of the 87 available climate simulations by fitting a trend model using a cubic smoothing spline (implemented by the function
smooth.splinein R software; R, 2017). High smoothing parameters (sparargument ofsmooth.splineequals 1.1 for temperature and 1 for precipitation) are chosen in order to avoid including decennial variability into these fitted forced responses (see Fig. 1a and b for an illustration). -
Climate change response. The climate change response of any given scenario–GCM–RCM chain corresponds to the anomaly of the forced response between a future period and the 1981–2010 reference period. Absolute changes are considered for temperature and relative changes for precipitation (Fig. 1c).
-
Balanced estimates of the main ANOVA effects using data augmentation. In QUALYPSO, the climate change response of a given simulation chain (a given emission scenario, GCM, RCM combination) is expressed as the sum of the grand ensemble mean, with the main effects corresponding to the considered GCMs, RCMs, and emission scenarios, and a residual term, i.e.,
where
-
μ(t) is the ensemble mean climate change response that would be obtained for a complete MME.
-
αi(t), βj(t), and γk(t) are the main effects corresponding to the RCM i, GCM j, and emission scenario k, respectively, for the time t. They correspond to the deviations from the ensemble mean climate change response μ(t) (see illustration of the main scenario effects γk(t) in Fig. 1d).
-
is a residual term which represents the part of the climate change response that cannot be explained by the sum of the ensemble mean and the main effects. These residual terms potentially include different interactions between models and/or scenarios. The numerous interaction terms being impossible to estimate using the QUALYPSO approach, they are further decomposed using an ad hoc method in order to estimate three types of interactions between models and/or scenarios: RCM–GCM, RCM–RCP, and GCM–RCP (see Sect. S2.4 in the Supplement).
The QUALYPSO approach (Evin et al., 2019) consists of estimating the different terms of Eq. (1) (grand mean μ(t) and the main effects αi(t), βj(t), and γk(t)) using a Bayesian framework and data augmentation. Missing climate projections are part of the inference, and the posterior distributions of all unknown quantities (grand mean, main effects, and missing climate projections) are sampled sequentially using the Gibbs algorithm. In particular, following the so-called data augmentation method, missing climate projections are simulated directly from Eq. (1), assuming that they follow the same ANOVA decomposition as available chains. These simulated MME experiments contribute to the estimation of the different quantities so that balanced estimates of all quantities (i.e., the grand ensemble mean, the main effects, the uncertainty components) are obtained. For example, the μ(t) estimate is obtained as the mean of the 351 climate change responses (available and simulated) corresponding to all RCP–GCM–RCM combinations that would be possible with the specific set of emission scenarios, GCMs, and RCMs considered in the available ensemble (Fig. 1c).
-
-
Internal variability. Internal variability of a modeling chain at a given time typically refers to the variance of all realizations that could be obtained with that chain at that time from multiple runs. In this study, it is estimated as the (temporal) variance of 30-year average deviations from the estimated climate change response of the chain (see Eq. S10 in the Supplement), and the internal variability estimate of the MME is estimated as the multichain mean. It is thus assumed to be constant over time.
-
Uncertainty components. The dispersion (variance) between the main effects obtained for the different GCMs, the different RCMs, and the three RCP scenarios gives an estimate of the GCM uncertainty, the RCM uncertainty, and the scenario uncertainty, respectively (Fig. 1d). Similarly, the variance between the interaction effects provides the uncertainty related to RCM–GCM, RCM–RCP, and GCM–RCP interactions. The residual variability corresponds to the part of the total variance which cannot be attributed to the other sources of uncertainty (i.e., related to the main effects, the different interactions, or internal variability).
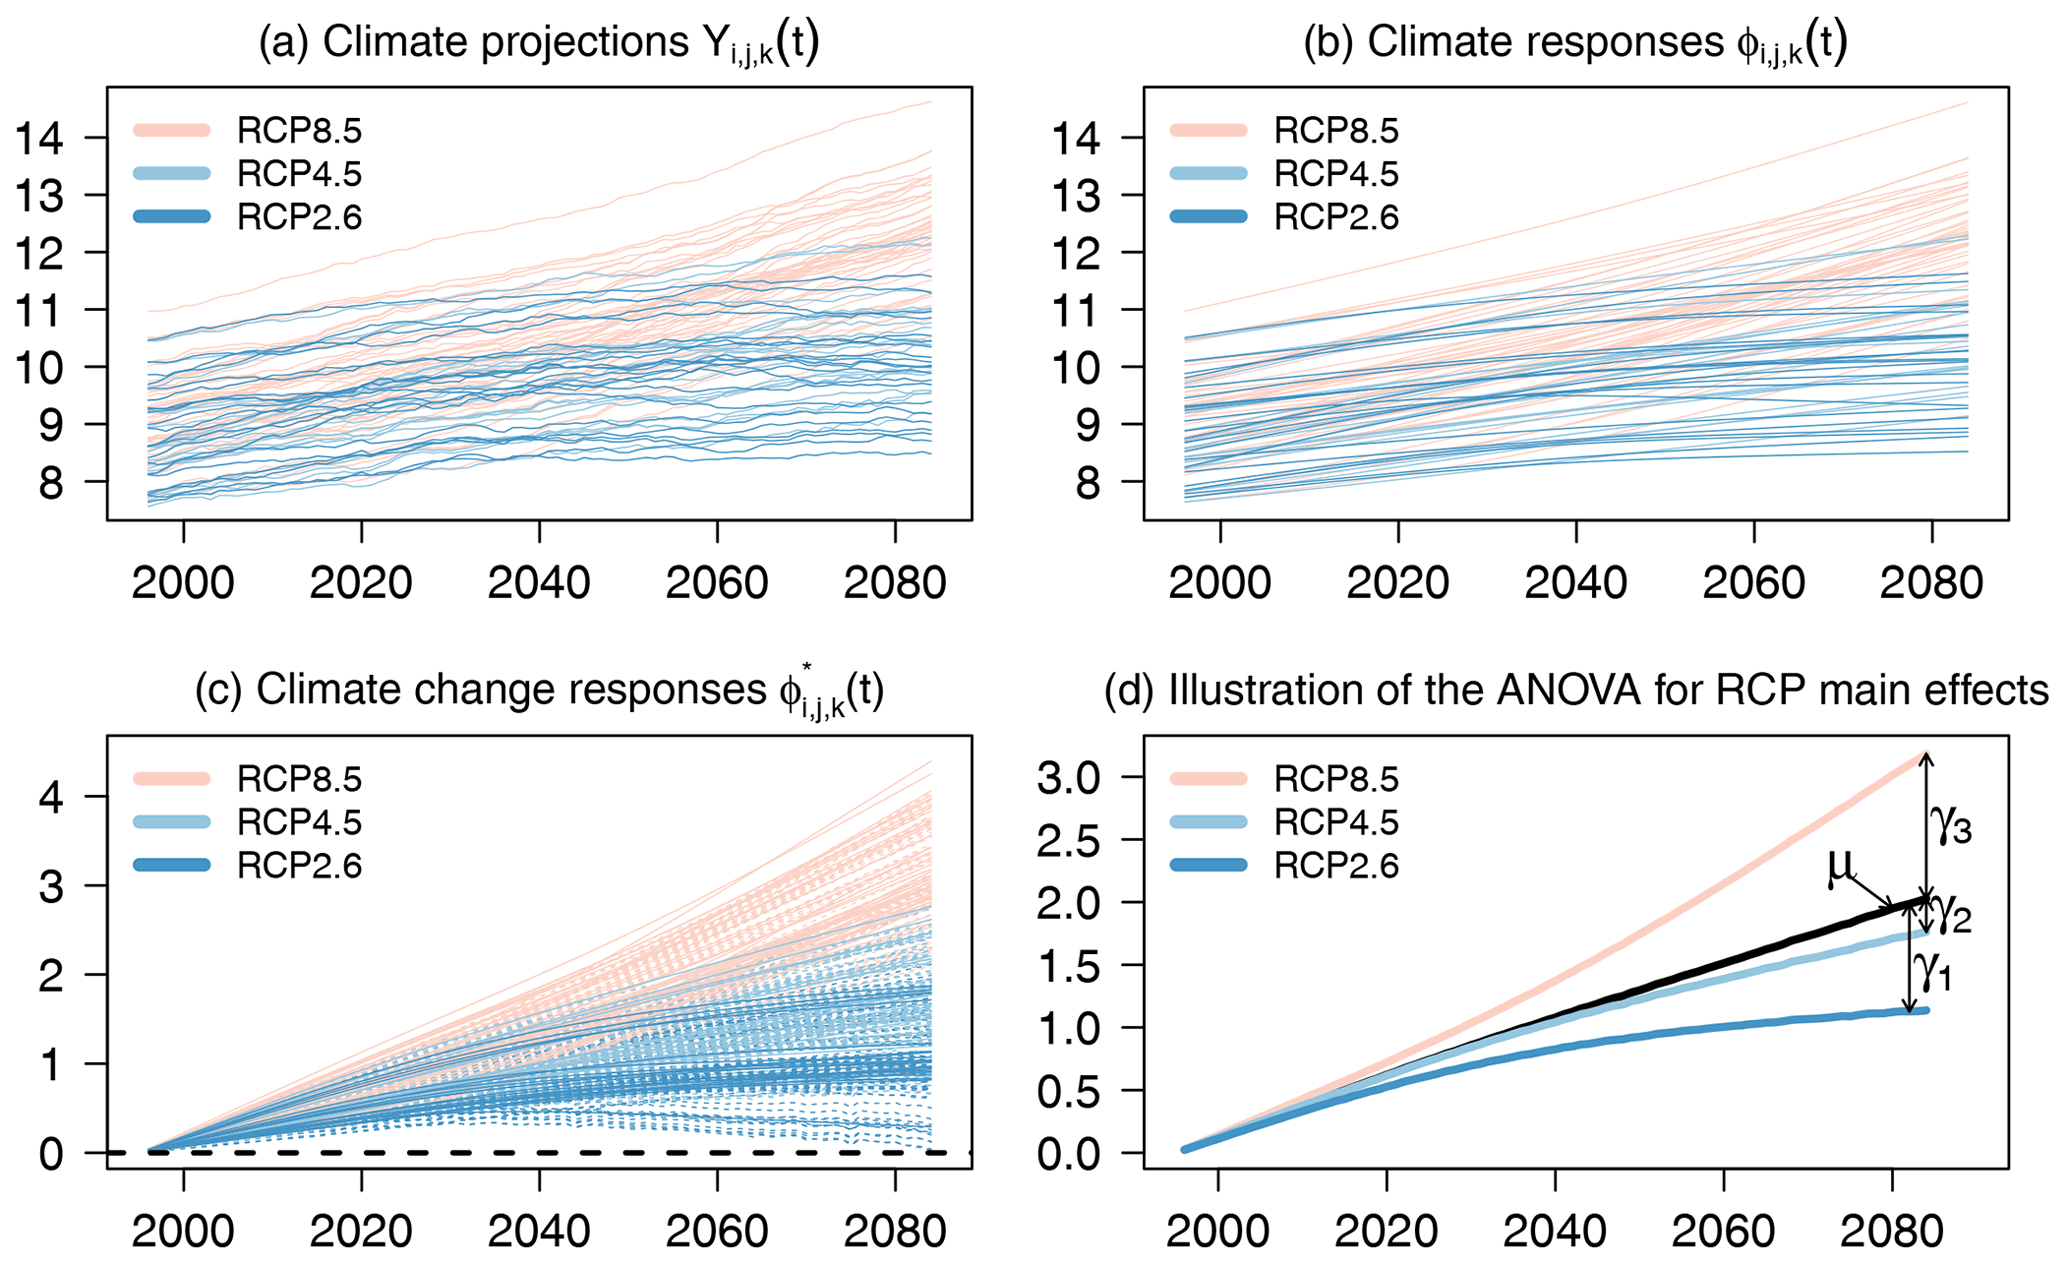
Figure 1Illustration of the QUALYPSO approach for the MME corresponding to the Mediterranean region (see MED region in Fig. 2 below) in winter for 30-year averages of temperature (∘C). (a) “Raw” climate projections . (b) Climate responses . (c) Available climate change responses (plain lines) and illustration of missing climate change responses (dashed lines). (d) Illustration of the ANOVA for RCP main effects. The main RCP effects γ1(t), γ2(t), and γ3(t) represent the deviations from the ensemble mean climate change response μ(t) for the emission scenarios RCP8.5, RCP4.5, and RCP2.6, respectively. The dispersion (variance) between γ1(t), γ2(t), and γ3(t) provides an estimate of the scenario uncertainty.
In addition, QUALYPSO provides, for the MME considered, estimates of different quantities, among which are the following.
-
BMk (balanced mean change response). The “balanced” mean climate change response for each RCP scenario k (“long-term” anthropogenic signal) is the sum of the balanced mean change response of the whole MME, , and the main effect of that scenario k, (see Eq. S3 in the Supplement).
-
Balanced total variance. The total variance in projections for the whole ensemble is the sum of the variances corresponding to scenario uncertainty, GCM and RCM uncertainties, RCM–GCM, RCM–RCP, and GCM–RCP interaction uncertainties, residual variability, and internal variability; see Eq. (S4) in the Supplement.
-
BU (balanced uncertainty). The scenario-excluded uncertainty is the standard deviation of the total variance without the uncertainty associated with the scenario (see Eq. S9 in the Supplement) and is the same for the three scenarios (see Sect. 8 for further discussion of this limitation).
-
Lastly, the relative contribution of the different uncertainty sources to the total variance and the contribution of each individual GCM (RCM) to the GCM (RCM) uncertainty are provided.
For each scenario, the balanced mean change response obtained from QUALYPSO, BMk, results from a proper treatment of missing RCP–GCM–RCM combinations and can be opposed to the direct estimate of the mean change response Mk taken as the direct average of the raw climate change responses (anomalies between future and reference periods).
The QUALYPSO approach is accessible through the R package QUALYPSO available at the CRAN repository at https://CRAN.R-project.org/package=QUALYPSO (last access: 17 December 2021). The package includes functions that implement the different steps described above, process the outputs, and provide a suite of plotting tools. A detailed description of the package and its features is available in its accompanying documentation.
In the following, we quantify mean changes and uncertainty sources for each grid cell of the EURO-CORDEX domain. Applications are done on 30-year moving averages of mean temperature and total precipitation aggregated for the summer (JJA) and winter (DJF) seasons. In this study, internal variability can thus be interpreted as the low-frequency variability of the climate. It does not include the high-frequency interannual variability. In addition, we assess the “significance” of changes for each RCP scenario k by comparing the mean climate change response BMk to the scenario-excluded uncertainty BU. The term significance should not be interpreted here as a result of a proper statistical test. However, an absolute BM ratio greater than 1 indicates a certain level of consistency between the climate models so that the signal provided by the estimated mean climate change response BMk is considered clear enough to be interpreted (see, e.g., Christensen et al., 2019; Matte et al., 2019). In addition, 90 % Gaussian confidence intervals are used as a descriptive tool (i.e., intervals are shown: ]). Finally, it must be noted that the scenario-excluded uncertainty BU includes the natural and irreducible climate variability (internal variability) and represents not only the agreement between the climate models.
We first provide a general description of the mean changes and related uncertainties of mean temperature and total precipitation in winter and summer, averaged over three large regions (land and sea points) considered in the IPCC SREX report (Seneviratne et al., 2012), namely northern Europe (NEU), central Europe (CEU), and southern Europe and the Mediterranean (MED) (Fig. 2), with more interpretations being provided in the following sections.
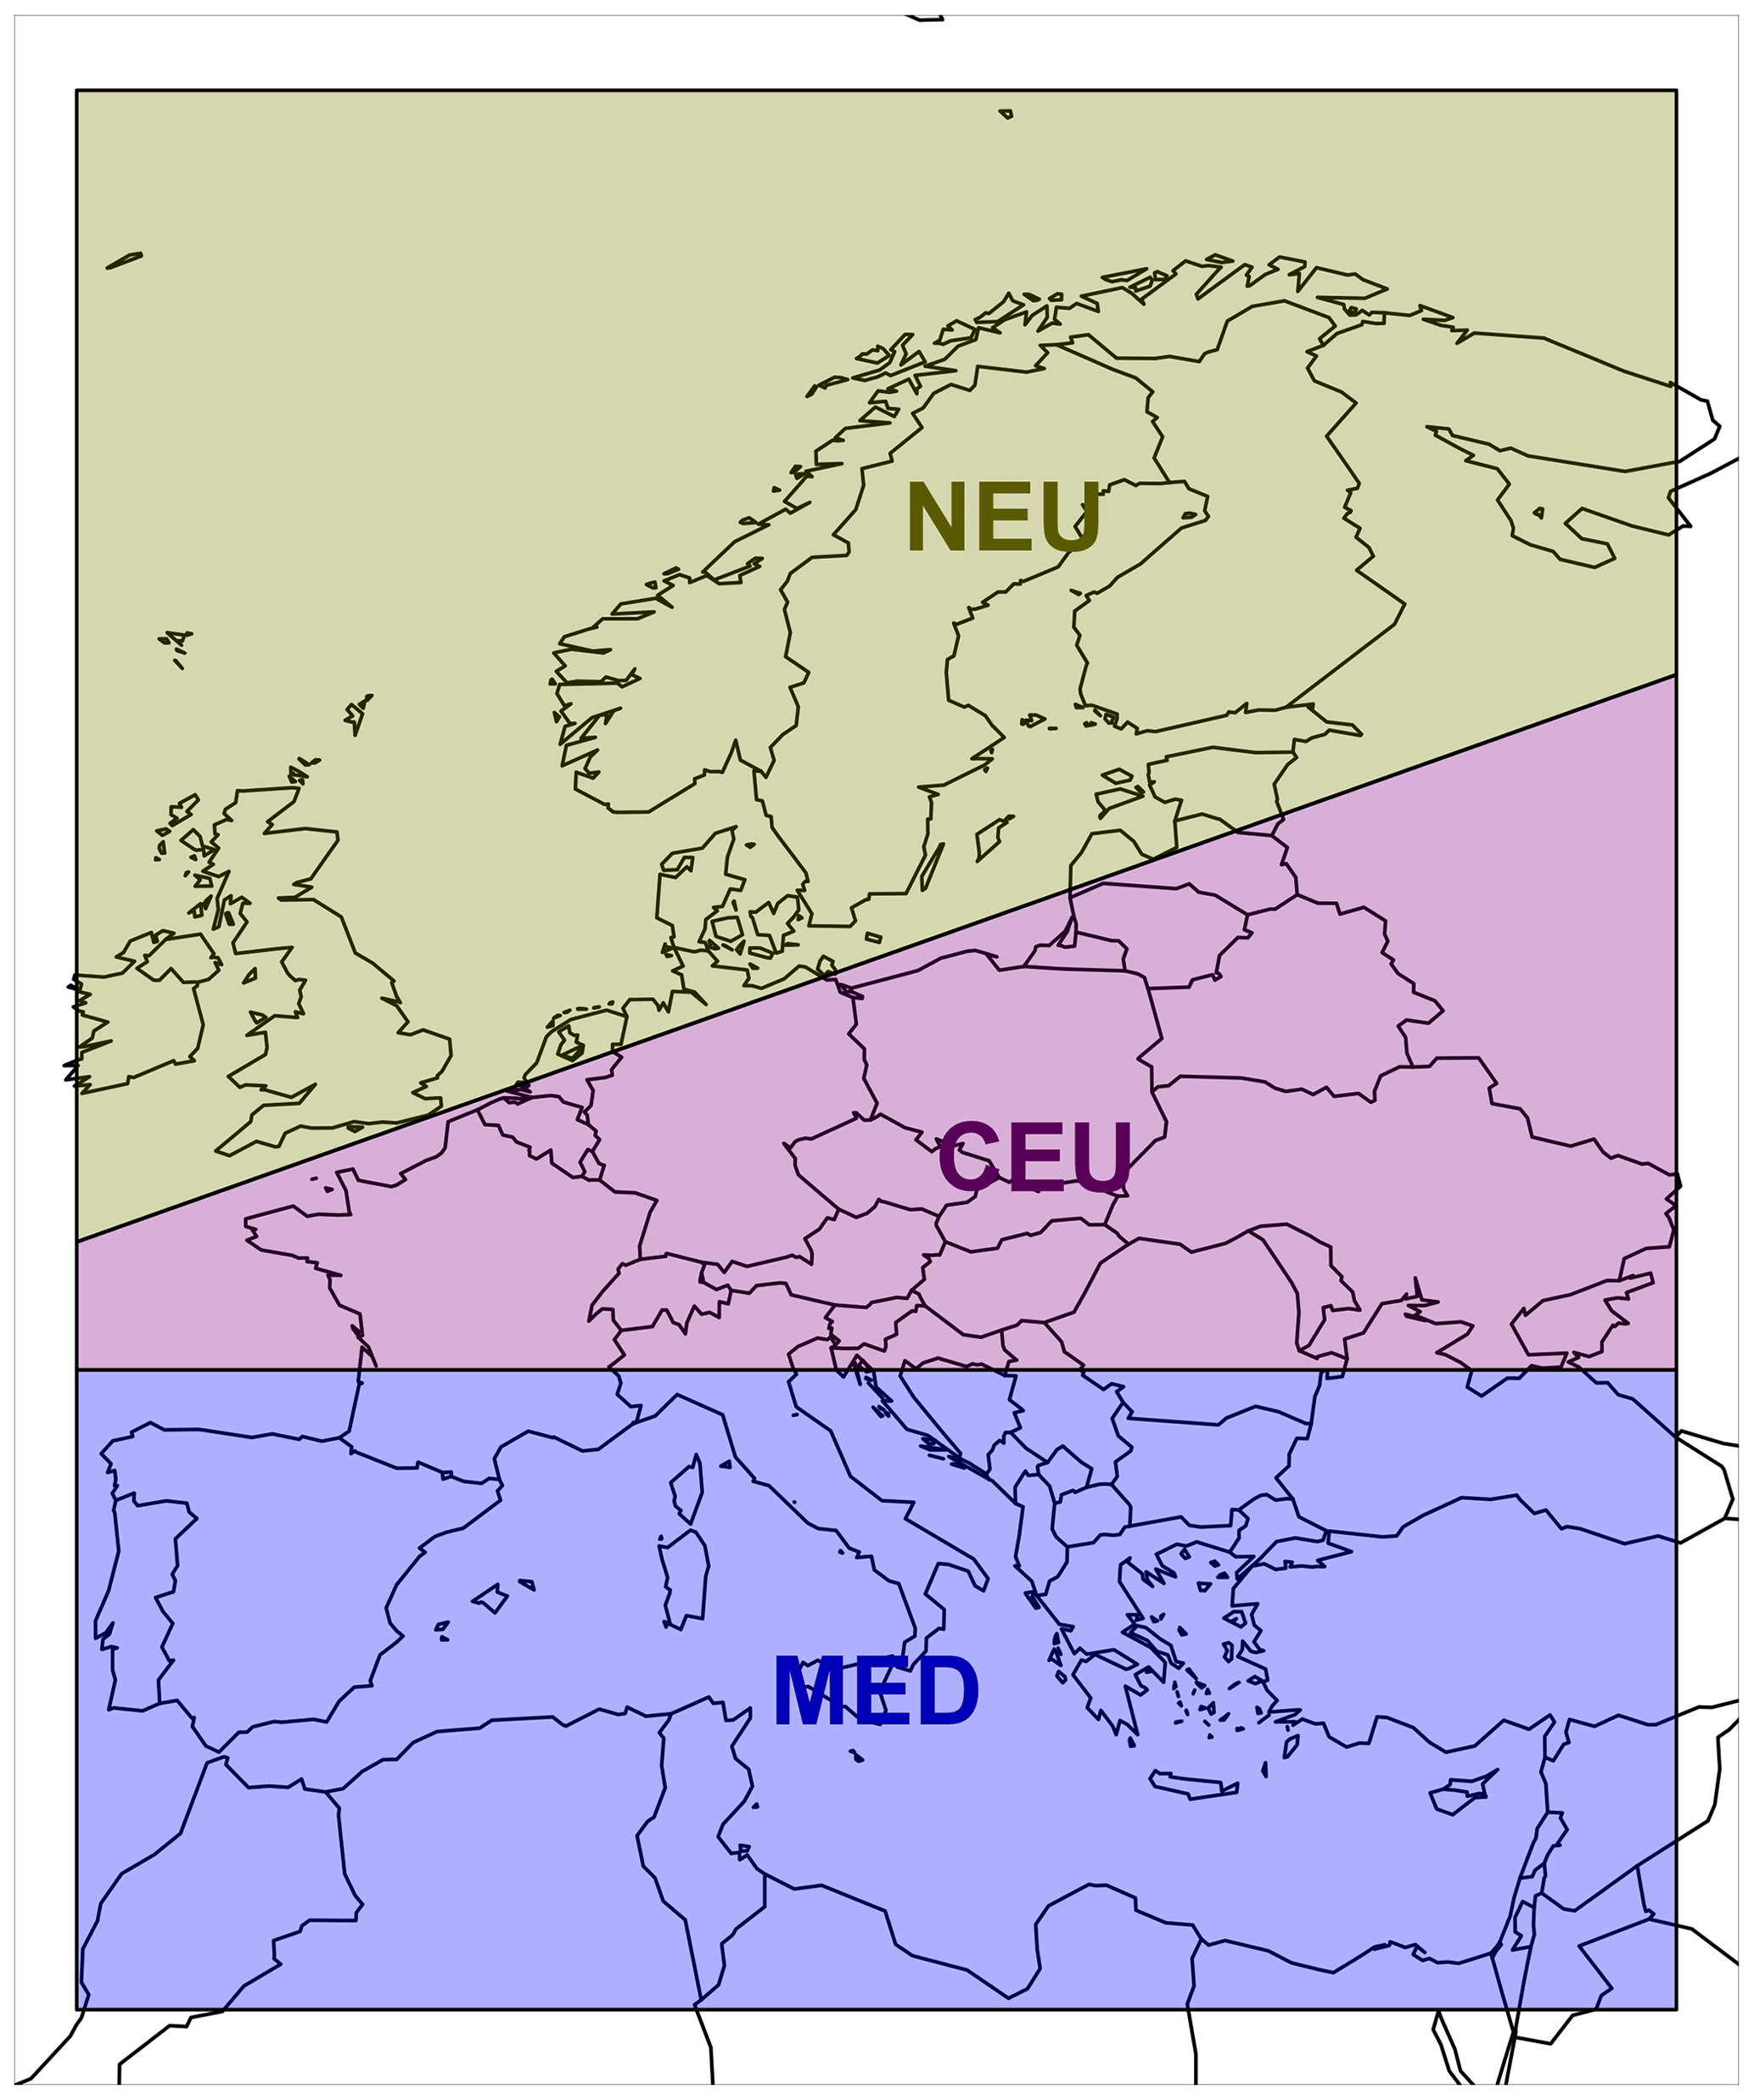
Figure 2Regions considered in the analyses. The three colored regions are taken from the IPCC SREX report (Seneviratne et al., 2012).
Mean changes and related uncertainties are provided in Tables 2–5 for temperature and precipitation changes in winter and summer (respective illustrations are shown in Figs. S2–S4 in the Supplement). For both temperature and precipitation, the largest mean changes are obtained with the scenario RCP8.5. With this scenario, a steady warming is projected throughout the 21st century of up to around 4 ∘C for the last 30-year period (2071–2099) and for both seasons (Tables 2 and 4 and corresponding Figs. S1 and S3). In winter and with the scenario RCP85, NEU and CEU warm substantially more than the MED area, likely due to the Arctic warming amplification and the regional snow–albedo positive feedback. In summer, with the RCP8.5, the projected warming is slightly more intense than in winter for the CEU (by about 0.3 ∘C) and MED regions (by 1.3 ∘C) and more moderate in NEU (by 0.4 ∘C) at the end of the century. For summer precipitation, an important decrease can be noticed in the MED region (mean change of −28 %), with a rather large uncertainty (BU equals 17 %). More comparisons of the mean changes to the corresponding uncertainties are provided in Sect. S3 in the Supplement.
Figure 3 presents the contribution of the different uncertainty components to the total variance as a function of time for the three regions. For winter temperature (tas/DJF), while scenario uncertainty is dominant in the MED and CEU regions at the end of the century (73 % and 66 %, respectively, see Table 2), it is close to the GCM uncertainty in NEU (45 % and 48 % for GCM and RCP uncertainty, respectively). For winter precipitation (pr/DJF), GCM and scenario uncertainties are similar in the MED and NEU regions at the end of the century and exceed RCM uncertainty, especially in the MED region. In NEU and CEU, RCM uncertainty is not negligible and can reach two-thirds of GCM uncertainty. In summer, conclusions are globally similar. However, for summer precipitation (pr/JJA), RCM uncertainty exceeds GCM uncertainty in NEU at the end of the century and contributes 30 % of the total variance in CEU.
For both variables, with internal variability being considered constant over time, its contribution to the total variability dominates during the first decades and rapidly decreases due to the larger variability at the end of the century. This moderate contribution can also be explained by the fact that internal variability is obtained from 30-year averages of seasonal temperature and precipitation values here. A larger contribution of internal variability for smaller temporal aggregation scales is illustrated in Figs. S5 and S6 in the Supplement using 1-year, 10-year, and 30-year aggregation scales for the three SREX regions in winter. At an annual timescale, the contribution of internal variability for relative changes in precipitation in winter is up to 80 % of the total variance in the Mediterranean region in 2100 (Fig. S6). For temperature, the contribution is smaller but reaches 40 % in CEU at an annual timescale in 2100 (Fig. S5).
Except for summer precipitation, the contribution of the different interactions and of the residual variability is moderate, especially for temperature changes. For these cases, the climate change response of each chain is thus adequately represented by a simple additive combination of the main effects (scenario, GCM, and RCM). For summer precipitation, interactions between the GCM and RCM are not negligible, especially in CEU, and RCP–GCM uncertainty is greater than the residual variability in the three regions.
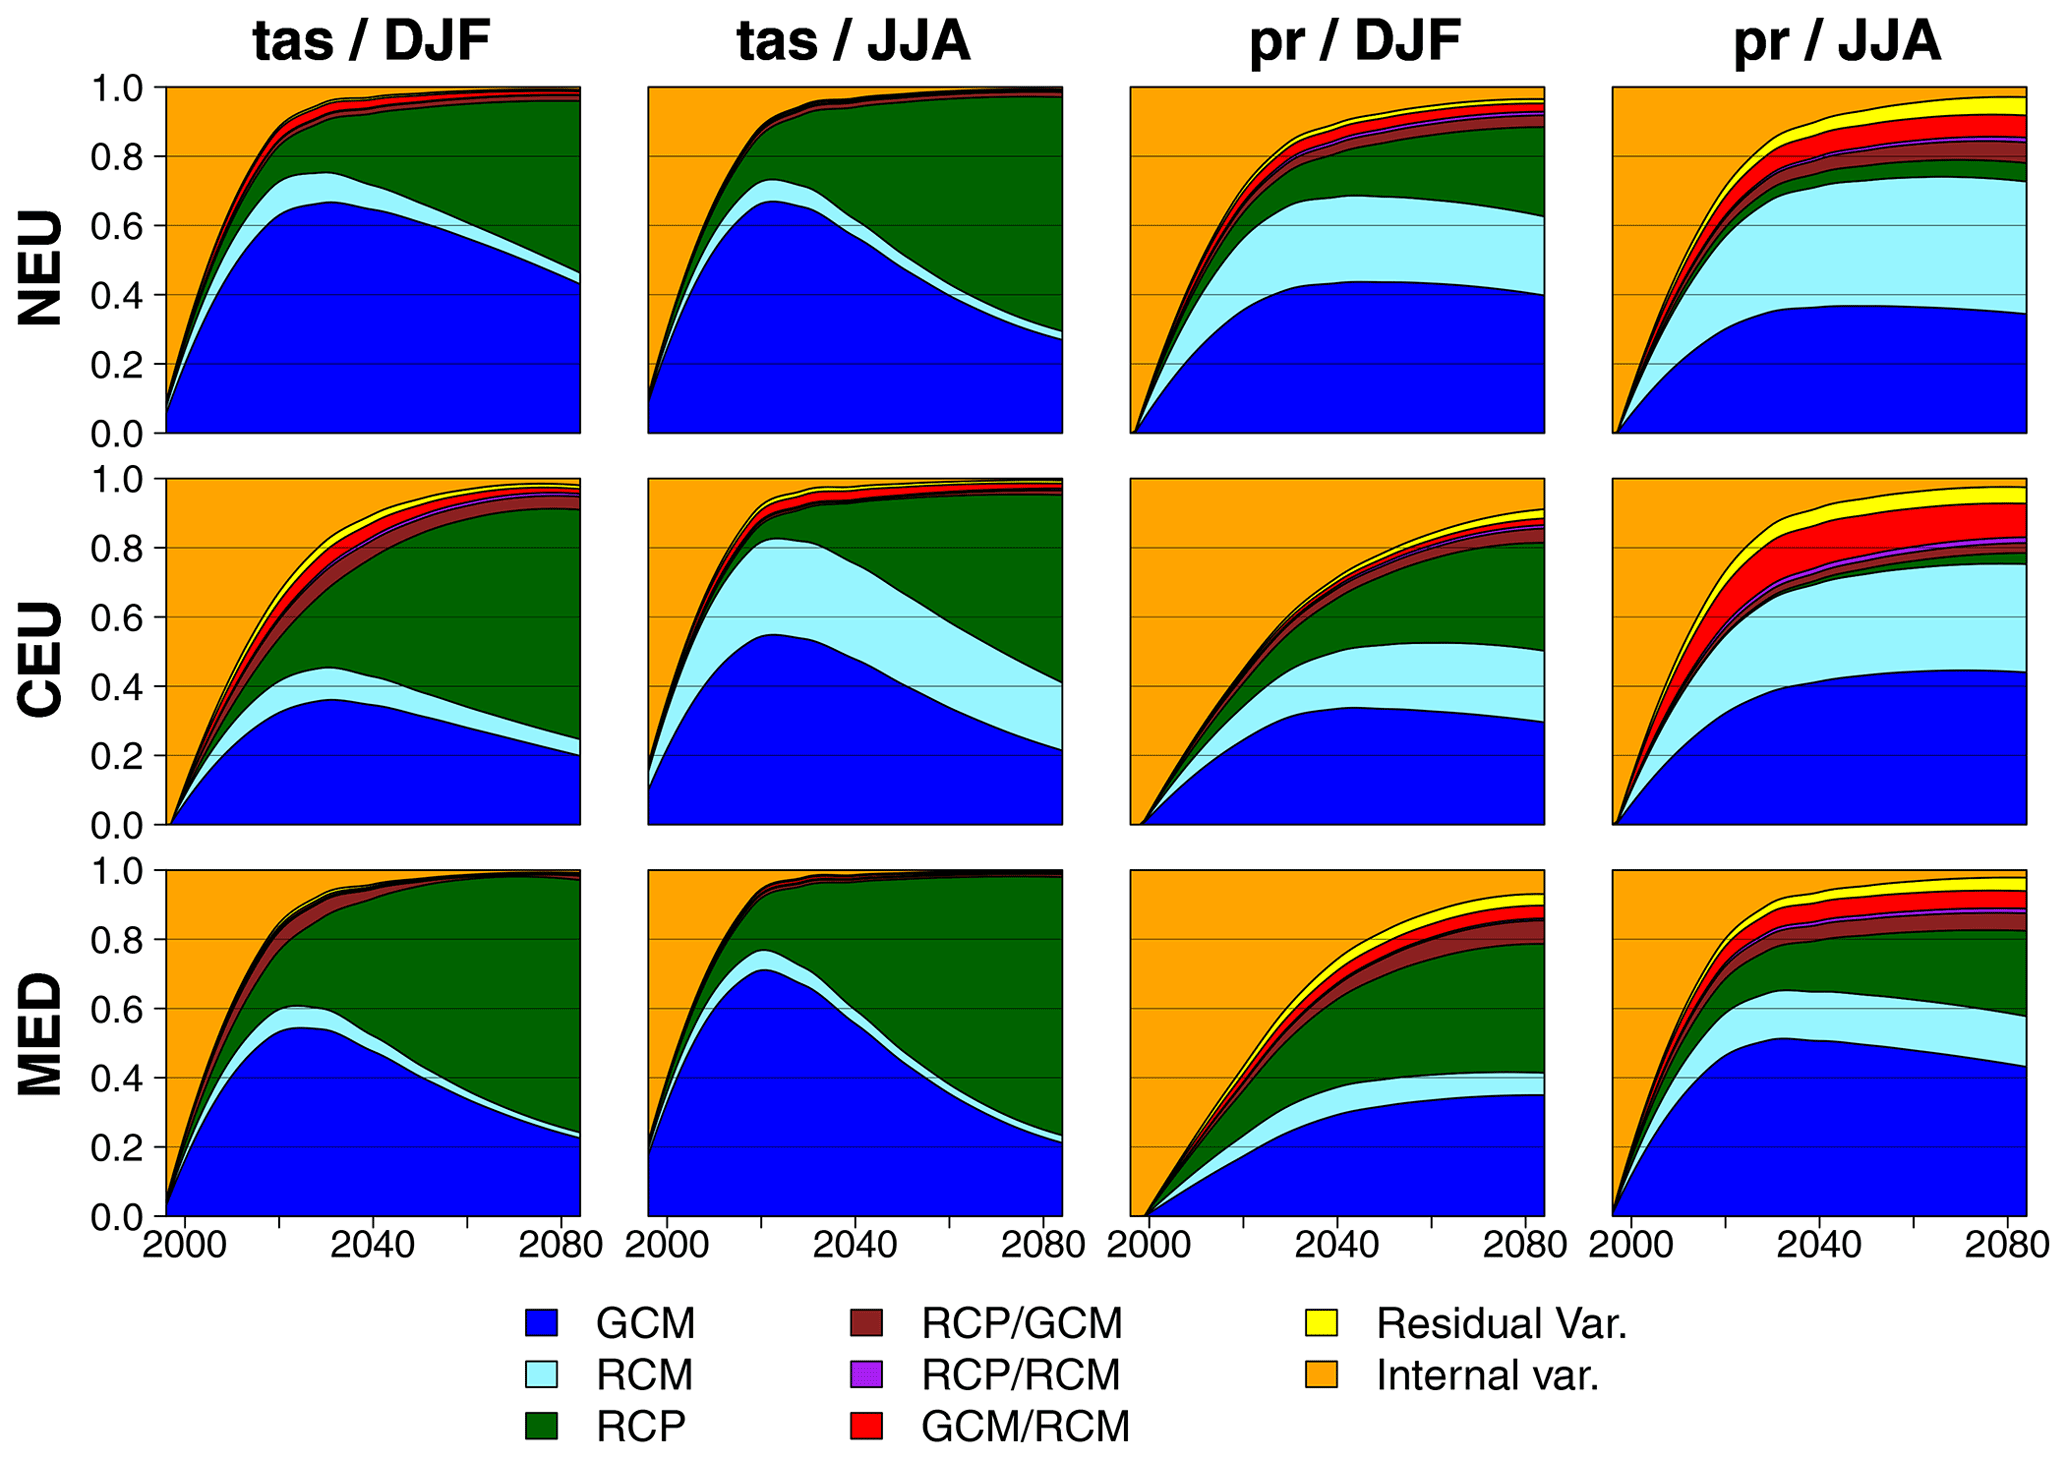
Figure 3Fraction of total variance for absolute changes in mean temperature (tas) and relative changes in total precipitation (pr) in winter (DJF) and summer (JJA) as a function of time compared to the period 1981–2010 for three illustrative regions (see Fig. 2).
Table 2Balanced mean change response BMk for each RCP scenario, scenario-excluded uncertainty BU, and partition of the total variance for three illustrative regions for absolute changes in mean temperature in winter (DJF) for two future periods compared to the period 1981–2010. I1, I2, and I3 refer to RCM–GCM, RCM–RCP, and GCM–RCP interactions, respectively. IV and RV refer to internal and residual variability, respectively. Absolute mean changes greater than the uncertainty () are indicated in bold font. 90 % confidence intervals can be obtained with the expression .
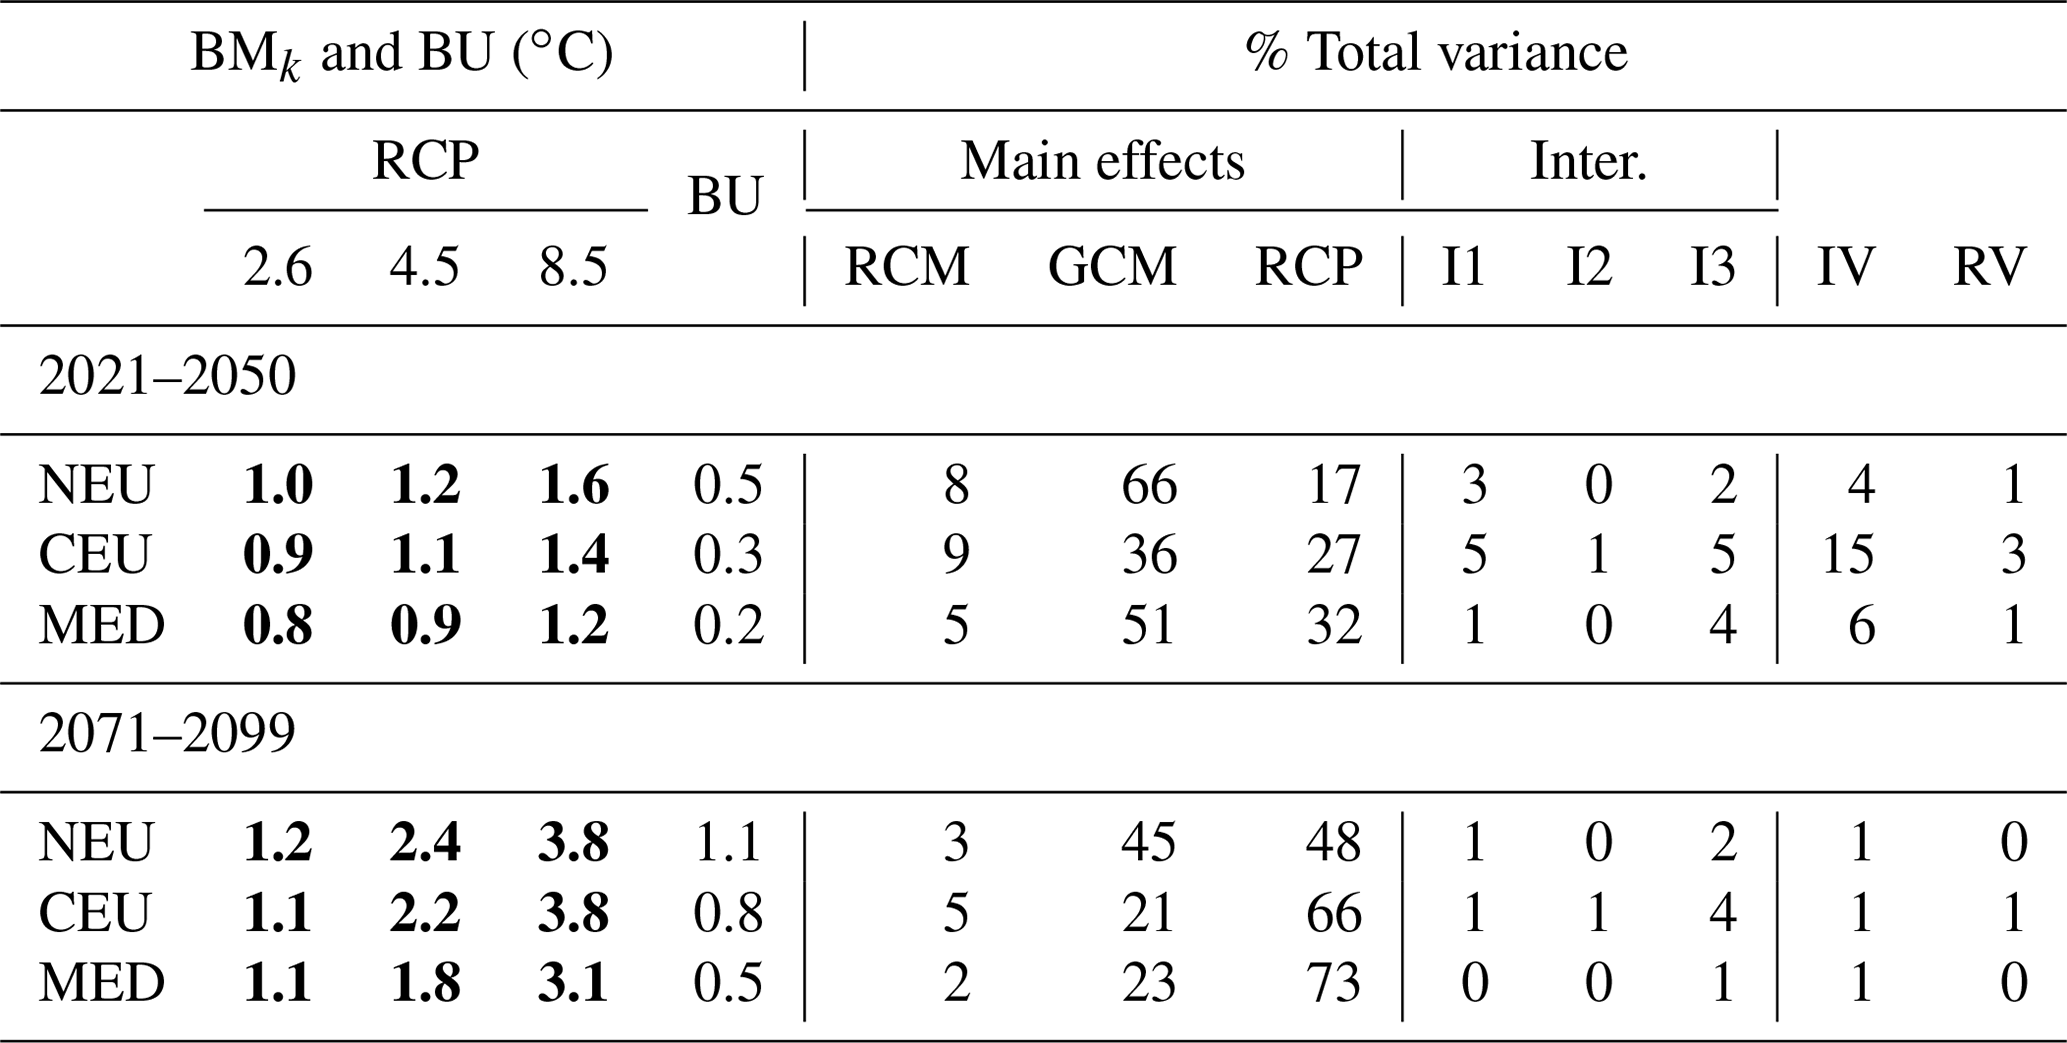
Table 3Same as Table 2 for relative changes in total precipitation in winter (DJF).
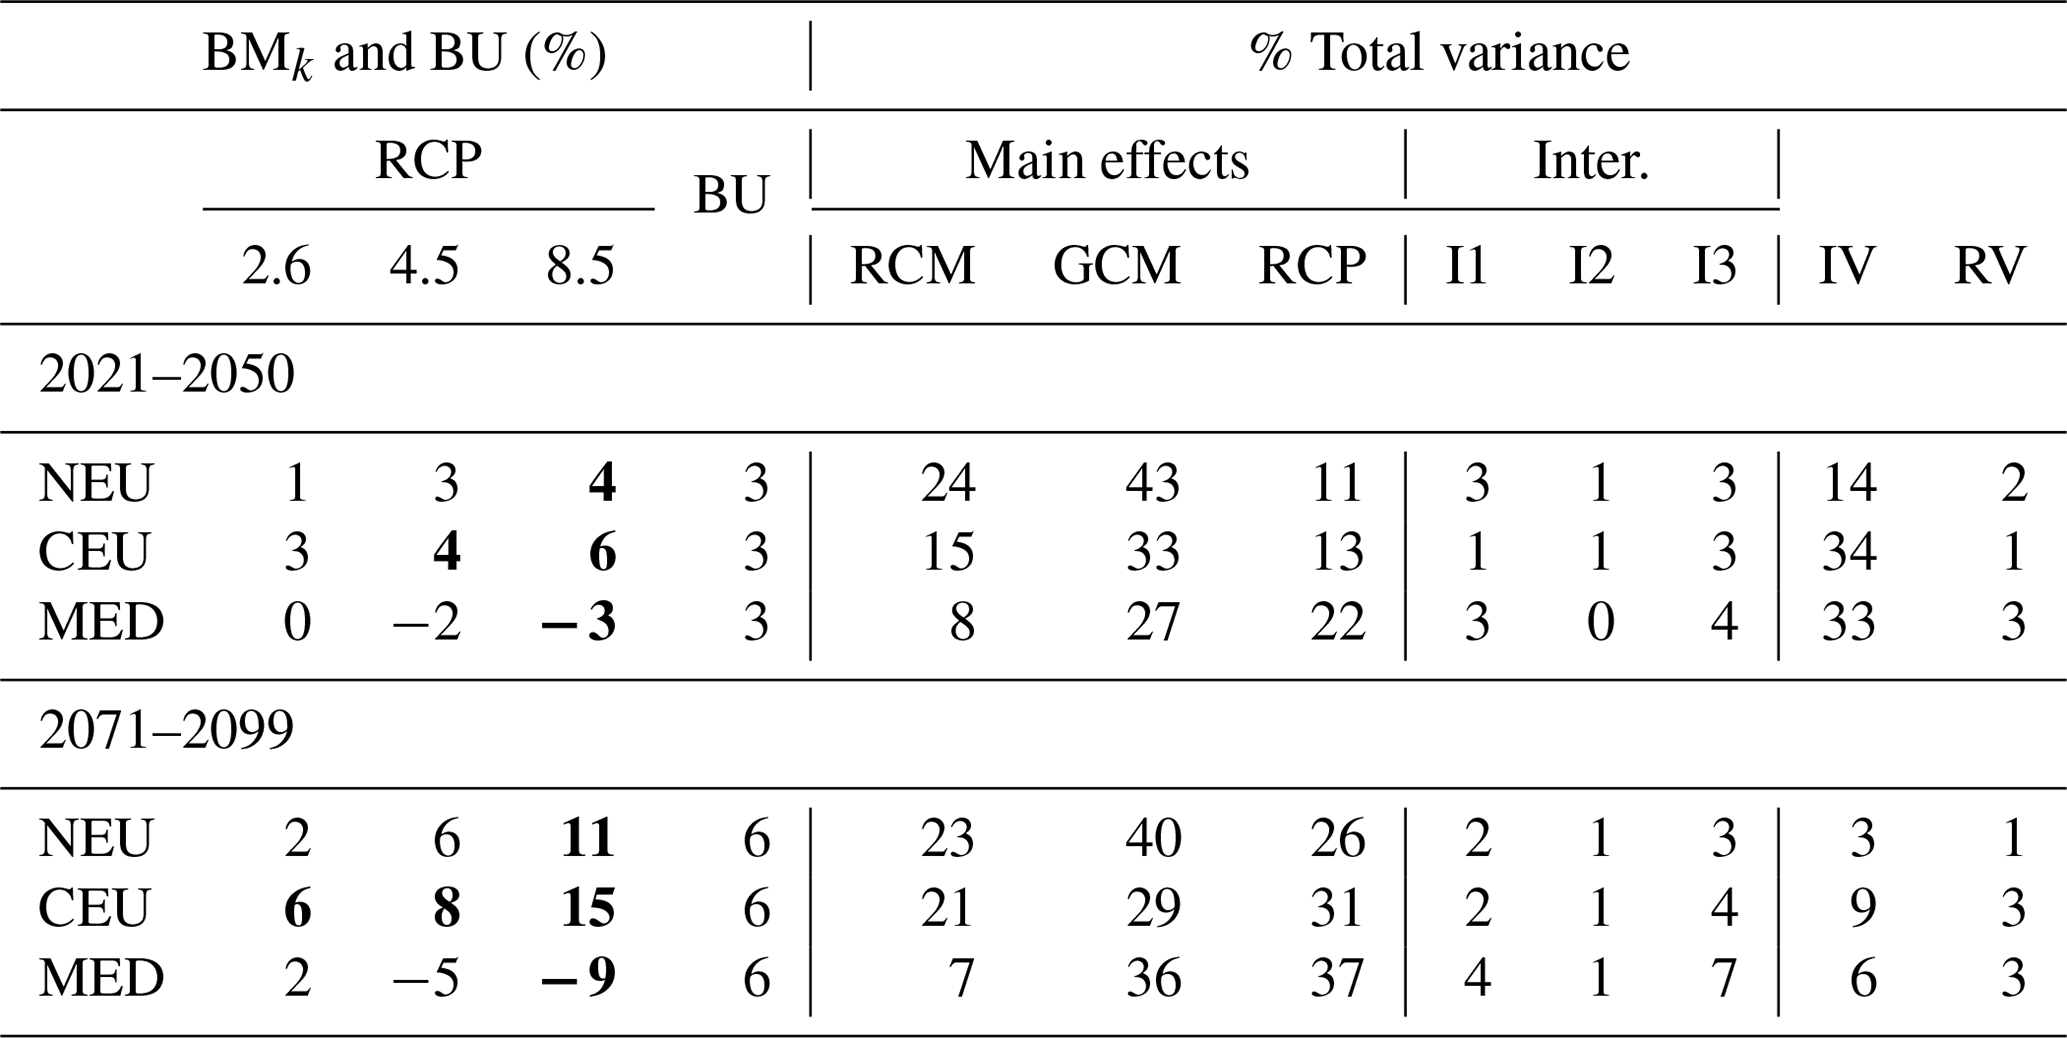
Table 4Same as Table 2 for absolute changes in mean temperature in summer (JJA).
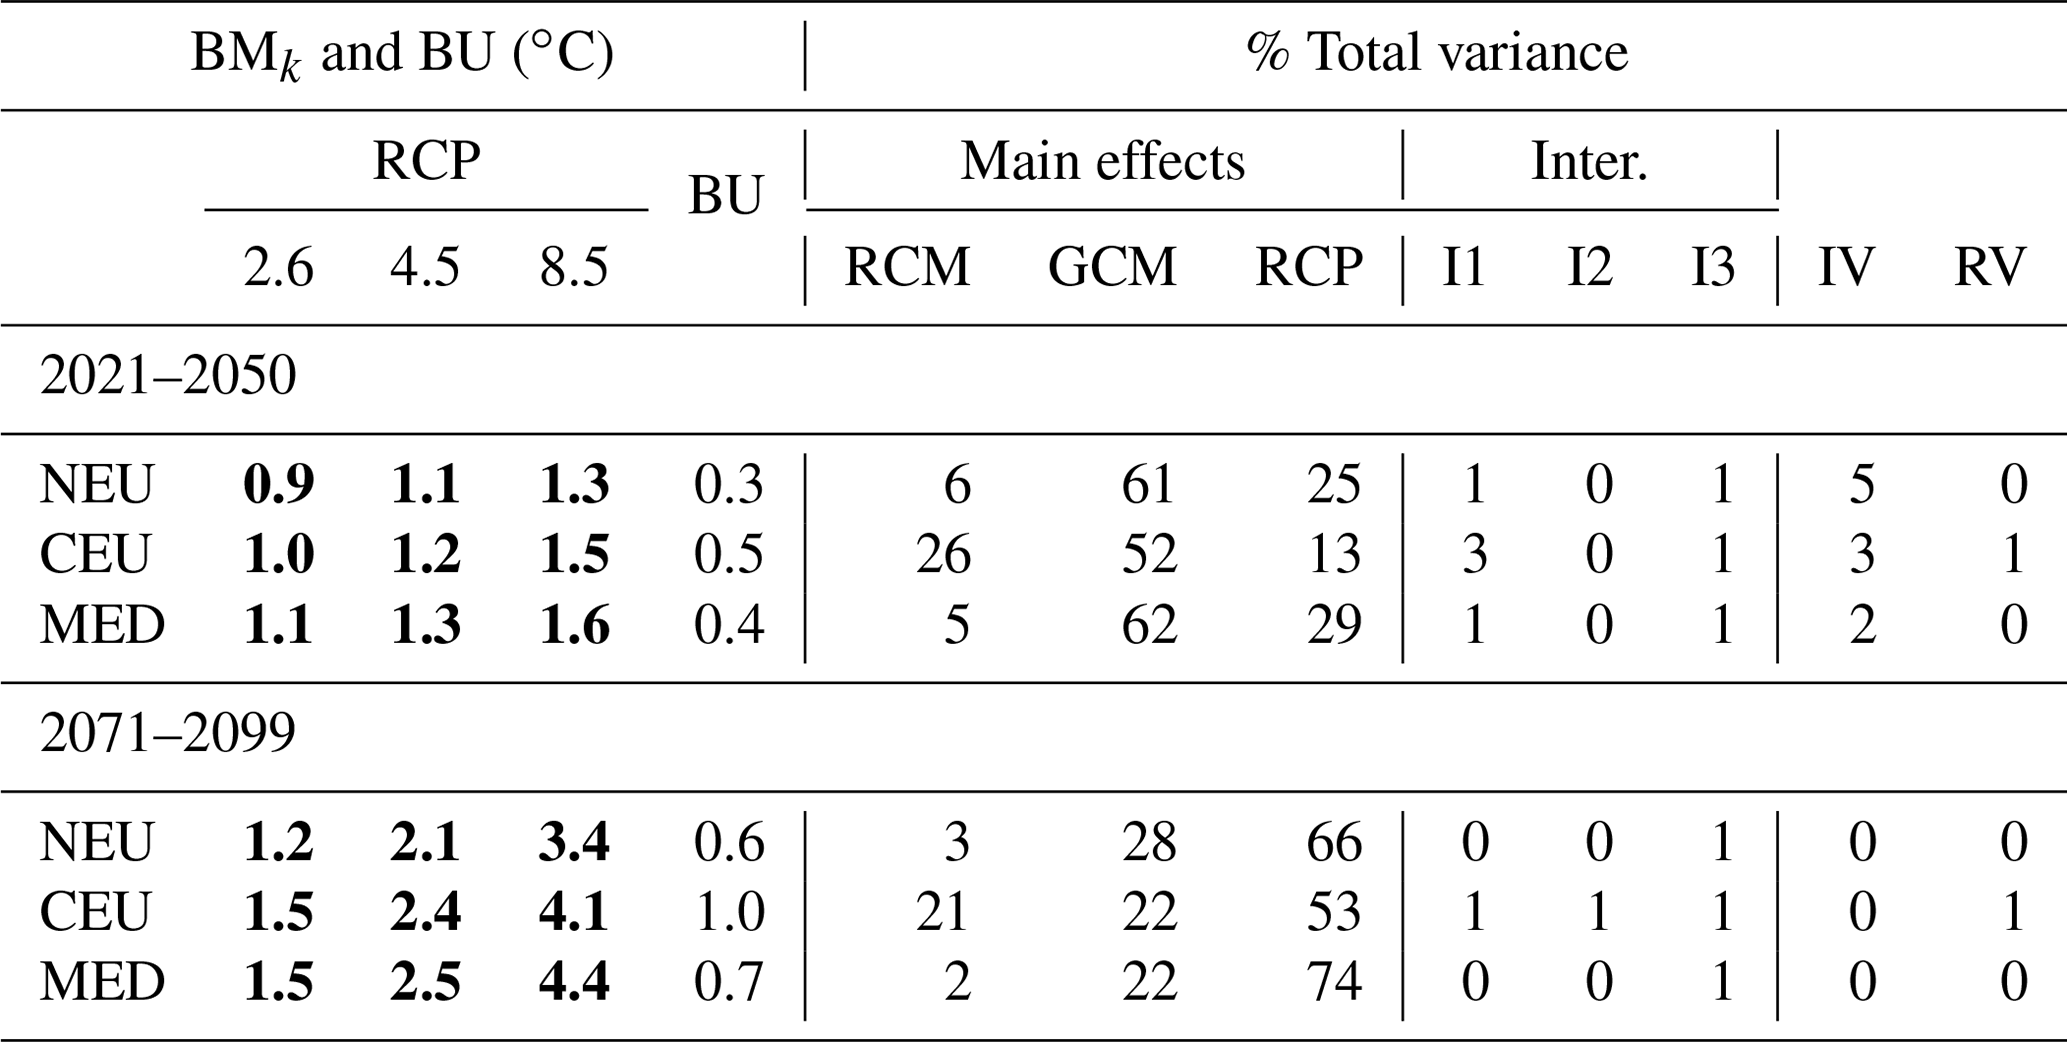
Table 5Same as Table 2 for relative changes in total precipitation in summer (JJA).

Tables S2–S9 in the Supplement provide the same quantitative results for all the countries of the domain for absolute temperature and relative precipitation changes in winter and summer for the near future (2021–2050) and at the end of the century (2071–2099). Tables S10–S17 in the Supplement report the same summary for all capital cities of the domain.
At the scale of the countries, the projected warming for the period 2071–2099 in winter (Table S3 in the Supplement) varies between 0.4 and 1.9 ∘C for RCP2.6, between 1.2 and 3.6 ∘C for RCP4.5, and between 2.2 and 5.7 ∘C for RCP8.5. The largest changes are obtained for Scandinavian countries (Finland, Norway). For most countries, the mean precipitation change in winter at the end of the century (Table S5 in the Supplement) for RCP2.6 is moderate compared to the uncertainty, with the absolute response-to-uncertainty ratio being less than 1. The estimated mean changes are stronger for RCP4.5. For RCP8.5, a clear increase is estimated for countries in northern and central Europe, and a clear decrease is estimated in the south of Europe (e.g., Cyprus, Morocco, Tunisia). The next section will detail the spatial variability of these changes, and in Sect. 6 we comment on the spatial variability of the main contributions to the total variance.
As illustrated by Hawkins and Sutton (2009) and other studies, the relative contributions of the different uncertainty sources depend on the temporal and spatial scales considered for the analysis. Internal variability is, for instance, known to increase at smaller spatial and temporal scales. Here, looking at the precipitation changes in winter in 2071–2099 for the countries (Table S5 in the Supplement) and the capitals (Table S13 in the Supplement), the uncertainty BU increases from 6 % and 10 % for France and Greece, respectively, to 9 % and 16 % for their capitals Paris and Athens, respectively. The same kind of increase can be observed for the internal variability of precipitation changes. For example, for precipitation changes in winter, the square root of the internal variability increases from 2.6 % and 3.3 % for France and Greece to 3.1 % and 4.9 % for Paris and Athens, respectively.
Figures 4 and 5 show the estimated mean climate change response BMk of temperature and precipitation obtained for the periods 2021–2050 and 2071–2099, respectively, for the three RCP scenarios and for both winter and summer seasons. Only areas where the response stands out from the uncertainty () are shown.
For the near future (Fig. 4), as expected, estimated temperature changes are quite similar between the scenarios, with the warming being slightly more intense with the RCP8.5 (between 0.5 and 2 ∘C) than with RCP2.6 and RCP4.5 (between 0 and 1.5 ∘C). For the period 2021–2050, regions where projected precipitation changes are more important than the uncertainty are mostly obtained with the RCP8.5, with an increase between 5 % and 15 % in the north of Europe in winter, a decrease between 5 % and 35 % in Morocco and Algeria in winter, and a decrease between 5 % and 15 % in summer over the west of Europe (Portugal, Ireland).
If we now look at the end of the century (Fig. 5), estimated mean warming varies from 0 to 2 ∘C for RCP2.6, from 2 to 4 ∘C for RCP4.5, and from 4 to 5.5 ∘C for RCP8.5. With the RCP8.5, the strongest increases (by more than 5 ∘C) are in the northeast of Europe (Scandinavia, Russia) in winter and in the south in summer (land areas around the Mediterranean sea). Higher warming rates are noticeable in winter with the RCP8.5 for some mountain ranges (Alps, Pyrenees, Carpathian, Atlas, part of Turkey). In summer, under the RCP8.5 hypothesis, an attenuated warming can be noticed along the coastlines of France, Spain, and southern Mediterranean countries, probably related to sea breezes and the land–sea warming contrast (Dong et al., 2009).
For precipitation, at the end of the century, only mild changes in a few regions can be noticed for the scenario RCP2.6 (e.g., around the Alps in winter). With the RCP4.5, a slight increase (between 5 % and 15 %) is projected in the north of Europe in winter and some decreases are projected for small areas (e.g., around Morocco in winter, in Portugal, north of Spain, west of France, and Turkey in summer). With the RCP2.6 and RCP4.5, estimated changes are thus usually moderate in comparison of the uncertainty. With the RCP8.5, however, and in accordance with Coppola et al. (2020), this well-established bipolar pattern is stronger in both seasons, with an increase in precipitation in the north of Europe (with areas higher than +35 % in winter) and a decrease in the south (with areas lower than −35 % in both seasons). The demarcation between regions with decreasing or increasing precipitation trends (in white) shifts northwards in summer and southwards in winter. In France and in the UK, decreases are thus projected in summer, and increases are projected in winter. We can also notice that the decrease in precipitation in summer with the RCP8.5 scenario over most of the Mediterranean islands (Majorca, Corsica, Sardinia, Sicily, Crete, Rhodos, Cyprus) is stronger than for the surrounding sea areas. This specific local climate change information relevant for the island water resource issue could not be provided by lower-resolution climate models (i.e., GCMs or RCMs at coarser resolutions). It is also worth mentioning the east–west asymmetry for central Italy in the summer precipitation response with the RCP8.5 at the end of the century. This illustrates the possible complex interplay between the fine representation of the topography at 12 km spatial resolution and the large-scale circulation pattern change in setting the local-scale climate change pattern, especially in precipitation (see also the pioneering study by Gao et al., 2006).
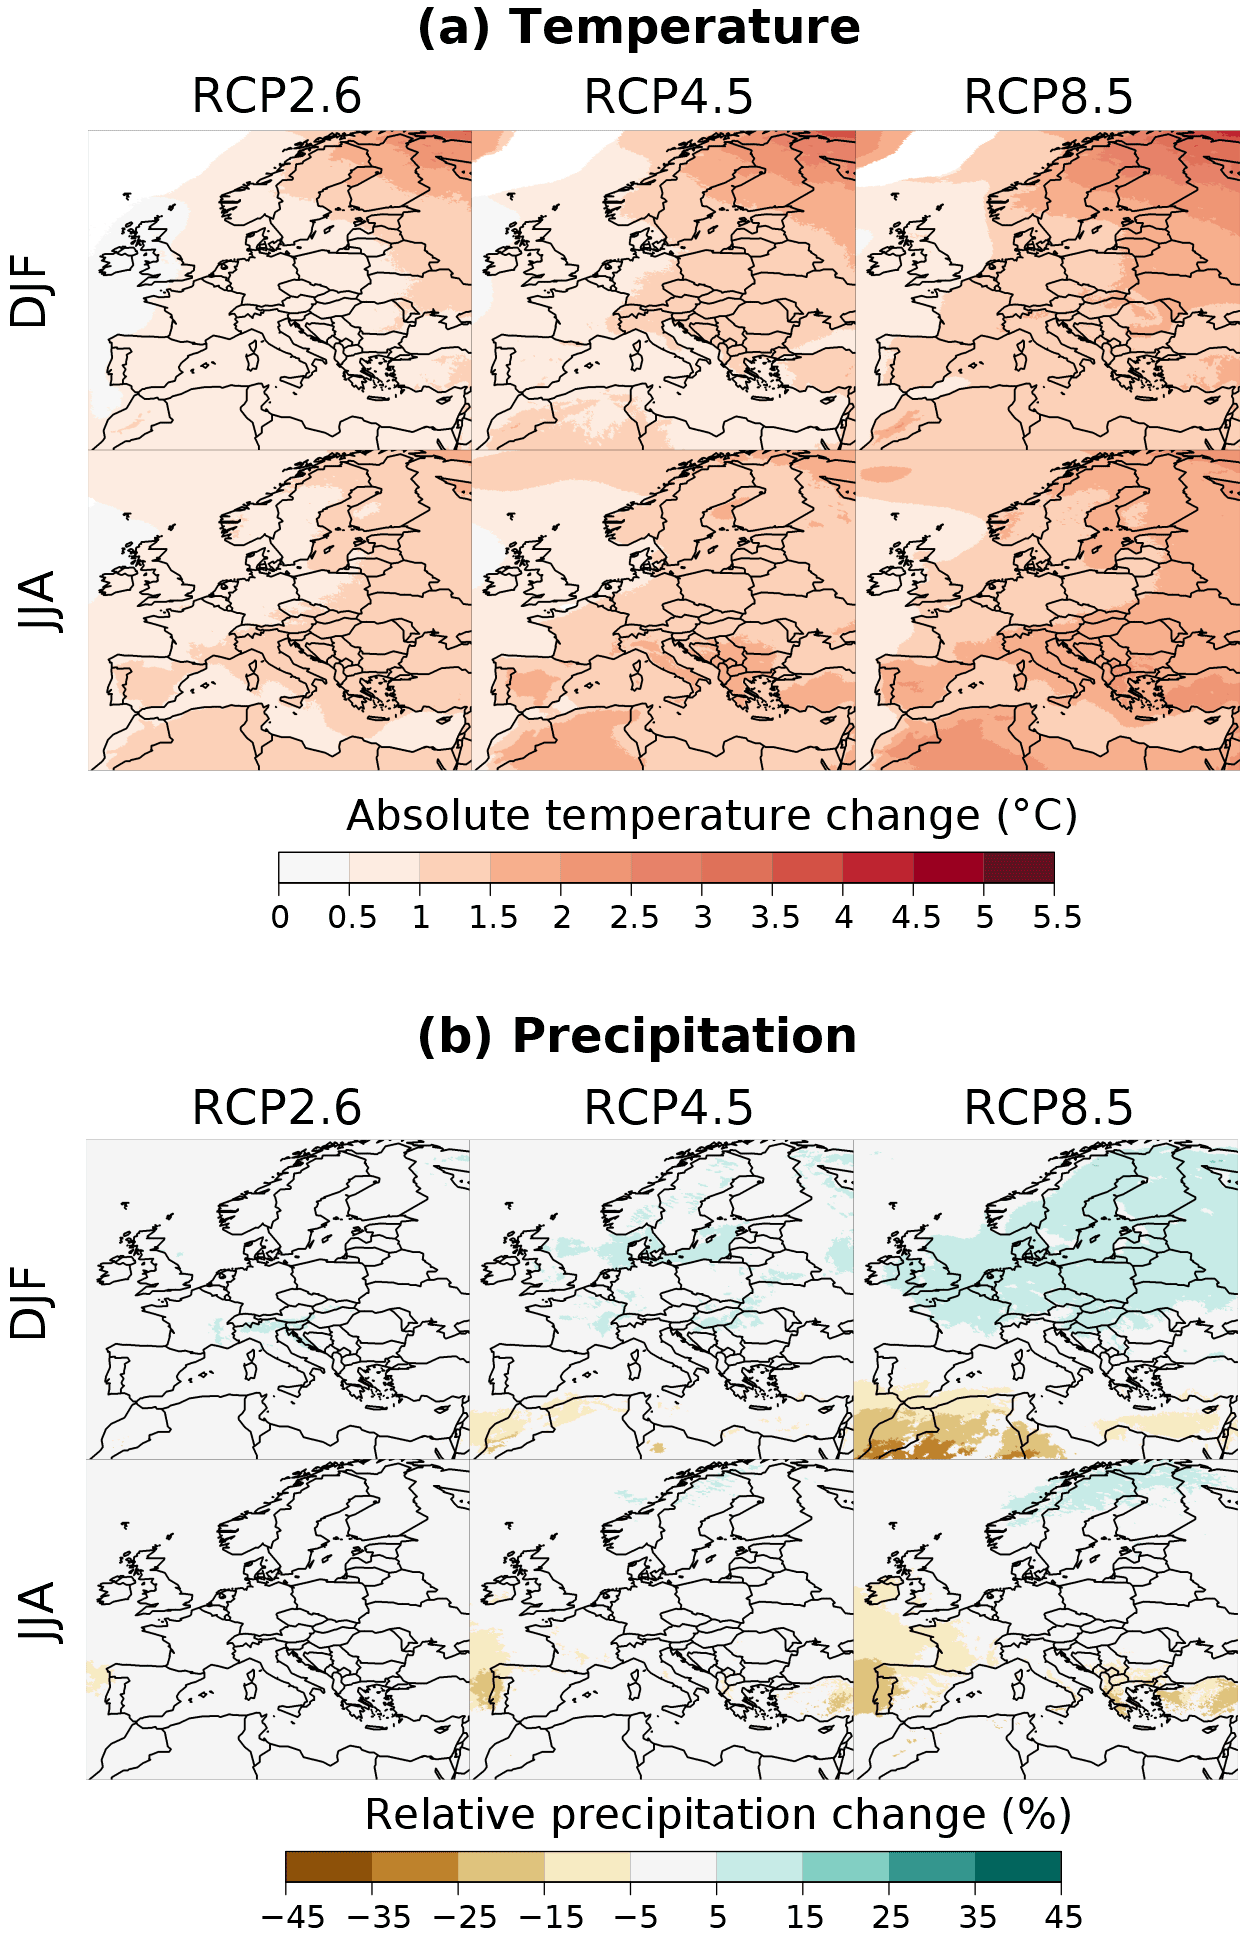
Figure 4Balanced mean climate change response BMk obtained with the different RCP scenarios for the near future (2021–2050) compared to the period 1981–2010 in winter (DJF) and summer (JJA). (a) Absolute changes in temperature. (b) Relative changes in precipitation. Only areas where the absolute response-to-uncertainty ratio is greater than 1 () are shown.
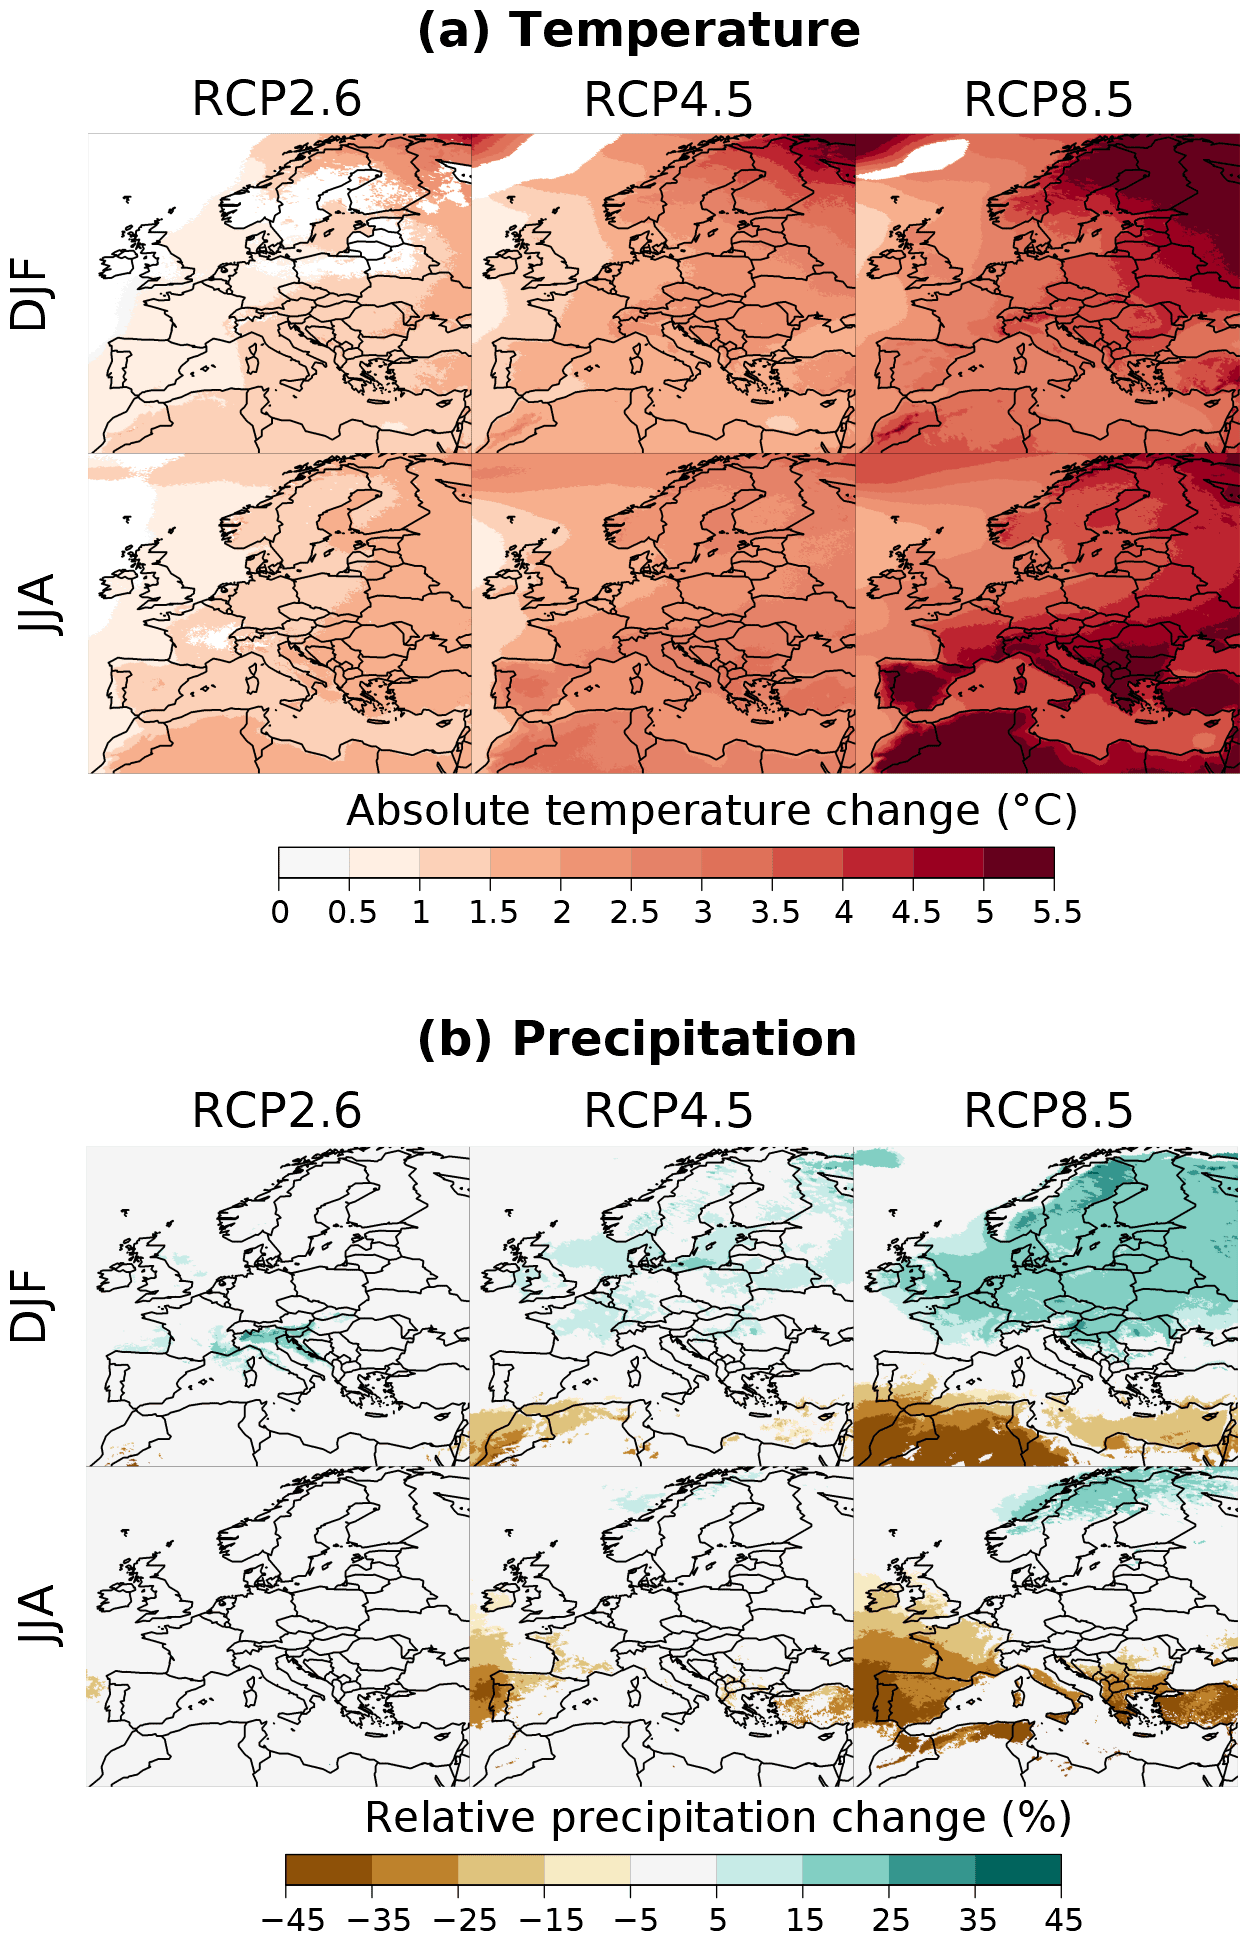
Figure 5Balanced mean climate change response BMk obtained with the different RCP scenarios at the end of the 21st century (2071–2099) compared to the period 1981–2010 in winter (DJF) and summer (JJA). (a) Absolute changes in temperature. (b) Relative changes in precipitation. Only areas where the absolute response-to-uncertainty ratio is greater than 1 () are shown.
Figure 6 presents the scenario-excluded uncertainty BU in projections by the end of the century. For temperature, this uncertainty varies between 0.4 and 2 ∘C. It is larger in the northeast of Europe in winter where it can reach up to 2 ∘C and over the continental part of eastern Europe in summer. Over the sea, the uncertainty is strong in the Norwegian Sea, in the north and east of the Baltic Sea, and in the Aegean and Adriatic seas in summer, pointing out the role of the ocean component of the driving GCMs through the change in sea ice cover and sea surface temperature.
For precipitation, the scenario-excluded uncertainty is less than 15 %–20 % almost everywhere in winter and less than 20 %–25 % in summer. The largest values are obtained in North Africa, the Norwegian Sea, and the Arctic Ocean in winter. In summer, high values are found over the Mediterranean, the Black and Baltic seas, in North Africa, and the Mediterranean climate zones in Italy, France, Spain, Turkey, and the Mediterranean islands.
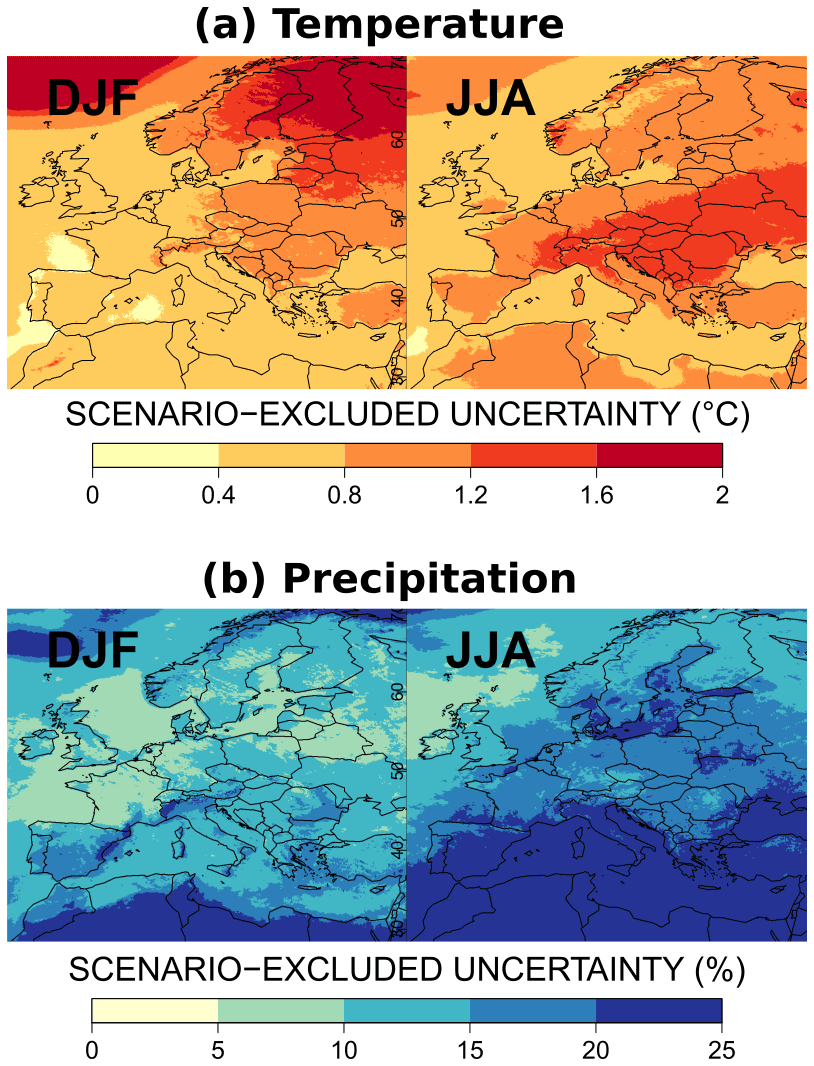
Figure 6Scenario-excluded uncertainty (balanced estimates) BU of the climate change responses at the end of the 21st century (2071–2099) compared to the period 1981–2010. Absolute temperature change (a) and relative precipitation change (b) in winter (DJF) and summer (JJA).
Figure 7 shows the contribution of RCM, GCM, scenario uncertainties, and internal variability to the total variance for the near future (period 2021–2050). For temperature changes, GCM uncertainty is clearly the main contributor for both seasons, with more than 50 % on oceans and seas. The second main contributor is the scenario uncertainty in the west and south of Europe in winter and in the south and north of Europe in summer for 25 % to 50 % of the total variance. RCM uncertainty is also important in summer over central and eastern Europe. In contrast to temperature, for precipitation changes, the contribution of internal variability is large for the near future and exceeds 25 % in many regions, especially in winter. For this temporal horizon, internal variability is therefore an important component. The contributions of GCMs and RCMs exhibit some clear patterns that are even more contrasting at the end of the century (see below).
Figure 8 presents the different contributions to the total variance at the end of the century. For temperature, scenario uncertainty is by far the most important contributor. Its contribution exceeds 50 % almost everywhere, except in the northeast of Europe and over the Norwegian Sea in winter, as well as over central Europe in summer. The other main contribution comes from the GCM uncertainty, which presents a “hot spot” over the Norwegian Sea, especially in winter. If negligible over oceans and seas where they are strongly constrained by the GCM fields, the contribution of the RCM uncertainty can be up to 35 % over some continental areas (central and eastern Europe) in summer (see Table S15 in the Supplement). This enhanced summer role of RCMs is due to the larger contributions of local phenomena (convection) and feedbacks (soil moisture, cloud cover) to summer climate over the continental zones. In winter, it is noticeable that the RCM uncertainty is lower than 25 % and even 10 % everywhere in large areas of the domain. This probably means that, in winter, European climate change in temperature is mostly driven by large-scale advection imposed by the GCMs and the fact that RCMs cannot really diverge from this large-scale influence.
For precipitation changes in 2071–2099, the largest contributions come from GCMs and RCMs in winter, followed by RCP scenarios. GCM uncertainty is by far dominant in the northwest of the domain. It is also very important over the eastern Mediterranean Sea in winter. RCM uncertainty is important in many areas, namely over all continental areas in winter and over almost the whole domain in summer. It is the largest contributor in the UK in winter and in the North Sea in summer. The stronger role of RCMs in the total variance for precipitation, especially in summer, is related to a lower influence of the large-scale circulation imposed by the GCMs as well as a larger role of the RCM physical parameterizations and the RCM soil moisture–atmosphere coupling to determine precipitation responses than for temperature. Scenario uncertainty is non-negligible in winter over a rather large southwest toward northeast band: it reaches 35 % in the northeast of Europe and can be greater than 50 % around Morocco (see Table S13 in the Supplement). Except in some areas, summer precipitation projections are less sensitive to the emission scenario.
At the end of the century, internal variability is small, especially for temperature changes. It only exceeds 10 % for precipitation changes over specific regions (e.g., southwest of Europe in winter, North Africa in summer). As mentioned previously, the internal variability variance and then its relative contribution to the total variance depend on the temporal and spatial aggregation scales considered for the studied variable. As shown in Figs. S1 and S2 in the Supplement, the internal variability relative contribution is much stronger for shorter temporal scales.
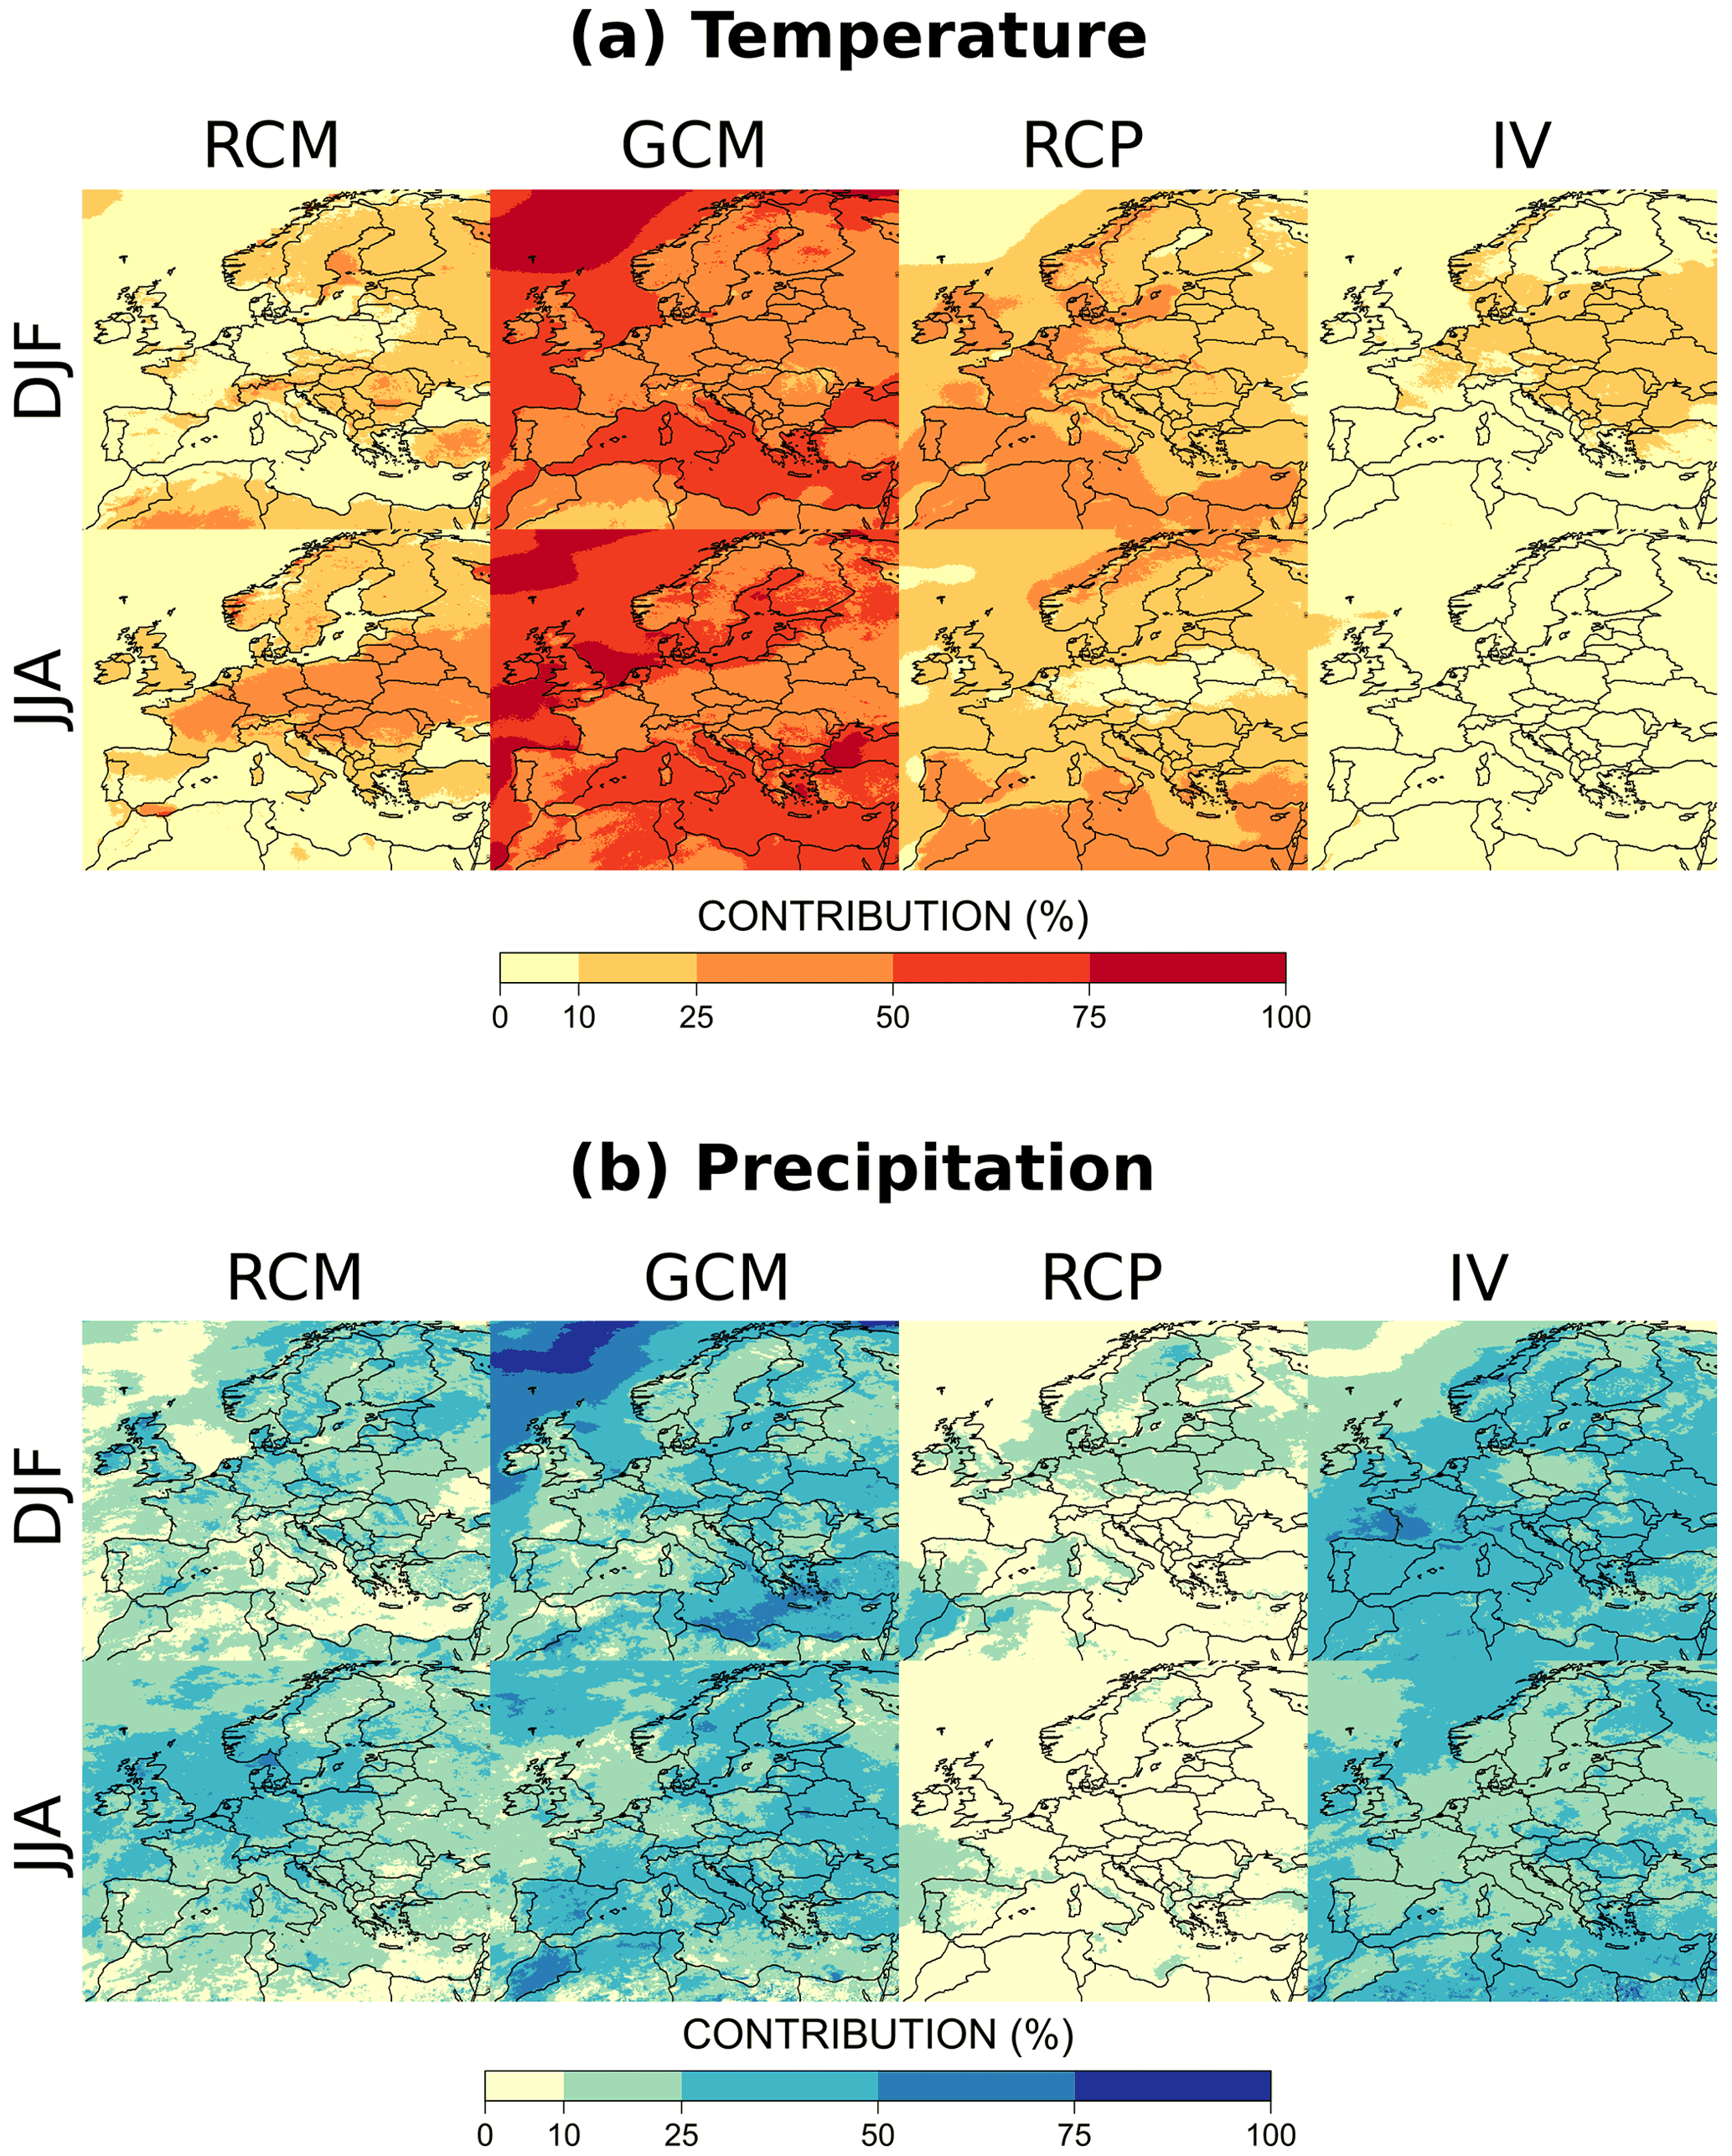
Figure 7Fraction of total variance explained by the main sources of uncertainty: RCM, GCM, RCP scenario, and internal variability (IV) for (a) absolute temperature changes and (b) relative precipitation changes for the near future (2021–2050) compared to the period 1981–2010.
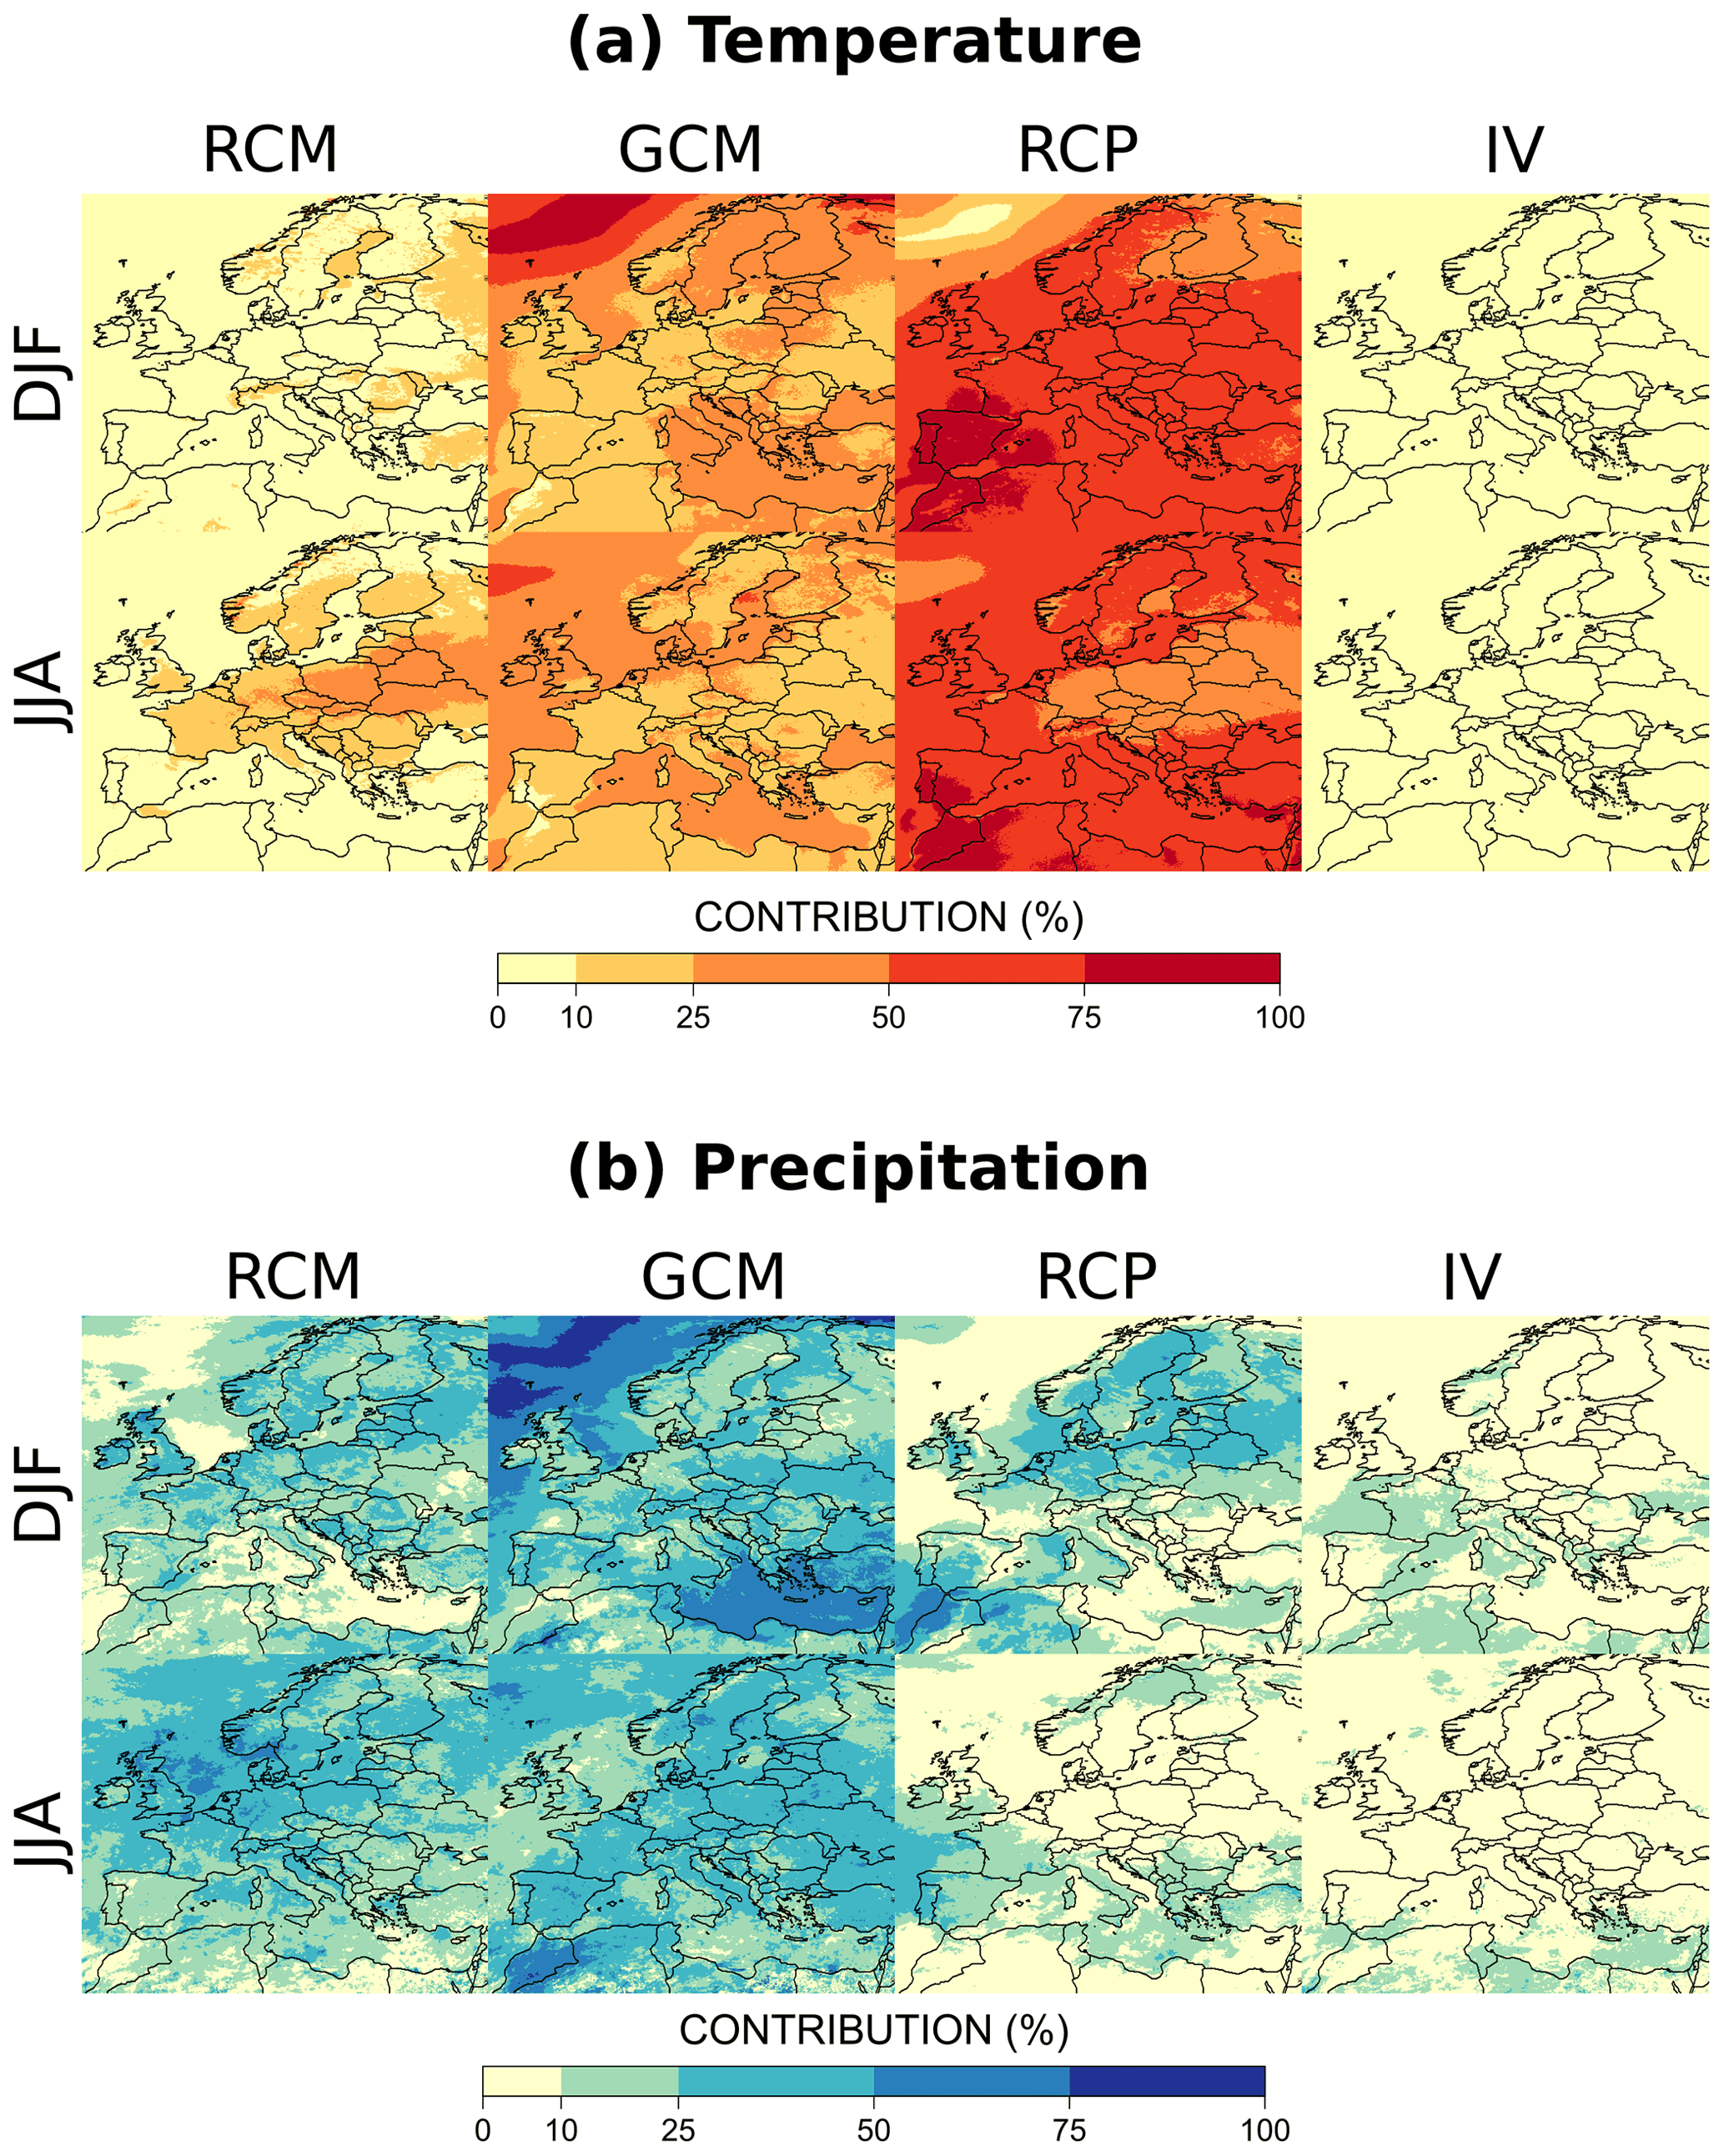
Figure 8Fraction of total variance explained by the main sources of uncertainty: RCM, GCM, RCP scenario, and internal variability (IV) for (a) absolute temperature changes and (b) relative precipitation changes at the end of the 21st century (2071–2099) compared to the period 1981–2010.
Figure S7 in the Supplement further provides the fraction of total variance explained by RCP–GCM, RCP–RCM, and RCM–GCM interactions, as well as residual variability, for temperature and precipitation changes in 2071–2099. These contributions are much smaller than the main sources (RCM, GCM, RCP scenario, and internal variability). Residual variability and uncertainty due to the different interactions are less than 6 % for temperature changes, except in some small areas. For precipitation, moderate interactions (from 15 %–25 %) are found for RCP–GCM interactions in winter in western Europe and northern Italy, as well as for RCM–GCM interactions in summer in southern Europe. Interactions between scenarios and RCMs are negligible, likely because RCP scenarios and RCMs are not directly connected inside the simulation chain. Residual variability is moderate but can contribute more than 25 % in summer in some very dry areas. The main explanation for this result is the numerical instability of relative change estimates due to very low precipitation amounts during the reference period (see discussion in Sect. 8).
In this section, we focus on all GCMs and RCMs individually. For each GCM (RCM), we consider the corresponding effect (the so-called main effect, i.e., the departure from the grand mean change for this specific GCM–RCM, in ∘C or %) and its relative contribution to GCM uncertainty (RCM uncertainty). Note that the main effects of all GCMs (all RCMs) sum to zero, while individual relative contributions of all GCMs (all RCMs) sum to 1. Figure 9 shows the individual contribution of each GCM to GCM uncertainty for temperature changes, as well as the main effect of each GCM, at the end of the century. Clearly, GFDL-ESM2G has a strong influence in both seasons and leads to a lower warming than the others (up to 2.5 ∘C less in winter). In winter, HadGEM2-ES (Morocco, Spain) and IPSL-CM5A-MR (Scandinavia, Turkey) also have important contributions in separate areas. CanESM2 has a strong influence in summer, particularly in the south of Europe. Looking at the corresponding main effects, high discrepancies are obtained between some models. In winter, they can be up to 5 ∘C in northwestern Europe between GFDL-ESM2G and EC-EARTH or IPSL-CM5A-MR. In summer, CanESM2 leads to a much higher warming almost everywhere (up to 2.5 ∘C more than the mean climate change BMk), with this divergence being particularly striking in the south of Europe.
Interpreting the results obtained for individual GCMs is not a simple task. The estimated temperature changes can be related to the climate sensitivity of the models described in the Working Group I contribution to the IPCC's Fifth Assessment Report (WGI AR5 IPCC, 2013). For instance, HadGEM2-ES and CanESM2 were considered to be very sensitive to greenhouse gases, being on the higher part of the CMIP5 range for the values of the transient climate response (TCR) and of the equilibrium climate sensitivity (ECS). As indicated in the last IPCC report (AR6, chap. 7), HadGEM2-ES and CanESM2 have a TCR (ECS) equal to 2.38 ∘C (3.96 ∘C) and 2.37 ∘C (3.71 ∘C): that is to say near the 95 % percentile value of the total CMIP5 TCR or ECS ranges. As RCMs tend to follow their driving GCMs for temperature change, they logically lead to a larger warming over Europe when used as RCM drivers. In contrast, GFDL-ESM2G lies on the lower part of the TCR and ECS IPCC ranges (0.96 and 2.3 ∘C, respectively) and logically leads to a weaker warming in the RCMs driven by it.
For precipitation changes (see Fig. 10), the GCMs CanESM2, CNRM-CM5, IPSL-CM5A-MR, and EC-EARTH show the most important contributions to GCM uncertainty. We recall here that the sum of the GCM (RCM) main effects is equal to zero and that changes shared by all GCMs (RCMs) correspond to the mean change of the ensemble. In winter, in comparison to all the other GCMs, IPSL-CM5A-MR leads to greater winter precipitation changes in northern Europe. For the same season, the wetter EC-EARTH and the drier GFDL-ESM2G and MIROC5 GCMs lead to a hot spot of uncertainty in the far northwest highlighted in Fig. 8. In summer, CanESM2 simulates much less precipitation than the other GCMs over almost the whole domain. For precipitation changes, the interpretation of individual GCM contributions is more complicated because the GCM global climate sensitivity is not very informative, and the RCMs can diverge more from the climate change pattern of their driving GCM. However, these spatial patterns are globally in line with previous studies (see discussion in Sect. 8).
Similarly, Figs. 11 and 12 present the individual contributions of the different RCMs to RCM uncertainty for temperature and precipitation changes, respectively. For winter temperature, HadREM3-GA7 and REMO warm much more than the other RCMs in the northeast of Europe (up to 2 ∘C more than the average behavior). This feature is compensated for in the ensemble by a more moderate warming provided by ALARO-0 and ALADIN63, both being from the same model family. At a smaller scale, RCA4 shows a striking warming over the Alps and the Carpathians. This explains the large contribution of RCA4 to the RCM uncertainty there and can likely be explained by an abnormal snow cover response to warming as discussed, for example, in Fernández et al. (2019), even though for a different season and temporal horizon.
For summer temperature, HadREM3-GA7 shows a striking feature, being 2.5 ∘C warmer than the multimodel average over the whole of continental Europe. To our knowledge, this model is intercompared here for the first time within the EURO-CORDEX context, and this behavior has not been reported so far in the literature. As a potential explanation, we can only say that HadREM3-GA7 is probably very sensitive to anthropogenic forcings as is HADGEM2-ES, with the Hadley Centre applying a seamless approach across its model hierarchy. In contrast, WRF381P warms less than the other RCMs over western Europe (up to −1.5 ∘C), explaining its strong individual contribution to the RCM uncertainty over the area. Except for RACMO22E, it is also worth mentioning that the RCMs taking into account evolving aerosol forcing along the projection simulations (Gutiérrez et al., 2020) generally warm more that the other RCMs in summer (ALADIN53, ALADIN63, ALARO-0, HadREM3-GA7). This behavior is well-aligned with results obtained by Boé et al. (2020). Indeed, as anthropogenic aerosols are declining during the 21st century, their dimming effect is also decreasing, leading to an increase in surface solar radiation and potentially an enhanced warming with respect to RCMs which do not take this effect into account.
Finally, for temperature changes, many RCMs (ALADIN53 and CCLM4-8-17 in winter, WRF381P and WRF361H for both seasons) show noticeable behaviors over oceanic areas (Baltic Sea, North Atlantic, Mediterranean Sea, the channel), with the corresponding main effects being moderate. This feature is not expected in RCMs as the 2 m temperature over the sea is largely imposed by the driving GCM SST and should be similar in all RCMs driven by the same SST field. For ALADIN53, this is likely the signature of a known issue in the way to force the SST from the driving model.
For winter precipitation (see Fig. 12), WRF361H, HadREM3-GA7, and COSMO-crCLIM produce smaller total precipitation than the other RCMs, respectively, over central–northern Europe, the North Atlantic, and North Africa. In contrast, ALADIN53, ALADIN63, RegCM4-6, and HIRHAM5 show more local spots where projected precipitation amounts are higher than the mean change. For summer precipitation, the influential models are neither the same nor over the same areas. WRF381P has a clear wetter (or less dry) signal than the ensemble over a large part of the domain. In contrast, HadREM3-GA7 is largely drier than the average for the whole of northern Europe as is WRF361H for the North Atlantic part of the domain.
The most influential RCMs are thus easily identified. Locally, one RCM can often explain more than 50 % of the RCM uncertainty range. We can cite, for example, HadREM3-GA7 and WRF381P for summer temperature and precipitation, WRF361H for precipitation in both seasons, and ALADIN53 and RACMO22E more locally for winter temperature. Such high values in the RCM individual contributions may guide future investigations in order to understand those specific model behaviors and to verify if the RCM uncertainty range is not artificially too large due to modeling issues. In contrast, RCA4 seems to be the only RCM that generally weakly influences the ensemble behavior. Its individual contribution is nearly always below 20 % except very locally for the Alps and the Carpathians for winter temperature and the channel for summer temperature.
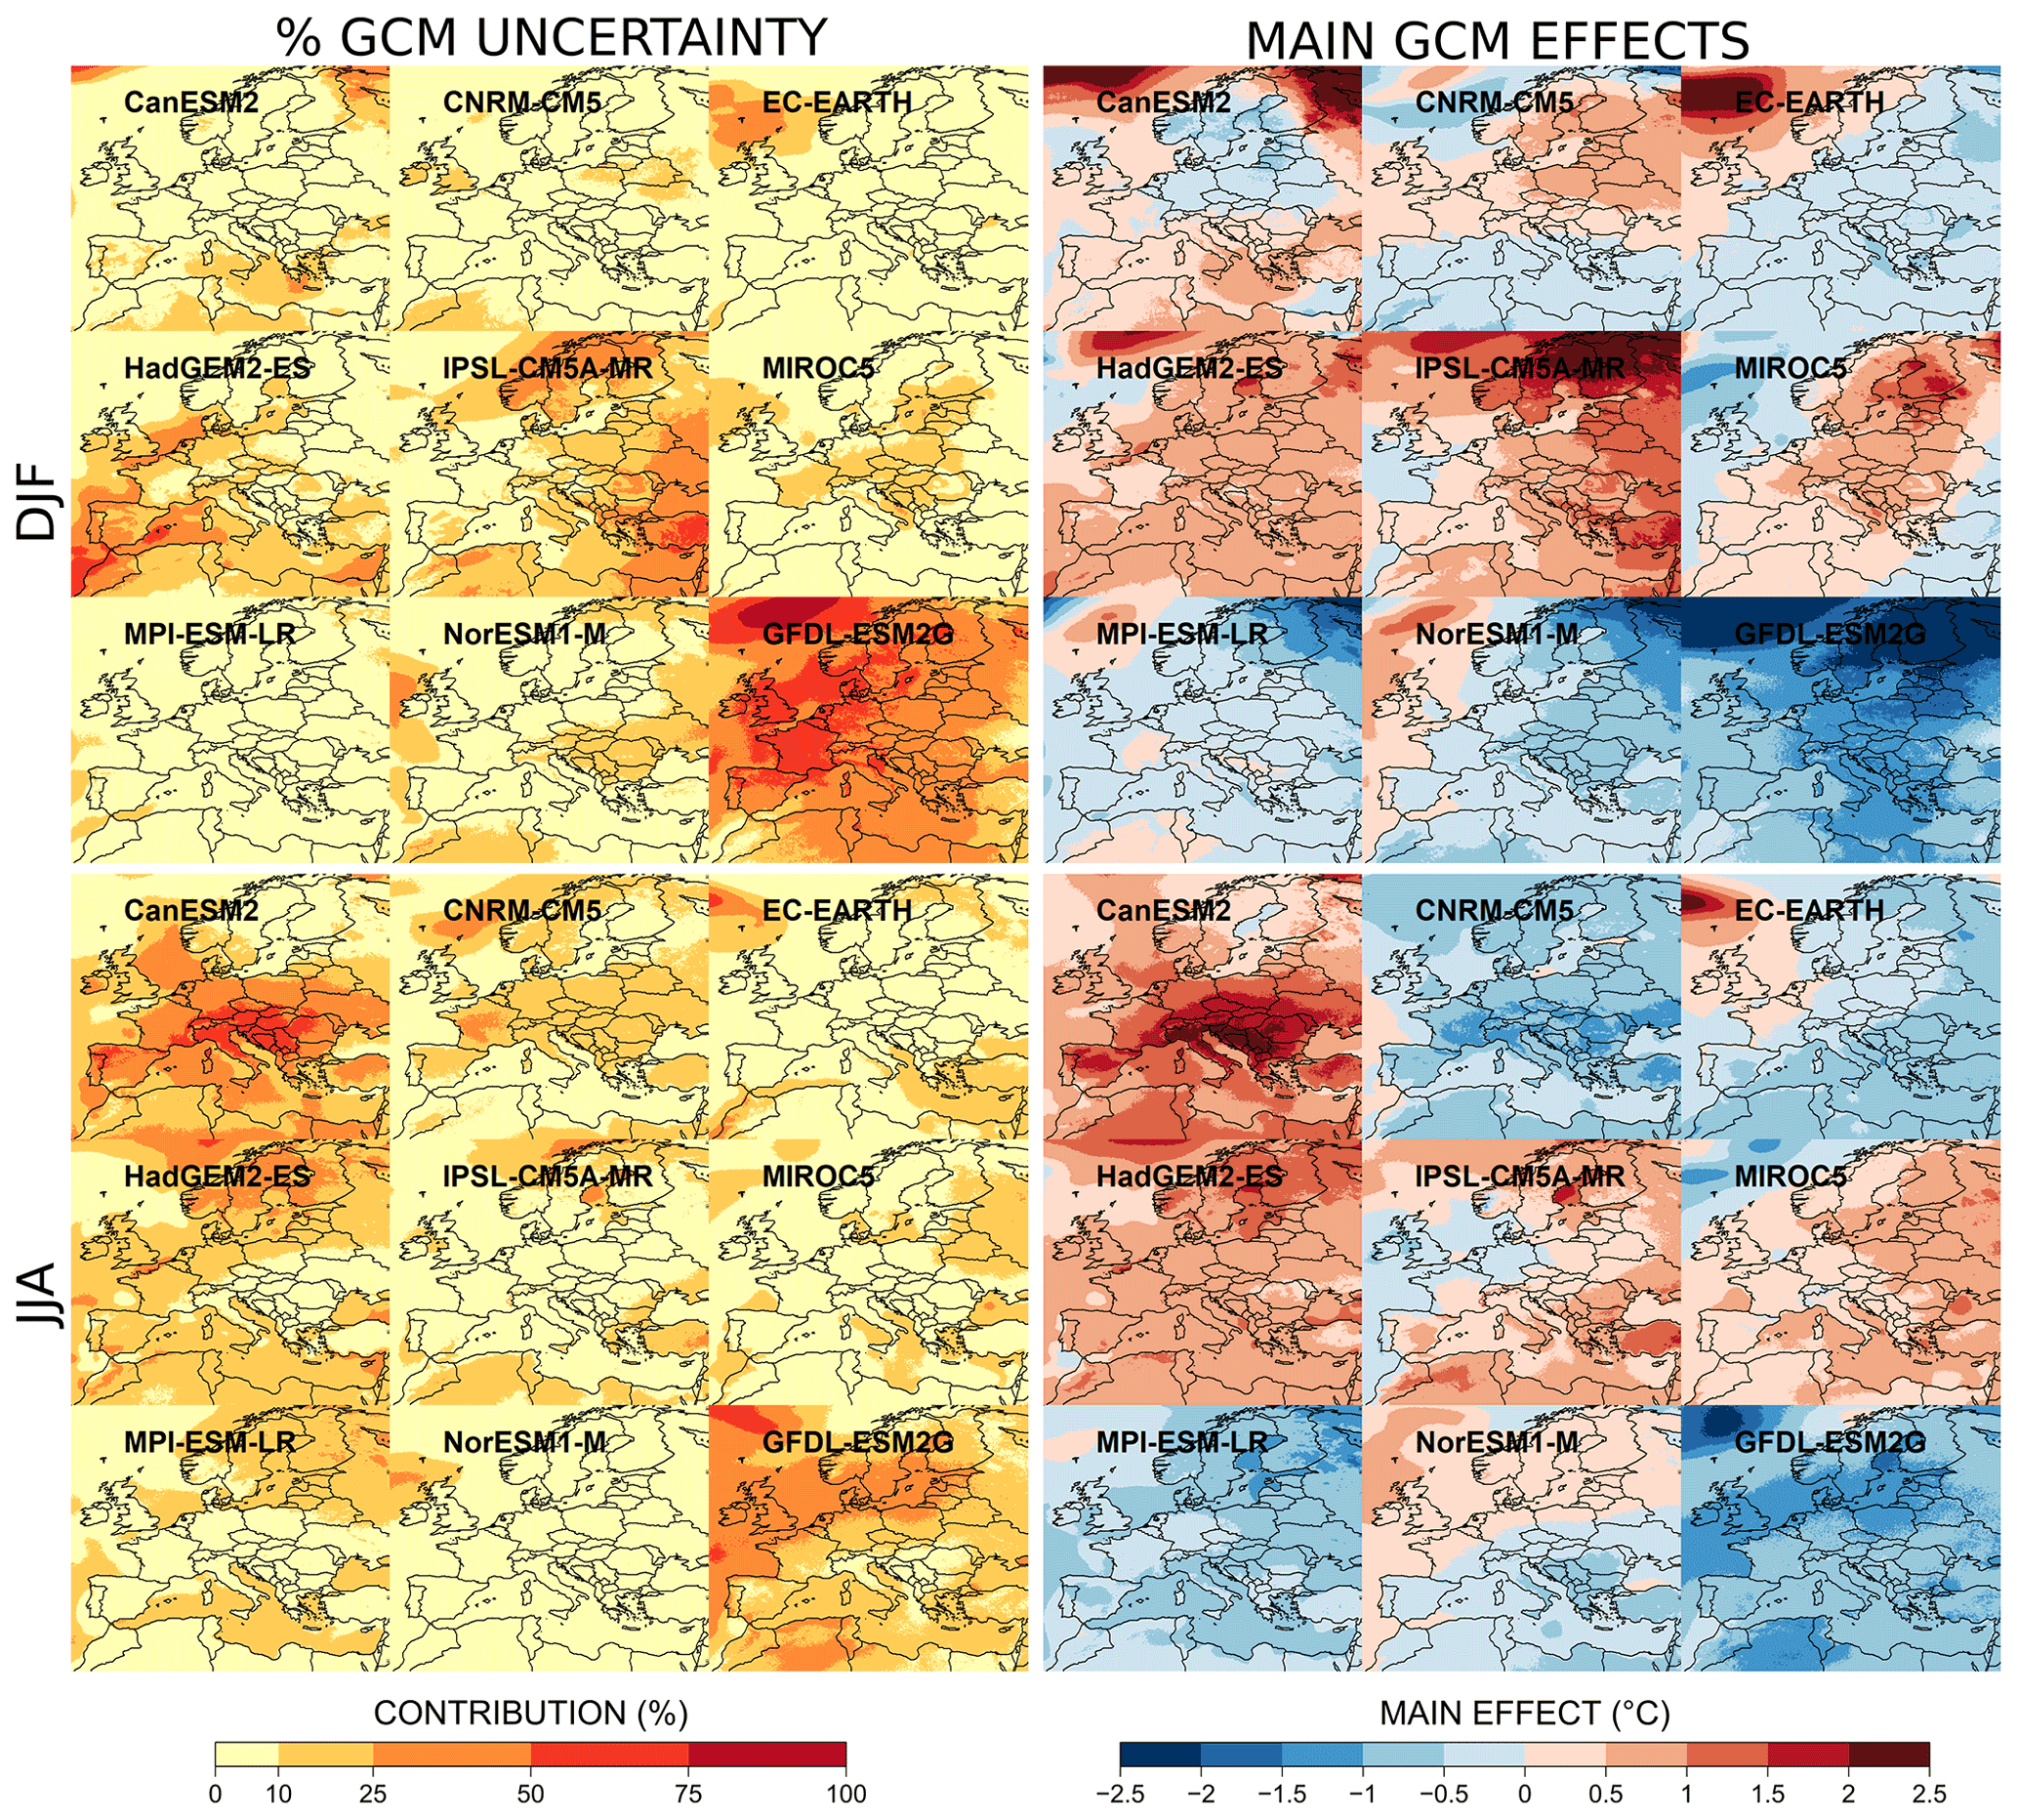
Figure 9Fraction of GCM uncertainty (left plots) and main GCM effects (right plots) for each GCM for absolute temperature changes in winter (DJF) and summer (JJA) at the end of the 21st century (2071–2099) compared to the period 1981–2010.
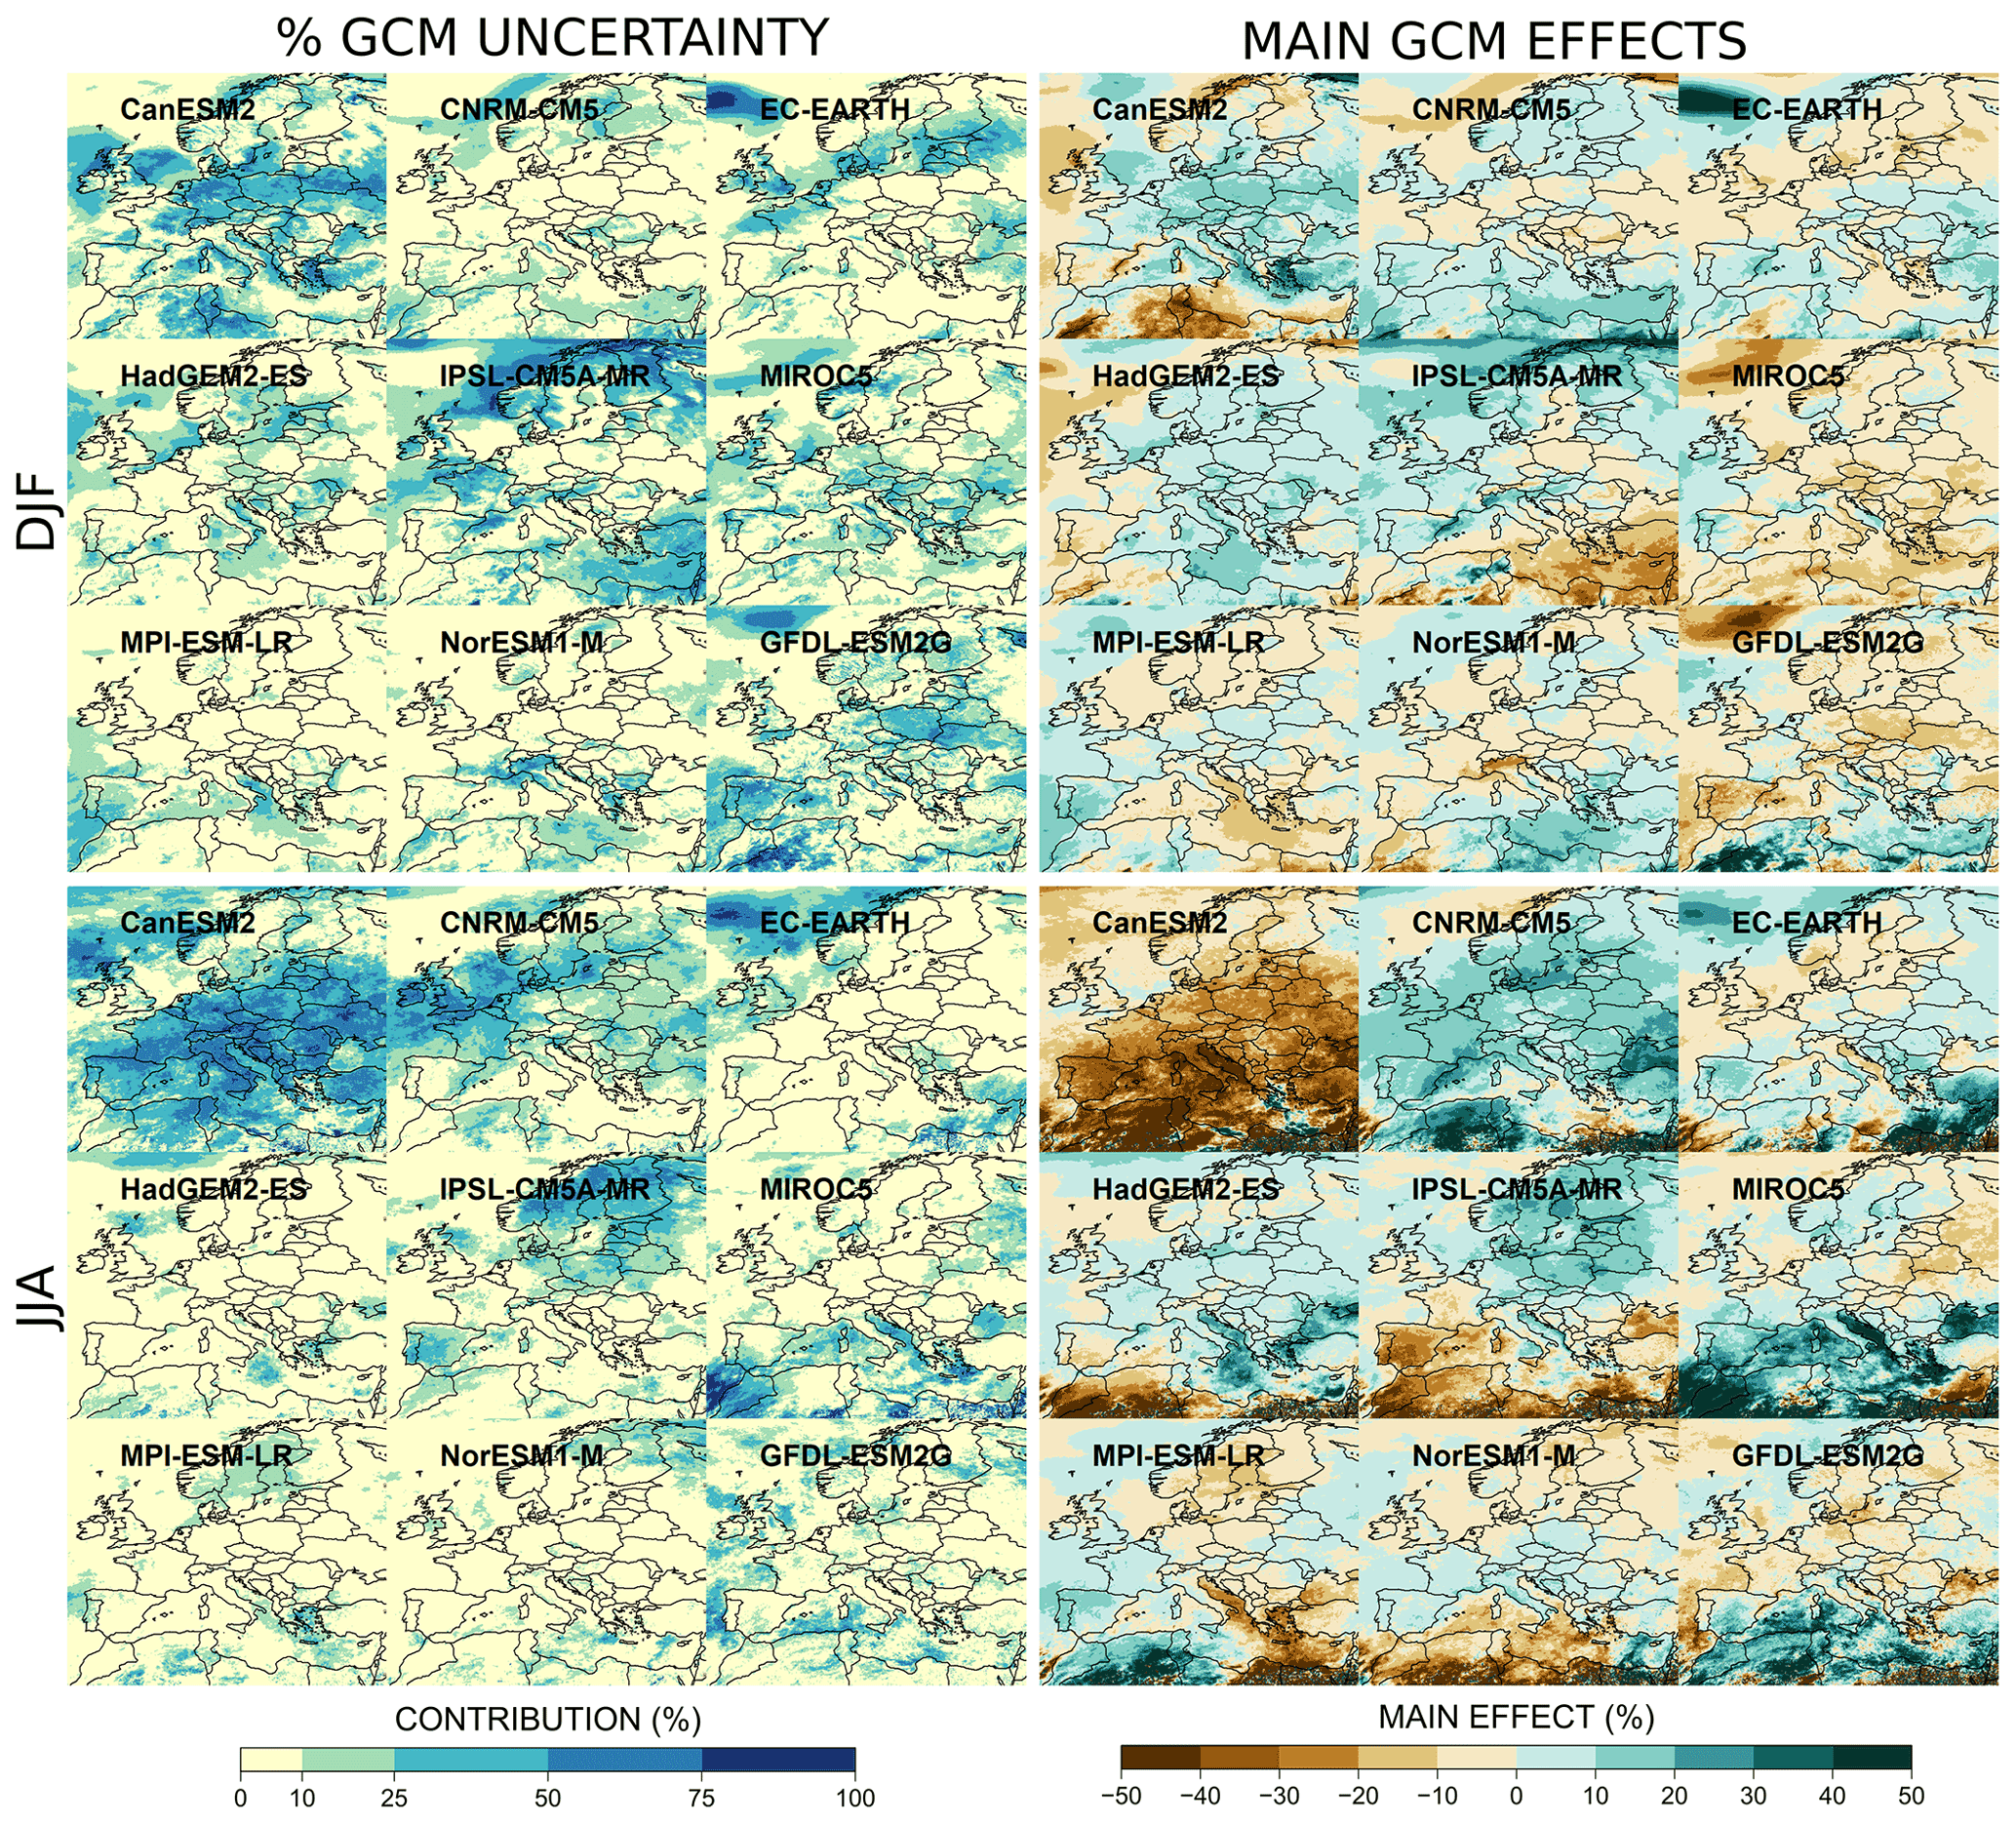
Figure 10Fraction of GCM uncertainty (left plots) and main GCM effects (right plots) for each GCM for relative precipitation changes in winter (DJF) and summer (JJA) at the end of the 21st century (2071–2099) compared to the period 1981–2010.
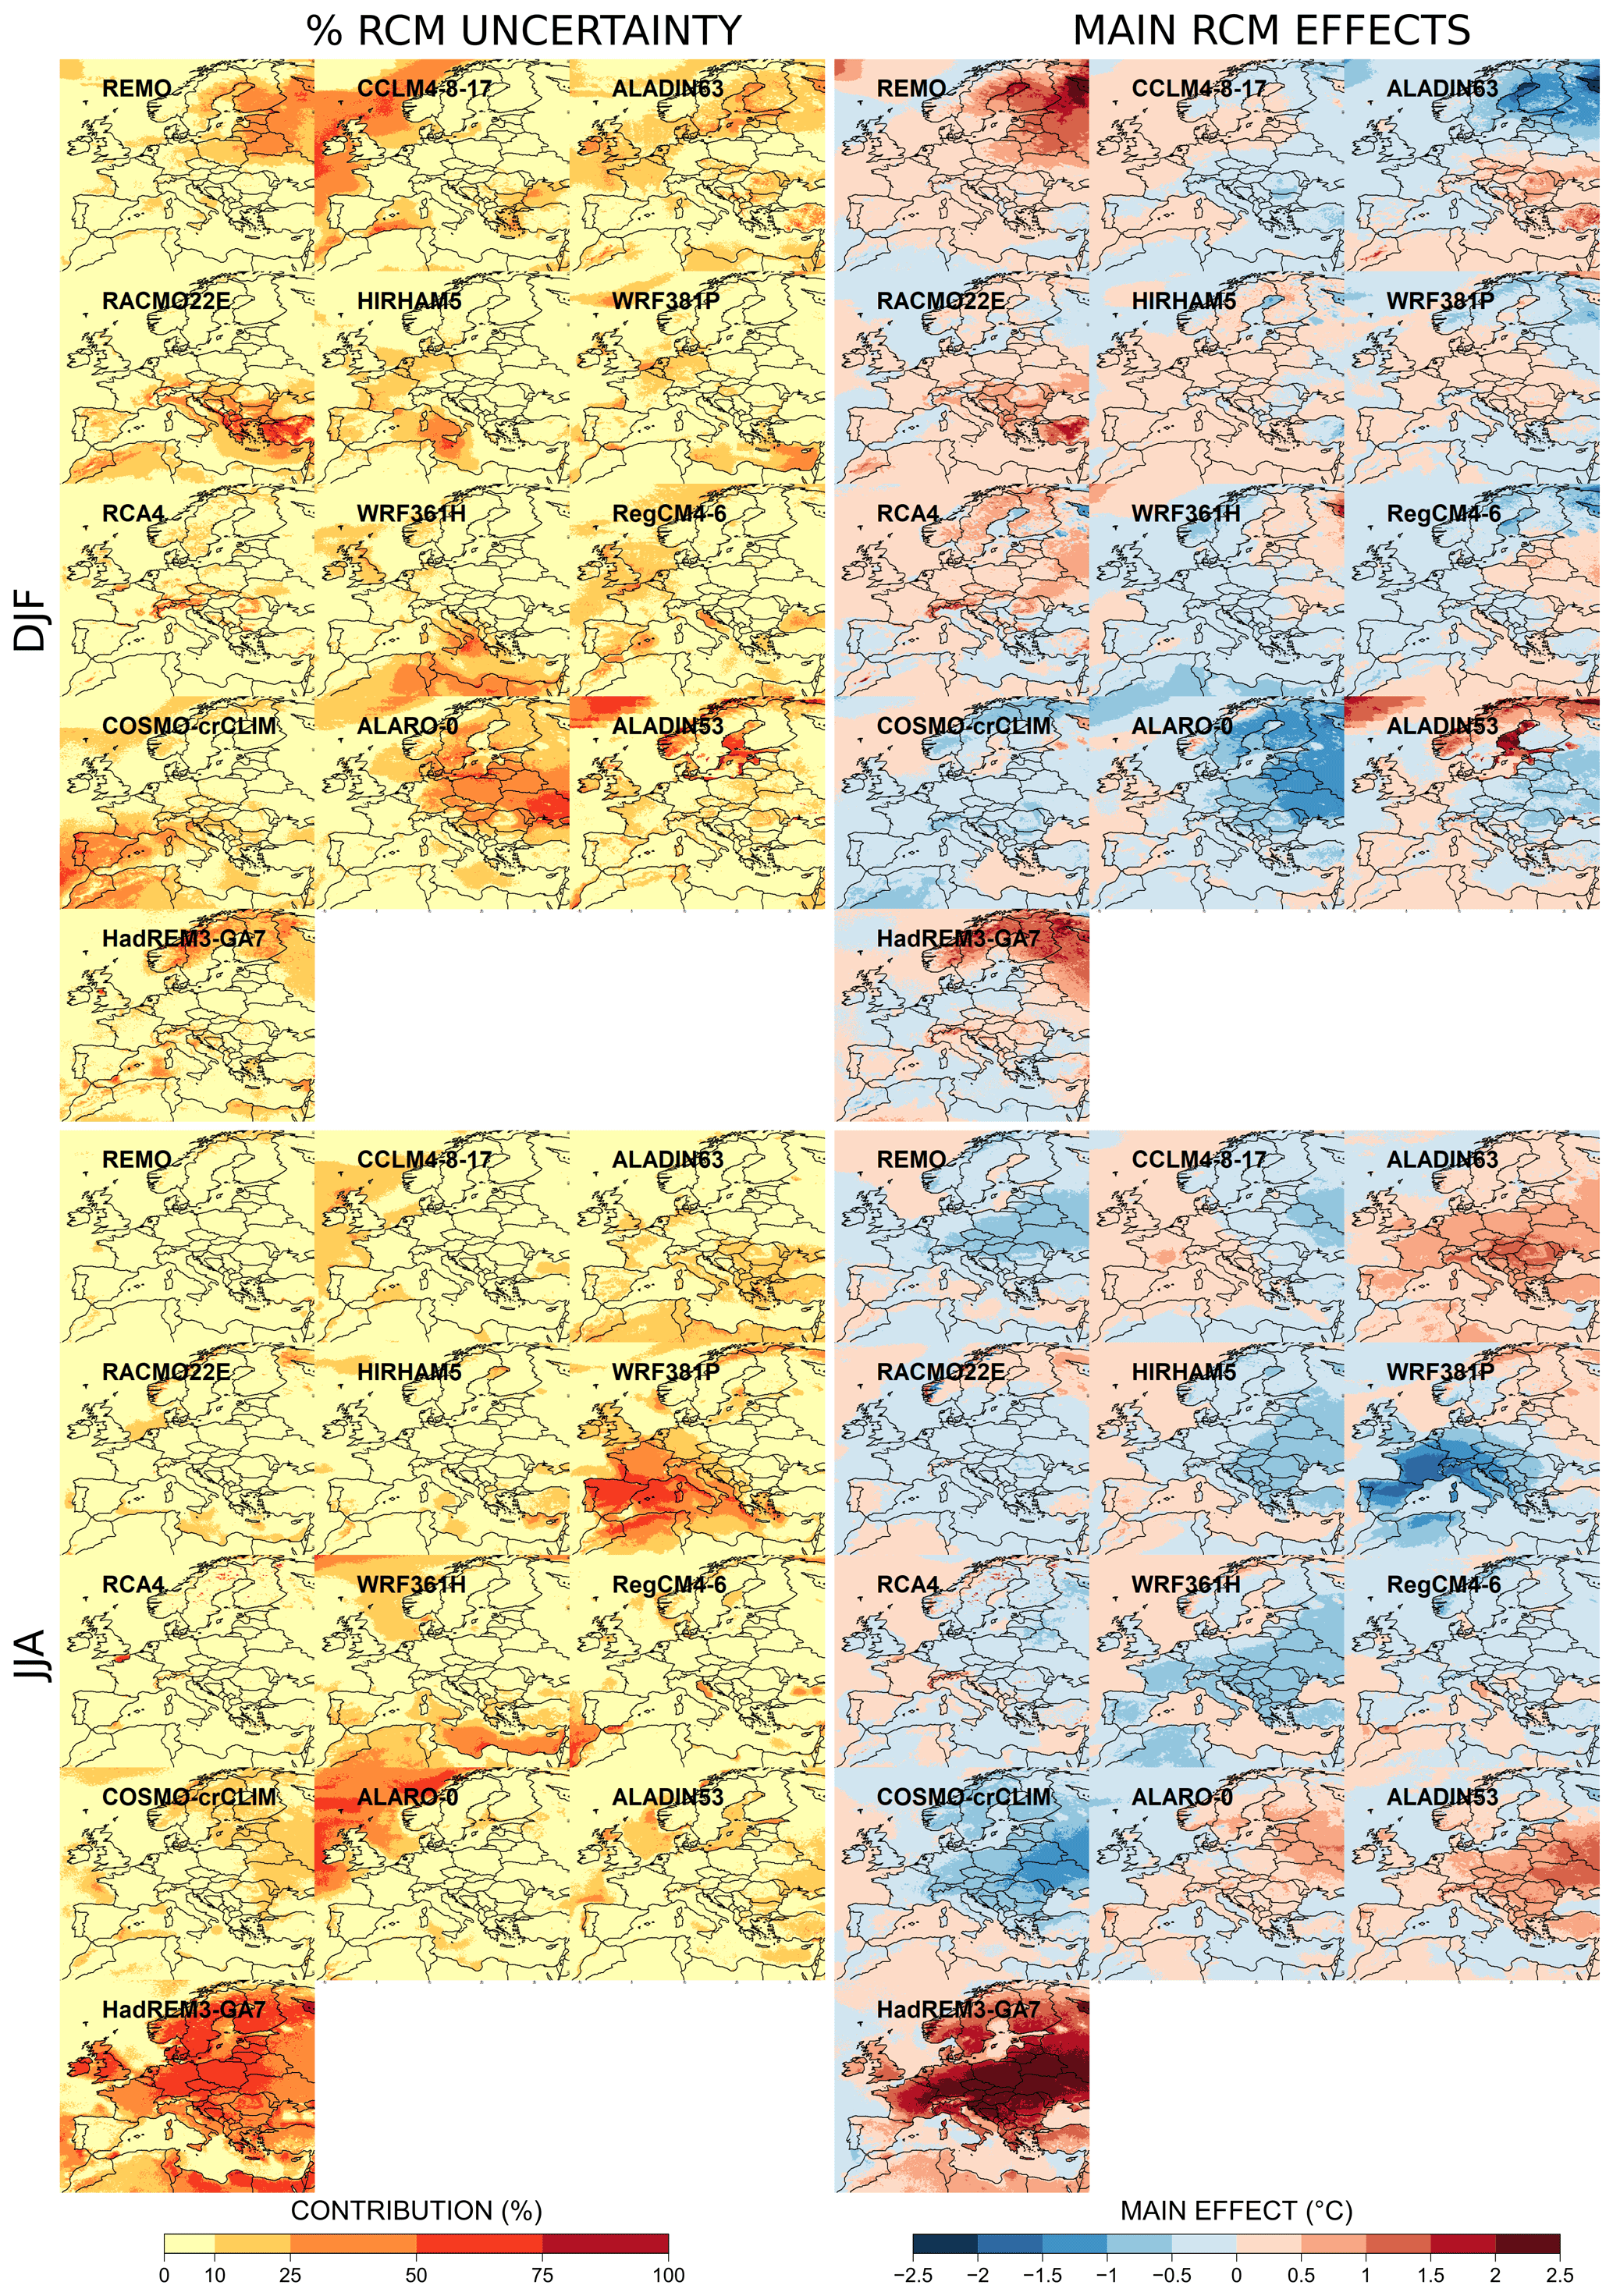
Figure 11Fraction of RCM uncertainty (left plots) and main RCM effects (right plots) for each RCM for absolute temperature changes in winter (DJF) and summer (JJA) at the end of the 21st century (2071–2099) compared to the period 1981–2010.
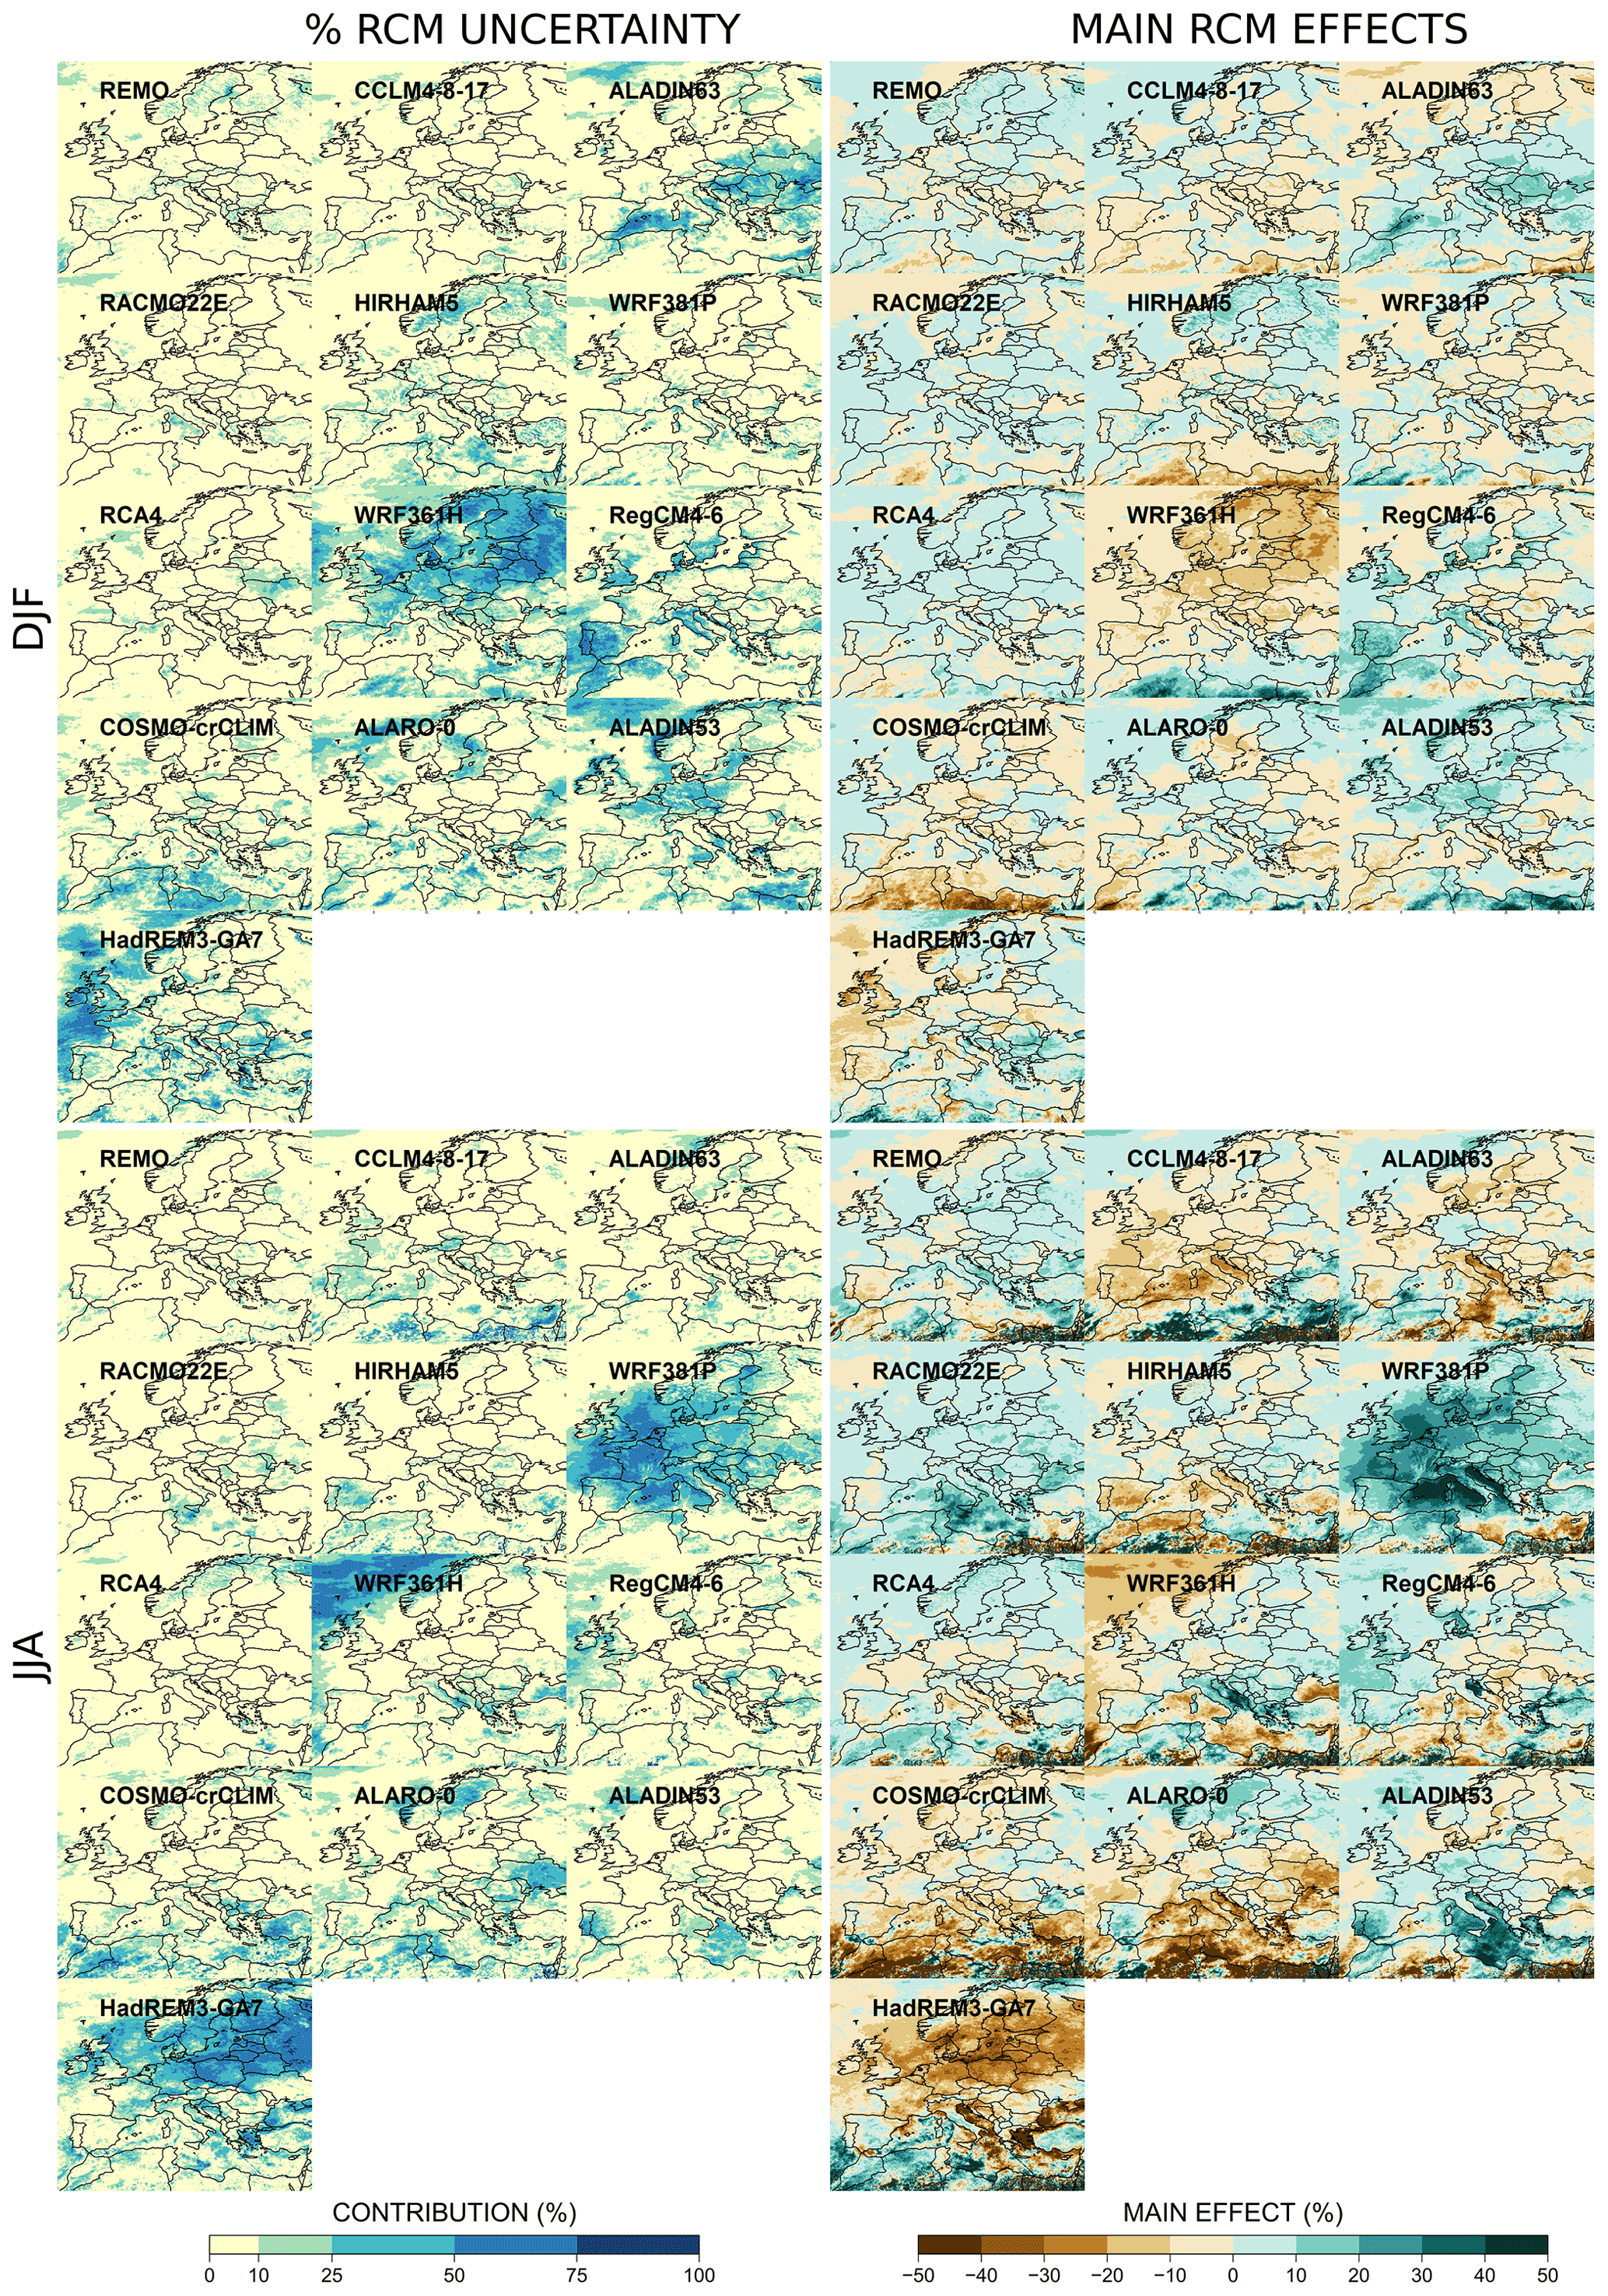
Figure 12Fraction of RCM uncertainty (left plots) and main RCM effects (right plots) for each RCM for relative precipitation changes in winter (DJF) and summer (JJA) at the end of the 21st century (2071–2099) compared to the period 1981–2010.
8.1 Unbalanced MMEs and robustness of QUALYPSO estimates
The projected mean change of any climate variable is typically estimated with the direct average of the climate change responses obtained for the different simulations of the available ensemble (see, e.g., Jacob et al., 2014; Fernández et al., 2019; Coppola et al., 2020; Vautard et al., 2020). Direct averages, however, are likely to be poor estimates of mean changes in the case of unbalanced and/or incomplete ensembles. As motivated by several papers (Déqué et al., 2007, 2012; Northrop and Chandler, 2014; Evin et al., 2019), a proper statistical treatment of unbalanced ensembles is important in order to exploit ensembles of opportunity and avoid unrepresentative estimates of the mean projected changes or even of the likely range. For each scenario k, Fig. 13 shows the differences between the balanced mean climate change response BMk obtained with the QUALYPSO approach and the direct average Mk of the climate change responses available for each scenario. In summer, important differences can be observed, in particular for temperature changes in eastern Europe with the RCP2.6 and RCP4.5 (the balanced estimate is up to 0.8 ∘C warmer) and for precipitation changes with the RCP4.5 (the balanced estimate is drier than the direct average by up to 20 % in eastern Europe). The winter season is also affected, with a balanced estimate that indicates a weaker warming than the direct average by up to 0.5 ∘C (see, e.g., central and northern Europe for the RCP8.5).
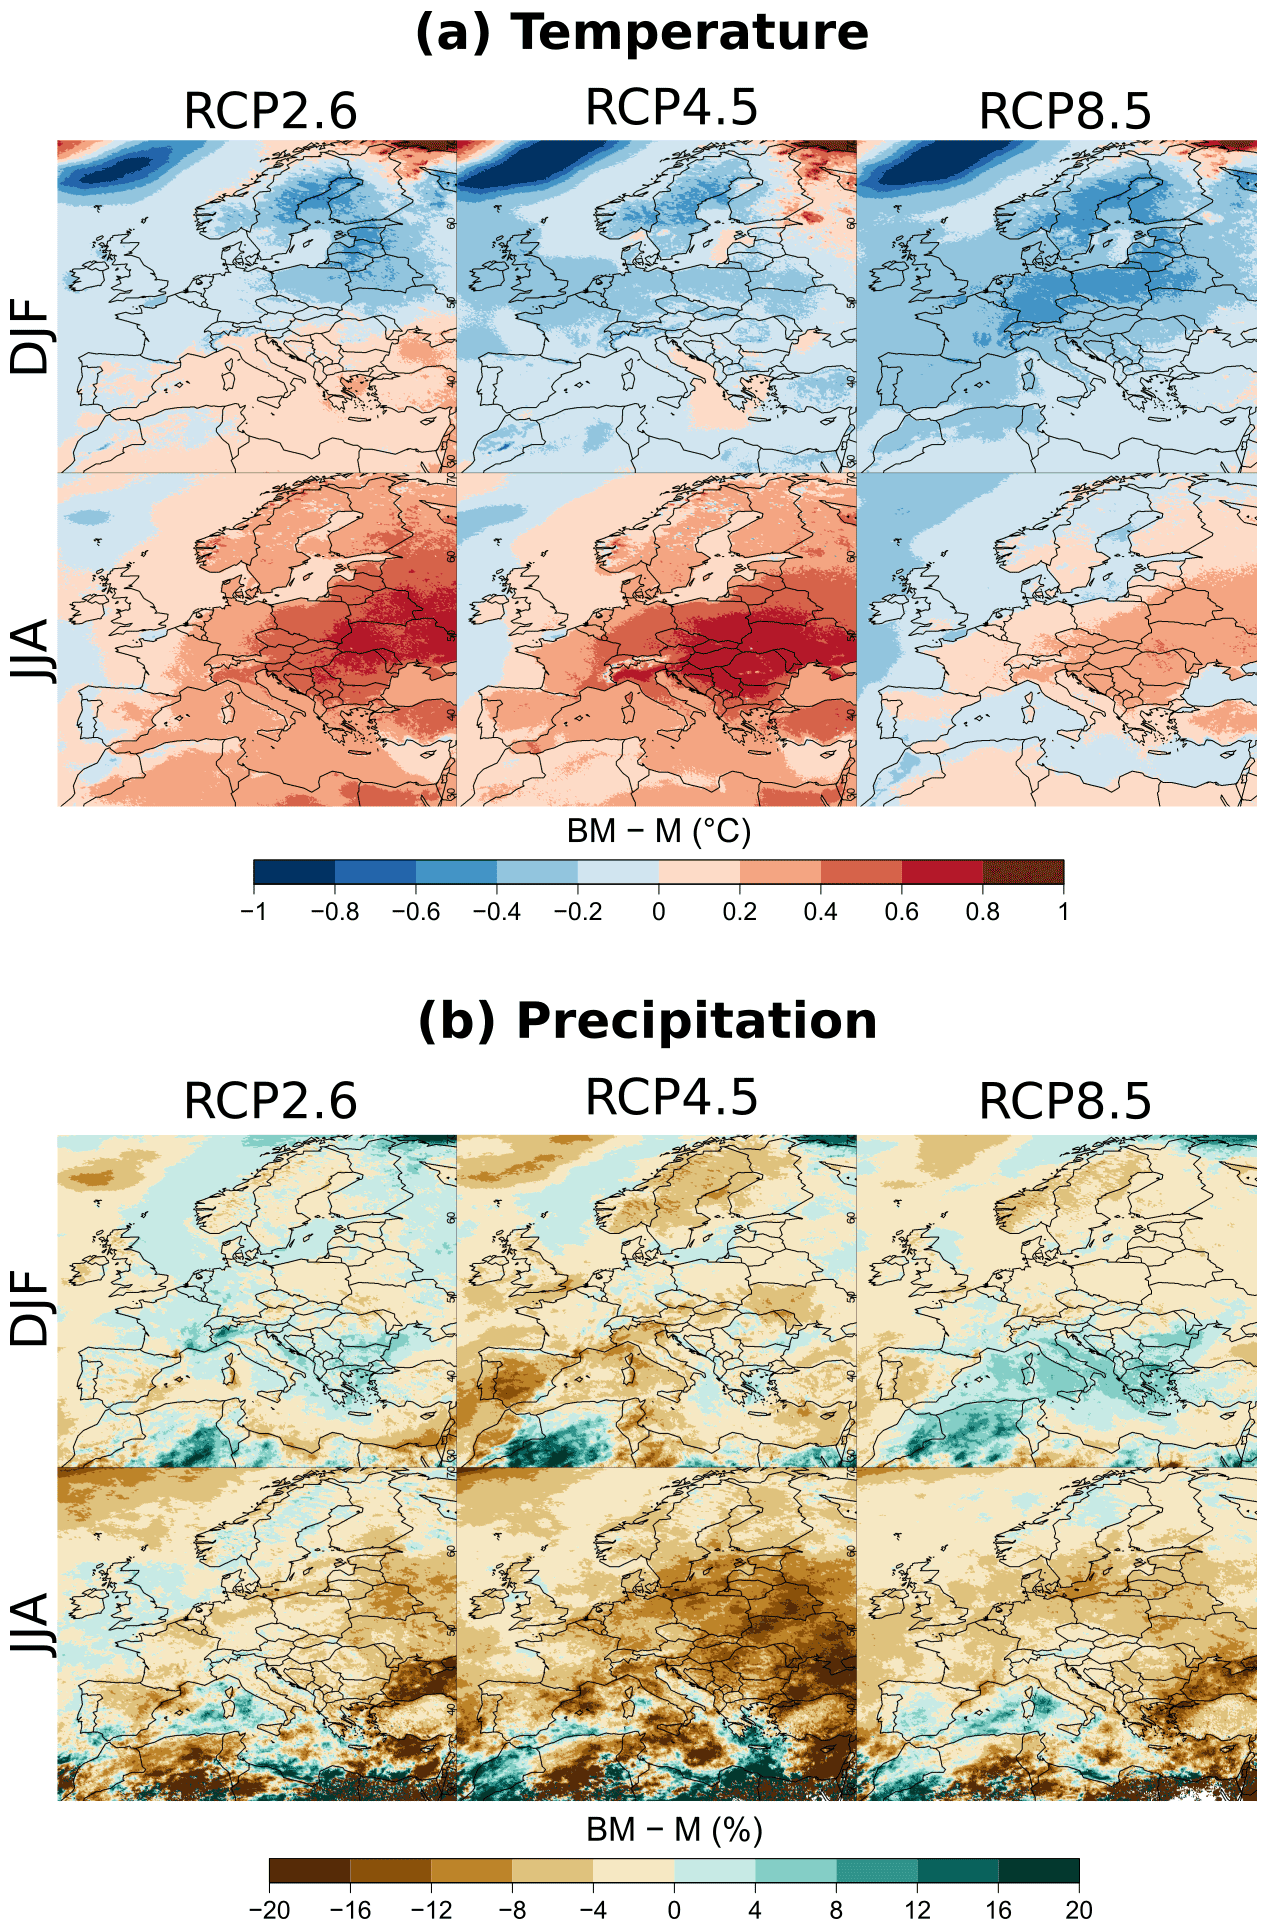
Figure 13Difference between the “balanced” estimates of the mean projected changes BMk obtained with the QUALYPSO approach and the direct average Mk of the climate change responses available for each scenario in winter (DJF) and summer (JJA) at the end of the 21st century (2071–2099) compared to the period 1981–2010 for mean projected changes in (a) precipitation (b) temperature.
Figures 14 and 15 further illustrate the advantage of the QUALYPSO approach using a synthetic experiment. A complete synthetic MME composed of 9 GCMs × 13 RCMs × 3 RCPs = 351 chains is generated from Eq. (1) using the grand mean, ANOVA main effects, and the residual variability estimated with the original MME of 87 chains. Mean change estimates are then obtained for 1000 random subsamples of 87 chains among the complete synthetic MME of 351 chains, with at least one chain for each of the 9 GCMs, 13 RCMs, and 3 RCPs. While both direct and balanced QUALYPSO estimates vary around the true mean change of the complete MME, balanced estimates are clearly less variable and more robust to the subsampling, especially for temperature changes. Moreover, this simple experiment ignores the over-representation of the scenario RCP8.5 or of some RCMs and GCMs that would have certainly worsened this effect.
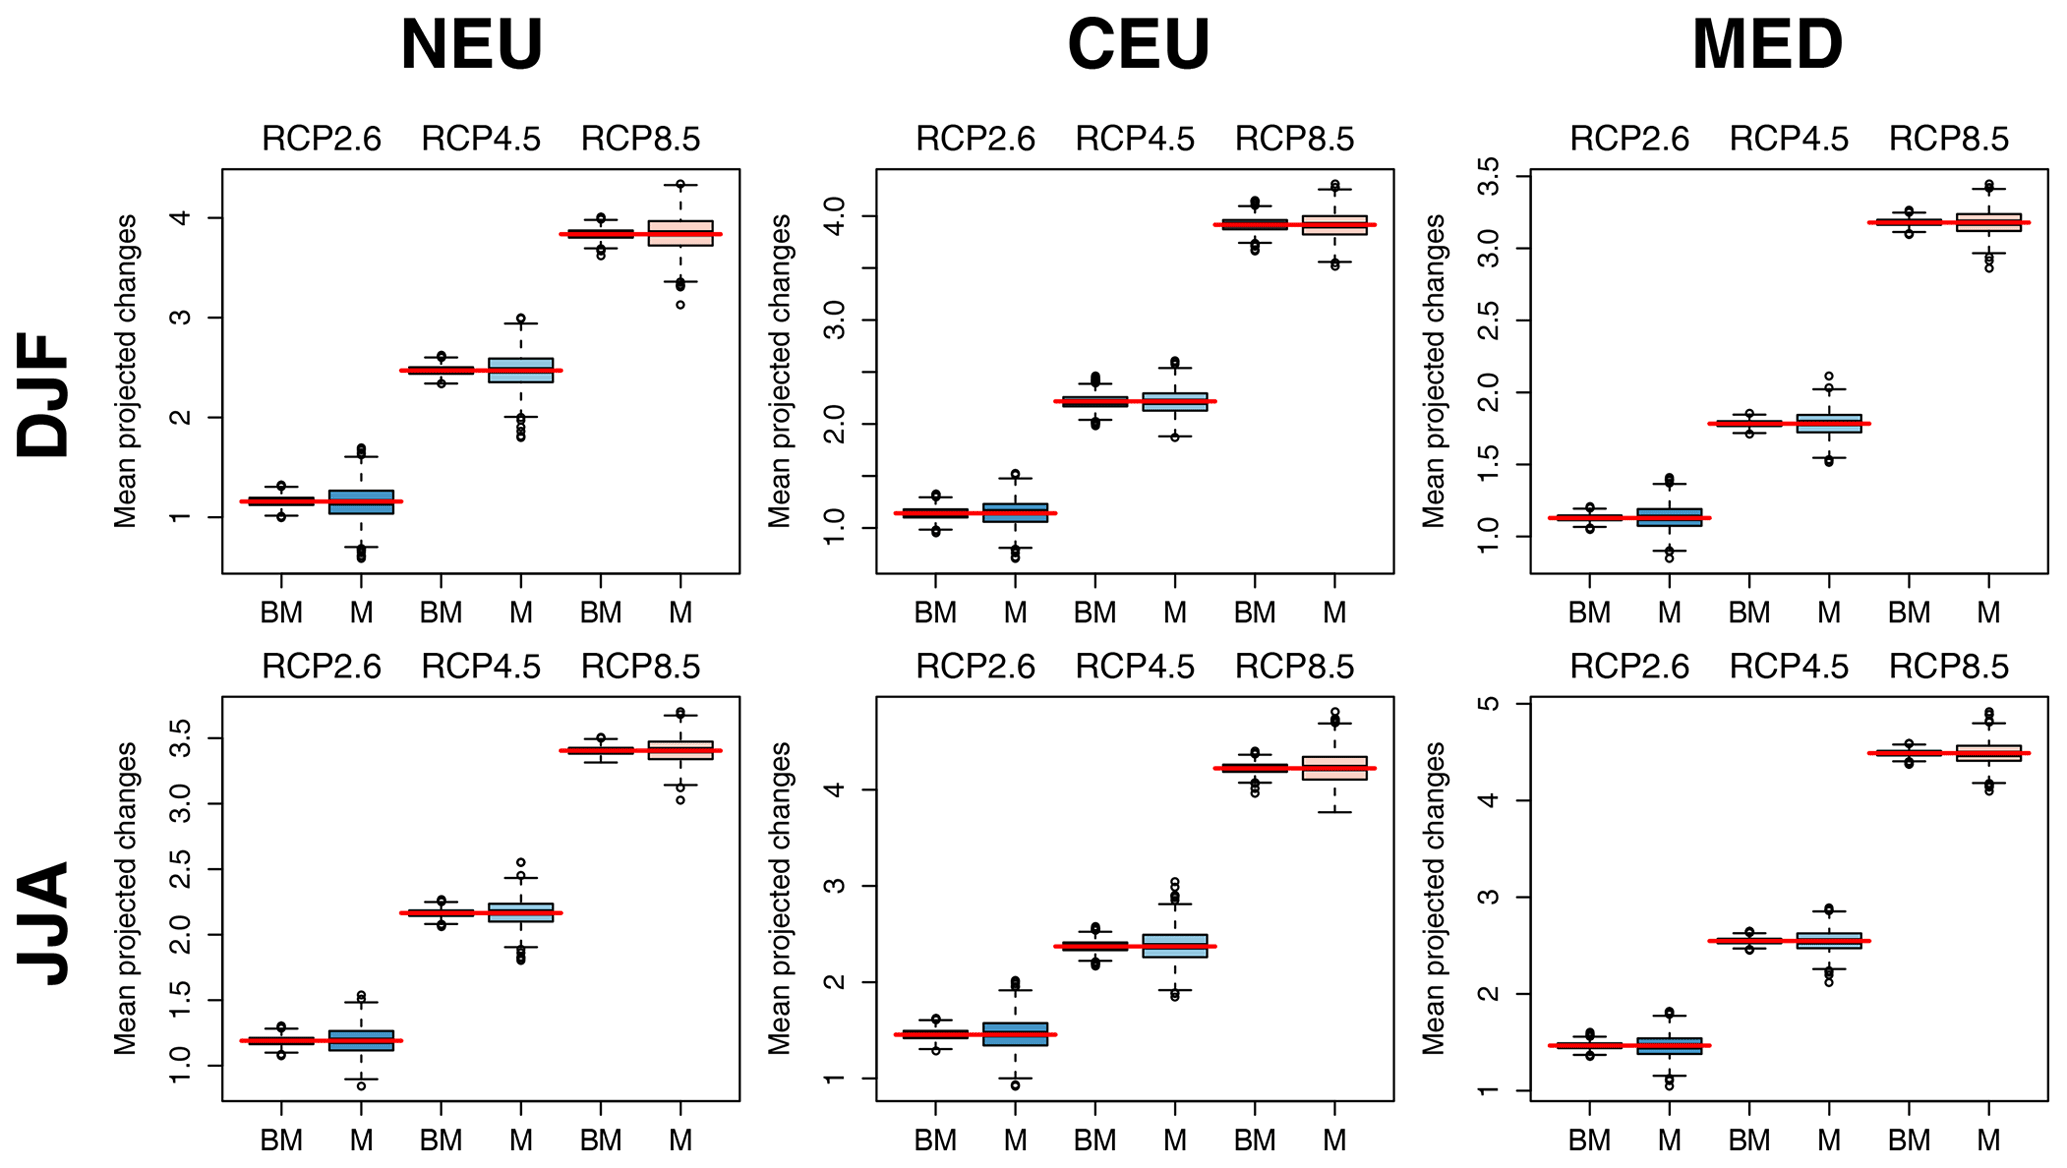
Figure 14Comparison of mean projected changes estimates for temperature using QUALYPSO (BM) and direct averages (M) of a synthetic MME for each RCP scenario, SREX region, and season. A complete synthetic MME composed of 9 GCMs × 13 RCMs × 3 RCPs = 351 chains is generated using the ANOVA effects and the residual variability estimated with the original MME. Each box plot shows the distribution of the 1000 mean change estimates obtained with the 1000 incomplete MMEs (87 chains) randomly subsampled from the complete synthetic MME (351 chains). Each incomplete MME includes at least one chain for each of the 9 GCMs, 13 RCMs, and 3 RCPs. Red horizontal lines indicate the corresponding averages obtained from the complete MME.
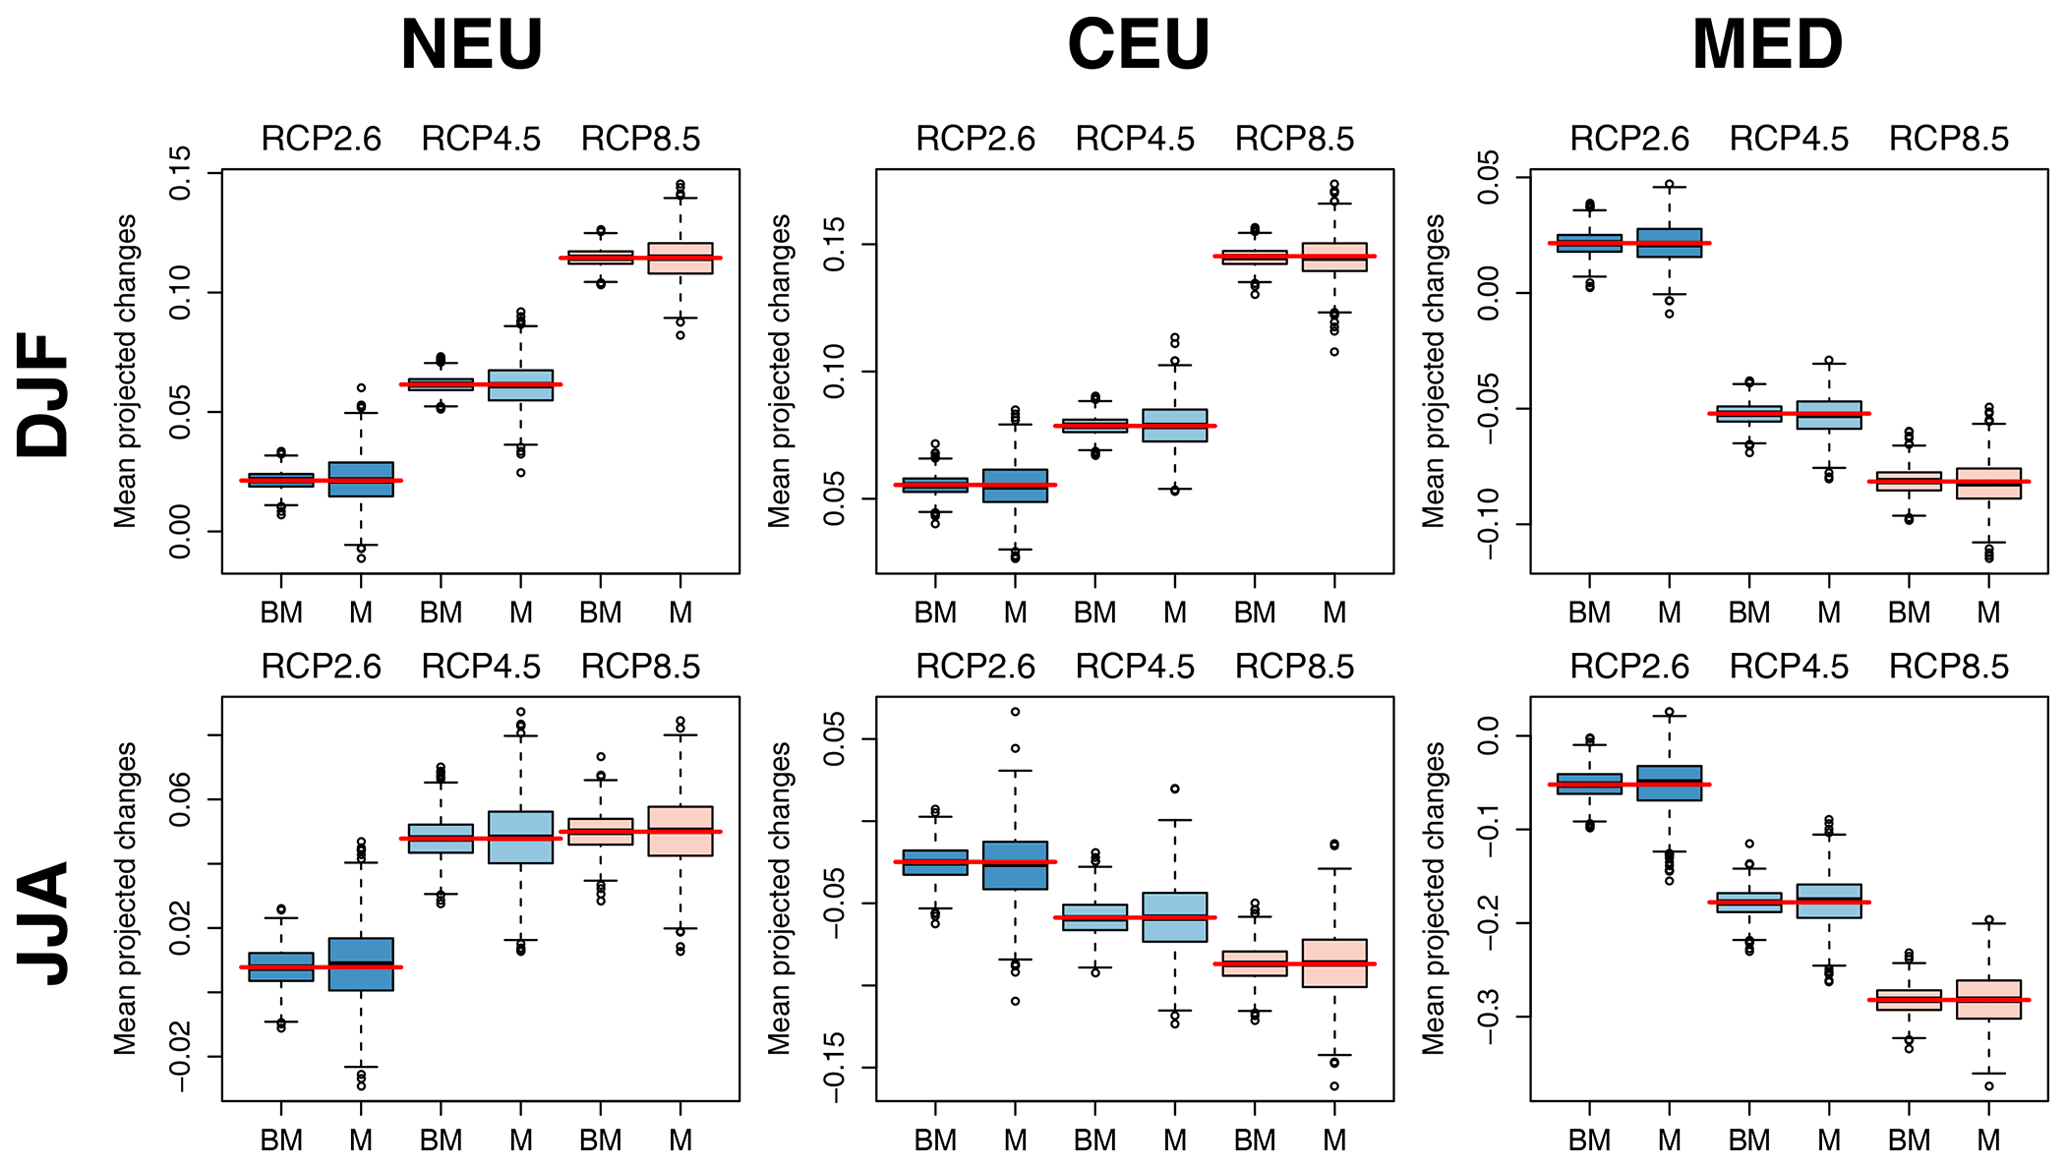
Figure 15Comparison of mean projected change estimates for precipitation using QUALYPSO (BM) and direct averages (M) of a synthetic MME for each RCP scenario, SREX region, and season. A complete synthetic MME composed of 9 GCMs × 13 RCMs × 3 RCPs = 351 chains is generated using the ANOVA effects and the residual variability estimated with the original MME. Each box plot shows the distribution of the 1000 mean change estimates obtained with the 1000 incomplete MMEs (87 chains) randomly subsampled from the complete synthetic MME (351 chains). Each incomplete MME includes at least one chain for each of the 9 GCMs, 13 RCMs, and 3 RCPs. Red horizontal lines indicate the corresponding averages obtained from the complete MME.
The very unbalanced nature of available MMEs is thus an important issue that should not be overlooked. The most critical configurations correspond to unbalanced ensembles for which the less consensual and/or the most different GCMs and RCMs (as expressed from the spatial signatures of their main effects) are under-represented, which is the case in this study. Indeed, the GCMs CanESM2 and RCM HadREM3-GA7 clearly stand out from the other climate models (see Figs. 9–11), whereas they only participate in two simulation chains and one simulation chain among the 87 members of our ensemble, respectively. In this case, the direct average of the MME is thus a misleading estimate of the mean projected changes and differs greatly from the estimate that would be obtained with a balanced MME.
8.2 Comparison to previous works
The results shown in this study can be compared to previous studies aiming at estimating mean projected changes and partitioning the different sources of uncertainties in EURO-CORDEX ensembles.
8.2.1 Mean projected changes: importance of the MME configuration and of the experiment
It is worth mentioning that numerous parameters and configurations can impact the estimates of mean projected changes. As shown above, some climate models included in the analysis can greatly influence the obtained mean projected changes and related uncertainties. This result is somewhat in contradiction to the study by Fernández et al. (2019), which concludes that there is a moderate influence of the subsampling, though this study is performed over a small region (around Spain) for the near future only (2021–2050) and for a smaller diversity of RCMs and GCMs (nine RCMs and eight GCMs at 0.11∘ resolution). Projected changes are also strongly dependent on the experiment and the different versions of the climate models. For example, the study by Coppola et al. (2020) notices much stronger projected changes with the recent CMIP6 MME than with the EURO-CORDEX MME.
The seasonal mean temperature and total precipitation changes at the end of the century obtained here (Fig. 5) with the RCP8.5 scenario can be compared to Figs. 1 and 5 in Coppola et al. (2020). The spatial patterns of these changes are obviously very similar (a larger projected warming in the north and northeast of Europe in winter and in the south in summer, positive precipitation changes in the northern part and negative changes in the southern part, with a different zero-change line in winter and summer). It is difficult to have a precise comparison considering the different color scales, but different factors could explain potential differences. First, the MME considered here is larger than in Coppola et al. (2020), with one more GCM (GFDL-ESM2) and two more RCMs (ALARO-0 and HadREM3-GA7) having a strong influence on mean temperature changes in winter (GFDL-ESM2 and ALARO-0) and summer (HadREM3-GA7) as well as summer precipitation changes (HadREM3-GA7). Secondly, as discussed above, the method of estimation (i.e., balanced versus direct estimates) also impacts estimates of mean projected changes. However, potential differences are difficult to quantify in comparison to Coppola et al. (2020) due to the different MME.
8.2.2 Contribution of the main sources of uncertainty
This study emphasizes the main sources of uncertainty over Europe (Figs. 7–8). GCM uncertainty overcomes RCM uncertainty for temperature, even if RCM uncertainty can contribute 25 %–50 % in summer over continental Europe. These results are in agreement with Christensen and Kjellström (2020) (see their Fig. 5), who also find a moderate contribution of RCMs for winter temperature, except in several regions (e.g., Turkey, over the Alps) where small contributions are also shown in this study. The remarkable hot spot of uncertainty in the northwest of Europe, due to disagreements between the GCMs, is also clearly visible in their study. For summer temperature, a noticeable difference is the small contribution found by the authors for RCMs over continental Europe, which is largely smaller than for GCMs, while our study exhibits an important contribution (more than 25 %) in eastern Europe surpassing the GCM contribution. This can be easily explained by the much larger set of RCMs used in our study, with important contributors of the RCM uncertainty (HadREM3-GA7, ALARO-0, WRF386P, WRF361H) being absent in Christensen and Kjellström (2020).
Conclusions are globally similar for precipitation changes, with GCM and RCM contributions both being important in winter and summer. The GCM contribution is also usually greater than the RCM contribution in winter in Christensen and Kjellström (2020) and almost equivalent in summer, with this result being shared by the study of Déqué et al. (2012) (see their Fig. 1). Unsurprisingly, scenario uncertainty is more important at the end of the century (2071–2099) than for the near future (2021–2050). At the end of the century, scenario uncertainty overcomes the other sources of uncertainty for temperature changes (generally more than 50 %), while its contribution is more moderate for precipitation changes, especially in summer (less than 25 % and often less than 10 %), corroborating previous studies (Hawkins and Sutton, 2009; Déqué et al., 2012).
Concerning different paired interactions between RCP scenarios, GCMs, and RCMs, the present study shows that they are negligible for temperature changes and for RCP–RCM interactions. For precipitation changes, however, RCP–GCM interactions can contribute more than 20 % in some areas in winter (along the coastlines of France, Spain, and Portugal, over the Alps) and for RCM–GCM interactions, particularly in summer. Christensen and Kjellström (2020) share these results (see their Fig. S14), with RCM–GCM interactions contributing 5 %–20 % of the total variance for summer precipitation over all of Europe and the Mediterranean sea.
8.2.3 Contribution of individual GCMs and RCMs
For individual GCM–RCM contributions, the results shown in our study can be compared to the outcomes of McSweeney et al. (2015), who analyze the climate change signal of individual CMIP5 GCMs over Europe in winter and summer at the end of the 21st century under the RCP8.5 scenario. Our results are in full agreement with their results. For the GCMs used in EURO-CORDEX, they find that HadGEM2-ES (GFDL-ESM2G and NorESM1-M) is the GCM that warms the most (the least) in winter over Europe and that HadGEM2-ES and CanESM2 (GFDL-ESM2G, CNRM-CM5, and MPI-ESM-LR) are the GCMs that warm the most (the least) in summer. In addition, considering the projected precipitation increase over most of continental Europe in winter, they also indicate that MIROC5 and GFDL-ESM2G are among the CMIP5 GCMs simulating the weakest wetting, whereas HadGEM2-ES and CanESM2 are the EURO-CORDEX-used GCMs simulating the largest precipitation increase for this season. In summer, while mean projected changes exhibit a decrease in precipitation changes in western and southern Europe, individual GCM responses are strongly contrasting, with CNRM-CM5 showing a strong wetting compared to the other GCMs, for example, while CanESM2 is particularly drier. Note, however, that CanESM2 is not identified as particularly drying in summer in McSweeney et al. (2015). Re-assessing the CanESM2/REMO and CanESM2/CCLM4-8-17 simulations could help understand and identify a potential GCM–RCM inconsistency. The hot spot of GCM uncertainty in the northwest of the domain over the North Atlantic Ocean is likely related to the sea ice cover change, in particular in winter. A precise interpretation is difficult to obtain using the current literature, but it is worth underlining that two of the GCMs showing a strong influence in this area (CanESM2, IPSL‐CM5A‐MR) are considered among the most trustable CMIP5 GCMs concerning the wintertime sea ice cover. MIROC5, NorESM1‐M, and CNRM‐CM5, however, are mentioned as strongly biased for the Arctic sea ice cover in winter (Stroeve et al., 2012), and the other driving GCMs are not analyzed in their study. In a future EURO-CORDEX multimodel initiative, it is therefore advised to evaluate the sea ice cover extent of the potential driving GCMs before selecting them (Stroeve et al., 2012).
Also, Zappa and Shepherd (2017) propose four contrasting storylines for projected wintertime Mediterranean precipitation changes. They classify GFDL-ESM2G in the model family leading to the strongest decline, whereas EC-EARTH, HADGEM2-ES, and NorESM1-M belong to the family of the weakest decline or wetting for the region in winter (Giuseppe Zappa, personal communication, 2018). Contrary to McSweeney et al. (2015), the classification proposed by Zappa and Shepherd (2017), though very relevant, does not help to understand our findings for precipitation changes.
Except for the evolving aerosol effect mentioned in Sect. 7, it is difficult so far to explain the RCM individual behavior as the most influencing RCMs of the current study have not always been included or detected in previous articles dealing with EURO-CORDEX projections (e.g., Sørland et al., 2018; Fernández et al., 2019; Boé et al., 2020; Christensen and Kjellström, 2020). We consider, however, the fact that the identification of strong RCM individual effects in our study motivates the definition of a standardized indicator of regional climate model sensitivity mimicking the ECS or TCR indicators for GCMs.
8.3 MME projections of future regional climate
This study assesses changes between a future and a reference period, as do most of the studies on this subject. Only the evolution of the climate from this reference period is trusted and assessed, not absolute values. However, past observations can also be used to improve the final regional climate information provided or to complement QUALYPSO-like approaches. For example, observations can be used to weight or to select the GCM or RCM in the initial ensemble. Indeed, many papers question the “model democracy” approach and aim at estimating future mean changes and associated uncertainties by proposing different ways to combine the runs of the MME, mostly using weights (see Brunner et al., 2020, for a recent comparison). Those constraints are not applied in the current study but they could be considered in future work as a complementary approach. Regional observations can also be used to correct a posteriori the regional climate simulations (Vrac and Friederichs, 2014) through statistical correction techniques. In the current study, QUALYPSO is not applied to post-processed MMEs using such techniques, but this could be easily done in a future work by applying QUALYPSO after a correction step.
There are also different approaches that have been favored to produce ensembles of regional climate projections. A great majority of climate change impact studies are based at least partially on GCMs. Because the GCM resolution is often too coarse for the climate change assessments, GCM outputs need to be downscaled at finer spatial scales. While the current study presents regional projections that have been dynamically downscaled using RCMs, many studies advocate that empirical–statistical downscaling (ESD) also presents some advantages (Benestad et al., 2017b; Jacob et al., 2020). There is a general consensus among the community working on climate change that complementarity between dynamical and statistical approaches is a key to provide useful regional climate information. A last approach, hybrid downscaling, mixes RCMs and ESD (Erlandsen et al., 2020). As illustrated in some previous studies (e.g., Lafaysse et al., 2014), dynamical and statistical approaches produce a larger variety of modeling chains and represent a significant contribution to the total uncertainty, especially for precipitation projections.
8.4 Limitations and technical difficulties
This study applies the QUALYPSO methodology described in Evin et al. (2019), which implies data augmentation and a Bayesian approach to augment the RCP–GCM–RCM matrix and properly treat unbalanced ensembles, as well as estimate the main RCP, GCM, and RCM effects. Due to the high number of missing quantities to be inferred, the estimation of interactions using QUALYPSO is not feasible, and we resort to heuristic estimates of some interaction effects (i.e., when at least two runs are available to estimate this interaction). As an alternative, Northrop and Chandler (2014), using a random-effect approach and a Bayesian implementation, propose directly inferring the variability (i.e., standard deviation) between the RCPs, GCMs, and RCP–GCM interactions. Instead of trying to infer all individual effects (for which few or no runs may be available), their approach directly tackles the partition of the different uncertainties in unbalanced MMEs. However, contrary to QUALYPSO, their approach does not aim at estimating individual GCM or RCM effects. As shown in the present study, individual contributions of specific GCMs or RCMs are interesting to assess since, as discussed above, they can guide future investigations.
QUALYPSO is not free of limitations. For example, the different inferred quantities are not scenario-dependent. Internal variability as well as the scenario-excluded uncertainty BU, GCM, and RCM uncertainties are thus considered to be identical for the three emission scenarios, whereas some differences could be expected due to the different responses of the GCMs for the different scenarios. In future studies, a different GCM uncertainty for each scenario could be considered. However, for the GCM uncertainty, GCM–RCP interaction effects would have to be estimated in the ANOVA. While very crude estimates of some of these interactions are provided in this study, these estimates probably lack precision since they rely on a few simulation chains only. Refined estimates of internal variability could also be considered to take into account (1) different internal variability by scenario and/or GCM, (2) different internal variability as a function of time, and/or (3) the potential autocorrelation present in the deviations from the climate change response as a result of the statistical preprocessing of the climate projections (in our case, 30-year moving averages).
In addition, the QUALYPSO method, like most of the matrix filling methods, relies on the existing MME. In our case, it means that it cannot be used to extrapolate towards GCMs that have not been downscaled by any RCM in the GCM × RCM × RCP matrix considered in this study. In addition, the results shown in this study are unavoidably impacted by the shortcomings of the climate models. For example, GCMs are known to produce very different internal variability from one GCM to the other (Deser et al., 2020), which tends to show that some GCMs overestimate or underestimate this characteristic of future possible climates. QUALYPSO relies on the runs available in the MMEs with their limitations and drawbacks, including this possible misrepresentation of the internal decadal variability.
A major technical difficulty is related to the computation of relative precipitation change in dry areas or more generally to the statistical assessment of relative errors when the reference value is close to zero. Indeed, for some regions (typically the Middle East), the average summer precipitation is very low for the reference periods. As a consequence, the ratio between future and reference periods is numerically unstable and can be huge for some simulation chains. As can be seen in Table S17 in the Supplement, in these situations, the uncertainty can be huge (see, e.g., BU obtained for precipitation changes equal 242 % and 392 % for Cairo, Egypt, and Damascus, Syria, respectively). For these regions, large changes in relative terms actually correspond to small changes in absolute values (see also Bichet et al., 2020, for an application of QUALYPSO to relative and absolute precipitation changes in Africa) such that absolute precipitation changes are actually more meaningful.
This paper proposes a thorough assessment of mean climate change responses and related uncertainties over Europe for mean seasonal temperature and total seasonal precipitation. QUALYPSO, an advanced statistical approach based on an ANOVA method and data augmentation, is applied to a large MME of 87 high-resolution (0.11∘) EURO-CORDEX projections. QUALYPSO provides a balanced estimate of all the parameters of the analysis, including the mean climate change signal and the associated uncertainty components. For the first time, we provide a comprehensive estimation of the relative contribution of GCMs and RCMs, RCP scenarios, and internal variability to the total variance of the largest ensemble based on regional climate models publicly available to date 1.
For temperature, RCP uncertainty is the most important contributor at the end of the century, particularly on land, but GCM uncertainty is also important on seas and on the Atlantic Ocean, and the RCM contribution reaches 30 % in central Europe in summer. For precipitation, GCM and RCM uncertainties are the most important contributors to the total variance in summer at the end of the century, while scenario uncertainty also plays a major role in winter. GCM uncertainties are more important in the Norwegian Sea and over the eastern part of the Mediterranean Sea in winter, while RCM uncertainties can be dominant in some specific regions (e.g., between the UK and Germany in summer). A strong contrast between lands and seas–oceans can also be noticed for summer temperature changes and winter precipitation changes.
In this study, internal variability is small compared to the other sources of uncertainty. As 30-year averages of the simulation chains are taken, most of the high-frequency variability is removed, and the low-frequency part only is usually negligible in comparison to the dispersion between the GCMs and RCMs. The residual variability and the different interactions are also shown to be usually small in our analyses compared to the other sources of uncertainties, with the most noticeable interactions being observed for precipitation changes, namely RCP–GCM interactions in winter and GCM–RCM interactions in summer.
For each major source of uncertainty, we also identify individual GCMs and RCMs explaining the greatest part of the corresponding uncertainty. The large values of uncertainty components are produced by a few “outlier” models in the sense that they strongly depart from the average of the MME. The legitimacy of this divergence must then be questioned. Are there strong reasons to discard these particular models (bugs, wrong parameterizations or model structures, etc.)? In that case, it seems reasonable to omit these climate models from the MMEs. Otherwise, the inclusion of these models is crucial in order to avoid an underestimation of the uncertainty.
A critical issue is finally related to the very unbalanced and incomplete nature of ensembles of opportunity. The over- or under-representation of some RCMs and GCMs forbids the application of standard ANOVA methods and the estimation of the mean changes by direct averages of these ensembles. In most past studies, changes are estimated from the average of all simulations (Jacob et al., 2014; Coppola et al., 2020). We show here that the average can be a poor estimate of the mean projected changes. The difference between a direct average and a “balanced” estimate is likely to increase with the unbalanced level of the MME and can be dramatically large when the under-represented models are atypical. In the present case, we show that the projected warming could be up to 0.8 ∘C larger than previously estimated by the end of the century for RCP2.6 and RCP4.5 over large parts of central Europe in summer. In contrast, the projected warming can be up to 0.4 ∘C smaller in winter in northern Europe. Using a balanced estimate, the decrease in summer precipitation by the end of the century can be up to 20 % larger in central–eastern Europe for RCP4.5.
Following the results shown in this work, we advise the community (1) to develop new strategies for future multimodel initiatives based on regional climate models, in particular by carefully selecting plausible GCMs and RCMs and by favoring their diversity in terms of climate change response at the regional scale and cover at best the plausible futures, (2) to choose MMEs in close collaboration with statistician specialists in order to envisage the best way to “fill” or “balance” the ensembles a posteriori, and (3) to adopt robust and appropriate statistical methods for the assessment and usage of large available MMEs. The purpose of this advice is to improve the reliability of the regional climate change information provided to the scientific communities and to various climate data users through climate services. There is a critical need for the development of best practices dedicated to the dissemination of results based on large ensembles of climate projections to managers and practitioners, which include not only climate scientists, but also geophysical and data scientists. In addition to the dynamical downscaling approach provided by regional climate models, several alternative methods are available in the literature in order to improve the uncertainty assessment of future climate change (e.g., empirical–statistical downscaling methods; Gutiérrez et al., 2019; Benestad et al., 2017a). The larger diversity of possible future climates, while desirable, also increases the complexity of the statistical analyses (such as QUALYPSO) required for their treatment.
Finally, this study provides many insights about the different uncertainty components and the diversity of climate change response provided by the different models. As such, this work should be considered complementary to the aforementioned methods. In QUALYPSO, contrary to most existing approaches, our estimates are “robust” to the subsampling of the complete MME (i.e., possible combinations of RCP–GCM–RCM).
Most of the statistical treatments were done using R software (R, 2017) and the QUALYPSO (v1.2.0; Evin, 2020) package.
The EURO-CORDEX RCM data analyzed in this work are available for download via the Earth System Grid Federation (ESGF) under the project name “CORDEX” at the Federated ESGF-CoG Nodes: https://esgf.llnl.gov/nodes.html (last access: 17 December 2021; ESGF, 2021).
The supplement related to this article is available online at: https://doi.org/10.5194/esd-12-1543-2021-supplement.
GE set up the statistical framework with the scientific contributions of SS and BH. GE produced the figures and tables. GE and SS jointly wrote the publication with important contributions from BH.
The contact author has declared that neither they nor their co-authors have any competing interests.
Publisher's note: Copernicus Publications remains neutral with regard to jurisdictional claims in published maps and institutional affiliations.
The authors are grateful to the editor, Rasmus Benestad, and the two anonymous reviewers, whose comments have helped to improve the paper. This work was partly supported by the French National program LEFE (Les Enveloppes Fluides et l'Environnement). Samuel Somot has been partly supported by the EUCP and C3S_34b_lot2 projects. EUCP is financed by the European Commission through the Horizon 2020 Programme for Research and Innovation under grant agreement 776613. C3S_34b_lot2 is funded by the Copernicus Climate Change Service. ECMWF implements this service on behalf of the European Commission. We thank the CMIP5 and EURO-CORDEX modeling groups for freely providing the simulations used in this study.
This work was partly supported by the French National program LEFE (Les Enveloppes Fluides et l'Environnement). Samuel Somot has been partly supported by the EUCP and C3S_34b_lot2 projects. EUCP is financed by the European Commission through the Horizon 2020 Programme for Research and Innovation (grant no. 776613). C3S_34b_lot2 is funded by the Copernicus Climate Change Service. ECMWF implements this service on behalf of the European Commission.
This paper was edited by Andrey Gritsun and reviewed by two anonymous referees.
Benestad, R., Parding, K., Dobler, A., and Mezghani, A.: A Strategy to Effectively Make Use of Large Volumes of Climate Data for Climate Change Adaptation, Climate Services, 6, 48–54, https://doi.org/10.1016/j.cliser.2017.06.013, 2017a. a
Benestad, R., Sillmann, J., Thorarinsdottir, T. L., Guttorp, P., Mesquita, M. D. S., Tye, M. R., Uotila, P., Maule, C. F., Thejll, P., Drews, M., and Parding, K. M.: New Vigour Involving Statisticians to Overcome Ensemble Fatigue, Nat. Clim. Change, 7, 697–703, https://doi.org/10.1038/nclimate3393, 2017b. a
Bichet, A., Diedhiou, A., Hingray, B., Evin, G., Touré, N. E., Browne, K. N. A., and Kouadio, K.: Assessing Uncertainties in the Regional Projections of Precipitation in CORDEX-AFRICA, Clim. Change, 162, 583–601, https://doi.org/10.1007/s10584-020-02833-z, 2020. a
Boé, J., Somot, S., Corre, L., and Nabat, P.: Large Discrepancies in Summer Climate Change over Europe as Projected by Global and Regional Climate Models: Causes and Consequences, Clim. Dynam., 54, 2981–3002, https://doi.org/10.1007/s00382-020-05153-1, 2020. a, b
Brunner, L., McSweeney, C., Ballinger, A. P., Befort, D. J., Benassi, M., Booth, B., Coppola, E., de Vries, H., Harris, G., Hegerl, G. C., Knutti, R., Lenderink, G., Lowe, J., Nogherotto, R., O'Reilly, C., Qasmi, S., Ribes, A., Stocchi, P., and Undorf, S.: Comparing Methods to Constrain Future European Climate Projections Using a Consistent Framework, J. Climate, 33, 8671–8692, https://doi.org/10.1175/JCLI-D-19-0953.1, 2020. a
Christensen, J. H., Larsen, M. A. D., Christensen, O. B., Drews, M., and Stendel, M.: Robustness of European Climate Projections from Dynamical Downscaling, Clim. Dynam., 53, 4857–4869, https://doi.org/10.1007/s00382-019-04831-z, 2019. a
Christensen, O. B. and Kjellström, E.: Partitioning Uncertainty Components of Mean Climate and Climate Change in a Large Ensemble of European Regional Climate Model Projections, Clim. Dynam., 54, 4293–4308, https://doi.org/10.1007/s00382-020-05229-y, 2020. a, b, c, d, e, f, g
Coppola, E., Nogherotto, R., Ciarlò, J. M., Giorgi, F., van Meijgaard, E., Kadygrov, N., Iles, C., Corre, L., Sandstad, M., Somot, S., Nabat, P., Vautard, R., Levavasseur, G., Schwingshackl, C., Sillmann, J., Kjellström, E., Nikulin, G., Aalbers, E., Lenderink, G., Christensen, O. B., Boberg, F., Sørland, S. L., Demory, M.-E., Bülow, K., Teichmann, C., Warrach-Sagi, K., and Wulfmeyer, V.: Assessment of the European Climate Projections as Simulated by the Large EURO-CORDEX Regional and Global Climate Model Ensemble, J. Geophys. Res.-Atmos., 125, e2019JD032356, https://doi.org/10.1029/2019JD032356, 2020. a, b, c, d, e, f, g, h, i
Déqué, M., Rowell, D. P., Lüthi, D., Giorgi, F., Christensen, J. H., Rockel, B., Jacob, D., Kjellström, E., de Castro, M., and van den Hurk, B.: An Intercomparison of Regional Climate Simulations for Europe: Assessing Uncertainties in Model Projections, Clim. Change, 81, 53–70, https://doi.org/10.1007/s10584-006-9228-x, 2007. a, b, c
Déqué, M., Somot, S., Sanchez-Gomez, E., Goodess, C. M., Jacob, D., Lenderink, G., and Christensen, O. B.: The Spread amongst ENSEMBLES Regional Scenarios: Regional Climate Models, Driving General Circulation Models and Interannual Variability, Clim. Dynam., 38, 951–964, https://doi.org/10.1007/s00382-011-1053-x, 2012. a, b, c, d, e
Deser, C., Lehner, F., Rodgers, K. B., Ault, T., Delworth, T. L., DiNezio, P. N., Fiore, A., Frankignoul, C., Fyfe, J. C., Horton, D. E., Kay, J. E., Knutti, R., Lovenduski, N. S., Marotzke, J., McKinnon, K. A., Minobe, S., Randerson, J., Screen, J. A., Simpson, I. R., and Ting, M.: Insights from Earth System Model Initial-Condition Large Ensembles and Future Prospects, Nat. Clim. Change, 10, 277–286, https://doi.org/10.1038/s41558-020-0731-2, 2020. a
Dong, B., Gregory, J. M., and Sutton, R. T.: Understanding Land–Sea Warming Contrast in Response to Increasing Greenhouse Gases. Part I: Transient Adjustment, J. Climate, 22, 3079–3097, https://doi.org/10.1175/2009JCLI2652.1, 2009. a
Erlandsen, H. B., Parding, K. M., Benestad, R., Mezghani, A., and Pontoppidan, M.: A Hybrid Downscaling Approach for Future Temperature and Precipitation Change, J. Appl. Meteorol. Climatol., 59, 1793–1807, https://doi.org/10.1175/JAMC-D-20-0013.1, 2020. a
ESGF: Federated ESGF-CoG Nodes, ESGF [data set], available at: https://esgf.llnl.gov/nodes.html, last access: 17 December 2021.
Evin, G.: QUALYPSO: Partitioning Uncertainty Components of an Incomplete Ensemble of Climate Projections, R package version 1.2 [code], available at: https://CRAN.R-project.org/package=QUALYPSO (last access: 17 December 2021), 2020.
Evin, G., Hingray, B., Blanchet, J., Eckert, N., Morin, S., and Verfaillie, D.: Partitioning Uncertainty Components of an Incomplete Ensemble of Climate Projections Using Data Augmentation, J. Climate, 32, 2423–2440, https://doi.org/10.1175/JCLI-D-18-0606.1, 2019. a, b, c, d, e, f, g, h
Fantini, A., Raffaele, F., Torma, C., Bacer, S., Coppola, E., Giorgi, F., Ahrens, B., Dubois, C., Sanchez, E., and Verdecchia, M.: Assessment of Multiple Daily Precipitation Statistics in ERA-Interim Driven Med-CORDEX and EURO-CORDEX Experiments against High Resolution Observations, Clim. Dynam., 51, 877–900, https://doi.org/10.1007/s00382-016-3453-4, 2018. a
Fernández, J., Frías, M. D., Cabos, W. D., Cofiño, A. S., Domínguez, M., Fita, L., Gaertner, M. A., García-Díez, M., Gutiérrez, J. M., Jiménez-Guerrero, P., Liguori, G., Montávez, J. P., Romera, R., and Sánchez, E.: Consistency of Climate Change Projections from Multiple Global and Regional Model Intercomparison Projects, Clim. Dynam., 52, 1139–1156, https://doi.org/10.1007/s00382-018-4181-8, 2019. a, b, c, d
Gao, X., Pal, J. S., and Giorgi, F.: Projected Changes in Mean and Extreme Precipitation over the Mediterranean Region from a High Resolution Double Nested RCM Simulation, Geophys. Res. Lett., 33, L03706, https://doi.org/10.1029/2005GL024954, 2006. a
Giorgi, F. and Gutowski, W. J.: Regional Dynamical Downscaling and the CORDEX Initiative, Annu. Rev. Environ. Resour., 40, 467–490, https://doi.org/10.1146/annurev-environ-102014-021217, 2015. a
Gutiérrez, C., Somot, S., Nabat, P., Mallet, M., Corre, L., Meijgaard, E. V., Perpiñán, O., and Gaertner, M. A.: Future Evolution of Surface Solar Radiation and Photovoltaic Potential in Europe: Investigating the Role of Aerosols, Environ. Res. Lett., 15, 034035, https://doi.org/10.1088/1748-9326/ab6666, 2020. a
Gutiérrez, J. M., Maraun, D., Widmann, M., Huth, R., Hertig, E., Benestad, R., Roessler, O., Wibig, J., Wilcke, R., Kotlarski, S., Martín, D. S., Herrera, S., Bedia, J., Casanueva, A., Manzanas, R., Iturbide, M., Vrac, M., Dubrovsky, M., Ribalaygua, J., Pórtoles, J., Räty, O., Räisänen, J., Hingray, B., Raynaud, D., Casado, M. J., Ramos, P., Zerenner, T., Turco, M., Bosshard, T.,Štěpánek, P., Bartholy, J., Pongracz, R., Keller, D. E., Fischer, A. M., Cardoso, R. M., Soares, P. M. M., Czernecki, B., and Pagé, C.: An Intercomparison of a Large Ensemble of Statistical Downscaling Methods over Europe: Results from the VALUE Perfect Predictor Cross-Validation Experiment, Int. J. Climatol., 39, 3750–3785, https://doi.org/10.1002/joc.5462, 2019. a
Hawkins, E. and Sutton, R.: The Potential to Narrow Uncertainty in Regional Climate Predictions, B. Am. Meteorol. Soc., 90, 1095–1107, https://doi.org/10.1175/2009BAMS2607.1, 2009. a, b, c, d
Herrmann, M., Somot, S., Calmanti, S., Dubois, C., and Sevault, F.: Representation of spatial and temporal variability of daily wind speed and of intense wind events over the Mediterranean Sea using dynamical downscaling: impact of the regional climate model configuration, Nat. Hazards Earth Syst. Sci., 11, 1983–2001, https://doi.org/10.5194/nhess-11-1983-2011, 2011. a
Hingray, B. and Saïd, M.: Partitioning Internal Variability and Model Uncertainty Components in a Multimember Multimodel Ensemble of Climate Projections, J. Climate, 27, 6779–6798, https://doi.org/10.1175/JCLI-D-13-00629.1, 2014. a, b
Hingray, B., Blanchet, J., Evin, G., and Vidal, J.-P.: Uncertainty Component Estimates in Transient Climate Projections, Clim. Dynam., 53, 2501–2516, https://doi.org/10.1007/s00382-019-04635-1, 2019. a
IPCC: Climate Change: The Physical Science Basis. Contribution of Working Group I to the Fifth Assessment Report of the Intergovernmental Panel on Climate Change, edited by: Stocker, T. F., Qin, D., Plattner, G.-K., Tignor, M., Allen, S. K., Boschung, J., Nauels, A., Xia, Y., Bex, V., and Midgley, P. M., Cambridge University Press, Cambridge, United Kingdom and New York, NY, USA, 2013. a
Jacob, D., Petersen, J., Eggert, B., Alias, A., Christensen, O. B., Bouwer, L. M., Braun, A., Colette, A., Déqué, M., Georgievski, G., Georgopoulou, E., Gobiet, A., Menut, L., Nikulin, G., Haensler, A., Hempelmann, N., Jones, C., Keuler, K., Kovats, S., Kröner, N., Kotlarski, S., Kriegsmann, A., Martin, E., Meijgaard, E., Moseley, C., Pfeifer, S., Preuschmann, S., Radermacher, C., Radtke, K., Rechid, D., Rounsevell, M., Samuelsson, P., Somot, S., Soussana, J.-F., Teichmann, C., Valentini, R., Vautard, R., Weber, B., and Yiou, P.: EURO-CORDEX: New High-Resolution Climate Change Projections for European Impact Research, Reg. Environ. Change, 14, 563–578, https://doi.org/10.1007/s10113-013-0499-2, 2014. a, b, c, d, e
Jacob, D., Teichmann, C., Sobolowski, S., Katragkou, E., Anders, I., Belda, M., Benestad, R., Boberg, F., Buonomo, E., Cardoso, R. M., Casanueva, A., Christensen, O. B., Christensen, J. H., Coppola, E., De Cruz, L., Davin, E. L., Dobler, A., Dominguez, M., Fealy, R., Fernandez, J., Gaertner, M. A., Garcia-Diez, M., Giorgi, F., Gobiet, A., Goergen, K., Jose Gomez-Navarro, J., Gonzalez Aleman, J. J., Gutierrez, C., Gutierrez, J. M., Guttler, I., Haensler, A., Halenka, T., Jerez, S., Jimenez-Guerrero, P., Jones, R. G., Keuler, K., Kjellström, E., Knist, S., Kotlarski, S., Maraun, D., van Meijgaard, E., Mercogliano, P., Pedro Montavez, J., Navarra, A., Nikulin, G., de Noblet-Ducoudre, N., Panitz, H.-J., Pfeifer, S., Piazza, M., Pichelli, E., Pietikaeinen, J.-P., Prein, A. F., Preuschmann, S., Rechid, D., Rockel, B., Romera, R., Sanchez, E., Sieck, K., Soares, P. M. M., Somot, S., Srnec, L., Sorland, S. L., Termonia, P., Truhetz, H., Vautard, R., Warrach-Sagi, K., and Wulfmeyer, V.: Regional Climate Downscaling over Europe : Perspectives from the EURO-CORDEX Community, Reg. Environ. Change, 20, 51, https://doi.org/10.1007/s10113-020-01606-9, 2020. a, b
Kjellström, E., Nikulin, G., Strandberg, G., Christensen, O. B., Jacob, D., Keuler, K., Lenderink, G., van Meijgaard, E., Schär, C., Somot, S., Sørland, S. L., Teichmann, C., and Vautard, R.: European climate change at global mean temperature increases of 1.5 and 2 ∘C above pre-industrial conditions as simulated by the EURO-CORDEX regional climate models, Earth Syst. Dynam., 9, 459–478, https://doi.org/10.5194/esd-9-459-2018, 2018. a
Kotlarski, S., Keuler, K., Christensen, O. B., Colette, A., Déqué, M., Gobiet, A., Goergen, K., Jacob, D., Lüthi, D., van Meijgaard, E., Nikulin, G., Schär, C., Teichmann, C., Vautard, R., Warrach-Sagi, K., and Wulfmeyer, V.: Regional climate modeling on European scales: a joint standard evaluation of the EURO-CORDEX RCM ensemble, Geosci. Model Dev., 7, 1297–1333, https://doi.org/10.5194/gmd-7-1297-2014, 2014. a
Lafaysse, M., Hingray, B., Mezghani, A., Gailhard, J., and Terray, L.: Internal Variability and Model Uncertainty Components in Future Hydrometeorological Projections: The Alpine Durance Basin, Water Resour. Res., 50, 3317–3341, https://doi.org/10.1002/2013WR014897, 2014. a
Matte, D., Larsen, M. A. D., Christensen, O. B., and Christensen, J. H.: Robustness and Scalability of Regional Climate Projections Over Europe, Front. Environ. Sci., 6, 163, https://doi.org/10.3389/fenvs.2018.00163, 2019. a
McSweeney, C. F., Jones, R. G., Lee, R. W., and Rowell, D. P.: Selecting CMIP5 GCMs for Downscaling over Multiple Regions, Clim. Dynam., 44, 3237–3260, https://doi.org/10.1007/s00382-014-2418-8, 2015. a, b, c
Moss, R. H., Edmonds, J. A., Hibbard, K. A., Manning, M. R., Rose, S. K., van Vuuren, D. P., Carter, T. R., Emori, S., Kainuma, M., Kram, T., Meehl, G. A., Mitchell, J. F. B., Nakicenovic, N., Riahi, K., Smith, S. J., Stouffer, R. J., Thomson, A. M., Weyant, J. P., and Wilbanks, T. J.: The next Generation of Scenarios for Climate Change Research and Assessment, Nature, 463, 747–756, https://doi.org/10.1038/nature08823, 2010. a
Northrop, P. J. and Chandler, R. E.: Quantifying Sources of Uncertainty in Projections of Future Climate, J. Climate, 27, 8793–8808, https://doi.org/10.1175/JCLI-D-14-00265.1, 2014. a, b, c
R: R: A Language and Environment for Statistical Computing, Vienna, Austria, available at: https://www.R-project.org/ (last access: 17 December 2021), ISBN 3-900051-07-0, 2017. a
Rummukainen, M.: Added Value in Regional Climate Modeling, WIREs Clim. Change, 7, 145–159, https://doi.org/10.1002/wcc.378, 2016. a
Seneviratne, S. I., Nicholls, N., Easterling, D., Goodess, C. M., Kanae, S., Kossin, J., Luo, Y., Marengo, J., Mc Innes, K., Rahimi, M., Reichstein, M., Sorteberg, A., Vera, C., Zhang, X., Rusticucci, M., Semenov, V., Alexander, L. V., Allen, S., Benito, G., Cavazos, T., Clague, J., Conway, D., Della-Marta, P. M., Gerber, M., Gong, S., Goswami, B. N., Hemer, M., Huggel, C., Van den Hurk, B., Kharin, V. V., Kitoh, A., Klein Tank, A. M. G., Li, G., Mason, S., Mc Guire, W., Van Oldenborgh, G. J., Orlowsky, B., Smith, S., Thiaw, W., Velegrakis, A., Yiou, P., Zhang, T., Zhou, T., and Zwiers, F. W.: Changes in Climate Extremes and their Impacts on the Natural Physical Environment, in: Managing the Risks of Extreme Events and Disasters to Advance Climate Change Adaptation: Special Report of the Intergovernmental Panel on Climate Change, edited by: Field, C., Barros, V., Stocker, T., and Dahe, Q., Cambridge University Press, Cambridge, 109-230, https://doi.org/10.1017/CBO9781139177245.006, 2012. a, b
Sørland, S. L., Schär, C., Lüthi, D., and Kjellström, E.: Bias Patterns and Climate Change Signals in GCM-RCM Model Chains, Environ. Res. Lett., 13, 074017, https://doi.org/10.1088/1748-9326/aacc77, 2018. a
Stroeve, J. C., Kattsov, V., Barrett, A., Serreze, M., Pavlova, T., Holland, M., and Meier, W. N.: Trends in Arctic Sea Ice Extent from CMIP5, CMIP3 and Observations, Geophys. Res. Lett., 39, 16, https://doi.org/10.1029/2012GL052676, 2012. a, b
Taylor, K. E., Stouffer, R. J., and Meehl, G. A.: An Overview of CMIP5 and the Experiment Design, B. Am. Meteorol. Soc., 93, 485–498, https://doi.org/10.1175/BAMS-D-11-00094.1, 2011. a
Tramblay, Y. and Somot, S.: Future Evolution of Extreme Precipitation in the Mediterranean, Clim. Change, 151, 289–302, https://doi.org/10.1007/s10584-018-2300-5, 2018. a
Vautard, R., Kadygrov, N., Iles, C., Boberg, F., Buonomo, E., Bülow, K., Coppola, E., Corre, L., van Meijgaard, E., Nogherotto, R., Sandstad, M., Schwingshackl, C., Somot, S., Aalbers, E., Christensen, O. B., Ciarlò, J. M., Demory, M.-E., Giorgi, F., Jacob, D., Jones, R. G., Keuler, K., Kjellström, E., Lenderink, G., Levavasseur, G., Nikulin, G., Sillmann, J., Solidoro, C., Sørland, S. L., Steger, C., Teichmann, C., Warrach-Sagi, K., and Wulfmeyer, V.: Evaluation of the Large EURO-CORDEX Regional Climate Model Ensemble, J. Geophys. Res.-Atmos., 126, 17, https://doi.org/10.1029/2019JD032344, 2020. a, b, c, d, e
Vrac, M. and Friederichs, P.: Multivariate – Intervariable, Spatial, and Temporal – Bias Correction, J. Climate, 28, 218–237, https://doi.org/10.1175/JCLI-D-14-00059.1, 2014. a
Yip, S., Ferro, C. A. T., Stephenson, D. B., and Hawkins, E.: A Simple, Coherent Framework for Partitioning Uncertainty in Climate Predictions, J. Climate, 24, 4634–4643, https://doi.org/10.1175/2011JCLI4085.1, 2011. a
Zappa, G. and Shepherd, T. G.: Storylines of Atmospheric Circulation Change for European Regional Climate Impact Assessment, J. Climate, 30, 6561–6577, https://doi.org/10.1175/JCLI-D-16-0807.1, 2017. a, b
In August 2020.
- Abstract
- Introduction
- EURO-CORDEX climate projections
- Statistical assessment of mean changes and uncertainty sources
- Mean changes and related uncertainties for illustrative regions
- Spatial variability of mean changes and related uncertainty
- Main contributions to the total variance
- Individual contributions of each climate model
- Discussion
- Conclusion
- Code availability
- Data availability
- Author contributions
- Competing interests
- Disclaimer
- Acknowledgements
- Financial support
- Review statement
- References
- Supplement