the Creative Commons Attribution 4.0 License.
the Creative Commons Attribution 4.0 License.
 | 23 Nov 2021
Parameter uncertainty dominates C-cycle forecast errors over most of Brazil for the 21st century
Thomas Luke Smallman
David Thomas Milodowski
Eráclito Sousa Neto
Gerbrand Koren
Jean Ometto
Mathew Williams
Identification of terrestrial carbon (C) sources and sinks is critical for understanding the Earth system as well as mitigating and adapting to climate change resulting from greenhouse gas emissions. Predicting whether a given location will act as a C source or sink using terrestrial ecosystem models (TEMs) is challenging due to net flux being the difference between far larger, spatially and temporally variable fluxes with large uncertainties. Uncertainty in projections of future dynamics, critical for policy evaluation, has been determined using multi-TEM intercomparisons, for various emissions scenarios. This approach quantifies structural and forcing errors. However, the role of parameter error within models has not been determined. TEMs typically have defined parameters for specific plant functional types generated from the literature. To ascertain the importance of parameter error in forecasts, we present a Bayesian analysis that uses data on historical and current C cycling for Brazil to parameterise five TEMs of varied complexity with a retrieval of model error covariance at 1∘ spatial resolution. After evaluation against data from 2001–2017, the parameterised models are simulated to 2100 under four climate change scenarios spanning the likely range of climate projections. Using multiple models, each with per pixel parameter ensembles, we partition forecast uncertainties. Parameter uncertainty dominates across most of Brazil when simulating future stock changes in biomass C and dead organic matter (DOM). Uncertainty of simulated biomass change is most strongly correlated with net primary productivity allocation to wood (NPPwood) and mean residence time of wood (MRTwood). Uncertainty of simulated DOM change is most strongly correlated with MRTsoil and NPPwood. Due to the coupling between these variables and C stock dynamics being bi-directional, we argue that using repeat estimates of woody biomass will provide a valuable constraint needed to refine predictions of the future carbon cycle. Finally, evaluation of our multi-model analysis shows that wood litter contributes substantially to fire emissions, necessitating a greater understanding of wood litter C cycling than is typically considered in large-scale TEMs.
- Article
(29721 KB) - Full-text XML
- BibTeX
- EndNote


Globally terrestrial ecosystems are estimated to be a net carbon sink sequestering 3.2 ± 0.6 Pg C yr−1 or ∼ 30 % of anthropogenic CO2 emissions (Friedlingstein et al., 2019). The net carbon balance of a given ecosystem is dependent on the balance between larger (and still uncertain) gross fluxes of uptake by photosynthesis, or gross primary productivity (GPP; 80–170 Pg C yr−1; Shao et al., 2013; Joiner et al., 2018; Jung et al., 2020), and losses from plant respiration (Ra; 40–80 Pg C yr−1; assuming fixed Ra : GPP ratio 0.46; Collalti and Prentice, 2019), heterotrophic decomposition (Rhet; 57.5 ± 9.8 Pg C yr−1; Sitch et al., 2015) and disturbance such as fire (∼ 2.2 Pg C yr−1 (1997–2016); van der Werf et al., 2017). However, uncertainties associated with gross fluxes remain large; for example, the range of global GPP estimates is ∼ 60 % of the mean of estimates. Moreover, the response of terrestrial ecosystems to elevated atmospheric CO2 concentrations and associated climate change are key unknowns in the Earth system (Jones et al., 2016). Uncertainties on ecosystem responses are greatest across the tropics, where data are scarce and process models both diverge in their analysis of current C cycling and exhibit discordant C-cycle responses to projected changes in climate (Exbrayat et al., 2019; Shao et al., 2013).

Figure 1Map of the major biomes of Brazil. Amazonia and the Atlantic Forest contain largely moist tropical forest. In contrast, the Cerrado and Caatinga are hot and seasonally drought-affected savannah ecosystems with substantial conversion to agriculture. The Pantanal is covered largely by wetlands. The Pantanal region has a temperate moist climate covered largely by grasslands and agriculture. Map source: Brazilian Institute of Geography and Statistics (IBGE), Biomes and Coastal-Marine System of Brazil map, https://www.ibge.gov.br/, last access: 17 November 2020.
Brazil's ecosystems are among the most biodiverse in the world, spanning a range of biomes and climate space (Myers et al., 2000; Lapola et al., 2014): the moist tropical forest of Amazonia and the Atlantic forests, seasonally dry tropical grassland forest mosaics of the Cerrado and Caatinga, wetlands in the Pantanal and temperate grasslands in the Pampas (Fig. 1). Brazil's biomes store large quantities of carbon in their biomass and soils, but Brazil is also among the largest emitters of CO2 from land-use change and deforestation (Baccini et al., 2012; Matthews et al., 2014). Between 1990 and 2015, Brazil's forests lost 5.3 Pg C (Sanquetta et al., 2018), equating to ∼ 39 % of global forest carbon loss for the same period (Köhl et al., 2015). Moreover, the Amazon has been subject to increasingly frequent drought (Lewis et al., 2011) which significantly impacts net carbon exchange due to increased mortality and decomposition (Yang et al., 2018).
Existing process models of the terrestrial ecosystem simulate carbon stocks that differ significantly from current satellite-based Earth observation (EO)-based estimates and disagree over future trends (Sitch et al., 2008; Huntingford et al., 2013; Shao et al., 2013; Exbrayat et al., 2018a, 2019). Process-oriented terrestrial ecosystem models (TEMs) predict the response of ecosystems to changes in their environment and to disturbance (whether natural or of human origin). Analyses of ensembles of TEM simulations, which are assumed to represent the combined model structural and parameter uncertainty (Todd-Brown et al., 2013; Friend et al., 2014; Jones et al., 2016), have provided valuable information on the likely future dynamics of terrestrial ecosystems (e.g. Friend et al., 2014; Koven et al., 2015; Eyring et al., 2016; Jones et al., 2016; Zhou et al., 2018). However, as TEMs typically lack information on their parametric uncertainty, it remains unclear whether model differences are driven by different parameter estimates or model structure. Moreover, estimated responses to environmental change are sometimes contradictory between studies indicating model-ensemble-specific (i.e. model) conclusions (Zhou et al., 2018). For example, using the Inter-Sectoral Impact Model Intercomparison Project (ISI-MIP) ensemble, Friend et al. (2014) showed that on global scales inter-model differences in the mean residence time (MRT) of biomass dominated uncertainty in future carbon stocks, rather than differences in carbon inputs from photosynthesis, while the analysis by Koven et al. (2015), using the CMIP5 ensemble, indicated the reverse. Also using the CMIP5 ensemble, Todd-Brown et al. (2013) showed that while on average simulated soil carbon stocks could be explained by carbon inputs and residence time, there was substantial between-model variation as a result of model structural and parameter differences. Lacking a common basis for calibration and evaluation, model intercomparisons have struggled to identify and reduce uncertainties surrounding model structure and parameterisation.
Ecosystem parameters that drive C exchanges (e.g. plant traits) are known to be highly variable both in space and often in time, even within a given biome (e.g. moist tropical forest) (Butler et al., 2017; Exbrayat et al., 2018b; Kattge et al., 2020). Moreover, field-based studies such as those across the Amazon basin have identified substantial spatial variation and trade-off among ecosystem variables including allocation of net primary productivity to plant tissue, MRTs of C pools and carbon use efficiency (CUE) (NPP / GPP) (Doughty et al., 2015; Malhi et al., 2015). In contrast, the majority of TEMs represent ecosystems processes using a limited number of plant functional types (PFTs), which assume a single parameterisation for each biome (i.e. all moist tropical forests are assumed to have the same traits). These TEMs therefore lack spatial variation in the traits that governs the response of ecosystems to changes in their environment, such as disturbance by fire (e.g. Exbrayat et al., 2018b). Furthermore, PFTs are typically calibrated and evaluated at a single site, which may not be representative of a given biome's mean dynamics (Kuppel et al., 2012).
Model–data fusion (MDF) approaches offer an opportunity to use a diverse array of observations to calibrate and evaluate TEMs by updating their current state and/or refining their parameters, weighted by observation uncertainty. For example, Exbrayat et al. (2018b) calibrated an intermediate complexity C-cycle model independently in each 1∘ × 1∘ pixel across the tropics using (among other data) location- and time-specific information on leaf area index (LAI), biomass and burned area from EO. Their analysis showed substantial within-biome variation in ecosystem variables (and model parameters) in response to varied intensity and frequency of fire. Such variations and parametric uncertainty are neglected in a classical PFT-based TEM framework, introducing errors into their representation of ecosystem C dynamics. A critical output of a location-based approach is the retrieval of both parameter magnitude and parameter uncertainty information at site level (i.e. pixel or grid cell). Such information can highlight the greatest unknowns, underpin explicit uncertainty propagation into future environments (e.g. climate change) and directly investigate the parameter-process uncertainty interactions that drive changes in ecosystem C stocks.
Uncertainty in future carbon cycle simulations (e.g. Arora et al., 2020) is dominated by combined model structure and parameter uncertainty; however, there remains a substantial contribution due to variations between climate change scenarios themselves (Lovenduski and Bonan, 2017; Bonan and Doney, 2018). The potential mean global warming is estimated to be 1.7–5 ∘C by 2100 (IPCC, 2014). This uncertainty is driven largely by broad ranges in anthropogenic emissions and land-use and land-cover change for which there are many plausible pathways leading to different atmospheric CO2 concentrations (O'Neill et al., 2016) for use in model intercomparisons (e.g. Eyring et al., 2016). For example, Bonan et al. (2019) showed that both land-use and climate change scenarios had a significant impact on TEM-simulated terrestrial carbon stocks, indicating the need to include future scenarios in any uncertainty partitioning experiment.
Here, we use the CARbon DAta MOdel fraMework (CARDAMOM; Bloom et al., 2016) to calibrate a suite of five intermediate complexity TEMs across Brazil (1∘ × 1∘ pixel; 2001–2017; monthly time steps) to retrieve ensembles of pixel-specific parameters. These localised parameter ensembles provide explicit estimates of parameter uncertainty and its spatial variability. The five models have a common basic structure, but progressively more complex process representation, allowing quantification of the model ensembles' structural uncertainty. Moreover, our approach mimics the typical TEM model development process where incremental changes in process representation are evaluated for their impact on simulated outcomes (e.g. Mercado et al., 2009; Verheijen et al., 2015; Jones et al., 2020), while we go further by explicitly quantifying the associated parametric uncertainty which is usually unavailable. Comparison of the dynamics of this model ensemble against independent estimates of the Brazilian C cycle quantifies whether a given change in model structure (i.e. added complexity) leads to an improvement, degradation or equally valid C-cycle analysis. Once calibrated, we simulate each model for each pixel over a parameter ensemble and under multiple climate change scenarios providing quantification of climate scenario uncertainty to 2100.
Using this approach, we address the following research questions:
-
Does increasing model complexity improve agreement with independent evaluation information? Firstly, we hypothesise that including a water-cycling submodel will reduce photosynthesis due to soil moisture limitations and so improve model outputs for the drier Cerrado and Caatinga regions. Secondly, we hypothesise that inclusion of a wood litter pool will increase fire emissions by adding another combustible dead organic matter pool and improve estimated emissions particularly within areas of forest cover loss such as the south eastern edge of the Amazon (the arc of deforestation).
-
How is uncertainty associated with predicted carbon stocks partitioned between (i) parameter estimates, (ii) model structure and (iii) the projected climate change scenario? We hypothesise that the climate change scenario will contribute a minor component to the overall uncertainty, consistent with the results found by Bonan et al. (2019). Additionally, we hypothesise that parameter uncertainty will be largest in areas of large biomass and soil carbon stocks (i.e. Amazon and Atlantic forests) due to larger uncertainties found in observational constraints at larger values, whereas model structure uncertainty will be more important in regions with lower stocks and more seasonality in fluxes, such as the Cerrado.
-
Is forecast uncertainty more strongly linked to the MRT of biomass or differences in carbon inputs from photosynthesis? How does the relative importance of these factors vary spatially across biomes and among models with different process representation? We hypothesise that biomes with stronger environmental constraints on production, for instance, dry tropics compared to moist tropics, will have errors dominated more by this process than MRT.
We investigate these questions at the scale of Brazil and also for its key biomes to determine if there are regional differences. We conclude with an assessment of key steps required to produce more robust projections of how Brazilian C stocks will respond to future forcing. The novelty of this study is to compare C-cycle projections that include propagated error from model calibration at pixel scale, for a range of models with difference process controls on C cycling, allowing a robust data-constrained analysis.
Table 1Summary information of process representations and total number of calibrated parameters of the different Data Assimilation Linked Ecosystem Carbon (DALEC) models. Model complexity increases from models M1–5. ACM is the Aggregated Canopy Model used to predict photosynthesis (GPP), with ACM1 the simplest version and ACM2 more complex with links to water balance. Plant respiration (Ra) can be determined as a simple ratio of GPP or by separate maintenance (Rm) and growth (Rg) components.
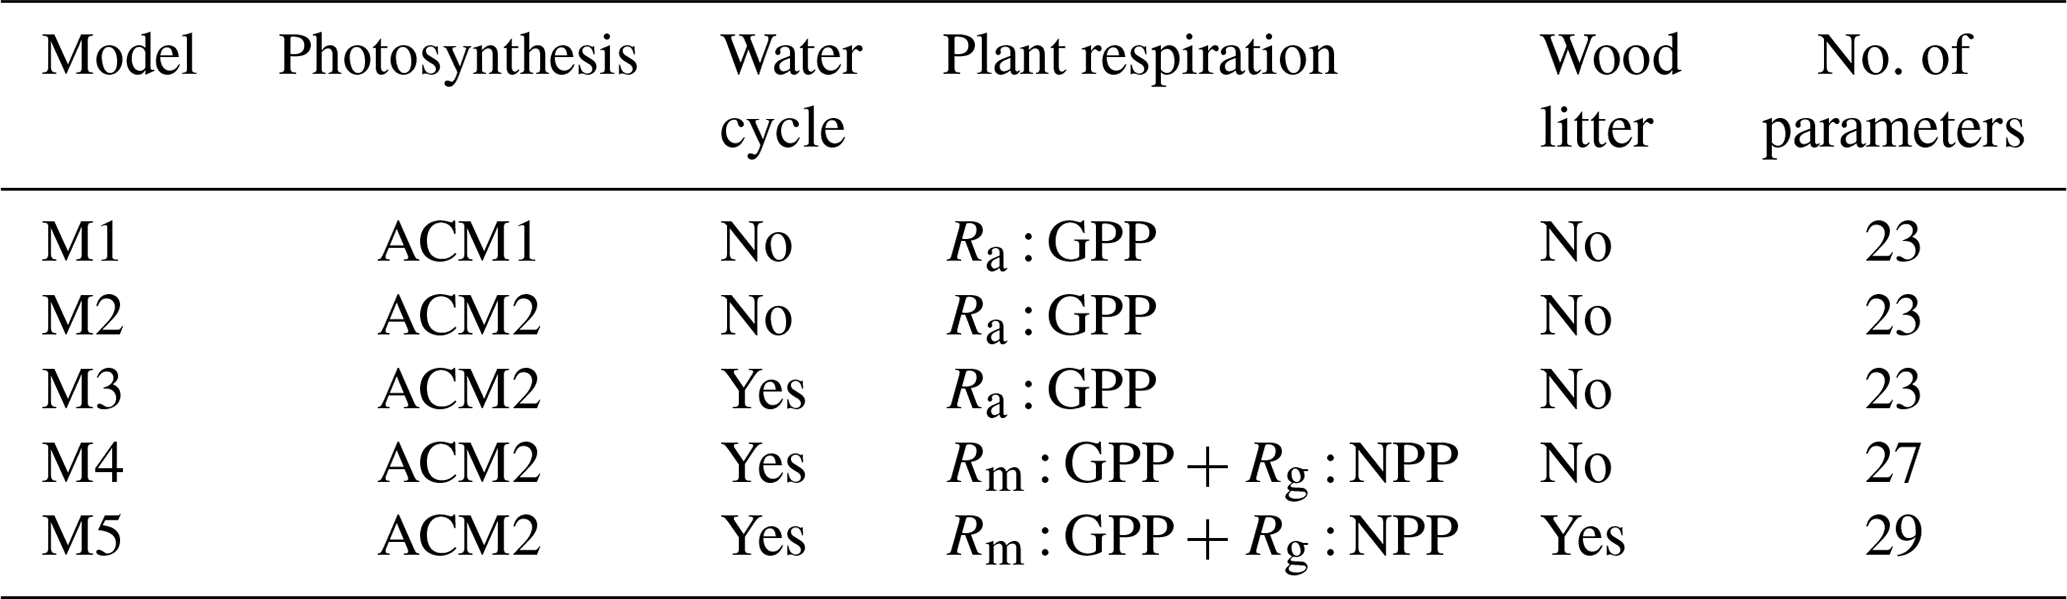
We use CARDAMOM (Bloom et al., 2016) to perform a MDF analysis of Brazil at 1∘ × 1∘ spatial (702 pixels) and monthly temporal resolutions between 2001 and 2017 (inclusive). CARDAMOM retrieves ensembles of model parameters independently for each location (see Sect. 2.1) as a function of location-specific observational constraints (see Sect. 2.3). To quantify model structural uncertainty, parameters are retrieved for five versions of the Data Assimilation Linked Ecosystem Carbon (DALEC) terrestrial ecosystem model, of differing complexity (see Sect. 2.2; Table 1). The DALEC calibrations are evaluated using independent estimates of net biome exchange (NBE) of CO2, GPP and fire (see Sect. 2.4). The calibrated DALEC models are then simulated into the future under four climate change scenarios (see Sect. 2.5) used in phase 6 of the Coupled Model Intercomparison Project (CMIP6; O'Neill et al., 2016).
2.1 CARDAMOM
CARDAMOM is a MDF framework which uses a Bayesian approach within an adaptive proposal – Markov chain Monte Carlo (AP-MCMC) to estimate ensembles of DALEC model parameters (x; Table A1) consistent with observational constraints and their uncertainties (Haario et al., 2001; Rodríguez-Veiga et al., 2020). CARDAMOM analyses are conducted independently for each pixel location and repeated three times (each repeat is known as a chain). Each chain assesses 100 million parameter proposals, drawn from uniform prior ranges, from which a subsample of 1000 accepted parameter vectors are stored. Parameters from the second half of the accepted subsample are used for post-processing, as we expect the chains to have converged by this point and thus represent a realistic approximation of the real pixel-level uncertainty. The chains are used to assess AP-MCMC quality; in each location, the chains are expected to statistically converge based on the Gelman–Rubin convergence criterion (Gelman and Rubin, 1992). Any location which did not achieve convergence is re-run. For further details, see Sect. A1 in the Appendix.
Pixel-level uncertainties are estimated directly from the CARDAMOM-retrieved ensembles of parameters and their model-generated C stocks and fluxes. However, we lack a robust understanding of how uncertainties are correlated in space, making the propagation of uncertainties from the pixel level to Brazil wide challenging. Assuming an intermediate value would lead to an arbitrary estimate of uncertainty while assuming either fully correlated or uncorrelated uncertainties leads to either an over- or under-estimate in Brazil-wide uncertainties, respectively. To be conservative, here, we assume uncertainties are fully correlated when propagating from pixel-level to Brazil-wide estimates. To allow for non-Gaussian distributions in the pixel-level ensembles, we assume that the fully correlated assumption is approximated by aggregating the pixel-level 5 % and 95 % quantiles across Brazil as previously done (e.g. Exbrayat et al., 2018b). Again, to be conservative, we will only discuss in detail between-model differences which are also supported in the pixel-level estimates.
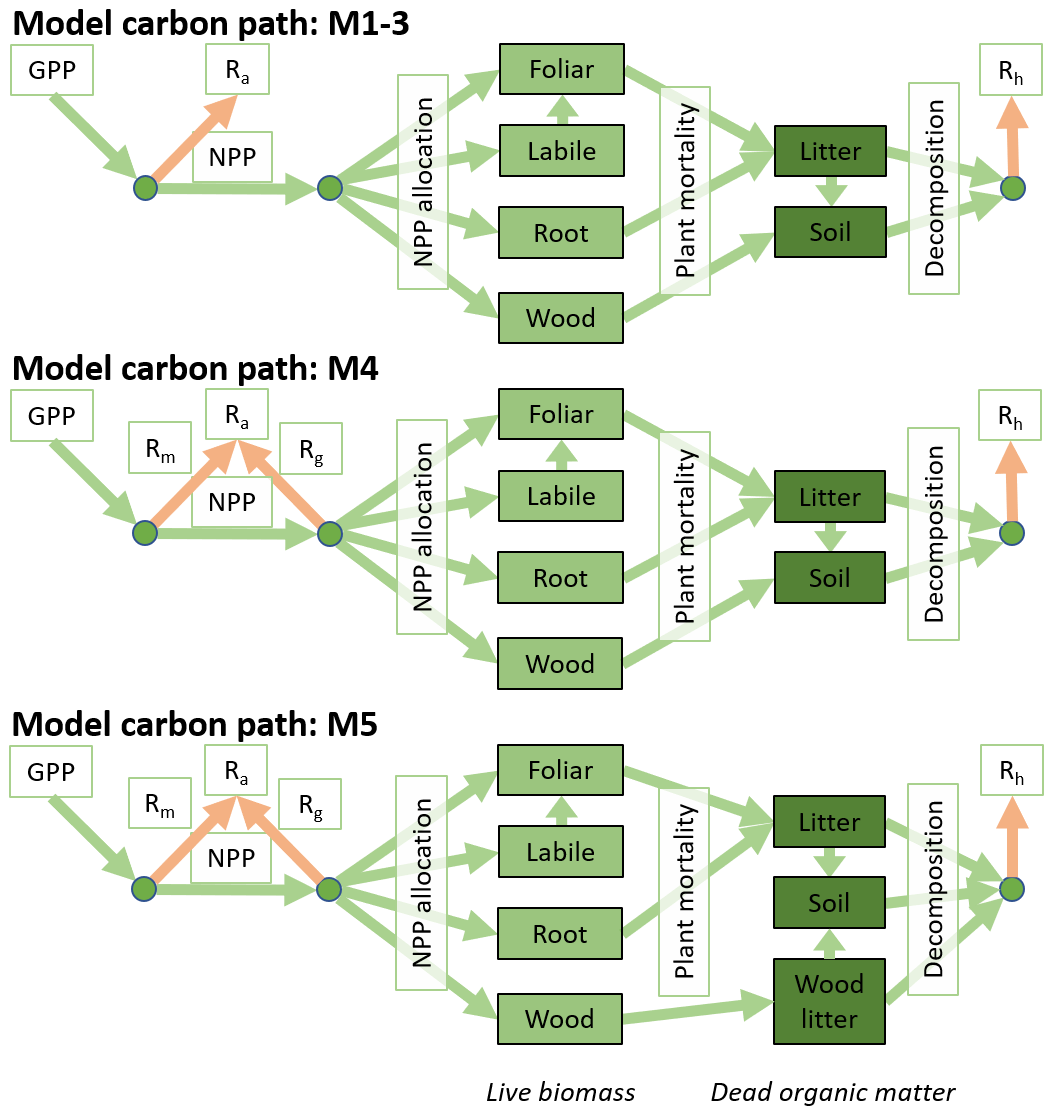
Figure 2The five DALEC versions include three carbon cycle structures. The top row shows the DALEC model carbon structure as previously described in Bloom and Williams (2015) as is used for M1–3. The middle row shows M4 where Ra is partitioned between Rm and Rg. The bottom row shows the inclusions of a wood litter pool used in M5.
2.2 DALEC models
The DALEC model suite used here comprises five related intermediate complexity models of the terrestrial carbon cycle (M1–5). Each model version tracks the state and dynamics of live and dead carbon pools, their interactions and their response to climate and exogenous factors such as fire or disturbance. The complexity (numbers of carbon pools, their connectivity) and process representation (component submodels of varying complexity) vary between DALEC models. There are three alternate carbon cycle structures (Fig. 2), plus a range of different submodels (Table 1). The submodels are related to different simulations of GPP, Ra, and carbon–water interactions. These submodels build on a common baseline structure, facilitating efforts to disentangle the impact of each specific process representation. Due to their varied complexity the DALEC models have different numbers of parameters which are calibrated for each location. DALEC parameters for each model can be found in Table A1 including a summary of the key features of each model in Sect. A2 in the Appendix.
2.3 Observational constraints and driving information
CARDAMOM uses a diverse array of data as both observational constraint and model inputs. Information on LAI (time series), above-ground biomass (AGB) and soil carbon includes assimilated observations with an associated uncertainty. Meteorology, burned area, forest cover loss and soil texture (sand/clay fractions) are inputs without uncertainty. Summary information on the assimilated observations and their uncertainties is shown in Fig. A1.
2.3.1 Leaf area index
Time series information on LAI magnitude and uncertainty is extracted from the 1 km × 1 km 8 d product from Copernicus Service Information (2020). LAI was aggregated to the analysis resolution. Each LAI estimate has a corresponding uncertainty value; however, the robustness of the uncertainty provided with EO LAI products remains unclear (Zhao et al., 2020). To be conservative, we assumed the maximum uncertainty value reported from the raw data used in the aggregation of each time step. Each pixel will typically assimilate 204 EO-based LAI estimates, i.e. 12 months × 17 years.
2.3.2 Wood C
A single estimate per pixel of AGB and uncertainty is extracted from a combination of the Avitabile et al. (2016) and Longo et al. (2016) maps. Avitabile et al. (2016) combines multiple years of EO and field data to create a pan-tropical map nominally representative of 2007. Longo et al. (2016) covers the Brazilian Amazonia only and uses field inventory and airborne lidar explicitly representing 2014. These maps are created using different source data and algorithms; they will contain unique errors and bias. Therefore, we use the Longo et al. (2016) map to provide constraint on Amazonian AGB and the Avitabile et al. (2016) map elsewhere (Fig. A1).
The DALEC models simulate a combined above- and below-ground woody pool. To link the AGB maps to the simulated wood pool, we use an allometric relationship to estimate the below-ground biomass (BGB) following Saatchi et al. (2011) (units of Mg ha−1).
AGB uncertainty is similarly converted based on the allometric equation neglecting statistical uncertainty of the allometric equation itself. Wood C and its uncertainty are then spatially aggregated assuming uncorrelated uncertainties as error covariance remains unknown.
2.3.3 Soil C and texture
Location-specific estimates of soil carbon and sand/clay fraction are extracted from the SoilGrids database (Hengl et al., 2017). Soil carbon is used as a prior on the initial soil carbon stock, while soil texture information is used as an input to the soil hydrology submodel. SoilGrids uses inventory data of soil properties and interpolates these across a 250 m × 250 m grid using a machine learning (ML) approach (Hengl et al., 2017). However, SoilGrids lacks an estimate of uncertainty. For simplicity, we assumed an uncertainty was the standard deviation of the spatially aggregated dataset.
2.3.4 Disturbance
Fire and forest biomass removal was imposed using EO information. The MODIS burned fraction product (Giglio et al., 2018) determines the areas where fire is imposed. Emissions are determined assuming a fraction of simulated biomass undergoes combustion or is converted to litter based on tissue-specific combustion-completeness factors, following Exbrayat et al. (2018b). Forest biomass removal is imposed using the Global Forest Watch (GFW) forest cover loss product (Hansen et al., 2013). GFW provides the year in which a forest area is removed, with biomass losses assumed to occur evenly across the year. All biomass is assumed to be subject to removal, except fine roots which remain in the ecosystem.
2.3.5 Meteorological drivers
Meteorological drivers are drawn from the Climatic Research Unit and Japanese reanalysis (CRU-JRA) v1.1 dataset, a 6-hourly 0.5∘ × 0.5∘ reanalysis (University of East Anglia Climatic Research Unit and Harris, 2019). Atmospheric CO2 concentration is taken from the Mauna Loa global CO2 concentration (https://www.esrl.noaa.gov/gmd/ccgg/trends/, last access: 22 August 2020). Due to their differing complexities, the DALEC models use different drivers. All models use temperature, short-wave radiation and atmospheric CO2 concentrations. M2–5 additionally use vapour pressure deficit and wind speed. M3–5 use precipitation. Summary information for mean climate is shown in Fig. A2.
2.4 Evaluation of models against independent data
To address research question 1, the five models were evaluated against a series of independent data on NBE of CO2, GPP and fire emissions. These datasets were derived from atmospheric inversions, upscaling from flux measurements and from remote sensing of burned area. A key evaluation metric is the degree of consistency at pixel level between the DALEC models and the independent historical evaluation data. We define consistency as the pixel-level ensemble of DALEC C-cycle estimates overlapping independent observations at > 90 % of observed time steps.
CarbonTracker Europe (CTE) is a widely used atmospheric inversion system which estimates NBE by combining time-varying prior information on NBE along with imposed CO2 fluxes from fire, fossil fuels and ocean exchange with observations of atmospheric CO2 concentrations (van der Laan-Luijkx et al., 2017). A single CTE analysis which spans the whole analysis period (2001–2017) is used to provide a long-term comparison of the trend in NBE (van der Laan-Luijkx et al., 2017). Spatial comparisons are restricted to the 2009–2017 period using the dataset described below.
An ensemble of 15 analyses (1∘ × 1∘; 2009–2017) which builds on the CarbonTracker South America (CT-SAM) framework provided robust uncertainty estimates of NBE. In addition to CTE's standard atmospheric measurements, CT-SAM includes airborne estimates focused over the Amazon forest (Gatti et al., 2014) and uses zoom regions over South America for improved atmospheric transport (van der Velde et al., 2015). The ensemble uses five net ecosystem exchange (NEE) priors and three fire emission drivers (combined to estimate NBE) but with a common set of atmospheric constraints and transport model (Schaefer et al., 2008; Bodesheim et al., 2018; van Schaik et al., 2018; Haynes et al., 2019; Koren, 2020). The mean pixel-level uncertainty between ensemble members is ∼ 0.5 g C m2 d−1 which, due to the near-neutral estimates, is ∼ 50 times the mean value. By using a range of priors, it covers the uncertainty in the seasonal variation of C fluxes in tropical regions (Saleska et al., 2003; Restrepo-Coupe et al., 2013; Koren et al., 2018; Mengistu et al., 2020). In the remainder of this text, the CTE and CT-SAM datasets are collectively referred to as CTE.
Evaluation of GPP is provided by the combination of three independent estimates of GPP (FLUXCOM, Copernicus and FluxSat v2). FLUXCOM GPP is estimated by an ensemble of ML approaches driven with meteorological reanalysis and EO-derived vegetation indices and calibrated using eddy covariance information drawn from the FLUXNET network (Jung et al., 2020). FLUXCOM has been widely evaluated using eddy covariance information and has been used to evaluate TEMs (Jung et al., 2020). Copernicus gross dry matter productivity (i.e. GPP; Copernicus Service Information, 2020) uses a modified Monteith (1972) approach which estimates GPP as a function of absorbed photosynthetically active radiation, temperature, atmospheric CO2 concentration and land-cover-specific parameters. FluxSat v2 combines MODIS reflectance and meteorological information within a ML framework to estimate GPP (Joiner et al., 2021). Similar to FLUXCOM, FluxSat v2 is calibrated using observations from the FLUXNET network. Collectively, these independent GPP estimates are assumed to represent a more realistic estimate of GPP uncertainty (mean of ∼ 1.2 g C m2 d−1 or 20 %) from observation-orientated sources for comparisons with CARDAMOM-DALEC.
Independent estimates of fire emissions are drawn from the Global Fire Emissions Database version 4.1s (GFEDv4.1s (2001–2017); van der Werf et al., 2017) and the Global Fire Assimilation System (GFAS (2003–2017); Kaiser et al., 2012). Neither product comes with uncertainty information. GFEDv4.1s uses MODIS burned area to impose fire on a TEM with actual emissions determined based on the simulated magnitude of carbon pools at steady state in conjunction with pool-specific combustion-completeness parameters (van der Werf et al., 2017). The GFAS product uses MODIS radiative energy and active fire products combined with ecosystem-specific parameters to estimate carbon emissions from fire (Kaiser et al., 2012). As these products are based on fundamentally different approaches, we assume that the range between them approximates the fire emissions uncertainty (mean of ∼ 0.04 g C m2 d−1 or ∼ 100 %). We evaluate DALEC for their overlapping period (2003–2017).
2.5 Analysing the drivers of forecast uncertainty
To project DALEC to 2100, future climate drivers were extracted from the UK Earth System Model (UKESM; Sellar et al., 2019) contribution to CMIP6 (Eyring et al., 2016). This study uses the core Shared Socioeconomic Pathway (SSP) scenarios – SSP1-2.6 W m−2, SSP2-4.5 W m−2, SSP3-7.0 W m−2, SSP5-8.5 W m−2 – spanning a mean global warming of 1.7–5 ∘C (O'Neill et al., 2016). The scenarios are also used to impose future forest biomass extraction. The contemporary meteorology from observations differs from that generated in the climate models used to project future climate. As a result, there are step changes in drivers between historical and future climate, impacting the simulation of the carbon cycle in an unrealistic manner. To avoid these step-change impacts, future meteorology is imposed as an anomaly relative to 2018. Specifically, each month of the future meteorology extracted from the UKESM has the corresponding month from 2018 subtracted creating the anomaly time series; i.e. for each month of 2018, the anomaly would be equal to 0. The anomalies are then added to the absolute values of the monthly values from 2018 from the calibration meteorology time series but with sanity checks to prevent negative values in positive definite variables. The mean temperature (M1–5), incoming short-wave radiation (M1–5), vapour pressure deficit (M2–5), wind speed (M2–5) and precipitation (M2–5) anomalies for each scenario are shown in Fig. A3. The time series of future atmospheric CO2 concentration is prescribed for each scenario. Disturbance due to forest harvest is driven by the management scenarios associated with each SSP. However, as DALEC does not represent land-cover types, we neglect land-use change in the drivers. Thus, any forest which undergoes biomass removal subsequently remains a forest and is allowed to regrow. Finally, as we currently lack a predictive model of fire in DALEC (i.e. we drive fire with EO burned area), we extended observed fire for the contemporary period into the future simulations.
Model analyses quantified the relative contribution of variation in model parameters, model structure and climate change scenario to overall uncertainty in the simulation of biomass and dead organic matter (DOM) to 2100. Parameter uncertainty was estimated to be the 90 % CI resulting from the simulation of the retrieved parameter ensembles. Model structural uncertainty was estimated as the between-model range of the pixel-level median estimates. Both parametric and structural uncertainties were estimated for each climate change scenario and then averaged across scenarios to provide an overall estimate. Climate change scenario uncertainty was estimated as the pixel-level range of median estimates across scenarios for each model. This analysis addresses research question 2.
To address question 3, quantifying the role of key ecosystem traits (NPP partitioning and MRTs) on C stock trajectories, the ensemble of pixel-level estimates of GPP, CUE, NPP allocation and MRTs is correlated with the ensemble of biomass and DOM stock change estimated between 2001–2100. It is the ensembles of per-pixel parameters, and by extension ensembles of C stock and flux estimates, that uniquely allow CARDAMOM to explicitly quantify the uncertainty in critical ecosystem properties with C stock dynamics.
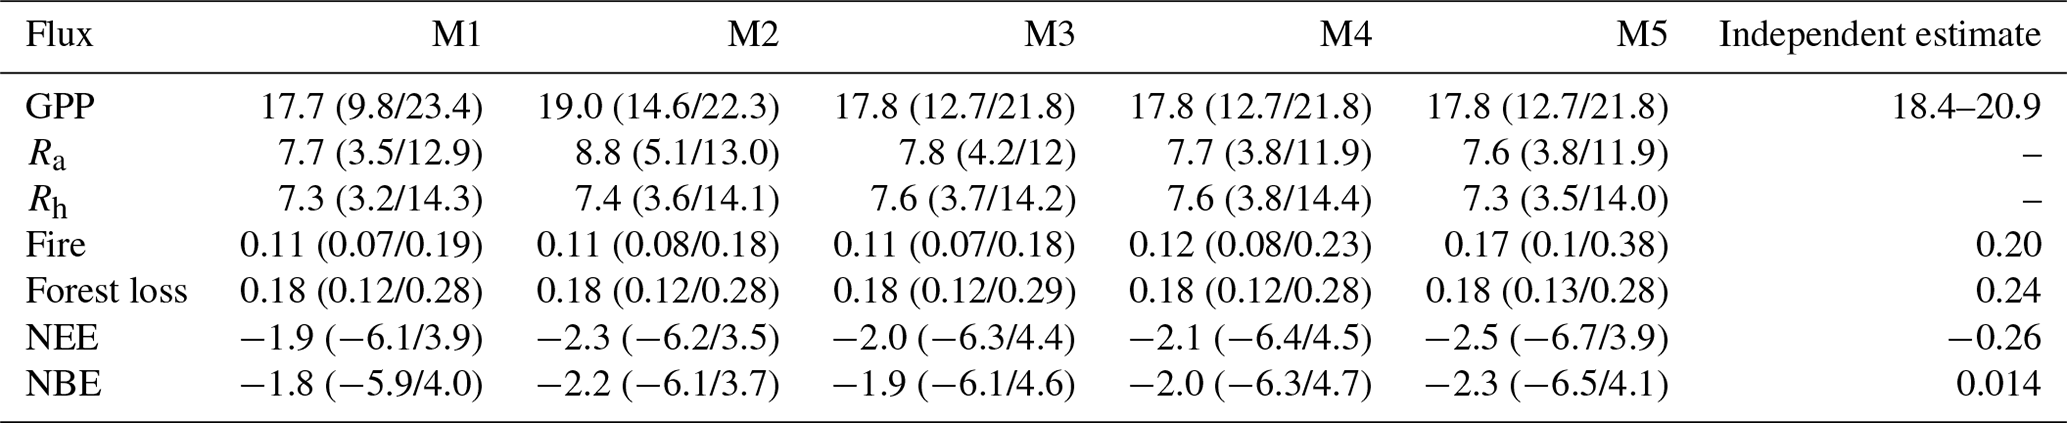
Table 2Summary of Brazil-wide carbon budgets for each DALEC model and independent estimates. Fluxes are GPP, autotrophic respiration (Ra), heterotrophic respiration (Rh), forest biomass loss, carbon emissions due to fire, NEE of CO2 (Ra + Rh − GPP) and NBE (NEE + fire). All units are in Pg C yr−1. Values given as the median pixel-level estimates averaged across Brazil, while values in parentheses are averaged Brazil-wide for the 5 % and 95 % quantiles, i.e. assuming fully correlated uncertainties. Independent estimates are derived from FLUXCOM FluxSat v2 and Copernicus for GPP, GFW (for forest loss), Global Fire Emissions Database v4.1s for fire and CarbonTracker Europe for NBE. The time period of all data is 2001–2017.
We conducted MDF analyses to retrieve ensembles of location-specific parameters for five DALEC models of varied complexity across Brazil. Each model simulated the calibration data with a good degree of skill, returning similar likelihood scores (R2 > 0.98; Figs. 3–5, A4 and A5). Simulated NBE, GPP and fire emissions have been evaluated at 1∘ (Fig. 4) and national scale (Fig. 5; Table 2) against independent estimates. The 1∘ spatial parameter ensembles show that there is a strong dependency between NBE and wood stocks (R2 > 0.8; Fig. A6). Furthermore, we quantify the reduction in posterior parameter distributions relative to their prior ranges, which indicates substantial variability both spatially (Fig. A7), between parameters (Table A2) and parameters representing different ecosystem components (Table A3). The DALEC parameter ensembles have been projected to 2100 (Fig. 6) and show that parameter, not structure or climate change scenario, dominates overall uncertainty in most areas (Fig. 7). Finally, using the parameter ensembles to quantify the correlation between ecosystem variables and future carbon stock dynamics, we identify allocation of NPP to wood (NPPwood) and MRTwood as targets for further constraint on model forecasts (Figs. 8 and 9).
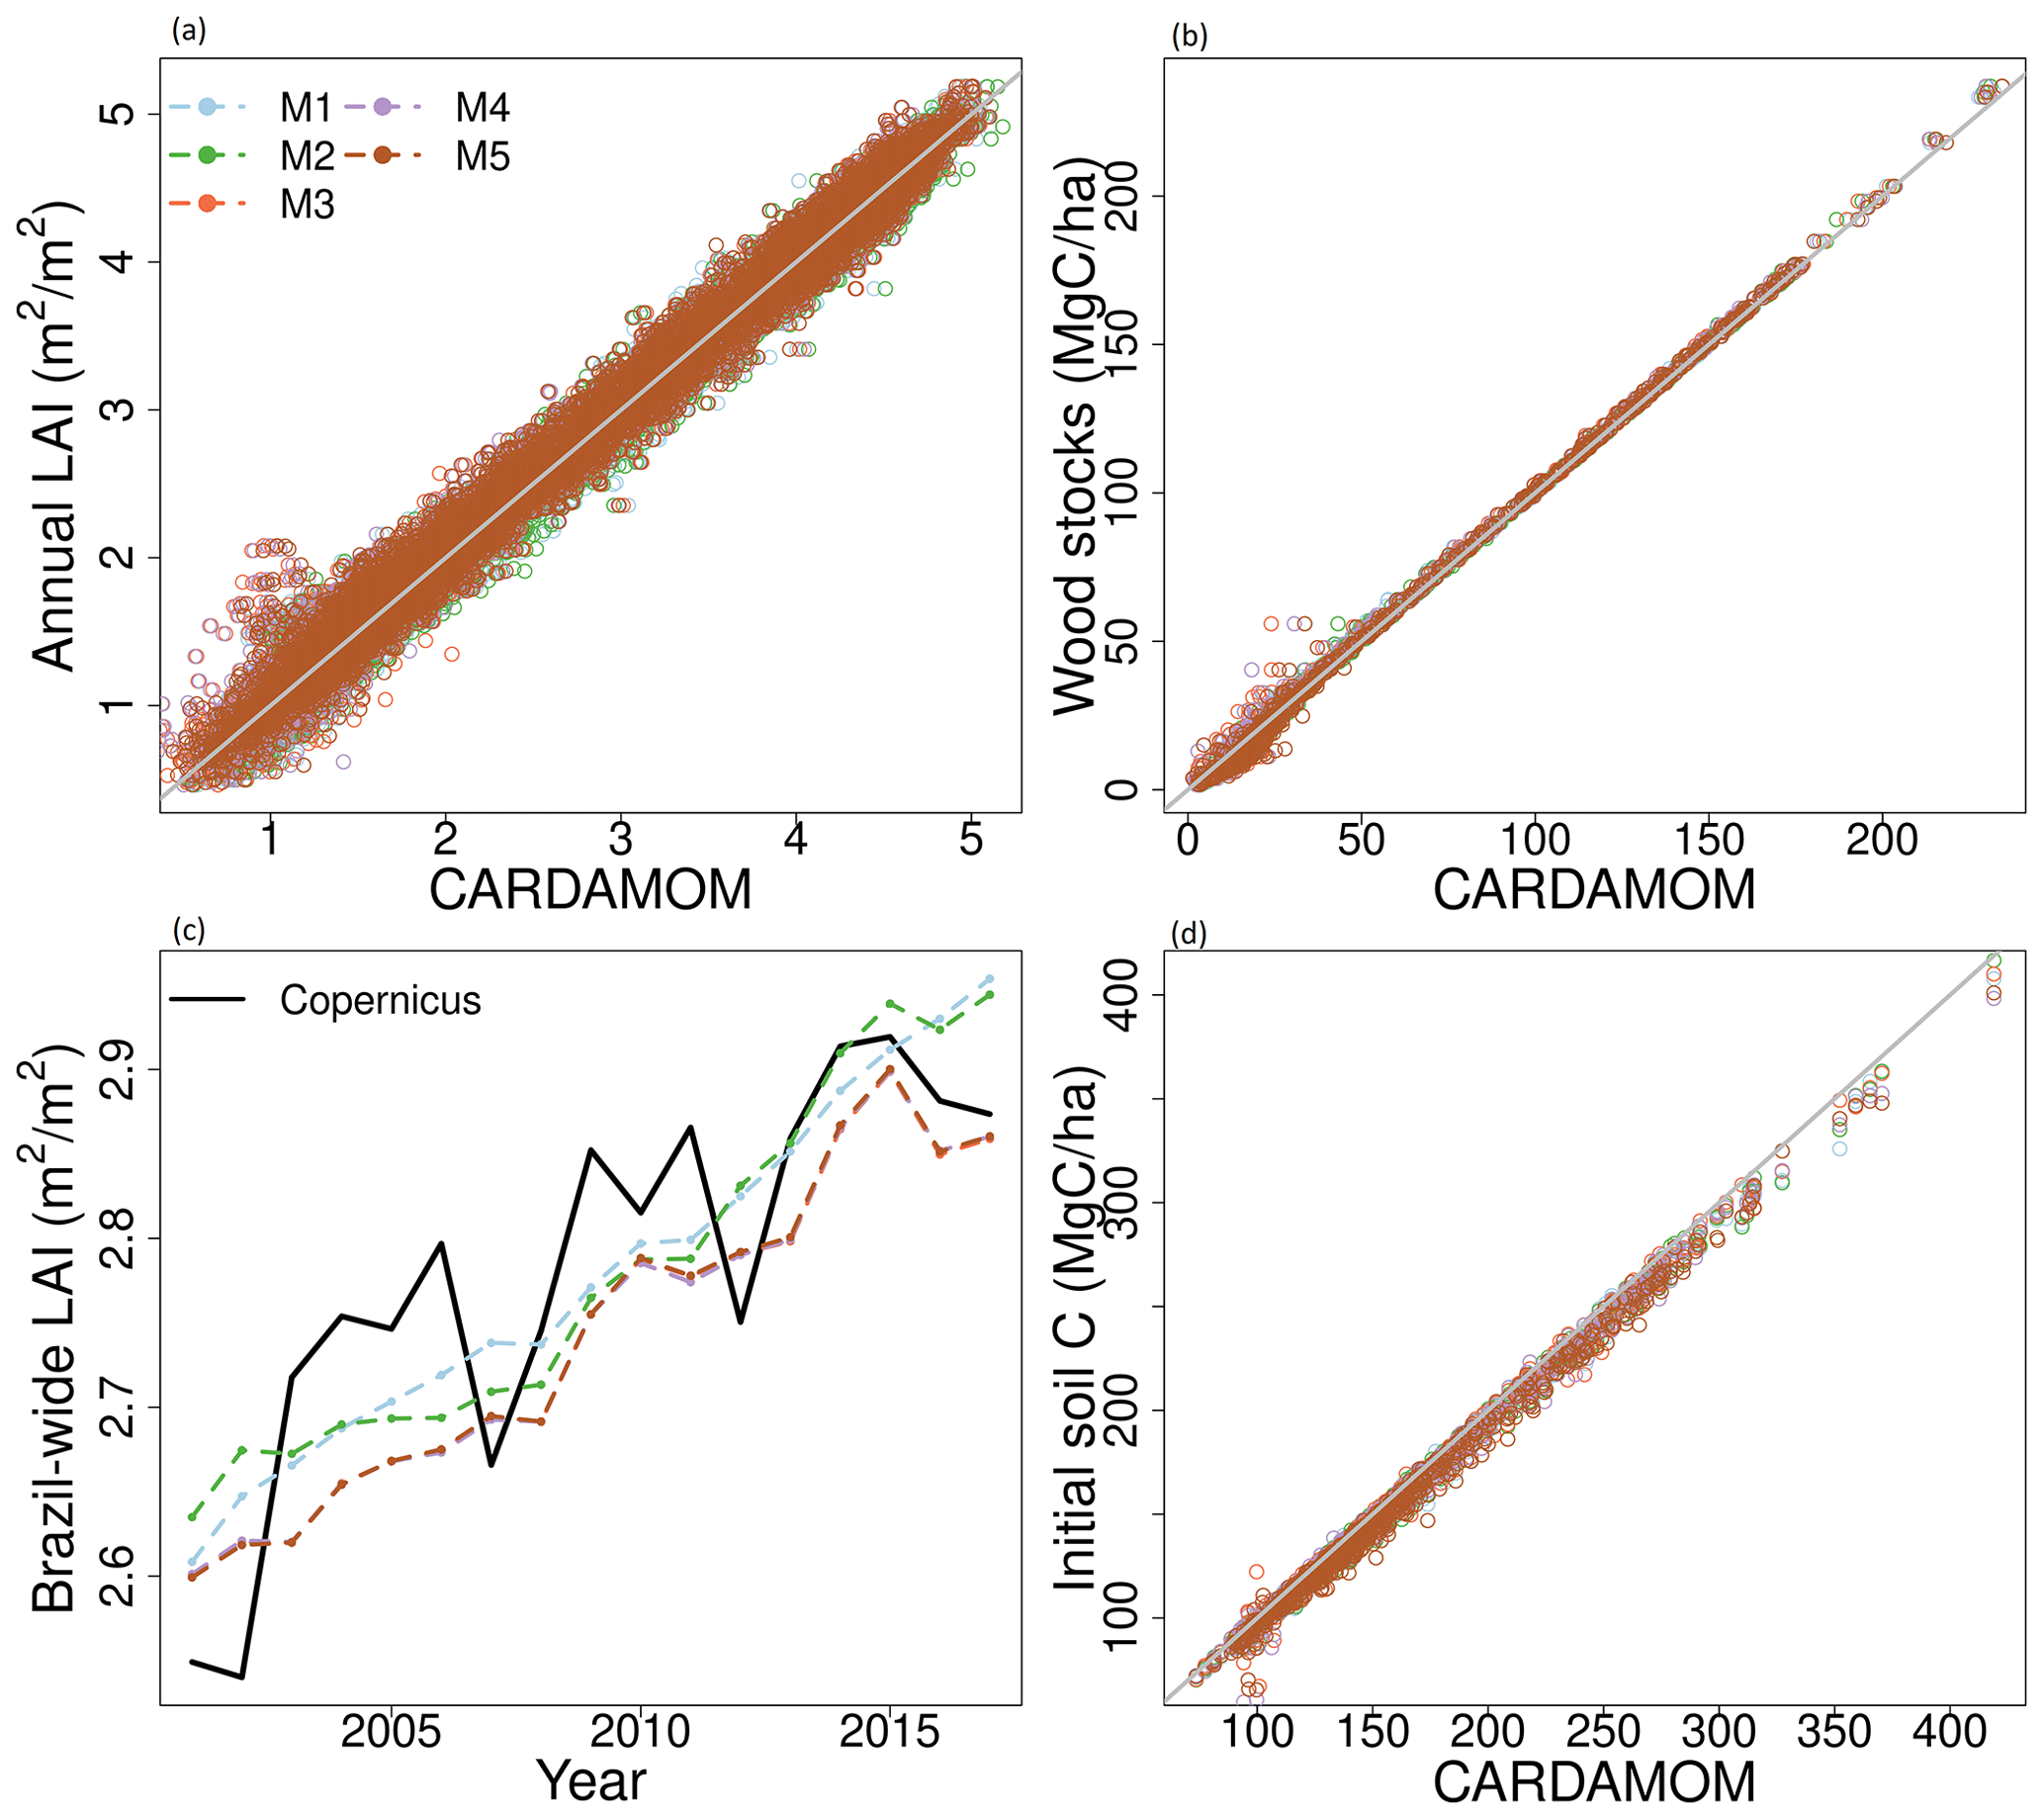
Figure 3Comparison between observational constraints used to calibrate the DALEC models and the corresponding model outputs. The grey line (a, b, d) shows the 1:1 line. LAI is presented as a pixel-wise comparison of the mean annual LAI (a) and as a Brazil-wide average time series highlighting the long-term trend of increasing LAI (c). The colours of the lines shown in panel (c) represent the different models matches that are shown in the legend in panel (a).
3.1 Calibration constraints
All DALEC models match their calibration information with a high degree of skill (Fig. 3). The root mean square error (RMSE) is small for LAI and the initial soil carbon stock (< 5 %). The RMSE between simulated wood stocks and calibration observations is larger in wood stocks (< 16 %) and is dominated by a model–observation mismatch at smaller wood stocks (< 50 Mg C ha−1; 20 %–28 %) with smaller errors (< 1 %) otherwise. The calibrated Ra : GPP (CUE = 1 − Ra : GPP) fraction across Brazil is consistent with the assimilated prior (M1, 4, 5 are 0.43; M2 is 0.46; M3 is 0.44) for each model (mean deviation < 0.06; prior of 0.46 ± 0.12; Fig. A5). The largest deviations from the prior are found in the Caatinga (Fig. A5), a hot, dry biome with mean air temperature > 25 ∘C and rainfall < 800 mm yr−1 (Fig. A2). In M2 (ACM2, no water cycle), the Caatinga has a higher Ra : GPP (deviations up to 0.33), while models M3–5 (ACM2, with water cycle) estimate a lower Ra : GPP in the Caatinga (deviations up to −0.25). M1 shows no substantial spatial patterning (ACM1, no water cycle). The inter-model differences follow the switching between photosynthesis models and the inclusion of the water cycle, indicating that drought stress has a significant impact on Ra : GPP (Table 1).
The reduction of parameter uncertainty between the 90 % confidence interval and the prior range is highly variable across Brazil, between parameters and to a lesser extent models (Tables A2 and A3, Fig. A7). The reduction in the parameter posteriors relative to the prior bounds (1 − posteriorCI90 : prior range) varies between models (M2 of 0.55, M5 of 0.46; Table A2) but with much larger variability between parameters (Rhet coefficient of 0.12, initial soil of 0.96) and across Brazil (0.62–0.7 for the Caatinga, 0.42–0.5 for the Amazon; Fig. A7). The spatial pattern across Brazil broadly follows the spatial distribution of precipitation (Fig. A2). The greatest reduction in posterior parameter uncertainty is typically achieved in M2 with the lowest in M5 and broadly similar values in M1, 3 and 4. Parameters related to initial C conditions and canopy phenology are best constrained, as expected given the majority of observations directly relate to these parameter groups, while NPP allocation and turnover-/decomposition-related parameters are least constrained in the posterior (Table A3).
3.2 Independent evaluation of Brazilian C cycling
DALEC-simulated NBE was statistically consistent with the CTE ensemble at the 90 % confidence interval (CI) across > 95 % of Brazil (2009–2017; Fig. 4); i.e. there is overlap between CARDAMOM's 90 % CI and the spread of estimates from the CTE ensemble across > 90 % of time steps with CTE estimates. Moreover, both CTE and DALEC models indicate a long-term decreasing trend in NBE (i.e. increasing net carbon uptake) (Fig. 5). While statistically consistent, there is a persistent negative bias between DALEC and CTE (i.e. DALEC models estimate a large sink over the whole time period, while CTE transitions from a small source to small sink) over the Amazon (M1–5; Fig. A8). This Amazon bias leads to the DALEC models consistently estimating Brazil's NBE to range between −2.3 and −1.8 Pg C yr−1, which contrasts the near-neutral 0.014 Pg C yr−1 estimated by CTE (2001–2017; Table 2). However, both the CTE ensemble and DALEC uncertainties cross the source–sink boundary, indicating that neither analysis can confidently quantify Brazil as a net source or sink overall for 2009–2017 (Fig. 5; Table 2).

Figure 4Comparison of DALEC model M1–5 estimated NBE and GPP with independent estimates of NEE from CarbonTracker Europe (2009–2017), GPP (2001–2017) from FLUXCOM/FluxSatv2/Copernicus and fire (2003–2016) GFEDv4.1s and GFAS. Stippling shows areas where the 90 % confidence interval derived from DALEC analysis overlaps with the independent value.
The DALEC models are consistent with independent GPP at the 90 % CI across 93 %–97 % of Brazil (Fig. 4). Inter-model variation follows the implementation of the differing photosynthesis models and inclusion of carbon–water cycle interactions. The simplest model, M1 (ACM1, no water cycle; 97 %), was the most consistent with independent estimates; followed by M2 (ACM2, no water cycle; 94 %). M3–5, which use ACM2 and simulate water cycling, are least consistent (∼ 93 %) over Brazil. The non-consistent areas for all models are concentrated in the Caatinga and Cerrado (Fig. 4), which have strong seasonality in rainfall and more extreme temperatures (Fig. A2). Moreover, the DALEC models all estimate a lower GPP for these regions (by ∼ 5 ) than independent estimates, suggesting different high temperature and drought sensitivities between analyses (Fig. A8). The activation of water cycling between M2 and M3–5 reduces Brazil's GPP by an average of 7 % but varies substantially in space with declines across the Cerrado and Caatinga of ∼ 30 %.
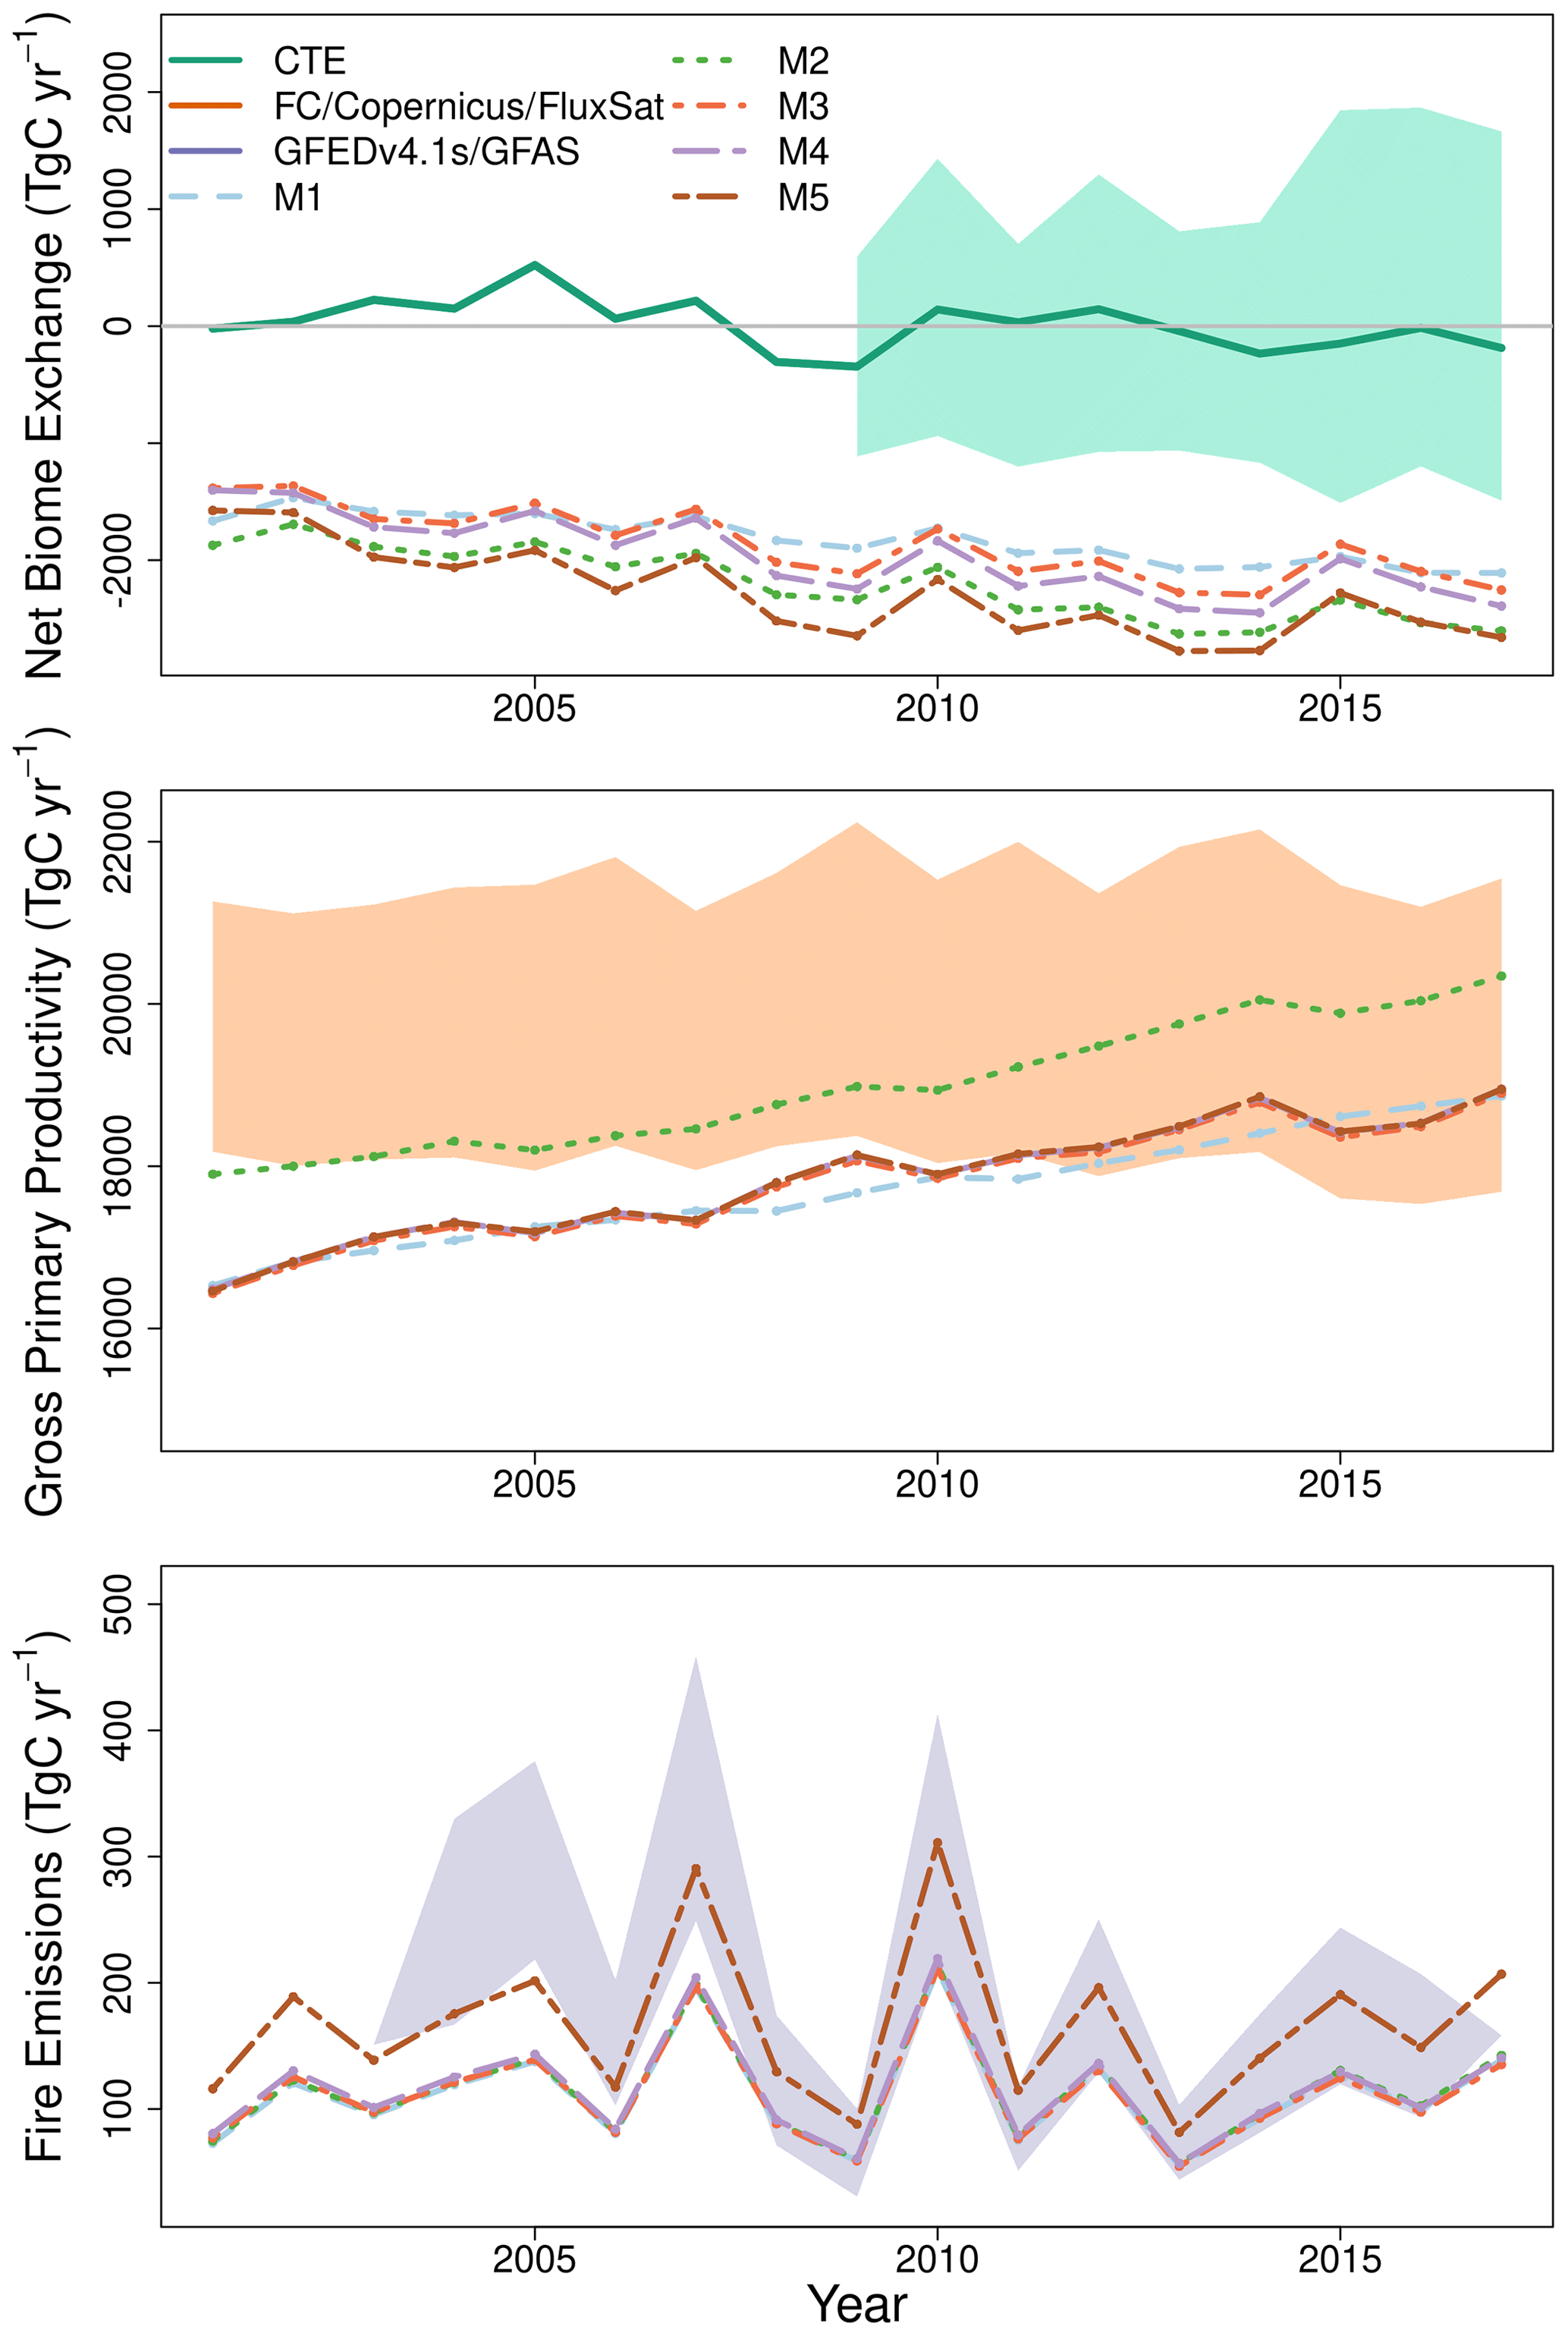
Figure 5Time series comparison showing the carbon budget for Brazil as estimated by CARDAMOM for each version of DALEC using the pixel-level median estimates. Independent data, where available, are shown as a single solid line. The shaded areas denote the maximum range the independent estimate for CTE (blue), the maximum range between FLUXCOM, Copernicus and FluxSat v2 (orange), and the range between GFEDv4.1s and GFAS fire emissions estimates (purple).
Brazil's mean annual GPP estimated by the DALEC models (17.7–19.0 Pg C yr−1) encompasses the range of independent estimates (18.4–20.9 Pg C yr−1) as do the model-specific uncertainties (Table 2). All DALEC models estimated Brazil's mean annual GPP to increase between 2001 and 2017 (∼ 0.15 ), while respiration increased by roughly half that of GPP (Figs. 5 and A9). The net change between GPP and respiration is consistent with the trend of declining NBE estimated by both DALEC (−0.038 to −0.06 ) and CTE (−0.032 ; Fig. 5). However, the increasing GPP trend is not uniform, with GPP declining in the Cerrado and Caatinga (range ± 0.45 ; Fig. A9). Independent estimates of GPP are in agreement with the sign of the GPP trend across most of Brazil (i.e. the Cerrado, Caatinga, Atlantic Forest, Pampas and Pantanal). The Amazon is the exception which is consistently estimated to remain constant or declining GPP, which contrasts the DALEC estimates.
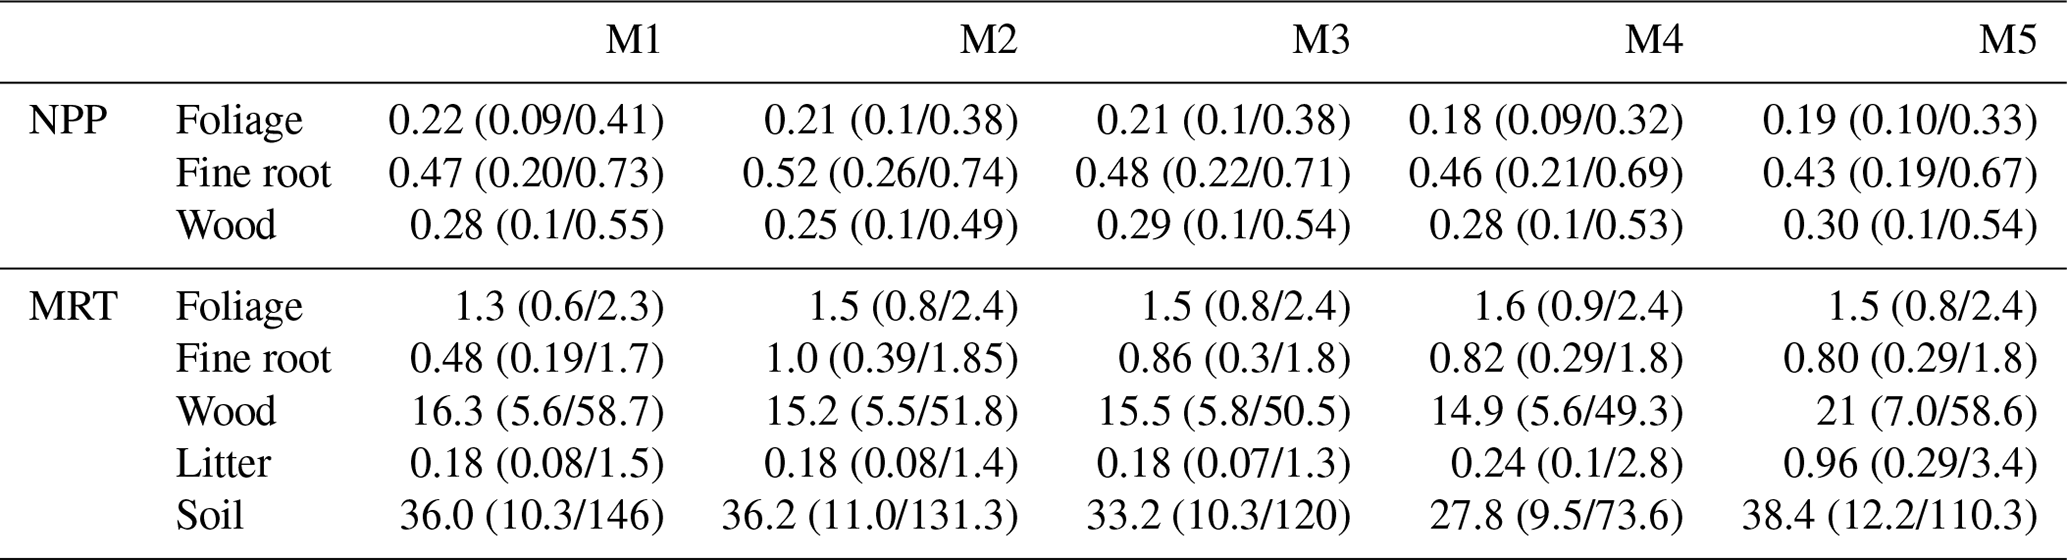
Table 3Mean Brazilian C-cycle NPP allocation fractions and MRTs (years) calculated with five different model structures (M1–5). The Brazil-wide mean is calculated from the median pixel-level estimates, with the equivalent estimates for the 5 % and 95 % quantiles in parentheses denoting the 90 % confidence interval. Note that litter in M5 includes the additional wood litter pool.
DALEC-estimated fire emissions show large interannual variation between ∼ 100 and ∼ 300 Tg C yr−1, reducing the annual net C uptake by 3 %–30 % over this period (Fig. 5). At the 90 % CI, the DALEC models are consistent with GFEDv4.1s and GFAS fire emissions estimates over 41 %–47 % of Brazil (Fig. 4). DALEC has, however, a persistent low bias (∼ 2 ) across the boundary between the Amazon and the Cerrado (Fig. A8). Spatial consistency is greatest in M1 (47 %) and M4 (45 %), whereas a comparison of total fire emissions shows that M1–4 estimates are substantially lower than either GFAS (mean of 65–69 Tg C yr−1) or GFEDv4.1s (mean of 92–96 Tg C yr−1) (Fig. 5), and M5 estimates, while still lower than GFAS (mean of 13 Tg C yr−1) or GFEDv4.1s (mean of 41 Tg C yr−1), fall between the independent estimates in 11 of 15 years in which these datasets overlap (Fig. 5). Despite the improvement in estimation of C emissions due to fire, there is no corresponding improvement in NEE or NBE due to compensating changes in both autotrophic and plant respiration (Table 2). This result highlights the need for greater overall constraint on the C cycle, for instance, independent estimates of respiratory fluxes. DALEC-estimated C losses due to forest biomass removals from GFW show substantial interannual variation (120–400 Tg C yr−1) reducing net uptake by 5 %–32 % (Fig. A11). For further details, see Appendix B.
3.3 Constraints on Brazilian C cycling
Simulated NBE (NEE + fire) is dominated by wood stock dynamics. Variation in wood stock dynamics explains 85 %–93 % of variation of simulated NBE, while variation in soil stock dynamics explains 1 %–18 % (Fig. A6). Carbon dynamics of wood, not soil, is the primary driver of net exchange. Using the per-model 1∘ resolution parameter ensembles provides quantification across Brazil of whether a given 1∘ pixel is a net source or sink of carbon, i.e. the sign of NBE (Fig. A6). At the 90 % confidence interval, our analyses indicate there is currently insufficient observational constraint to confidently determine the sign of NBE or soil C dynamics. The same was largely true for wood stock dynamics, except that the sign of wood stock trajectories could be confidently determined for ∼ 5 % of Brazil's land area after the inclusion of the water cycle increasing to 11 % on the inclusion of a wood litter pool. The areas of statistical confidence are concentrated in the Cerrado (Fig. A6).
The CARDAMOM analyses provide spatially explicit estimates of critical ecosystem traits such as the allocation of NPP to live tissue (Fig. A12) and carbon stock MRT (Table 3, Fig. A13). Moreover, our analysis allows us to partition MRT into its constituent drivers, i.e. natural, fire and biomass removal, which indicates that given currently available driver disturbance is only a major determinant of MRT across the Amazon–Cerrado boundary (Fig. A14). All five models estimate similar mean Brazil-wide partitioning of NPP to plant tissue. The MRT of the foliar pool is best constrained across models, consistently estimated to be ∼ 1.5 years with an uncertainty ranging between 84–116 d. The MRT of fine roots increases by 67 %–101 % between M1, which uses ACM1 and M2–5, which use ACM2. A key feature of ACM2 is the inclusion of fine roots in determining potential water supply to the canopy underpinning stomatal conductance. Wood MRT, while associated with large uncertainty (∼ 50 years), is consistently estimated to be 15–16 years for M1–4. In M5, with the inclusion of the wood litter pool, median wood MRT increased by 25 % to 21 years. No significant impacts on mean estimates or uncertainty of litter or soil MRT are noted.
These analyses show clear spatial patterning both between and within biomes in the estimates of NPP (Fig. A12) and MRT (Fig. A13). Spatial patterns of NPP allocation are similar between models, except M2, which has several notable differences in the Cerrado and Caatinga. All models estimate the fraction of NPP allocated to foliage across the Amazon, Atlantic Forest, Pantanal and Pampas to be relatively low at 0.1–0.2 with a larger fractional allocation (0.3–0.5) estimated across the Cerrado and Caatinga. The change in foliar allocation is compensated for in the allocation to fine roots, where models M1 and 3–5 estimate the fractional allocation to fine roots across Brazil to be 0.5–0.6 except in the Cerrado and Caatinga, which have a lower fractional allocation at ∼ 0.4. M2 estimated a similar spatial pattern and magnitude of fine root allocation except over the Cerrado and especially the Caatinga, which is estimated to have a larger allocation fraction of up to 0.8. The larger fractional allocation to fine roots comes as a trade-off with allocation to wood leading to very low wood allocation fractions across the Cerrado and Caatinga (< 0.15).
There are substantial variations between models in estimated MRTs, in addition to biome-level differences (Fig. A13). MRTroot shows the greatest between-model variation with short (< 1 year) MRTs estimates across the majority of Brazil (i.e. little biome-level variation) in M1 but longer MRT in all other models (1–2 years). Models M2–5 have larger biome-level variability in MRT, with longer (> 1 year) MRTroot in the drier Cerrado and Caatinga regions compared to other biomes. In models M1–4, MRTwood is ∼ 10 years across much of Brazil, except the Amazon, which has MRTs of up to 50 years but notable short MRT along the boundary of with the Cerrado (i.e. the arc of deforestation). Longer residence times were estimated across parts of the Caatinga in M3–5, likely linked to the inclusion of the water cycle in these models. In M5, where an explicit wood litter pool is included, MRTwood increased in the southern Cerrado and Atlantic Forest from < 10 years to > 10 years. Finally, the estimate of the combined litter (i.e. foliar, fine root and wood) MRT in model M5 was greater across Brazil than in other models due to the explicit inclusion of slowly decomposing wood litter.

Figure 6Simulated Brazil-wide total stock change between 2001 and 2100 for biomass (labile, foliar, fine root and wood) and dead organic matter (DOM; litter, wood litter (M5 only) and soil). The left column shows each model for the SSP2-4.5 W m−2 climate scenario, while the right column shows the DALEC suite mean for each climate scenario. Median estimates are shown using a solid line, while the dashed lines indicate the 90 % confidence interval. Note that uncertainties were propagated from the pixel level to Brazil-wide totals assuming fully correlated uncertainties.
3.4 Quantifying uncertainty in the future Brazilian C cycle
3.4.1 Future Brazilian carbon stocks
The calibrated DALEC models were simulated under four climate change scenarios to estimate changes in biomass and DOM between 2001 and 2100 (Fig. 6). We assess the model-specific behaviour under scenario SSP2-4.5 W m−2, which is considered to be the central pathway, and the model average response for each of the four scenarios (O'Neill et al., 2016).
The median forecasts of all DALEC models simulated a net increase of biomass and DOM by 2100 under the SSP2-4.5 W m−2 climate change scenario (Figs. 6 and A3). M1–2 and M5 simulated a larger C accumulation (∼ 75 Pg C), while M3–4 simulate a smaller increase (∼ 40 Pg C). The 90 % CI (i.e. the 5 %–95 % quantiles) is greater than the median predicted accumulation for each model, therefore crossing the source–sink boundary for the next century in all cases (Fig. 6). Using our ensemble-based approach, we estimate that the likelihood of a net increase of C in biomass by 2100 is 73 %–85 %, while the likelihood of a net accumulation in DOM is 64 %–84 % (Table A6). C accumulation is simulated to be most likely concentrated in the Amazon and to a lesser degree the Atlantic Forest (e.g. M5). However, only across the Caatinga does our analysis estimate confidence in the sign of C accumulation with > 90 % confidence as either a small source or sink (Figs. A15 and A16).
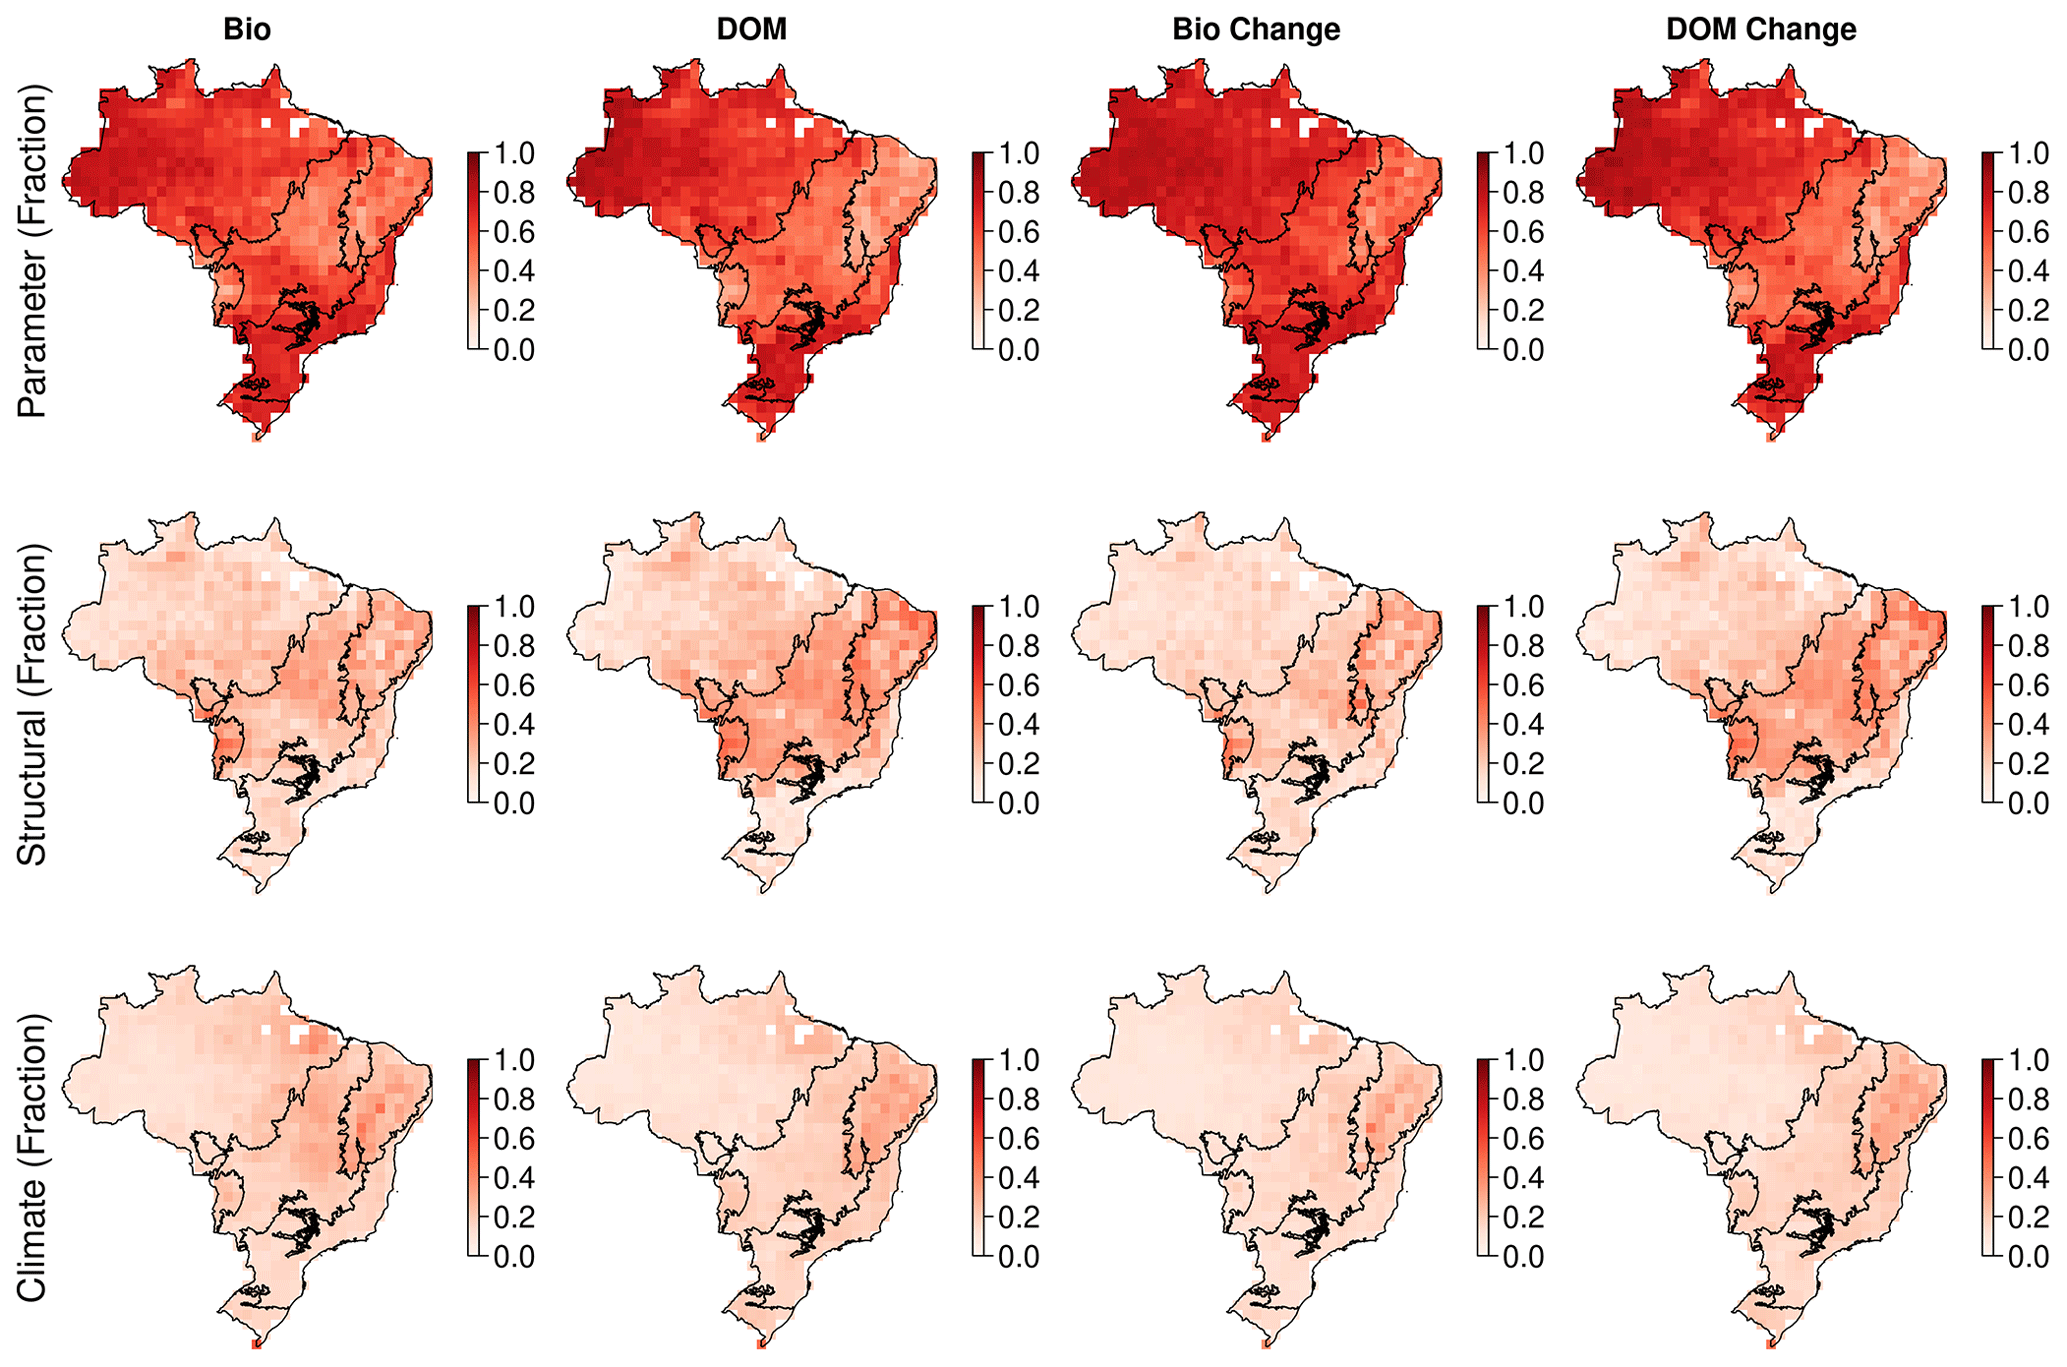
Figure 7Quantification of the relative contribution of model parameter (top row), structural (middle row) and climate change scenario (lower row) uncertainties on the simulated Brazilian carbon cycle in 2100 at 1∘ resolution. Carbon cycle components shown in columns as the live biomass (Bio) and DOM stocks in 2100, and their change between 2017 and 2100. The colour bar indicates the fractional contributions.
The analyses indicate that live biomass and DOM stocks will most likely increase under each climate change scenario (Fig. 6). Median C accumulation under SSP1-2.6 W m−2 plateaus by 2080 before turning into a carbon source by 2100 (i.e. begins losing its accumulated carbon), while all other scenarios continue to accumulate carbon to 2100. As expected, accumulation of DOM lags behind that of biomass, as turnover of biomass provides inputs to DOM in the models. Analysis uncertainty is larger than the mean predicted accumulation for all scenarios, with the lower bound of the 90 % CI indicating a possible net loss of carbon for the next century. The spatial variation in carbon source–sink distribution indicated for SSP2-4.5 W m−2 is consistent for each scenario (Figs. A15 and A16).
3.4.2 Partitioning uncertainty: parameter, model structure and climate change scenario
Across Brazil for forecasts of live biomass and DOM change to 2100, the largest proportion of uncertainty is derived from parameters (biomass of 0.62, DOM of 0.68), followed by model structure (biomass of 0.21, DOM of 0.24), with the remainder due to climate change scenario uncertainty (biomass of 0.16, DOM of 0.18) (Fig. 7). However, there were important spatial variations in uncertainty contributions both between and within biomes. Parameter uncertainty was on average the largest across the Amazon (biomass of 0.74, DOM of 0.72) and Atlantic Forest (biomass of 0.71, DOM of 0.66), with smaller contributions in the Cerrado (biomass of 0.64, DOM of 0.52) and Caatinga (biomass of 0.49, DOM of 0.38; Fig. 7). Structural uncertainty follows the inverse spatial pattern, contributing its largest component (though still smaller than parameters) across the Cerrado (biomass of 0.20, DOM of 0.30) and Caatinga (biomass of 0.29, DOM of 0.36). Uncertainty due to climate change scenarios was relatively large in the Cerrado and Caatinga (0.11–0.26) but was still the minority contribution in all cases. Moreover, in absolute uncertainty terms, structural (range of 0.4–1.0 Mg C ha−1) and climate change (range of 0.3–0.7 Mg C ha−1) uncertainties vary relatively little compared to parameter uncertainty (range of 0.9–4.9 Mg C ha−1), which has its largest absolute uncertainties across the Amazon and Atlantic forests with smaller values over the Cerrado and Caatinga (Fig. A17).
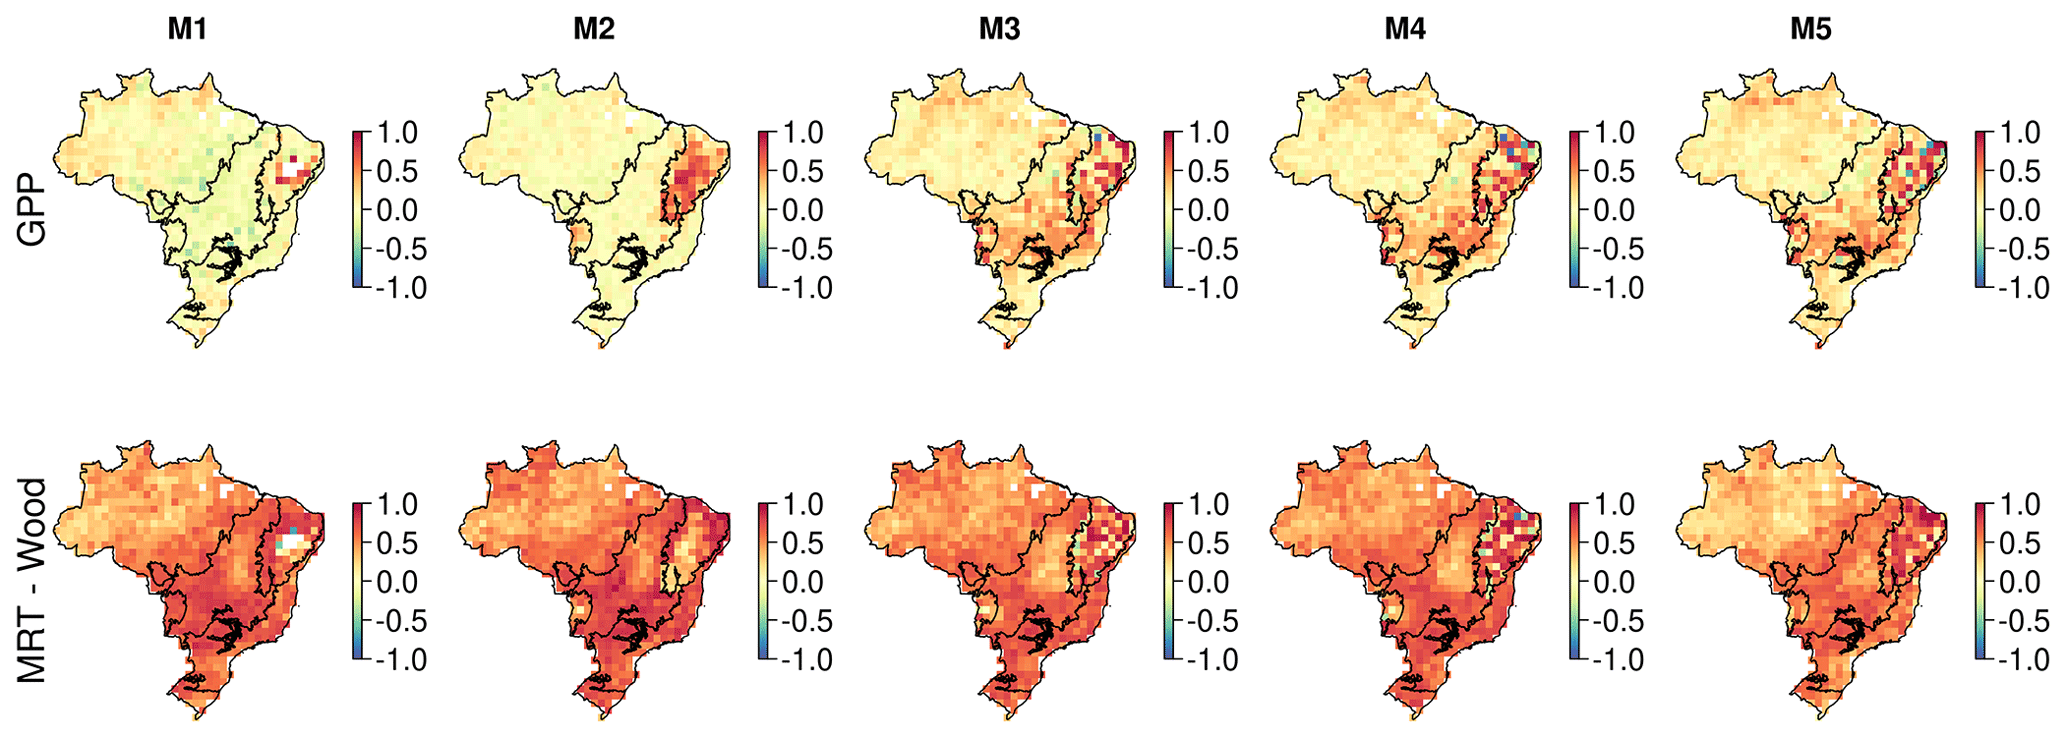
Figure 8Correlation maps between the simulated change in biomass stocks (SSP2-4.5; 2001–2100) and ecosystem variables. These maps identify spatial variation in the sensitivity of biomass change to key ecosystem variables. Correlates are wood MRT (years) and GPP () estimated across the whole simulation period.
3.4.3 Quantifying the determinants of future carbon stock change
Our analysis highlights substantial differences in the magnitude and spatial variation of correlations between ecosystem variables for both biomass (Figs. 8 and A18) and DOM (Figs. 9 and A19). Overall, both simulated biomass and DOM change are most strongly correlated with NPPwood, MRTwood and MRTsoil, with only small variations in this pattern among models.
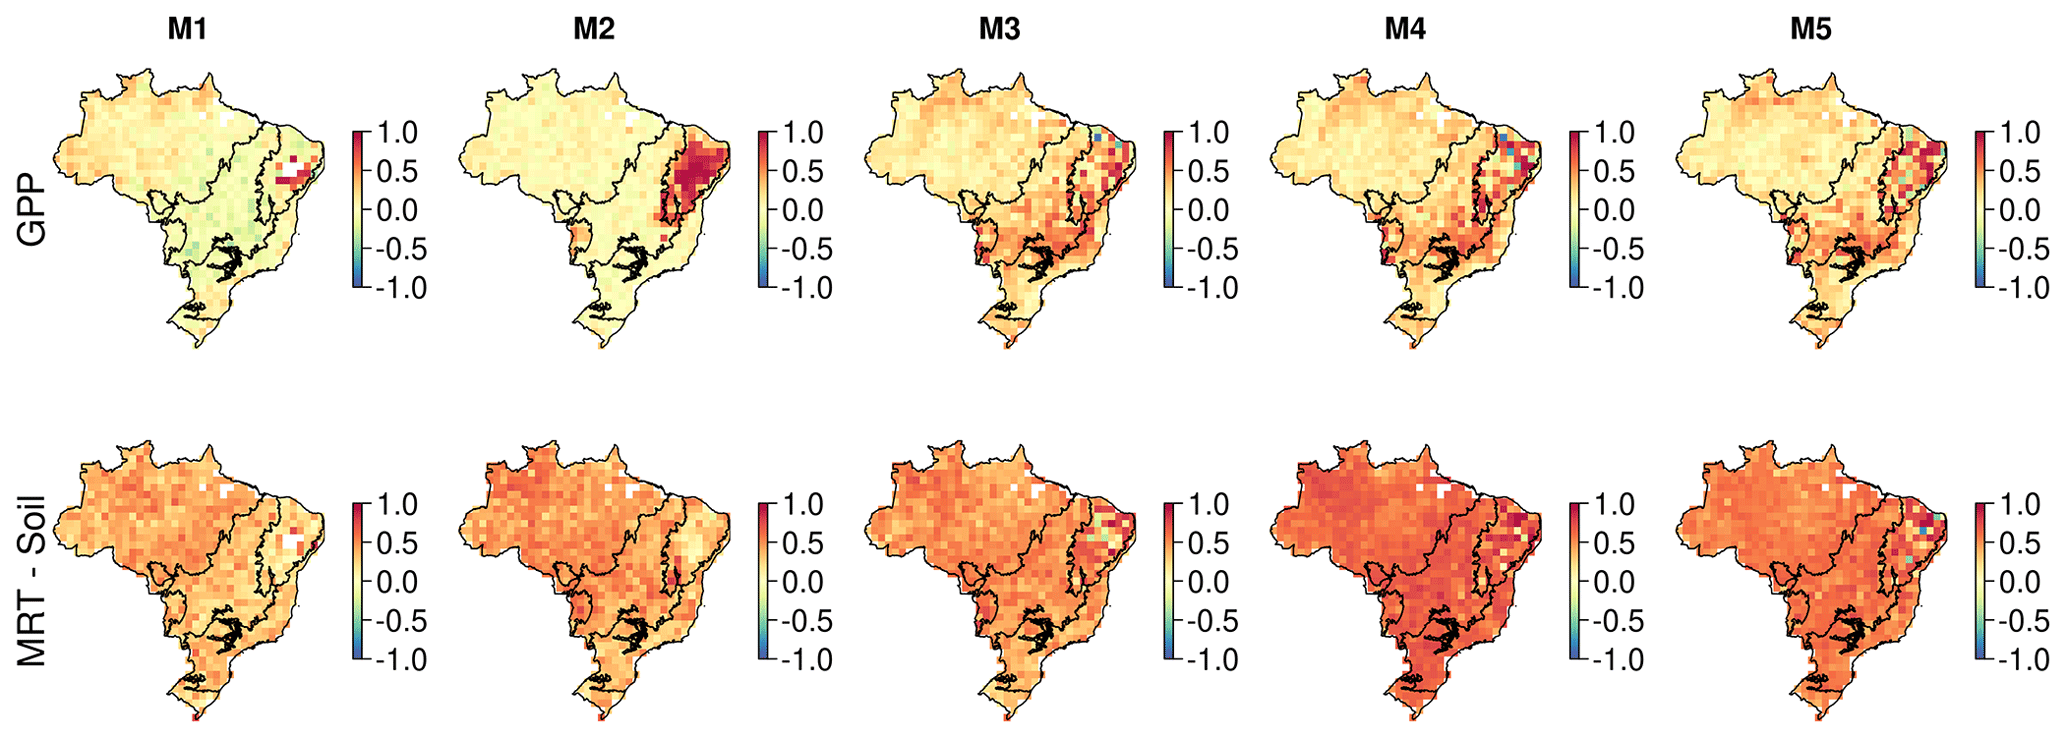
Figure 9Correlation maps between the simulated change in DOM stocks (SSP2-4.5; 2001–2100) and ecosystem variables. These maps identify the spatial variation in the sensitivity of biomass change to key ecosystem variables. Correlates are soil MRT (years) and GPP () estimated across the whole simulation period.
On average, MRTwood (r of 0.57) is the most important correlate with biomass change, followed by NPPwood (r of 0.31), MRTsoil (r of 0.27; Fig. 8) and GPP (r of 0.25). There is substantial spatial variation with NPPwood being the dominant correlate in 12 %–29 % of pixels (between-model variation). MRTwood is strongly correlated with biomass change (r > 0.9) across most of Brazil, except the Amazon and isolated areas of the Cerrado and Caatinga where the correlation coefficient declines (r < | 0.25 |). In contrast, NPPwood is the process most strongly correlated with biomass in the Caatinga and parts of the Amazon, consistent for all models. There are some between-model differences indicating varied sensitivity to ecosystem variables (Fig. 8). For example, GPP becomes on average an increasingly important correlate as model complexity increases (from M1 of 0.16 to M5 of 0.30), potentially in response to the implementation of drought impacts on productivity. Litter MRT has a low correlation value (M1–4 of ∼ 0.01) for all models except M5 (which includes wood litter, M5 of 0.06), which has increased correlation in the Caatinga (M1–4 of ∼ 0.03, M5 of 0.18), the Atlantic Forest (M1–4 of ∼ 0.01, M5 of 0.11) and the Pampas (M1–4 of ∼ 0.01, M5 of 0.12).
Uncertainty in DOM stock change is most strongly correlated with MRTsoil (r of 0.5), NPPwood (r of 0.36) and MRTwood (r of 0.33; Fig. 9). GPP (r of 0.17 to 0.30) and MRTsoil (r of 0.36 to 0.56) become increasingly correlated as model complexity increases. MRTwood and NPPwood correlation remains similar between models. There is substantial spatial variation and between-model differences. For example, NPPwood is more strongly correlated with DOM change than MRTsoil in 10 %–44 % of pixels, concentrated over the Cerrado and the western Amazon. As with simulated biomass change, the MRTlitter correlation increases in model M5.
4.1 Does increasing model complexity improve agreement with evaluation information?
Increasing model complexity by including a wood litter pool (M5) reduces bias (by ∼ 65 %) between total fire emissions estimated by DALEC and independent estimates (Table 2, Fig. 5). However, the spatial consistency remains largely unchanged with a persistent spatial disagreement across the southern Amazon–Cerrado border (Fig. 4) and the DALEC-estimated Brazil-wide fire emissions uncertainty increased on the addition of a wood litter pool (Table 2). The assimilation of repeat estimate EO biomass should help resolve carbon stock trajectories and provide constraint on the wood litter pool determining the available fuel load for fire combustion (Smallman et al., 2017; Quegan et al., 2019). Fire has a significant impact on the Brazilian C cycle, reducing net carbon uptake by up to 30 % (Table 2) but with substantial interannual variation (Fig. 5). Thus, inclusion of wood litter is potentially a major step forward in improving DALEC's fire emissions but is dependent on appropriate observational constraint. Wood litter has received comparatively little attention in TEMs but plays an important role in ecosystem carbon and nutrient cycling (Brovkin et al., 2012; Magnússon et al., 2016).
Contrary to our hypothesis, net carbon uptake was not reduced by the inclusion of a water cycle (Table 2). The inclusion of water stress between M2 and M3–5 reduces GPP by up to 30 % (Fig. A8), so the hypothesised sensitivity of simulated C uptake to soil moisture was confirmed. However, these reductions in GPP were compensated by changes to C losses which are governed by turnover/decomposition parameters which are more uncertain (Table A3); therefore, the modelled net carbon exchange was not strongly affected (Figs. 4 and A6). Such compensating changes in C uptake and losses reinforce the importance of improving constraint on C loss processes such as residence times.
DALEC and CTE estimate that net carbon uptake increased between 2001 and 2017 (Fig. 5), consistent with the net increase in LAI observed by Copernicus and reproduced by each DALEC model (Fig. 3). The observed net increase in LAI is consistent with that found across the globe and has been associated with the accumulation of atmospheric CO2 (Zhu et al., 2016; Piao et al., 2020). In our analyses, the trend in NBE is concurrent with changes in GPP and respiration over time but dominated by GPP (Table 2; Fig. A9). CTE NBE estimates are consistent with other atmospheric inversion and TEM intercomparisons (e.g. Jung et al., 2020; Zscheischler et al., 2017). This consistency among TEM and atmospheric inversion supports robustness of the increasing sink strength estimated by DALEC, but also that the DALEC models are likely overestimating current net uptake across the Amazon (Fig. A8).
There is consistent evidence of a net increase in LAI (Zhu et al., 2016; Piao et al., 2020). However, disagreement remains as to whether GPP is also increasing, especially in tropical forests. For example, there is substantial divergence between observational orientated estimates of GPP (such as those used as independent evaluation here), both in terms of absolute values (∼ 20 %, Table 2) and trends over time (Fig. A10). Whether a given analysis indicates increasing GPP concurrent with LAI is linked to the sensitivity of the respective models to variations in atmospheric CO2 (Melnikova and Sasai, 2020; Sun et al., 2019). The sensitivity of GPP to CO2 remains poorly quantified, especially in the tropics, due to the lack of in situ data and large observational uncertainties (Sun et al., 2019). As a result, process-model-enhanced GPP may be overestimated due to missing nutrient limitation (He et al., 2017), acclimation processes (Ainsworth and Rogers, 2007) or errors in the coupling of the water and C cycles (Wang et al., 2020). Our analyses estimate increases in both LAI and GPP for much of Brazil but declines in water-limited regions (e.g. the Caatinga) (Figs. A9 and A10), consistent with other studies using alternate methodologies (He et al., 2017; Jung et al., 2020; Sun et al., 2018; Zhang et al., 2019).
4.2 What is the relative importance of parameter, structure and climate change scenario on projections of future carbon stocks?
The five DALEC models and their parameter ensembles were projected to the year 2100 under four climate change scenarios (Fig. 6). The resultant multi-model ensemble of carbon cycle trajectories shows a similar spread and behaviour as that found in regional model intercomparisons (e.g. Arora et al., 2020). For example, by 2100, the ensemble contains models which are still accumulating carbon and have plateaued, and those which have peaked and are now declining (Fig. 6; Friend et al., 2014; Arora et al., 2020). Given the similar behaviours we found, meaningful lessons can be drawn from our analysis to inform ESM/TEM model intercomparisons.
Uncertainty associated with projections of biomass and DOM dynamics is dominated by parameter uncertainty, followed by model structure and climate change scenario. For parameter uncertainty, there are also clear spatial patterns, particularly focused over the Amazon and Atlantic forests (Figs. 7 and A17), while spatial patterning is weaker for model structure and climate change scenario. A reduction of parameter uncertainty (∼ 75 %) in the Cerrado and Caatinga relative to the Amazon (Fig. A17) may be linked with these areas being more water limited (Fig. A2), providing a smaller ecologically realistic parameter space (as defined by the ecological and dynamical constraints (EDCs); see Sect. A1 in the Appendix for details) and thus reducing uncertainty. This spatial patterning is consistent irrespective of the parameters constraining ecosystem processes or initial conditions (Fig. A7). However, the uncertainty associated with parameters alone precludes determination of whether Brazil is a net sink or source of carbon at the 90 % confidence level (Fig. 6). In order to reduce projection uncertainties, there has been substantial effort within the ESM and TEM communities towards identifying the underlying processes (i.e. structure) driving model error on a range of scales (e.g. Friend et al., 2014; De Kauwe et al., 2014; Zhou et al., 2018) and methodologies to weight existing analyses based on their simulation of contemporary observation constraints (e.g. Wenzel et al., 2014; Exbrayat et al., 2018a). However, increasing model complexity also increases the number of parameters that may be poorly constrained in the absence of adequate observational data (Prentice et al., 2015). In fact, parametric uncertainty is largely unquantified in large-scale ESMs/TEMs, meaning the relative contribution of parameter and model structure uncertainties. Our framework for exploring the relative impact of parameter uncertainties on future carbon dynamics contrasts strongly with the typical process of model development. Typically in TEM development, relatively small model structural changes are made and the resultant response is extensively investigated in the absence of knowledge on parameter uncertainties (e.g. Mercado et al., 2009; Verheijen et al., 2015; Jones et al., 2020). Uncertainties in terrestrial carbon cycling have remained large over multiple intercomparison cycles (Arora et al., 2020). Thus, we argue that a greater focus is needed on refining parameters themselves.
4.3 Which ecosystem traits are most strongly correlated with simulated carbon dynamics?
MRTwood was the parameter most tightly coupled to the response of biomass C stocks to climate change between now and 2100 (Fig. 8), and the third most important determinant of the response of DOM (Fig. 9). There are three possible interacting explanations for this high importance. First, there is a relatively weak constraint on the MRTwood parameter in each pixel over the calibration period due to lack of repeat observations of wood biomass. Second, woody biomass is typically the largest biomass pool, and MRTwood is a key control on turnover and therefore on decadal changes in the size of this pool. Third, MRTwood is a key control on C inputs to the soil C (all models) and wood litter (M5 only) pools in DALEC, generated by modelled wood losses. The analysis of long-term C trajectories contrasts with the correlation between GPP and net C exchange during the calibration period. This contrast highlights the importance of considering the timescale of change that is of interest, with wood and soil residence times driving long-term net C exchanges rather than interannual variability. Similarly, it is important to note that NPPwood is the second most important determinant of future dynamics of both biomass and DOM, and in many areas it is co-dominant with MRTwood(Fig. 8). Efforts to constrain estimates of both MRTwood and NPP allocation are thus critical for more robust predictions of C storage (Friend et al., 2014; Koven et al., 2015; Zhou et al., 2018). These efforts should be enhanced by current and future missions that repeatedly and with high confidence measure woody biomass from space (Quegan et al., 2019), using approaches like CARDAMOM for model calibration (Smallman et al., 2017). While EO-derived AGB maps of different time periods do exist (e.g. ESA CCI Santoro et al., 2021), these estimates are typically created using different processing chains, calibration data, satellites, etc. As a result, these estimates have different bias and error structures, making them more challenging dataset to use at this time. Therefore, robust assessments of wood biomass uncertainty in these EO products will be critical to producing more constrained C-cycle projections (Exbrayat et al., 2019).
Higher-resolution studies (e.g. at ha or km2 resolution) over areas of rapid biomass change, such as the arc of deforestation in Brazil, will provide added insights into model structure and parameter uncertainties. There are challenges for the CARDAMON-DALEC approach to work at finer scales and with more dynamic ecosystems. For instance, the concept of MRT is less appropriate in modelling successional change (i.e. species change driving change community trait composition) and highly dynamic systems, where internal feedbacks may adjust C losses (mortality) with variations in density (e.g. competition) and age (Peters, 2003; Ge et al., 2019). Chronosequence data at high spatial and temporal resolutions can provide the means to test alternate representations of successional variation in C cycling and storage (e.g. Safar et al., 2020).
Variations in C storage linked to model structure were smaller than those linked to model parameterisation, except in specific areas of Brazil (the Caatinga; Figs. 7 and S15). The selection of five model structures was limited by our choice, so it is perhaps not surprising that the parameter calibration, which allows for multidimensional variation over broad priors, contributes more variation to projections than does model structural variability. However, the variation in model structure was designed to test whether hypothesised key processes were important in projections and similar to the kinds of developments which are tested and interpreted in ESMs and/or TEMs. For instance, we used models with and without a water cycle simulation to test the importance of carbon–water feedbacks in projections of C storage to 2100. Models M3–5 included dynamic simulation of soil moisture changes and its interactions with canopy processes. Projections with these models thus included the potential development of soil moisture stress, with an impact on GPP. Models M1 and M2 had no direct effect of soil moisture on C cycling. This soil moisture feedback on GPP only manifested itself in projections for northeastern Brazil, the driest part of the country, in the Caatinga biome and some nearby parts of the Cerrado (Figs. 4 and A8). This feedback does have an impact on projected C storage (Fig. 7; Table A5), but these effects are of similar or lower magnitude as parameter uncertainty. We conclude that for much of Brazil, outside of the Caatinga, our model–data fusion shows a limited sensitivity of C cycling to future soil moisture stress. However, our modelled analysis contrasts the finding of the Caxiuana rainfall exclusion experiment which found drought-enhanced tree mortality and reduced productivity (da Costa et al., 2010). Our result is likely a result of CO2 fertilisation leading to reductions in plant water demand that are explicit in both ACM GPP models. However, it is possible that land surface models like DALEC are overestimating CO2 fertilisation effect (Wang et al., 2020), and/or by using time-invariant parameters (i.e. traits) we are neglecting the impact of species change (i.e. biodiversity shifts) on ecosystem response. Collectively, these results highlight the need for further evaluation and refinement.
As expected, climate change scenario uncertainty is dwarfed by uncertainties in both model structure and parameters (Fig. 7). However, we have only used projections from one Earth system model (UKESMv1), and therefore we have not quantified the impact of uncertainty in meteorology/climate change itself for a given emissions scenario. While uncertainty in meteorology has been shown on longer timescales (decadal) to contribute a minority component relative to the overall uncertainty (e.g. Huntingford et al., 2013; Bonan et al., 2019), we do consider multi-model forcing well worth including in future analyses to provide the most robust assessment of observation-constrained carbon trajectories possible.
4.4 Future avenues to improve observational constraint
Improving constraints on NPP and MRT will reduce uncertainties associated with simulated biomass and DOM change (Figs. 8 and 9). The reverse is also true: providing information on contemporary biomass and DOM dynamics will improve constraint on NPP and MRT, which in turn reduces uncertainty when simulating into the future. In addition to repeat measurement of biomass stocks, there is a diverse range of alternate observational constraints which could provide critical information.
In this study, we chose to retain atmospheric inversion estimated net carbon exchange for evaluation giving us a clear benchmark for future improvement; these data could provide constraint on simulated biomass and DOM change and therefore on their correlated ecosystem variables and parameters. The divergence between estimates of net carbon exchange by different atmospheric inversion systems, while still substantial (mean CTE CI of ∼ 3 Mg C ha yr−1 or 50 times the mean exchange), has reduced substantially over recent years (Gaubert et al., 2019). Moreover, given sufficient observational constraint, posterior estimates of net exchange can converge even with substantially different priors of biospheric exchange indicating a robust analysis (White et al., 2019). But this approach limits ecological learning (e.g. refining MRT to reduce prediction uncertainties). Direct assimilation of atmospheric observations of CO2 concentrations into TEMs has previously been used to refine a limited number of parameters for specific PFTs (e.g. Reuter et al., 2011). However, key ecosystem traits (e.g. NPP allocation and MRTs) vary within what would classically be considered the same PFT (e.g. Exbrayat et al., 2018b), necessitating the development of strategies to allow direct model parameterisation at sub-PFT scales. We recognise that this approach will have substantial technical and computational challenges but the potential benefits are too great to ignore.
Methodologies to estimate potential biomass, i.e. in the absence of direct human disturbance (Exbrayat and Williams, 2015), or potential regrowth rates (Cook-Patton et al., 2020) have recently gained attention. However, a key weakness of these estimates is their dependence on current biomass–climate relationships, thus lacking the ability to project into new climate or disturbance regimes (Lewis et al., 2019). Nevertheless, we see an opportunity to use potential biomass information as an additional constraint, in conjunction with existing EO biomass maps, on the steady state generated by a given combination of current climate and parameters in the absence of human disturbance (which can be determined analytically). As simulation of biomass change correlates strongly with both MRTwood and NPPwood (Fig. 8), we expect that assimilation of potential biomass will also provide constraints on these parameters, increasing confidence in simulations of climate-sensitive carbon cycle trajectories.
Forest biomass removal has a significant impact on the Brazilian C cycle, resulting in losses between 100–450 Tg C yr−1 (Table 2; Fig. A11) and the subsequent regrowth of secondary forests. Secondary forests across the Brazilian Amazon alone are estimated to cover an area of 22–28 Mha accumulating 1.5–11.25 Mg C ha yr−1 but are estimated to be re-cleared every 5–10 years (Poorter et al., 2016; Yang et al., 2020). It is likely that we are missing losses driven by degradation, re-clearance events and edge effects (e.g. Yang et al., 2020) (e.g. Yang et al., 2020) that are not accounted for in existing EO datasets, such as GFW, that are used to drive disturbance in our models (Milodowski et al., 2017; Silva Junior et al., 2020). Missing these disturbance events would lead to overestimation of long-term accumulation of woody carbon, consistent with the likely overestimate of net carbon uptake estimated by the DALEC models already discussed in comparison with CTE. Moreover, improved disturbance drivers can add additional constraint to the C cycle, potentially reducing uncertainty and refining our best estimates of key ecosystem traits as has previously been demonstrated due to the inclusion of fire disturbance information (Exbrayat et al., 2018b). Therefore, improvements in EO-based estimates of deforestation, degradation and the inclusion of re-clearance information are essential to reflect their associated emissions and therefore improve model calibration efforts.
We use a MDF approach in conjunction with five related terrestrial carbon cycle models, with differences in key feedbacks and processes, and observational constraints to quantify the current and future state, trajectory and uncertainties of the Brazilian carbon cycle. Our analysis shows that parameter uncertainty exceeded both the structural uncertainty captured within our model ensemble and uncertainties in projected climate except in drier areas of the country. Parameter uncertainty alone was large enough to span the source–sink boundary, identifying a clear need to further refine parameter constraint and not just model structural complexity. We identify NPPwood, MRTwood and MRTsoil as key uncertainties influencing future trajectories. Given the bi-directional nature of these associations, we have identified future avenues for new observational constraints on these ecosystem properties. Such constraints include repeat estimations of AGB, estimates of NBE from atmospheric inversion, estimates of potential AGB stocks and improved estimates of fluxes driven by ecosystem disturbance and regrowth. Improving constraints on residence times will greatly improve our ability to make meaningful predictions into the future.
A1 Description of the CARDAMOM framework
CARDAMOM is a MDF framework which uses a Bayesian approach to estimate ensembles of DALEC model parameters (x; Table A1) consistent with observational constraints and their uncertainties. The likelihood (i.e. probability) of a given x is estimated with respect to the assimilated observations (P(x|O)) as a function of the likelihood of the observations given the current parameters (P(O|x)) and any prior knowledge. In our analyses, we assume a prior range on each parameter defined as Prange(x) and EDCs estimated as a function of DALEC output (PEDC(DALEC(x))) (See Bloom and Williams, 2015, for details). Finally, all models apply a prior value (Pprior(x)) on the ratio of Ra to GPP (Ra : GPP) of 0.46 ± 0.12 (Collalti and Prentice, 2019). The Ra : GPP is also known as the CUE (NPP GPP, Ra : GPP is 1 − CUE).
P(O|x) is calculated by comparing the nth observation (On) to the corresponding model state variables or flux (Mn) and scaled by the observation uncertainty (σn).
CARDAMOM uses EDCs to ensure ecological realism in the accepted parameter sets that are challenging to constrain directly with a numerical prior (Bloom et al., 2016). The EDCs include preventing inappropriate parameter combinations, e.g. fine root residence times being longer than wood. PEDC(DALEC(x)) is equal to 1 when all EDC conditions are achieved; otherwise, PEDC(DALEC(x)) is equal to 0 and the proposed x is rejected.
A2 Summary description of DALEC models
The structure of each DALEC model follows a similar system of carbon stocks and fluxes (Fig. 2). Carbon enters the system via GPP, which is estimated as a function of leaf area (as simulated by DALEC), canopy photosynthetic efficiency (estimated per pixel), absorbed solar radiation, atmospheric CO2 concentration and air temperature. GPP is allocated to Ra and live tissue based on fixed fractions. Canopy growth is determined by a combination of direct allocation from GPP and release of carbon from the labile pool, which is controlled by a day-of-year model. Similarly, canopy senescence is determined by a day-of-year model with a parameterised leaf lifespan. Wood and fine roots follow continuous turnover based on first-order kinetics. Decomposition of dead organic matter and associated Rhet follows first-order kinetics with an exponential temperature sensitivity. Using EO-derived information on burned area, fire emissions (FIRE) are based on available carbon stocks. From these, key emergent fluxes are derived including NPP (GPP − Ra), NEE of CO2 (Ra + Rhet − GPP) and NBE (NEE + fire). Model M1 is DALEC as described in Bloom and Williams (2015). Each subsequent model cumulatively increases the complexity of its process representation in the following ways.
In M2, the photosynthesis model (ACM1; Williams et al., 1997) is replaced with a revised version (ACM2; Smallman and Williams , 2019). The new key feature of ACM2 is a stomatal conductance model which explicitly balances supply of water via the roots and atmospheric demand, estimated as a function of absorbed radiation and vapour pressure deficit (VPD). ACM2 also includes a full water cycle simulating evaporation, drainage and runoff. However, to isolate the impact of the stomatal conductance model itself, the soil moisture is fixed at saturation. In M3, soil moisture is dynamic, allowing explicit simulation of the water cycle including the potential for development of drought.
In M4, rather than estimating Ra as a fixed fraction of GPP (Ra : GPP), Ra is divided between that associated with maintenance (Rm) or growth (Rg). Rm is estimated as a fixed fraction of GPP, while Rg is estimated as 22 % of carbon allocated to live tissue (equivalent to 28 % of NPP; Waring and Schlesinger, 1985). This development provides the first step in explicit simulation of respiratory costs needed for implementation of economic theory within DALEC (e.g. Thomas et al., 2019; Flack-Prain et al., 2020).
M5 includes a wood litter pool rather than allocating wood litter directly to the soil. The inclusion of a wood litter pool tests our ability to constrain this potentially large but challenging to observe carbon store (Magnússon et al., 2016). Furthermore, wood litter can play an important role in carbon emissions due to fire (van der Werf et al., 2006), and its inclusion here allows us to investigate whether M5 has an improved estimate of fire emissions.
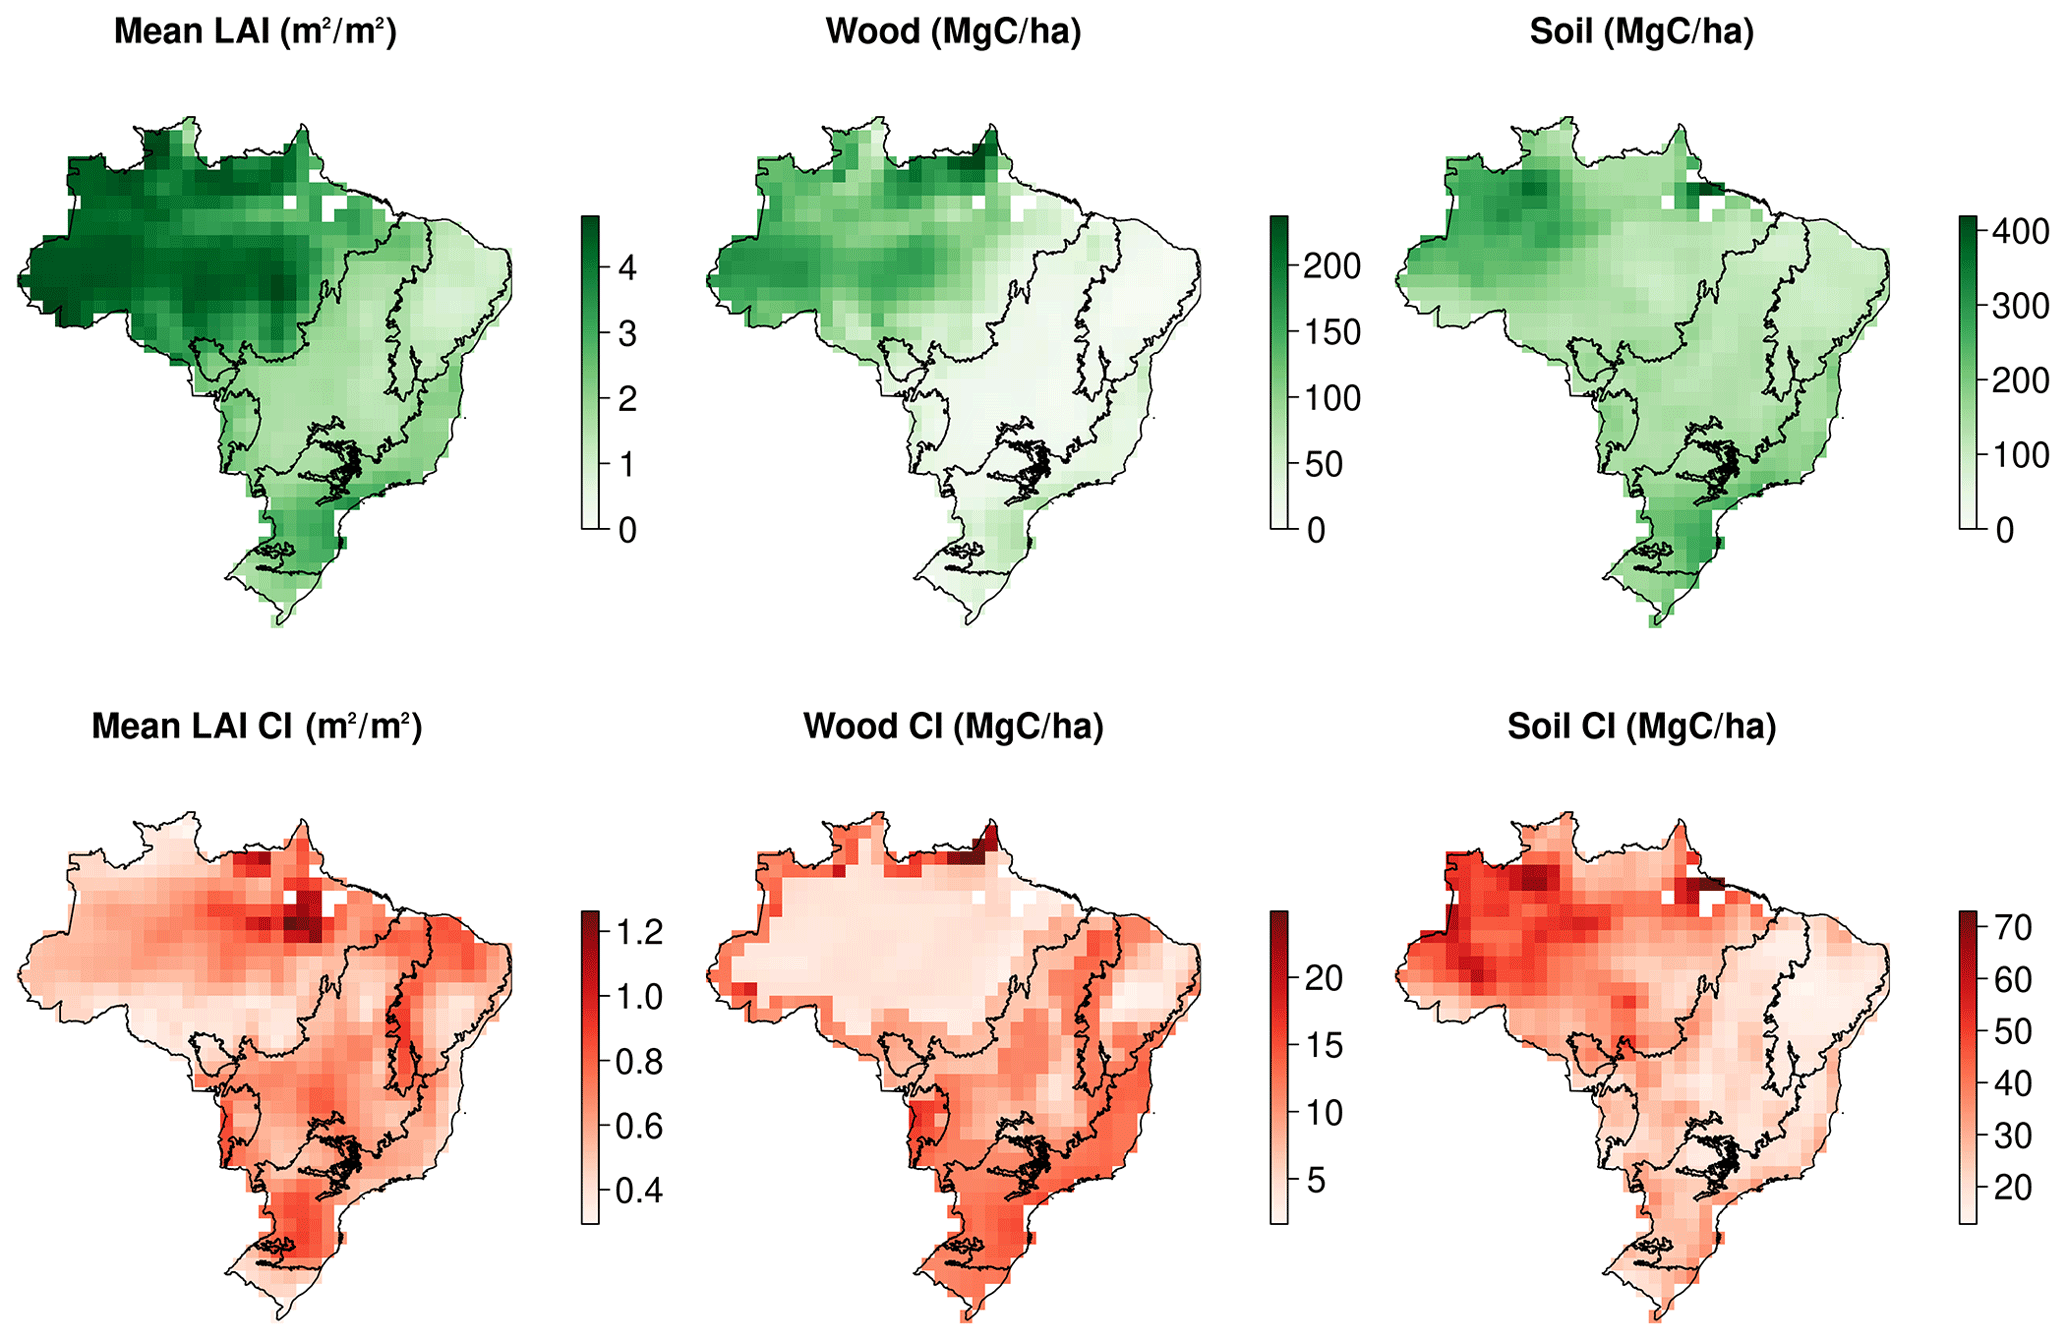
Figure A1Maps of observational constraints and their associated uncertainties used in the CARDAMOM assimilation framework: mean annual LAI, wood stocks and initial soil stocks.
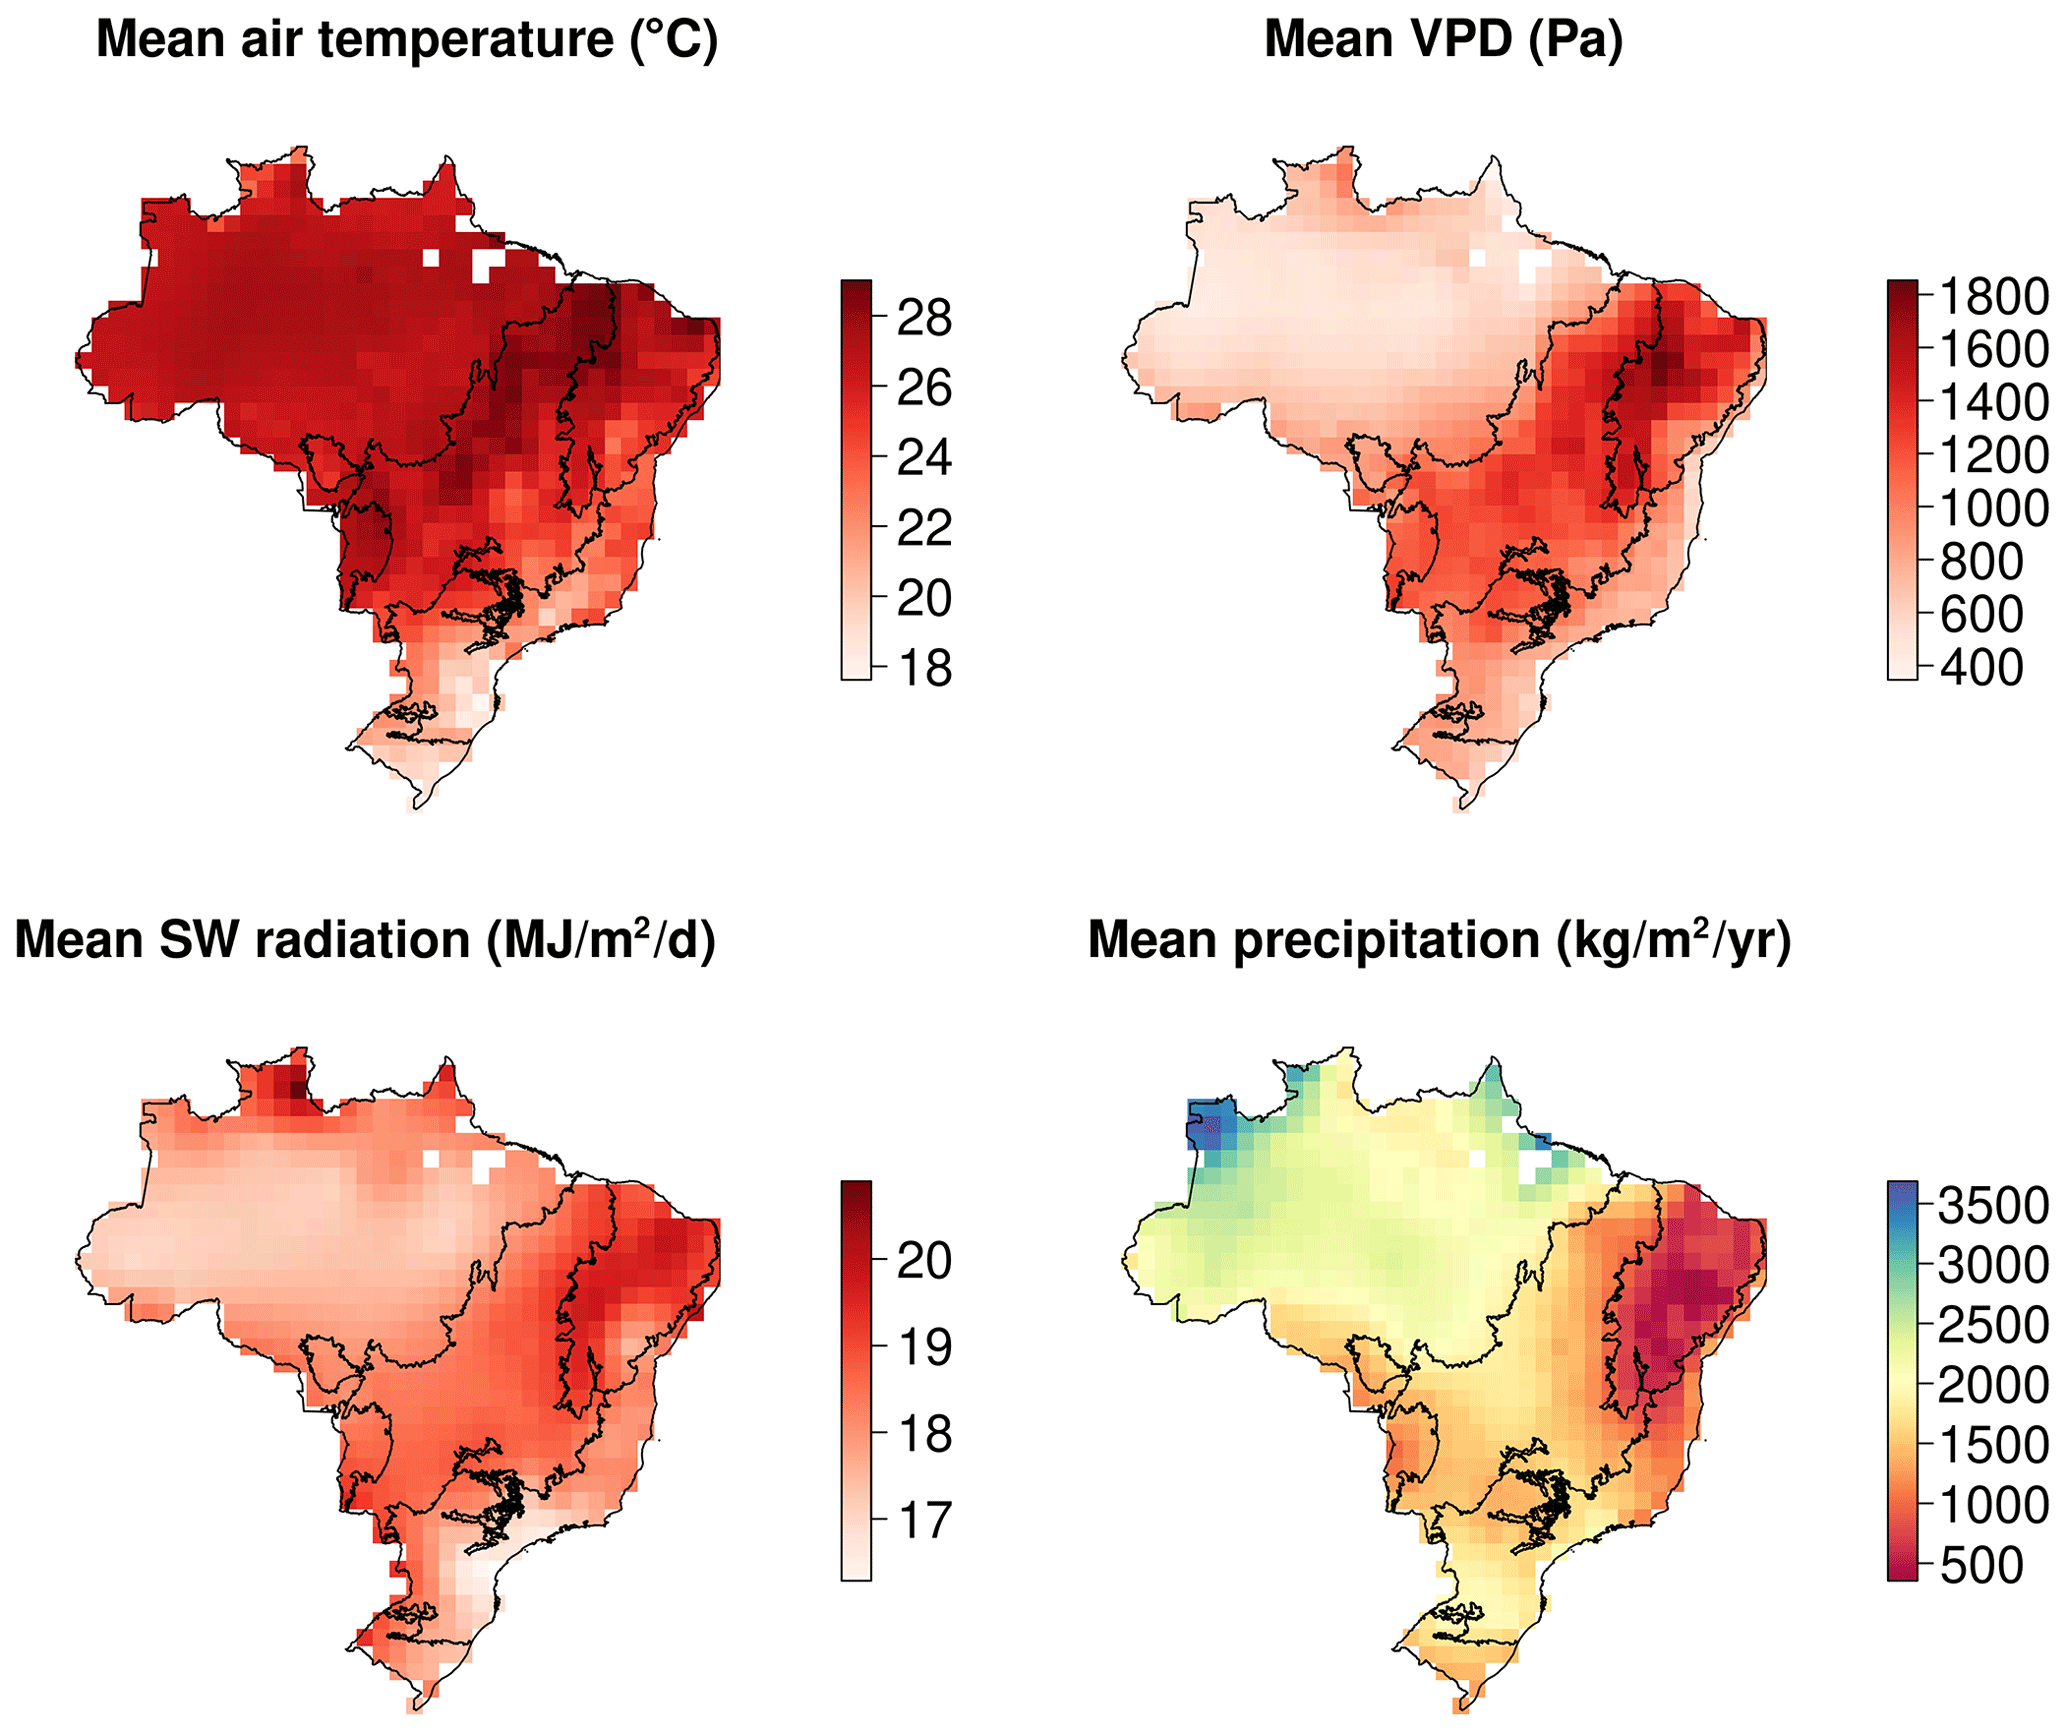
Figure A2Mean meteorological conditions for the calibration period from CRU-JRA dataset (2001–2017).
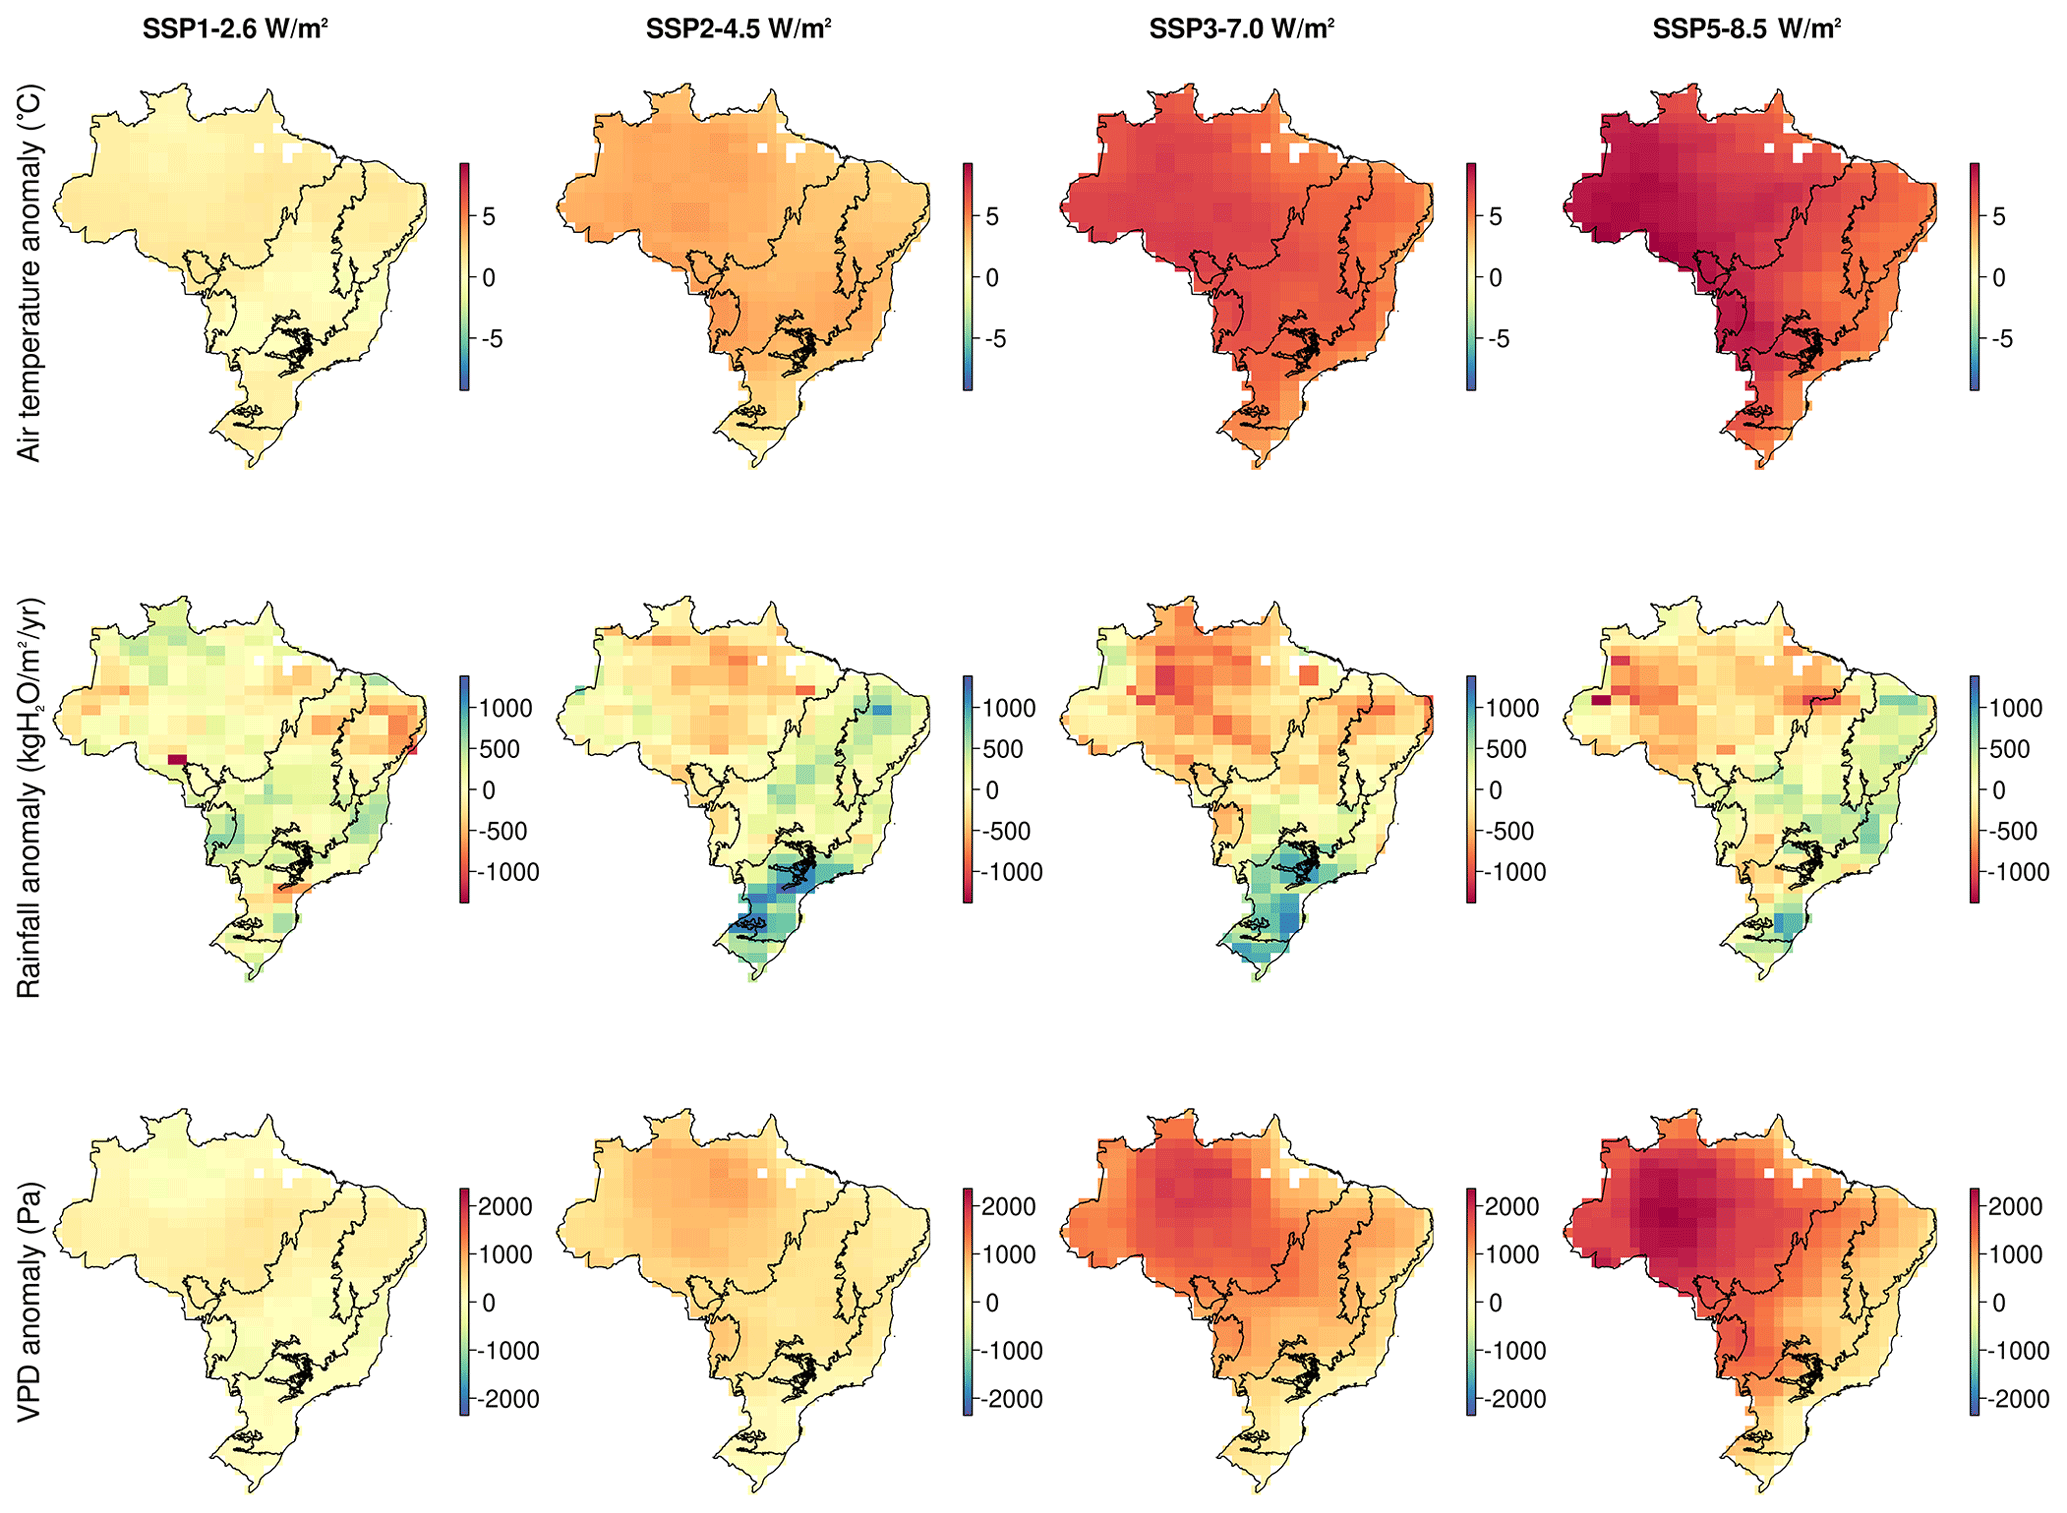
Figure A3Maps of mean climate anomaly averaged between two 5-year periods at the beginning (2018–2022) and end (2095–2099) of the future simulations.
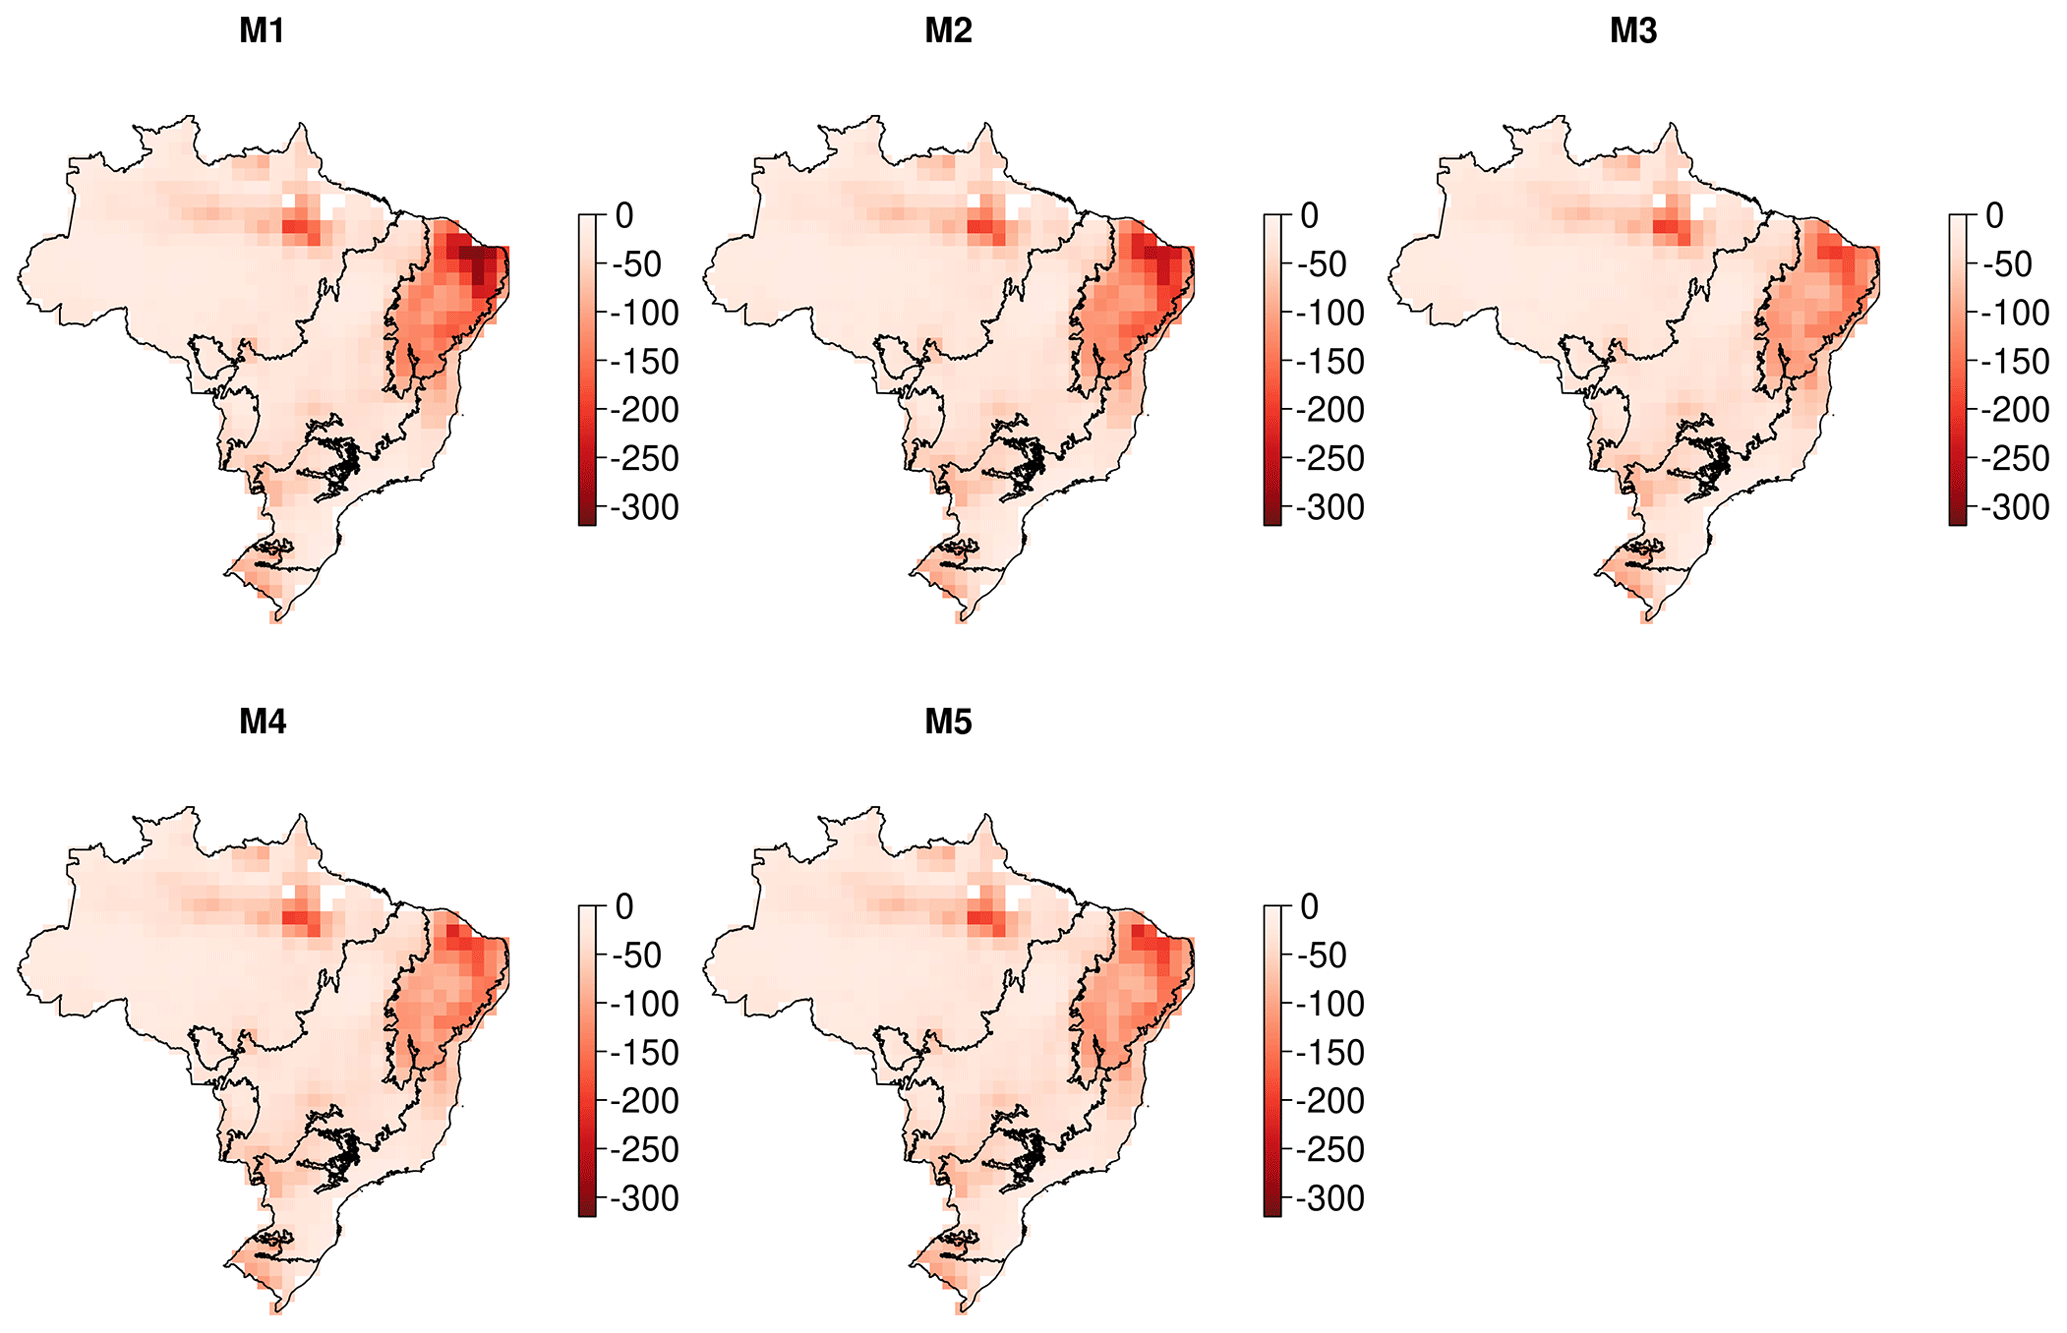
Figure A4Maps showing the pixel-level median log-likelihood scores achieved by each. More negative values indicate a greater disagreement between the model-simulated carbon cycle and corresponding observational constraints. The Brazil-wide averaged likelihood scores are −48.7, −47.7, −45.1, −45.6 and −45.7 for models M1–5, respectively.

Figure A5Comparison between Ra : GPP estimated by DALEC models and prior value assimilated by CARDAMOM. The top row shows the maps of the pixel-level median estimated by each model. The bottom row shows the histograms of the mapped information. The vertical solid red line shows the prior value and the vertical dashed red line shows the uncertainty range associated with the prior value.
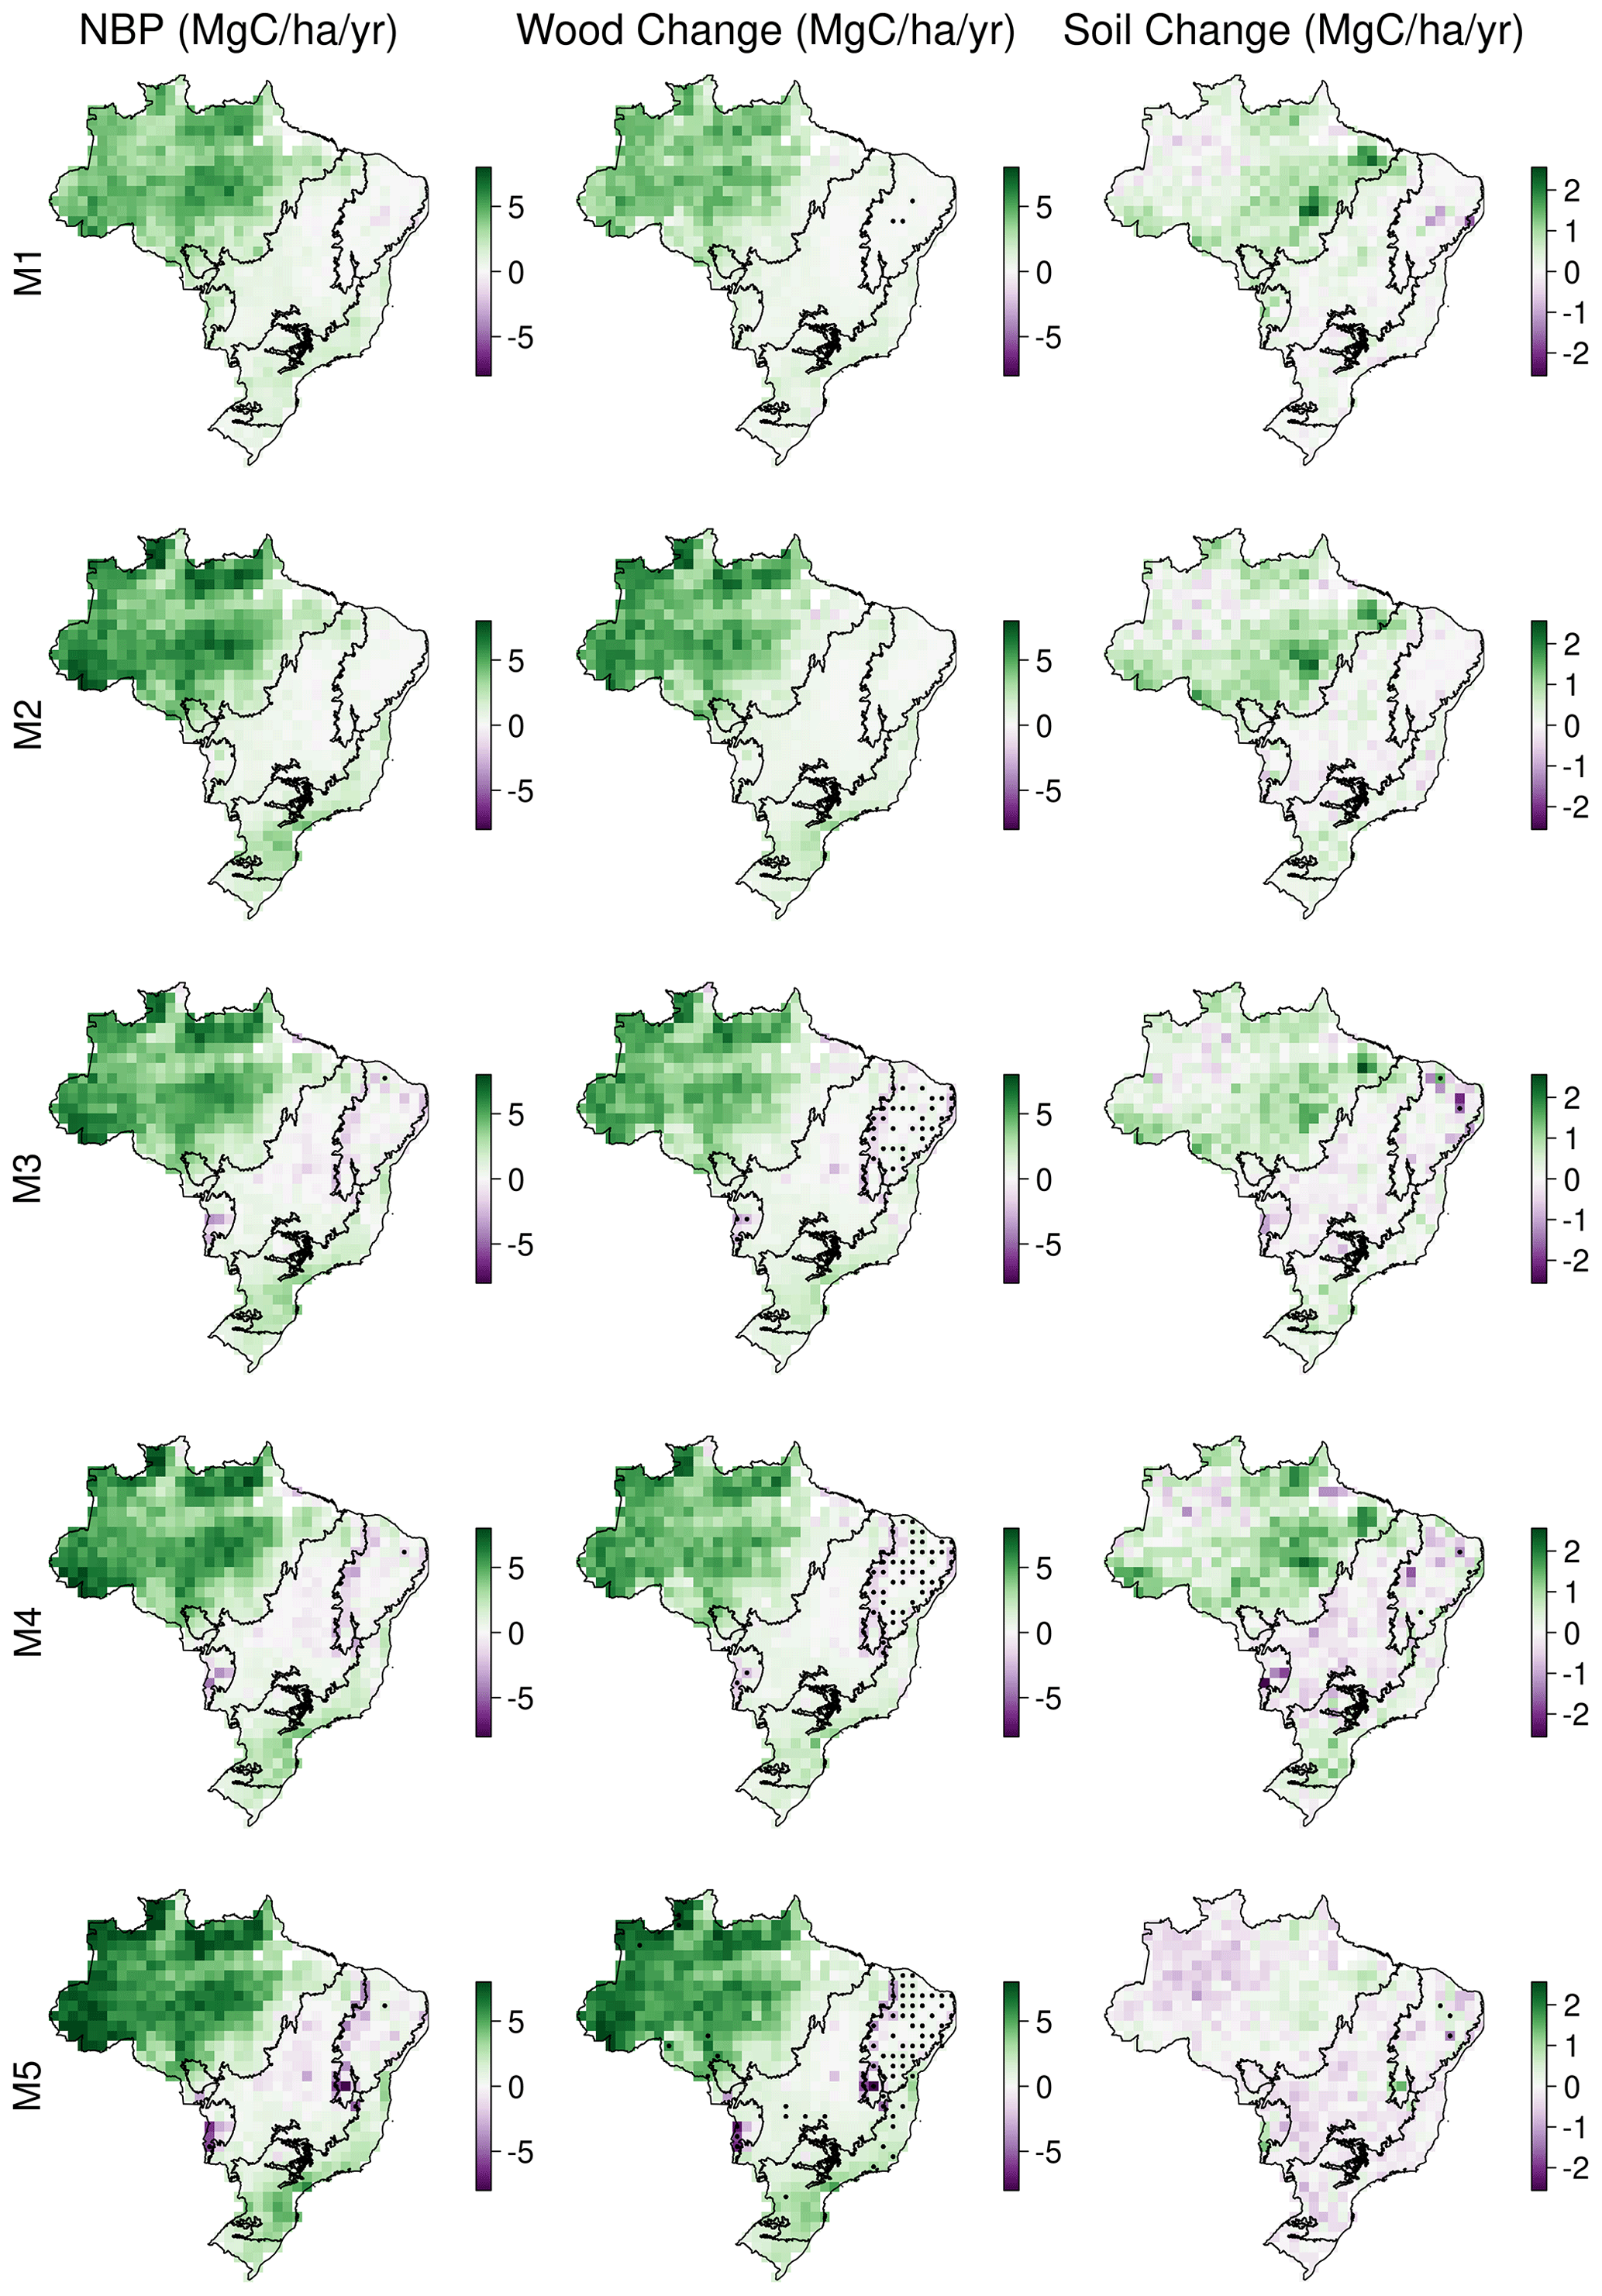
Figure A6DALEC suite estimates of estimates of net biome productivity (NBP; 2001–2017) (i.e. NBE to provide sign consistency with C stocks), wood and soil carbon stock change. Stippling to indicate > 90 % confidence on a given pixel being a net source or sink of carbon during our analysis.
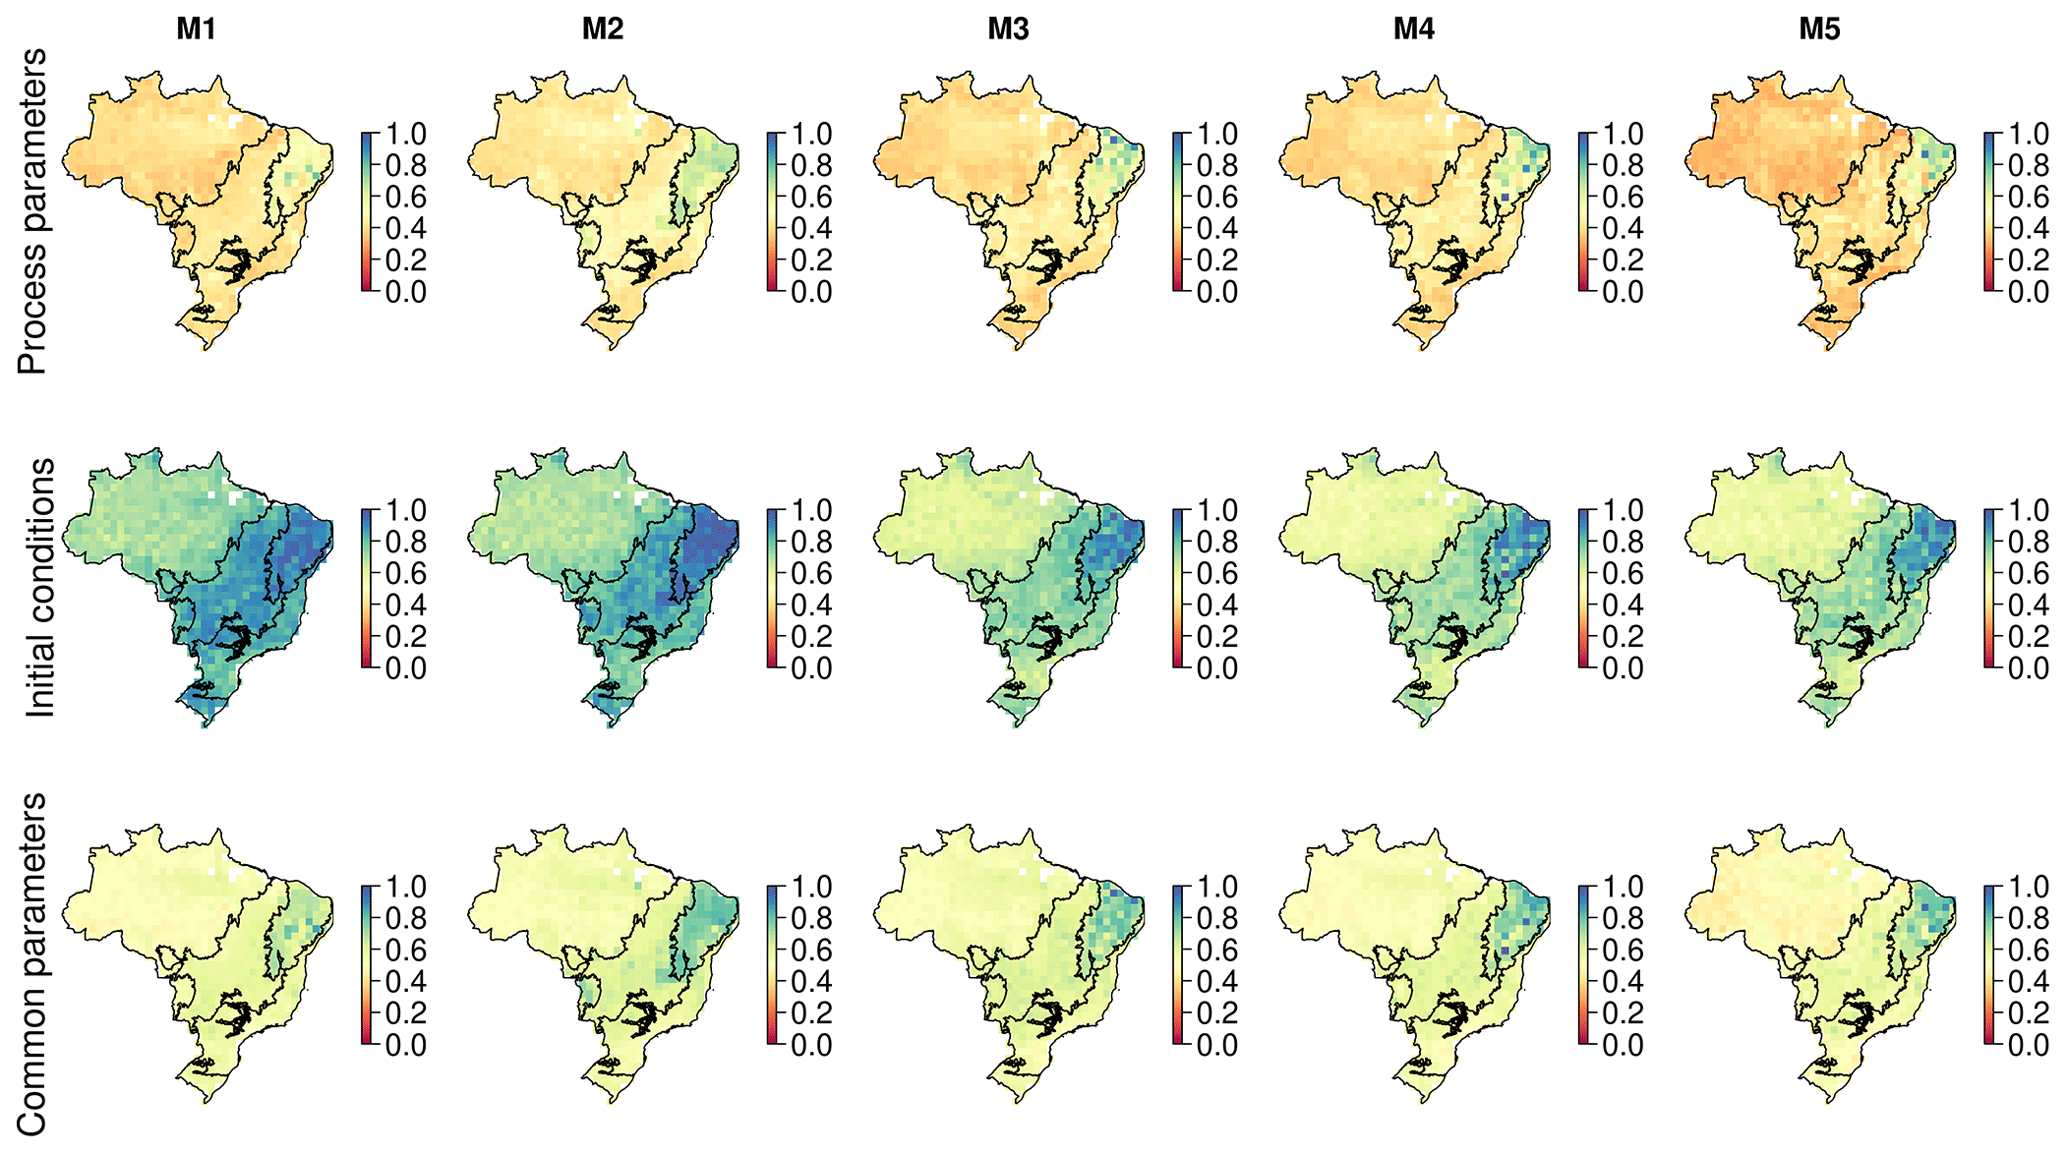
Figure A7Maps showing 1 − posterior : prior for parameters at the 90 % confidence interval, i.e. the reduction in parameter uncertainty in the posterior relative to the prior parameter ranges. The top row shows parameters associated with ecosystem processes, the middle row shows parameters that specify the initial conditions of the model C and water pools, and the bottom row shows those parameters which are common across all models. For information on common parameters, see Table A1.
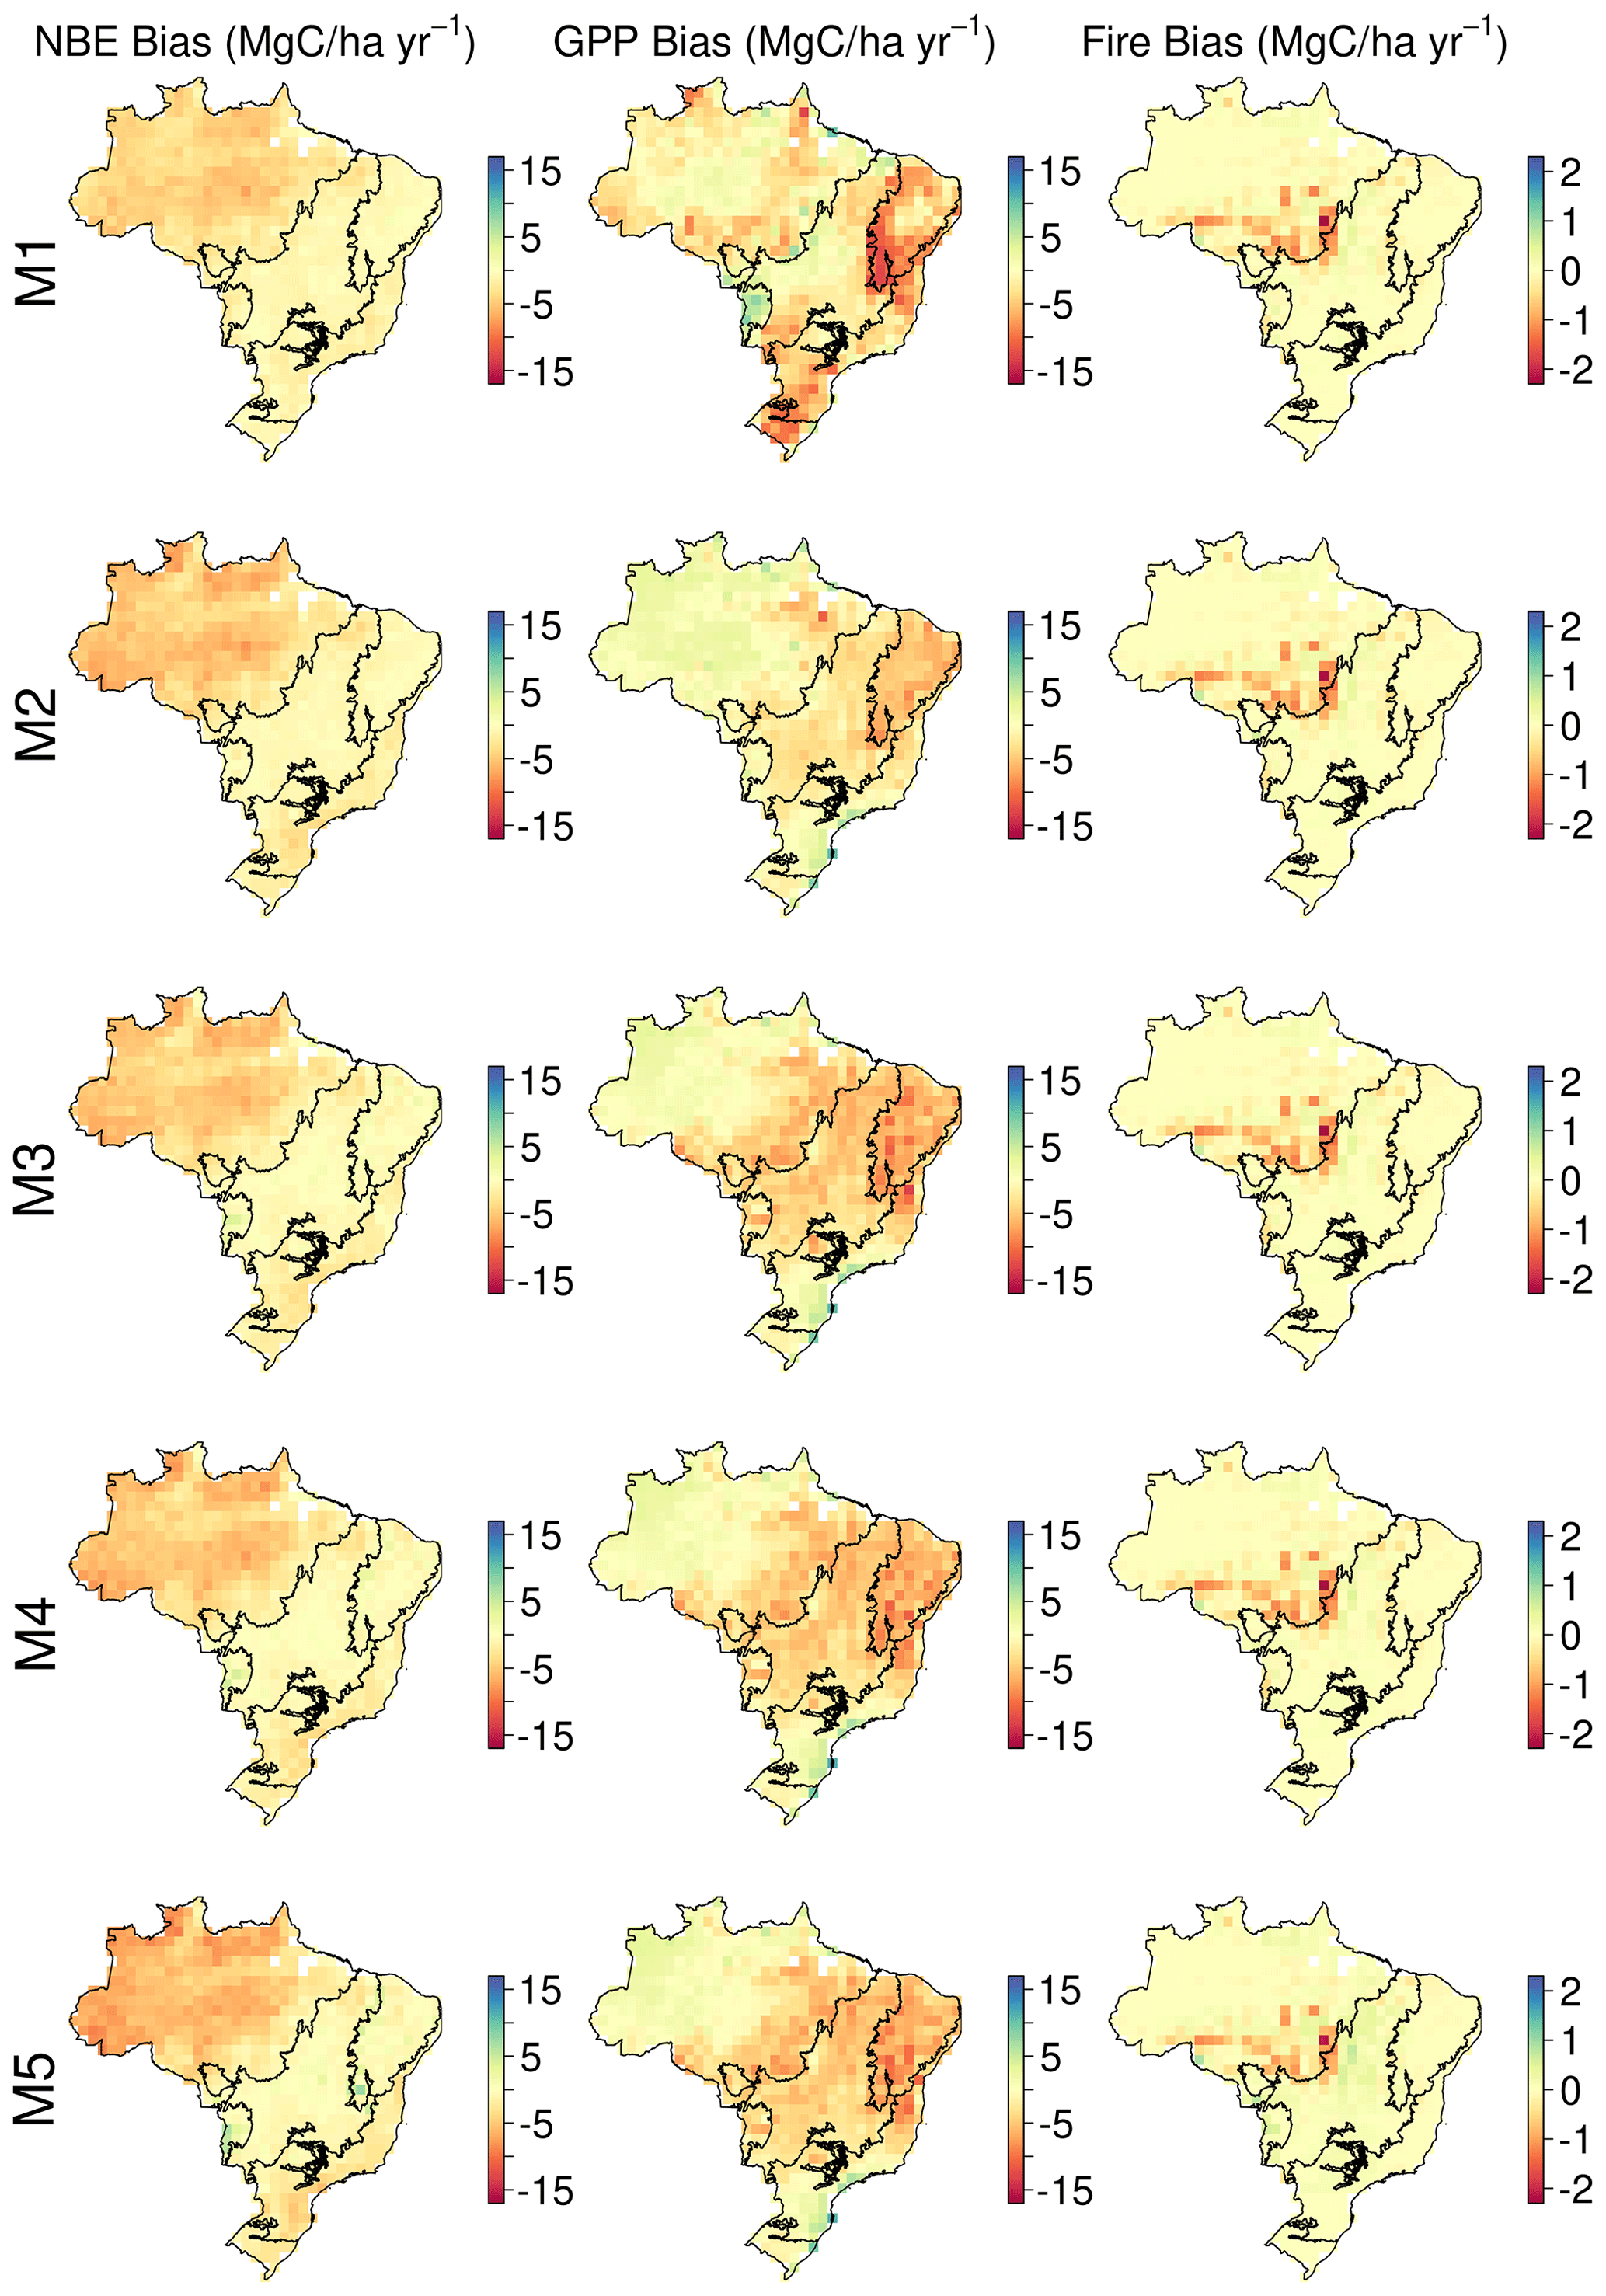
Figure A8Maps showing the mean bias between each DALEC model and independent data for NBE, GPP and fire emissions. See Fig. 4 for details.

Figure A9Model-specific trends (2001–2017) in GPP, Rauto, Rhet, LAI estimated from the pixel-level median estimates.
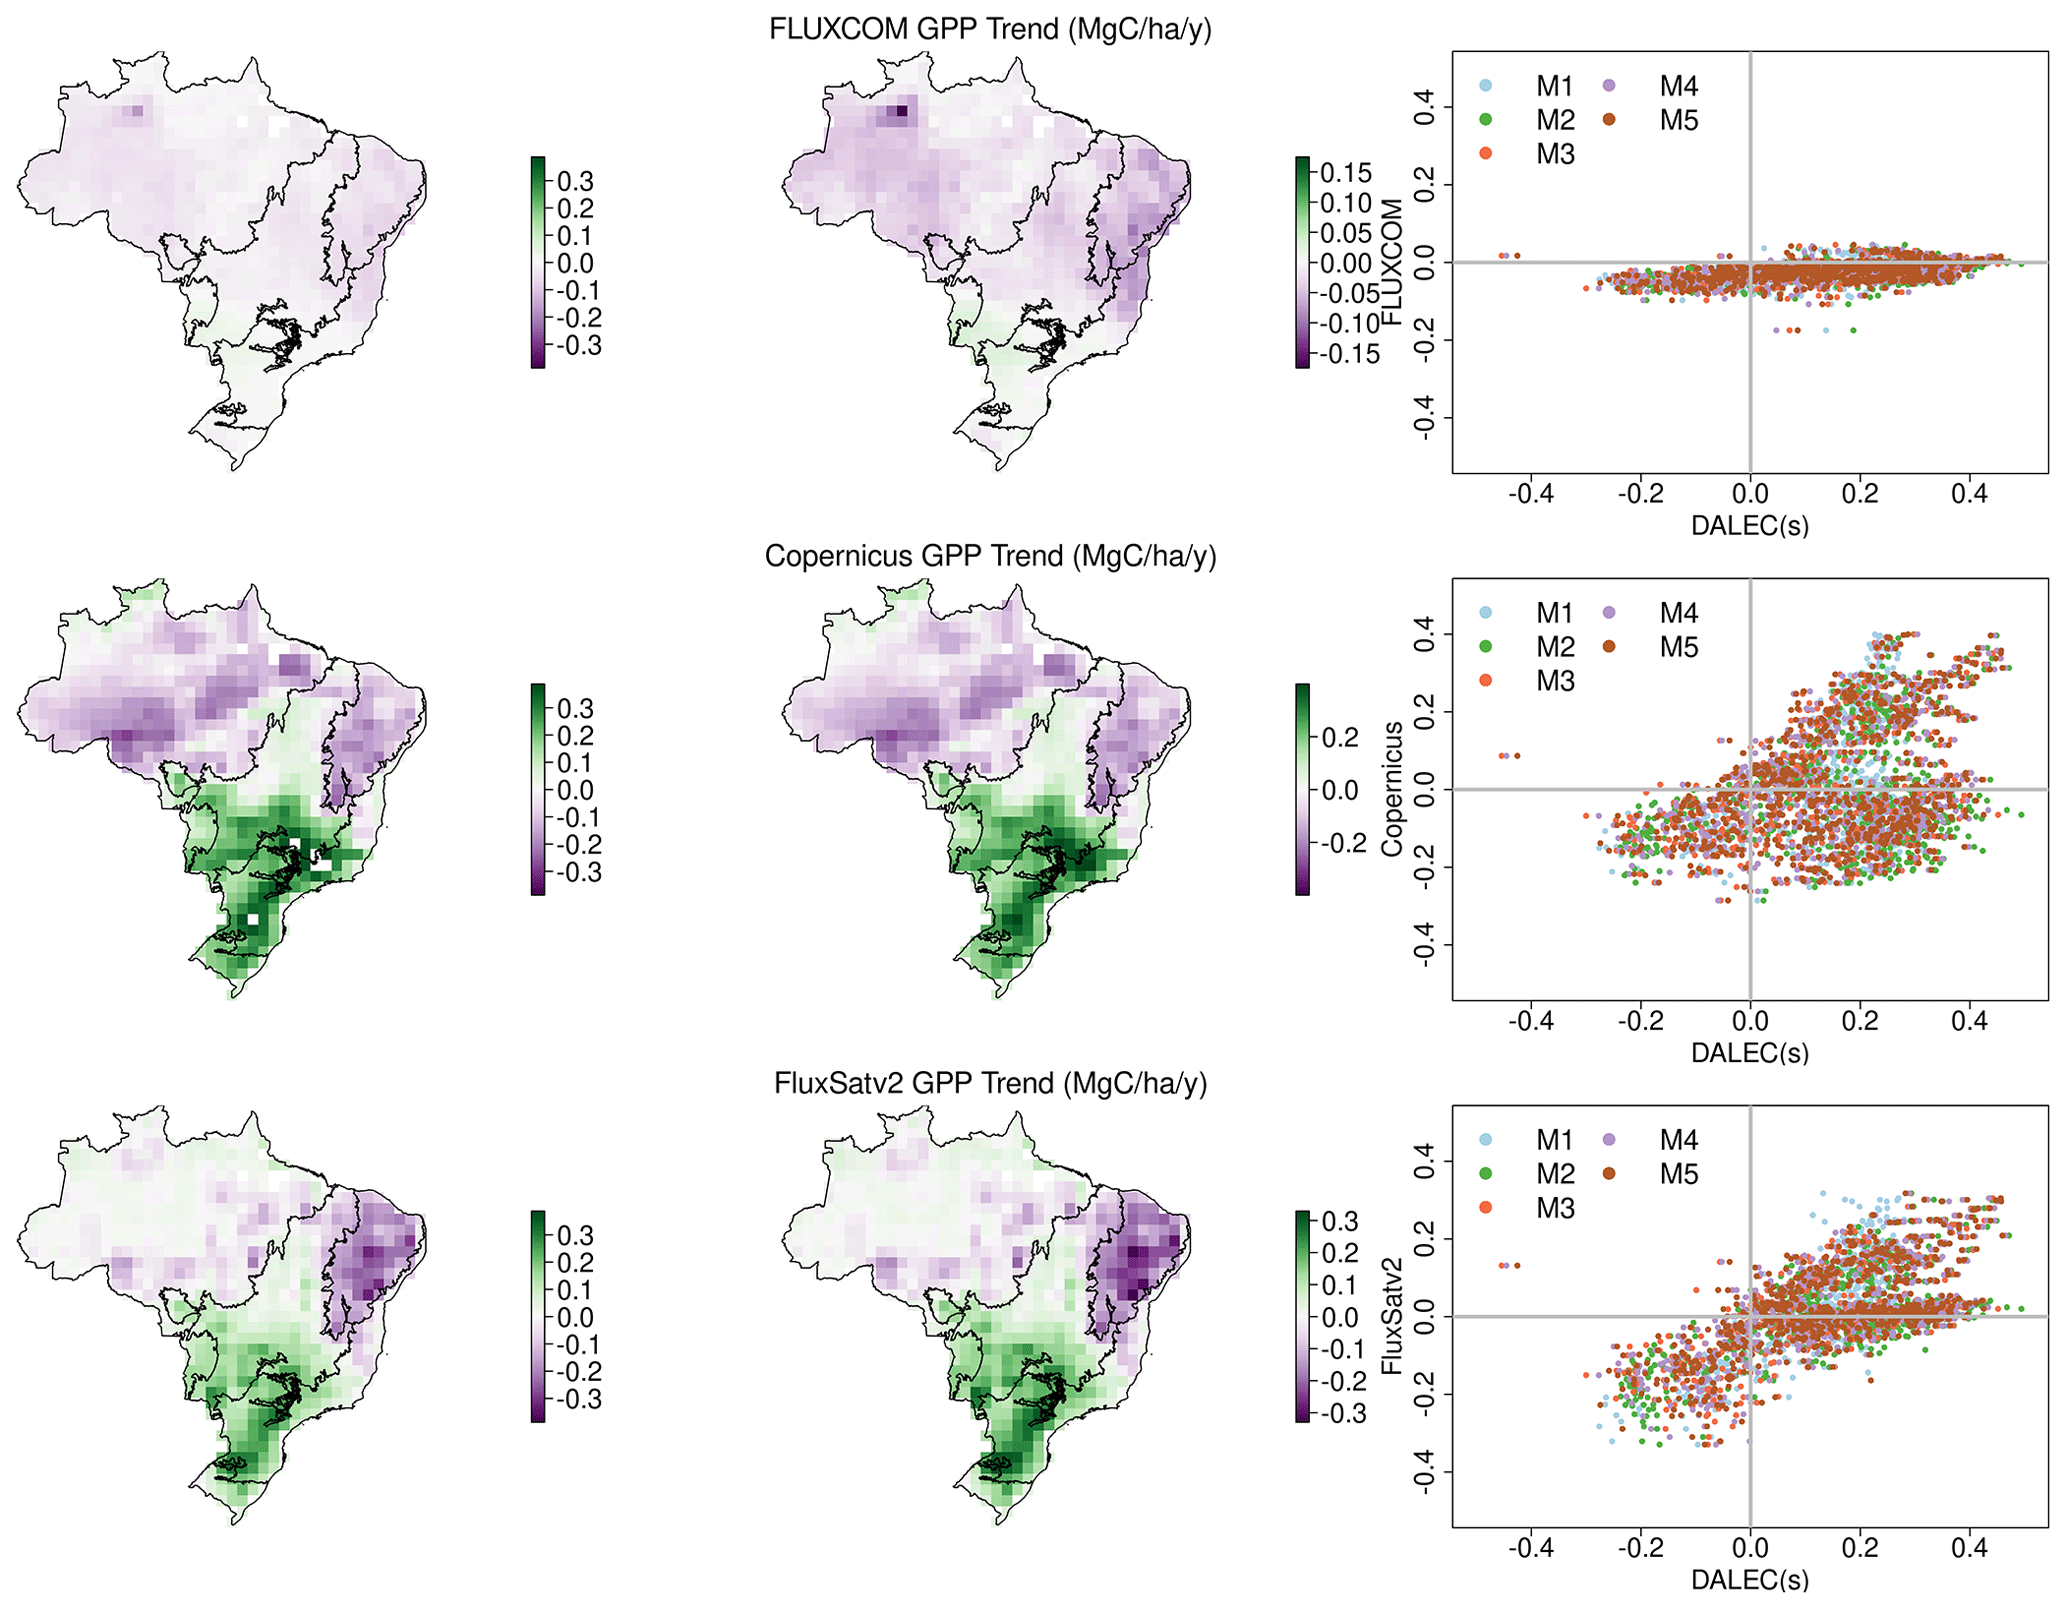
Figure A10FLUXCOM, Copernicus and FluxSatv2 GPP trends across Brazil (2001–2017). The maps in the left column show the trends on the same axis as the DALEC models in Fig. A9. The middle column shows the same information but on an axis based on values found in each independent estimate only to highlight their spatial patterning. The right column shows a comparison between trend estimates by each independent GPP estimate and the DALEC models (FLUXCOM R2 of 0.17–0.19, Copernicus R2 of 0.09–0.14, FluxSatv2 R2 of 0.40–0.45).
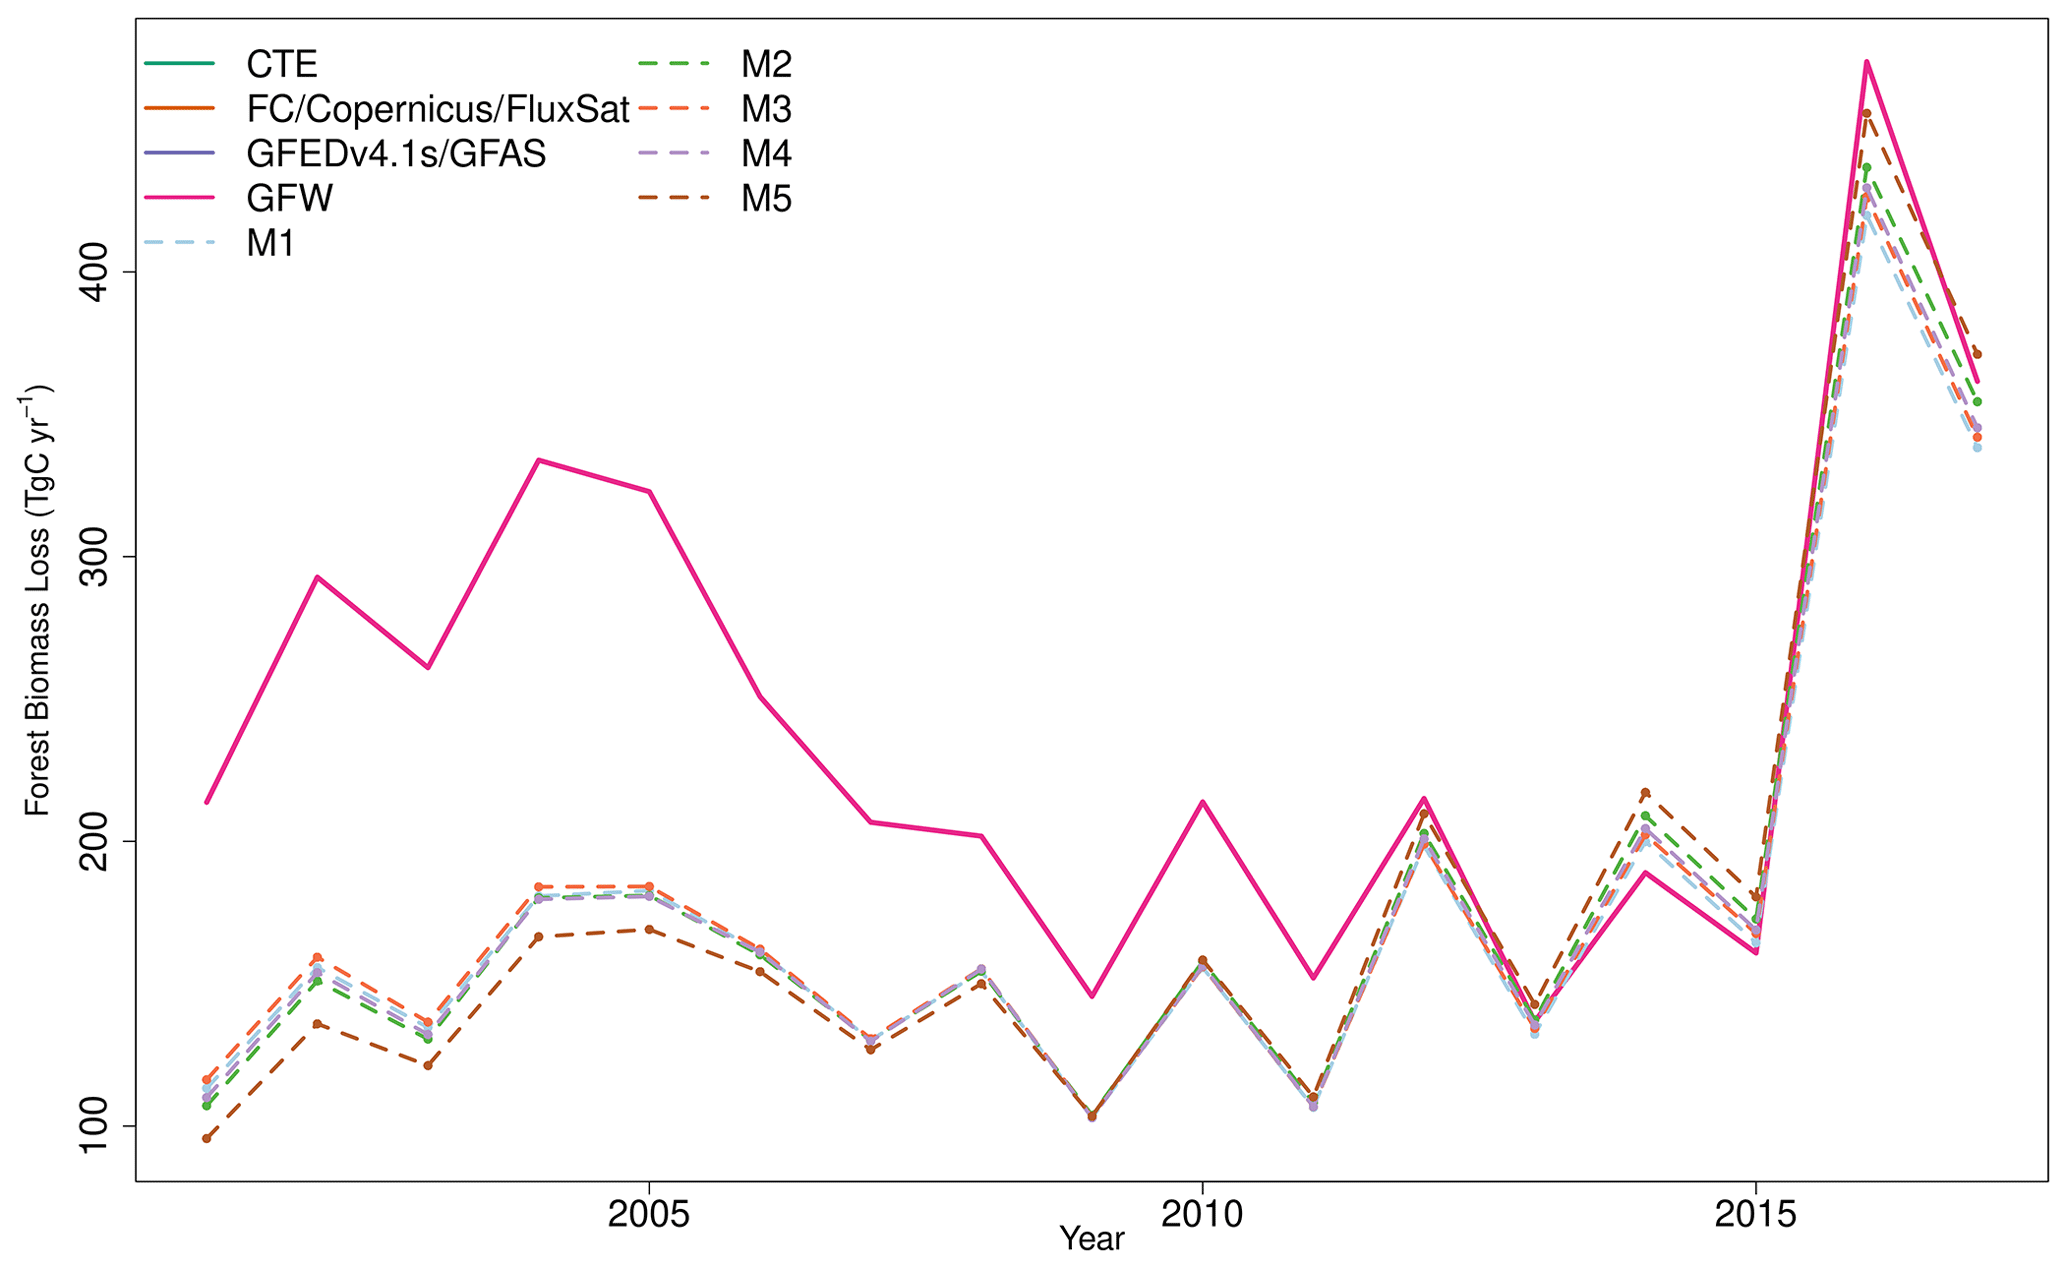
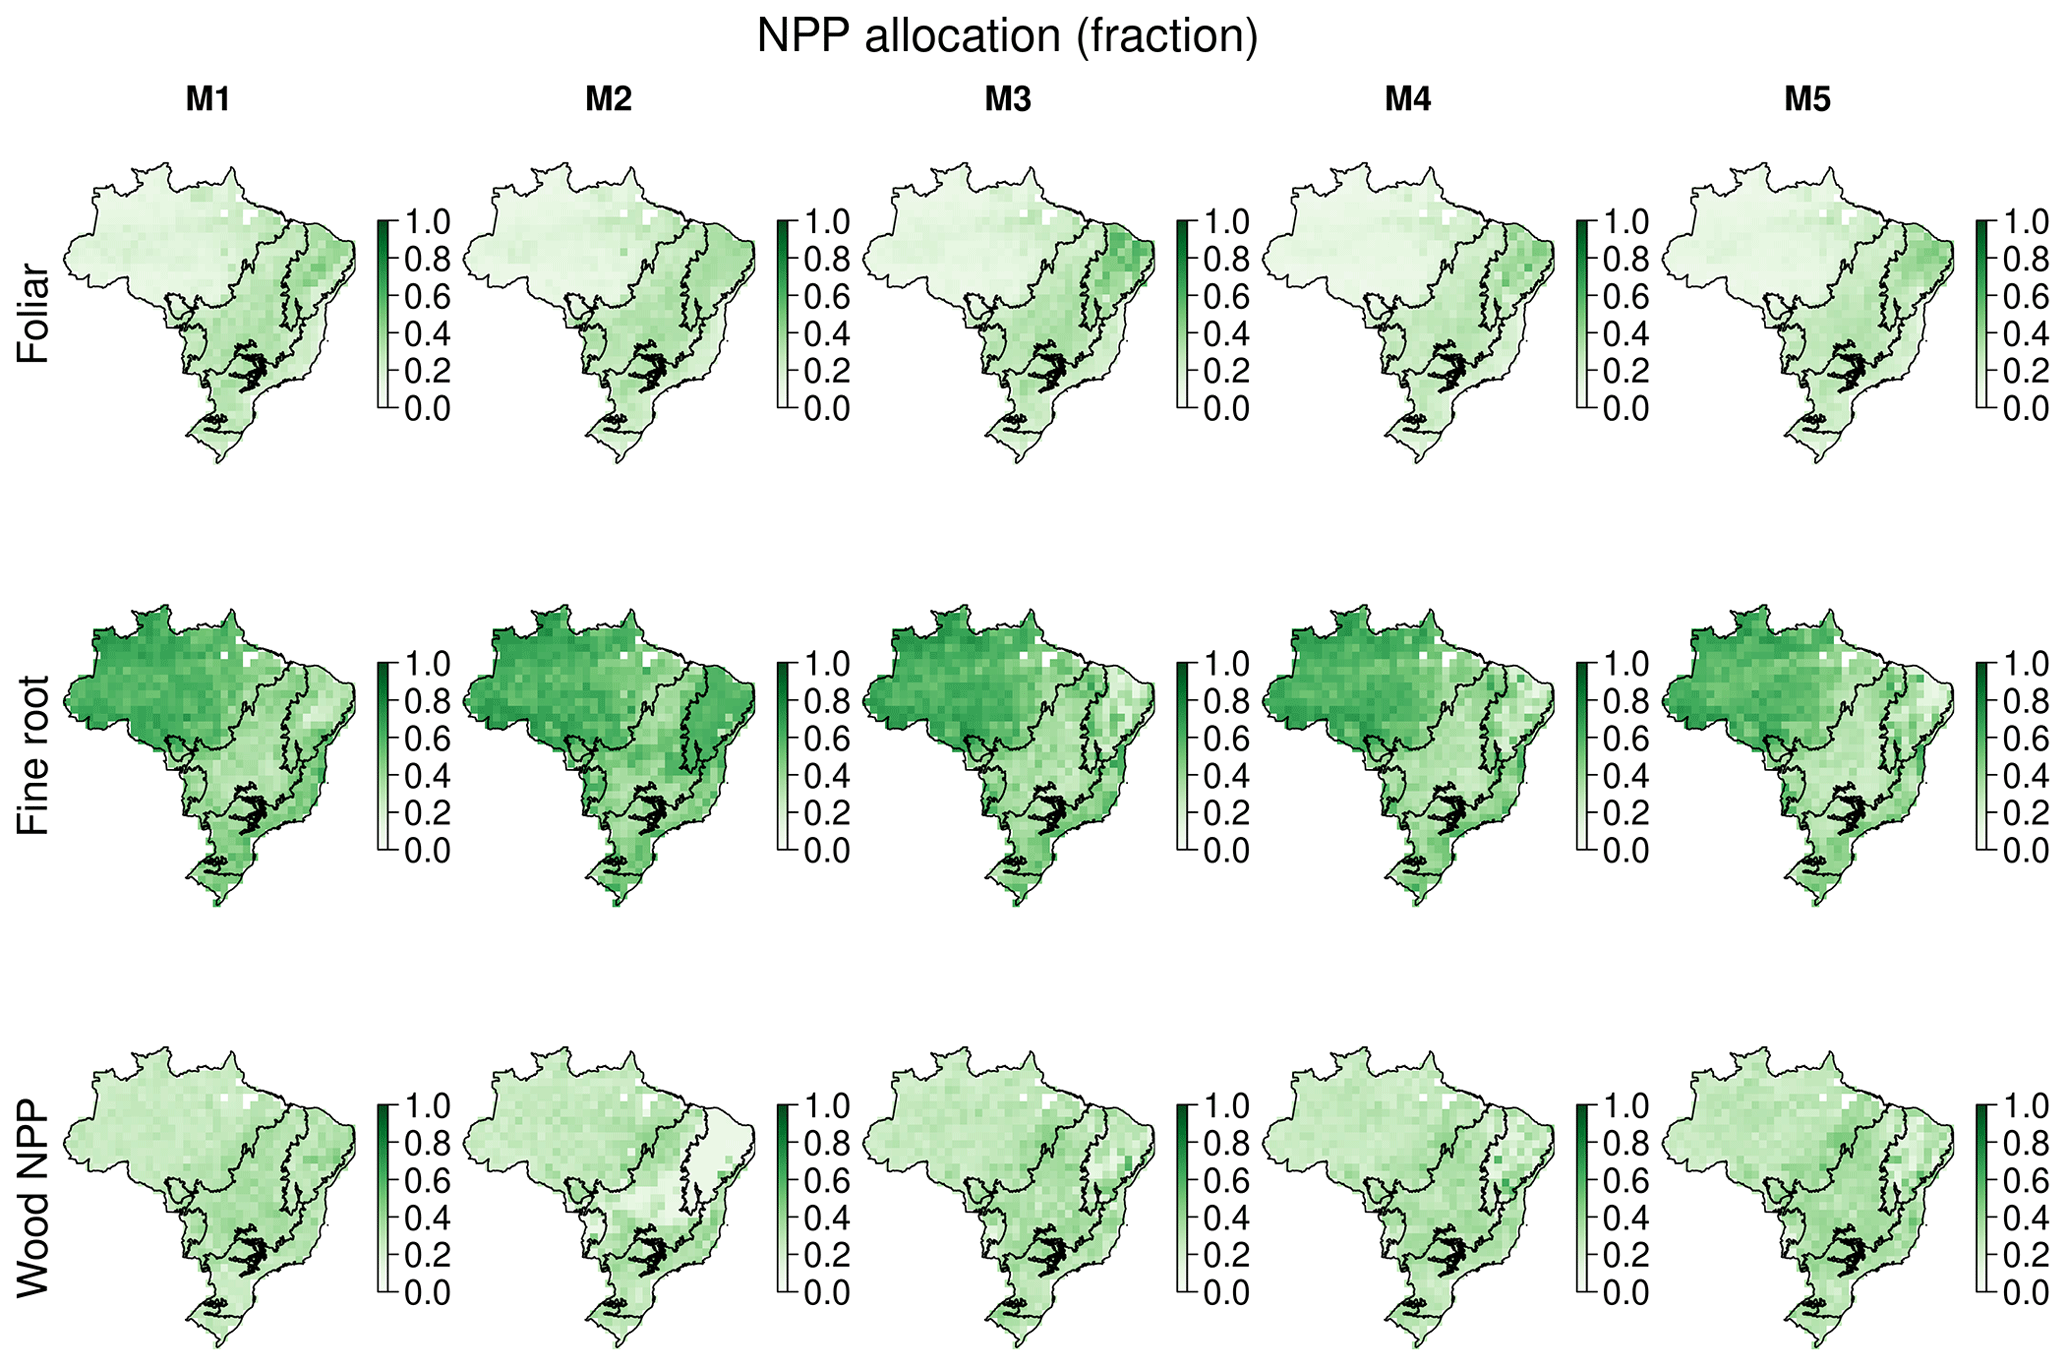
Figure A12Maps of the localised median estimates of NPP allocation fractions to live tissue for each model.
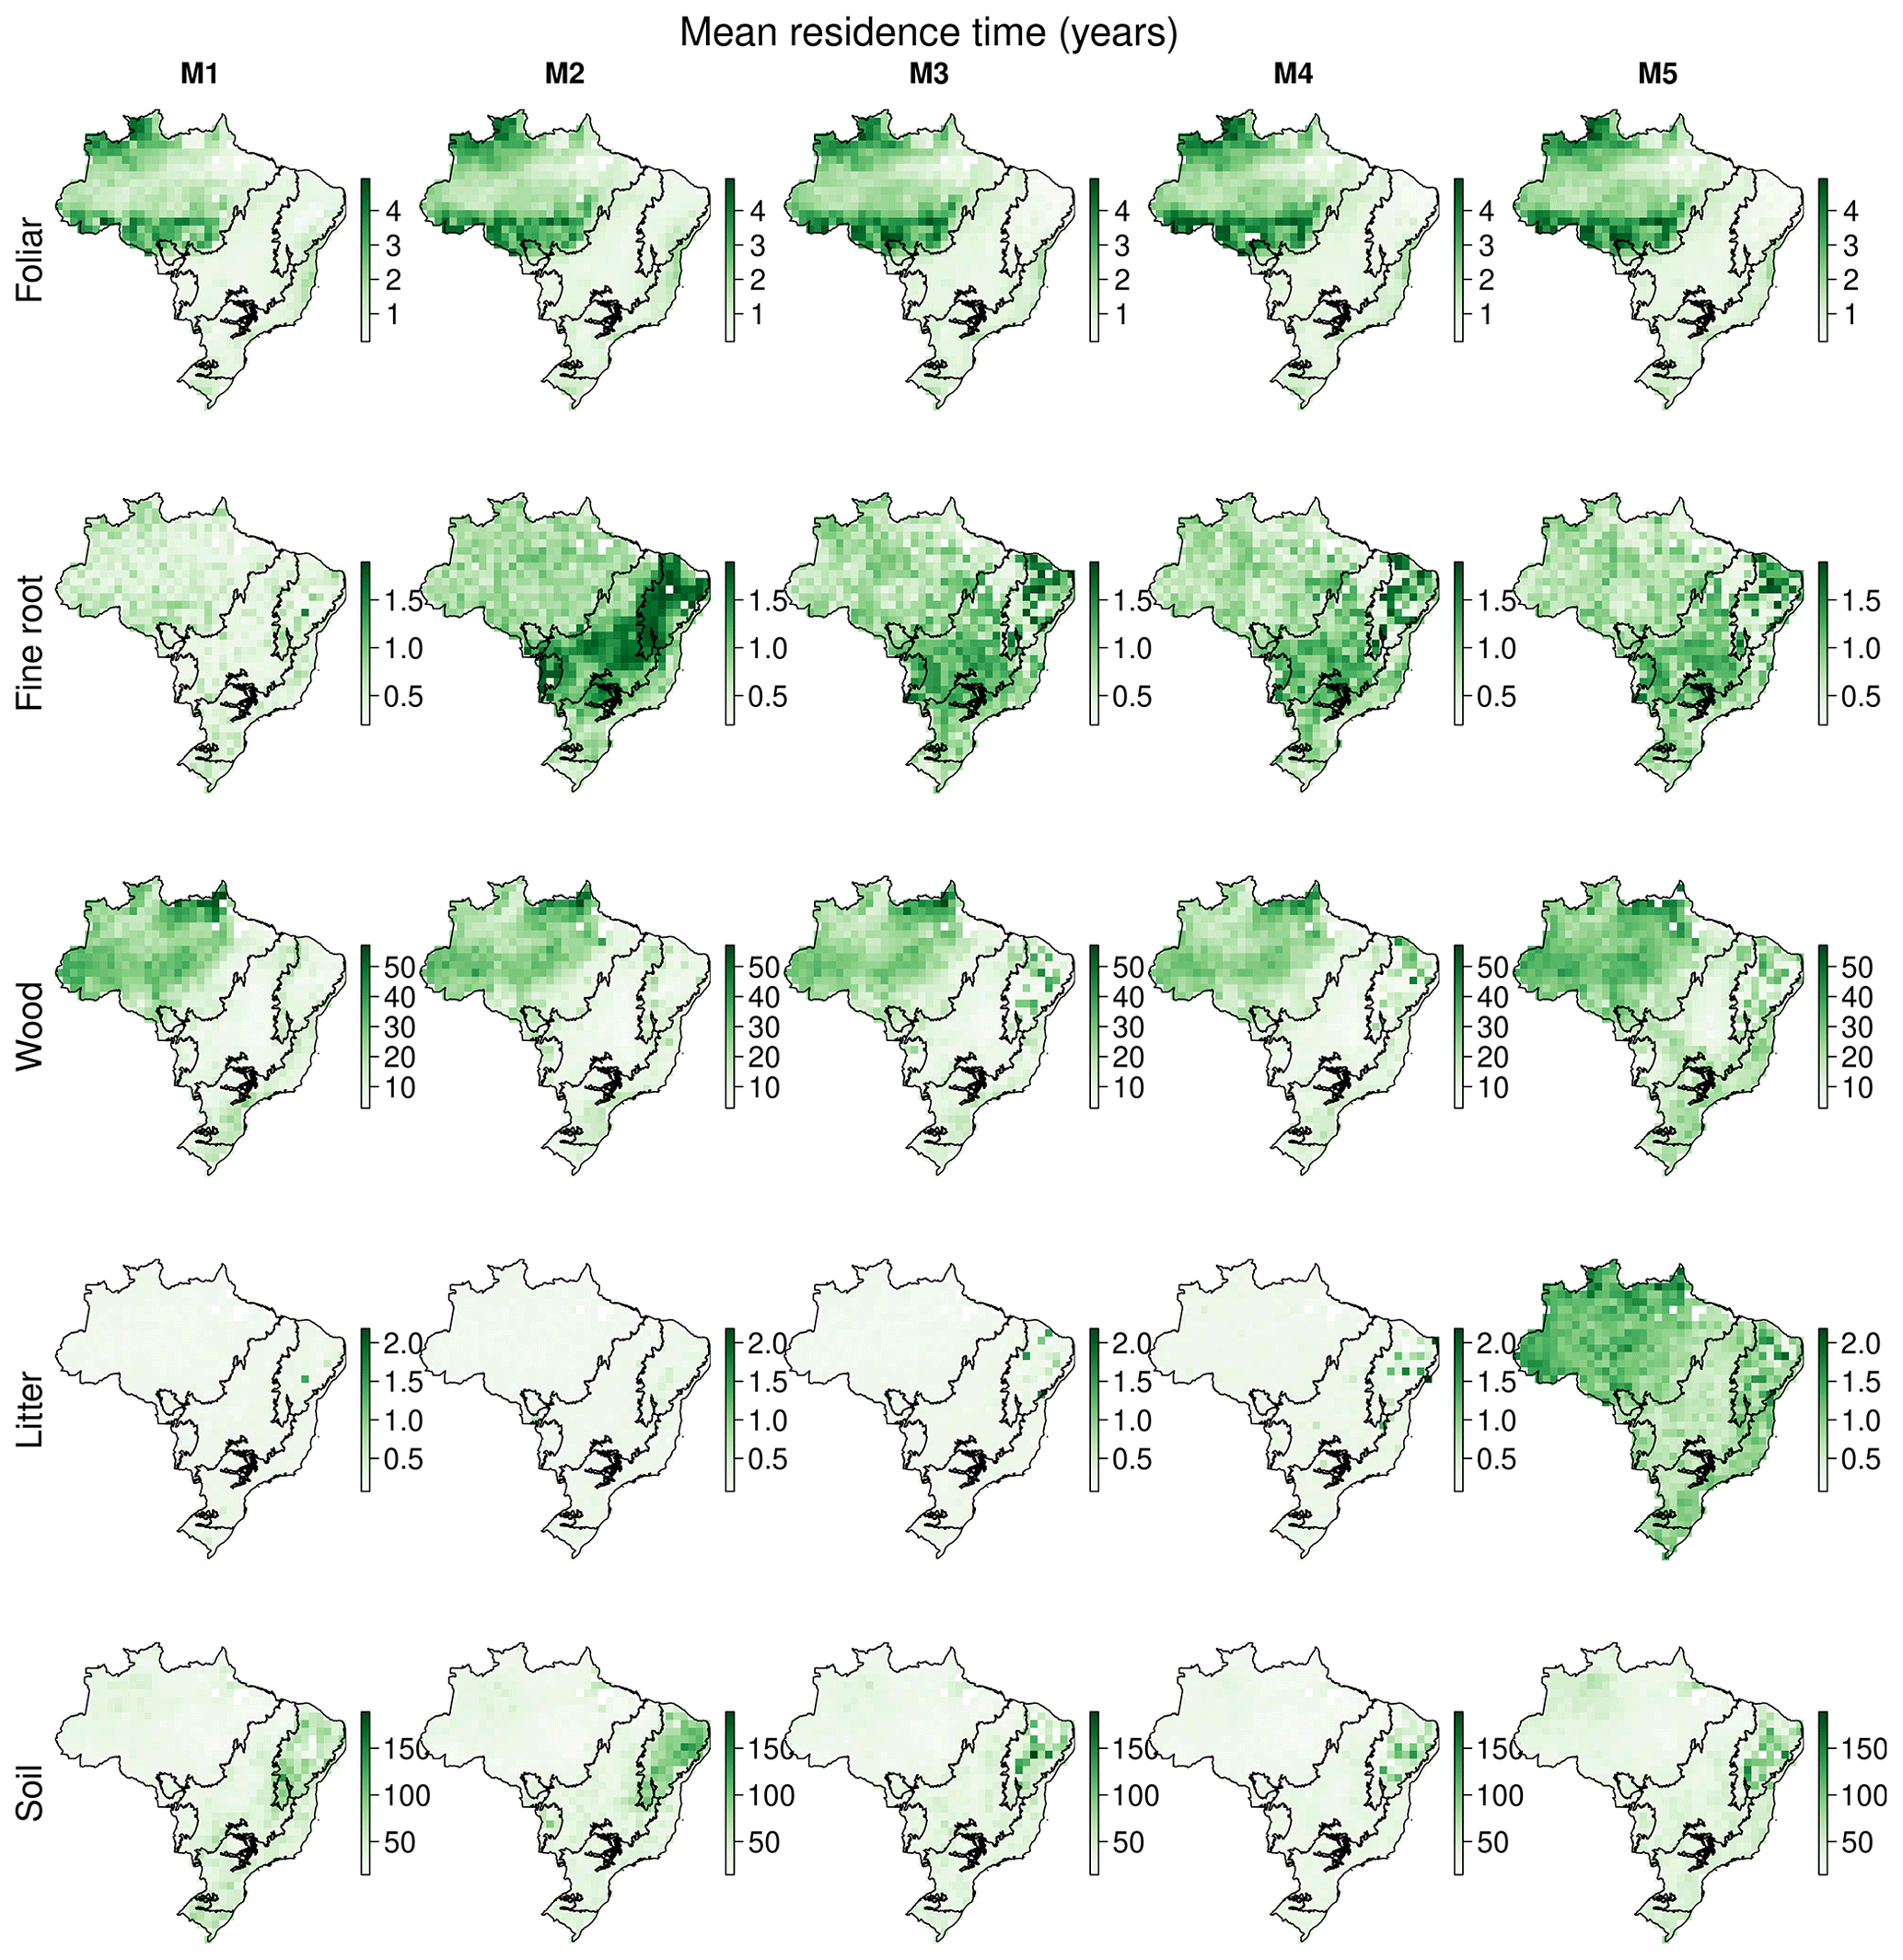
Figure A13Maps showing the localised median estimates of carbon pool MRTs for each model. Note that for models M1–4 litter MRT is foliar and fine root litter, while M5 also includes wood litter.

Figure A14Maps of DALEC model estimates of the contribution of natural, fire and biomass removals to biomass mean residence time. The mapped values are estimated from the pixel-level median estimates.

Figure A15Maps of DALEC model estimates biomass (sum of labile, foliage, fine root and wood) change between 2001 and 2100. The mapped values are estimated from the pixel-level median estimates. Areas with biomass change with > 90 % confidence are shown with stippling.
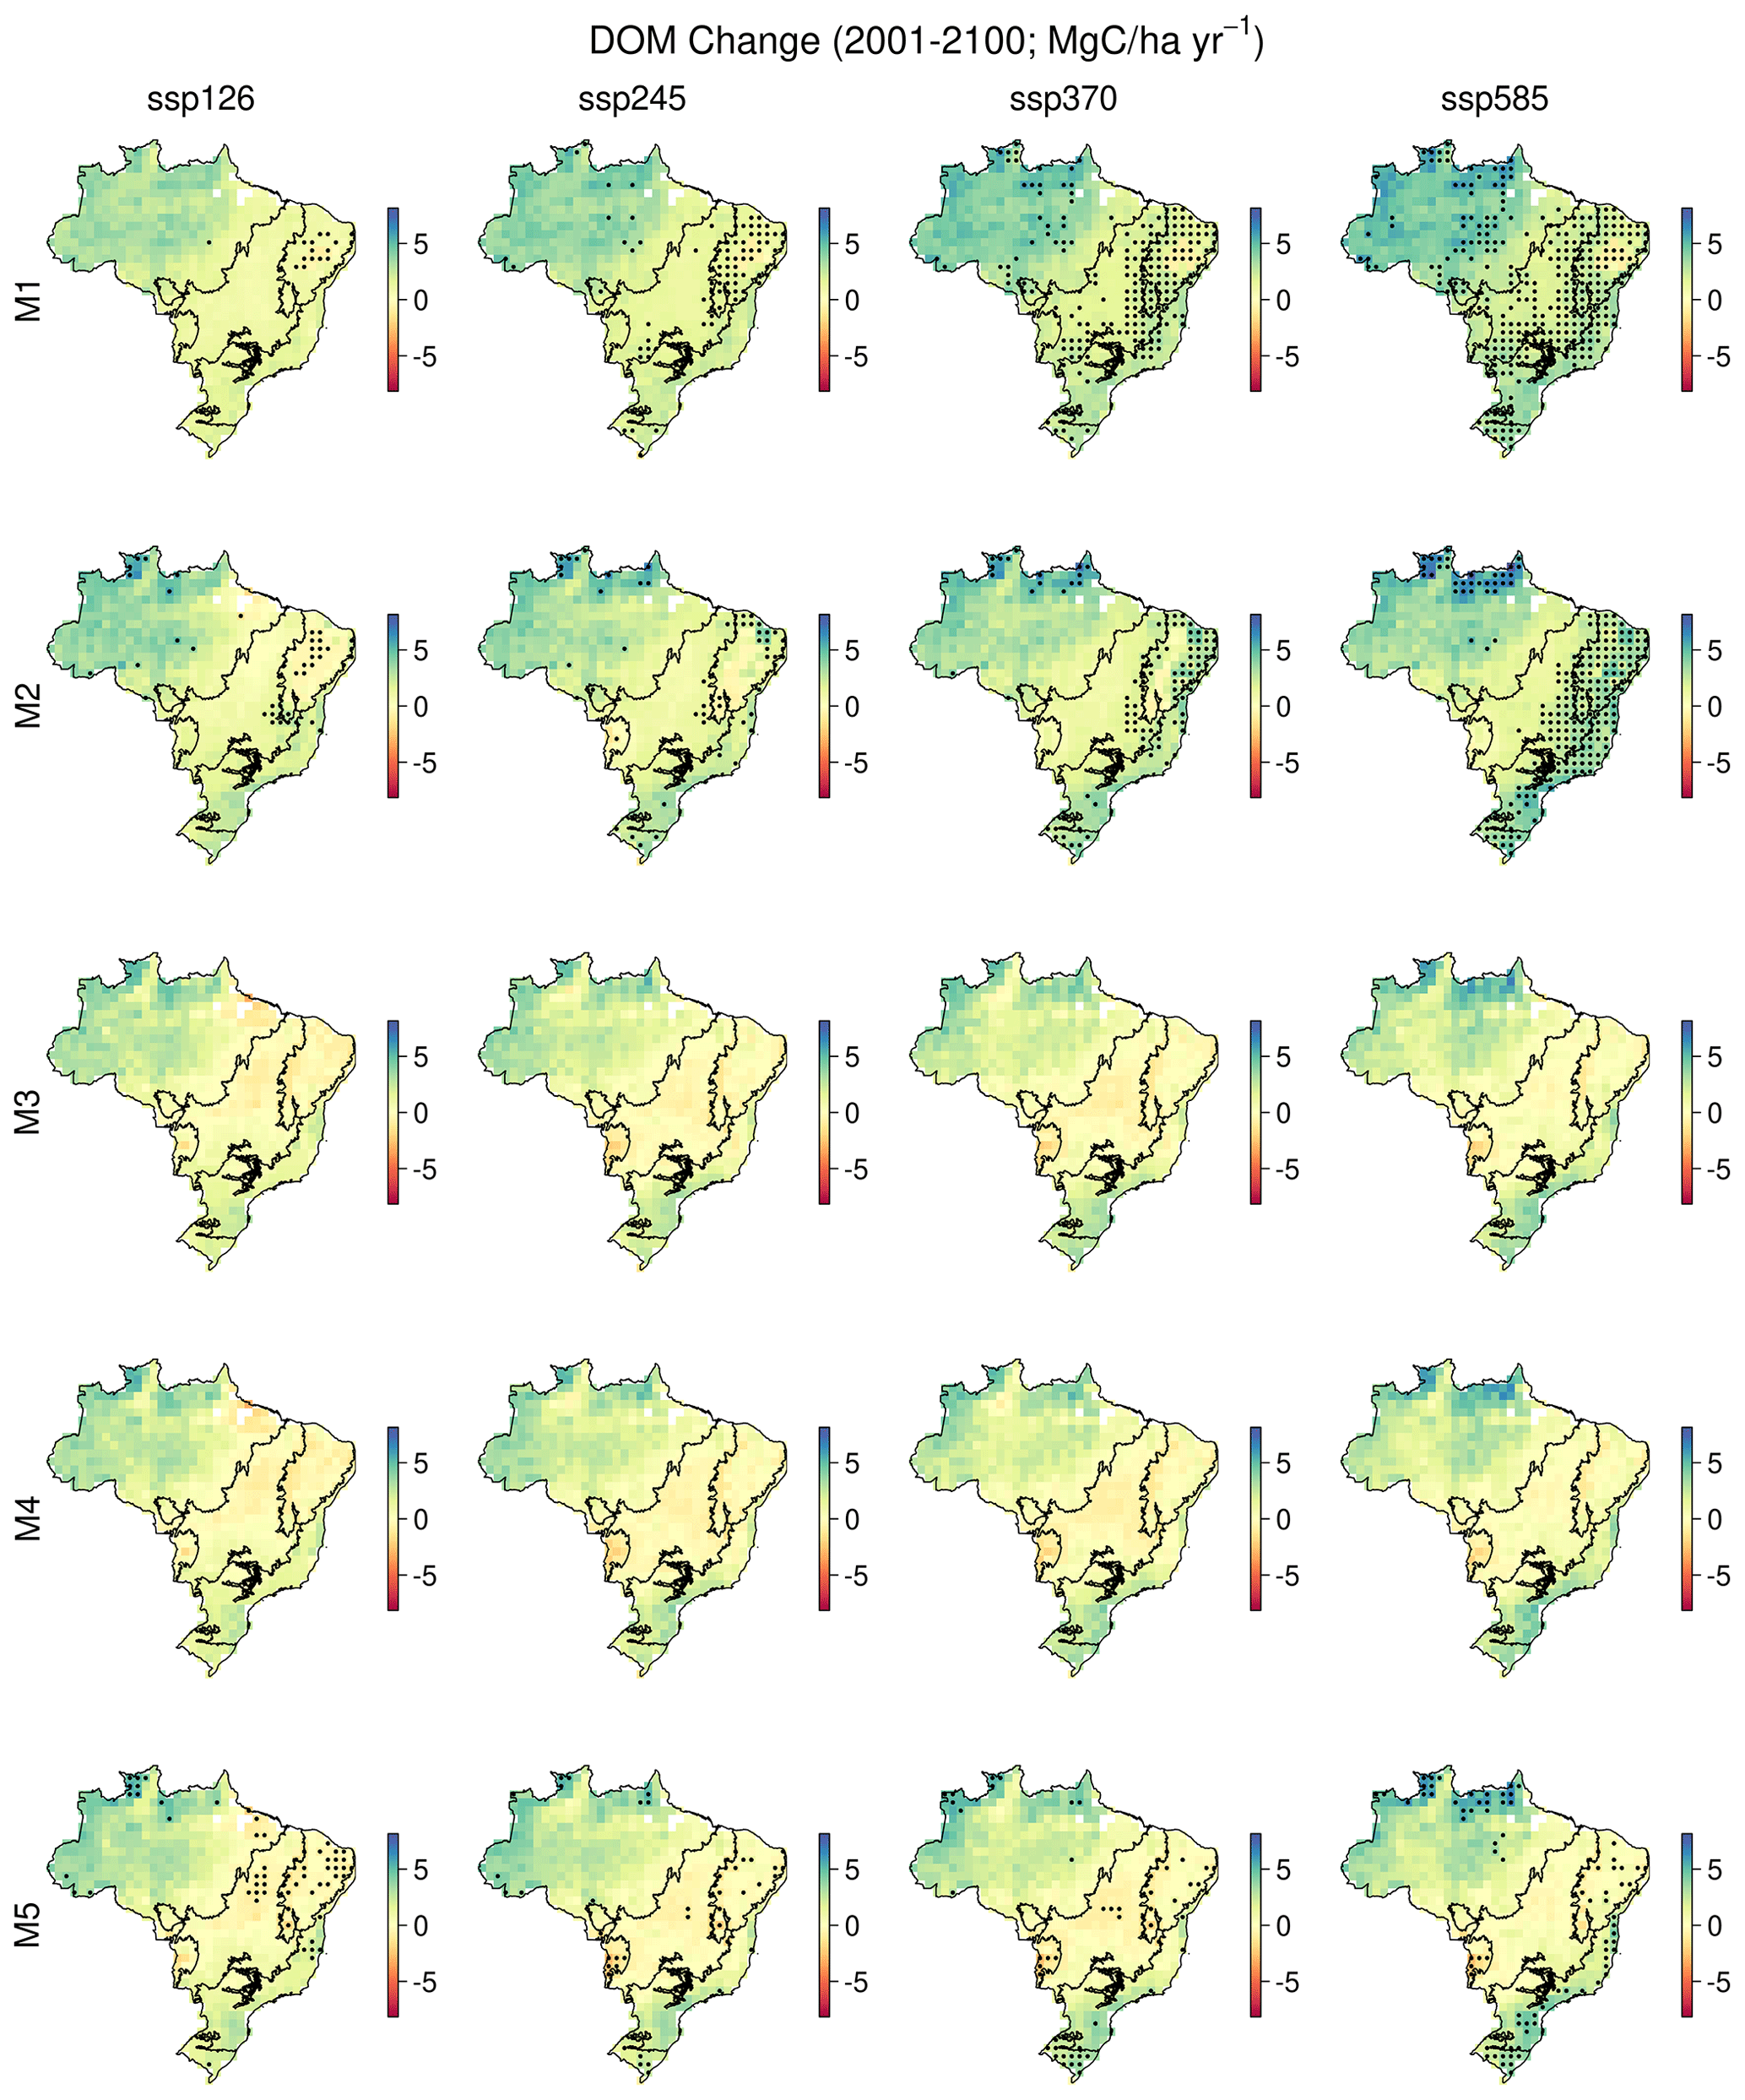
Figure A16Maps of DALEC model estimates DOM (sum of soil, litter and in M5 wood litter) change between 2001 and 2100. The mapped values are estimated from the pixel-level median estimates. Areas with DOM change with > 90 % confidence are shown with stippling.

Figure A17Absolute uncertainty range (5 %–95 % quantiles) simulated for each pixel in 2100 attributed to model parameters, model structural diversity and climate change scenario.
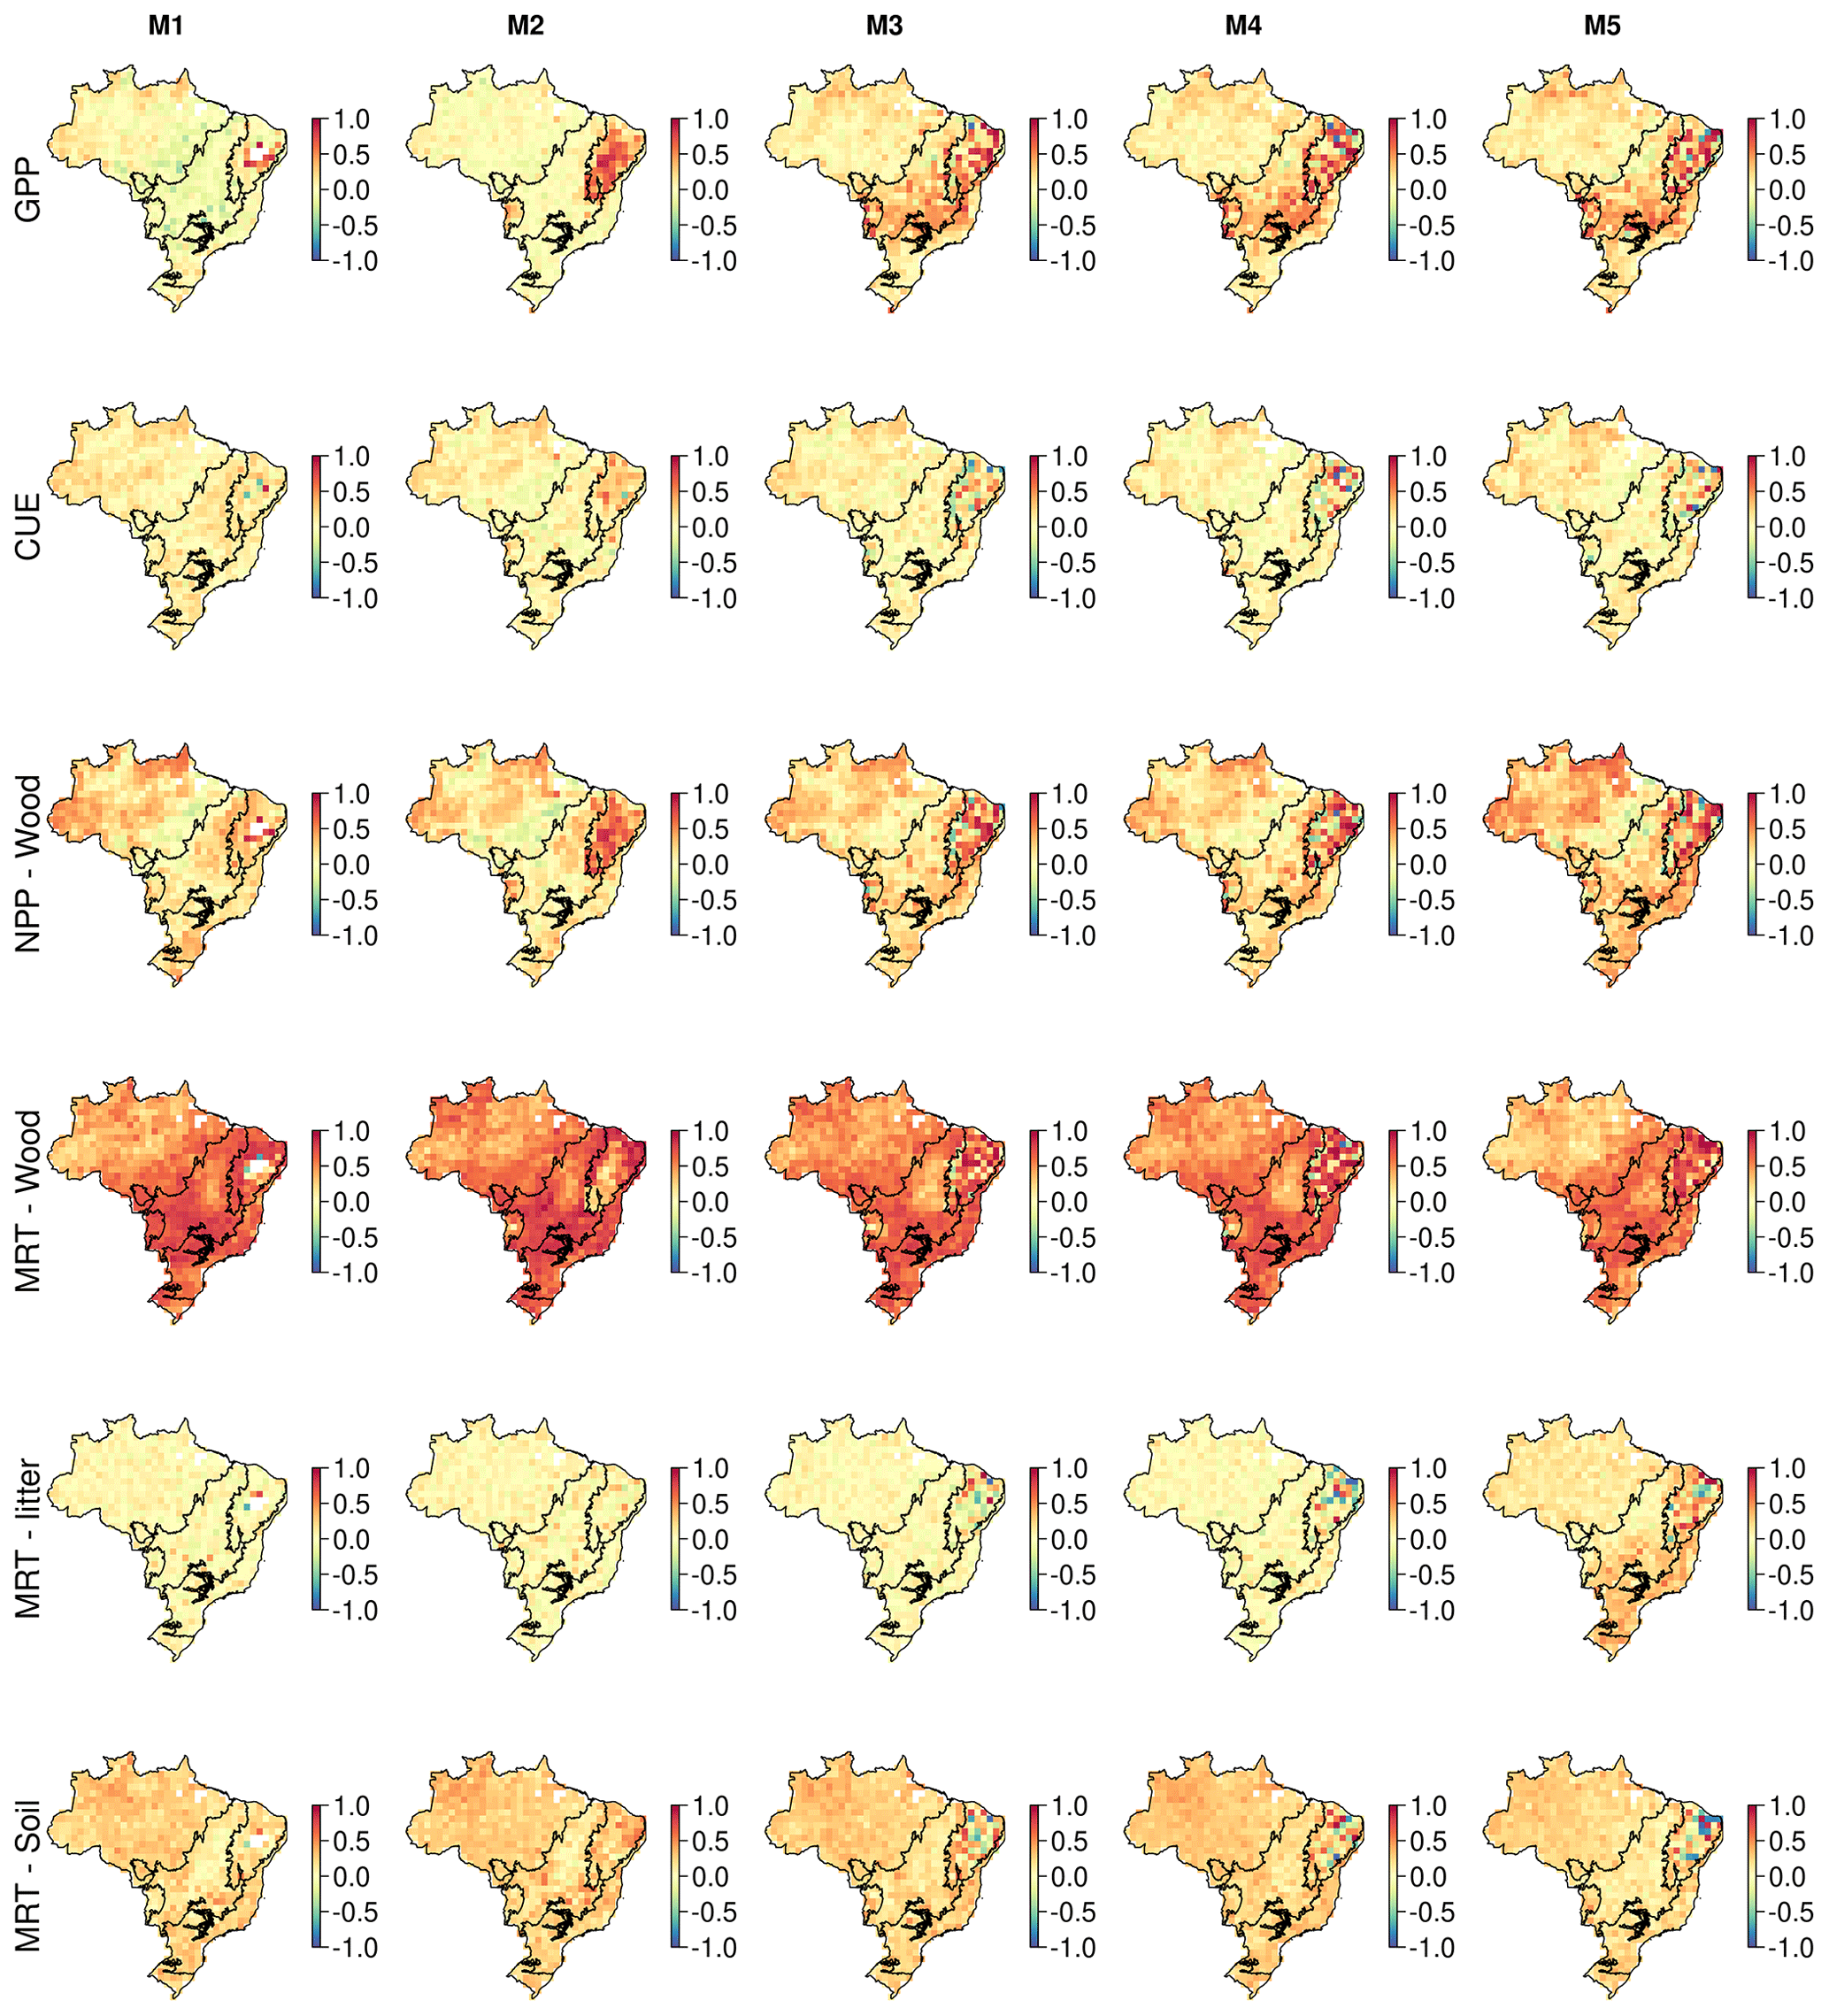
Figure A18Correlation maps between the simulated change in biomass stocks (SSP2-4.5; 2001–2100) and ecosystem variables. These maps identify spatial variation in the sensitivity of biomass change to key ecosystem variables. Correlates are pool-specific MRT (years), NPP (), CUE (1 − Ra : GPP) and GPP () estimated across the whole simulation period.
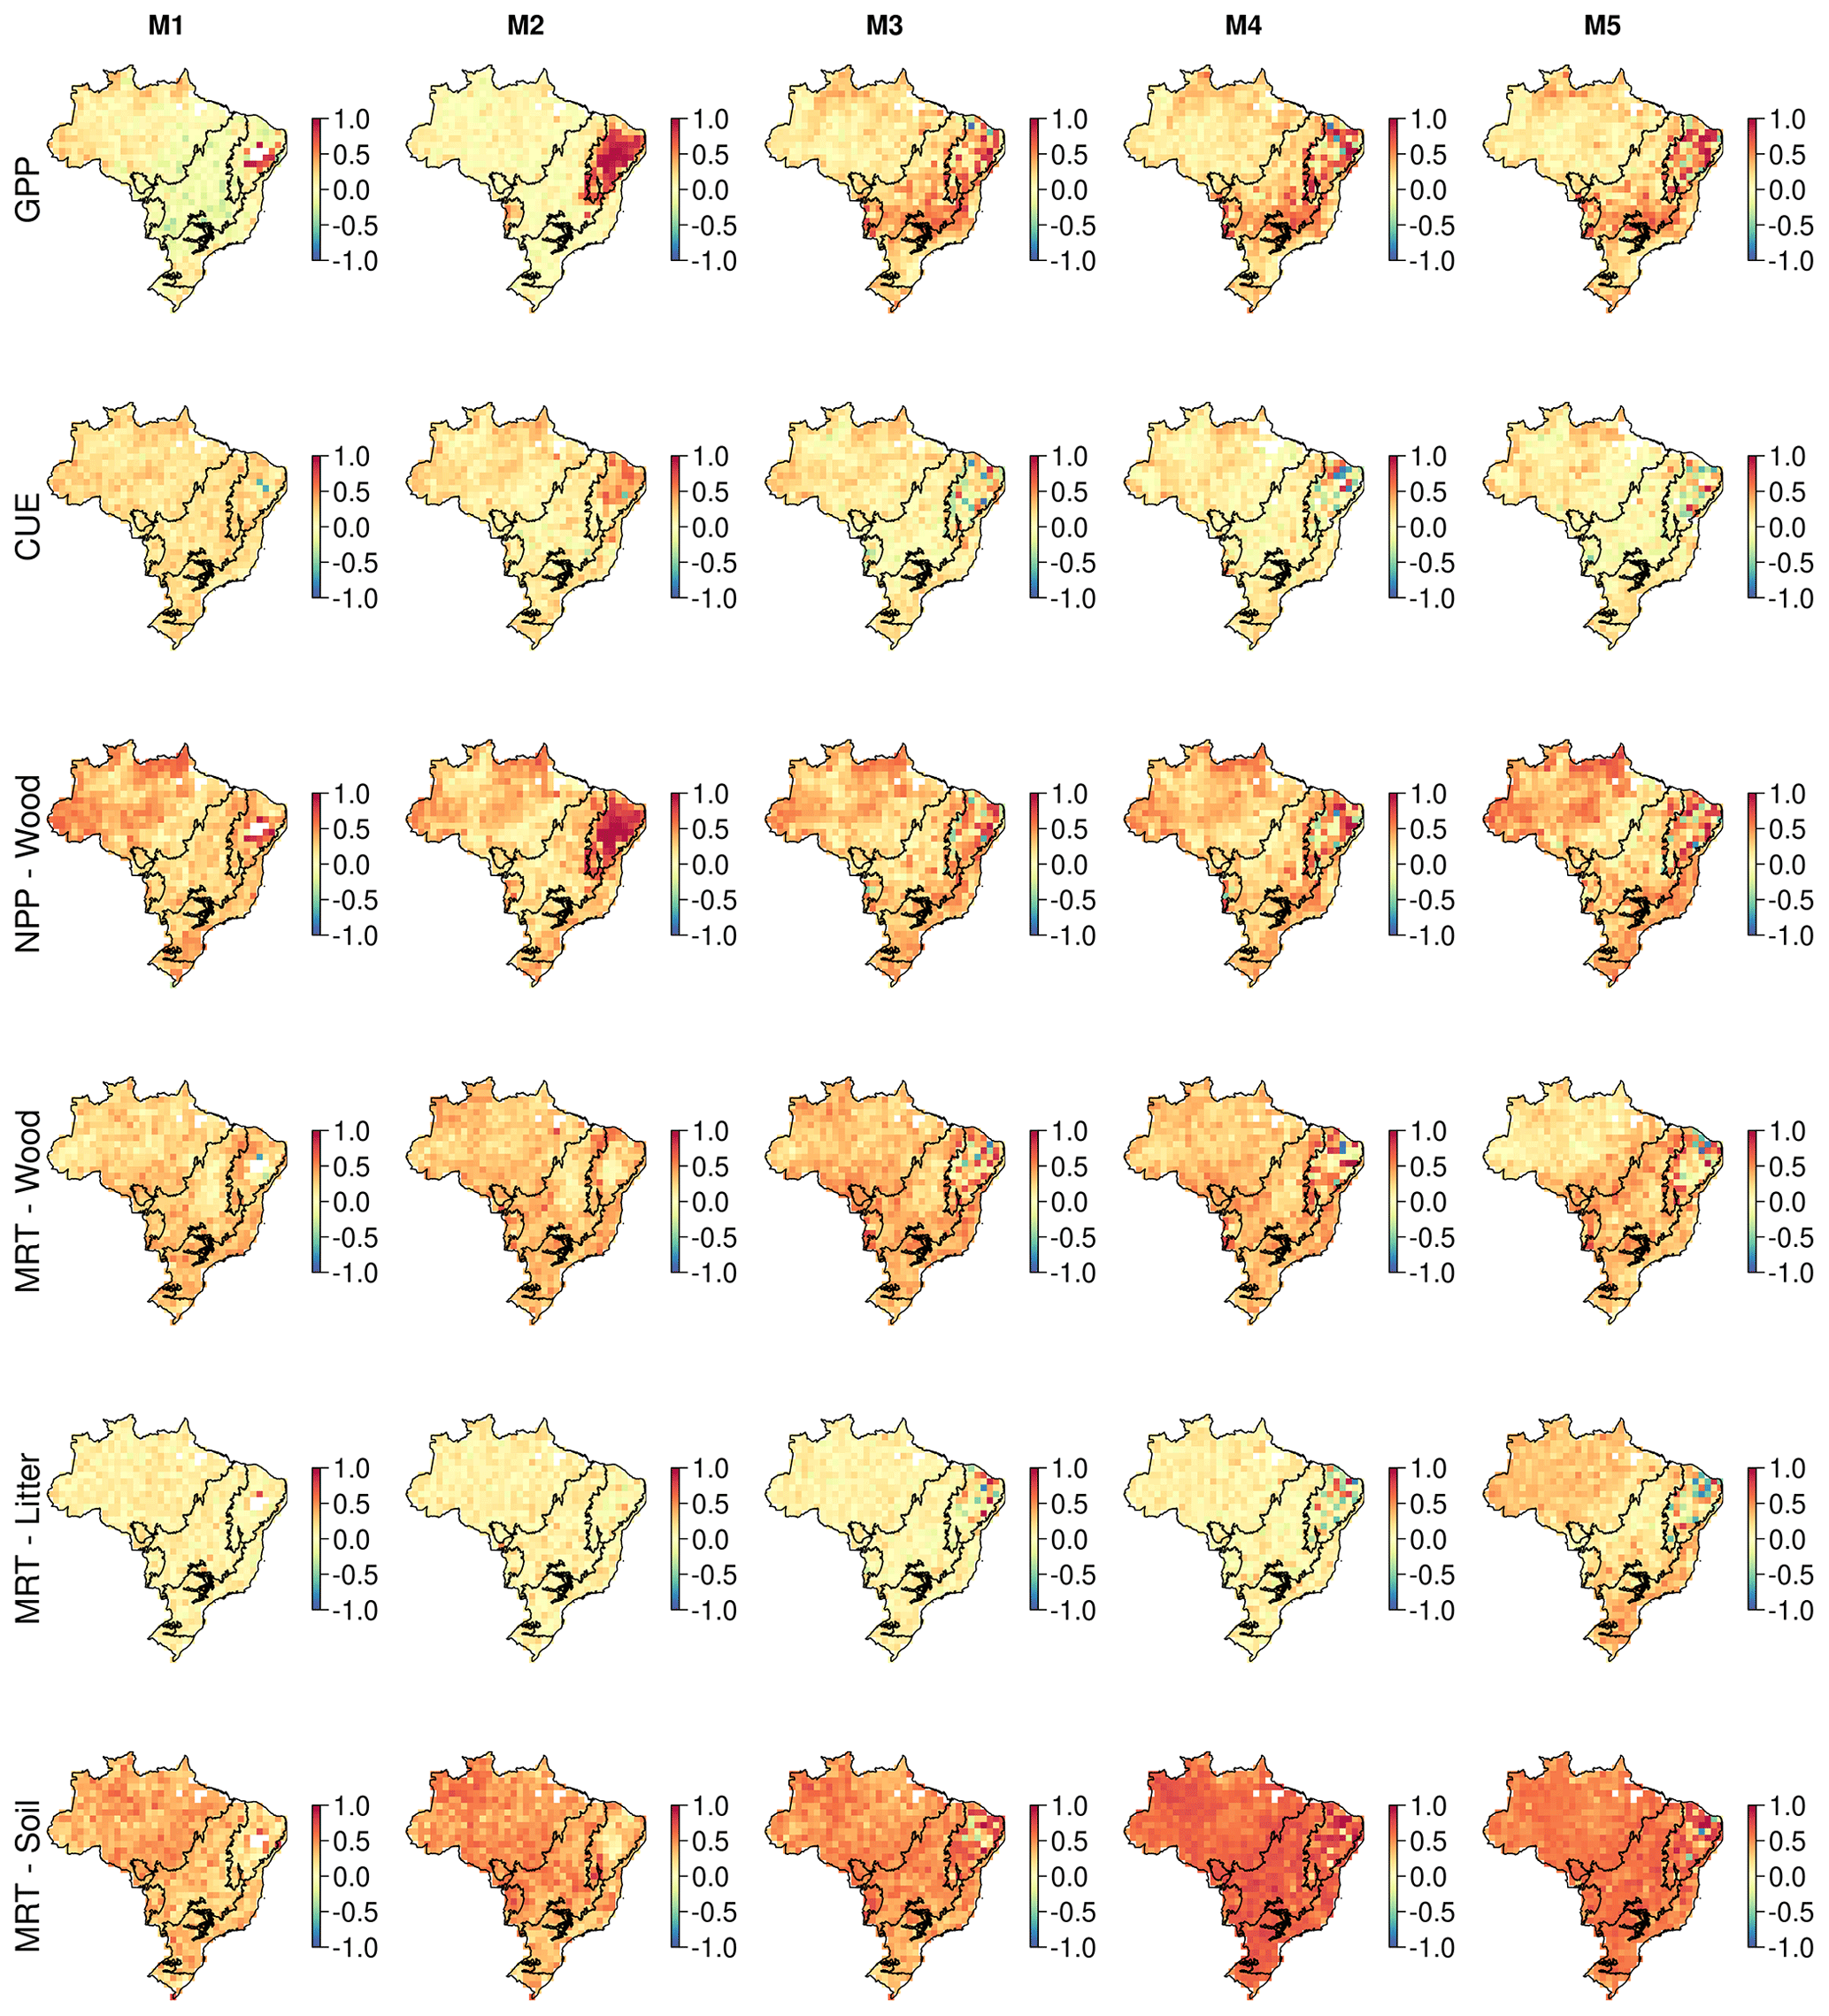
Figure A19Correlation maps between the simulated change in DOM stocks (SSP2-4.5; 2001–2100) and ecosystem variables. These maps identify spatial variation in the sensitivity of biomass change to key ecosystem variables. Correlates are pool-specific MRT (years), NPP (), CUE (1 − Ra : GPP) and GPP () estimated across the whole simulation period.
Table A1Description of parameters estimated for each DALEC model; each parameter is given a name, unit and description. As not all parameters are used by all models, the applicable models are also given following the code used in the main text. Note: gross primary productivity is indicated as GPP, autotrophic respiration is indicated as Ra, autotrophic maintenance respiration is indicated as Rm, and heterotrophic respiration is indicated as Rh. Litter is assumed to be the combined foliage and fine root litter pools, where appropriate wood litter will be explicitly stated. Note that GPP allocation fractions are applied sequentially such that GPP allocation to Cwood = GPP − (GPP ⋅ Ra : GPP) − (GPP ⋅ GPPlab) − (GPP ⋅ GPProot).
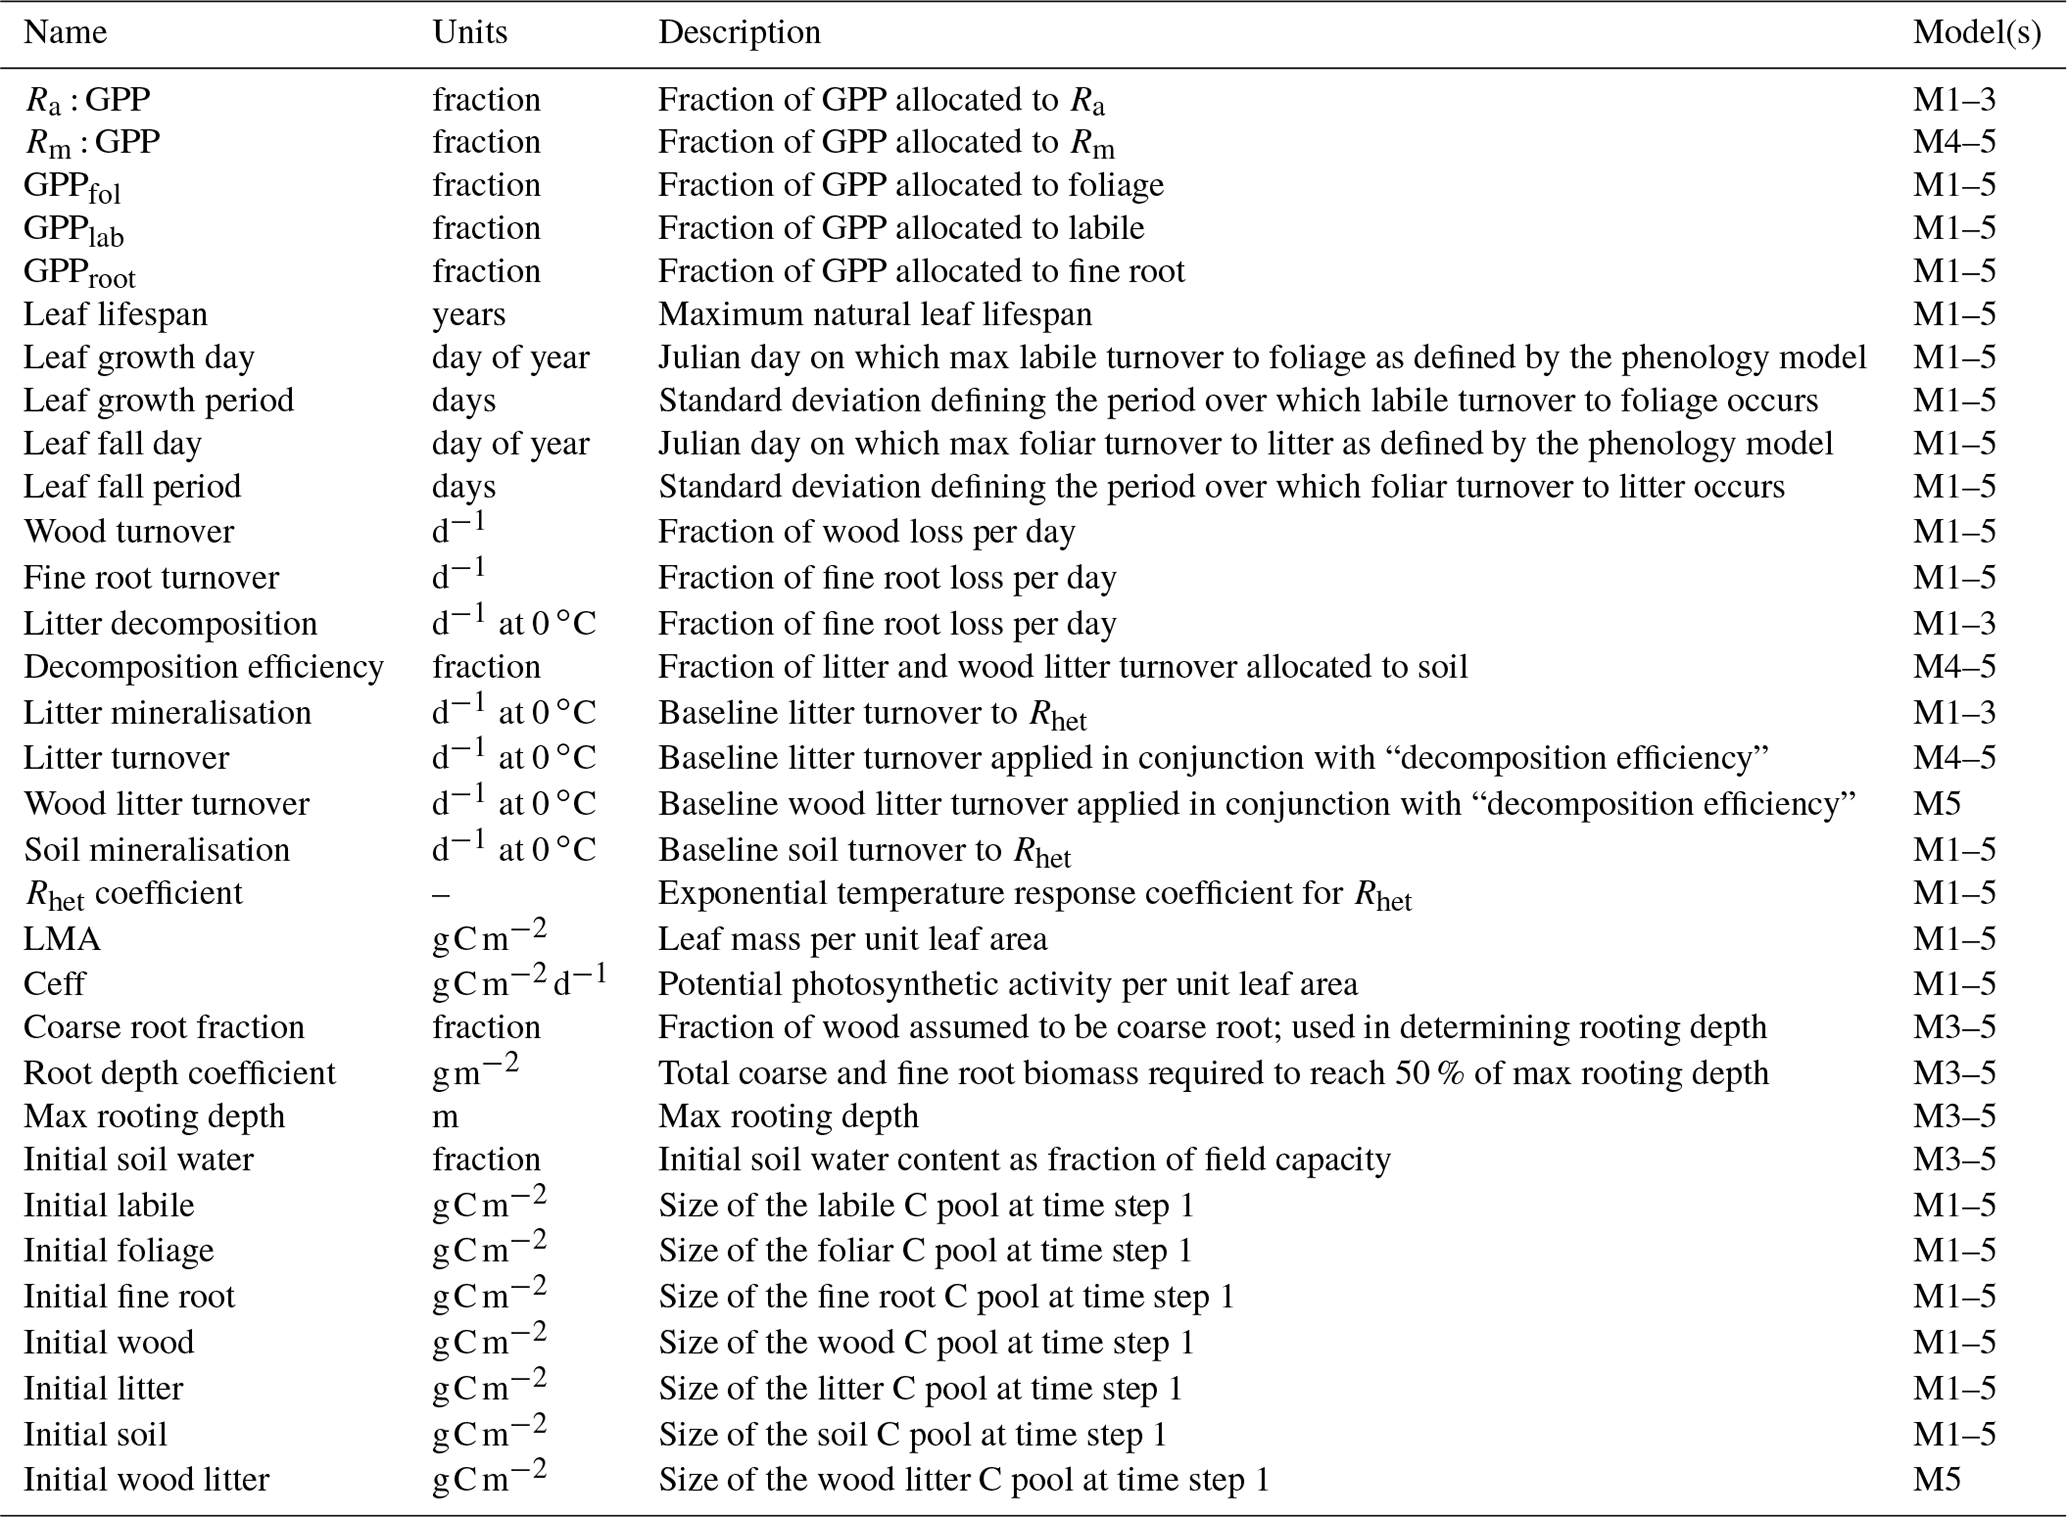
Table A2Summary information of posterior parameter constraint for each model. Presented is the Brazil-wide mean of 1 − posterior : prior, indicating the relative reduction in parameter uncertainty for each DALEC model. As not all parameters are used by all models, the row value will be left black where a parameter is not applicable. Each parameter is also allocated to one of the following broad parameter definitions: GPP allocation (P1), canopy phenology (P2), other plant turnover (P3), decomposition processes (P4) and initial conditions (P5), which are used to provide parameter group means in Table A3. Note: gross primary productivity is indicated as GPP, autotrophic respiration is indicated as Ra, autotrophic maintenance respiration is indicated as Rm, and heterotrophic respiration is indicated as Rh. Litter is assumed to be the combined foliage and fine root litter pools, where appropriate wood litter will be explicitly stated. Note that GPP allocation fractions are applied sequentially such that GPP allocation to Cwood = GPP − (GPP ⋅ Ra : GPP) − (GPP ⋅ GPPlab) − (GPP ⋅ GPProot).
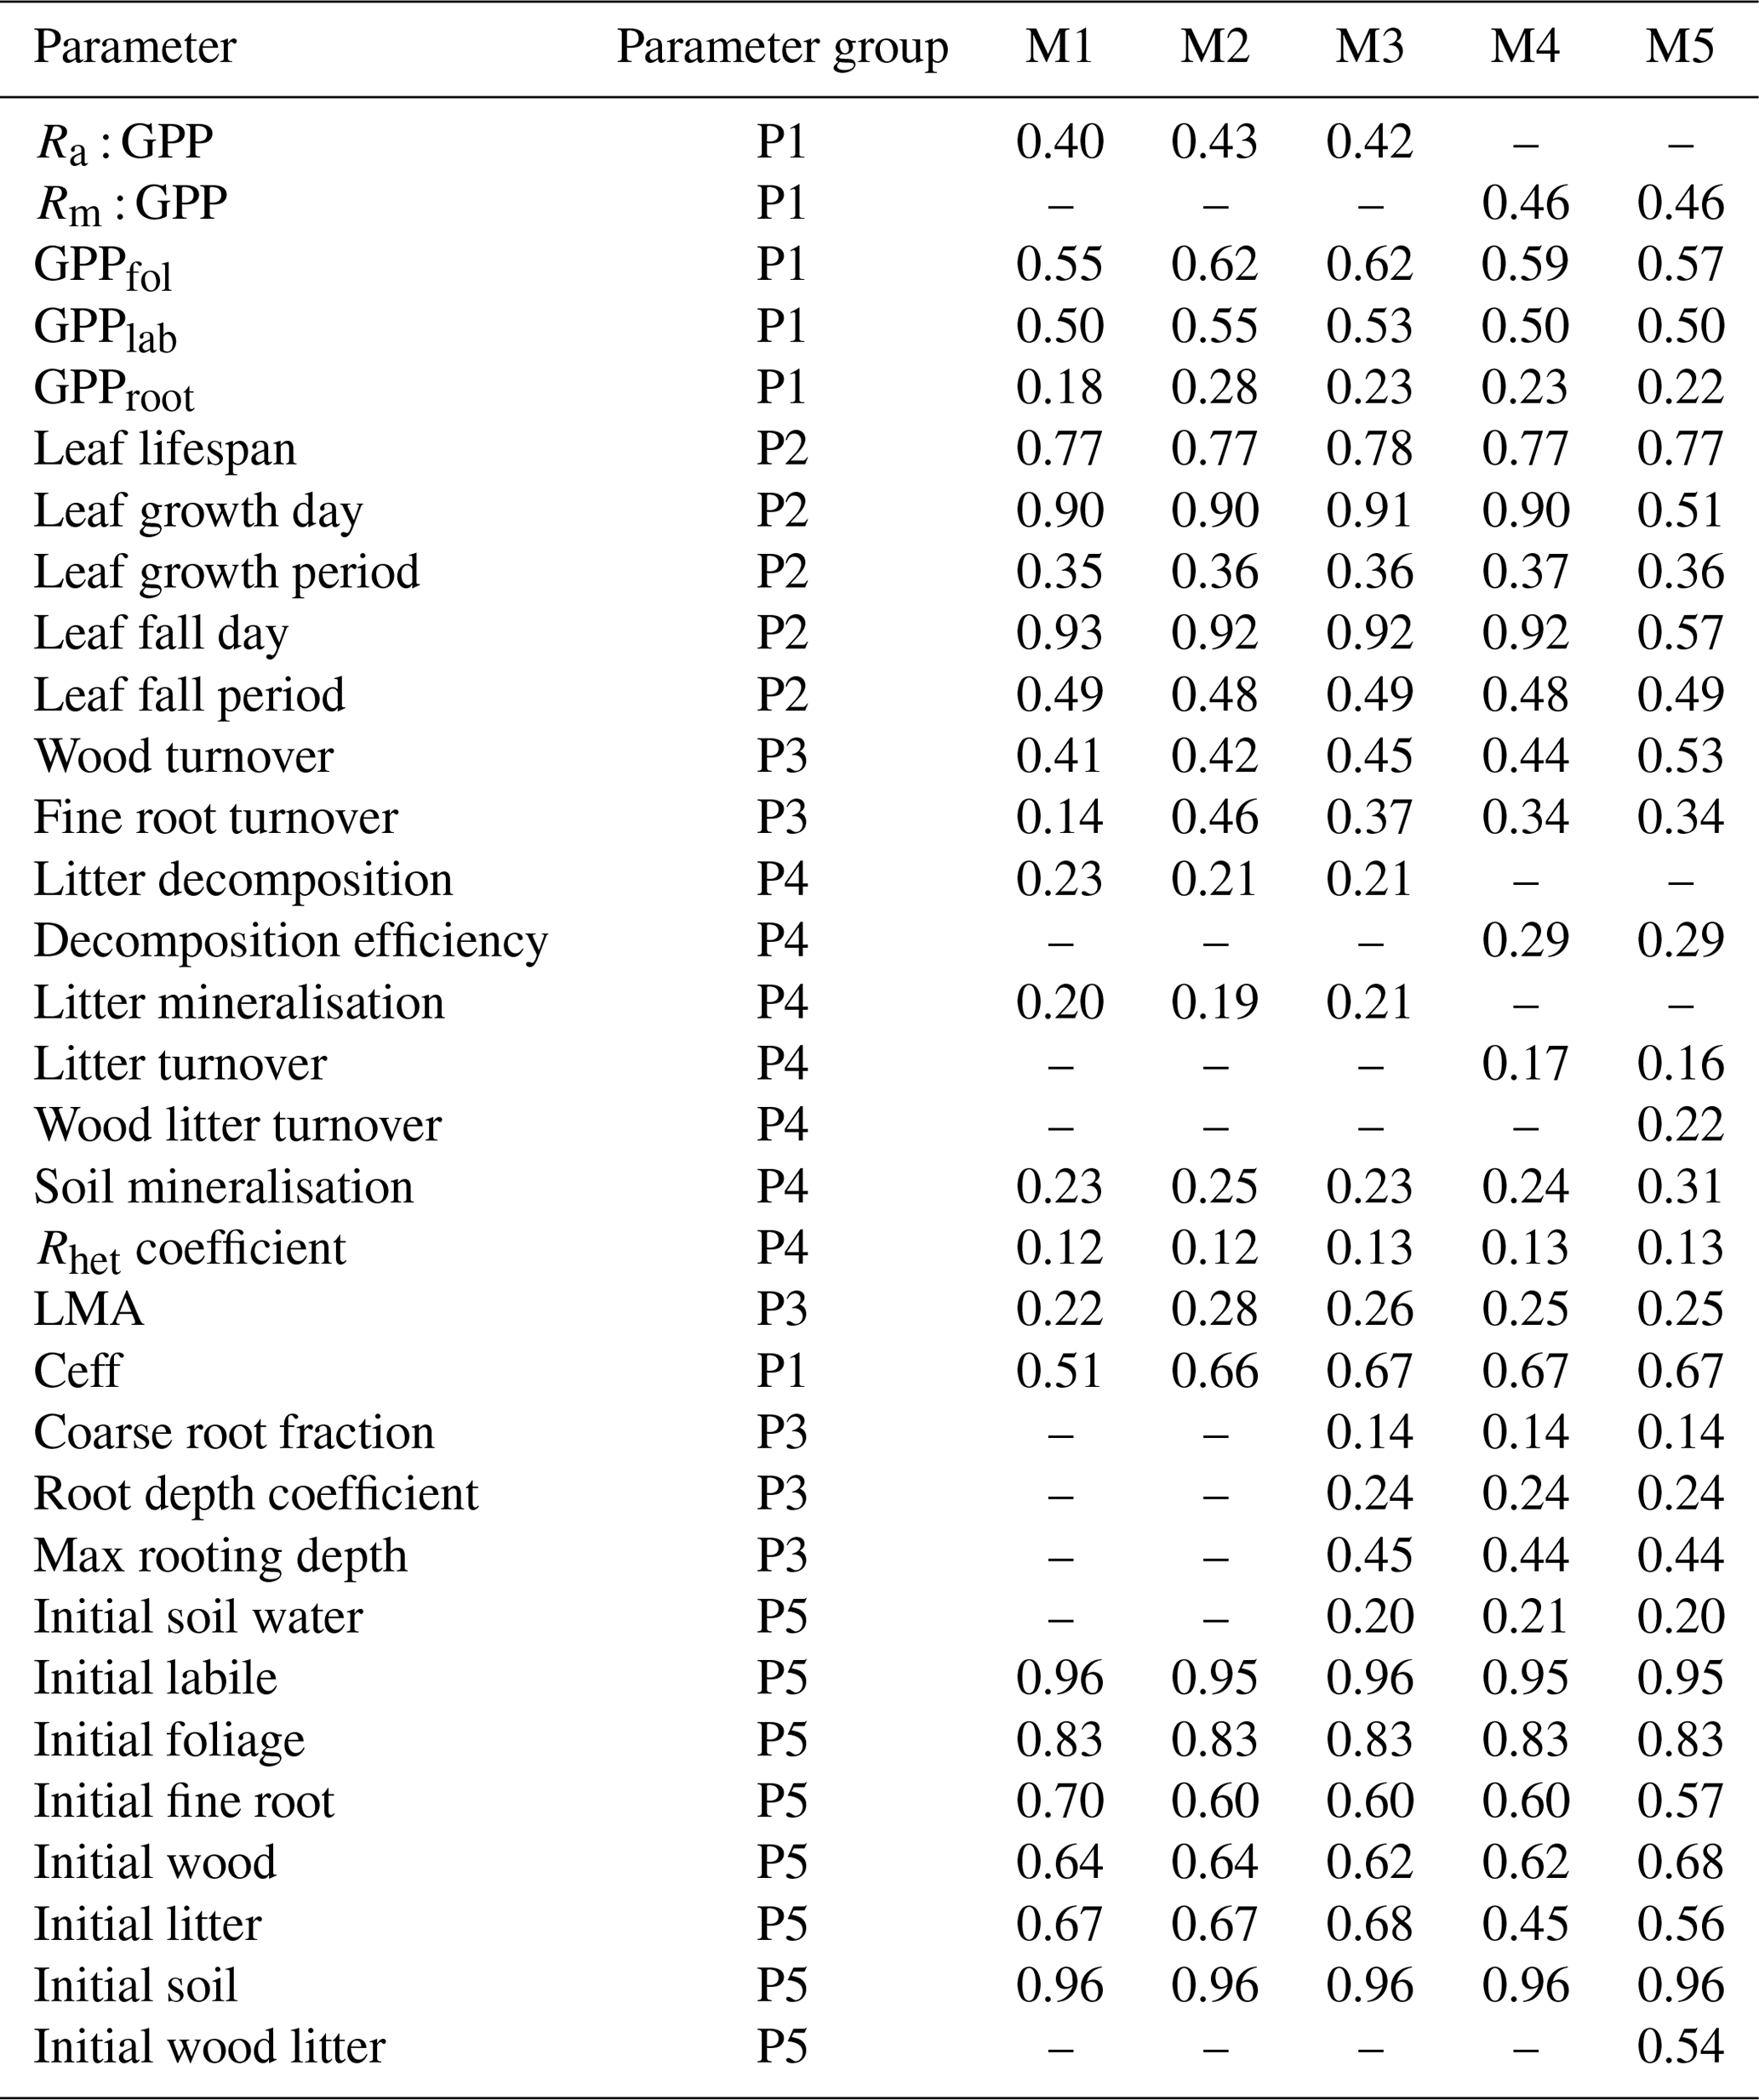
Table A3Aggregated of information presented in Table A2 of posterior parameter constraint for each model. Presented is the Brazil-wide mean of 1 − posterior : prior, indicating the relative reduction in parameter uncertainty for each DALEC model. Each parameter is allocated to one of the following broad parameter definitions: GPP allocation (P1), canopy phenology (P2), other plant turnover (P3), decomposition processes (P4) and initial conditions (P5); see Table A2 for groupings.
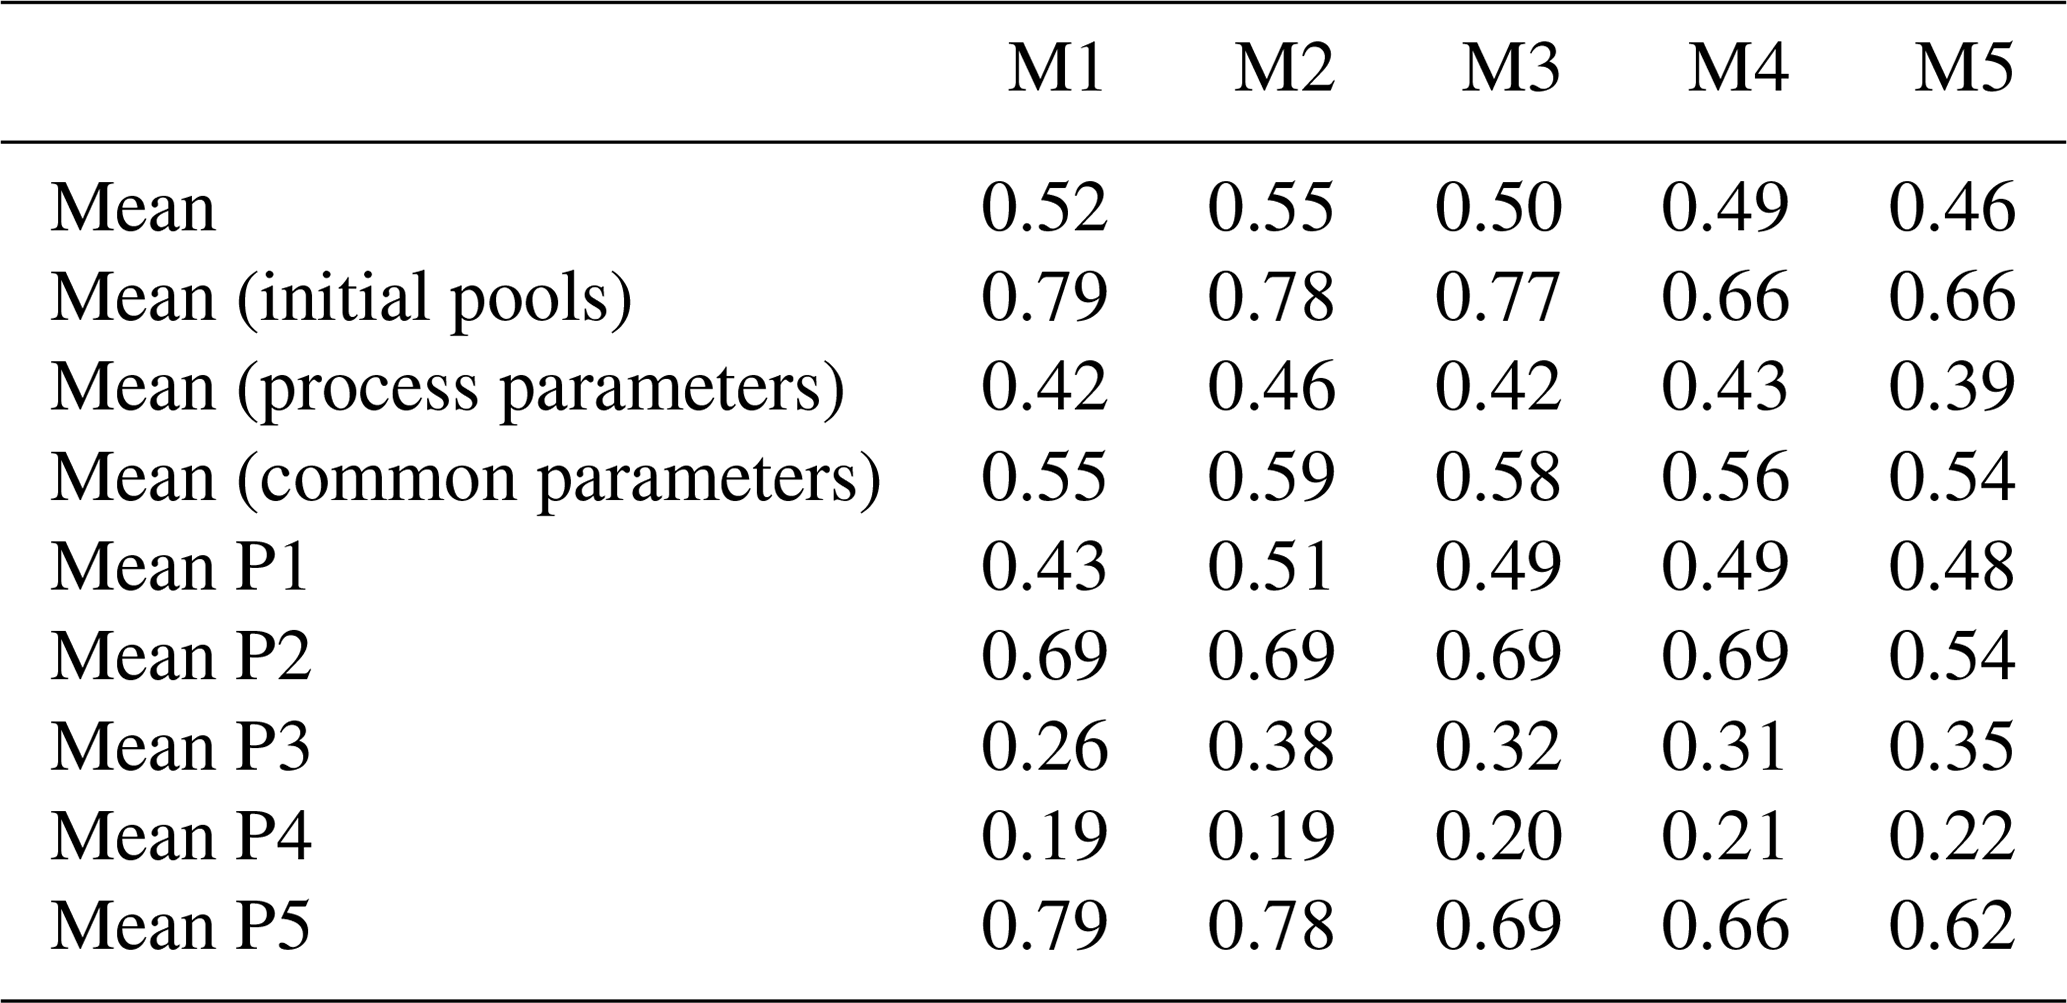
Table A4Climate-change-scenario-specific estimates of biomass change (2001–2100) by DALEC for each of the Brazil biomes (Fig. 1). Units are Pg C and values in parentheses are the 5 % and 95 % quantiles defining the 90 % confidence interval. For clarity, values are rounded to the nearest Pg C or two significant figures. SSP126 indicates SSP1-2.6 W m−2, SSP245 indicates SSP2-4.5 W m−2, SSP370 indicates SSP3-7.0 W m−2, and SSP585 indicates SSP5-8.5 W m−2.
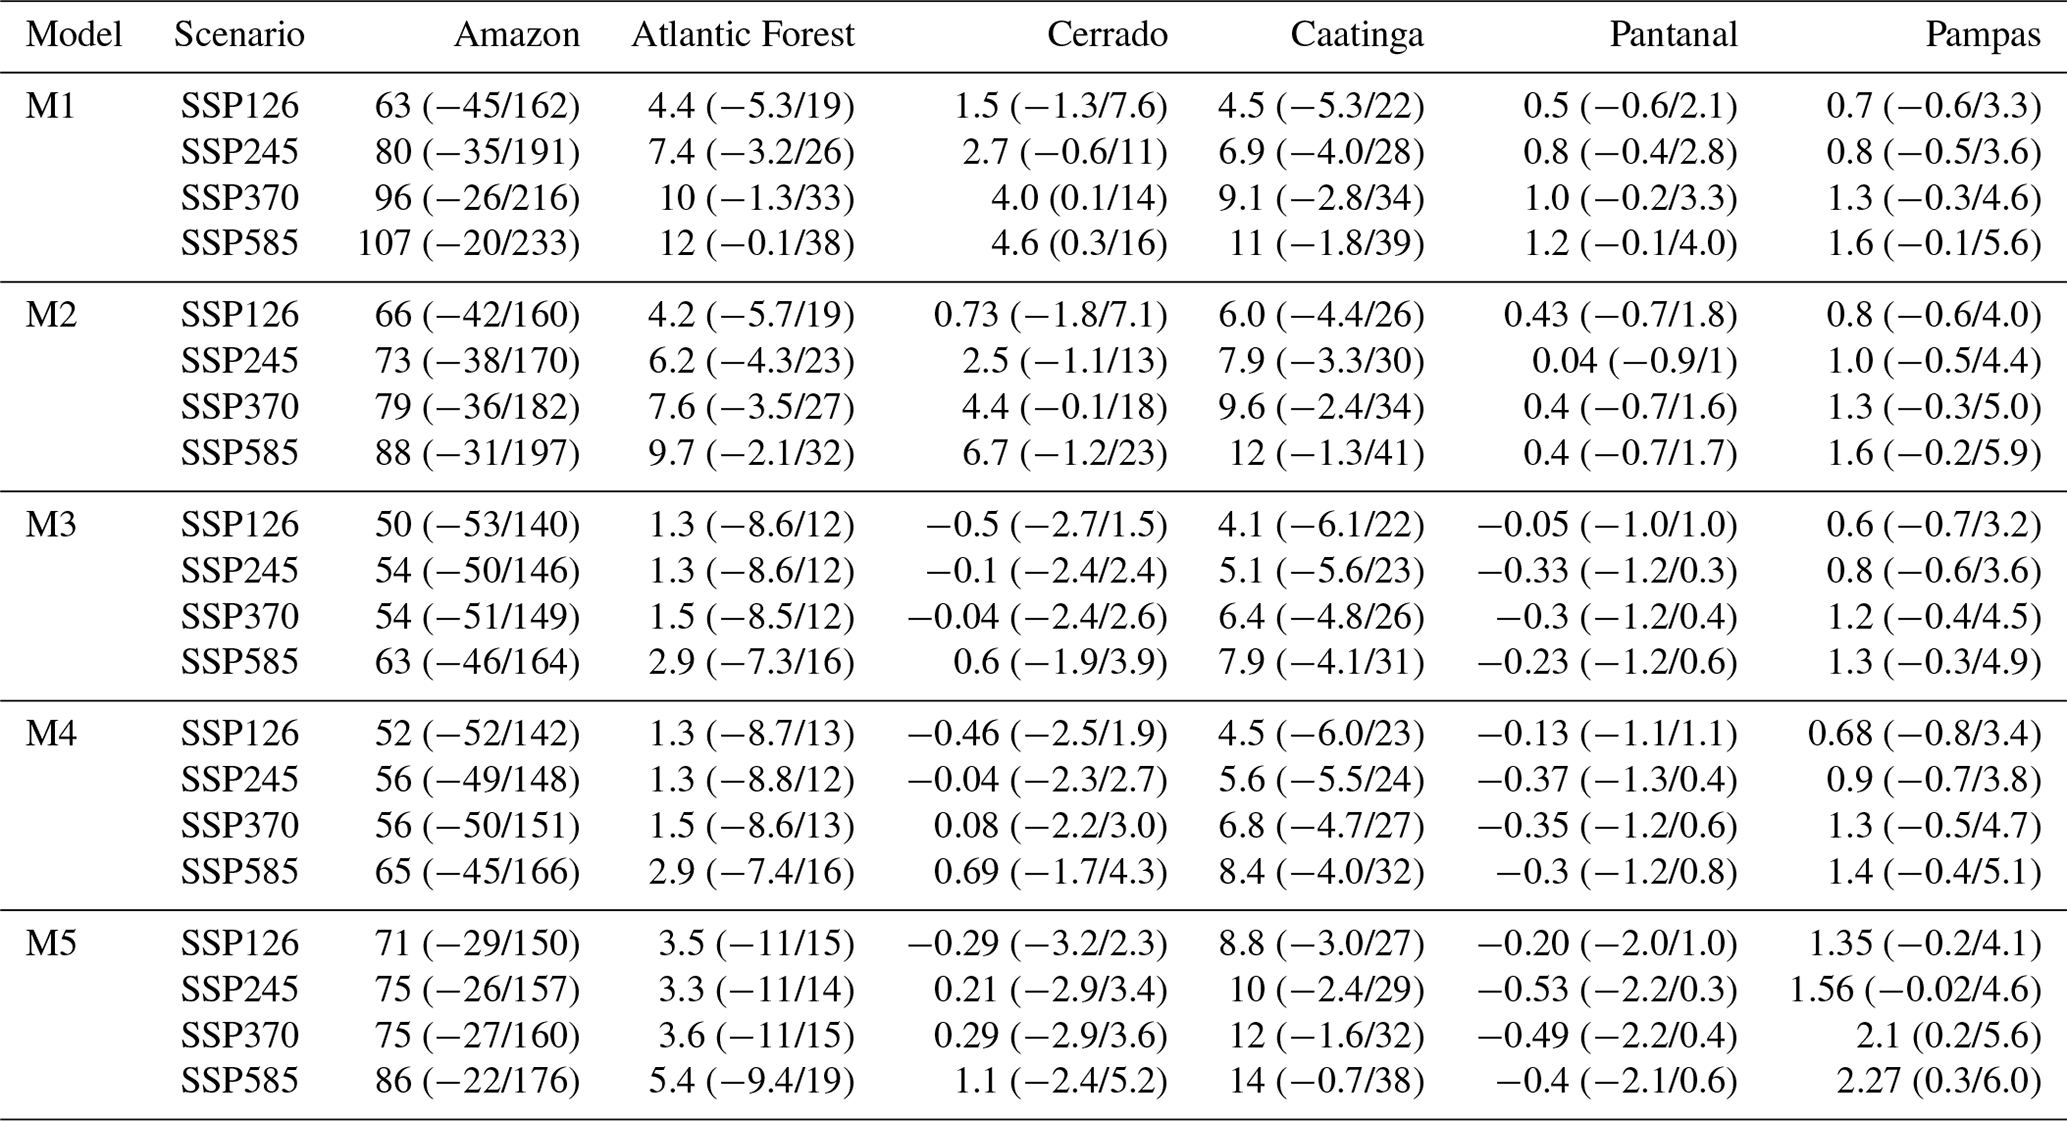
Table A5Climate-change-scenario-specific estimates of DOM change (2001–2100) by DALEC for each of the Brazil biomes (Fig. 1). Units are Pg C and values in parentheses are the 5 % and 95 % quantiles defining the 90 % confidence interval. For clarity, values are rounded to the nearest Pg C or two significant figures. SSP126 indicates SSP1-2.6 W m−2, SSP245 indicates SSP2-4.5 W m−2, SSP370 indicates SSP3-7.0 W m−2, and SSP585 indicates SSP5-8.5 W m−2.
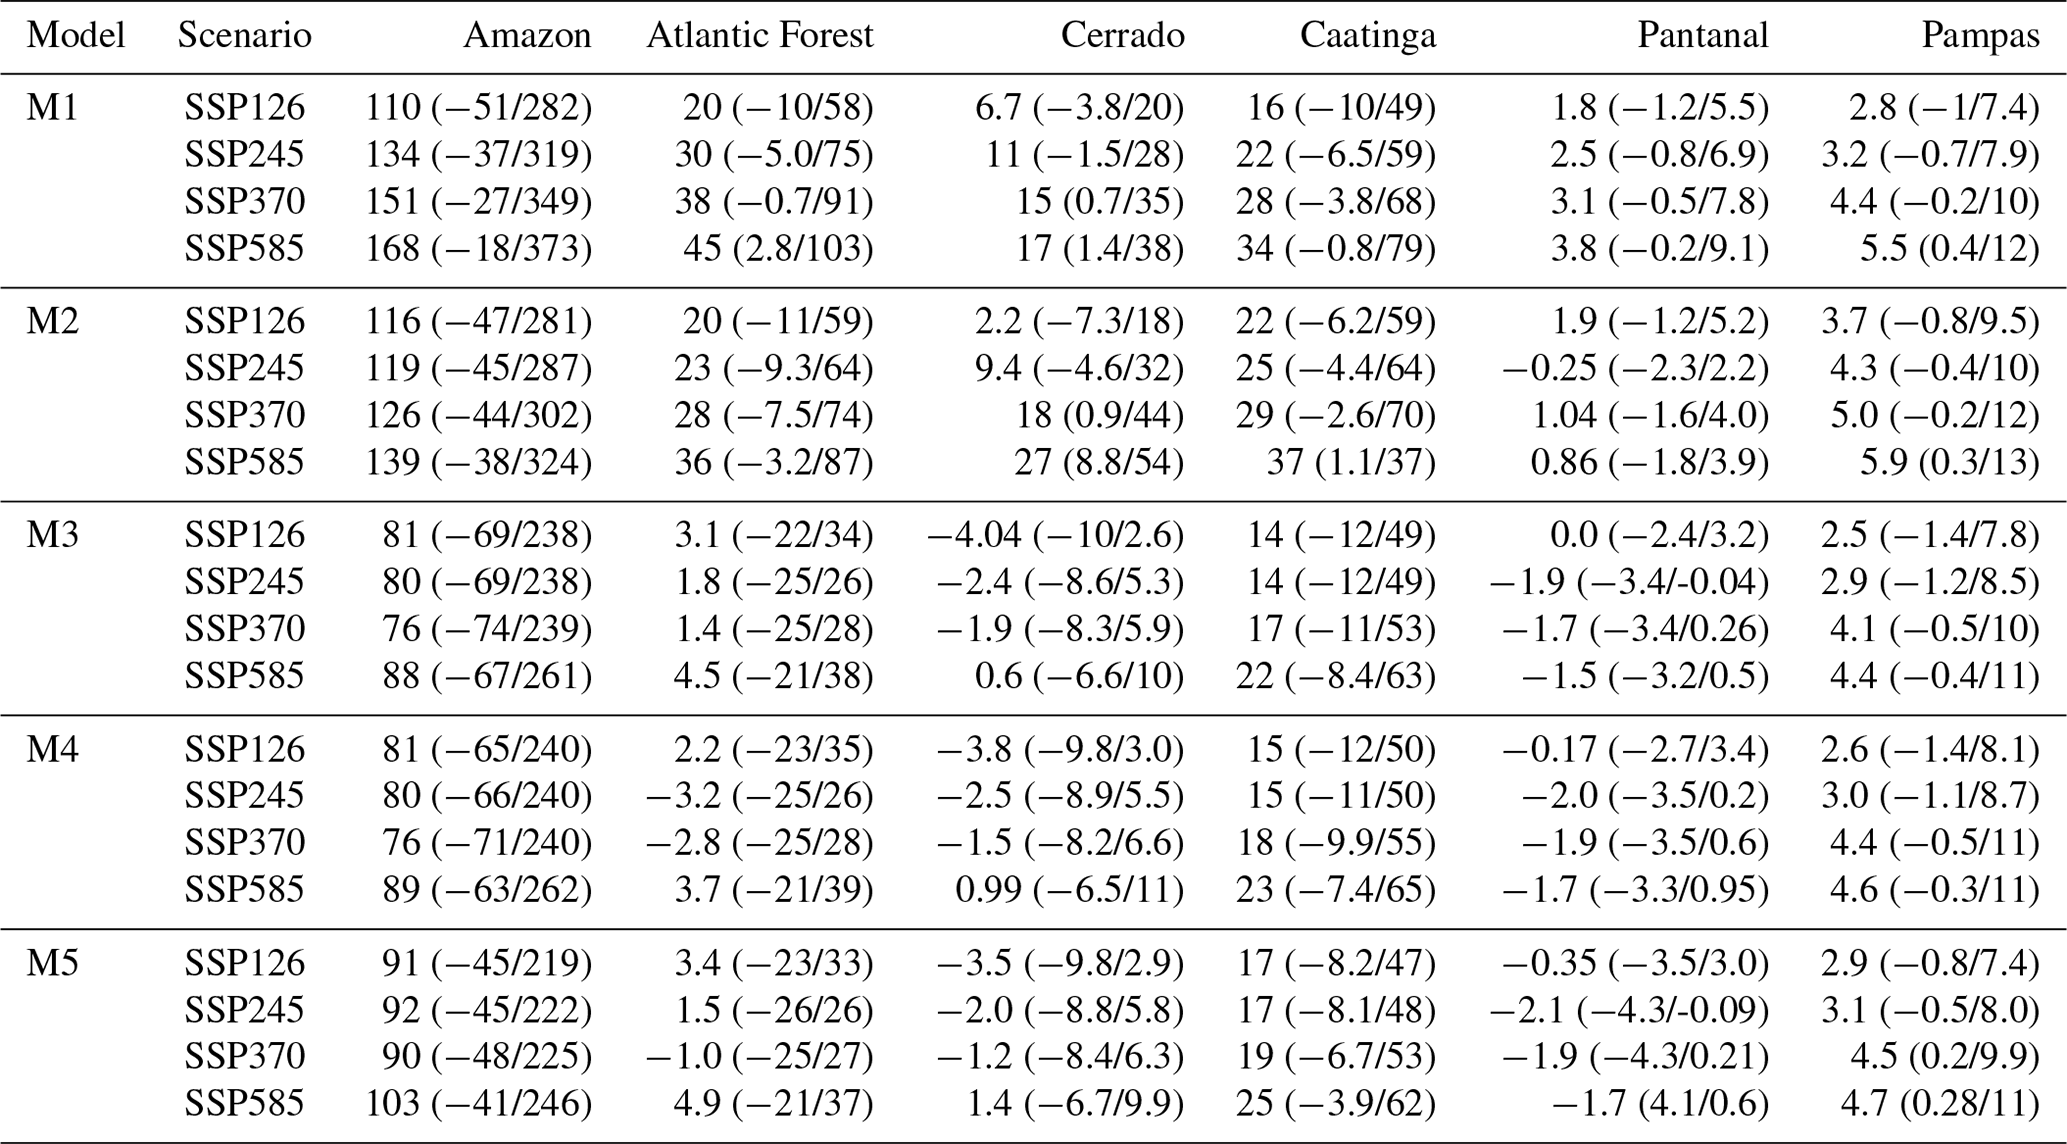
Table A6Climate-change-scenario-specific estimates of the likelihood of biomass and DOM increasing (2001–2100) per DALEC model. Likelihoods are presented as a percentage to the nearest percentile. SSP126 indicates SSP1-2.6 W m−2, SSP245 indicates SSP2-4.5 W m−2, SSP370 indicates SSP3-7.0 W m−2, and SSP585 indicates SSP5-8.5 W m−2.
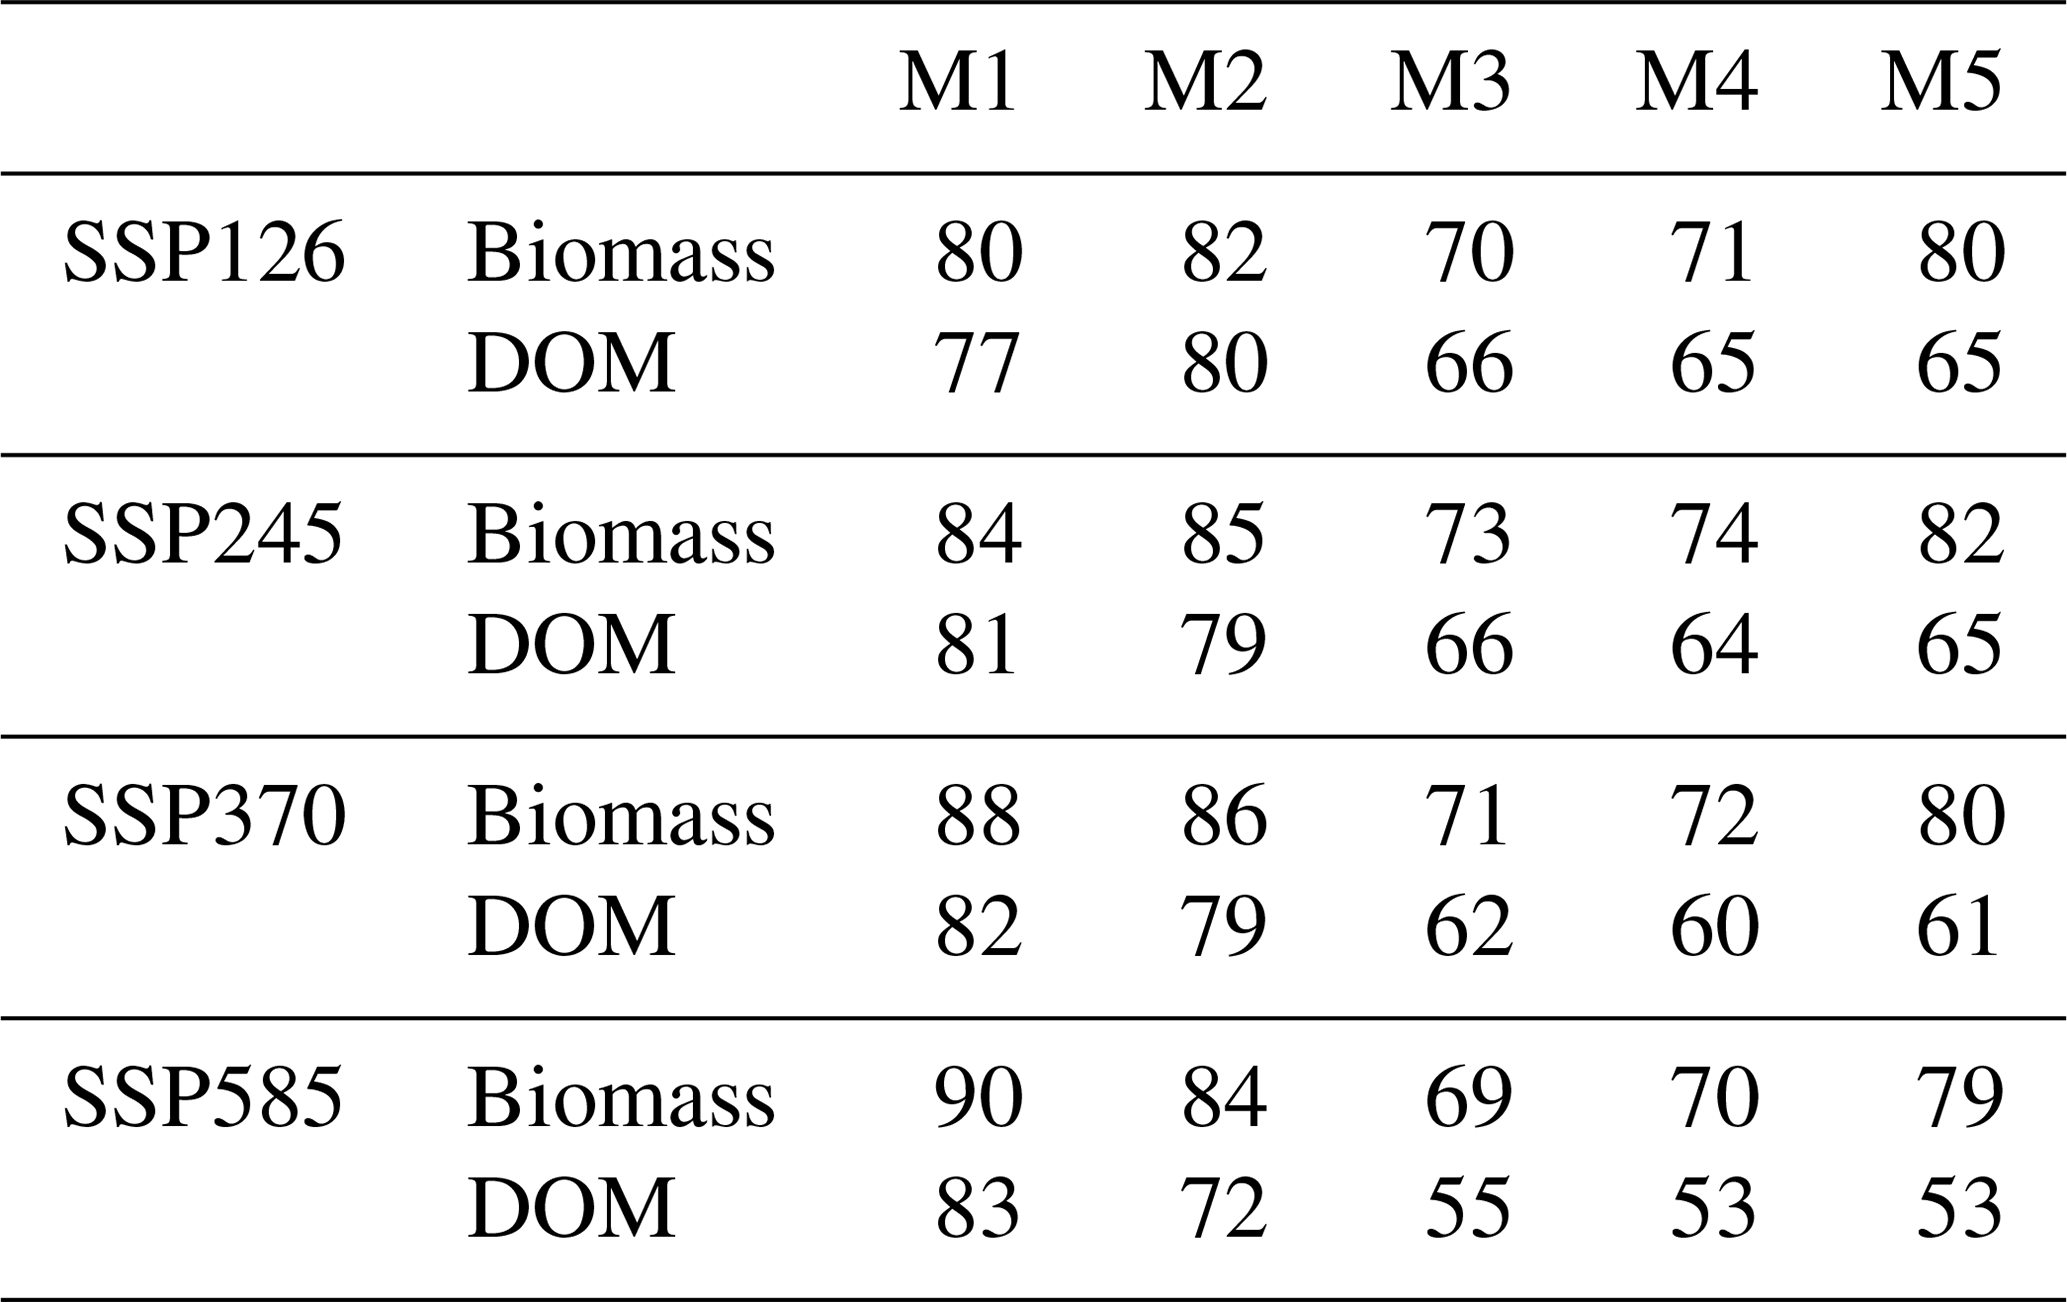
DALEC-estimated carbon losses due to forest biomass removals are estimated to vary between 120–400 Tg C yr−1, reducing the biospheric sink by 5 %–32 % (Fig. 5). The largest biomass extractions are estimated for 2016 (387–425 Tg C yr−1; between-model range) and 2017 (302–337 Tg C yr−1; between-model range). In all other years, the mean biomass loss was substantially lower at 102–220 Tg C yr−1. The interannual variation follows the GFW estimate as the fraction forest cover loss is derived by GFW. GFW-estimated forest losses are larger than those by the DALEC models at the beginning of the analysis but converge by 2017 potentially driven by the accumulation of wood in the DALEC models. As GFW is used as a forest loss driver by the DALEC suite, this comparison is not fully independent. However, disagreement between these estimates highlights the importance of the biomass map underpinning the analyses (see discussion for further details).
The model outputs parameters and carbon cycle outputs are freely available to download from https://doi.org/10.7488/ds/3000 (Smallman and Williams, 2021). CARDAMOM and DALEC source codes are available to download from a GitHub repository, with registration provided upon request to either Thomas Luke Smallman or Mathew Williams.
TLS, DTM and MW created the experimental design. TLS ran CARDAMOM and analyses the outputs. GK created the ensembles of CarbonTracker atmospheric inversions. TLS led the writing with inputs from DTM and MW. All authors contributed to the writing of the paper.
The authors declare that they have no conflict of interest.
Publisher's note: Copernicus Publications remains neutral with regard to jurisdictional claims in published maps and institutional affiliations.
Thomas Luke Smallman, David Thomas Milodowski, Eráclito Sousa Neto and Mathew Williams were funded primarily by the UK Space Agency through the Forests2020 project (https://ecometrica.com/space/forests2020, last access: 23 October 2020). Thomas Luke Smallman and Mathew Williams were additionally supported by the UK's National Centre for Earth Observation; Mathew Williams and David Thomas Milodowski was additionally supported by the Newton Fund through the Met Office Climate Science for Service Partnership Brazil (CSSP Brazil). Mathew Williams also received funding from the Royal Society. This work has made use of the resources provided by the Edinburgh Compute and Data Facility (ECDF) (http://www.ecdf.ed.ac.uk/, last access: 15 November 2021). LAI information was generated by the Global Land Service of Copernicus, the Earth Observation programme of the European Commission. The LAI product is based on SPOT-VEGETATION 1 km data (copyright CNES and distribution by VITO). Gerbrand Koren was funded by the ERC ASICA project (649087) and the inversions were carried out using a grant for computing time from NWO (SH-312-14). CarbonTracker Europe results provided by Wageningen University in collaboration with the ObsPack partners (http://www.carbontracker.eu, last access: 10 June 2021). The authors thank Wouter Peters for useful discussions on the use of atmospheric inversion analyses as an evaluation dataset. The University of Edinburgh CARDAMOM framework is available on GitHub (https://github.com/GCEL/CARDAMOM, last access: 15 November 2021), with permissions provided upon request to the corresponding author. The Jet Propulsion Laboratory CARDAMOM framework is also available on GitHub (https://github.com/CARDAMOM-framework/CARDAMOM_2.1.6c, 5 October 2021 – contact abloom@jpl.nasa.gov for access).
This research has been supported by the UK Space Agency (grant no. Forests2020), the National Centre for Earth Observation (National Capability Funding), the Newton Fund (UK Meteorological Office Climate Science for Service Partnership Brazil) and the European Research Council, H2020 European Research Council (grant no. ASICA (649087)).
This paper was edited by Kirsten Thonicke and reviewed by Thomas Wutzler and one anonymous referee.
Ainsworth, E. A. and Rogers, A.: The response of photosynthesis and stomatal conductance to rising [CO2]: mechanisms and environmental interactions, Plant Cell Environ., 30, 25–270, https://doi.org/10.1111/j.1365-3040.2007.01641.x, 2007. a
Arora, V. K., Katavouta, A., Williams, R. G., Jones, C. D., Brovkin, V., Friedlingstein, P., Schwinger, J., Bopp, L., Boucher, O., Cadule, P., Chamberlain, M. A., Christian, J. R., Delire, C., Fisher, R. A., Hajima, T., Ilyina, T., Joetzjer, E., Kawamiya, M., Koven, C. D., Krasting, J. P., Law, R. M., Lawrence, D. M., Lenton, A., Lindsay, K., Pongratz, J., Raddatz, T., Séférian, R., Tachiiri, K., Tjiputra, J. F., Wiltshire, A., Wu, T., and Ziehn, T.: Carbon–concentration and carbon–climate feedbacks in CMIP6 models and their comparison to CMIP5 models, Biogeosciences, 17, 4173–4222, https://doi.org/10.5194/bg-17-4173-2020, 2020. a, b, c, d
Avitabile, V., Herold, M., Heuvelink, G. B. M., Lewis, S. L., Phillips, O. L., Asner, G. P., Armston, J., Ashton, P. S., Banin, L., Bayol, N., Berry, N. J., Boeckx, P., de Jong, B. H. J., DeVries, B., Girardin, C. A. J., Kearsley, E., Lindsell, J. A., Lopez-Gonzalez, G., Lucas, R., Malhi, Y., Morel, A., Mitchard, E. T. A., Nagy, L., Qie, L., Quinones, M. J., Ryan, C. M., Ferry, S. J. W., Sunderland, T., Laurin, G. V., Gatti, R. C., Valentini, R., Verbeeck, H., Wijaya, A., and Willcock, S.: An integrated pan-tropical biomass map using multiple reference datasets, Glob. Change Biol., 22, 1406–1420, https://doi.org/10.1111/gcb.13139, 2016. a, b, c
Baccini, A., Goetz, S. J., Walker, W. S., Laporte, N. T., Sun, M., Sulla-Menashe, D., Hackler, J., Beck, P. S. A., Dubayah, R., Friedl, M. A., Samanta, S., and Houghton, R. A.: Estimated carbon dioxide emissions from tropical deforestation improved by carbon-density maps, Nat. Clim. Change, 2, 182–185, https://doi.org/10.1038/nclimate1354, 2012. a
Baccini, A., Walker, W., Carvalho, L., Farina, M., Sulla-Menashe, D., and Houghton, R. A.: Tropical forests are a net carbon source based on aboveground measurements of gain and loss, Science, 358, 230–234, 2017.
Bloom, A. A. and Williams, M.: Constraining ecosystem carbon dynamics in a data-limited world: integrating ecological “common sense” in a model–data fusion framework, Biogeosciences, 12, 1299–1315, https://doi.org/10.5194/bg-12-1299-2015, 2015. a, b, c
Bloom, A. A., Exbrayat, J.-F. , van der Velde, I. R., Feng, L., and Williams, M.: The decadal state of the terrestrial carbon cycle: Global retrievals of terrestrial carbon allocation, pools, and residence times, P. Natl. Acad. Sci. USA, 113, 1285–1290, https://doi.org/10.1073/pnas.1515160113, 2016. a, b, c
Bodesheim, P., Jung, M., Gans, F., Mahecha, M. D., and Reichstein, M.: Upscaled diurnal cycles of land–atmosphere fluxes: a new global half-hourly data product, Earth Syst. Sci. Data, 10, 1327–1365, https://doi.org/10.5194/essd-10-1327-2018, 2018. a
Bonan, G. B., and Doney, S, C.: Climate, ecosystems, and planetary futures: The challenge to predict life in Earth system models, Science, 359, 6375, https://doi.org/10.1126/science.aam8328, 2018. a
Bonan, G. B., Lombardozzi, D. L., Wieder, W. R., Oleson, K. W., Lawrence, D. M., Hoffman, F. M., and Collier, N.: Model structure and climate data uncertainty in historical simulations of the terrestrial carbon cycle (1850–2014), Global Biogeochem. Cy., 33, 1310–1326. https://doi.org/10.1029/2019GB006175, 2019. a, b, c
Brienen, R. J. W., Phillips, O. L., Feldpausch, T. R., Gloor, E., Baker, T. R., Lloyd, J., Lopez-Gonzalez, G., Monteagudo-Mendoza, A., Malhi, Y., Lewis, S. L., Vásquez Martinez, R., Alexiades, M., Álvarez Dávila, E., Alvarez-Loayza, P., Andrade, A., Aragão, L. E. O. C., Araujo-Murakami, A., Arets, E. J. M. M., Arroyo, L., Aymard C., G. A., Bánki, O. S., Baraloto, C., Barroso, J., Bonal, D., Boot, R. G. A., Camargo, J. L. C., Castilho, C. V., Chama, V., Chao, K. J., Chave, J., Comiskey, J. A., Cornejo Valverde, F., da Costa, L., de Oliveira, E. A., Di Fiore, A., Erwin, T. L., Fauset, S., Forsthofer, M., Galbraith, D. R., Grahame, E. S., Groot, N., Hérault, B., Higuchi, N., Honorio Coronado, E. N., Keeling, H., Killeen, T. J., Laurance, W. F., Laurance, S., Licona, J., Magnussen, W. E., Marimon, B. S., Marimon-Junior, B. H., Mendoza, C., Neill, D. A., Nogueira, E. M., Núñez, P., Pallqui Camacho, N. C., Parada, A., Pardo-Molina, G., Peacock, J., Peña-Claros, M., Pickavance, G. C., Pitman, N. C. A., Poorter, L., Prieto, A., Quesada, C. A., Ramírez, F., Ramírez-Angulo, H., Restrepo, Z., Roopsind, A., Rudas, A., Salomão, R. P., Schwarz, M., Silva, N., Silva-Espejo, J. E., Silveira, M., Stropp, J., Talbot, J., ter Steege, H., Teran-Aguilar, J., Terborgh, J., Thomas-Caesar, R., Toledo, M., Torello-Raventos, M., Umetsu, R. K., van der Heijden, G. M. F., van der Hout, P., Guimarães Vieira, I. C., Vieira, S. A., Vilanova, E., Vos, V. A., and Zagt, R. J.: Long-term decline of the Amazon carbon sink, Nature, 519, 344–348, https://doi.org/10.1038/nature14283, 2015.
Brovkin, V., van Bodegom, P. M., Kleinen, T., Wirth, C., Cornwell, W. K., Cornelissen, J. H. C., and Kattge, J.: Plant-driven variation in decomposition rates improves projections of global litter stock distribution, Biogeosciences, 9, 565–576, https://doi.org/10.5194/bg-9-565-2012, 2012. a
Butler, E. E., Datta, A., Flores-Moreno, H., Chen, M., Wythers, K. R., Fazayeli, F., Banerjee, A., Atkin, O. K., Kattge, J., Amiaud, B., Blonder, B., Boenisch, G., Bond-Lamberty, B., Brown, K. A., Byun, C., Campetella, G., Cerabolini, B. E. L., Cornelissen, J. H. C., Craine, J. M., Craven, D., de Vries, F. T., Díaz, S., Domingues, T. F., Forey, E., González-Melo, A., Gross, N., Han, W., Hattingh, W. N., Hickler, T., Jansen, S., Kramer, K., Kraft, N. J. B., Kurokawa, H., Laughlin, D. C., Meir, P., Minden, V., Niinemets, U., Onoda, Y., Peñuelas, J., Read, Q., Sack, L., Schamp, B., Soudzilovskaia, N. A., Spasojevic, M. J., Sosinski, E., Thornton, P. E., Valladares, F., van Bodegom, P. M., Williams, M., Wirth, C., and Reich, P. B.: Mapping local and global variability in plant trait distributions, P. Natl. Acad. Sci. USA, 114, E10937–E10946, https://doi.org/10.1073/pnas.1708984114, 2017. a
Collalti, A. and Prentice, I. C.: Is NPP proportional to GPP? Waring's hypothesis 20 years on, Tree Physiol., 39, 1473–1483, https://doi.org/10.1093/treephys/tpz034, 2019. a, b
Cook-Patton, S. C., Leavitt, S. M., and Gibbs, D., Harris, N. L., Lister, K., Anderson-Teixeira, K. J., Briggs, R. D., Chazdon, R. L., Crowther, T. W., Ellis, P. W., Griscom, H. P., Herrmann, V., Holl, K. D., Houghton, R. A., Larrosa, C., Lomax, G., Lucas, R., Madsen, P., Malhi, Y., Paquette, A., Parker, J. D., Paul, K., Routh, D., Roxburgh, S., Saatchi, S., van den Hoogen, J., Walker, W. S., Wheeler, C. E., Wood, S. A., Xu, L., and Griscom, B. W.: Mapping carbon accumulation potential from global natural forest regrowth, Nature, 585, 545–550, https://doi.org/10.1038/s41586-020-2686-x, 2020. a
da Costa, A. C. L., Galbraith, D., Almeida, S., Portela, B. T. T., da Costa, M., de Athaydes Silva Junior, J., Braga, A. P., de Gonçalves, P. H. L., de Oliveira, A. A., Fisher, R., Phillips, O. L., Metcalfe, D. B., Levy, P., and Meir, P.: Effect of 7 yr of experimental drought on vegetation dynamics and biomass storage of an eastern Amazonian rainforest, New Phytol., 187, 579–591, https://doi.org/10.1111/j.1469-8137.2010.03309.x, 2010. a
De Kauwe, M. G., Medlyn, B. E., Zaehle, S., Walker, A. P., Dietze, M. C., Wang, Y.-P., Luo, Y., Jain, A. K., El-Masri, B., Hickler, T., Wårlind, D., Weng, E., Parton, W. J., Thornton, P. E., Wang, S., Prentice, I. C., Asao, S., Smith, B., McCarthy, H. R., Iversen, C. M., Hanson, P. J., Warren, J. M., Oren, R., and Norby, R. J.: Where does the carbon go? A model-data intercomparison of vegetation carbon allocation and turnover processes at two temperate forest free-air CO2 enrichment sites, New Phytol., 203, 883–899, https://doi.org/10.1111/nph.12847, 2014. a
Doughty, C. E., Metcalfe, D. B., Girardin, C. A. J., Amezquita, F. F., Durand, L., Huaraca Huasco, W., Silva-Espejo, J. E., Araujo-Murakami, A., da Costa, M. C., da Costa, A. C. L., Rocha, W., Meir, P., Galbraith, D., and Malhi, Y.: Source and sink carbon dynamics and carbon allocation in the Amazon basin, Global Biogeochem. Cy., 29, 645–655, https://doi.org/10.1002/2014GB005028, 2015. a
Exbrayat, J.-F. and Williams, M.: Quantifying the net contribution of the historical Amazonian deforestation to climate change: Net deforestation in the Amazon Basin, Geophys. Res. Lett., 42, 2968–2976, https://doi.org/10.1002/2015GL063497, 2015. a
Exbrayat, J.-F., Bloom, A. A., Falloon, P., Ito, A., Smallman, T. L., and Williams, M.: Reliability ensemble averaging of 21st century projections of terrestrial net primary productivity reduces global and regional uncertainties, Earth Syst. Dynam., 9, 153–165, https://doi.org/10.5194/esd-9-153-2018, 2018a. a, b
Exbrayat, J.-F., Smallman, T. L., Bloom, A. A., Huntley, L. B., and Williams, M.: Inverse Determination of the Influence of Fire on Vegetation Carbon Turnover in the Pantropics, Global Biogeochem. Cy., 32, 1776–1789, https://doi.org/10.1029/2018GB005925, 2018b. a, b, c, d, e, f, g
Exbrayat, J.-F., Bloom, A. A., Carvalhais, N., Fischer, R., Huth, A., MacBean, N., and Williams, M.: Understanding the Land Carbon Cycle with Space Data: Current Status and Prospects, Surv. Geophys., 40, 735–755, https://doi.org/10.1007/s10712-019-09506-2, 2019. a, b, c
Eyring, V., Bony, S., Meehl, G. A., Senior, C. A., Stevens, B., Stouffer, R. J., and Taylor, K. E.: Overview of the Coupled Model Intercomparison Project Phase 6 (CMIP6) experimental design and organization, Geosci. Model Dev., 9, 1937–1958, https://doi.org/10.5194/gmd-9-1937-2016, 2016. a, b, c
Flack-Prain, S., Meir, P., Malhi, Y., Smallman, T. L., and Williams, M.: Does economic optimisation explain LAI and leaf trait distributions across an Amazon soil moisture gradient?, Glob. Change Biol., 27, 1–19, https://doi.org/10.1111/gcb.15368, 2020. a
Friedlingstein, P., Jones, M. W., O'Sullivan, M., Andrew, R. M., Hauck, J., Peters, G. P., Peters, W., Pongratz, J., Sitch, S., Le Quéré, C., Bakker, D. C. E., Canadell, J. G., Ciais, P., Jackson, R. B., Anthoni, P., Barbero, L., Bastos, A., Bastrikov, V., Becker, M., Bopp, L., Buitenhuis, E., Chandra, N., Chevallier, F., Chini, L. P., Currie, K. I., Feely, R. A., Gehlen, M., Gilfillan, D., Gkritzalis, T., Goll, D. S., Gruber, N., Gutekunst, S., Harris, I., Haverd, V., Houghton, R. A., Hurtt, G., Ilyina, T., Jain, A. K., Joetzjer, E., Kaplan, J. O., Kato, E., Klein Goldewijk, K., Korsbakken, J. I., Landschützer, P., Lauvset, S. K., Lefèvre, N., Lenton, A., Lienert, S., Lombardozzi, D., Marland, G., McGuire, P. C., Melton, J. R., Metzl, N., Munro, D. R., Nabel, J. E. M. S., Nakaoka, S.-I., Neill, C., Omar, A. M., Ono, T., Peregon, A., Pierrot, D., Poulter, B., Rehder, G., Resplandy, L., Robertson, E., Rödenbeck, C., Séférian, R., Schwinger, J., Smith, N., Tans, P. P., Tian, H., Tilbrook, B., Tubiello, F. N., van der Werf, G. R., Wiltshire, A. J., and Zaehle, S.: Global Carbon Budget 2019, Earth Syst. Sci. Data, 11, 1783–1838, https://doi.org/10.5194/essd-11-1783-2019, 2019. a
Friedlingstein, P., Smith, W. K., Yuan, W., He, W., Lombardozzi, D., Kautz, M., Zhu, D., Lienert, S., Kato, E., Poulter, B., Sanders, T. G. M., Krüger, I., Wang, R., Zeng, N., Tian, H., Vuichard, N., Jain, A. K. Wiltshire, A., Haverd, V., Goll, D. S., and Pe nuelas, J.: Recent global decline of CO2 fertilization effects on vegetation photosynthesis, Science, 370, 1295–1300, https://doi.org/10.1126/science.abb7772, 2020.
Friend, A. D., Lucht, W., Rademacher, T. T., Keribin, R., Betts, R., Cadule, P., Ciais, P., Clark, D. B., Dankers, R., Falloon, P. D., Ito, A., Kahana, R., Kleidon, A., Lomas, M. R., Nishina, K., Ostberg, S., Pavlick, R., Peylin, P., Schaphoff, S., Vuichard, N., Warszawski, L., Wiltshire, A., and Woodward, F. I.: Carbon residence time dominates uncertainty in terrestrial vegetation responses to future climate and atmospheric CO2, P. Natl. Acad. Sci. USA, 111, 3280–3285, https://doi.org/10.1073/pnas.1222477110, 2014. a, b, c, d, e, f
Gatti, L. V., Gloor, M., Miller, J. B., Doughty, C. E., Malhi, Y., Domingues, L. G., Basso, L. S., Martinewski, A., Correia, C. S. C., Borges, V. F., Freitas, S., Braz, R., Anderson, L. O., Rocha, H., Grace, J., Phillips, O. L., and Lloyd, J.: Drought sensitivity of Amazonian carbon balance revealed by atmospheric measurements, Nature, 506, 76–80, https://doi.org/10.1038/nature12957, 2014. a
Gaubert, B., Stephens, B. B., Basu, S., Chevallier, F., Deng, F., Kort, E. A., Patra, P. K., Peters, W., Rödenbeck, C., Saeki, T., Schimel, D., Van der Laan-Luijkx, I., Wofsy, S., and Yin, Y.: Global atmospheric CO2 inverse models converging on neutral tropical land exchange, but disagreeing on fossil fuel and atmospheric growth rate, Biogeosciences, 16, 117–134, https://doi.org/10.5194/bg-16-117-2019, 2019. a
Ge, R., He, H., Ren, X., Zhang, L., Yu, G., Smallman, T. L., Zhou, T., Yu, S-Y., Luo, Y., Xie, Z., Wang, S., Wang, H., Zhou, G., Zhang, Q., Wang, A., Fan, Z., Zhang, Y., Shen, W., Yin, H., and Lin, L.: Underestimated ecosystem carbon turnover time and sequestration under the steady state assumption: A perspective from long-term data assimilation, Glob. Change Biol., 25, 938–953, https://doi.org/10.1111/gcb.14547, 2019. a
Gelman, A. and Rubin, D. B.: Inference from iterative simulation using multiple sequences, Stat. Sci., 7, 457–472, 1992. a
Giglio, L., Boschetti, L., Roy, D. P., Humber, M. L., and Justice, C. O.: The Collection 6 MODIS burned area mapping algorithm and product, Remote Sens. Environ., 217, 72–85, https://doi.org/10.1016/j.rse.2018.08.005, 2018. a
Haario, H., Saksman, E., and Tamminen, J.: An adaptive Metropolis algorithm, Bernoulli, 7, 223–242, 2001. a
Hansen, M. C., Potapov, P. V., Moore, R., Hancher, M., Turubanova, S. A., Tyukavina, A., Thau, D., Stehman, S. V., Goetz, S. J., Loveland, T. R., Kommareddy, A., Egorov, A., Chini, L., Justice, C. O., and Townshend, J. R. G.: High-Resolution Global Maps of 21st-Century Forest Cover Change, Science, 342, 850–853, 2013. a
Haynes, K., Baker, I. T., Denning, S., Stöckli, R., Schaefer, K., Lokupitiya, E. Y., and Haynes, J. M.: Representing grasslands using dynamic prognostic phenology based on biological growth stages: 1. Implementation in the Simple Biosphere Model (SiB4), J. Adv. Model Earth Sy., 11, 4423–4439. https://doi.org/10.1029/2018MS001540, 2019. a
He, L., Chen, J. M., Croft, H., Gonsamo, A., Luo, X., Liu, J., Zheng, T., Liu, R., and Liu, Y.: Nitrogen availability dampens the positive impacts of CO2 fertilization on terrestrial ecosystem carbon and water cycles, Geophys. Res. Lett., 44, 590–611, https://doi.org/10.1002/2017GL075981, 2017. a, b
Hengl, T., Mendes de Jesus, J., Heuvelink, G. B. M., Ruiperez Gonzalez, M., Kilibarda, M., Blagotić, A., Shangguan, W., Wright, M. N., Geng, X., Bauer-Marschallinger, B., Guevara, M. A., Vargas, R., MacMillan, R. A., Batjes, N. H., Leenaars, J. G. B., Ribeiro, E., Wheeler, I., Mantel, S., and Kempen, B.: SoilGrids250m: Global gridded soil information based on machine learning, PLoS ONE, 12, e0169748, 2017. a, b
Hubau, W., Lewis, S. L., Phillips, O. L., Affum-Baffoe, K., Beeckman, H., Cuní-Sanchez, A., Daniels, A. K., Ewango, C. E. N., Fauset, S., Mukinzi, J. M., Sheil, D., Sonké, B., Sullivan, M. J. P., Sunderland, T. C. H., Taedoumg, H., Thomas, S. C., White, L. J. T., Abernethy, K. A., Adu-Bredu, S., Amani, C. A., Baker, T. R., Banin, L. F., Baya, F., Begne, S. K., Bennett, A. C., Benedet, F., Bitariho, R., Bocko, Y. E., Boeckx, P., Boundja, P., Brienen, R. J. W., Brncic, T., Chezeaux, E., Chuyong, G. B., Clark, C. J., Collins, M., Comiskey, J. A., Coomes, D. A., Dargie, G. C., de Haulleville, T., Kamdem, M. N. D., Doucet, J.-L., Esquivel-Muelbert, A., Feldpausch, T. R., Fofanah, A., Foli, E. G., Gilpin, M., Gloor, E., Gonmadje, C., Gourlet-Fleury, S., Hall, J. S., Hamilton, A. C., Harris, D. J., Hart, T. B., Hockemba, M. B. N., Hladik, A., Ifo, S. A., Jeffery, K. J., Jucker, T., Yakusu, E. K., Kearsley, E., Kenfack, D., Koch, A., Leal, M. E., Levesley, A., Lindsell, J. A., Lisingo, J., Lopez-Gonzalez, G., Lovett, J. C., Makana, J-R., Malhi, Y., Marshall, A. R., Martin, J., Martin, E. H., Mbayu, F. M., Medjibe, V. P., Mihindou, V., Mitchard, E. T. A., Moore, S., Munishi, P. K. T., Bengone, N. N., Ojo, L., Ondo, F. E., Peh, K. S.-H., Pickavance, G. C., Poulsen, A. D., Poulsen, J. R., Qie, L., Reitsma, J., Rovero, F., Swaine, M. D., Talbot, J., Taplin, J., Taylor, D. M., Thomas, D. W., Toirambe, B., Mukendi, J. T., Tuagben, D., Umunay, P. M., van der Heijden, G. M. F., Verbeeck, H., Vleminckx, J., Willcock, S., Wöll, H., Woods, J. T., and Zemagho, L.: Asynchronous carbon sink saturation in African and Amazonian tropical forests, Nature, 579, 80–87, https://doi.org/10.1038/s41586-020-2035-0, 2020.
Huntingford, C., Zelazowski, P., Galbraith, D., Mercado, L. M., Sitch, S., Fisher, R., Lomas, M., Walker, A. P., Jones, C. D., Booth, B. B. B., Malhi, Y., Hemming, D., Kay, G., Good, P., Lewis, S. L., Phillips, O. L., Atkin, O. K., Lloyd, J., Gloor, E., Zaragoza-Castells, J., Meir, P., Betts, R., Harris, P. P., Nobre, C., Marengo, J., and Cox, P. M.: Simulated resilience of tropical rainforests to CO2-induced climate change, Nat. Geosci., 6, 268–273, https://doi.org/10.1038/ngeo1741, 2013. a, b
Ito, A., Nishina, K., Reyer, C. P. O., François, L., Henrot, A-J., Munhoven, G., Jacquemin, I., Tian, H., Yang, J., Pan, S., Morfopoulos, C., Betts, R., Hickler, T., Steinkamp, J., Ostberg, S., Schaphoff, S., Ciais, P., Chang, J., Rafique, R., Zeng, N., and Zhao, F.: Photosynthetic productivity and its efficiencies in ISIMIP2a biome models: benchmarking for impact assessment studies, Environ. Res. Lett., 12, 085001, https://doi.org/10.1088/1748-9326/aa7a19, 2017.
Joiner, J. and Yoshida, Y.: Global MODIS and FLUXNET-derived Daily Gross Primary Production, V2, ORNL DAAC, Oak Ridge, Tennessee, USA, https://doi.org/10.3334/ORNLDAAC/1835, 2021. a
Joiner, J., Yoshida, Y., Zhang, Y., Duveiller, G., Jung, M., Lyapustin, A., Wang, Y., and Tucker, C. J.: Estimation of Terrestrial Global Gross Primary Production (GPP) with Satellite Data-Driven Models and Eddy Covariance Flux Data, Remote Sens.-Basel, 10, 1346, https://doi.org/10.3390/rs10091346, 2018. a
Jones, C. D., Arora, V., Friedlingstein, P., Bopp, L., Brovkin, V., Dunne, J., Graven, H., Hoffman, F., Ilyina, T., John, J. G., Jung, M., Kawamiya, M., Koven, C., Pongratz, J., Raddatz, T., Randerson, J. T., and Zaehle, S.: C4MIP – The Coupled Climate–Carbon Cycle Model Intercomparison Project: experimental protocol for CMIP6, Geosci. Model Dev., 9, 2853–2880, https://doi.org/10.5194/gmd-9-2853-2016, 2016. a, b, c
Jones, S., Rowland, L., Cox, P., Hemming, D., Wiltshire, A., Williams, K., Parazoo, N. C., Liu, J., da Costa, A. C. L., Meir, P., Mencuccini, M., and Harper, A. B.: The impact of a simple representation of non-structural carbohydrates on the simulated response of tropical forests to drought, Biogeosciences, 17, 3589–3612, https://doi.org/10.5194/bg-17-3589-2020, 2020. a, b
Jung, M., Schwalm, C., Migliavacca, M., Walther, S., Camps-Valls, G., Koirala, S., Anthoni, P., Besnard, S., Bodesheim, P., Carvalhais, N., Chevallier, F., Gans, F., Goll, D. S., Haverd, V., Köhler, P., Ichii, K., Jain, A. K., Liu, J., Lombardozzi, D., Nabel, J. E. M. S., Nelson, J. A., O'Sullivan, M., Pallandt, M., Papale, D., Peters, W., Pongratz, J., Rödenbeck, C., Sitch, S., Tramontana, G., Walker, A., Weber, U., and Reichstein, M.: Scaling carbon fluxes from eddy covariance sites to globe: synthesis and evaluation of the FLUXCOM approach, Biogeosciences, 17, 1343–1365, https://doi.org/10.5194/bg-17-1343-2020, 2020. a, b, c, d, e
Kaiser, J. W., Heil, A., Andreae, M. O., Benedetti, A., Chubarova, N., Jones, L., Morcrette, J.-J., Razinger, M., Schultz, M. G., Suttie, M., and van der Werf, G. R.: Biomass burning emissions estimated with a global fire assimilation system based on observed fire radiative power, Biogeosciences, 9, 527–554, https://doi.org/10.5194/bg-9-527-2012, 2012. a, b
Kattge, J., Bönisch, G., Díaz, S., Lavorel, S., Prentice, I. C., Leadley, P., Tautenhahn, S., Werner, G. D. A., Aakala, T., Abedi, M., Acosta, A. T. R., Adamidis, G. C., Adamson, K., Aiba, M., Albert, C. H., Alcántara, J. M., Alcázar C, C., Aleixo, I., Ali, H., Amiaud, B., Ammer, C., Amoroso, M. M., Anand, M., Anderson, C., Anten, N., Antos, J., Apgaua, D. M. G., Ashman, T-L., Asmara, D. H., Asner, G. P., Aspinwall, M., Atkin, O., Aubin, I., Baastrup-Spohr, L., Bahalkeh, K., Bahn, M., Baker, T., Baker, W. J., Bakker, J. P., Baldocchi, D., Baltzer, J., Banerjee, A., Baranger, A., Barlow, J., Barneche, D. R., Baruch, Z., Bastianelli, D., Battles, J., Bauerle, W., Bauters, M., Bazzato, E., Beckmann, M., Beeckman, H., Beierkuhnlein, C., Bekker, R., Belfry, G., Belluau, M., Beloiu, M., Benavides, R., Benomar, L., Berdugo-Lattke, M. L., Berenguer, E., Bergamin, R. Bergmann, J., Bergmann Carlucci, M., Berner, L., Bernhardt-Römermann, M., Bigler, C., Bjorkman, A. D., Blackman, C., Blanco, C., Blonder, B., Blumenthal, D., Bocanegra-González, K. T., Boeckx, P., Bohlman, S., Böhning-Gaese, K., Boisvert-Marsh, L., Bond, W., Bond-Lamberty, B., Boom, A., Boonman, C. C. F., Bordin, K., Boughton, E. H., Boukili, V., Bowman, D. M. J. S., Bravo, S., Brendel, M. R., Broadley, M. R., Brown, K. A., Bruelheide, H., Brumnich, F., Bruun, H. H., Bruy, D., Buchanan, S. W., Bucher, S. F., Buchmann, N., Buitenwerf, R., Bunker, D. E., Bürger, J., Burrascano, S., Burslem, D. F. R. P., Butterfield, B. J., Byun, C., Marques, M., Scalon, M. C., Caccianiga, M., Cadotte, M., Cailleret, M., Camac, J., Camarero, J. J., Campany, C., Campetella, G., Campos, J. A., Cano-Arboleda, L., Canullo, R., Carbognani, M., Carvalho, F., Casanoves, F., Castagneyrol, B., Catford, J. A., Cavender-Bares, J., Cerabolini, B. E. L., Cervellini, M., Chacón-Madrigal, E., Chapin, K., Chapin, F. S., Chelli, S., Chen, S.-C., Chen, A., Cherubini, P., Chianucci, F., Choat, B., Chung, K-S., Chytrý, M., Ciccarelli, D., Coll, L., Collins, C. G., Conti, L., Coomes, D., Cornelissen, J. H. C., Cornwell, W. K., Corona, P., Coyea, M., Craine, J., Craven, D., Cromsigt, J. P. G. M., Csecserits, A., Cufar, K., Cuntz, M., da Silva, A. C., Dahlin, K. M., Dainese, M., Dalke, I., Dalle Fratte, M., Dang-Le, A. T., Danihelka, J., Dannoura, M., Dawson, S., de Beer, A. J., De Frutos, A., De Long, J. R., Dechant, B., Delagrange, S., Delpierre, N., Derroire, G., Dias, A. S., Diaz-Toribio, M. H., Dimitrakopoulos, P. G., Dobrowolski, M., Doktor, D., Dřevojan, P., Dong, N., Dransfield, J., Dressler, S., Duarte, L., Ducouret, E., Dullinger, S., Durka, W., Duursma, R., Dymova, O., E-Vojtkó, A., Eckstein, R. L., Ejtehadi, H., Elser, J., Emilio, T., Engemann, K., Erfanian, M. B., Erfmeier, A., Esquivel-Muelbert, A., Esser, G., Estiarte, M., Domingues, T. F., Fagan, W. F., Fagúndez, J., Falster, D. S., Fan, Y., Fang, J., Farris, E., Fazlioglu, F., Feng, Y., Fernandez-Mendez, F., Ferrara, C., Ferreira, J., Fidelis, A., Finegan, B., Firn, J., Flowers, T. J., Flynn, D. F. B., Fontana, V., Forey, E., Forgiarini, C., François, L., Frangipani, M., Frank, D., Frenette-Dussault, C., Freschet, G. T., Fry, E. L., Fyllas, N. M., Mazzochini, G. G., Gachet, S., Gallagher, R., Ganade, G., Ganga, F., García-Palacios, P., Gargaglione, V., Garnier, E., Garrido, J. L., de Gasper, A. L., Gea-Izquierdo, G., Gibson, D., Gillison, A. N., Giroldo, A., Glasenhardt, M-C., Gleason, S., Gliesch, M., Goldberg, E., Göldel, B., Gonzalez-Akre, E., Gonzalez-Andujar, J. L., González-Melo, A., González-Robles, A., Graae, B. J., Granda, E., Graves, S., Green, W. A., Gregor, T., Gross, N., Guerin, G. R., Günther, A., Gutiérrez, A. G., Haddock, L., Haines, A., Hall, J., Hambuckers, A., Han, W., Harrison, S. P., Hattingh, W., Hawes, J. E., He, T., He, P., Heberling, J. M., Helm, A., Hempel, S., Hentschel, J., Hérault, B., Hereş, A-M., Herz, K., Heuertz, M., Hickler, T., Hietz, P., Higuchi, P., Hipp, A. L., Hirons, A., Hock, M., Hogan, J. A., Holl, K., Honnay, O., Hornstein, D., Hou, E., Hough-Snee, N., Hovstad, K. A., Ichie, T., Igić, B., Illa, E., Isaac, M., Ishihara, M., Ivanov, L., Ivanova, L., Iversen, C. M., Izquierdo, J., Jackson, R. B., Jackson, B., Jactel, H., Jagodzinski, A. M., Jandt, U., Jansen, S., Jenkins, T., Jentsch, A., Jespersen, J. R. P., Jiang, G-F., Johansen, J. L., Johnson, D., Jokela, E. J., Joly, C. A., Jordan, G. J., Joseph, G. S., Junaedi, D., Junker, R. R., Justes, E., Kabzems, R., Kane, J., Kaplan, Z., Kattenborn, T., Kavelenova, L., Kearsley, E., Kempel, A., Kenzo, T., Kerkhoff, A., Khalil, M. I., Kinlock, N. L., Kissling, W. D., Kitajima, K., Kitzberger, T., Kjøller, R., Klein, T., Kleyer, M., Klimešová, J., Klipel, J., Kloeppel, B., Klotz, S., Knops, J. M. H., Kohyama, T., Koike, F., Kollmann, J., Komac, B., Komatsu, K., König, C., Kraft, N. J. B., Kramer, K., Kreft, H., Kühn, I., Kumarathunge, D., Kuppler, J., Kurokawa, H., Kurosawa, Y., Kuyah, S., Laclau, J.-P., Lafleur, B., Lallai, E., Lamb, E., Lamprecht, A., Larkin, D. J., Laughlin, D., Le Bagousse-Pinguet, Y., le Maire, G., le Roux, P. C., le Roux, E., Lee, T., Lens, F., Lewis, S. L., Lhotsky, B., Li, Y., Li, X., Lichstein, J. W., Liebergesell, M., Lim, J. Y., Lin, Y-S., Linares, J. C., Liu, C., Liu, D., Liu, U., Livingstone, S., Llusià, J., Lohbeck, M., López-García, Á., Lopez-Gonzalez, G., Lososová, Z., Louault, F., Lukács, B. A., Lukeš, P., Luo, Y., Lussu, M., Ma, S., Maciel Rabelo Pereira, C., Mack, M., Maire, V., Mäkelä, A., Mäkinen, H., Malhado, A. C. M., Mallik, A., Manning, P., Manzoni, S., Marchetti, Z., Marchino, L., Marcilio-Silva, V., Marcon, E., Marignani, M., Markesteijn, L., Martin, A., Martínez-Garza, C., Martínez-Vilalta, J., Mašková, T., Mason, K., Mason, N., Massad, T. J., Masse, J., Mayrose, I., McCarthy, J., McCormack, M. L., McCulloh, K., McFadden, I. R., McGill, B. J., McPartland, M. Y., Medeiros, J. S., Medlyn, B., Meerts, P., Mehrabi, Z., Meir, P., Melo, F. P. L., Mencuccini, M., Meredieu, C., Messier, J., Mészáros, I., Metsaranta, J., Michaletz, S. T., Michelaki, C., Migalina, S., Milla, R., Miller, J. E. D., Minden, V., Ming, R., Mokany, K., Moles, A. T., Molnár V, A., Molofsky, J., Molz, M., Montgomery, R. A., Monty, A., Moravcová, L., Moreno-Martínez, A., Moretti, M., Mori, A. S., Mori, S., Morris, D., Morrison, J., Mucina, L., Mueller, S., Muir, C. D., Müller, S. C., Munoz, F., Myers-Smith, I. H., Myster, R. W., Nagano, M., Naidu, S., Narayanan, A., Natesan, B., Negoita, L., Nelson, A. S., Neuschulz, E. L., Ni, J., Niedrist, G., Nieto, J., Niinemets, Ü., Nolan, R., Nottebrock, H., Nouvellon, Y., Novakovskiy, A., The Nutrient Network, Nystuen, K. O., O'Grady, A., O'Hara, K., O'Reilly-Nugent, A., Oakley, S., Oberhuber, W., Ohtsuka, T., Oliveira, R., Öllerer, K., Olson, M. E., Onipchenko, V., Onoda, Y., Onstein, R. E., Ordonez, J. C., Osada, N., Ostonen, I., Ottaviani, G., Otto, S., Overbeck, G. E., Ozinga, W. A., Pahl, A. T., Paine, C. E. T., Pakeman, R. J., Papageorgiou, A. C., Parfionova, E., Pärtel, M., Patacca, M., Paula, S., Paule, J., Pauli, H., Pausas, J. G., Peco, B., Penuelas, J., Perea, A., Peri, P. L., Petisco-Souza, A. C., Petraglia, A., Petritan, A. M., Phillips, O. L., Pierce, S., Pillar, V. D., Pisek, J., Pomogaybin, A., Poorter, H., Portsmuth, A., Poschlod, P., Potvin, C., Pounds, D., Powell, A. S., Power, S. A., Prinzing, A., Puglielli, G., Pyšek, P., Raevel, V., Rammig, A., Ransijn, J., Ray, C. A., Reich, P. B., Reichstein, M., Reid, D. E. B., Réjou-Méchain, M., de Dios, V. R., Ribeiro, S., Richardson, S., Riibak, K., Rillig, M. C., Riviera, F., Robert, E. M. R., Roberts, S., Robroek, B., Roddy, A., Rodrigues, A. V., Rogers, A., Rollinson, E., Rolo, V., Römermann, C, Ronzhina, D., Roscher, C., Rosell, J. A., Rosenfield, M. F., Rossi, C., Roy, D. B., Royer-Tardif, S., Rüger, N., Ruiz-Peinado, R., Rumpf, S. B., Rusch, G. M., Ryo, M., Sack, L., Saldaña, A., Salgado-Negret, B., Salguero-Gomez, R., Santa-Regina, I., Santacruz-García, A. C., Santos, J., Sardans, J., Schamp, B., Scherer-Lorenzen, M., Schleuning, M., Schmid, B., Schmidt, M., Schmitt, S., Schneider, J. V., Schowanek, S. D., Schrader, J., Schrodt, F., Schuldt, B., Schurr, F., Selaya Garvizu, G., Semchenko, M., Seymour, C., Sfair, J. C., Sharpe, J. M., Sheppard, C. S., Sheremetiev, S., Shiodera, S., Shipley, B., Shovon, T. A., Siebenkäs, A., Sierra, C., Silva, V., Silva, M., Sitzia, T., Sjöman, H., Slot, M., Smith, N. G., Sodhi, D. Soltis, P., Soltis, D., Somers, B., Sonnier, G., Sørensen, M. V., Sosinski Jr, E. E., Soudzilovskaia, N. A., Souza, A. F., Spasojevic, M., Sperandii, M. G., Stan, A. B., Stegen, J., Steinbauer, K., Stephan, J. G., Sterck, F., Stojanovic, D. B., Strydom, T., Suarez, M. L., Svenning, J.-C., Svitková, I., Svitok, M., Svoboda, M., Swaine, E., Swenson, N., Tabarelli, M., Takagi, K., Tappeiner, U., Tarifa, R., Tauugourdeau, S., Tavsanoglu, C., te Beest, M., Tedersoo, L., Thiffault, N., Thom, D., Thomas, E., Thompson, K., Thornton, P. E., Thuiller, W., Tichý, L., Tissue, D., Tjoelker, M. G., Tng, D. Y. P., Tobias, J., Török, P., Tarin, T., Torres-Ruiz, J. M., Tóthmérész, B., Treurnicht, M., Trivellone, V., Trolliet, F., Trotsiuk, V., Tsakalos, J. L., Tsiripidis, I., Tysklind, N., Umehara, T., Usoltsev, V., Vadeboncoeur, M., Vaezi, J., Valladares, F., Vamosi, J., van Bodegom, P. M., van Breugel, M., Van Cleemput, E., van de Weg, M., van der Merwe, S., van der Plas, F., van der Sande, M. T., van Kleunen, M., Van Meerbeek, K., Vanderwel, M., Vanselow, K. A., Vårhammar, A., Varone, L., Vasquez Valderrama, M. Y., Vassilev, K., Vellend, M., Veneklaas, E. J., Verbeeck, H., Verheyen, K., Vibrans, A., Vieira, I., Villacís, J., Violle, C., Vivek, P., Wagner, K., Waldram, M. Waldron, A., Walker, A. P., Waller, M., Walther, G., Wang, H., Wang, F., Wang, W., Watkins, H., Watkins, J., Weber, U., Weedon, J. T., Wei, L., Weigelt, P., Weiher, E., Wells, A. W., Wellstein, C., Wenk, E., Westoby, M., Westwood, A., White, P. J., Whitten, M., Williams, M., Winkler, D. E., Winter, K., Womack, C., Wright, I. J., Wright, S. J., Wright, J., Pinho, B. X., Ximenes, F., Yamada, T. Yamaji, K., Yanai, R., Yankov, N., Yguel, B., Zanini, K. J., Zanne, A. E., Zelený, D., Zhao, Y-P., Zheng, J., Zheng, J., Ziemińska, K. Zirbel, C. R., Zizka, G., Zo-Bi, I. C., Zotz, G., Wirth, C., TRY plant trait database – enhanced coverage and open access, Glob. Change Biol., 26, 119–188, https://doi.org/10.1111/gcb.14904, 2020. a
Köhl, M., Lasco, R., Cifuentes, M., Jonsson, Ö., Korhonen, K. T., Mundhenk, P., Navar, J. J., and Stinson, G.: Changes in forest production, biomass and carbon: Results from the 2015 UN FAO Global Forest Resource Assessment, Forest Ecol. Manag., 352, 21–34, https://doi.org/10.1016/j.foreco.2015.05.036, 2015. a
Koren, G.: Constraining the exchange of carbon dioxide over the Amazon: New insights from stable isotopes, remote sensing and inverse modeling, PhD thesis, Wageningen University, Wageningen, the Netherlands, https://doi.org/10.18174/524771, 2020. a
Koren, G., van Schaik, E., Araújo, A. C., Boersma, K. F., Gärtner, A., Killaars, L., Kooreman, M. L., Kruijt, B., van der Laan-Luijkx, I. T., von Randow, C., Smith, N. E., and Peters, W.: Widespread reduction in sun-induced fluorescence from the Amazon during the 2015/2016 El Nino, Philos. T. R. Soc. B, 373, 20170408, https://doi.org/10.1098/rstb.2017.0408, 2018. a
Koven, C. D., Chambers, J. Q., Georgiou, K., Knox, R., Negron-Juarez, R., Riley, W. J., Arora, V. K., Brovkin, V., Friedlingstein, P., and Jones, C. D.: Controls on terrestrial carbon feedbacks by productivity versus turnover in the CMIP5 Earth System Models, Biogeosciences, 12, 5211–5228, https://doi.org/10.5194/bg-12-5211-2015, 2015. a, b, c
Kuppel, S., Peylin, P., Chevallier, F., Bacour, C., Maignan, F., and Richardson, A. D.: Constraining a global ecosystem model with multi-site eddy-covariance data, Biogeosciences, 9, 3757–3776, https://doi.org/10.5194/bg-9-3757-2012, 2012. a
Lapola, D. M., Martinelli, L. A., Peres, C. A., Ometto, J. P. H. B., Ferreira, M. E., Nobre, Carlos A., Aguiar, A. P. D., Bustamante, M. M. C., Cardoso, M. F., Costa, M. H., Joly, C. A., Leite, C. C., Moutinho, P., Sampaio, G., Strassburg, B. B. N., and Vieira, I. C. G.: Pervasive transition of the Brazilian land-use system, Nat. Clim. Change, 4, 27–35, https://doi.org/10.1038/nclimate2056, 2014. a
Lewis, S. L., Brando, P. M., Phillips, O. L., van der Heijden, G. M. F., and Nepstad, D.: The 2010 Amazon Drought, Science, 331, 554–554, https://doi.org/10.1126/science.1200807, 2011. a
Lewis, S. L., Mitchard, E. T. A., Prentice, C., Maslin, M., and Poulter, B.: Comment on “The global tree restoration potential”, Science, 366, 6463, https://doi.org/10.1126/science.aaz0388, 2019. a
Longo, M., Keller, M., dos-Santos, M. N., Leitold, V., Pinagé, E. R., Baccini, A., Saatchi, S., Nogueira, E. M., Batistella, M., and Morton, D. C.: Aboveground biomass variability across intact and degraded forests in the Brazilian Amazon, Global Biogeochem. Cy., 30, 1639–1660, https://doi.org/10.1002/2016GB005465, 2016. a, b, c
Lovenduski, N. S. and Bonan, G. B.: Reducing uncertainty in projections of terrestrial carbon uptake, Environ. Res. Lett., 12, 44020. https://doi.org/10.1088/1748-9326/aa66b8, 2017. a
Magnússon, R. Í., Tietema, A., Cornelissen, J. H. C., Hefting, M. M., and Kalbitz, K.: Tamm Review: Sequestration of carbon from coarse woody debris in forest soils, Forest Ecol. Manag., 377, 1–15, https://doi.org/10.1016/j.foreco.2016.06.033, 2016. a, b
Malhi, Y., Doughty, C. E., Goldsmith, G. R., Metcalfe, D. B., Girardin, C. A. J., Marthews, T. R., del Aguila-Pasquel, J., Aragão, L. E. O. C., Araujo-Murakami, A., Brando, P., da Costa, A. C. L., Silva-Espejo, J. E., Farfán Amézquita, F., Galbraith, D. R., Quesada, C. A., Rocha, W., Salinas-Revilla, N., Silvério, D., Meir, P., and Phillips, O. L.: The linkages between photosynthesis, productivity, growth and biomass in lowland Amazonian forests, Glob. Change Biol., 21, 2283–2295, https://doi.org/10.1111/gcb.12859, 2015. a
Matthews, H. D., Graham, T. L., Keverian, S., Lamontagne, C., Seto, D., and Smith, T. J.: National contributions to observed global warming, Environ. Res. Lett., 9, 014010, https://doi.org/10.1088/1748-9326/9/1/014010, 2014. a
Melnikova, I. and Sasai, T.: Effects of anthropogenic activity on global terrestrial gross primary production, J. Geophys. Res.-Biogeo., 125, e2019JG005403, https://doi.org/10.1029/2019JG005403, 2020. a
Mengistu, A. G., Mengistu Tsidu, G., Koren, G., Kooreman, M. L., Boersma, K. F., Tagesson, T., Ardö, J., Nouvellon, Y., and Peters, W.: Sun-induced fluorescence and near-infrared reflectance of vegetation track the seasonal dynamics of gross primary production over Africa, Biogeosciences, 18, 2843–2857, https://doi.org/10.5194/bg-18-2843-2021, 2021. a
Mercado, L., Bellouin, N., Sitch, S., Boucher, O., Huntingford, C., Wild, M., and Cox, P. M.: Impact of changes in diffuse radiation on the global land carbon sink, Nature, 458, 1014–1017, https://doi.org/10.1038/nature07949, 2009. a, b
Milodowski, D., Mitchard, E., and Williams, M.: Forest loss maps from regional satellite monitoring systematically underestimate deforestation in two rapidly changing parts of the Amazon, Environ. Res. Lett., 12, 094003, https://doi.org/10.1088/1748-9326/aa7e1e, 2017. a
Mitchard, E. T. A., Feldpausch, T. R., Brienen, R. J. W., Lopez-Gonzalez, G., Monteagudo, A., Baker, T. R., Lewis, S. L., Lloyd, J., Quesada, C. A., Gloor, M., ter Steege, H., Meir, P., Alvarez, E., Araujo-Murakami, A., Arag ao, L. E. O. C., Arroyo, L., Aymard, G., Banki, O., Bonal, D., Brown, S., Brown, F. I., Cerón, C. E., Chama Moscoso, V., Chave, J., Comiskey, J. A., Cornejo, F., Corrales Medina, M., Da Costa, L., Costa, F. R. C., Di Fiore, A., Domingues, T. F., Erwin, T. L., Frederickson, T., Higuchi, N., Honorio Coronado, E. N., Killeen, T. J., Laurance, W. F., Levis, C., Magnusson, W. E., Marimon, B. S., Marimon Junior, B. H., Mendoza Polo, I., Mishra, P., Nascimento, M. T., Neill, D., Nún̄ez Vargas, M. P., Palacios, W. A., Parada, A., Pardo Molina, G., Peña-Claros, M., Pitman, N., Peres, C. A., Poorter, L., Prieto, A., Ramirez-Angulo, H., Restrepo Correa, Z., Roopsind, A., Roucoux, K. H., Rudas, A., Salomāo, R. P., Schietti, J., Silveira, M., de Souza, P. F., Steininger, M. K., Stropp, J., Terborgh, J., Thomas, R., Toledo, M., Torres-Lezama, A., van Andel, T. R., van der Heijden, G. M. F., Vieira, I. C. G., Vieira, S., Vilanova-Torre, E., Vos, V. A., Wang, O., Zartman, C. E., Malhi, Y., and Phillips, O. L.: Divergent forest carbon maps from plots and space, Global. Ecol. Biogeogr., 2, 935–946, https://doi.org/10.1111/geb.12168, 2014.
Monteith, J. L.: Solar Radiation and Productivity in Tropical Ecosystems, J. Appl. Ecol., 9, 747–766, https://doi.org/10.2307/2401901, 1972. a
Myers, N., Mittermeier, R. A., Mittermeier, C. G., Da Fonseca, G. A., and Kent, J.: Biodiversity hotspots for conservation priorities, Nature, 403, 853–858, https://doi.org/10.1038/35002501, 2000. a
O'Neill, B. C., Tebaldi, C., van Vuuren, D. P., Eyring, V., Friedlingstein, P., Hurtt, G., Knutti, R., Kriegler, E., Lamarque, J.-F., Lowe, J., Meehl, G. A., Moss, R., Riahi, K., and Sanderson, B. M.: The Scenario Model Intercomparison Project (ScenarioMIP) for CMIP6, Geosci. Model Dev., 9, 3461–3482, https://doi.org/10.5194/gmd-9-3461-2016, 2016. a, b, c, d
Peters, H. A.: Neighbour-regulated mortality: the influence of positive and negative density dependence on tree populations in species-rich tropical forests, Ecol. Lett., 6, 757–765. https://doi.org/10.1046/j.1461-0248.2003.00492.x, 2003. a
Piao, S., Wang, X., Park, T., Chen, C., Lian, X., He, Y., Bjerke, J. W., Chen, A., Ciais, P., Tømmervik, H., Nemani, R. R., and Myneni, R. B.: Characteristics, drivers and feedbacks of global greening, Nat. Rev. Earth Environ., 1, 14–27, https://doi.org/10.1038/s43017-019-0001-x, 2020. a, b
Poorter, L., Bongers, F., Aide, T. M., Almeyda Zambrano, A. M., Balvanera, P., Becknell, J. M., Boukili, V., Brancalion, P. H. S., Broadbent, E. N., Chazdon, R. L., Craven, D., de Almeida-Cortez, J. S., Cabral, G. A. L., de Jong, B. H. J., Denslow, J. S., Dent, D. H., DeWalt, S. J., Dupuy, J. M., Durán, S. M., Espírito-Santo, M. M., Fandino, M. C., César, R. G., Hall, J. S., Hernandez-Stefanoni, J. L., Jakovac, C. C., Junqueira, A. B., Kennard, D., Letcher, S. G., Licona, J.-C., Lohbeck, M., Marín-Spiotta, E., Martínez-Ramos, M., Massoca, P., Meave, J. A., Mesquita, R., Mora, F., Muñoz, R., Muscarella, R., Nunes, Y. R. F., Ochoa-Gaona, S., de Oliveira, A. A., Orihuela-Belmonte, E., Peña-Claros, M., Pérez-García, E. A., Piotto, D., Powers, J. S., Rodríguez-Velázquez, J., Romero-Pérez, I. E., Ruíz, J., Saldarriaga, J. G., Sanchez-Azofeifa, A., Schwartz, N. B., Steininger, M. K., Swenson, N. G., Toledo, M., Uriarte, M., van Breugel, M., van der Wal, H., Veloso, M. D. M., Vester, H. F. M., Vicentini, A., Vieira, I. C. G., Bentos, T. V., Williamson, G. B., and Rozendaal, D. M. A.: Biomass resilience of Neotropical secondary forests, Nature, 530, 211–214, https://doi.org/10.1038/nature16512, 2016. a
Prentice, I. C., Liang, X., Medlyn, B. E., and Wang, Y.-P.: Reliable, robust and realistic: the three R's of next-generation land-surface modelling, Atmos. Chem. Phys., 15, 5987–6005, https://doi.org/10.5194/acp-15-5987-2015, 2015. a
Quegan S., Le Toan T., Chave J., Dall J., Exbrayat J., Minh D. H. T., Lomas, M., D'Alessandro, M. M., Paillou, P., Papathanassiou, K., Rocca, F., Saatchi, S., Scipal, K., Shugart, H., Smallman, T. L., Soja, M. J., Tebaldini, S., Ulander, L., Villard, L., and Williams, M.: The European Space Agency BIOMASS mission: Measuring forest above-ground biomass from space, Remote Sens. Environ., 227, 44–60, https://doi.org/10.1016/j.rse.2019.03.032, 2019. a, b
Restrepo-Coupe, N., da Rocha, H. R., Hutyra, L. R., da Araujo, A. C., Borma, L. S., Christoffersen, B., Cabral, O. M. R., de Camargo, P. B., Cardoso, F. L., da Costa, A. C. L., Fitzjarrald, D. R., Goulden, M. L., Kruijt, B., Maia, J. M. F., Malhi, Y. S., Manzi, A. O., Miller, S. D., Nobre, A. D., von Randow, C., Abreu Sá, L. D., Sakai, R. K., Tota, J., Wofsy, S. C., Zanchi, F. B., and Saleska, S. R.: What drives the seasonality of photosynthesis across the Amazon basin? A cross-site analysis of eddy flux tower measurements from the Brasil flux network, Agr. Forest Meteorol., 182–183, 128–144, https://doi.org/10.1016/j.agrformet.2013.04.031, 2013. a
Reuter, M., Bovensmann, H., Buchwitz, M., Burrows, J. P., Connor, B. J., Deutscher, N. M., Griffith, D. W. T., Heymann, J., Keppel-Aleks, G., Messerschmidt, J., Notholt, J., Petri, C., Robinson, J., Schneising, O., Sherlock, V., Velazco, V., Warneke, T., Wennberg, P. O., and Wunch, D.: Retrieval of atmospheric CO2 with enhanced accuracy and precision from SCIAMACHY: Validation with FTS measurements and comparison with model results, J. Geophys. Res., 116, D04301, https://doi.org/10.1029/2010JD015047, 2011. a
Rodríguez-Veiga, P., Carreiras, J., Smallman, T. L., Exbrayat, J.-F., Ndambiri, J., Mutwiri, F., Nyasaka, D., Quegan, S., Williams, M., and Balzter, H.: Carbon Stocks and Fluxes in Kenyan Forests and Wooded Grasslands Derived from Earth Observation and Model-Data Fusion, Remote Sens.-Basel, 12, 2380, https://doi.org/10.3390/rs12152380, 2020. a
Ryu, Y., Berry, J. A., and Baldocchi, D. D.: What is global photosynthesis? History, uncertainties and opportunities, Remote Sens. Environ., 223, 95–114, https://doi.org/10.1016/j.rse.2019.01.016, 2019.
Saatchi, S. S., Harris, N. L., Brown, S., Lefsky, M., Mitchard, E. T. A., Salas, W., Zutta, B. R., Buermann, W., Lewis, S. L., Hagen, S., Petrova, S., White, L., Silman, M., and Morel, A.: Benchmark map of forest carbon stocks in tropical regions across three continents, P. Natl. Acad. Sci. USA, 108, 9899–9904, https://doi.org/10.1073/pnas.1019576108, 2011. a
Safar, N. V. H., Magnago, L. F. S., and Schaefer, C. E. G. R.: Resilience of lowland Atlantic forests in a highly fragmented landscape: Insights on the temporal scale of landscape restoration, Forest Ecol. Manag., 470–471, 118183, https://doi.org/10.1016/j.foreco.2020.118183, 2020. a
Saleska, S. R., Miller, S. D., Matross, D. M., Goulden, M. L., Wofsy, S. C., da Rocha, H. R., de Camargo, P. B., Crill, P., Daube, B. C., de Freitas, H. C., Hutyra, L., Keller, M., Kirchhoff, V., Menton, M., Munger, J. W., Pyle, E. H., Rice, A. H., and Hudson, S.: Carbon in Amazon Forests: Unexpected Seasonal Fluxes and Disturbance-Induced Losses, Science, 302, 1554–1557, https://doi.org/10.1126/science.1091165, 2003. a
Sanquetta, C. R., Dalla Corte, A. P., Pelissari, A. L., Tomé, M., Maas, G. C. B., and Sanquetta, M. N. I.: Dynamics of Forest Cover, Volume, Biomass, and Carbon in the Brazilian Native Forests: 1990–2015, BIOFIX Scientific Journal, 3, 193–198, https://doi.org/10.5380/biofix.v3i1.58513, 2018. a
Santoro, M. and Cartus, O.: ESA Biomass Climate Change Initiative (Biomass_cci): Global datasets of forest above-ground biomass for the years 2010, 2017 and 2018, v2, Centre for Environmental Data Analysis, available at: https://catalogue.ceda.ac.uk/uuid/84403d09cef3485883158f4df2989b0c (last access: 17 November 2021), 2021. a
Schaefer, K., Collatz, G. J., Tans, P., Denning, A. S., Baker, I., Berry, J., Prihodko, L., Suits, N., and Philpott, A.: Combined Simple Biosphere/Carnegie-Ames-Stanford Approach terrestrial carbon cycle model, J. Geophys. Res., 113, G03034, https://doi.org/10.1029/2007JG000603, 2008. a
Sellar, A. A., Jones, C. G., Mulcahy, J. P., Tang, Y., Yool, A., Wiltshire, A., O'Connor, F. M., Stringer, M., Hill, R., Palmieri, J., Woodward, S., de Mora, L., Kuhlbrodt, T., Rumbold, S. T., Kelley, D. I., Ellis, R., Johnson, C. E., Walton, J., Abraham, N. L., Andrews, M. B., Andrews, T., Archibald, A. T., Berthou, S., Burke, E., Blockley, E., Carslaw, K., Dalvi, M., Edwards, J., Folberth, G. A., Gedney, N., Griffiths, P. T., Harper, A. B., Hendry, M. A., Hewitt, A. J., Johnson, B., Jones, A., Jones, C. D., Keeble, J., Liddicoat, S., Morgenstern, O., Parker, R. J., Predoi, V., Robertson, E., Siahaan, A., Smith, R. S., Swaminathan, R., Woodhouse, M. T., Zeng, G., and Zerroukat, M.: UKESM1: Description and evaluation of the U.K. Earth System Model, J. Adv. Model. Earth Sy., 11, 4513–4558, https://doi.org/10.1029/2019MS001739, 2019. a
Shao, P., Zeng, X., Sakaguchi, K., Monson, R. K., and Zeng, X.: Terrestrial Carbon Cycle: Climate Relations in Eight CMIP5 Earth System Models, J. Climate, 26, 8744–8764, https://doi.org/10.1175/JCLI-D-12-00831.1, 2013. a, b, c
Silva Junior, C. H. L., Aragão, L. E. O. C., Anderson, L. O., Fonseca, M. G., Shimabukuro, Y. E., Vancutsem, C., Achard, F., Beuchle, R., Numata, I., Silva, C. A., Maeda, E. E., Longo, M., and Saatchi, S. S.: Persistent collapse of biomass in Amazonian forest edges following deforestation leads to unaccounted carbon losses, Science Advances, 6, eaaz8360, https://doi.org/10.1126/sciadv.aaz8360, 2020. a
Sitch, S., Huntingford, C., Gedney, N., Levy, P. E., Lomas, M., Piao, S. L., Betts, R., Ciais, P., Cox, P., Friedlingstein, P., Jones, C. D., Prentice, I. C., and Woodward, F. I.: Evaluation of the terrestrial carbon cycle, future plant geography and climate-carbon cycle feedbacks using five Dynamic Global Vegetation Models (DGVMs), Glob. Change Biol., 14, 2015–2039, https://doi.org/10.1111/j.1365-2486.2008.01626.x, 2008. a
Sitch, S., Friedlingstein, P., Gruber, N., Jones, S. D., Murray-Tortarolo, G., Ahlström, A., Doney, S. C., Graven, H., Heinze, C., Huntingford, C., Levis, S., Levy, P. E., Lomas, M., Poulter, B., Viovy, N., Zaehle, S., Zeng, N., Arneth, A., Bonan, G., Bopp, L., Canadell, J. G., Chevallier, F., Ciais, P., Ellis, R., Gloor, M., Peylin, P., Piao, S. L., Le Quéré, C., Smith, B., Zhu, Z., and Myneni, R.: Recent trends and drivers of regional sources and sinks of carbon dioxide, Biogeosciences, 12, 653–679, https://doi.org/10.5194/bg-12-653-2015, 2015. a
Smallman, T. L. and Williams, M.: Description and validation of an intermediate complexity model for ecosystem photosynthesis and evapotranspiration: ACM-GPP-ETv1, Geosci. Model Dev., 12, 2227–2253, https://doi.org/10.5194/gmd-12-2227-2019, 2019. a
Smallman, T. L. and Williams, M.: CARDAMOM Brazil C-cycle multi-DALEC, multi-CMIP6 scenarios (1×1 degree; monthly; 2001–2017), National Centre for Earth Observation, School of GeoSciences, University of Edinburgh [data set], https://doi.org/10.7488/ds/3000, 2021. a
Smallman, T. L., Exbrayat, J.-F., Mencuccini, M., Bloom, A. A., and Williams, M.: Assimilation of repeated woody biomass observations constrains decadal ecosystem carbon cycle uncertainty in aggrading forests, J. Geophys. Res.-Biogeo., 122, 528–545, https://doi.org/10.1002/2016JG003520, 2017. a, b
Sun, Z., Wang, X., Yamamoto, H., Tani, H., Zhong, G., Yin, S., and Guo, E.: Spatial pattern of GPP variations in terrestrial ecosystems and its drivers: Climatic factors, CO2 concentration and land-cover change, 1982–2015, Ecol. Inform., 46, 156–165, https://doi.org/10.1016/j.ecoinf.2018.06.006, 2018. a
Sun, Z., Wang, X., Zhang, X., Tani, H., Guo, E., Yin, S., and Zhang, T.: Evaluating and comparing remote sensing terrestrial GPP models for their response to climate variability and CO2 trends, Sci. Total Environ., 668, 696–713, https://doi.org/10.1016/j.scitotenv.2019.03.025, 2019. a, b
Thomas, R. Q., Williams, M., Cavaleri, M. A., Exbrayat, J.-F., Smallman, T. L., and Street, L.: Alternate trait-based leaf respiration schemes evaluated at ecosystem-scale through carbon optimization modeling and canopy property data, J. Adv. Model. Earth Sy., 11, 4629–4644, https://doi.org/10.1029/2019MS001679, 2019. a
Todd-Brown, K. E. O., Randerson, J. T., Post, W. M., Hoffman, F. M., Tarnocai, C., Schuur, E. A. G., and Allison, S. D.: Causes of variation in soil carbon simulations from CMIP5 Earth system models and comparison with observations, Biogeosciences, 10, 1717–1736, https://doi.org/10.5194/bg-10-1717-2013, 2013. a, b
University of East Anglia Climatic Research Unit and Harris, I. C.: CRU JRA v1.1: A forcings dataset of gridded land surface blend of Climatic Research Unit (CRU) and Japanese reanalysis (JRA) data, Jan. 1901–Dec. 2017, 25 February 2019, Centre for Environmental Data Analysis, https://doi.org/10.5285/13f3635174794bb98cf8ac4b0ee8f4ed, 2019. a
van der Laan-Luijkx, I. T., van der Velde, I. R., van der Veen, E., Tsuruta, A., Stanislawska, K., Babenhauserheide, A., Zhang, H. F., Liu, Y., He, W., Chen, H., Masarie, K. A., Krol, M. C., and Peters, W.: The CarbonTracker Data Assimilation Shell (CTDAS) v1.0: implementation and global carbon balance 2001–2015, Geosci. Model Dev., 10, 2785–2800, https://doi.org/10.5194/gmd-10-2785-2017, 2017. a, b
van der Velde, I. R., Krol, M. C., Gatti, L. V., Domingues, L. G., Correia, C. S. C., Miller, J. B., Gloor, M., van Leeuwen, T. T., Kaiser, J. W., Wiedinmyer, C., Basu, S., Clerbaux, C., and Peters, W.: Response of the Amazon carbon balance to the 2010 drought derived with CarbonTracker South America, Global Biogeochem. Cycles, 29, 1092–1108, https://doi.org/10.1002/2014GB005082, 2015. a
van der Werf, G. R., Randerson, J. T., Giglio, L., Collatz, G. J., Kasibhatla, P. S., and Arellano Jr., A. F.: Interannual variability in global biomass burning emissions from 1997 to 2004, Atmos. Chem. Phys., 6, 3423–3441, https://doi.org/10.5194/acp-6-3423-2006, 2006. a
van der Werf, G. R., Randerson, J. T., Giglio, L., van Leeuwen, T. T., Chen, Y., Rogers, B. M., Mu, M., van Marle, M. J. E., Morton, D. C., Collatz, G. J., Yokelson, R. J., and Kasibhatla, P. S.: Global fire emissions estimates during 1997–2016, Earth Syst. Sci. Data, 9, 697–720, https://doi.org/10.5194/essd-9-697-2017, 2017. a, b, c
van Schaik, E., Killaars, L., Smith, N. E., Koren, G., van Beek, L. P. H., Peters, W., and van der Laan-Luijkx I. T.: Changes in surface hydrology, soil moisture and gross primary production in the Amazon during the 2015/2016 El Nino, Philos. T. R. Soc. B, 373, 20180084, https://doi.org/10.1098/rstb.2018.0084, 2018. a
Verheijen, L. M., Aerts, R., Brovkin, V., Cavender-Bares, J., Cornelissen, J. H. C., Kattge, J., and van Bodegom, P. M.: Inclusion of ecologically based trait variation in plant functional types reduces the projected land carbon sink in an earth system model, Glob. Change Biol., 21, 3074–3086, https://doi.org/10.1111/gcb.12871, 2015. a, b
Wang, S., Zhang, Y., Ju, W., Chen, J. M., Ciais, P., Cescatti, A., Sardans, J., Janssens, I. A., Wu, M., Berry, J. A., Campbell, E., Fernández-Martínez, M., Alkama, R., Sitch, S., Friedlingstein, P., Smith, W. K., Yuan, W., He, W., Lombardozzi, D., Kautz, M., Zhu, D., Lienert, S., Kato, E., Poulter, B., Sanders, T. G. M., Krüger, I., Wang, R., Zeng, N., Tian, H., Vuichard, N., Jain, A. K. Wiltshire, A., Haverd, V., Goll, D. S., and Peñuelas, J.: Recent global decline of CO2 fertilization effects on vegetation photosynthesis, Science, 370, 1295–1300, https://doi.org/10.1126/science.abb7772, 2020. a, b
Waring, R. H. and Schlesinger, W. H.: Forest ecosystems: concepts and management, Academic Press, Orlando, Florida, USA, 1985. a
Wenzel, S., Cox, P. M., Eyring, V., and Friedlingstein, P.: Emergent constraints on climate-carbon cycle feedbacks in the CMIP5 Earth system models, J. Geophys. Res.-Biogeo., 119, 794–807, https://doi.org/10.1002/2013JG002591, 2014. a
White, E. D., Rigby, M., Lunt, M. F., Smallman, T. L., Comyn-Platt, E., Manning, A. J., Ganesan, A. L., O'Doherty, S., Stavert, A. R., Stanley, K., Williams, M., Levy, P., Ramonet, M., Forster, G. L., Manning, A. C., and Palmer, P. I.: Quantifying the UK's carbon dioxide flux: an atmospheric inverse modelling approach using a regional measurement network, Atmos. Chem. Phys., 19, 4345–4365, https://doi.org/10.5194/acp-19-4345-2019, 2019. a
Williams, M., Rastetter, E. B., Fernandes, D. N., Goulden, M. L., Shaver, G. R., and Johnson, L. C.: Predicting gross primary productivity in terrestrial ecosystems, Ecol. Appl., 7, 882–894, 1997. a
Yang, H., Ciais, P., Santoro, M., Huang, Y., Li, W., Wang, Y., Bastos, A., Goll, D., Arneth, A., Anthoni, P., Arora, V. K., Friedlingstei, P., Harverd, V., Joetzjer, E., Kautz, M., Lienert, S., Nabel, J. E. M. S., O'Sullivan, M., Sitch, S., Vuichard, N., Wiltshire, A., and Zhu, D.: Comparison of forest above-ground biomass from dynamic global vegetation models with spatially explicit remotely sensed observation-based estimates, Glob. Change Biol., 26, 3997–4012, https://doi.org/10.1111/gcb.15117, 2020. a, b
Yang, Y., Saatchi, S. S., Xu, L., Yu, Y., Choi, S., Phillips, N., Kennedy, R., Keller, M., Knyazikhin, Y., and Myneni, R. B.: Post-drought decline of the Amazon carbon sink, Nat. Commun., 9, 3172, https://doi.org/10.1038/s41467-018-05668-6, 2018. a
Zhang, Y., Song, C., Band, L. E., and Sun, G.: No proportional increase of terrestrial gross carbon sequestration from the greening Earth, J. Geophys. Res.-Biogeo., 124, 2540–2553, https://doi.org/10.1029/2018JG004917, 2019. a
Zhao, Y., Chen, X., Smallman, T. L. Flack-Prain, S., Milodowski, D. T., and Williams, M.: Characterizing the Error and Bias of Remotely Sensed LAI Products: An Example for Tropical and Subtropical Evergreen Forests in South China, Remote Sens.-Basel, 12, 3122, https://doi.org/10.3390/rs12193122, 2020. a
Zhou, S., Liang, J., Lu, X., Li, Q., Jiang, L., Zhang, Y., Schwalm, C. R., Fisher, J. B., Tjiputra, J., Sitch, S., Ahlström, A., Huntzinger, D. N., Huang, Y., Wang, G., and Luo, Y.: Sources of Uncertainty in Modeled Land Carbon Storage within and across Three MIPs: Diagnosis with Three New Techniques, J. Climate, 31, 2833–2851, https://doi.org/10.1175/JCLI-D-17-0357.1, 2018. a, b, c, d
Zhu, Z., Piao, S., Myneni, R. B., Huang, M., Zeng, Z., Canadell, J. G., Ciais, P., Sitch, S., Friedlingstein, P., Arneth, A., Cao, C., Cheng, L., Kato, E., Koven, C., Li, Y., Lian, X., Liu, Y., Liu, R., Mao, J., Pan, Y., Peng, S., Peñuelas, J., Poulter, B., Pugh, T. A. M., Stocker, B. D., Viovy, N., Wang, X., Wang, Y., Xiao, Z., Yang, H., Zaehle, S., and Zeng, N.: Greening of the Earth and its drivers, Nat. Clim. Change, 6, 791–795, https://doi.org/10.1038/nclimate3004, 2016. a, b
Zscheischler, J., Mahecha, M. D., Avitabile, V., Calle, L., Carvalhais, N., Ciais, P., Gans, F., Gruber, N., Hartmann, J., Herold, M., Ichii, K., Jung, M., Landschützer, P., Laruelle, G. G., Lauerwald, R., Papale, D., Peylin, P., Poulter, B., Ray, D., Regnier, P., Rödenbeck, C., Roman-Cuesta, R. M., Schwalm, C., Tramontana, G., Tyukavina, A., Valentini, R., van der Werf, G., West, T. O., Wolf, J. E., and Reichstein, M.: Reviews and syntheses: An empirical spatiotemporal description of the global surface–atmosphere carbon fluxes: opportunities and data limitations, Biogeosciences, 14, 3685–3703, https://doi.org/10.5194/bg-14-3685-2017, 2017. a