the Creative Commons Attribution 4.0 License.
the Creative Commons Attribution 4.0 License.
 | 09 Nov 2021
Climate change impacts on solar power generation and its spatial variability in Europe based on CMIP6
Martin Wild
Doris Folini
Stelios Kazadzis
Jan Wohland
Solar photovoltaics (PV) plays an essential role in decarbonizing the European energy system. However, climate change affects surface solar radiation and will therefore directly influence future PV power generation. We use scenarios from Phase 6 of the Coupled Model Intercomparison Project (CMIP6) for a mitigation (SSP1-2.6) and a fossil-fuel-dependent (SSP5-8.5) pathway in order to quantify climate risk for solar PV in Europe as simulated by the Global Solar Energy Estimator (GSEE). We find that PV potential increases by around 5 % in the mitigation scenario, suggesting a positive feedback loop between climate change mitigation and PV potential. While increased clear-sky radiation and reduced cloud cover go hand in hand in SSP1-2.6, the effect of a decrease in clear-sky radiation is outweighed by a decrease in cloud cover in SSP5-8.5, resulting in an increase in all-sky radiation. Moreover, we find that the seasonal cycle of PV generation changes in most places, as generation grows more strongly in winter than in summer (SSP1-2.6) or increases in summer and declines in winter (SSP5-8.5). We further analyze climate change impacts on the spatial variability of PV power generation. Similar to the effects anticipated for wind energy, we report an increase in the spatial correlations of daily PV production with large inter-model agreement yet relatively small amplitude, implying that PV power balancing between different regions in continental Europe will become more difficult in the future. Thus, based on the most recent climate simulations, this research supports the notion that climate change will only marginally impact renewable energy potential, while changes in the spatiotemporal generation structure are to be expected and should be included in power system design.
- Article
(8685 KB) - Full-text XML
- BibTeX
- EndNote


To combat climate change, humankind has to drastically reduce carbon emissions in the coming decades (IPCC, 2013). Solar photovoltaics (PV) are a key technology to achieve this goal because the potential of PV exceeds current electricity demand (Tröndle et al., 2019) and its costs have plummeted over the last few years (Creutzig et al., 2017; IRENA, 2019). As of today, the global installed PV capacity amounts to 580 GW, reflecting a 20-fold increase since 2010, as reported by the International Renewable Energy Agency (IRENA 2020). Within less than 3 decades, the European Union (EU) wants to achieve net carbon neutrality (EU, 2019). This ambitious timeline implies the accelerated deployment of renewable generation technology, dominantly wind and solar power. In the short run, by 2030, the EU aims at about 30 % renewables in energy consumption.
Power generation from sunlight is weather dependent and, thus, fluctuates in space and time (e.g., Bloomfield et al., 2021; van der Wiel et al., 2019; Craig et al., 2019; Ravestein et al., 2018). In a power system, these fluctuations can be mainly mitigated through (a) large-scale interconnection that averages spatially over different weather conditions (e.g., Rodriguez et al., 2014; Grams et al., 2017), (b) electricity storage that averages temporally over different weather conditions (e.g., Kittner et al., 2017), and (c) optimized portfolios that exploit synergies between different types of generation (e.g., Heide et al., 2010). Weather and climate variability govern the extent to which these options can be successful – now and in the future. Future PV power generation, in particular, is linked to atmospheric parameters that affect surface solar radiation such as cloud coverage and optical thickness, aerosols, and water vapor.
Earlier studies investigated the impacts of climate change on surface radiation and PV power production under different climate scenarios, generally finding limited magnitudes of change in solar potential (Wild et al., 2015; Jerez et al., 2015; Panagea et al., 2014; Gaetani et al., 2014; Crook et al., 2011). These assessments were mostly based on data from the Climate Modeling Intercomparison Project Phase 5 (CMIP5; Taylor et al., 2012), where the global climate is simulated with general circulation models (GCMs), or the Coordinated Downscaling Experiment (EURO-CORDEX; Jacob et al., 2020), where GCM output is dynamically downscaled to capture the synoptic atmospheric circulation features of a certain region.
However, recent evidence suggests that most EURO-CORDEX models are poorly suited to investigate surface solar radiation because aerosols were kept constant in most of the regional climate models used for the downscaling (Gutié rrez et al., 2020; Bartok et al., 2017). Therefore, some earlier studies based on regional climate models have to be interpreted with caution. Moreover, most studies focus on long-term averages of power generation and neglect changes in the spatiotemporal structure of PV generation. However, ignoring changes in the spatiotemporal structure induces a risk in power system design. For instance, climate change could compromise the effectiveness of international transmission to smooth renewable generation variability. Wohland et al. (2017) reported that wind power generation will become more uniform over Europe; thus, more countries will experience below-average wind generation at the same time, thereby reducing the potential for smooth generation variability by spatial integration. It remains to be evaluated whether similar effects exist for solar PV.
Therefore, this study has the following two goals:
First, we test the robustness of earlier results by evaluating changes in surface solar radiation and PV potentials in Europe based on Phase 6 of the Coupled Model Intercomparison Project (CMIP6; Eyring et al., 2016). To this end, we use projections from 28 CMIP6 models to account for model uncertainty and consider pathways at the upper (SSP1-2.6) and lower (SSP5-8.5) ends of mitigation ambition in order to cover the range of different potential futures.
Second, to assess the risks for the power system that stem from changes in the spatiotemporal structure of PV generation, we analyze climate change impacts beyond the long-term mean. In particular, we quantify changes in the spatial correlations of PV power generation over the continent and analyze balancing potentials between different focus regions in continental Europe.
2.1 CMIP6 data
We use the output from 28 CMIP6 models at a daily and monthly resolution (see Table 1). In the assessment of the climate variables, we use conservatively remapped monthly data aligned with the lowest model resolution of . By contrast, to account for the nonlinear dependency of PV generation on climatic inputs, we run the PV model with daily data in the finer original spatial resolution. Thus, PV generation is calculated on a different grid for each climate model. To ease inter-model comparison, the PV generation is subsequently remapped onto the uniform grid. Unless otherwise stated, we selected the r1 ensemble member from each model, where there might be multiple members available.
To evaluate the operating conditions of solar PV, we analyzed four climate variables: surface downwelling shortwave radiation under all-sky conditions (rsds), surface temperature (tas), surface downwelling shortwave radiation under clear-sky conditions (rsdscs), and total cloud fraction (clt). Surface downwelling radiation is the fuel of a solar cell, and the surface temperature influences the panel efficiency. Clear-sky radiation and cloud fraction allow one to contextualize changes in all-sky radiation. All-sky radiation is affected by cloud cover and atmospheric composition (e.g., aerosol load), whereas the clear-sky component only considers changes due to atmospheric composition and assumes cloud-free conditions.
We analyze two climate change scenarios: two Shared Socioeconomic Pathways (SSPs) representing the low (SSP1-2.6) and high (SSP5-8.5) ends of the range of the mitigation challenges (O'Neill et al., 2016). SSP1 envisions sustainable development and stringent climate change mitigation, whereas SSP5 assumes continued heavy reliance on fossil fuels. The associated numbers 2.6 and 8.5 indicate the radiative forcing (in W m−2) by the year 2100 compared with the preindustrial period from 1850 to 1900 according to the United Nations Framework Convention on Climate Change (UNFCCC, 2015). Broadly speaking, SSP1-2.6 is the successor of the Representative Concentration Pathway 2.6 (RCP2.6), whereas SSP5-8.5 replaces RCP8.5. We compare the climate variables' multi-model mean for the 2081–2100 period with the reference historical time span from 1995 to 2014. We measure the inter-model agreement by the number of models showing the same sign of change and consider the agreement to be high if more than 75 % agree.
Table 1CMIP6 models used in this study, showing the institution, model acronym, and horizontal grid resolution (number of grid points). Output from these 28 models is available at a monthly and daily resolution.
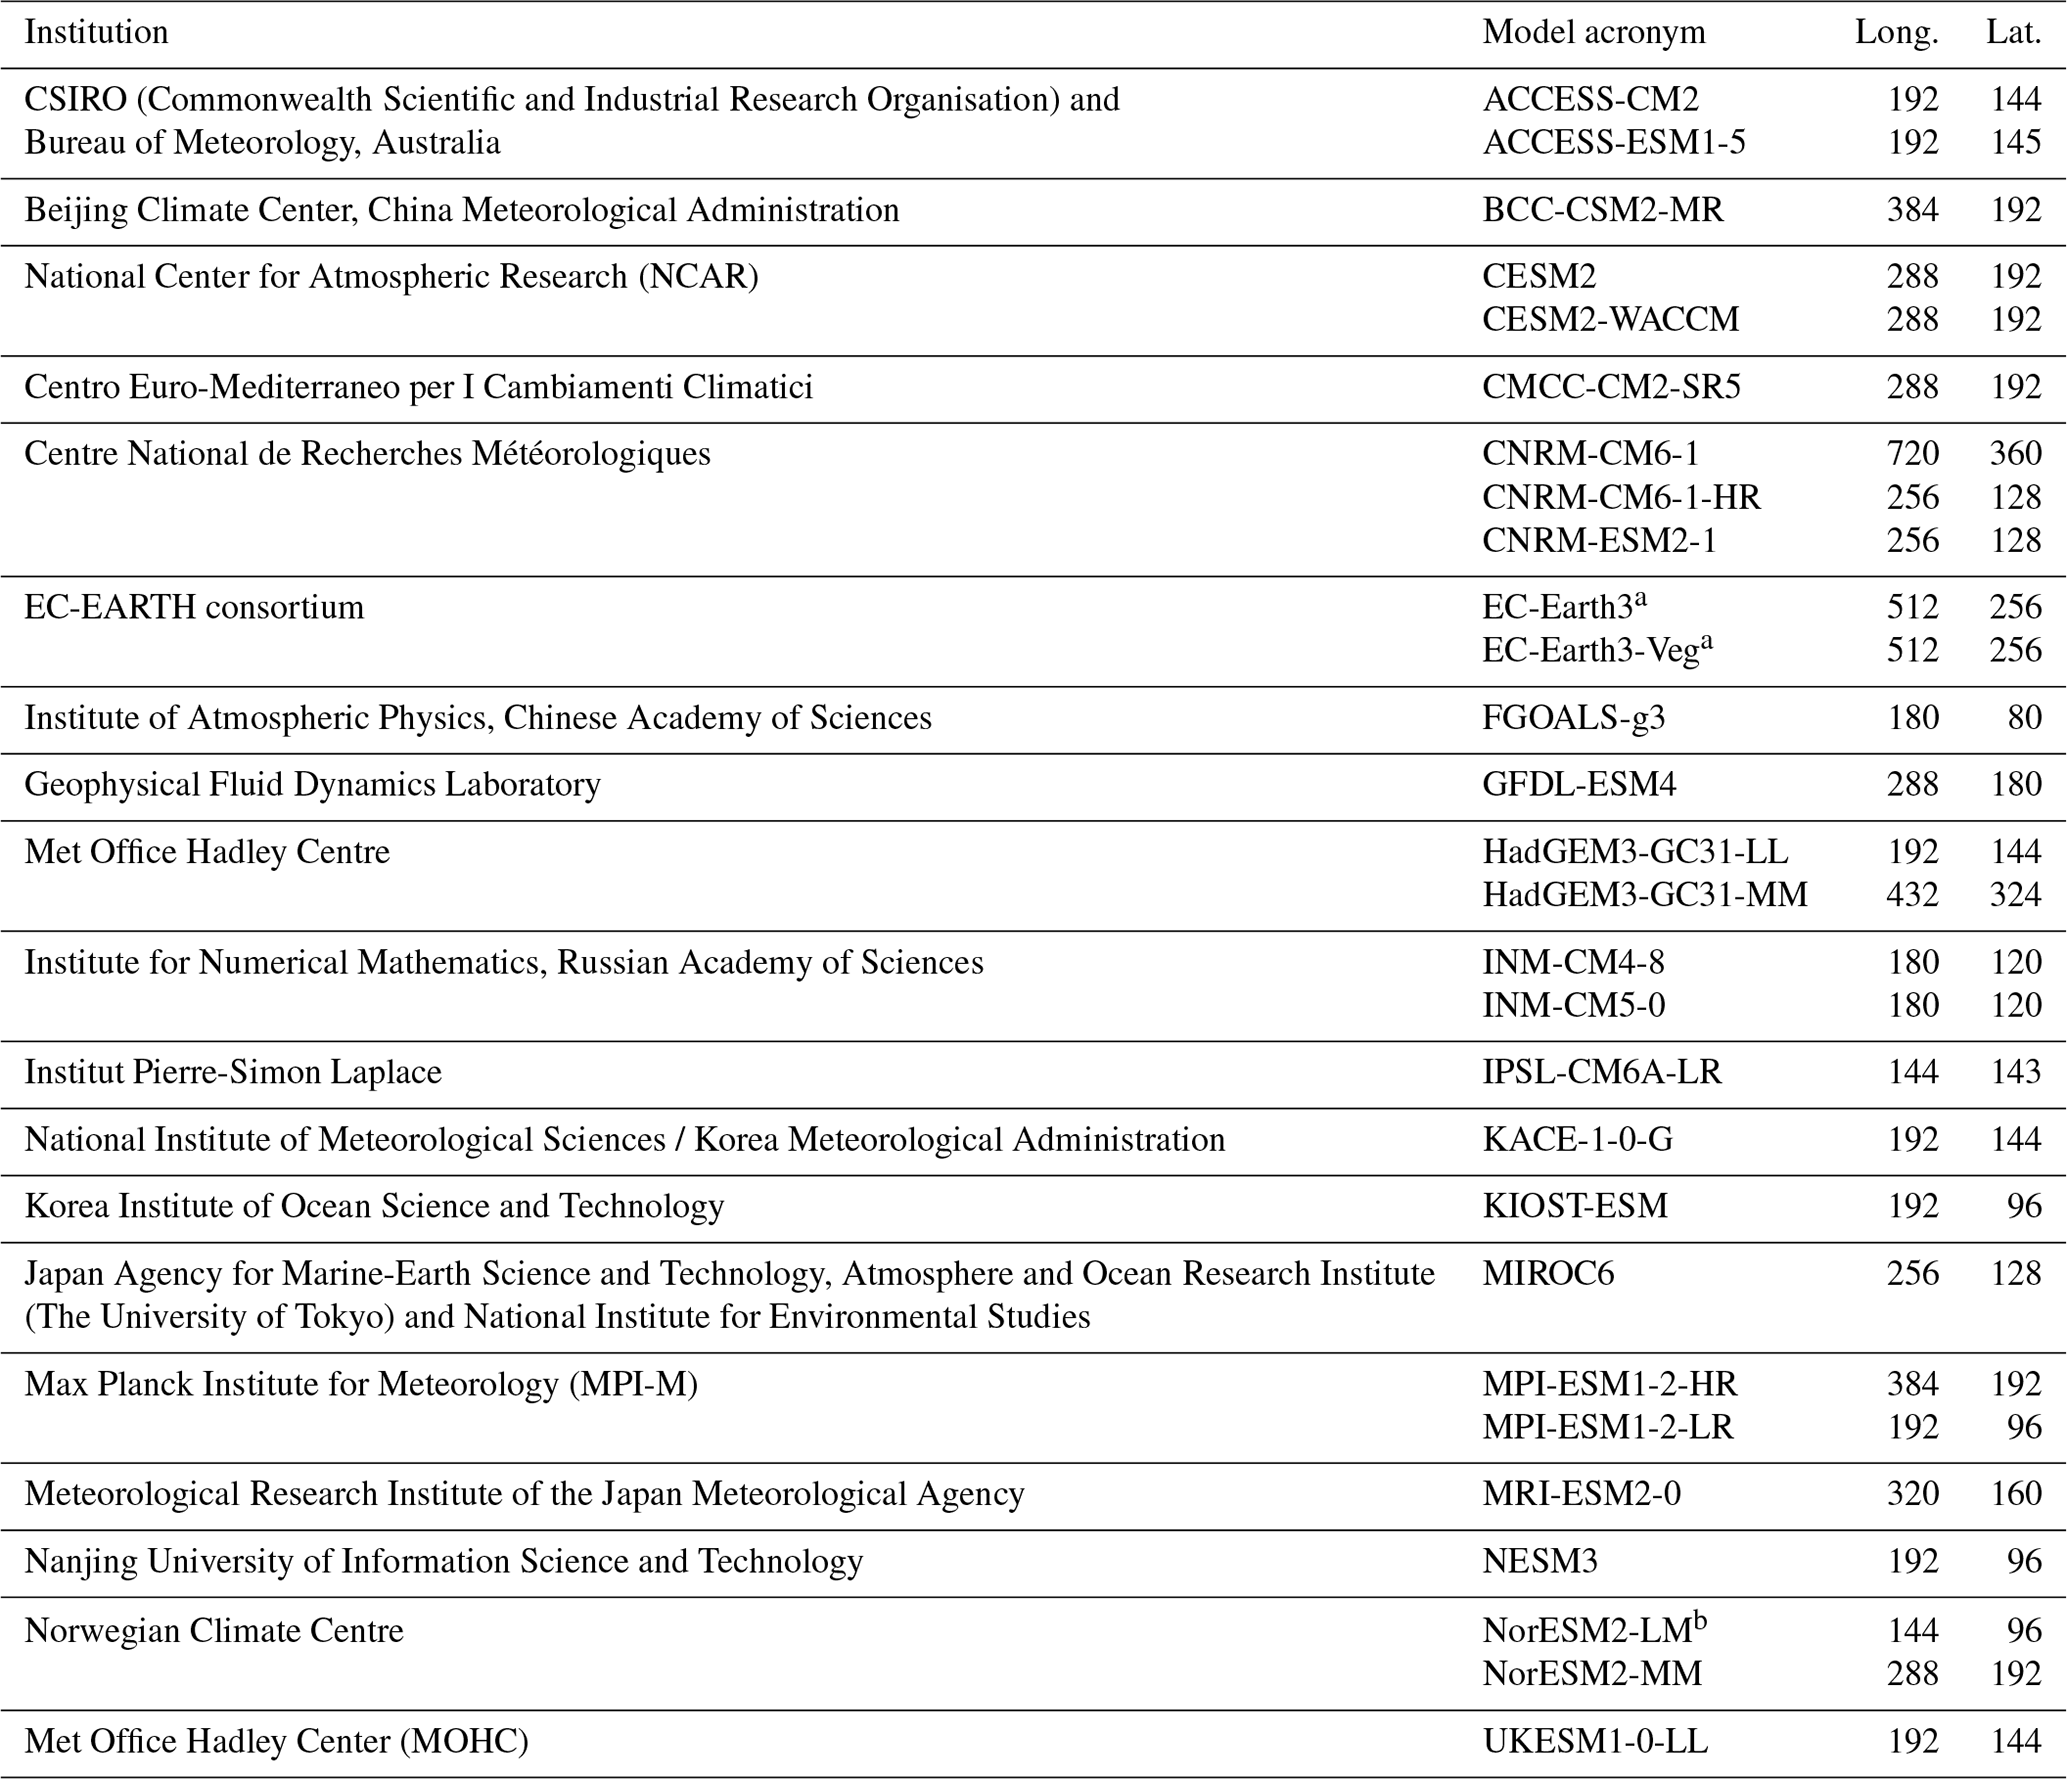
a The model does not provide clear-sky surface downwelling shortwave radiation (rsdscs).b The model does not provide cloud fraction (clt) in SSP5-8.5.
2.2 Modeling solar photovoltaics
Based on the aforementioned climate variables, we calculate solar power generation using the Global Solar Energy Estimator (GSEE; Pfenninger and Staffell, 2016). GSEE allows us to simulate PV electricity production of a solar panel on annual to hourly intervals, particularly also accounting for panel orientation (Müller et al., 2019). Pfenninger and Staffell (2016) used meteorological reanalyses and satellite datasets as input and validated the GSEE through bias correction by matching the simulations to the mean bias in individual sites' time series, which were provided by transmission network operators in Europe. Here, we use the highest temporal CMIP6 output resolution (daily data) to also capture changes in the distributions and spatial correlations of daily PV production. This approach particularly reflects the nonlinear relation between climatic inputs and GSEE-derived PV generation.
For the calculations, we adopt the prevailing PV technology using crystalline silicon (IRENA, 2019). Inputs to GSEE include total horizontal irradiance (the sum of direct and diffuse radiation, here rsds from CMIP6), the fraction of diffuse irradiance from total horizontal irradiance (using the Boland–Ridley–Lauret model in Ridley et al., 2010; predefined in the GSEE software module), the ambient temperature (tas from CMIP6), and panel-specific parameters (grid coordinates, tilt and azimuth angle, peak generation capacity, and panel tracking mode). We compute the optimal tilt angle in degrees for each latitude using linear regression after Jacobson and Jadhav (2018) and use an azimuth angle of 180∘ (facing south towards the Equator). A capacity of 1 kW per grid cell is used with fixed panels (no sun-tracking). The effects of wind speed changes on panel efficiency are neglected due to their small magnitude and pronounced uncertainty of wind speeds at the panel location, which are strongly controlled by local effects.
The focus on Europe translates into a rectangular geo-grid extended from 35 to 75∘ N and from 10∘ W to 30∘ E. The PV output data from the GSEE are remapped to a spatial lat × long resolution of 2.5∘ × 2.5∘ using the first-order conservative remapping, leading to a common grid of 16 × 16 cells.
2.3 Seasonal analysis approach
We analyze summer (June, July, and August) and winter (December, January, and February) changes separately to investigate potential impacts on the seasonal cycle and to highlight intra-annual variations that could be masked in annual means. Both wind and solar generation follow strong seasonal cycles in Europe and have their maximum generation in different parts of the year: PV peaks in summer, whereas wind power peaks in autumn. The evolution of the seasonal cycle is of high practical relevance, as combining wind and solar power allows for the smoothing of generation variability throughout the year (Heide et al., 2010). Thus, optimal shares of wind and solar power would change if the seasonal cycle of generation changed.
When investigating correlation changes in PV production, we remove the seasonal cycle over the reference period (1995–2004) by subtracting the 20-year daily mean and dividing by the 20-year daily standard deviation:
For instance, deseasonalized PV production on 1 February 2085 is computed as PV generation on that day minus mean PV production on 1 February from 1995 to 2014, divided by the standard deviation on 1 February throughout the reference 20 years. This procedure delivers the excess or deficit in daily PV production from its long-term average during the reference period and captures changes in the seasonal cycle.
2.4 Spatial correlation methodology
We conduct a correlation analysis on daily PV generation from two different 20-year periods (1995–2014 from the historical CMIP6 simulations, and 2081–2100 from the SSP1-2.6 and SSP5-8.5 scenarios, respectively), following the approach in Wohland et al. (2017), in order to identify changes in the spatial PV generation patterns. For each CMIP6 model, we compute a matrix of correlations, with each matrix entry corresponding to one of the 16 × 16 grid boxes covering Europe. Each grid point (matrix entry) is assigned the average Pearson correlation coefficient between itself and all other grid points. If this value is high, the grid point is – on average – highly correlated with all other grid boxes in the domain. If it is close to zero, the grid point is – on average – largely uncorrelated with the other grid boxes. This approach yields one correlation matrix of the 16 × 16 dimensions for each of the three 20-year periods.
We characterize the long-term changes in spatial variability by correlation changes between 2081–2100 and 1995–2014:
where CorrSSPi stands for the correlation matrix in the SSP1-2.6 and SSP5-8.5 scenarios, respectively, and Corrhis denotes the historical run. Finally, we iterate the procedure for each model and compute the multi-model mean of ΔCorrSSPi from all 28 models.
2.5 Case studies
While the correlation analysis enables the comparison of continental-scale changes, it fails to capture smaller-scale features due to the averaging procedure. To overcome this limitation, we investigate three case studies, namely the Iberian (35–42.5∘ N, 10–0∘ W) and the Balkan (35–42.5∘ N, 0∘ W–30∘ E) peninsulas as well as central Europe (45–50∘ N, 5–15∘ E), by lat–long boxes. The atmospheric conditions over these regions are subject to the general atmospheric circulation patterns over the European continent, but the areas are also far enough away to concurrently experience different weather conditions. Central Europe has a high share of the electricity load in the European continent (Wohland et al., 2017). Located in southern Europe, Iberia and the Balkans are rich in solar resources and possess a high potential for PV electricity production. They are also connected within the European power grid network, providing high potential for energy balancing. We aggregate daily PV generation over the respective area and then compute correlations between deseasonalized daily time series (see Sect. 2.3) from the different areas to examine their mutual power generation balancing potential.
In this section, we first calculate the projected changes in four climate variables: all-sky radiation (rsds), as the key parameter governing PV production; clear-sky radiation (rsdscs) and cloud fraction (clt), to differentiate between clouds and other factors affecting rsds; and surface temperature (tas), to illustrate future warming in Europe as another parameter affecting PV production (Sect. 3.1). We show that changes in all-sky radiation and their underlying causes in terms of cloud fraction and clear-sky radiation depend on the scenario (SSP1-2.6 or SSP5-8.5) and the season (summer or winter). Next, we proceed to implied changes in PV production in absolute (W h d−1) and relative (%) terms (Sect. 3.2). Finally, we turn from mean power production to spatiotemporal balancing of PV power production. Looking at spatial correlations of daily PV power production under present-day and future projections, we find that the balancing potential among European regions tends to decrease in the future (Sect. 3.3). Associated findings for SSP5-8.5 are observed to be largely in line with corresponding studies based on RCP8.5 from CMIP5 (Müller et al., 2019). For SSP1-2.6, we find qualitatively different results that, to our knowledge, are original and have no CMIP5 counterpart in the literature.
3.1 Projected climate changes
In the annual mean, Europe is projected to become warmer and have higher all-sky radiation available in both scenarios (see Figs. 1, 2). Exceptions are Iceland and parts of Scandinavia, but the model agreement there is lower. In line with expectations, temperatures rise in both climate change scenarios, and the increase is nearly twice as strong in SSP5-8.5 as in SSP1-2.6. All-sky radiation also increases in the two scenarios. In SSP1-2.6, a decrease of up to 4 % in cloud cover and an increase in clear-sky radiation (fewer aerosols) jointly contribute to the increase of 5–10 W m−2 in all-sky radiation (Fig. 1). In contrast, the increase in SSP5-8.5 all-sky radiation results from a decrease of up to 10 % in cloud cover, despite a decrease of 3–5 W m−2 in clear-sky radiation (Fig. 2). We attribute this discrepancy in the evolution of clear-sky radiation to competing effects from future warming, associated changes in atmospheric water vapor, and projected future aerosol emissions in SSP1-2.6 and SSP5-8.5. The stronger warming in SSP5-8.5 results in a higher atmospheric water vapor content and, thus, stronger shortwave absorption and decreased (clear-sky) radiation. Future anthropogenic aerosol emissions are projected to decrease in both scenarios, implying an increase in clear-sky radiation, but the projected decrease occurs earlier and is stronger under SSP1-2.6 (Gidden et al., 2019). In SSP1-2.6, the strong reduction in aerosols dominates over the weak increase in water vapor, resulting in an overall increase in clear-sky radiation, whereas for SSP5-8.5, the strong warming and increase in water vapor dominate.
The seasonal breakdown reveals different evolution in summer and winter. In summer, the patterns for all four variables and both scenarios strongly resemble the annual means. In winter, however, the pattern of all-sky radiation changes in SSP5-8.5 is qualitatively different, with decreasing radiation in most of Europe except around the Mediterranean. There is a major increase of up to 10 W m−2 in southern Europe, but all-sky radiation mainly decreases northwards. Examining clear-sky radiation and cloud cover again separately suggests that the latter plays a key role in the qualitatively different winter pattern, although the model agreement is limited.
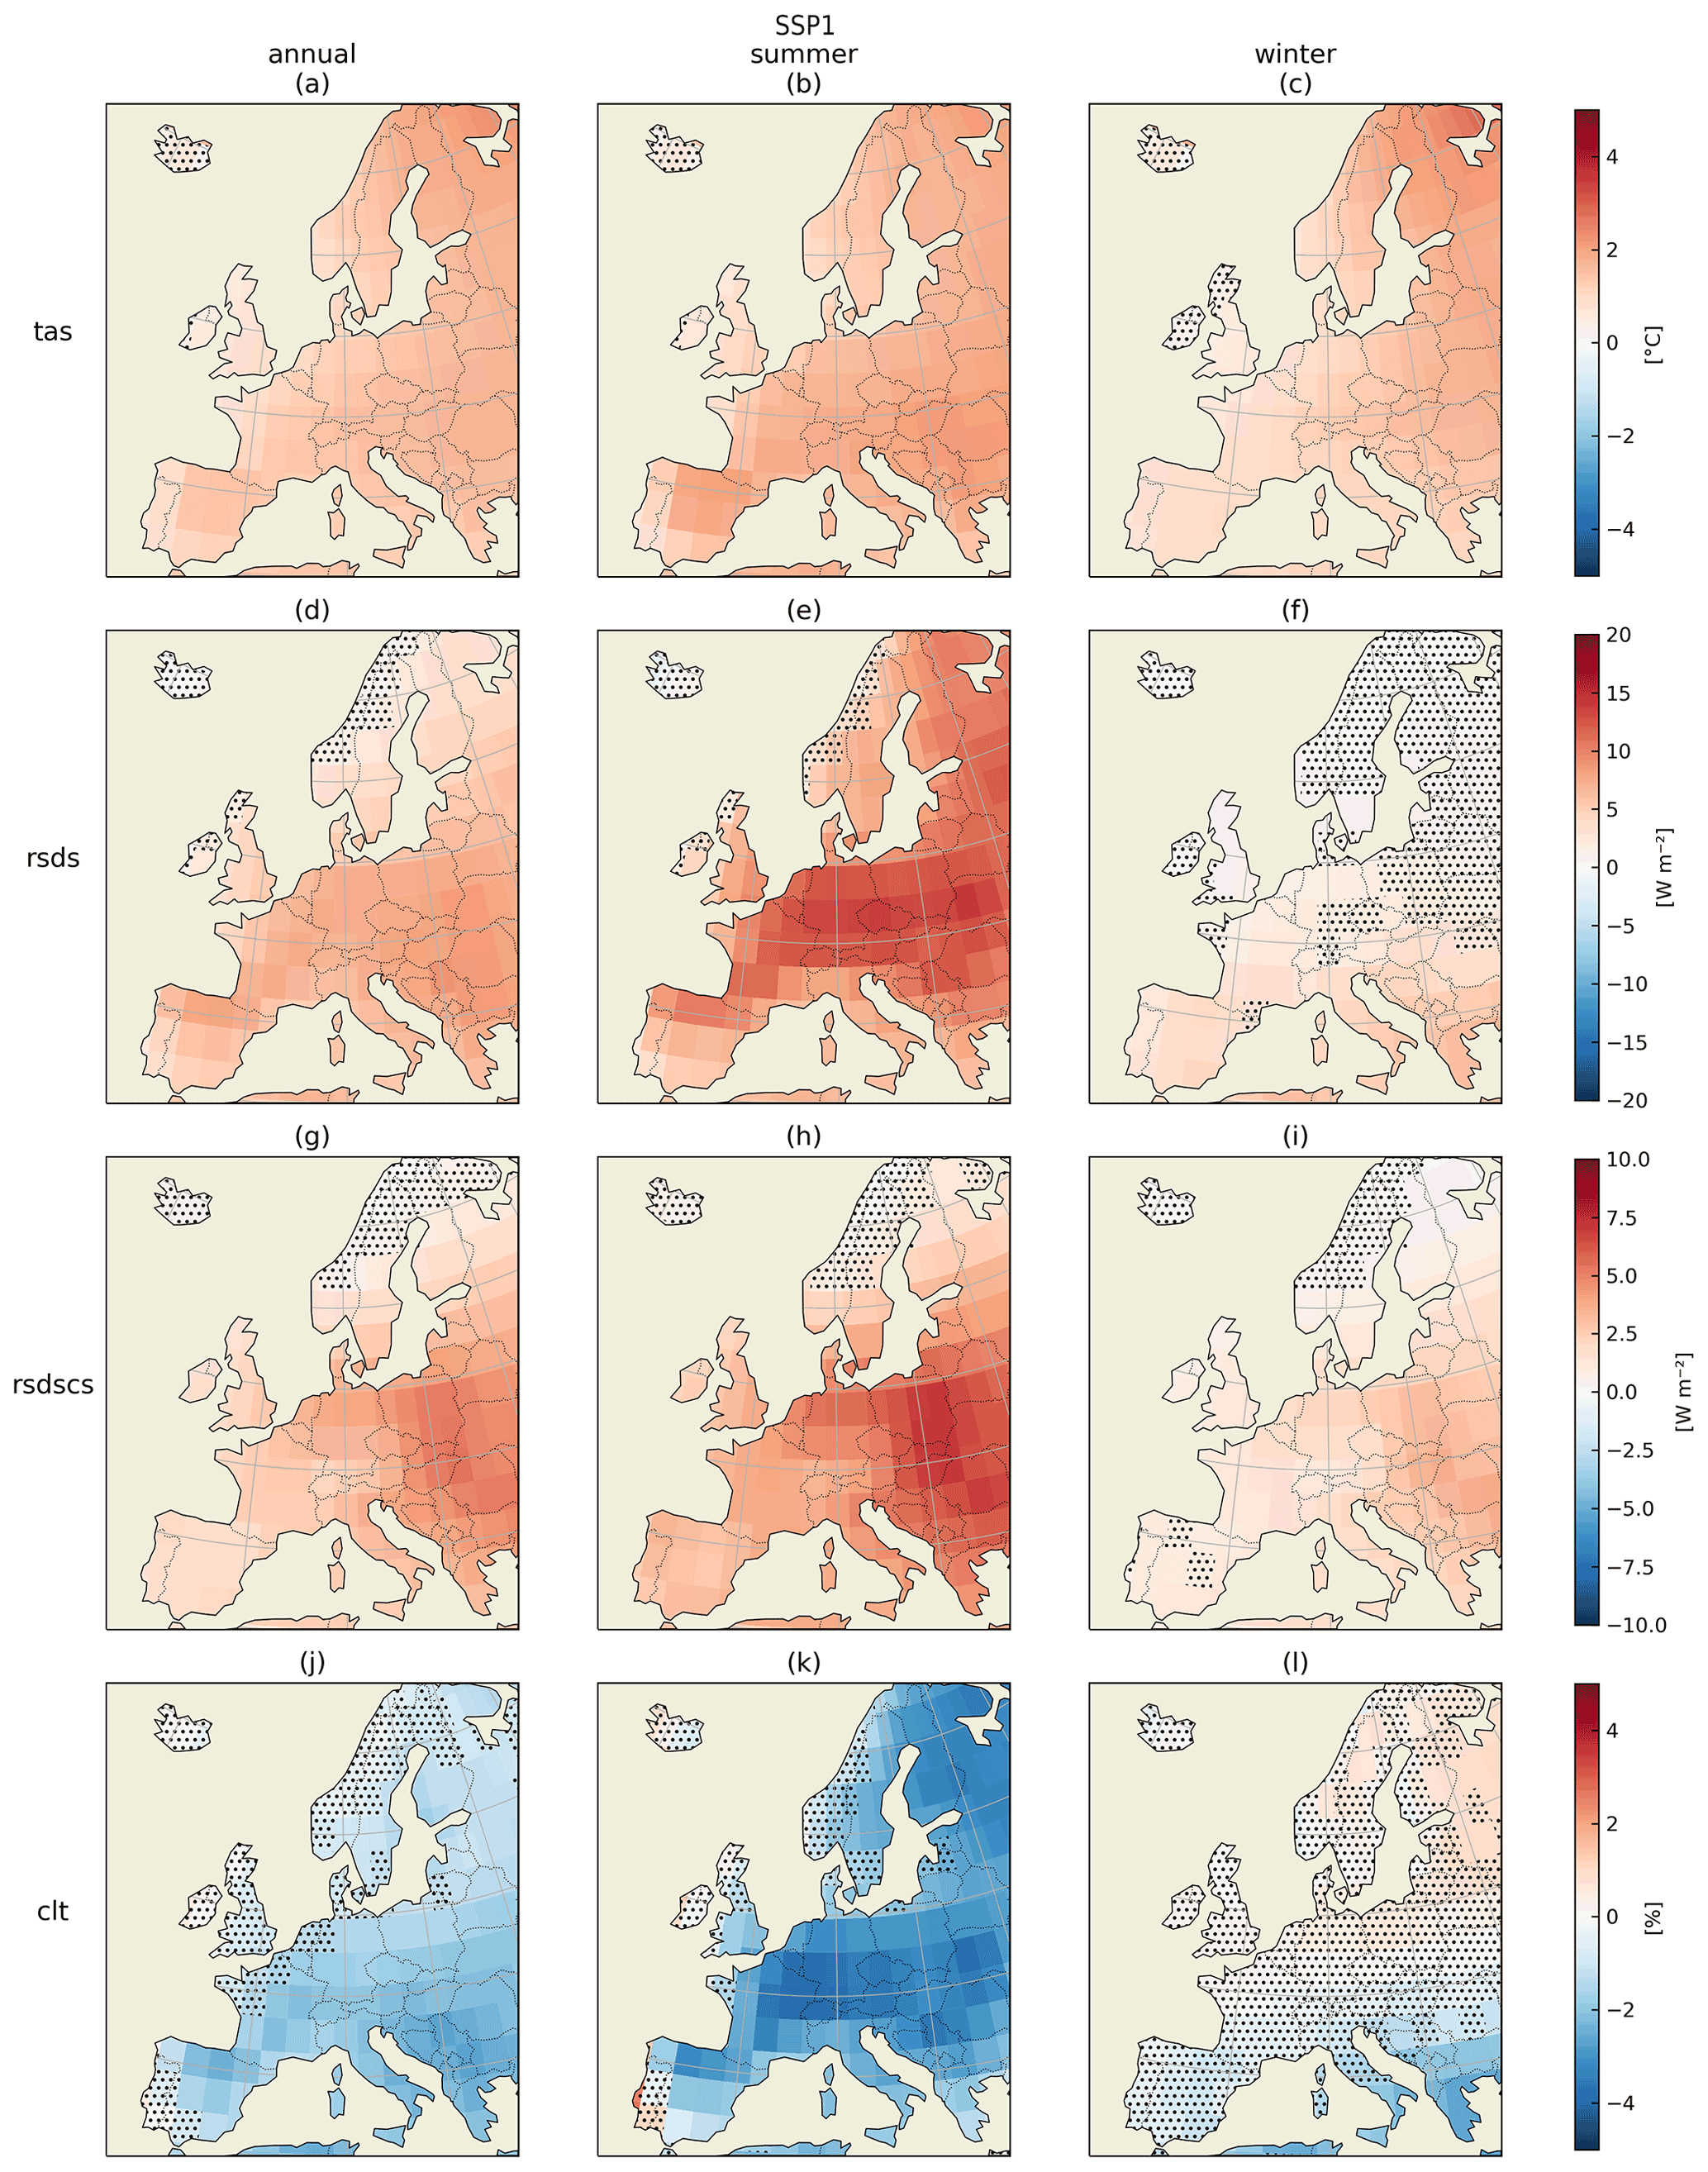
Figure 1Change in climate variables relevant for PV production in SSP1-2.6. Maps show differences between 2081–2100 and 1995–2014 in the multi-model mean, calculated as future minus reference. Each row shows one variable, and each column refers to one period of interest. The variables are shown in the rows, in descending order, as follows: (a)–(c) temperature above surface (tas), (d)–(f) surface downward solar radiation (rsds), (g)–(i) surface downward clear-sky solar radiation (rsdscs), and (j)–(l) total cloud fraction (clt). The left column depicts the mean over the entire year, whereas summer (June, July, and August) and winter (December, January, and February) are displayed in the other two respective columns. The same variables share color bars with the same limits. The dots signify less than 75 % model agreement in the sign of the projected changes.
In summer, we observe slightly stronger warming than in winter in both SSP scenarios. For SSP5-8.5, the temperature increases in northern regions are higher than in the south in winter, whereas the reverse is true in summer. The summer increase in all-sky radiation is more pronounced in SSP5-8.5 than in SSP1-2.6. For SSP5-8.5, summer cloud fraction changes reach > 10 % decreases, resulting in increases of up to 25 W m−2 in all-sky radiation, while clear-sky radiation changes are in the order of 0 to −5 W m−2.
In addition to the opposite sign of changes in clear-sky radiation, the model agreement also varies greatly for each scenario. While the model agreement with respect to clear-sky radiation is high in SSP1-2.6, fewer models agree on the sign of changes in SSP5-8.5. The low agreement affects eastern Europe in summer and the majority of the continent in winter. In SSP5-8.5, the disagreement in the winter cloud fraction is mainly in central and northern Europe, as well as in northwestern Iberia.
The evolution of cloud cover is remarkably similar in all scenarios. A large-scale decline in the order of 5 % occurs in summer in both scenarios and causes a negative change in the annual mean. The annual mean, however, is weaker and less robust due to the mostly uncertain and weak changes in winter. Given the strong seasonality of radiation, the summer decline in cloud cover is of greater relevance for mean PV generation than the winter increase.
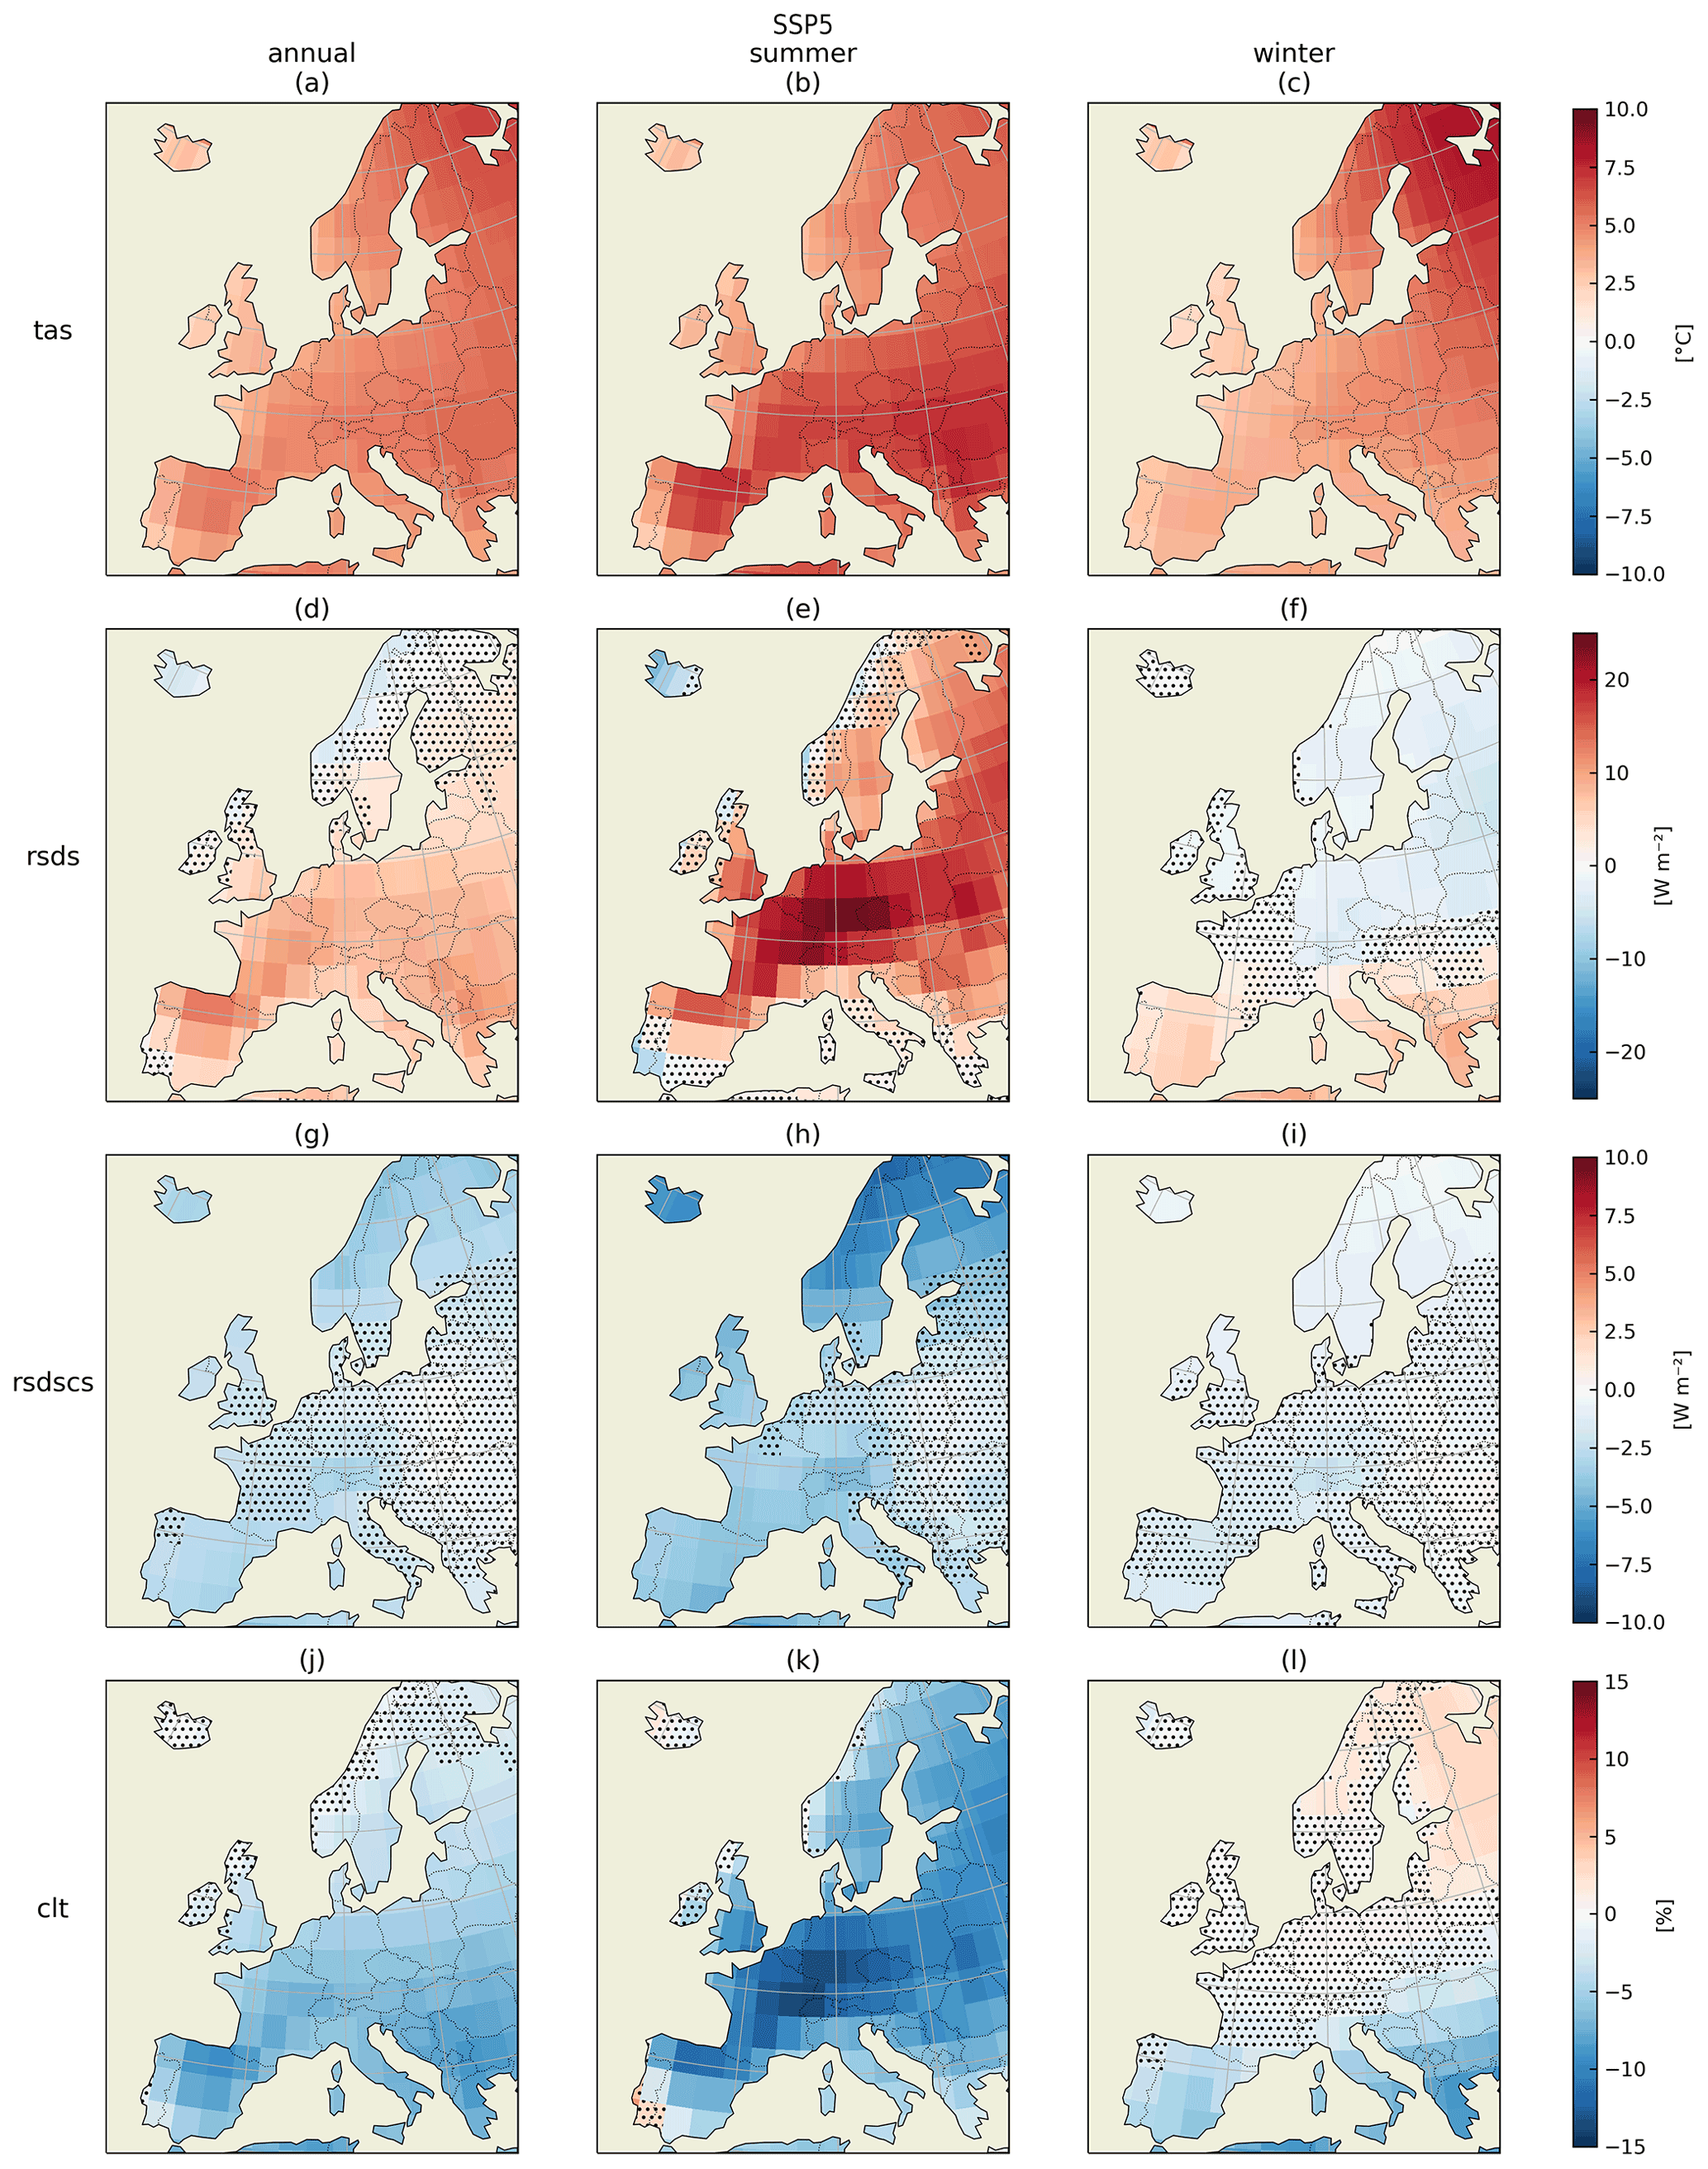
Figure 2Change in climate variables relevant for PV production in SSP5-8.5. The figure is structured in the same way as Fig. 1.
3.2 Simulated PV electricity production
We now report projected changes for PV power generation. Figures 3 and 4 show the multi-model mean absolute change and relative change in PV electricity projection from the historical period to the SSP1-2.6 and SSP5-8.5 scenarios, respectively. The overall absolute and relative change patterns in PV electricity production are similar within their scenario and closely follow the patterns of change in all-sky radiation (panels d–f in Figs. 1 and 2), as expected. The changes in both seasons vary with latitude in both SSP scenarios.
For SSP1-2.6, positive changes in PV yields dominate in continental Europe (Fig. 1). Prominent absolute changes in summer include a strong increase in central Europe, while the Mediterranean region features only a slight increase. The latitudinal pattern is qualitatively reversed in winter, with the strongest overall increase in PV electricity generation around the Mediterranean. In particular, there is a substantial increase in the Apennine and Balkan peninsulas in winter, whereas the signal is much weaker west- and northwards. Furthermore, negative changes of small absolute magnitude and with low model agreement occur in northern Scandinavia.
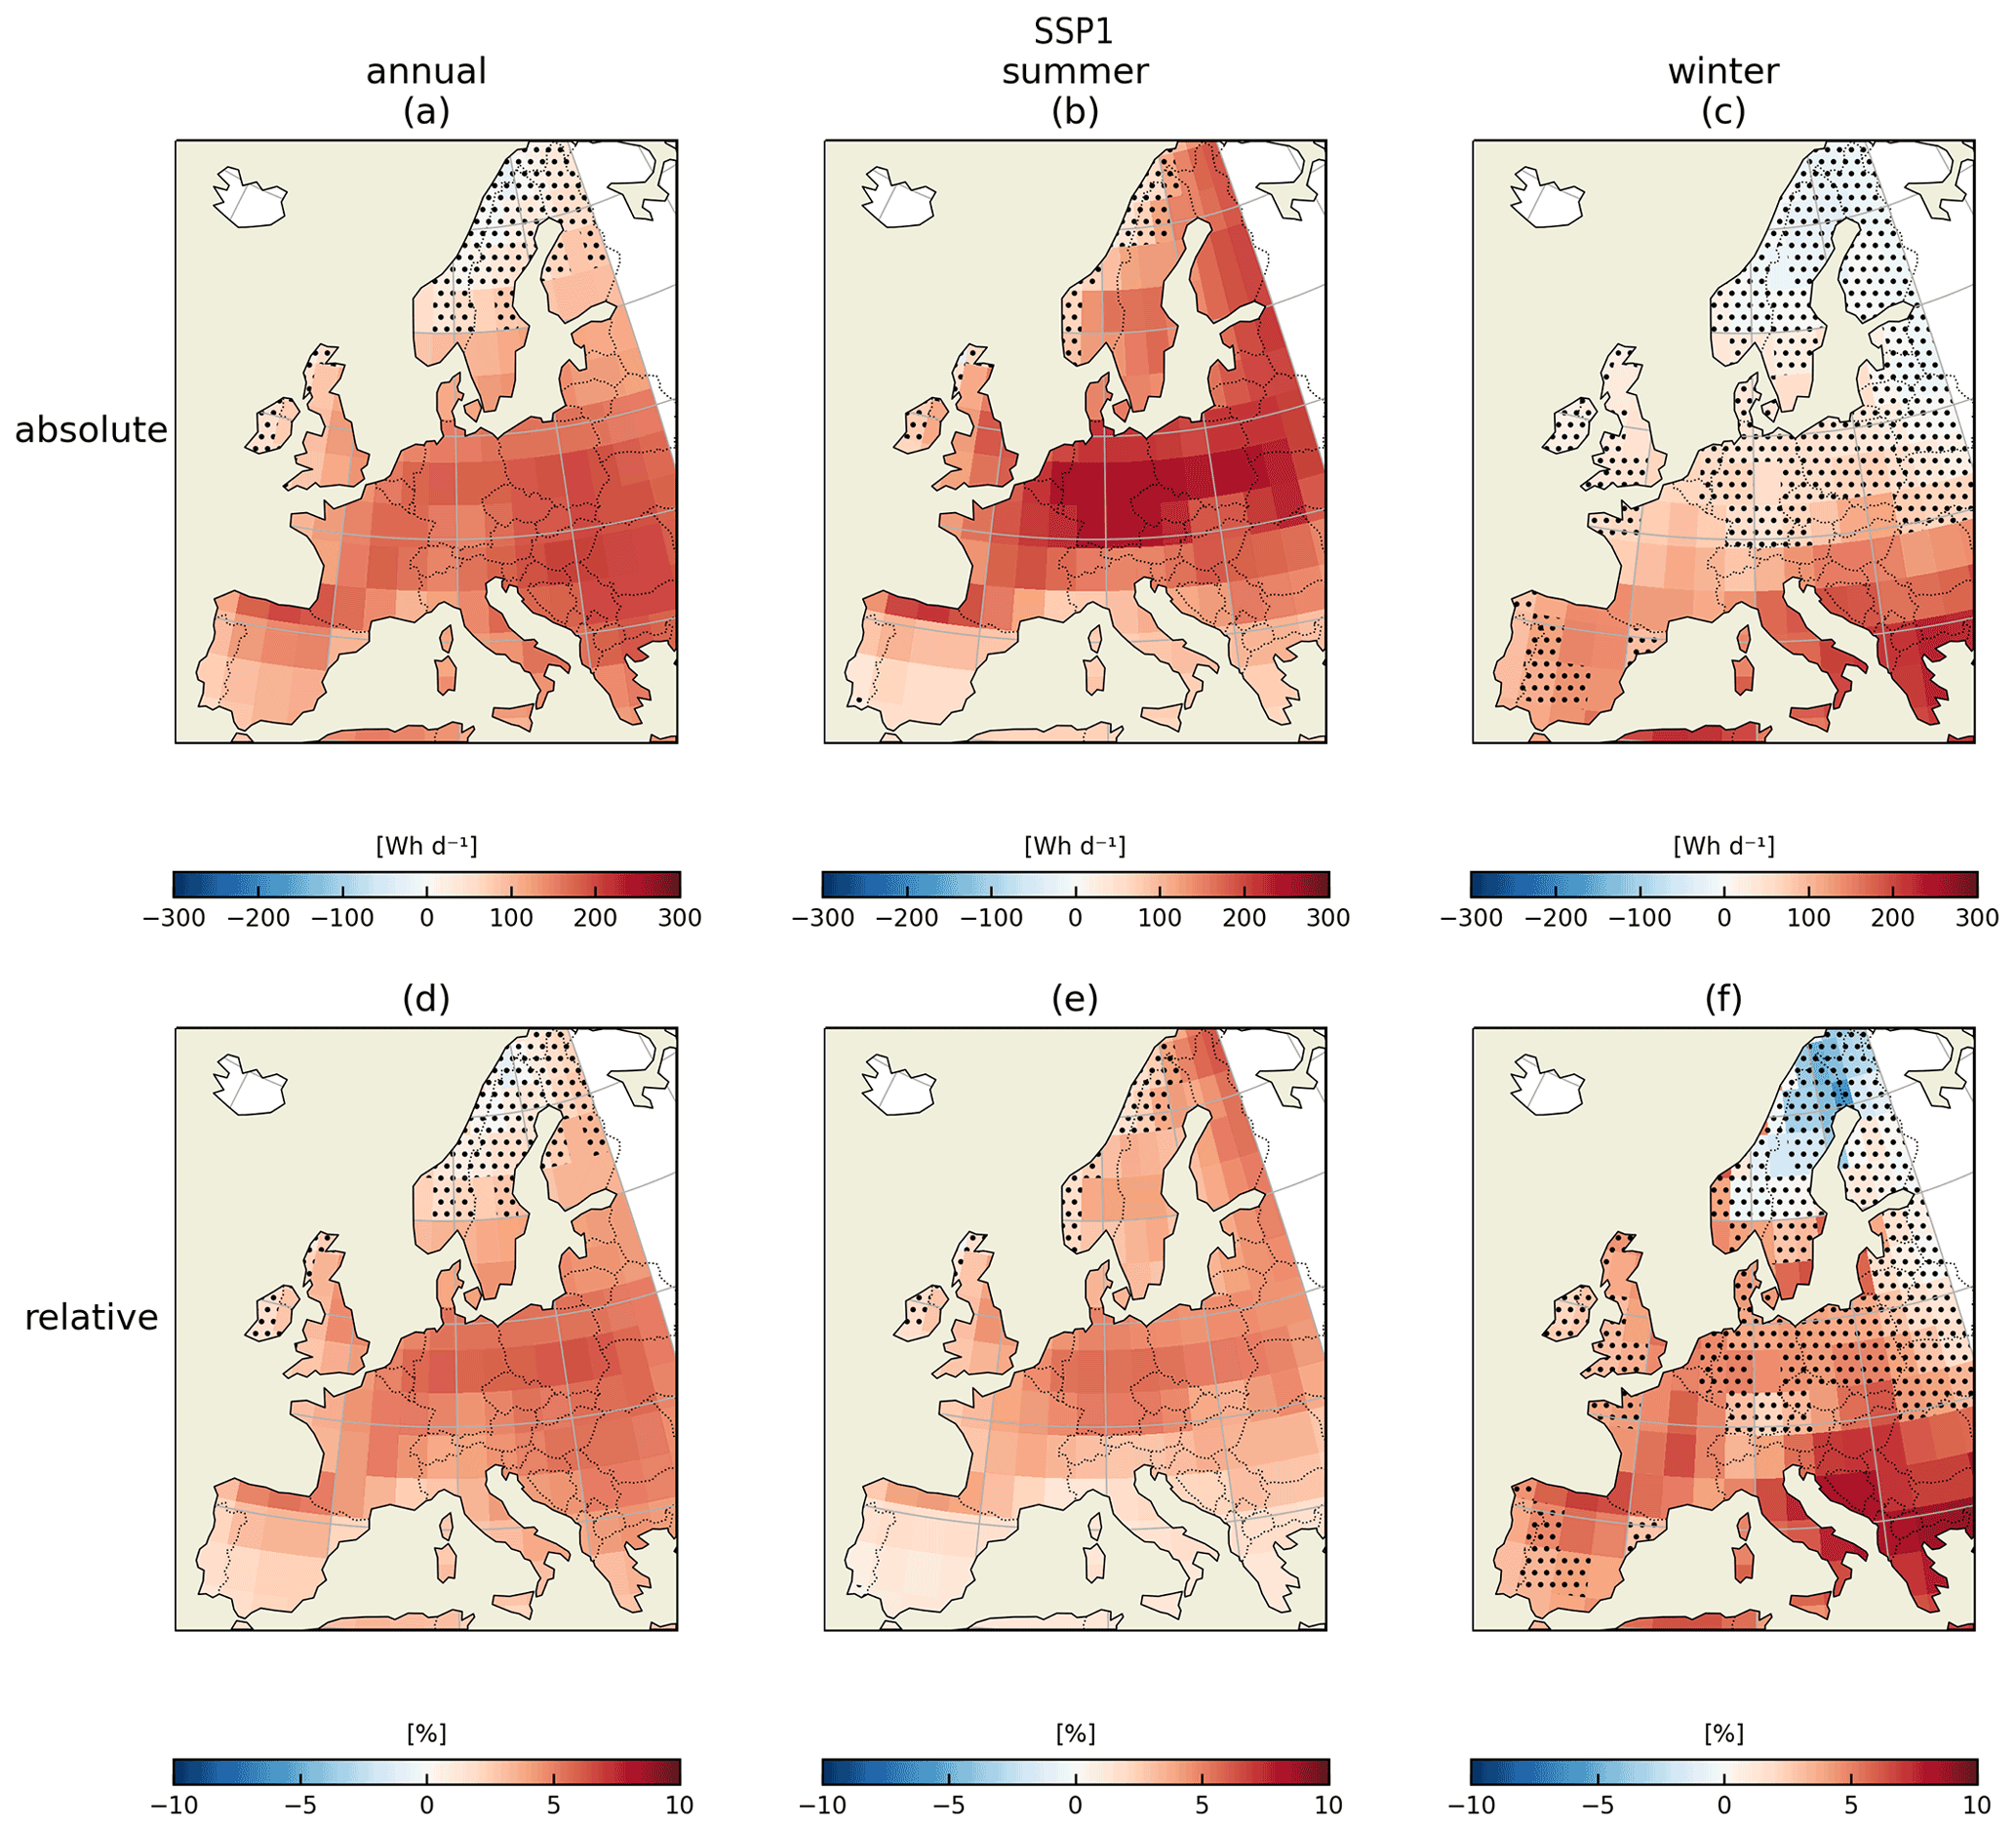
Figure 3Impacts of climate change on PV generation in SSP1-2.6. Multi-model annual (left), summer (June, July, and August; middle), and winter (December, January, and February; right) (a)–(c) mean absolute change (W h d−1) and (d)–(f) relative change (%) in simulated PV electricity generation between the 2081–2100 period and the 1995–2014 period. The dots signify less than 75 % model agreement in the sign of the projected changes.
In the strong climate change scenario SSP5-8.5, the annual mean generation increases over most of the European continent. The hot spots of summer increase in absolute terms are centered in Germany and countries in the same or higher latitudes, such as Poland and the Czech Republic. South of Iberia, Italy, and the Balkans, PV yields decrease. During winter, the opposite changes hold.
While the strongest summer increase is found in central to northern Europe, the strongest winter increase occurs in the south. This feature occurs similarly in both scenarios. The practical relevance of the decrease in the northernmost part of the domain is limited because high latitudes are barely suitable for large-scale PV electricity production due to limited solar radiation reaching the surface there.
To conclude, we find that mitigating emissions according to the SSP1-2.6 scenario improves the climatic boundary conditions for PV, i.e., the availability of total horizontal irradiance, and would lead to approximately 5 % more power generation compared with today. Moreover, the seasonal cycle of PV generation is expected to become more pronounced as the generation grows stronger in summer than in winter (SSP1-2.6) or grows in summer and decreases in winter (SSP5-8.5). The southern end of the continent represents an exception, as summer generation decreases while winter generation increases in SSP5-8.5.
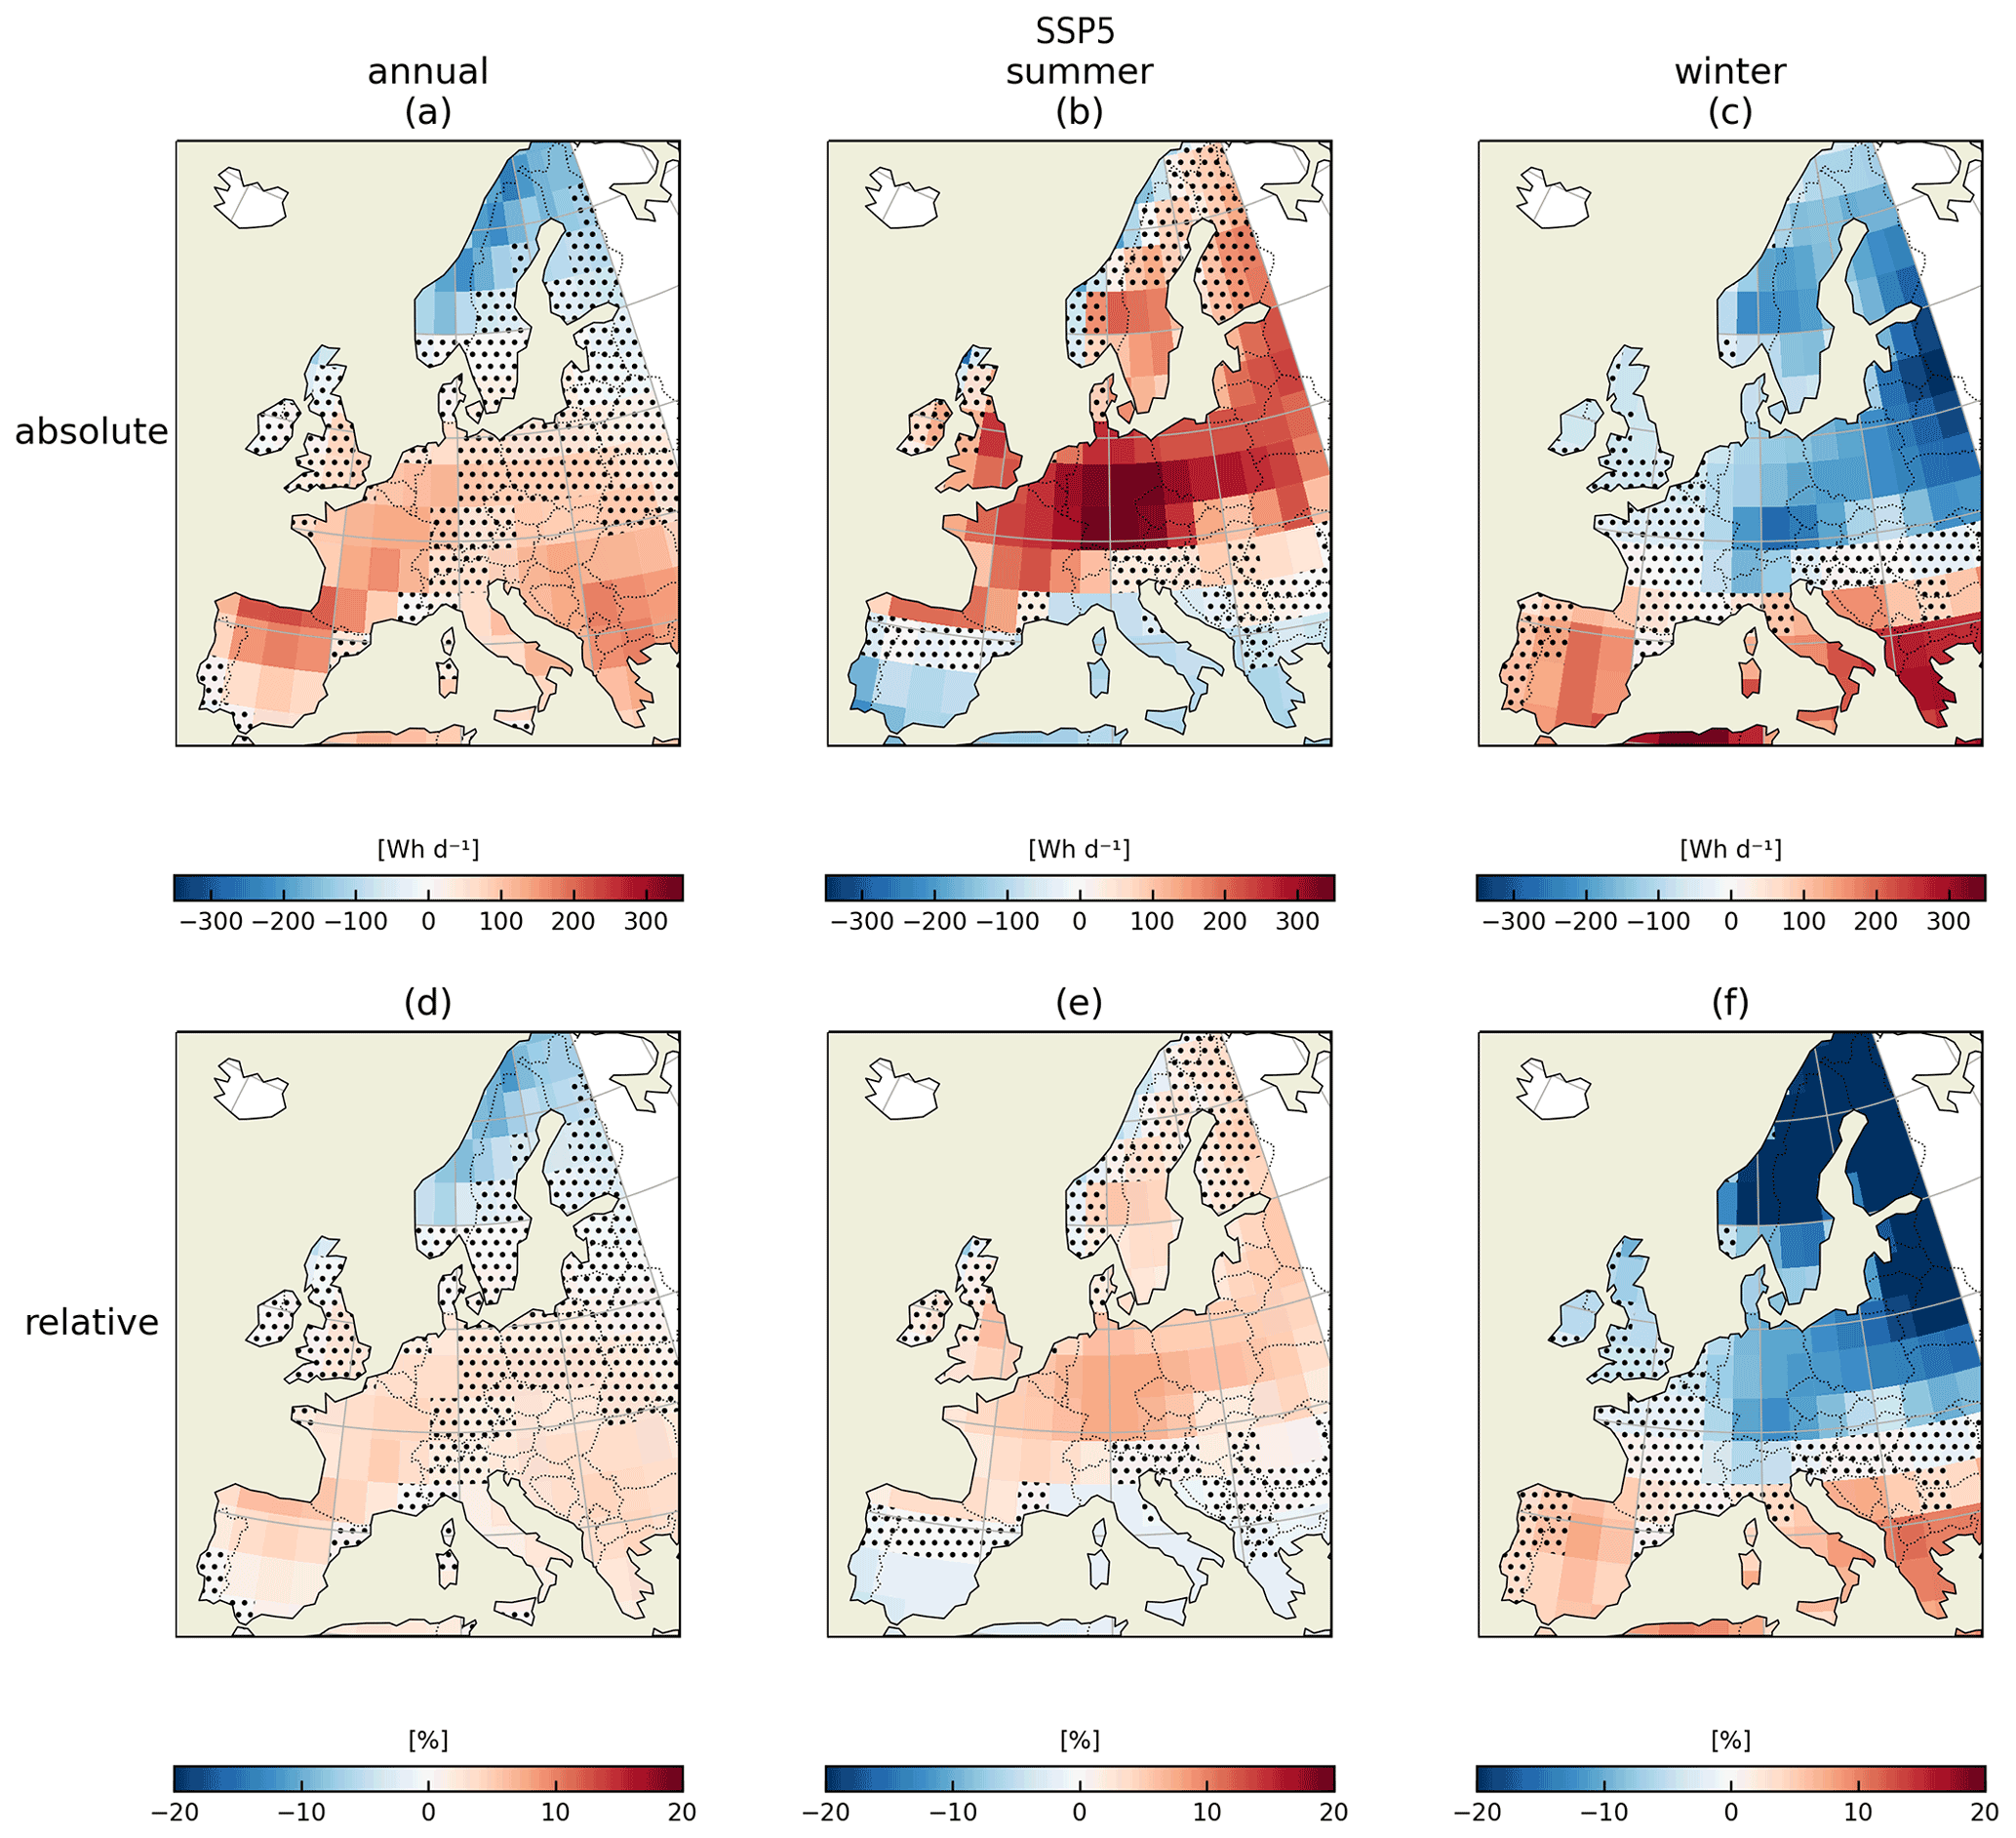
Figure 4Impacts of climate change on PV generation in SSP5-8.5. The figure is structured in the same way as Fig. 3.
3.3 Correlation changes in PV electricity production
Future carbon-free power systems need to reliably provide electricity despite the variability in renewable power generation. One key strategy in this context is intercountry transmission, which allows one to exploit the complementarity of generation in different countries. However, we find that PV generation becomes more uniform in both SSP scenarios: the change in correlation is positive virtually everywhere (Fig. 5). Moreover, the signal is approximately twice as strong in SSP5-8.5 as in SSP1-2.6, suggesting that the correlation increases with forcing. This finding is robust across the set of models, as the inter-model agreement is high: more than three-quarters of all models show the same sign of change except for a few grid boxes towards the margins of the continent (northern Britain and Norway for both SSP scenarios and the southern margin of Europe for SSP1-2.6). For SSP5-8.5, the correlation changes are most pronounced in central Europe, with maxima in southern Germany, Austria, Switzerland, and the Czech Republic.
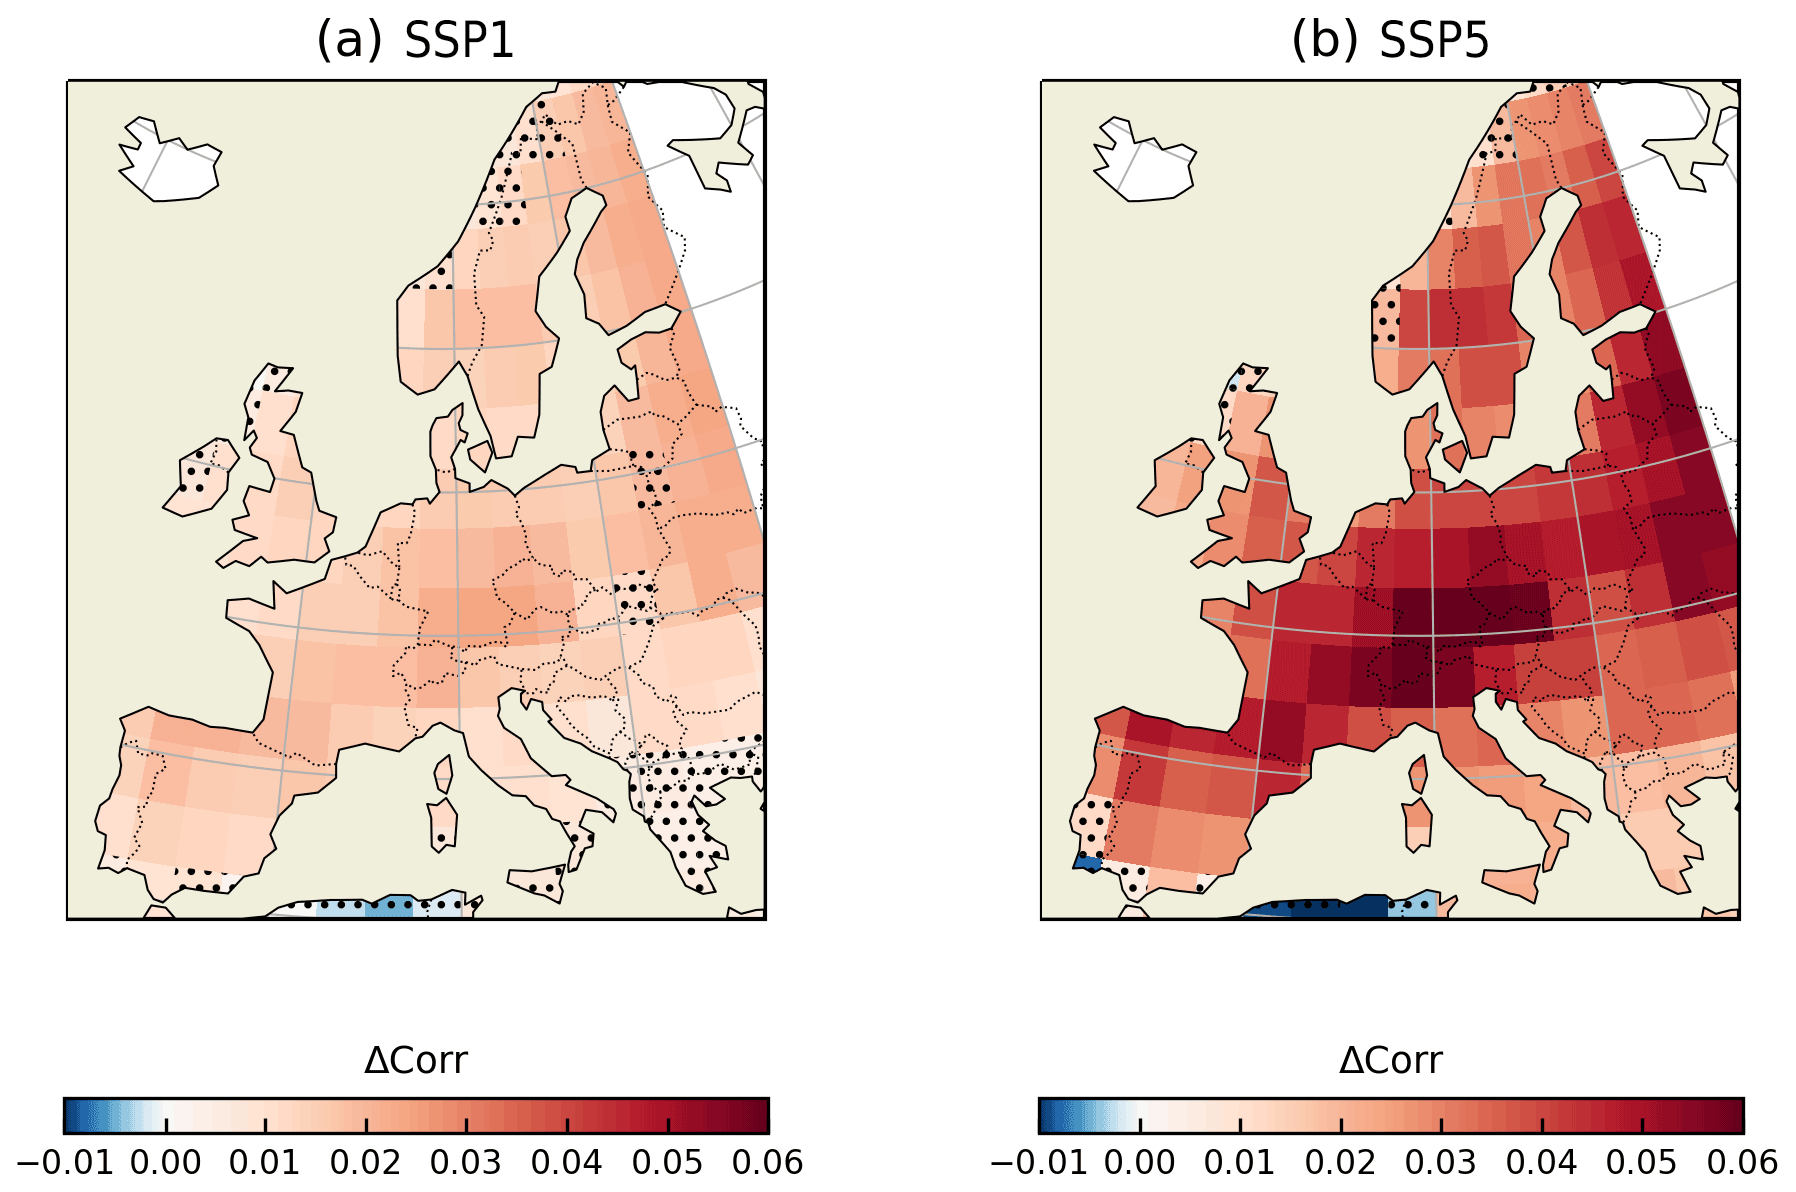
Figure 5Climate change impacts on daily PV generation correlations in (a) SSP1-2.6 and (b) SSP5-8.5. Changes are computed relative to 1985–2014 and are displayed as the mean across all 28 models. The dots signify less than 75 % model agreement in the sign of the projected changes.
The large-scale increase in correlations implies that climate change reduces PV balancing potential in Europe in the two scenarios considered. A similar result for wind power is found in Wohland et al. (2017). These changes might affect the possibility of complementary power production from the PV and wind sources over Europe during summer and winter (Heide et al., 2010; Miglietta et al., 2017). Moreover, from Fig. 5, we conclude that the negative effects on balancing potential are stronger in the heavily fossil-fueled pathway (SSP5-8.5) than in a sustainable one (SSP1-2.6), which is indicated by a stronger increase in interregional correlations of the PV yields in the former scenario.
While this spatial correlation evaluation at the European scale allows for investigation of the big picture, it involves multiple averaging steps on the individual grid point and is, thus, convoluted to interpret in greater detail. Therefore, for a better understanding of the mechanism along with more application-oriented analyses, we conduct case studies for the Iberian and Balkan peninsulas and central Europe (as introduced in Sect. 2.5).
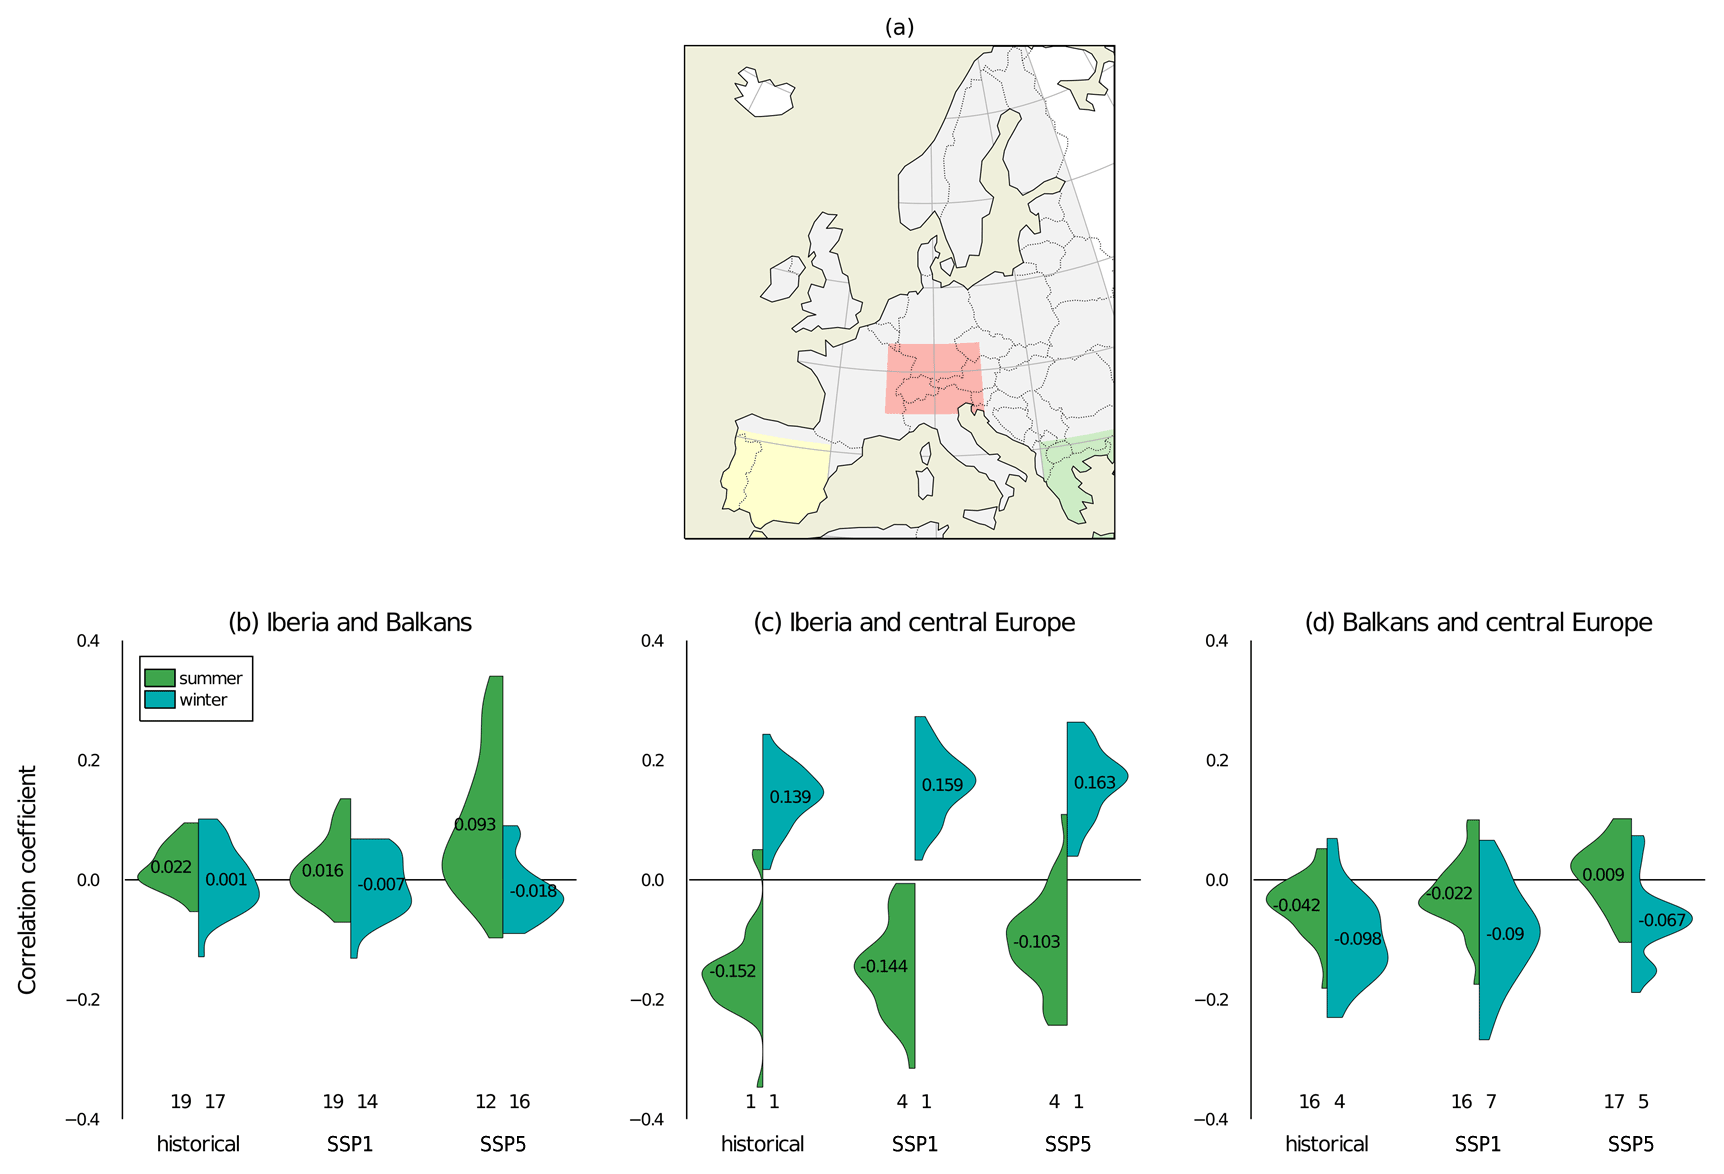
Figure 6(a) Selected regions for the case study: Iberia (35–42.5∘ N, 10–0∘ W; yellow), the Balkans (35–42.5∘ N, 20∘ W–30∘ E; green), and central Europe (45–50∘ N, 5–15∘ E; red). The lower panels show the correlation of deseasonalized PV electricity production (b) between Iberia and the Balkans, (c) between Iberia and central Europe, and (d) between the Balkans and central Europe for the historical and the two SSP scenarios based on daily data. The green and blue colors distinguish correlations in summer and winter, respectively. The violin shapes represent the probability density function of the 28 models used. The numbers in the middle indicate the mean correlation coefficient for the specific scenario in each season. The values below each violin part show the number of models (out of 28) for which the null hypothesis (zero correlation) cannot be rejected at the 5 % level. At the same time, the rest of the models have a statistically significant nonzero correlation.
Figure 6a shows the correlation of daily deseasonalized PV electricity production (excess or deficit from the reference 20-year daily mean, normalized by the reference 20-year standard deviation) between every pair of the three regions for the historical period and the two SSP scenarios. We distinguish between summer and winter months and illustrate the inter-model variability via probability density functions (PDFs; derived from daily time series of PV yields in individual models) of each season’s correlation coefficient. Ideally, a negative PV production correlation of exactly −1 between two locations would guarantee a stable supply of power. A small correlation close to zero would provide a stable supply when many different locations are combined. Here, we found that the correlation between the Iberian Peninsula and the Balkans is generally low in the historical period (below 0.025 on average across all models, and within ± 0.1 for nearly all individual models).
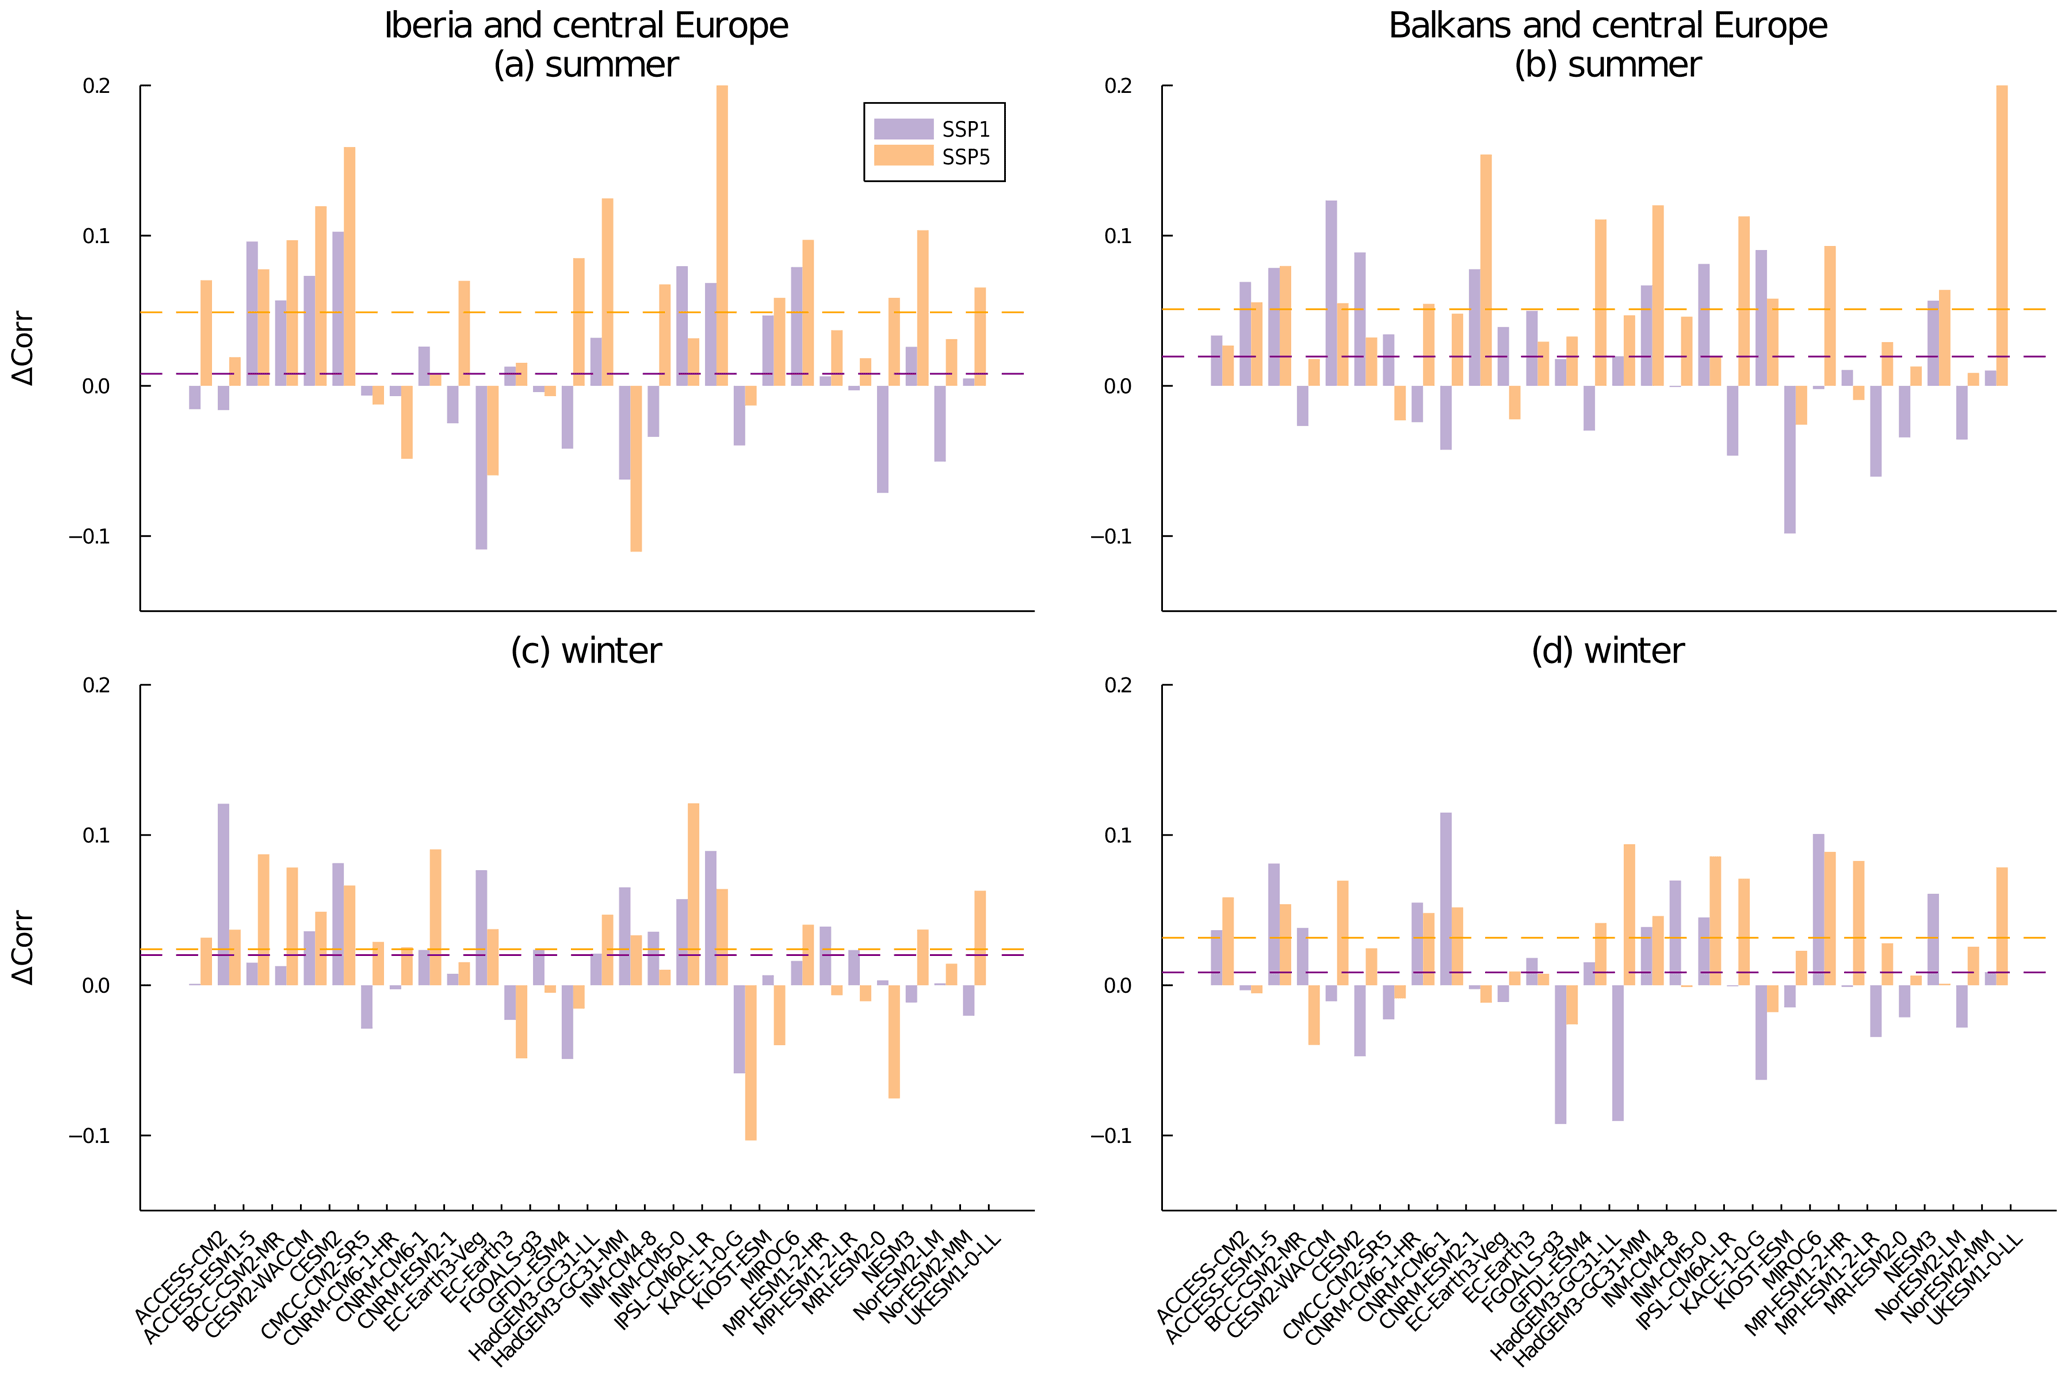
Figure 7Change in spatial correlation of daily PV electricity production in SSP1-2.6 (purple) and SSP5-8.5 (orange) for balancing PV electricity in central Europe with Iberia (a, c) and the Balkans (b, d) in summer (a, b) and winter (c, d) by alphabetically sorted models. The dashed lines in the same color as the scenario denote the mean of the correlation change.
Daily PV underproduction in one region is, thus, often accompanied by excess production in the other region, implying that, in principle, mutual production buffering on daily timescales is possible. Turning to the future, average correlations across all models experience only a slight increase in summer in SSP1-2.6 and a slight decrease in winter for both SSP scenarios. However, a few models suggest substantial changes for summer in SSP5-8.5, with correlations reaching up to 0.4.
The correlation between Iberia and central Europe suggests that there is further potential for PV electricity balancing between these two regions in summer and less so in winter, as indicated by the distinctive negative and positive correlations in the respective season. Between these regions, the average correlations increase mildly in both seasons from the historical period to SSP1-2.6 to SSP5-8.5, implying a slight reduction in buffering potential.
Between the Balkans and central Europe, less difference between summer and winter is visible, and although the majority is in the negative range, the correlation in winter is generally lower than in summer. We observe increased average correlations in the SSP scenarios for both seasons compared with the historical period. These increases in correlations between central Europe and Iberia as well as between central Europe and the Balkans are the regional equivalent of the correlation changes seen over the continent (Fig. 5).
The aggregate assessment using PDFs could mask changes in individual models. Therefore, we inspect models individually (Fig. 7) and notice that the majority of the models show an increase in correlation from historical to SSPs in both region pairs (central Europe with Iberia and the Balkans, respectively) during both seasons. The average correlation increase in SSP5-8.5 is roughly 0.03 to 0.05 higher than in SSP1-2.6, although the winter difference is 0.01 at most in the case of Iberia and central Europe. More models show correlation decreases in summer than in winter, and the models with decreases in SSP1-2.6 also outnumber those in SSP5-8.5.
In summary, the case studies support the aggregate assessment, as the correlation between the three regions generally increases with forcing. There is only one exception, namely the Iberian Peninsula and the Balkans in winter. While the increase is captured by a large majority of models, detailed power system modeling would be needed to judge the effect of this mild increase in correlation on the power system design.
Regarding changes in all-sky and clear-sky radiation as well as surface temperature and cloud fraction, we find CMIP6-based projections to be largely consistent with Wild et al. (2015), who used RCP8.5 data from CMIP5 and looked at trends from 2006 to 2049. In particular, a majority of models from both model generations agree on increasing all-sky radiation in southern Europe and parts of central Europe, whereas the model agreement is more limited in northern Europe and for clear-sky radiation. Regional climate models, by contrast, often report a widespread decrease in future all-sky radiation in Europe (e.g., Jerez et al., 2015; Bartok et al., 2017), possibly due to overly simple treatment of aerosols (Bartok et al., 2017, Jerez et al., 2021; Boé et al., 2020; Gutiérrez et al., 2020). All mentioned studies use strong forcing scenarios: RCP8.5 or RCP4.5. Our CMIP6-based results add to this picture in that we find the increase in all-sky radiation under SSP5-8.5 to result from decreasing cloud cover, which overcompensates for the decreasing clear-sky radiation in the wake of a warmer and wetter climate and despite decreasing future aerosol emissions under any SSP. In the much less studied strong mitigation scenario, SSP1-2.6 in the case of CMIP6, we find decreasing cloud cover and increasing clear-sky radiation to act in concert towards increasing all-sky radiation. In both SSP scenarios, water vapor content (not shown) in the atmosphere increases compared with the present situation, with the increase being larger in SSP5-8.5 than in SSP1-2.6. For SSP1-2.6, the observed increase in clear-sky radiation then suggests that the small increase in atmospheric water vapor is negligible compared with the decrease in aerosol load. All-sky radiation increases even more as the cloud cover fraction decreases. In the SSP5-8.5 scenario, the observed reduction in clear-sky radiation suggests that the augmented water vapor content has a stronger impact than the decrease in aerosol load. Nevertheless, all-sky radiation increases due to a reduction in the cloud fraction. The relationship between the total cloud cover over the Iberian Peninsula and the dominant modes of atmospheric circulation variability during summer is weaker than during winter due to clouds of a more convective origin in the warm season (Sanchez-Lorenzo et al., 2009). Jerez et al. (2013) show that negative North Atlantic Oscillation (NAO) phases strengthen the westerly winds over Iberia and enhance cloudiness there, thereby diminishing the solar potential by 10 %–20 %.
With solar radiation being a prime determinant of PV power production, the two quantities show common features in the calculated changes. Müller et al. (2019) estimated the effect of the ambient temperature to be about 1 order of magnitude smaller, at least in Europe. In fact, the relative change pattern in PV electricity production in SSP5-8.5 is close to the results for RCP8.5 using 23 CMIP5 models in Müller et al. (2019), where they also found an increase in most regions of central to southern Europe. Note that Müller et al. (2019) investigated different periods (2060–2080 compared with 2007–2027), as we do in the present work. Jerez et al. (2015) also confirmed a slightly positive trend in southern Europe (2070–2099 compared with 1970–1999) based on regional climate models. The PV generation increases in Spain and Germany are also found in Wild et al. (2015) in the RCP8.5 scenario. At the same time, Müller et al. (2019) and Jerez et al. (2015) both reported a decreasing trend of PV yields in relative terms in central to northern Europe.
Our results add two new facets to the discussion concerning the spatiotemporal variability of PV power production. First, we find a tendency for the correlation of daily PV production in spatially distant regions to increase, thereby hampering the potential to buffer production variability via regional exchange. Second, we observe a tendency for enhanced seasonal cycles, implying an increased need to buffer such seasonal variability. For example, network planning could consider the combination of a seasonally complementary power supply from PV and wind sources, as reasoned in Sect. 3.3. The changes in correlation coefficients are within 0.2, yet they ought to be taken into account in the future planning of PV production. We acknowledge that real-world energy system design and investment decisions face a range of uncertainties that are related or unrelated to climate. For instance, regulatory frameworks might evolve, innovation could make new technologies available, and financial circumstances can change abruptly in economic crises. Nevertheless, policymakers, investors, and utilities need a sound understanding of the climatic boundary conditions for solar photovoltaics in different plausible future climate states.
We show that PV potentials increase in the mitigation scenario SSP1-2.6, suggesting a positive feedback loop where the transition to renewables improves the climatic conditions for renewables. In SSP1-2.6 , PV production increases independent of season or region and with a generally high model agreement. Only minor exceptions exist in parts of Scandinavia and Ireland, and also in parts of central-eastern Europe and the Iberian Peninsula in winter. Due to clear-sky radiation and cloud effects acting (in part) against each other, a more complex PV change pattern is found for the strong forcing scenario, SSP5-8.5: summer PV production increases in central and northern Europe but decreases in the south, whereas this geographical pattern is flipped in winter, in line with prior work by Müller et al. (2019). This complex pattern is largely robust across the CMIP6 models, albeit more uncertain than in SSP1-2.6. An overall higher PV production under SSP1-2.6 conditions contrasts with an increased (decreased) seasonality of PV production in central northern (southern) Europe under the SSP5-8.5 scenario. The CMIP6 projections suggest that the spatial correlations of simulated daily PV electricity production in Europe increase towards the end of the 21st century. Consequently, the probability of multiple regions experiencing an excess or deficit with respect to PV electricity generation simultaneously increases. We exemplify this general tendency by investigating three regions in greater detail. Deseasonalized daily PV production in the Balkans is largely uncorrelated with production in either the Iberian Peninsula or central Europe, in winter and summer, in the present day and in the future, and under either SSP1-2.6 or SSP5-8.5. By contrast, we find a negative correlation in summer (around −0.15 on average across models) and a positive correlation (around +0.14) in winter for central Europe and the Iberian Peninsula under present-day conditions. Except for summer in the SSP1-2.6 scenario, these correlations become less negative/more positive in the future. This finding is robust, as more than 75 % of the models show this behavior, with 5 out of 28 models showing an increase in correlation of more than 0.1 in summer for the SSP5-8.5 scenario. Such changes in spatial correlations could hamper the effectiveness of future international transmission in balancing PV generation variability.
The CMIP6 data are accessible via the Earth System Grid Federation: https://esgf-node.llnl.gov/search/cmip6/ (ESGF, 2021).
XH processed the data, performed the PV simulation, created all figures, and wrote the first draft of the paper. JW, MW, and DF designed the study and regularly provided feedback. All authors analyzed the results and wrote the final paper.
The contact author has declared that neither they nor their co-authors have any competing interests.
Publisher’s note: Copernicus Publications remains neutral with regard to jurisdictional claims in published maps and institutional affiliations.
We acknowledge the World Climate Research Program which, through its Working Group on Coupled Modelling, coordinated and promoted CMIP6. We thank the climate modeling groups for producing and making available their model output, the Earth System Grid Federation (ESGF) for archiving the data and providing access, and the multiple funding agencies that support CMIP6 and ESGF. Xinyuan Hou is funded through the “European Commission EuroGEO Showcases: Applications Powered by Europe” project (grant no. 820852). Jan Wohland is funded through an ETH Postdoctoral Fellowship and acknowledges support from the ETH Zürich Foundation and the Uniscientia foundation. Martin Wild and Doris Folini acknowledge funding from the Swiss National Science Foundation (grant no. 200020_188601).
This research has been supported by the “European Commission EuroGEO Showcases: Applications Powered by Europe” project (grant no. 820852), the ETH Zürich Foundation, the Uniscientia foundation, and the Swiss National Science Foundation (grant no. 200020_188601).
This paper was edited by Somnath Baidya Roy and reviewed by two anonymous referees.
Bartok, B., Wild, M., Folini, D., Lüthi, D., Kotlarski, S., Schär, C., Vautard, R., Jerez, S., and Imecs, Z.: Projected changes in surface solar radiation in CMIP5 global climate models and in EURO-CORDEX regional climate models for Europe, Clim. Dyn., 49, 2665–2683, https://doi.org/10.1007/s00382-016-3471-2, 2017.
Bloomfield, H. C., Gonzalez, P. L. M., Lundquist, J. K., Stoop, L. P., Browell, J., Dargaville, R., De Felice, M., Gruber, K., Hilbers, A., Kies, A., Panteli, M., Thornton, H. E., Wohland, J., Zeyringer, M., and Brayshaw, D. J.: The Importance of Weather and Climate to Energy Systems: A Workshop on Next Generation Challenges in Energy–Climate Modeling, B. Am. Meteorol. Soc., 102, E159–E167, https://doi.org/10.1175/BAMS-D-20-0256.1, 2021.
Boé, J., Somot, S., Corre, L., and Nabat, P.: Large discrepancies in summer climate change over Europe as projected by global and regional climate models: causes and consequences, Clim. Dyn., 54, 2981–3002, https://doi.org/10.1007/s00382-020-05153-1, 2020.
Craig, M. T., Losada Carreño, I., Rossol, M., Hodge, B.-M., and Brancucci, C.: Effects on power system operations of potential changes in wind and solar generation potential under climate change, Environ. Res. Lett., 14, 34014, https://doi.org/10.1088/1748-9326/aaf93b, 2019.
Creutzig, F., Agoston, P., Goldschmidt, J. C., Luderer, G., Nemet, G., and Pietzcker, R. C.: The underestimated potential of solar energy to mitigate climate change, Nat. Energy, 2, 17140, https://doi.org/10.1038/nenergy.2017.140, 2017.
Crook, J. A., Jones, L. A., Forster, P. M., and Crook, R.: Climate change impacts on future photovoltaic and concentrated solar power energy output, Energ. Environ. Sci., 4, 3101–3109, https://doi.org/10.1039/c1ee01495a, 2011.
Earth System Grid Federation (ESGF): ESGF Node at DOE/LLNL, Earth System Grid Federation (ESGF) [data set], available at: https://esgf-node.llnl.gov/search/cmip6/, last access: 22 October 2021.
EU: Communication from the Commission to the European Parliament, the European Council, the Council, the European Economic and Social Committee and the Committee of the Regions (COM(2019) 640 final), available at: https://eur-lex.europa.eu/resource.html?uri=cellar:b828d165-1c22-11ea-8c1f-01aa75ed71a1.0002.02/DOC_1&format=PDF (last access: 23 June 2021), 2019.
Eyring, V., Bony, S., Meehl, G. A., Senior, C. A., Stevens, B., Stouffer, R. J., and Taylor, K. E.: Overview of the Coupled Model Intercomparison Project Phase 6 (CMIP6) experimental design and organization, Geosci. Model Dev., 9, 1937–1958, https://doi.org/10.5194/gmd-9-1937-2016, 2016.
Gaetani, M., Huld, T., Vignati, E., Monforti-Ferrario, F., Dosio, A., and Raes, F.: The near future availability of photovoltaic energy in Europe and Africa in climate-aerosol modeling experiments, Renew. Sust. Energ. Rev., 38, 706–716, https://doi.org/10.1016/j.rser.2014.07.041, 2014.
Gidden, M. J., Riahi, K., Smith, S. J., Fujimori, S., Luderer, G., Kriegler, E., van Vuuren, D. P., van den Berg, M., Feng, L., Klein, D., Calvin, K., Doelman, J. C., Frank, S., Fricko, O., Harmsen, M., Hasegawa, T., Havlik, P., Hilaire, J., Hoesly, R., Horing, J., Popp, A., Stehfest, E., and Takahashi, K.: Global emissions pathways under different socioeconomic scenarios for use in CMIP6: a dataset of harmonized emissions trajectories through the end of the century, Geosci. Model Dev., 12, 1443–1475, https://doi.org/10.5194/gmd-12-1443-2019, 2019.
Grams, C.M., R. Beerli, S. Pfenninger, I. Staffell, and H. Wernli: Balancing Europe's wind power output through spatial deployment informed by weather regimes, Nat. Clim. Change, 7, 557–562, https://doi.org/10.1038/nclimate3338, 2017.
Gutiérrez, C., Somot, S., Nabat, P., Mallet, M., Corre, L., van Meijgaard, E., Perpiñán, O., and Gaertner, M. Á.: Future evolution of surface solar radiation and photovoltaic potential in Europe: investigating the role of aerosols, Environ. Res. Lett., 15, 34035, https://doi.org/10.1088/1748-9326/ab6666, 2020.
Heide, D., von Bremen, L., Greiner, M., Hoffmann, C., Speckmann, M., and Bofinger, S.: Seasonal optimal mix of wind and solar power in a future, highly renewable Europe, Renew. Energ., 35, 2483–2489, https://doi.org/10.1016/j.renene.2010.03.012, 2010.
IPCC: Climate Change 2013: The Physical Science Basis. Contribution of Working Group I to the Fifth Assessment Report of the Intergovernmental Panel on Climate Change, edited by: Stocker, T. F., Qin, D., Plattner, G.-K., Tignor, M., Allen, S. K., Boschung, J., Nauels, A., Xia, Y., Bex, V., and Midgley, P. M., Cambridge University Press, Cambridge, United Kingdom and New York, NY, USA, 2013.
International Renewable Energy Agency (IRENA): Future of Solar Photovoltaic: Deployment, investment, technology, grid integration and socio-economic aspects (A Global Energy Transformation: paper), International Renewable Energy Agency, Abu Dhabi, 2019.
IRENA: Trends in Renewable Energy, available at:http://resourceirena.irena.org/gateway/dashboard/?topic=4&subTopic=16 (last access: 24 March 2021), 2020.
Jacob, D., Teichmann, C., Sobolowski, S., Katragkou, E., Anders, I., Belda, M., Benestad, R., Boberg, F., Buonomo, E., Cardoso, R. M., Casanueva, A., Christensen, O. B., Christensen, J. H., Coppola, E., Cruz, L. de, Davin, E. L., Dobler, A., Domínguez, M., Fealy, R., Fernandez, J., Gaertner, M. A., García-Díez, M., Giorgi, F., Gobiet, A., Goergen, K., Gómez-Navarro, J. J., Alemán, J. J. G., Gutiérrez, C., Gutiérrez, J. M., Güttler, I., Haensler, A., Halenka, T., Jerez, S., Jiménez-Guerrero, P., Jones, R. G., Keuler, K., Kjellström, E., Knist, S., Kotlarski, S., Maraun, D., van Meijgaard, E., Mercogliano, P., Montávez, J. P., Navarra, A., Nikulin, G., Noblet-Ducoudré, N. de, Panitz, H.-J., Pfeifer, S., Piazza, M., Pichelli, E., Pietikäinen, J.-P., Prein, A. F., Preuschmann, S., Rechid, D., Rockel, B., Romera, R., Sánchez, E., Sieck, K., Soares, P. M. M., Somot, S., Srnec, L., Sørland, S. L., Termonia, P., Truhetz, H., Vautard, R., Warrach-Sagi, K., and Wulfmeyer, V.: Regional climate downscaling over Europe: perspectives from the EURO-CORDEX community, Reg. Environ. Change, 20, 51, https://doi.org/10.1007/s10113-020-01606-9, 2020.
Jacobson, M. Z. and Jadhav, V.: World estimates of PV optimal tilt angles and ratios of sunlight incident upon tilted and tracked PV panels relative to horizontal panels, Sol. Energy, 169, 55–66, https://doi.org/10.1016/j.solener.2018.04.030, 2018.
Jerez, S., Trigo, R. M., Vicente-Serrano, S. M., Pozo-Vázquez, D., Lorente-Plazas, R., Lorenzo-Lacruz, J., Santos-Alamillos, F., and Montávez, J. P.: The Impact of the North Atlantic Oscillation on Renewable Energy Resources in Southwestern Europe, J. Appl. Meteor. Climatol., 52, 2204–2225. https://doi.org/10.1175/JAMC-D-12-0257.1, 2013.
Jerez, S., Tobin, I., Vautard, R., Montávez, J. P., López-Romero, J. M., Thais, F., Bartok, B., Christensen, O. B., Colette, A., Déqué, M., Nikulin, G., Kotlarski, S., van Meijgaard, E., Teichmann, C., and Wild, M.: The impact of climate change on photovoltaic power generation in Europe, Nat. Commun., 6, 10014, https://doi.org/10.1038/ncomms10014, 2015.
Jerez, S., Palacios-Peña, L., Gutiérrez, C., Jiménez-Guerrero, P., López-Romero, J. M., Pravia-Sarabia, E., and Montávez, J. P.: Sensitivity of surface solar radiation to aerosol–radiation and aerosol–cloud interactions over Europe in WRFv3.6.1 climatic runs with fully interactive aerosols, Geosci. Model Dev., 14, 1533–1551, https://doi.org/10.5194/gmd-14-1533-2021, 2021.
Kittner, N., Lill, F., and Kammen, D. M.: Energy storage deployment and innovation for the clean energy transition, Nat. Energy, 2, 17125, https://doi.org/10.1038/nenergy.2017.125, 2017.
Miglietta, M. M., Huld, T., and Monforti-Ferrario, F.: Local Complementarity of Wind and Solar Energy Resources over Europe: An Assessment Study from a Meteorological Perspective, J. Appl. Meteor. Climatol., 56, 217–234, https://doi.org/10.1175/JAMC-D-16-0031.1, 2017.
Müller, J., Folini, D., Wild, M., and Pfenninger, S.: CMIP-5 models project photovoltaics are a no-regrets investment in Europe irrespective of climate change, Energy, 171, 135–148, https://doi.org/10.1016/j.energy.2018.12.139, 2019.
O'Neill, B. C., Tebaldi, C., van Vuuren, D. P., Eyring, V., Friedlingstein, P., Hurtt, G., Knutti, R., Kriegler, E., Lamarque, J.-F., Lowe, J., Meehl, G. A., Moss, R., Riahi, K., and Sanderson, B. M.: The Scenario Model Intercomparison Project (ScenarioMIP) for CMIP6, Geosci. Model Dev., 9, 3461–3482, https://doi.org/10.5194/gmd-9-3461-2016, 2016.
Panagea, I. S., Tsanis, I. K., Koutroulis, A. G., and Grillakis, M. G.: Climate Change Impact on Photovoltaic Energy Output: The Case of Greece, Adv. Meteorol., 2014, 1–11, https://doi.org/10.1155/2014/264506, 2014.
Pfenninger, S. and Staffell, I.: Long-term patterns of European PV output using 30 years of validated hourly reanalysis and satellite data, Energy, 114, 1251–1265, https://doi.org/10.1016/j.energy.2016.08.060, 2016.
Ravestein, P., van der Schrier, G., Haarsma, R., Scheele, R., and van den Broek, M.: Vulnerability of European intermittent renewable energy supply to climate change and climate variability, Renew. Sust. Energ. Rev., 97, 497–508, https://doi.org/10.1016/j.rser.2018.08.057, 2018.
Ridley, B., Boland, J., and Lauret, P.: Modelling of diffuse solar fraction with multiple predictors, Renew. Energ., 35, 478–483, https://doi.org/10.1016/j.renene.2009.07.018, 2010.
Rodríguez, R. A., Becker, S., Andresen, G. B., Heide, D., and Greiner, M.: Transmission needs across a fully renewable European power system, Renew. Energ., 63, 467–476, https://doi.org/10.1016/j.renene.2013.10.005, 2014.
Sanchez-Lorenzo, A., Calbó, J., Brunetti, M., and Deser, C.: Dimming/brightening over the Iberian Peninsula: Trends in sunshine duration and cloud cover and their relations with atmospheric circulation, J. Geophys. Res., 114, D00D09, https://doi.org/10.1029/2008JD011394, 2009.
Taylor, K. E., Stouffer, R. J., and Meehl, G. A.: An Overview of Cmip5 and the Experiment Design, B. Am. Meteorol. Soc., 93, 485–498, https://doi.org/10.1175/BAMS-D-11-00094.1, 2012.
Tröndle, T., Pfenninger, S., and Lilliestam, J.: Home-made or imported: On the possibility for renewable electricity autarky on all scales in Europe, Energy Strateg. Rev., 26, 100388, https://doi.org/10.1016/j.esr.2019.100388, 2019.
UNFCCC: Adoption of the Paris Agreement, Decision1/CP.21 of FCCC/CP/2015/10/Add.1, available at: http://unfccc.int/resource/docs/2015/cop21/eng/10a01.pdf (last access: 20 October 2021), 2015.
van der Wiel, K., Bloomfield, H. C., Lee, R. W., Stoop, L. P., Blackport, R., Screen, J. A., and Selten, F. M.: The influence of weather regimes on European renewable energy production and demand, Environ. Res. Lett., 14, 094010, https://doi.org/10.1088/1748-9326/ab38d3, 2019.
Wild, M., Folini, D., Henschel, F., Fischer, N., and Müller, B.: Projections of long-term changes in solar radiation based on CMIP5 climate models and their influence on energy yields of photovoltaic systems, Sol. Energy, 116, 12–24, https://doi.org/10.1016/j.solener.2015.03.039, 2015.
Wohland, J., Reyers, M., Weber, J., and Witthaut, D.: More homogeneous wind conditions under strong climate change decrease the potential for inter-state balancing of electricity in Europe, Earth Syst. Dynam., 8, 1047–1060, https://doi.org/10.5194/esd-8-1047-2017, 2017.