the Creative Commons Attribution 4.0 License.
the Creative Commons Attribution 4.0 License.
 | 22 Oct 2020
Climate change as an incentive for future human migration
Ken Caldeira
Human migration is both motivated and constrained by a multitude of socioeconomic and environmental factors, including climate-related factors. Climatic factors exert an influence on local and regional population density. Here, we examine the implications of future motivation for humans to migrate by analyzing today's relationships between climatic factors and population density, with all other factors held constant. Such “all other factors held constant” analyses are unlikely to make quantitatively accurate predictions, but the order of magnitude and spatial pattern that come out of such an analysis can be useful when considering the influence of climate change on the possible scale and pattern of future incentives to migrate. Our results indicate that, within decades, climate change may provide hundreds of millions of people with additional incentive to migrate, largely from warm tropical and subtropical countries to cooler temperate countries, with India being the country with the greatest number of people with additional incentive to migrate. These climate-driven incentives would be among the broader constellation of incentives that influence migration decisions. Areas with the highest projected population growth rates tend to be areas that are likely to be most adversely affected by climate change.
- Article
(3930 KB) - Full-text XML
-
Supplement
(709 KB) - BibTeX
- EndNote


Human migration is a complex socioeconomic phenomena driven by mixture of historical, political, cultural, economic, and geographical factors (Black et al., 2011; Boas et al., 2019; Foresight: Migration and Global Environmental Change, 2011; Greenwood, 1985) – often by the need to adapt to environmental stressors (Adger et al., 2014) including those caused by climate change (Missirian and Schlenker, 2017; Myers, 1993; Núñez et al., 2002; Stapleton et al., 2017). Climate change is expected to lead to higher temperatures and an altered hydrological cycle in the coming decades (McLeman and Hunter, 2010), and temperature and precipitation changes have been shown to influence human migration at the local to regional scale (Barrios et al., 2006; Black et al., 2011; Bohra-Mishra et al., 2014; Gray and Bilsborrow, 2013; Hsiang et al., 2013; Kelley et al., 2015; Marchiori et al., 2012; Mueller et al., 2014). Hsiang and Sobel (2016) examined the consequences of migration if everyone moved to remain at the same annual global mean temperature under a climate change scenario.
We apply a simple and transparent approach to estimate the number and geographical distribution of people for whom temperature and precipitation changes may provide an additional incentive migrate. Of course, people are subject to a wide range of incentives and constraints; therefore, actual future migration will depend on a much broader set of factors (Adger et al., 2014; Boas et al., 2019; Greenwood, 1985). Ideally, projections of future human migration patterns would involve the consideration of a wide range of factors that are difficult to quantify, such as future wealth, the efficacy of the adaptive response, cultural factors, and nonlinear interactions between climate change and population growth (Boas et al., 2019; Holobinko, 2012; Suweis, 2018), although this is a topic with ongoing debate (Afifi, 2011; Bettini, 2013; Boas et al., 2019; Mortreux and Barnett, 2009; Piguet et al., 2011; Suhrke, 1994). For example, Milan et al. (2015) pointed out that household vulnerability could impact human migration patterns in the mountainous areas of the “Global South”. Nevertheless, our goal is to identify what a continuance of the current relationships between climate variables and global human population density would imply for future incentives to migrate. While these relationships will not remain fixed in time, it is nonetheless useful to understand what the direct application of current relationships to future climate would contribute to the set of incentives that will influence future human migration.
2.1 Overview
Nordhaus (2006) applied a regression analysis on geographical and economic data to estimate the influence of climate variables on the areal density of the gross domestic product (GDP). Samson et al. (2011) used a weighted regression model to identify the ideal temperature and precipitation ranges for human habitation (as measured by population density) and studied how those ideal temperature and precipitation ranges may change in the future owing to climate change. Here we apply similar methods to the same dataset, the Geographically based Economic data (G-Econ), to estimate the influence of climate variables on population density.
To estimate the influence of climate on the attractiveness of different locations, we apply the historical relationship between climate variables and population density along with projections (Taylor et al., 2012) of future climate change from the output of the Coupled Model Intercomparison Project Phase 5 (CMIP5) under Representative Concentration Pathways (RCPs; Vuuren et al., 2011), including RCP2.6, RCP4.5, RCP6.0, and RCP8.5, incorporating future country-scale demographic population projections from the United Nations' World Population Prospects 2015 (United Nations, 2015). Details are given in Sect. 2.3, but the basic idea is that if, for example, historical relationships between population density and climate change would predict a 10 % decrease in population density for a grid cell in a climate change scenario, we would estimate that there would be incentive for 10 % of the future population (as estimated by the UN) to migrate from that grid cell. Of course, many other factors including family ties, linguistic barriers, lack of resources, employments relations, and so on would be expected to influence migration decisions. When we report country-level results, we integrate across all grid cells within a country and report the net value; thus, our methodology would not predict the incentive to migrate from a country, when that country had some grid cells that indicated incentives for emigration, if other grid cells indicated an even greater incentive to migrate into that country. When we report country-level results, we consider only cross-border migration with our study and do not consider movement within a country (Rigaud et al., 2018).
2.2 Data
This research uses the Geographically based Economic data (G-Econ) dataset (Nordhaus, 2006) for the historical climate and population data. The G-Econ dataset was originally developed for analyzing global economic activities and provides gridded () economic (e.g., gross cell product and population) and geographical (e.g., climate, location, country, distance from seacoasts, soils, and vegetation cover) information covering all terrestrial regions. In total, there are 27 445 grid cells in the dataset. Climatology data from G-Econ, including annual mean air temperature (T, in ∘C) and annual precipitation (P, in mm yr−1), were derived from the Climate Research Unit average climatology high-resolution datasets (New et al., 2002). The gridded population (N) was adapted from the Gridded Population of the World (GPW) dataset (http://sedac.ciesin.columbia.edu/data/collection/gpw-v3, last access: 2 October 2020). More details and the data download link are available at http://gecon.yale.edu/, last access: 2 October 2020).
In this study, we used the population density (D) and the geographical data from the G-Econ dataset, including T, P, distance to lake (DL, in km), distance to major river (DMR, in km), distance to river (DR, in km), distance to ocean (DO, in km), elevation (E, in m), and surface roughness (roughness, in m).
To make our projections, we used T and P in historical (i.e., 1960–2005) climate as well as future (2006–2100) climate scenarios from the output of the Coupled Model Intercomparison Project Phase 5 (CMIP5), which produces a state-of-the-art multi-model dataset to advance the knowledge of climate change. We collected the model projected T and P (20 model projections; see Table S1 in the Supplement) under all RCPs, including RCP2.6, RCP4.5, RCP6.0, and RCP8.5, from the CMIP5 dataset to represent the range of future climate projections. We regridded the CMIP5 data to a common grid using bilinear interpolation.
We used the historical and predicted (median variant) country-level population data from the “World Population Prospects: The 2015 Revision” by the United Nations Department of Economic and Social Affairs (United Nations, 2015). We use Wi,y to denote the population estimated by the UN for grid cell i in year y, and we use Wc,y to denote the population estimated by the UN for country c in year y.
2.3 Analysis
2.3.1 Year 2005 population density and within-country distribution
Areal population density for the year 2005 in each grid cell i (Di) was calculated from the population (Ni) of 2005, grid area (Ai, in km2), and the land fraction of the grid (Li, no unit) from the G-Econ dataset:
We denote the fraction of the population of country c living in grid cell i with the symbol di,c:
where i∈c indicates that the summation is performed over all grid cells in country c. The distributional parameter, di,c, is considered to be constant in time.
2.3.2 Linear regression model
Our methods for estimating climate influence on the population density parallels methods previously applied (Nordhaus, 2006) to estimate climate influence on the areal density of the GDP. The basic idea is to find a single set of coefficients that explain within-country relationships between population, climatic, and geographical variables. For our regressions, we used data from the G-Econ dataset. The Climate Research Unit average climatology high-resolution datasets were used to fill the missing data in the G-Econ dataset. To estimate the logarithm of the population density from both geographical (G) and climatic variables (C), we used the following equation:
where D is a vector of grid-scale population densities (i.e., Di for grid cell i). Specifically,
Here, T is as defined above, and p is log10P. “country” and “soil” are categorical variables, and βG and βC are the numerical coefficient vectors on geographical and climatic variables, respectively.
and
Antarctica, Greenland, and grid cells with zero precipitation were excluded from this analysis.
The values for the β coefficients are determined by an area-weighted ordinary least squares curve fit to log 10D. Fitting of the above linear regression model was conducted in MATLAB R2017a (http://www.mathworks.com/products/matlab/, last access: 2 October 2020). In total, 20 503 grid cells had data for all of the parameters needed for the fitting procedure. Variability that is not explained by Eq. (3) is assumed to be the result of unknown factors which we treat as invariant with time.
2.3.3 Population change projections
We first calculated the ratio of the population in the changed climate relative to the base-state climate (here taken to be the climate in the period preceding 2005) in region i for the climate in year y considering climate factors alone (ri,y):
For each grid, we calculated ri,y for each year from 2006 to 2100 using Eq. (8) and the 30-year moving average of T and P projected by each CMIP5 model. (The 30-year moving average ends on the period under consideration so that decisions are made on past but not future climate states.)
In the absence of climate change, we would estimate the population in grid cell i in country c for year y (Wi,y) to be , where c is the country containing grid cell i. If we directly apply the population change ratio under climate change (ri,y) to the population estimates, the population considering climate change would be . However, this estimate must be scaled to conserve total population. Thus, the population Ni,y of grid cell i in year y can be estimated to be
By carrying this adjustment out, we conserve the total global population but also consider climate change when estimating the spatial distribution of the population.
We then estimate the number of people for whom climate change is projected to provide additional incentive to migrate for grid cell i and year y (indicated by ΔNi,y) as
Negative ΔNi,y values are interpreted as indicating areas where climate change provides additional incentive to emigrate; positive values indicate areas that are projected to increase in relative attractiveness. (Even if every location were to decrease in absolute attractiveness due to climate change, places with a smaller absolute decrease would increase in relative attractiveness.)
We define , so that indicates the fractional change in the population that would be required to offset the influence of climate change on the attractiveness of grid cell i in year y. When , it means that grid cell i has become less attractive. We integrated Ni,y for grid cells in each country c to yield Nc,y and define . We calculate results independently for each of the CMIP5 models' simulations (Taylor et al., 2012) and present median results. Where a range is reported, it encompasses results for 68 % of the CMIP5 models.
We report results to two significant figures. The computer scripts written in MATLAB R2017a used to perform our analyses are available upon request.
The regression of population density against geographical and climate variables as described above (see also Sect. 2 and the Supplement) explains 72 % of the geographical variance in the logarithm of the population density. Parameter values and their uncertainties are shown in Table S2; p values, based on a Student's t test on coefficients for all temperature- and precipitation-related variables, are <0.0005, indicating that these results are unlikely to have been obtained by chance.
Applying our regression equation to climate model and demographic projections, we find that ΔNi,y is negative (i.e., indicating decreased attractiveness) in regions that are already hot and are projected to experience substantial additional warming under climate change (primarily tropical and subtropical regions), whereas ΔNi,y is positive (i.e., indicating increased attractiveness) in cooler regions (primarily in the temperate regions of the Northern Hemisphere; Figs. 1a and S1a, b, c).
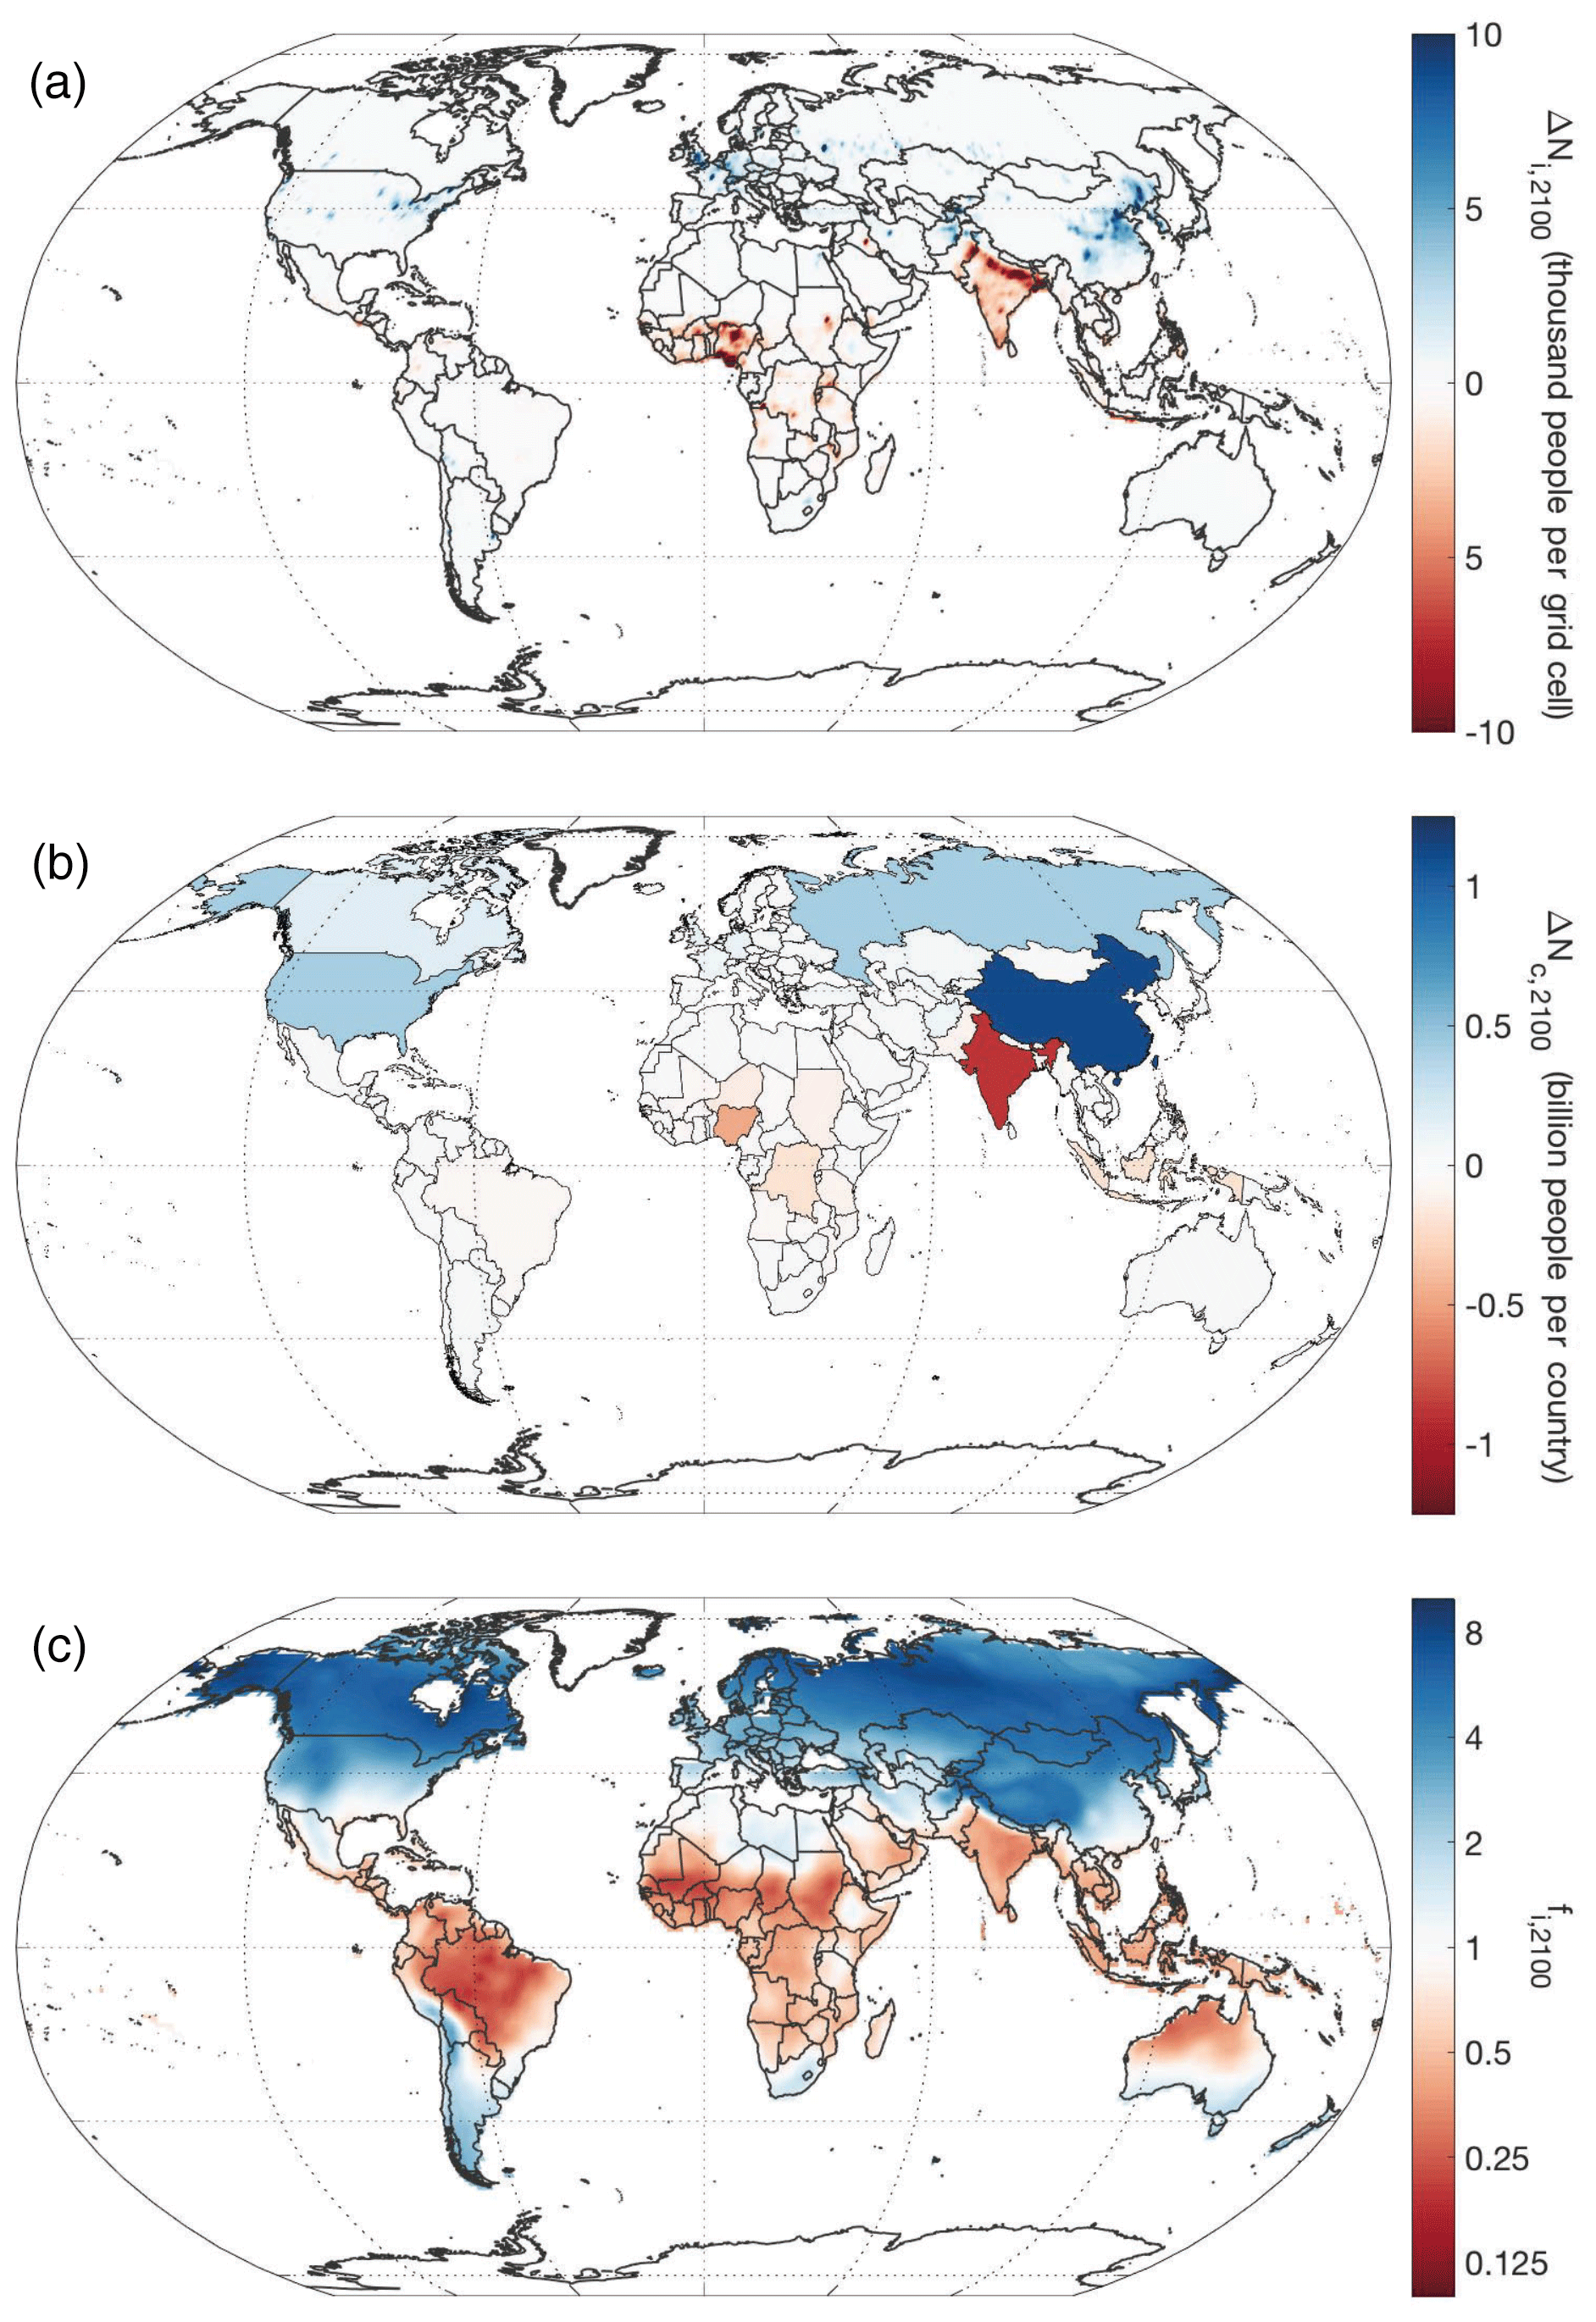
Figure 1The number of people for whom climate change is projected to provide additional incentive to migrate under RCP8.5 per grid cell: (a) ΔNi,2100 (in thousands of people per grid cell) and (b) ΔNc,2100 (in billions people per country). (c) The fractional change in the population that would be required to offset the influence of climate change on the relative attractiveness of living in a particular location for the year 2100 (fi,2100) under scenario RCP8.5 . To isolate the effect of climate change on incentives to migrate, all factors are held constant, except for climate and country-level population. Of course, many other factors influence migration decisions.
Under RCP8.5, India has the largest negative ΔNc,2100 value among countries (0.89 billion, range from 0.77 to 1.10 billion; Fig. 1b), followed by Nigeria (0.46 billion, range from 0.38 to 0.58 billion). The other countries with the largest negative ΔNi,2100 values are the Democratic Republic of Congo (0.20 billion), Indonesia (0.18 billion), Niger (0.14 billion), Sudan (0.11 billion), the Philippines (0.10 billion), Bangladesh (0.09 billion), Tanzania (0.09 billion), and Pakistan (0.08 billion). In contrast, China, Russia, and the United States all have positive ΔNc,2100 values.
The fi,2100 metric is less than 0.3 in parts of the northern African tropical savanna, tropical South America, and tropical Asia under RCP8.5, indicating that future incentives to migrate from those areas may be substantial. The fi,2100 metric is >5 in much of Canada, Russia, and Scandinavia, as well as parts of the United States and China (Fig. 1c), which could indicate that – in the absence of other barriers – these regions could become migration destinations. Results for RCP2.6, RCP4.5, and RCP6.0 show similar spatial patterns but at a lower magnitude (Fig. S1).
The countries with the largest projected population growth by the year 2100 tend to be countries with the largest negative ΔNc,2100 values (Fig. 2). The equation explains 79 % of the variation in population-weighted ΔNc,2100 (best estimate ±1 standard error). Figure 2 shows that the average projected population increase from 2005 to 2100 (ΔWc,2100; on the x axis) is negatively correlated with the number of people in each country with additional incentive to emigrate (ΔNc,2100; on the y axis). About 70 % of the projected global population in the year 2100 lives in a country that is expected to experience population growth and for which ΔNc,2100 is <0 (lower right quadrant in Fig. 2). In contrast, 14 % of the global population in 2100 is projected to live in a country with a population lower than today and for which ΔNc,2100 is >0 (upper left quadrant in Fig. 2). Similar patterns are found under other scenarios (Fig. S2).
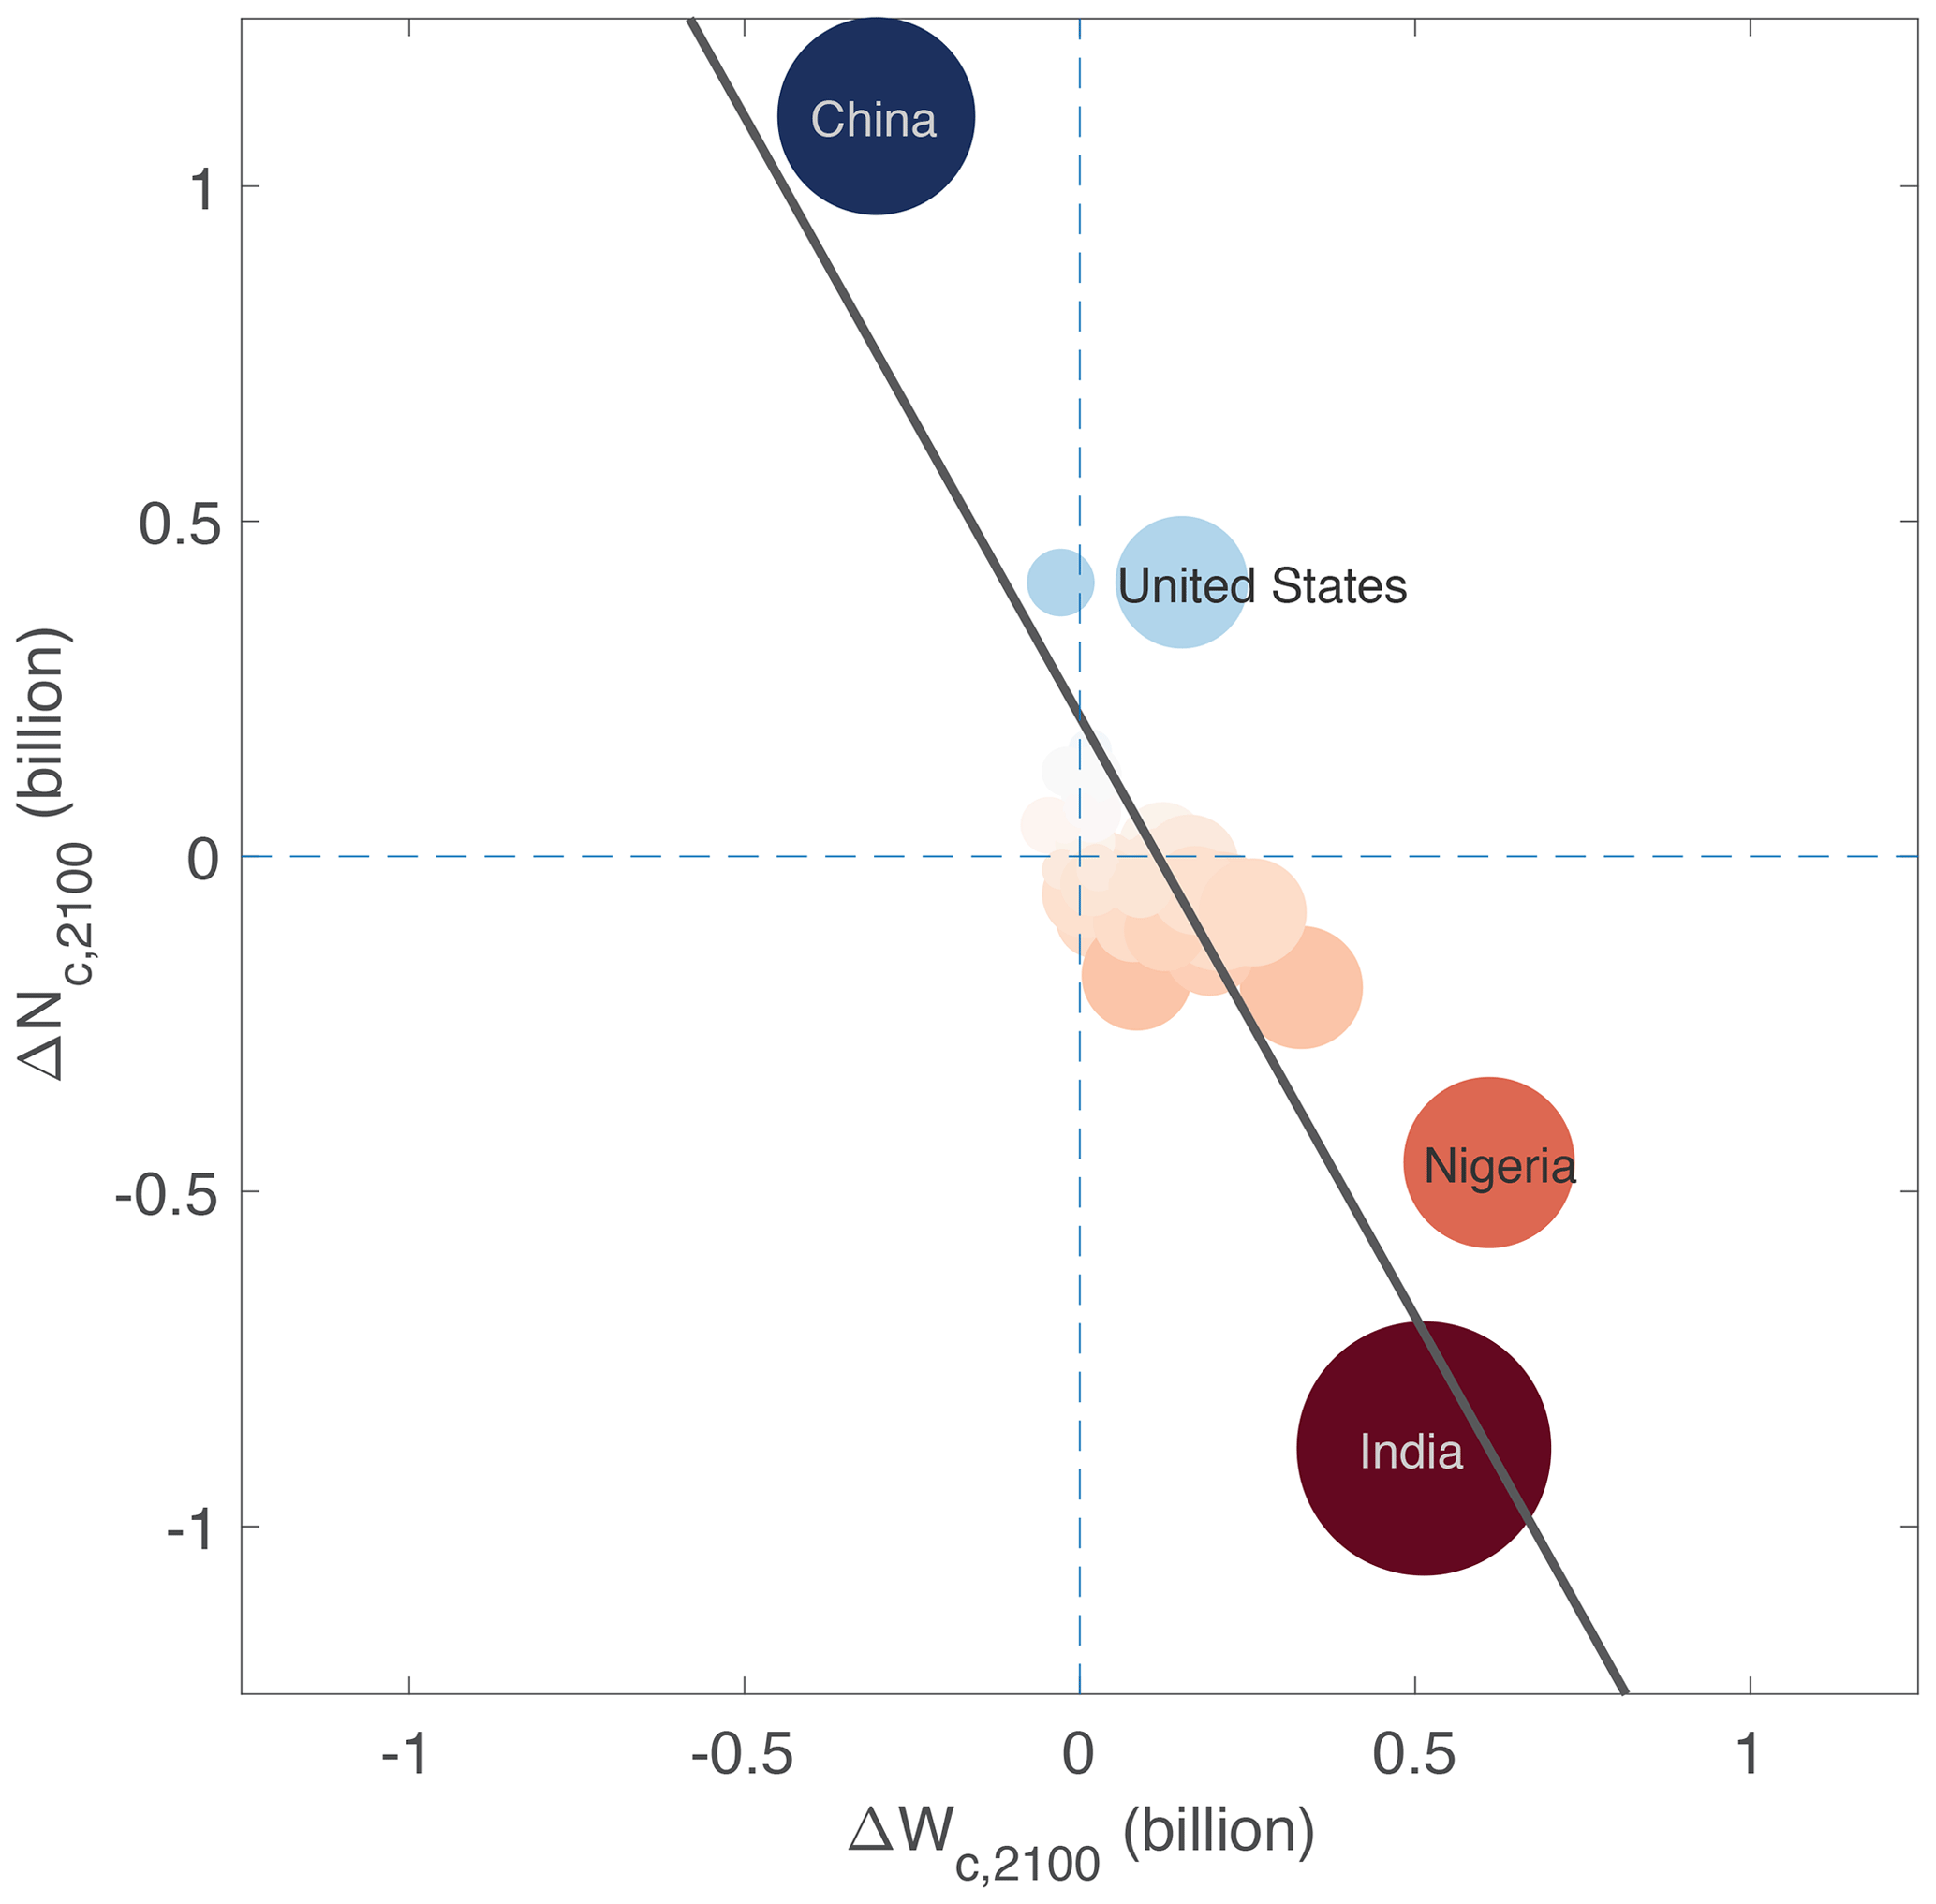
Figure 2Country-level projections for population increase in the year 2100 relative to the year 2005 (, x axis) and the number of people for whom climate change is projected to provide additional incentive to migrate under RCP8.5 (ΔNc,2100; y axis). The areas of the circles are proportional to the year 2100 population. The color scale is as per Fig. 1b. The line shows the population-weighted linear trend. Negative values on the y axis indicate additional incentive to emigrate; positive values indicate countries that increase in relative attractiveness. The results hold all factors constant, except for climate and country-level population. The data used to produce this figure are provided in Table S3.
Figure 3 shows ΔNi,y values integrated over all grid cells with ΔNi,y<0, indicating the number of people for whom climate change may produce an additional incentive to migrate. Under all of the RCP scenarios, this integrated value increases over the next few decades (Fig. 3), reaching 0.6 to 1.9 billion people by 2050 (depending on RCP scenario). By the year 2100 under RCP8.5, this number increases to about 3.8 billion people (range from 3.3 to 4.9 billion people), which is about one-third of the projected global population in 2100.
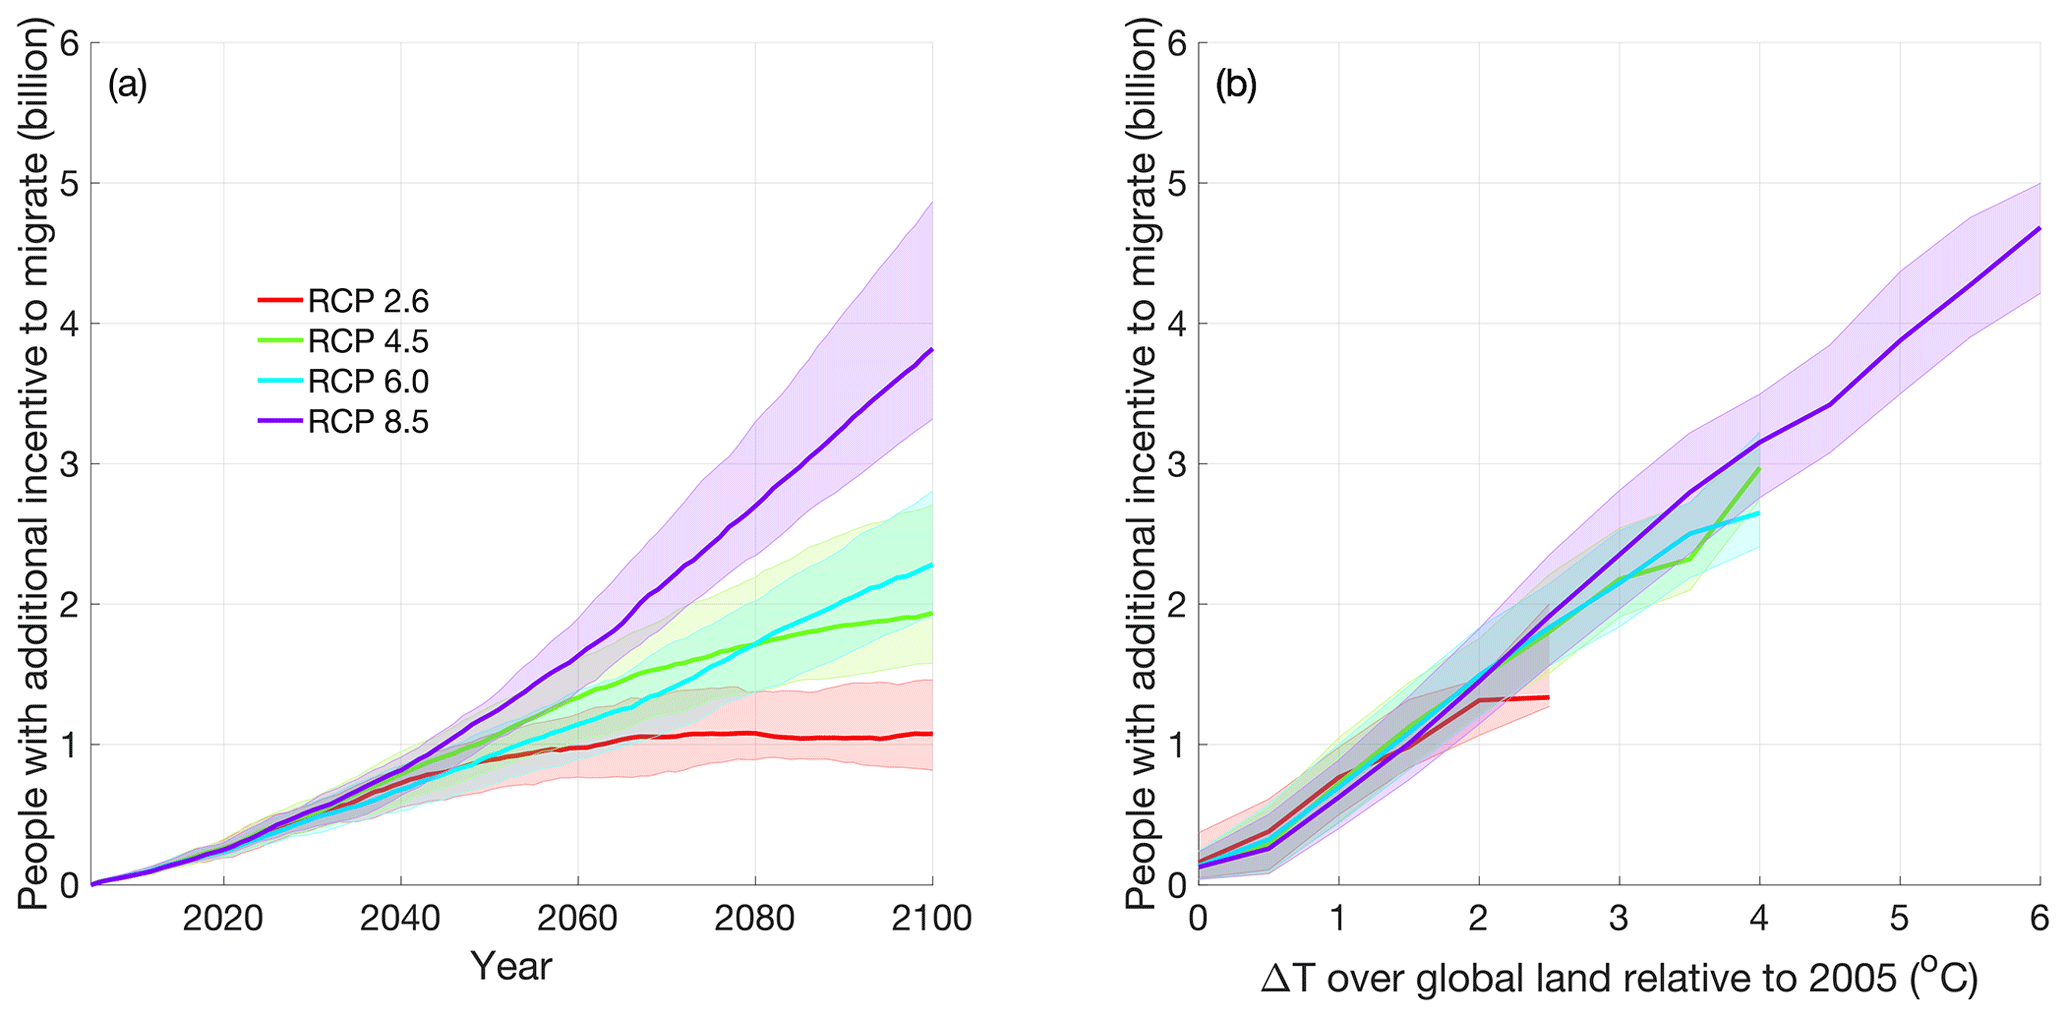
Figure 3(a) The number of people projected to experience additional climate-related incentive to emigrate under four Representative Concentration Pathways (RCPs) against years, and (b) the number of people projected to experience additional climate-related incentive to emigrate against the change in the 30-year moving mean temperature over global land relative to 2005. The lines show the median value across CMIP5 models with results from 66 % of the models falling within the shaded area. The results hold all factors constant, except for climate and country-level population.
In this section, we discuss some of the relevance of the results of our calculations for the real world. We intend our quantitative results to indicate possible orders of magnitude and global-scale spatial patterns of people with changed incentives; we do not intend our results to be interpreted as quantitative predictions of future climate-induced human migration.
It is clear that population distributions are related to climate variables. Population densities tend be very low in both very hot areas (e.g., Death Valley) and very cold areas (e.g., Alaska) and tend to be relatively high in areas with intermediate temperatures (e.g., New York City). Similarly, population densities tend to be low in very dry areas (e.g., central Australia) and very wet areas (e.g., northern Australia) and relatively high where there is an intermediate amount of precipitation (e.g., Sydney, Australia). Our calculations consider changes in temperature and precipitation only, under the artificial assumption that all other factors remain constant. Further, our calculation treats the relationship between climate and incentive to move as constant in time. However, factors such as the availability of indoor work in air-conditioned environments would surely modify these relationships. This study isolates a narrow range of factors under ceteris paribus assumptions. We hope that our study motivates efforts to quantitatively address the panoply of factors that can influence migration decisions.
Our highly idealized calculations are intended to indicate the scale and geographical distribution of people for whom climate change might provide an additional incentive to migrate. Our calculations also indicate the regions that climate change might make more attractive to potential migrants. Clearly, migration decisions are influenced by a wide range of factors (Fussell et al., 2014; McLeman and Hunter, 2010). Further, there is often a substantial incentive to avoid migration entirely; thus, additional incentive to migrate does not imply an overall positive net incentive to migrate. Consequently, the number of people who will have positive net incentive to migrate as a result of climate change is less than the number of people for whom climate change will provide an additional incentive to migrate. Migration is one of many possible adaptive responses to climate change. For example, people might choose to cool interior spaces with air conditioners (Barreca et al., 2016). Another response could be a shift from agricultural work in rural environments to industrial or service-sector jobs in more urbanized environments (Jiang and O'Neill, 2017; Neill et al., 2010). Thus, migration flows can be influenced by differences in the types of development and not only climatic factors.
Our results indicate that India may be the country that will contain the largest number of people for whom climate change may provide an additional incentive to emigrate. West Africa, in particular Nigeria, may be the second most important area in this regard (Fig. 1a, b). This is largely a consequence of the high population densities in areas that are already warm and are projected to get warmer. Our results indicate that many people living in the Amazon region would have additional incentive to emigrate, but the population density is generally low. More generally, climate change may provide many people living in the tropics with additional incentive to emigrate (Fig. 1c). In contrast, our regression equations indicate that, from a purely climatic perspective, climate change may increase the attractiveness of northern countries, such as China, Russia, Canada, Norway, Sweden, and Finland, relative to most other parts of the world.
There is a country-level correlation between projected population increase and the degree to which climate change is projected to provide additional incentive to emigrate. This correlation suggests that population increases have the potential to exacerbate the negative effects of climate change in much of the world. Over two-thirds of the global population in 2100 is projected to live in a country with a greater population than today and for which climate change may provide additional incentive to emigrate. In contrast, about one in seven people are projected to live in a country with a lower population and where climate change may cause the location to become relatively more attractive. China is the largest country that is expected to experience both a decrease in population and an increase in climate-related relative attractiveness. Moreover, our calculations suggest that India could be the largest potential source of climate emigrants and that China could potentially be the largest potential destination for climate immigrants (Fig. 1b). However, immigration in China is currently very limited (Abel and Sander, 2014). Thus, barriers to migration in Southeast Asia could potentially become an important source of future climate-related conflict (Hsiang et al., 2013).
Climate change may provide hundreds of millions of people with additional incentive to migrate over the coming decades and potentially billions of people with additional incentive to migrate by the end of this century (Fig. 3). Approximately 0.8 billion people are provided with additional incentive to migrate per 1 ∘C increase in air temperature over global land (Fig. 3b). The number of people projected to have additional incentive to migrate by the year 2100 under RCP4.5 or RCP6.0 is about half that projected under RCP8.5, and the number projected under RCP2.6 is about half that projected under RCP4.5 or RCP6.0. This result points to the important role that emissions reductions may play in reducing climate-related incentives to migrate. Successful local adaptation measures could greatly reduce incentives to migrate (Adger et al., 2014).
Climate change is likely to induce a complex web of dynamical interactions at a range of spatial and temporal scales, and these interactions are not well represented by our model. A more complete treatment of migration, and not simply an examination of one possible set of incentives as we have done here, would require embedding our results in the broader context of incentives that could influence migration decisions (Piguet et al., 2011). For example, factor such as language, work, and family ties can provide strong incentive not to migrate. Therefore, projections of how climate change might affect migration are fraught with uncertainty. Nevertheless, the results of our calculations may indicate areas where climate change can be expected to provide large numbers of people with an additional incentive to migrate – primarily from the tropics to the middle and high latitudes of the Northern Hemisphere. This change in climate-driven incentives to migrate is one factor among many that need to be included in a comprehensive understanding of possible future migration flows.
The data used in this study are publicly available. The CMIP5 climate projections are available at https://pcmdi.llnl.gov/mips/cmip5/data-portal.html (Program for Climate Model Diagnosis & Intercomparison, the CMIP5 output data, last access: 2 October 2020). The G-Econ dataset is available at http://gecon.yale.edu/sites/default/files/files/Gecon40_post_final.xls (Nordhaus et al., last access: 2 October 2020) and the WPP2015 (World Population Prospects: The 2015 Revision by the United Nations Department of Economic and Social Affairs) data are available at https://population.un.org/wpp/Download/Files/5_Archive/WPP2015-Excel-files.zip (United Nations, World Population Prospects: The 2015 Revision by the United Nations Department of Economic and Social Affairs, last access: 2 October 2020). The computer scripts written in MATLAB R2017a that were used to perform our analyses are available upon request.
The supplement related to this article is available online at: https://doi.org/10.5194/esd-11-875-2020-supplement.
MC and KC conceived and designed the project and performed the computational analysis. MC wrote the first draft of the paper with subsequent development by MC and KC.
The authors declare that they have no conflict of interest.
The authors thank Bill Hayes for his efforts with respect to processing CMIP5 data. We appreciate comments from Kate Ricke and Juan Moreno-Cruz on earlier drafts of this paper. This work was supported by the Carnegie Institution for Science endowment and the Fund for Innovative Climate and Energy Research. While no financial support was provided specifically for this project, Min Chen was supported by NASA's Terrestrial Ecology program Arctic-Boreal Vulnerability Experiment (ABoVE; grant no. NNH18ZDA001N-TE). Ken Caldeira was supported primarily by the Carnegie Institution for Science.
This paper was edited by Valerio Lucarini and reviewed by two anonymous referees.
Abel, G. J. and Sander, N.: Quantifying global international migration flows., Science (New York), 343, 1520–1522, https://doi.org/10.1126/science.1248676, 2014.
Adger, W. N., Pulhin, J. M., Barnett, J., Dabelko, G. D., Hovelsrud, G. K., Levy, M., Ú. Oswald, S., and Vogel, C. H.: Human security, in: Climate Change 2014: Impacts, Adaptation, and Vulnerability. Part A: Global and Sectoral Aspects, Contribution of Working Group II to the Fifth Assessment Report of the Intergovernmental Panel of Climate Change, edited by: Field, C. B., Barros, V. R., Dokken, D. J., Mach, K. J., Mastrandrea, M. D., Bilir, T. E., Chatterjee, Ebi, M., K. L., Estrada, Y. O., Genova, R. C., Girma, B., Kissel, E. S., Levy, A. N., MacCracken, S., Mastrandrea, P. R., and White, L. L., pp. 755–791, Cambridge University Press, Cambridge, United Kingdom and New York, NY, USA, ISBN 978-1-107-05807-1 Hardback ISBN 978-1-107-64165-5 Paperback, 2014.
Afifi, T.: Economic or Environmental Migration? The Push Factors in Niger, Int. Migr., 49, e95–e124, https://doi.org/10.1111/j.1468-2435.2010.00644.x, 2011.
Barreca, A., Clay, K., Deschenes, O., Greenstone, M., and Shapiro, J. S.: Adapting to Climate Change: The Remarkable Decline in the US Temperature-Mortality Relationship over the Twentieth Century, J. Polit. Econ., 124, 105–159, https://doi.org/10.1086/684582, 2016.
Barrios, S., Bertinelli, L., and Strobl, E.: Climatic change and rural-urban migration: The case of sub-Saharan Africa, J. Urban Econ., 60, 357–371, https://doi.org/10.1016/j.jue.2006.04.005, 2006.
Bettini, G.: Climate Barbarians at the Gate? A critique of apocalyptic narratives on “climate refugees”, Geoforum, 45, 63–72, https://doi.org/10.1016/j.geoforum.2012.09.009, 2013.
Black, R., Adger, W. N., Arnell, N. W., Dercon, S., Geddes, A., and Thomas, D.: The effect of environmental change on human migration, Global Environ. Change, 21, Supplement 1, S3–S11, https://doi.org/10.1016/j.gloenvcha.2011.10.001, 2011.
Boas, I., Farbotko, C., Adams, H., Sterly, H., Bush, S., van der Geest, K., Wiegel, H., Ashraf, H., Baldwin, A., Bettini, G., Blondin, S., de Bruijn, M., Durand-Delacre, D., Fröhlich, C., Gioli, G., Guaita, L., Hut, E., Jarawura, F. X., Lamers, M., Lietaer, S., Nash, S. L., Piguet, E., Rothe, D., Sakdapolrak, P., Smith, L., Tripathy Furlong, B., Turhan, E., Warner, J., Zickgraf, C., Black, R., and Hulme, M.: Climate migration myths, Nat. Clim. Change, 9, 901–903, https://doi.org/10.1038/s41558-019-0633-3, 2019.
Bohra-Mishra, P., Oppenheimer, M., and Hsiang, S. M.: Nonlinear permanent migration response to climatic variations but minimal response to disasters, P. Natl. Acad. Sci., 111, 9780–9785, https://doi.org/10.1073/pnas.1317166111, 2014.
Davis, K. F., Bhattachan A., D'Odorico P., and Suweis S.: A universal model for predicting human migration under climate change: examining future sea level rise in Bangladesh, Environ. Res. Lett., 13, 64030, https://doi.org/10.1088/1748-9326/aac4d4, 2018.
Foresight: Migration and Global Environ. Change: Final Project Report, GOV.UK, available at: https://www.gov.uk/government/publications/migration-and-global-environmental-change-future-challenges-and-opportunities (last access: 15 July 2020), 2011.
Fussell, E., Hunter, L. M., and Gray, C. L.: Measuring the environmental dimensions of human migration: The demographer's toolkit, Global Environ. Change, 28, 182–191, https://doi.org/10.1016/j.gloenvcha.2014.07.001, 2014.
Gray, C. and Bilsborrow, R.: Environmental Influences on Human Migration in Rural Ecuador, Demography, 50, 1217–1241, https://doi.org/10.1007/s13524-012-0192-y, 2013.
Greenwood, M. J.: HUMAN MIGRATION: THEORY, MODELS, AND EMPIRICAL STUDIES*, J. Regional Sci., 25, 521–544, https://doi.org/10.1111/j.1467-9787.1985.tb00321.x, 1985.
Holobinko, A.: Theoretical and Methodological Approaches to Understanding Human Migration Patterns and their Utility in Forensic Human Identification Cases, Societies, 2, 42–62, https://doi.org/10.3390/soc2020042, 2012.
Hsiang, S. M. and Sobel, A. H.: Potentially Extreme Population Displacement and Concentration in the Tropics Under Non-Extreme Warming, Sci Rep.-UK, 6, 25697, https://doi.org/10.1038/srep25697, 2016.
Hsiang, S. M., Burke, M., and Miguel, E.: Quantifying the Influence of Climate on Human Conflict, Science, 341, 1235367, 2013.
Jiang, L. and O'Neill, B. C.: Global urbanization projections for the Shared Socioeconomic Pathways, Global Environ. Change, 42, 193–199, https://doi.org/10.1016/j.gloenvcha.2015.03.008, 2017.
Kelley, C. P., Mohtadi, S., Cane, M. A., Seager, R., and Kushnir, Y.: Climate change in the Fertile Crescent and implications of the recent Syrian drought, P. Natl. Acad. Sci., 112, 3241–3246, https://doi.org/10.1073/pnas.1421533112, 2015.
Marchiori, L., Maystadt, J.-F., and Schumacher, I.: The impact of weather anomalies on migration in sub-Saharan Africa, J. Environ. Econ. Manag., 63, 355–374, https://doi.org/10.1016/j.jeem.2012.02.001, 2012.
McLeman, R. A. and Hunter, L. M.: Migration in the context of vulnerability and adaptation to climate change: insights from analogues, Wiley Interdisciplinary Reviews: Climate Change, 1, 450–461, https://doi.org/10.1002/wcc.51, 2010.
Milan, A., Gioli, G., and Afifi, T.: Migration and global environmental change: methodological lessons from mountain areas of the global South, Earth Syst. Dynam., 6, 375–388, https://doi.org/10.5194/esd-6-375-2015, 2015.
Missirian, A. and Schlenker, W.: Asylum applications respond to temperature fluctuations, Science, 358, 1610–1614, 2017.
Mortreux, C. and Barnett, J.: Climate change, migration and adaptation in Funafuti, Tuvalu, Global Environ. Change, 19, 105–112, https://doi.org/10.1016/j.gloenvcha.2008.09.006, 2009.
Mueller, V., Gray, C., and Kosec, K.: Heat stress increases long-term human migration in rural Pakistan, Nat. Clim. Change, 4, 182–185, 2014.
Myers, N.: Environmental Refugees in a Globally Warmed World: Estimating the scope of what could well become a prominent international phenomenon, Bioscience, 43, 752–761, https://doi.org/10.2307/1312319, 1993.
Neill, B. C., Dalton, M., Fuchs, R., Jiang, L., Pachauri, S., and Zigova, K.: Global demographic trends and future carbon emissions, P. Natl. Acad. Sci., 107, 17521–17526, 2010.
New, M., Lister, D., and Hulme, M.: A high-resolution data set of surface climate over global land areas, Clim. Res., 21, 1–25, 2002.
Nordhaus, W. D.: Geography and macroeconomics: new data and new findings., P. Natl. Acad. Sci. USA, 103, 3510–3517, https://doi.org/10.1073/pnas.0509842103, 2006.
Nordhaus, W., Azam, Q., Corderi, D., Hood, K., Victor, N. M., Mohammed, M., Miltner, A., and Weiss, J.: The G-Econ data, http://gecon.yale.edu/sites/default/files/files/Gecon40_post_final.xls, last access: 2 October 2020.
Núñez, L., Grosjean, M., and Cartajena, I.: Human Occupations and Climate Change in the Puna de Atacama, Chile, Science, 298, 821–824, 2002.
Piguet, E., Pécoud, A., and de Guchteneire, P.: Migration and Climate Change: An Overview, Refugee Survey Quarterly, 30, 1–23, https://doi.org/10.1093/rsq/hdr006, 2011.
Program for Climate Model Diagnosis & Intercomparison, the CMIP5 output data, https://pcmdi.llnl.gov/mips/cmip5/data-portal.html, last access: 2 October 2020.
Rigaud, K. K., de Sherbinin, A., Jones, B., Bergmann, J., Clement, V., Ober, K., Schwe, J., Adamo, S., McCusker, B., Heuser, S., and Midgley, A.: Groundswell: Preparing for Internal Climate Migration, World Bank, Washington, DC, available at: https://openknowledge.worldbank.org/handle/10986/29461 (last access: 15 July 2020), 2018.
Samson, J., Berteaux, D., McGill, J. B., and Humphries, M. M.: Geographic disparities and moral hazards in the predicted impacts of climate change on human populations, Global Ecol. Biogeogr., 20, 532–544, https://doi.org/10.1111/j.1466-8238.2010.00632.x, 2011.
Stapleton, S. O., Nadin, R., Watson, C., and Kellett, J.: Climate change, migration and displacement and coherent approach, Research reports and studies, Overseas Development Institute, London, UK. pp. 35 https://www.odi.org/sites/odi.org.uk/files/resource-documents/11874.pdf, 2017.
Suhrke, A.: Environmental Degradation and Population Flows, J. Int. Aff., 47, 473–496, 1994.
Taylor, K. E., Stouffer, R. J., and Meehl, G. A.: An Overview of CMIP5 and the Experiment Design, B. Am. Meteorol. Soc., 93, 485–498, https://doi.org/10.1175/BAMS-D-11-00094.1, 2012.
United Nations, World Population Prospects: The 2015 Revision by the United Nations Department of Economic and Social Affairs, https://population.un.org/wpp/Download/Files/5_Archive/WPP2015-Excel-files.zip, last access: 2 October 2020.
Vuuren, D. P., Edmonds, J., Kainuma, M., Riahi, K., Thomson, A., Hibbard, K., Hurtt, G. C., Kram, T., Krey, V., Lamarque, J.-F., Masui, T., Meinshausen, M., Nakicenovic, N., Smith, S. J., and Rose, S. K.: The representative concentration pathways: an overview, Climatic Change, 109, 5–31, https://doi.org/10.1007/s10584-011-0148-z, 2011.