the Creative Commons Attribution 4.0 License.
the Creative Commons Attribution 4.0 License.
 | 15 Oct 2019
Modeling forest plantations for carbon uptake with the LPJmL dynamic global vegetation model
Maarten C. Braakhekke
Jonathan C. Doelman
Peter Baas
Christoph Müller
Sibyll Schaphoff
Elke Stehfest
Detlef P. van Vuuren
We present an extension of the dynamic global vegetation model, Lund–Potsdam–Jena Managed Land (LPJmL), to simulate planted forests intended for carbon (C) sequestration. We implemented three functional types to simulate plantation trees in temperate, tropical, and boreal climates. The parameters of these functional types were optimized to fit target growth curves (TGCs). These curves represent the evolution of stemwood C over time in typical productive plantations and were derived by combining field observations and LPJmL estimates for equivalent natural forests. While the calibrated model underestimates stemwood C growth rates compared to the TGCs, it represents substantial improvement over using natural forests to represent afforestation. Based on a simulation experiment in which we compared global natural forest versus global forest plantation, we found that forest plantations allow for much larger C uptake rates on the timescale of 100 years, with a maximum difference of a factor of 1.9, around 54 years. In subsequent simulations for an ambitious but realistic scenario in which 650 Mha (14 % of global managed land, 4.5 % of global land surface) are converted to forest over 85 years, we found that natural forests take up 37 PgC versus 48 PgC for forest plantations. Comparing these results to estimations of C sequestration required to achieve the 2 ∘C climate target, we conclude that afforestation can offer a substantial contribution to climate mitigation. Full evaluation of afforestation as a climate change mitigation strategy requires an integrated assessment which considers all relevant aspects, including costs, biodiversity, and trade-offs with other land-use types. Our extended version of LPJmL can contribute to such an assessment by providing improved estimates of C uptake rates by forest plantations.
- Article
(6023 KB) - Full-text XML
-
Supplement
(1389 KB) - BibTeX
- EndNote


It is increasingly clear that the stringent climate targets of the Paris Agreement cannot be achieved without negative emissions, i.e., net removal of carbon (C) from the atmosphere later during the 21st century, to compensate for emissions in the first half of the century (Gasser et al., 2015; Rogelj et al., 2018). Of the many proposed techniques to achieve C uptake, the two options currently most discussed for large-scale implementation are bioenergy in combination with carbon capture and storage and afforestation (Williamson, 2016). Both approaches will require considerable amounts of land and thus compete with other land-use functions, for example, food production and biodiversity. While bioenergy is receiving considerable attention (van Vuuren et al., 2013), less consideration has been given to afforestation as a tool for land-based mitigation. C uptake occurs when natural vegetation is allowed to grow back on former croplands and pasture. While deliberately taking cropland or pasture out of production may involve costs, the direct management costs of natural regrowth are negligible. The carbon uptake rate of such natural regrowth, however, will usually achieve only a fraction of the potential C uptake rate at short timescales. Considerably higher C uptake rates are possible by planting forests (Paquette and Messier, 2010). Assisting regrowth by planting trees can substantially boost growth rates compared to natural forests because initial stages of primary succession (with herbaceous or shrub vegetation) are skipped and because fast-growing tree species can be selected. Moreover, trees are usually planted as saplings, cultivated under controlled conditions, which improves the chance of successful establishment compared to development from seeds (Gladstone and Thomas Ledig, 1990).
Assessing the potential of land-based approaches for climate mitigation requires reliable estimates of C sequestration rates. Process-based models, such as dynamic global vegetation models (DGVMs), are a crucial tool for providing these estimates. DGVMs simulate carbon stocks and fluxes based on mechanistic descriptions of underlying processes, such as photosynthesis and organic matter decomposition in relation to environmental conditions. However, since the focus of DGVM development has traditionally been on natural ecosystems, very few of these models have an explicit representation of planted forests. Therefore, previous modeling studies on large-scale afforestation represented afforestation as natural regrowth (Krause et al., 2017), in some cases applying corrections to account for higher growth rates (Humpenoder et al., 2014; van Minnen et al., 2008).
In this paper, we present an updated version of the Lund–Potsdam–Jena Managed Land (LPJmL) DGVM (Bondeau et al., 2007; Schaphoff et al., 2013), modified to explicitly represent afforestation. Three new plant functional types have been implemented in order to represent planted forests in temperate, tropical, and boreal regions. The parameters of these plantation types were estimated based on observations of stemwood carbon from real-world forest plantations. Using this new LPJmL version, we present a global assessment of potential carbon sequestration rates in forest plantations and compare these to rates achieved by letting forests grow back naturally.
2.1 The LPJmL dynamic global vegetation model
LPJmL is a global process-based model simulating vegetation dynamics and fluxes of carbon and water in the vegetation and soil of terrestrial ecosystems (Bondeau et al., 2007; Schaphoff et al., 2013; Sitch et al., 2003), including agricultural land and biomass plantations for bioenergy production (Beringer et al., 2011). The model runs primarily on a daily time step, except for C allocation, vegetation dynamics, and disturbances for natural vegetation and biomass plantations, which are resolved annually. Forcing consists of monthly climate variables (air temperature, precipitation, cloud fraction, and number of wet days per month) – which are interpolated to daily values (Gerten et al., 2004) – and annual atmospheric CO2 concentrations. Using a combination of plant physiological relations, generalized empirically established functions, and plant trait parameters, LPJmL simulates processes such as photosynthesis, plant growth, maintenance and regeneration losses, fire disturbance, soil moisture dynamics, runoff, evapotranspiration, irrigation, and vegetation structure (Schaphoff et al., 2013). Natural vegetation is represented as a number of plant functional types (PFTs): aggregated vegetation classes representing variation in leaf type (broadleaf, needleleaf), phenology (summergreen, evergreen, raingreen), and climate preference (boreal, temperate, tropical). Most model parameters related to vegetation are defined separately for each PFT. The model simulates the occurrence of each PFT based on bioclimatic limits and competition with other PFTs for resources. Agricultural ecosystems are handled in a separate module and are represented by a range of crop functional types (Bondeau et al., 2007). Additionally, one herbaceous and two woody PFTs are implemented to simulate short-rotation bioenergy plantations (Beringer et al., 2011). Area fractions specifying allocation to different land-use types are part of the model input. Finally, the model can simulate river discharge, surface water reservoirs, and several types of irrigation. LPJmL has been coupled to the IMAGE integrated assessment model, serving as the land surface component (Müller et al., 2016; Stehfest et al., 2014).
In all simulations for this study, the model was forced by semi-constant monthly climate input, representative of the period 1980–2010. This dataset was derived by repeating a cycle of detrended time series for this period, taken from the Climate Research Unit (CRU) TS3.23 global gridded (0.5∘ × 0.5∘) climate dataset (Harris et al., 2014). For simplicity, we chose to ignore the effect of atmospheric CO2 concentration change at this stage; hence, this variable was held fixed at the mean global value for 1980–2010 (362.4 ppmv). Fire disturbance was not considered. Further information on the model input and configuration is given in subsequent sections.
2.2 Forest plantations
LPJmL was extended to represent forest plantations. Specifically, a new land-use type was added, as well as three functional types to represent trees in temperate, tropical, and boreal plantations. These types – referred to as forest plantation functional types (FPFTs) – are derived from the natural PFTs (temperate broadleaved summergreen tree, tropical broadleaved evergreen tree, and boreal needleleaf evergreen tree, respectively). The occurrence of the FPFTs is subject to the same establishment and mortality rules used for natural PFTs. However, the bioclimatic limits are set such that they do not overlap; hence, co-occurrence of different FPFTs in a single grid cell is rare, occurring only when climate fluctuates near a boundary between two types.
Structurally, the implementation largely follows that of the woody bioenergy plantations implemented in LPJmL (Beringer et al., 2011), which in turn are based on equivalent natural PFTs. Contrary to bioenergy trees, forest plantations are not automatically clear cut after a fixed rotation period, but a fraction of the plantation fraction may be harvested, specified as model input. However, for the purpose of this study, harvest was set to zero. Forest plantation PFTs also differ from other PFTs with regard to establishment of new trees. A fixed initial planting density (Pinit) was introduced, which determines the number of trees per unit area at planting. After planting, establishment of new trees occurs similarly to natural PFTs: at fixed maximum rate, downscaled according to an exponentially declining function of foliar projective cover. Generally, stand density will decrease after plantation due to self-thinning, implemented according to Reineke's rule (Reineke, 1933), which relates stem diameter to crown area. When the area-fraction of forest plantations in a given grid cell increases over time, establishment is determined as a combination of Pinit and the standard establishment rate, weighted according to the old forest plantation fraction and the fraction added.
2.3 Calibration
2.3.1 General setup
To obtain realistic growth rates, we calibrated several FPFT-specific parameters, based on published observed growth data for forest plantations. Ideally, calibration of dynamic vegetation models should be performed using detailed observations for a given site. However, this requires a large amount of data, both for model input and to compare to model output to assess performance. While much data on growth of forest plantations have been published, the number of forest plantation sites for which calibration data as well as data for model input are available for sufficiently long time periods is not enough to derive globally applicable parameter sets. Therefore, we chose a different approach. Rather than aiming to reproduce site-level observations, we calibrated the model in order to obtain desired mean biome-level behavior for each of the three FPFTs. For every iteration in the calibration, the model was run for a selection of 100 grid cells from the spatial domain of the FPFT being calibrated. Subsequently, model output for the relevant variables was aggregated over all grid cells and compared to observed values to determine model performance.
Within the spatial domain for a given FPFT, many grid cells exist where growth is marginal due to unfavorable climate and/or soil properties. The observations used in the calibration are not representative of these locations, since forest plantations from which data have been retrieved can be assumed to represent locations where productivity is sufficient for economic profitability. Therefore, rather than choosing grid cells randomly, the selection was limited to locations for which LPJmL simulates relatively high productivity. This was done based on results from a 300-year simulation with only natural vegetation, in the same setup as the one used in the calibration (see Sect. 2.3). For each FPFT, 100 cells were selected for which the simulated stemwood C storage of the corresponding natural PFT (see Sect. 2.2) exceeds the 70th percentile over the complete domain where this PFT is dominant, i.e., has highest foliar projective cover (Fig. 1). During the calibration, LPJmL was run only for these cells, with land-use type set to forest plantations.
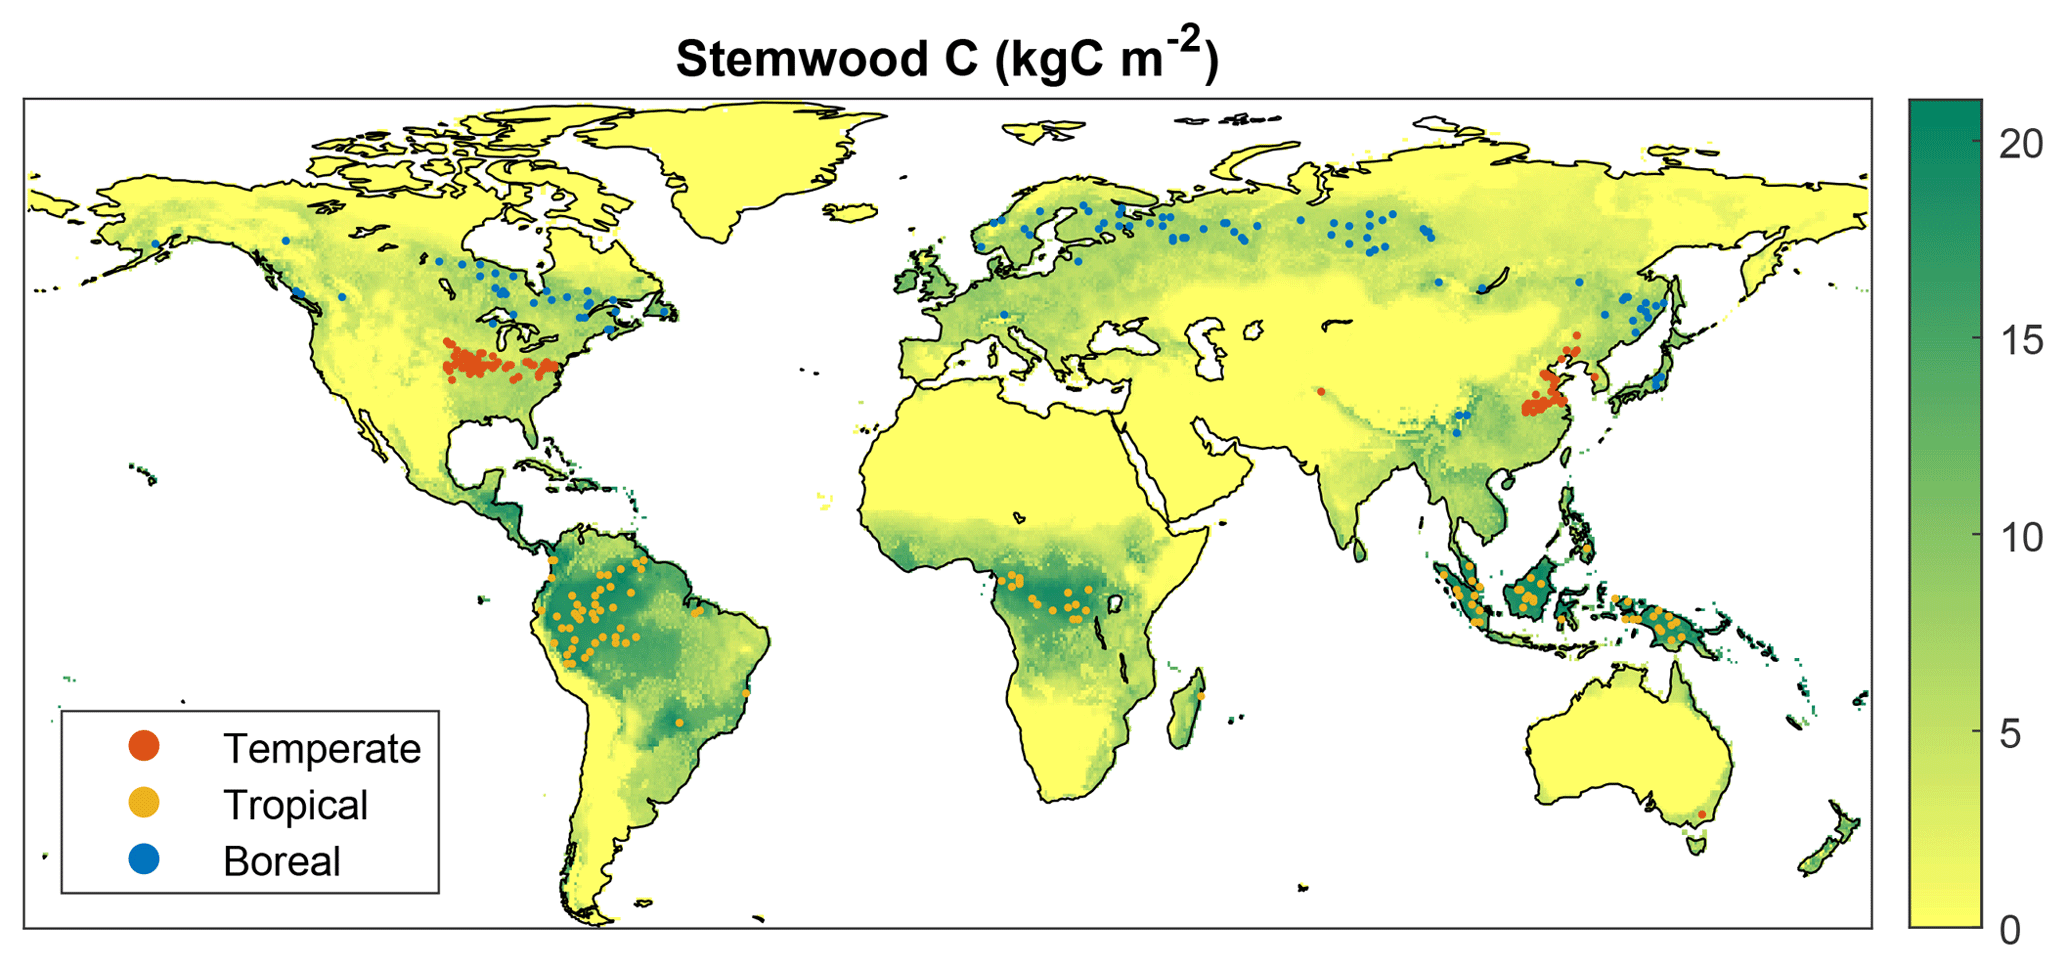
Figure 1Location of the grid cells included in calibration simulations (100 per FPFT). The map shows simulated stemwood C (kgC m−2) for a simulation with potential natural vegetation.
2.3.2 Observations
Target growth curves
Time series of stand-level stemwood C were collected from various sources in the literature. We required observations in the form of time series for a sufficiently long period to assess the growth behavior on timescales relevant to this study – at least 50 years. Due to limited data availability (see Sect. 2.3.1), a rigorous data-selection procedure was not possible; hence, the observations were collected in an ad hoc fashion. For the tropical FPFT, we used data from Brown et al. (1986), who derived time series of stemwood biomass for several species and species groups for tropical forest plantations. For the temperate and boreal FPFTs, no such compilations were available; hence, we used datasets for typical plantation species for wood production. Observations for natural poplar (Populus × euramericana) forests were taken from Cannell (1982) for the calibration of the temperate FPFT. For the boreal FPFT, we used data for Scots pine (Pinus sylvestris) plantations from Vanninen et al. (1996). Outliers in the observations were removed using Hampel filtering (Pearson, 2002). The data are depicted in Fig. 2.
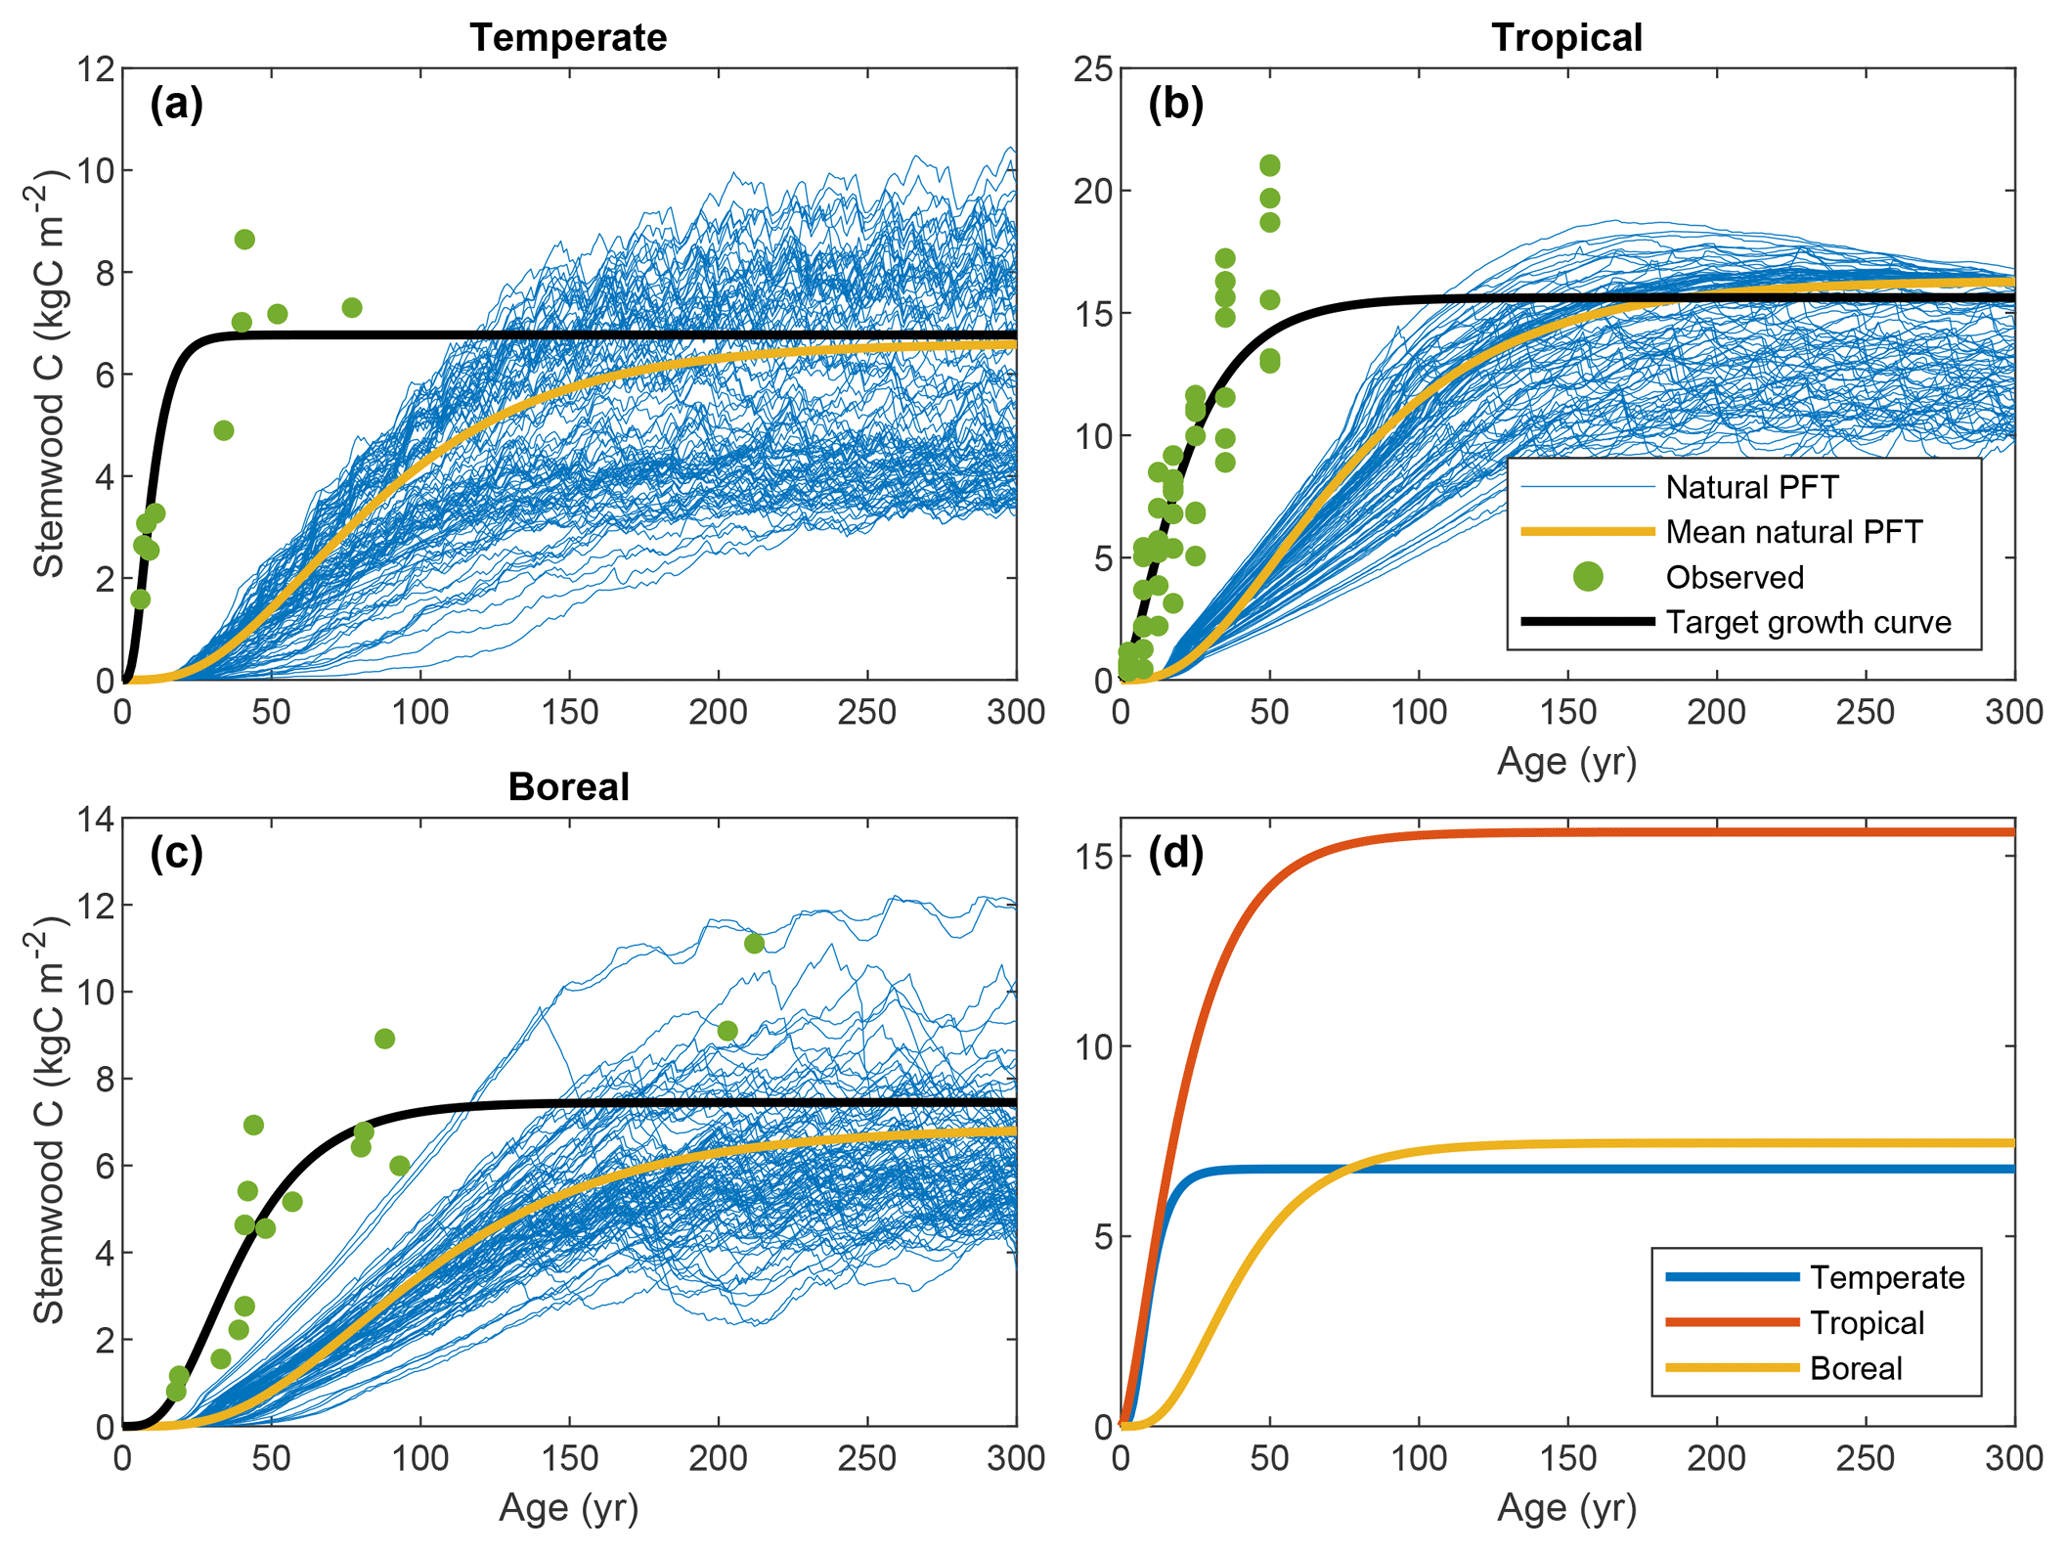
Figure 2Target growth curves for stemwood C, associated observations, and LPJmL output for natural vegetation in the cells selected for calibration.
Since most forest plantations are grown for timber production, they are harvested approximately at the optimal rotation length for maximum wood production, which is well before the trees reach maturity. Hence, growth data for higher tree ages are scarce. Calibrating LPJmL against these observations alone would result in excessive weight on the earlier part of the curve, leading to unpredictable results for the later part. Therefore, we did not use the observations directly in the LPJmL calibration but used them to derive growth curves representing the typical growing behavior of productive plantations for each FPFT. We refer to these as the target growth curves (TGCs). The general structure of the TGCs is given by the Chapman–Richards function, which is widely used to model forest growth (e.g., Von Gadow and Hui, 1999). It defines the stemwood C (CSWC) at time t as
where CSWC,max is the maximum CSWC, k is the growth rate, and p is a shape parameter determining the timing of maximum growth. These parameters were estimated using a Bayesian non-linear regression approach. The scarcity of high-age observations was solved by constraining CSWC,max using a prior distribution based on LPJmL output for the corresponding natural PFTs from the 300-year simulation used to select the calibration grid cells (see Sect. 2.3.1). Specifically, for each FPFT, we used the mean simulated stemwood C of the last 10 simulation years, averaged over the 100 calibration cells as a representative value.
The parameters were estimated using Markov chain Monte Carlo (MCMC) sampling. The samples with highest posterior density, together with the variances over the marginal posterior distributions, were used in the LPJmL calibration. Further details are given in the Supplement.
Additional constraints
Initial tests showed that parameter sets derived by calibration with the TGCs alone result in unrealistically high values of net primary production (NPP), leading to similarly high litter fluxes and soil carbon storage. This was traced to a higher carbon use efficiency (CUE) – the ratio of NPP to gross primary productivity – and a lower vegetation carbon turnover time (τvegC; vegetation-C-to-NPP ratio) compared to the natural PFT counterparts. Therefore, to assure realistic carbon fluxes and storage, we implemented additional constraints for these variables in the calibration. These constraints are based on LPJmL simulations for the natural PFT counterparts of the FPFTs, similar to the maximum stemwood C of the target growth curves (see Table 2 and Fig. 4).
Additionally, it was found that certain parameter sets, while leading to acceptable mean results, cause simulated trees for certain cells to die-off repeatedly at regular intervals. In order to avoid this, we modified the calibration such that a penalty was added to the cost function when this occurs.
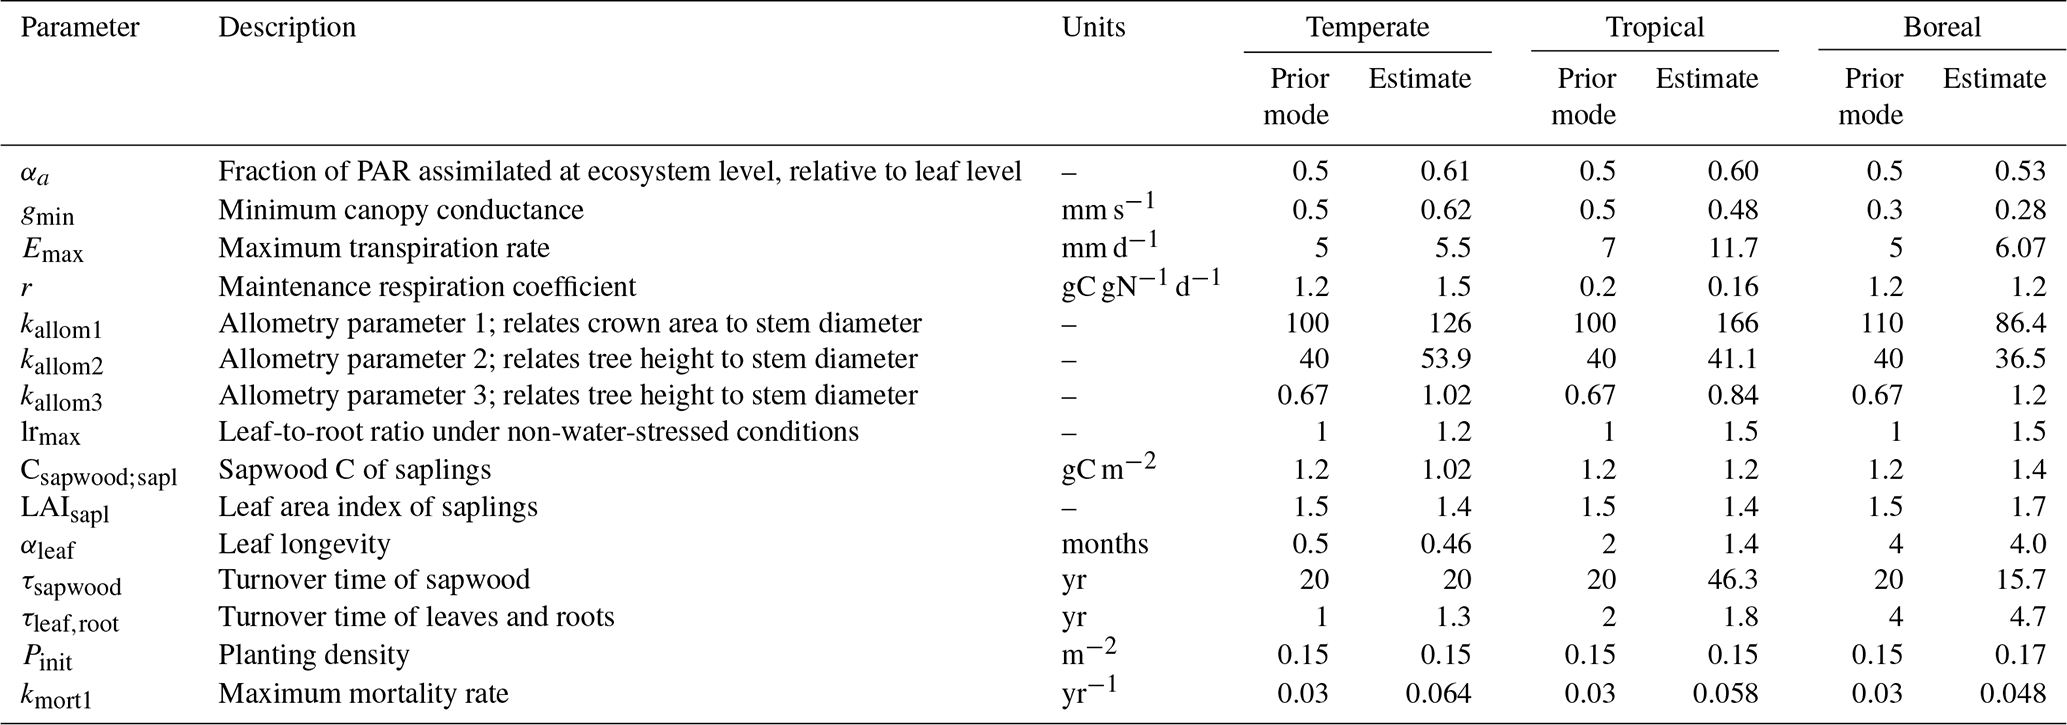
Table 1LPJmL parameters included in the calibration. “Prior mode” refers to the most probable value indicated by the prior distribution.
2.3.3 Parameter estimation
In the calibration, 15 parameters were estimated, separately for each FPFT (Table 1). The calibration was performed on a transformed scale (logit for αa; log for all other parameters), in view of the lower bound at zero (and upper bound at 1 for αa). We applied a Bayesian cost function, including informative prior distributions. Priors express belief about reasonable parameter values before the calibration in the form of probability distributions and help to avoid unrealistic values, particularly for parameters that have little influence on the relevant model output. The priors were chosen such that their central tendency reflects existing parameter values for the corresponding natural PFTs, with a relatively wide variance to avoid overly strong influence on the calibration. Full specification of the priors is given in the Supplement (Sect. S1).
Similar to the parameters, all observations were transformed in the calibration (logit for CUE; log for all other observations). For the calibration simulations, LPJmL was started from zero vegetation and soil C and run for a period of 300 years, sufficient for the vegetation C to reach equilibrium with reasonable parameter values. LPJmL simulates heartwood and sapwood C pools but does not distinguish between stem, branches, and coarse roots. For the purpose of the calibration, we assumed that all heartwood and 66 % of the sapwood are located aboveground (Müller et al., 2016), and 84 % of aboveground wood is located in the stem (which is representative of mature trees; Pretzsch, 2010).
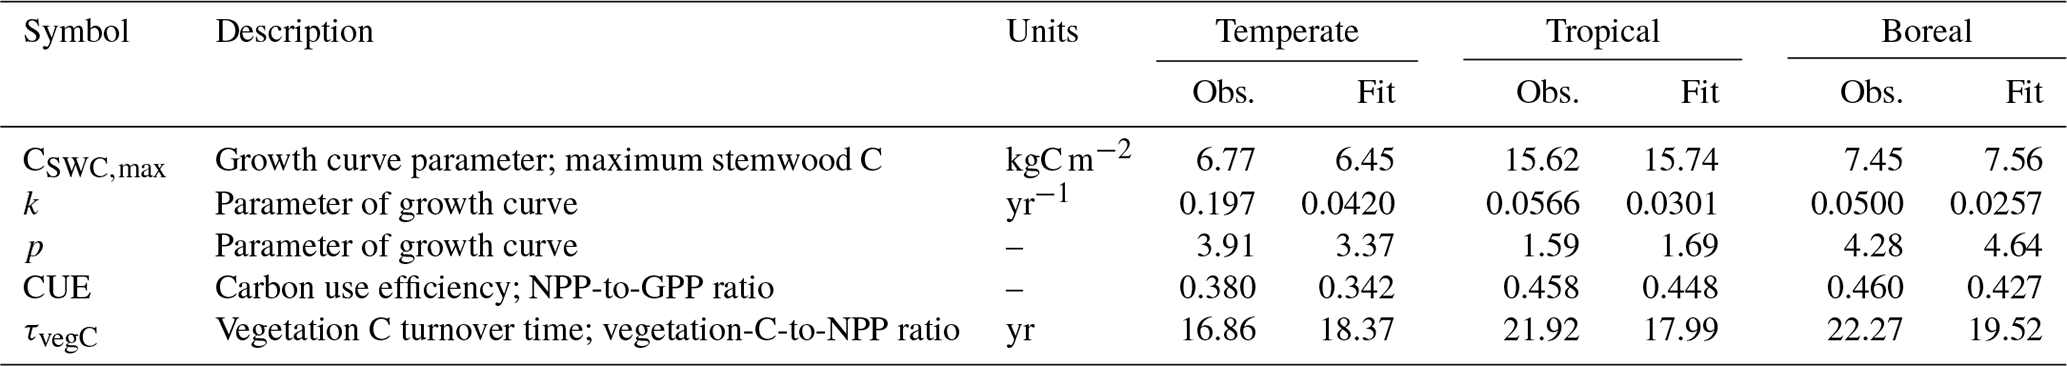
Table 2Observations and corresponding fits for the 100 included grid cells included in the calibration. Observed values correspond to the mode of the likelihood function.
After simulation, the Chapman–Richards function was fitted to the time series of simulated stemwood C for the 100 grid cells (using non-linear least squares) to derive FPFT-mean estimates of CSWC,max, k, and p based on LPJmL predictions. Carbon use efficiency and vegetation turnover time were determined for the last 10 years of the simulation, averaged over the 100 grid cells. The observations were subsequently compared to the corresponding observations to determine log-likelihood, and combined with log prior density to determine the overall cost C(θ) for the given parameter set θ. Further details are given in Sect. S2.
The optimal parameter set (with minimal value of C) was derived using the GENOUD algorithm (Mebane Jr. and Sekhon, 2011), which combines a genetic algorithm with a gradient search approach. This algorithm has previously been applied to calibrate LPJmL (Forkel et al., 2014). An additional description is given in Sect. S2.
2.4 Global simulations
After calibration, several global simulations were performed. First, in order to assess sequestration potential of afforestation, a simulation was run in the same setup as the one used for the calibration, i.e., starting with zero vegetation and soil C and with land fully allocated to forest plantations and running for 300 years so that the vegetation C pool can reach equilibrium. Additionally, a simulation with land fully allocated to natural vegetation was performed to compare natural regrowth and afforestation as land-based mitigation options.
Second, we applied the model for an ambitious scenario of large-scale afforestation, assuming that from 2015 onwards approximately 14 % of global managed land is (corresponding to 650 Mha or 4.5 % of global land surface) gradually replaced by forest plantations over the course of 85 years. This afforestation area is in line with the average land area used for land-based mitigation (both bio-energy and afforestation) in 1.5∘ mitigation scenarios in integrated assessment models (Doelman et al., 2019b; Rogelj et al., 2018). To bring soil C to reasonable values, the simulation was initialized by two spin-up phases: (1) a 1000-year phase with natural vegetation only until 1901, and (2) a phase from 1900 to 2015 with transient cropland and pasture fractions, based on the HYDE dataset (Klein Goldewijk et al., 2010). From 2015, forest plantation area was increased and crop and pasture area was decreased, balancing each other so that total area of managed (i.e., non-natural) land remained constant. From 2100, the simulation was continued for another 50 years with constant land use. For this analysis, two complementary simulations were performed. First, a simulation where fractions of natural vegetation were increased instead of forest plantations, and second, a “baseline” simulation where land-use fractions were held constant in time from 2015. Figures S2 and S3 depict the development of land-use fractions for the three scenarios.
3.1 Target growth curves
Figure 2 depicts the stemwood C observations for the three FPFTs, LPJmL simulations for the corresponding natural PFTs, and the TGCs resulting from the fitting procedure. The values of the maximum stemwood C (CSWC,max), growth rate (k), and shape parameter (p) and their marginal variances are given in Table 2 (see also Fig. S1 in the Supplement). As expected, the observations show substantially higher growth rates than simulated for the natural PFTs, as well as an earlier timing of maximum growth. The TGCs represent a compromise between the observations and the CSWC,max for natural PFTs, predicted by LPJmL: the initial high growth rate is representative of the observations, while CSWC,max is closer to that of the simulated natural PFTs and notably lower than the level indicated by the observations.
The tropical FPFT has substantially higher CSWC,max, approximately twice as high as the other two FPFTs. With respect to the relative growth rate k, however, the tropical FPFT is comparable to the boreal FPFT. The temperate FPFT approaches its maximum stemwood approximately 4 times faster. The boreal TGC has the highest value of p, resulting in a later timing of maximum growth.
3.2 LPJmL calibration
The parameter estimates resulting from the calibration are shown in Fig. 3, together with the range of the prior distributions. Most estimates are within interquartile range of the priors, but for several parameters the calibration resulted in relatively strong changes, in particular kmort1, which controls mortality due to low growth efficiency. Specifically for the tropical FPFT, the estimates also clearly deviate from the prior for Emax, kallom1, lrmax, and τsapwood.
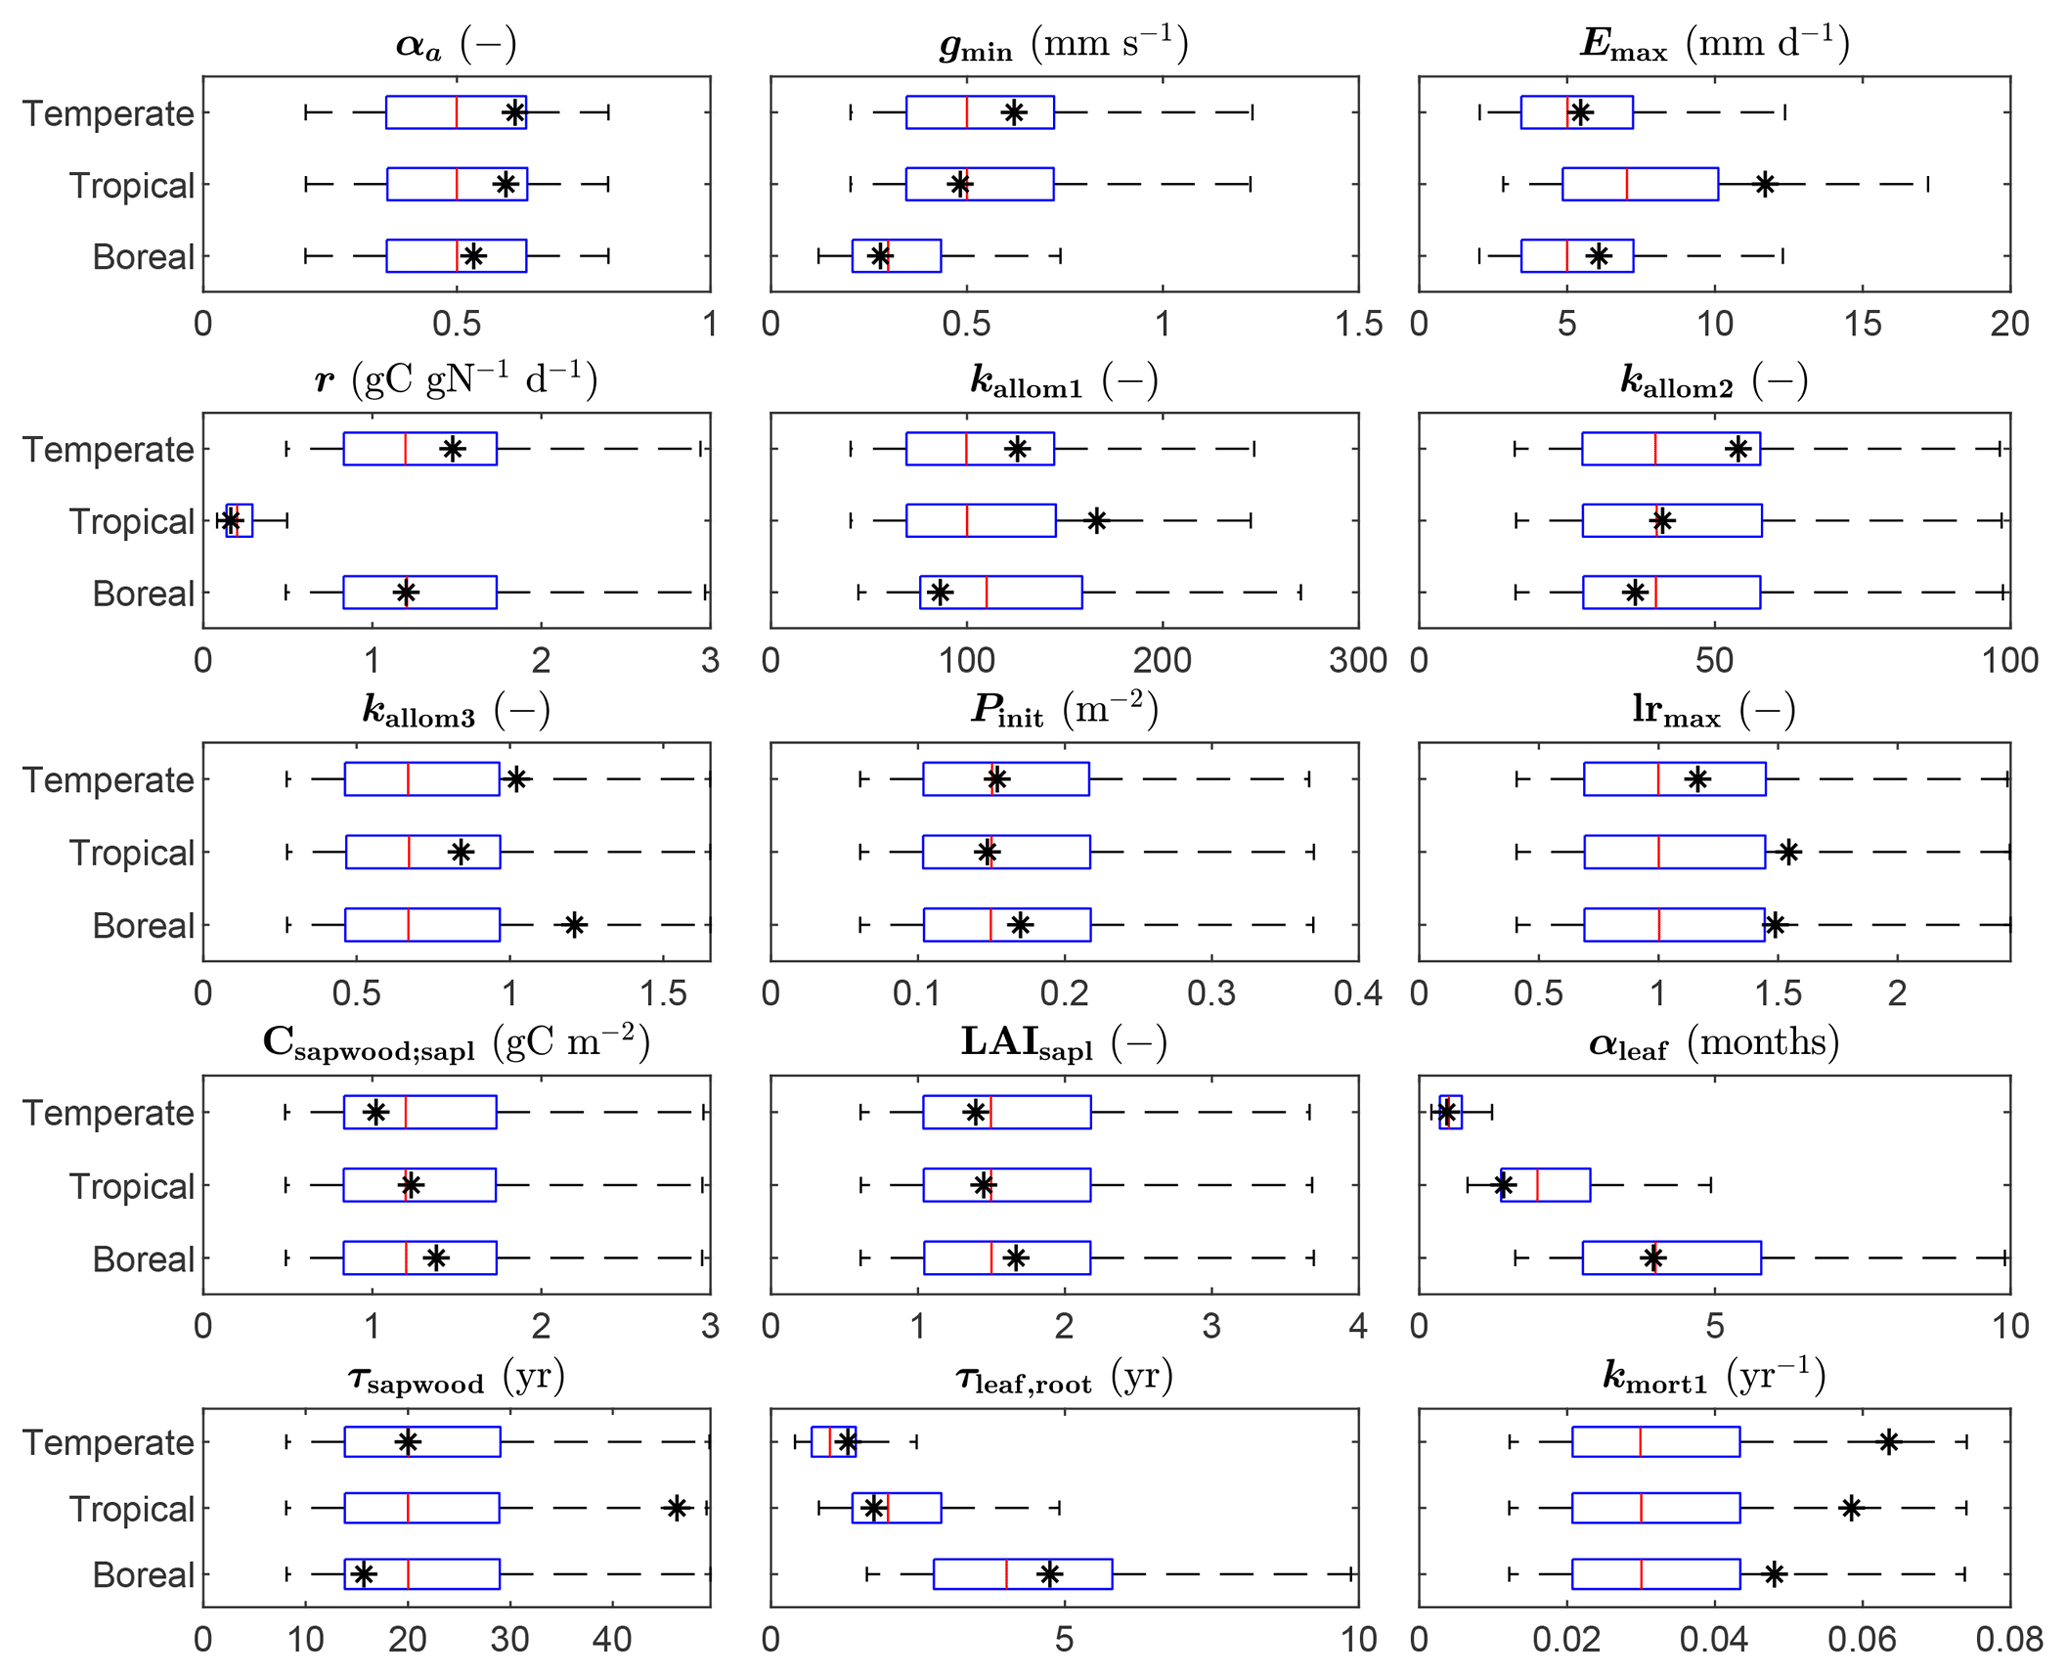
Figure 3Prior distributions and estimated values of the FPFT parameters estimated in the calibration. The box plots indicate the 5th and 95th percentiles (whiskers), the median (red line), and 25th and 75th percentiles (box) or the priors. The final parameter estimate is indicated by the asterisk (*). See Table 1 for an explanation of the parameters.
The ranges of the observed variables are depicted in Fig. 4, together with the LPJmL predictions for the calibration grid cells, based on the optimized parameter sets. The parameter CSWC,max is fit well by the model for all FPFTs. However, k is clearly underestimated for all three FPFTs, compared to the observed ranges. This affects the simulated growth curve for stemwood C, as shown in Fig. 5. In the LPJmL simulation, vegetation needs a longer time to reach its maximum stemwood biomass than the target growth curve. Nevertheless, the growth rate based on the optimized parameters represents a substantial improvement compared to the natural PFT counterparts. The CUE and vegetation turnover time (τvegC) are also reasonably well fitted.
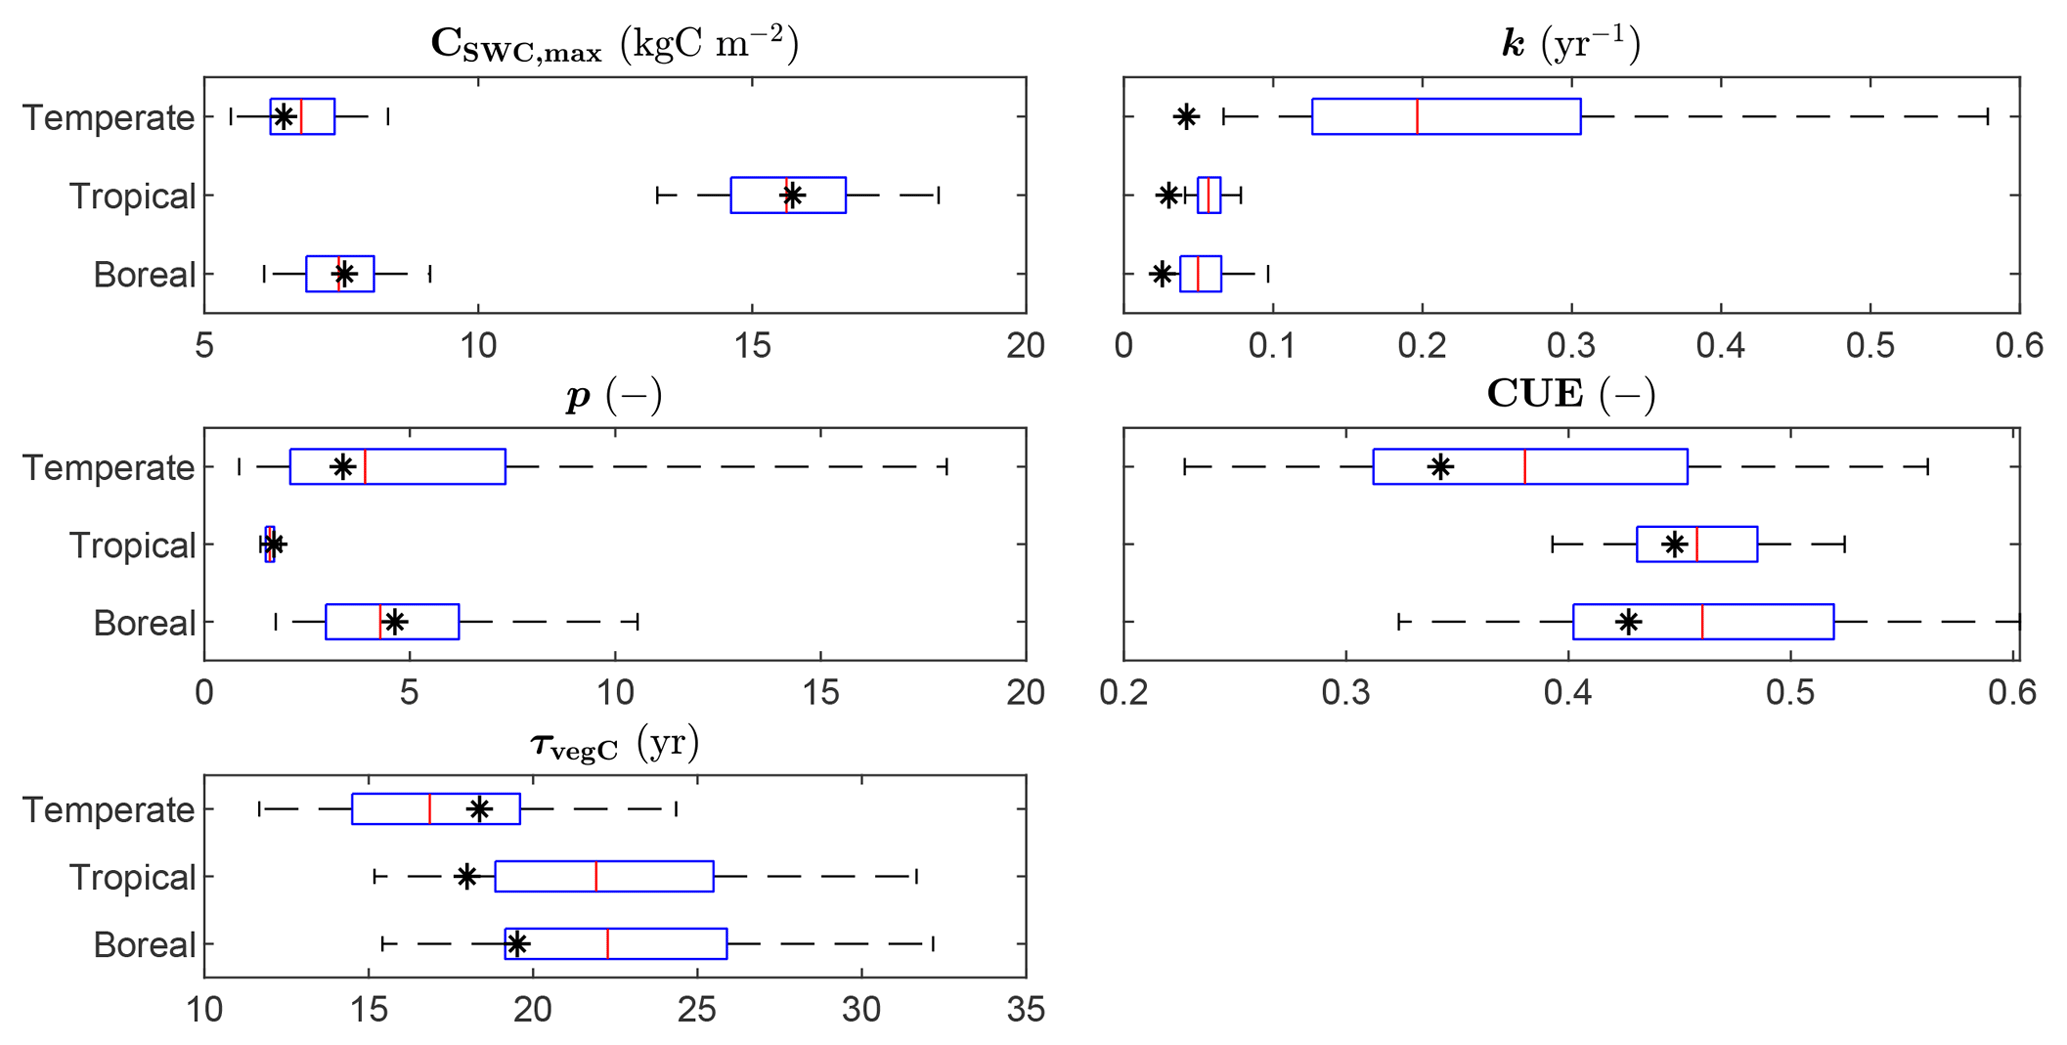
Figure 4Ranges of the observations used in the calibration and LPJmL estimates after calibration. The box plots indicate the 5th and 95th percentiles (whiskers), the median (red line), and 25th and 75th percentiles (box) of the likelihood function. The fitted value is indicated by the asterisk (*). CSWC,max: maximum stemwood C, k: growth rate; p: shape factor, CUE: carbon use efficiency (NPP-to-GPP ratio); τvegC: vegetation C turnover time (vegetation-C-to-NPP ratio).

Figure 5Predicted stemwood C for 100 calibration grid cells of each FPFT based on the optimal parameter sets. Note the different scales of the y axes.
3.3 Global simulations
3.3.1 Global afforestation and natural regrowth
Figure 6 depicts the predicted spatial distribution of forest plantation functional types for a global simulation experiment with land fully allocated to forest plantations. The total area for the temperate, tropical, and boreal plantation types is 2472 Mha (1010 m2), 6242, and 3094 Mha, respectively, corresponding to 17 %, 43 %, and 22 % of global land surface. In 2579 Mha (18 %), no tree growth is simulated due to a too-cold or too-dry climate. Note that in many non-marginal regions, tree growth may still be very low due to unfavorable conditions – the depicted distribution simply results from the bioclimatic limits set in the model. The distribution the FPFTs corresponds roughly to zones C, A, and D of the first level of the Köppen climate classification (Peel et al., 2007). Since there is no type for forest plantations in arid climates, the three FPFTs extend also into desert regions.

Figure 6Spatial distribution of the different forest plantation functional types resulting from the bioclimatic limits. In marginal regions, no trees are simulated, but grass may be present.
The global vegetation C stock over time is depicted in Fig. 7a (see also Fig. S2). Tropical plantations contribute most to C storage due to their larger area and higher productivity. Comparison with the simulation where all land is allocated to natural vegetation shows considerably faster C uptake for forest plantations (Fig. 7b), with a maximum difference of 308 PgC (193 %) after 54 years. After 300 years, global vegetation C is 102 PgC higher (112 %) for afforestation simulation. Soil and litter C storage is also proportionally higher for forest plantations. Note that the soil and litter C uptake rate is extremely high due to the fact that the simulation was started with zero C. In reality, soil C will already be present before land-use change and uptake will be much slower, possibly even negative, depending on previous land use.
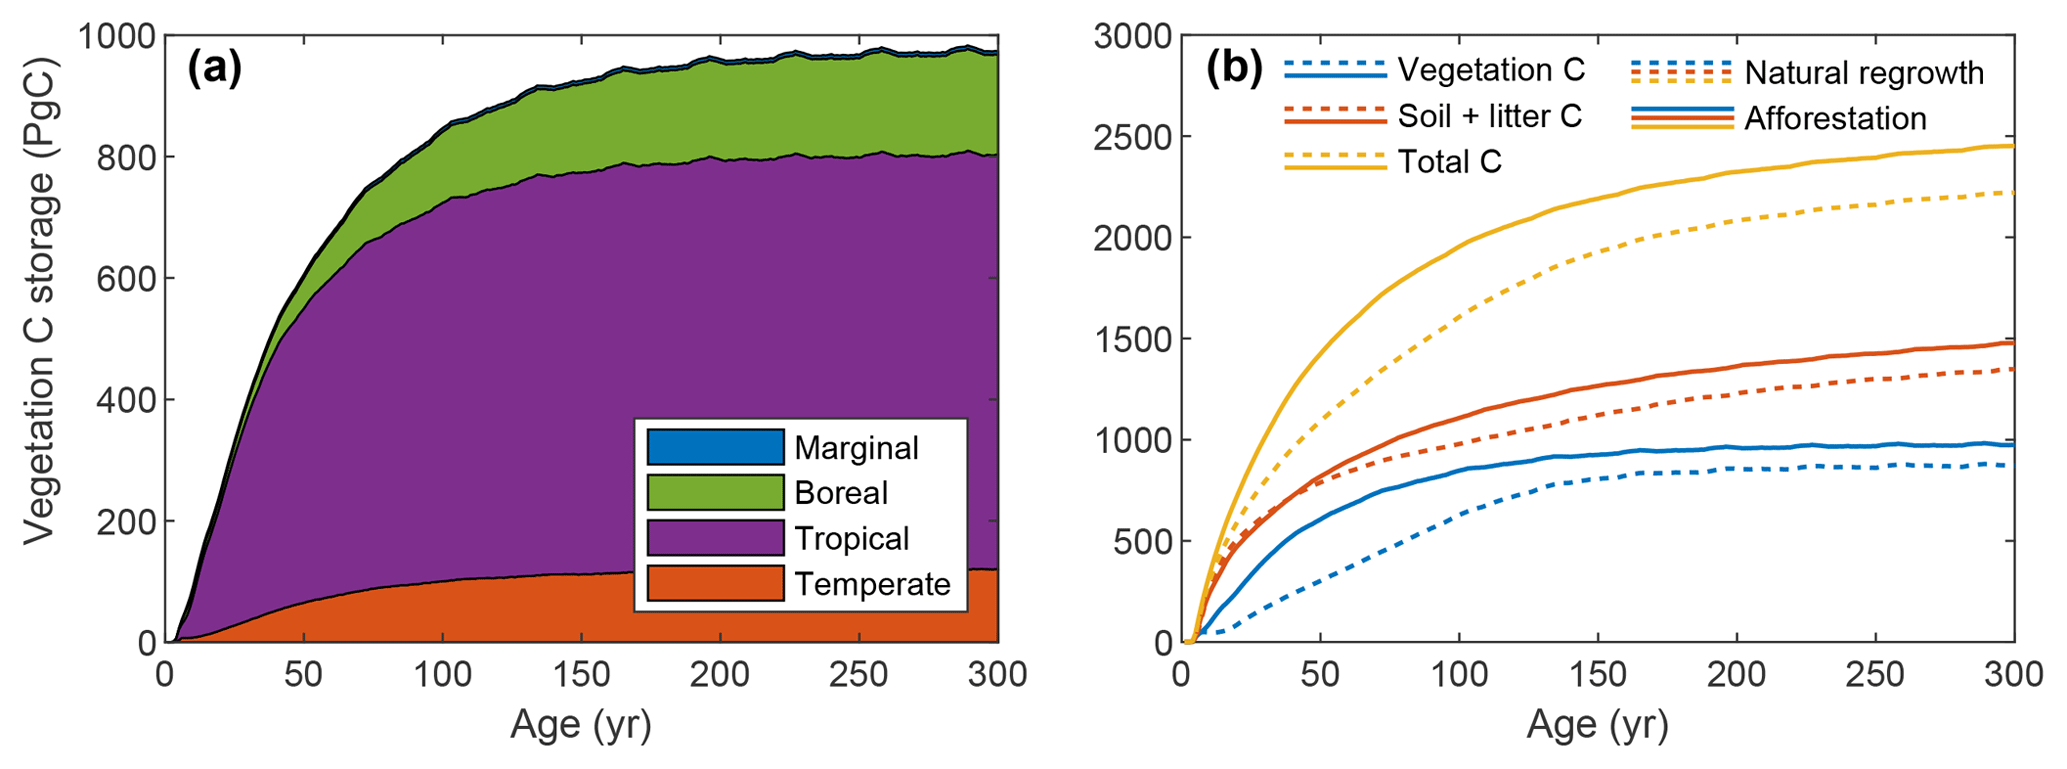
Figure 7Global total ecosystem C over time for simulations with global forest plantations or global natural vegetation. (a) Vegetation C storage per biome for the global forest plantation simulation only; (b) C storage per compartment for both simulations.
The potential for C uptake is illustrated by the mean annual increment (MAI) of vegetation C since the start of plantation (Fig. 8). There are remarkable differences between the two simulations. After an initial similar increase, MAI sharply drops after approximately 10 years for natural regrowth, while for afforestation MAI keeps rising until approximately 30 years. The behavior for natural regrowth can be explained by vegetation succession, leading to a shift from grasses to trees. This succession does not occur for forest plantations, where trees start growing immediately, resulting in a substantially higher MAI in the early part of the simulation. From spatial differences in MAI after 50 years, it is evident that tropical regions contribute most to this difference.
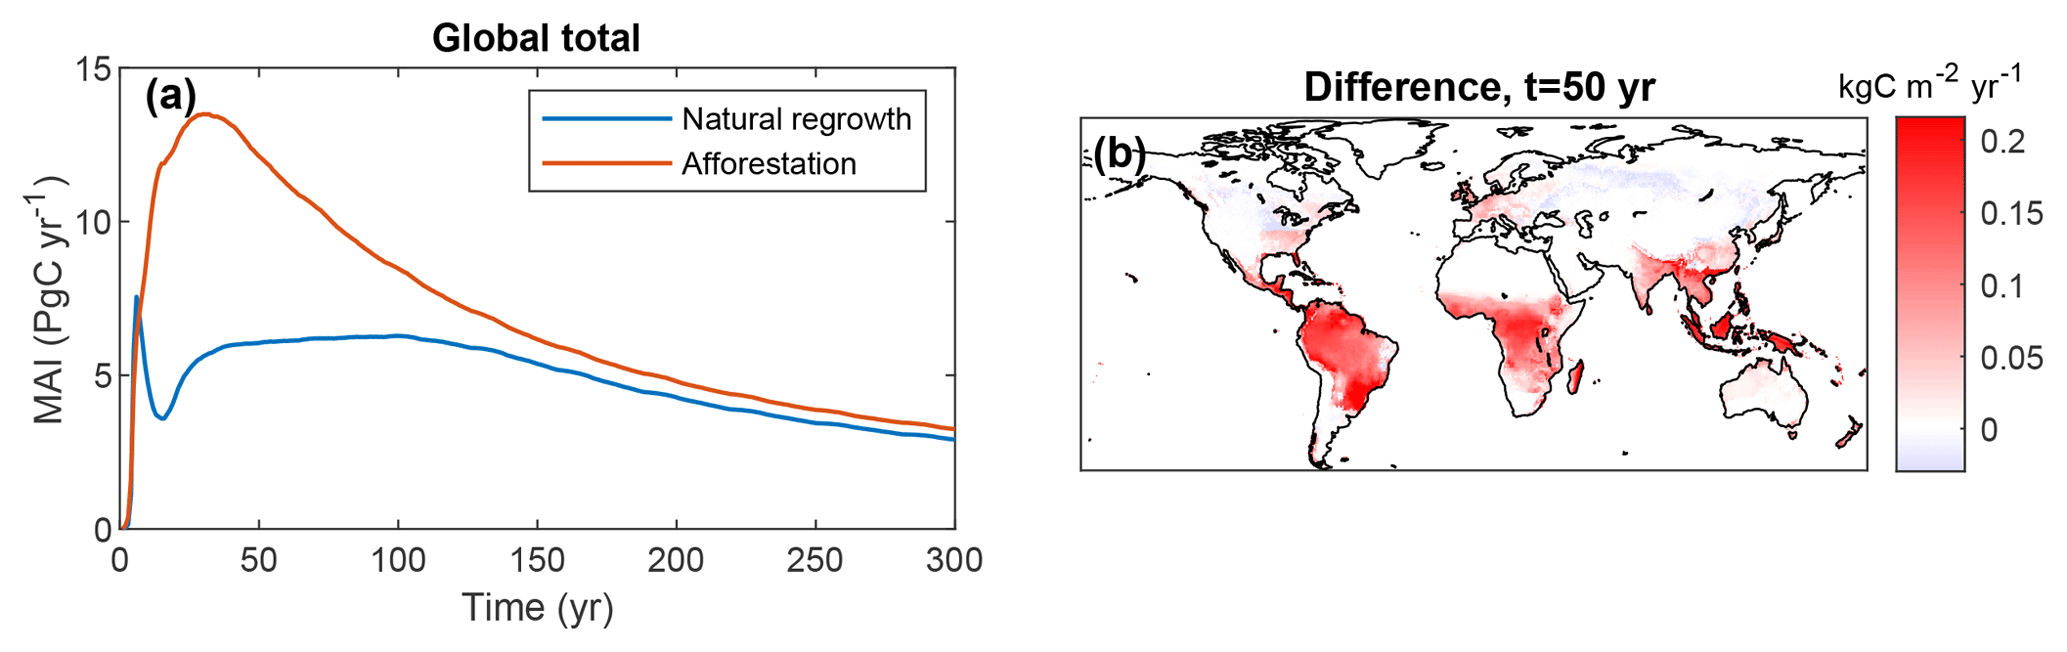
Figure 8Mean ecosystem sequestration rate (mean annual increment, MAI), determined as total C storage divided by time since the start of LPJmL simulations with only forest plantations or only natural vegetation. (a) Global total versus time; (b) difference between (afforestation minus natural regrowth) after 50 years.
3.3.2 Transient afforestation and natural regrowth
Figure 9 depicts results of the global simulation scenarios with gradual increase in forest, applying either afforestation or natural regrowth. Since changes in C storage – particularly for the soil – result also from land-use changes before 2015, we focus on the difference in global C stocks compared to the baseline simulation with constant land use from 2015. Until 2015, all three simulations have very similar results, but small differences arise from the stochastic generation of daily precipitation. Gradual afforestation of 650 Mha of land between 2015 and 2100 results in 19, 48, and 75 PgC additional C storage by 2065, 2100, and 2150, respectively, versus 16, 37, and 61 PgC for natural regrowth. Most of the difference between the two simulations is due to vegetation C, but from 2100 the difference for soil C grows and would ultimately dominate, had the simulation been continued after 2150. Global C sequestration rate peaks between 2090 and 2100 at approximately 0.91 and 0.68 PgC yr−1 for afforestation and natural regrowth, with average rates of 0.25 and 0.19 PgC yr−1 until 2100. Around 2130, global sequestration rates are higher for the natural regrowth simulation because land use remains constant from 2100, allowing natural ecosystems to “catch up”.
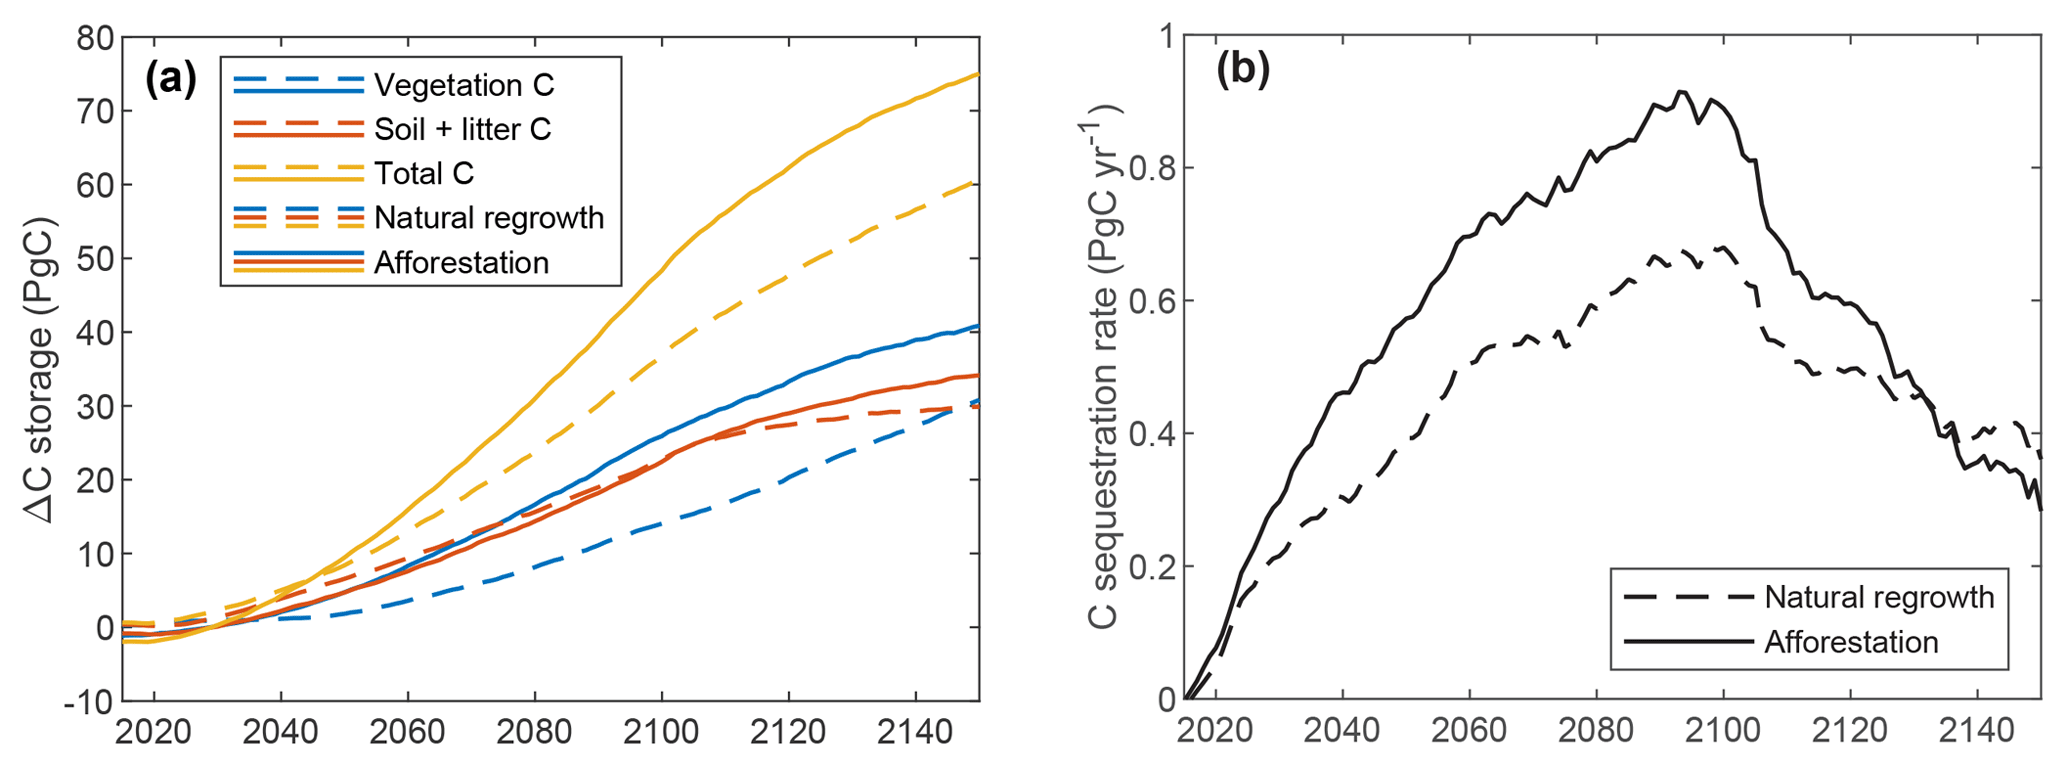
Figure 9Results of the simulations for gradual afforestation and natural regrowth. Both graphs show differences relative to the baseline simulation with constant land use. (a) Global C storage; (b) global C sequestration rate, smoothed using a 10-year moving average window.
4.1 LPJmL calibration
4.1.1 Parameters changes
Compared to the prior distributions – which are largely based on values for corresponding natural PFTs – the calibration resulted in a substantial shift for several parameters. We will discuss the more notable changes. First, kmort1 is substantially higher compared to the prior mode for all FPFTs. This parameter controls tree mortality related to low growth efficiency, which is defined as the ratio of the annual net biomass increment to leaf area. A high value of kmort1 results in higher mortality under unfavorable conditions. The increase of this parameter can be explained by the fact that the target growth curves have substantially higher growth rates than the natural PFT equivalents, while maximum biomass is approximately the same. The apparent conflict between these two constraints can in part be resolved by increasing first-order mortality. A higher value for kmort1 for forest plantation trees is not necessarily unrealistic since it is likely that fast-growing tree species have low tolerance for low growth conditions (Pacala et al., 1996).
The parameter kallom3, which relates tree stem diameter to tree height, has also substantially increased for all FPFTs. Higher values of this parameter mean higher trees for the same diameter, resulting in higher maximum biomass per tree. Again, this is in agreement with field observations, which have shown a positive relationship between tree growth rate and this parameter (Martínez Cano et al., 2019)
The maximum leaf-to-root mass ratio, lrmax, is also high compared to the prior, particularly for the tropical and boreal FPFTs. This causes higher allocation of C to leaves, compared to roots, which positively affects growth rate via leaf area index and absorbed photosynthetically active radiation. Conversely, in LPJmL, lower root biomass does not reduce growth since there is no link between root biomass and water uptake. Hence, higher values of lrmax unequivocally lead to higher productivity in the model.
For the tropical FPFT, Emax, τsapwood, and kallom1 have increased. Emax is the maximum water transport capacity and controls the transpiration rate. τsapwood is the turnover time of sapwood – higher values result in more sapwood biomass, which allows for larger leaf area. Finally, kallom1 relates crown area to stem diameter. The generally stronger shifts for the tropical FPFT compared to the temperate and boreal ones is explained by the lower uncertainties of parameters k and p of the target growth curve (Figs. 4 and S1), which is in turn caused by the larger number of stemwood C observations (Fig. 2).
4.1.2 Fit to observations
The calibration resulted in good fits with respect to most observations, with the exception of the growth rate parameter of the target growth curves. Despite substantial improvement compared to the corresponding natural PFTs, this parameter is underestimated for all three FPFTs. As a result, predicted initial C uptake rates are lower than implied by the stemwood C observations, possibly underestimating the potential efficacy of forest plantations for climate mitigation.
As discussed in Sect. 2.3.2, we incorporated data into the calibration to constrain NPP-to-GPP ratio and vegetation C turnover time to values similar to those of the corresponding natural PFTs. Earlier calibrations, in which these constraints were not included, yielded a substantially better fit to the growth rate but with unrealistically high litter fluxes, which points to a trade-off between the fit to these observations. From a mass-balance perspective, this result is explicable: fast growth requires high NPP, which will result in high litter fluxes once vegetation reaches equilibrium biomass. This is exacerbated by the fact that we constrained maximum stemwood C (CSWC,max) at levels close to those of the corresponding natural PFTs. The fact that fast growth results in very high litter fluxes when trees reach equilibrium relates to the fact that LPJmL does not represent certain mechanisms that lead to declining productivity with age (Zaehle et al., 2006). In reality, NPP reduction with age has been frequently observed (Ryan et al., 1997). Multiple reasons for this phenomenon have been proposed, but the leading hypothesis is that hydraulic resistance increases with tree height due to longer distance between soil and leaves (Ryan and Yoder, 1997). This results in lower photosynthesis rates and gross productivity (GPP). Since LPJmL does not include such mechanisms, it is mostly representative of mature forests. Incorporation of a more realistic representation of age dependence of forest growth rate is likely to improve the fit to observations (Zaehle et al., 2006).
4.2 Global simulations
4.2.1 Global afforestation versus natural regrowth
Despite the underestimated growth rates, our results show C can be sequestered substantially faster by forest plantations compared to natural regrowth (Fig. 7), particularly in the first 50 years following land conversion. The largest potential for plantations lies in tropical regions, which is not surprising, given that the maximum biomass of tropical FPFTs is more than twice as high compared to the temperate and boreal FPFTs. In addition to faster C sequestration, LPJmL also predicts a 12 % higher equilibrium global vegetation C pool for forest plantations, despite the fact that the FPFTs were calibrated to produce a value of CSWC,max comparable to that of natural equivalent PFTs (Fig. 5). This contradiction is in part explained by a larger productivity of forest plantations in less productive regions, which were not included in the calibration grid cells. Another reason is a larger spatial extent of the tropical FPFT compared to that of the natural tropical PFTs.
Combined soil and litter C is also higher for forest plantations after 300 years (Fig. 7b), but its proportion to total ecosystem C (60 %) is globally almost identical to that of the natural vegetation, due to the constraints on NPP-to-GPP ratio and vegetation C turnover time included in the calibration (see Sect. 2.3.2). It is difficult to compare these results to observations for real-world plantations since studies on this topic have generally compared natural forests to tree plantations for production of wood or other products, where the effects of harvest and other management on soil C are likely considerable (Guo and Gifford, 2002; van Straaten et al., 2015). Such effects are not relevant for plantations intended for C sequestration.
4.2.2 Gradual afforestation versus natural regrowth
According to our projections, gradual conversion of 650 Mha managed land to natural forest between 2015 and 2100 results in additional C uptake of 16 and 37 PgC by 2065 and 2100, respectively. If these lands are converted to forest plantations, the estimated C uptake is 19 and 48 PgC, i.e., 19 % and 30 % higher. These should be seen as conservative estimates, in view of the underestimated growth rates resulting from the calibration. To put these numbers into perspective, we compare them to results of Gasser et al. (2015), who estimated the negative emissions needed to limit global warming to 2 ∘C for a range of scenarios in which both the start time and the rate of reduction of greenhouse gases varied. In their most favorable scenario (energy and industry emission reduction starting in 2015 at a rate of 5 % per year), they estimated an average cumulative negative emission of 25–100 PgC is needed by 2100, compared to 450–800 PgC in the most unfavorable scenario (energy and industry emission reduction starting in 2030 at 1 % per year). Hence, large-scale forest plantations can offer a substantial contribution to climate mitigation but will likely not be sufficient.
4.3 Comparison to previous work
The results of the simulations for transient afforestation and natural regrowth compare well to results of previous studies on potential C sequestration rates of forest plantations and natural regrowth. For example, using the IMAGE integrated assessment model, van Minnen et al. (2008) performed a simulation experiment based on the Intergovernmental Panel on Climate Change (IPCC) Special Report on Emissions Scenarios (SRES) A1B scenario where 831 Mha of agricultural land is converted to permanent forest plantations between 2000 and 2100, taking into consideration land demand for food production and other uses. They estimated an additional 93 PgC can be sequestered but mostly after 2050, when land becomes gradually available due to decreasing population and increasing agricultural efficiency.
Humpenoder et al. (2014) presented a much more ambitious afforestation scenario, in which 2773 Mha of land is converted to forest plantations. The authors used maximum C storage for natural vegetation predicted by LPJmL but corrected sequestration rates using stylized growth curves for plantations in different climate regions. They estimate an additional C uptake of 192 PgC after 80 years. Roughly converting our estimate to the same land area yields a similar result (205 PgC). This similarity is not surprising, given that we used the same model, and our FPFTs were calibrated to produce the same maximum biomass as the natural PFT equivalents.
Potential sequestration rates by natural regrowth were studied by Krause et al. (2017), using the dynamic global vegetation model LPJ-GUESS. In two scenarios, derived by IMAGE and the agricultural land-use model MAgPIE, 1119 and 914 Mha were converted to natural lands, resulting in a predicted additional C uptake of 76 and 55 PgC, respectively, between 2000 and 2099. This compares well with our estimates for natural regrowth.
4.4 Model limitations
In our implementation of planted forests, the diversity of plantation tree species is reduced to three functional types with fixed properties. While the functional diversity of plantation tree species is not as vast as that of natural forests – especially in the context of C sequestration – the predictions would likely improve from implementation of additional FPFTs, particularly for the tropical biome. The model currently predicts a relatively large C storage for dry tropical zones compared to natural regrowth, which may not be fully realistic, given water limitations. Addition of a dry tropical FPFT would allow for a more accurate assessment of C sequestration in these regions.
This study does not consider the effects of climate change and CO2 concentration on productivity of forest plantations. Although there is still considerable uncertainty regarding this topic, accounting for CO2 fertilization will likely increase the C sequestration potential (Schimel et al., 2015) in both natural and managed forests. However, in order to properly assess this, it is important to take into account nutrient limitation to productivity as well (Norby et al., 2010).
We also did not consider possible management options that may improve C uptake rates. In particular, regular thinning can result in substantially higher C uptake rates (van Minnen et al., 2008). The model supports harvesting, but this feature was not used in this study. However, continual thinning would result in export of nutrients from the ecosystem, which would ultimately slow down growth rates, unless plantations are fertilized. Thus, representing regular harvest in LPJmL would also require representation of nutrient limitation.
4.5 Considerations beyond C uptake
Evaluation of afforestation and natural regrowth as strategies for climate change mitigation involves a range of considerations other than carbon sequestration. First, converting agricultural land to forest involves a number of costs. For both natural and planted forests, this includes price for acquiring land, while specifically for the latter costs related to establishing and maintaining the plantation are relevant (e.g., land preparation, planting of seedlings). The costs per unit C sequestered will rise with increasing area of (planted) forest, mainly due to competition for land (Doelman et al., 2019a).
Second, the positive effects of carbon uptake of changing land cover to forest can be offset due biophysical changes in the surface energy budget, related to changes in albedo, evapotranspiration, and surface roughness (Perugini et al., 2017). This may result in a net warming effect, regionally, and possibly globally, depending on the extent of land-cover change.
Third, the reduction of cropland and pasture might also have a negative impact on food security due to increased competition for land (Hasegawa et al., 2018). In order to maintain food production for the growing population, strong intensification of the agricultural sector would be required. Locally, this will result in a range of negative effects on the environment, due to higher application of fertilizers and plant protection products, as well as water extraction for irrigation (Smith et al., 2013). Furthermore, in terms of climate change mitigation, agricultural intensification will likely partially offset the benefits of afforestation and regrowth, e.g., due to higher N2O emissions from fertilizers (Burney et al., 2010).
Finally, biodiversity is a particularly important aspect to consider, given that plantation forests have usually substantially lower species richness than primary or secondary forests (Barlow et al., 2007). A more balanced solution may be a compromise between biodiversity and C sequestration by establishing a mixture of native and plantation species, or plantation forest with a native undergrowth (Barlow et al., 2007; Bremer and Farley, 2010).
To our knowledge, the extension of LPJmL presented here represents the first model of forest plantations for C sequestration as part of a DGVM for global-scale applications. Although calibration of the model still resulted in underestimated growth rates compared to observations of stemwood C, this represents an improvement over previous approaches. According to our simulations, conversion of 650 Mha of land to forest over 85 years results in an additional C uptake of 48 PgC for forest plantation versus 37 PgC for natural regrowth, with greatest potential in the tropics. We conclude that large-scale afforestation can offer a substantial contribution to C uptake, particularly on a timescale of approximately 50–100 years. Evaluating afforestation as a strategy for climate change mitigation requires consideration of all relevant aspects in a comprehensive assessment. Our model can contribute to such an evaluation by providing improved estimates of C uptake rates.
The source code of the LPJmL version with forest plantations and the model output of the global simulations will be made available in a public data repository at a later date. Until then they will be sent upon request to the corresponding author.
The supplement related to this article is available online at: https://doi.org/10.5194/esd-10-617-2019-supplement.
ES, DvV, and JD initiated the project and contributed to discussions during all stages. PB and MB implemented the modifications to the LPJmL model to represent forest plantations. MB implemented the calibration algorithm and ran the calibrations and global simulations. JD provided the input data needed for global simulations. CM and SS provided expert advice on the workings of the LPJmL model and the interpretation of its results. MB drafted the paper, and all authors contributed to the final paper.
The authors declare that they have no conflict of interest.
We gratefully acknowledge Matthias Forkel for advice on using the GENOUD algorithm to calibrate LPJmL.
This paper was edited by Govindasamy Bala and reviewed by Jagmohan Sharma and one anonymous referee.
Barlow, J., Gardner, T. A., Araujo, I. S., Avila-Pires, T. C., Bonaldo, A. B., Costa, J. E., Esposito, M. C., Ferreira, L. V., Hawes, J., Hernandez, M. I. M., Hoogmoed, M. S., Leite, R. N., Lo-Man-Hung, N. F., Malcolm, J. R., Martins, M. B., Mestre, L. A. M., Miranda-Santos, R., Nunes-Gutjahr, A. L., Overal, W. L., Parry, L., Peters, S. L., Ribeiro-Junior, M. A., da Silva, M. N. F., da Silva Motta, C., and Peres, C. A.: Quantifying the biodiversity value of tropical primary, secondary, and plantation forests, P. Natl. Acad. Sci. USA, 104, 18555–18560, https://doi.org/10.1073/pnas.0703333104, 2007.
Beringer, T. I. M., Lucht, W., and Schaphoff, S.: Bioenergy production potential of global biomass plantations under environmental and agricultural constraints, GCB Bioenergy, 3, 299–312, https://doi.org/10.1111/j.1757-1707.2010.01088.x, 2011.
Bondeau, A., Smith, P. C., Zaehle, S., Schaphoff, S., Lucht, W., Cramer, W., Gerten, D., Lotze-Campen, H., Mueller, C., Reichstein, M., and Smith, B.: Modelling the role of agriculture for the 20th century global terrestrial carbon balance, Global Change Biol., 13, 679–706, https://doi.org/10.1111/j.1365-2486.2006.01305.x, 2007.
Bremer, L. L. and Farley, K. A.: Does plantation forestry restore biodiversity or create green deserts? A synthesis of the effects of land-use transitions on plant species richness, Biodivers. Conserv., 19, 3893–3915, https://doi.org/10.1007/s10531-010-9936-4, 2010.
Brown, S., Lugo, A. E., and Chapman, J.: Biomass of tropical tree plantations and its implications for the global carbon budget, Can. J. For. Res.-Rev. Can. Rech. For., 16, 390–394, https://doi.org/10.1139/x86-067, 1986.
Burney, J. A., Davis, S. J., and Lobell, D. B.: Greenhouse gas mitigation by agricultural intensification, P. Natl. Acad. Sci. USA, 107, 12052–12057, https://doi.org/10.1073/pnas.0914216107, 2010.
Cannell, M. G. R.: World forest biomass and primary production data, Academic Press, London, 1982.
Doelman, J. C., Stehfest, E., van Vuuren, D. P., Tabeau, A., Hof, A. F., Braakhekke, M. C., Gernaat, D. E. H. J., van den Berg, M., van Zeist, W., Daioglou, V., van Meijl, H. and Lucas, P.: Afforestation for climate change mitigation: potentials, risks and trade-offs, Global Change Biol., in review, 2019a.
Doelman, J. C., Stehfest, E., Tabeau, A. and van Meijl, H.: Making the Paris agreement climate targets consistent with food security objectives, Global Food Security, 23, 93–103, doi:10.1016/j.gfs.2019.04.003, 2019b.
Forkel, M., Carvalhais, N., Schaphoff, S., v. Bloh, W., Migliavacca, M., Thurner, M., and Thonicke, K.: Identifying environmental controls on vegetation greenness phenology through model–data integration, Biogeosciences, 11, 7025–7050, https://doi.org/10.5194/bg-11-7025-2014, 2014.
Gasser, T., Guivarch, C., Tachiiri, K., Jones, C. D., and Ciais, P.: Negative emissions physically needed to keep global warming below 2 ∘C, Nat. Commun., 6, 7958, https://doi.org/10.1038/ncomms8958, 2015.
Gerten, D., Schaphoff, S., Haberlandt, U., Lucht, W., and Sitch, S.: Terrestrial vegetation and water balance – hydrological evaluation of a dynamic global vegetation model, J. Hydrol., 286, 249–270, https://doi.org/10.1016/j.jhydrol.2003.09.029, 2004.
Gladstone, W. T. and Thomas Ledig, F.: Reducing pressure on natural forests through high-yield forestry, Forest Ecol. Manage., 35, 69–78, https://doi.org/10.1016/0378-1127(90)90232-Z, 1990.
Guo, L. B. and Gifford, R. M.: Soil carbon stocks and land use change: a meta analysis, Global Change Biol., 8, 345–360, https://doi.org/10.1046/j.1354-1013.2002.00486.x, 2002.
Harris, I., Jones, P. D., Osborn, T. J., and Lister, D. H.: Updated high-resolution grids of monthly climatic observations – the CRU TS3.10 Dataset: Updated High-Resolution Grids Of Monthly Climatic Observations, Int. J. Climatol., 34, 623–642, https://doi.org/10.1002/joc.3711, 2014.
Hasegawa, T., Fujimori, S., Havlík, P., Valin, H., Bodirsky, B. L., Doelman, J. C., Fellmann, T., Kyle, P., Koopman, J. F. L., Lotze-Campen, H., Mason-D'Croz, D., Ochi, Y., Pérez Domínguez, I., Stehfest, E., Sulser, T. B., Tabeau, A., Takahashi, K., Takakura, J., van Meijl, H., van Zeist, W.-J., Wiebe, K., and Witzke, P.: Risk of increased food insecurity under stringent global climate change mitigation policy, Nat. Clim. Change, 8, 699–703, https://doi.org/10.1038/s41558-018-0230-x, 2018.
Humpenoder, F., Popp, A., Dietrich, J. P., Klein, D., Lotze-Campen, H., Bonsch, M., Bodirsky, B. L., Weindl, I., Stevanovic, M., and Muller, C.: Investigating afforestation and bioenergy CCS as climate change mitigation strategies, Environ. Res. Lett., 9, 064029, https://doi.org/10.1088/1748-9326/9/6/064029, 2014.
Klein Goldewijk, K., Beusen, A., and Janssen, P.: Long-term dynamic modeling of global population and built-up area in a spatially explicit way: HYDE 3.1, Holocene, 20, 565–573, https://doi.org/10.1177/0959683609356587, 2010.
Krause, A., Pugh, T. A. M., Bayer, A. D., Doelman, J. C., Humpenöder, F., Anthoni, P., Olin, S., Bodirsky, B. L., Popp, A., Stehfest, E., and Arneth, A.: Global consequences of afforestation and bioenergy cultivation on ecosystem service indicators, Biogeosciences, 14, 4829–4850, https://doi.org/10.5194/bg-14-4829-2017, 2017.
Martínez Cano, I., Muller-Landau, H. C., Wright, S. J., Bohlman, S. A., and Pacala, S. W.: Tropical tree height and crown allometries for the Barro Colorado Nature Monument, Panama: a comparison of alternative hierarchical models incorporating interspecific variation in relation to life history traits, Biogeosciences, 16, 847–862, https://doi.org/10.5194/bg-16-847-2019, 2019.
Mebane Jr., W. R. and Sekhon, J. S.: Genetic Optimization Using Derivatives: The rgenoud Package for R, J. Stat. Softw., 42, 1–26, https://doi.org/10.18637/jss.v042.i11, 2011.
Müller, C., Stehfest, E., van Minnen, J. G., Strengers, B., von Bloh, W., Beusen, A. H. W., Schaphoff, S., Kram, T., and Lucht, W.: Drivers and patterns of land biosphere carbon balance reversal, Environ. Res. Lett., 11, 044002, https://doi.org/10.1088/1748-9326/11/4/044002, 2016.
Norby, R. J., Warren, J. M., Iversen, C. M., Medlyn, B. E., and McMurtrie, R. E.: CO2 enhancement of forest productivity constrained by limited nitrogen availability, P. Natl. Acad. Sci. USA, 107, 19368–19373, https://doi.org/10.1073/pnas.1006463107, 2010.
Pacala, S. W., Canham, C. D., Saponara, J., Silander, J. A., Kobe, R. K., and Ribbens, E.: Forest Models Defined by Field Measurements: Estimation, Error Analysis and Dynamics, Ecol. Monogr., 66, 1–43, https://doi.org/10.2307/2963479, 1996.
Paquette, A. and Messier, C.: The role of plantations in managing the world's forests in the Anthropocene, Front. Ecol. Environ., 8, 27–34, https://doi.org/10.1890/080116, 2010.
Pearson, R. K.: Outliers in process modeling and identification, IEEE T. Control Syst. Technol., 10, 55–63, https://doi.org/10.1109/87.974338, 2002.
Peel, M. C., Finlayson, B. L., and McMahon, T. A.: Updated world map of the Köppen–Geiger climate classification, Hydrol. Earth Syst. Sci., 11, 1633–1644, https://doi.org/10.5194/hess-11-1633-2007, 2007.
Perugini, L., Caporaso, L., Marconi, S., Cescatti, A., Quesada, B., de Noblet-Ducoudré, N., House, J. I., and Arneth, A.: Biophysical effects on temperature and precipitation due to land cover change, Environ. Res. Lett., 12, 053002, https://doi.org/10.1088/1748-9326/aa6b3f, 2017.
Pretzsch, H.: Forest Dynamics, Growth and Yield, Springer, Berlin, Heidelberg, 2010.
Reineke, L. H.: Perfecting a stand-density index for even-aged forests, J. Agric. Res., 46, 0627–0638, 1933.
Rogelj, J., Popp, A., Calvin, K. V., Luderer, G., Emmerling, J., Gernaat, D., Fujimori, S., Strefler, J., Hasegawa, T., Marangoni, G., Krey, V., Kriegler, E., Riahi, K., van Vuuren, D. P., Doelman, J., Drouet, L., Edmonds, J., Fricko, O., Harmsen, M., Havlík, P., Humpenöder, F., Stehfest, E., and Tavoni, M.: Scenarios towards limiting global mean temperature increase below 1.5 ∘C, Nat. Clim. Change, 8, 325–332, https://doi.org/10.1038/s41558-018-0091-3, 2018.
Ryan, M. G. and Yoder, B. J.: Hydraulic Limits to Tree Height and Tree Growth, BioScience, 47, 235–242, https://doi.org/10.2307/1313077, 1997.
Ryan, M. G., Binkley, D. and Fownes, J. H.: Age-Related Decline in Forest Productivity: Pattern and Process, Adv. Ecol. Res., 27, 213–262, https://doi.org/10.1016/S0065-2504(08)60009-4, 1997.
Schaphoff, S., Heyder, U., Ostberg, S., Gerten, D., Heinke, J., and Lucht, W.: Contribution of permafrost soils to the global carbon budget, Environ. Res. Lett., 8, 014026, https://doi.org/10.1088/1748-9326/8/1/014026, 2013.
Schimel, D., Stephens, B. B., and Fisher, J. B.: Effect of increasing CO2 on the terrestrial carbon cycle, P. Natl. Acad. Sci. USA, 112, 436–441, https://doi.org/10.1073/pnas.1407302112, 2015.
Sitch, S., Smith, B., Prentice, I. C., Arneth, A., Bondeau, A., Cramer, W., Kaplan, J. O., Levis, S., Lucht, W., Sykes, M. T., Thonicke, K., and Venevsky, S.: Evaluation of ecosystem dynamics, plant geography and terrestrial carbon cycling in the LPJ dynamic global vegetation model, Global Change Biol., 9, 161–185, https://doi.org/10.1046/j.1365-2486.2003.00569.x, 2003.
Smith, P., Haberl, H., Popp, A., Erb, K., Lauk, C., Harper, R., Tubiello, F. N., de Siqueira Pinto, A., Jafari, M., Sohi, S., Masera, O., Böttcher, H., Berndes, G., Bustamante, M., Ahammad, H., Clark, H., Dong, H., Elsiddig, E. A., Mbow, C., Ravindranath, N. H., Rice, C. W., Robledo Abad, C., Romanovskaya, A., Sperling, F., Herrero, M., House, J. I., and Rose, S.: How much land-based greenhouse gas mitigation can be achieved without compromising food security and environmental goals?, Global Change Biol., 19, 2285–2302, https://doi.org/10.1111/gcb.12160, 2013.
Stehfest, E., van Vuuren, D., Bouwman, L. and Kram, T.: Integrated assessment of global environmental change with IMAGE 3.0: Model description and policy applications, PBL Netherlands Environmental Assessment Agency, The Hague, 2014.
van Minnen, J. G., Strengers, B. J., Eickhout, B., Swart, R. J., and Leemans, R.: Quantifying the effectiveness of climate change mitigation through forest plantations and carbon sequestration with an integrated land-use model, Carb. Balance Manage., 3, 3, https://doi.org/10.1186/1750-0680-3-3, 2008.
Vanninen, P., Ylitalo, H., Sievänen, R., and Mäkelä, A.: Effects of age and site quality on the distribution of biomass in Scots pine (Pinus sylvestris L.), Trees, 10, 231–238, https://doi.org/10.1007/BF02185674, 1996.
van Straaten, O., Corre, M. D., Wolf, K., Tchienkoua, M., Cuellar, E., Matthews, R. B., and Veldkamp, E.: Conversion of lowland tropical forests to tree cash crop plantations loses up to one-half of stored soil organic carbon, P. Natl. Acad. Sci. USA, 112, 9956–9960, https://doi.org/10.1073/pnas.1504628112, 2015.
van Vuuren, D. P., Deetman, S., van Vliet, J., van den Berg, M., van Ruijven, B. J., and Koelbl, B.: The role of negative CO2 emissions for reaching 2 ∘C – insights from integrated assessment modelling, Climatic Change, 118, 15–27, https://doi.org/10.1007/s10584-012-0680-5, 2013.
Von Gadow, K. and Hui, G.: Modelling Forest Development, Springer Netherlands, Dordrecht, 1999.
Williamson, P.: Emissions reduction: Scrutinize CO2 removal methods, Nature, 530, 153–155, https://doi.org/10.1038/530153a, 2016.
Zaehle, S., Sitch, S., Prentice, I. C., Liski, J., Cramer, W., Erhard, M., Hickler, T., and Smith, B.: The Importance of Age-Related Decline in Forest NPP for Modeling Regional Carbon Balances, Ecol. Appl., 16, 1555–1574, 2006.