the Creative Commons Attribution 4.0 License.
the Creative Commons Attribution 4.0 License.
 | 05 Jun 2018
Euro-Atlantic winter storminess and precipitation extremes under 1.5 °C vs. 2 °C warming scenarios
Monika J. Barcikowska
Scott J. Weaver
Frauke Feser
Simone Russo
Frederik Schenk
Dáithí A. Stone
Michael F. Wehner
Matthias Zahn
Severe winter storms in combination with precipitation extremes pose a serious threat to Europe. Located at the southeastern exit of the North Atlantic's storm track, European coastlines are directly exposed to impacts by high wind speeds, storm floods and coastal erosion. In this study we analyze potential changes in simulated winter storminess and extreme precipitation, which may occur under 1.5 or 2 ∘C warming scenarios. Here we focus on a first simulation suite of the atmospheric model CAM5 performed within the HAPPI project and evaluate how changes of the horizontal model resolution impact the results regarding atmospheric pressure, storm tracks, wind speed and precipitation extremes.
The comparison of CAM5 simulations with different resolutions indicates that an increased horizontal resolution to 0.25∘ not only refines regional-scale information but also improves large-scale atmospheric circulation features over the Euro-Atlantic region. The zonal bias in monthly pressure at mean sea level and wind fields, which is typically found in low-resolution models, is considerably reduced. This allows us to analyze potential changes in regional- to local-scale extreme wind speeds and precipitation in a more realistic way.
Our analysis of the future response for the 2 ∘C warming scenario generally confirms previous model simulations suggesting a poleward shift and intensification of the meridional circulation in the Euro-Atlantic region. Additional analysis suggests that this shift occurs mainly after exceeding the 1.5 ∘C global warming level, when the midlatitude jet stream manifests a strengthening northeastward. At the same time, this northeastern shift of the storm tracks allows an intensification and northeastern expansion of the Azores high, leading to a tendency of less precipitation across the Bay of Biscay and North Sea.
Regions impacted by the strengthening of the midlatitude jet, such as the northwestern coasts of the British Isles, Scandinavia and the Norwegian Sea, and over the North Atlantic east of Newfoundland, experience an increase in the mean as well as daily and sub-daily precipitation, wind extremes and storminess, suggesting an important influence of increasing storm activity in these regions in response to global warming.
- Article
(14617 KB) - Full-text XML
-
Supplement
(1546 KB) - BibTeX
- EndNote


International climate policy discussions use annual mean globally averaged temperature targets as the metric to anchor climate mitigation and adaptation strategies. While useful for climate policy development and implementation, global temperature targets do not explicitly convey the climate impacts that may be felt by society at seasonal and regional scales and hence make it difficult to justify any target as a safe level of warming (Knutti et al., 2016). The recent Paris agreement (Adoption of the Paris Agreement FCCC/CP/2015/L.9/Rev.1, UNFCCC, 2017) hopes to limit the rise in postindustrial globally averaged temperature to no more than 2 ∘C, while pursuing efforts toward the more ambitious 1.5 ∘C target. Accordingly, understanding the changes in regional climate as the result of this half-a-degree difference in these two global temperature levels is important to clarify projected near-term climate change impacts.
In this study, we focus on projected changes in winter storminess and precipitation extremes over the Euro-Atlantic region. The winter climate in the North Atlantic–European sector is dominated by variations in midlatitude westerly winds, which determine the position and intensity of storm tracks and thus the pathways of momentum, moisture and temperature transport. Extratropical cyclones dominate the redistribution of energy with a net poleward heat transport. They typically form in the region of strong baroclinic activity at the (sub)polar front of Arctic vs. (sub)tropical air masses. Stronger pressure gradients are linked to increased storminess and precipitation over central and northern Europe and less storms and precipitation over southern Europe and vice versa for weak pressure gradients (e.g., Pinto et al., 2009a). Large-scale storminess is dominated by multi-decadal variations in response to a complex interplay of different factors which may lead to changes in storm track position and intensity. The location of the storm track generally changes seasonally in response to solar insolation. Here, changes in the position of the sea-ice front push storm tracks southward while tropical sea surface temperatures (SSTs) build a barrier in the south (Shaw et al., 2016).
Owing to its exposure to the direct impact by cyclones from the North Atlantic, weather extremes in this region frequently cause profound socioeconomic costs. Heavy rainfall and intense winds are often associated with extratropical cyclones, and may cause flooding and storm surge, damaging infrastructure, industry, agriculture and forestry. As an example for the North Sea region, extreme wind gusts can exceed category 3 hurricane wind forces like during storms Christian and Allan on 28 and 29 October 2013 with 171 km h−1 at the German North Sea coast and 193 km h−1 over Denmark (von Storch et al., 2014). Hydrological extremes like the coastal as well as inland flooding over the southern United Kingdom during winter 2013/2014 (Schaller et al., 2016; Priestley et al., 2017) are also closely tied to unusual series of low-pressure systems including severe storm clusters and persistent rain. Given the large spatial variation in winter European climate affected by Euro-Atlantic storminess, any effect of global climate change on storminess could profoundly contribute to the associated regional impacts.
Many observational studies on the hydrological cycle in the recent century show wettening tendencies in the Northern Hemisphere highlighted by annual precipitation increases over large portions of the European continent including Scandinavia and central-eastern Europe. While these tendencies have also been detected in the winter season over most of these regions, they are not present over the southern flanks (Maraun, 2013), leading to a north–south dipole structure in precipitation anomalies over the European sector. A similar dipole pattern, with positive sign tendencies for the north and a negative sign for the south of the continent, was also found in the records of winter extreme rainfall (Donat et al., 2013; Fischer et al., 2014) and river flows (Stahl et al., 2010, 2012). Other studies (Casanueva et al., 2014; Fleig et al., 2015) linked these changes directly to the altered large-scale circulation patterns. Hov et al. (2013) have shown that the intensification of the winter heavy rainfall in northern and northeastern Europe is directly associated with the observed poleward shift of the North Atlantic storm track and weakening of Mediterranean storms. Nevertheless, spatial changes of the storm track activity in this region feature much higher complexity, as will be discussed in the latter part.
There is however an insufficient understanding of long-term changes in storminess and their drivers (Seneviratne et al., 2012). Records of extreme winds suffer from large inhomogeneities, contributing to uncertainty of the derived statistics the satellite era (Hartmann et al., 2013; Feser et al., 2015a) in addition to spurious long-term trends in global reanalysis data (e.g., Krueger et al., 2013; Schenk and Stendel, 2016). There is however consistency across multiple data sets and medium confidence in a poleward shift of storm tracks since the second half of the 20th century (Seneviratne et al., 2012). The observed increase in northern hemispheric storminess towards northern latitudes and a decrease southwards during the past several decades is consistent with the northward shift of storm tracks and their intensity since at least 1970 (e.g., Ulbrich et al., 2009; Lehmann et al., 2011; Hov et al., 2013; Feser et al., 2015a). Wang et al. (2009) attributes these changes since 1950 at least partly to external drivers.
Recent efforts to better understand future impacts of global warming on the Euro-Atlantic climate and weather and their extremes such as midlatitude storminess typically involve an assessment of changes to various properties of atmospheric dynamics in global climate models (GCMs) (e.g., changes in wind and sea level pressure variance) under various Representative Concentration Pathway (RCP) greenhouse gas (GHG) forcing scenarios (Yin, 2005; Lu et al., 2007; Wu et al., 2010; Feser et al., 2015b).
Projections of future annual precipitation indicate an increase for the northern parts and a decrease for the southern parts of Europe. Studies based on GCMs (Sillmann et al., 2013; Giorgi et al., 2014) as well as studies based on regional climate models (RCMs) (Rajczak et al., 2013; Jacob et al., 2014) agree that the strongest increase in the heavy winter rainfall will occur over Scandinavia and eastern Europe. Moreover, Sillmann et al. (2013) have shown that heavy rainfall is projected to increase even in the regions with a mean precipitation decrease (e.g., over the Mediterranean region). Studies analyzing high-resolution, single-model projections (Kitoh and Endo, 2016; Barcikowska et al., 2018) corroborate these results. This bipolar pattern, with positive tendencies over the northern flanks of central and western Europe and a decrease over southern parts of Europe, has also been found in a multi-model ensemble projection (Donat et al., 2012) for wind speeds.
Projections of future changes in the midlatitude storms in the Northern Hemisphere indicate remarkable changes; however their features (e.g., spatial patters and intensity) show a strong dependency on the analysis method as well as the generation of the models. Projections based on the ensemble mean of 16 CMIP3 (early 2000s generation) GCMs (Lambert and Fyfe, 2006) as well as earlier modeling studies (Lambert, 1995, 2004) suggest a reduced frequency of extratropical cyclones due to a decreased surface meridional temperature gradient over the Northern Hemisphere. However, this decrease is not spatially uniform as storm activity south of 60∘ N over the northeastern Atlantic and western Europe opposes this tendency, showing an increase in the CMIP3 projections (Leckebusch et al., 2006). Most of CMIP3 and earlier studies (Della-Marta and Pinto, 2009; Pinto et al., 2006, 2009b; Bengtsson et al., 2006; Geng and Sugi, 2003; Leckebusch et al., 2006) indicate an eastward extension of storminess associated with an increase in frequency of strong storms over the British Isles, the North Sea and northwestern Europe. Moreover, Zappa et al. (2013) have shown that the winter storm track's response in CMIP5 (late 2000s generation) projections manifests as a tripolar pattern, with an increase over the British Isles and decreased activity over both the Norwegian and the Mediterranean seas.
In most of the modeling applications, the horizontal resolution constrains the ability of GCMs to simulate both the important regional features and the large-scale circulation. So far, the quality of the simulated present climate and thus presumably projections of future climate have improved over time owing to progressing development of GCMs including resolution and representation of the physical process. Nevertheless, present climate simulations in CMIP5 models still suffer from notable biases, i.e., on a regional scale.
Zappa et al. (2012) have shown that CMIP5-based cyclones are generally too weak and the DJF storm track pattern is too zonal. These deficiencies are associated with the tripolar bias, manifested by negative anomalies over the Norwegian Sea and central-eastern parts of the Mediterranean, and positive anomalies spreading across northwestern to central Europe towards the Black Sea. These biases are largely due to the inability of low-resolution models to correctly capture flow–orography interactions and thus correctly represent the tilt of the eddy-driven jet stream over the North Atlantic. Kelley et al. (2011) showed that the increased horizontal resolution in CMIP5 (∼ 200 km) models potentially allowed for a spatial refinement in the simulated geographical pattern and for improvements in the simulated amplitude of precipitation indices. However the resolutions of the CMIP5 GCMs are not sufficiently high to correctly represent daily precipitation extremes (and their changes) and lead to severe underestimations (Sillmann et al., 2013).
Projections downscaled with RCMs may refine spatial details but will mostly inherit the large-scale circulation biases from the driving GCMs. Therefore, increasing spatial and temporal resolution in GCMs is crucial to improve the representation of the simulated mean climate, weather extremes and their changes. The PRIMAVERA project (https://www.primavera-h2020.eu/about/objectives/, last access: February 2018) focuses specifically on high-resolution modeling of the Euro-Atlantic climate. Modeling efforts pursued within this project facilitate an analysis of regional changes and associated impacts. For example, Schiemann et al. (2017) have shown an improved representation of atmospheric blocking, which often redirects storm tracks, when simulated at higher (i.e., 25 km) resolution. Yang et al. (2015) used a high-resolution climate prediction model and highlight the importance of credibly resolved upper tropospheric jet flow in order to skillfully predict storm track statistics and associated extremes. Other studies (Kitoh and Endo, 2016; Barcikowska et al., 2018) employing relatively high-resolution models (∼ 20 to ∼ 50 km) pointed to much higher skill in capturing large-scale circulation features, spatial features and magnitude of precipitation extremes. First experimental simulations at even higher resolution (1–5 km, Kendon et al., 2014; Ban et al., 2015; Lehmann et al., 2015) were capable of projecting changes in heavy rainfall on sub-daily timescales but are usually too expensive to perform.
While it is important to understand the impacts from the worst-case emissions scenarios in order to support policy-relevant mitigation and adaptation strategies as expressed in the Paris agreement, it is also necessary to assess the role of near-term global climate change in anticipating the shifts in regional climate and weather as a function of the 1.5 and 2 ∘C climate policy goals. However, there is a wide range of global temperature responses and considerable overlap of the CMIP5 models to lower emission scenarios that encompass the 1.5 and 2 ∘C levels of global warming (Mitchell et al., 2017). As such, teasing out the relative differences between these two temperature targets is not trivial and requires an alternate modeling strategy that obviates the transient uncertainty with respect to when a given model crosses either the 1.5 or 2 ∘C threshold (Kalmarkar and Bradley, 2017), mitigates the impact of potential differences in the phasing and amplitude of internal climate variability, and provides enough ensemble members to adequately distinguish the relevant climate change statistics.
The high-resolution CAM5 simulations as part of the Half a degree Additional warming, Prognosis, and Projected Impacts (HAPPI) project provides such a set of model experiments targeted specifically at differentiating the climate response between the 1.5 and 2 ∘C global temperature levels and their regional implications (Mitchell et al., 2017). The high spatiotemporal resolution of the CAM5 HAPPI experiments are unique in that they allow for a detailed analysis of large-scale changes to North Atlantic storm track activity and differential impacts as a function of model resolution – a necessary component for studying changes in precipitation and atmospheric circulation on sub-daily timescales and for the representation of extreme weather events.
The aim of this study is to assess changes in the winter climate and weather extremes over the Euro-Atlantic region associated with the 1.5 and 2 ∘C levels of global warming. In this study we employ the Community Atmospheric Model version 5 (CAM5), which is available at different horizontal resolutions. This allows us to investigate the impacts of a very high model resolution on the representation of large-scale and regional features in comparison to a coarser resolution. Additionally this model provides unprecedented opportunity to investigate extremes on sub-daily timescales. Our primary focus here is on the differences between these two temperature levels in the context of extreme precipitation, winds and storminess. The availability of high-frequency model output (3 hourly) allows us to investigate changes in sub-daily events and also to extract storm tracks using a tracking algorithm (Feser et al., 2015b).
The structure of the study is as follows: Sect. 2 describes the data and explains the methods used in the analysis. The impact of the horizontal resolution on the representation of atmospheric large-scale circulation is investigated in Sect. 3.1. The historical runs are validated against observed mean atmospheric circulation and precipitation, as well as high percentiles of daily precipitation in Sect. 3.2. Section 4 focuses on changes in the mean climate and weather extremes. A summary and discussion follow in Sect. 5.
2.1 Data
To assess the importance of the horizontal model resolution, we first analyzed historical runs of CAM5.1 (http://www.cesm.ucar.edu/models/cesm1.0/cam/, last access: February 2018), provided by the C20C+ Detection and Attribution Project (http://portal.nersc.gov/c20c/main.html/, last access: February 2018). We compare three runs, which cover the period 1979–2005 and are performed at different resolutions. The CAM5-1-2degree run (hereafter CAM5_2, Wolski et al., 2014), the CAM5-1-1degree run (hereafter CAM5_1, Stone et al., 2018) and the CAM5-1-0.25degree run (hereafter CAM5_0.25, Wehner et al., 2015) are performed at atmospheric horizontal grid distances of 2.5∘ × 1.875∘, 1.25∘ × 0.937∘ and 0.3125∘ × 0.234∘, respectively. The 1979–2005 runs use historical values for all forcings (GHGs, ozone, volcanic aerosol, solar), except land-use changes (set at year-1850), and without changes in non-volcanic aerosols, which adopt a year-2000-era repeated annual cycle.
Projected climate change impacts on the mean climate state and on extreme weather are investigated based on model simulations with CAM5.1.2 (hereafter CAM5.1.2_0.25) at the highest available ∼ 0.25∘ horizontal resolution. The simulations are part of the HAPPI experiment (Mitchell et al., 2017). The project is designed to provide model output data describing climate and weather changes under 1.5 and 2 ∘C levels of global warming, as compared to preindustrial conditions (1861–1880). The design of HAPPI (Mitchell et al., 2017) provides three time slice experiments, using atmosphere-only models, to create large ensembles of 10-year simulations for the present climate (2006–2015) and potential future climate under 1.5 and 2 ∘C levels of warming (2106–2115). The two future run ensembles will hereafter be referred to +1.5 and +2 ∘C, respectively. Observed forcing conditions include SSTs and sea ice (Taylor et al., 2012). SSTs in future scenarios are prescribed by summation of the observed 2006–2015 SSTs and an offset estimated between decadal averages of the 2006–2015 period and the projected warmer global conditions for the 2091–2100 period. The 2006–2015 runs use 2006–2015 values for all forcings (GHGs, nonvolcanic aerosols, ozone, volcanic aerosol, solar), except land cover (set at 1850). Representative Concentration Pathway 2.6 (RCP2.6, year 2095) is used to provide the model boundary conditions, including atmospheric GHG concentrations, aerosols, ozone, land use and land cover for the 1.5 ∘C scenario. For the 2 ∘C scenario these conditions are the same, except the CO2 concentration, which is set to a weighted combination of the RCP2.6 and RCP4.5 scenarios
It is important to underline that the design of HAPPI future simulations use the same aerosol forcing (RCP2.6, year 2095). This protocol differs essentially from the protocol of historical simulations, causing a nonnegligible decrease in the aerosol forcing in both future scenarios. Wehner et al. (2018a, b) (accepted in Earth System Dynamics) found a remarkable reduction in total aerosol optical thickness over the Northern Hemisphere for these scenarios, reaching up to 50 % over the North Atlantic and European regions. Thus the interpretation of differences between future and present climate could be complicated by the combined effects of the reduced aerosols and increasing CO2.
The simulated features of large-scale circulation are compared with reanalysis data of monthly pressure at mean sea level (hereafter SLP), winds at 850 hPa level and DJF precipitation rates (hereafter PR) for the period 1979–2005. For SLP and wind we use ERA-Interim, provided by the European Centre for Medium-Range Weather Forecasts (https://www.ecmwf.int/en/research/climate-reanalysis/era-interim, last access: Feburary 2018), at the spatial resolution of ∼ 0.75∘ × 0.75∘. We also use NCEP-DOE AMIP-II Reanalysis 2 (Kanamitsu et al., 2002, https://www.esrl.noaa.gov/psd/data/gridded/data.ncep.reanalysis2.html, last access: January 2018), at 2.5∘ × 2.5∘ resolution. Precipitation is provided by the University of Delaware (V4.01), http://climate.geog.udel.edu/~climate/html_pages/README.ghcn_ts2.html (last access: January 2018). It is a global gridded land data set, with 0.5∘ × 0.5∘ horizontal resolution. For comparison of the large-scale features, all variables were interpolated on a common 2.5∘ × 2.5∘ horizontal grid. For our analysis of daily precipitation data, we use E-OBS (Haylock et al., 2008; http://www.ecad.eu, last access: January 2018), provided by the European Climate Assessment and Dataset. The data set contains daily precipitation sums on a 0.25∘ regular latitude–longitude grid for the period 1950–2015.
2.2 Methods
Our analysis of projected climate change focuses on the North Atlantic and European sector (27–75∘ N, 80∘ W–45∘ E). While most of the analysis focuses on the DJF season, the analysis of storm tracks is extended to the period of October to March (ONDJFM).
We use the long historical run of CAM5.1 at ∼ 0.25∘ resolution (CAM5_0.25), which includes the 1979–2005 period, and also a five-member ensemble for the period 2006–2015 (CAM5.1.2_0.25), when referring to present climate. Five-member ensemble simulations for the 1.5 and 2 ∘C levels of warming are referred to as future +1.5 and +2 ∘C runs, respectively. Comparison of the mean DJF climate in the present and future runs was computed by averaging differences between the two paired samples (present vs. future runs, or future +1.5 ∘C vs. +2 ∘C runs), each consisting of 50 seasonal (DJF) values. Statistical significance of differences in the mean DJF climate between future and present climate is tested with the Wilcoxon signed rank test at the 5 % significance level. It is a nonparametric test and hence it can be used without the assumption that the population follows Gaussian distribution.
The analysis of the simulated large-scale circulation will be based on monthly means of hydrometeorological variables for the winter (December, January, February, hereafter DJF) season. Ambient flow over the North Atlantic is described by the meridional SLP gradient between the SLP in the vicinity of the Azores and SLP over Iceland. The metric is relevant to the North Atlantic Oscillation index; hence the location and size of the regions are chosen to match the location of the simulated maxima and minima of SLP, i.e., 30–20∘ W, 30–40∘ N and 25–15∘ W, 60–70∘ N, in the present climate and future projections. Spatial patterns of the mean SLP fields were compared using centered pattern correlation. The maximum of the zonal wind was estimated for the region 0–30∘ W, 50–65∘ N.
The extreme precipitation analysis is based on the 95th percentiles of 3 h and daily total precipitation ratio and return values (RVs) for a return period T = 10 years. The RVs were estimated by fitting generalized extreme value (GEV) distribution by the method of maximum log-likelihood estimation (MLE) (Coles, 2001; Smith, 2003; Wilks, 2006; Gilleland and Katz, 2014) to a block (seasonal) maximum in the 50-year sample of concatenated member runs. The design of the HAPPI simulations satisfies requirements of stationarity and independence necessary to fit with a stationary GEV model.
RV for a given return period (T) are defined as values expected to be exceeded once per T years. RVs are estimated as the values corresponding to [(1 − 1∕T)th quantile] of a sample fitted to the GEV model. For example the 90th quantile (10 % exceedance probability) is an RV for a T = 10-year period. The analysis here focuses on 10-year periods of RVs because estimations for longer periods (e.g., 50-year periods with an exceedance probability of 2 %) are more prone to sampling errors and biases due to large uncertainties on the tails given relatively short samples.
The goodness of fit to the GEV model is estimated with the Anderson–Darling (A–D) test. The test is a modified version of the Kolmogorov–Smirnov goodness-of-fit test. The A–D test gives more weight to the tail and therefore is more suitable for EV distribution analysis. Analysis shows that it validates most of the estimations of extreme precipitation for midlatitude and high latitudes. However, approximations for the regions in the southern parts of Europe, where the mean precipitation is much lower, have shown larger uncertainty. Similar results were obtained in the analysis of the extreme precipitation, where the Kolmogorov–Smirnov test was applied (Barcikowska et al., 2018).
2.3 Storm tracks
Changes in storminess were explored with two measures of daily values during the DJF season. The first one uses high percentiles (95th) of daily wind speed. The second is a transient poleward temperature flux at 700 hPa, computed with the daily meridional wind and temperature deviations from the wintertime average. Anomalies were filtered with a 2–10-day band-pass (Butterworth) filter and averaged over the DJF season.
Storm tracks were extracted using a tracking algorithm according to Feser and von Storch (2008). The automated tracking approach facilitates the analysis of spatiotemporal variability in cyclones, their lifetime and intensity (Ulbrich et al., 2009; Neu et al., 2013). The algorithm consists of two parts: detection and tracking. The first part searches for the local minimum SLP and maximum wind speed. Additionally, before tracking, a spatial digital band-pass filter (Feser and von Storch, 2005) was applied to the 3-hourly output of SLP fields to extract mesoscale features of variability.
A storm was identified when a lifetime wind speed maximum exceeded 18 m s−1, and a pressure minimum dropped to 950 hPa and a filtered pressure anomaly of −1 hPa. Only tracks lasting more than 96 h were taken into account in order to extract relatively long-lived and intense storms. Cyclones forming at latitudes higher than 60∘ N were excluded to align with the purpose of the study, which focuses on the European climate.
Seasonal fields of spatial density (SPD) of 3-hourly storm occurrences were accumulated within a 4∘ × 4∘ grid and weighted by the unit area. Spatial intensity fields were computed by aggregating the number of 3 h storm occurrences within 3∘ × 3∘ grid boxes with maximum intensity exceeding certain thresholds. The threshold for the accumulated wind fields is 10 m s−1 and 0.25 mm h−1 for precipitation. Additionally, maximum intensity values were chosen from each 3∘ × 3∘ grid falling within an area of 9∘ × 9∘ from the center of the storm. This approach facilitates the analysis of the storm's impact not only in the regions with local maximum but also for the exposed regions within larger distances from the center.
To evaluate the performance of the CAM5 simulation, we compare time-average (1979–2005) SLP fields from observations with three CAM5 historical simulations each run at different resolution, where all data sets are interpolated to the lowest data set resolution (2.5∘ × 2.5∘ lat–long grid). ERA-I (∼ 0.75∘) and NCEP-CFSR (∼ 0.34∘) observations are provided at higher resolutions than NCEP/DOE 2 (∼ 2.5∘); hence they better serve the purpose. The SLP fields in ERA-I and NCEP-CFSR are almost identical, with small differences over Greenland (not shown). Hodges et al. (2011) also found that these reanalyses agree, in both terms of numbers and locations of extratropical cyclones, much better than the older ones (JRA-25) for both hemispheres and that intensities are higher. A comparison of ERA-I with NCEP/DOE 2 shows most differences in the vicinity of Greenland. The latter shows slightly higher SLP values over land and lower SLP values southeast of Greenland. Nevertheless, the SLP patterns share very high correlation (uncentered), which is 0.98. As shown below, the differences between ERA-I and CAM5 are of larger magnitude than the observational differences.
Figure 1 shows that all simulations exhibit realistic patterns of the meridional SLP gradient. However, the gradient between the Icelandic Low and Azores High, which characterizes the typical North Atlantic Oscillation (NAO) pattern, intensifies with increasing resolution. The magnitude and the pattern in ERA-I correlate best with the one simulated at similar horizontal resolution (CAM5_1) (r = 0.96). Correlations with the remaining two are slightly smaller, i.e., 0.95 for CAM5_2 and 0.94 for CAM5_0.25. The magnitude in CAM5_0.25 is most intense, which agrees well with stronger westerlies from Greenland towards the British Isles, indicating a stronger midlatitude jet stream. Secondly, both CAM5_2 and CAM_1 show a strong positive SLP bias in the subtropical part of Europe and North Africa and a negative bias extending from Iceland towards southeastern Europe and the Caspian Sea, causing the mean ambient flow (Fig. 1 contours of differences between CAM5 and reanalysis) over the eastern North Atlantic and most of Europe to be more zonally oriented when compared to the reanalysis.
The deficiencies in the SLP fields are also reflected in the anomalies of zonal wind (Fig. 2) along the borders of the SLP circulation patterns. Both CAM5_2 and CAM5_1 exhibit anomalously strong westerlies extending across Europe from the British Isles towards Turkey. This corresponds with the zonal bias in the ambient flow and pattern of storm tracks, found in the same regions in CMIP5 models (Zappa et al., 2012). This zonal bias in the ambient flow (Fig. 1) is strongly reduced in the high-resolution run (CAM5_0.25).
The results presented here indicate that using high-resolution CAM5 simulations in applications to the winter climate over the Euro-Atlantic regions adds considerably better performance than simply spatially more detailed information. At higher resolution, the large-scale atmospheric flow and associated midlatitude jet stream is better represented, in terms of both the pattern and the magnitude. This improvement will presumably lead to a more realistic representation of the midlatitude storm tracks and, associated with them, wind and precipitation over Europe.
Figure 3a shows that mean seasonal precipitation in CAM5_0.25 indeed bears a very close resemblance to observations. However the comparison also indicates a much higher magnitude of precipitation over regions with complex orography (up to 1 mm day−1) such as the Alps and the western coasts of Scandinavia and the UK. Our comparison of observed (E-OBS) and simulated daily precipitation at the same resolution (∼ 0.25∘) also demonstrates very high skill of CAM5_0.25 in simulating precipitation extremes. Figure 3b compares 90th percentiles of daily precipitation extremes, indicating that CAM5 skillfully captures the structure and sharp gradients over orographically complex subdomains. Again, in some mountainous regions like the northwestern coast of the Balkan Peninsula and southwestern coast of Turkey, the simulated values are much higher than the observed ones.
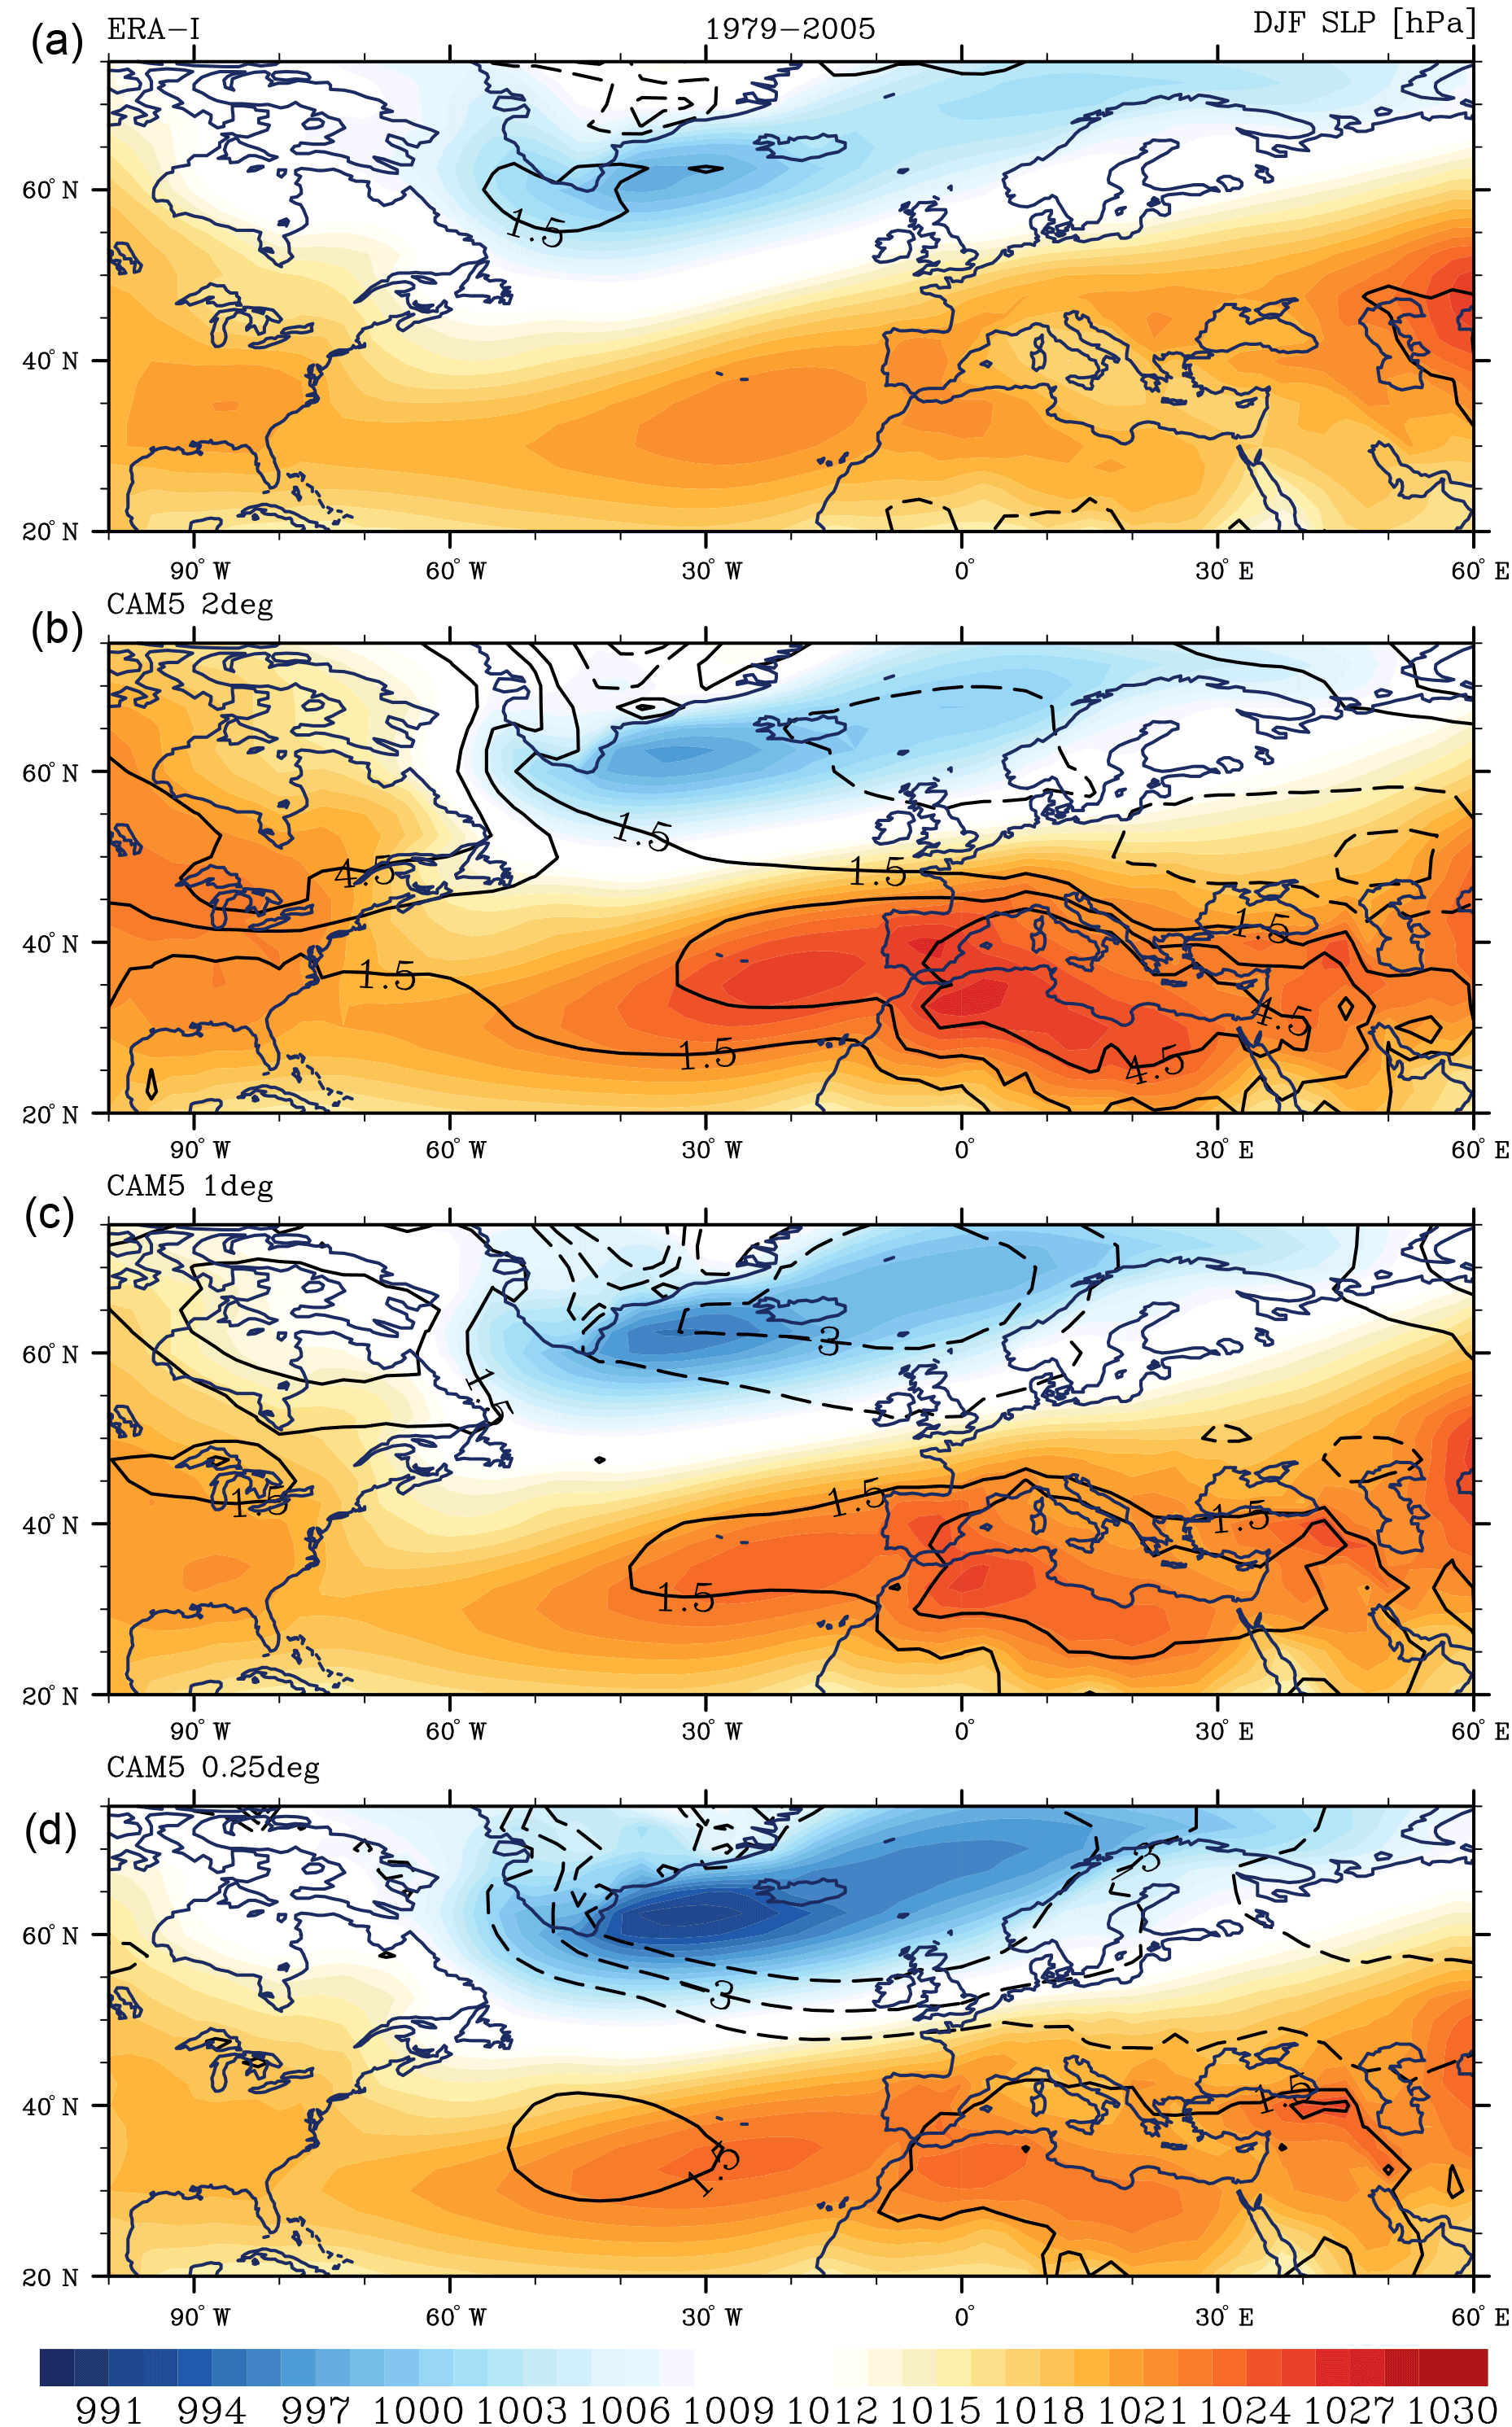
Figure 1Time-mean average of the DJF sea level pressure (hPa) over the period 1979–2005, regridded to a 2.5∘ × 2.5∘ horizontal grid for ERA-Interim (ERA-I, ∼ 0.75∘ lat–long original resolution), and CAM5 at ∼ 2∘ (CAM5_2deg), ∼ 1∘ (CAM5_1deg) and ∼ 0.25∘ (CAM5_0.25deg) lat–long resolution. Contours show a difference in reference to (a) NCEP-DOE 2 (2.5∘ lat–long) and (b–d) ERA-Interim.

Figure 2Time-mean average of the DJF zonal wind (m s−1) over the period 1979–2005, regridded to a 2.5∘ × 2.5∘ horizontal grid for ERA-Interim (ERA-I, ∼ 0.75∘ lat–long original resolution), and CAM5 at ∼ 2∘ (CAM5_2deg), ∼ 1∘ (CAM5_1deg) and ∼ 0.25∘ (CAM5_0.25deg) lat–long resolution. Contours show the difference, in reference to ERA-Interim.
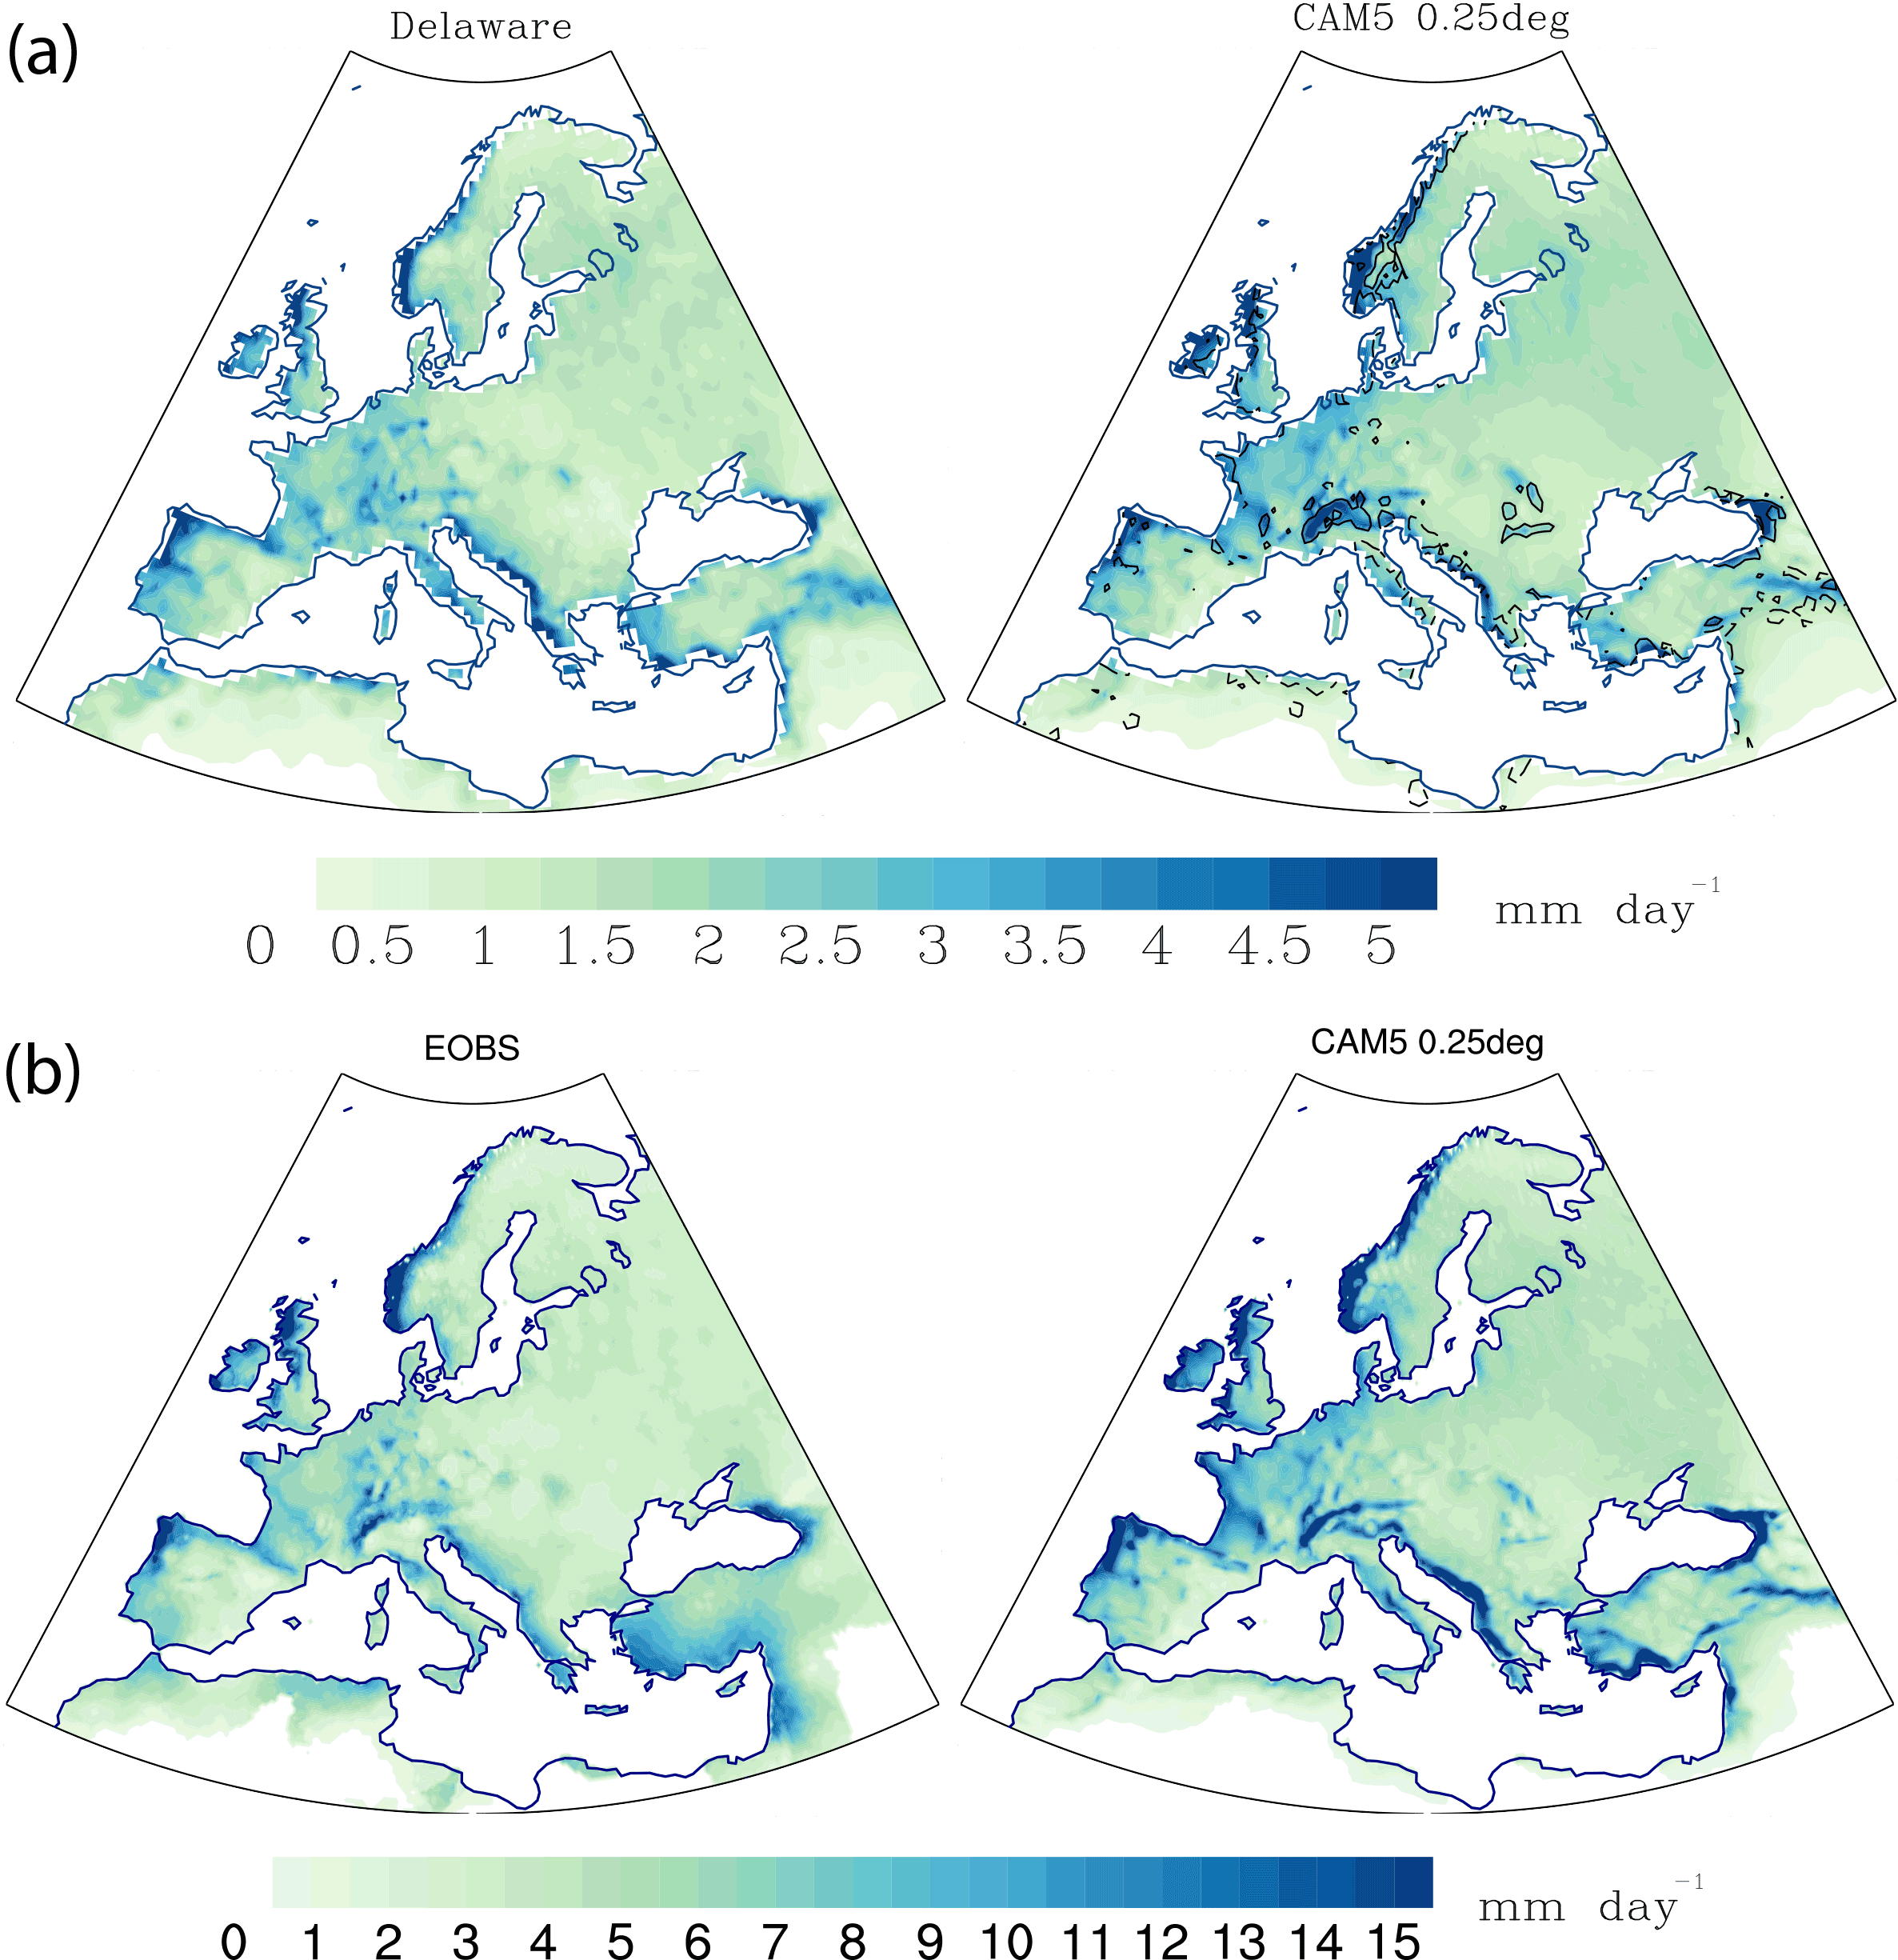
Figure 3(a) Time-mean average of DJF monthly means of precipitation ratio (mm day−1), averaged over the period 1979–2005, in observations (Delaware, 0.5∘ resolution), and the CAM5_0.25 model, smoothed to 0.5∘ × 0.5∘ horizontal resolution; (b) DJF daily precipitation 90th percentiles (mm day−1), averaged over the period 1980–2005 in observations (E-OBS, 0.25∘ resolution) and the CAM5_0.25 model.
At the same time, it is important to note that constructing homogenous and high-resolution observational data sets is severely limited over these regions. Thus the differences among these data sets may originate either from the model bias or from observational bias (deficient quality or lack of the observations in these regions). As pointed out for Spain, the differences among different observational data sets may be higher than differences between model simulations and a certain observational data set (Gómez-Navarro et al., 2012).
Overall, the comparison strongly suggests that high-resolution runs provide a more accurate representation of the winter climate and weather for the Euro-Atlantic sector, where storms play an important role. A correct representation of storm tracks, governed by the ambient flow, is crucial for capturing the wind and precipitation extremes in the European region; thus in the following section we will focus on the analysis of CAM5 simulations on a 0.25∘ × 0.25∘ horizontal grid.
3.1 Impacts of climate warming at the +1.5 and +2 ∘C temperature levels: large-scale atmospheric circulation and precipitation changes
In this section, we investigate climate and weather changes associated with the two global warming temperature levels 1.5 and 2 ∘C, specified at the Paris climate agreement, and the recently experienced climate. Differences in the forcing between two future sets of HAPPI experiments is confined to different CO2 forcing and also to the SST offset, which corresponds to the difference between the decadal average of SSTs in the present climate and in projections reaching 1.5 ∘C or 2 ∘C levels of warming. Each of the experiment also includes internal climate SST variations (e.g., ENSO), in the same phase, i.e., during experiment 2006–2015. Therefore it is expected that the impacts of internal variations will be canceled out while discriminating among all three experiments. The interpretation between the future and present climate is more complex in HAPPI experiments, as the latter also includes impacts resulting from reduced aerosol forcing. Unfortunately, the protocol of the project lacks an additional experiment, which would allow isolating these impacts. Thus at the moment we have to accept the possibility of different factors dominating the changes derived between future vs. present climate and changes derived between the future scenarios. In the following part we will investigate future changes in the mean winter climate including precipitation and atmospheric circulation over the North Atlantic and Europe.
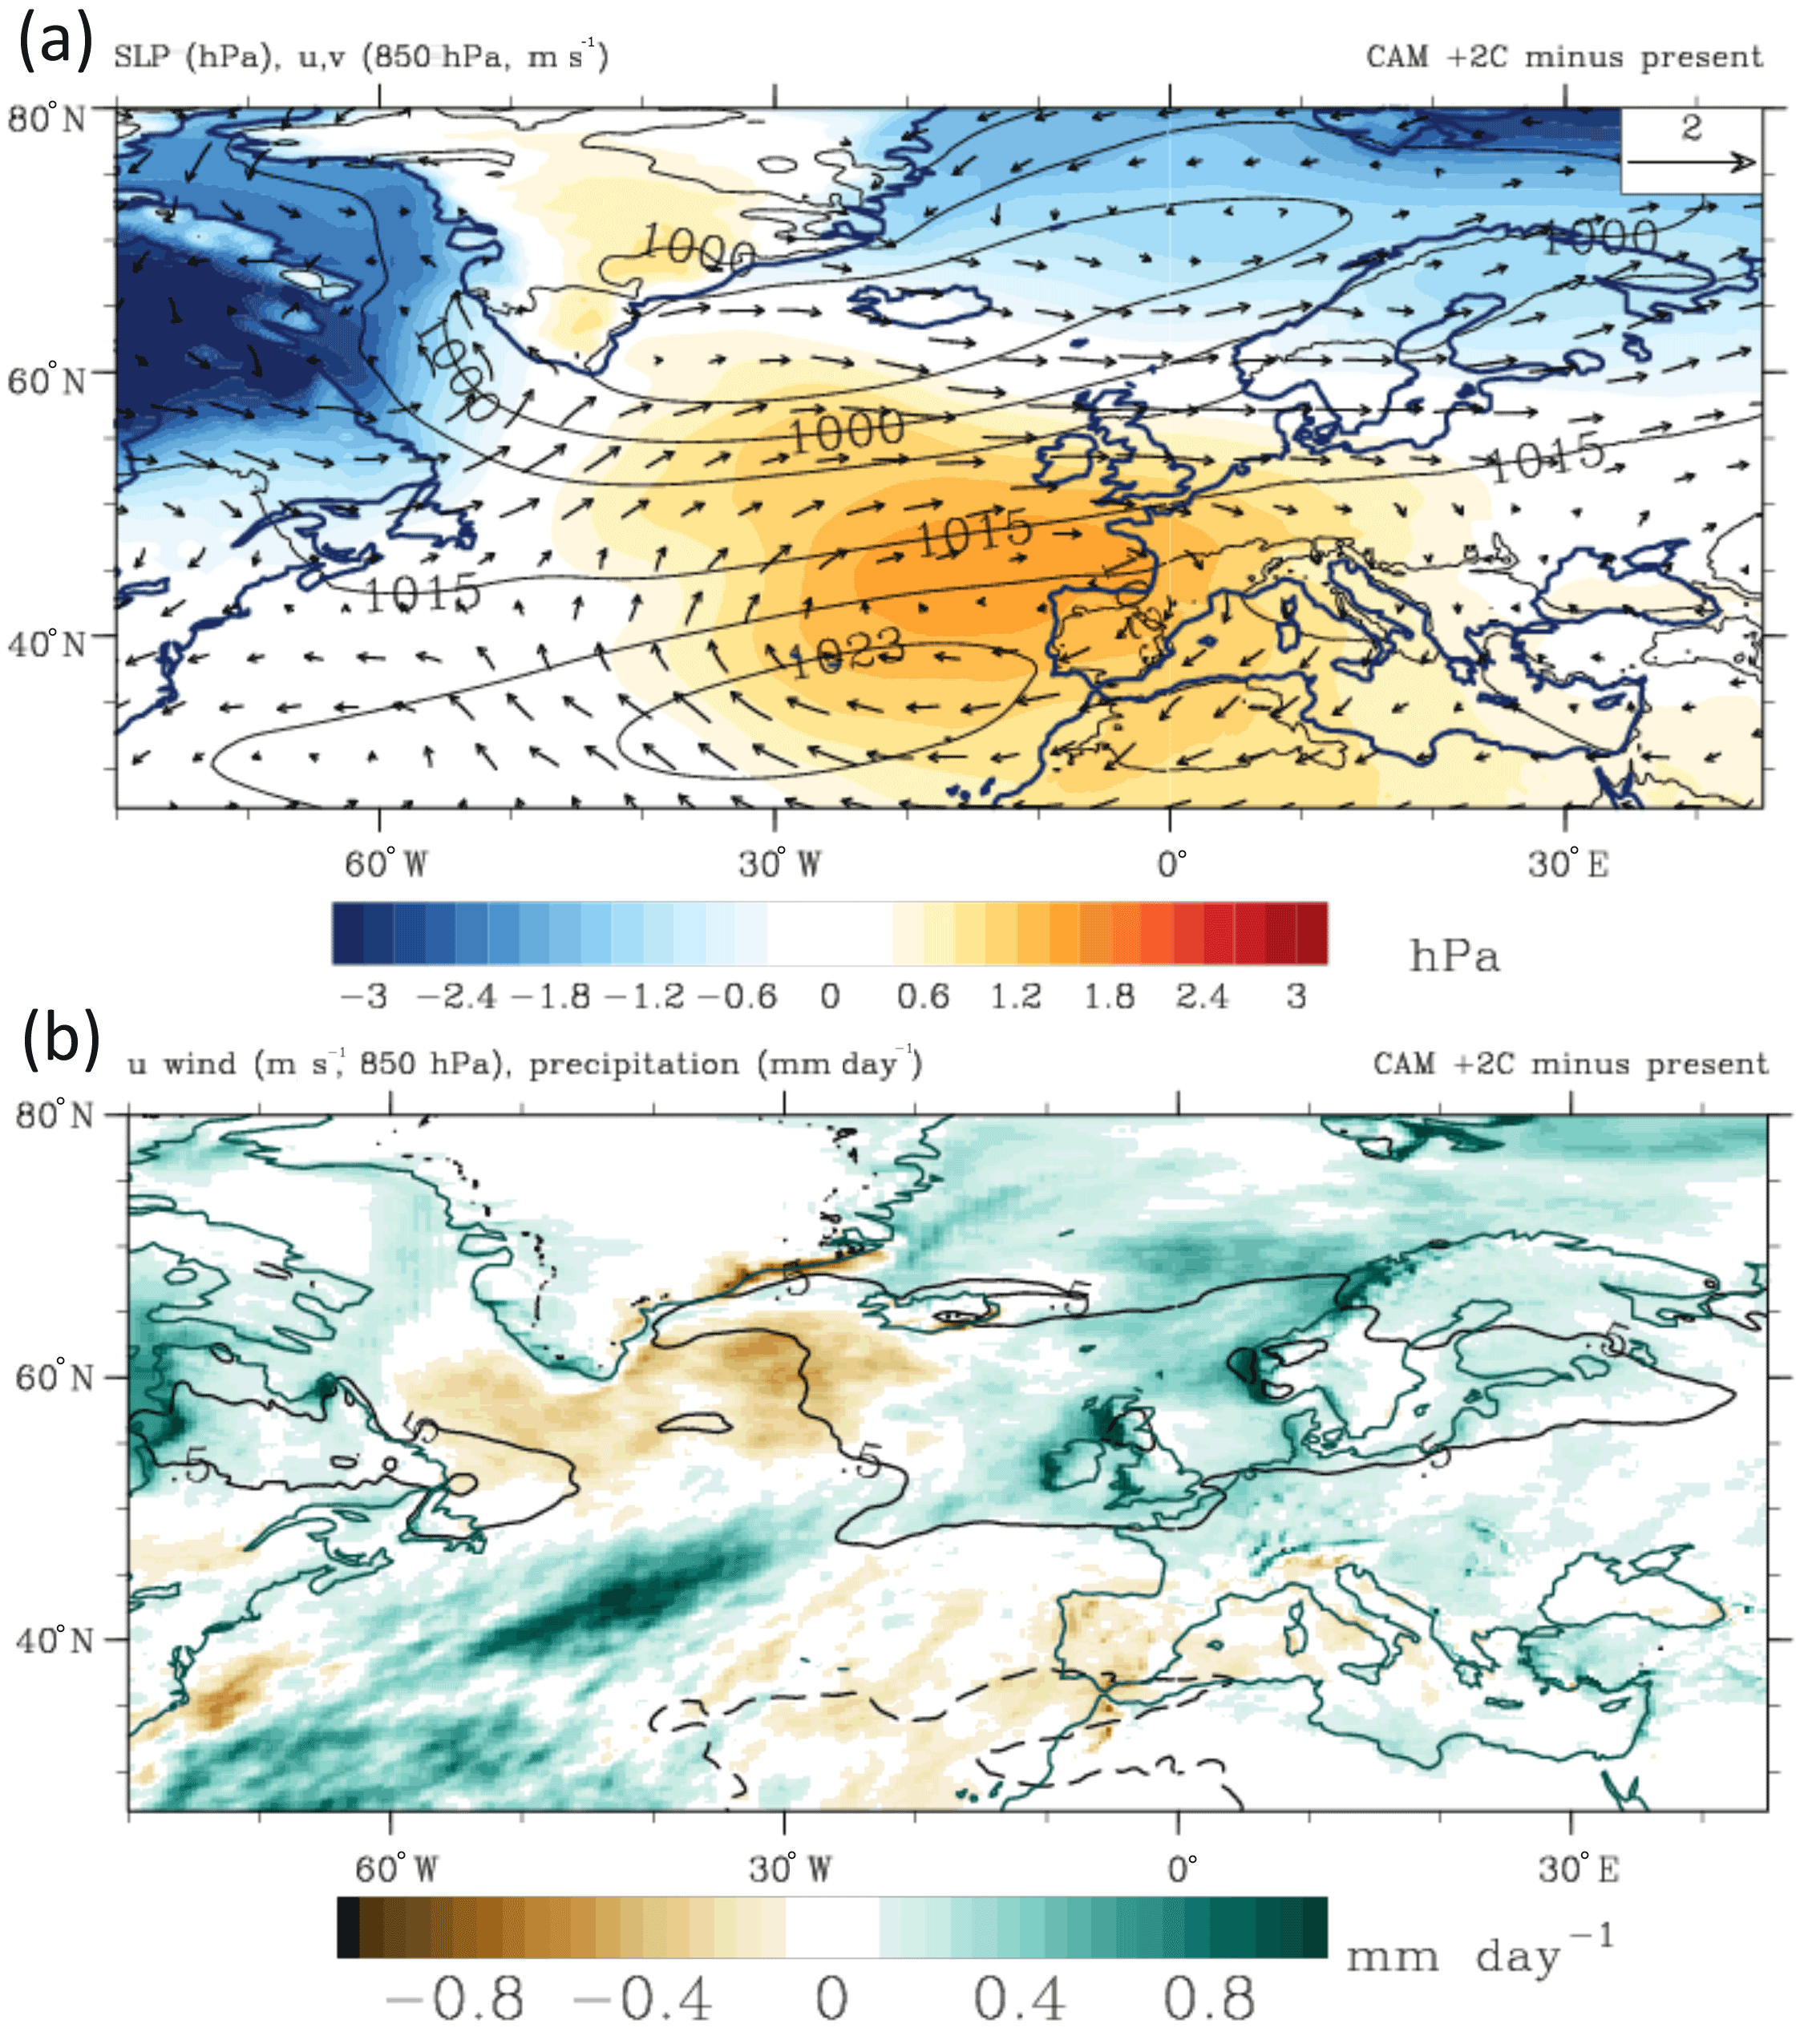
Figure 4Difference between +2 ∘C (runs 2106–2115) and present climate ensemble means (2006–2015) in DJF (a) sea level pressure (shaded, hPa) and wind vector at 850 hPa (m s−1). Contours show DJF sea level pressure in present climate ensemble, with a local maximum in the vicinity of the Azores and minimum in the vicinity of Iceland; (b) precipitation (mm day−1) and zonal wind (contours, m s−1) in CAM5_0.25.

Figure 5Difference between +2 and 1.5 ∘C ensembles in DJF (a) sea level pressure (shaded, hPa) and wind vector at 850h Pa (m s−1). Contours show (as in Fig. 4a) DJF sea level pressure in the present climate, with a local maximum in the vicinity of the Azores and minimum in the vicinity of Iceland; (b) precipitation (mm day−1) and zonal wind (contours, m s−1) in CAM5_0.25.
Here we explore the future response of large-scale winter circulation to the specified levels of global warming. Figure 4a and b depicts differences between the large-scale circulation at the 2 ∘C level of warming (CAM5.1.2_0.25) and the present climate. To aid interpretation of these changes in the context of the mean ambient flow, Fig. 4a also shows the present climate SLP pattern, featured with the maximum in the vicinity of the Azores and minimum over Iceland. The average SLP difference between these two regions is estimated as 29.6 hPa and the interseasonal standard deviation within the ensemble is estimated as 6.5 hPa. At the 2 ∘C warming level the meridional SLP gradient intensifies to 31.3 hPa, which is reflected in the positive SLP anomalies in the subtropical regions and the negative anomalies in the upper latitudes. The depicted pattern resembles to some extent the fingerprint of the previously found global warming response, characterized by intensified and poleward-shifted meridional circulation cells and corresponding intensification and shift of the westerlies among these cells (Lu et al., 2007; Yin, 2005; Bengtsson et al., 2006; Wu et al., 2010). Anomalously intense westerlies (Fig. 4a and b) extend eastward from north of the British Isles to the northern coast of Scandinavia. This feature corresponds to an increase in precipitation in these regions (Fig. 4b). The maximum change is located at the northwestern coasts of the British Isles (up to ∼ 0.8 mm day−1) and Norway (∼ 1 mm day−1), which are directly exposed to the influence of extratropical cyclones and the associated large quantities of moisture. Precipitation increases slightly over northwestern Europe (France and Germany, up to 0.3 mm day−1). The intensification of the subtropical high (Fig. 4a) is accompanied by easterly anomalies at the southern (equatorward) flanks of the anomalous divergent flow, which reduces precipitation, with a maximum near the center of the anticyclonic anomaly. The anomalies extend eastward and cover most regions of the Iberian Peninsula, but mostly they do not exceed a reduction stronger than 0.1 mm day−1 (Fig. 4b). At the same time, the derived pattern is not entirely clear as it depicts positive SLP anomalies over Greenland, reductions south of Greenland, and very weak zonal wind and precipitation anomalies in the subtropics. In the comparison between future scenarios, the pattern seems more robust and of larger magnitude.
The difference estimated between the two warming levels (Fig. 5a) clearly depicts that the additional half a degree warming added to the +1.5 ∘C level yields not only a remarkable intensification of the SLP gradient but also a strong poleward shift of the circulation cells, midlatitude westerlies and precipitation anomalies. The estimated SLP differences show statistical significance at the 5 % level, with most regions showing nonzero changes (Fig. S2). Figure 5 shows that the maximum SLP anomaly is located over the northern part of Bay of Biscay, while reduced precipitation expands northeastward, through the Bay of Biscay, France, southern parts of the British Isles and the North Sea. Drying over the northwestern coast of the Iberian Peninsula is even stronger, compared to the difference in reference to the present climate. Therefore, the zone of increased precipitation is more confined towards the north, covering northern parts of the British Isles and the Norwegian coast. The changes in the large-scale circulation are also manifested in the meridional SLP gradient, which increases from 29.1 to 31.3 hPa. It is worth noting that this difference is even larger than the one derived between the +2 ∘C warming and the present climate.
At the same time, changes associated with warming at the +1.5 ∘C level are quantitatively and qualitatively different from those shown above. In fact, the derived changes (Fig. S1a in the Supplement) in large-scale circulation manifest an opposite tendency, when compared with the previous results. However the magnitude of these changes is very small. The meridional SLP gradient decreases from 29.6 to 29.1 hPa. Consistent with it are (Fig. S1a) pronounced positive SLP anomalies over Greenland and negative SLP anomalies southeastward of the British Isles, which contributes to the weakening of the meridional cells. These results also explain why the +2 ∘C minus present pattern is much weaker in comparison to the one derived between future scenarios. The derived discrepancy points again to the combination of competing factors, i.e., reduced aerosols and increasing CO2, which renders the interpretation of the comparison of future and present climate more complex. This interpretation requires a separate analysis of an additional, properly designed experiment to isolate the effect of aerosol reductions. Thus in the following sections, we will focus mostly on the difference between the +1.5 and +2 ∘C scenarios.
3.2 Changes in daily and sub-daily precipitation extremes
In this section we investigate changes in daily and 3 h precipitation extremes associated with an increase in global warming from 1.5 to 2 ∘C (CAM5.1.2_0.25). Precipitation extremes are defined here as 95th percentiles and 10-year RVs, derived by fitting a GEV distribution to the HAPPI model outputs.
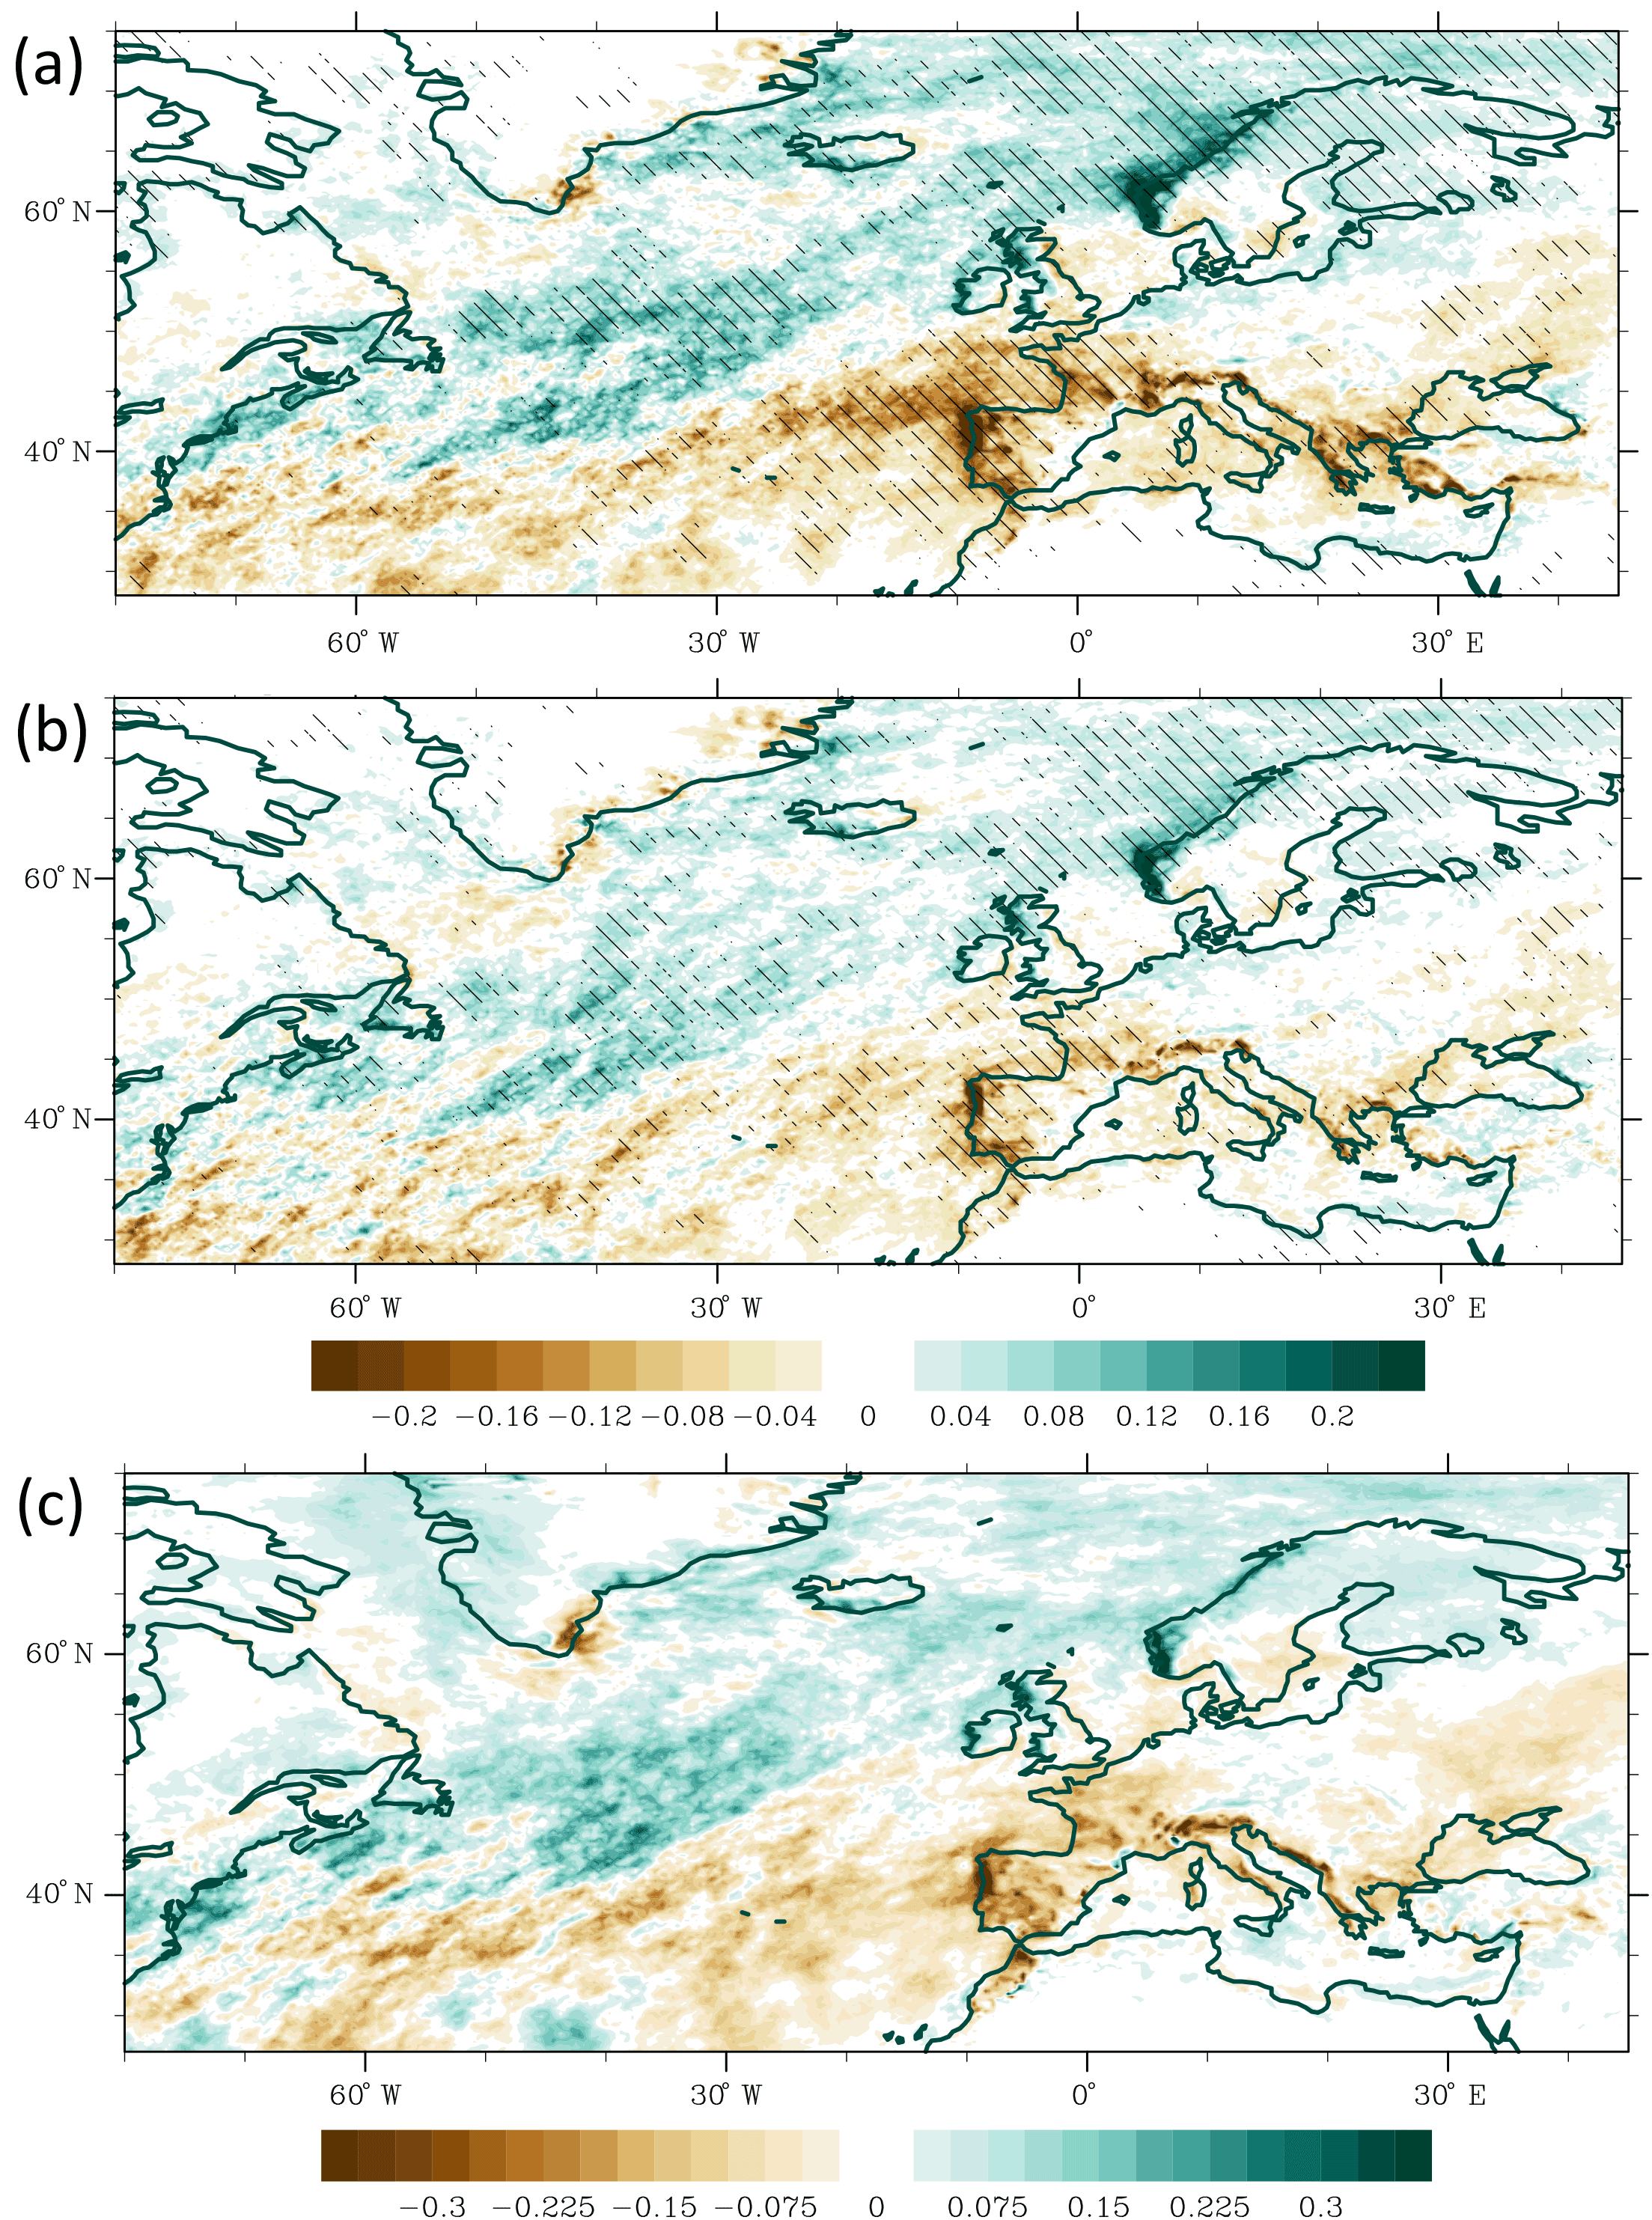
Figure 6Difference between +2 and +1.5 ∘C ensemble experiments for DJF (a) 95th percentile of 3-hourly precipitation, (b) 95th percentile of daily precipitation (mm h−1) and (c) 10-year return values in 3 h precipitation CAM5.1.2_0.25. Percentiles and return values are derived from the samples with values larger than 1 mm day−1. Regions in (a) and (b) are stippled for differences significant at the 10 % level.
Figure 6a and b present the future response derived for 95th percentiles of daily and 3 h precipitation, associated with an additional half a degree of warming. The response shows a bipolar pattern, with an increase over the North Atlantic over the northern part of the typical midlatitude storm track region and a decrease southward, over the region of anticyclonic anomalies. Significantly increased precipitation anomalies extend northeastward from Nova Scotia through the northwestern British Isles towards the Norwegian Sea and northern Scandinavia. The maximum change is located along the northwestern coasts of the British Isles and Scandinavia (up to ∼ 0.2 and 0.24 mm h−1 in 3 h precipitation, respectively), which corresponds well with the derived changes in mean precipitation.
Figure 6 also exhibits a significant (at the 10 % significance level) reduction over the Iberian Peninsula, northwestern Europe and southern flanks of the British Isles. The most radical decrease in sub-daily precipitation extremes occurs along the northwestern coast of the Iberian Peninsula (−0.25 mm h−1) and in the vicinity of the Bay of Biscay (−0.18 mm h−1). It is worth noting that changes in extremes of sub-daily precipitation are larger and more significant over larger areas. For example, the local minimum found in the extremes of sub-daily precipitation northwestward from the Iberian Peninsula is less recognizable in daily precipitation extremes, which may indicate a smaller impact of storminess on the daily scale, as compared to 3 h data.
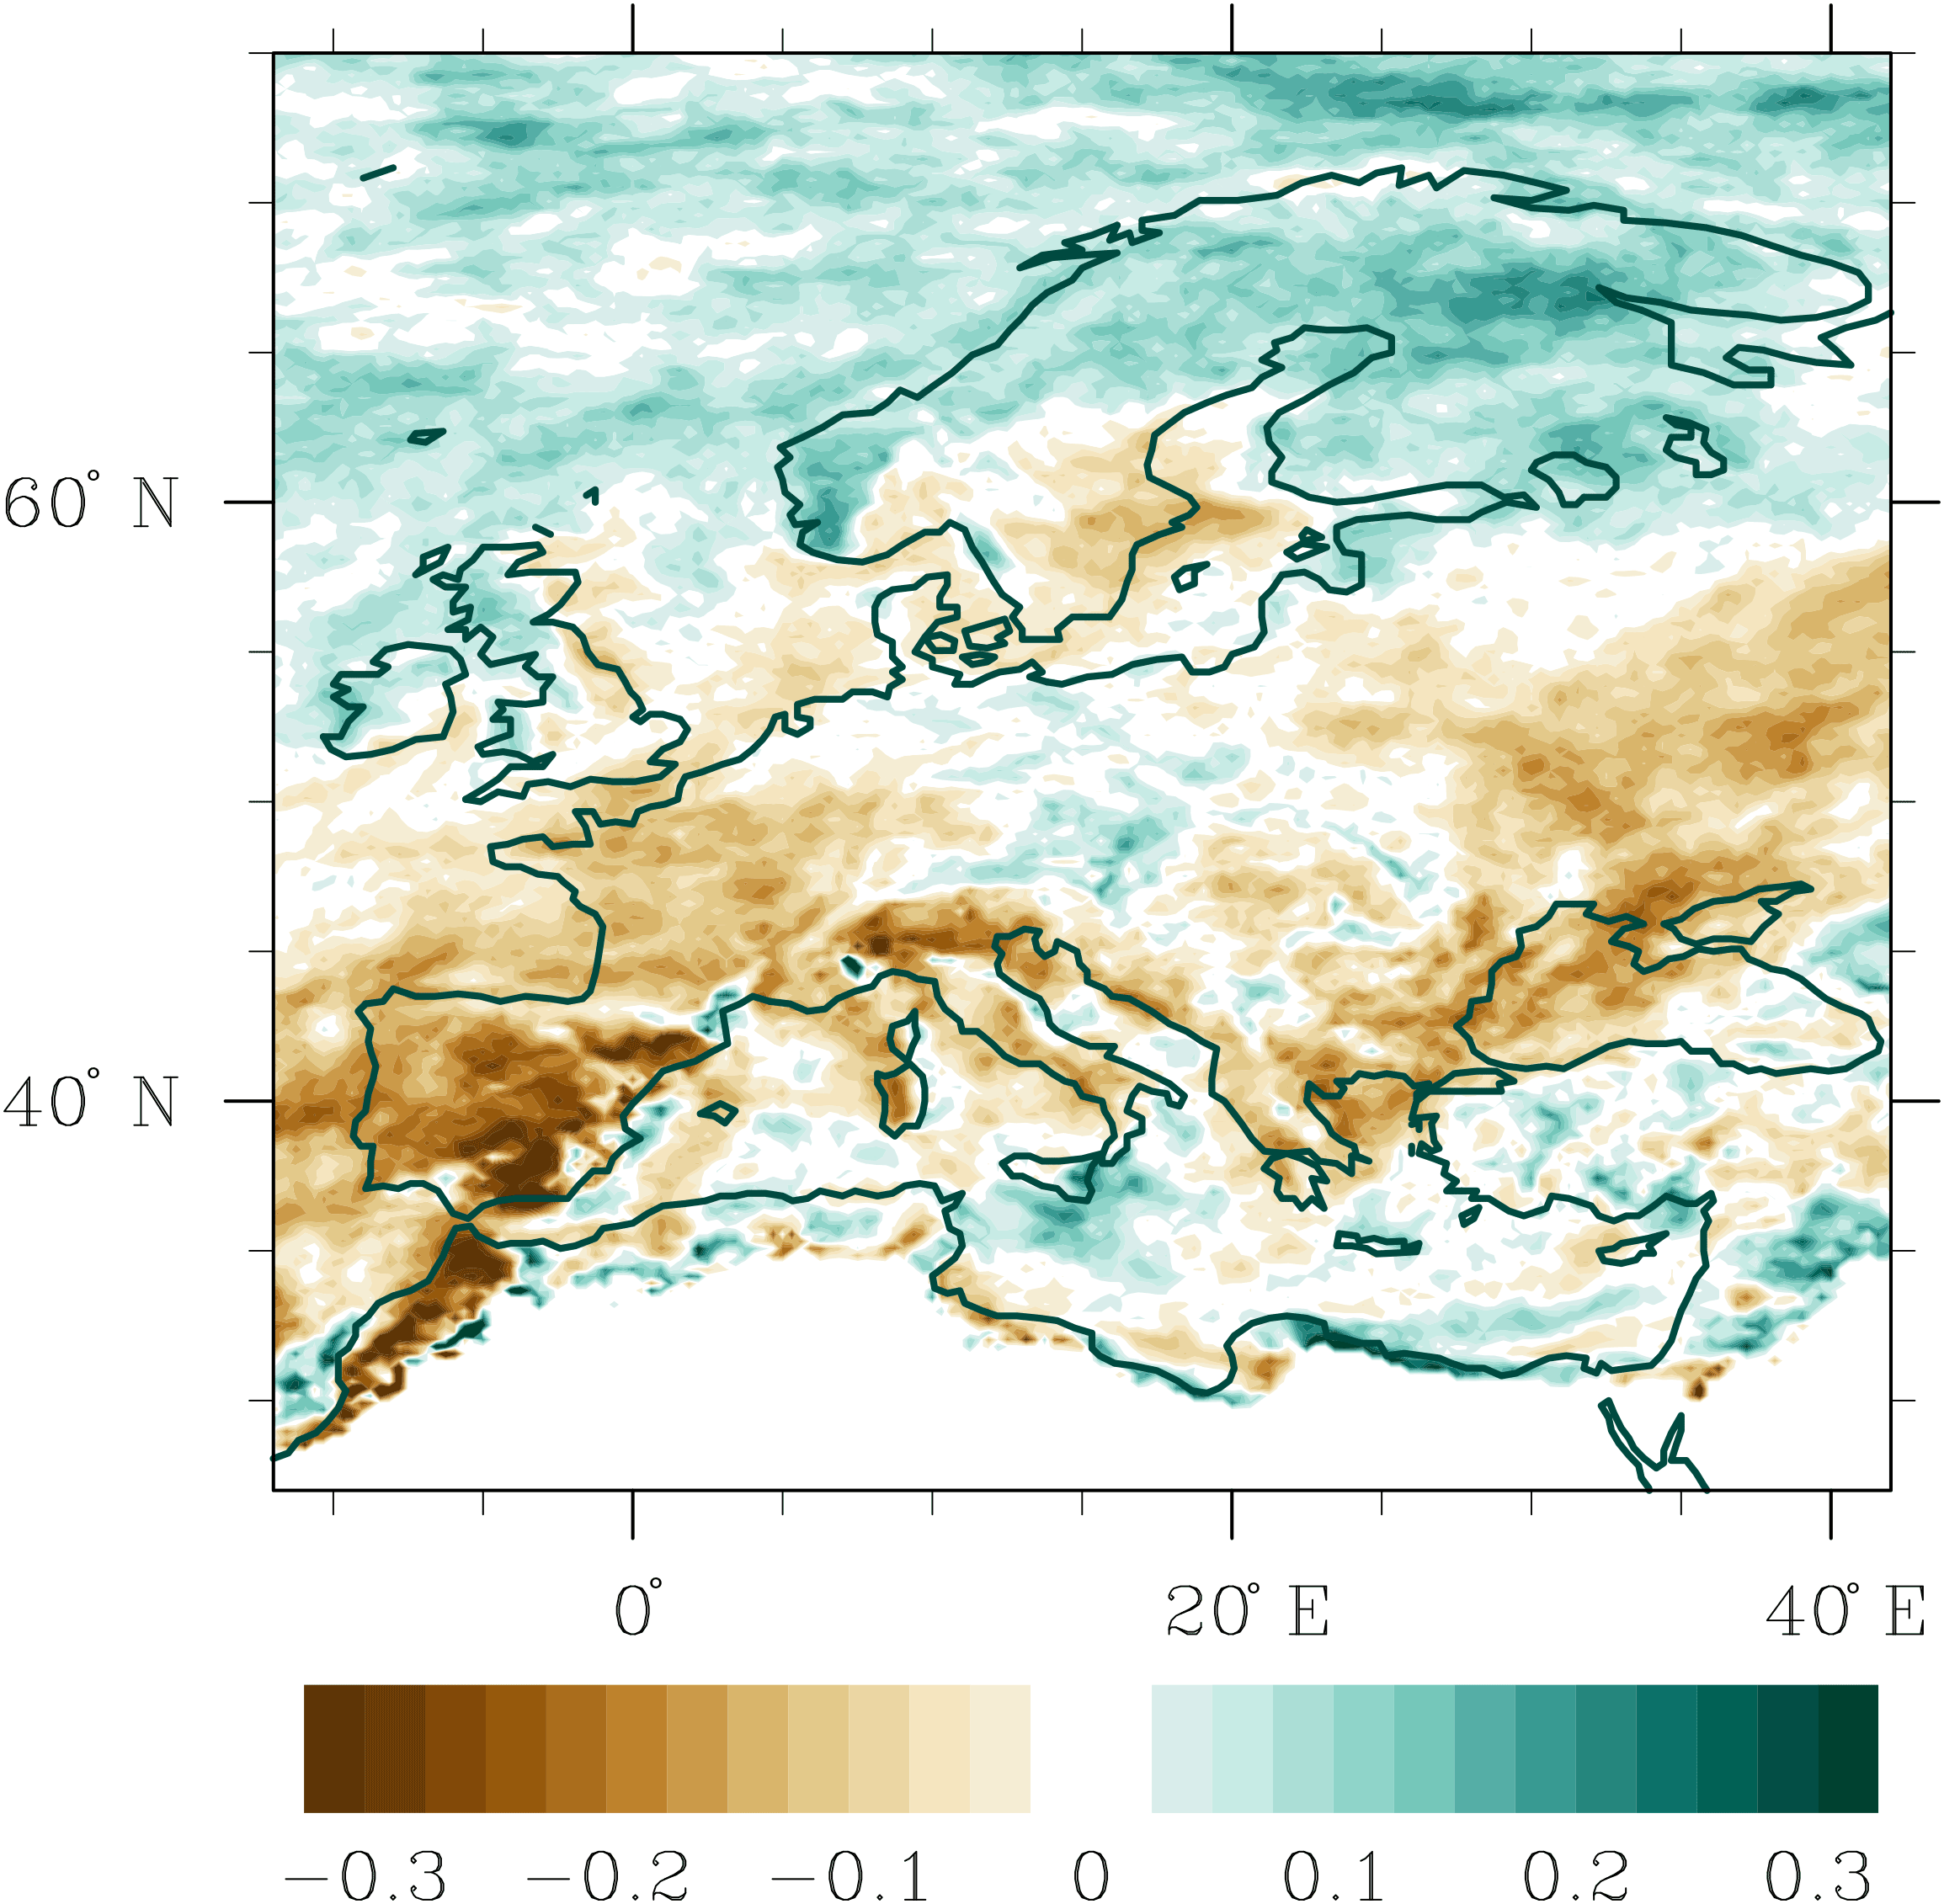
Figure 7Fractional change between +2 and +1.5 ∘C ensembles (ratio of the difference and the climatological mean in the +1.5 ∘C experiment) for 10-year return values of 3-hourly precipitation (× 100 %) in CAM5.1.2_0.25. Differences in precipitation were estimated for the values larger than 1 mm day−1.
The future response in 10-year RVs for sub-daily precipitation (Fig. 6c), derived from GEV statistical models, is consistent with the pattern derived from 95th percentiles and indicates even larger changes. For example, the increase over the northwestern coasts of the British Isles and northwestern Scandinavia reaches up to 0.3 mm h−1. The decrease in the western part of the continent, found in the analysis of the percentiles, covers a larger area and extends more towards the center of the continent. The magnitude of the precipitation and the changes in the off-coastal areas is often smaller. Nevertheless, the percent changes (in reference to the climatological values at the 1.5 ∘C level) (Fig. 7) indicate pronounced decreases (approaching a 15 %) in the interior of France, over the North Sea, southern Scandinavia and southeastern Europe and up to a 25 % increase in the interior of northeastern Scandinavia.
3.3 Climatology and changes in sub-daily wind extremes and storminess
In this section we investigate future changes in storminess associated with an increase in global warming from 1.5 to 2 ∘C. Apart from the chosen forcing scenario, additional uncertainty in predictions of future climate may also be related to the general model performance, known bias in the historical period and the ability to simulate certain features of interest. As such, a validation of the model skill in simulating the long-term climate is not necessarily a guarantee for skillful future projections. However, it is a useful indicator for the model's fidelity to reasonably simulate features of interest. Hence, before analyzing projected changes for the future, we will start the analysis of storminess here by focusing first on the long-term mean, simulated with CAM5_0.25 for the period 1979–2005.
Here we use three different measures of storminess: the 95th percentile 3 h wind speeds, band-pass-filtered transient poleward temperature flux (VT) and density of storm tracks, which are explicitly extracted with a tracking algorithm. All of these measures have certain limitations in characterizing storminess. Measures of wind extremes and transient temperature fluxes will not distinguish the cause of the changes, e.g., changing frequency or intensity of storms. An application of the Lagrangian approach facilitates extraction of storm tracks and their properties. However potential deficiencies of models in realistically representing storm features (e.g., underestimated intensity) often limit the feasibility of tracking algorithms to construct a representative sample of storms. Thus the robustness of that approach can be limited due to the sampling bias. An interpretation using all three measures facilitates a more complete description of the present climate and future changes in storminess.
The analysis of the historical run for the period 1979–2005 shows that CAM5_0.25 reproduces the spatial features of storminess very realistically compared to the observationally based data sets. For example, a strong meridional tilt is skillfully captured in all three measures (Figs. 8b, 9a and S3). For VT (Fig. 8b), not only the spatial pattern but also the intensity agrees remarkably well upon direct comparison with the observational climatology (http://www.met.reading.ac.uk/~swrshaff/sstanom.html, last access: January 2018). The VT pattern manifests the full spatial spectrum of the location of extratropical cyclone activity. The pattern spreads across the subtropical and midlatitude North Atlantic, featuring maximum values along the region from Newfoundland, across the eastern Atlantic between the British Isles and Iceland, to the Norwegian Sea. The simulated maximum intensity of VT yields the value of approximately 25 ∘C m s−1, which is very close to the derived values from the ECMWF reanalysis. The simulated intensity with CAM_0.25 is much more realistic in comparison with one of the CMIP3 models (http://www.met.reading.ac.uk/~swrshaff/sstanom.html, last access: January 2018), with typically much lower horizontal resolution. In the latter, the strength of the storm intensity was found to be nearly half of the observed one.
For high wind speed percentiles (Fig. S3), which have been widely used (e.g., Krueger et al., 2013) as a simple measure of storm activity, CAM5_0.25 reproduces the pattern of local maximum very closely to the one found in VT. The simulated intensities also bear a close resemblance to the wind extremes (not shown) in reanalysis data, i.e., ERA-Interim and CFSR. CFSR, which has the finest (∼ 0.25–0.5∘) horizontal resolution, shows a much better agreement with the model. The ERA data set shows lower values than CFSR, especially over the vicinity of the local maximum. The apparent difference most likely stems from the underestimation of midlatitude extreme winds in ERA-Interim and ERA-40, which appears to be related to their relatively coarser spatial and temporal resolution (Chawla et al., 2013; Pielke, 2002; Stopa and Cheung, 2014; Sterl and Caires, 2005; Campos and Guedes Soares, 2017). As in the case of precipitation mentioned previously, this points again towards the finding that differences among different observational data products may be as large or even larger than deviations of climate simulation relative to a certain reference data set (Gómez-Navarro et al., 2012). A coarse model resolution is however not the only explanation for too low wind speeds for high wind percentiles. As shown by Rockel and Woth (2007), for example, even RCMs simulate too low wind speeds for high percentiles if no gustiness correction is applied to the model output.
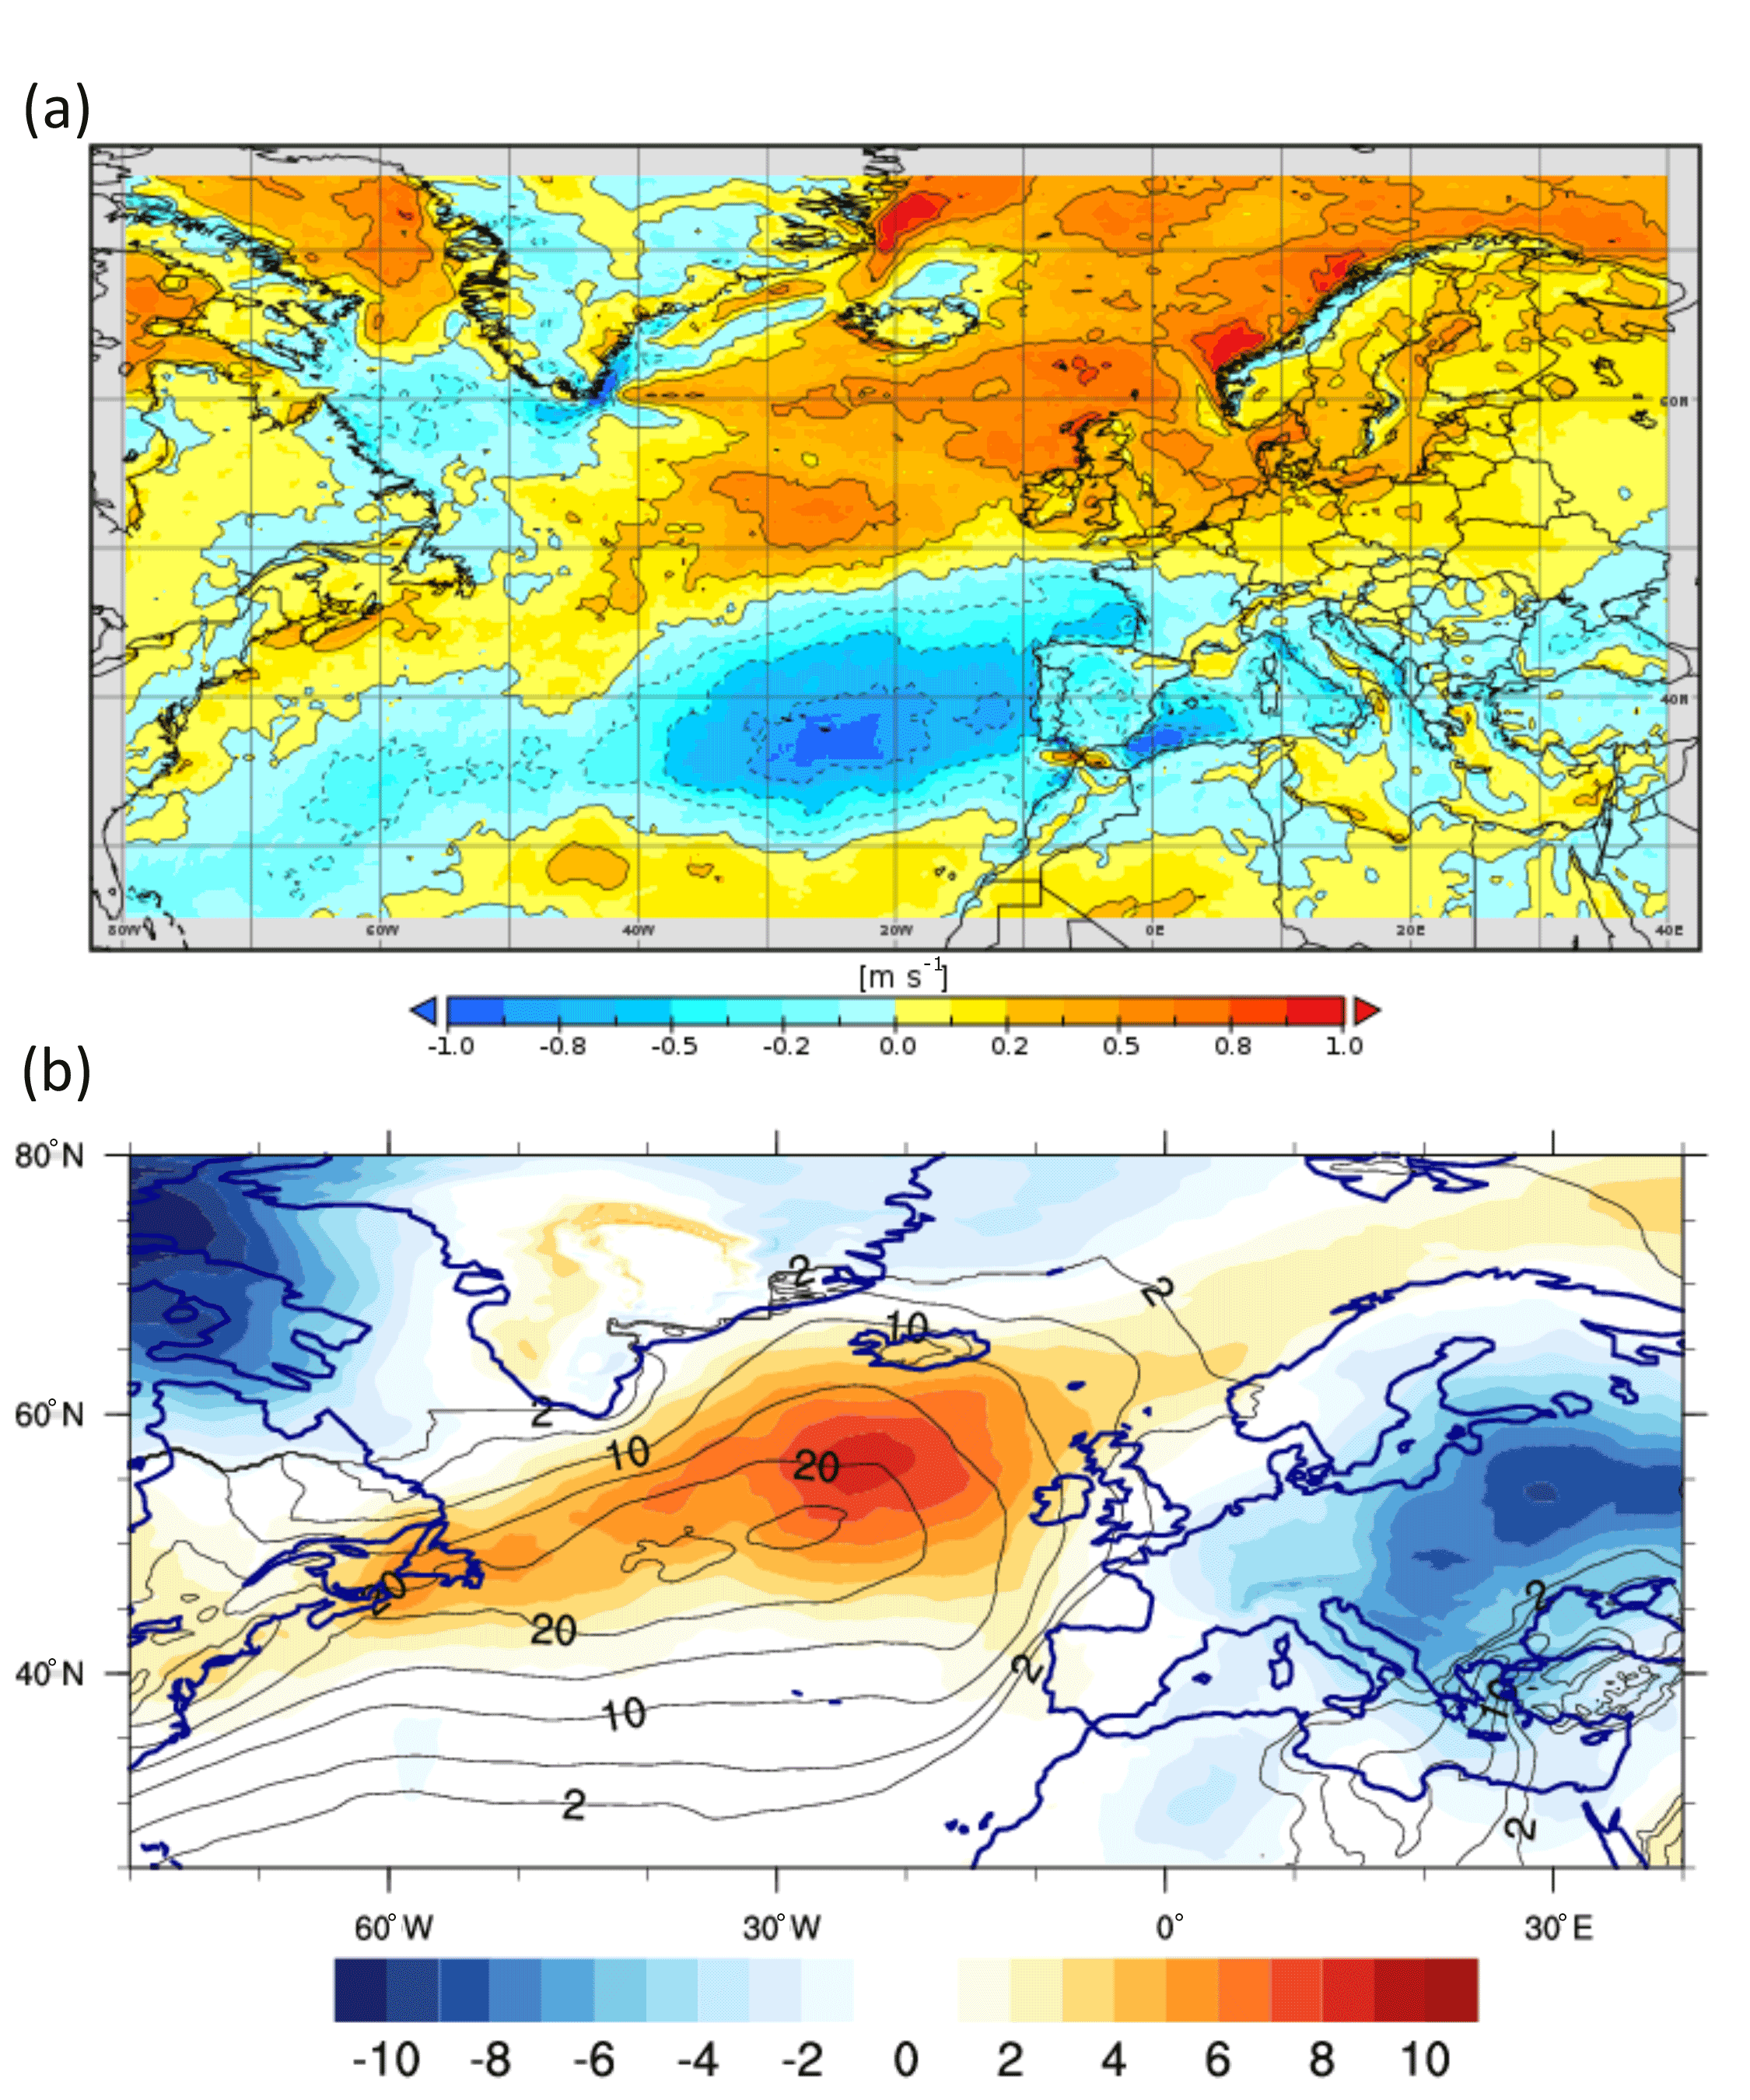
Figure 8(a) Difference between +2 and +1.5 ∘C ensemble experiments for DJF 95th daily wind percentiles, (b) DJF 700 hPa transient poleward temperature flux in CAM5.1.2_0.25. Contours show the climatology derived for the period 1979–2005 (CAM5_0.25) (∘C m s−1); values over high orography are masked.
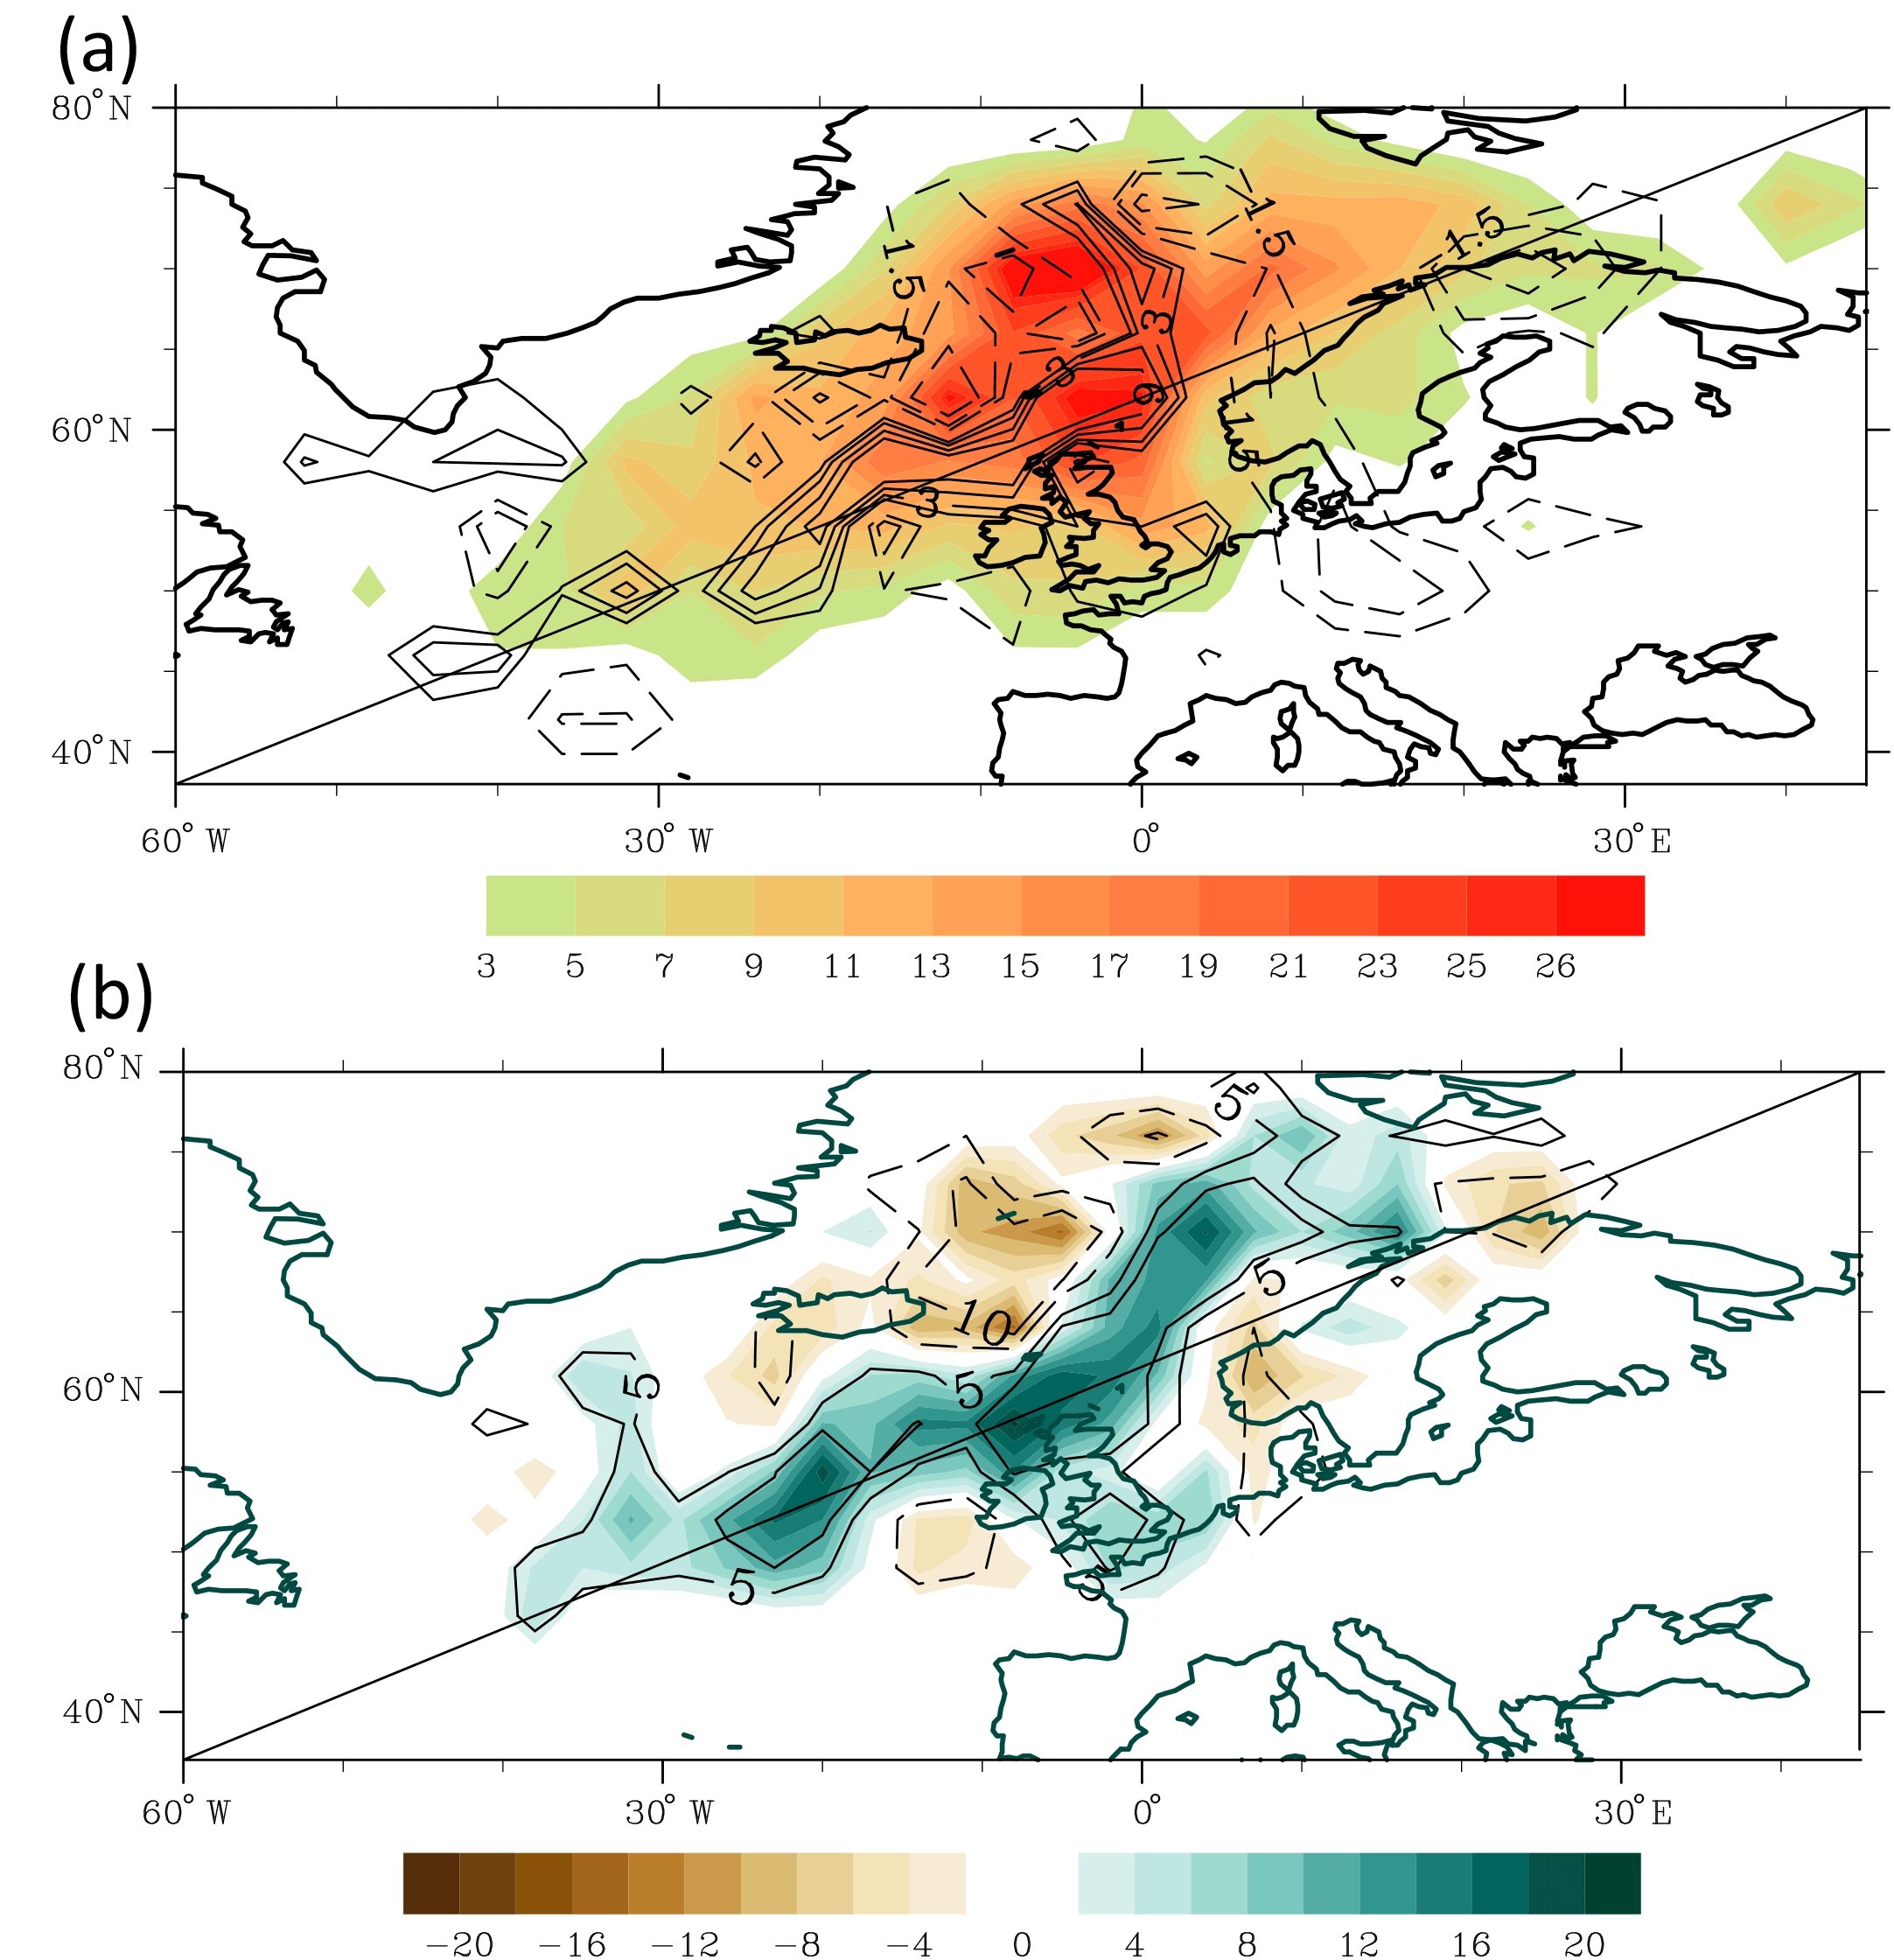
Figure 9(a) Difference between +2 minus +1.5 ∘C ensemble experiments (contour levels: −4.5, −3, −1.5, 1.5, 3, 4.5, 6; contours for negative values are dashed) and mean climatology (shaded) in the years 1979–2005, derived for the number of 3 h storm occurrences accumulated within 4∘ × 4∘ grid boxes (number/decade); climatology derived for the period 1979–2005 is shaded. The ensembles for +2 and +1.5 ∘C constitute five decadal periods each; the 1979–2005 period is missing one year (1981). (b) Difference between +2 minus +1.5 ∘C ensemble experiments, estimated for a number of 3 h occurrences with a maximum larger than 0.25 (mm h−1) and wind larger than 10 m s−1 (number/decade). Maximum values were chosen from 3 h precipitation data at 0.25∘, which falls into 3∘ × 3∘ grid boxes. Differences were computed for grid boxes with the number over the threshold of at least 20 per decade in both experiments. Contours for negative values are dashed.
The climatology of the spatial track density (Fig. 9a), derived from the tracking algorithm, agrees reasonably well with the tracks gleaned from observations (Zappa et al., 2012, 2013; Hodges et al., 2003). However, the pattern in CAM5_0.25 exhibits a maximum shifted towards the Norwegian Sea and does not manifest strong activity in the region southeast of Greenland. This feature is well captured in the CAM5_0.25 wind speed percentiles and is most likely associated with the short-lived katabatic winds that descend from the Greenland ice sheet. These features are however not of interest for our analysis and the tracking algorithm used in this study is tailored to extract only the long-lived and most intense cyclones. Upon visual inspection it can also be suggested that the track density simulated in CAM5_0.25 is improved, compared to the low-resolution CMIP3 and CMIP5 models. The CMIP models have been shown to exhibit a very strong zonal bias with positive anomalies in central Europe and negative values over the Norwegian Sea (Zappa et al., 2012). We note however that the verification of whether increasing the resolution improves the simulated climatology of midlatitude storms demands further analysis. This would require a unified methodology, with the same tracking algorithm applied to all of the data sets. Overall, the first results shown here indicate that the CAM5_0.25 reproduces features of storminess considerably more realistically than coarse-resolution simulations, in terms of both spatial pattern and intensity. This increases our confidence in the skill in projections of future storminess projected with the CAM5_025 and is the focus of the remainder of this section.
Figure 8a depicts differences in the response between 1.5 and 2 ∘C levels of warming, derived for the 95th percentile of 3 h wind speed. The derived changes show a bipolar pattern, similar to the one found for extreme precipitation. The most radical decrease in wind speeds manifests at the poleward fringe of the subtropics (40∘ N), between the Iberian Peninsula and the Azores. This region overlaps well with the location of maximum easterly anomalies at the southern flanks of the winter anticyclonic anomaly, found in the analysis of changes in general atmospheric circulation (see Fig. 5). Thus it is likely that the simulated reductions in extreme winds are to a large extent caused by the poleward shift of the large-scale circulation, the signature of which is the weakening of the westerlies at the poleward flanks of the subtropics.
The response to the additional half a degree of warming is also expressed as a remarkable increase in extreme winds over the northern half of the typical storm track region, with the maximum located between Iceland and the British Isles and along the Scandinavian coast. This feature is highly consistent with the response pattern derived for VT (Fig. 8b). Changes in VT indicate a pronounced intensification of storminess on the poleward flanks of their DJF climatology, again featuring a maximum between Iceland and the British Isles and an eastward extension along the Scandinavian coast. Small negative anomalies occur over the Norwegian Sea, northeast of Iceland. A similar response is found in the storm track density (Fig. 9a), showing an increase over the eastern North Atlantic and negative anomalies northeast of Iceland. Positive anomalies found in all measures of storminess collocate well with the local maximum of the intensification of the mean DJF westerlies (Fig. 5), which is consistent with the eddy-driven nature of the midlatitude jet stream.
The analysis of the intensity accumulated along the extracted tracks provides further insights. Figure 9b shows an increase in the number of 3 h storm occurrences, which exceed certain thresholds of precipitation and wind (0.25 mm h−1 and 10 m s−1, respectively). The derived pattern shows similar features to those in the track density, except that the positive changes are extended northeast of the Norwegian Sea. An additional analysis (not shown), repeated for higher thresholds of wind and precipitation, confirms the previous results in that it also exhibits an increase along the Scandinavian coast, indicating that the pattern becomes more zonal for higher intensities.
Overall, the increase manifested in the track density fields over the eastern North Atlantic, between the British Isles and Iceland, is consistent with the anomalies in VT. This suggests that the change in storm activity in this region is influenced by the increased frequency of storms. The increase in VT and in the number of high-intensity days (as diagnosed from wind and precipitation) also becomes clearly visible over the Norwegian Sea, despite no tendencies in track density in this area. For the increased thresholds of the intensity, positive anomalies also emerge at the coastal regions of Scandinavia, which are also accompanied by insignificant or zero tendencies in track density. Therefore the response found in storm activity over the Norwegian Sea could be alternatively explained by an increase in the intensity of the storms, rather than frequency. This is however a subject for a separate and more thorough analysis. It is also important to note that the storm tracks analyzed here exhibit a very strong year-to-year variability. Thus the statistics derived here may suffer from large uncertainty and should be repeated when a larger number of ensemble simulations become available, in order to facilitate a reduction in the sampling error.
In this study we assess near-term regional winter climate and weather changes over the North Atlantic Ocean and Europe associated with the 1.5 and 2 ∘C levels of global warming. The design of most state-of-the-art experiments, e.g., Coupled Model Inter-comparison Project (CMIP), is not well suited to address questions on climatic changes associated with the specific climate policy goals. This is due to the fact that CMIP experiments are set in the framework of responses to the particular concentration scenarios, rather than to the particular level of warming. Therefore, we use a set of ensemble simulations provided by the HAPPI project. The design of that experiment reduces the impacts of different phases of climate variations and thus facilitates differentiation of the climate response between the two warming levels. The CAM5 simulations provide a set of future climate experiments, describing the global climate and weather at ∼ 0.25∘ horizontal resolution and at a sub-daily timescale (3 h). Hence these simulations create a unique opportunity to explore changes and physical linkages between them across spatial and temporal scales. Additionally, a set of CAM5 historical simulations, provided at different horizontal resolutions, facilitates an insightful analysis of the benefits of increasing horizontal resolution in regional climate applications.
In the first part of our paper, we focused on the assessment of the model's ability to realistically represent key features of winter climate and weather over the Euro-Atlantic sector. Our analysis of the runs, performed at horizontal resolutions ranging from ∼ 2 to 0.25∘, has shown a substantial improvement in simulated large-scale circulation, specifically the meridional SLP gradient and midlatitude zonal winds. The zonal bias of the ambient flow over the North Atlantic and Europe, common for low-resolution CMIP3 and CMIP5 (Zappa et al., 2012) models, has been very clearly reduced with the highest model resolution. To a large extent, the reduction of the zonal bias may result from a much better skill to capture ambient flow–orographic interactions in the model with finer horizontal resolution, suggesting an important upscaling impact of regional scales in shaping the large-scale circulation.
In the second part of the paper, we investigated near-future changes, associated with global warming at the temperature levels specified by the Paris agreement. The pattern of the future response, when 2 ∘C warming is compared to the present climate, confirms typical fingerprints of climate response. These are characterized by a poleward shift and intensification of the meridional circulation cells, manifested here as strengthening meridional SLP gradient, and poleward strengthening and eastward extension of midlatitudes (Lu et al., 2007; Yin, 2005; Bengtsson et al., 2006; Wu et al., 2010; Feser et al., 2015a, b).
However, different to previous studies, our analysis did not identify a local maximum of anticyclonic SLP anomalies over the central Mediterranean. This feature was found in many CMIP3 and CMIP5 simulations (Giorgi and Lionello, 2008; Giorgi and Coppola, 2007; AR5, IPCC, 2007) and was often used as an explanation (Giorgi and Lionello, 2008) for reduced precipitation in most parts of this region. Instead, in our analysis, the center of the anticyclonic anomaly is shifted northwestward, which locates it over the North Atlantic, northwestward of the Iberian Peninsula. This feature corresponds well with the shift in drying anomalies, which extend from the eastern North Atlantic and cover only western parts of the Mediterranean.
The reason for this difference may be associated again with a strong positive bias in SLP over the Mediterranean and associated zonal bias of ambient flow, persisting in most CMIP3 and CMIP5 models. Thus, the maximum of the SLP field over the Mediterranean might be partly an expression of that bias. Increasing horizontal resolution to ∼ 0.25∘ reduces the SLP bias almost completely, as shown in our analysis, which might explain the difference in the response pattern. In contrast to this result, other simulations using a ∼ 0.5∘ horizontal model resolution (Barcikowska et al., 2018) indicated a strong anticyclonic intensification and drying over most of the Mediterranean, despite remarkable reduction of the bias. Therefore, the explanation of this difference in the projected pattern may have other/or additional causes and demands further exploration running different models at different resolutions.
Our analysis also provides additional insights into the evolution of the response, as a function of changing global temperature and suggests that the poleward shift and intensification of the meridional circulation cells and midlatitude westerlies occurs mostly during the additional half a degree of warming beyond the 1.5 ∘C level. The difference in the response between 2 and 1.5 ∘C levels is shifted poleward, compared to the changes estimated between 2 ∘C and present climate. The maximum anticyclonic SLP anomaly is located over the Bay of Biscay, which corresponds well with strong relative drying in this region. These drying anomalies also extend further northeast towards the North Sea, shifting the borderline between opposite sign tendencies northwards. Maximum precipitation anomalies occur in the northwestern parts of the British Isles, along the northwestern coast of Scandinavia and the Norwegian Sea.
The evolution of the future response shows a much stronger and distinct pattern compared to the changes prior to the 1.5 ∘C level of warming. This amplification in the change may hence be a reflection of the asymmetry in forcing changes between present climate and for the 1.5 and 2.0 ∘C experiments. The changes associated with warming at the 1.5 ∘C level stem from an interplay of a number of forcings, including strong aerosol reductions, while an additional half a degree of warming is solely a consequence of CO2 increases and ocean warming.
The response found here of winter weather over the North Atlantic and Europe is largely consistent with the changes found for the mean climate state and large-scale circulation. An increase in warming from the +1.5 level to 2 ∘C level suggests a poleward intensification of daily and sub-daily extreme wind and precipitation. These tendencies show the most pronounced impact in the regions most exposed to the inflow of moisture from the North Atlantic, e.g., the British Isles and northwestern Scandinavia, where the 95th percentiles of 3 h precipitation increase up to 0.2 and 0.24 mm h−1, respectively. The response pattern derived from daily precipitation shows a very similar pattern to the one derived from 3 h data. However, the latter exhibits larger magnitudes and encompasses larger areas with significant changes. Changes derived with GEV approximations, indicating even more radical shifts, show an increase in 10-year return levels of up to 0.3 mm h−1 in the coastal regions of the British Isles and northwestern Scandinavia. The magnitude of changes in precipitation is smaller in the inland areas. However, many regions like northeastern Scandinavia may still be strongly impacted by an increase of up to 20 %, when compared to the 1.5 ∘C level. Consistent with changes in the mean precipitation along the southern coast of Scandinavia, the east coast of the British Isles and North Sea indicate a slight decrease. These tendencies are more intense and expand towards western Europe, exhibiting a decrease of up to 15 % over France and exceeding a 25 % decrease over the interior and eastern Iberian Peninsula.
Derived changes in extreme precipitation and wind correspond well with changes in storminess, measured here with the transient poleward temperature flux (VT) and features of explicitly extracted storm tracks. The projected future response, derived from sub-daily VT and from spatial density of the extratropical storm tracks, indicates an increase in storm activity towards the northern side of the current storm track (between Iceland and the British Isles) but also a decrease northeast of Iceland.
The decrease in storminess at the northern flanks of the storm track, measured as the frequency of intense storms, has been identified in the CMIP5 projections (Zappa et al., 2013). Similar to our analysis, the future response according to CMIP5 models suggests a polar amplification of global warming, associated strongly with the Arctic sea-ice loss. This in turn reduces the lower-atmosphere meridional temperature gradient and also baroclinicity, shown here by the decrease in zonal wind northeastward from Iceland, which is consistent with the reduced storminess in this region. At the same time, the minimum of warming SSTs over the North Atlantic could lead to increased surface atmospheric baroclinicity (Brayshaw et al., 2009; Woollings et al., 2012) and thus enhance storminess over the eastern North Atlantic.
An increase in transient poleward temperature flux is also found over the Norwegian Sea, along the Scandinavian coast, which collocates well with the local maxima of increase in extreme precipitation and wind. The density of storm tracks does not indicate any spatially coherent tendencies in this region. However, the positive tendencies in this region emerge when the extreme precipitation and wind events, associated with the extracted storm tracks, are analyzed. In these regions we found an increase in frequency of 3-hourly storm occurrences with exceptionally high intensities. The strength of this tendency increases with the intensity of the extreme event, which suggests the possibility of increased frequency of more intense storms. These results should however be confirmed by a more elaborate analysis, specifically targeting changes in storms, and are the subject of further research.
Data is available from C20C+ Detection and Attribution Project (Stone and Krishnan, 2018; http://portal.nersc.gov/c20c).
The supplement related to this article is available online at: https://doi.org/10.5194/esd-9-679-2018-supplement.
The authors declare that they have no conflict of interest.
This article is part of the special issue “The Earth system at a global warming of 1.5 ∘C and 2.0 ∘C”. It is not associated with a conference.
The authors are grateful to Ángel Muñoz and Alex Petrescu for helpful
discussions. Matthias Zahn was supported through the Cluster of Excellence
“CliSAP” (EXC177), Universität Hamburg, funded through the German Research
Foundation (DFG). Dáithí A. Stone and Michael F. Wehner were supported
by the U.S. Department of Energy, Office of Science, Office of Biological and
Environmental Research, under contract number DE-AC02-05CH11231.
Edited by: Rui A. P. Perdigão
Reviewed by: Joaquim G. Pinto and one anonymous referee
Ban, N., Schmidli, J., and Schär, C.: Heavy precipitation in a changing climate: Does short-term summer precipitation increase faster?, Geophys. Res. Lett., 42, 1165–1172, https://doi.org/10.1002/2014GL062588, 2015.
Barcikowska, M., Kapnick, S. B., and Feser, F.: Impact of large-scale circulation changes in the North Atlantic sector on the current and future Mediterranean winter hydroclimate, Clim. Dynam., 50, 2039–2059, https://doi.org/10.1007/s00382-017-3735-5, 2018.
Bengtsson, L., Hodges, K. I., and Roeckner, E.: Storm tracks and climate change, J. Climate, 19, 3518–3543, 2006.
Brayshaw, D. J., Woollings, T., and Vellinga, M.: Tropical and extratropical responses of the North Atlantic atmospheric circulation to a sustained weakening of the MOC, J. Climate, 22, 3146–3155, 2009.
Campos, M. and Guedes Soares, C.: Assessment of three wind reanalyses in the North Atlantic Ocean, J. Operat. Oceanogr., 10, 30–44, https://doi.org/10.1080/1755876X.2016.1253328, 2017.
Casanueva, A., Rodríguez-Puebla, C., Frías, M. D., and González-Reviriego, N.: Variability of extreme precipitation over Europe and its relationships with teleconnection patterns, Hydrol. Earth Syst. Sci., 18, 709–725, https://doi.org/10.5194/hess-18-709-2014, 2014.
Chawla, A., Spindler, D. M., and Tolman, H. L.: Validation of a thirty year wave hindcast using the Climate Forecast System Reanalysis winds, Ocean Model., 70, 189–206, 2013.
Coles, S.: An Introduction to Statistical Modeling of Extreme Values, Springer, London, 2001.
Della-Marta, P. M. and Pinto, J. G.: Statistical uncertainty of changes in winter storms over the North Atlantic and Europe in an ensemble of transient climate simulations, Geophys. Res. Lett., 36, L14703, https://doi.org/10.1029/2009GL038557, 2009.
Dokken, D. J., Ebi, K. L., Mastrandrea, M. D., Mach, K. J., Plattner, G.-K., Allen, S. K., Tignor, M., and Midgley, P. (Eds.): Managing the Risks of Extreme Events and Disasters to Advance Climate Change Adaptation, in: chap. 3: Changes in climate extremes and their impacts on the natural physical environment Cambridge University Press, Cambridge, UK and New York, NY, USA, 109–230, 2012.
Donat, M. G., Leckebusch, G. C., Wild, S., and Ulbrich, U.: Future changes in European winter storm losses and extreme wind speeds inferred from GCM and RCM multi-model simulations, Nat. Hazards Earth Syst. Sci., 11, 1351–1370, https://doi.org/10.5194/nhess-11-1351-2011, 2011.
Donat, M. G., Alexander, L. V., Yang, H., Durre I., Vose R., Dunn, R. J. H., Willett, K. M., E. Aguilar, Brunet, M., Caesar, J., Hewitson, B., Jack, C., Klein Tank, A. M. G., Kruger, A. C., Marengo, J., Peterson, T. C., Renom, M., Oria Rojas, C., Rusticucci, M., Salinger, J., Elrayah, A. S., Sekele, S. S., Srivastava, A. K., Trewin, B., Villarroel, C., Vincent, L. A., Zhai, P., Zhang, X., and Kitching, S.: Updated analyses of temperature and precipitation extreme indices since the beginning of the twentieth century: The HadEX2 dataset, J. Geophys. Res.-Atmos., 118, 2098–2118, https://doi.org/10.1002/jgrd.50150, 2013.
Feser, F. and von Storch, H.: Regional modelling of the western Pacific typhoon season 2004, Meteorol. Z., 17, 519–528, 2008.
Feser, F. and von Storch, H.: A Spatial Two-Dimensional Discrete Filter for Limited-Area-Model Evaluation Purposes, Mon. Weather Rev., 133, 1774–1786, https://doi.org/10.1175/MWR2939.1, 2005.
Feser, F., Barcikowska, M., Krueger, O., Schenk, F., Weisse, R., and Xia, L.: Storminess over the North Atlantic and Northwestern Europe: A review, Q. J. Roy. Meteorol. Soc., 141, 350–382, https://doi.org/10.1002/qj.2364, 2015a.
Feser, F., Barcikowska, M., Haeseler, S., Levebvre, C., Schubert-Frisius, M., Stendel, M., von Storch, H., and Zahn, M.: Hurricane Gonzalo and its Extratropical Transition to a Strong European Storm, B. Am. Meteorol. Soc., 96, 51–55, https://doi.org/10.1175/BAMS-D-15-00122.1, 2015b.
Fischer, E. M., Sedláček, J., Hawkins, E., and Knutti, R.: Models agree on forced response pattern of precipitation and temperature extremes, Geophys. Res. Lett., 41, 8554–8562, https://doi.org/10.1002/2014GL062018, 2014.
Fleig, A. K., Tallaksen, L. M., James, P., Hisdal, H., and Stahl, K.: Attribution of European precipitation and temperature trends to changes in synoptic circulation, Hydrol. Earth Syst. Sci., 19, 3093–3107, https://doi.org/10.5194/hess-19-3093-2015, 2015.
Geng, Q. and Sugi, M.: Possible Change of Extratropical Cyclone Activity due to Enhanced Greenhouse Gases and Sulfate Aerosols – Study with a High-Resolution AGCM, J. Climate, 16, 2262–2274, 2003.
Gilleland, E. and Katz, R. W.: extRemes 2.0: An Extreme Value Analysis Package in R, J. Stat. Softw., 72, 1–39, https://doi.org/10.18637/jss.v072.i08, 2014.
Giorgi, F. and Coppola, E.: European climate-change oscillation (ECO), Geophys. Res. Lett., 34, L21703, https://doi.org/10.1029/2007GL031223, 2007.
Giorgi, F. and Lionello, P.: Climate change projections for the Mediterranean region, Global Planet. Change, 63, 90–104, 2008.
Giorgi, F., Coppola, E., and Raffaele, F.: A consistent picture of the hydroclimatic response to global warming from multiple indices: Models and observations, J. Geophys. Res.-Atmos., 119, 11695–11708, https://doi.org/10.1002/2014JD022238, 2014.
Gómez-Navarro, J. J., Montávez, J. P., Jerez, S., Jiménez-Guerrero, P., and Zorita, E.: What is the role of the observational dataset in the evaluation and scoring of climate models?, Geophys. Res. Lett., 39, L24701, https://doi.org/10.1029/2012GL054206, 2012.
Hartmann, D. L., Klein Tank, A. M. G., Rusticucci, M., Alexander, S., Brönimann, S., Charabi, Y., Dentener, F. J., Dlugokencky, E. J., Easterling, D. R., Kaplan, A., Soden, B. J., Thorne, P. W., Wild, M., and Zhai, P. M.: Observations: Atmosphere and surface, in: Climate change 2013: The physical science basis, Contribution of Working Group I to the Fifth Assessment Report of the Intergovernmental Panel on Climate Change, edited by: Stocker, T. F., Qin, D., Plattner, G.-K., Tignor, M., Allen, S. K., Boschung, J., Nauels, A., Xia, Y., Bex, V., and Midgley, P. M., Cambridge University Press, Cambridge, New York, 159–254, 2013.
Haylock, M. R., Hofstra, N., Klein Tank, A. M. G., Klok, E. J., Jones, P. D., and New, M.: A European daily high-resolution gridded dataset of surface temperature and precipitation, J. Geophys. Res.-Atmos., 113, D20119, https://doi.org/10.1029/2008JD010201, 2008.
Hodges, K.I., Hoskins, B.J., Boyle, J. and Thorncroft, C.: A Comparison of Recent Reanalysis Datasets Using Objective Feature Tracking: Storm Tracks and Tropical Easterly Waves. Mon. Wea. Rev., 131, 2012–2037, https://doi.org/10.1175/1520-0493(2003)131<2012:ACORRD>2.0.CO;2, 2003.
Hodges, K. I., Lee, R. W., and Bengtsson, L.: A Comparison of Extratropical Cyclones in Recent Reanalyses ERA-Interim, NASA MERRA, NCEP CFSR, and JRA-25, J. Climate, 24, 4888–4906, https://doi.org/10.1175/2011JCLI4097.1, 2011.
Hov, Ø., Cubasch, U., Fischer, E., Höppe, P., Iversen, T., Kvamstø, N. G., Kundzewicz, Z. W., Rezacova, D., Rios, D., Duarte Santos, F., Schädler, B., Veisz, O., Zerefos, C., Benestad, R., Murlis, J., Donat, M., Leckebusch, G. C., and Ulbrich, U.: Extreme weather events in Europe: preparing for climate change adaptation, Norwegian Meteorological Institute, Oslo, 2013.
IPCC: Climate change: the physical science basis, in: Contribution of working group I to the fourth assessment report of the intergovernmental panel on climate change, edited by: Solomon, S., Qin, D., Manning, M., Chen, Z., Marquis, M., Averyt, K. B., Tignor, M., and Miller, H. L., Cambridge University Press, Cambridge, UK, 2007.
Jacob, D., Petersen, J., Eggert, B., Alias, A., Christensen, O. B., Bouwer, L. M., Braun, A., Colette, A., Déqué, M., Georgievski, G., Georgopoulou, E., Gobiet, A., Menut, L., Nikulin, G., Haensler, A., Hempelmann, N., Jones, C., Keuler, K., Kovats, S., Kröner, N., Kotlarski, S., Kriegsmann, A., Martin, E., Meijgaard, E., Moseley, C., Pfeifer, S., Preuschmann, S., Radermacher, C., Radtke, K., Rechid, D., Rounsevell, M., Samuelsson, P., Somot, S., Soussana, J.-F., Teichmann, C., Valentini, R., Vautard, R., Weber, B., and Yiou, P.: EURO-CORDEX: New high-resolution climate change projections for European impact research, Reg. Environ. Change, 14, 563–578, https://doi.org/10.1007/s10113-013-0499-2, 2014.
Kanamitsu, M., Ebisuzaki, W., Woollen, J., Yang, S., Hnilo, J. J., Fiorino, M., and Potter, G. L.: NCEP–DOE AMIP-II Reanalysis (R-2), B. Am. Meteorol. Soc., 83, 1631–1644, https://doi.org/10.1175/BAMS-83-11-1631, 2002.
Karmalkar, A. V. and Bradley, R. S.: Consequences of Global Warming of 1.5 ∘C and 2 ∘C for Regional Temperature and Precipitation Changes in the Contiguous United States, PLoS ONE, 12, e0168697, https://doi.org/10.1371/journal.pone.0168697, 2017.
Kelley, C., Ting, M., Seager, R., and Kushnir, Y.: The relative contributions of radiative forcing and internal climate variability to the late 20th century drying the Mediterranean region, Clim. Dynam., 38, 2001–2015, https://doi.org/10.1007/s00382-011-1221-z, 2011.
Kendon, E. J., Roberts, N. M., Fowler, H. J., Roberts, M. J., Chan, S. C., and Senior, C. A.: Heavier summer downpours with climate change revealed by weather forecast resolution model, Nat. Clim. Change, 4, 570–576, https://doi.org/10.1038/nclimate2258, 2014.
Kitoh, A. and Endo, H.: Changes in precipitation extremes projected by a 20-km mesh global atmospheric model, Weather Clim. Extrem., 11, 41–52, 2016.
Knutti, R., Rogelj, J., Sedlácek, J., and Fischer, E. M.: A scientific critique of the two-degree climate change target, Nat. Geosci., 9, 13–18, 2016.
Krueger, O., Schenk, F., Feser, F., and Weisse, R.: Inconsistencies between Long-Term Trends in Storminess Derived from the 20CR Reanalysis and Observations, J. Climate, 26, 868–874, https://doi.org/10.1175/JCLI-D-12-00309.1, 2013.
Lambert, S. J.: The effect of enhanced greenhouse warming on winter cyclone frequencies and strengths, J. Climate, 8, 1447–1452, https://doi.org/10.1175/1520-0442(1995)008<1447:TEOEGW>2.0.CO;2, 1995.
Lambert, S. J.: Changes in winter cyclone frequencies and strengths in transient enhanced greenhouse warming simulations using two coupled climate models, Atmos.-Ocean, 42, 173–181, https://doi.org/10.3137/ao.420302, 2004.
Lambert, S. J. and Fyfe, J. C.: Changes in winter cyclone frequencies and strengths simulated in enhanced greenhouse warming experiments: results from the models participating in the IPCC diagnostic exercise, Clim. Dynam., 26, 713–728, https://doi.org/10.1007/s00382-006-0110-3, 2006.
Leckebusch, G. C., Koffi, B., Ulbrich, U., Pinto, J. G., Spangehl, T., and Zacharias, S.: Analysis of frequency and intensity of European winter storm events from a multimodel perspective, at synoptic and regional scales, Clim. Res., 31, 59–74, 2006.
Lehmann, A., Getzlaff, K., and Harlass, J.: Detailed assessment of climate variability in the Baltic Sea area for the period 1958 to 2009, Clim. Res., 46, 185–196, 2011.
Lehmann, J., Coumou, D., and Frieler, K.: Increased record-breaking precipitation events under global warming, Climatic Change, 132, 501–515, https://doi.org/10.1007/s10584-015-1434-y, 2015.
Lu, J., Vecchi, G. A., and Reichler, T.: Expansion of the Hadley cell under global warming, Geophys. Res. Lett., 34, L06805, https://doi.org/10.1029/2006GL028443, 2007.
Maraun, D.: When will trends in European mean and heavy daily precipitation emerge?, Environ. Res. Lett., 8, 14004, https://doi.org/10.1088/1748-9326/8/1/014004, 2013.
Mitchell, D., AchutaRao, K., Allen, M., Bethke, I., Beyerle, U., Ciavarella, A., Forster, P. M., Fuglestvedt, J., Gillett, N., Haustein, K., Ingram, W., Iversen, T., Kharin, V., Klingaman, N., Massey, N., Fischer, E., Schleussner, C.-F., Scinocca, J., Seland, Ø., Shiogama, H., Shuckburgh, E., Sparrow, S., Stone, D., Uhe, P., Wallom, D., Wehner, M., and Zaaboul, R.: Half a degree additional warming, prognosis and projected impacts (HAPPI): background and experimental design, Geosci. Model Dev., 10, 571–583, https://doi.org/10.5194/gmd-10-571-2017, 2017.
Neu, U., Akperov, M. G., Bellenbaum, N., Benestad, R., Blender, R., Caballero, R., Di Cocozza, A., Dacre, H. F., Feng, Y., Fraedrich, K., Grieger, J., Gulev, S., Hanley, J., Hewson, T., Inatsu, M., Keay, K., Kew, S. F., Kindem, I., Leckebusch, G. C., Liberato, M. L. R., Di Lionello, P., Mokhov, I. I., Pinto, J. G., Raible, C. C., Di Reale, M., Rudeva, I., Schuster, M., Simmonds, I., Sinclair, M., Sprenger, M., Tilinina, N. D., Trigo, I. F., Ulbrich, S., Ulbrich, U., Wang, X. L., and Wernli, H.: IMILAST: A community effort to intercompare extratropical cyclone detection and tracking algorithms, B. Am. Meteorol. Soc., 94, 529–547, https://doi.org/10.1175/BAMS-D-11-00154.1, 2013.
Pielke, R. A.: Mesoscale meteorological modeling, Academic Press, New York, p. 676, 2002.
Pinto, J. G., Spangehl,T., Ulbrich, U., and Speth, P.: Assessment of winter cyclone activity in a transient ECHAM4-OPYC3 GHG experiment, Meteorol. Z., 15, 279–291, https://doi.org/10.1127/0941-2948/2006/0128, 2006.
Pinto, J. G., Spangehl, T., Fink, A., Leckebusch, G. C., and Ulbrich, U.: Factors contributing to the development of extreme North Atlantic cyclones and their relationship with the NAO, Clim. Dynam., 32, 711–737, 2009a.
Pinto, J. G., Zacharias, S., Fink, A. H., Leckebusch, G. C., and Ulbrich, U.: Factors contributing to the development of extreme North Atlantic cyclones and their relationship with the NAO, Clim. Dynam., 32, 711–737, https://doi.org/10.1007/s00382-008-0396-4, 2009b.
Priestley, M. D. K., Pinto, J. G., Dacre, H. F., and Shaffrey, L. C.: The role of cyclone clustering during the stormy winter of 2013/2014, Weather, 72, 187–192, 2017.
Rajczak, J., Pall, P., and Schär, C.: Projections of extreme precipitation events in regional climate simulations for Europe and the Alpine Region, J. Geophys. Res.-Atmos., 118, 3610–3626, https://doi.org/10.1002/jgrd.50297, 2013.
Rockel, B. and Woth, K.: Extremes of near-surface wind speed over Europe and their future changes as estimated from an ensemble of RCM simulations, Climatic Change, 81, 267–280, https://doi.org/10.1007/s10584-006-9227-y, 2007.
Schaller, N., Kay, A. L., Lamb, R., Massey, N. R., van Oldenborgh, G. J., Otto, F. E. L., Sparrow, S. N., Vautard, R., Yiou, P., Ashpole, I., Bowery, A., Crooks, S. M., Haustein, K., Huntingford, C., Ingram, W. J., Jones, R. G., Legg, T., Miller, J., Skeggs, J., Wallom, D., Weisheimer, A., Wilson, S., Stott, P. A., and Allen, M. R.: Human influence on climate in the 2014 southern England winter floods and their impacts, Nat. Clim. Change, 6, 627–634, https://doi.org/10.1038/nclimate2927, 2016.
Schenk, F. and Stendel, M.: On the Problem of Homogeneity in Observations and Reanalysis Data., in: North Sea Region Climate Change Assessment, edited by: Quante, M. and Colijn, F., Springer International Publishing, https://www.springer.com/us/book/9783319397436 (last access: June 2018), 2016.
Schiemann, R., Demory, M., Shaffrey, L. C., Strachan, J., Vidale, P. L., Mizielinski, M. S., Roberts, M. J., Matsueda, M., Wehner, M. F., and Jung, T.: The Resolution Sensitivity of Northern Hemisphere Blocking in Four 25-km Atmospheric Global Circulation Models, J. Climate, 30, 337–358, 2017.
Seneviratne, S .I., Nicholls, N., Easterling, D., Goodess, C. M., Kanae, S., Kossin, J., Luo, Y., Marengo, J., McInnes, K., Rahimi, M., Reichstein, M, Sorteberg, A., Vera, C., and Zhang, X.: Changes in climate extremes and their impacts on the natural physical environment, in: Managing the Risks of Extreme Events and Disasters to Advance Climate Change Adaptation, A Special Report of Working Groups I and II of the Intergovernmental Panel on Climate Change (IPCC), edited by: Field, C. B., Barros, V., Stocker, T. F., Qin, D., Dokken, D. J., Ebi, K. L., Mastrandrea, M. D., Mach, K. J., Plattner, G.-K., Allen, S. K., Tignor, M., and Midgley, P. M., Cambridge University Press, Cambridge, UK, and New York, NY, USA, 109–230, 2012.
Shaw, T. A., Baldwin, M., Barnes, E. A., Caballero, R., Garfinkel, C. I., Hwang, Y.-T. , Li, C., O'Gorman, P. A., Rivière, G., Simpson, I. R., and Voigt, A.: Storm track processes and the opposing influences of climate change, Nat. Geosci, 9, 656–664, 2016.
Smith, R. L.: Statistics of extremes, with applications in environment, insurance and finance, in: Extreme values in finance, telecommunications and the environment, Chapman & Hall, New York, 1–78, 2003
Stahl, K., Hisdal, H., Hannaford, J., Tallaksen, L. M., van Lanen, H. A. J., Sauquet, E., Demuth, S., Fendekova, M., and Jódar, J.,: Streamflow trends in Europe: Evidence from a dataset of near-natural catchments, Hydrol. Earth Syst. Sci., 14, 2367–2382, https://doi.org/10.5194/hess-14-2367-2010, 2010.
Stahl, K., Tallaksen, L. M., Hannaford, J. and van Lanen, H. A. J.: Filling the white space on maps of European runoff trends: Estimates from a multi-model ensemble, Hydrol. Earth Syst. Sci., 16, 2035–2047, https://doi.org/10.5194/hess-16-2035-2012, 2012.
Sterl, A. and Caires, S.: Climatology, variability and extrema of Ocean waves: the web-based KNMI/ERA-40 wave atlas, Int. J. Climatol., 25, 963–977, 2005.
Stone, D. A. and Krishnan, H.: C20C+ Detection and Attribution Project, available at: http://portal.nersc.gov/c20c, last access: February 2018.
Stone, D. A., Risser, M. D., Ang'elil, O. M., Wehner, M. F., Cholia, S., Keen, N., Krishnan, H., O'Brien, T. A., and Collins, W. D.: A basis set for exploration of sensitivity to prescribed ocean conditions for estimating human contributions to extreme weather in CAM5.1-1degree, Weather Clim. Extrem., 19, 10–19, https://doi.org/10.1016/j.wace.2017.12.003, 2018.
Stopa, J. E. and Cheung, K. F.: Intercomparison of wind and wave data from the ECMWF Reanalysis Interim and the NCEP Climate Forecast System Reanalysis, Ocean Model., 75, 65–83, 2014.
Taylor, K. E., Stouffer, R. J., and Meehl, G. A.: An overview of CMIP5 and the experiment design, B. Am. Meteorol. Soc., 93, 485–498, 2012.
Ulbrich, U., Leckebusch, G. C., and Pinto, J. G.: Extra-tropical cyclones in the present and future climate: a review, Theor. Appl. Climatol, 96, 117–131, https://doi.org/10.1007/s00704-008-0083-8, 2009.
UNFCCC: Adoption of the Paris Agreement, FCCC/CP/2015/L.9/Rev.1, http://unfccc.int/documentation/documents/advanced_search/items/6911.php?priref=600008831 (last access: January 2018), 2017.
von Storch, H., Feser, F., Haeseler, S., Lefebvre, C., and Stendel, M.: Explaining Extreme Events of 2013 from a Climate Perspective, B. Am. Meteorol. Soc., 95, S76–S78, https://doi.org/10.1175/1520-0477-95.9.S1.1, 2014.
Wang, X., Swail, V., Zwiers, F., Zhang, X., and Feng, Y.: Detection of external influence on trends of atmospheric storminess and northern oceans wave heights, Clim. Dynam., 32, 189–203, 2009.
Wehner, M., Prabhat, Reed, K. A., Stone, D., Collins, W. D., and Bacmeister, J.: Resolution dependence of future tropical cyclone projections of CAM5.1 in the US CLIVAR Hurricane Working Group idealized configurations, J. Climate, 28, 3905–3925, https://doi.org/10.1175/JCLI-D-14-00311.1, 2015.
Wehner, M. F., Stone, D., Shiogama, H., Wolski, P., Ciavarella, A., Christidis, N., Krishnan, H.: Early 21st century anthropogenic changes in extremely hot days, as simulated by the C20C+ Detection and Attribution multimodel ensemble, Weather Clim. Extrem., https://doi.org/10.1016/j.wace.2018.03.001, in press, 2018a.
Wehner, M. F., Reed, K. A., Loring, B., Stone, D., and Krishnan, H.: Changes in tropical cyclones under stabilized 1.5 and 2.0 ∘C global warming scenarios as simulated by the Community Atmospheric Model under the HAPPI protocols, Earth Syst. Dynam., 9, 187–195, https://doi.org/10.5194/esd-9-187-2018, 2018b.
Wilks, D. S.: Methods in the atmospheric sciences, 2nd Edn., Academic Press, St Louis, MO, 2006.
Wolski, P., Stone, D., Tadross, M., Wehner, M., and Hewitson, M.: Attribution of floods in the Okavango Basin, Southern Africa, J. Hydrol., 511, 350–358, 2014.
Woollings, T., Gregory, J. M., Pinto, J. G., Reyers, M., and Brayshaw, D. J.: Response of the North Atlantic storm track to climate change shaped by ocean–atmosphere coupling, Nat. Geosci., 5, 313–317, 2012.
Wu, Y., Ting, M. F., Seager, R., Huang, H., and Cane, M.: Changes in storm tracks and energy transports in a warmer climate simulated by the GFDL CM2.1 model, Clim. Dynam., 37, 53–72, https://doi.org/10.1007/s00382-010-0776-4, 2010.
Yang, X., Vecchi, G. A., Gudgel, R. G., Delworth, T. L., Zhang, S., Rosati, A., Jia, L., Stern, W. F., Wittenberg, A. T., Kapnick, S., Msadek, R., Underwood, S. D., Zeng, F., Anderson, W., and Balaji, V.: Seasonal Predictability of Extratropical Storm Tracks in GFDL's High-Resolution Climate Prediction Model, J. Climate, 28, 3592–3611, https://doi.org/10.1175/JCLI-D-14-00517.1, 2015.
Yin, J. H.: A consistent poleward shift of the storm tracks in simulations of 21st century climate, Geophys. Res. Lett., 32, L18701, https://doi.org/10.1029/2005GL023684, 2005.
Zappa, G., Shaffrey, L. C., and Hodges, K. I.: The Ability of CMIP5 Models to Simulate North Atlantic Extratropical Cyclones, J. Climate, 26, 5379–5396, https://doi.org/10.1175/JCLI-D-12-00501.1, 2012.
Zappa, G., Shaffrey, L. C., Hodges, K. I., Sansom, P. G., and Stephenson, D. B.: A Multimodel Assessment of Future Projections of North Atlantic and European Extratropical Cyclones in the CMIP5 Climate Models, J. Climate, 26, 5846–5862, https://doi.org/10.1175/JCLI-D-12-00573.1, 2013.