the Creative Commons Attribution 4.0 License.
the Creative Commons Attribution 4.0 License.
 | 09 Nov 2018
Sensitivity study of the regional climate model RegCM4 to different convective schemes over West Africa
Brahima Koné
N'datchoh Evelyne Touré
Mouhamadou Bamba Sylla
Filippo Giorgi
Sandrine Anquetin
Adama Bamba
Adama Diawara
Arsene Toka Kobea
The latest version of RegCM4 with CLM4.5 as a land surface scheme was used to assess the performance and sensitivity of the simulated West African climate system to different convection schemes. The sensitivity studies were performed over the West African domain from November 2002 to December 2004 at a spatial resolution of 50 km × 50 km and involved five convective schemes: (i) Emanuel; (ii) Grell; (iii) Emanuel over land and Grell over ocean (Mix1); (iv) Grell over land and Emanuel over ocean (Mix2); and (v) Tiedtke. All simulations were forced with ERA-Interim data. Validation of surface temperature at 2 m and precipitation were conducted using data from the Climate Research Unit (CRU), Global Precipitation Climatology Project (GPCP) and the Tropical Rainfall Measurement Mission (TRMM) during June to September (rainy season), while the simulated atmospheric dynamic was compared to ERA-Interim data. It is worth noting that the few previous similar sensitivity studies conducted in the region were performed using BATS as a land surface scheme and involved less convective schemes. Compared with the previous version of RegCM, RegCM4-CLM also shows a general cold bias over West Africa whatever the convective scheme used. This cold bias is more reduced when using the Emanuel convective scheme. In terms of precipitation, the dominant feature in model simulations is a dry bias that is better reduced when using the Emanuel convective scheme. Considering the good performance with respect to a quantitative evaluation of the temperature and precipitation simulations over the entire West African domain and its subregions, the Emanuel convective scheme is recommended for the study of the West African climate system.
- Article
(5670 KB) - Full-text XML
- BibTeX
- EndNote


Agriculture in West Africa relies mainly on rainfall and is strongly dependent on the West African monsoon. Therefore, the onset, cessation and the amount of expected precipitation associated with the West African monsoon are of great importance for farmers, and accurate simulation and prediction of rainfall and temperature are crucial for various sectors, such as agriculture, energy and health, and for decision-makers. Rainfall over West Africa is strongly related to the meridional migration of the Intertropical Convergence Zone (ITCZ) and is modulated by successive active and inactive phases of the monsoon system (Sultan et al., 2003a; Janicot et al., 2011). After a quasi-stationary position around 5∘ N between mid-April and the end of June, the rainfall maxima present an abrupt shift toward the north to hold another quasi-stationary position around 11∘ N in July–August, bringing precipitation over the central Sahel region (Sultan and Janicot, 2000). This abrupt northward shift is the monsoon “onset” over the Sahel and contrasts with the smooth southward retreat of the ITCZ, followed by the second rainy season over the Guinean coast in October–November (Sultan et al., 2003b; Janicot et al., 2011). In addition, atmospheric circulations through the African easterly jet (AEJ), tropical easterly jet (TEJ) and their interaction with convection play an important role in the West African monsoon (WAM) system (Nicholson 2013) and modulate the summer rainfall (Sylla et al., 2013a). Various climate modeling tools have been applied over West Africa for studying and better understanding the WAM.
General circulation models (GCMs) are unable to include the effects of regional features (Xue et al., 2010) due to their relatively coarse resolution. Regional climate models (RCMs) are relevant tools for this purpose since they allow for land surface heterogeneity and fine-scale forcing such as complex topography and vegetation variations (Paeth and al., 2006). Moreover, previous studies have shown that they are able to reasonably simulate the WAM climatology (Kamga and Buscarlet, 2006; Sylla et al., 2009) and its variability (Diallo et al., 2012). RCMs contribute to improving our knowledge of the interactions between atmospheric and surface factors affecting precipitation (Sylla et al., 2011; Browne and Sylla, 2012) and the influence of external forcing such as sea surface temperature (SST, Paeth and A. Hense, 2004), dust (Konare et al., 2008; N'Datchoh et al., 2017) and land-use changes on the dynamic of the monsoon system (Abiodun et al., 2012; Zaroug et al., 2012).
RegCM versions (Giorgi et al., 2012; Pal et al., 2007) are some of the most commonly used among the large range of RCMs to study the climate of West Africa and many regions of the world. Compared with the previous version (RegCM3; Pal et al., 2007), the latest release (RegCM4) has been improved with substantial development of the software code and the physical representations (Giorgi et al., 2012) and with the introduction of CLM (version 3.5 and 4.5) as an option to describe land surface processes. Previously, it was the Biosphere–Atmosphere Transfer Scheme (BATS; Dickinson et al., 1993) only that was used as a land surface model. Many studies have shown that the model performs well when using BATS over West Africa (Sylla et al., 2009; Diallo et al., 2013) but CLM offers improvements in the land–atmosphere exchanges of moisture and energy and in the associated surface climate feedbacks (Steiner et al., 2009). Nonetheless, it was shown over India that CLM use may lead to a weaker performance of RegCM than BATS (Halder and al., 2015). Thus, the performance of RegCM4 when using CLM (RegCM4-CLM4.5) needs to be assessed and sensitivities tests have to be conducted on physical process parameterizations to find the optimal configuration of the RCM for a given region and to give the relevant information to RCM users.
Among the different physical processes in climate models, convective parameterization is usually considered as the most important when simulating monsoon rainfall (Im et al., 2008; Leung et al., 2004). Simulations of regional climate are very sensitive to physical parameterization schemes, particularly over the tropics where convection plays a major role in monsoon dynamics (Singh et al., 2011; Srinivas et al., 2013; Gao et al., 2016). One of the main sources of uncertainties in climate prediction is related to the representation of clouds, which mainly influences the energy response of the models to a disturbance (Soden and Held, 2006; IPCC, 2007). Thus, implementing an appropriate convective scheme in dynamic models is needed for realistic simulations.
Several sensitivity studies using the previous version of RegCM have been conducted over Africa. Meinke et al. (2007) and Djiotang Tchotchou and Kamga Mkankam (2010) showed that in West Africa, monsoon precipitation is sensitive to the choice of cumulus parameterization and closure schemes. Brown and Sylla (2012) performed a sensitivity study of RegCM3 to the domain size over West Africa and showed that a large domain is required to capture the variability of summer monsoon rainfall and circulation features. A recent study by Adeniyi (2014) using version 4 of RegCM indicated that all convective schemes give good spatial representation of rainfall with biases over West Africa. Komkoua et al. (2016) found that the last release of RegCM implementing Grell as a convective scheme with the Arakawa–Schubert closure assumption is more suitable to downscale the diurnal cycle of rainfall over Central Africa. However, none of these studies have attempted to investigate a sensitivity study of the regional climate model RegCM4 to the convective scheme over West Africa with CLM4.5 as the land surface model.
This study investigates the performance of RegCM4-CLM4.5 over West Africa using different convection schemes to identify the “best” configuration option for the region. It is worth noting that the few previous similar sensitivity studies conducted in the region were performed using BATS as a land surface scheme and involved less convective schemes. The paper is structured as follows: the description of the model, data and numerical experiments used to investigate the RegCM4 performance are described in Sect. 2; Sect. 3 analyzes and discusses the model performance under different convection processes; and the main conclusions are summarized in Sect. 4.
2.1 Model description and datasets
The fourth generation of the ICTP RegCM (hereafter RegCM4) is used in this study. RegCM is a limited-area model using a terrain-following σ-pressure vertical coordinate system and an Arakawa B-grid finite differencing algorithm (Giorgi et al., 2012). The model's dynamical component is derived from the hydrostatic version of the Pennsylvania State University Mesoscale Model version 5 (MM5; Grell et al., 1994) with improvements on the coupling with an advanced and complex land surface model (CLM3.5 and CLM4.5; Oleson et al., 2008, 2013). In the version used here, the radiation scheme is derived from the NCAR global model CCM3 (Kiehl et al., 1996) and includes a representation of aerosols following Solmon et al. (2006) and Zakey et al. (2006). Turbulent transports of momentum, water vapor and sensible heat in the planetary boundary layer over land and ocean are computed as in Holtslag et al. (1990), which allows for nonlocal transport in the convective boundary layer. The large-scale precipitation scheme of Pal et al. (2000), referred to as the SUBgrid EXplicit moisture scheme (SUBEX), includes the sub-grid variability in clouds (Sundqvist and al., 1989) and the evaporation and accretion processes for stable precipitation. Ocean surfaces fluxes of momentum, heat and moisture are represented using the scheme of Zeng et al. (1998) with a drag-coefficient-based bulk aerodynamic procedure and considering the influence of surface friction velocity on roughness length computed following Smith (1988) and Brutsaert (1982), respectively, for momentum and heat (and also moisture).
The soil–vegetation–atmosphere interaction processes are parameterized using Community Land Model (CLM version 4.5; Oleson et al., 2013). CLM4.5 presents in each grid cell the possibility to have 15 soil layers, up to five snow layers, five different land unit types and 16 different plant functional types (Lawrence et al., 2011; Wang et al., 2016). RegCM4-CLM4.5 proposes five different convective schemes (Im et al., 2008; Giorgi et al., 2012): the modified Kuo scheme (Anthes et al., 1987), the Tiedtke scheme (Tiedtke, 1989), the Emanuel scheme (Emanuel, 1991), the Grell scheme (Grell, 1993) and the Kain–Fritsch scheme (Kain-Fritsch, 1990; Kain, 2004) with the possibility to combine different schemes over ocean and land (called “mixed” convection).
2.2 Convective schemes
The convective precipitation parameterizations used in this study are the Tiedtke (1989), Emanuel (1991) and Grell (1993) schemes.
The Emanuel (1991) scheme assumes that the mixing in clouds is highly episodic and inhomogeneous (in contrast to a continuous entraining plume) and takes into account convective fluxes based on an idealized model of sub-cloud-scale updrafts and downdrafts. Convection is triggered when the level of neutral buoyancy is greater than the cloud base level. Between these two levels, air is lifted and a fraction of the condensed moisture forms precipitation, while the remaining fraction forms the cloud. The cloud is supposed to mix with the air from the environment according to a uniform spectrum of mixtures that ascend or descend to their respective levels of neutral buoyancy. The mixing entrainment and detrainment rates depend on the vertical gradients of buoyancy in clouds. The Emanuel scheme includes a formulation of the auto-conversion of cloud water into precipitation inside cumulus clouds.
In the Grell (1993) scheme, deep convective clouds are represented by an updraft and a downdraft that are undiluted and mix with environmental air only in the cloud base and top. Heating and moistening profiles are derived from latent heat released or absorbed, linked with the updraft–downdraft fluxes and compensating motion (Martinez-Castro et al., 2006). Two types of Grell scheme convective closure assumptions can be found in RegCM4. In the Arakawa–Schubert (1974) closure (AS), a quasi-equilibrium condition is assumed between the generation of instability by grid-scale processes and the dissipation of instability by sub-grid (convective) processes. In the Fritsch–Chappell (FC) closure (Fritsch and Chappell, 1980), the available buoyant energy is dissipated during a specified convective time period (between 30 min and 1 h).
Similarly, the Tiedtke (1989) scheme is a mass flux convection scheme, although it considers a number of cloud types as well as cumulus downdrafts that can represent deep, mid-level and shallow convection (Singh et al., 2011; Bhatla et al., 2016). The closure assumptions for the deep and mid-level convection are maintained by large-scale moisture convergence, while the shallow convection is sustained by the supply of moisture derived from surface evaporation.
2.3 Numerical experiments and methodology
Five experiments using the convection schemes of (1) Emanuel over land and Grell over ocean (mix1), (2) Emanuel, (3) Grell, (4) Tiedtke, and (5) Grell over land and Emanuel over ocean (mix2) are conducted using RegCM4-CLM4.5 with 18 sigma levels at 50 km horizontal resolution for the period from November 2002 to September 2004. The first 2 months (i.e., November and December 2002) was considered as spin-up time and not included in the analysis. The years 2003 and 2004 have been selected in this study because they corresponded to a dry and wet year in this region, respectively. The analyses will focus on the rainy season from June to September (JJAS). As quantitative measurements of model skills, we consider mean bias (MB), which is the difference between the area-averaged value of the simulation and the observation, the spatial root mean square difference (RMSD), the spatial correlation called pattern correlation coefficient (PCC) and the distribution of the probability density function (PDF) of the temperature bias. The RMSD, PCC and the PDF provide information at the grid-point level, while the MB does so at the regional level. A Taylor diagram (Taylor, 2001) is used to summarize the assessments above and to show the deviation of different model configuration results from observations.
As assumed in Gao et al. (2016), the temperature bias in JJAS presents a normal-mode type of distribution. The PDF is expressed as
where μ is the mean and σ the standard deviation of temperature bias.
The PDF is characterized by its bell-shaped curve, and the temperature biases distribute symmetrically around the mean bias temperature value in decreasing numbers as one moves away from the mean. The empirical rule states that for a normal distribution, nearly all of the data will fall within 3 standard deviations of the mean. The empirical rule can be broken down into three parts.
-
68 % of grid points fall within the first standard deviation from the mean.
-
95 % of grid points fall within 2 standard deviations from the mean.
-
99.7 % of grid points fall within 3 standard deviations from the mean.
The rule is also called the 68-95-99.7 rule or the three sigma rule. Thus, they constitute measurements of model performance and systematic model errors. These metrics are computed for each of the subregions indicated in Fig. 1.
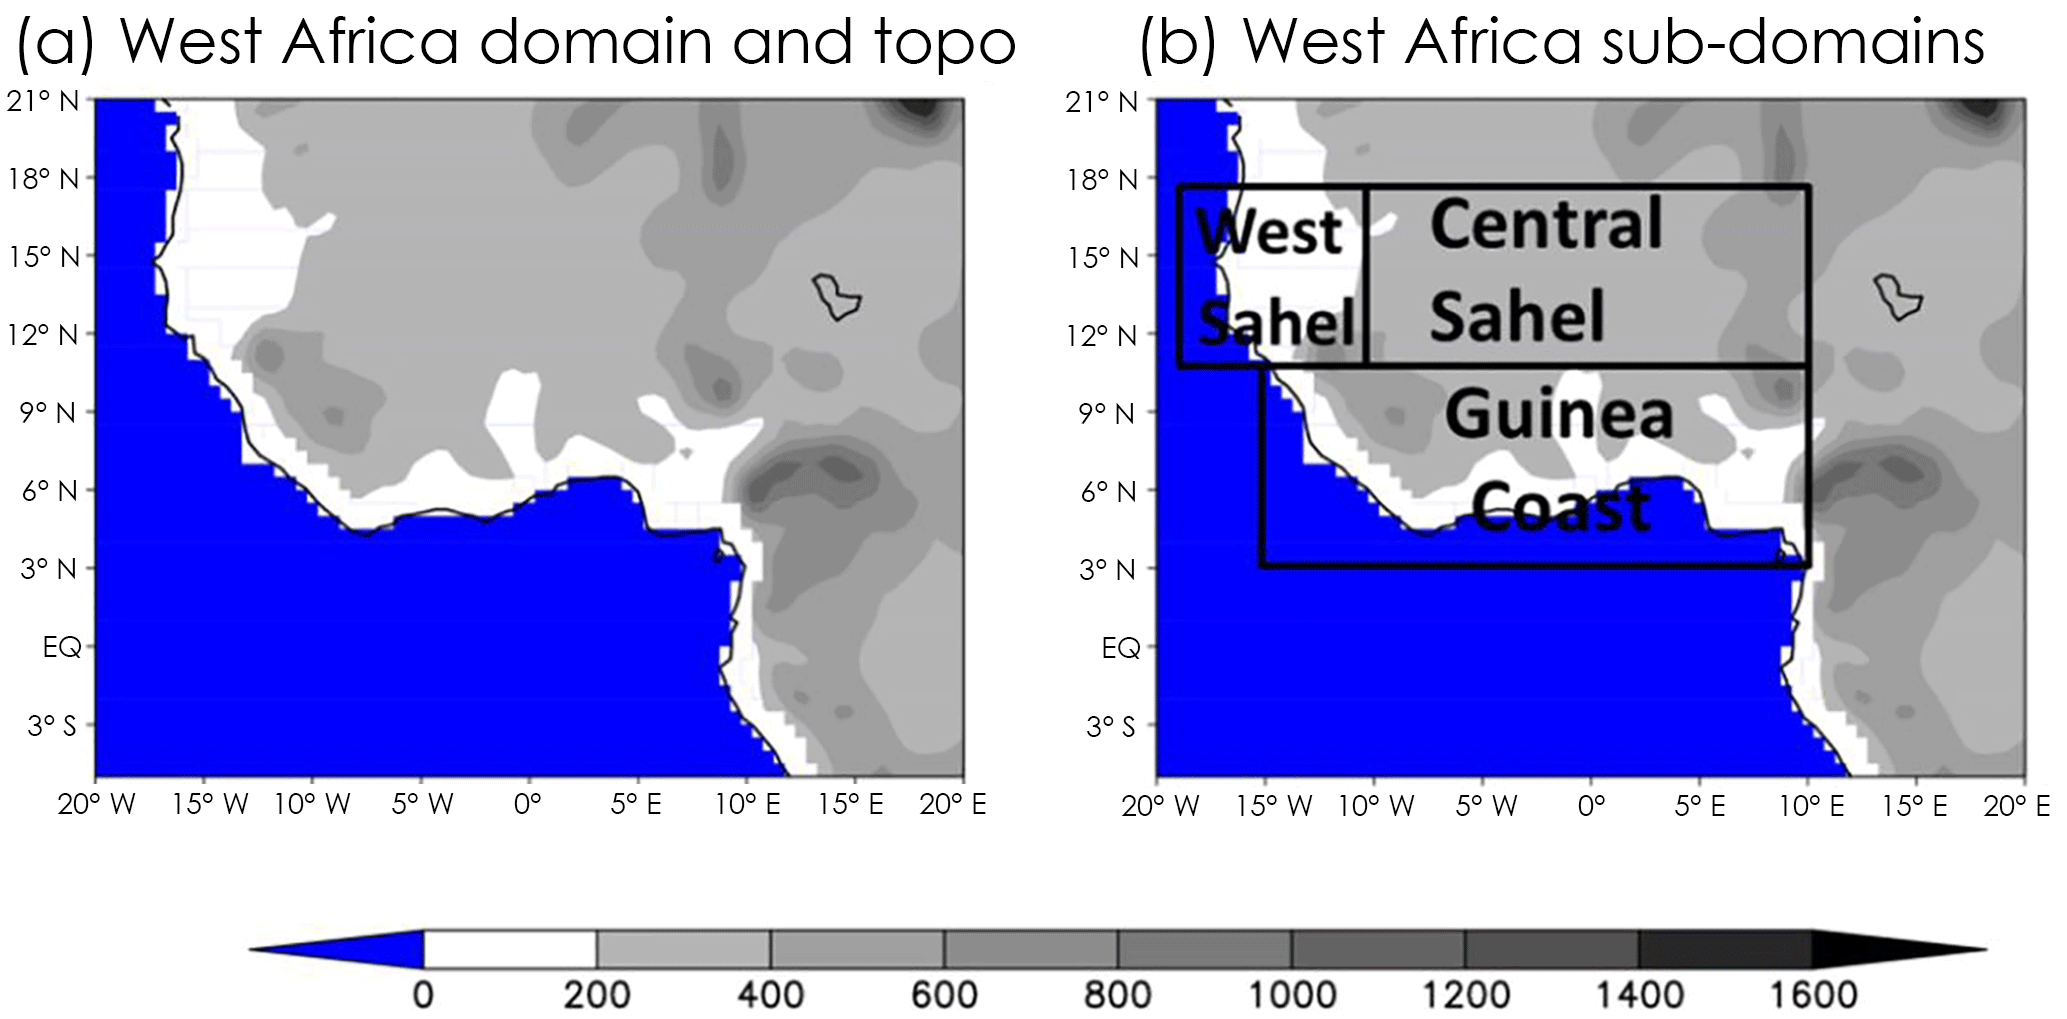
Figure 1Topography of the West African domain. The analysis of the model result has an emphasis on the whole West African domain and the three subregions Guinea coast, central Sahel and west Sahel, which are marked with black boxes.
For this sensitivity study, the model was run at its standard configuration with 18 vertical sigma layers (model top at 50 hPa) and with initial and boundary conditions provided by the European Centre for Medium-Range Weather Forecasts reanalysis ERA-Interim (Simmons et al., 2007; Uppala et al., 2008) at a horizontal resolution of 50 km and a temporal resolution of 6 h (00:00, 06:00, 12:00 and 18:00 UTC). Sea surface temperatures (SSTs) were from NOAA optimal interpolation weekly SST data (Reynolds et al., 2007). The terrain characteristics (topography and land use data) were derived from United States Geological Survey (USGS) Global Land Cover Characterization (GLCC; Loveland et al., 2000) at 10 min horizontal resolution.
We focus our analysis on the precipitation and the air temperature at 2 m in the summer of June–July–August–September (JJAS) over mainland West Africa. To reduce uncertainty due to lack of surface climate observations over the region (Nikulin et al., 2012; Sylla et al., 2013a), the simulated precipitation is validated using two observational datasets: the GPCP product ( resolution) is a satellite-derived dataset developed under the Global Precipitation Climatology Project and made available from late 1996 to present and the 0.25∘ high-resolution dataset of the Tropical Rainfall Measuring Mission 3B43V7 (TRMM) available from 1998 to 2013 (Huffman et al.,2007). The simulated 2 m temperature is also validated using two observational datasets: the Climate Research Unit (CRU) time series version 3.20 gridded at 0.5∘ of horizontal resolution from the University of East Anglia, available from 1901 to 2011 (Harris et al., 2013), and the University of Delaware version 3.01 (UDEL) gridded dataset at 0.5∘ of horizontal resolution, available from 1900 to 2010 (Legates and Willmott, 1990). The simulated atmospheric fields are compared with ERA-Interim reanalysis available from 1979 to present at 1.5∘ of horizontal resolution (Dee et al., 2011). All products have been regridded to using a bilinear interpolation method to facilitate the comparison with RegCM4 simulations (Nikulin et al., 2012). The model performance is further examined in four subregions (Fig. 1), each with different characteristics of the annual cycle of rainfall: central Sahel (10∘ W–10∘ E; 10–16∘ N), west Sahel (18–10∘ W; 10–16∘ N), Guinea coast (15∘ W–10∘ E; 3–10∘ N) and West Africa (20∘ W–20∘ E; 5∘ S–21∘ N).
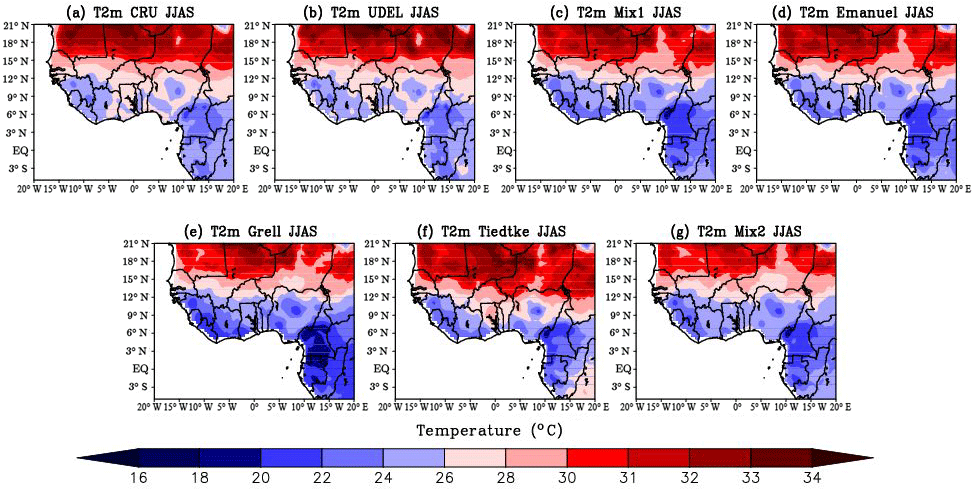
Figure 2Averaged 2003–2004 JJAS 2 m temperature (in ∘C) over West Africa from (a) CRU, (b) UDEL, (c) Mix1, (d) Emanuel, (e) Grell, (f) Tiedtke and (g) Mix2.
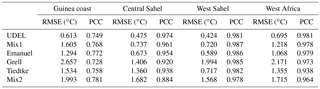
Table 1Pattern correlation coefficient (PCC) and root mean square difference (RMSD) for JJAS 2 m temperature for model simulations and observations (UDEL) with respect to CRU over the subregions Guinea coast, central Sahel, west Sahel and the West African domain during the period 2002–2003
3.1 Temperature
The spatial distribution of averaged temperature during JJAS over 2003–2004 from CRU and UDEL observations (Fig. 2a, b) is compared to the temperature simulated by RegCM4 using the convection schemes Mix1, Emanuel, Grell, Tiedtke and Mix2 (Fig. 2c–g). Figure 3 shows the associated mean model biases with areas statistically significant at the 95 % confidence level (the dotted area denotes differences that are statistically significant at a significance level of 0.05) relative to CRU for observations (UDEL; Fig. 3a) and the model simulations (Fig. 3b–f). Table 1 reports the PCC and the RMSD between the simulated and observed temperature calculated for Guinea coast, central Sahel, west Sahel and the entire West African domain.
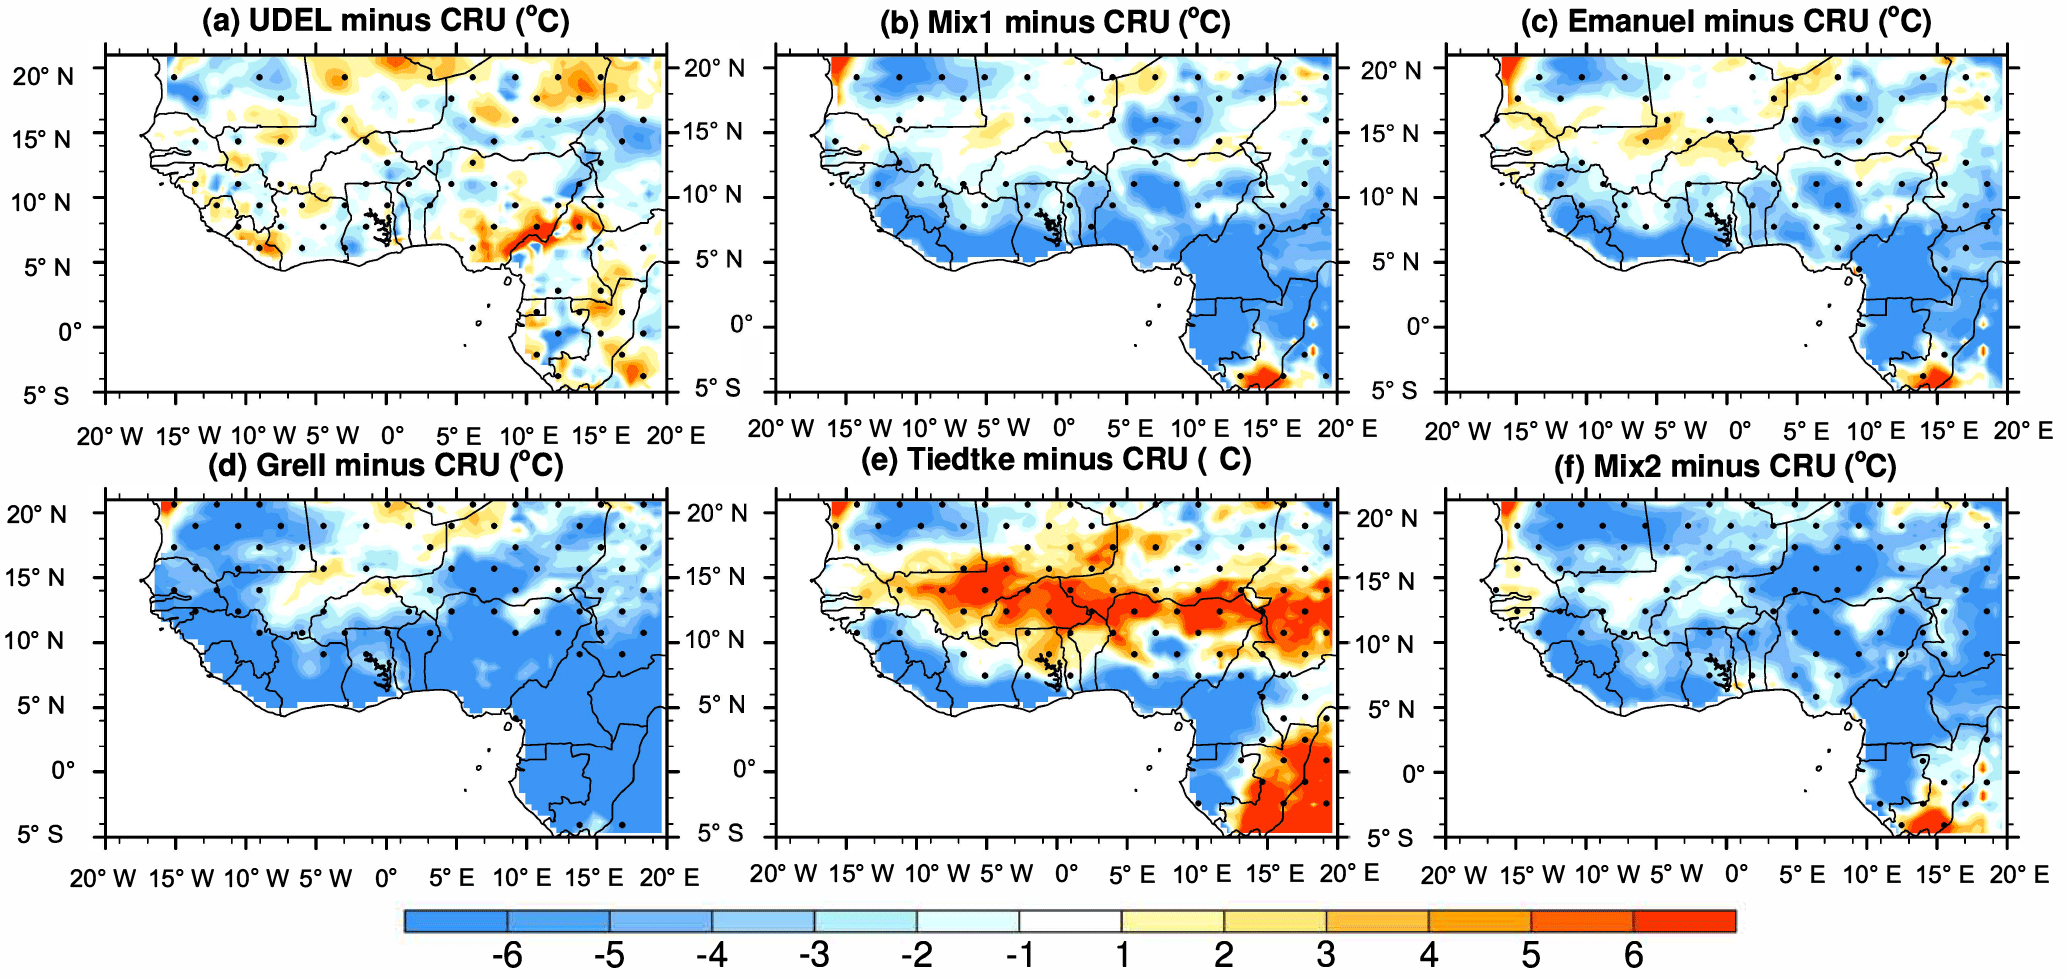
Figure 3JJAS 2 m temperature bias (in ∘C) over West Africa with respect to CRU from (a) UDEL, (b) Mix1, (c) Emanuel, (d) Grell, (e) Tiedtke and (f) Mix2 during the period 2002–2003. The dotted area denotes differences that are statistically significant at a significance level of 0.05.
The CRU temperatures present a zonal distribution in West Africa with a maximum (>34 ∘C) in the Sahara and the lowest temperatures (<22∘ C) over the Guinea coast and over complex terrains such as the Jos Plateau, Cameroon mountains and Guinean highlands. Figure 3 shows that the spatial distribution of the temperature biases is statistically significant at the 0.05 level over most of the domain studied, except over the Guinea coast region and Cameron mountains. The UDEL observation (Fig. 2b) shows similarity with CRU in terms of spatial distribution with PCC larger than 0.98 over the entire West African domain (see Table 1). However, UDEL depicts a sparse distribution with a mixture of warm and cold bias over the Sahara and along the Nigeria–Cameroon border around ±2 ∘C (see Fig. 3a). There is also a good agreement between model-simulated temperatures and CRU observations with PCCs more than 0.93 (Table 1) over West Africa. All model configurations reproduce the general features of the observed pattern well, including the meridional surface temperature gradient zone between Guinea coast and the Sahara Desert. This temperature gradient is important for the evolution of the African easterly jet (AEJ; Cook 1999; Thorncroft and Blackburn, 1999). All model configurations (Fig. 3b–d, f) exhibit a similar dominant cold biases, except the Tiedtke configuration (Fig. 3e) in the Sahara Desert at the central part of Mauritania and Niger and along the Guinea coast region. The greater cold bias with values up to −5 ∘C occurs when using the Grell configuration, while the simulation using the Tiedtke configuration depicts a dominant warm bias up to 4 ∘C, mainly located in central Sahel around 12∘ N (Fig. 3e). One effect of the warm bias shown in the Tiedtke simulation is to shift the zone of meridional temperature gradient southward relative to its observed position (Fig. 2f). However, it is difficult to determine the origin of RCM temperature biases as they involve changes in surface–atmosphere interactions and as they are a function of many factors such as surface albedo, cloudiness, temperature advection, and surface water and energy fluxes (Tadross et al., 2006; Sylla et al., 2012).

Figure 4PDF distributions (%) of temperature bias in JJAS over Guinea, central Sahel, west Sahel and West Africa derived from the model simulations using different convection schemes (land only; units: ∘C) during the period 2002–2003.
For a quantitative evaluation of the performance of these sensitivity tests, the PDF statistical tool was used. The PDF distributions of the temperature bias in JJAS are shown in Fig. 4 for Guinea coast, central Sahel, west Sahel and the entire West African domain. The PDF distribution shows a generally dominant cold bias (see Fig. 4a–d) in model simulations over most of the study domain, except with the Tiedtke configuration in the central Sahel region.
Over the Guinea coast region, the Grell configuration presents a colder bias with the maximum of temperature bias distribution centered around −2 ∘C (see Fig. 4a) compared to the other configurations. However, the Emanuel simulation shows a lower RMSD at about 1.29 ∘C with a PCC larger than 0.77 (see Table 1). For the central Sahel region (Fig. 4b) a warmer bias is found in the Tiedtke simulation, while a colder bias is found in the Grell and Mix2 configurations (see Fig. 4b). The Emanuel configuration shows a lower value of RMSD at about 0.67 ∘C and a higher PCC larger than 0.95 compared to the other model-simulated temperatures (see Table 1). In west Sahel a colder bias is found with the Grell scheme (see Fig. 4c), while the Emanuel and Tiedtke simulations show a mixture of cold and warm bias. The configuration of RegCM with Emanuel presents a better performance with a lower RMSD and higher PCC values compared to the other simulations in west Sahel. Over the entire West African domain (see Fig. 4d), Grell and Tiedtke respectively present a colder and warmer bias. Generally, with respect to temperature simulations, a better performance of RegCM4 is obtained when using the Emanuel scheme.

Figure 5Averaged 2003–2004 JJAS precipitation (in millimeters per day) over West Africa from (a) GPCP, (b) TRMM, (c) Mix1, (d) Emanuel, (e) Grell, (f) Tiedtke and (g) Mix2.

Figure 6JJAS precipitation bias (in %) over West Africa with respect to GPCP from (a) TRMM, (b) Mix1, (c) Emanuel, (d) Grell, (e) Tiedtke and (f) Mix2 during the period 2002–2003.
3.2 Precipitation
The spatial distribution of mean JJAS precipitation (2003–2004) over West Africa is shown in Fig. 5 for observations from GPCP and TRMM (Fig. 5a–b) and for RegCM4 simulations with the following convective schemes: Mix1, Emanuel, Grell, Tiedtke and Mix2 (Fig. 5c–g). Sylla et al. (2013a) argued that over Africa, GPCP is more consistent with gauge-based observations, while Nikulin et al. (2012) found a significant dry bias over tropical Africa in TRMM compared to GPCP. We therefore select GPCP as our main observational reference for precipitation in this paper. Figure 6 shows the corresponding precipitation mean biases that are statistically significant at the 95 % confidence level (the dotted area denotes differences that are statistically significant at a significance level of 0.05) relative to GPCP for TRMM (Fig. 6a) and for the different simulation configurations (Mix1, Emanuel, Grell, Tiedtke and Mix2; Fig. 6b–f, respectively). GPCP depicts a zonal band of rainfall decreasing from north to south (see Fig. 5a). Precipitation maxima are found in orographic regions of the Guinea highlands, Jos Plateau and Cameroon mountains. Figure 6 shows that the spatial distribution of the precipitation biases is statistically significant at 0.05 levels over almost the entire domain studied. Differences between TRMM and GPCP observation products (Table 2) can reach up to −5.26 % at subregional levels, while over the entirety of West Africa it does not exceed 0.82 %. Although both observation products exhibit some differences (Fig. 6a), their patterns show a good agreement, with PCCs more than 0.96 over the entire West African domain (Table 2). TRMM underestimates the rainfall intensity over the Guinea coast and central Sahel regions (no more than −0.86 % and −5.12 %, respectively) and overestimates the rainfall intensity over west Sahel and the entire West African domain, respectively reaching 3.48 % and 0.83 %. The spatial distribution of rainfall is reproduced well by all model configurations with PCC values within the range 0.61 and 0.89 over the entire West African domain. The dominant feature in these simulations is the dry bias over the West African domain (Fig. 6b–f), which is more pronounced in the Tiedtke configuration (see Table 2). The warmer bias over central Sahel in the Tiedtke configuration (Fig. 3e) is consistent with the drier bias found in the same region (see Table 2 and Fig. 6e), as less rainfall would induce less evaporative cooling (decrease in latent heat flux) and therefore less favorable conditions for cloud cover (Feddema et al., 2005). The decrease in cloud cover will lead to an increase in incident radiation, inducing an increase in sensible heat flux and warmer surface temperatures. Moreover, a drier bias may be associated with a heating induced by the adiabatic subsidence to compensate for the effect of the increase in the surface albedo (Charney, 1975). However, Table 2 reveals that Mix1 and Emanuel show a better performance with lower mean biases and greater PCC compared to the other model simulations over the entire West African domain and its subregions.
Table 2Mean bias (MB) and the pattern correlation coefficient (PCC) for JJAS precipitation for model simulations and observations (TRMM) with respect to GPCP for the subregions Guinea coast, central Sahel and west Sahel as well as the West African domain. The PCC is calculated only for the West African domain during the period 2002–2003.
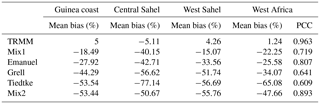
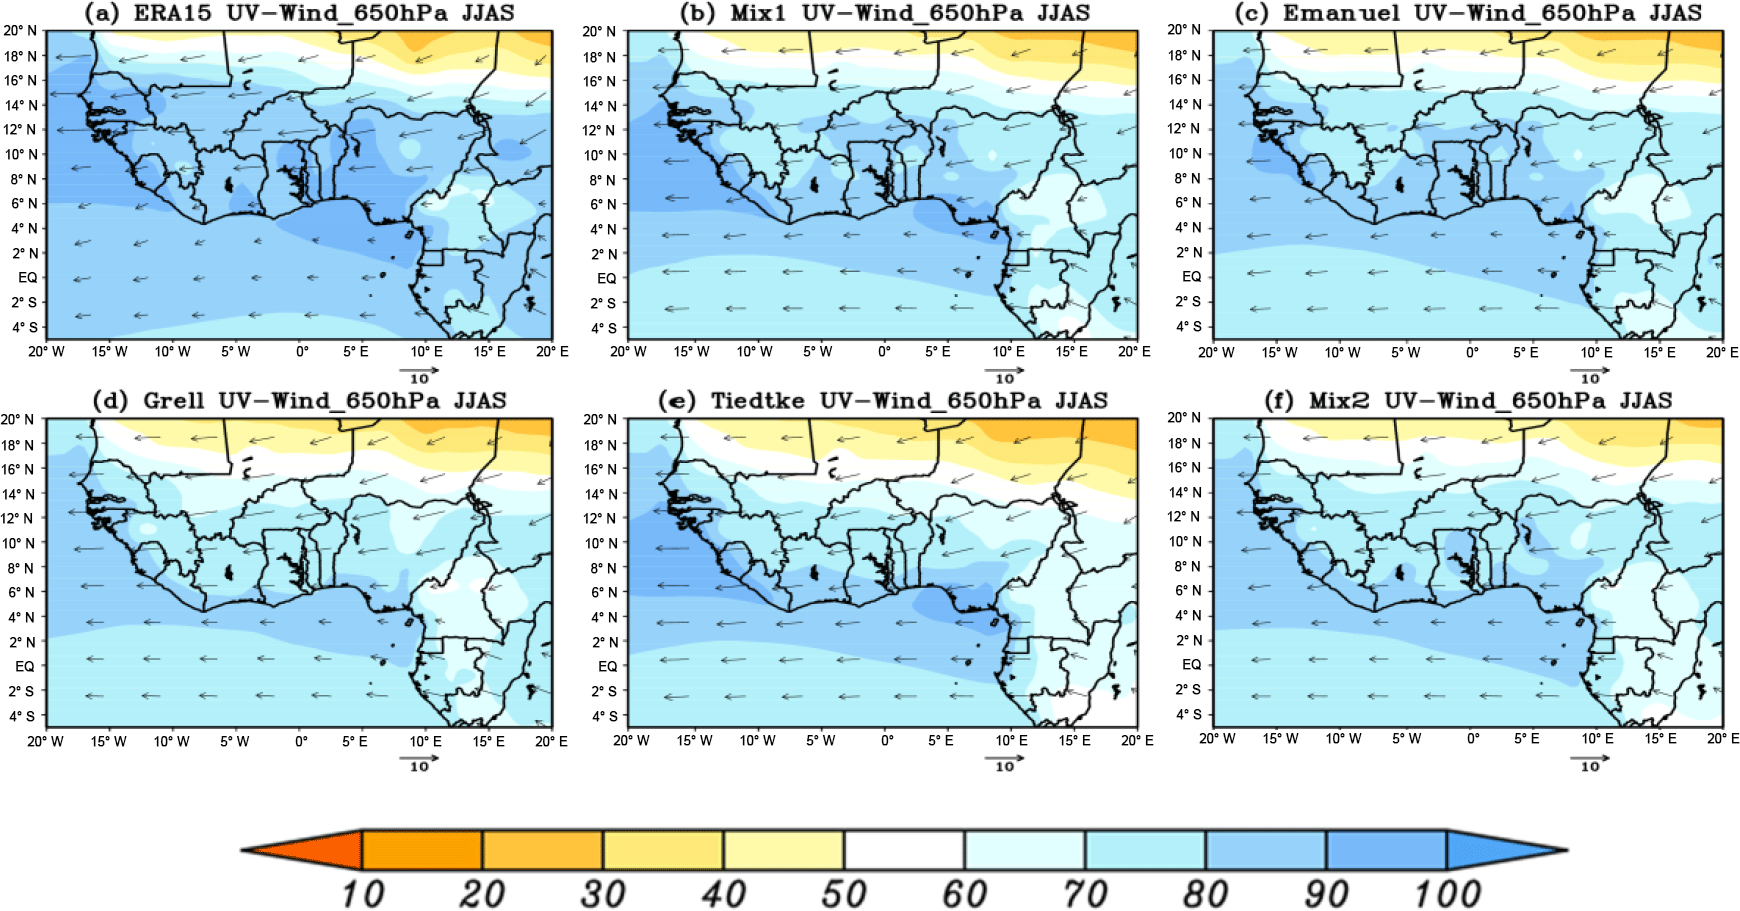
Figure 7The (a) observed and (b–f) simulated mean mid-level (850–300 hPa) vertically integrated specific humidity (shaded) superimposed on zonal winds in JJAS at 650 hPa over West Africa from (a) ERA-Interim, (b) Mix1 (c) Emanuel, (d) Grell (e) Tiedtke and (f) Mix2. Arrows are in m s−1 and specific humidity is expressed in 10−3 kg kg−1 during the period 2002–2003.
In order to understand the origins of the model rainfall biases, we analyzed the JJAS mid-level (850–300 hPa) vertically integrated water vapor mixing ratio and the 650 hPa low-level wind (African easterly jet, AEJ) over West Africa averaged over the 2003–2004 period (Fig. 7). The AEJ is the most prominent feature affecting the West African monsoon through its role in organizing convection and precipitation over the region (Cook, 1999; Diedhiou et al., 1999; Mohr and Thorncroft, 2006; Sylla et al., 2011). Areas with larger water vapor mixing ratio correspond to the areas of maximum precipitation in observations (see Fig. 5a–b). Around 9∘ N the weaker easterly wind (AEJ) contributes to enhancing moisture convergence, which results in an increase in water vapor and precipitation (see Fig. 5a–b). All model configurations show some quantitative differences compared to ERA-Interim in both the wind flux and the water vapor mixing ratio.

Figure 8Taylor diagram showing the pattern correlation and the standard deviation (normalized) for JJAS precipitation with respect to GPCP from Mix1, Emanuel, Grell, Tiedtke and Mix2 over Guinea coast, central Sahel, west Sahel and West Africa during the period 2002–2003.
The underestimation of vertically integrated water vapor mixing ratio is larger in the Grell and Mix2 simulations (Fig. 7c, e) over the Guinea coast and Atlantic Ocean compared to those of Mix1, Emanuel and Tiedtke (Fig. 7a, b, e). Mix1 and the Emanuel configurations better reproduce the spatial extent of the moisture convergence than the other model configurations (Fig. 7b, c). All model configurations simulate a stronger easterly wind flux (AEJ) than observed, in particular over the Guinea coast and Atlantic Ocean, inducing a negative impact on simulated precipitations in the subregions (see Fig. 5c–g). Another possible explanation for model rainfall biases is further discussed in Brown and Sylla (2011), whereby a sensitivity study on the domain size with RegCM3 over West Africa showed that RegCM3 simulates drier conditions over a default domain (RegCM-D1) quite similar to our domain size used in this study.
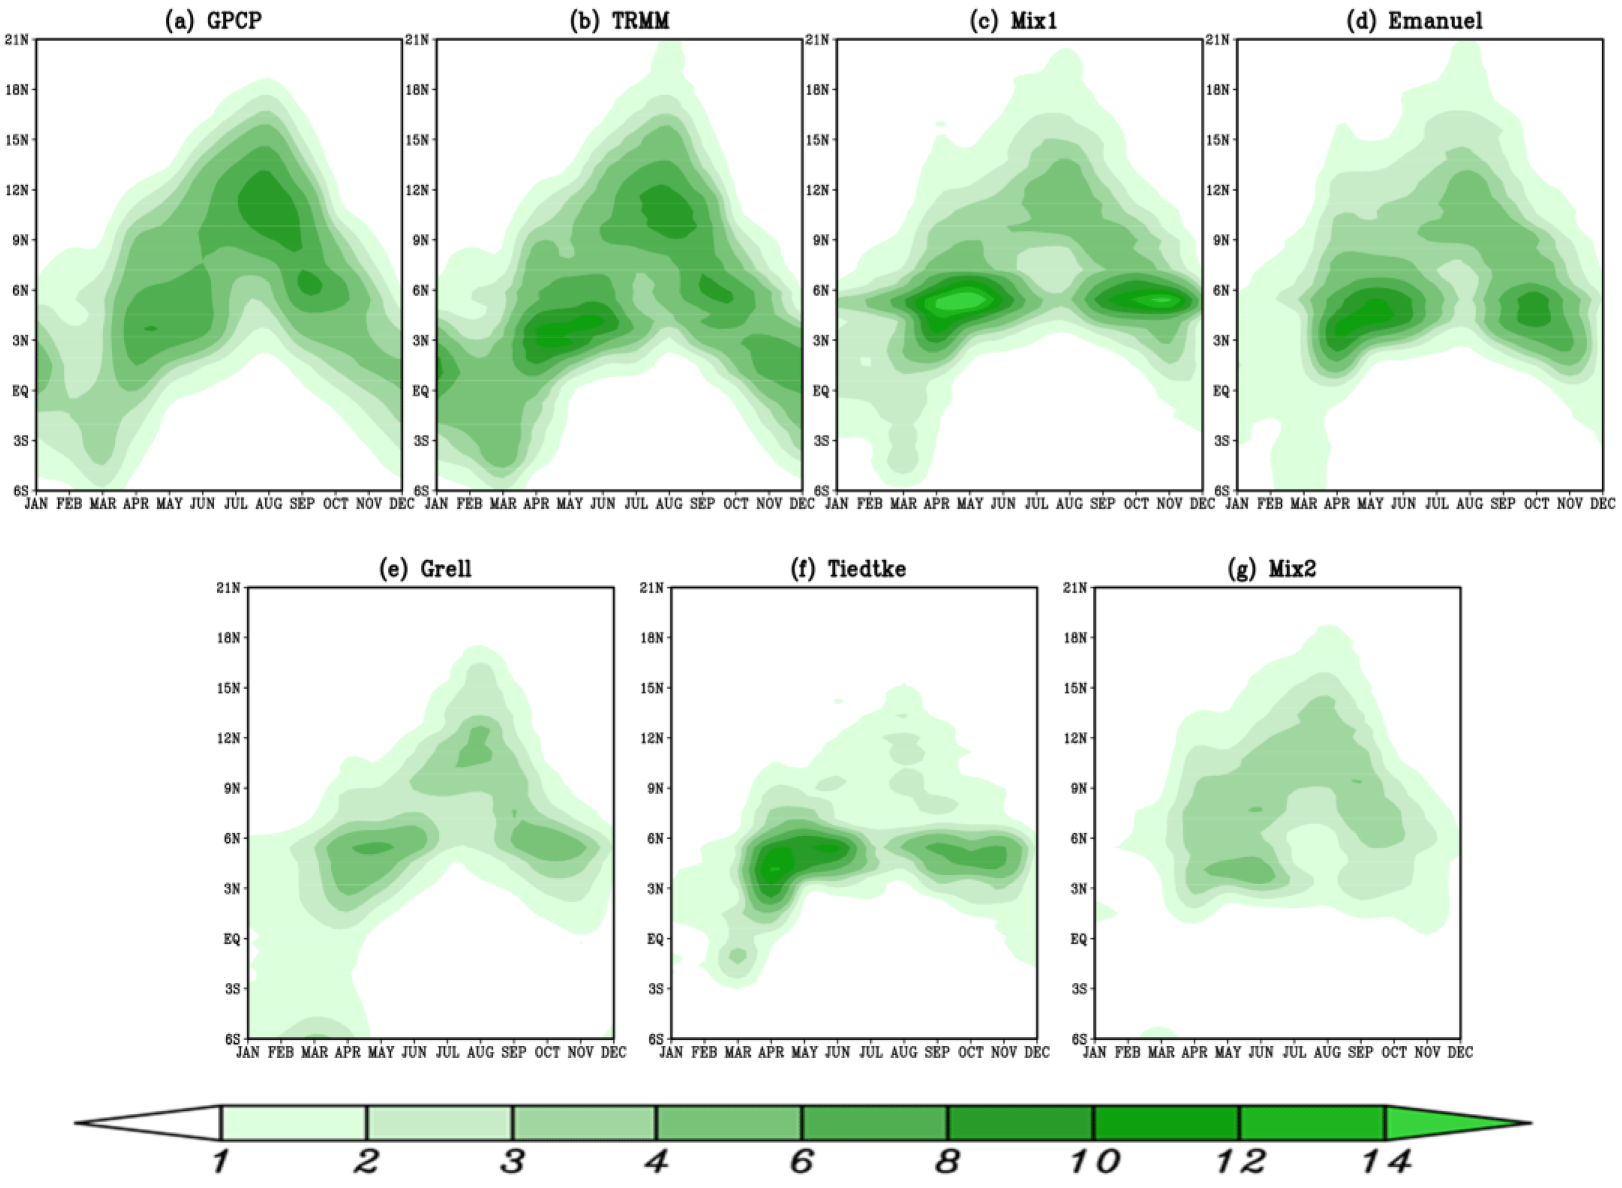
Figure 9Hovmöller diagram of monthly precipitation (mm d−1) averaged between 10∘ W and 10∘ E for the period 2003–2004 for (a) GPCP, (b) TRMM, (c) Mix1, (d) Emanuel, (e) Grell, (f) Tiedtke and (g) Mix2 under different convective schemes: Mix1, Emanuel, Grell, Tiedtke and Mix2.
A Taylor diagram is used to give a combined synthesized view of the pattern correlation coefficient and the JJAS standard deviation of precipitation from the different sensitivity studies with respect to GPCP over Guinea coast, central Sahel, west Sahel and West Africa. Model standard deviations are normalized by the observed value from GPCP (indicated by REF; see Fig. 8). For the entire West African domain, the diagram shows that Tiedtke and Emanuel outperform the other configurations with values of normalized standard deviation much closer to 1. However, the Emanuel configuration present a better spatial correlation, reaching 0.8 compared to the Tiedke configuration. Over the Guinea coast subregion, Grell and Emanuel present better values of normalized standard deviation. However, regarding the spatial correlation, a value of about 0.7 as in the Emanuel configuration is the best. For west and central Sahel, Mix1 and Emanuel are closer to observations. However, Emanuel outperforms the Mix1 configuration with a good spatial correlation score between 0.7 and 0.8 over the central and west Sahel subregions. From the Taylor diagram, it can be inferred that Emanuel performs better regarding the normalized standard deviation and the pattern correlation over the entire West African domain and its subregions.
Based on previous experience and studies, Gao et al. (2016) noted that the use of the Emanuel convection scheme in RegCM3 and RegCM4 over China tends to simulate too much precipitation when using BATS as the land surface scheme. They explained that it is mainly due to the fact that the Emanuel scheme responds quite strongly to heating from the land surface compared to the Grell and Tiedtke convection schemes once convection is triggered. BATS with only two soil-level depths maximizes this response; this is why Emanuel is too wet when using BATS compared to Grell and Tiedtke. By contrast, CLM uses several soil layers down to a depth of several meters; therefore, the upper soil temperatures respond less strongly to the solar heating. The precipitation amount is much reduced when using CLM, which is good for Emanuel but not good for Grell and Tiedtke (Gao and al., 2016), while the combination of BATS with Grell and Tiedtke shows good performance (Gao et al., 2012; Ali et al., 2015).
In conclusion, although RegCM4-CLM4.5 shows some weaknesses, such as a dry bias over most of the central Sahel and Guinea coast region, its performance in replicating the spatial distribution of rainfall appears in line with that documented in previous studies using the previous version RegCM3 (Sylla et al., 2009; Abiodun et al., 2012).
3.3 Mean annual cycle
In this section, we examine the effect of the convection scheme on the characterization of the three distinct phases of the West African monsoon: the onset, the high rain period and the southward retreat of the monsoon rain band (Sultan et al., 2003). Such behavior is best represented by a meridional cross section (time–latitude Hovmöller diagram). This diagram provides a robust framework to assess RCM skill in simulating seasonal and intraseasonal variations of the WAM and thus the mechanisms of the region's rainfall (Hourdin et al., 2010). Figure 9 shows the time–latitude diagrams of rainfall averaged over the region between 10∘ E and 10∘ W for observations from GPCP and TRMM (Fig. 9a–b) and for model simulations using the Mix1, Emanuel, Grell, Tiedtke and Mix2 convection schemes (Fig. 9c–g). The averages are taken for the period 2003–2004 and displayed throughout the year. This figure shows that the cores of the different phases are more well marked in TRMM than in GPCP (Fig. 9a, b). TRMM observations show a first rainy season from mid-March up to mid-June over the Gulf of Guinea and Guinea coast with a northward extension of the rain belt up to about 5∘ N (Fig. 9b). The monsoon jump is characterized by a sudden cessation of precipitation intensities (Sultan and Janicot, 2000, 2003) and occurs from mid-June to early July, when the rain band core moves suddenly northward to about 10∘ N (Fig. 9b). This indicates the beginning of the rainy season over the Sahel with a peak reached in August between 9 and 12∘ N over central Sahel. A gradual retreat of the monsoon starts at the end of August and it is shown well by GPCP (Fig. 9a), with a decrease in intensity and a southward migration of the rain band. There are both similarities and differences across the two observation datasets of TRMM and GPCP. Both datasets agree on the area of rainfall maximum intensity around 4∘ N despite a more intense peak of rainfall for TRMM compared to GPCP (Fig. 9a, b). The monsoon jump characterized by a sharp discontinuity is not well defined in GPCP compared to TRMM. In addition, GPCP shows wet conditions during the retreat phase in July to September compared to TRMM (Fig. 9a, b).
The Mix1, Emanuel, and Grell model configurations (Fig. 9c–e) capture the three phases of the seasonal evolution of the WAM, while the Tiedke and Mix2 simulations fail to reproduce them, in particular the rainy season over central Sahel. However, the Emanuel and Mix1 model configurations (Fig. 9c, d) overestimate rainfall amounts during the two rainy seasons over Guinea coast, mostly as a result of an overestimate of the precipitation over the orographic regions of Guinea highlands, Jos Plateau and Cameroon mountains. The Mix1 and Mix2 configurations are respectively wetter and drier compared to the other model configurations (Fig. 9c, g). Generally, the three monsoon phases are shown well by the Grell simulation, although it is drier compared to the other model simulations.
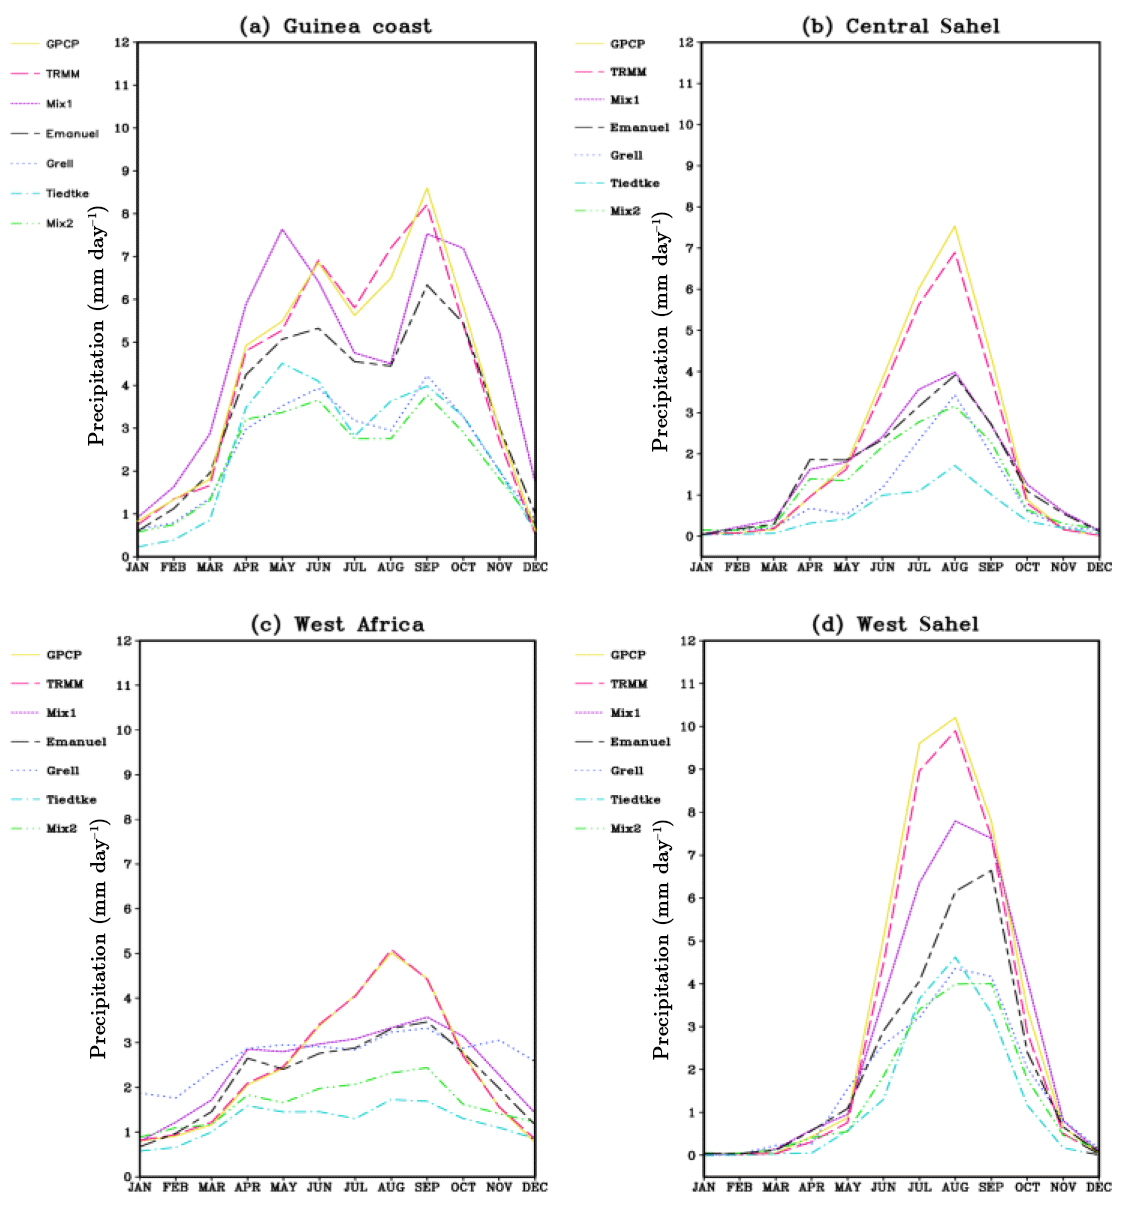
Figure 10Annual cycle of monthly precipitation (mm d−1) averaged over (a) the Guinea coast, (b) west and central Sahel, (c) West Africa, and (d) west Sahel for the period 2003–2004 under different convective schemes: Mix1, Emanuel, Grell, Tiedke and Mix2.
Another analysis of the annual cycle consists of considering the area-averaged (land-only grid points) value of monthly rainfall and temperature over the Gulf of Guinea, central Sahel and the entire West African domain (Figs. 10, 11). This allows for better identification of rainfall and temperature minima and peaks. Figure 10a–d show the annual cycle of precipitation averaged over Guinea coast, central Sahel, west Sahel and the entire West African domain, respectively. Over the Guinea coast (Fig. 10a), both GPCP and TRMM observations show a primary maximum in June and a secondary one in September. The Mix1 and Tiedtke model configurations simulate an early first peak in May, while the Emanuel, Grell and Mix2 configurations capture the observed peak in June well. We note that all model configurations reproduce the timing of the midsummer break and second rainfall peak in September well, but they underestimate its magnitude, although the Mix1 simulation result is higher and much closer to observations compared to the other model simulations.
In both central Sahel and west Sahel, observations (GPCP and TRMM) display a dry spring (from January to March) and winter (from October to December) and a wet summer (from June to September) with a well-defined peak occurring in August. Model configurations reproduce both the phase of the annual cycle and the observed rainfall peak in August except the Emanuel configuration, which shifts it in September over the west Sahel region. Model simulations underestimate the peak intensity compare to observations. However, the Mix1 configuration rainfall peak is much closer to observations for both the central Sahel and west Sahel regions (Fig. 10b, d) compared to the other model simulations. Over the entire West African domain, the annual cycle (Fig. 10c) is smoother with a notable shift of the peak in September in the different model configurations. All the model configurations underestimate the rainfall peak and shift it in October. However, the Mix1 and Emanuel model simulations are much closer to the observed annual cycle of precipitation compared to the others. The Mix1 simulation, compared to the others, better reproduces the observed annual cycle of precipitation over the subregions and the entire West African domain.
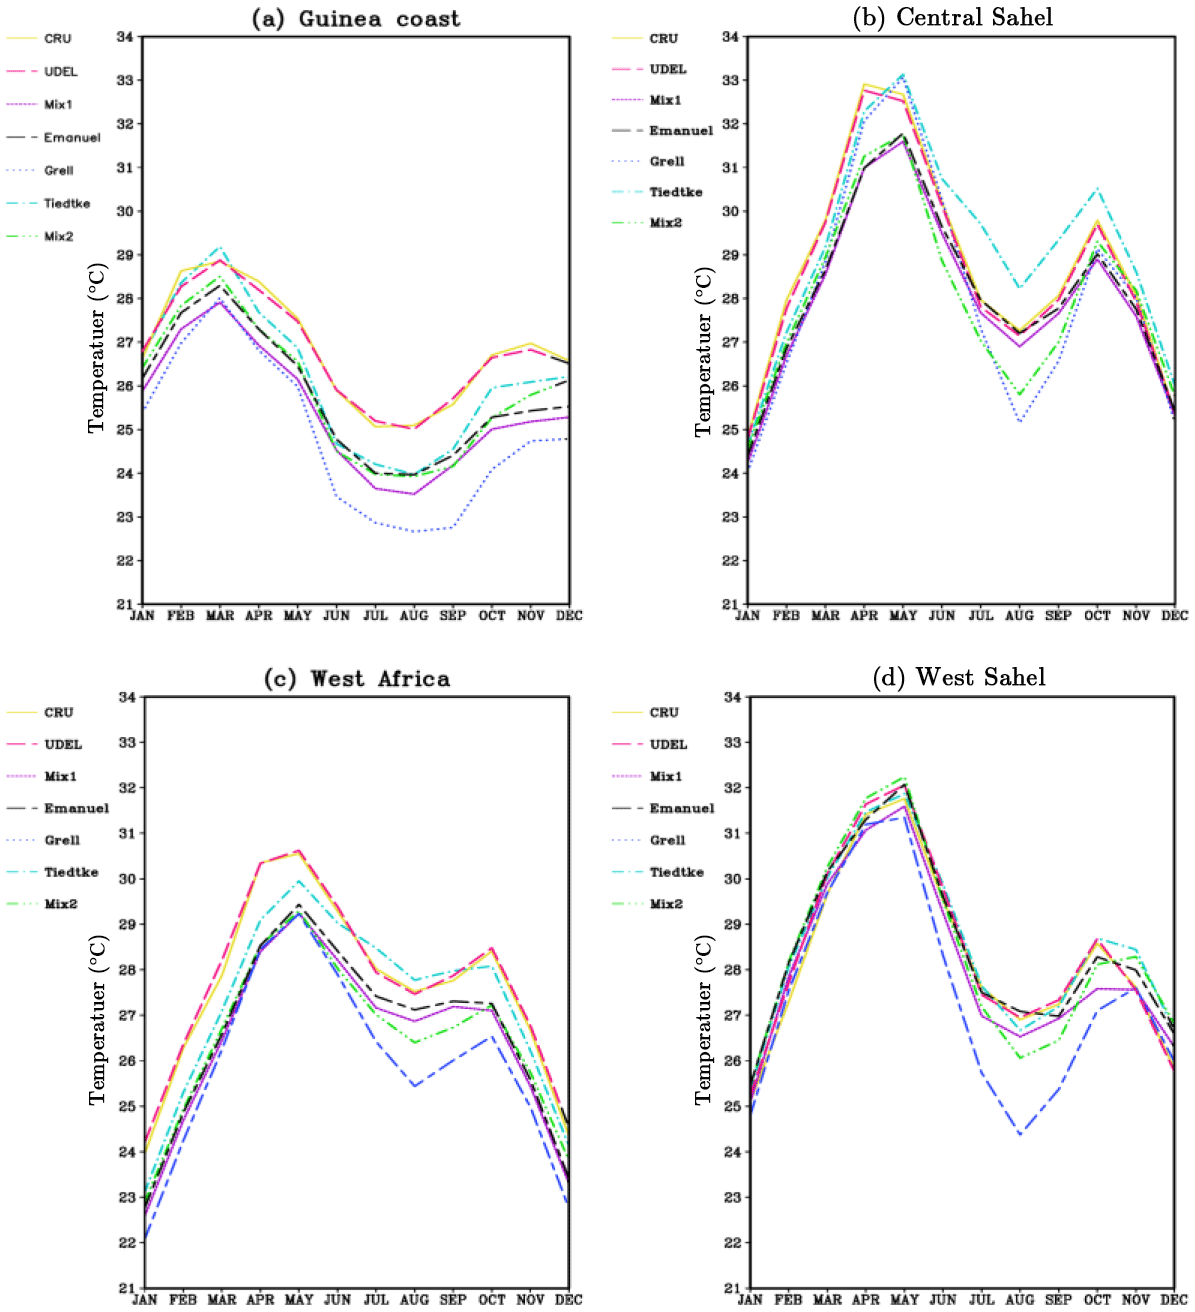
Figure 11Annual cycle of 2 m temperature (∘C) averaged over (a) the Guinea coast, (b) central Sahel, (c) West Africa and (d) west Sahel for the period 2003–2004 under different convective schemes: Mix1, Emanuel, Grell, Tiedke and Mix2.
The annual cycles of temperature for central Sahel, west Sahel and the entire West African domain of the Mix1, Emanuel, Grell, Tiedtke and Mix2 convection schemes are shown in Fig. 11b–d. The observations (CRU and UDEL) indicate a cooler winter from December to February and warmer pre- and post-monsoon periods with relative minima occurring during August, while over Guinea coast both winter and post-monsoon are cooler and only the pre-monsoon phase is warmer (Fig. 11a). Model configurations present a similar seasonal variation of the mean monthly temperature at 2 m compared to observations, but do exhibit some differences.
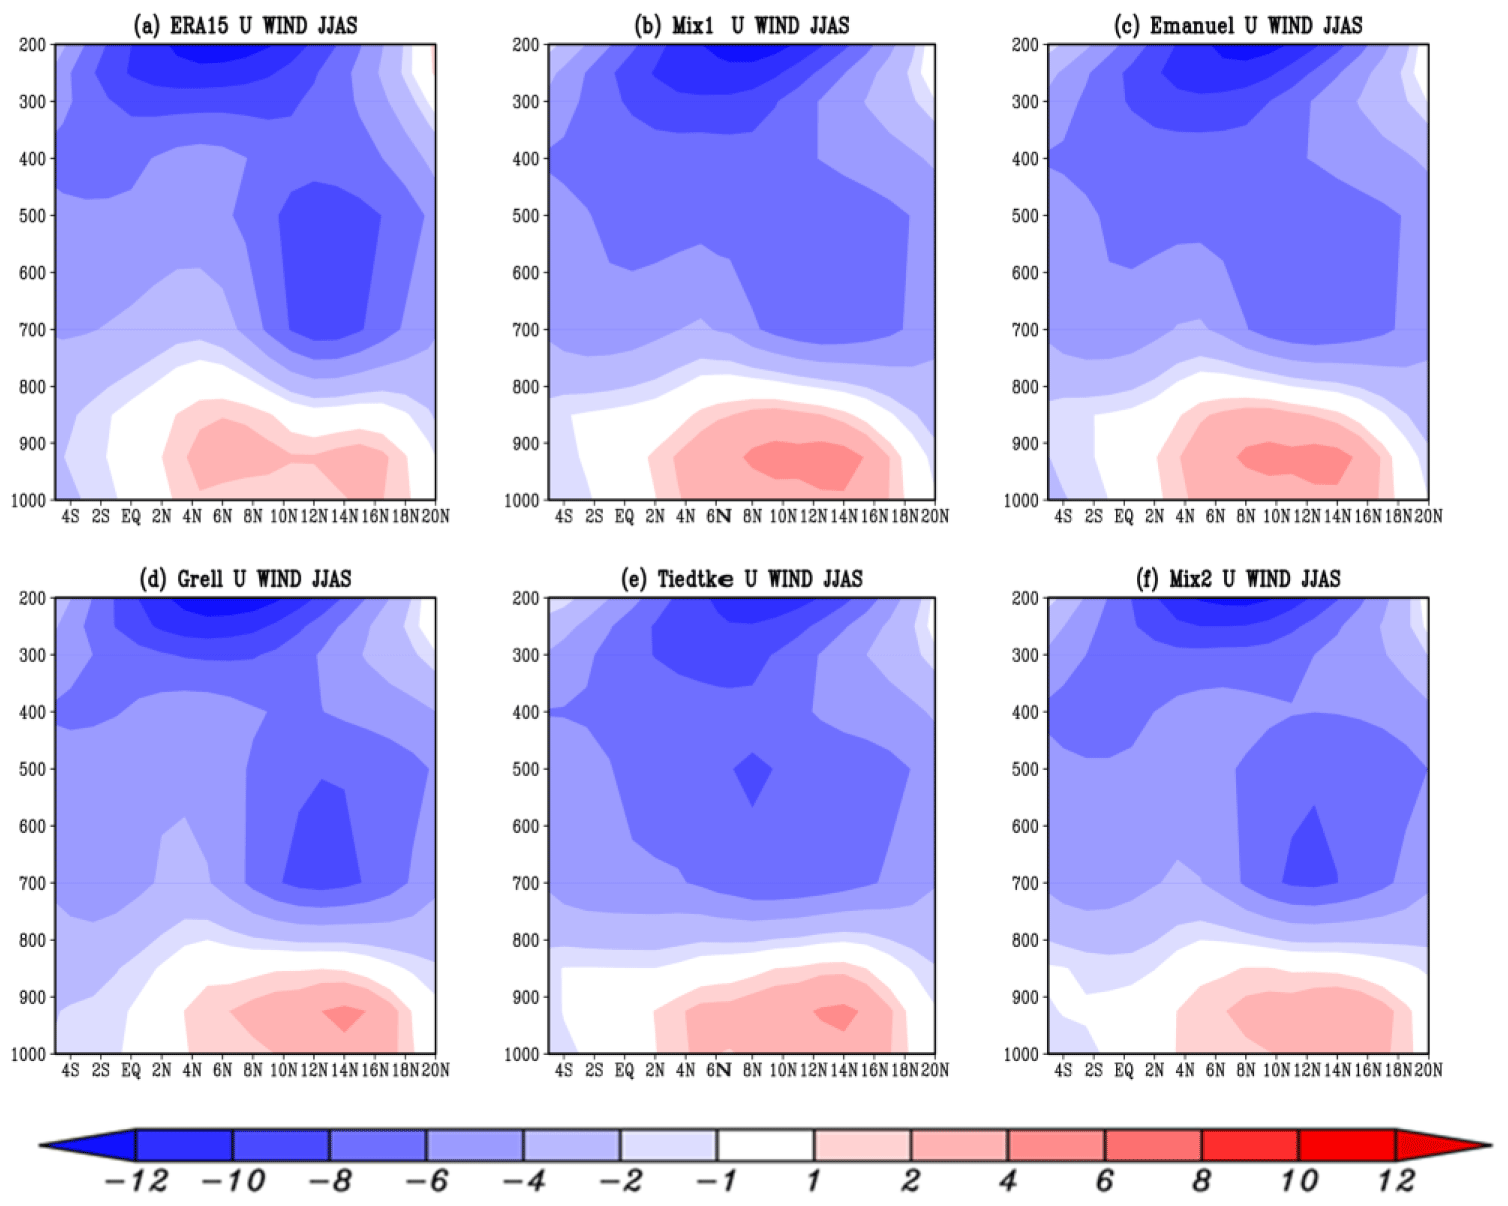
Figure 12Vertical cross section of the JJAS mean zonal wind (in m s−1) averaged between 10∘ W and 10∘ E over West Africa from (a) ERA-Interim (b) Mix1, (c) Emanuel, (d) Grell, (e) Tiedtke and (f) Mix2. The mean is calculated using the 2003–2004 period.
Over Guinea coast model simulations underestimate the magnitude of the temperature compared to observations. However, the Tiedtke configuration is higher and much closer to observations compared to the other model simulations throughout the year (Fig. 11a). Over the central Sahel region, Grell and Tiedtke capture the seasonal variation from November to June well, in particular the first peak in August, compared to the other model simulations. During the summer (JJAS) Emanuel and Mix1 reproduce the observed precipitation annual cycle quite well (Fig. 11b). Therefore, model simulations underestimate the seasonal variation of temperature over the entire West African domain. Although the Tiedtke simulation overestimates the midsummer break period, it is much closer to the observed annual cycle of temperature throughout the year compared to the other model simulations. Over west Sahel, model simulations reproduce the annual cycle of temperature quite well except the Grell and Mix2 configurations, in particular during the summer (JJAS). In summary, the Tiedtke simulation better reproduces the observed annual cycle of temperature throughout the year over the subregions and the entire West African domain compared to the other model configurations.
The divergences in the RCM annual cycles arise mostly from their different abilities to simulate the main features responsible for triggering and maintaining the WAM precipitation (Gbobaniyi et al., 2013). Among them, we have the monsoon flow, the African easterly jet (AEJ), the tropical easterly jet (TEJ) and the African easterly waves (AEWs; Diedhiou et al., 1999; Sylla et al., 2013b).
3.4 Wind profile
Atmospheric circulations and their interactions with the ITCZ play an important role in the WAM system (Nicholson, 2013). Thus, this section aims to analyze the impact of the choice of convection scheme in simulations of zonal wind features, including the near-surface westerly component (the West African monsoon, WAM), the African easterly jet (AEJ) and the tropical easterly jet (TEJ) in the middle and upper troposphere. Figure 12 depicts the vertical cross section of the JJAS mean of the zonal wind averaged between 10∘ W and 10∘ E for ERA-Interim (Fig. 12a) and model configurations in the Mix1, Emanuel, Grell, Tiedtke and Mix2 convection schemes (Fig. 12b–f). The reanalysis ERA-Interim (Fig. 12a) displays the monsoon flow winds below 800 hPa at 2–18∘ N with two cores merged over both Guinea coast (centered at 6∘ N) and central Sahel (centered at 15∘ N) subregions, the AEJ in the mid-levels centered at 12∘ N, and the TEJ in the upper tropospheric levels at 200 hPa centered at 5∘ N (Fig. 12a). All model configurations reproduce the zonal wind features well despite some biases.
Model simulations Mix1, Emanuel, Grell and Tiedtke present a strong core of monsoon flow compared to Era-Interim (reaching 6 m s−1). The stronger and weaker monsoon flows are found with the Mix1 and Mix2 configurations, respectively, compared to the other configurations. However, model simulations reproduce the limit of the surface westerly flow well compared to its position. Of particular interest is the core of the AEJ in the mid-tropospheric levels, which is greatly weakened with Mx1 and Emanuel. While the AEJ magnitude core is well defined in the Grell and Mix2 simulations at 12∘ N, its spatial extent is somewhat reduced. This location of the AEJ in the Grell and Mix2 simulation is consistent with the location of the region of zonal temperature gradient (see Fig. 3e, g), as the AEJ is associated with the surface temperature gradient (Cook, 1999; Thorncroft and Blackburn, 1999). The Tiedtke simulation shifts the location of the AEJ core at 8∘ N in agreement with the warm bias shown in the Tiedtke configuration (see Fig. 4e). The TEJ at 200 hPa and 5∘ N is very similar in model simulations compared to the ERA-Interim reanalysis. However, the core of the jet is weaker in the Tiedtke configuration compared to the other model simulations. Overall, the Grell configuration outperforms simulations of the main features of the zonal wind compared to the other model simulations.
The latest release of RegCM4 has been applied over West Africa for 2 years (2002–2003) to assess its performance using five convective parameterizations: (a) the Emanuel scheme, (b) Emanuel over land and Grell over ocean (Mix1), (c) the Grell scheme, (d) the Tiedke scheme, and (e) Grell over land and Emanuel over ocean (Mix2). The sensitivity of the model to different convection schemes was validated using observations. The main findings and conclusions can be summarized as follows.
Compared with the previous version of RegCM, RegCM4-CLM also shows a general cold bias over West Africa. However, in the central Sahel region, the Tiedtke simulation presents a warm bias. This warms bias tends to displace the meridional temperature gradient southward relative to its observed position. An overall better performance with respect to temperature is obtained when using the Emanuel scheme.
With respect to precipitation, the dominant feature in model simulations is a dry bias, which is more pronounced when using the Tiedtke convection scheme. Considering the good performance over the entire West African domain and its subregions in the temperature and precipitation simulations, we suggest the Emanuel convection scheme when using RegCM4-CLM4.5 over West Africa.
Simulations using the Mix1 and Emanuel schemes reproduce the spatial extent of moisture convergence of the ERA-Interim reanalyses well compared to the other convection schemes. However, in the mid-levels of the atmosphere, model simulations show an easterly wind flux (AEJ) stronger than observed, in particular over the Guinea coast and Atlantic Ocean below the latitude 4∘ N, creating an increased subsidence with a negative effect on simulated precipitation there. This is a possible explanation for the dry bias over the West African domain. However, the vertical features of the zonal wind, including the near-surface westerly component, the AEJ and the TEJ in the middle and upper troposphere, are better simulated when using the Grell convection scheme compared to the other model simulations.
In the time evolution of simulations using the Grell convection scheme, rainfall matches well with the observed evolution, including the timing of the discontinuous northward jump of the main rainfall band in late June, although it is drier compared to the Mix1 and Emanuel convection scheme.
Over central Sahel and west Sahel, the mean annual cycle of precipitation and temperature, with the single-peak rainy season, is especially well captured in terms of timing despite the fact that all model simulations underestimated the magnitude. However, simulations using Mix1 better reproduce the annual cycle of precipitation compared to the other schemes.
Over Guinea coast, the Mix1 and Tiedtke model simulations failed to reproduce the double-peak rainy seasons, while the Emanuel, Grell and Mix2 simulations reproduce them well but underestimate their amplitude. The bimodal nature of rainfall associated with the Guinea subregion is not so well defined when averaging rainfall over the entire West African domain. This emphasizes the importance of separating regions into homogeneous precipitation subregions for evaluation analyses.
The mean annual cycle of temperature is reproduced well in simulation when using the Tiedtke convection scheme throughout the year over the subregions and the entire West African domain compared to the other model simulations.
As a more advanced package compared to the previous version of RegCM with BATS, CLM4.5 can be considered as the primary land surface process option in RegCM4. Therein, the use of the Emanuel scheme is recommended over the West African region. We plan to use this configuration in long-term multi-decadal simulations to further evaluate the model capability to reproduce the mean climatology. To make this study more complete, we will examine the sensitivity of temperature and precipitation extremes simulated by RegCM4-CLM4.5 to different convective schemes.
Data from these simulations are shared for free on request via email to arona.diedhiou@ird.fr.
BK conducted this research under the supervision of AD and NET. MBS, FG and SA were the advisors. Methodology and original draft preparation: BK, AD and and NET. Writing, review and editing: MBS, FG, SA, AB and ATK.
The authors declare that they have no conflict of interest.
This work is dedicated to the memory of Prof. Abdourahamane Konaré with
whom we started this assessment. The authors thank the Institute of Research
for Development (IRD, France) and the Institute of Geosciences for Environment
(IGE, University Grenoble Alpes) for providing the facility (the Regional
Climate Modelling Platform) to perform these simulations and the IT support
funded by an IRD/PRPT contract at the University Felix Houphouet Boigny
(Abidjan, Côte d'Ivoire). The authors are grateful to all students,
technicians, engineers and researchers involved at ICTP (Abdus Salam
International Centre of Theoretical Physics; Trieste, Italy) in the
development and improvement of the regional climate model RegCM. The
research leading to this publication is co-funded by the NERC/DFID “Future
Climate for Africa” program under the AMMA-2050 project, grant number
NE/M019969/1, and by IRD (Institut de Recherche pour le Développement;
France) grant number UMR IGE imputation 252RA5.
Edited by: Zhenghui Xie
Reviewed by: two anonymous referees
Abiodun, B. J., Adeyewa, Z. D., Oguntunde, P. G., Salami, A. T., and Ajayi, V. O.: Modeling the impacts of reforestation on future climate in West Africa, Theor. Appl. Climatol., 110, 77–96, 2012.
Adeniyi, M. O.: Sensitivity of different convective schemes in RegCM4.0 for simulation of precipitation during the Septembers of 1989 to 1998 over West Africa. Theor. Appl. Climatol., 115, 305–322, https://doi.org/10.1007/s00704-013-0881-5, 2014.
Ali, S., Dan, L., Fu, C. B., and Yang, Y.: Performance of convective parameterization schemes in Asia using RegCM: Simulations in three typical regions for the period 1998–2002, Adv. Atmos. Sci., 32, 715–730, https://doi.org/10.1007/s00376-014-4158-4, 2015.
Arakawa, A. and Schubert, W. H.: Interaction of a cumulus cloud ensemble with the large scale environment Part I, J. Atmos. Sci., 31, 674–701, 1974.
Bhatla, R., Ghosh, S., Mandal, B., Mall, R. K., and Sharma, K.: Simulation of Indian summer monsoon onset with different parameterization convection schemes of RegCM-4.3, Atmos. Res., 176, 10–18, https://doi.org/10.1016/j.atmosres.2016.02.010, 2016.
Browne, N. A. K. and Sylla, M. B.: Regional climate model sensitivity to domain size for the simulation of the West African monsoon rainfall, Int. J. Geophys., 625831, https://doi.org/10.1155/2012/625831, 2012.
Brutsaert, W.: Evaporation into the atmosphere: theory, history and applications, USA, Reidel Himgham Mass, 299 pp, 1982.
Charney, J. G.: Dynamics of deserts and drought in the Sahel, Q. J. Roy. Meteorol. Soc., 101, 193–202, 1975.
Cook, K. H.: Generation of the African easterly jet and its role in determining West African precipitation, J. Climate, 12, 1165–1184, https://doi.org/10.1175/1520-0442(1999)012<1165:GOTAEJ>2.0.CO;2, 1999.
Dee, D. P., Uppala, S. M., Simmons, A. J., Berrisford, P., Poli, P., Kobayashi, S., Andrae, U., Balmaseda, M. A., Balsamo, G., Bauer, P., Bechtold, P., Beljaars, A. C. M., van de Berg, L., Bidlot, J., Bormann, N., Delsol, C., Dragani, R., Fuentes, M., Geer, A. J., Haimberger, L., Healy, S. B., Hersbach, H., Hólm, E. V., Isaksen, L., Kållberg, P., Köhler, M., Matricardi, M., McNally, A. P., Monge-Sanz, B. M., Morcrette, J.-J., Park, B.-K., Peubey, C., de Rosnay, P., Tavolato, C., Thépaut, J.-N., and Vitart, F.: The ERA-Interim reanalysis: configuration and performance of the data assimilation system, Q. J. Roy. Meteorol. Soc., 137, 553–597, https://doi.org/10.1002/qj.828, 2011.
Diallo, I., Sylla, M. B., Camara, M., and Gaye, A. T.: Interannual variability of rainfall over the Sahel based on multiple regional climate models simulations, Theor. Appl. Climatol., https://doi.org/10.1007/s00704-012-0791-y, 2013.
Dickinson, R., Henderson-Sellers, A., and Kennedy, P.: Biosphere-Atmosphere Transfer Scheme (BATS) Version 1eas Coupled to the NCAR Community Climate Model, NCAR Technical Note, NCAR/TN-387+ STR, 72 pp, 1993.
Diedhiou, A., Janicot, S., Viltard, A., De Felice, P., and Laurent, H.: Easterly wave regimes and associated convection over West Africa and tropical Atlantic: Results from the NCEP/NCAR and ECMWF reanalyses, Clim. Dynam., 15, 795–822, 1999.
Djiotang Tchotchou, L. A. and Mkankam Kamga, F.: Sensitivity of the simulated African monsoon of summers 1993 and 1999 to convective parameterization schemes in RegCM3, Theor. Appl. Climatol., 100, 207–220, 2010.
Emanuel, K.: A Scheme for Representing Cumulus Convection in Large-Scale Models, J. Atmos. Sci., 48, 2313–2329, 1991.
Emanuel, K. A. and Zivkovic-Rothman, M.: Development and evaluation of a convection scheme for use in climate models, J. Atmos. Sci., 56, 1766–1782, 1999.
Feddema, J. J., Oleson, K. W., Bonan, G. B., Mearns, L. O., Buja, L. E., Meehl, G. A., and Washington, W. M.: The importance of land-cover change in simulating future climates, Science, 310, 1674–1678, 2005.
Fritsch, J. M. and Chappell, C. F.: Numerical prediction of convectively driven mesoscale pressure systems, Part I: Convective parameterization, J. Atmos. Sci., 37, 722–1733, 1980.
Gao, X., Shi, Y., Zhang, D., Wu, J., Giorgi, F., Ji, Z., and Wang, Y: Uncertainties in monsoon precipitation projections over China: results from two high-resolution RCM simulations, Clim. Res., 52, 213–226, https://doi.org/10.3354/cr01084, 2012.
Gao, X.-J., Shi, Y., and Giorgi, F.: Comparison of convective parameterizations in RegCM4 experiments over China with CLM as the land surface model, Atmos. Ocean. Sci. Lett., 9, 246–254, https://doi.org/10.1080/16742834.2016.1172938, 2016.
Gbobaniyi, E., Sarr, A., Sylla, M. B., Diallo, I., Lennard, C., Dosio, A., Dhiédiou, A., Kamga, A., Klutse, N. A. B., Hewitson, B., Nikulin, G., and Lamptey, B.: Climatology, annual cycle and interannual variability of precipitation and temperature in CORDEX regional climate models simulation over West Africa, Int. J. Climatol., 34, 2241–2257, https://doi.org/10.1002/joc.3834, 2013.
Giorgi, F., Coppola, E., Solmon, F., Mariotti, L., Sylla, M. B., Bi, X., Elguindi, N., Diro, G. T., Nair, V., Giuliani, G., Cozzini, S., Guettler, I., O'Brien, T., Tawfik, A., Shalaby, A., Zakey, A. S., Steiner, A., Stordal, F., Sloan, L., and Brankovic, C.: RegCM4: model description and preliminary tests over multiple CORDEX domains, Clim. Res., 52, 7–29, https://doi.org/10.3354/cr01018, 2012.
Grell, G., Dudhia, J., and Stauffer, D. R.: A description of the fifth generation Penn State/NCAR Mesoscale Model (MM5), National Center for Atmospheric Research Tech Note NCAR/TN-398+STR, NCAR, Boulder, CO, 1994.
Grell, G.: Prognostic Evaluation of Assumptions Used by Cumulus Parameterizations, Mon. Weather Rev., 121, 764–787, 1993.
Halder, S., Dirmeyer, P., and Saha, K.: Sensitivity of the Mean and Variability of Indian Summer Monsoon to Land Surface Schemes in RegCM4: Understanding Coupled Land-Atmosphere Feedbacks, J. Geophys. Res., 120, 9437–9458, 2015.
Harris, I., Jones, P. D., Osborn, T. J., and Lister, D. H.: Updated high-resolution grids of monthly climatic observations, Int. J. Climatol., 34, 623–642, https://doi.org/10.1002/joc.3711, 2013.
Holtslag A., De Bruijn E., and Pan, H. L.: A high resolution air mass transformation model for short-range weather forecasting, Mon. Weather Rev., 118, 1561–1575, 1990.
Huffman, G. J., Adler, R. F., Bolvin, D. T., Gu, G., Nelkin, E. J., Bowman, K. P., Hong, Y, Stocker, E. F., and Wolff, D. B.: The TRMM multisatellite precipitation analysis: quasi-global, multi-year, combined-sensor precipitation estimates at fine scale, J. Hydrometeorol., 8, 38–55, 2007.
Hourdin, F., Musat, I., Guichard, F., Ruti, P. M., Favot, F., Filiberti, M. A., Pham, M., Grandpeix, J. Y., Polcher, J., Marquet, P., Boone, A., Lafore, J. P., Redelsperger, J. L., Dell'aquila, A., Doval, T. L., Traore, A. K., and Gallée, H.: AMMA-model intercomparison project, B. Am. Meteorol. Soc., 91, 95–104, 2010.
Im, E., Ahn, J., Remedio, A., and Kwon, W. T.: Sensitivity of the Regional Climate of East/Southeast Asia to Convective Parameterizations in the RegCM3 Modelling System, Part 1: Focus on the Korean Peninsula, Int. J. Climatol., 28, 1861–1877, 2008.
IPCC: Climate Change 2007: The Physical Science Basis, Contribution of Working group I to the Fouth Assessment Report of the Intergovernmental Panel on Climate Change, edited by: Solomon, S., Qin, D., Manning, M., Chen, Z., Marquis, M., Averyth, K. B., Tignor, M., Miller, H. L., Cambridge University Press, Cambridge, UK, 996 pp, 2007.
Janicot, S., Caniaux, G., Chauvin, F., de Coetlogon, G., Fontaine, B., Hall, N., Killadis, G., Lafore, J.-P., Lavaysse, C., Lavender, S. L., Leroux, S., Marteau, R., Mounier, F., Philippon, N., Roehrrig, R., Sultan, B., Taylor, C. M.: Intraseasonal variability of the West African monsoon, Atmos. Sci. Lett., 12, 58–66, https://doi.org/10.1002/asl.280, 2011.
Kain, J. S. and Fritsch J. M.: A one-dimensional entraining/detraining plume model and its application in convective parameterization, J. Atmos. Sci., 47, 2784–2802, 1990.
Kain, J. S.: The Kain–Fritsch Convective Parameterization: An Update, J. Appl. Meteorol., 43, 170–181, 2004.
Kamga Foamouhoue, A., Buscarlet, E.: Simulation du climat de l'Afrique de l'Ouest à l'aide d'un modèle climatique régional: validation sur la période, 1961–1990, 2006.
Komkoua Mbienda, A. J., Tchawoua, C., Vondou, D. A., Choumbou, P., Kenfack Sadem, C., and Dey, S.: Sensitivity experiments of RegCM4 simulations to different convective schemes over Central Africa, Int. J. Climatol., https://doi.org/10.1002/joc.4707, 2016.
Kiehl, J. T., Hack, J. J., Bonan, G. B., Boville, B. A., Briegleb, B. P., Williamson, D. L., and Rasch, P. J.: Description of the NCAR Community Climate Model (CCM3), Technical Note NCAR/TN−420+STR, 152, 1996.
Konare, A., Zakey, A. S., Solmon, F., Giorgi, F., Rauscher, S., Ibrah, S., and Bi, X.: A regional climate modeling study of the effect of desert dust on the West African monsoon, J. Geophys. Res., 113, D12206, https://doi.org/10.1029/2007JD009322, 2008.
Meinke, I., Roads, J., and Kanamitsu, M.: Evaluation of RSM-simulated precipitation during CEOP, J. Meteorol. Soc. Jpn., 85, 145–166, 2007.
Mohr, K. I. and Thorncroft, C. D.: Intense convective systems in West Africa and their relationship to the African easterly jet, Q. J. Roy. Meteor. Soc., 132, 163–176, https://doi.org/10.1256/qj.05.55, 2006.
N'Datchoh, E. T., Diallo, I., Konaré, A., Silué, S., Ogunjobi, K. O., Diedhiou, A., and Doumbia, M.: Dust induced changes on theWest African summer monsoon features, Int. J. Climatol., 38, 452–466, https://doi.org/10.1002/joc.5187, 2017.
Nicholson, S. E.: The West African Sahel: a review of recent studies on the rainfall regime and its interannual variability, Meteorology, 453521, 32 p., https://doi.org/10.1155/2013/453521, 2013.
Nikulin, G., Jones, C., Samuelsson, P., Giorgi, F., Asrar, G., Büchner, M., Cerezo-Mota, R., Christensen, O. B., Déque, M., Fernandez, J., Hansler, A., van Meijgaard, E., Sylla, M. B., and Sushama, L.: Precipitation climatology in an ensemble of CORDEX-Africa regional climate simulations, J. Climate, 6057–6078, https://doi.org/10.1175/JCLI-D-11-00375.1, 2012.
Lawrence, D. M., Oleson, K. W., Flanner, M. G., Thornton, P. E., Swenson, S. C., Lawrence, P. J., Zeng, X., Y., Zong-liang, L. S., Sakaguchi, K. B., Gordon, B. S., and Andrew, G.: Parameterization improvements and functional and structural advances in version 4 of the Community Land Model, J. Adv. Model. Earth Syst., 3, M03001, https://doi.org/10.1029/2011MS000045, 2011.
Legates, D. R. and Willmott, C. J.: Mean seasonal and spatial variability in gauge-corrected, global precipitation, Int. J. Climatol., 10, 111–127, 1990.
Leung, L. R., Zhong, S., Qian, Y., and Liu, Y.: Evaluation of regional climate simulations of the 1998 and 1999 East Asian summer monsoon using the GAME/HUBEX observational data, J. Meteorol. Soc. Japan. Ser. II, 82, 1695–1713, 2004.
Loveland, T. R., Reed, B. C., Brown, J. F., Ohlen, D. O., Zhu, J., Yang, L., and Merchant, J. W.: Development of a global land cover characteristics database and IGBP DISCover from 1-km AVHRR Data, Int. J. Remote. Sens., 21, 1303–1330, 2000.
Martinez-Castro, D., da Rocha, R. P., Bezanilla-Morlot, A., Alvarez-Escudero, L., Reyes-Fernández, J. P., Silva-Vidal, Y., and Arritt, R. W.: Sensitivity studies of the RegCM3 simulation of summer precipitation, temperature and local wind field in the Caribbean Region, Theor. Appl. Climatol., 86, 5–22, https://doi.org/10.1007/s00704-005-0201-9, 2006.
Oleson, K. W, Niu, G.-Y., Yang, Z.-L., Lawrence, D. M., Thornton, P. E., Lawrence, P. J., Stöckli, R., Dickinson, R. E., Bonan, G. B., Levis, S., Dai, A., and Qian, T.: Improvements to the Community Land Model and Their Impact on the Hydrological Cycle, J. Geophys. Res., 113, G01021, https://doi.org/10.1029/2007JG000563, 2008.
Oleson, K. W., Lawrence, D. M., Bonan, G. B., Drewniak, B., Huang, M., Koven, C. D., Levis, S., Li, F., Riley, W. J., Subin, Z. M., Swenson, S. C., Thornton, P. E., Bozbiyik, A., Fisher, R., Heald, C. L., Kluzek, E., Lamarque, J.-F., Lawrence, P. J., Leung, L. R., Lipscomb, W., Muszala, S., Ricciuto, D. M., Sacks, W., Sun, Y., Tang, J., and Yang Z.-L.: Technical description of version 4.5 of the Community Land Model (CLM). NCAR technical note NCAR/TN-503+STR, National Center for Atmospheric Research, Boulder, 2013.
Paeth, H. and Hense, A.: SST versus climate change signals in West African rainfall: 20th-century variations and future projections, Clim. Change, 65, 179–208, 2004.
Paeth, H., Girmes, R., Menz, G., and Hense, A.: Improving seasonal forecasting in the low latitudes, Mon. Weather Rev., 134, 1859–1879, 2006.
Paeth, H., Hall, N. M., Gaertner, M. A., Alonso, M. D., Moumouni, S., Polcher, J., Ruti, P. M., Fink, A. H., Gosset, M., Lebel, T., Gaye, A. T., Rowell, D. P., Moufouma-Okia, W., Jacob, D., Rockel, B., Giorgi, F., and Rummukainen, M.: Progress in regional downscaling of West African precipitation, Atmos. Sci. Lett., 12, 75–82, 2011.
Pal, J. S., Small, E. E., and Elthair, E. A.: Simulation of regionalscale water and energy budgets: representation of subgrid cloud and precipitation processes within RegCM, J. Geophys. Res., 105, 29579–29594, 2000.
Pal, J. S., Giorgi, F., Bi, X., Elguindi, N., Solomon, F., Gao, X., Francisco, R., Zakey, A., Winter, J., Ashfaq, M., Syed, F., Bell, J. L., Diffanbaugh, N. S., Kamacharya, J., Konare, A., Martinez, D., da Rocha, R. P., Sloan, L. C., and Steiner, A.: The ICTP RegCM3 and RegCNET: regional climate modeling for the developing world, B. Am. Meteor. Soc., 88, 1395–1409, 2007.
Reynolds, R. W. and Smith, T. M.: Improved global sea surface temperature analysis using optimum interpolation, J. Climate, 7, 929–948, 1994.
Simmons, A. S., Uppala, D. D., and Kobayashi, S.: ERA-interim: new ECMWF reanalysis products from 1989 onwards, ECMWF Newsl., 110, 29–35, 2007.
Singh, A. P., Singh, R. P., Raju, P. V. S., and Bhatla, R.: Comparison of three different cumulus parameterization schemes on Indian summer monsoon circulation, Int. J. Ocean Clim. Syst., 2, 27–43, 2011.
Smith, S. D.: Coefficients for sea surface wind stress, heat flux, and wind profiles as a function of wind speedand temperature, J. Geophys. Res., 93, 15467–15472, 1988.
Soden, B. J. and Held, I. M.: An assessment of climate feedbacks in coupled ocean–atmosphere model, J. Climate, 19, 3354–3360, 2006.
Solmon, F., Giorgi, F., and Liousse, C.: Aerosol modeling for regional climate studies: application to anthropogenic particles and evaluation over a European/African domain, Tellus B, 58, 51–72, 2006.
Srinivas, C. V., Hariprasad, D., Rao, D. V. B., Anjaneyulu, Y., Baskaran, R., and Venkataraman, B.: Simulation of the Indian summer monsoon regional climate using advanced research WRF model, Int. J. Climatol., 33, 1195–1210, 2013.
Steiner, A., Pal, J., Rauscher, S., Bell, J., Diffenbaugh, N., Boone, A., Sloan, L., and Giorgi, F.: Land Surface Coupling in Regional Climate Simulations of the West African Monsoon, Clim. Dynam., 33, 869–892, 2009.
Sultan, B. and Janicot, S.: Abrupt shift of the ITCZ over West Africa and intra-seasonal variability, Geophys. Res. Lett., 27, 3353–3356, 2000.
Sultan, B., Janicot, S., and Diedhiou, A.: The West African monsoon dynamics, Part I: Documentation of intraseasonal variability, J. Climate, 16, 3389–3406, 2003.
Sultan, B. and Janicot, S.: The West African monsoon dynamics, Part II: The “preonset” and “onset” of the summer monsoon, J. Climate, 16, 3407–3427, 2003.
Sundqvist, H. E., Berge, E., and Kristjansson, J. E.: The effects of domain choice on summer precipitation simulation and sensitivity in a regional climate model, J. Climate, 11, 2698–2712, 1989.
Sylla, M. B., Gaye, A. T., Pal, J. S., Jenkins, G. S., and Bi, X. Q.: High resolution simulations of West Africa climate using Regional Climate Model (RegCM3) with different lateral boundary conditions, Theor. Appl. Climatol., 98, 293–314, https://doi.org/10.1007/s00704-009-0110-4, 2009.
Sylla, M. B., Giorgi, F., Ruti, P. M., Calmanti, S., and Dell'Aquila, A.: The impact of deep convection on the West African summer monsoon climate: a regional climate model sensitivity study, Q. J. Roy. Meteorol. Soc., 137, 1417–1430, https://doi.org/10.1002/qj.853, 2011.
Sylla, M. B., Giorgi, F., and Stordal, F.: Large-scale origins of rainfall and temperature bias in high resolution simulations over Southern Africa, Clim. Res., 52, 193–211, https://doi.org/10.3354/cr01044, 2012.
Sylla, M. B., Giorgi, F., Coppola, E., and Mariotti, L.: Uncertainties in daily rainfall over Africa: assessment of observation products and evaluation of a regional climate model simulation, Int. J. Climatol., 33, 1805–1817, https://doi.org/10.1002/joc.3551, 2013a.
Sylla, M. B., Diallo, I., and Pal, J. S.: West African monsoon in state of the art regional climate models, in: Climate Variability Regional and Thematic Patterns, edited by: Tarhule, A., ISBN:980-953-307-816-3, 2013b.
Tadross, M. A., Gutowski, W. J. Jr, Hewitson, B. C., Jack, C., and New, M.: MM5 simulations of interannual change and the diurnal cycle of Southern African regional climate, Theor. Appl. Climatol., 86, 63–80, 2006.
Thorncroft, C. D. and Blackburn, M.: Maintenance of the African easterly jet, Q. J. R. Meteorol Soc., 125, 763–786, 1999.
Tiedtke, M.: A Comprehensive Mass Flux Scheme for Cumulus Parameterization in Large-scale Models, Mon. Weather Rev., 117, 1779–1800, 1989.
Uppala, S., Dee, D., Kobayashi, S., Berrisford, P., and Simmons, A.: Towards a climate data assimilation system: status update of ERA-interim, ECMWF Newsl., 15, 12–18, 2008.
Wang, G., Yu, M., Pal, J. S., Mei, R., Bonan, G. B., Levis, S., and Thornton, P. E.: On the development of a coupled regional climate vegetation model RCM-CLM-CN-DV and its validation its tropical Africa, Clim. Dynam, 46, 515–539, 2016.
Xue, Y., De Sales, F., Lau, K. M. W., Bonne, A., Feng, J., Dirmeyer, P., Guo, Z., Kim, K. M., Kitoh, A., Kumar, V., Poccard-Leclercq, I., Mahowald, N., Moufouma-Okia, W., Pegion, P., Rowell, D. P., Schemm, J., Schulbert, S., Sealy, A., Thiaw, W. M., Vintzileos, A., Williams, S. F., and Wu, M. L.: Intercomparison of West African Monsoon and its variability in the West African Monsoon Modelling Evaluation Project (WAMME) first model Intercomparison experiment, Clim. Dynam., 35, 3–27, https://doi.org/10.1007/s00382-010-0778-2, 2010.
Zakey, A. S., Solmon, F., and Giorgi, F.: Implementation and testing of a desert dust module in a regional climate model, Atmos. Chem. Phys., 6, 4687–4704, https://doi.org/10.5194/acp-6-4687-2006, 2006.
Zaroug, M. A. H., Sylla, M. B., Giorgi, F., Eltahir, E. A. B., and Aggarwal, P. K.: A sensitivity study on the role of the Swamps of Southern Sudan in the summer climate of North Africa using a regional climate model, Theor. Appl. Climatol., 113, 63–81, https://doi.org/10.1007/s00704-012-0751-6, 2012.
Zeng, X., Zhao, M., and Dickinson, R .E.: Intercomparison of bulk aerodynamic algorithms for the computation of sea surface fluxes using TOGA COARE and TAO DATA, J. Climate, 11, 2628–2644, 1998.