the Creative Commons Attribution 4.0 License.
the Creative Commons Attribution 4.0 License.
 | 26 Jun 2026
Regional impacts of irrigation on the atmospheric and terrestrial water cycle of the Iberian Peninsula in a climate model
Pierre Tiengou
Agnès Ducharne
Frédérique Cheruy
This study presents regional simulations over the Iberian Peninsula between 2010 and 2022 with the atmospheric (ICOLMDZ) and land surface (ORCHIDEE) components of the IPSL climate model in a new limited area model configuration (25 km resolution). It uses a recently developed river routing and irrigation scheme based on a water-conservative supply-and-demand approach. Two simulations, with and without irrigation, are compared to isolate the impacts of simulated irrigation on land-atmosphere interactions and the water cycle. First, an evaluation of the simulations is conducted to characterize existing model biases in river discharge, precipitation, evapotranspiration (ET) and surface soil moisture (SSM), and assess whether they can be improved by simulating irrigation. The simulated irrigation is too low in southern Spain because of a lack of available water in the reservoirs, and likely because of the absence of representation of river dams. In northern regions such as the Ebro Valley, the simulated irrigation is more realistic and reduces the biases of river discharge and ET in summer and autumn. In general, SSM is not strongly impacted by irrigation as most additional water is evaporated. Second, atmospheric changes induced by irrigation are studied in summer (JJA). Large atmospheric responses are found over intensely irrigated areas, mainly consisting of a shift in energy partitioning between the turbulent fluxes (increase in latent heat flux and decrease in sensible heat flux, up to 50 W m−2), and a lowering of the atmospheric boundary layer (−100 m) and of the lifting condensation level (−250 m). Increases in precipitation are statistically significant only over the mountainous areas surrounding the Ebro Valley, and are closely linked to increases in convective available potential energy. Finally, atmospheric moisture recycling over the Iberian Peninsula is identified by showing that the increase in ET in the presence of irrigation exceeds the amount of water added by irrigation. This is made possible by an increase in precipitation over land, although most of this increase is located in lightly irrigated areas rather than in intensively irrigated areas. These results point to remote atmospheric effects of irrigation and motivate further investigation into land-atmosphere coupling processes in the presence of irrigation in the IPSL model.
- Article
(16495 KB) - Full-text XML
- BibTeX
- EndNote


Physical processes at the interface between the soil surface and the lower atmosphere can influence meteorological and hydrological variables at various spatial and temporal scales, contributing to complex feedback loops. In areas where the transition regime described by Budyko (1956); Budyko and Miller (1974) is most frequent, soil moisture (SM) plays a central role in these processes as a strong driver of evapotranspiration (ET), which conditions the partitioning of energy at the interface between land and atmosphere (Betts and Ball, 1995; Seneviratne et al., 2010). The GLACE experiment used general circulation models (GCMs) to identify regions of strong land-atmosphere coupling between SM and precipitation, which were mostly found in semiarid transition regions (Koster et al., 2004). This was confirmed by other modelling studies that also identified various mechanisms through which land surface conditions can impact the atmosphere in these coupling hotspots, and metrics to quantify them (Dirmeyer, 2011; Santanello et al., 2018; Zou et al., 2023; Hay-Chapman and Dirmeyer, 2023). The GLACE-CMIP5 experiments (Seneviratne et al., 2013) extended these conclusions by highlighting the importance of this coupling in the response of climate and the water cycle to global warming in these hotspots (Berg et al., 2015). Moreover, some warm biases of the CMIP5 models (Christensen and Boberg, 2012; Mueller and Seneviratne, 2014) were linked to underestimations of SM (Al-Yaari et al., 2019) and partly attributed to the representation of land-atmosphere coupling processes (Cheruy et al., 2013, 2014; Williams et al., 2016; Ma et al., 2018). This investigation was pursued in the CMIP6 framework with the Land Surface, Snow and Soil moisture Model Intercomparison Project (LS3MIP, van den Hurk et al., 2016). The higher sensitivity of precipitation to changes in soil moisture in transition zones between wet and dry climates was confirmed, as well as the more intense response of 2 m temperature and precipitation to moisture changes under a strong climate change scenario (Catalano et al., 2021). In CMIP6 models, regional analyses found improvements in the representation of precipitation and soil moisture over the USA (Srivastava et al., 2020; Yuan et al., 2021), but excessive land-atmosphere coupling strength in East and Southern Africa (Mwanthi et al., 2024). Substantial model uncertainty on land surface conditions remains in CMIP6 models (Yuan et al., 2021) and the mean climate simulated by current climate models is still highly dependent on the representation of land processes (May, 2023; Zarakas et al., 2024), and of the atmospheric feedbacks they induce (Laguë et al., 2019). The importance of land surface description and its interactions with the atmosphere to properly represent energy partitioning and precipitation has been renewed for this generation of climate models (Devanand et al., 2020; Singh et al., 2024), justifying ongoing research on their understanding and improvement within models.
A great source of complexity in land-atmosphere processes comes from the spatial heterogeneity of SM, which may be derived from the diversity of vegetation, soil types, orographic features, and anthropogenic processes. In particular, in semiarid climates, artificial water inputs in irrigated fields create strong contrasts with the surrounding environment. Observational studies have shown that it increases the latent heat flux and decreases the sensible heat flux in irrigated areas (Rappin et al., 2022; Boone et al., 2025), leading to a moister and cooler atmosphere near the surface (Bonfils and Lobell, 2007; McDermid et al., 2023). In the American Midwest, Nocco et al. (2019) showed that such effects could impact the regional climate and even mask the rise in temperature induced by global warming. Regarding the impacts of irrigation on precipitation, two opposite processes are at play. In general, increases in SM and ET have been associated with increases in precipitation in both modelling and observational studies (Koster et al., 2003; Guo et al., 2006; Wei and Dirmeyer, 2012; Findell et al., 2011), constituting a positive feedback loop (moisture recycling, as presented in Eltahir and Bras, 1996). However, they can also lead to a stabilization of the atmospheric boundary layer (ABL), inhibiting vertical development and convection (Findell and Eltahir, 2003; Ek and Holtslag, 2004). In heterogeneous soil moisture conditions, this can lead to a negative feedback loop where convective rainfall is more likely to occur over drier soil patches. This negative spatial coupling was frequently noticed in observations (Taylor et al., 2012; Klein and Taylor, 2020), although Guillod et al. (2015) emphasized the importance of temporal variability, showing that precipitation over drier soils occurs more often when soils are moister than usual at the regional scale. Specific responses of precipitation to irrigation can be hard to disentangle from other signals in observations, but decreases in irrigated areas associated with concurrent increases in downwind regions have been observed in different contexts (DeAngelis et al., 2010; Alter et al., 2015; Szilagyi and Franz, 2020).
To analyse the atmospheric processes involved and isolate the impacts of irrigation, observational campaigns are often complemented by mesoscale modelling studies. The Great Plains irrigation experiment (GRAINEX, Rappin et al., 2021) measurements and simulations with the Weather Research and Forecasting (WRF) model revealed a lower ABL over irrigated areas (Lachenmeier et al., 2024), although land-atmosphere coupling metrics indicated that irrigated fields were more favourable to convection than non-irrigated ones during the day (Whitesel et al., 2024). A reduction of existing mesoscale slope-induced circulations in the presence of irrigation was identified (Rappin et al., 2022; Phillips et al., 2022), and Lawston-Parker et al. (2023) emphasized the need to account for soil moisture heterogeneities induced by irrigation in modelling studies. Held in the Ebro Valley (northern Spain) in July 2021, the Land surface Interactions with the Atmosphere over the Iberian Semiarid Environment campaign (LIAISE Boone, 2019) highlighted strongly contrasting ABL properties between an irrigated and a rain-fed site, separated by 14 km (Boone et al., 2025). They were partly attributed to a high impact of the contrasts induced by irrigation on the development of the ABL through the morning transition (Brooke et al., 2023). Mesoscale simulations without irrigation over the LIAISE study area exhibited strong limitations over irrigated areas (Jiménez et al., 2025), and near-surface conditions and vertical profiles over the area were greatly improved by representing irrigation (Lunel et al., 2024a; Udina et al., 2024). A lower, more stable ABL was identified over irrigated and surrounding areas (Udina et al., 2024), as well as a weakening of the regional sea-breeze regime due to irrigation (Lunel et al., 2024b). However, irrigation was not associated with a better representation of precipitation during the campaign which was mostly driven by large-scale processes (Udina et al., 2024). In various other contexts, mesoscale simulations with the WRF model showed that the representation of irrigation improves model performance, especially limiting warm biases (Qian et al., 2013; Yang et al., 2017; Qian et al., 2020; Liu et al., 2021). Over the American Great Plains, they identified a lowering of the boundary layer and lifting condensation level (Qian et al., 2013), and a reduction of the summertime precipitation deficit by increasing the frequency of mesoscale convective systems (Qian et al., 2020). In the Colorado River basin, Yang et al. (2017) showed an increase in precipitation linked to irrigation due to moisture recycling over the Sierra Nevada mountains, and similar processes of regional precipitation recycling were identified by Zhang et al. (2025) in the US Corn Belt region. Conversely, a negative feedback loop on precipitation in Saudi Arabia was described in Lo et al. (2021), with moisture convergence leading to increased precipitation in a remote area west of the irrigated region.
However, these mesoscale modelling studies are mostly limited to timescales smaller than a year or focused on a specific field campaign. Moreover, they rely on idealized representations of irrigation, usually forcing soil moisture to remain at field capacity in irrigated areas (as done with Meso-NH in Lunel et al., 2024a). In contrast, this work analyses regional impacts of irrigation on a multiyear timescale and relies on a water-conservative parametrization of irrigation, which allows a study of the full water cycle. The impacts of irrigation on global climate have been studied with such approaches in land-atmosphere coupled simulations, with regional effects mostly visible and analysed in irrigation hotspots such as India, Eastern China and the United States of America (USA) (Sacks et al., 2009; Puma and Cook, 2010; Pokhrel et al., 2012; Cook et al., 2015, 2020; Arboleda-Obando et al., 2025). However, in the CMIP6 framework, only three models included a representation of irrigation, and Al-Yaari et al. (2022) showed that they better captured the trends of several climate variables over irrigated regions. Compared to the mesoscale studies mentioned above, climate models use coarser resolutions and can not explicitly capture the surface heterogeneities created by irrigation. They use parametrizations to account for sub-grid heterogeneities, which have generally been identified as a major challenge for future climate models (Fisher and Koven, 2020). Such modelling choices can greatly influence the response of the atmosphere to changes in surface conditions (Alexander et al., 2022) and partly explain why the impacts of irrigation on climate are still not well constrained (de Vrese and Hagemann, 2018). Additional choices in the parametrization of irrigation itself have also been shown to affect model performance compared to observed surface fluxes (Yao et al., 2022), and to generate contrasting responses in groundwater levels and river flows (Leng et al., 2017). Therefore, efforts are currently being pursued to better account for the impacts of irrigation in climate models, as illustrated by the Irrigation Model Intercomparison Project (IRRMIP), which aims to compare the responses of models to various representations of irrigation (Yao et al., 2023).
This study investigates the regional impacts of irrigation on land-atmosphere coupling variables and the water cycle of the Iberian Peninsula over a decadal timescale. The impact of irrigation on climate has rarely been looked into in this region, even though it has been identified as very dependent on irrigation and subject to future climate disruptions, like the rest of the Mediterranean basin (Cook et al., 2020; Arboleda-Obando et al., 2025; IPCC, 2021). This work is based on two regional simulations (with and without irrigation) run between 2010 and 2022. It leverages a new limited area model configuration developed for the Institut Pierre-Simon Laplace climate model (IPSL-CM) to perform the first regional climate simulations with the land surface and atmospheric components of the global model, ORCHIDEE (Krinner et al., 2005; Cheruy et al., 2020) and ICOLMDZ (Dubos et al., 2015; Hourdin et al., 2020). This setup provides insight on the behaviour of the IPSL-CM components while running with a higher resolution (25 km) and lower computational costs than in global applications, unlocking the possibility to study coupling processes and regional specificities in detail on a multiyear timescale. It also paves the way for future comparisons of the model to measurements of the LIAISE campaign to analyse coupling processes and evaluate the IPSL-CM in irrigated areas.
Section 2 provides a detailed description of the modelling design and reference products used to evaluate the simulations. Section 3 presents an evaluation of irrigation volumes, river discharge, precipitation, ET, SM, and a comparison of the two simulations to isolate the effects of irrigation and analyse continental moisture recycling. Finally, Sect. 4 presents the conclusions, as well as a discussion of the limitations and future developments of this work.
2.1 ICOLMDZOR limited area model
This study uses the atmosphere and land surface components of the IPSL-CM, which has been a regular participant in CMIP, including CMIP6 (Boucher et al., 2020). The simulations are run with prescribed sea surface temperature and sea ice content from the Atmospheric Model Intercomparison Project (AMIP) dataset.
2.1.1 ICOLMDZ atmospheric model
The atmospheric component of the model is the association of the dynamical core DYNAMICO (Dubos et al., 2015), which uses an icosahedral grid, and the LMDZ6A physics version NPv6.2 used for CMIP6, with 79 vertical levels (Hourdin et al., 2020). The physics of the model are run every 15 min and include the following parametrizations:
-
a surface layer description based on Monin-Obukhov similarity theory (Monin and Obukhov, 1954). Turbulent fluxes are expressed using the specific humidity and temperature gradients between the surface and the lowest atmospheric level and the aerodynamic resistance. A neutral drag coefficient is computed from the surface roughness, and the formulations of Louis (1979) and King et al. (2001) are used to account for stability conditions;
-
an eddy-diffusivity mass flux (EDMF) scheme of boundary layer vertical transfer composed of a turbulent diffusion scheme based on Yamada (1983) with recent improvements described in Vignon et al. (2018), and a thermal plume model for shallow convection (Rio and Hourdin, 2008; Hourdin et al., 2019);
-
a mass-flux scheme for deep convection based on Emanuel's scheme (Emanuel, 1991; Grandpeix et al., 2004; Rio et al., 2013), with stochastic triggering (Rochetin et al., 2014a, b);
-
a parametrization of the cold pools created below cumulonimbus clouds by reevaporation of convective rainfall (Grandpeix et al., 2010; Grandpeix and Lafore, 2010);
-
a large scale condensation scheme based on a statistical distribution of the subgrid total water content, from which the cloud fraction and water contents are derived (Madeleine et al., 2020);
-
the radiative transfer model RRTM (Mlawer et al., 1997).
Regional simulations are run using a limited area model (LAM) configuration, which was first used and described in Raillard et al. (2024). Lateral boundary conditions for the LAM are read at each time step of the dynamics, and are taken from ERA5 reanalysis hourly values at 0.25° resolution (Hersbach et al., 2020). The LAM domain comprises 3 zones: a raw forcing zone that contains values directly given by the forcing, a transition zone where the model is nudged towards the forcing with decreasing strength, and a free zone at the centre of the domain where there is no direct influence of the lateral forcing. The outputs of the model are natively on a hexagonal grid but are interpolated to a more traditional longitude-latitude grid of similar resolution, to simplify posttreatment and comparisons to evaluation products.
2.1.2 ORCHIDEE land surface model
Water and energy budgets
The ICOLMDZ LAM is coupled to the ORCHIDEE v2.2 land surface model (LSM) (Krinner et al., 2005; Cheruy et al., 2020). The spatial grid of the LSM is the same as that of the LAM and the timestep is dictated by that of the atmospheric physics (15 mn). ORCHIDEE represents a 2 m soil column discretized along 11 vertical layers of increasing thickness. It computes the coupled water and energy budgets at the surface by simulating, among other processes, latent and sensible heat fluxes, surface runoff and water infiltration in the soil column, with a free drainage condition at the bottom. Each grid cell is assigned the dominant United States Department of Agriculture (USDA) soil texture according to the 5 arcmin resolution map from Reynolds et al. (2000). Vegetation is described using 15 plant functional types (PFTs) from a 0.1° resolution input map based on the Land Use Harmonization 2 (LUHv2) dataset (Hurtt et al., 2020; Lurton et al., 2020). In each grid cell, PFTs are clustered into 3 soil tiles, for bare soil, forests, and low vegetation (including C3 and C4 crops). The model computes a separate water budget for each soil tile but only one energy budget per grid cell, using a composite approach with aggregated parameters (roughness length, albedo, aridity factor) to compute surface temperature and turbulent fluxes. The variable for surface soil moisture (SSM) gives water content in the first 10 cm of soil for the entire grid cell. Snow is represented with three layers of varying density and thermal conductivity (Wang et al., 2013). The energy budget of the snowpack is computed, and when a layer's simulated temperature exceeds freezing, it is automatically reset to 0 °C in the snow, and the excess energy is used to melt snow. The resulting liquid water may then percolate through the snowpack or be refrozen. If it reaches the soil surface, it is integrated into the surface water budget, contributing to infiltration and runoff in the same manner as rainwater.
Routing scheme
River discharge is simulated using a routing scheme based on the one described in Ngo-Duc et al. (2007). This scheme solves horizontal water transfers on the digital elevation model (DEM) grid, here upscaled at a 2 km resolution from the MERIT DEM (Yamazaki et al., 2019). Each DEM grid cell contains three linear reservoirs that provide overland flow, groundwater flow and river flow. For each reservoir, the characteristic residence time of water in a grid cell depends on a fixed transfer coefficient and on the slope provided by the DEM. The surface runoff and drainage computed for each ORCHIDEE soil column are interpolated to the routing grid to feed the overland and groundwater reservoirs, respectively. Water from all three reservoirs flows into the river reservoir of the downstream grid cell. In this scheme, river reservoirs constitute the only means of grid-to-grid horizontal water transfer.
Irrigation
Irrigation is modelled using the scheme extensively described in Arboleda-Obando et al. (2024), which is based on a water-conservative supply-and-demand approach. It computes a moisture deficit by comparing SM in the upper layers of the ORCHIDEE soil column (64 cm, corresponding to the root zone) to a target SM described as a fraction of the SM at field capacity. In the default version of the global model, this target is set to 90 % of the SM at field capacity, but this parameter was calibrated on global average to reflect a wide variety of irrigation practices, including flooding in rice paddies. In the Iberian Peninsula, the irrigation methods are less water-intensive, and after calibrating the routing and irrigation schemes, the target value was adjusted to 60 % of the SM at field capacity (see Appendix A). This value had already been identified in Arboleda-Obando et al. (2024) as a more suitable value for irrigated areas with other methods than paddy irrigation, confirming its relevance for the study area. To avoid computing irrigation requirements on grid cells without plants, the SM deficit is set to zero if the leaf area index (LAI) is below a given threshold LAImin=0.1.
At each time step, the SM deficit is weighted by the irrigated fraction of each ORCHIDEE grid cell, based on the historical irrigation dataset (HID, Siebert and Döll, 2010) at 5 arcmin resolution, to define the irrigation requirement. This demand is then compared with the available water in the three reservoirs of the routing module. Only 90 % of the volume can be withdrawn from each reservoir to maintain a minimum environmental flow. This parameter value was selected after a sensitivity analysis in Arboleda-Obando et al. (2024) and found to have a much lower impact on withdrawals than the target SM parameter, so it was not tuned again for this study. Water is withdrawn preferentially from either surface water (overland and rivers) or groundwater depending on the nature of irrigation equipment, defined by the map of Siebert et al. (2010). It must be noted that although the original irrigation scheme from Arboleda-Obando et al. (2024) included the possibility to withdraw water from neighbouring grid cells to represent adduction systems, this option is not yet compatible with the new version of the routing scheme and was not used in this study. As a final step, the amount of water withdrawn from the reservoirs is added at the top of the ORCHIDEE soil column at the next time step for infiltration.
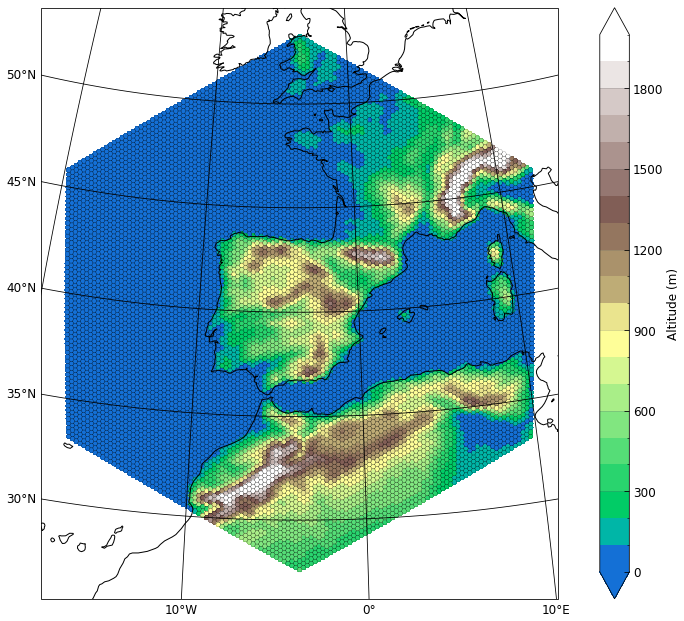
Figure 1Altitude (m) over the simulation domain on the native hexagonal grid.
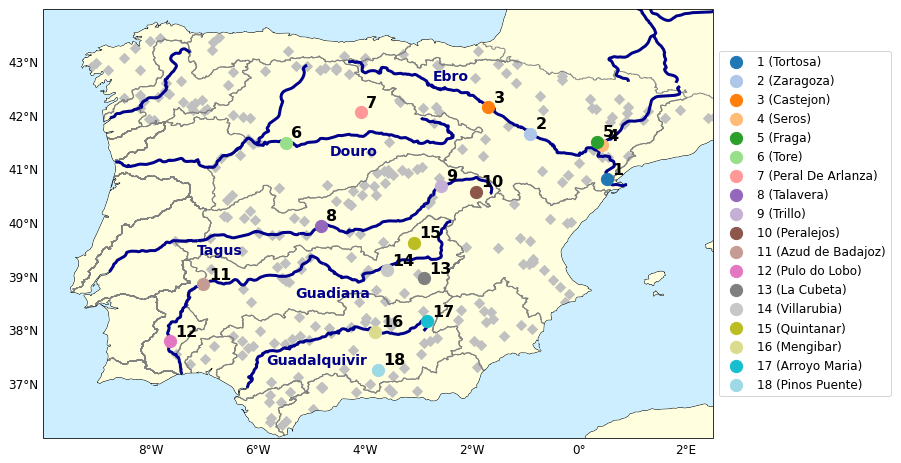
Figure 2Stations used for river discharge evaluation and major rivers of the Iberian Peninsula, with river basin district borders from the WISE WFD Reference Spatial Datasets reported under Water Framework Directive. Grey diamonds show river dams from FAO – Aquastat (2009).
2.2 Simulation setup
The Iberian Peninsula was chosen as the study region since it is a hotspot for irrigation in Europe, particularly in the Ebro Valley (north-eastern Spain, see Fig. 2). In addition, it is clearly bounded by the Atlantic Ocean, the Mediterranean Sea, and the Pyrenees mountain range in the north, which ensures that all watersheds are fully included in the simulation domain, making the regional study of the continental water cycle rather straightforward. Moreover, although it was not identified by Koster et al. (2004) as a region of strong coupling, probably owing to its small size relative to the resolution of the model used and to other identified hotspots, its semiarid climate should make it very sensitive to the influence of land-atmosphere coupling processes. Therefore, modifications of the SM heterogeneity patterns induced by irrigation are expected to have a clear influence on the local and regional climates.
To study this region, the LAM simulation domain is a hexagon (centred at 40.4° N, −3.7° E) with a radius of 1500 km (Fig. 1). The radius is composed of 60 grid cells, so the diameter of each cell is 25 km. The simulations are run for 13 years from 2010 to 2022, which enables capturing some interannual variability of the current climate, making the averages less sensitive to anomalies or biases from any single year or extreme event. Before this 13 year simulation, 3 years were run as a spin-up to allow for the hydrological and vegetation variables to reach a satisfactory equilibrium (see Appendix B for more details). Two simulations are run with the same setup except for the inclusion of irrigation. They are referred to as irr (with irrigation activated in ORCHIDEE) and no_irr (without irrigation). Considering the focus on land-atmosphere coupling, the analysis is restricted to the Iberian Peninsula, thus excluding ocean grid cells and the land grid cells north of the Pyrenees, which flow to France. To prevent mismatches between the simulations and the evaluation datasets because of different coastlines, the analysis is further reduced to grid cells where the continental fraction is greater than 95 % .
Rustemeier et al. (2020)Martens et al. (2017)Miralles et al. (2025)Dorigo et al. (2017)Gruber et al. (2019)Dari et al. (2023)Fekete (2003)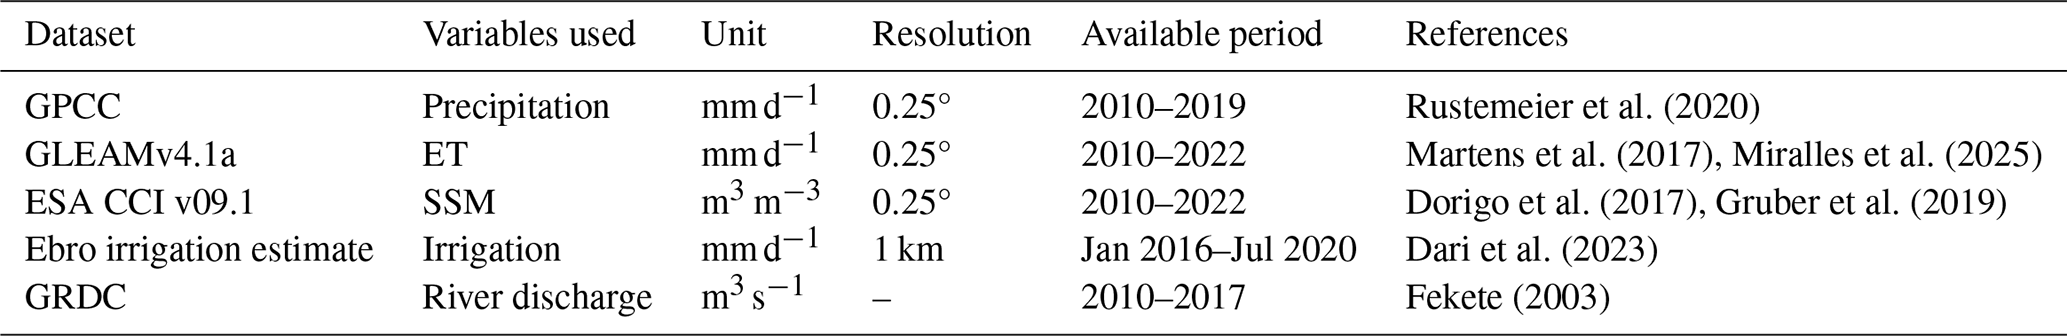
2.3 Evaluation datasets
The simulations are evaluated against the monthly mean values of the reference gridded products listed in Table 1. Precipitation data from the Global Precipitation Climatology Centre (GPCC) Full Data Monthly Product Version 2020 (Rustemeier et al., 2020) is used. This reanalysis product provides precipitation data until 2019 over land on a 0.25° × 0.25° grid using in situ rain gauges. For ET, the Global Land Evaporation Amsterdam Model (GLEAM) dataset is used, in its fourth version (Miralles et al., 2025). This product computes ET using a large set of input variables obtained from reanalyses as well as in situ and satellite observations. Monthly values at 0.25° resolution are used, initially given in mm per month but converted to mm d−1. GLEAM4 is available until 2022 but since precipitation and ET are evaluated jointly, it is only used over the availability period of GPCC data (2010–2019). The evaluation of surface soil moisture uses the European Space Agency Climate Change Initiative (ESA CCI, Dorigo et al., 2017; Gruber et al., 2019) COMBINED product, which merges multiple active and passive satellite remote sensing instruments in the microwave domain (Preimesberger et al., 2021) to provide daily SSM (in m3 m−3) at 0.25° resolution. This product contains low-quality flags (e.g. in the presence of snow, dense vegetation, or radio-frequency interference in the measurements) and an estimated uncertainty of the measurement. A screening of the data for the Iberian Peninsula over the period 2010–2022 was conducted, following the procedure described in Mizuochi et al. (2021). Data records with quality flags other than zero were excluded (representing 19 % of daily data records), as well as those with an uncertainty larger than 0.6 m3 m−3 (representing only 0.1 % of the remaining data records). The remaining daily values were then averaged to monthly time steps. Direct comparison of the CCI SSM product with the ORCHIDEE model is limited by the inherent differences in soil representation between ORCHIDEE and the LSM used to scale the satellite measurements (GLDAS-Noah), as analysed in Raoult et al. (2018). Therefore, a spatio-temporal normalization was applied following Mizuochi et al. (2021); Polcher et al. (2016) to compare statistically normalized values rather than absolute values:
where SSMnorm is the normalized SSM, and and σSSM are the mean and standard deviation, respectively, of the available SSM values over the Iberian Peninsula for all the considered monthly time steps. Similarly to ET, although the product is available until 2022, the evaluation was restricted to 2010–2019 to match the evaluation of precipitation, and the normalization is conducted over this period.
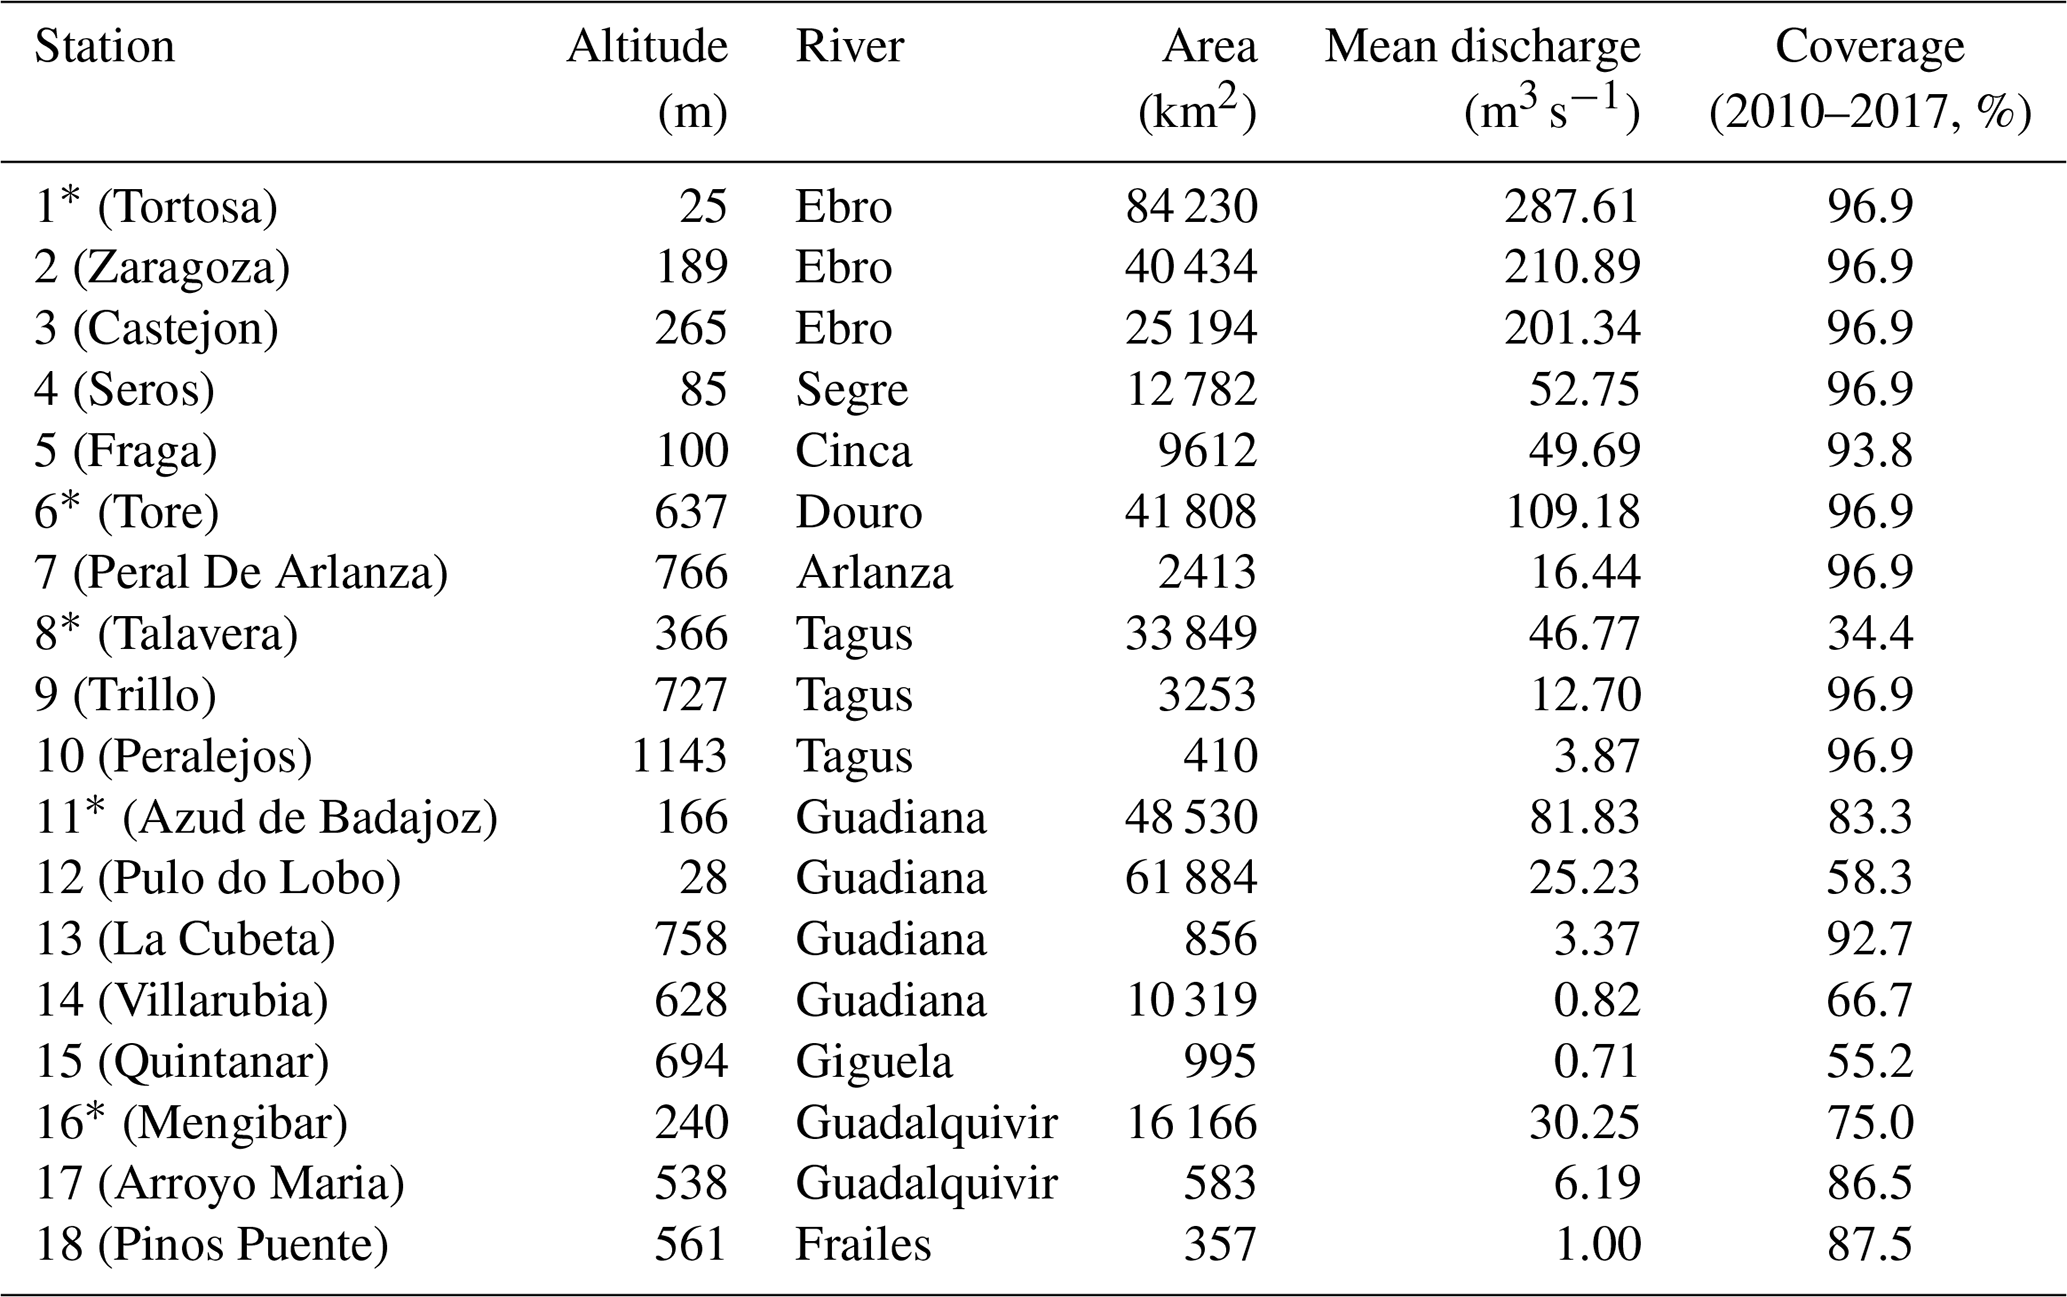
Irrigation is evaluated in the Ebro Valley region using a high-resolution remote sensing product from the European Space Agency (ESA) Irrigation+ project (Dari et al., 2023). This product estimates irrigation with a soil moisture based approach using satellite measurements from Sentinel-1, and provides data for three intensely irrigated areas: the Ebro Basin in Spain, the Po Valley in Italy and the Murray-Darling Basin in Australia. From 2016 to 2020 in the Ebro Basin, the median values of the RMSE, Pearson correlation coefficient r and bias are 12.4 mm over 14 d, 0.66, and −4.62 mm over 14 d, respectively. Weekly values are aggregated to a monthly average in mm d−1. The simulated river discharge is evaluated against monthly observation data from discharge stations of the Global Runoff Data Center (GRDC, https://grdc.bafg.de, last access: 14 May 2026, Fekete, 2003). Stations were positioned on the MERIT DEM grid with tools presented in Polcher et al. (2023), which use the GPS position of the stations as well as the upstream catchment area to find the most appropriate grid cell for comparison with the observations. The 18 selected stations with available data over the simulation period and an adequate position on the DEM grid are described in Table 2 and shown in Fig. 2. Most stations have available data from January 2010 to September 2017, and river discharge was therefore evaluated using the first eight years of simulation (2010–2017).
Table 2Characteristics of river discharge stations used for evaluation. Stations marked with * are the largest of the five major basins of the Peninsula, and are shown in Fig. 5.
2.4 Statistical significance
To assess the influence of irrigation on the model, the two simulations (irr and no_irr) are compared and a statistical significance test is used to filter out differences that may be the result of natural variability only. For the maps of changes induced by irrigation in Sect. 3.4, a Student t test is used to assess for each grid cell whether the mean difference between the two simulations (irr − no_irr) significantly differs from 0, with a p value of 0.05 as the limit to reject the null hypothesis. Grid cells with nonsignificant changes are partly hidden with hatches.
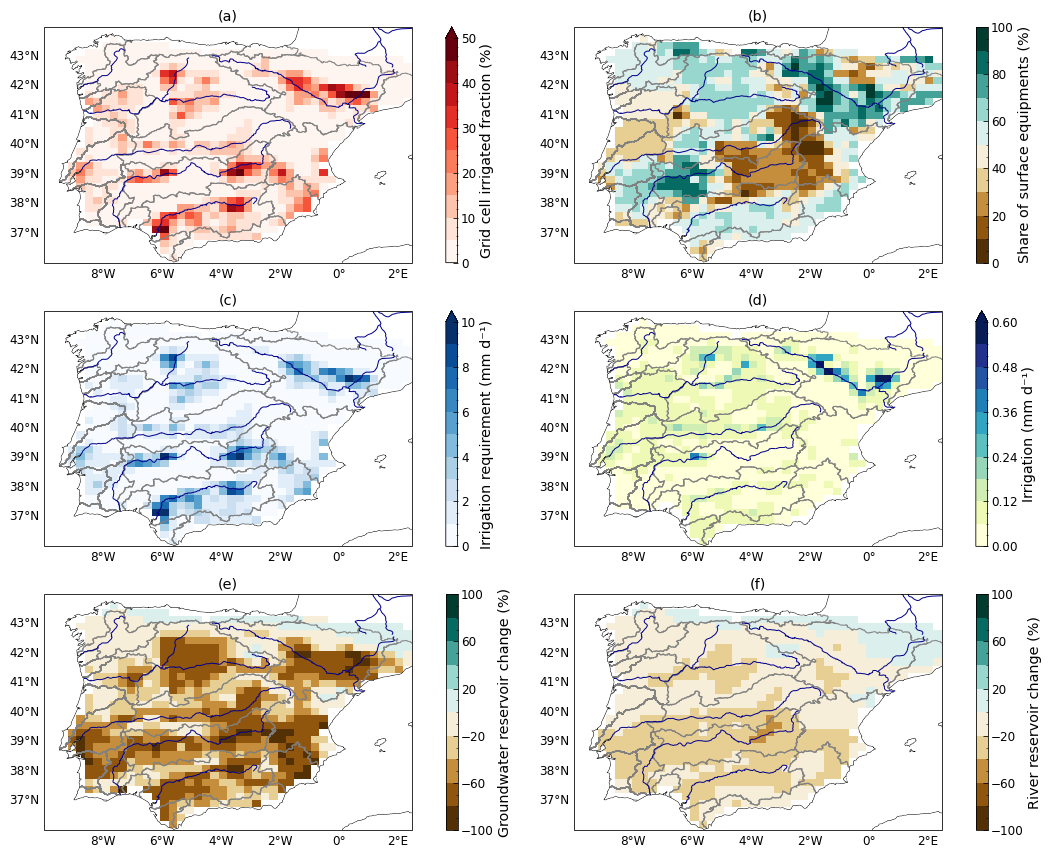
Figure 3Simulated irrigation and its drivers. Input maps of (a) grid cell irrigated fraction (%, derived from Hurtt et al., 2020) and (b) the share of irrigation equipment for surface withdrawals, as opposed to groundwater withdrawals (%, derived from Siebert et al., 2010). Annual means (2010–2022) of (c) simulated irrigation requirement (mm d−1), (d) irrigation (mm d−1), and relative changes (irr − no_irr, %) in water volumes in (e) groundwater and (f) river reservoirs.
3.1 Simulated irrigation
The computed irrigation demand (Fig. 3c) is highly dependent on the irrigated fraction (Fig. 3a) and much greater than the applied irrigation (Fig. 3d). This shows that irrigation is often constrained by water availability, with clear regional differences. Indeed, irrigation is much greater in the northern regions (Ebro and Douro river basins) than in southern regions (Guadiana and Guadalquivir basins) even though these regions have similar levels of irrigation demand (Fig. 3c, d). As shown in Fig. 3b, southern regions (Guadalquivir Basin, upper Guadiana Basin) are more dependent on groundwater equipment for irrigation water withdrawals than the Ebro Basin, where withdrawals are taken mainly from surface water (overland and river reservoirs in the model). Considering that the groundwater reservoir is much more depleted in the presence of irrigation than the river reservoir is (Fig. 3e, f), it is not surprising that the irrigation requirement cannot be met in these regions as much as it is in the north. This depletion can be explained by the fact that the groundwater reservoir can only be filled with drainage in the grid cell, whereas the river reservoir can be fed from upstream grid cells. It is also important to note that ORCHIDEE does not model deep groundwater storage, which is an important source of water for irrigation in southeastern Spain (Custodio et al., 2016).
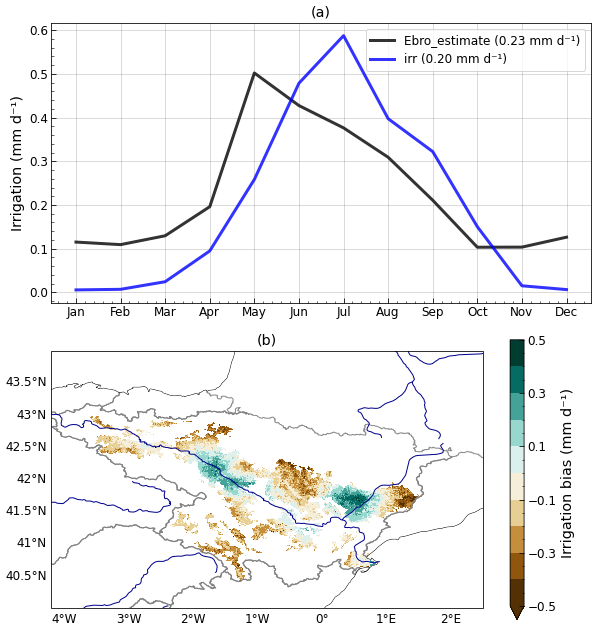
Figure 4Evaluation of simulated irrigation from January 2016 to July 2020 over the Ebro Valley. (a) Mean seasonal cycle of irrigation for the irr simulation and the remote sensing product (Ebro_estimate, mm d−1). Annual mean values are shown in the legend. (b) Mean bias compared with the product (mm d−1). The simulation outputs are interpolated on the grid of the remote sensing product.
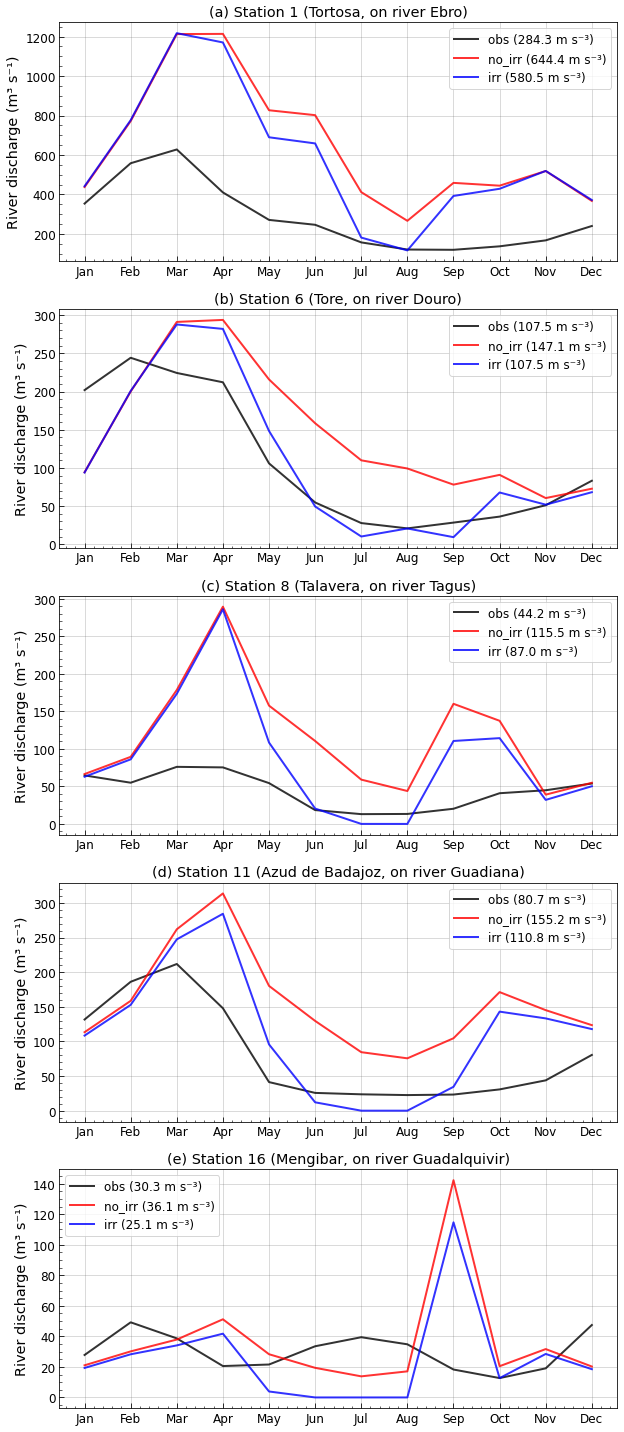
Figure 5Impacts of irrigation on river discharge. Mean seasonal cycle of river discharge (m3 s−1) in observations (black) and the no_irr (red) and irr (blue) simulations at five stations: (a) Tortosa (Ebro), (b) Tore (Douro), (c) Talavera (Tagus), (d) Azud de Badajoz (Guadiana), and (e) Mengibar (Guadalquivir). Annual mean values are shown in the legend. A mask is applied to the simulations to filter out months without corresponding observation data.
In the Ebro Basin, simulated irrigation is evaluated using the irrigation remote sensing product from Dari et al. (2023) with good overall performance, particularly in summer (Fig. 4a). In winter, the model simulates almost no irrigation since it requires a minimum LAI to be activated, whereas the product shows irrigation all year long, which can be explained by the presence of winter crops not represented in the model. A delay of the summer peak in the model compared with the product is noticeable, but the model might not be very far from actual irrigation since this product was found to be slightly ahead of actual irrigation based on benchmark volumes in some districts of the Ebro Valley (Fig. 5 in Dari et al., 2023). Spatially, the remote sensing product shows greater irrigation on the hillslopes than in the thalwegs, whereas the model simulates the opposite, with more intense irrigation next to the large rivers (Ebro, Segre, Cinca). The resulting bias pattern (Fig. 4b) can be explained by the fact that in the model, water is mainly withdrawn from the river reservoir in this region, which is much greater in grid cells holding a large river than in upper areas of the valley. In reality, infrastructures such as the Canal d'Urgell in the Segre basin (Farran, 2024), enable gravity irrigation of hillslopes by diverting water from large rivers to neighbouring croplands. Including a representation of water adduction in the irrigation scheme by enabling withdrawal from adjacent grid cells could be a way to improve this bias. Overall, the spatial biases of the simulated irrigation offset each other relatively well. Averaged over the subdomain where the satellite product provides values, the simulated irrigation is 0.20 mm d−1 while the product estimates it at 0.23 mm d−1.
3.2 Impacts of irrigation on river discharge
Figure 5 shows the average seasonal cycle of river discharge for the five largest rivers of the Peninsula (Ebro, Douro, Tagus, Guadiana, and Guadalquivir), for the two simulations and the GRDC observation data. The station with the greatest river discharge was selected for each river, to reflect integrated impacts of irrigation over the basin. A similar figure with all eighteen stations is presented in (Fig. C2). In most cases, the model shows a slight delay and a large overestimation of river discharge compared with observations, particularly in winter and spring. Snow melt does not seem to play a large role in the delay since it occurs rather concurrently with snowfall (Fig. F1a). These errors are most likely related to the precipitation biases of the simulations, described in the next section, and to the lack of river dams in the model, which have a strong impact on actual discharge, given their high density in the Iberian Peninsula (Fig. 2, Sabater et al., 2022; Morán-Tejeda et al., 2012; Lobera et al., 2015). In particular, the model overestimates the winter and spring discharge, a period when water is stored in dam reservoirs, which reduces the actual river flow. The presence of dams also leads to unnatural seasonal cycles in the observations if river discharge is artificially increased in summer by the release of stored water (Fig. 5e).
Table 3Station mean discharge (obs, m3 s−1), discharge bias (for the no_irr and irr simulations, in %), and change in evaluated metrics (irr − no_irr) for the RMSE (relative change in %), Pearson correlation coefficient r, Nash-Sutcliffe efficiency and Kling-Gupta efficiency. Model performance improvements when using irrigation are shown in bold. Stations marked with * are the largest of the five major basins of the Peninsula, and are shown in Fig. 5.
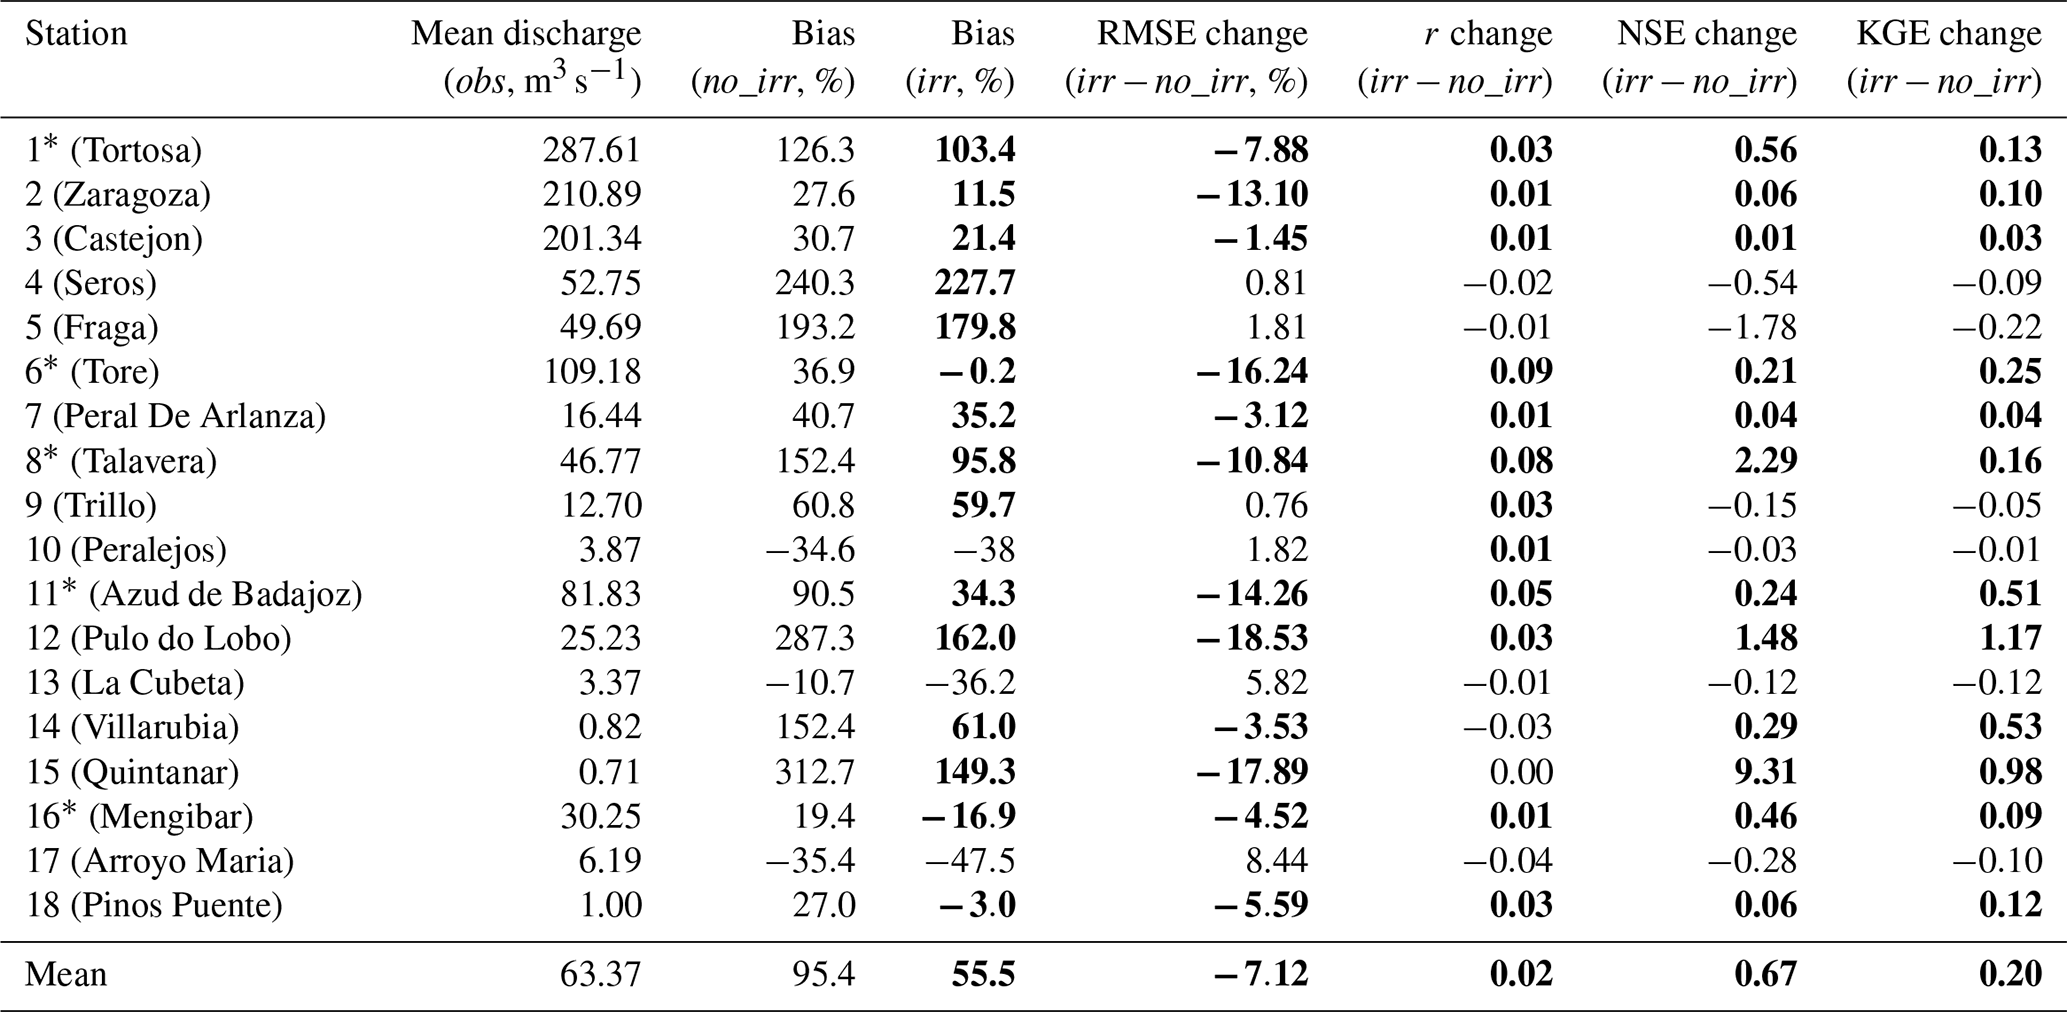
The simulation of irrigation used cannot improve either of these aspects since it does not include a specific reservoir to store water. Its impact becomes noticeable in spring, with water withdrawals resulting in lower discharge during summer and autumn, generally leading to a much better match with observations (Fig. 5). As shown in Table 3, for all fifteen stations where the mean bias is positive in the no_irr simulation, this bias is reduced in the presence of irrigation (in three cases it becomes negative but the absolute value is reduced). However, for the three stations where the no_irr bias is negative (no. 10, 13, 17), it is worsened in the irr simulation. On average, the irr simulation exhibits clear improvements of the mean bias (−41.8 %) and root mean square error (RMSE, −7.12 %). The Pearson correlation coefficient is 0.56 on average in no_irr and is slightly improved (+0.02), with mostly small changes except for stations 6 and 8 (+0.09 and +0.08). Improvements are also observed for Nash-Sutcliffe efficiency (NSE, +0.67) and Kling-Gupta efficiency (KGE, +0.2), mostly as a consequence of improvements in the mean bias. However, only eight out of eighteen stations have a positive value of NSE and KGE values in the no_irr simulation (not shown), limiting the relevance of this average increase. In particular, the average NSE value is strongly influenced by a few stations (no. 5, 8, 15) with initial NSE values below −10.
Overall, the performance is clearly improved for 12 stations but partly degraded for 6 stations, although three of them (no. 10, 13, 17) have a very small average discharge. This may explain why small changes in the model can lead to large changes in performance and limits their relevance compared with larger stations. If only stations with an average annual discharge greater than 10 m3 s−1 are considered, irrigation improves performance in nine out of twelve cases, and degrades it for three stations. One station (no. 9) exhibits an unexpected increase in the spring discharge peak which originates mostly from a single year (2011, see Fig. C1) and worsens an already-existing 250 % bias in this season. The other two (no. 4 and 5) are close to the Pyrenees Mountains and present very strong biases in both simulations (300 % overestimation in spring, unexpected double peak in March and June, Fig. C2). These discrepancies are likely related to biases in precipitation (discussed hereafter) and were not positively impacted by irrigation, apart from the mean bias. It must also be mentioned here that in the Pyrenees, snowfall represents up to 35 % of annual precipitation in the simulation (Fig. F1b) and largely contributes to river discharge in these two stations via snow melt.
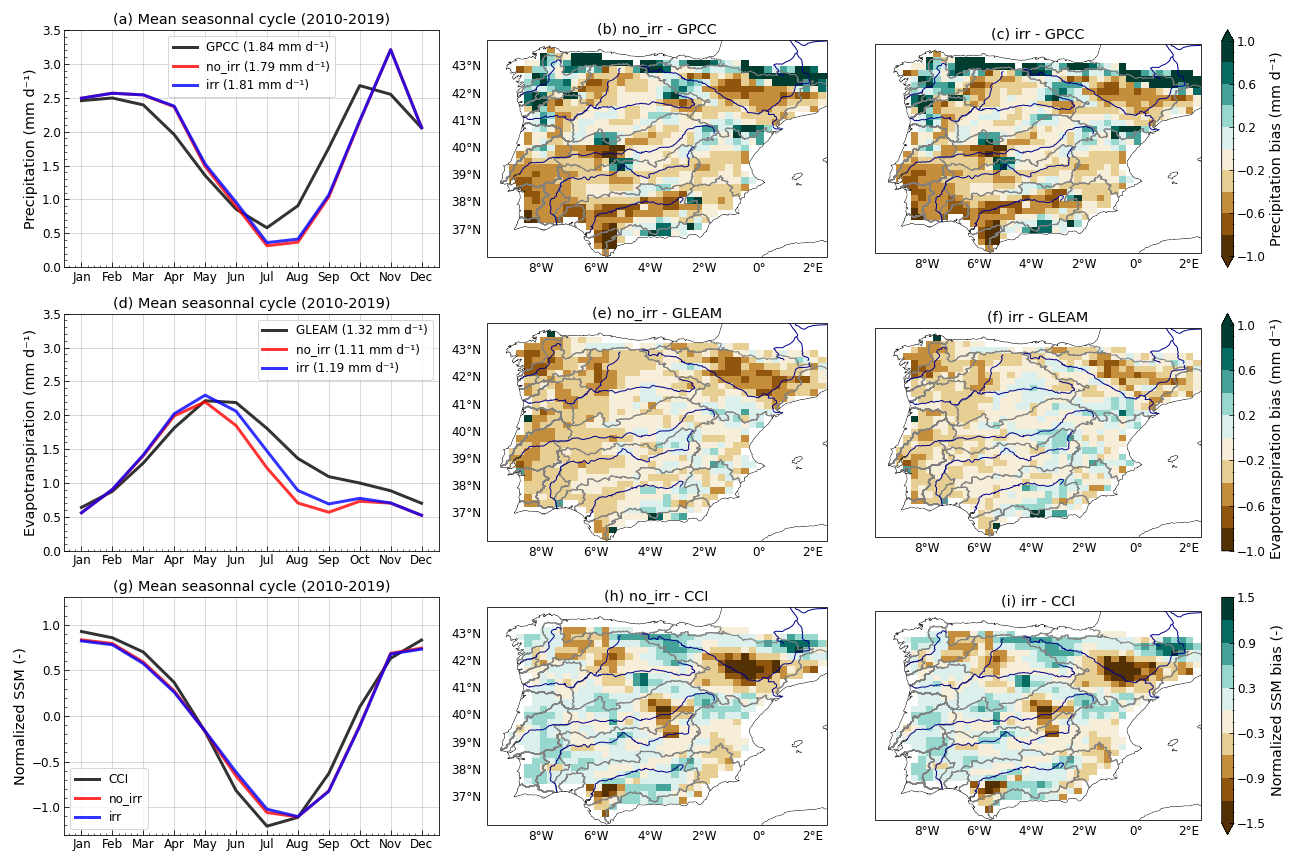
Figure 6Evaluation of simulated precipitation (P) and evapotranspiration (ET) over the Iberian Peninsula continental subdomain, from 2010 to 2019. (a) Mean seasonal cycle of P (mm d−1) for the two simulations and GPCC product (annual mean values are shown in the legend), annual mean P bias of the (b) no_irr and (c) irr simulations relative to the GPCC product (mm d−1). (d) Mean seasonal cycle of ET (mm d−1) for the two simulations and GLEAM4 product (annual mean values are shown in the legend), annual mean ET bias of the (e) no_irr and (f) irr simulations relative to the GLEAM4 product (mm d−1). (g) Mean seasonal cycle of normalized SSM for the two simulations and CCI product, annual mean normalized SSM bias of the (e) no_irr and (f) irr simulations relative to the CCI product.
3.3 Evaluation and influence of irrigation on precipitation, ET, and SSM
The simulated precipitation, ET, and normalized SSM are evaluated from 2010 to 2019 using the GPCC, GLEAM4 and CCI products, respectively (Fig. 6). On average over the domain, the two simulations present very similar seasonal cycles of precipitation. The model is in good agreement with GPCC until June (Fig. 6a), but presents a strong underestimation of precipitation in summer, followed by a delayed and overestimated peak in autumn. This peak is mostly the consequence of precipitation in mountainous regions such as the Pyrenees and the northern coast (see Fig. D1 for seasonal comparisons to GPCC) and is dominated by rainfall rather than snowfall (Fig. F1a). The delay in precipitation likely contributes to the biases of river discharge winter peaks visible in Fig. 5. This seasonal cycle is largely representative of the whole peninsula, although some spatial disparities persist. The two simulations exhibit very similar spatial patterns of annual mean precipitation, with a strong overestimation in elevated areas (Fig. 6b, c), which is a known bias of climate models (Arjdal et al., 2024; Adhikari et al., 2024). This is partly compensated by smaller underestimates of precipitation over large neighbouring areas, as seen in the Ebro Valley.
Both simulations match the GLEAM4 ET product well from January to May but underestimate ET for the rest of the year, particularly in summer (Fig. 6d). As expected, ET increases when irrigation is accounted for, particularly from May to September, which is the period where vegetation is the most developed and irrigation is the greatest. This partially alleviates the dry bias, but ET remains underestimated, even in the irr simulation. No similar patterns of biases between ET and incoming radiative fluxes were identified, and the remaining ET bias can be related to the underestimation of precipitation in the southwestern part of the Peninsula and in plains, such as the northern Ebro Valley (Fig. 6b, e). The biases in ET and precipitation are not consistent in the north-west of the Peninsula, which is explained by seasonal differences. Indeed, the overestimation of precipitation mostly occurs in winter and spring and does not strongly affect ET since soils are already wet in this season, whereas the underestimation of ET is dominated by summer (see appendix Figs. D1 and D2). Along large rivers, the ET underestimation almost disappears in the irr simulation (Fig. 6f). In contrast, the ET bias remains significant in lightly irrigated grid cells such as hillslopes, which is consistent with the limits of simulated irrigation described in Sect. 3.1 (Fig. 4).
The seasonal cycle of the normalized SSM matches the CCI product in both simulations (Fig. 6g). It is very similar in the two simulations, although in absolute value, SSM is slightly higher in summer in irr, and annual increases up to 11 % are visible in the most irrigated grid cells (Fig. E1a–b). Compared to the increase in ET, this indicates that the water added by irrigation is mostly evaporated, as will be further illustrated in Sect. 3.5 and Fig. 8. This confirms that the transition regime described by Budyko (1956) is dominant in the region. Spatial biases in normalized SSM compared with the CCI product are very similar in the two simulations and match the precipitation underestimation in the Ebro valley, Guadalquivir river mouth, and overestimation in the Pyrenees, but show a contrasting pattern in the West compared to precipitation and ET, due to a positive bias in summer (Fig. D3).
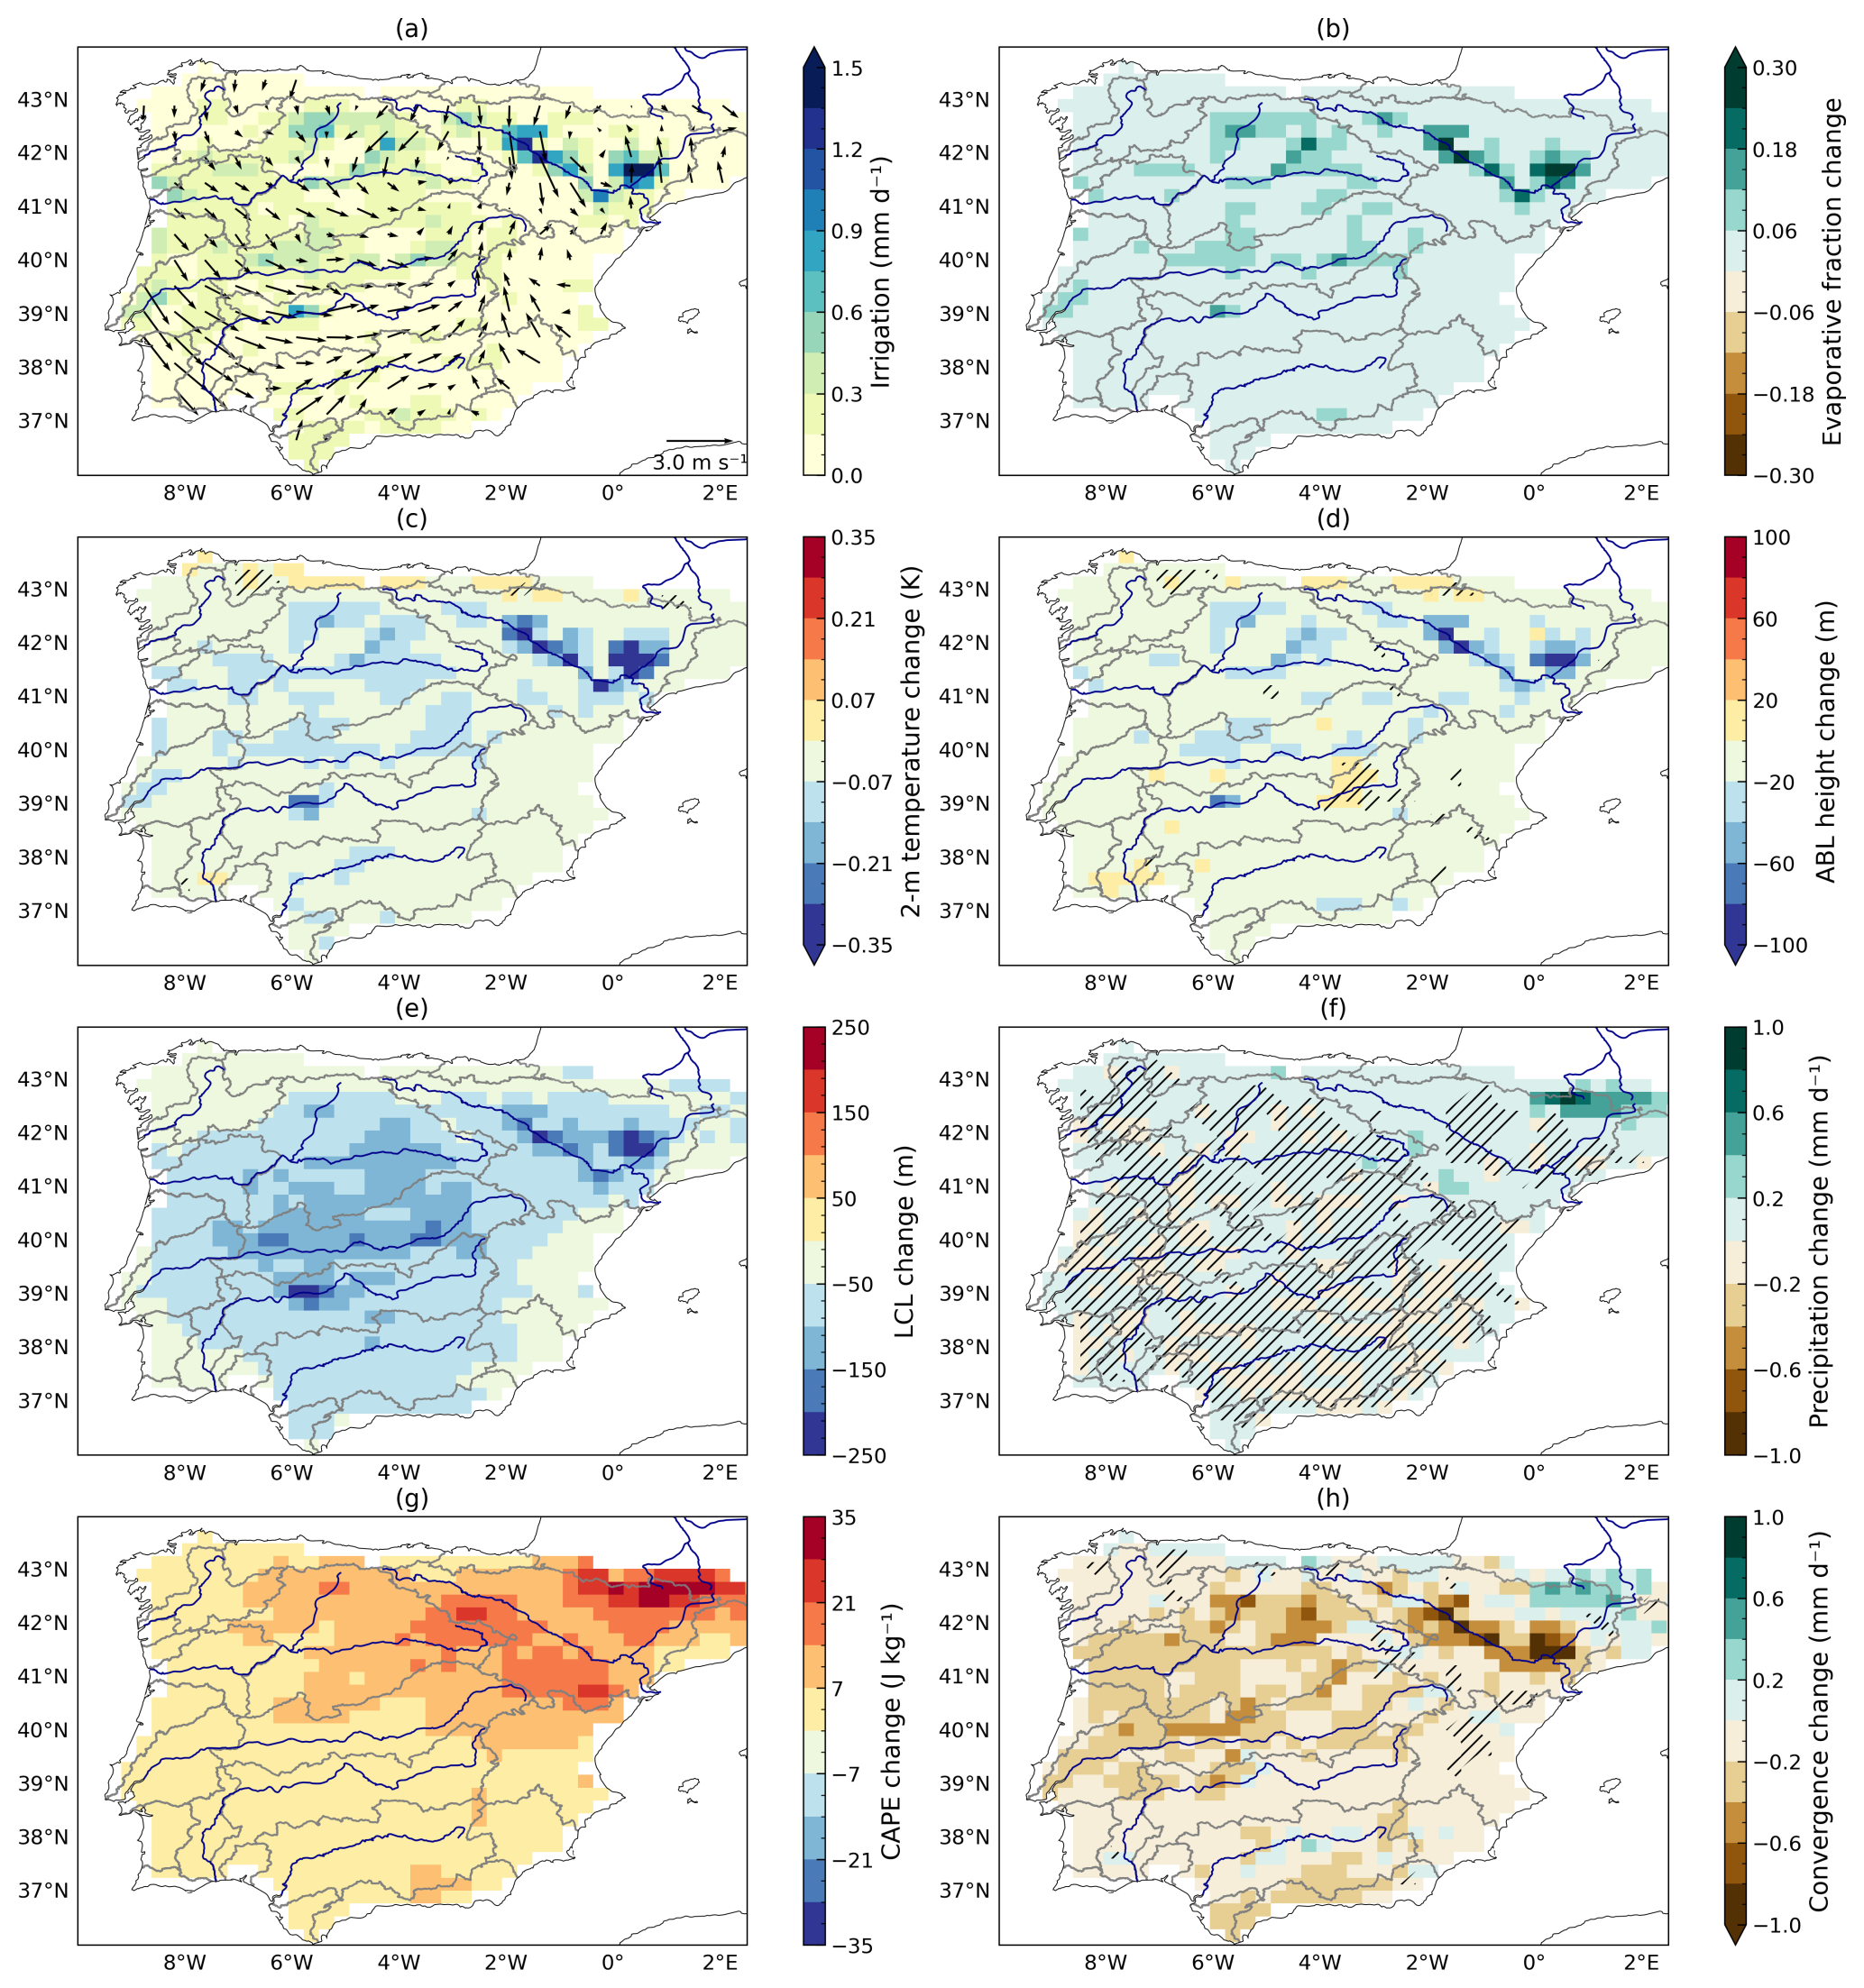
Figure 7Summer irrigation and its impacts (JJA, 2010–2022). (a) Irrigation (mm d−1) and 10 m wind (irr simulation). Mean changes in the presence of irrigation (irr − no_irr): (b) evaporative fraction, (c) 2 m temperature (K), (d) atmospheric boundary layer height (m), (e) lifting condensation level (m), (f) precipitation (mm d−1), (g) convective available potential energy (J kg−1), (h) moisture convergence (mm d−1). Hatching indicates areas where the change is not statistically significant.
3.4 Atmospheric impacts of irrigation in summer
Here, the impacts of irrigation on atmospheric variables are studied in summer (JJA) since it is the season with the highest levels of simulated irrigation, with seasonal mean values of up to 1.5 mm d−1 in the most intensely irrigated grid cells (Fig. 7a). In the presence of irrigation, the simulated latent heat flux (LE) increases across the entire Iberian Peninsula, by up to 50 W m−2 in the Ebro Valley. As expected from the surface energy partitioning, this is compensated by a decrease in the sensible heat flux (H), which is almost equivalent in irrigated areas and leads to large increases in the evaporative fraction () shown in Fig. 7b. When the sensible heat flux decreases, less energy is transmitted from the surface to the air, leading to a decrease in the 2 m air temperature which spatially matches the increase in EF. The order of magnitude remains low over most of the Peninsula, with the most important changes reaching −0.35 K in the Ebro Valley (Fig. 7c). The decreases in sensible heat flux and temperature also lead to a more stable boundary layer over most of the peninsula, but mostly in intensely irrigated areas where it is lowered by 100 m (Fig. 7d). Moreover, the presence of irrigation results in a moister lower atmosphere, with an average specific humidity over the Peninsula increasing by kg kg−1 in summer (+3.4 %) and maximal local increases in the Ebro Valley of kg kg−1 (+10 %). Since air temperature changes in the atmospheric column are rather small, the lowering of the lifting condensation level (LCL) reflects this atmospheric moistening very well. It is most marked in the Ebro Valley, where the LCL is lowered by 250 m (−13 %) in the most intensely irrigated grid cells, and remains significant even in areas where irrigation is low (Fig. 7e).
The lowering of the ABL and LCL theoretically favour opposite effects on precipitation. On the one hand, a lower and more stable ABL inhibits vertical mixing and convection, reducing the likelihood of cloud formation and deep convection initiation. On the other hand, if the LCL is lower, air parcels do not need to be lifted as high to condense, which increases the likelihood of cloud formation. Over the most intensely irrigated areas, ABL stabilization seems to dominate and inhibit convective development since no significant change in precipitation is observed. However, mountainous areas surrounding the Ebro Valley show significant increases in precipitation (Fig. 7f). This can be understood because ABL stabilization remains weak in these zones whereas humidity can still be increased if moisture is advected (Fig. 7d, e). In particular, the dominant wind patterns in the Ebro Valley (Fig. 7a) indicate that the additional atmospheric moisture from irrigated areas is driven towards the valley slopes, which is consistent with the increases in moisture convergence (Fig. 7h) and precipitation over the Pyrenees. The competing interactions of ABL stabilization and atmospheric moistening are reflected by the increases in convective available potential energy (CAPE) which are most important in elevated areas around the valley (Fig. 7g), where increases in precipitation are significant.
In other seasons (see Appendix G for equivalent figures), almost no significant impacts are visible in winter (DJF) since irrigation is very low and no clear pattern emerges in other variables. In spring (MAM) and autumn (SON), the impacts resemble those of JJA with lower values for all variables and less statistical significance over the domain, and a greater amplitude in SON than MAM. Precipitation increases in the Pyrenees are also present in these seasons, but the area where changes are significant is reduced, and no clear signal is found in the southern rim of the Ebro Valley. The only difference in spatial pattern is found for CAPE in the spring, with increases at the centre of the Peninsula rather than the mountainous areas, although the amplitude of the change remains almost ten times lower than in summer.
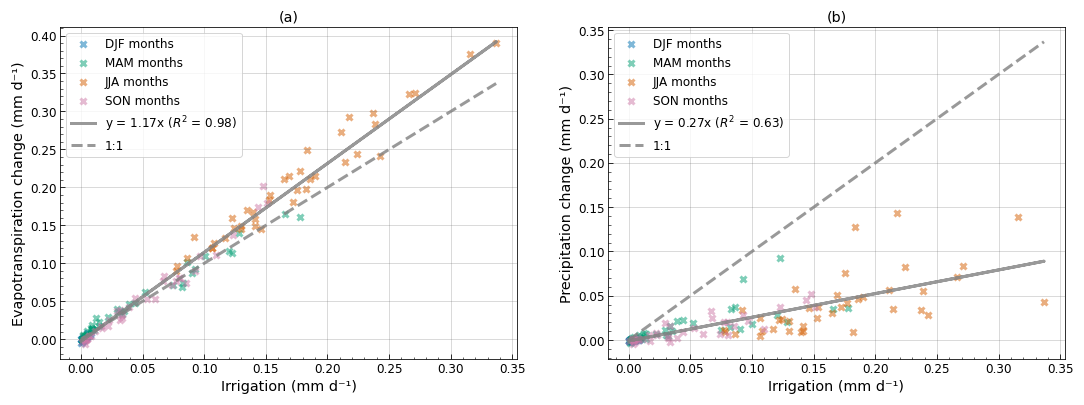
Figure 8Domain-averaged influence of irrigation on monthly changes in ET and P (2010–2022). Each data point corresponds to the average value over the Iberian Peninsula continental domain for a single month of simulation (156 data points for 12 months over 13 years). The average amount of water added by irrigation in the irr simulation (mm d−1) is plotted against the average change (irr − no_irr) in (a) ET (mm d−1) and (b) P (mm d−1). The data points for the winter months are all concentrated around (0,0) for both figures because of very small irrigation volumes and changes in ET and P during this season.
3.5 Atmospheric moisture recycling over the Iberian Peninsula
On average over the continental domain, the monthly change in ET in the presence of irrigation is well correlated with the amount of water added by irrigation and even exceeds it, particularly in summer months (the orange JJA data points in Fig. 8a are all on or above the 1:1 line). In the simulation, ET is constrained by available water, and almost all the water added by irrigation is evaporated or transpired, meaning that this additional increase in ET comes from an additional input of water into the soil. This is explained by a systematic increase in precipitation over the domain (all the data points are on or above the x axis on Fig. 8b). This increase is also roughly proportional to the amount of applied irrigation, although the correlation is weaker than that for the increase in ET, and its values remain lower than the amount of water added by irrigation. Therefore, it appears that irrigation contributes to an increase in atmospheric moisture, and that a part of this moisture is recycled as continental precipitation, which can then be reevaporated.
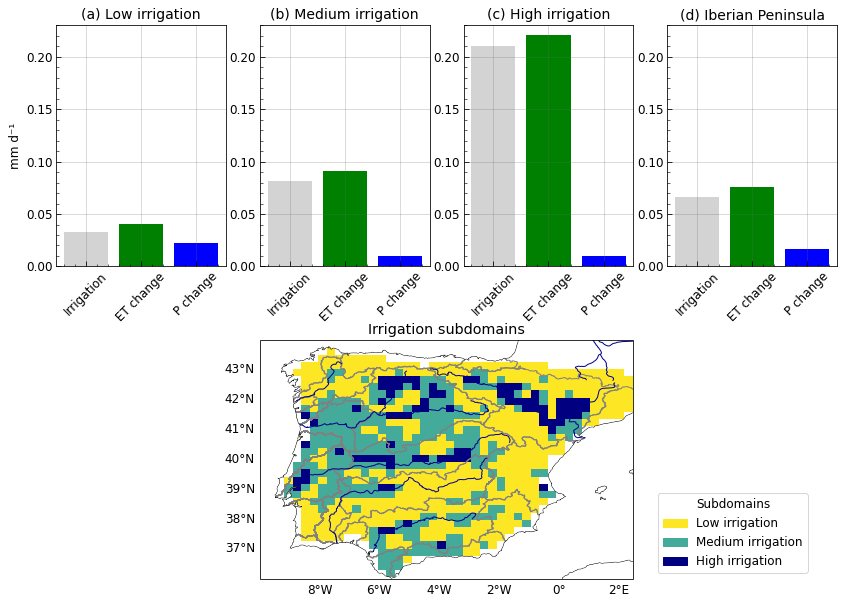
Figure 9Changes in the atmospheric moisture budget for subdomains with different irrigation intensities. Each bar plot shows the annual mean irrigation in the irr simulation (2010–2022, mm d−1) alongside the changes (irr − no_irr) in ET (mm d−1) and P (mm d−1) averaged over distinct subsets of the domain: (a) low irrigation, grid cells with an annual average irrigation lower than 0.06 mm d−1, (b) medium irrigation, those where it is between 0.06 and 0.12 mm d−1, (c) high irrigation those where it is higher than 0.12 mm d−1, and (d) the Iberian Peninsula includes all 3 subsets. The three subdomains are shown in (e).
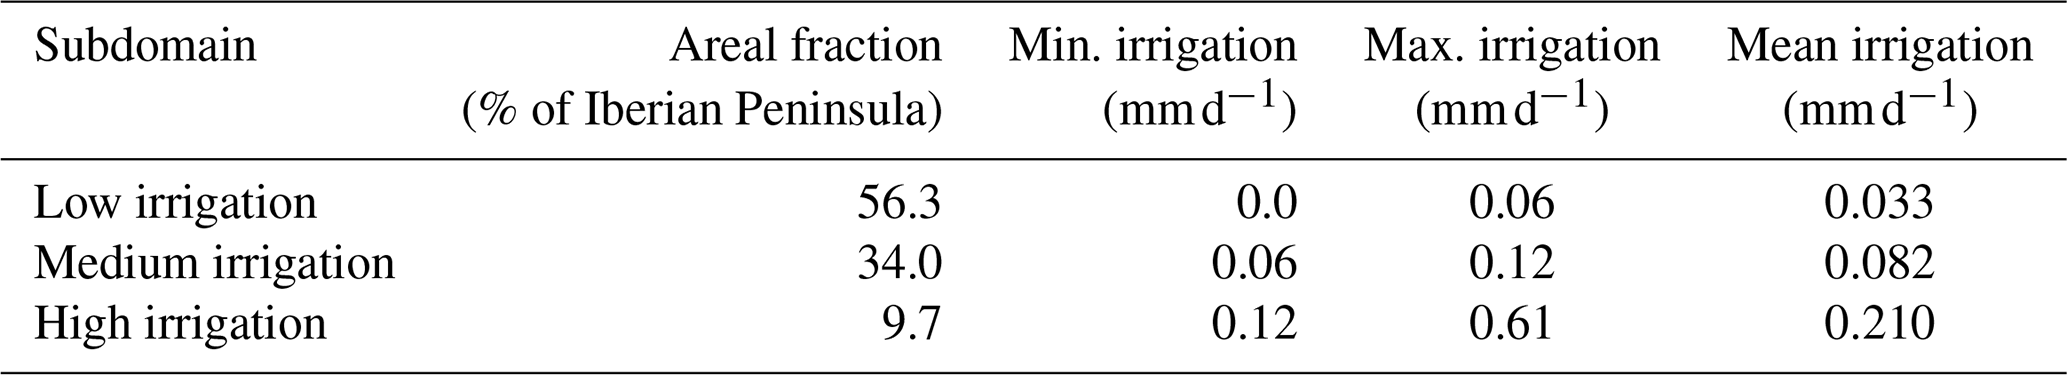
To look further into this recycling, three subdomains were defined, namely, low, medium and high irrigation areas, on the basis of the mean irrigation thresholds given in Table 4. In the map of simulated irrigation (Fig. 3d), the low irrigation domain corresponds to the first colour bin (yellow), the medium irrigation domain to the second bin (light green), and the high irrigation domain to the eight other bins. The three subdomains are also shown distinctly in Fig. 9e. On average, the increase in ET is slightly superior to irrigation for each subdomain (Fig. 9). However, the increase in precipitation is more than twice as large for the low irrigation subdomain than for the medium and high irrigation subdomains. Since irrigated areas are mostly in plains and valleys, this result is consistent with the increase in precipitation already described over mountainous areas in summer (Fig. 7f). It points towards a nonlocal moisture recycling, with atmospheric moisture transfer from intensely irrigated areas to neighbouring lightly irrigated areas, meaning that a significant part of the additional rainfall does not occur on irrigated crops. Over the entire Iberian Peninsula, the increase in precipitation represents 25 % of the irrigated volume, whereas the increase in ET amounts to 112 % of irrigation.
This study analyses the regional impacts of simulated irrigation on land-atmosphere coupling variables and the water cycle over the Iberian Peninsula. It uses a regional model at 25 km resolution, with the same physics as the global IPSL-CM, to better understand the strengths and limits of its parametrizations in representing the impacts of irrigation.
It first shows that the ORCHIDEE irrigation scheme simulates realistic values from April to September in areas where surface water withdrawals are most important, such as the Ebro Valley, although it partly relies on the compensation between an overestimation of irrigation in the thalwegs and an underestimation in the hillslopes. However, the irrigation scheme cannot represent winter irrigation, or satisfy irrigation demand in southern regions, where actual irrigation is more dependent on groundwater pumping and river dams, due to low available volumes in rivers and groundwater routing reservoirs. Ongoing developments to add river dams into the ORCHIDEE routing scheme (Baratgin et al., 2024) could very likely improve this aspect by representing interseasonal water storage, making more water available in summer for irrigation. Explicit dam representation could generally improve the fidelity of the model by limiting the winter and spring overestimation of river discharge in anthropized areas (since water would be stored in the dam reservoirs during this season instead of flowing in the rivers), and by accounting for environmental flow regulations that increase discharge in summer using water stored in dam reservoirs (Sadki et al., 2023). This would disentangle the impacts of irrigation on river discharge from those of dam operation, and likely require a new parameter tuning of the irrigation scheme. In its current state, the irrigation parametrization reduces river discharge and enables better agreement with observations, but since it is only active when the LAI is above a defined threshold, these impacts are mostly visible in summer and autumn. Future work with a looser activation threshold for irrigation could help to represent winter crop irrigation, although it is not expected to have as significant an impact on discharge as an explicit dam representation since simulated irrigation demand would still remain low in winter. Nevertheless, biases induced by precipitation and the melting of snow in mountainous regions are very likely to remain major drivers of discharge biases, largely independent of irrigation or dam representation.
The simulation of precipitation and ET over the Iberian Peninsula is satisfactory in winter and spring, but this study highlights underestimates in summer and contrasted spatial patterns with positive precipitation biases in elevated regions and negative biases in plains. ET underestimation is partly improved by simulated irrigation, but remains present on average and over most of the domain. These linked biases might be improved with a different simulation setup, particularly in the lateral forcing. Preliminary analyses (not shown) revealed an abnormal behaviour of the model in the transition zone between the ERA5 forcing zone and the central free zone, which was attributed to discrepancies between the physics used in the model and in the reanalysis. This resulted in precipitation underestimations throughout the entire simulation domain, which were largely improved by using a larger domain for the simulations presented here. A good lead for future works would be to use lateral forcing from global simulations of the ICOLMDZ model or nested LAM simulations rather than a reanalysis, but these options are not yet technically available. The precipitation biases can also be due to structural flaws of the IPSL-CM parametrizations, as mentioned for mountain precipitation in Arjdal et al. (2024), and improving them might require more work in the modelling of radiative processes, shallow and deep convection (whose tuning often focuses on tropical regions), or surface processes (roughness, albedo, components of ET). This highlights the fact that the results of this study are necessarily limited by the modelling choices, uncertainties, and biases of the IPSL-CM, and therefore remain largely model-specific.
The atmospheric impacts of irrigation are analysed in more detail in summer, since it is the season with the largest irrigation values and the most significant response for all variables of interest, although it is the driest season, with very little precipitation. In JJA, the strong response of turbulent fluxes to irrigation leads to cooling and moistening of the lower atmosphere and significantly affects its structure (LCL and ABL height), with stronger effects on intensely irrigated regions, which is consistent with the findings of Rappin et al. (2022). In contrast, significant increases in precipitation are mostly detected in lightly irrigated mountainous areas surrounding the highly irrigated Ebro Valley. This points to a dominant effect of ABL stabilization, described by Findell and Eltahir (2003); Ek and Holtslag (2004), in intensely irrigated areas, and remote effects of atmospheric moistening as in DeAngelis et al. (2010), Lo and Famiglietti (2013), Yang et al. (2017). An improved representation of winter and spring irrigation could either allow to generalize the following results or to identify different responses to irrigation under moister atmospheric conditions. Furthermore, over the Iberian Peninsula, increases in ET are proportional to applied irrigation and actually exceed it for almost every simulation month. This is made possible by small but systematic increases in average precipitation over the domain, forming evidence of continental moisture recycling over the Iberian Peninsula. The precipitation increases are of lower magnitude than those of ET and occur much more in lightly irrigated regions than in intensely irrigated regions, confirming that the recycling is partial and mostly nonlocal.
These findings call for an analysis of land-atmosphere coupling processes in the presence of irrigation at the diurnal scale to better describe the impacts on the ABL structure in both irrigated areas and neighbouring regions. In particular, it would be relevant to compare the model to field observations from the LIAISE campaign held in the Ebro Valley in July 2021 (Boone et al., 2025). High resolution modelling experiments using irrigation parametrizations have shown large improvements of performance relative to LIAISE observations for turbulent fluxes, air temperature and humidity (Lunel et al., 2024a; Udina et al., 2024); stressed the importance of the convection parametrization for the response of precipitation to irrigation (Udina et al., 2024); and identified interactions of irrigation-induced heterogeneities with regional breeze circulations (Lunel et al., 2024b). Conducting similar analyses with the simulation setup used in this study should provide insights into the ability of a climate model to reproduce the complex structure of these heterogeneities (Mangan et al., 2023) and their impacts on the ABL and atmospheric water cycle.
The irrigation scheme used in this study was introduced in Arboleda-Obando et al. (2024), who also conducted a calibration and sensitivity analysis of the parameters introduced. The soil moisture target parameter (named β) was found to be the dominant parameter that drives the irrigation withdrawals, and a default value of 0.9 was selected for the global model (meaning the target soil moisture is 90 % of field capacity soil moisture). Although the parametrization uses a single value for the entire simulation domain, Arboleda-Obando et al. (2024) suggested that the value obtained on global average was mainly the result of two main irrigation practices, flooding in rice paddies and other types of irrigation that are less water-intensive:
The results roughly show at least two classes for β, with the first with values of 1.2 and 1.4 (for instance, China and north India) and the second with values of 0.6. Using at least two β values is not enough to reduce the irrigation bias at a global scale, but it has an important effect on the spatial distribution of the irrigation bias in Southern Asia, the region with the largest paddy rice area. These results suggest that the β parameter should have at least two values, namely 1.3 in areas with paddy rice and 0.6 in the rest of the irrigated areas.
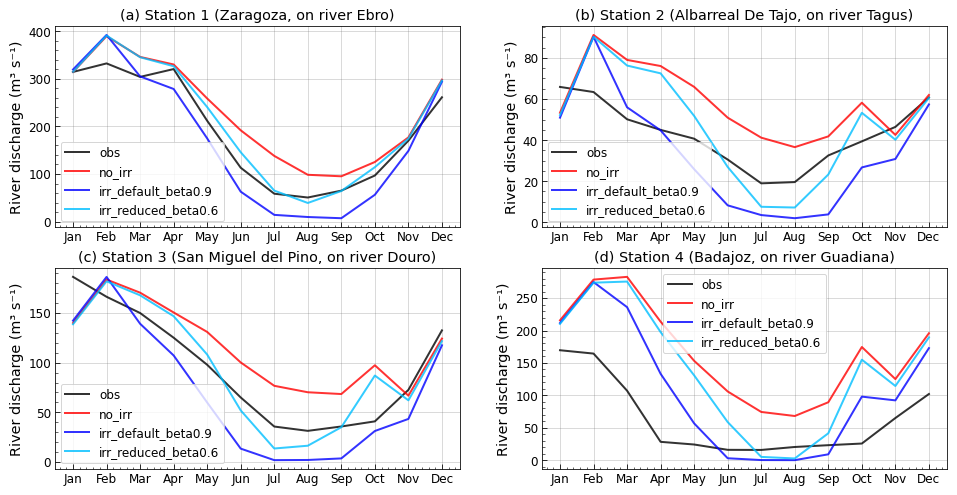
Figure A1Mean seasonal cycle of river discharge at four stations, for the no_irr, irr_default_beta0.9 and irr_reduced_beta0.6 offline simulations and GRDC observations (1983–2010).
Therefore, for this study of the Iberian Peninsula, preliminary offline simulations were used to experiment with different values of the β parameter. Three simulations are presented here:
-
without irrigation (no_irr),
-
with irrigation using the default value β=0.9 (irr_default_beta0.9),
-
with irrigation using the reduced value β=0.6 (irr_reduced_beta0.6)
They were run using the WATCH Forcing Data ERA-Interim (WFDEI Weedon et al., 2014) forcing dataset from 1980 to 2010. Four GRDC discharge stations (see Sect. 2.3 for more details) were selected on the largest rivers of the Iberian Peninsula (Ebro, Tagus, Douro and Guadiana), to represent integrated impacts of irrigation over large river basins. The first 3 years were considered as a spin-up for vegetation and hydrological variables and the simulations were analysed over the remaining period (1983–2010). They revealed very large differences in simulated discharge between no_irr and irr_default_beta0.9 with one mostly overestimating river discharge and the other underestimating it, especially in summer, the season where irrigation is the largest. The irr_reduced_beta0.6 shows an intermediate behaviour with lower discharge than no_irr, but avoiding complete depletion of the river reservoir in summer. These preliminary results in offline simulations justified the choice of a target soil moisture at 60 % of field capacity SM for the coupled ICOLMDZOR LAM simulations.
The simulations started after a 3-year spin-up run to enable the stabilization of the vegetation and hydrological variables, in particular irrigation and ET. The ORCHIDEE model starts with a saturated soil and no vegetation and therefore the first year of the spin-up shows no irrigation on average over the Iberian Peninsula, and a very small mean value of LAI (Fig. B1g–h). After three years, variations of total runoff, ET, total soil moisture in the ORCHIDEE 2-metre soil column, and routing reservoirs are largely driven by the interannual variability of precipitation, as illustrated by the correlation coefficients of Tables B1 and B2. It must be noted that over the final years, the simulations exhibit a decrease in precipitation and therefore in other hydrological variables. This trend in precipitation is also present in ERA5 and mostly dictated by the lateral boundary conditions of the simulation, which is why it was not considered as an indicator of an incomplete spin-up process.
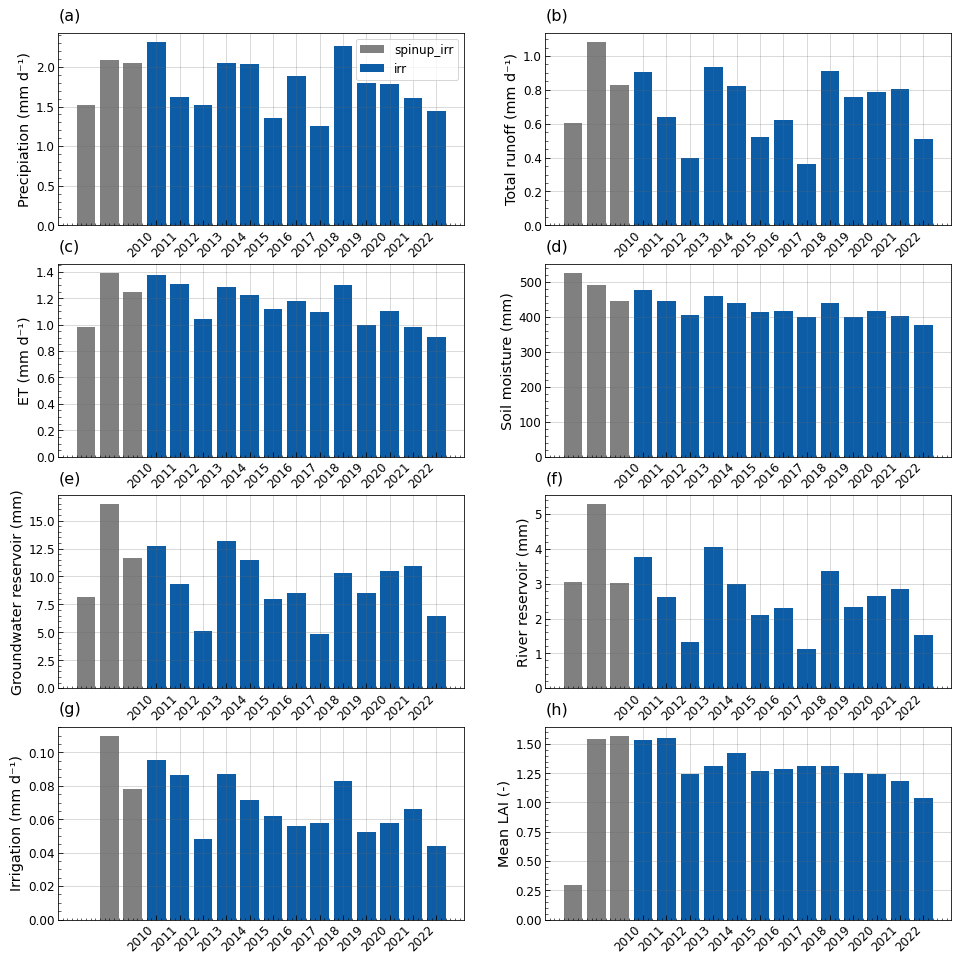
Figure B1Annual mean values over the Iberian Peninsula in the 3-year spin-up and irr simulation for (a) precipitation, (b) total runoff, (c) evapotranspiration, (d) soil moisture in the 2 m soil column, (e) groundwater reservoir, (f) river reservoir, (g) irrigation, (h) mean Leaf Area Index. Annual values are very similar for the no_irr simulation but irr was used to include irrigation.
Table B1Correlation matrix (Pearson's r coefficient) for annual values of hydrological and vegetation variables in the irr simulation (2010–2022). The level of significance of the correlation coefficient is indicated by * if p value <0.05, if p value <0.01, if p value <0.001.
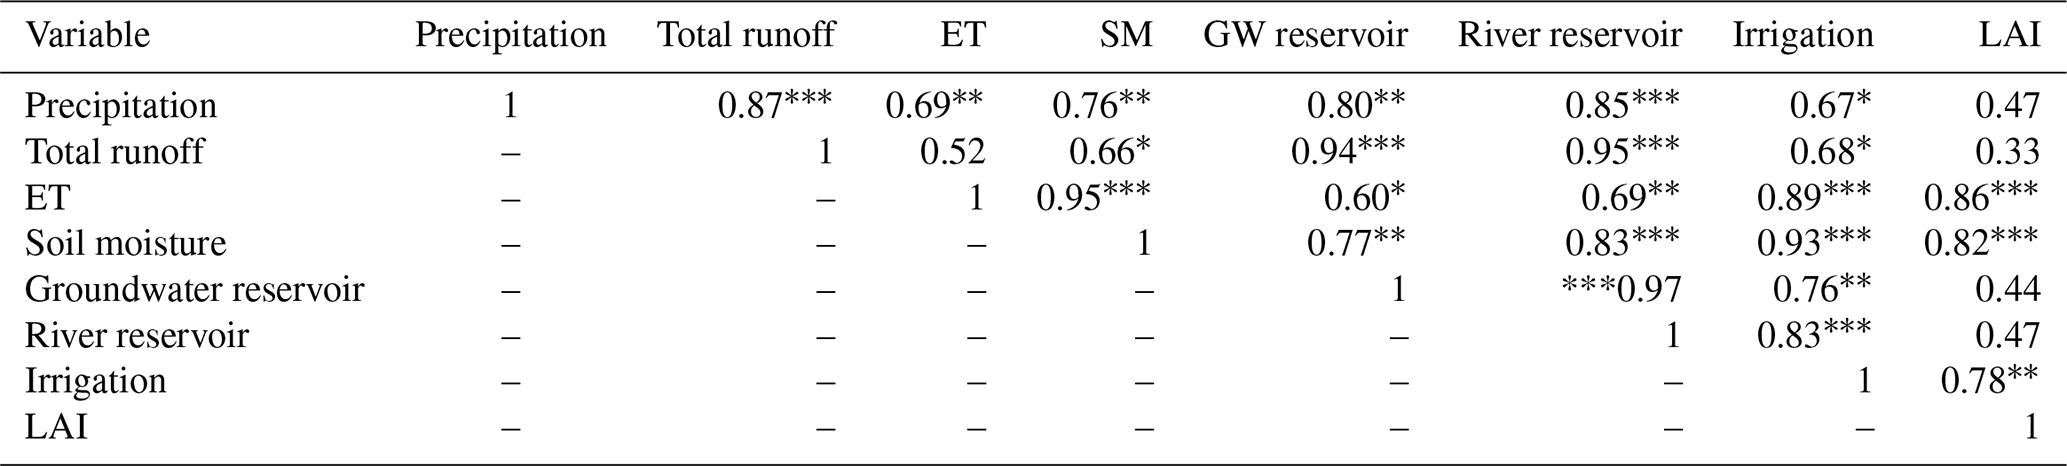
Table B2Correlation matrix (Pearson's r coefficient) for annual values of hydrological and vegetation variables in the no_irr simulation (2010–2022). The level of significance of the correlation coefficient is indicated by * if p value <0.05, if p value <0.01, if p value <0.001.
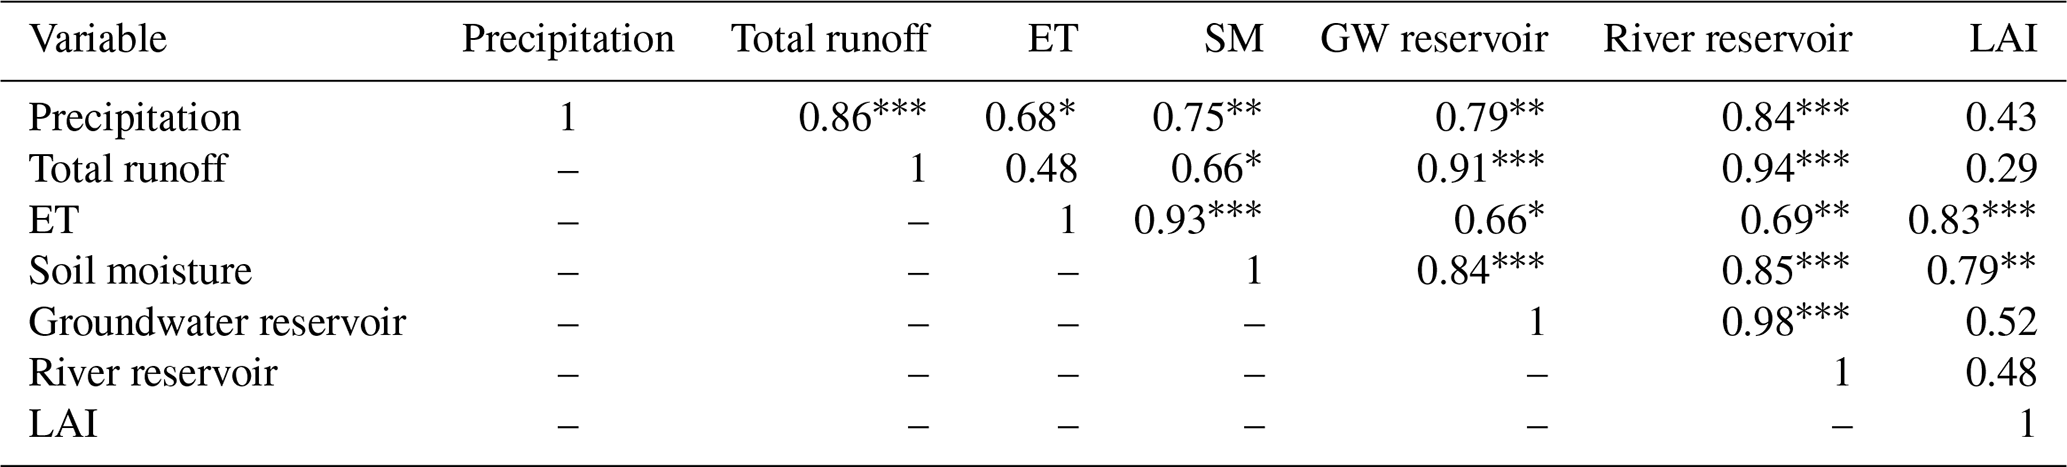
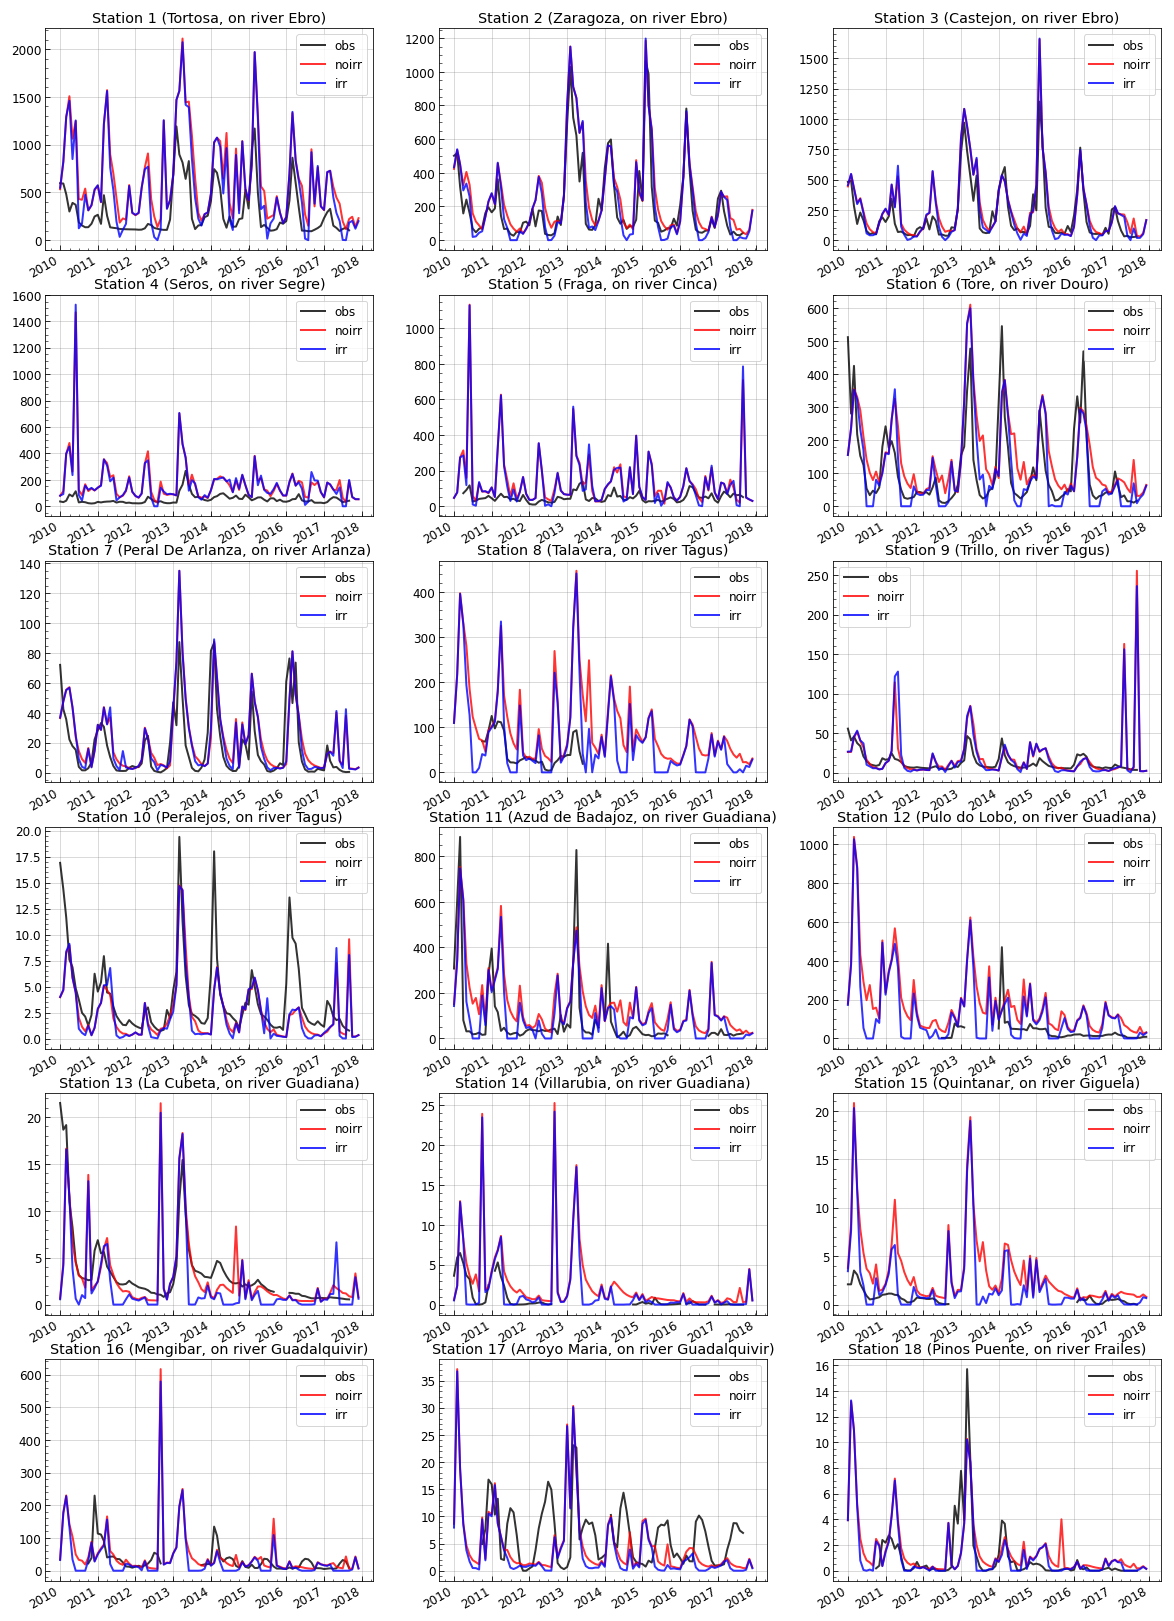
Figure C1Time series of river discharge for the irr and no_irr simulations and GRDC observations.
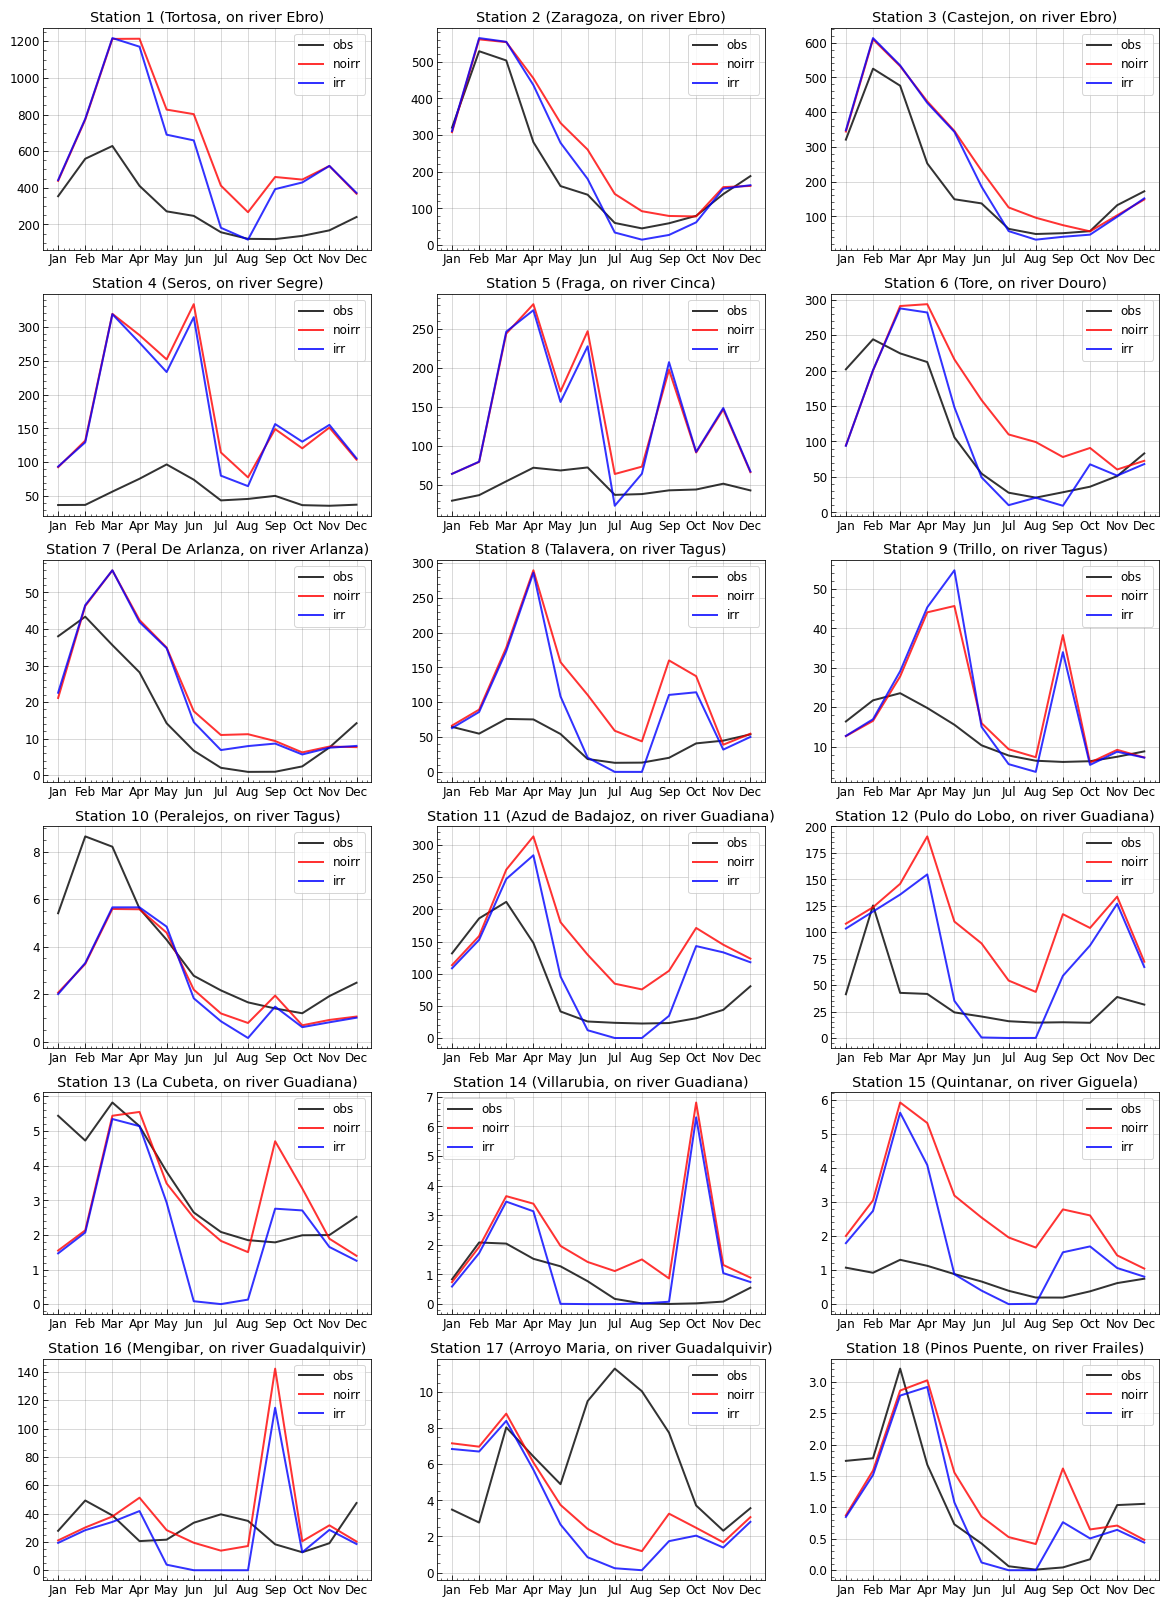
Figure C2Mean seasonal cycle of river discharge for the irr and no_irr simulations and GRDC observations. A mask is applied to the simulations to filter out months without corresponding observation data.
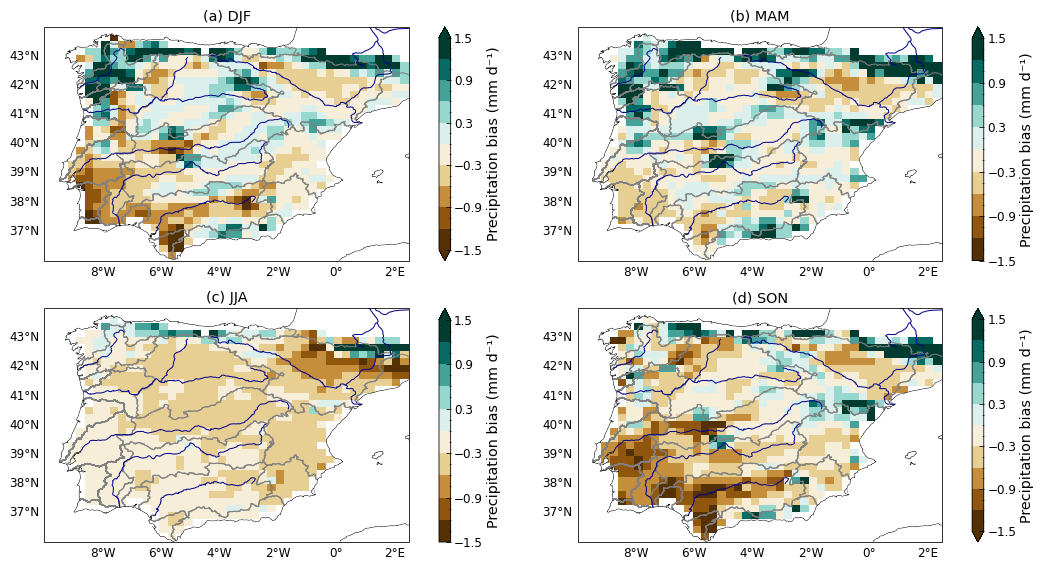
Figure D1Seasonal mean biases of precipitation (mm d−1) in the no_irr simulation compared with the GPCC product (2010–2019).
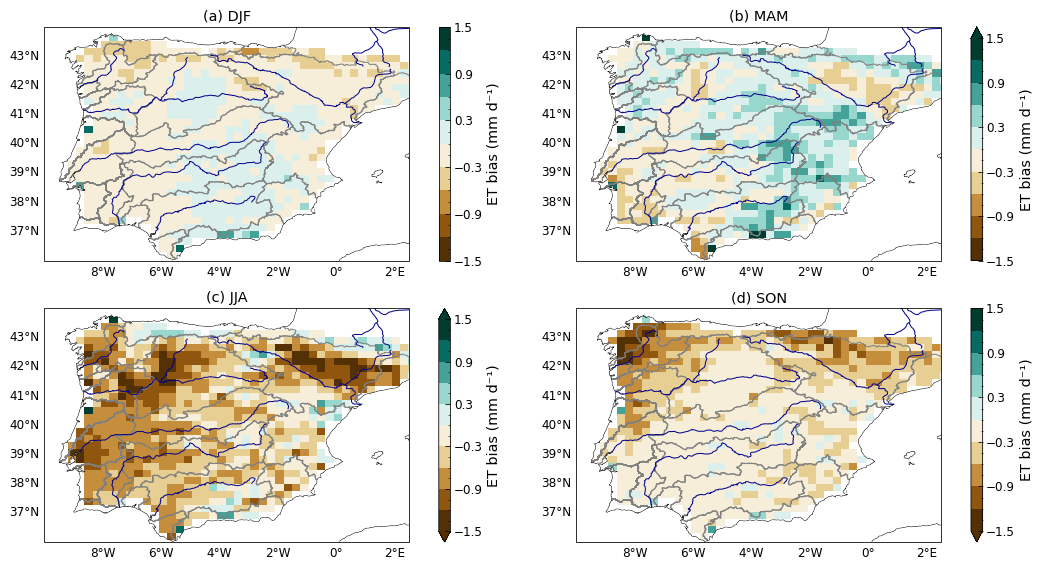
Figure D2Seasonal mean biases of ET (mm d−1) in the no_irr simulation compared with the GLEAM4 product (2010–2019).
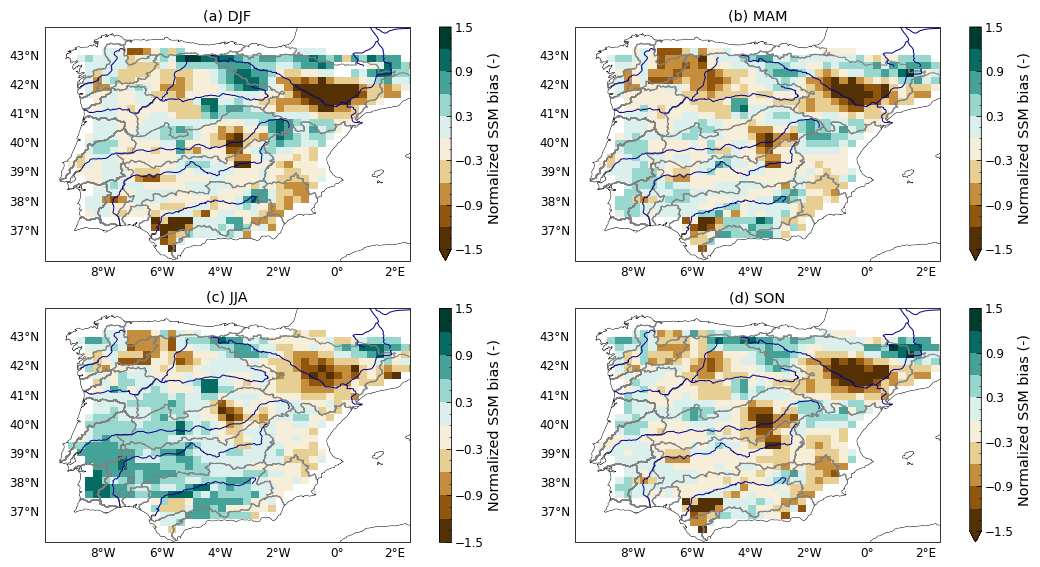
Figure D3Seasonal mean biases of normalized SSM (no unit) in the no_irr simulation compared with the CCI product (2010–2019).
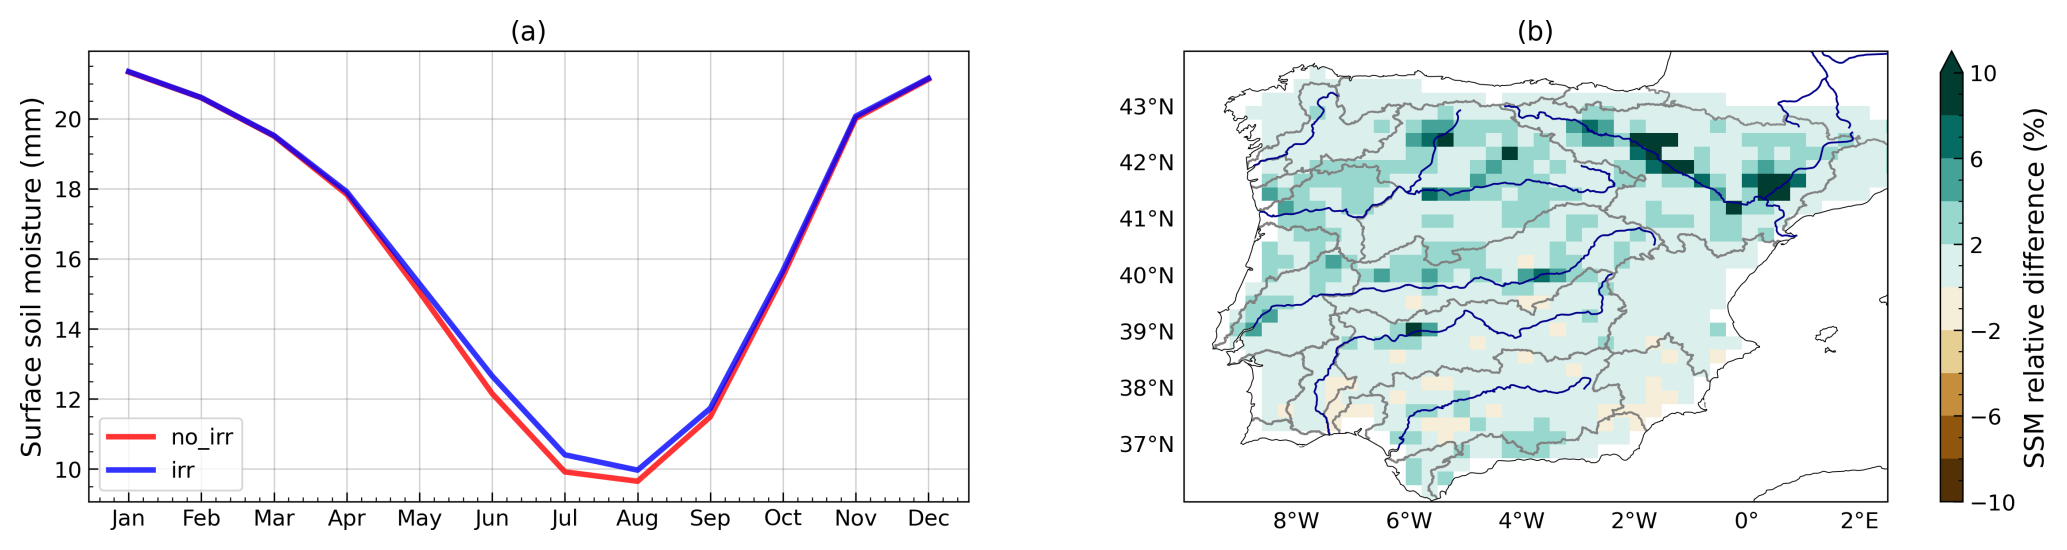
Figure E1(a) Mean seasonal cycle of surface soil moisture (mm contained in the top 10 cm) in the no_irr and irr simulations (2010–2022). (b) Annual mean relative difference (%) in surface soil moisture between the two simulations (irr − no_irr, 2010–2022).
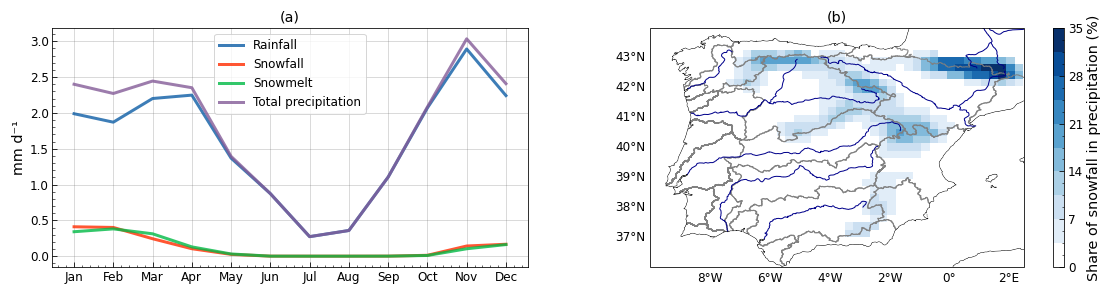
Figure F1Influence of snow in the no_irr simulation (2010–2022). (a) Mean seasonal cycle of rainfall, snowfall, snow melt and total precipitation. (b) Annual mean share of snowfall in total precipitation (%).
As Fig. 7 only presented results in summer, equivalent figures are shown for winter, spring and autumn, with a different set of colour bar boundaries.
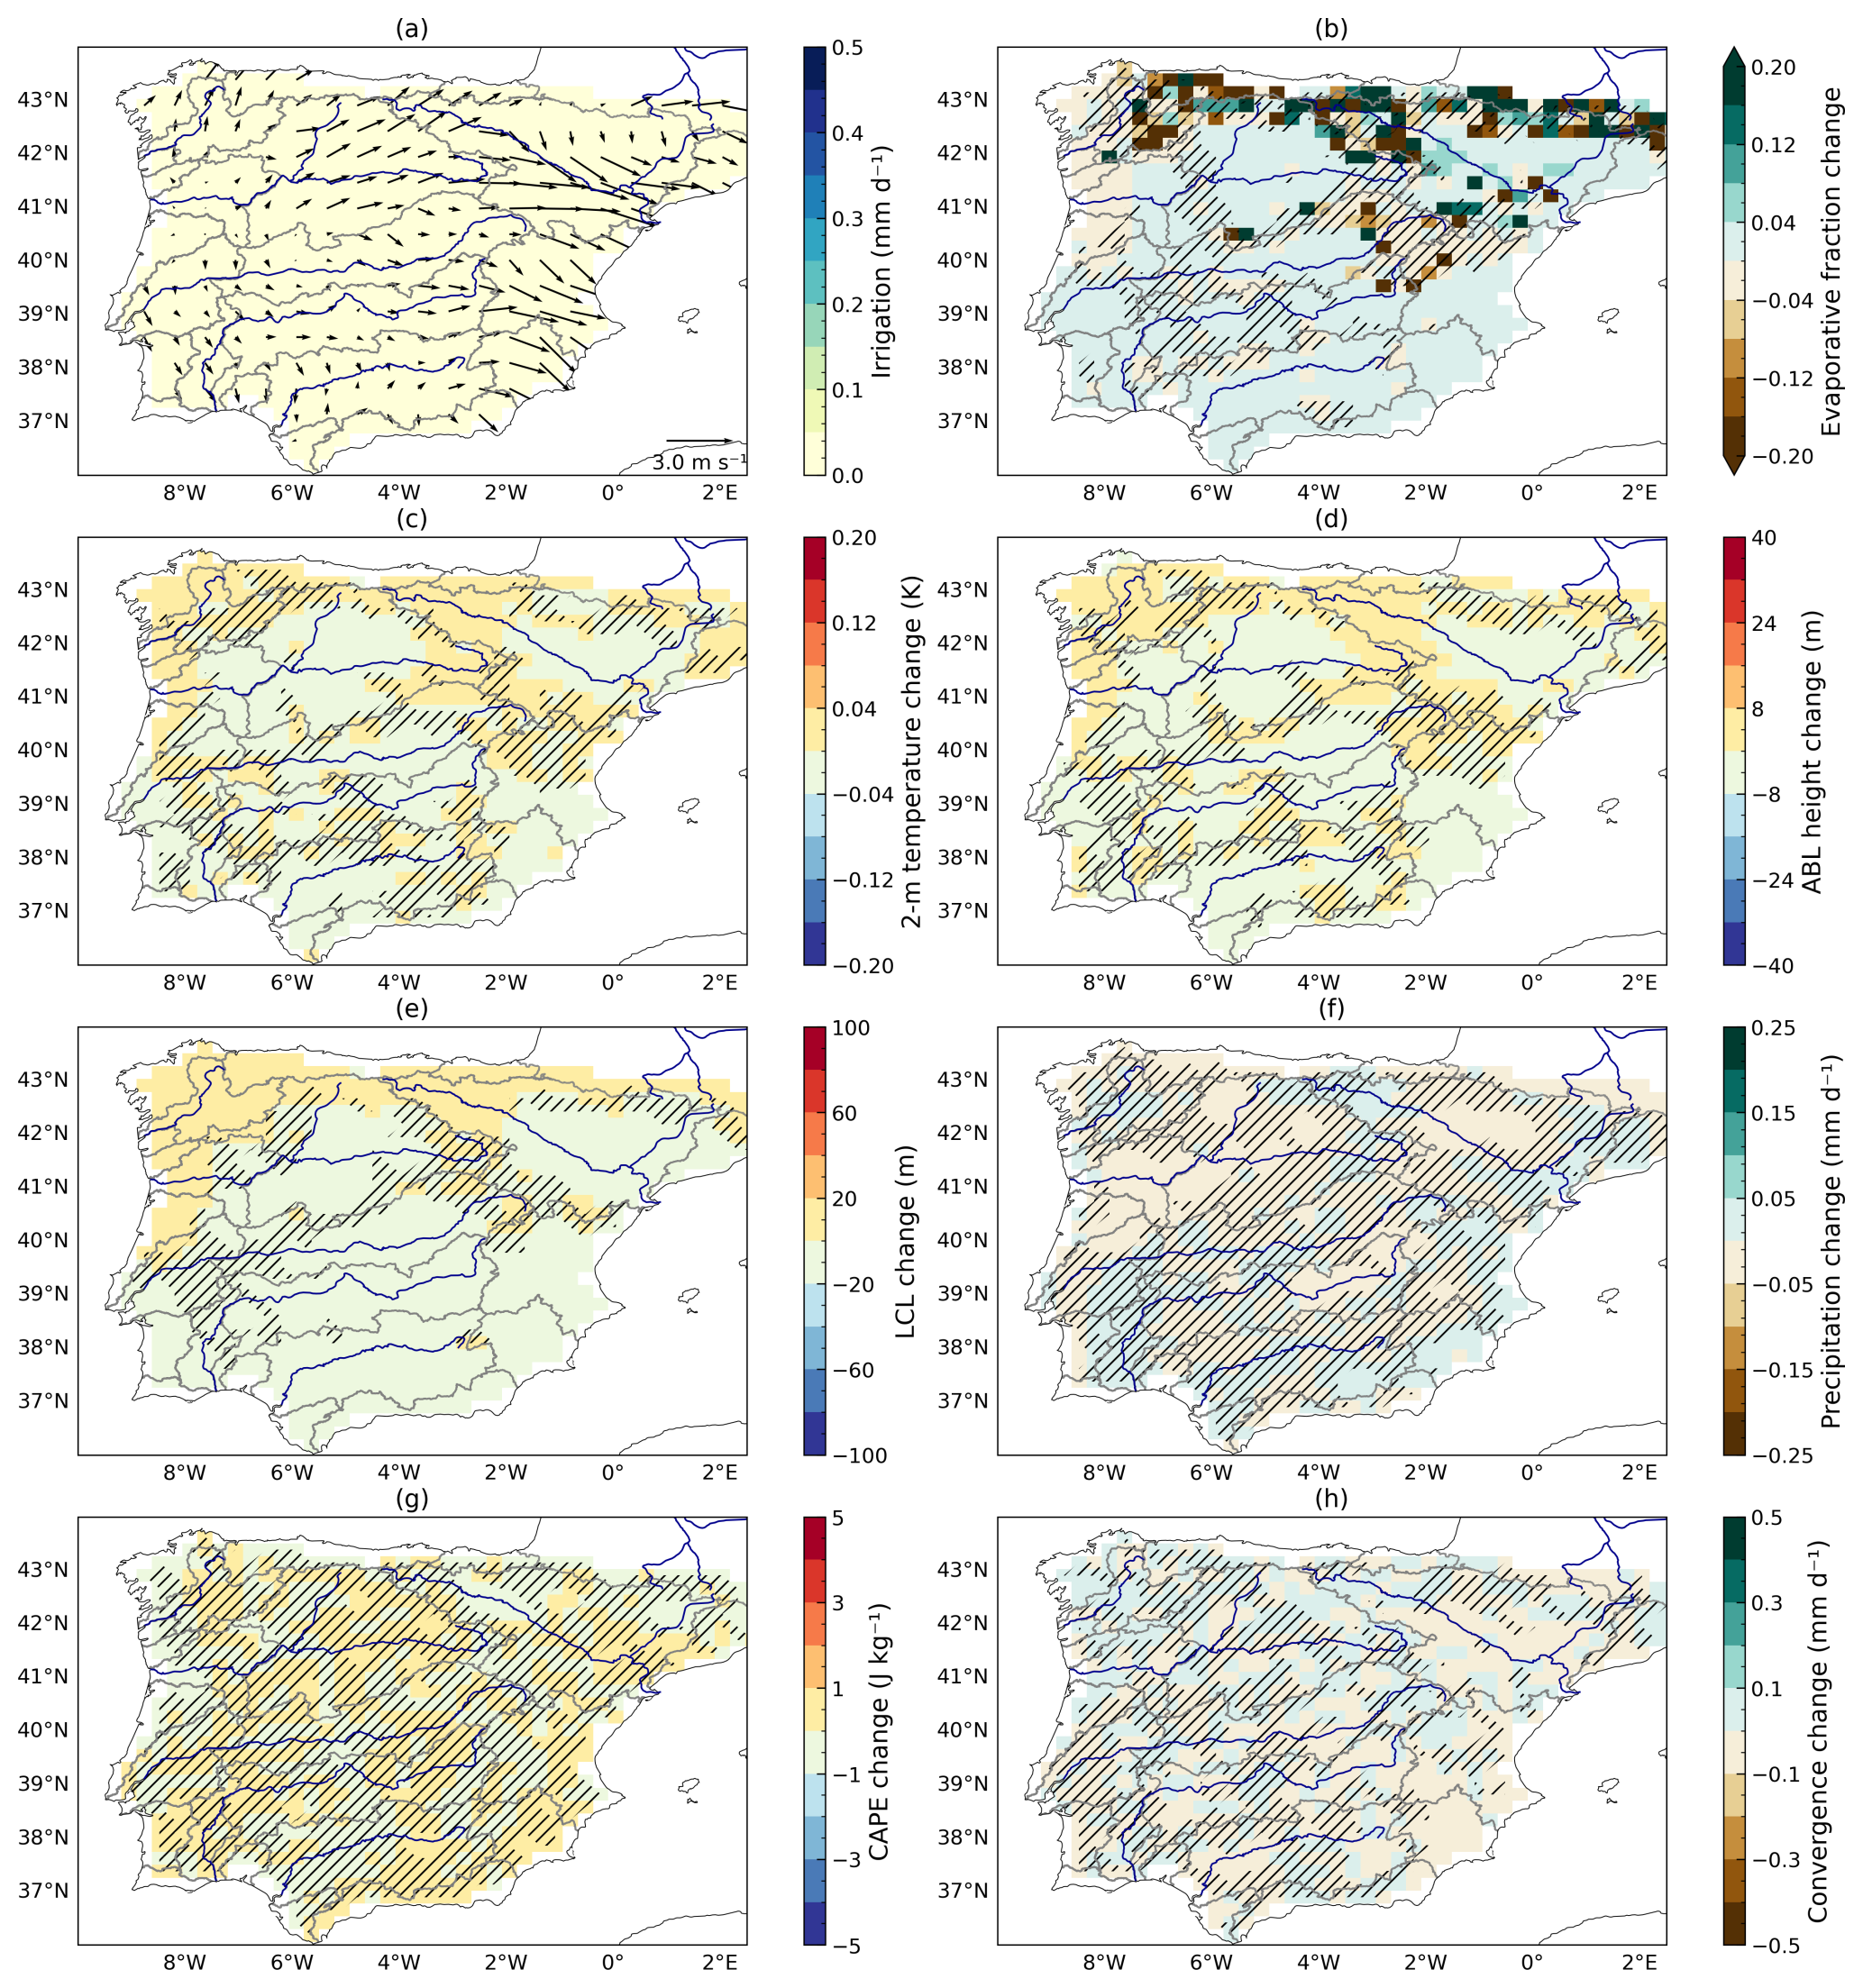
Figure G1Winter irrigation and its impacts (DJF, 2010–2022). (a) Irrigation (mm d−1) and 10 m wind (irr simulation). Mean changes in the presence of irrigation (irr − no_irr): (b) evaporative fraction, (c) 2 m temperature (K), (d) atmospheric boundary layer height (m), (e) lifting condensation level (m), (f) precipitation (mm d−1), (g) convective available potential energy (J kg−1), (h) moisture convergence (mm d−1). Hatching indicates areas where the change is not statistically significant.
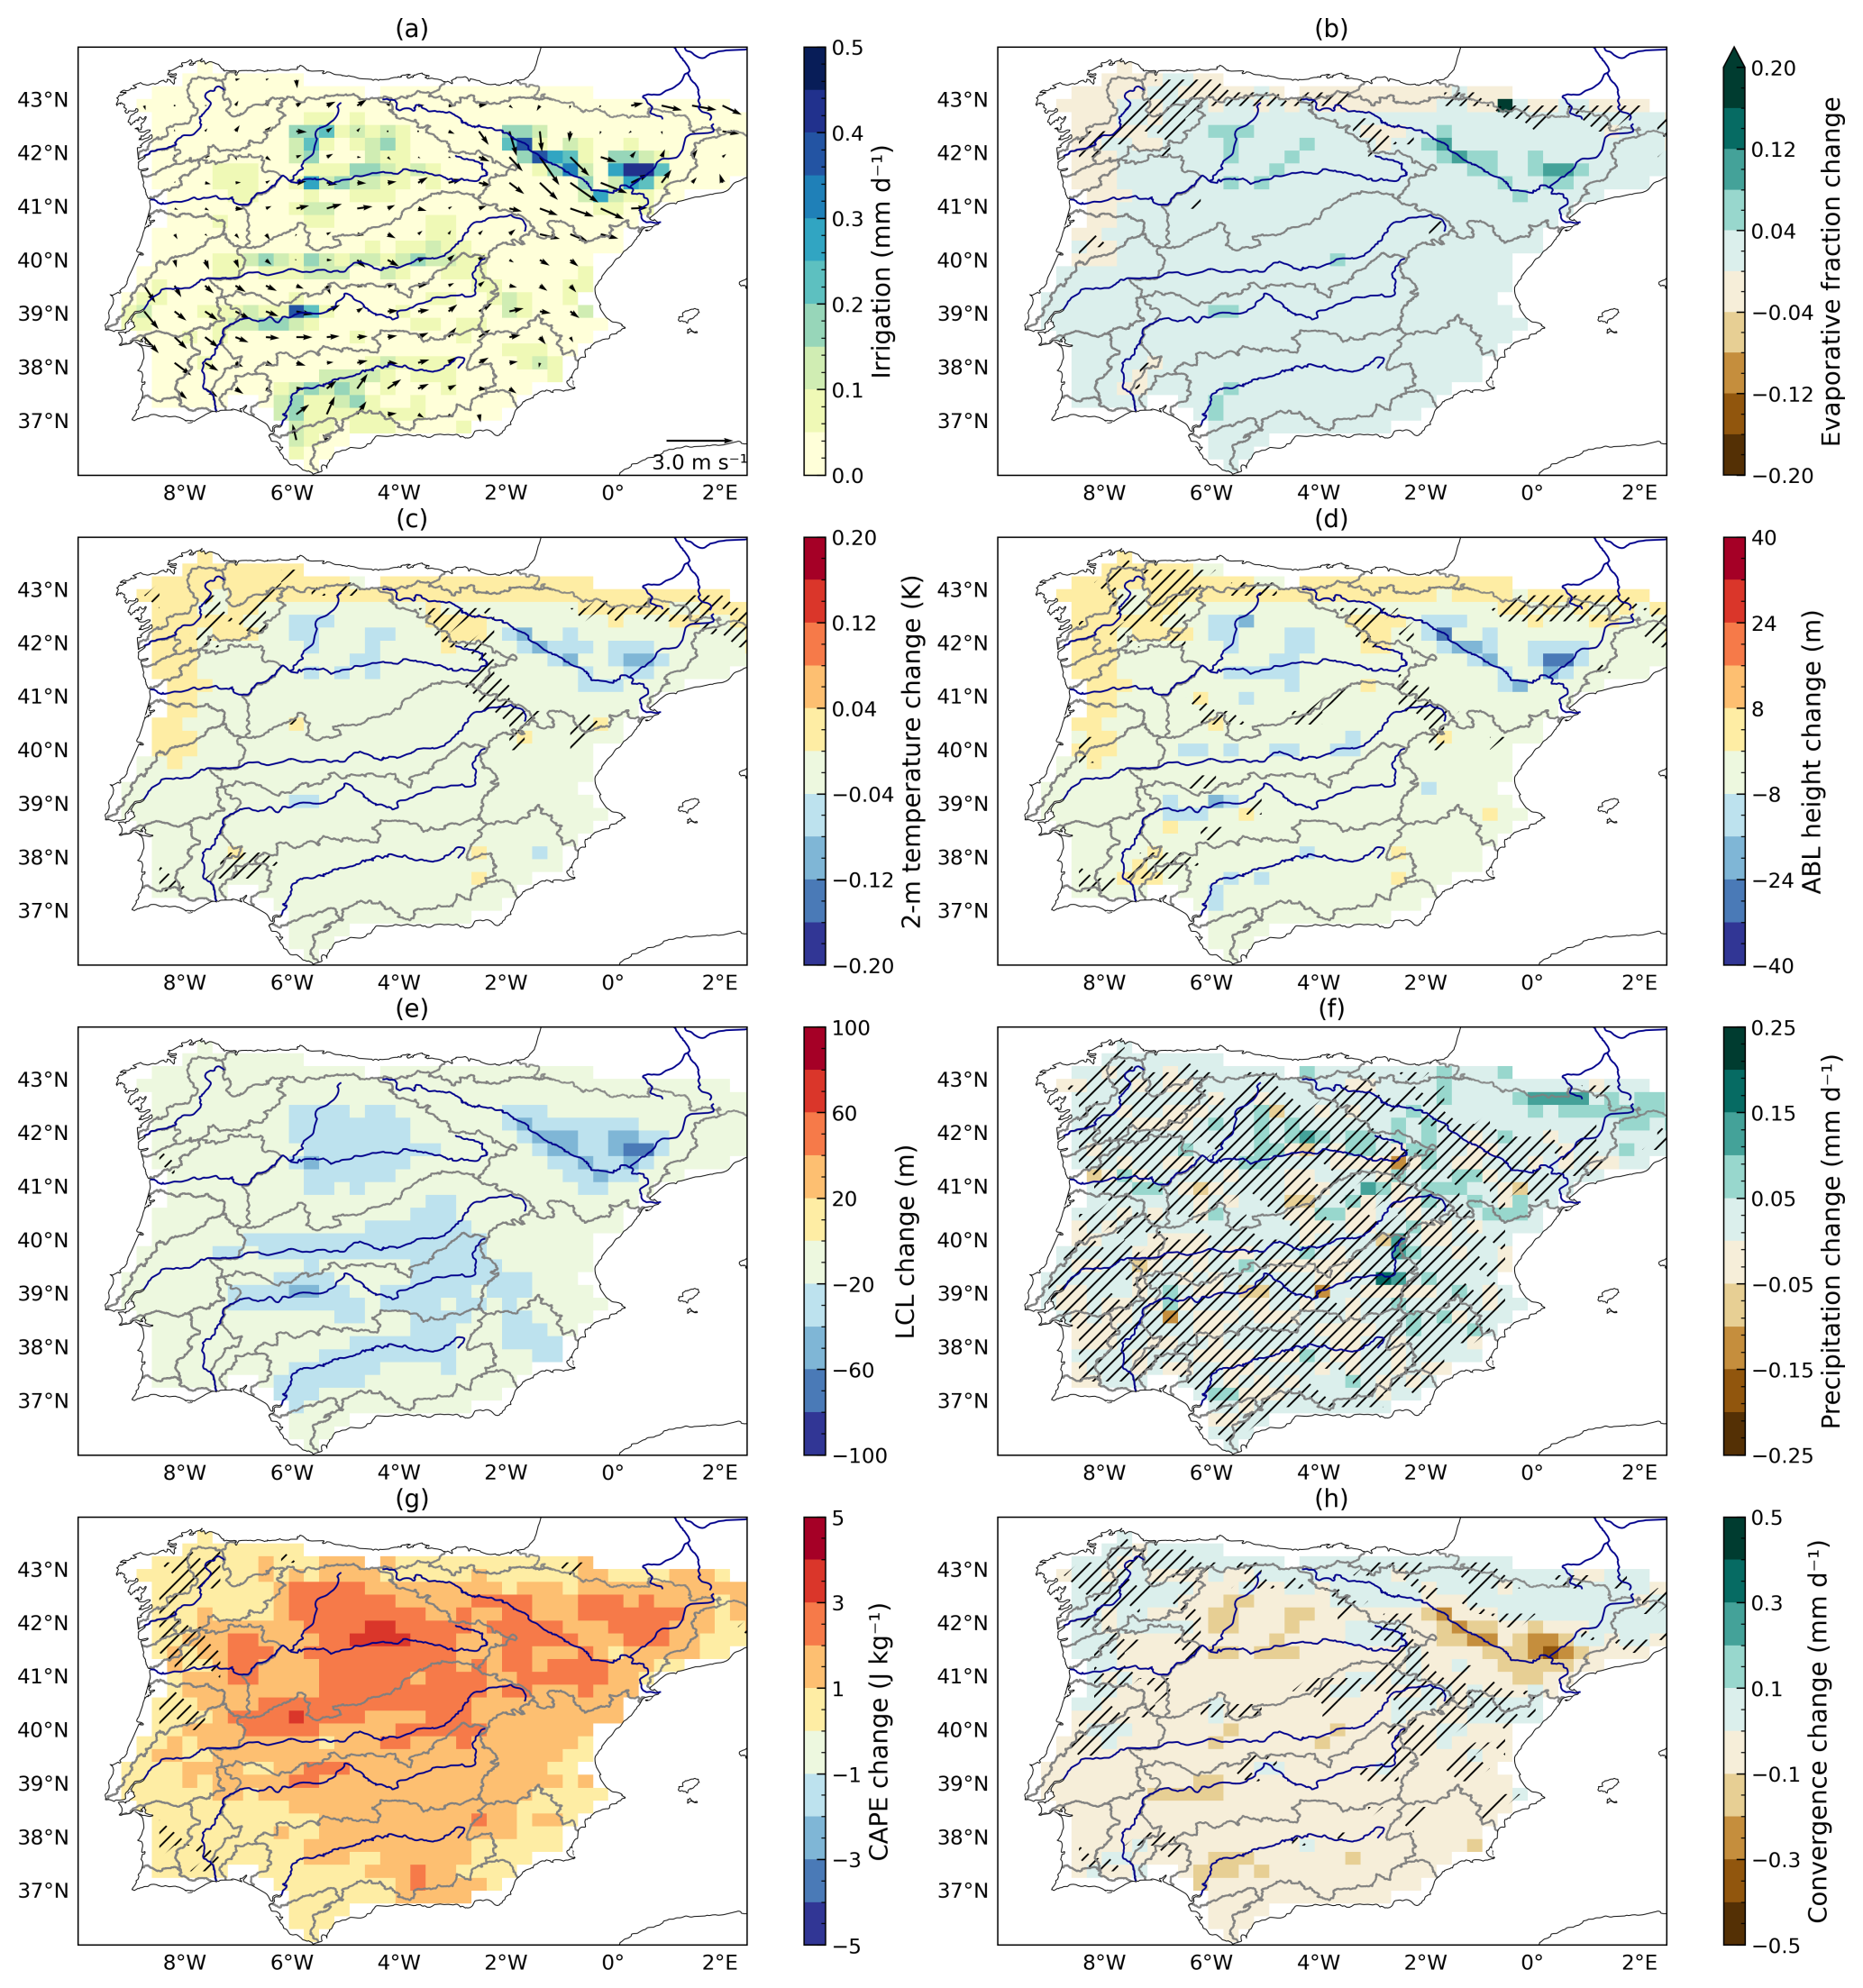
Figure G2Spring irrigation and its impacts (MAM, 2010–2022). (a) Irrigation (mm d−1) and 10 m wind (irr simulation). Mean changes in the presence of irrigation (irr − no_irr): (b) evaporative fraction, (c) 2 m temperature (K), (d) atmospheric boundary layer height (m), (e) lifting condensation level (m), (f) precipitation (mm d−1), (g) convective available potential energy (J kg−1), (h) moisture convergence (mm d−1). Hatching indicates areas where the change is not statistically significant.
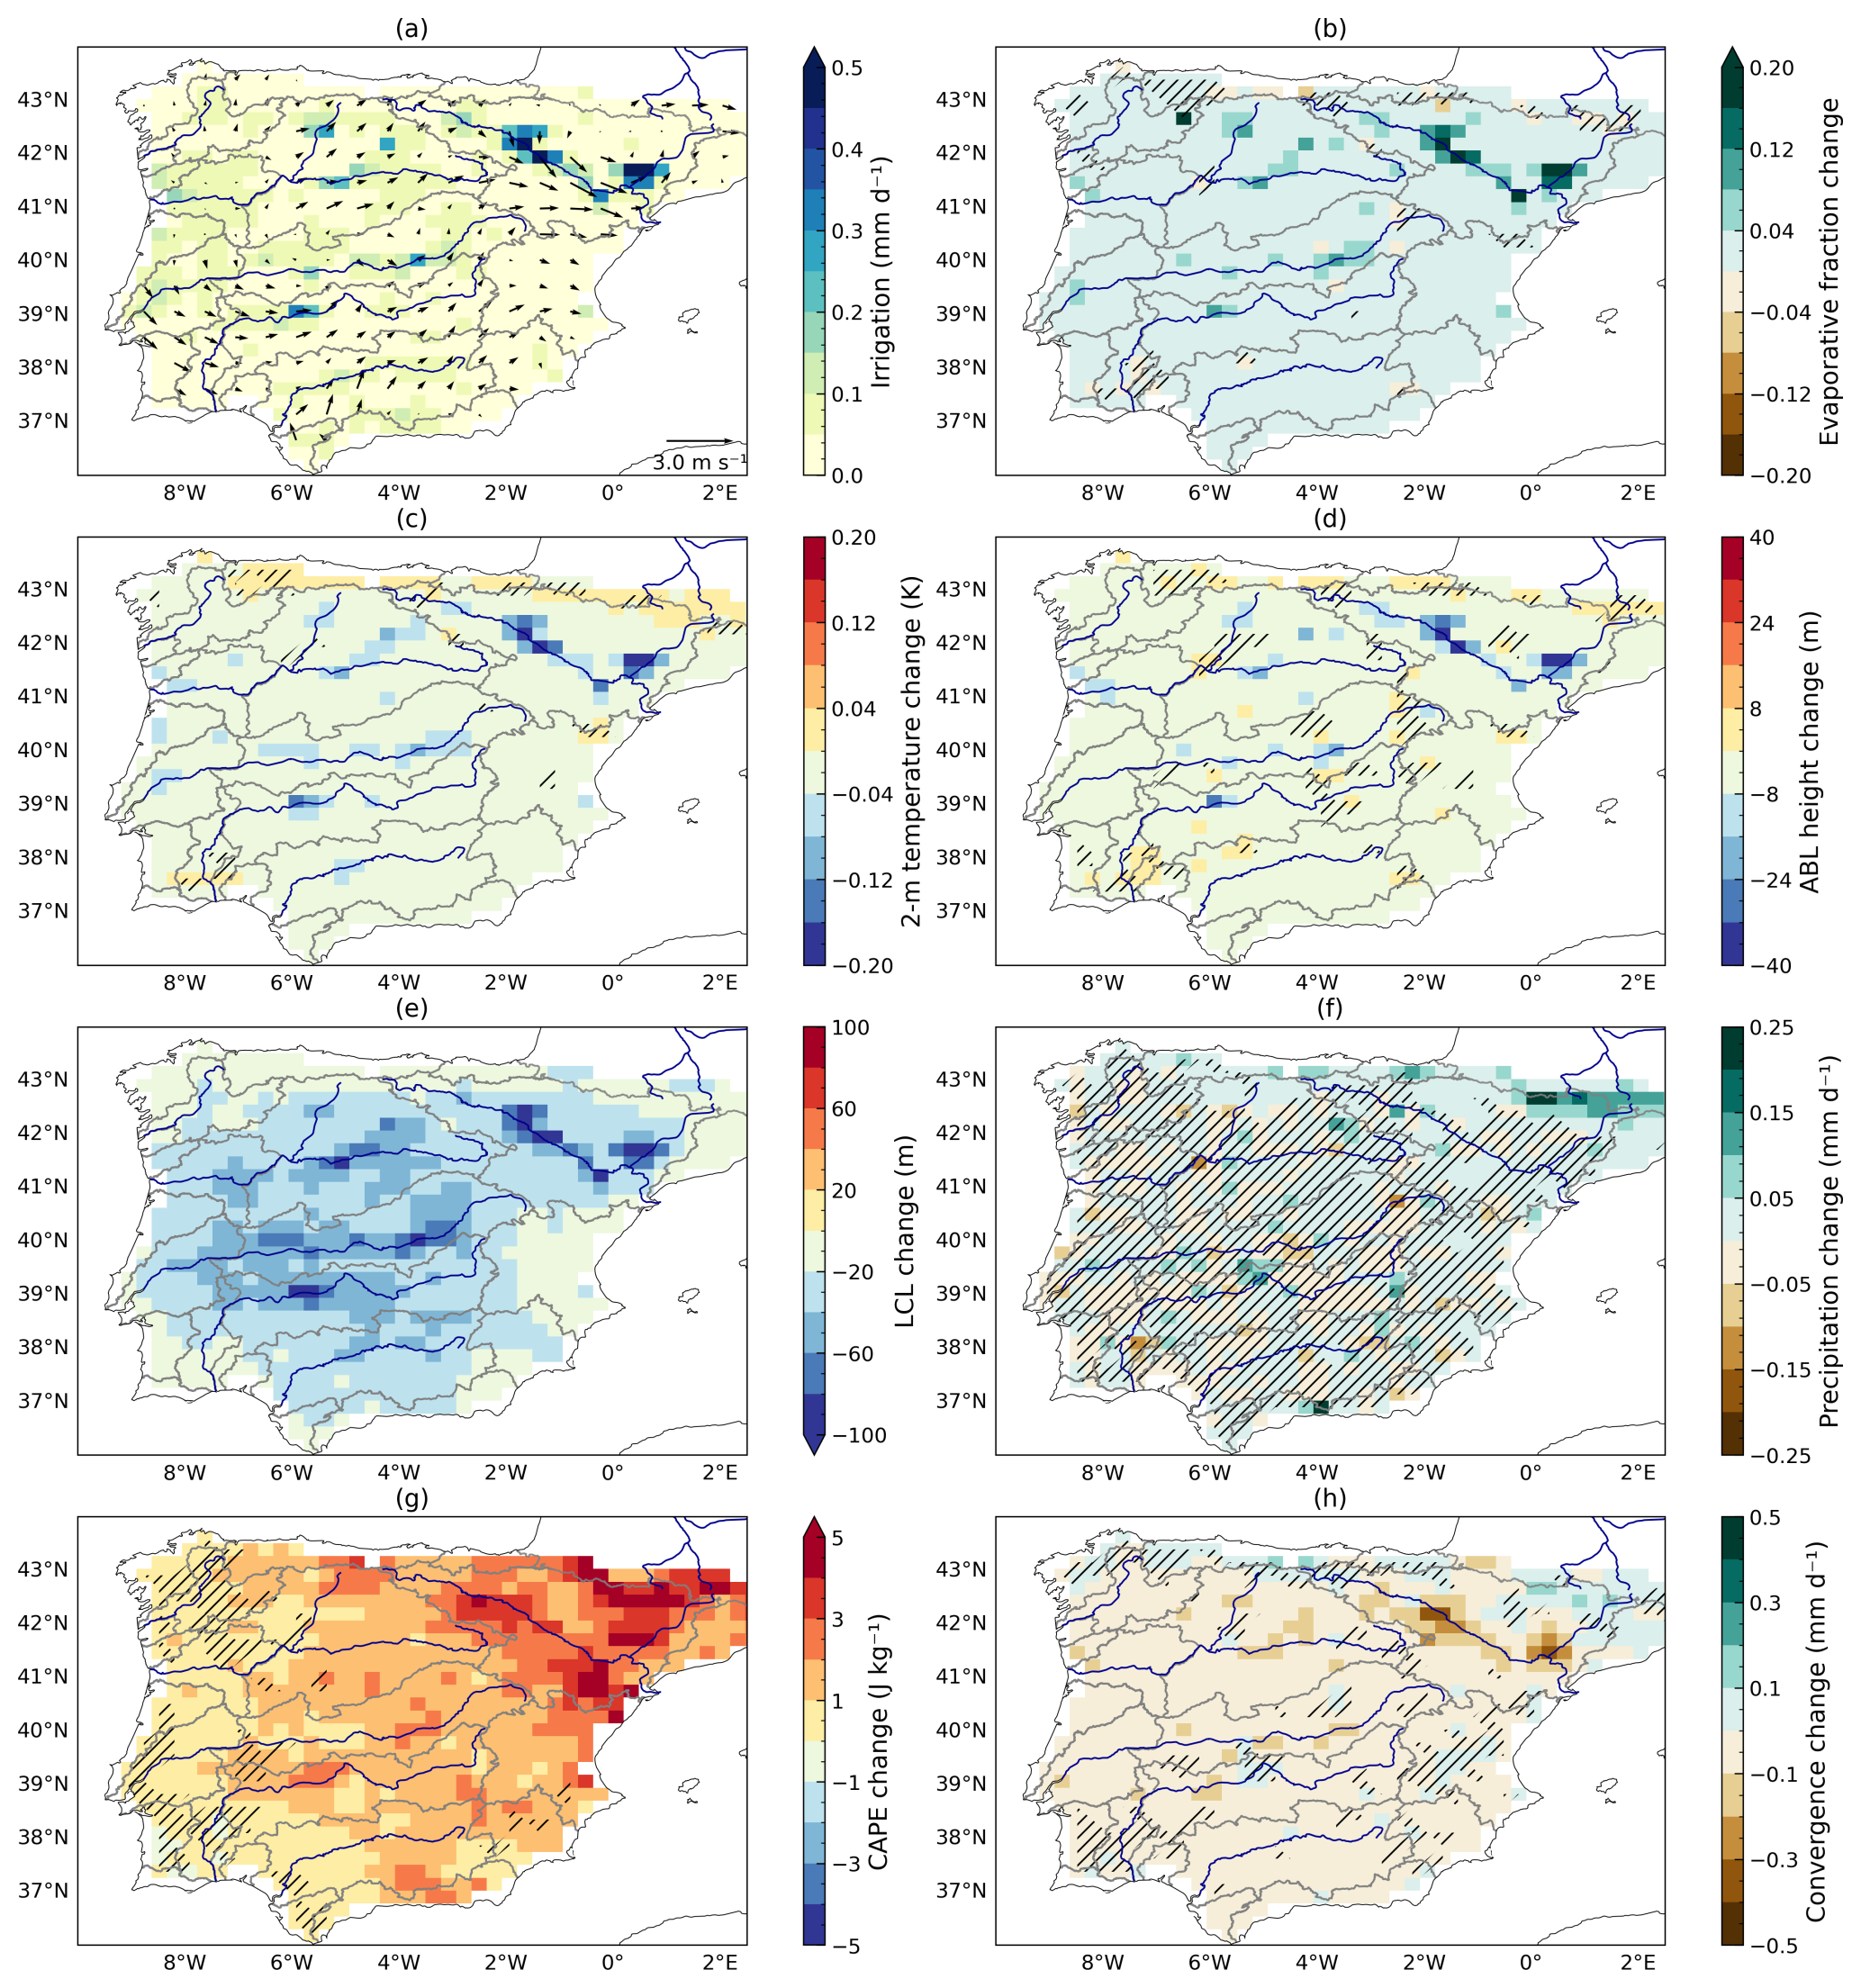
Figure G3Autumn irrigation and its impacts (SON, 2010–2022). (a) Irrigation (mm d−1) and 10 m wind (irr simulation). Mean changes in the presence of irrigation (irr − no_irr): (b) evaporative fraction, (c) 2 m temperature (K), (d) atmospheric boundary layer height (m), (e) lifting condensation level (m), (f) precipitation (mm d−1), (g) convective available potential energy (J kg−1), (h) moisture convergence (mm d−1). Hatching indicates areas where the change is not statistically significant.
The version of the ORCHIDEE LSM used for this study corresponds to tag 2.2, revision 8473 and is freely available from https://forge.ipsl.fr/orchidee/log/branches/ORCHIDEE_2_2 (last access: 17 April 2026). It is provided under a CeCILL-C license (French equivalent to the LGPL license). The LMDZ and DYNAMICO models are freely distributed at the following links https://web.lmd.jussieu.fr/~lmdz/pub/ (revision 4507) (last access: 14 May 2026) and https://gitlab.in2p3.fr/ipsl/projets/dynamico/dynamico (revision 4501) (last access: 14 May 2026).
The Python code used to produce the figures and tables of this manuscript is available at https://github.com/ptiengou/netcdf-scripts/blob/main/python_notebooks/LMDZOR/LAM_06_article_figures.ipynb (Tiengou, 2026).
The simulation outputs and observation data used are available at https://doi.org/10.5281/zenodo.17454875 (Tiengou, 2025).
PT ran the simulations, conducted the analysis, produced the figures and wrote the manuscript. AD and FC supervised the research, guided the analysis, and edited the manuscript.
The contact author has declared that none of the authors has any competing interests.
Publisher's note: Copernicus Publications remains neutral with regard to jurisdictional claims made in the text, published maps, institutional affiliations, or any other geographical representation in this paper. The authors bear the ultimate responsibility for providing appropriate place names. Views expressed in the text are those of the authors and do not necessarily reflect the views of the publisher.
The simulations were run using the IDRIS computational facilities (Institut du Développement et des Ressources en Informatique Scientifique, CNRS, France), under the allocations [AD010113599R1] and [A0150114642]. The authors acknowledge and thank Yann Meurdesoif and Antoine Bierjon for their assistance in running the LAM simulations with river routing and irrigation, as well as Julie Collignan for her help with river discharge observations. They also wish to thank Pedro Arboleda and Filipe Aires for helpful discussions while conducting the analysis. Finally, the authors thank the three reviewers for constructive comments and suggestions that led to substantial improvements of the manuscript, especially the first reviewer who accepted to follow-up after the first revisions.
This research has been supported by the French National Research Agency (ANR) as funder (under grant no. ANR-21-SOIL-0001).
This paper was edited by Anping Chen and reviewed by Shuchang Tang, Xabier Pedruzo Bagazgoitia, and one anonymous referee.
Adhikari, P., Geerts, B., Rahimi-Esfarjani, S., Smith, K., Shuman, B. N., and Schneider, T. L.: Evaluation of the Mountain Hydroclimate across the Western United States in Dynamically Downscaled Climate Models, J. Hydrometeorol., 25, 1877–1894, https://doi.org/10.1175/JHM-D-24-0063.1, 2024. a
Al-Yaari, A., Ducharne, A., Cheruy, F., Crow, W. T., and Wigneron, J.-P.: Satellite-based soil moisture provides missing link between summertime precipitation and surface temperature biases in CMIP5 simulations over conterminous United States, Sci. Rep., 9, 1657, https://doi.org/10.1038/s41598-018-38309-5, 2019. a
Al-Yaari, A., Ducharne, A., Thiery, W., Cheruy, F., and Lawrence, D.: The Role of Irrigation Expansion on Historical Climate Change: Insights From CMIP6, Earth's Future, 10, e2022EF002859, https://doi.org/10.1029/2022EF002859, 2022. a
Alexander, G. A., Holmes, H. A., Sun, X., Caputi, D., Faloona, I. C., and Oldroyd, H. J.: Simulating land-atmosphere coupling in the Central Valley, California: Investigating soil moisture impacts on boundary layer properties, Agr. Forest Meteorol., 317, 108898, https://doi.org/10.1016/j.agrformet.2022.108898, 2022. a
Alter, R. E., Im, E.-S., and Eltahir, E. A. B.: Rainfall consistently enhanced around the Gezira Scheme in East Africa due to irrigation, Nat. Geosci., 8, 763–767, https://doi.org/10.1038/ngeo2514, 2015. a
Arboleda-Obando, P. F., Ducharne, A., Yin, Z., and Ciais, P.: Validation of a new global irrigation scheme in the land surface model ORCHIDEE v2.2, Geosci. Model Dev., 17, 2141–2164, https://doi.org/10.5194/gmd-17-2141-2024, 2024. a, b, c, d, e, f
Arboleda-Obando, P. F., Ducharne, A., Cheruy, F., and Ghattas, J.: Joint evolution of irrigation, the water cycle and water resources under a strong climate change scenario from 1950 to 2100 in the IPSL-CM6, Earth Syst. Dynam., 16, 2201–2223, https://doi.org/10.5194/esd-16-2201-2025, 2025. a, b
Arjdal, K., Vignon, E., Driouech, F., Chéruy, F., Er-Raki, S., Sima, A., Chehbouni, A., and Drobinski, P.: Modeling Land–Atmosphere Interactions over Semiarid Plains in Morocco: In-Depth Assessment of GCM Stretched-Grid Simulations Using In Situ Data, J. Appl. Meteorol. Climatol., 63, 369–386, https://doi.org/10.1175/JAMC-D-23-0099.1, 2024. a, b
Baratgin, L., Polcher, J., Dumas, P., and Quirion, P.: Modeling hydropower operations at the scale of a power grid: a demand-based approach, Hydrol. Earth Syst. Sci., 28, 5479–5509, https://doi.org/10.5194/hess-28-5479-2024, 2024. a
Berg, A., Lintner, B. R., Findell, K., Seneviratne, S. I., Hurk, B. v. d., Ducharne, A., Chéruy, F., Hagemann, S., Lawrence, D. M., Malyshev, S., Meier, A., and Gentine, P.: Interannual Coupling between Summertime Surface Temperature and Precipitation over Land: Processes and Implications for Climate Change, J. Climate, 28, 1308–1328, https://doi.org/10.1175/JCLI-D-14-00324.1, 2015. a
Betts, A. K. and Ball, J. H.: The FIFE surface diurnal cycle climate, J. Geophys. Res.-Atmos., 100, 25679–25693, https://doi.org/10.1029/94JD03121, 1995. a
Bonfils, C. and Lobell, D.: Empirical evidence for a recent slowdown in irrigation-induced cooling, P. Natl. Acad. Sci. USA, 104, 13582–13587, https://doi.org/10.1073/pnas.0700144104, 2007. a
Boone, A.: Land surface Interactions with the Atmosphere over the Iberian Semi-arid Environment (LIAISE), HAL, https://hal.archives-ouvertes.fr/hal-02392949 (last access: 14 May 2026), 2019. a
Boone, A., Bellvert, J., Best, M., Brooke, J. K., Canut-Rocafort, G., Cuxart, J., Hartogensis, O., Moigne, P. L., Miró, J. R., Polcher, J., Price, J., Seguí, P. Q., Bech, J., Bezombes, Y., Branch, O., Cristóbal, J., Dassas, K., Fanise, P., Gibert, F., Goulas, Y., Groh, J., Hanus, J., Hmimina, G., Jarlan, L., Kim, E., Dantec, V. L., Page, M. L., Lohou, F., Lothon, M., Mangan, M. R., Martí, B., Martínez-Villagrasa, D., McGregor, J., Kerr-Munslow, A., Ouaadi, N., Philibert, A., Quiros-Vargas, J., Rascher, U., Siegmann, B., Udina, M., Vial, A., Wrenger, B., Wulfmeyer, V., and Zribi, M.: The Land Surface Interactions with the Atmosphere over the Iberian Semi-Arid Environment (LIAISE) field campaign, J. Eur. Meteorol. Soc., 2, 100007, https://doi.org/10.1016/j.jemets.2025.100007, 2025. a, b, c
Boucher, O., Servonnat, J., Albright, A. L., Aumont, O., Balkanski, Y., Bastrikov, V., Bekki, S., Bonnet, R., Bony, S., Bopp, L., Braconnot, P., Brockmann, P., Cadule, P., Caubel, A., Cheruy, F., Codron, F., Cozic, A., Cugnet, D., D'Andrea, F., Davini, P., de Lavergne, C., Denvil, S., Deshayes, J., Devilliers, M., Ducharne, A., Dufresne, J.-L., Dupont, E., Ethé, C., Fairhead, L., Falletti, L., Flavoni, S., Foujols, M.-A., Gardoll, S., Gastineau, G., Ghattas, J., Grandpeix, J.-Y., Guenet, B., Guez, Lionel, E., Guilyardi, E., Guimberteau, M., Hauglustaine, D., Hourdin, F., Idelkadi, A., Joussaume, S., Kageyama, M., Khodri, M., Krinner, G., Lebas, N., Levavasseur, G., Lévy, C., Li, L., Lott, F., Lurton, T., Luyssaert, S., Madec, G., Madeleine, J.-B., Maignan, F., Marchand, M., Marti, O., Mellul, L., Meurdesoif, Y., Mignot, J., Musat, I., Ottlé, C., Peylin, P., Planton, Y., Polcher, J., Rio, C., Rochetin, N., Rousset, C., Sepulchre, P., Sima, A., Swingedouw, D., Thiéblemont, R., Traore, A. K., Vancoppenolle, M., Vial, J., Vialard, J., Viovy, N., and Vuichard, N.: Presentation and Evaluation of the IPSL-CM6A-LR Climate Model, J. Adv. Model. Earth Sy., 12, e2019MS002010, https://doi.org/10.1029/2019MS002010, 2020. a
Brooke, J. K., Best, M. J., Lock, A. P., Osborne, S. R., Price, J., Cuxart, J., Boone, A., Canut-Rocafort, G., Hartogensis, O. K., and Roy, A.: Irrigation contrasts through the morning transition, Q. J. Roy. Meteor. Soc., 150, 170–194, https://doi.org/10.1002/qj.4590, 2023. a
Budyko: The heat balance of the earth's surface, Taylor & Francis, https://doi.org/10.1080/00385417.1961.10770761, 1956. a, b
Budyko and Miller, D.: Climate and Life, edited by: Miller, D. H., Academic Press, New York, ISBN 10:0121394506, 1974. a
Catalano, F., Alessandri, A., May, W., and Reerink, T.: Land-surface feedbacks on temperature and precipitation in CMIP6-LS3MIP projections, EGU General Assembly 2021, online, 19–30 April 2021, EGU21-12175, https://doi.org/10.5194/egusphere-egu21-12175, 2021. a
Cheruy, F., Campoy, A., Dupont, J.-C., Ducharne, A., Hourdin, F., Haeffelin, M., Chiriaco, M., and Idelkadi, A.: Combined influence of atmospheric physics and soil hydrology on the simulated meteorology at the SIRTA atmospheric observatory, Clim. Dynam., 40, 2251–2269, https://doi.org/10.1007/s00382-012-1469-y, 2013. a
Cheruy, F., Dufresne, J. L., Hourdin, F., and Ducharne, A.: Role of clouds and land-atmosphere coupling in midlatitude continental summer warm biases and climate change amplification in CMIP5 simulations, Geophys. Res. Lett., 41, 6493–6500, https://doi.org/10.1002/2014GL061145, 2014. a
Cheruy, F., Ducharne, A., Hourdin, F., Musat, I., Vignon, E., Gastineau, G., Bastrikov, V., Vuichard, N., Diallo, B., Dufresne, J., Ghattas, J., Grandpeix, J., Idelkadi, A., Mellul, L., Maignan, F., Ménégoz, M., Ottlé, C., Peylin, P., Servonnat, J., Wang, F., and Zhao, Y.: Improved Near‐Surface Continental Climate in IPSL‐CM6A‐LR by Combined Evolutions of Atmospheric and Land Surface Physics, J. Adv. Model. Earth Sy., 12, https://doi.org/10.1029/2019MS002005, 2020. a, b
Christensen, J. H. and Boberg, F.: Temperature dependent climate projection deficiencies in CMIP5 models, Geophys. Res. Lett., 39, https://doi.org/10.1029/2012GL053650, 2012. a
Cook, B. I., Shukla, S. P., Puma, M. J., and Nazarenko, L. S.: Irrigation as an historical climate forcing, Clim. Dynam., 44, 1715–1730, https://doi.org/10.1007/s00382-014-2204-7, 2015. a
Cook, B. I., McDermid, S. S., Puma, M. J., Williams, A. P., Seager, R., Kelley, M., Nazarenko, L., and Aleinov, I.: Divergent Regional Climate Consequences of Maintaining Current Irrigation Rates in the 21st Century, J. Geophys. Res.-Atmos., 125, e2019JD031814, https://doi.org/10.1029/2019JD031814, 2020. a, b
Custodio, E., Andreu-Rodes, J. M., Aragón, R., Estrela, T., Ferrer, J., García-Aróstegui, J. L., Manzano, M., Rodríguez-Hernández, L., Sahuquillo, A., and del Villar, A.: Groundwater intensive use and mining in south-eastern peninsular Spain: Hydrogeological, economic and social aspects, Sci. Total Environ., 559, 302–316, https://doi.org/10.1016/j.scitotenv.2016.02.107, 2016. a
Dari, J., Brocca, L., Modanesi, S., Massari, C., Tarpanelli, A., Barbetta, S., Quast, R., Vreugdenhil, M., Freeman, V., Barella-Ortiz, A., Quintana-Seguí, P., Bretreger, D., and Volden, E.: Regional data sets of high-resolution (1 and 6 km) irrigation estimates from space, Earth Syst. Sci. Data, 15, 1555–1575, https://doi.org/10.5194/essd-15-1555-2023, 2023. a, b, c, d
de Vrese, P. and Hagemann, S.: Uncertainties in modelling the climate impact of irrigation, Clim. Dynam., 51, 2023–2038, https://doi.org/10.1007/s00382-017-3996-z, 2018. a
DeAngelis, A., Dominguez, F., Fan, Y., Robock, A., Kustu, M. D., and Robinson, D.: Evidence of enhanced precipitation due to irrigation over the Great Plains of the United States, J. Geophys. Res.-Atmos., 115, https://doi.org/10.1029/2010JD013892, 2010. a, b
Devanand, A., Huang, M., Lawrence, D. M., Zarzycki, C. M., Feng, Z., Lawrence, P. J., Qian, Y., and Yang, Z.: Land Use and Land Cover Change Strongly Modulates Land-Atmosphere Coupling and Warm-Season Precipitation Over the Central United States in CESM2-VR, J. Adv. Model. Earth Sy., 12, e2019MS001925, https://doi.org/10.1029/2019MS001925, 2020. a
Dirmeyer, P. A.: The terrestrial segment of soil moisture–climate coupling, Geophys. Res. Lett., 38, https://doi.org/10.1029/2011GL048268, 2011. a
Dorigo, W., Wagner, W., Albergel, C., Albrecht, F., Balsamo, G., Brocca, L., Chung, D., Ertl, M., Forkel, M., Gruber, A., Haas, E., Hamer, P. D., Hirschi, M., Ikonen, J., de Jeu, R., Kidd, R., Lahoz, W., Liu, Y. Y., Miralles, D., Mistelbauer, T., Nicolai-Shaw, N., Parinussa, R., Pratola, C., Reimer, C., van der Schalie, R., Seneviratne, S. I., Smolander, T., and Lecomte, P.: ESA CCI Soil Moisture for improved Earth system understanding: State-of-the art and future directions, Remote Sens. Environ., 203, 185–215, https://doi.org/10.1016/j.rse.2017.07.001, 2017. a, b
Dubos, T., Dubey, S., Tort, M., Mittal, R., Meurdesoif, Y., and Hourdin, F.: DYNAMICO-1.0, an icosahedral hydrostatic dynamical core designed for consistency and versatility, Geosci. Model Dev., 8, 3131–3150, https://doi.org/10.5194/gmd-8-3131-2015, 2015. a, b
Ek, M. B. and Holtslag, A. A. M.: Influence of Soil Moisture on Boundary Layer Cloud Development, J. Hydrometeorol., 5, 86–99, https://doi.org/10.1175/1525-7541(2004)005<0086:IOSMOB>2.0.CO;2, 2004. a, b
Eltahir, E. A. B. and Bras, R. L.: Precipitation recycling, Rev. Geophys., 34, 367–378, https://doi.org/10.1029/96RG01927, 1996. a
Emanuel, K. A.: A Scheme for Representing Cumulus Convection in Large-Scale Models, J. Atmos. Sci., 48, 2313–2329, https://doi.org/10.1175/1520-0469(1991)048<2313:ASFRCC>2.0.CO;2, 1991. a
FAO – Aquastat: https://www.fao.org/aquastat/en/databases/dams (last access: 14 May 2026), 2009. a
Farran, F. C.: The Urgell canal, a human miracle, Per saber-ne m{\'e}s, edited by: Museu d'Història de Catalunya, Generalitat de Catalunya, Departament de Cultura, ISBN 978-84-10144-01-9, 2024. a
Fekete, B. M.: Danube river, Ceatal Izmail, monthly min-mean-max discharge, 1921–1984, PANGAEA [data set], https://doi.org/10.1594/PANGAEA.97167, 2003. a, b
Findell, K. L. and Eltahir, E. A. B.: Atmospheric Controls on Soil Moisture–Boundary Layer Interactions. Part I: Framework Development, J. Hydrometeorol., 4, 552–569, https://doi.org/10.1175/1525-7541(2003)004<0552:ACOSML>2.0.CO;2, 2003. a, b
Findell, K. L., Gentine, P., Lintner, B. R., and Kerr, C.: Probability of afternoon precipitation in eastern United States and Mexico enhanced by high evaporation, Nat. Geosci., 4, 434–439, https://doi.org/10.1038/ngeo1174, 2011. a
Fisher, R. A. and Koven, C. D.: Perspectives on the Future of Land Surface Models and the Challenges of Representing Complex Terrestrial Systems, J. Adv. Model. Earth Sy., 12, e2018MS001453, https://doi.org/10.1029/2018MS001453, 2020. a
Grandpeix, J.-Y. and Lafore, J.-P.: A Density Current Parameterization Coupled with Emanuel’s Convection Scheme. Part I: The Models, J. Atmos. Sci., 67, 881–897, https://doi.org/10.1175/2009JAS3044.1, 2010. a
Grandpeix, J.-Y., Phillips, V., and Tailleux, R.: Improved mixing representation in Emanuel's convection scheme, Q. J. Roy. Meteor. Soc., 130, 3207–3222, https://doi.org/10.1256/qj.03.144, 2004. a
Grandpeix, J.-Y., Lafore, J.-P., and Cheruy, F.: A Density Current Parameterization Coupled with Emanuel’s Convection Scheme. Part II: 1D Simulations, J. Atmos. Sci., 67, 898–922, https://doi.org/10.1175/2009JAS3045.1, 2010. a
Gruber, A., Scanlon, T., van der Schalie, R., Wagner, W., and Dorigo, W.: Evolution of the ESA CCI Soil Moisture climate data records and their underlying merging methodology, Earth Syst. Sci. Data, 11, 717–739, https://doi.org/10.5194/essd-11-717-2019, 2019. a, b
Guillod, B. P., Orlowsky, B., Miralles, D. G., Teuling, A. J., and Seneviratne, S. I.: Reconciling spatial and temporal soil moisture effects on afternoon rainfall, Nat. Commun., 6, 6443, https://doi.org/10.1038/ncomms7443, 2015. a
Guo, Z., Dirmeyer, P. A., Koster, R. D., Sud, Y. C., Bonan, G., Oleson, K. W., Chan, E., Verseghy, D., Cox, P., Gordon, C. T., McGregor, J. L., Kanae, S., Kowalczyk, E., Lawrence, D., Liu, P., Mocko, D., Lu, C.-H., Mitchell, K., Malyshev, S., McAvaney, B., Oki, T., Yamada, T., Pitman, A., Taylor, C. M., Vasic, R., and Xue, Y.: GLACE: The Global Land–Atmosphere Coupling Experiment. Part II: Analysis, J. Hydrometeorol., 7, 611–625, https://doi.org/10.1175/JHM511.1, 2006. a
Hay-Chapman, F. M. and Dirmeyer, P. A.: A Novel Method for Diagnosing Land-Atmosphere Coupling Sensitivity in a Single-Column Model, J. Hydrometeorol., 24, 2207–2223, https://doi.org/10.1175/JHM-D-22-0237.1, 2023. a
Hersbach, H., Bell, B., Berrisford, P., Hirahara, S., Horányi, A., Muñoz-Sabater, J., Nicolas, J., Peubey, C., Radu, R., Schepers, D., Simmons, A., Soci, C., Abdalla, S., Abellan, X., Balsamo, G., Bechtold, P., Biavati, G., Bidlot, J., Bonavita, M., De Chiara, G., Dahlgren, P., Dee, D., Diamantakis, M., Dragani, R., Flemming, J., Forbes, R., Fuentes, M., Geer, A., Haimberger, L., Healy, S., Hogan, R. J., Hólm, E., Janisková, M., Keeley, S., Laloyaux, P., Lopez, P., Lupu, C., Radnoti, G., de Rosnay, P., Rozum, I., Vamborg, F., Villaume, S., and Thépaut, J.-N.: The ERA5 global reanalysis, Q. J. Roy. Meteor. Soc., 146, 1999–2049, https://doi.org/10.1002/qj.3803, 2020. a
Hourdin, F., Jam, A., Rio, C., Couvreux, F., Sandu, I., Lefebvre, M.-P., Brient, F., and Idelkadi, A.: Unified Parameterization of Convective Boundary Layer Transport and Clouds With the Thermal Plume Model, J. Adv. Model. Earth Sy., 11, 2910–2933, https://doi.org/10.1029/2019MS001666, 2019. a
Hourdin, F., Rio, C., Grandpeix, J.-Y., Madeleine, J.-B., Cheruy, F., Rochetin, N., Jam, A., Musat, I., Idelkadi, A., Fairhead, L., Foujols, M.-A., Mellul, L., Traore, A.-K., Dufresne, J.-L., Boucher, O., Lefebvre, M.-P., Millour, E., Vignon, E., Jouhaud, J., Diallo, F. B., Lott, F., Gastineau, G., Caubel, A., Meurdesoif, Y., and Ghattas, J.: LMDZ6A: The Atmospheric Component of the IPSL Climate Model With Improved and Better Tuned Physics, J. Adv. Model. Earth Sy., 12, e2019MS001892, https://doi.org/10.1029/2019MS001892, 2020. a, b
Hurtt, G. C., Chini, L., Sahajpal, R., Frolking, S., Bodirsky, B. L., Calvin, K., Doelman, J. C., Fisk, J., Fujimori, S., Klein Goldewijk, K., Hasegawa, T., Havlik, P., Heinimann, A., Humpenöder, F., Jungclaus, J., Kaplan, J. O., Kennedy, J., Krisztin, T., Lawrence, D., Lawrence, P., Ma, L., Mertz, O., Pongratz, J., Popp, A., Poulter, B., Riahi, K., Shevliakova, E., Stehfest, E., Thornton, P., Tubiello, F. N., van Vuuren, D. P., and Zhang, X.: Harmonization of global land use change and management for the period 850–2100 (LUH2) for CMIP6, Geosci. Model Dev., 13, 5425–5464, https://doi.org/10.5194/gmd-13-5425-2020, 2020. a, b
IPCC: Climate Change 2021: The Physical Science Basis. Contribution of Working Group I to the Sixth Assessment Report of the Intergovernmental Panel on Climate Change, Cambridge University Press, Cambridge, United Kingdom and New York, NY, USA, https://doi.org/10.1017/9781009157896, 2021. a
Jiménez, M. A., Cuxart, J., Boone, A. A., Le Moigne, P., Lunel, T., Mercader, J., Miró, J. R., Best, M., and Brooke, J. K.: Land-surface interactions with the atmosphere over the Iberian Semi-arid Environment (LIAISE): First mesoscale modelling intercomparison, Q. J. Roy. Meteor. Soc., 151, e4949, https://doi.org/10.1002/qj.4949, 2025. a
King, J. C., Connolley, W. M., and Derbyshire, S. H.: Sensitivity of modelled Antarctic climate to surface and boundary-layer flux parametrizations, Q. J. Roy. Meteor. Soc., 127, 779–794, https://doi.org/10.1002/qj.49712757304, 2001. a
Klein, C. and Taylor, C. M.: Dry soils can intensify mesoscale convective systems, P. Natl. Acad. Sci. USA, 117, 21 132–21 137, https://doi.org/10.1073/pnas.2007998117, 2020. a
Koster, R. D., Suarez, M. J., Higgins, R. W., and Van den Dool, H. M.: Observational evidence that soil moisture variations affect precipitation, Geophys. Res. Lett., 30, https://doi.org/10.1029/2002GL016571, 2003. a
Koster, R. D., Dirmeyer, P. A., Guo, Z., Bonan, G., Chan, E., Cox, P., Gordon, C. T., Kanae, S., Kowalczyk, E., Lawrence, D., Liu, P., Lu, C.-H., Malyshev, S., McAvaney, B., Mitchell, K., Mocko, D., Oki, T., Oleson, K., Pitman, A., Sud, Y. C., Taylor, C. M., Verseghy, D., Vasic, R., Xue, Y., and Yamada, T.: Regions of Strong Coupling Between Soil Moisture and Precipitation, Science, 305, 1138–1140, https://doi.org/10.1126/science.1100217, 2004. a, b
Krinner, G., Viovy, N., de Noblet-Ducoudré, N., Ogée, J., Polcher, J., Friedlingstein, P., Ciais, P., Sitch, S., and Prentice, I. C.: A dynamic global vegetation model for studies of the coupled atmosphere-biosphere system, Glob. Biogeochem. Cycles, 19, https://doi.org/10.1029/2003GB002199, 2005. a, b
Lachenmeier, E., Mahmood, R., Phillips, C., Nair, U., Rappin, E., Pielke, R. A., Brown, W., Oncley, S., Wurman, J., Kosiba, K., Kaulfus, A., Santanello, J., Kim, E., Lawston-Parker, P., Hayes, M., and Franz, T. E.: Irrigated Agriculture Significantly Modifies Seasonal Boundary Layer Atmosphere and Lower-Tropospheric Convective Environment, J. Appl. Meteorol. Climatol., 63, 245–262, https://doi.org/10.1175/JAMC-D-23-0020.1, 2024. a
Laguë, M. M., Bonan, G. B., and Swann, A. L. S.: Separating the Impact of Individual Land Surface Properties on the Terrestrial Surface Energy Budget in both the Coupled and Uncoupled Land–Atmosphere System, J. Climate, 32, 5725–5744, https://doi.org/10.1175/JCLI-D-18-0812.1, 2019. a
Lawston-Parker, P., Santanello Jr., J. A., and Chaney, N. W.: Investigating the response of land–atmosphere interactions and feedbacks to spatial representation of irrigation in a coupled modeling framework, Hydrol. Earth Syst. Sci., 27, 2787–2805, https://doi.org/10.5194/hess-27-2787-2023, 2023. a
Leng, G., Leung, L. R., and Huang, M.: Significant impacts of irrigation water sources and methods on modeling irrigation effects in the ACME Land Model, J. Adv. Model. Earth Sy., 9, 1665–1683, https://doi.org/10.1002/2016MS000885, 2017. a
Liu, G., Wang, W., Shao, Q., Wei, J., Zheng, J., Liu, B., and Chen, Z.: Simulating the Climatic Effects of Irrigation Over China by Using the WRF-Noah Model System With Mosaic Approach, J. Geophys. Res.-Atmos., 126, e2020JD034428, https://doi.org/10.1029/2020JD034428, 2021. a
Lo, M.-H. and Famiglietti, J. S.: Irrigation in California's Central Valley strengthens the southwestern U.S. water cycle, Geophys. Res. Lett., 40, 301–306, https://doi.org/10.1002/grl.50108, 2013. a
Lo, M.-H., Wey, H.-W., Im, E.-S., Tang, L. I., Anderson, R. G., Wu, R.-J., Chien, R.-Y., Wei, J., AghaKouchak, A., and Wada, Y.: Intense agricultural irrigation induced contrasting precipitation changes in Saudi Arabia, Environ. Res. Lett., 16, 064049, https://doi.org/10.1088/1748-9326/ac002e, 2021. a
Lobera, G., Besné, P., Vericat, D., López-Tarazón, J. A., Tena, A., Aristi, I., Díez, J. R., Ibisate, A., Larrañaga, A., Elosegi, A., and Batalla, R. J.: Geomorphic status of regulated rivers in the Iberian Peninsula, Sci. Total Environ., 508, 101–114, https://doi.org/10.1016/j.scitotenv.2014.10.058, 2015. a
Louis, J.-F.: A parametric model of vertical eddy fluxes in the atmosphere, Bound.-Lay. Meteorol., 17, 187–202, https://doi.org/10.1007/BF00117978, 1979. a
Lunel, T., Boone, A. A., and Le Moigne, P.: Irrigation strongly influences near-surface conditions and induces breeze circulation: Observational and model-based evidence, Q. J. Roy. Meteor. Soc., 150, 2798–2819, https://doi.org/10.1002/qj.4736, 2024a. a, b, c
Lunel, T., Jimenez, M. A., Cuxart, J., Martinez-Villagrasa, D., Boone, A., and Le Moigne, P.: The marinada fall wind in the eastern Ebro sub-basin: physical mechanisms and role of the sea, orography and irrigation, Atmos. Chem. Phys., 24, 7637–7666, https://doi.org/10.5194/acp-24-7637-2024, 2024b. a, b
Lurton, T., Balkanski, Y., Bastrikov, V., Bekki, S., Bopp, L., Braconnot, P., Brockmann, P., Cadule, P., Contoux, C., Cozic, A., Cugnet, D., Dufresne, J.-L., Ethé, C., Foujols, M.-A., Ghattas, J., Hauglustaine, D., Hu, R.-M., Kageyama, M., Khodri, M., Lebas, N., Levavasseur, G., Marchand, M., Ottlé, C., Peylin, P., Sima, A., Szopa, S., Thiéblemont, R., Vuichard, N., and Boucher, O.: Implementation of the CMIP6 Forcing Data in the IPSL-CM6A-LR Model, J. Adv. Model. Earth Sy., 12, e2019MS001940, https://doi.org/10.1029/2019MS001940, 2020. a
Ma, H.-Y., Klein, S. A., Xie, S., Zhang, C., Tang, S., Tang, Q., Morcrette, C. J., Van Weverberg, K., Petch, J., Ahlgrimm, M., Berg, L. K., Cheruy, F., Cole, J., Forbes, R., Gustafson Jr, W. I., Huang, M., Liu, Y., Merryfield, W., Qian, Y., Roehrig, R., and Wang, Y.-C.: CAUSES: On the Role of Surface Energy Budget Errors to the Warm Surface Air Temperature Error Over the Central United States, J. Geophys. Res.-Atmos., 123, 2888–2909, https://doi.org/10.1002/2017JD027194, 2018. a
Madeleine, J.-B., Hourdin, F., Grandpeix, J.-Y., Rio, C., Dufresne, J.-L., Vignon, E., Boucher, O., Konsta, D., Cheruy, F., Musat, I., Idelkadi, A., Fairhead, L., Millour, E., Lefebvre, M.-P., Mellul, L., Rochetin, N., Lemonnier, F., Touzé-Peiffer, L., and Bonazzola, M.: Improved Representation of Clouds in the Atmospheric Component LMDZ6A of the IPSL-CM6A Earth System Model, J. Adv. Model. Earth Sy., 12, e2020MS002046, https://doi.org/10.1029/2020MS002046, 2020. a
Mangan, M. R., Hartogensis, O., Boone, A., Branch, O., Canut, G., Cuxart, J., de Boer, H. J., Le Page, M., Martínez-Villagrasa, D., Miró, J. R., Price, J., and Vilà-Guerau de Arellano, J.: The surface-boundary layer connection across spatial scales of irrigation-driven thermal heterogeneity: An integrated data and modeling study of the LIAISE field campaign, Agr. Forest Meteorol., 335, 10952, https://doi.org/10.1016/j.agrformet.2023.109452, 2023. a
Martens, B., Miralles, D. G., Lievens, H., van der Schalie, R., de Jeu, R. A. M., Fernández-Prieto, D., Beck, H. E., Dorigo, W. A., and Verhoest, N. E. C.: GLEAM v3: satellite-based land evaporation and root-zone soil moisture, Geosci. Model Dev., 10, 1903–1925, https://doi.org/10.5194/gmd-10-1903-2017, 2017. a
May, W.: The role of land-surface interactions for surface climate in the EC-Earth3 earth system model, Earth Syst. Dynam. Discuss. [preprint], https://doi.org/10.5194/esd-2023-13, 2023. a
McDermid, S., Nocco, M., Lawston-Parker, P., Keune, J., Pokhrel, Y., Jain, M., Jägermeyr, J., Brocca, L., Massari, C., Jones, A. D., Vahmani, P., Thiery, W., Yao, Y., Bell, A., Chen, L., Dorigo, W., Hanasaki, N., Jasechko, S., Lo, M.-H., Mahmood, R., Mishra, V., Mueller, N. D., Niyogi, D., Rabin, S. S., Sloat, L., Wada, Y., Zappa, L., Chen, F., Cook, B. I., Kim, H., Lombardozzi, D., Polcher, J., Ryu, D., Santanello, J., Satoh, Y., Seneviratne, S., Singh, D., and Yokohata, T.: Irrigation in the Earth system, Nat. Rev. Earth Environ., 4, 435–453, https://doi.org/10.1038/s43017-023-00438-5, 2023. a
Miralles, D. G., Bonte, O., Koppa, A., Baez-Villanueva, O. M., Tronquo, E., Zhong, F., Beck, H. E., Hulsman, P., Dorigo, W., Verhoest, N. E. C., and Haghdoost, S.: GLEAM4: global land evaporation and soil moisture dataset at 0.1° resolution from 1980 to near present, Sci. Data, 12, 416, https://doi.org/10.1038/s41597-025-04610-y, 2025. a, b
Mizuochi, H., Ducharne, A., Cheruy, F., Ghattas, J., Al-Yaari, A., Wigneron, J.-P., Bastrikov, V., Peylin, P., Maignan, F., and Vuichard, N.: Multivariable evaluation of land surface processes in forced and coupled modes reveals new error sources to the simulated water cycle in the IPSL (Institute Pierre Simon Laplace) climate model, Hydrol. Earth Syst. Sci., 25, 2199–2221, https://doi.org/10.5194/hess-25-2199-2021, 2021. a, b
Mlawer, E. J., Taubman, S. J., Brown, P. D., Iacono, M. J., and Clough, S. A.: Radiative transfer for inhomogeneous atmospheres: RRTM, a validated correlated-k model for the longwave, J. Geophys. Res.-Atmos., 102, 16663–16682, https://doi.org/10.1029/97JD00237, 1997. a
Monin, A. and Obukhov, A.: Osnovnye zakonomernosti turbulentnogo peremeshivanija v prizemnom sloe atmosfery (Basic laws of turbulent mixing in the atmosphere near the ground), Trudy geofiz. inst. AN SSSR, 24, 163–187, 1954. a
Morán-Tejeda, E., Lorenzo-Lacruz, J., López-Moreno, J. I., Ceballos-Barbancho, A., Zabalza, J., and Vicente-Serrano, S. M.: Reservoir Management in the Duero Basin (Spain): Impact on River Regimes and the Response to Environmental Change, Water Resour. Manage., 26, 2125–2146, https://doi.org/10.1007/s11269-012-0004-6, 2012. a
Mueller, B. and Seneviratne, S. I.: Systematic land climate and evapotranspiration biases in CMIP5 simulations, Geophys. Res. Lett., 41, 128–134, https://doi.org/10.1002/2013GL058055, 2014. a
Mwanthi, A. M., Mutemi, J. N., Dyer, E., James, R., Opijah, F. J., Webb, T., Mutua, F., Washington, R., Senior, C., Segele, Z., and Artan, G.: Representation of land–atmosphere coupling processes over Africa in coupled model intercomparison project Phase 6, Clim. Dynam., 62, 8389–8401, https://doi.org/10.1007/s00382-023-06710-0, 2024. a
Ngo-Duc, T., Laval, K., Ramillien, G., Polcher, J., and Cazenave, A.: Validation of the land water storage simulated by Organising Carbon and Hydrology in Dynamic Ecosystems (ORCHIDEE) with Gravity Recovery and Climate Experiment (GRACE) data, Water Resour. Res., 43, https://doi.org/10.1029/2006WR004941, 2007. a
Nocco, M. A., Smail, R. A., and Kucharik, C. J.: Observation of irrigation-induced climate change in the Midwest United States, Glob. Change Biol., 25, 3472–3484, https://doi.org/10.1111/gcb.14725, 2019. a
Phillips, C. E., Nair, U. S., Mahmood, R., Rappin, E., and Pielke Sr, R. A.: Influence of Irrigation on Diurnal Mesoscale Circulations: Results From GRAINEX, Geophys. Res. Lett., 49, e2021GL096822, https://doi.org/10.1029/2021GL096822, 2022. a
Pokhrel, Y., Hanasaki, N., Koirala, S., Cho, J., Yeh, P. J.-F., Kim, H., Kanae, S., and Oki, T.: Incorporating Anthropogenic Water Regulation Modules into a Land Surface Model, J. Hydrometeorol., 13, 255–269, https://doi.org/10.1175/JHM-D-11-013.1, 2012. a
Polcher, J., Piles, M., Gelati, E., Barella-Ortiz, A., and Tello, M.: Comparing surface-soil moisture from the SMOS mission and the ORCHIDEE land-surface model over the Iberian Peninsula, Remote Sens. Environ., 174, 69–81, https://doi.org/10.1016/j.rse.2015.12.004, 2016. a
Polcher, J., Schrapffer, A., Dupont, E., Rinchiuso, L., Zhou, X., Boucher, O., Mouche, E., Ottlé, C., and Servonnat, J.: Hydrological modelling on atmospheric grids: using graphs of sub-grid elements to transport energy and water, Geosci. Model Dev., 16, 2583–2606, https://doi.org/10.5194/gmd-16-2583-2023, 2023. a
Preimesberger, W., Scanlon, T., Su, C.-H., Gruber, A., and Dorigo, W.: Homogenization of Structural Breaks in the Global ESA CCI Soil Moisture Multisatellite Climate Data Record, IEEE T. Geosci. Remote, 59, 2845–2862, https://doi.org/10.1109/TGRS.2020.3012896, 2021. a
Puma, M. J. and Cook, B. I.: Effects of irrigation on global climate during the 20th century, J. Geophys. Res.-Atmos., 115, https://doi.org/10.1029/2010JD014122, 2010. a
Qian, Y., Huang, M., Yang, B., and Berg, L. K.: A Modeling Study of Irrigation Effects on Surface Fluxes and Land–Air–Cloud Interactions in the Southern Great Plains, J. Hydrometeorol., 14, 700–721, https://doi.org/10.1175/JHM-D-12-0134.1, 2013. a, b
Qian, Y., Yang, Z., Feng, Z., Liu, Y., Gustafson, W. I., Berg, L. K., Huang, M., Yang, B., and Ma, H.-Y.: Neglecting irrigation contributes to the simulated summertime warm-and-dry bias in the central United States, npj Climate and Atmospheric Science, 3, 1–10, https://doi.org/10.1038/s41612-020-00135-w, 2020. a, b
Raillard, L., Vignon, E., Rivière, G., Madeleine, J.-B., Meurdesoif, Y., Delanoë, J., Caubel, A., Jourdan, O., Baudoux, A., Fromang, S., and Conesa, P.: Leveraging RALI-THINICE Observations to Assess How the ICOLMDZ Model Simulates Clouds Embedded in Arctic Cyclones, J. Geophys. Res.-Atmos., 129, e2024JD040973, https://doi.org/10.1029/2024JD040973, 2024. a
Raoult, N., Delorme, B., Ottlé, C., Peylin, P., Bastrikov, V., Maugis, P., and Polcher, J.: Confronting Soil Moisture Dynamics from the ORCHIDEE Land Surface Model With the ESA-CCI Product: Perspectives for Data Assimilation, Remote Sens., 10, 1786, https://doi.org/10.3390/rs10111786, 2018. a
Rappin, E., Mahmood, R., Nair, U., Pielke, R. A., Brown, W., Oncley, S., Wurman, J., Kosiba, K., Kaulfus, A., Phillips, C., Lachenmeier, E., Santanello, J., Kim, E., and Lawston-Parker, P.: The Great Plains Irrigation Experiment (GRAINEX), B. Am. Meteorol. Soc., 102, E1756–E1785, https://doi.org/10.1175/BAMS-D-20-0041.1, 2021. a
Rappin, E., Mahmood, R., Nair, U. S., and Sr, R. A. P.: Land–Atmosphere Interactions during GRAINEX: Planetary Boundary Layer Evolution in the Presence of Irrigation, J. Hydrometeorol., 23, 1401–1417, https://doi.org/10.1175/JHM-D-21-0160.1, 2022. a, b, c
Reynolds, C. A., Jackson, T. J., and Rawls, W. J.: Estimating soil water-holding capacities by linking the Food and Agriculture Organization Soil map of the world with global pedon databases and continuous pedotransfer functions, Water Resour. Res., 36, 3653–3662, https://doi.org/10.1029/2000WR900130, 2000. a
Rio, C. and Hourdin, F.: A Thermal Plume Model for the Convective Boundary Layer: Representation of Cumulus Clouds, J. Atmos. Sci., 65, 407–425, https://doi.org/10.1175/2007JAS2256.1, 2008. a
Rio, C., Grandpeix, J.-Y., Hourdin, F., Guichard, F., Couvreux, F., Lafore, J.-P., Fridlind, A., Mrowiec, A., Roehrig, R., Rochetin, N., Lefebvre, M.-P., and Idelkadi, A.: Control of deep convection by sub-cloud lifting processes: the ALP closure in the LMDZ5B general circulation model, Clim. Dynam., 40, 2271–2292, https://doi.org/10.1007/s00382-012-1506-x, 2013. a
Rochetin, N., Couvreux, F., Grandpeix, J.-Y., and Rio, C.: Deep Convection Triggering by Boundary Layer Thermals. Part I: LES Analysis and Stochastic Triggering Formulation, J. Atmos. Sci., 71, 496–514, https://doi.org/10.1175/JAS-D-12-0336.1, 2014a. a
Rochetin, N., Grandpeix, J.-Y., Rio, C., and Couvreux, F.: Deep Convection Triggering by Boundary Layer Thermals. Part II: Stochastic Triggering Parameterization for the LMDZ GCM, J. Atmos. Sci., 71, 515–538, https://doi.org/10.1175/JAS-D-12-0337.1, 2014b. a
Rustemeier, E., Becker, A., Finger, P., Schneider, U., and Ziese, M.: GPCC Climatology Version 2020 at 0.25°: Monthly Land-Surface Precipitation Climatology for Every Month and the Total Year from Rain-Gauges built on GTS-based and Historical Data, Global Precipitation Climatology Centre [data set], https://doi.org/10.5676/DWD_GPCC/CLIM_M_V2020_025, 2020. a, b
Sabater, S., Elosegi, A., Feio, M. J., Gómez, R., Graça, M. A. S., Muñoz, I., Pardo, I., and Romaní, A. M.: Chapter 4 - The Iberian rivers, in: Rivers of Europe (Second Edition), edited by: Tockner, K., Zarfl, C., and Robinson, C. T., 181–224, Elsevier, ISBN 978-0-08-102612-0, https://doi.org/10.1016/B978-0-08-102612-0.00004-3, 2022. a
Sacks, W. J., Cook, B. I., Buenning, N., Levis, S., and Helkowski, J. H.: Effects of global irrigation on the near-surface climate, Clim. Dynam., 33, 159–175, https://doi.org/10.1007/s00382-008-0445-z, 2009. a
Sadki, M., Munier, S., Boone, A., and Ricci, S.: Implementation and sensitivity analysis of the Dam-Reservoir OPeration model (DROP v1.0) over Spain, Geosci. Model Dev., 16, 427–448, https://doi.org/10.5194/gmd-16-427-2023, 2023. a
Santanello, J. A., Dirmeyer, P. A., Ferguson, C. R., Findell, K. L., Tawfik, A. B., Berg, A., Ek, M., Gentine, P., Guillod, B. P., Heerwaarden, C. v., Roundy, J., and Wulfmeyer, V.: Land–Atmosphere Interactions: The LoCo Perspective, B. Am. Meteorol. Soc., 99, 1253–1272, https://doi.org/10.1175/BAMS-D-17-0001.1, 2018. a
Seneviratne, S. I., Corti, T., Davin, E. L., Hirschi, M., Jaeger, E. B., Lehner, I., Orlowsky, B., and Teuling, A. J.: Investigating soil moisture–climate interactions in a changing climate: A review, Earth-Sci. Rev., 99, 125–161, https://doi.org/10.1016/j.earscirev.2010.02.004, 2010. a
Seneviratne, S. I., Wilhelm, M., Stanelle, T., Hurk, B., Hagemann, S., Berg, A., Cheruy, F., Higgins, M. E., Meier, A., Brovkin, V., Claussen, M., Ducharne, A., Dufresne, J., Findell, K. L., Ghattas, J., Lawrence, D. M., Malyshev, S., Rummukainen, M., and Smith, B.: Impact of soil moisture‐climate feedbacks on CMIP5 projections: First results from the GLACE‐CMIP5 experiment, Geophys. Res. Lett., 40, 5212–5217, https://doi.org/10.1002/grl.50956, 2013. a
Siebert, S. and Döll, P.: Quantifying blue and green virtual water contents in global crop production as well as potential production losses without irrigation, J. Hydrol., 384, 198–217, https://doi.org/10.1016/j.jhydrol.2009.07.031, 2010. a
Siebert, S., Burke, J., Faures, J. M., Frenken, K., Hoogeveen, J., Döll, P., and Portmann, F. T.: Groundwater use for irrigation – a global inventory, Hydrol. Earth Syst. Sci., 14, 1863–1880, https://doi.org/10.5194/hess-14-1863-2010, 2010. a, b
Singh, A., Kumar, S., Chen, L., Maruf, M., Lawrence, P., and Lo, M.-H.: Land-Use Feedback under Global Warming–A Transition from Radiative to Hydrological Feedback Regime, J. Climate, 37, 3847–3866, https://doi.org/10.1175/JCLI-D-23-0426.1, 2024. a
Srivastava, A., Grotjahn, R., and Ullrich, P. A.: Evaluation of historical CMIP6 model simulations of extreme precipitation over contiguous US regions, Weather and Climate Extremes, 29, 100268, https://doi.org/10.1016/j.wace.2020.100268, 2020. a
Szilagyi, J. and Franz, T. E.: Anthropogenic hydrometeorological changes at a regional scale: observed irrigation–precipitation feedback (1979–2015) in Nebraska, USA, Sustainable Water Resources Management, 6, 1, https://doi.org/10.1007/s40899-020-00368-w, 2020. a
Taylor, C. M., de Jeu, R. A. M., Guichard, F., Harris, P. P., and Dorigo, W. A.: Afternoon rain more likely over drier soils, Nature, 489, 423–426, https://doi.org/10.1038/nature11377, 2012. a
Tiengou, P.: Simulating regional impacts of irrigation on the atmospheric and terrestrial water cycle using Earth System Model physics, Zenodo [data set], https://doi.org/10.5281/zenodo.17454875, 2025. a
Tiengou, P.: netcdf-scripts, GitHub [code], https://github.com/ptiengou/netcdf-scripts/blob/main/python_notebooks/LMDZOR/LAM_06_article_figures.ipynb (last access: 14 May 2026), 2026. a
Udina, M., Peinó, E., Polls, F., Mercader, J., Guerrero, I., Valmassoi, A., Paci, A., and Bech, J.: Irrigation impact on boundary layer and precipitation characteristics in Weather Research and Forecasting model simulations during LIAISE-2021, Q. J. Roy. Meteor. Soc., 150, 3251–3273, https://doi.org/10.1002/qj.4756, 2024. a, b, c, d, e
van den Hurk, B., Kim, H., Krinner, G., Seneviratne, S. I., Derksen, C., Oki, T., Douville, H., Colin, J., Ducharne, A., Cheruy, F., Viovy, N., Puma, M. J., Wada, Y., Li, W., Jia, B., Alessandri, A., Lawrence, D. M., Weedon, G. P., Ellis, R., Hagemann, S., Mao, J., Flanner, M. G., Zampieri, M., Materia, S., Law, R. M., and Sheffield, J.: LS3MIP (v1.0) contribution to CMIP6: the Land Surface, Snow and Soil moisture Model Intercomparison Project – aims, setup and expected outcome, Geosci. Model Dev., 9, 2809–2832, https://doi.org/10.5194/gmd-9-2809-2016, 2016. a
Vignon, E., Hourdin, F., Genthon, C., Van de Wiel, B. J. H., Gallée, H., Madeleine, J.-B., and Beaumet, J.: Modeling the Dynamics of the Atmospheric Boundary Layer Over the Antarctic Plateau With a General Circulation Model, J. Adv. Model. Earth Sy., 10, 98–125, https://doi.org/10.1002/2017MS001184, 2018. a
Wang, T., Ottlé, C., Boone, A., Ciais, P., Brun, E., Morin, S., Krinner, G., Piao, S., and Peng, S.: Evaluation of an improved intermediate complexity snow scheme in the ORCHIDEE land surface model, J. Geophys. Res.-Atmos., 118, 6064–6079, https://doi.org/10.1002/jgrd.50395, 2013. a
Weedon, G. P., Balsamo, G., Bellouin, N., Gomes, S., Best, M. J., and Viterbo, P.: The WFDEI meteorological forcing data set: WATCH Forcing Data methodology applied to ERA-Interim reanalysis data, Water Resour. Res., 50, 7505–7514, https://doi.org/10.1002/2014WR015638, 2014. a
Wei, J. and Dirmeyer, P. A.: Dissecting soil moisture-precipitation coupling, Geophys. Res. Lett., 39, https://doi.org/10.1029/2012GL053038, 2012. a
Whitesel, D., Mahmood, R., Phillips, C., Roundy, J., Rappin, E., Flanagan, P., Santanello, J. A., Nair, U., and Pielke, R.: Assessing the Convective Environment over Irrigated and Nonirrigated Land Use with Land–Atmosphere Coupling Metrics: Results from GRAINEX, J. Hydrometeorol., 25, 1061–1080, https://doi.org/10.1175/JHM-D-23-0187.1, 2024. a
Williams, I. N., Lu, Y., Kueppers, L. M., Riley, W. J., Biraud, S. C., Bagley, J. E., and Torn, M. S.: Land-atmosphere coupling and climate prediction over the U.S. Southern Great Plains, J. Geophys. Res.-Atmos., 121, 12,125–12,144, https://doi.org/10.1002/2016JD025223, 2016. a
Yamada, T.: Simulations of Nocturnal Drainage Flows by a q2l Turbulence Closure Model, J. Atmos. Sci., 40, 91–106, https://doi.org/10.1175/1520-0469(1983)040<0091:SONDFB>2.0.CO;2, 1983. a
Yamazaki, D., Ikeshima, D., Sosa, J., Bates, P. D., Allen, G. H., and Pavelsky, T. M.: MERIT Hydro: A High-Resolution Global Hydrography Map Based on Latest Topography Dataset, Water Resour. Res., 55, 5053–5073, https://doi.org/10.1029/2019WR024873, 2019. a
Yang, Z., Dominguez, F., Zeng, X., Hu, H., Gupta, H., and Yang, B.: Impact of Irrigation over the California Central Valley on Regional Climate, J. Hydrometeorol., https://doi.org/10.1175/JHM-D-16-0158.1, 2017. a, b, c
Yao, Y., Vanderkelen, I., Lombardozzi, D., Swenson, S., Lawrence, D., Jägermeyr, J., Grant, L., and Thiery, W.: Implementation and Evaluation of Irrigation Techniques in the Community Land Model, J. Adv. Model. Earth Sy., 14, e2022MS003074, https://doi.org/10.1029/2022MS003074, 2022. a
Yao, Y., Aas, K. S., Arboleda Obando, P., Bentsen, M., Chen, L., Cook, B., Devaraju, N., Ducharne, A., Gosling, S., Hartley, A., Jägermeyr, J., Jones, C., Kim, H., Lawrence, D., Lawrence, P., Leung, R., Lo, M.-H., and McDermid, S. and the IRRMIP members: Irrigation-expansion-induced impacts model-intercomparison project (IRRMIP), EGU General Assembly 2023, Vienna, Austria, 23–28 Apr 2023, EGU23-14584, https://doi.org/10.5194/egusphere-egu23-14584, 2023. a
Yuan, S., Quiring, S. M., and Leasor, Z. T.: Historical Changes in Surface Soil Moisture Over the Contiguous United States: An Assessment of CMIP6, Geophys. Res. Lett., 48, e2020GL089991, https://doi.org/10.1029/2020GL089991, 2021. a, b
Zarakas, C. M., Kennedy, D., Dagon, K., Lawrence, D. M., Liu, A., Bonan, G., Koven, C., Lombardozzi, D., and Swann, A. L. S.: Land Processes Can Substantially Impact the Mean Climate State, Geophys. Res. Lett., 51, e2024GL108372, https://doi.org/10.1029/2024GL108372, 2024. a
Zhang, Z., He, C., Chen, F., Miguez-Macho, G., Liu, C., and Rasmussen, R.: US Corn Belt enhances regional precipitation recycling, P. Natl. Acad. Sci. USA, 122, e2402656121, https://doi.org/10.1073/pnas.2402656121, 2025. a
Zou, X., Wang, G., Hagan, D. F. T., Li, S., Wei, J., Lu, J., Qiao, Y., Zhu, C., Ullah, W., and Yeboah, E.: Precipitation Sensitivity to Soil Moisture Changes in Multiple Global Climate Models, Atmosphere, 14, 1531, https://doi.org/10.3390/atmos14101531, 2023. a
- Abstract
- Introduction
- Methods
- Results
- Discussion and conclusions
- Appendix A: Offline parameter tuning of irrigation scheme
- Appendix B: Three-year spin-up
- Appendix C: River discharge
- Appendix D: Seasonal comparison to evaluation products
- Appendix E: Influence of irrigation on surface soil moisture
- Appendix F: Influence of snow
- Appendix G: Impacts of irrigation on land-atmosphere interactions in other seasons
- Code and data availability
- Author contributions
- Competing interests
- Disclaimer
- Acknowledgements
- Financial support
- Review statement
- References