the Creative Commons Attribution 4.0 License.
the Creative Commons Attribution 4.0 License.
 | 22 Apr 2026
Stratospheric aerosol injection geoengineering has the potential to increase land carbon storage and to protect the Amazon rainforest
Isobel M. Parry
Paul D. L. Ritchie
Olivier Boucher
Peter M. Cox
James M. Haywood
Ulrike Niemeier
Roland Séférian
Simone Tilmes
Daniele Visioni
Solar radiation modification (SRM) aims to artificially cool the Earth, counteracting warming from anthropogenic greenhouse gases by increasing the reflection of incoming sunlight. One SRM strategy is stratospheric aerosol injection (SAI), which mimics explosive volcanoes by injecting aerosols into the stratosphere. There are concerns that SAI could suppress vegetation productivity by reducing the amount of sunlight reaching the Earth's surface and by shifting rainfall patterns. Here we examine results from five Earth System Models that use SAI to reduce the global mean temperature from that of a high emissions world (SSP585), to that of a more moderate global warming scenario (SSP245). Compared to SSP245, the SAI simulations project higher global net primary productivity (NPP) values (+15.6 %) and higher land carbon storage (+5.9 %), primarily because of increased CO2 fertilisation. The effects of SAI are especially clear in Amazonia where land carbon storage increases compared to both SSP245 (+8.6 %) and SSP585 (+10.8 %), even though the latter scenario has the same atmospheric CO2 scenario as the SAI scenario. Our results therefore suggest that SAI could provide some protection against the risk of climate change induced carbon losses from the Amazon rainforest, though this is not universally observed in all tropical forests. Additionally, we observe decreases in NPP and land carbon storage in some regions, such as eastern Africa, the northern high latitudes, and Indonesia.
- Article
(7254 KB) - Full-text XML
-
Supplement
(2167 KB) - BibTeX
- EndNote


The 2015 Paris Climate Agreement set out to hold global warming to well below 2 °C, and to pursue efforts to limit global warming to 1.5 °C above pre-industrial levels (Britain, 2009). However, global anthropogenic CO2 emissions – the primary cause of global warming – have continued to rise, reaching new record highs in 2023 and 2024. The global temperature for 2023 was between 1.34 and 1.54 °C warmer than pre-industrial (Witze, 2024), while 2024 had a global warming of 1.55 °C (±0.13 °C) (World Meteorological Organization (WMO), 2025). The Paris targets apply to decade-long warming, but even then, it is estimated that a little more than a decade of current global CO2 emissions would take decadal mean warming over 1.5 °C (Cox et al., 2024; Betts et al., 2023). Avoiding 1.5 °C of global warming therefore looks increasingly unlikely through conventional mitigation, even if carbon dioxide removal measures are also employed at scale.
Further global warming also increases the risks associated with potential climate tipping points, such as ice-sheet melt, collapse of the ocean's thermohaline circulation, and Amazon Forest dieback (Armstrong McKay et al., 2022; Parry et al., 2022). Climate tipping points are described as conditions beyond which the changes in a part of the climate system become self-perpetuating, often with abrupt and significant impact (Armstrong McKay et al., 2022). In many cases, there may be early warning signals for these tipping points, and for slower tipping elements such as ice sheet melt, there may be sufficient time to avoid tipping through the management of greenhouse gases alone (Ritchie et al., 2021). However, for faster tipping elements such as forest dieback, a faster acting “emergency” measure would be required to avoid tipping.
The failure of humanity to slow global warming, and reduce the associated tipping point risks, has led to a surge in research around Solar Radiation Modification (SRM). The IPCC states that SRM refers to a range of radiation modification measures not related to greenhouse gas (GHG) mitigation that seek to limit global warming. Most methods involve reducing the amount of incoming solar radiation reaching the surface, but others also act on the longwave radiation budget by reducing optical thickness and cloud lifetime (Calvin et al., 2023). Stratospheric aerosol injection (SAI) is the most prominent SRM approach. This aims to mimic the cooling effect of explosive volcanoes by injecting reflective aerosols, or their gaseous precursors, into the stratosphere (Crutzen, 2006; Robock et al., 2009). SAI has the potential to rapidly cool the planet, but there are numerous concerns about this approach associated with governance, equity, moral hazard, and unintended consequences (Robock, 2020; Abiodun et al., 2021; Pope et al., 2012; Trisos et al., 2018; Barrett, 2008; Haywood et al., 2022b). SRM is also a topic that elicits very strong responses, which has tended to marginalise SRM research, at a time when it needs to be discussed more widely and openly (Wieners et al., 2023).
Here we address questions about the potential impact of SAI on global vegetation productivity, land carbon storage (the storage of carbon in terrestrial ecosystems, in vegetation, soil and litter) and the risk of climate-driven Amazon Forest carbon loss (Cox et al., 2004; Trisos et al., 2018; Barrett, 2008). Both land carbon storage and net primary productivity (NPP – the rate at which carbon is gained via photosynthesis minus respiratory losses) are often used as proxies for evaluating vegetation health. NPP reflects regional carbon sequestration via photosynthesis, and land carbon storage is directly impacted by carbon stored within vegetation. We use results from recent Geoengineering Model Intercomparison Project (GeoMIP) projections (Kravitz et al., 2015; Visioni et al., 2021) carried out with five of the latest Coupled Model Intercomparison Project Phase 6 (CMIP6) (Eyring et al., 2016) generation of Earth Systems Models (ESMs). Instances of Amazon forest dieback in CMIP6 models are typically associated with declining net primary productivity (NPP) (Cox et al., 2004), we therefore look specifically at how SAI may affect the change in NPP in Amazonia. These ESMs model the responses of global vegetation and land carbon storage to changes in climate and atmospheric CO2. All of these models include some parametrisation of nutrient constraints on CO2 fertilisation of photosynthesis (Norby, 2011; Terrer et al., 2018), and therefore on the resulting increases in NPP and land carbon storage. Three have an explicit nitrogen cycle, while the other two represent implicit nutrient limitations (Arora et al., 2020).
We examine the projected climate under SAI (G6sulfur), which aims to reduce global temperatures by reducing the radiative forcing levels from the high emissions scenario (SSP585) to the medium forcing scenario (SSP245) using equatorial SO2 injections into the stratosphere. We also compare to a medium emissions scenario (SSP245) which reaches a similar global warming to G6sulfur, but through reduced greenhouse gas concentrations rather than SAI. Therefore, the comparison between G6sulfur and SSP245 allows us to compare the impacts of SAI to the impacts of a similar level of global warming achieved through conventional mitigation. Since G6sulfur applies the higher CO2 scenario of SSP585, G6Sulfur will benefit from a higher CO2 fertilisation. By contrast, the comparison between G6sulfur and SSP585 isolates the climatic impacts of SAI. To represent the uncertainties in the model projections we present our results as a likely range (plus and minus one standard deviation) around an ensemble mean as well as the individual ESM projections.
Previous single-model studies have explored changes in NPP under SRM scenarios (Xia et al., 2016; Dagon and Schrag, 2019; Yang et al., 2020; Lauvset et al., 2017; Tjiputra et al., 2016; Zhao and Cao, 2022; Jones et al., 2011; Duan et al., 2020; Lee et al., 2021). Multi-model simulations include Kravitz et al. (2013, 2021); Glienke et al. (2015); Plazzotta et al. (2019), however, these studies assumed that the impact of SAI is equivalent to turning down the solar constant (GeoMIP G1); they did not explicitly represent the transport, and chemical evolution of sulphate aerosols. A multi-model study of the impacts of explicit SAI injection was carried out using the previous generation of GeoMIP G4 simulations (Plazzotta et al., 2018) but did not describe the simulated responses of vegetation. Here, we use the GeoMIP G6 simulations carried out with the more recent CMIP6 ESMs. We focus specifically on the potential impacts of SAI on the Amazon rainforest, which is one of the most diverse ecosystems on Earth and may be vulnerable to both CO2-induced climate change (Cox et al., 2004) and shifting rainfall patterns due to changing aerosol loadings (Jones et al., 2013; Cox et al., 2008). Key questions that we address include: (i) how will the reduced sunlight at the surface affect vegetation productivity; and (ii) how will any residual regional climate change impact vegetation?
2.1 CMIP6 models, experiment runs, and data used
Our study focuses on results from Earth System Model simulations from Phase 6 of the Coupled Model Intercomparison Project (CMIP6) (Eyring et al., 2016) for three scenarios, namely SSP245, SSP585 and G6sulfur (Kravitz et al., 2015; O'Neill et al., 2016). Broadly, SSP585 is a fossil fuel intensive high emissions scenario, while SSP245 is a medium radiative forcing scenario with medium challenges to conventional mitigation, which assumes that historical trends continue without substantial deviations (O'Neill et al., 2016). Both scenarios run from 2015 to 2100. G6sulfur is part of the Geoengineering Model Intercomparison Project (GeoMIP). G6sulfur sets out to reduce the forcing from the high forcing scenario (SSP585) to the medium forcing scenario (SSP245) using stratospheric sulphate aerosols injected in a line from 10° S to 10° N along a single longitude band (0°), starting in 2020 and continuing to 2100. The amount of sulphate injection required to reduce radiative forcing to that of the medium forcing scenario SSP245 varies between models and the necessary amount is calculated on an individual model basis (Kravitz et al., 2015). Table 1 highlights differences between how individual models simulate G6sulfur. Fires are an important mediator of forest dieback and form part of a positive feedback loop that can lead to abrupt losses of vegetation. Thus, when analysing the simulation of dieback dynamics, it is important to identify which models explicitly represent fire processes (Table 2). All three scenarios were concatenated onto historical runs (1850–2014) for each model. G6sulfur simulations begin in 2020, and so for the missing five years from 2015–2019 SSP585 data is used to bridge the gap. MPI and CNRM initiate the G6sulfur simulations slightly earlier than the other modelling groups (2015 rather than 2020). As the baseline experiment for G6sulfur is SSP585, the years preceding the onset of SAI in 2020 correspond to SSP585 simulations. Therefore, after concatenation, all models can be treated the same.
(Tilmes et al., 2022)(Visioni et al., 2021)(Danabasoglu et al., 2020)(MacMartin et al., 2017)(Séférian et al., 2019)(Tilmes et al., 2015)(Tilmes et al., 2015)(Boucher et al., 2020b)(Mauritsen et al., 2019)(Niemeier and Schmidt, 2017)(Niemeier and Schmidt, 2017)(Sellar et al., 2019)Table 1Details of G6sulfur experiment setup within the models analysed in this work.
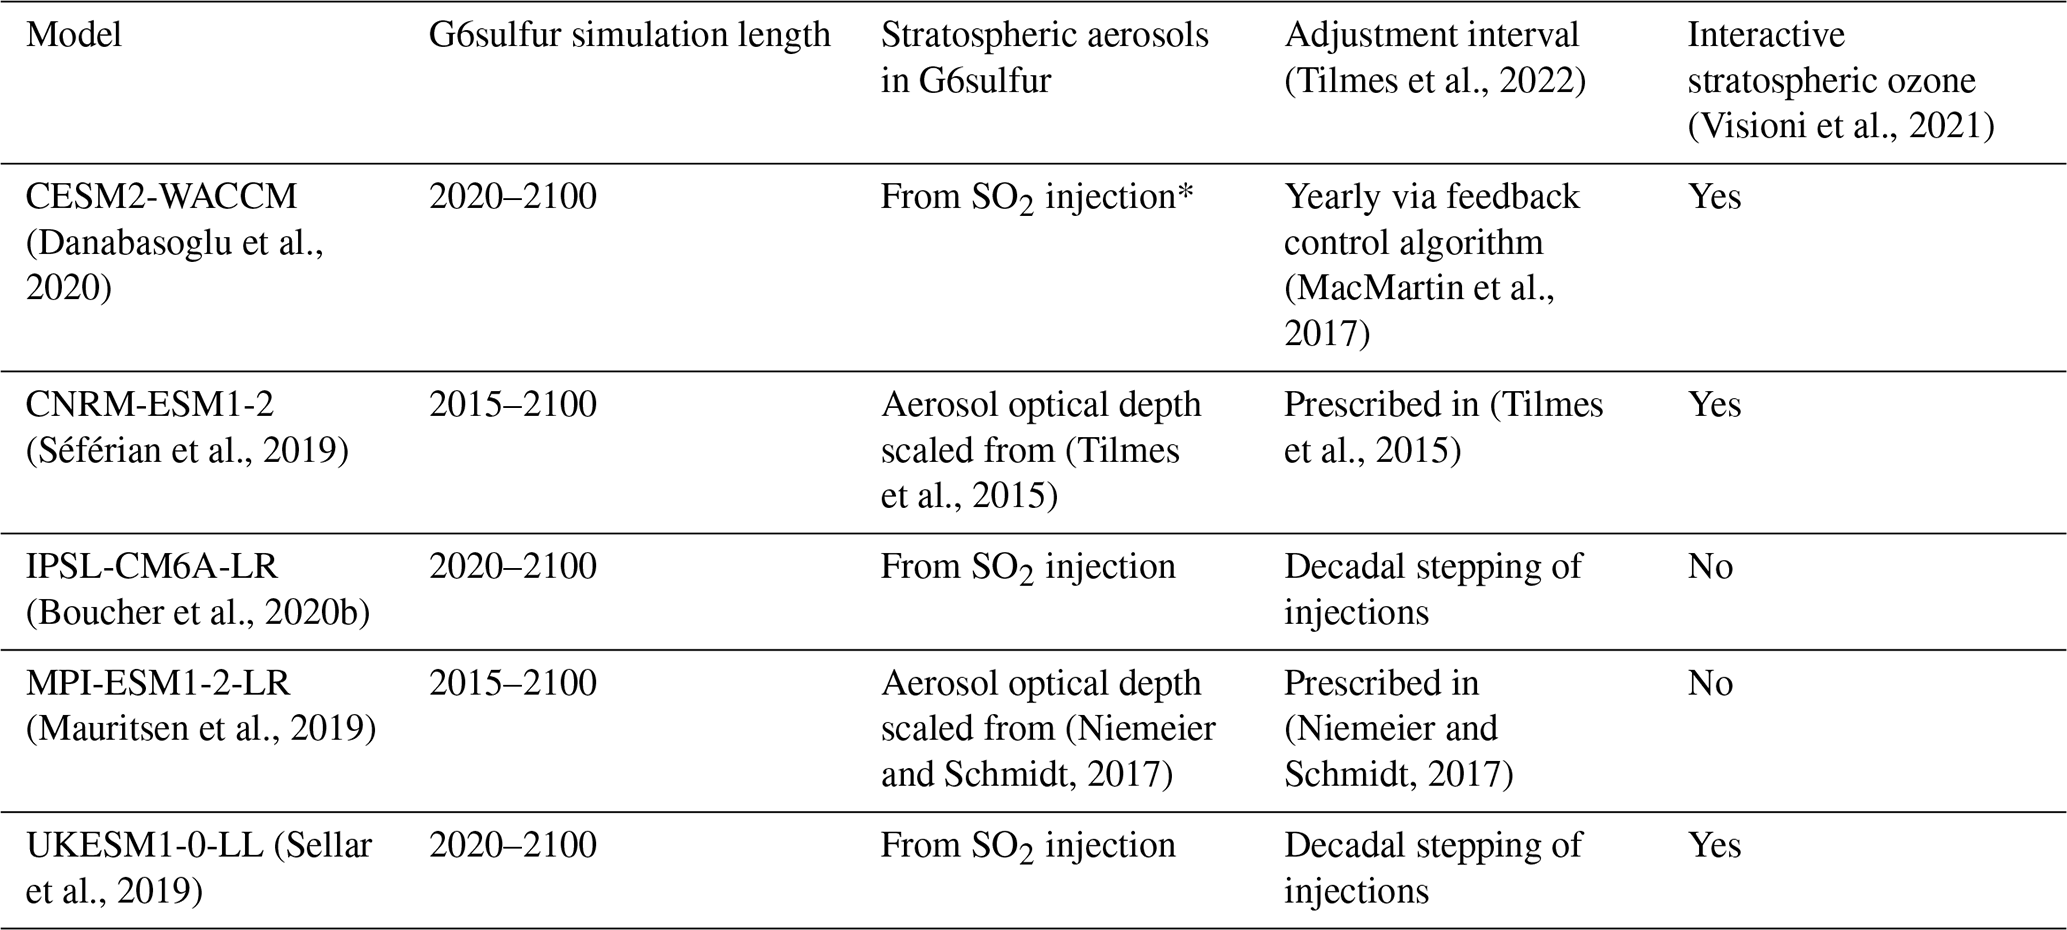
* Injected at the Equator at 25 km in deviation from the protocol described by Kravitz et al. (2015), Visioni et al. (2021).
For this study, single ensemble members from five climate models (provided in Table 2) that performed the G6sulfur CMIP6 simulation are used (Meehl et al., 2014). We examine the model output diagnostics for terrestrial carbon storage (cLand) and net primary productivity (NPP) to assess the impact of the SAI (G6sulfur) GeoMIP experiment on the terrestrial carbon cycle. Four of the models used in this study show good agreement with observations for land ecosystems and the carbon cycle according to the IPCC AR6 report (the fifth, CNRM-ESM1-2, was not assessed in this chapter of the AR6; Canadell et al., 2023). We also analyse surface temperature and precipitation differences as these are key for explaining the differences across the scenarios. All data from the CMIP6 experiments were first linearly interpolated onto a world grid with 1° × 1° resolution. Analysis of the Amazon used a region defined by the latitudes 20° S to 14° N and longitudes 83 to 34° W.
(Danabasoglu et al., 2020)(Séférian et al., 2019)(Yin, 2002)(Boucher et al., 2020b)(Mauritsen et al., 2019)(Sellar et al., 2019)Table 2The 5 CMIP6 Earth System models included in this study and relevant features of their land carbon cycle components (Arora et al., 2020).
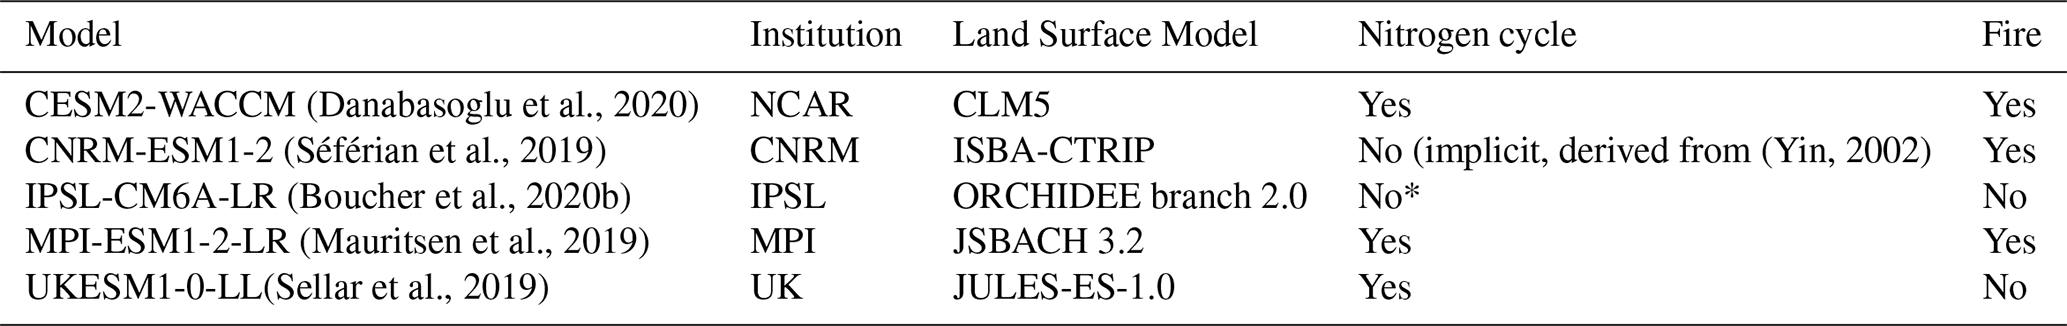
* No nitrogen cycle is included, but there is a parametrisation to limit CO2 fertilisation at high concentrations of CO2 (Boucher et al., 2020b).
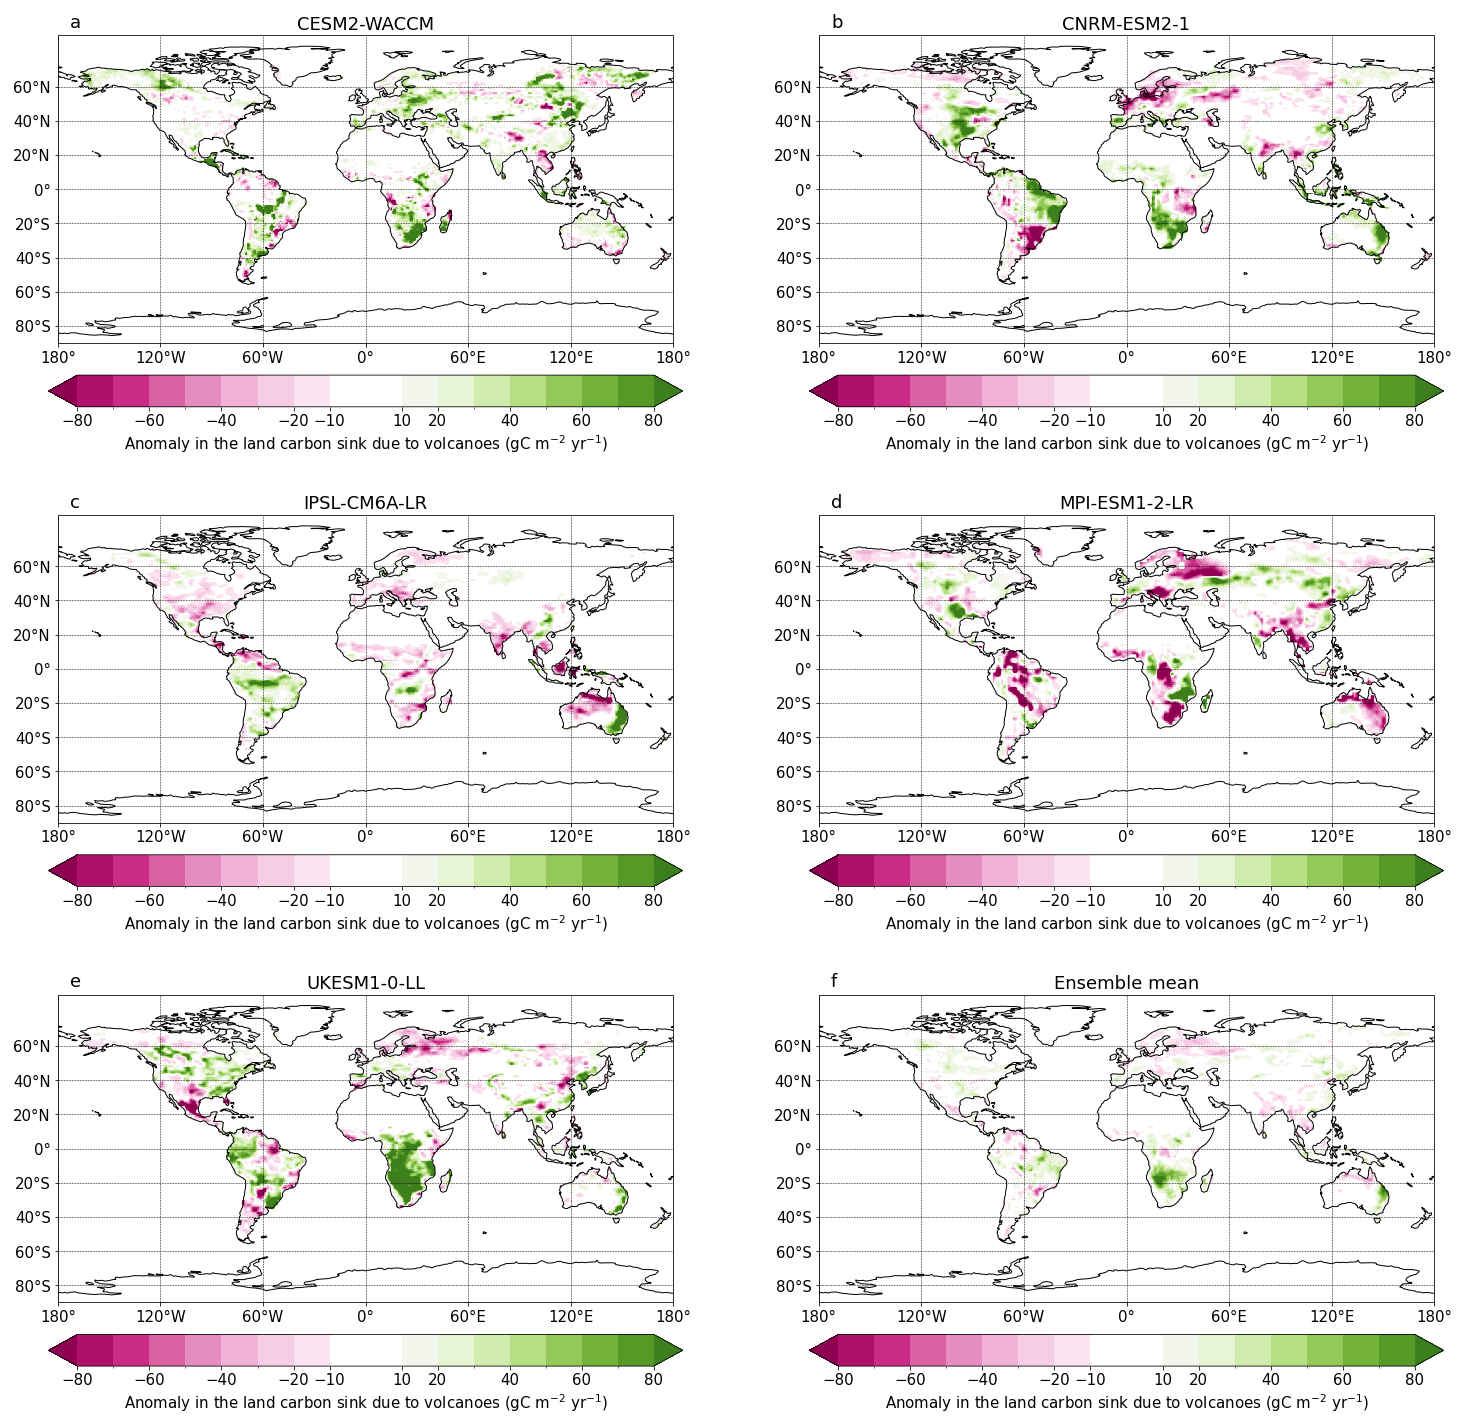
Figure 1(a–e) maps showing the anomaly in the land carbon flux () due to volcanoes for five models. These display average anomaly of the land carbon flux for the average of the first two years following the eruptions of 1991 Pinatubo, 1982 El Chichon, 1963 Agung and 1883 Krakatoa eruptions, compared to the 5 years preceding these eruptions. (f) map showing the ensemble mean of the five models.
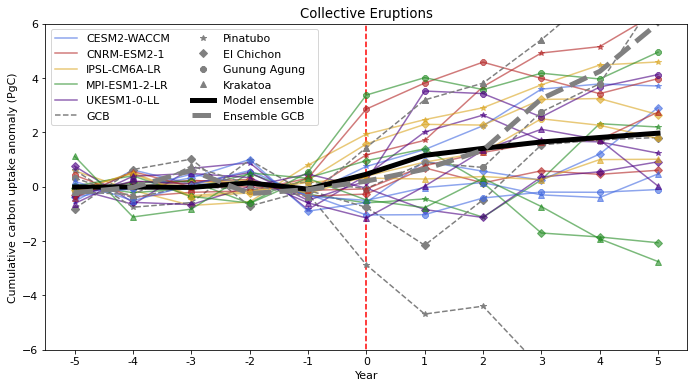
Figure 2Timeseries showing the evolution of the cumulative land carbon uptake anomaly (relative to the average of the five years before the eruption) in the five years before and after a large volcanic eruption. Four volcanic eruptions are considered here: Pinatubo (1991), El Chichon (1982), Agung (1963), and Krakatoa (1883). The bold black line represents the ensemble mean for all the models and eruptions analysed here while the bold grey line represents the ensemble mean of the global carbon budget data for the period around the four eruptions.
2.2 Validation of models against volcanic eruptions
Although it is impossible to evaluate SAI runs against observations, we can use volcanic eruptions as a proxy. We see consistent spatial patterns between models in response to the volcanic eruptions of Pinatubo, El Chichon, Agung, and Krakatoa (Fig. 1), which are comparable to those observed in atmospheric inversion models (Piao et al., 2020). The magnitude of the land carbon flux anomalies in the models we analyse are comparable to those from Piao et al. (2020), with both experiencing land carbon anomalies that lie predominantly in the range ±70 . The land carbon anomalies in high latitudes are relatively small in both examples, with more notable changes occurring around the equator and low latitudes. Of all the models, MPI-ESM1-2-LR experiences the greatest area of notable decreases in the land carbon sink, though similar decreases are also observable in CNRM-ESM2-1, IPSL-CM6A-LR and UKESM1-0-LL. Meanwhile, UKESM1-0-LL appears to have the largest areas of notable increase in the land carbon sink due to volcanic eruptions, with these increases especially prominent in southern regions of the African continent. Observed responses to individual volcanic eruptions differ due to differences in the ENSO phase (Jones et al., 2001; Frölicher et al., 2013), which are typically different to the ENSO phase being experienced in the models for the same year. In fact, one study finds that the response of atmospheric CO2 to volcanic eruptions can be as much as 60 % larger during El Niño and winter (Frölicher et al., 2013), highlighting the difficulty of directly comparing the response to volcanic eruptions between models and observations. Despite this, we observe an increase in land carbon uptake after an eruption in both models and the global carbon budget (GCB) data, though the models appear to underestimate the increase in the land carbon sink compared with GCB data from 2 years post-eruption onwards (Fig. 2). On this basis, we conclude that the ESMs have a qualitatively realistic response to stratospheric aerosol injection by volcanoes (with the global land carbon sink tending to increase after explosive volcanic eruptions), but that the magnitude of this response appears to be slightly underestimated compared to the GCB data. This may be because this generation of ESMs does not routinely model the enhancement of photosynthesis by diffuse radiation (Mercado et al., 2009). As a result, the results presented in this study are likely to be conservative with respect to the positive impacts of SAI on NPP and land carbon storage.
Compared to SSP245, the SSP585 scenario sees an average increase in global temperatures across the models of 1.81 °C, though the warming is very concentrated in the northern polar regions with increases of more than 5 °C in some regions (Fig. S8 in the Supplement). The warmer temperatures in SSP585 are accompanied by an increase in mean rainfall globally, especially in higher latitudes, and the formation of a double ITCZ in some models. NPP appears to increase on average in SSP585 compared to SSP245, with areas of increase across central Africa, north America and east Asia. The only area of notable decrease in NPP is observed in central America. Land carbon storage also increases on average, though there are few areas of significant change (without stippling). The two areas with notable change are a decrease over northern Amazonia and an increase in southeast Asia.
Figure 3 shows the changes in global mean (relative to the pre-industrial reference period, 1850–1900) for four variables (surface temperature, precipitation, land net primary productivity, and land carbon storage). On each panel there are lines representing the two conventional climate change scenarios (SSP245 and SSP585) and the SAI scenario (G6sulfur). All scenarios exhibit rising temperatures compared with pre-industrial temperatures, though as expected, the SSP585 scenario shows the greatest increase reaching an ensemble-mean global warming of approximately 6 °C by 2100. By design, the G6sulfur profile tracks that of SSP245 reaching about 3.5 °C of global warming by the end of the century in the ensemble mean. Increases relative to the pre-industrial period are observed in precipitation, NPP and land carbon storage with scenarios starting to noticeably diverge after 2025. Precipitation increase in G6sulfur plateaus around 2050, then decreases to only about 1.5 % greater than pre-industrial levels. Increases in NPP and land carbon storage are observed despite an expected increase in respiration resulting from increased temperatures (Ballantyne et al., 2017; Bond-Lamberty and Thomson, 2010). The larger increase in land carbon storage in G6sulfur results from both the positive effects of additional CO2 (like SSP585) but without the extra soil and plant respiration that arises from the additional warming of SSP585 relative to SSP245. Respiration increases under warming due to the temperature dependence of the reaction rates of enzymes involved in respiratory pathways (Heskel et al., 2016; Chen et al., 2024). Lower temperatures therefore reduce respiration rates and increase NPP, which results in greater increases in land carbon storage.
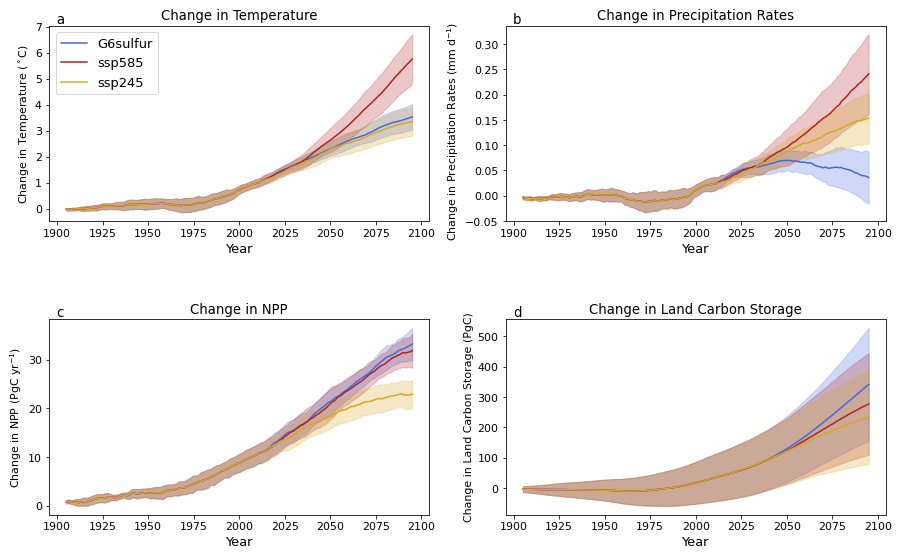
Figure 3Timeseries showing the evolution of the decadal means, calculated over a 10-year sliding window, of (a) surface temperature, (b) precipitation, (c) net primary productivity, and (d) land carbon storage anomalies relative to the pre-industrial period (1850–1900) with time from 1900 to 2100. Solid curves represent the ensemble mean of the five CMIP6 models (see Table 2), while the banding represents one standard deviation from this mean.
The range in land carbon storage results from differences in land carbon process representation across the models. Models with an explicit nitrogen cycle tend to have lower land carbon uptake than models that do not (Arora et al., 2020), as nitrogen limitations typically suppress CO2 fertilisation (Terrer et al., 2018). However, the extent of nutrient limitation remains one of the greatest sources of uncertainty regarding the magnitude of CO2 fertilisation (Terrer et al., 2018). CNRM-ESM2-1, which lacks an explicit representation of the nitrogen cycle (see Table 2), shows notably greater uptake than the other models (Fig. S1 in the Supplement). This model also has a high residence timescale for land carbon, which contributes to its elevated land carbon uptake (Davies-Barnard et al., 2020; Arora et al., 2020).
3.1 Exclusive effects: Comparing G6sulfur to SSP585
Figure 4 depicts differences between the SSP585 and G6sulfur scenarios by the end of the 21st century, where the hatching in these plots removes changes in land carbon storage that are not due to SAI from our analysis. See Fig. S2 for prescribed forest fraction changes between SSP585 and SSP245. In Fig. 4a there is an average global temperature decrease of approximately 2.2 °C in G6sulfur relative to SSP585, although this is not homogeneous across the globe. CESM2-WACCM, IPSL-CM6A-LR and UKESM1-0-LL all experience similar levels of global cooling, between 2.5 and 2.56 °C (Fig. 5). CNRM-ESM1-2 meanwhile experiences less cooling, with a global average of 1.86 °C. Nevertheless, the level of cooling in the northern polar regions is similar to the cooling in CESM2-WACCM, IPSL-CM6A-LR and UKESM1-0-LL, because regions with less cooling, or even warming, are concentrated outside of the northern poles. MPI-ESM1-2-LR shows notably less cooling than even CNRM-ESM2-1 with global mean temperatures only 1.38 °C cooler, while the northern polar regions in MPI-ESM1-LR show little cooling, and warming of up to 2 °C in some regions. This warming may be caused by heating in the lower stratosphere around the tropics which results in surface warming in some northern high latitude regions, which can result in under-cooled polar winters and a reduced seasonal cycle in these regions (Duffey et al., 2023). In general, the Northern Hemisphere cools considerably more than the southern, with polar regions in particular experiencing a cooling of 5 °C or more, while much of the ocean in the Southern Hemisphere only experiences decreases between 1 and 2 °C, a trend observed in most models (compare Figs. 4 and 5).
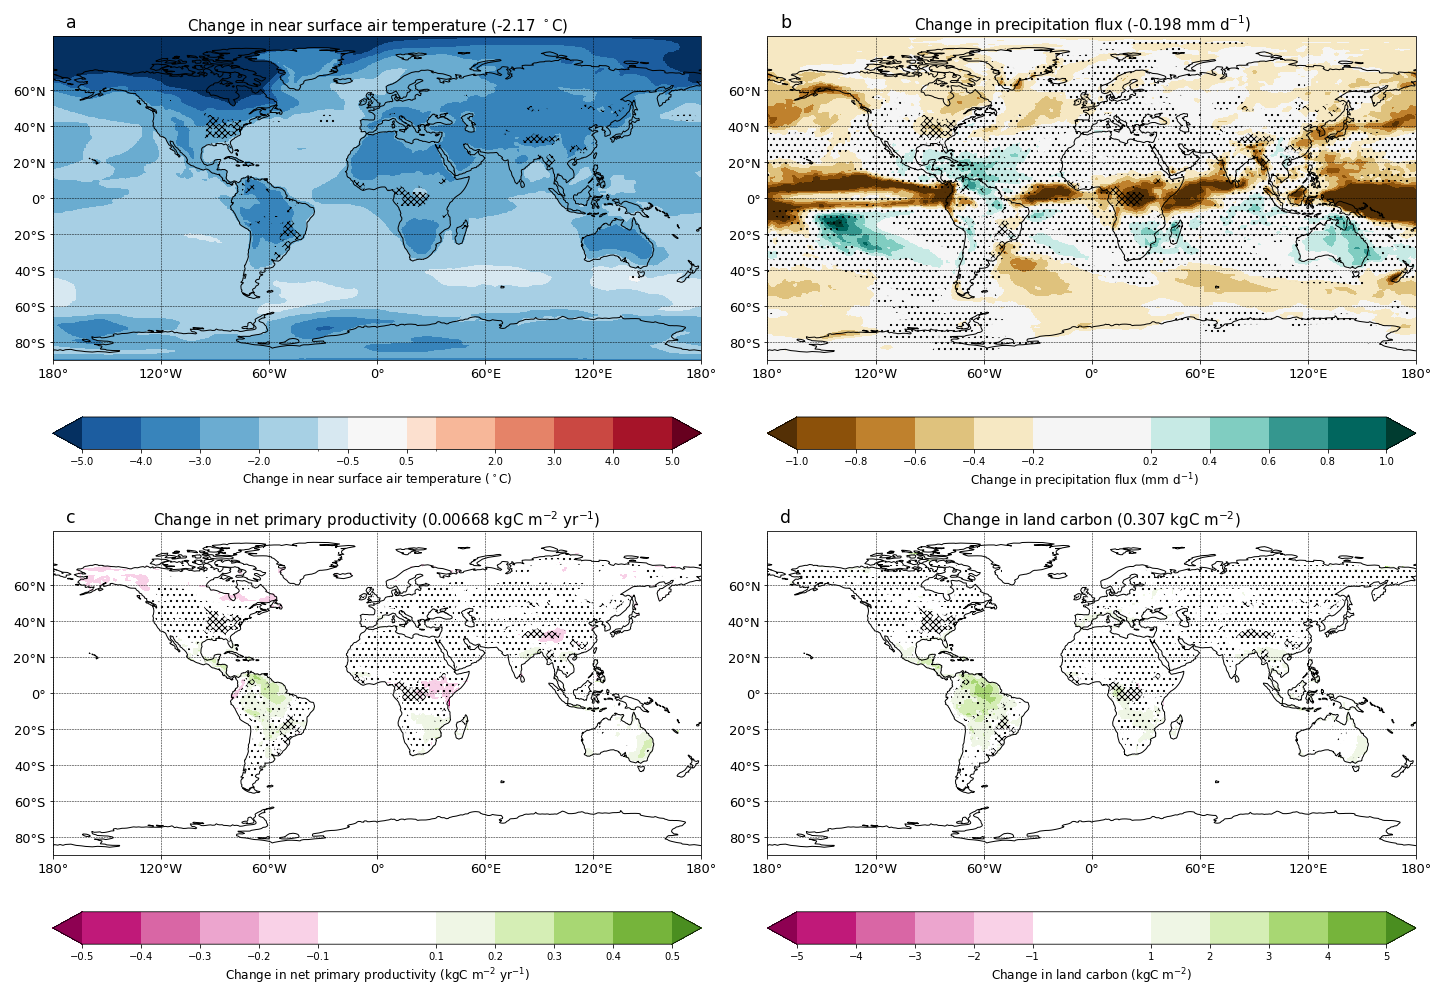
Figure 4Maps showing the model ensemble mean of the difference between the 2090–2100 means of G6sulfur and SSP585 for (a) surface temperature (°C), (b) precipitation (mm d−1), (c) net primary productivity (), and (d) land carbon storage (kg C m−2). The numbers shown in the titles give the global average (a, b) or global land average for each map (c, d). Stippling indicates regions where the standard deviation across the models is more than the ensemble mean change, i.e. the coefficient of variation is more than 1. Hatching indicates where the forest fraction as prescribed in the SSP245 and SSP585 land-use scenarios, differs by more than 0.1 (on which the scenario for G6sulfur is based). In these regions, differences in regional climate, NPP and land carbon may arise due to the different land-use scenario, rather than the impacts of SAI. The hatching is used to indicate areas which we therefore remove from our comparative analyses.
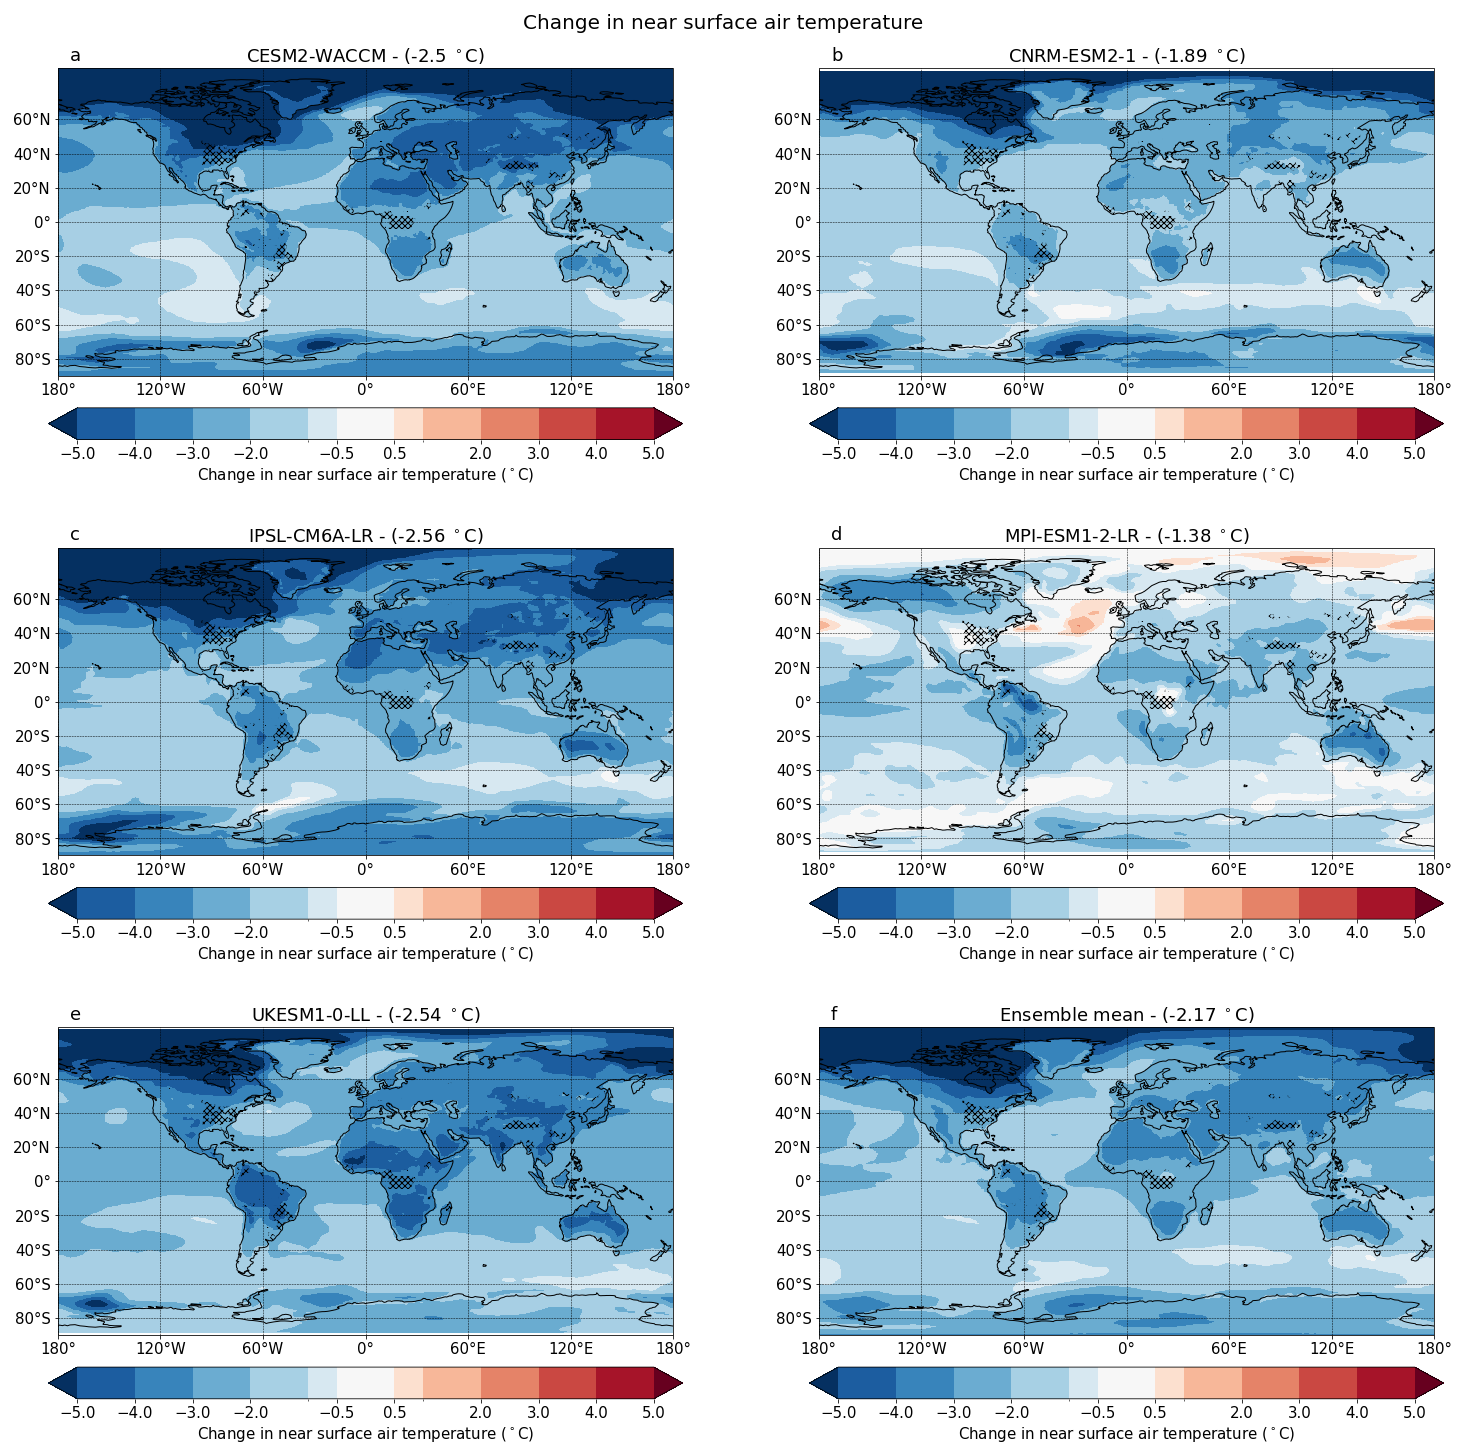
Figure 5Maps showing the difference between the 2090–2100 means of G6sulfur and SSP585 for surface temperature for individual models. The numbers shown in the titles give the global average. Hatching indicates where differences in the forest fraction as prescribed by the land use scenarios between SSP245 and SSP585 is greater than 0.1 (see Fig. S2).
SAI affects precipitation patterns compared to SSP585 (Fig. 4b) resulting in an average global decrease of about 6.4 %. The most pronounced changes occur around the equator, where a decrease in precipitation around the equator, and increases in the subtropics, are associated with a weakening of the Hadley cell. This weakening results from changes to the spatial distribution of aerosols due to SAI in G6sulfur (Wells et al., 2024). We also see evidence of a double ITCZ forming later in SSP585 projections compared to G6sulfur. A double ITCZ is a noted feature of many CMIP models in future climate projections and is acknowledged to be partly a consequence of model biases (Li and Fedorov, 2025). Therefore, it is possible that this reduction in rainfall in the ITCZ region is in part simply due to no double ITCZ forming in the G6sulfur projections.
UKESM1-0-LL experiences the greatest drying of the models analysed in this study, on average drying by 0.26 mm d−1 globally. Meanwhile, MPI-ESM1-2-LR shows the smallest average global decrease in precipitation of 0.16 mm d−1. While this model still shows large decreases in precipitation around the equator, the mid to high latitudes show a notably smaller decrease in precipitation than the other models analysed here. All models show large decreases in precipitation over Indonesia of more than 1 mm d−1, while all models except CNRM-ESM2-1 show notable decreases in precipitation over central areas of the African continent (Fig. 6). Going back to the ensemble mean (Fig. 4b), the effect of SAI is especially strong over the equatorial oceans, with smaller decreases spread across the mid to high-latitudes. Conversely, a statistically significant increase is observed over eastern Australia, where vegetation is largely water-limited (Chen et al., 2022). This region also shows a notable rise in NPP and land carbon storage (i.e. a greening under the G6sulfur scenario, Fig. 4c, d).
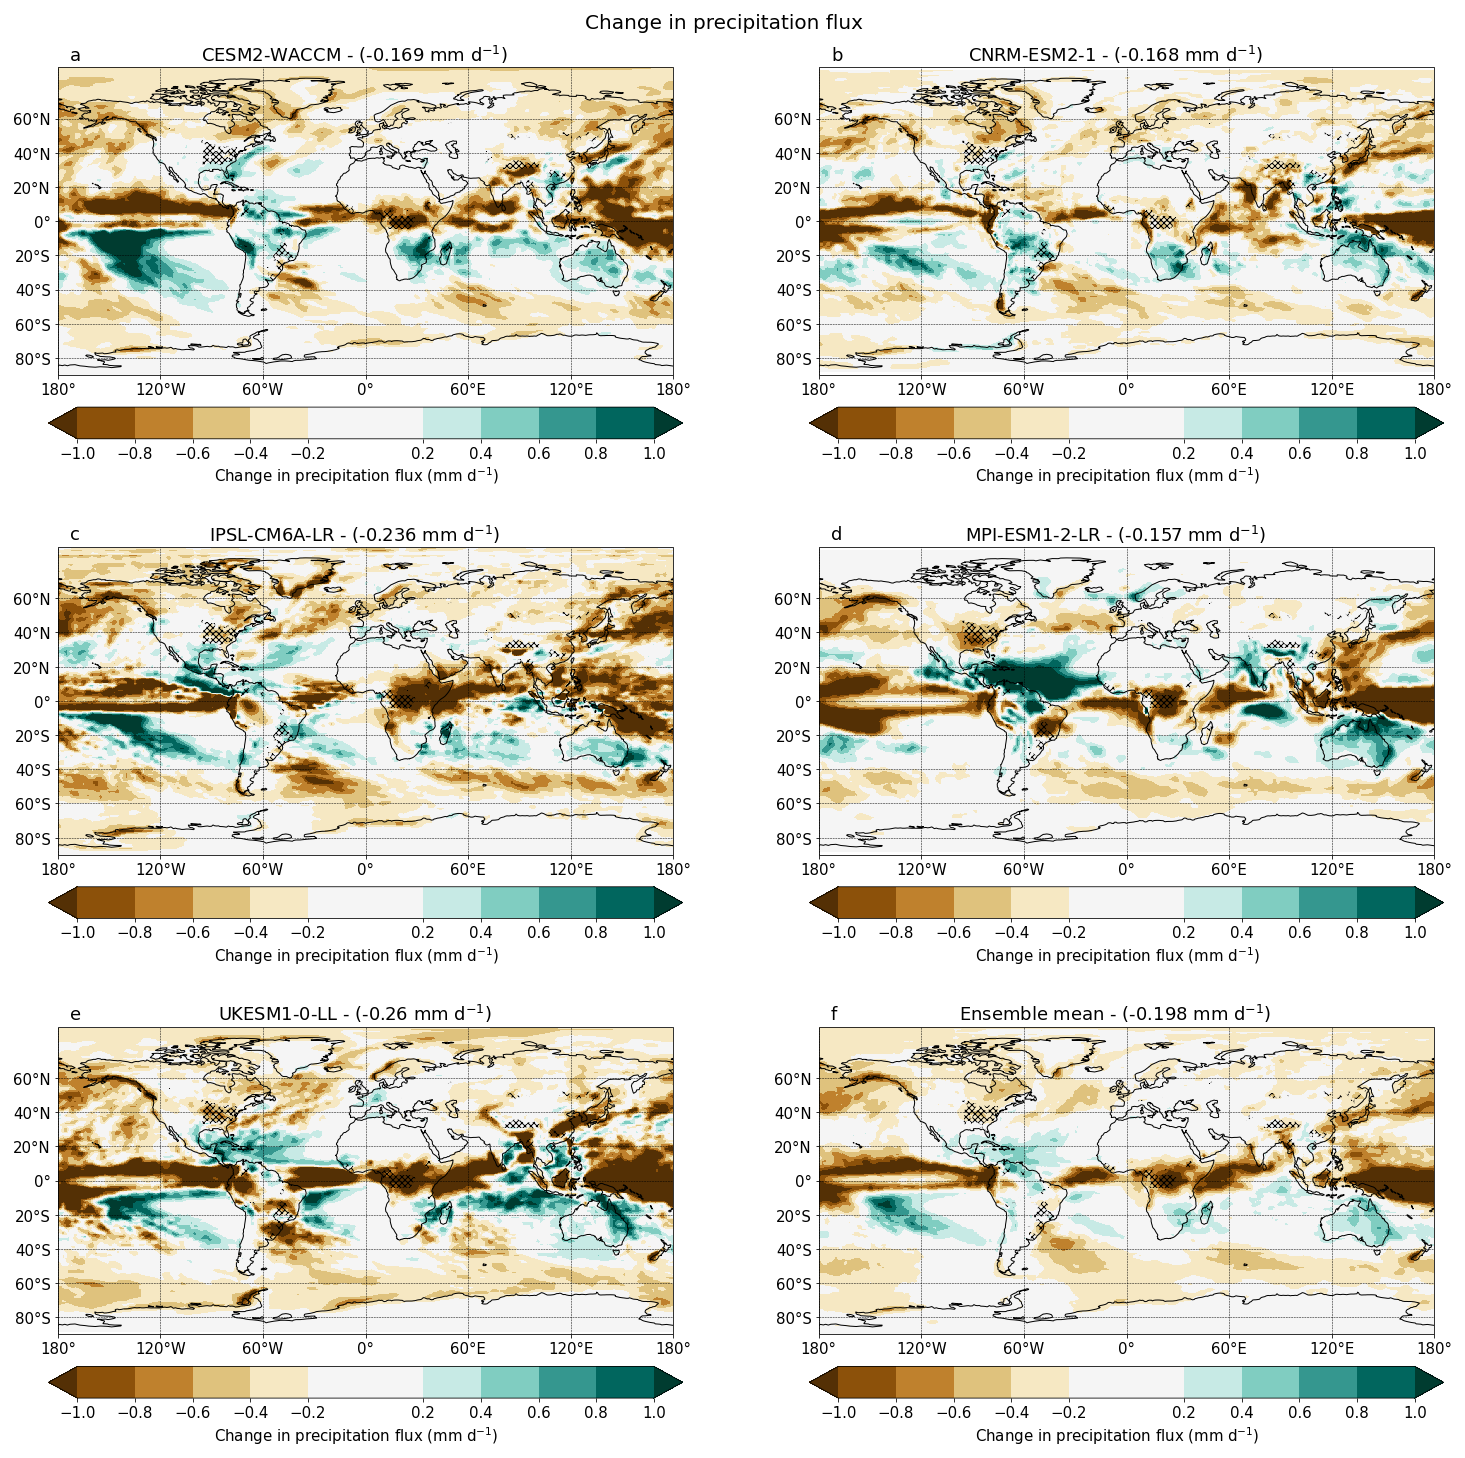
Figure 6Maps showing the difference between the 2090-2100 means of G6sulfur and SSP585 for precipitation (mm d−1) for individual models. The numbers shown in the titles give the global average. Hatching indicates where differences in the forest fraction as prescribed by the land use scenarios between SSP245 and SSP585 is greater than 0.1 (see Fig. S2).
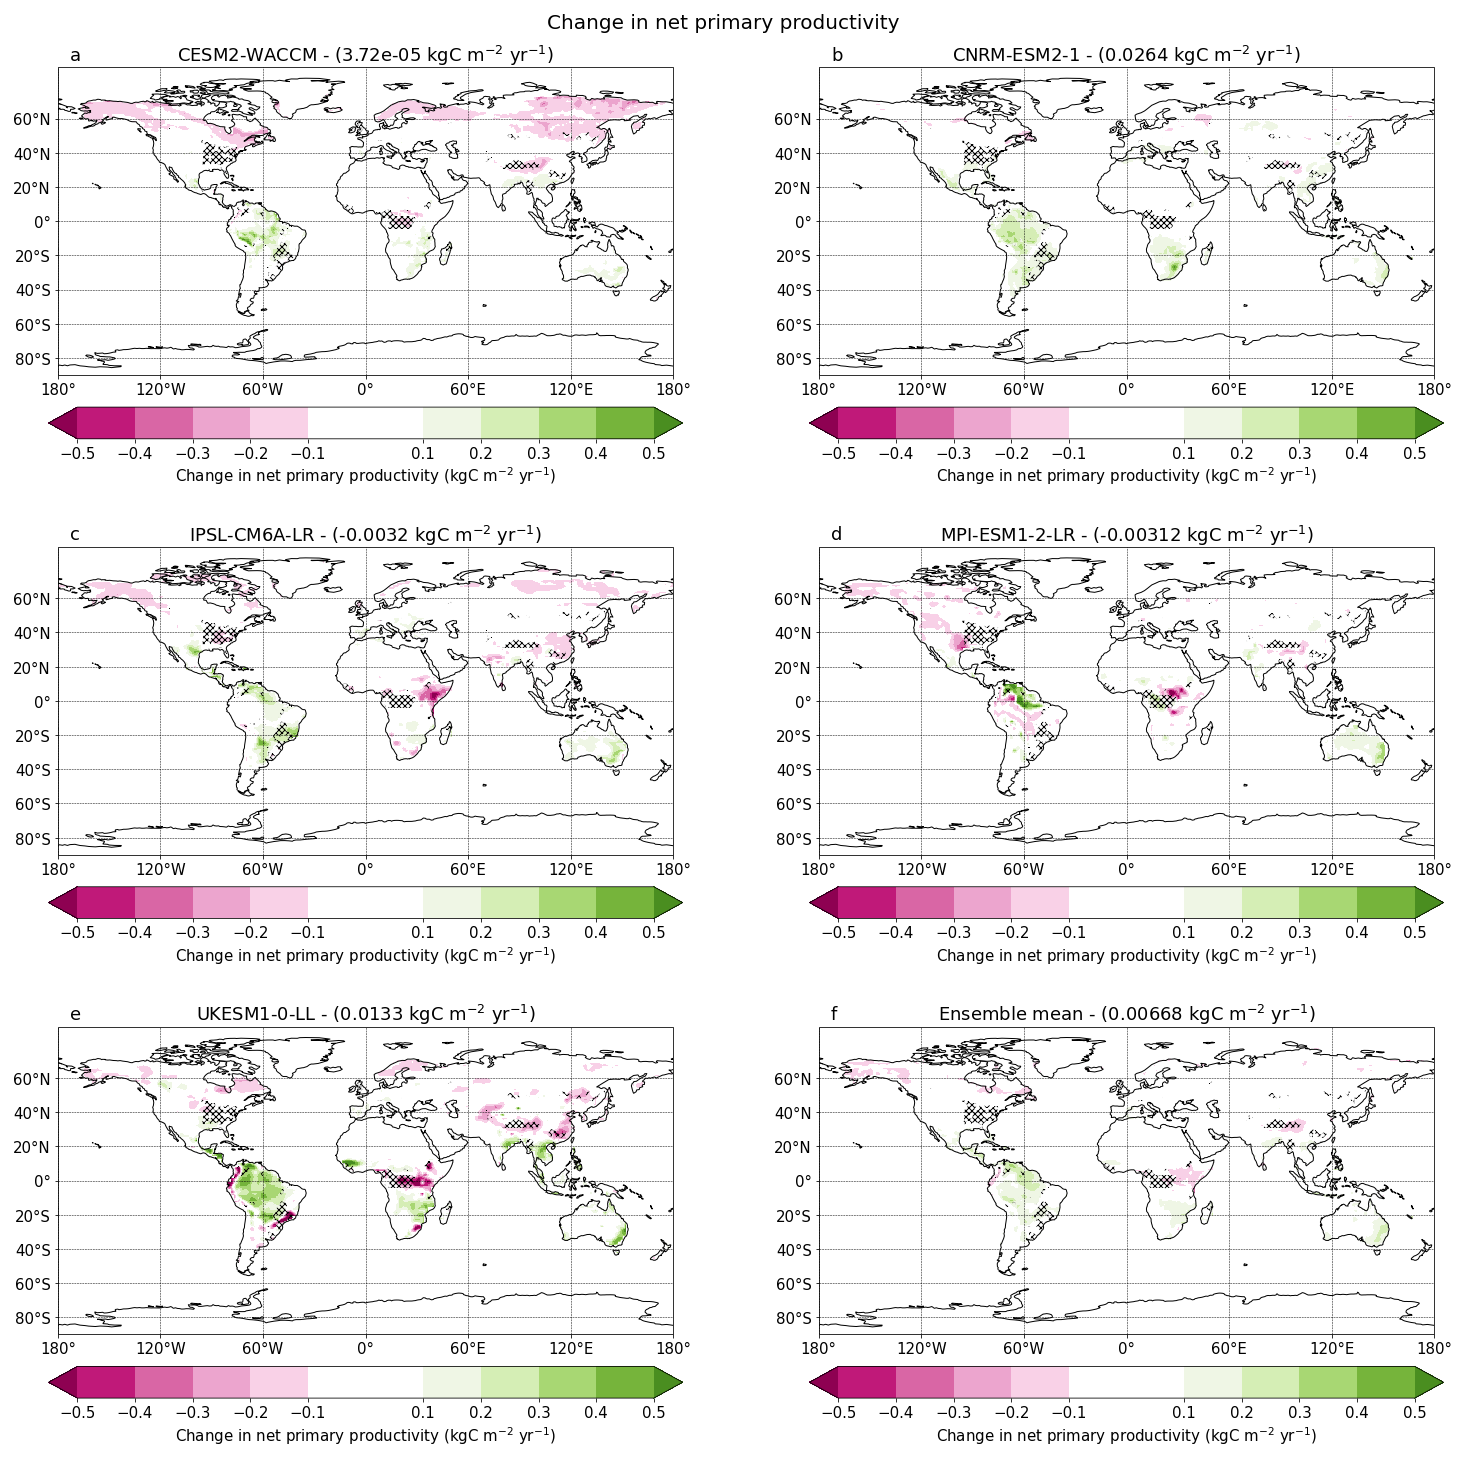
Figure 7Maps showing the difference between the 2090–2100 means of G6sulfur and SSP585 for net primary productivity () for individual models. The numbers shown in the titles give the global land average. Hatching indicates where the forest fraction as prescribed in the SSP245 and SSP585 land-use scenarios, differs by more than 0.1 (on which the scenario for G6sulfur is based) (see Fig. S2). In these regions, differences in regional climate, NPP and land carbon may arise due to the different land-use scenario, rather than the impacts of SAI. The hatching is used to indicate areas which we therefore remove from our comparative analyses.
Relative to SSP585, global mean NPP increases in three models in G6sulfur (Fig. 7). There is a global mean decrease of NPP in IPSL-CM6A-LR and MPI-ESM1-2-LR, associated with reduced precipitation, which can reduce NPP in water limited regions, and insufficient cooling, which can lead to plant temperatures going beyond the optimum for photosynthesis (see Table S1 in the Supplement). We also observe decreases in NPP (up to 0.2 ) over large areas of the northern high latitudes in CESM2-WACCM where the model has the greatest cooling, though this is not visible in the global average due to counteracting increases in the Southern Hemisphere.
Global land carbon storage increases in all models except IPSL-CM6A-LR (Fig. 8), which shows some areas of decrease in northern high latitudes and eastern Africa with little offset from land carbon storage increases in other regions. The only other model with a notable decrease in land carbon storage is MPI-ESM1-2-LR which has a region of decrease of more than 5 kg C m−2 in central regions of Africa. UKESM1-0-LL shows the greatest increase in land carbon storage of the models analysed, with a global average increase of 0.658 kg C m−2. These increases are concentrated around Amazonia, central Africa and south-east Asia, with smaller increases occurring around the mid to high latitudes.
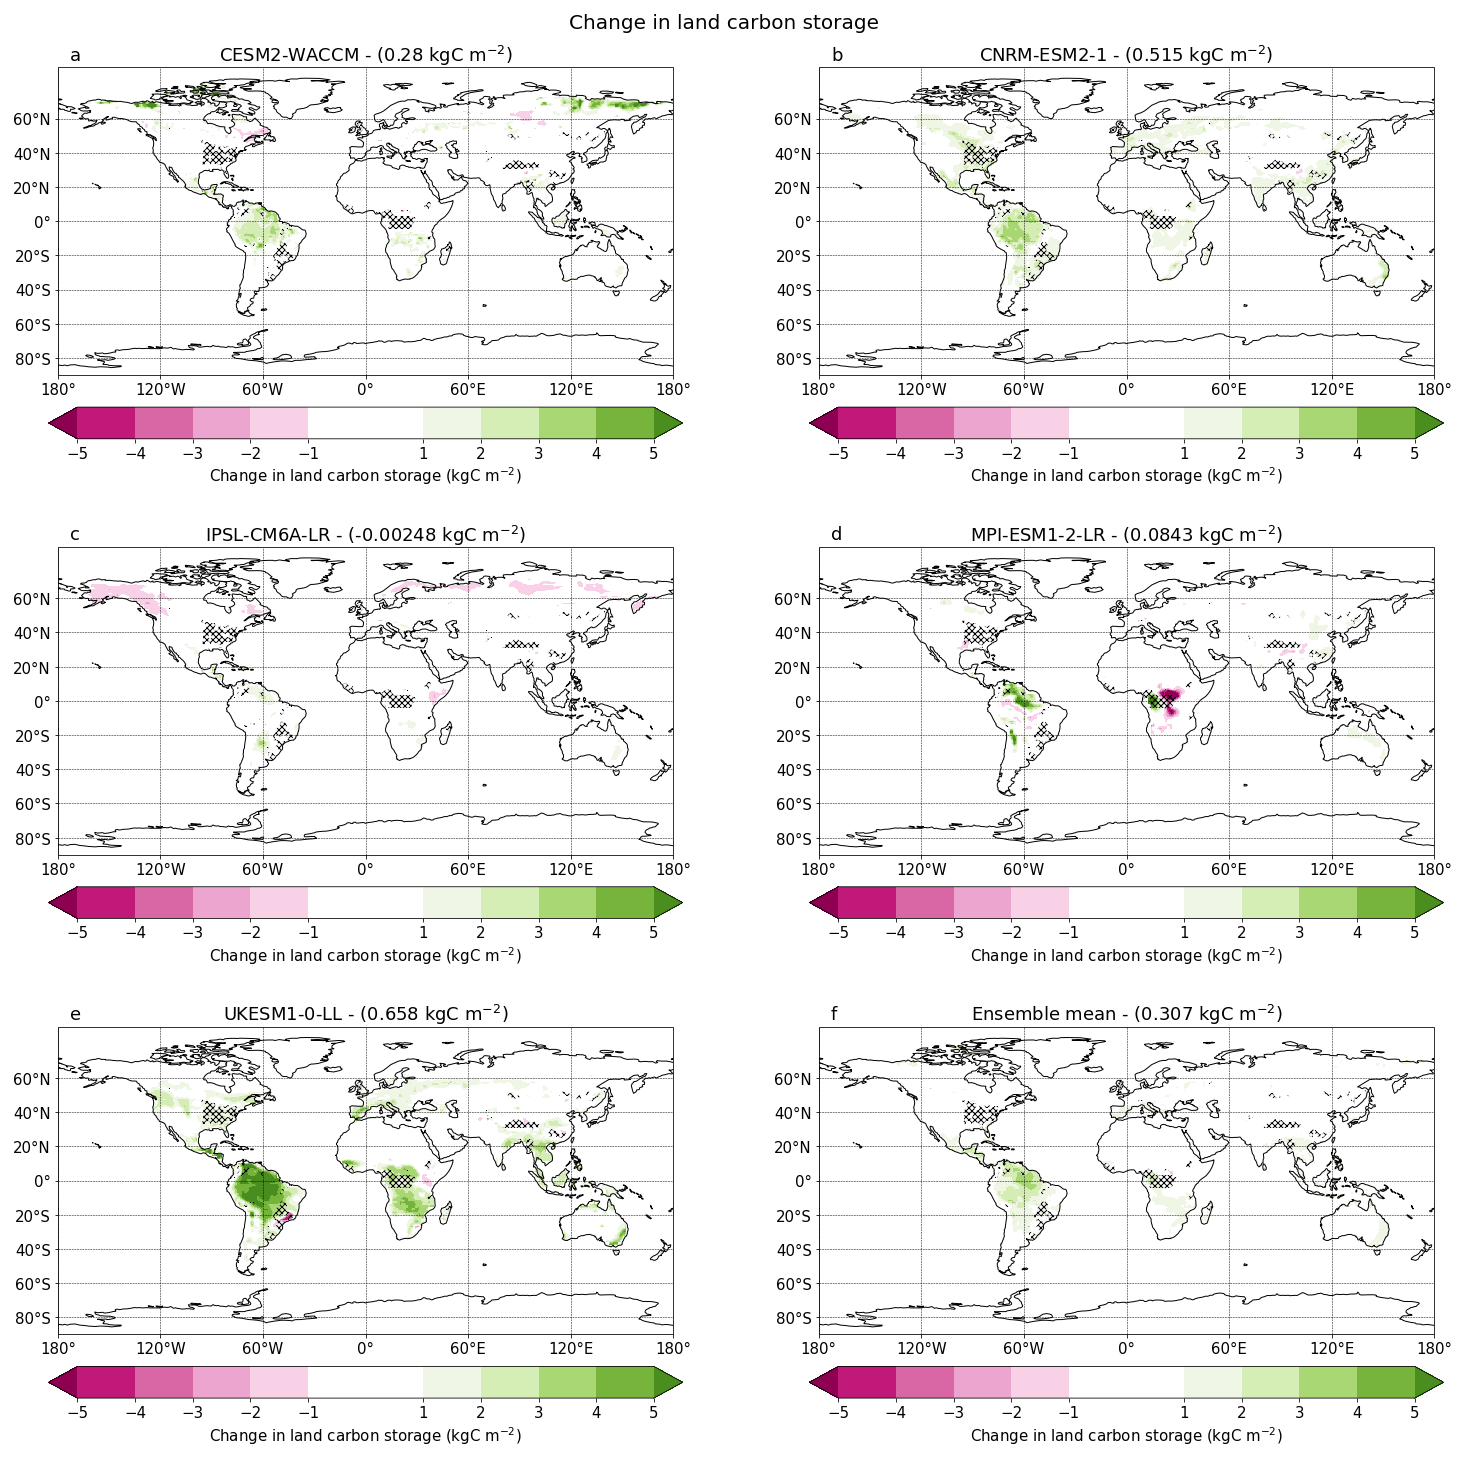
Figure 8Maps showing the difference between the 2090-2100 means of G6sulfur and SSP585 for land carbon storage (kg C m−2) for individual models. The numbers shown in the titles give the global land average. Hatching indicates where differences in the forest fraction as prescribed by the land use scenarios between SSP245 and SSP585 is greater than 0.1 (see Fig. S2).
The impact of SAI on the Amazon compared to SSP585
Tropical forests are sensitive to climate changes. Of particular concern is drying in Amazonia (Parry et al., 2022). Increases in temperature above optimum levels also result in reduced photosynthesis, and therefore reduced NPP, in most current models (Doughty and Goulden, 2009). There is observational evidence of partial acclimation of photosynthesis to warming, although this is not yet fully represented in Earth System Models (Kumarathunge et al., 2019). By contrast, reducing temperatures via SAI brings tropical forests closer to their optimum photosynthesis temperatures while also reducing respiration rates, thereby increasing both NPP and land carbon storage (Ballantyne et al., 2017; Bond-Lamberty and Thomson, 2010).
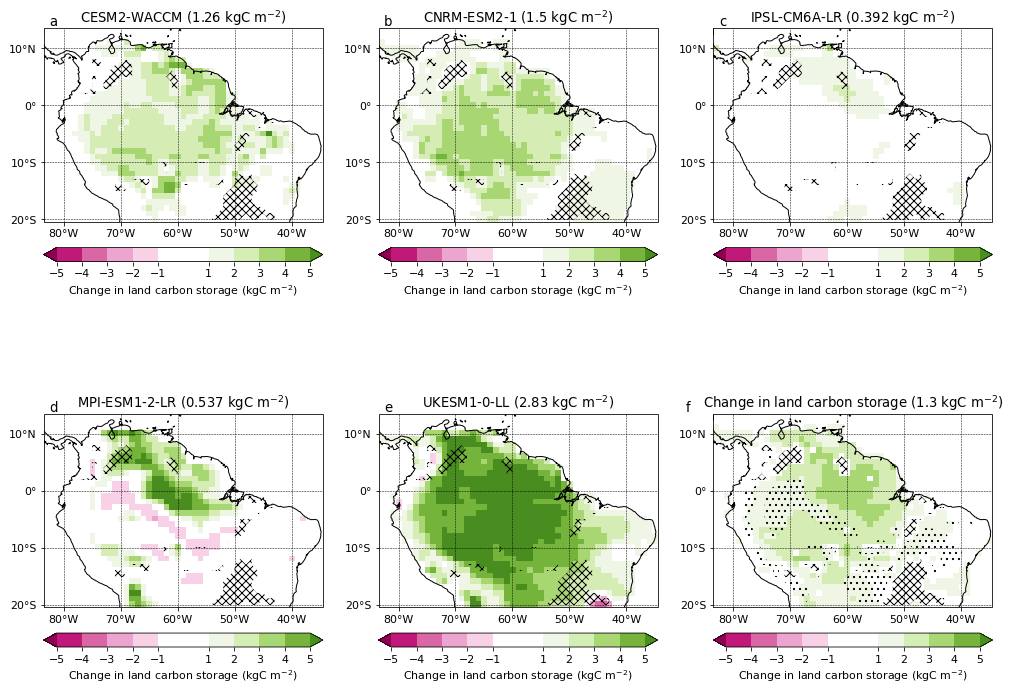
Figure 9Maps for individual models (a–e) and the model ensemble mean (f) showing the difference between the 2090–2100 means of G6sulfur and SSP585 for land carbon storage (kg C m−2) in Amazonia. The numbers shown in the titles give the regional land average for each map. Stippling in (f) indicates regions where the standard deviation across the models is more than the ensemble mean change, i.e. the coefficient of variation is more than 1. Hatching indicates where the forest fraction as prescribed in the SSP245 and SSP585 land-use scenarios, differs by more than 0.1 (on which the scenario for G6sulfur is based). In these regions, differences in regional climate, NPP and land carbon may arise due to the different land-use scenario, rather than the impacts of SAI. The hatching is used to indicate areas which we therefore remove from our comparative analyses.
The Amazon rainforest is projected to benefit from G6sulfur compared to SSP585, with an ensemble-mean increase in NPP of about 10.8 %. This corresponds to a positive impact on land carbon storage in the Amazon (+7.1 %) with increases observed throughout Amazonia (Fig. 9), despite localised areas of reduced rainfall in the east and west. However, the area of greatest decrease in the ensemble mean precipitation occurs on the north-western coast of South America (a decrease of more than 1 mm d−1) and corresponds to a decrease in NPP in the model ensemble mean between 0.1 and 0.2 (Figs. 10 and 6). The increase in precipitation over the north-east, and accompanying reductions in the north-west, is likely driven by a weakening of the Hadley cell, resulting from changes to tropical aerosol distribution associated with the deployment of SAI (Wells et al., 2024). Because the reduction in precipitation in northeastern Amazon is particularly severe, vegetation in this region likely becomes water-limited, thereby reducing NPP. This is in contrast to the decreases seen in NPP and vegetation carbon in idealised scenarios (Xia et al., 2016) and in a single climate model (Yang et al., 2020; Tjiputra et al., 2016). Four of the five ESMs project increases in land carbon storage across Amazonia due to SAI. The fifth model (MPI-ESM1-2-LR) also projects major increases in land carbon storage in the north and east of Amazonia, but this is partially counteracted by a band of reduced vegetation carbon in the south-west (Fig. 9d). Overall though, all models project increases in Amazonian land carbon storage (ranging from 6 to 41 Pg C) relative to SSP585 (Table S1). As the SSP585 and G6sulfur scenarios have the same prescribed evolution of atmospheric CO2, these increases are solely due to the impact of SAI on the Amazonian climate.
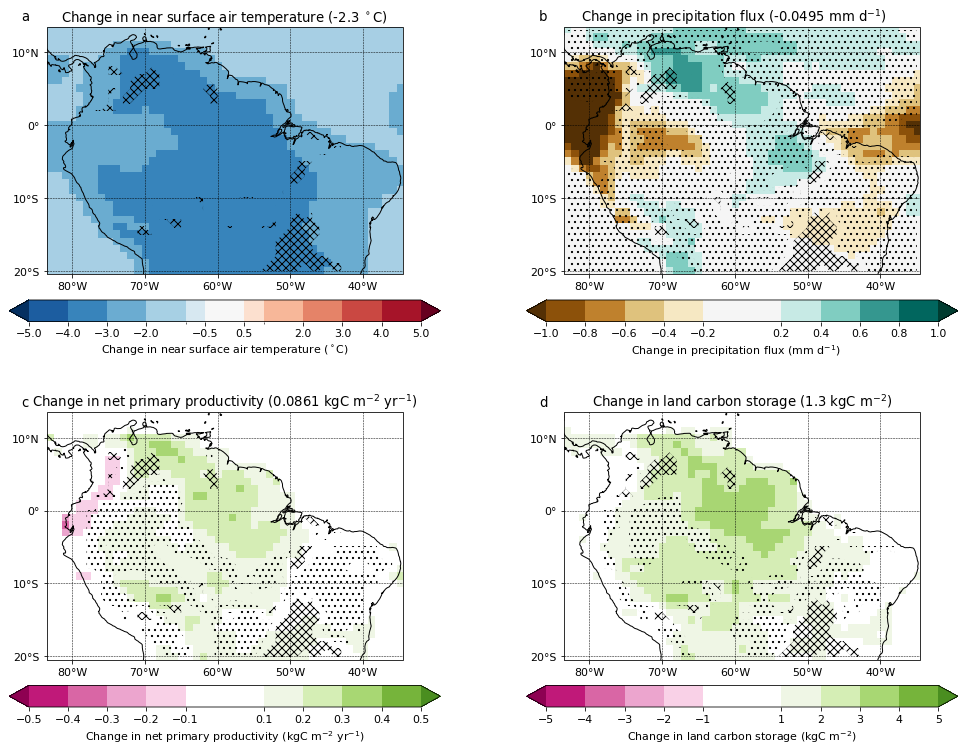
Figure 10Maps showing the model ensemble mean of the difference between the 2090–2100 means of G6sulfur and SSP585 in the Amazon for (a) surface temperature (°C), (b) precipitation (mm d−1), (c) net primary productivity (, and (d) land carbon (kg C m−2). The numbers shown in the titles give the average of the displayed area (a, b) or land average of the displayed area for each map (c, d). Stippling indicates regions where the standard deviation across the models is more than the ensemble mean change while hatching indicates where differences in the forest fraction as prescribed by the land use scenarios between SSP245 and SSP585 is greater than 0.1 (see Fig. S2).
These increases in NPP and land carbon storage suggest that SAI would offer protection against the risk of climate driven carbon loss in the Amazon forest (Flores et al., 2024). Other tropical forest regions, where precipitation declines are larger under SAI, are not afforded the same degree of protection via increases in NPP. We have previously seen evidence of localised Amazon forest dieback in multiple models, in idealised 1 % CO2 increase per year runs (Parry et al., 2022). However, of the models studied here, only UKESM1-0-LL exhibits a notable reduction in vegetation carbon under the SSP585 scenario. Under SSP585 UKESM1-0-LL projects a notable decrease in vegetation carbon over the north-east of the Amazon, amounting to up to a 40 % decrease in some small areas (Fig. S5). Looking at the projected evolution of vegetation carbon averaged over this region, we see that by 2100 SSP585 projects a decrease of about 4 kg C m−2 (Fig. S6). This is a decrease that is largely avoided after the application of SAI (Fig. S7), with the same region experiencing a decrease of less than 1 kg C m−2. All other models show an increase in NPP over this region after SAI is applied, compared with SSP585. As forest dieback arises when the rate of forest carbon loss exceeds the rate of carbon gain, changes in simulated NPP imply changes in the risk of forest dieback. The results presented here indicate that SAI would protect against carbon losses in the Amazon forest. However, future studies would benefit from longer-duration experiments that produce clearer instances of forest dieback in the absence of SRM, allowing us to better evaluate the impact of SAI when applied. Though the Amazon experiences relatively small decreases in precipitation in most models, other tropical forest regions experience larger decreases in precipitation (Fig. 6). As a result, the increases in NPP and land carbon storage in these areas is less pronounced than is modelled for Amazonia (Figs. 7 and 8). We note that, aside from Amazonia, we observe few regions with the same consistent signal across models. Apart from Amazonia, only eastern Australia shows a consistent increase in NPP and land carbon storage. The decreases within the models are generally inconsistent across models in their magnitude and location.
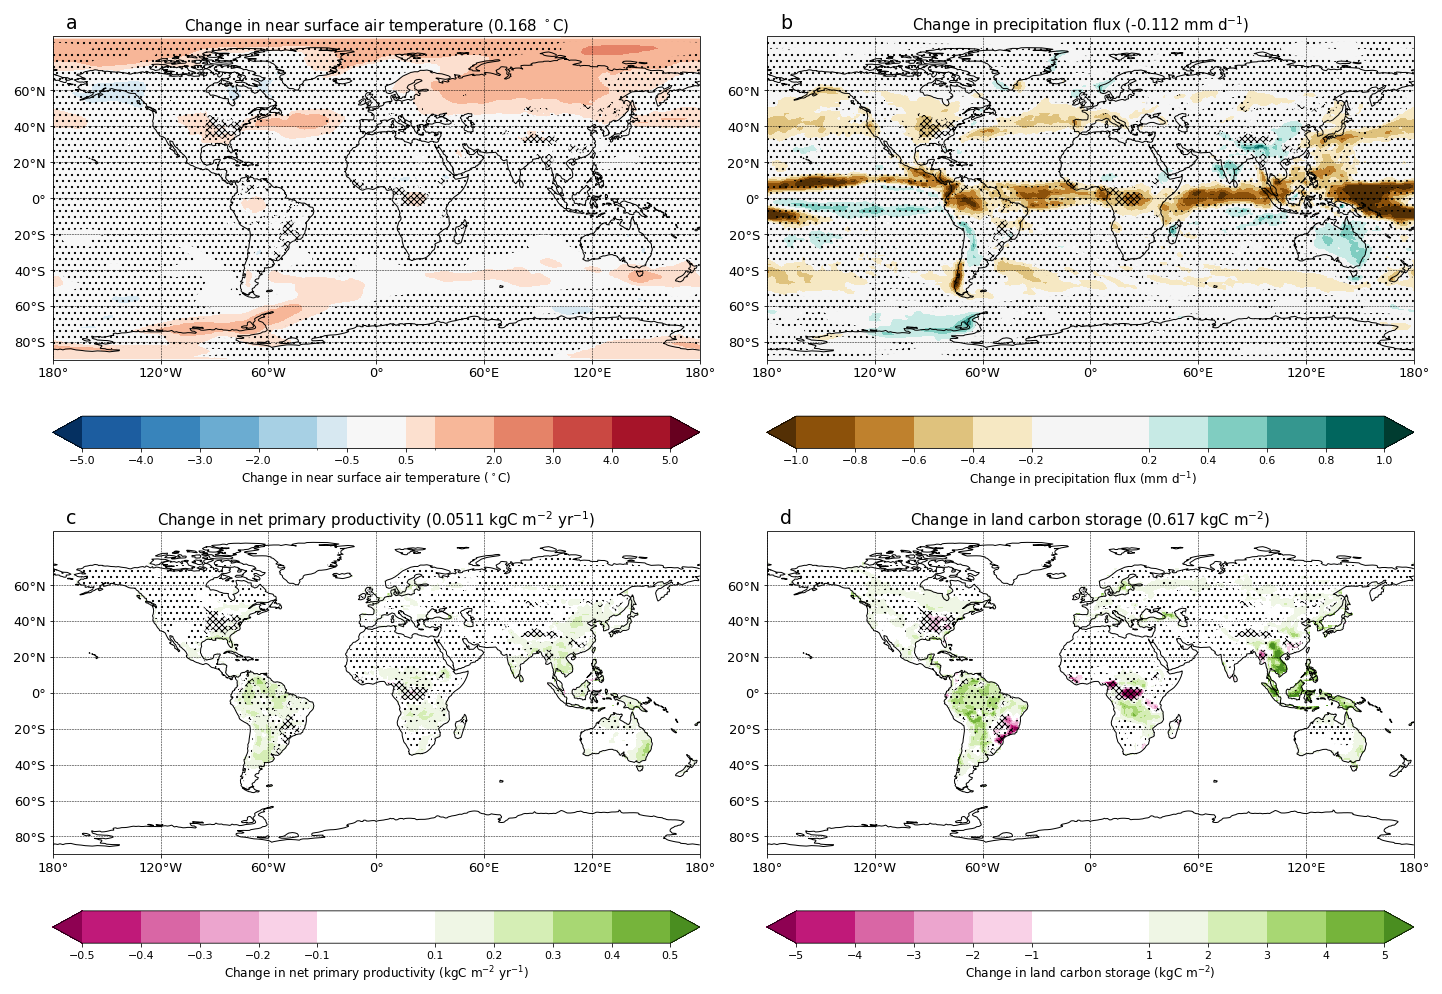
Figure 11Maps showing the model ensemble mean of the difference between the 2090–2100 means of G6sulfur and SSP245 for (a) surface temperature (°C), (b) precipitation (mm d−1), (c) net primary productivity (), and (d) land carbon storage (kg C m−2). The numbers shown in the titles give the global average (a, b) or global land average for each map (c, d). Stippling indicates regions where the standard deviation across the models is more than the ensemble mean change.Hatching indicates where the forest fraction as prescribed in the SSP245 and SSP585 land-use scenarios, differs by more than 0.1 (on which the scenario for G6sulfur is based). In these regions, differences in regional climate, NPP and land carbon may arise due to the different land-use scenario, rather than the impacts of SAI. The hatching is used to indicate areas which we therefore remove from our comparative analyses.
3.2 Cumulative effects: Comparing G6sulfur to SSP245
The scenarios SSP245 and G6sulfur have similar global mean temperatures, but there are higher atmospheric CO2 concentrations under G6sulfur. This allows us to compare the relative impact of a given global warming achieved through conventional mitigation (SSP245) with that achieved through SAI (G6sulfur). Figure 11 shows equivalent maps to Fig. 4, but now for G6sulfur relative to SSP245. By design, the projected global warming is very similar. However, there is a residual warming of the polar regions in G6sulfur (Visioni et al., 2021). This is most pronounced in MPI-ESM1-2-LR, which experienced increases of more than 4 °C in some northern polar regions, and is prominent in IPSL-CM6A-LR and UKESM1-0-LL (Fig. 12). The simple strategy of injection at the Equator has been modified in other studies to reduce these residual impacts (Kravitz et al., 2017). IPSL-CM6A-LR produces the closest average global temperature in G6sulfur compared to SSP245 with a difference of only 0.016 °C. As this value is a global mean there are of course regional variations in the level of cooling achieved, with residual warming still being present in northern high latitudes in this model. The greatest difference between SSP245 and G6sulfur global average temperatures is observed in CNRM-ESM2-1 in which G6sulfur is 0.275 °C warmer than SSP245 by the end of the century, with lots of this warming concentrated over land masses. In particular, Amazonia and northern regions of Russia experience the largest area of warming between 2 and 3 °C compared to SSP245.
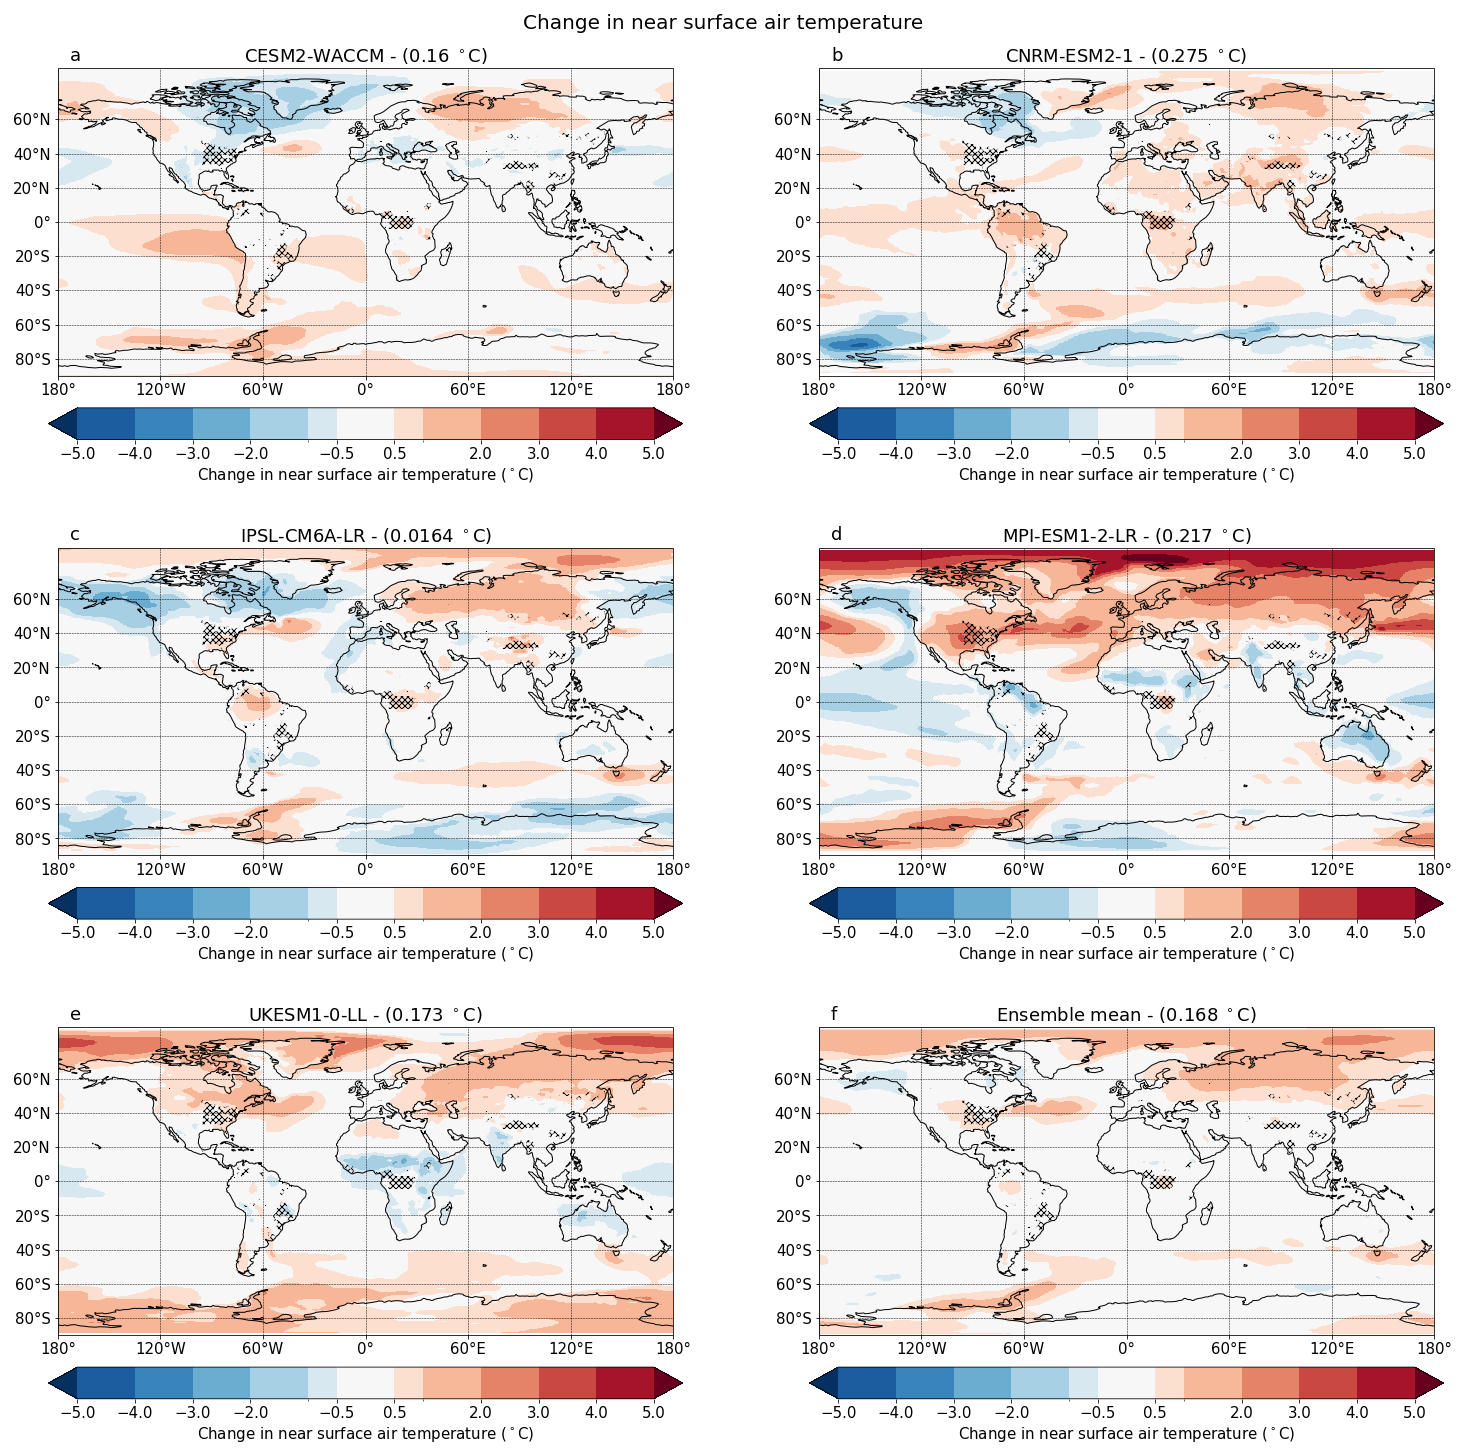
Figure 12Maps showing the difference between the 2090–2100 means of G6sulfur and SSP245 for surface temperature for individual models. The numbers shown in the titles give the global average. Hatching indicates where differences in the forest fraction as prescribed by the land use scenarios between SSP245 and SSP585 is greater than 0.1 (see Fig. S2).
Global mean precipitation decreases slightly on average across the models (−3.7 %) (Fig. 11b), mainly due to a band of decreased precipitation around the Equator. This response is driven by a reduction in the intensity of the Hadley cell resulting from changes to the tropical distribution of aerosols associated with SAI in G6sulfur (Wells et al., 2024) (Fig. 13). Such regional changes in rainfall can have major regional impacts, an important consideration for SAI (Zhao and Cao, 2022). A statistically significant (clear of stippling) increase in precipitation is also observed in eastern Australia, corresponding to increases in NPP and land carbon storage (Fig. 11c, d). Figure 13 shows that IPSL-CM6A-LR and UKESM1-0-LL have the greatest average decrease in precipitation globally in G6sulfur compared to SSP245. While UKESM1-0-LL appears to have more areas where precipitation decreases more than 1 mm d−1, it also has more areas in which precipitation increases notably, thereby offsetting the areas of decrease when the average is taken. Similarly, MPI-ESM1-2-LR has large areas that experience a decrease in precipitation of more than 1 mm d−1, but this is not necessarily reflected in the global average due to a substantial number of areas in which precipitation increases more than 0.6 mm d−1. In most models, there is a pattern of both large increases and decreases in precipitation concentrated in a band around the equator. Smaller changes in precipitation tend to occur in the mid-latitudes of the models.
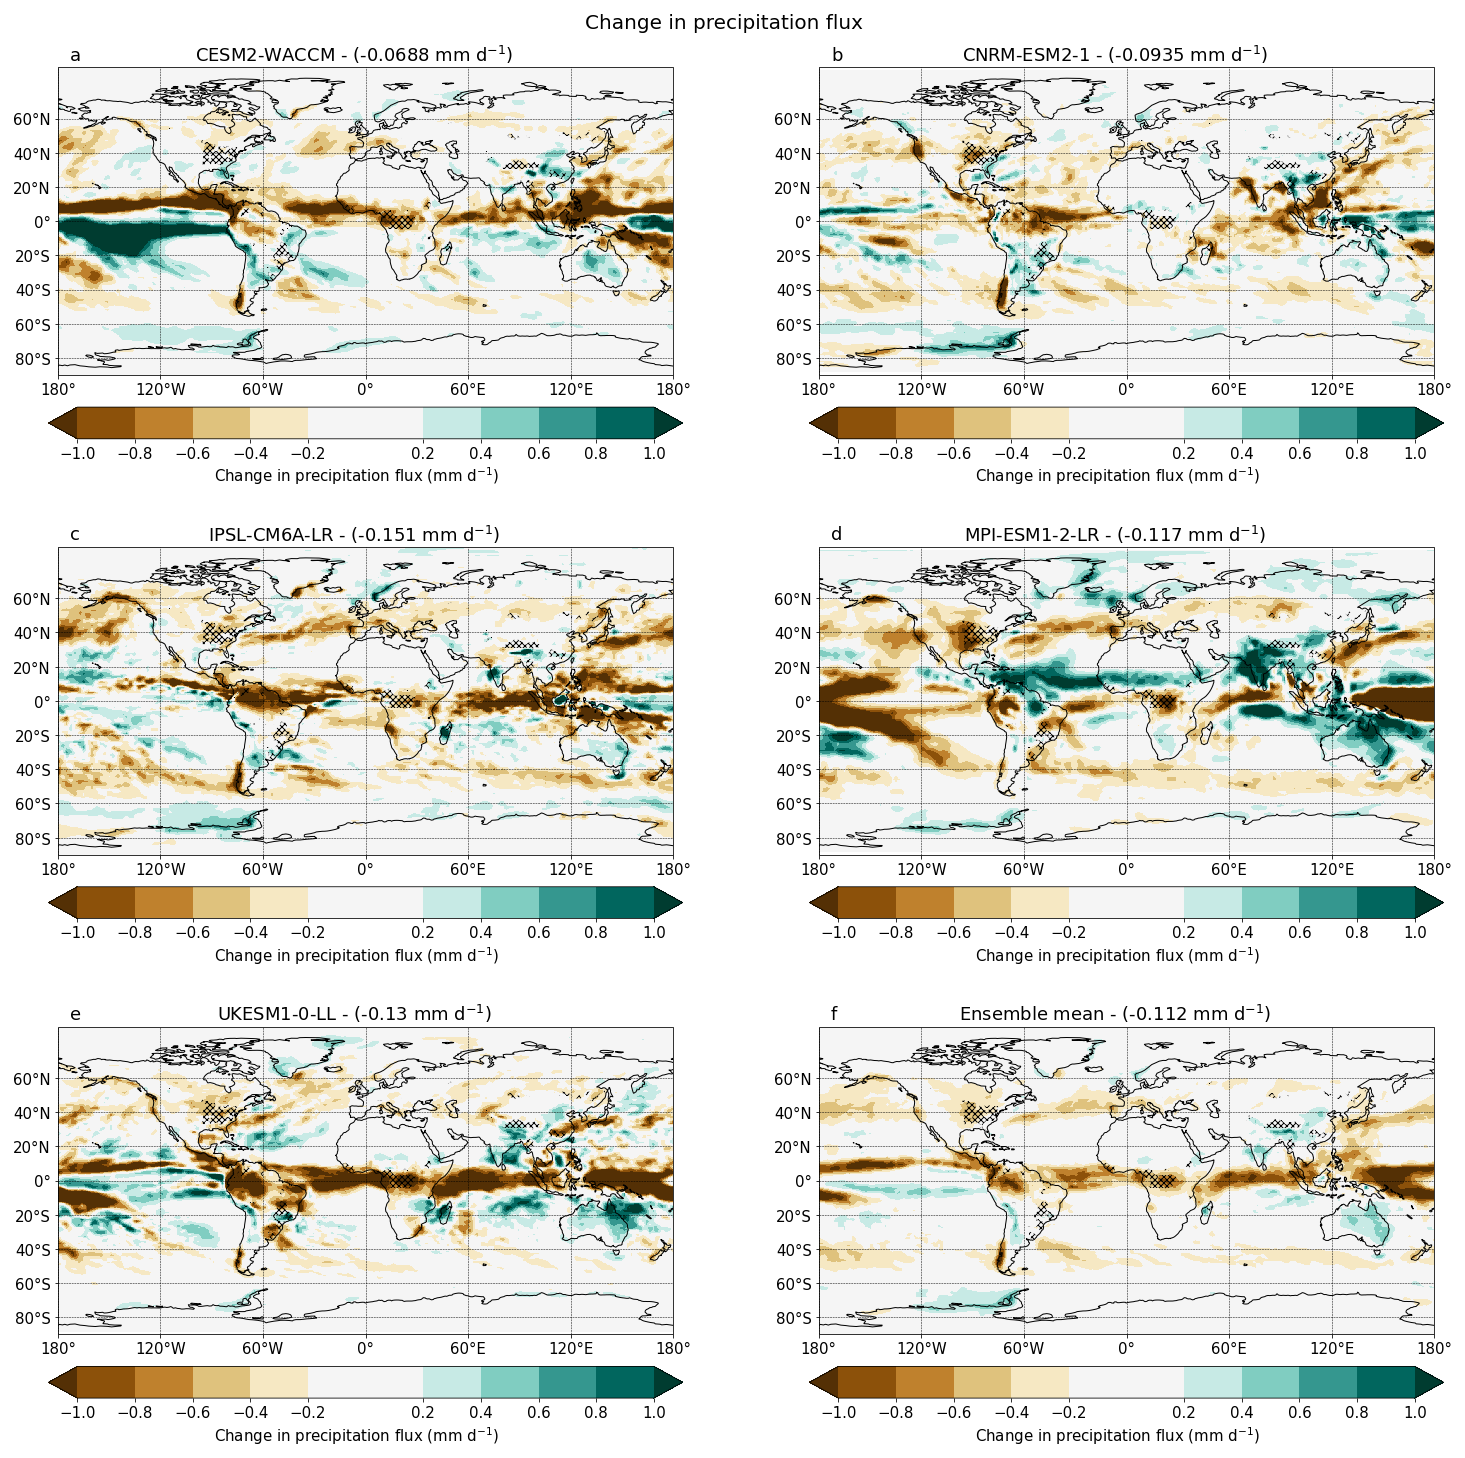
Figure 13Maps showing the difference between the 2090–2100 means of G6sulfur and SSP245 for precipitation (mm d−1) for individual models. The numbers shown in the titles give the global average. Hatching indicates where differences in the forest fraction as prescribed by the land use scenarios between SSP245 and SSP585 is greater than 0.1 (see Fig. S2).
Figure 11c depicts an increase in global mean NPP of about 15.6 % in G6sulfur compared to SSP245. Generally, areas with increased NPP in the ensemble mean coincide with agreement between models on the projected sign for this change. Much of the land in the Southern Hemisphere, southern Asia, and central America shows NPP increases in G6sulfur relative to SSP245. The larger NPP increases in G6sulfur, which are primarily due to additional CO2 fertilisation, drive a larger land carbon storage increase compared to SSP245 (+5.9 % as opposed to +2.8 %) (Fig. 11d). The largest increases in land carbon storage are observed in Indonesia, a difference that is not observable in the comparison between G6sulfur and SSP585 (Fig. 4d). All models show global mean increases in both NPP and land carbon storage in G6sulfur compared to SSP245 (Figs. 14 and 15). CESM2-WACCM shows some decreases in NPP and land carbon storage in areas of eastern Europe, while IPSL-CM6A-LR has decreases of a similar scale in NPP and land carbon storage in northern Amazonia, Indonesia and central areas of the African continent. The increase in land carbon storage observed in IPSL-CM6A-LR, while the smallest of all the models, contrasts with the decrease in land carbon storage observed in the same model for the comparison with SSP585 (Fig. 8c). All other models display the same global upward trend in land carbon storage across both the SSP585 and SSP245 comparison. UKESM1-0-LL has the greatest average increase in NPP of the models analysed (0.0748 ) compared to SSP245. Notable increases in NPP are largely focused around the equator and at lower latitudes, something reflected in the land carbon storage increases in UKESM1-0-LL (Fig. 14). Conversely, the model which experiences the greatest increase in land carbon storage is CNRM-ESM2-1, which shows notable increases in land carbon storage across the globe, with the largest increases in the northern mid to high latitudes (Fig. 15).
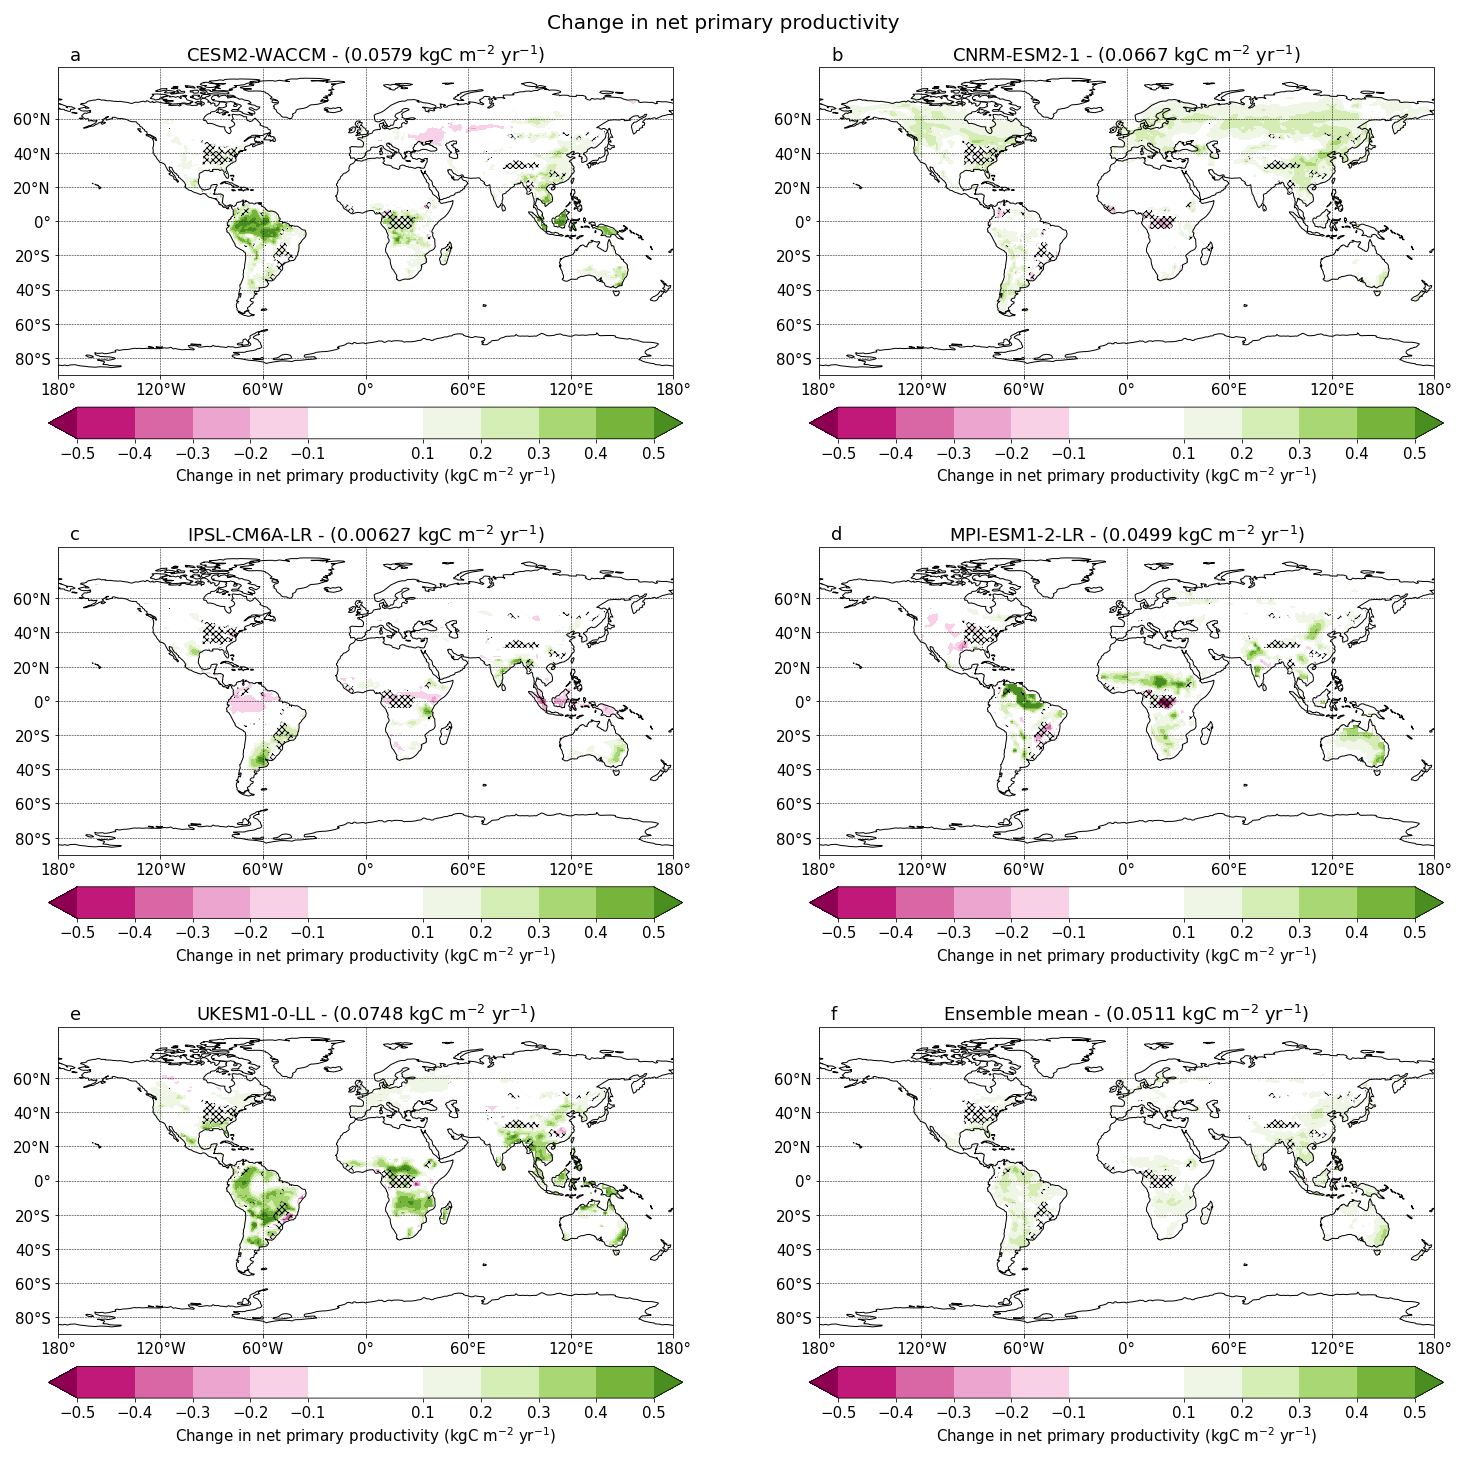
Figure 14Maps showing the difference between the 2090–2100 means of G6sulfur and SSP245 for net primary productivity () for individual models. The numbers shown in the titles give the global land average. Hatching indicates where differences in the forest fraction as prescribed by the land use scenarios between SSP245 and SSP585 is greater than 0.1 (see Fig. S2).
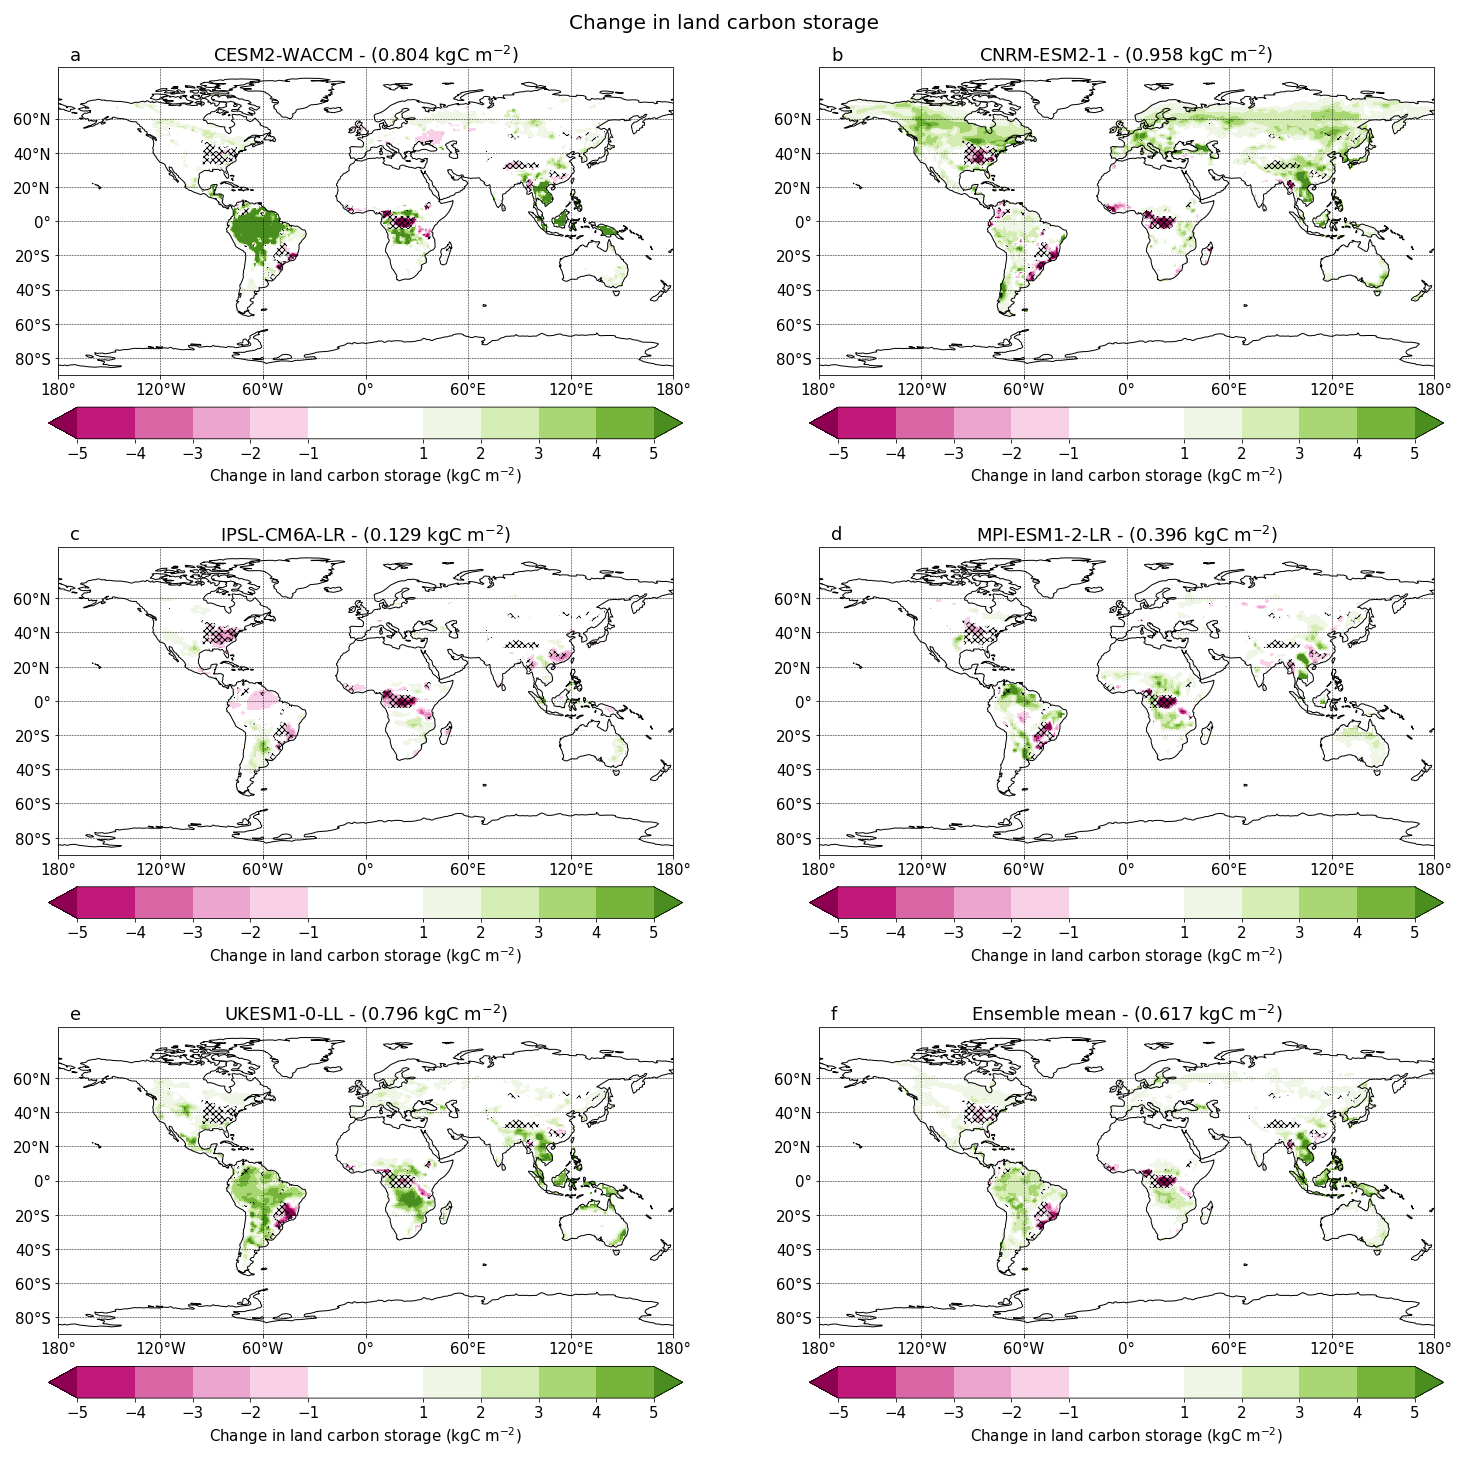
Figure 15Maps showing the model ensemble mean of the difference between the 2090–2100 means of G6sulfur and SSP245 for land carbon (kg C m−2) for individual models. The numbers shown in the titles give the global land average. Hatching indicates where differences in the forest fraction as prescribed by the land use scenarios between SSP245 and SSP585 is greater than 0.1 (see Fig. S2).
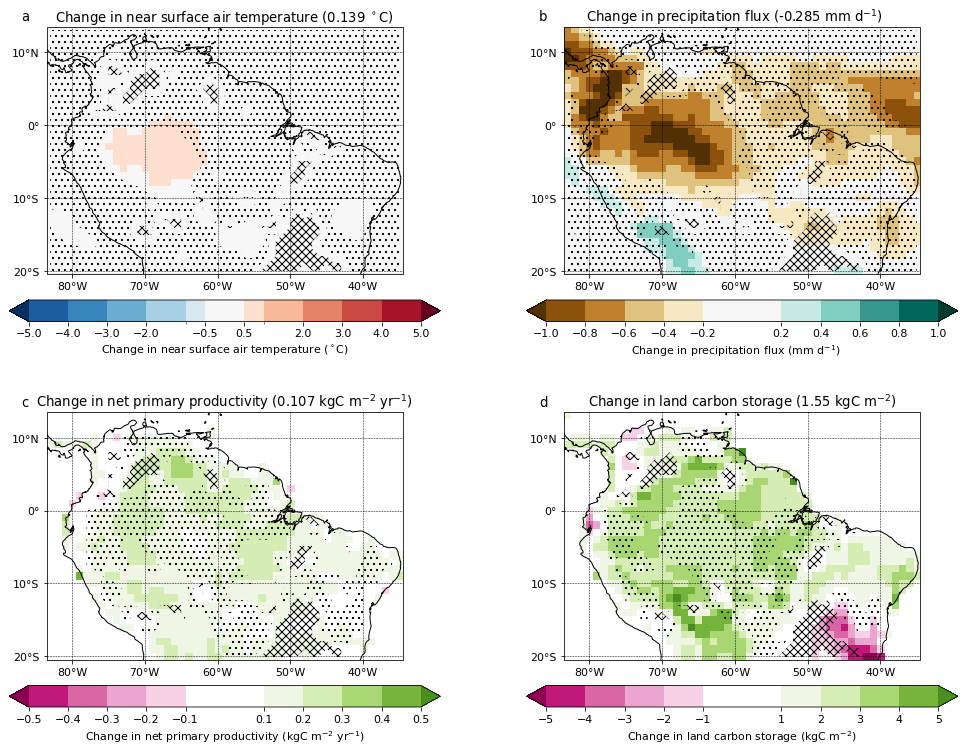
Figure 16Maps showing the difference between the 2090–2100 means of G6sulfur and SSP245 in the Amazon for (a) surface temperature (°C), (b) precipitation (mm d−1), (c) net primary productivity () and (d) land carbon (kg C m−2). The numbers shown in the titles give the average of the displayed area (a, b) or land average of the displayed area for each map (c, d). Stippling indicates regions where the standard deviation across the models is more than the ensemble mean change while hatching indicates where differences in forest fraction as prescribed by the land use scenarios between SSP245 and SSP585 is greater than 0.1 (see Fig. S2).
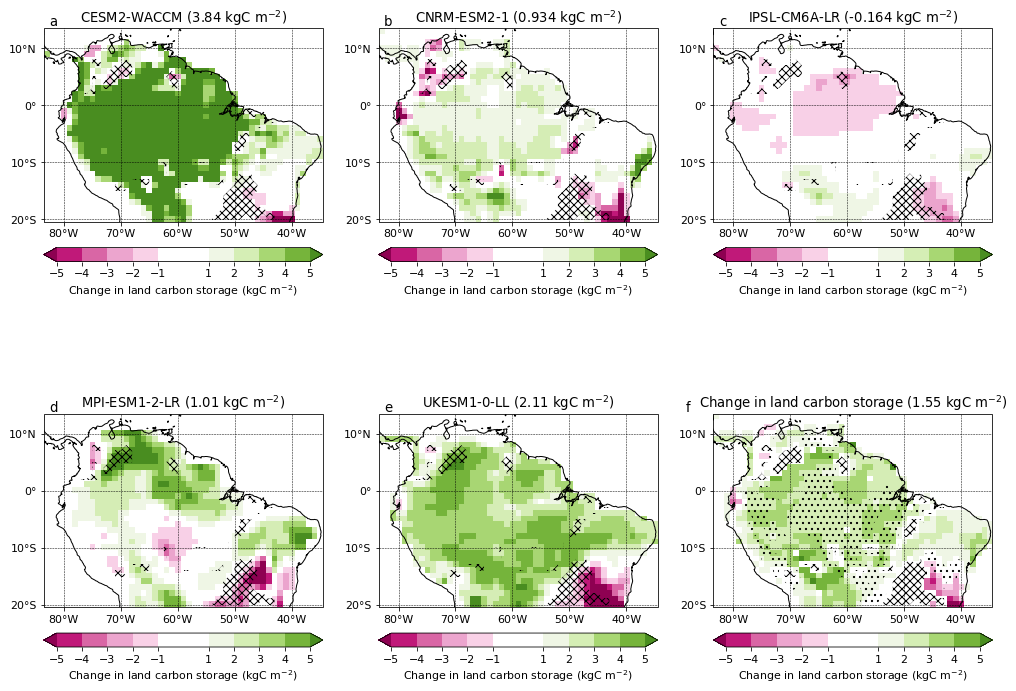
Figure 17Maps for individual models (a–e) or the model ensemble mean (f) showing the difference between the 2090–2100 means of G6sulfur and SSP245 for land carbon storage (kg C m−2) in Amazonia. The numbers shown in the titles give the regional land average for each map. Stippling (f) indicates regions where the standard deviation across the models is more than the ensemble mean change, i.e. the coefficient of variation is more than 1, while hatching indicates where differences in the forest fraction as prescribed by the land use scenarios between SSP245 and SSP585 is greater than 0.1 (see Fig. S2).
The impact of SAI on the Amazon compared to SSP245
Once again, the Amazon rainforest demonstrates enhanced carbon storage (+8.6 %) and NPP (+13.8 %) under G6sulfur compared to SSP245 (Fig. 16), primarily due to the CO2 fertilisation effect, where an increase in photosynthesis results in an increase in NPP and biomass (Cox et al., 2004; Norby, 2011; Huntingford et al., 2013). The increase in NPP and land carbon storage is observed in all models except IPSL-CM6A-LR (Figs. 14 and 17), where there are small reductions in both, likely resulting from the strong drying trend in northern Amazonia in this model (Fig. 13) (Flores et al., 2024). Additionally, IPSL-CM6A-LR was previously noted to have relatively low land carbon uptake compared to other models (Arora et al., 2020). This increase occurs despite a notable reduction in rainfall (−7.1 % total) in central and eastern parts of Amazonia, which was not observable in the comparison with SSP585. Drying is often associated with increased risk of dieback in the Amazon forest (Parry et al., 2022), so the increase in both NPP and land carbon storage, despite decreases in precipitation is interesting. This is likely due to increased water use efficiency at higher concentrations of CO2, which is a strong compensating effect (Dekker et al., 2016).
CESM2-WACCM experiences the largest increase in land carbon storage within Amazonia by a large margin, with an average increase of 3.84 kg C m−2 (Fig. 17). These increases are concentrated in central and western areas of Amazonia, with the furthest eastern region experiencing little to no increase in land carbon storage. This further suggests that CESM2-WACCM has a particularly strong CO2 fertilisation effect compared to other models, though its increases in land carbon globally are concentrated around the equator. Additionally, CESM2-WACCM experiences a weaker decline in precipitation over the Amazon compared with other models. Interestingly, CNRM-ESM2-1, which experiences the largest increase in land carbon storage globally, shows relatively little increase in land carbon storage in Amazonia compared to other models, only IPSL-CM6A-LR has smaller increases alongside notable areas of decrease. Other than the increases over the Amazon, there is an increase in NPP and land carbon storage in eastern Australia, in comparison to SSP585. This signal is consistent across all the models. Similarly, we observe increases in NPP and land carbon storage across regions of central Africa, though only in three of the five models. Aside from these instances there are few regions which display a consistent signal across all the models in either the comparison with SSP245 and SSP585, highlighting the significance of these examples.
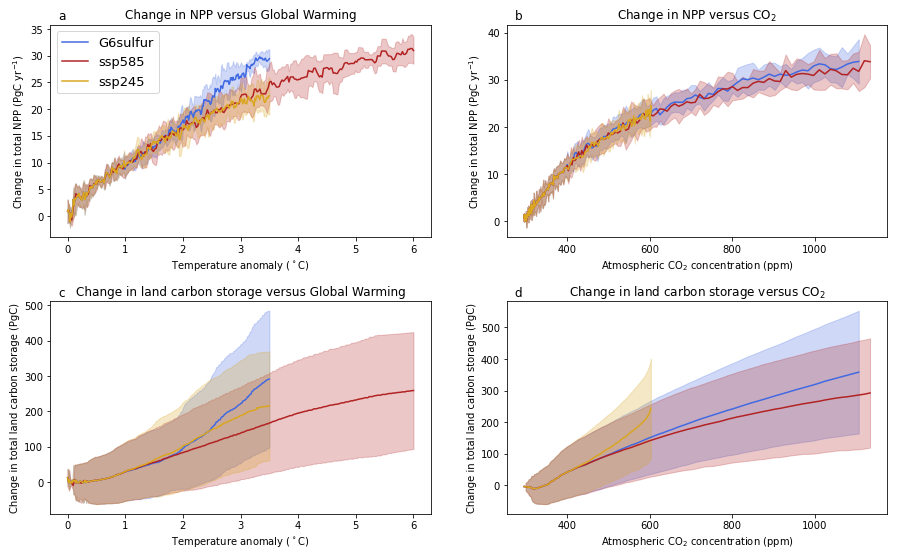
Figure 18Multi-model means showing the evolution of the global decadal means, calculated over a 10-year sliding window, of NPP (a, b) and land carbon storage (c, d) anomalies relative to the pre-industrial period (1850–1900) against temperature anomaly (a, c) and CO2 (b, d). Solid curves represent the ensemble mean of the five CMIP6 models (see Table 2), while the banding represents one standard deviation from this mean.
3.3 Sensitivity of NPP and land carbon storage to temperature and CO2 concentrations
Figure 18 shows ensemble mean NPP and land carbon storage against global warming and CO2 concentrations. In G6sulfur, NPP exhibits a steeper increase with global warming compared to SSP245 and SSP585, which both track similar trajectories against temperature (Fig. 18a). Plotting NPP against CO2 shows overlapping trajectories across all three experiments, increasing steeply from pre-industrial levels before plateauing at around 800 ppm (Fig. 18b). The CO2 fertilisation effect plays a crucial role in these global mean responses, as has been shown in previous studies (Jones et al., 2013; Cox et al., 2004; Norby, 2011; Huntingford et al., 2013). Elevated CO2 levels in the SSP585 scenario yield a nearly 40 % increase in NPP compared to SSP245 (Fig. 18a). Conversely, global NPP shows minimal sensitivity to temperature, demonstrated in Fig. 18b where the change in total NPP in G6sulfur tracks SSP585 despite their different global mean temperatures, as a result of counteracting negative effects of warming in the tropics and positive effects in the high latitudes (Cramer et al., 2001; Tjiputra et al., 2010) (Fig. 7). G6sulfur and SSP585 show comparable global NPP increases relative to pre-industrial levels, consistent with global NPP being mainly dependent on CO2 concentrations. However, projected global land carbon storage increases are larger in G6sulfur relative to either SSP245 or SSP585 (Fig. 18c, d), but for different reasons.
Compared to SSP245, global land carbon storage is increased in G6sulfur due to extra CO2 fertilisation (Fig. 18c). This depends on the uncertain magnitude of CO2 fertilisation of photosynthesis, although it remains clearly visible even in the CMIP6 models that include nitrogen limitations. Meanwhile, global land carbon storage is increased in G6sulfur compared to SSP585 as the reduced warming in G6sulfur results in reduced soil respiration (Fig. 18d). These results build upon the findings of single model analysis on the impacts of SRM on land carbon storage and NPP (Yang et al., 2020; Tjiputra et al., 2016; Zhao and Cao, 2022; Duan et al., 2020), as well as analysis performed for idealised scenarios in which the solar constant is reduced (Jones et al., 2013). As far as global land carbon storage is concerned, G6sulfur therefore has the benefit of higher CO2 for photosynthesis (as in SSP585), but without the counteracting negative impact of additional warming compared to SSP245. The increases in global land carbon storage in G6sulfur relative to SSP585 occur despite a global decrease in precipitation and shifts in regional rainfall patterns within G6sulfur. Increased water use efficiency at higher concentrations of CO2, likely compensates for a large part of the reduction in rainfall (Dekker et al., 2016). However, it is important to note that a reduction in precipitation has other impacts which, though not observable in NPP or land carbon storage, remain important to consider. Examples include threats to freshwater availability for human consumption and agriculture (Pauloo et al., 2020; Van Loon et al., 2024), increased susceptibility of soils to wind and water erosion (Dollar et al., 2013) and increased wildfire risk (Brando et al., 2014; Albertson et al., 2009) to name a few.
3.4 Discussion
The ESMs analysed in this study do not fully represent all processes important to the carbon cycle. They do not, for instance, model the impact of topographical variation on groundwater and its impact on ecosystem productivity (Costa et al., 2023). These models also do not explicitly account for diffuse radiation and its impacts on the biosphere (Mercado et al., 2009; Chakraborty et al., 2022). However, we note that diffuse radiation fertilisation is expected to further increase land carbon storage under SAI. We also note that this study only analyses a small number of models for one SAI scenario, stratospheric aerosol injection, and that the risks and benefits of SAI depend strongly on how it is deployed (Haywood et al., 2022a; Keith and MacMartin, 2015; Kalidindi et al., 2015). However, we see similar increases in projected NPP and land carbon storage in the G6solar experiments, which apply a reduction of the solar constant (Figs. S3 and S4). However, we see similar increases in projected NPP and land carbon storage in the G6solar experiments, which reduce the radiative forcing from the high emissions scenario (SSP585) to the medium forcing scenario (SSP245) by reducing solar irradiance (Kravitz et al., 2015) (Figs. S3 and S4). Additionally, we note that SAI is a temporary mitigation measure which, while reducing global temperatures, does not address the primary drivers of climate change, (increased concentrations of greenhouse gases). As a result, if SAI is terminated, global temperatures would rise rapidly due to the elevated greenhouse gas concentrations (this is known as the “termination effect”, (Jones et al., 2013; Muri et al., 2018). Therefore, global efforts to reduce carbon emissions would still be required even if SAI were to be deployed temporarily to reduce the risk of Amazon dieback.
Model ensemble averages show that CMIP6 models tend to underestimate NPP in central and northeastern areas of the Amazon but overestimate in north-west and south easterly regions, when compared with MODIS data. Looking at individual models, CESM2-WACCM and IPSL-CM6A-LR underestimate NPP in Amazonia, while MPI-ESM1-2-LR generally overestimates NPP (Hu et al., 2022) These individual model variations are important to take into account when interpreting CMIP6 outputs for the Amazon. Although improved on the CMIP5 model generation, the CMIP6 models still tend to overestimate temperatures in the Amazon basin (Firpo et al., 2022), and underestimate rainfall (Hagos et al., 2021; Parsons, 2020; Monteverde et al., 2022). This tends to bias models towards less favourable conditions for the Amazon rainforest. However, CMIP6 models show greater agreement in projections of rainfall change in the Amazonian basin, than previous model generations (Parsons, 2020).
There are many legitimate concerns about the possibility of implementing SAI geoengineering in the real world (Robock, 2020; Abiodun et al., 2021; Pope et al., 2012; Trisos et al., 2018; Barrett, 2008; Keith et al., 2016), which need to be openly discussed. However, based on results from five Earth System Models, this study suggests that Stratospheric Aerosol Injection (SAI) geoengineering would likely increase global NPP and land carbon storage relative to both unmitigated climate change (under the SSP585 scenario) and conventional mitigation (as represented by SSP245 relative to SSP585), with NPP and land carbon storage increasing by 15.6 % and 5.9 % respectively compared to SSP245. The modelled positive impacts of SAI are most marked in Amazonia, where SAI is projected to lead to significant increases in both NPP and land carbon storage. We observe increases in land carbon storage on the order of 8.6 % and 10.8 % in G6sulfur compared to SSP245 and SSP585, respectively. We note, however, that these observed increases in NPP and land carbon storage are not universal, with regions such as eastern Africa, the northern high latitudes, and Indonesia showing decreases for some models. The best protection for the Amazon rainforest is a combination of reduced rates of both deforestation and anthropogenic climate change. However, this study suggests that SAI geoengineering might provide some emergency protection against climate-change induced Amazon carbon loss, if CO2 induced climate change is not brought under control. In our view, further modelling studies are urgently needed to assess SAI approaches in that context.
The code used for data analysis and producing the figures is available at https://doi.org/10.5281/zenodo.11507510 (Parry, 2024). Please refer to the README file at Parry (2024) for a detailed description of the code's functionality.
The CMIP6 model output datasets analysed during this study are publicly available online at: https://doi.org/10.22033/ESGF/CMIP6.10034 (Danabasoglu, 2019), https://doi.org/10.22033/ESGF/CMIP6.3907 (Seferian, 2019), https://doi.org/10.22033/ESGF/CMIP6.5059 (Boucher et al., 2020a), https://doi.org/10.22033/ESGF/CMIP6.6448 (Niemeier et al., 2019), https://doi.org/10.22033/ESGF/CMIP6.5822 (Jones, 2019), https://doi.org/10.22033/ESGF/input4MIPs.10468 (Hurtt et al., 2019).
The supplement related to this article is available online at https://doi.org/10.5194/esd-17-387-2026-supplement.
IMP led the analysis and drafted the manuscript with support from PDLR and PMC. PMC and PDLR conceived of the research idea, and IMP, PDLR, PMC and JMH shaped the research. All co-authors commented on and provided edits to the original manuscript.
The contact author has declared that none of the authors has any competing interests.
Publisher's note: Copernicus Publications remains neutral with regard to jurisdictional claims made in the text, published maps, institutional affiliations, or any other geographical representation in this paper. The authors bear the ultimate responsibility for providing appropriate place names. Views expressed in the text are those of the authors and do not necessarily reflect the views of the publisher.
We acknowledge the World Climate Research Programme's Working Group on Coupled Modelling, which is responsible for CMIP, and we thank the climate modelling groups for producing and making available their model output. The IPSL-CM6 experiments were performed using the HPC resources of TGCC under the allocations 2021-A0100107732, 2022-A0120107732, 2023-A0140107732 (project gencmip6) provided by GENCI (Grand Equipement National de Calcul Intensif). Isobel M. Parry, Peter M. Cox, and James M. Haywood were part funded by Quadrature Climate Foundation; grant reference number 01-21-000336. Paul D. L. Ritchie and Peter M. Cox were supported by the Optimal High Resolution Earth System Models for Exploring Future Climate Changes (OptimESM) project, grant agreement number 101081193, and by ClimTip. The ClimTip project received funding from the European Union's Horizon Europe research and innovation programme under grant no. 101137601, funded by the European Union. Peter M. Cox was supported by the PREDICT project, which received funding from the European Space Agency (ESA) under contract no. 4000146344/24/I-LR. Paul D. L. Ritchie and Peter M. Cox acknowledge support from the UK Advanced Research and Invention Agency (ARIA) via project “AdvanTip”, grant no. SCOP-PR01-P003.
This research has been supported by the Quadrature Climate Foundation (grant no. 01-21-000336).
This paper was edited by Ben Kravitz and reviewed by two anonymous referees.
Abiodun, B. J., Odoulami, R. C., Sawadogo, W., Oloniyo, O. A., Abatan, A. A., New, M., Lennard, C., Izidine, P., Egbebiyi, T. S., and MacMartin, D. G.: Potential impacts of stratospheric aerosol injection on drought risk managements over major river basins in Africa, Climatic Change, 169, https://doi.org/10.1007/s10584-021-03268-w, 2021. a, b
Albertson, K., Aylen, J., Cavan, G., and McMorrow, J.: Forecasting the outbreak of moorland wildfires in the English Peak District, J. Environ. Manage., 90, 2642–2651, https://doi.org/10.1016/j.jenvman.2009.02.011, 2009. a
Armstrong McKay, D. I., Staal, A., Abrams, J. F., Winkelmann, R., Sakschewski, B., Loriani, S., Fetzer, I., Cornell, S. E., Rockström, J., and Lenton, T. M.: Exceeding 1.5 °C global warming could trigger multiple climate tipping points, Science, 377, https://doi.org/10.1126/science.abn7950, 2022. a, b
Arora, V. K., Katavouta, A., Williams, R. G., Jones, C. D., Brovkin, V., Friedlingstein, P., Schwinger, J., Bopp, L., Boucher, O., Cadule, P., Chamberlain, M. A., Christian, J. R., Delire, C., Fisher, R. A., Hajima, T., Ilyina, T., Joetzjer, E., Kawamiya, M., Koven, C. D., Krasting, J. P., Law, R. M., Lawrence, D. M., Lenton, A., Lindsay, K., Pongratz, J., Raddatz, T., Séférian, R., Tachiiri, K., Tjiputra, J. F., Wiltshire, A., Wu, T., and Ziehn, T.: Carbon–concentration and carbon–climate feedbacks in CMIP6 models and their comparison to CMIP5 models, Biogeosciences, 17, 4173–4222, https://doi.org/10.5194/bg-17-4173-2020, 2020. a, b, c, d, e
Ballantyne, A., Smith, W., Anderegg, W., Kauppi, P., Sarmiento, J., Tans, P., Shevliakova, E., Pan, Y., Poulter, B., Anav, A., Friedlingstein, P., Houghton, R., and Running, S.: Accelerating net terrestrial carbon uptake during the warming hiatus due to reduced respiration, Nat. Clim. Change, 7, 148–152, https://doi.org/10.1038/nclimate3204, 2017. a, b
Barrett, S.: The incredible economics of geoengineering, in: Environmental and Resource Economics, Springer Nature Link, 39, 45–54, https://doi.org/10.1007/s10640-007-9174-8, 2008. a, b, c
Betts, R. A., Belcher, S. E., Hermanson, L., Tank, A. K., Lowe, J. A., Jones, C. D., Morice, C. P., Rayner, N. A., Scaife, A. A., and Stott, P. A.: Approaching 1.5 °C: how will we know we’ve reached this crucial warming mark?, Nature, 624, 33–35, https://doi.org/10.1038/d41586-023-03775-z, 2023. a
Bond-Lamberty, B. and Thomson, A.: Temperature-associated increases in the global soil respiration record, Nature, 464, 579–582, https://doi.org/10.1038/nature08930, 2010. a, b
Boucher, O., Denvil, S., Levavasseur, G., Cozic, A., Caubel, A., Foujols, M.-A., Meurdesoif, Y., and Lurton, T.: IPSL IPSL-CM6A-LR model output prepared for CMIP6 GeoMIP G6sulfur, Earth System Grid Federation [data set], https://doi.org/10.22033/ESGF/CMIP6.5059, 2020a. a
Boucher, O., Servonnat, J., Albright, A. L., Aumont, O., Balkanski, Y., Bastrikov, V., Bekki, S., Bonnet, R., Bony, S., Bopp, L., Braconnot, P., Brockmann, P., Cadule, P., Caubel, A., Cheruy, F., Codron, F., Cozic, A., Cugnet, D., D'Andrea, F., Davini, P., de Lavergne, C., Denvil, S., Deshayes, J., Devilliers, M., Ducharne, A., Dufresne, J. L., Dupont, E., Éthé, C., Fairhead, L., Falletti, L., Flavoni, S., Foujols, M. A., Gardoll, S., Gastineau, G., Ghattas, J., Grandpeix, J. Y., Guenet, B., Lionel, E. G., Guilyardi, E., Guimberteau, M., Hauglustaine, D., Hourdin, F., Idelkadi, A., Joussaume, S., Kageyama, M., Khodri, M., Krinner, G., Lebas, N., Levavasseur, G., Lévy, C., Li, L., Lott, F., Lurton, T., Luyssaert, S., Madec, G., Madeleine, J. B., Maignan, F., Marchand, M., Marti, O., Mellul, L., Meurdesoif, Y., Mignot, J., Musat, I., Ottlé, C., Peylin, P., Planton, Y., Polcher, J., Rio, C., Rochetin, N., Rousset, C., Sepulchre, P., Sima, A., Swingedouw, D., Thiéblemont, R., Traore, A. K., Vancoppenolle, M., Vial, J., Vialard, J., Viovy, N., and Vuichard, N.: Presentation and Evaluation of the IPSL-CM6A-LR Climate Model, J. Adv. Model. Earth Sy., 12, https://doi.org/10.1029/2019MS002010, 2020b. a, b, c
Brando, P. M., Balch, J. K., Nepstad, D. C., Morton, D. C., Putz, F. E., Coe, M. T., Silvério, D., Macedo, M. N., Davidson, E. A., Nóbrega, C. C., Alencar, A., and Soares-Filho, B. S.: Abrupt increases in Amazonian tree mortality due to drought-fire interactions, P. Natl. Acad. Sci. USA, 111, 6347–6352, https://doi.org/10.1073/pnas.1305499111, 2014. a
Britain, R. S. G.: Geoengineering the climate: science, governance and uncertainty, Royal Society, ISBN 9780854037735, 2009. a
Calvin, K., Dasgupta, D., Krinner, G., Mukherji, A., Thorne, P. W., Trisos, C., Romero, J., Aldunce, P., Barrett, K., Blanco, G., Cheung, W. W., Connors, S., Denton, F., Diongue-Niang, A., Dodman, D., Garschagen, M., Geden, O., Hayward, B., Jones, C., Jotzo, F., Krug, T., Lasco, R., Lee, Y.-Y., Masson-Delmotte, V., Meinshausen, M., Mintenbeck, K., Mokssit, A., Otto, F. E., Pathak, M., Pirani, A., Poloczanska, E., Pörtner, H.-O., Revi, A., Roberts, D. C., Roy, J., Ruane, A. C., Skea, J., Shukla, P. R., Slade, R., Slangen, A., Sokona, Y., Sörensson, A. A., Tignor, M., van Vuuren, D., Wei, Y.-M., Winkler, H., Zhai, P., Zommers, Z., Hourcade, J.-C., Johnson, F. X., Pachauri, S., Simpson, N. P., Singh, C., Thomas, A., Totin, E., Alegría, A., Armour, K., Bednar-Friedl, B., Blok, K., Cissé, G., Dentener, F., Eriksen, S., Fischer, E., Garner, G., Guivarch, C., Haasnoot, M., Hansen, G., Hauser, M., Hawkins, E., Hermans, T., Kopp, R., Leprince-Ringuet, N., Lewis, J., Ley, D., Ludden, C., Niamir, L., Nicholls, Z., Some, S., Szopa, S., Trewin, B., van der Wijst, K.-I., Winter, G., Witting, M., Birt, A., and Ha, M.: IPCC, 2023: Climate Change 2023: Synthesis Report. Contribution of Working Groups I, II and III to the Sixth Assessment Report of the Intergovernmental Panel on Climate Change, edited by: Core Writing Team, Lee, H., and Romero, J., IPCC, Geneva, Switzerland., Tech. rep., Intergovernmental Panel on Climate Change, https://doi.org/10.59327/IPCC/AR6-9789291691647, 2023. a
Canadell, J. G., Monteiro, P. M. S., Costa, M. H., Cotrim da Cunha, L., Cox, P. M., Eliseev, A. V., Henson, S., Ishii, M., Jaccard, S., Koven, C., Lohila, A., Patra, P. K., Piao, S., Rogelj, J., Syampungani, S., Zaehle, S., and Zickfeld, K.: Global Carbon and Other Biogeochemical Cycles and Feedbacks, in: Climate Change 2021: The Physical Science Basis. Contribution of Working Group I to the Sixth Assessment Report of the Intergovernmental Panel on Climate Change, edited by: Masson-Delmotte, V., Zhai, P., Pirani, A., Connors, S. L., Péan, C., Berger, S., Caud, N., Chen, Y., Goldfarb, L., Gomis, M. I., Huang, M., Leitzell, K., Lonnoy, E., Matthews, J. B., Maycock, T. K., Waterfield, T., Yelekçi, R., Yu, R., and Zhou, B., 673–816, Cambridge University Press, Cambridge, United Kingdom and New York, NY, USA, https://doi.org/10.1017/9781009157896.007, 2023. a
Chakraborty, T., Lee, X., and Lawrence, D. M.: Diffuse Radiation Forcing Constraints on Gross Primary Productivity and Global Terrestrial Evapotranspiration, Earth's Future, 10, https://doi.org/10.1029/2022EF002805, 2022. a
Chen, A., Guan, H., and Batelaan, O.: Non-linear interactions between vegetation and terrestrial water storage in Australia, J. Hydrol., 613, https://doi.org/10.1016/j.jhydrol.2022.128336, 2022. a
Chen, X., Hu, H., Wang, Q., Wang, X., and Ma, B.: Exploring the Factors Affecting Terrestrial Soil Respiration in Global Warming Manipulation Experiments Based on Meta-Analysis, Agriculture, 14, 1581, https://doi.org/10.3390/agriculture14091581, 2024. a
Costa, F. R., Schietti, J., Stark, S. C., and Smith, M. N.: The other side of tropical forest drought: do shallow water table regions of Amazonia act as large-scale hydrological refugia from drought?, New Phytologist, 237, 714–733, https://doi.org/10.1111/nph.17914, 2023. a
Cox, P., Betts, R., Collins, M., Harris, P., Huntingford, C., and Jones, C.: Amazonian forest dieback under climate-carbon cycle projections for the 21st century, Theor. Appl. Climatol., 78, https://doi.org/10.1007/s00704-004-0049-4, 2004. a, b, c, d, e
Cox, P. M., Harris, P. P., Huntingford, C., Betts, R. A., Collins, M., Jones, C. D., Jupp, T. E., Marengo, J. A., and Nobre, C. A.: Increasing risk of Amazonian drought due to decreasing aerosol pollution, Nature, 453, 212–215, https://doi.org/10.1038/nature06960, 2008. a
Cox, P. M., Williamson, M. S., Friedlingstein, P., Jones, C. D., Raoult, N., Rogelj, J., and Varney, R. M.: Emergent constraints on carbon budgets as a function of global warming, Nat. Commun., 15, 1885, https://doi.org/10.1038/s41467-024-46137-7, 2024. a
Cramer, W., Bondeau, A., Woodward, F. I., Prentice, I. C., Betts, R. A., Brovkin, V., Cox, P. M., Fisher, V., Foley, J. A., Friend, A. D., Kucharik, C., Lomas, M. R., Ramankutty, N., Sitch, S., Smith, B., White, A., and Young-Molling, C.: Global response of terrestrial ecosystem structure and function to CO2 and climate change: Results from six dynamic global vegetation models, Glob. Change Biol., 7, 357–373, https://doi.org/10.1046/j.1365-2486.2001.00383.x, 2001. a
Crutzen, P. J.: Albedo enhancement by stratospheric sulfur injections: A contribution to resolve a policy dilemma?, Climatic Change, 77, 211–220, https://doi.org/10.1007/s10584-006-9101-y, 2006. a
Dagon, K. and Schrag, D. P.: Quantifying the effects of solar geoengineering on vegetation, Climatic Change, 153, 235–251, https://doi.org/10.1007/s10584-019-02387-9, 2019. a
Danabasoglu, G.: NCAR CESM2-WACCM model output prepared for CMIP6 GeoMIP G6sulfur, Earth System Grid Federation [data set], https://doi.org/10.22033/ESGF/CMIP6.10034, 2019. a
Danabasoglu, G., Lamarque, J. F., Bacmeister, J., Bailey, D. A., DuVivier, A. K., Edwards, J., Emmons, L. K., Fasullo, J., Garcia, R., Gettelman, A., Hannay, C., Holland, M. M., Large, W. G., Lauritzen, P. H., Lawrence, D. M., Lenaerts, J. T., Lindsay, K., Lipscomb, W. H., Mills, M. J., Neale, R., Oleson, K. W., Otto-Bliesner, B., Phillips, A. S., Sacks, W., Tilmes, S., van Kampenhout, L., Vertenstein, M., Bertini, A., Dennis, J., Deser, C., Fischer, C., Fox-Kemper, B., Kay, J. E., Kinnison, D., Kushner, P. J., Larson, V. E., Long, M. C., Mickelson, S., Moore, J. K., Nienhouse, E., Polvani, L., Rasch, P. J., and Strand, W. G.: The Community Earth System Model Version 2 (CESM2), J. Adv. Model. Earth Sy., 12, https://doi.org/10.1029/2019MS001916, 2020. a, b
Davies-Barnard, T., Meyerholt, J., Zaehle, S., Friedlingstein, P., Brovkin, V., Fan, Y., Fisher, R. A., Jones, C. D., Lee, H., Peano, D., Smith, B., Wårlind, D., and Wiltshire, A. J.: Nitrogen cycling in CMIP6 land surface models: progress and limitations, Biogeosciences, 17, 5129–5148, https://doi.org/10.5194/bg-17-5129-2020, 2020. a
Dekker, S. C., Groenendijk, M., Booth, B. B. B., Huntingford, C., and Cox, P. M.: Spatial and temporal variations in plant water-use efficiency inferred from tree-ring, eddy covariance and atmospheric observations, Earth Syst. Dynam., 7, 525–533, https://doi.org/10.5194/esd-7-525-2016, 2016. a, b
Dollar, E., Edwards, F., Stratford, C., May, L., Biggs, J., Laize, C., Acreman, M., Blake, J., Carvalho, L., Elliott, A., Gunn, I., Hinsley, S., Mountford, O., Nunn, M., Preston, C., Sayer, E., Schonrogge, K., Spears, B., Spurgeon, D., Winfield, I., and Wood, P.: Monitoring and Assessment of Environmental Impacts of Droughts: Literature Synthesis, Tech. Rep. Report SC120024/R1ii, Environment Agency, Bristol, UK, https://assets.publishing.service.gov.uk/media/5a75ba92e5274a436829984f/LIT_8569_b765dd.pdf (last access: 10 February 2026), 2013. a
Doughty, C. E. and Goulden, M. L.: Are tropical forests near a high temperature threshold?, J. Geophys. Res.-Biogeo., 114, https://doi.org/10.1029/2007JG000632, 2009. a
Duan, L., Cao, L., Bala, G., and Caldeira, K.: A model‐based investigation of terrestrial plant carbon uptake response to four radiation modification approaches, J. Geophys. Res.-Atmos., 125, e2019JD031883, https://doi.org/10.1029/2019JD031883, 2020. a, b
Duffey, A., Irvine, P., Tsamados, M., and Stroeve, J.: Solar Geoengineering in the Polar Regions: A Review, Earth's Future, 11, e2023EF003679, https://doi.org/10.1029/2023EF003679, 2023. a
Eyring, V., Bony, S., Meehl, G. A., Senior, C. A., Stevens, B., Stouffer, R. J., and Taylor, K. E.: Overview of the Coupled Model Intercomparison Project Phase 6 (CMIP6) experimental design and organization, Geosci. Model Dev., 9, 1937–1958, https://doi.org/10.5194/gmd-9-1937-2016, 2016. a, b
Firpo, M. Â. F., Guimarães, B. D. S., Dantas, L. G., Silva, M. G. B. D., Alves, L. M., Chadwick, R., Llopart, M. P., and Oliveira, G. S. D.: Assessment of CMIP6 models; performance in simulating present-day climate in Brazil, Front. Climate, 4, 948499, https://doi.org/10.3389/fclim.2022.948499, 2022. a
Flores, B. M., Montoya, E., Sakschewski, B., Nascimento, N., Staal, A., Betts, R. A., Levis, C., Lapola, D. M., Esquível-Muelbert, A., Jakovac, C., Nobre, C. A., Oliveira, R. S., Borma, L. S., Nian, D., Boers, N., Hecht, S. B., ter Steege, H., Arieira, J., Lucas, I. L., Berenguer, E., Marengo, J. A., Gatti, L. V., Mattos, C. R. C., and Hirota, M.: Critical transitions in the Amazon forest system, Nature, 626, 555–564, https://doi.org/10.1038/s41586-023-06970-0, 2024. a, b
Frölicher, T. L., Joos, F., Raible, C. C., and Sarmiento, J. L.: Atmospheric CO2 response to volcanic eruptions: The role of ENSO, season, and variability, Global Biogeochem. Cy., 27, 239–251, https://doi.org/10.1002/gbc.20028, 2013. a, b
Glienke, S., Irvine, P. J., and Lawrence, M. G.: The impact of geoengineering on vegetation in experiment G1 of the Geoengineering Model Intercomparison Project (GeoMIP), J. Geophys. Res.-Atmos., 120, 10196–10213, https://doi.org/10.1002/2015JD024202, 2015. a
Hagos, S. M., Leung, L. R., Garuba, O. A., Demott, C., Harrop, B., Lu, J., and Ahn, M. S.: The relationship between precipitation and precipitable water in CMIP6 simulations and implications for tropical climatology and change, J. Climate, 34, 1587–1600, https://doi.org/10.1175/JCLI-D-20-0211.1, 2021. a
Haywood, J., Tilmes, S., Keutsch, F., Niemeier, U., Schmidt, A., Visioni, D., Yu, P., Dykema, J., Jones, A. C., Laasko, A., and Wilka, C. A.: Stratospheric Aerosol Injection and its Potential Effect on the Stratospheric Ozone Layer, Chap. 6, in: Scientific Assessment of Ozone Depletion, Tech. rep., World Meteorological Organization, 2022a. a
Haywood, J. M., Jones, A., Johnson, B. T., and McFarlane Smith, W.: Assessing the consequences of including aerosol absorption in potential stratospheric aerosol injection climate intervention strategies, Atmos. Chem. Phys., 22, 6135–6150, https://doi.org/10.5194/acp-22-6135-2022, 2022b. a
Heskel, M. A., O'Sullivan, O. S., Reich, P. B., Tjoelker, M. G., Weerasinghe, L. K., Penillard, A., Egerton, J. J., Creek, D., Bloomfield, K. J., Xiang, J., Sinca, F., Stangl, Z. R., Torre, A. M.-D. L., Griffin, K. L., Huntingford, C., Hurry, V., Meir, P., Turnbull, M. H., and Atkin, O. K.: Convergence in the temperature response of leaf respiration across biomes and plant functional types, P. Natl. Acad. Sci. USA, 113, 3832–3837, https://doi.org/10.1073/pnas.1520282113, 2016. a
Hu, Q., Li, T., Deng, X., Wu, T., Zhai, P., Huang, D., Fan, X., Zhu, Y., Lin, Y., Xiao, X., Chen, X., Zhao, X., Wang, L., and Qin, Z.: Intercomparison of global terrestrial carbon fluxes estimated by MODIS and Earth system models, Sci. Total Environ., 810, 152231, https://doi.org/10.1016/j.scitotenv.2021.152231, 2022. a
Huntingford, C., Zelazowski, P., Galbraith, D., Mercado, L. M., Sitch, S., Fisher, R., Lomas, M., Walker, A. P., Jones, C. D., Booth, B. B. B., Malhi, Y., Hemming, D., Kay, G., Good, P., Lewis, S. L., Phillips, O. L., Atkin, O. K., Lloyd, J., Gloor, E., Zaragoza-Castells, J., Meir, P., Betts, R., Harris, P. P., Nobre, C., Marengo, J., and Cox, P. M.: Simulated resilience of tropical rainforests to CO2-induced climate change, Nat. Geosci., 6, 268–273, https://doi.org/10.1038/ngeo1741, 2013. a, b
Hurtt, G., Chini, L., Sahajpal, R., Frolking, S., Bodirsky, B. L., Calvin, K., Doelman, J., Fisk, J., Fujimori, S., Goldewijk, K. K., Hasegawa, T., Havlik, P., Heinimann, A., Humpenöder, F., Jungclaus, J., Kaplan, J., Krisztin, T., Lawrence, D., Lawrence, P., Mertz, O., Pongratz, J., Popp, A., Riahi, K., Shevliakova, E., Stehfest, E., Thornton, P., van Vuuren, D., and Zhang, X.: Harmonization of Global Land Use Change and Management for the Period 2015–2300, Earth System Grid Federation [data set], https://doi.org/10.22033/ESGF/input4MIPs.10468, 2019. a
Jones, A.: MOHC UKESM1.0-LL model output prepared for CMIP6 GeoMIP G6sulfur, Earth System Grid Federation [data set], https://doi.org/10.22033/ESGF/CMIP6.5822, 2019. a
Jones, A., Haywood, J., and Boucher, O.: A comparison of the climate impacts of geoengineering by stratospheric SO2 injection and by brightening of marine stratocumulus cloud, Atmos. Sci. Lett., 12, 176–183, https://doi.org/10.1002/asl.291, 2011. a
Jones, A., Haywood, J. M., Alterskjær, K., Boucher, O., Cole, J. N., Curry, C. L., Irvine, P. J., Ji, D., Kravitz, B., Kristjánsson, J. E., Moore, J. C., Niemeier, U., Robock, A., Schmidt, H., Singh, B., Tilmes, S., Watanabe, S., and Yoon, J. H.: The impact of abrupt suspension of solar radiation management (termination effect) in experiment G2 of the Geoengineering Model Intercomparison Project (GeoMIP), J. Geophys. Res.-Atmos., 118, 9743–9752, https://doi.org/10.1002/jgrd.50762, 2013. a, b, c, d
Jones, C. D., Collins, M., Cox, P. M., and Spall, S. A.: The Carbon Cycle Response to ENSO: A Coupled Climate–Carbon Cycle Model Study, J. Climate, 14, 4113–4129, https://doi.org/10.1175/1520-0442(2001)014<4113:TCCRTE>2.0.CO;2, 2001. a
Kalidindi, S., Bala, G., Modak, A., and Caldeira, K.: Modeling of solar radiation management: a comparison of simulations using reduced solar constant and stratospheric sulphate aerosols, Clim. Dynam., 44, 2909–2925, https://doi.org/10.1007/s00382-014-2240-3, 2015. a
Keith, D. W. and MacMartin, D. G.: A temporary, moderate and responsive scenario for solar geoengineering, Nat. Clim. Change, 5, 201–206, https://doi.org/10.1038/nclimate2493, 2015. a
Keith, D. W., Weisenstein, D. K., Dykema, J. A., and Keutsch, F. N.: Stratospheric solar geoengineering without ozone loss, P. Natl. Acad. Sci. USA, 113, 14910–14914, https://doi.org/10.1073/pnas.1615572113, 2016. a
Kravitz, B., Caldeira, K., Boucher, O., Robock, A., Rasch, P. J., Alterskjær, K., Karam, D. B., Cole, J. N., Curry, C. L., Haywood, J. M., Irvine, P. J., Ji, D., Jones, A., Kristjánsson, J. E., Lunt, D. J., Moore, J. C., Niemeier, U., Schmidt, H., Schulz, M., Singh, B., Tilmes, S., Watanabe, S., Yang, S., and Yoon, J. H.: Climate model response from the Geoengineering Model Intercomparison Project (GeoMIP), J. Geophys. Res.-Atmos., 118, 8320–8332, https://doi.org/10.1002/jgrd.50646, 2013. a
Kravitz, B., Robock, A., Tilmes, S., Boucher, O., English, J. M., Irvine, P. J., Jones, A., Lawrence, M. G., MacCracken, M., Muri, H., Moore, J. C., Niemeier, U., Phipps, S. J., Sillmann, J., Storelvmo, T., Wang, H., and Watanabe, S.: The Geoengineering Model Intercomparison Project Phase 6 (GeoMIP6): simulation design and preliminary results, Geosci. Model Dev., 8, 3379–3392, https://doi.org/10.5194/gmd-8-3379-2015, 2015. a, b, c, d, e
Kravitz, B., Macmartin, D. G., Mills, M. J., Richter, J. H., Tilmes, S., Lamarque, J. F., Tribbia, J. J., and Vitt, F.: First simulations of designing stratospheric sulfate aerosol geoengineering to meet multiple simultaneous climate objectives, J. Geophys. Res.-Atmos., 122, 12616–12634, https://doi.org/10.1002/2017JD026874, 2017. a
Kravitz, B., MacMartin, D. G., Visioni, D., Boucher, O., Cole, J. N. S., Haywood, J., Jones, A., Lurton, T., Nabat, P., Niemeier, U., Robock, A., Séférian, R., and Tilmes, S.: Comparing different generations of idealized solar geoengineering simulations in the Geoengineering Model Intercomparison Project (GeoMIP), Atmos. Chem. Phys., 21, 4231–4247, https://doi.org/10.5194/acp-21-4231-2021, 2021. a
Kumarathunge, D. P., Medlyn, B. E., Drake, J. E., Tjoelker, M. G., Aspinwall, M. J., Battaglia, M., Cano, F. J., Carter, K. R., Cavaleri, M. A., Cernusak, L. A., Chambers, J. Q., Crous, K. Y., Kauwe, M. G. D., Dillaway, D. N., Dreyer, E., Ellsworth, D. S., Ghannoum, O., Han, Q., Hikosaka, K., Jensen, A. M., Kelly, J. W., Kruger, E. L., Mercado, L. M., Onoda, Y., Reich, P. B., Rogers, A., Slot, M., Smith, N. G., Tarvainen, L., Tissue, D. T., Togashi, H. F., Tribuzy, E. S., Uddling, J., Vårhammar, A., Wallin, G., Warren, J. M., and Way, D. A.: Acclimation and adaptation components of the temperature dependence of plant photosynthesis at the global scale, New Phytologist, 222, 768–784, https://doi.org/10.1111/nph.15668, 2019. a
Lauvset, S. K., Tjiputra, J., and Muri, H.: Climate engineering and the ocean: effects on biogeochemistry and primary production, Biogeosciences, 14, 5675–5691, https://doi.org/10.5194/bg-14-5675-2017, 2017. a
Lee, H., Muri, H., Ekici, A., Tjiputra, J., and Schwinger, J.: The response of terrestrial ecosystem carbon cycling under different aerosol-based radiation management geoengineering, Earth Syst. Dynam., 12, 313–326, https://doi.org/10.5194/esd-12-313-2021, 2021. a
Li, Z. and Fedorov, A. V.: Climate Models Exaggerate the Enhanced Double-ITCZ in the Warming Tropical Pacific Due To Preexisting Precipitation Bias, Geophys. Res. Lett., 52, e2025GL115445, https://doi.org/10.1029/2025GL115445, 2025. a
MacMartin, D. G., Kravitz, B., Tilmes, S., Richter, J. H., Mills, M. J., Lamarque, J.-F., Tribbia, J. J., and Vitt, F.: The climate response to stratospheric aerosol geoengineering can be tailored using multiple injection locations, J. Geophys. Res.-Atmos., 122, 12574–12590, https://doi.org/10.1002/2017JD026868, 2017. a
Mauritsen, T., Bader, J., Becker, T., Behrens, J., Bittner, M., Brokopf, R., Brovkin, V., Claussen, M., Crueger, T., Esch, M., Fast, I., Fiedler, S., Fläschner, D., Gayler, V., Giorgetta, M., Goll, D. S., Haak, H., Hagemann, S., Hedemann, C., Hohenegger, C., Ilyina, T., Jahns, T., de-la Cuesta, D. J., Jungclaus, J., Kleinen, T., Kloster, S., Kracher, D., Kinne, S., Kleberg, D., Lasslop, G., Kornblueh, L., Marotzke, J., Matei, D., Meraner, K., Mikolajewicz, U., Modali, K., Möbis, B., Müller, W. A., Nabel, J. E., Nam, C. C., Notz, D., Nyawira, S. S., Paulsen, H., Peters, K., Pincus, R., Pohlmann, H., Pongratz, J., Popp, M., Raddatz, T. J., Rast, S., Redler, R., Reick, C. H., Rohrschneider, T., Schemann, V., Schmidt, H., Schnur, R., Schulzweida, U., Six, K. D., Stein, L., Stemmler, I., Stevens, B., von Storch, J. S., Tian, F., Voigt, A., Vrese, P., Wieners, K. H., Wilkenskjeld, S., Winkler, A., and Roeckner, E.: Developments in the MPI-M Earth System Model version 1.2 (MPI-ESM1.2) and Its Response to Increasing CO2, J. Adv. Model. Earth Sy., 11, 998–1038, https://doi.org/10.1029/2018MS001400, 2019. a, b
Meehl, G. A., Moss, R., Taylor, K. E., Eyring, V., Stouffer, R. J., Bony, S., and Stevens, B.: Climate model intercomparisons: Preparing for the next phase, Eos, 95, 77–78, https://doi.org/10.1002/2014EO090001, 2014. a
Mercado, L. M., Bellouin, N., Sitch, S., Boucher, O., Huntingford, C., Wild, M., and Cox, P. M.: Impact of changes in diffuse radiation on the global land carbon sink, Nature, 458, 1014–1017, https://doi.org/10.1038/nature07949, 2009. a, b
Monteverde, C., Sales, F. D., and Jones, C.: Evaluation of the CMIP6 Performance in Simulating Precipitation in the Amazon River Basin, Climate, 10, https://doi.org/10.3390/cli10080122, 2022. a
Muri, H., Tjiputra, J., Otterå, H., Adakudlu, M., Lauvset, S. K., Grini, A., Schulz, M., Niemeier, U., and Kristjánsson, J. E.: Climate Response to Aerosol Geoengineering: A Multimethod Comparison, J. Climate, 31, https://doi.org/10.1175/JCLI-D-17-0620.s1, 2018. a
Niemeier, U. and Schmidt, H.: Changing transport processes in the stratosphere by radiative heating of sulfate aerosols, Atmos. Chem. Phys., 17, 14871–14886, https://doi.org/10.5194/acp-17-14871-2017, 2017. a, b
Niemeier, U., Wieners, K.-H., Giorgetta, M., Jungclaus, J., Reick, C., Esch, M., Bittner, M., Legutke, S., Schupfner, M., Wachsmann, F., Gayler, V., Haak, H., de Vrese, P., Raddatz, T., Mauritsen, T., von Storch, J.-S., Behrens, J., Brovkin, V., Claussen, M., Crueger, T., Fast, I., Fiedler, S., Hagemann, S., Hohenegger, C., Jahns, T., Kloster, S., Kinne, S., Lasslop, G., Kornblueh, L., Marotzke, J., Matei, D., Meraner, K., Mikolajewicz, U., Modali, K., Müller, W., Nabel, J., Notz, D., Peters-von Gehlen, K., Pincus, R., Pohlmann, H., Pongratz, J., Rast, S., Schmidt, H., Schnur, R., Schulzweida, U., Six, K., Stevens, B., Voigt, A., and Roeckner, E.: MPI-M MPI-ESM1.2-LR model output prepared for CMIP6 GeoMIP G6sulfur, Earth System Grid Federation [data set], https://doi.org/10.22033/ESGF/CMIP6.6448, 2019. a
Norby, R. J.: Ecological and evolutionary lessons from free air carbon enhancement (FACE) experiments, Annu. Rev. Ecol. Evol. S., 42, https://doi.org/10.1146/annurev-ecolsys-102209-144647, 2011. a, b, c
O'Neill, B. C., Tebaldi, C., van Vuuren, D. P., Eyring, V., Friedlingstein, P., Hurtt, G., Knutti, R., Kriegler, E., Lamarque, J.-F., Lowe, J., Meehl, G. A., Moss, R., Riahi, K., and Sanderson, B. M.: The Scenario Model Intercomparison Project (ScenarioMIP) for CMIP6, Geosci. Model Dev., 9, 3461–3482, https://doi.org/10.5194/gmd-9-3461-2016, 2016. a, b
Parry, I. M.: IP294/SRM-is-projected-to-increase-land-carbon-storage-and-to-protect-the-Amazon-rainforest: SRM-is-projected-to-increase-land-carbon-storage-and-to-protect-the-Amazon-rainforest release v1.0.0 (v1.0.2), Zenodo [code], https://doi.org/10.5281/zenodo.11507510, 2024. a, b
Parry, I. M., Ritchie, P. D. L., and Cox, P. M.: Evidence of localised Amazon rainforest dieback in CMIP6 models, Earth Syst. Dynam., 13, 1667–1675, https://doi.org/10.5194/esd-13-1667-2022, 2022. a, b, c, d
Parsons, L. A.: Implications of CMIP6 Projected Drying Trends for 21st Century Amazonian Drought Risk, Earth's Future, 8, https://doi.org/10.1029/2020EF001608, 2020. a, b
Pauloo, R. A., Escriva-Bou, A., Dahlke, H., Fencl, A., Guillon, H., and Fogg, G. E.: Domestic well vulnerability to drought duration and unsustainable groundwater management in California's Central Valley, Environ. Res. Lett., 15, https://doi.org/10.1088/1748-9326/ab6f10, 2020. a
Piao, S., Wang, X., Wang, K., Li, X., Bastos, A., Canadell, J. G., Ciais, P., Friedlingstein, P., and Sitch, S.: Interannual variation of terrestrial carbon cycle: Issues and perspectives, Glob. Change Biol., 26, 300–318, https://doi.org/10.1111/gcb.14884, 2020. a, b
Plazzotta, M., Séférian, R., Douville, H., Kravitz, B., and Tjiputra, J.: Land Surface Cooling Induced by Sulfate Geoengineering Constrained by Major Volcanic Eruptions, Geophys. Res. Lett., 45, 5663–5671, https://doi.org/10.1029/2018GL077583, 2018. a
Plazzotta, M., Séférian, R., and Douville, H.: Impact of Solar Radiation Modification on Allowable CO2 Emissions: What Can We Learn From Multimodel Simulations?, Earth's Future, 7, 664–676, https://doi.org/10.1029/2019EF001165, 2019. a
Pope, F. D., Braesicke, P., Grainger, R. G., Kalberer, M., Watson, I. M., Davidson, P. J., and Cox, R. A.: Stratospheric aerosol particles and solar-radiation management, Nat. Clim. Change, 2, 713–719, https://doi.org/10.1038/nclimate1528, 2012. a, b
Ritchie, P. D. L., Clarke, J. J., Cox, P. M., and Huntingford, C.: Overshooting tipping point thresholds in a changing climate, Nature, 592, 517–523, https://doi.org/10.1038/s41586-021-03263-2, 2021. a
Robock, A.: Benefits and Risks of Stratospheric Solar Radiation Management for Climate Intervention (Geoengineering), http://climate.envsci.rutgers.edu/pdf/RobockBridge.pdf (last access: 26 September 2025), 2020. a, b
Robock, A., Marquardt, A., Kravitz, B., and Stenchikov, G.: Benefits, risks, and costs of stratospheric geoengineering, Geophys. Res. Lett., 36, https://doi.org/10.1029/2009GL039209, 2009. a
Seferian, R.: CNRM-CERFACS CNRM-ESM2-1 model output prepared for CMIP6 GeoMIP G6sulfur, Earth System Grid Federation [data set], https://doi.org/10.22033/ESGF/CMIP6.3907, 2019. a
Séférian, R., Nabat, P., Michou, M., Saint-Martin, D., Voldoire, A., Colin, J., Decharme, B., Delire, C., Berthet, S., Chevallier, M., Sénési, S., Franchisteguy, L., Vial, J., Mallet, M., Joetzjer, E., Geoffroy, O., Guérémy, J.-F., Moine, M.-P., Msadek, R., Ribes, A., Rocher, M., Roehrig, R., Salas-y Mélia, D., Sanchez, E., Terray, L., Valcke, S., Waldman, R., Aumont, O., Bopp, L., Deshayes, J., Éthé, C., and Madec, G.: Evaluation of CNRM Earth System Model, CNRM-ESM2-1: Role of Earth System Processes in Present-Day and Future Climate, J. Adv. Model. Earth Sy., 11, 4182–4227, https://doi.org/10.1029/2019MS001791, 2019. a, b
Sellar, A. A., Jones, C. G., Mulcahy, J. P., Tang, Y., Yool, A., Wiltshire, A., O'Connor, F. M., Stringer, M., Hill, R., Palmieri, J., Woodward, S., de Mora, L., Kuhlbrodt, T., Rumbold, S. T., Kelley, D. I., Ellis, R., Johnson, C. E., Walton, J., Abraham, N. L., Andrews, M. B., Andrews, T., Archibald, A. T., Berthou, S., Burke, E., Blockley, E., Carslaw, K., Dalvi, M., Edwards, J., Folberth, G. A., Gedney, N., Griffiths, P. T., Harper, A. B., Hendry, M. A., Hewitt, A. J., Johnson, B., Jones, A., Jones, C. D., Keeble, J., Liddicoat, S., Morgenstern, O., Parker, R. J., Predoi, V., Robertson, E., Siahaan, A., Smith, R. S., Swaminathan, R., Woodhouse, M. T., Zeng, G., and Zerroukat, M.: UKESM1: Description and Evaluation of the U.K. Earth System Model, J. Adv. Model. Earth Sy., 11, 4513–4558, https://doi.org/10.1029/2019MS001739, 2019. a, b
Terrer, C., Vicca, S., Stocker, B. D., Hungate, B. A., Phillips, R. P., Reich, P. B., Finzi, A. C., and Prentice, I. C.: Ecosystem responses to elevated CO2 governed by plant–soil interactions and the cost of nitrogen acquisition, New Phytologist, 217, 507–522, https://doi.org/10.1111/nph.14872, 2018. a, b, c
Tilmes, S., Mills, M. J., Niemeier, U., Schmidt, H., Robock, A., Kravitz, B., Lamarque, J.-F., Pitari, G., and English, J. M.: A new Geoengineering Model Intercomparison Project (GeoMIP) experiment designed for climate and chemistry models, Geosci. Model Dev., 8, 43–49, https://doi.org/10.5194/gmd-8-43-2015, 2015. a, b
Tilmes, S., Visioni, D., Jones, A., Haywood, J., Séférian, R., Nabat, P., Boucher, O., Bednarz, E. M., and Niemeier, U.: Stratospheric ozone response to sulfate aerosol and solar dimming climate interventions based on the G6 Geoengineering Model Intercomparison Project (GeoMIP) simulations, Atmos. Chem. Phys., 22, 4557–4579, https://doi.org/10.5194/acp-22-4557-2022, 2022. a
Tjiputra, J. F., Assmann, K., Bentsen, M., Bethke, I., Otterå, O. H., Sturm, C., and Heinze, C.: Bergen Earth system model (BCM-C): model description and regional climate-carbon cycle feedbacks assessment, Geosci. Model Dev., 3, 123–141, https://doi.org/10.5194/gmd-3-123-2010, 2010. a
Tjiputra, J. F., Grini, A., and Lee, H.: Impact of idealized future stratospheric aerosol injection on the large-scale ocean and land carbon cycles, J. Geophys. Res.-Biogeo., 121, 2–27, https://doi.org/10.1002/2015JG003045, 2016. a, b, c
Trisos, C. H., Amatulli, G., Gurevitch, J., Robock, A., Xia, L., and Zambri, B.: Potentially dangerous consequences for biodiversity of solar geoengineering implementation and termination, Nature Ecology and Evolution, 2, 475–482, https://doi.org/10.1038/s41559-017-0431-0, 2018. a, b, c
Van Loon, A. F., Kchouk, S., Matanó, A., Tootoonchi, F., Alvarez-Garreton, C., Hassaballah, K. E. A., Wu, M., Wens, M. L. K., Shyrokaya, A., Ridolfi, E., Biella, R., Nagavciuc, V., Barendrecht, M. H., Bastos, A., Cavalcante, L., de Vries, F. T., Garcia, M., Mård, J., Streefkerk, I. N., Teutschbein, C., Tootoonchi, R., Weesie, R., Aich, V., Boisier, J. P., Di Baldassarre, G., Du, Y., Galleguillos, M., Garreaud, R., Ionita, M., Khatami, S., Koehler, J. K. L., Luce, C. H., Maskey, S., Mendoza, H. D., Mwangi, M. N., Pechlivanidis, I. G., Ribeiro Neto, G. G., Roy, T., Stefanski, R., Trambauer, P., Koebele, E. A., Vico, G., and Werner, M.: Review article: Drought as a continuum – memory effects in interlinked hydrological, ecological, and social systems, Nat. Hazards Earth Syst. Sci., 24, 3173–3205, https://doi.org/10.5194/nhess-24-3173-2024, 2024. a
Visioni, D., MacMartin, D. G., Kravitz, B., Boucher, O., Jones, A., Lurton, T., Martine, M., Mills, M. J., Nabat, P., Niemeier, U., Séférian, R., and Tilmes, S.: Identifying the sources of uncertainty in climate model simulations of solar radiation modification with the G6sulfur and G6solar Geoengineering Model Intercomparison Project (GeoMIP) simulations, Atmos. Chem. Phys., 21, 10039–10063, https://doi.org/10.5194/acp-21-10039-2021, 2021. a, b, c, d
Wells, A. F., Henry, M., Bednarz, E. M., MacMartin, D. G., Jones, A., Dalvi, M., and Haywood, J. M.: Identifying climate impacts from different Stratospheric Aerosol Injection strategies in UKESM1, Earth's Future, 12, e2023EF004358, https://doi.org/10.1029/2023EF004358, 2024. a, b, c
Wieners, C. E., Hofbauer, B. P., Vries, I. E. D., Honegger, M., Visioni, D., Russchenberg, H., and Felgenhauer, T.: Solar Radiation Modification is risky, but so is rejecting it: A call for balanced research, Oxford Open Climate Change, 3, 1–4, https://doi.org/10.1093/oxfclm/kgad002, 2023. a
Witze, A.: EARTH BOILED IN 2023 – WILL IT HAPPEN AGAIN IN 2024?, Nature, 625, 637–639, https://doi.org/10.1038/d41586-024-00074-z, 2024. a
World Meteorological Organization (WMO): WMO confirms 2024 as warmest year on record at about 1.55 °C above pre-industrial level, https://public.wmo.int/media/news/wmo-confirms-2024-warmest-year-record-about-155degc-above-pre-industrial-level (last access: 10 February 2026), 2025. a
Xia, L., Robock, A., Tilmes, S., and Neely III, R. R.: Stratospheric sulfate geoengineering could enhance the terrestrial photosynthesis rate, Atmos. Chem. Phys., 16, 1479–1489, https://doi.org/10.5194/acp-16-1479-2016, 2016. a, b
Yang, C. E., Hoffman, F. M., Ricciuto, D. M., Tilmes, S., Xia, L., MacMartin, D. G., Kravitz, B., Richter, J. H., Mills, M., and Fu, J. S.: Assessing terrestrial biogeochemical feedbacks in a strategically geoengineered climate, Environ. Res. Lett., 15, https://doi.org/10.1088/1748-9326/abacf7, 2020. a, b, c
Yin, X.: Responses of leaf nitrogen concentration and specific leaf area to atmospheric CO2 enrichment: A retrospective synthesis across 62 species, Glob. Change Biol., 8, 631–642, https://doi.org/10.1046/j.1365-2486.2002.00497.x, 2002. a
Zhao, M. and Cao, L.: Regional Response of Land Hydrology and Carbon Uptake to Different Amounts of Solar Radiation Modification, Earth's Future, 10, https://doi.org/10.1029/2022EF003288, 2022. a, b, c