
the Creative Commons Attribution 4.0 License.
the Creative Commons Attribution 4.0 License.
 | 03 Nov 2026
Global-scale meteorological-to-groundwater drought propagation and the drivers and patterns of multi-year groundwater drought

Sandra Hauswirth
Denise Ruijsch
Barry van Jaarsveld
Jonna van Mourik
Niko Wanders
Groundwater stores a third of all global freshwater and supports water supply, irrigation and ecosystems across the world. As such, groundwater drought can have wide-reaching financial, social and environmental impacts, particularly when drought events are prolonged or multi-year. Although recent work has made significant progress in understanding the drivers and patterns of multi-year meteorological droughts, we do not know how this signal translates into multi-year groundwater drought, where subsurface processes, anthropogenic influences and abstractions can alter the meteorological signal. This is particularly true at the global-scale, where a major barrier to understanding large-scale groundwater drought dynamics is the difficulty of obtaining consistent and comprehensive groundwater data. In this research, we use a new global hyper-resolution (∼1 km) groundwater dataset to investigate the global patterns and drivers of groundwater drought from 1960–2019, with a specific focus on multi-year events. We start by characterizing the propagation of meteorological (represented by SPEI-12) to groundwater drought, evaluating how and to what extent the sub-surface plays a role in modulating the meteorological drought signal. Subsequently, we define three global groundwater response types that provide a framework for understanding the processes and geo-physical drivers of normal versus multi-year groundwater droughts. We find that 35 % of global groundwater grid cells have an average groundwater drought duration which is multi-year. In 83 % of these locations, the subsurface extends the meteorological drought signal, whereas in the remaining 17 %, groundwater drought duration appears to be primarily driven by meteorological anomalies. Our analysis offers new insights into global-scale drought exposure by identifying regions which have been most vulnerable to multi-year groundwater drought in the past, as well as those which might be more vulnerable in the future. Importantly, our typology also highlights areas where multi-year groundwater droughts can be anticipated based on meteorological drought anomalies and can therefore inform strategies for managing and mitigating future water scarcity risks.
- Article
(6448 KB) - Full-text XML
-
Supplement
(12616 KB) - BibTeX
- EndNote


Groundwater stores a third of all global freshwater and supports water supply, irrigation and ecosystems across the world (United Nations University – Institute for Environment and Human Security (UNU-EHS) et al., 2023). It is estimated that 2 billion people rely on groundwater as their primary source of water and that groundwater-dependent ecosystems cover millions of square kilometres (Rohde et al., 2024). As such below normal levels of groundwater can have wide-reaching financial, societal and environmental impacts (Huggins et al., 2023; Saccò et al., 2024).
Below normal levels of groundwater may result from unsustainable groundwater extraction or may indicate the occurrence of a groundwater drought (Leijnse et al., 2024; Wada et al., 2013; Taylor et al., 2013; Ashraf et al., 2021; Scanlon et al., 2023). Groundwater drought arises primarily from a decrease in groundwater recharge, which is typically attributed to deficits in precipitation or increased evaporative demand (Han et al., 2019), but can be exacerbated by human pressures such as groundwater abstractions. A groundwater drought is preceded by a meteorological drought, which propagates via the unsaturated zone to the groundwater (or saturated zone) at varying rates depending on the local geo-physical properties, antecedent conditions and the characteristics of the meteorological drought (Han et al., 2019; Liu et al., 2023; Hellwig et al., 2022; Van Lanen et al., 2013). The severity of the groundwater drought impacts will depend on a number of factors, one of which is the drought duration (Athukoralalage et al., 2024; Pauloo et al., 2020). Since groundwater is usually the most resilient component of the hydrological cycle, it is crucial for supporting river flow in dry conditions and is often used as a buffer to mitigate the impacts of meteorological drought e.g. by maintaining irrigation or supporting water supply (Jasechko et al., 2024; Liu et al., 2022; Apurv and Cai, 2020). Consequently, the impacts of prolonged groundwater drought can be particularly severe, threatening water and food supplies, as well as socio-economic security (Castle et al., 2014; Taylor et al., 2013; Schreiner-McGraw and Ajami, 2021; Bierkens and Wada, 2019).
In recent decades, some of the most impactful drought events have spanned multiple years, for example the Millennium Drought in Australia or South Africa's “Day Zero” drought (Van Dijk et al., 2013; Sousa et al., 2018; Cai et al., 2014). Unlike prior droughts which were too short for significant groundwater decline, the prolonged nature of Australia's Millennium Drought severely depleted groundwater stores which led to wide-spread financial and environmental problems (Fowler et al., 2022; Xie et al., 2016; Heberger, 2012). The groundwater drought intensified the decline in streamflow across some of Australia's most important river basins, such as the Murray-Darling Basin, where groundwater dependent baseflow contributes 48 % of streamflow (Van Dijk et al., 2013; Leblanc et al., 2012). Here, groundwater depletion was particularly problematic, since the catchment supports half of Australia's total water extraction (84 % of extracted water is used for agriculture, 13 % for the water supply industry and 2 % for household use). To make matters worse, observations from the Murray-Darling Basin revealed that almost a decade after the Millennium drought event, 70 % of groundwater wells had still not fully recovered or had continued to decline (Chen et al., 2024; Le Brocque et al., 2018). Past events have taught us that the impacts of multi-year groundwater droughts can be much harder to mitigate than shorter drought events, and consequently, understanding what drives a multi-year groundwater drought event is essential for planning and preparedness.
In the future, we expect climate change to increase the frequency, duration, and magnitude of groundwater drought (Pascale et al., 2020; Rakovec et al., 2022; Mishra et al., 2024). Not only will changes in weather patterns exacerbate drought from a meteorological perspective (Cook et al., 2020; Pokhrel et al., 2021), but at the same time, the overall vulnerability to groundwater drought will be enhanced by increasing groundwater abstractions (Cárdenas Belleza et al., 2023; Leijnse et al., 2024). It is estimated that 71 % of global groundwater aquifers are already declining, with approximately 30 % demonstrating an acceleration in decline over recent decades. This trend is only projected to intensify under continued climate change and the resultant increases in human water demands (e.g. demands from irrigation, population growth, drinking water etc.) (Jasechko et al., 2024; Wunsch et al., 2022; Nazari et al., 2025; Bierkens and Wada, 2019). Future groundwater droughts are likely to be more frequent, but might also last longer, leading to an increase in multi-year droughts (Wunsch et al., 2022).
Although recent work has made significant progress in understanding the drivers and patterns of multi-year meteorological droughts (Van Mourik et al., 2025; Van Der Wiel et al., 2023; Pascale and Ragone, 2025), we do not know how this signal translates into multi-year groundwater droughts, where subsurface processes and anthropogenic pumping or abstractions can alter the meteorological signal (Chen et al., 2024; Schreiner-McGraw and Ajami, 2021). This is particularly true at the global-scale, where a major barrier to understanding large-scale groundwater drought dynamics is the difficulty of obtaining consistent and comprehensive groundwater data. Observational data are often sparse or incomplete, and although initiatives like the International Groundwater Resources Assessment Center (IGRAC) (IGRAC, 2024), the global-scale integrated GROundWater package (GROW) (Bäthge et al., 2026), or the European Groundwater Drought Initiative (Brauns et al., 2020) collate groundwater timeseries on continental to global scales, they are still limited in their spatial coverage and representativeness (Condon et al., 2021). Comparatively, whilst satellite datasets such as GRACE have made large-scale groundwater analysis possible (Rodell et al., 2018; Richey et al., 2015; Famiglietti et al., 2011), this data is limited in its temporal coverage and remains at coarse spatial resolutions, meaning that it cannot resolve patterns and trends on smaller, more regional or local scales. Furthermore, when analysis focuses on multi-year drought, there are fewer events in the observational records, mandating long-term temporal and spatial coverage. In the absence of observational data, groundwater models can provide valuable insights. These models can simulate groundwater levels over large spatial domains at high temporal resolutions. Historically, groundwater models have had to balance spatial resolution with spatial coverage and therefore operate at scales too coarse for actionable use (Condon et al., 2021; van Jaarsveld et al., 2026). However, recent advances in computational power have shown us that hyper-resolution groundwater modelling is now possible at the global scale (Verkaik et al., 2024; Ebeling et al., 2025).
In this paper, we use a new global hyper-resolution (∼ 1 km) groundwater dataset (van Jaarsveld et al., 2026) produced by the global groundwater model GLOBGM to investigate the global patterns and drivers of groundwater drought from 1960–2019, with a specific focus on multi-year drought events. We start by exploring the propagation from meteorological to groundwater drought, evaluating how and to what extent the subsurface plays a role in modulating the meteorological drought signal. Subsequently, we define three global groundwater response types based on the relationship between meteorological and groundwater drought, providing a new framework for understanding the processes and geo-physical drivers of normal versus multi-year groundwater drought events within each type. By disentangling this relationship at the global scale, our study is the first of its kind to focus specifically on multi-year groundwater drought at the global scale. Our analysis identifies regions that are most prone to multi-year groundwater drought under present-day conditions, and uses this knowledge to infer which areas may be more vulnerable in the future. By using a global hyper-resolution groundwater dataset, our results uniquely capture the finer-scale interactions between river systems and groundwater whilst also resolving the spatial variability in global groundwater depth. This added detail allows us to generate new insights into the spatial patterns of global drought propagation at actionable resolution, which will help inform strategies for managing, mitigating, and predicting future water scarcity risks.
2.1 GLOBGM modelled groundwater data
The groundwater dataset used in this paper was produced by GLOBGM v1.1, a two-layer transient MODFLOW-based groundwater model which represents confined, confining and unconfined aquifers (Verkaik et al., 2024; van Jaarsveld et al., 2026). The model simulates monthly groundwater heads and water table depths at ∼1 km spatial resolution for the time period 1960–2019. The model distributes independent unstructured grids over three continental-scale groundwater models (Afro-Eurasia, America, Australia) and one representing the remaining islands. GLOBGM employs an offline coupling approach whereby local runoff, groundwater abstraction and groundwater recharge outputs at the 5 arcmin resolution (∼10 km at the equator) are derived from the PCR-GLOBWB2 global hydrological model (Sutanudjaja et al., 2018). These inputs are then used as boundary conditions and forcing to simulate groundwater dynamics.
The groundwater abstractions in GLOBGM are based on data from PCR-GLOBWB2 (Sutanudjaja et al., 2018). In PCR-GLOBWB2, the water withdrawal is equal to the gross water demand, which made up of both irrigation and non-irrigation sources. The demand from irrigation is based on the crop composition and the irrigated area and is derived from MIRCA2000 (Portmann et al., 2010) and the Global Crop Water Model (Siebert and Döll, 2010). The non-irrigation demand covers three sectors (industry, households and livestock). For more information on the calculation of this demand we refer to Wada and Bierkens (2014). In PCR-GLOBWB2, water demand can be fulfilled from three sources: surface water, groundwater and desalinated water. The fraction of water which is abstracted from groundwater and surface water is calculated based on their relative abundance, where the abundance is calculated based on a 2-year running mean of recharge and discharge. Based on this, PCR-GLOBWB2 calculates how much water is abstracted from each source each month. The total groundwater abstraction is then given as an input to GLOBGM. Groundwater abstractions are highest in many of the recognized water scarcity hot-spots, with the largest average abstractions across the Indo-Gangetic Plain, northern China and western and central United States (see Fig. S8 in the Supplement). Declining water table depth trends in the GLOBGM simulations align well with known regions of excessive irrigation, groundwater abstraction and depletion e.g. the United States, the Arabian Peninsula and the Indo-Gangetic plain (van Jaarsveld et al., 2026). For more information on the groundwater abstraction data we refer users to Sutanudjaja et al. (2018).
The validation of global groundwater models is notoriously difficult due to mismatches in spatial resolution and representation between observed groundwater data and model simulations of groundwater. Nonetheless, the outputs from GLOBGM have been validated in previous work (Verkaik et al., 2024; van Jaarsveld et al., 2026). van Jaarsveld et al. (2026) found that the GLOBGM non-parametric KGE skill score was more than 0 (suggesting that the model outperforms the mean flow benchmark) in 75 % of the simulated area. This proportion increased to 81 % after excluding locations where poor skill scores were attributed to metric artifacts associated with weak groundwater trends and very shallow water tables. The model performance is best where water table depths are shallow (0–20 m), but there is also a tendency for it to underestimate groundwater heads between 0–5 m. Contrastingly, groundwater heads were found to be overestimated at deeper water table depths, perhaps due to delays that occur in deeper unsaturated zones which the model does not accurately account for. Notably though, the ability of the model to reproduce groundwater variability does not appear to be linked to water table depth. GLOBGM has also been evaluated against other, similar, groundwater models. Compared to alternative 5 arcmin dynamic model simulations (e.g. de Graaf et al. 2017), GLOBGM displays a 19 % increase in the number of locations which have a non-parametric KGE skill score more than 0. For more information on the model evaluation we refer to van Jaarsveld et al. (2026).
Since this study focuses on drought, and the prior validation efforts have not considered this aspect of model performance, an extra validation was carried out to assess how effectively GLOBGM simulates patterns of groundwater drought against two sources of observed groundwater data which are introduced below.
Observed groundwater data
To validate the simulations produced by GLOBGM from a drought perspective we use two observational datasets. Initially, we use the observed data to validate the GLOBGM outputs by calculating the anomaly correlation and comparing the duration and timing of observed drought events to those simulated by the model. The anomaly correlation measures the drought synchronisation, whilst calculating the average drought duration assesses the simulation of key drought characteristics. These metrics are introduced in more detail below (see Sect. 2.3).
The first observational dataset is obtained from remotely sensed groundwater estimates from NASA's Gravity Recovery and Climate Experiment (GRACE) and GRACE Follow-On (GRACE-FO) missions. Specifically, we use the GRACE(-FO) mascon gridded data with a JPL solution (release 06.1 v3) (GRACE-FO, 2024; Watkins et al., 2015). These observations represent gridded, monthly, global, terrestrial water storage anomalies (relative to a time-mean) and the data is available from April 2002 to 2023. For our validation, we used the period April 2002 to December 2019 to coincide with the simulated groundwater data. Gaps smaller than 6 months are filled by linearly interpolating across the existing observational data.
The second observational dataset uses observations from the IGRAC database (IGRAC, 2024). We subset the database to ensure that points are only included where there are more than 10 years of continuous data between 1960 and 2019, this leaves 16 639 locations. The majority of the locations are distributed across North America, Europe and Australia (96.5 % of data points are located in these regions) and the average water table depth is 17.9 m.
2.2 Drought definitions
Throughout this study we refer to two types of drought: Normal Droughts (ND) and Multi-Year Droughts (MYD). A MYD event is defined as any event that lasts for at least 12 consecutive months (Van Der Wiel et al., 2023; Van Mourik et al., 2025; Ruijsch et al., 2025). Comparatively, a ND is defined as any event which lasts for less than 12 months. The onset and termination of a drought event is defined using run-theory, where a drought is defined as a continuous period below a threshold.
2.2.1 Groundwater drought
Groundwater drought thresholds are calculated based on the monthly standardized anomaly, where a drought is initiated when the water table depth (or water storage) falls more than one standard deviation below the long-term monthly mean. By definition, this assumes that (when the data is normally distributed) there will be a drought in 16 % of the record.
Monthly standardized anomaly, Z(t), is calculated as:
where X(t) represents the water table depth at a given timestep, μm and σm are the long-term mean and standard deviation for month m, respectively. Z(t) is the resulting monthly standardized anomaly used to identify drought conditions. A drought is initiated when this value is less than −1. This approach is comparable to the quantification of droughts using normalized meteorological drought indicators (e.g. SPI and SPEI). We acknowledge that by using the monthly standardized anomaly we assume that the groundwater data follows a normal distribution, and whilst this is not true everywhere, we found that this distribution fit better than the alternatives (log-normal, gaussian). Our approach makes similar assumptions to those who use the same dataset (Hauswirth et al., 2026). The results of this study are conditional on the drought definition methodology and we acknowledge that were we to use alternative thresholds or definitions we would see different results. See Sects. S6 and S10 in the Supplement for more detail.
2.2.2 Recharge drought
To understand whether multi-year groundwater droughts are a result of processes in the saturated zone (groundwater) or driven by the unsaturated (recharge) zone, we also calculate the average recharge drought duration globally. Groundwater recharge is generated by PCR-GLOBWB2 and is used as an input to the groundwater model (GLOBGM). Unlike the groundwater data (which is at ∼1 km resolution), recharge data is only available at 5 arcmin (∼10 km at the equator). To identify drought events, we calculate the monthly standardized anomaly from the recharge timeseries using the same formula as in Eq. (1) and use the same threshold approach where a drought is initiated when the monthly standardized anomaly falls below −1 (more than one standard deviation below the mean).
2.2.3 Meteorological drought
To define a meteorological drought we use the 12-month averaged Standardized Precipitation-Evapotranspiration Index (SPEI-12) which consists of the standardized difference between precipitation and potential evapotranspiration (Vicente-Serrano et al., 2010). By choosing a 12-month accumulation period, we inherently account for the accumulated precipitation and evapotranspiration over the preceding 12 months, which provides a stronger connection between the meteorological drought and the potential groundwater response. This is done because often groundwater droughts are the composite of multiple shorter meteorological droughts (Van Lanen et al., 2013). We use the same threshold approach as for groundwater and recharge, assuming that when SPEI-12 falls below −1, a meteorological drought begins. Each meteorological drought can be considered a function of the combined effects of the meteorological anomalies of the last year. Each meteorological drought can be considered a function of the combined effects of the meteorological anomalies of the last year. This is not the case for a groundwater drought, which by definition integrates the meteorological anomalies. However the groundwater drought in each month is defined only based on the current month assuming that the current groundwater state is already an accumulation of the anomalies in the incoming groundwater recharge over the last 12 months.
We chose this measure since it encompasses a wide range of meteorological data and does not rely solely on precipitation and thus is closer related to the groundwater recharge. SPEI-12 has been calculated from the W5E5 reanalysis data (Büchner and Reyer, 2022) and the python package xclim (Bourgault et al., 2023). SPEI-12 is calculated at the 0.5° spatial resolution, and the temporal resolution has been coarsened from a daily to monthly timestep to match the GLOBGM monthly outputs. While the meteorological forcing comes at roughly 50 km spatial resolution, the heterogeneity in groundwater response time mostly comes from the sub-surface geophysical properties of the groundwater system.
2.3 Quantifying the propagation of meteorological to groundwater drought
To understand the global vulnerability to groundwater droughts, we first aim to understand the role of the subsurface properties in the propagation of meteorological drought into groundwater drought. The following section introduces the metrics used in this manuscript to characterize the relationship between meteorological and groundwater drought. These metrics are also used to evaluate the model against observed groundwater data.
2.3.1 Drought Duration Ratio (DDR)
To quantify differences in the average length of groundwater and meteorological droughts, we calculate the Drought Duration Ratio (DDR). This metric characterizes the responsiveness of the groundwater system to the meteorology with the following equation:
The mean groundwater drought duration and mean meteorological drought duration are calculated globally in each grid cell using a database of drought events which were calculated using the methods introduced in Sect. 2.2.1 and 2.2.3. Droughts which have already begun at the start of the simulation period or that have not ended on the final timestep are excluded from the calculation of the average drought duration. The DDR can vary between 0 and ∞ where values <1 represent areas with on average longer meteorological droughts than groundwater droughts, values >1 represent places where the average groundwater drought is longer than the average meteorological drought and a value of 1 means the average length of a meteorological drought is equal to the average length of a groundwater drought.
To check whether the average drought duration could be skewed towards long or short drought events, we also calculate the ND MYD ratio which compares the number of total months spent in ND versus MYD.
2.3.2 Groundwater response types
Based on the DDR concept, we define three groundwater response types that describe the relationship between meteorological and groundwater drought duration. To account for uncertainty in the distribution and number of simulated meteorological and groundwater drought events, and to establish whether the length of an average groundwater drought is significantly different from the length of an average meteorological drought, the typology is not based on the raw DDR alone. Instead, for each grid cell with more than one groundwater and meteorological drought event, we first calculate uncertainty bounds for the mean groundwater and meteorological drought duration. These bounds are defined for groundwater (GW) and meteorological (meteo) droughts as:
where (μmin) represents the mean drought duration excluding the longest drought event and (μmax) represents the mean drought duration excluding the shortest drought event. We then use these upper and lower bounds to identify the limits of the DDR and classify grid cells as:
Where a location only has one groundwater or meteorological drought event, we cannot compute the uncertainty bounds and thus directly compare the raw means.
The three response types represent locations where (1) groundwater drought events are on average longer than meteorological drought events (meteo < GW), (2) the average length of a groundwater drought cannot be distinguished from the average length of a meteorological drought (meteo = GW) and (3) groundwater drought events are on average shorter than meteorological drought events (meteo > GW). For each type, we then separate the data based on whether the average groundwater drought event is multi-year or normal across the simulation period (Fig. 1). For those locations in the meteo < GW type where groundwater droughts are multi-year, we also look at the average length of a recharge drought to establish whether the multi-year drought is driven by the unsaturated zone or is a result of processes in the saturated zone modulating the incoming recharge drought signal. Our assumption is that if a recharge drought is also multi-year, then it is processes in the unsaturated zone that drive the modulation from meteorological ND to groundwater MYD, rather than the local groundwater properties. However, it is also possible that the recharge signal is further amplified by the saturated zone to extend the MYD further.
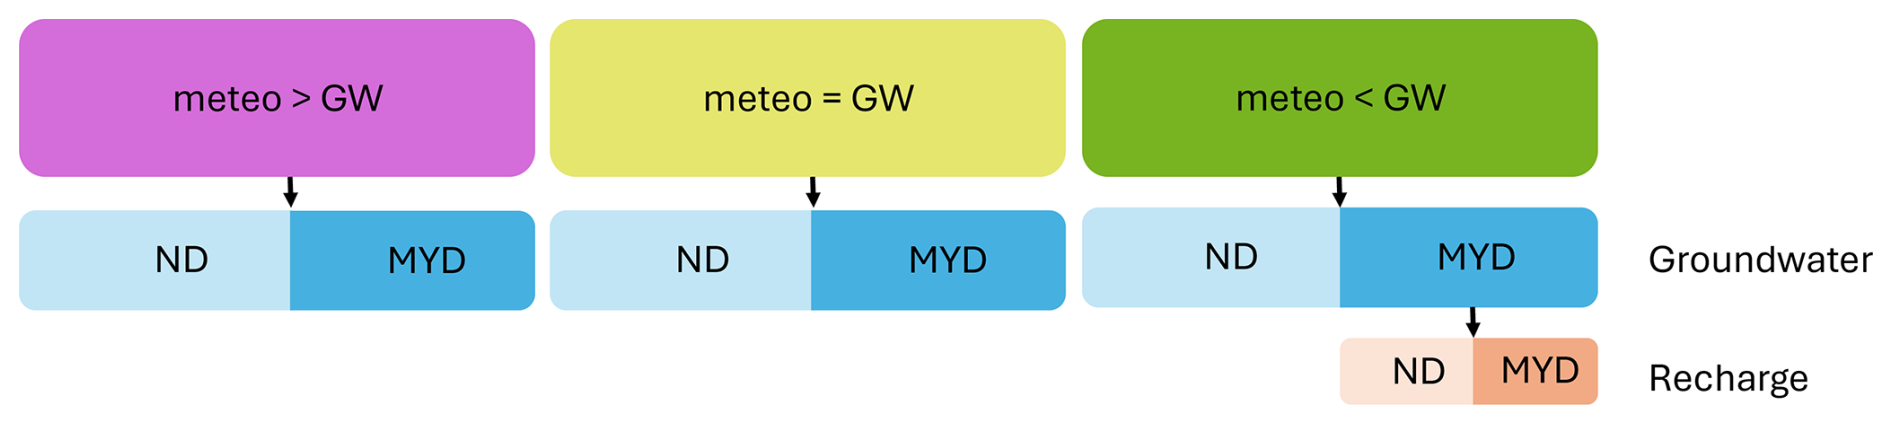
Figure 1Schematic introducing the global groundwater response types (top row) and the subsequent division of data into multi-year and normal droughts in groundwater (second row) and recharge (bottom row).
2.3.3 Anomaly Correlation (drought synchronicity)
To explore the synchronicity of meteorological and groundwater drought, we calculate the anomaly correlation between the simulated timeseries of standardized monthly groundwater table depth and SPEI-12. As part of our model evaluation, we also calculate the anomaly correlation between the simulated timeseries of standardized monthly groundwater table depth and timeseries of monthly standardized observed groundwater data. Since seasonality has been removed from these data, the anomaly correlation reflects how well the temporal variability in anomalous conditions aligns between two datasets and thus how directly the anomalies in the meteorological signal are translated to the groundwater anomalies.
To assess whether there is a lag between the meteorology and the groundwater, we also calculate the anomaly correlation between SPEI-12 and several lagged iterations of the simulated standardized monthly groundwater table depth. To identify the dominant lag, we shift the groundwater timeseries back by 1–12 months and find the dataset with the highest anomaly correlation at a given lag. For a lag to be considered dominant it must have an anomaly correlation of at least 0.073 (threshold calculated using the standard t-test for Pearson correlation) which confirms that the correlation is statistically significant at the 5 % level. It must also be at least 0.03 higher than the anomaly correlation associated with the timeseries without shifts (lag 0). Conceptually, the lag represents a delay in the groundwater response, usually related to subsurface properties and processes.
2.3.4 SPEI-12 discriminatory ability
To complement the anomaly correlation, we also calculate the ROC AUC score (Receiver Operating Characteristic Area Under the Curve), which quantifies the extent to which the SPEI-12 metric can predict groundwater drought events. The ROC AUC score can vary between 0 and 1 where a value of 1 implies that SPEI-12 can perfectly discriminate groundwater droughts from non-drought conditions simulated by GLOBGM. A ROC AUC score of 0.5 or less implies that the model does no better than random chance. The ROC AUC score was computed using the non-parametric definition implemented in scikit-learn. Formally, the ROC AUC can be expressed as:
where Npos and Nneg are the number of drought and non-drought months in the groundwater timeseries; si and sj are the SPEI values at time steps classified as groundwater drought (yi=1, where the standardized groundwater anomaly is below the drought threshold) and non-drought (yj=0) months, respectively; and 1 is the indicator function.
We first validate the GLOBGM outputs against observed data to assess their ability to simulate groundwater droughts. We then distribute the global data into three groundwater response types based on the relationship between average groundwater and meteorological drought duration. Next, we disentangle the processes that contribute to each response type and examine the characteristics associated with locations within each type.
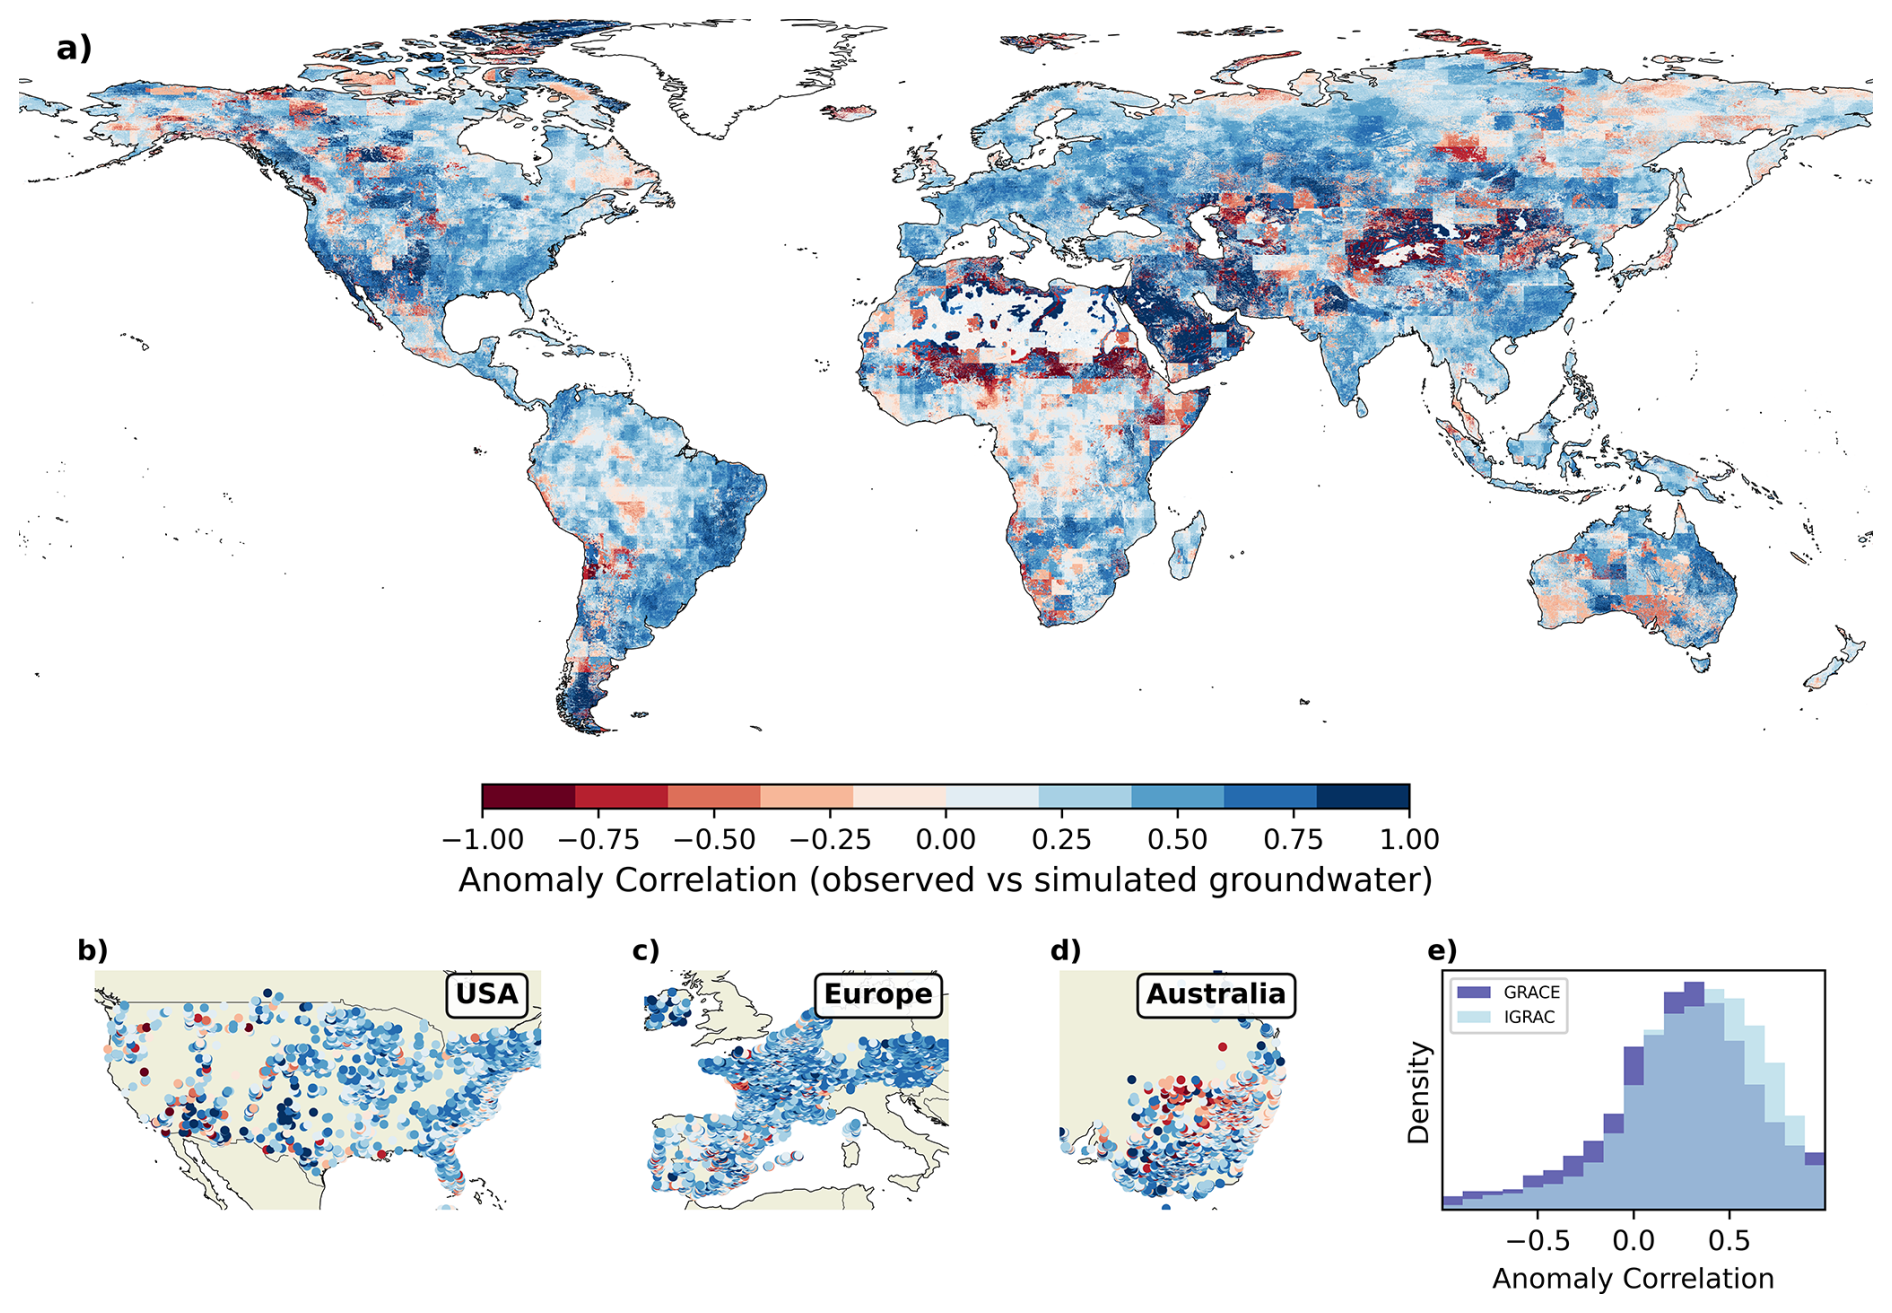
Figure 2Anomaly correlation between (a) observed Gravity Recovery and Climate Experiment (GRACE) data and simulated groundwater data and (b, c, d) point observations from the International Groundwater Resources Assessment Center (IGRAC) database and simulated groundwater data. 90 % of all point observations in the IGRAC database (with sufficient data) are displayed in panels (b), (c), and (d). (e) compares the distribution of anomaly correlation coefficients computed with GRACE and IGRAC datasets.
3.1 Drought based groundwater model validation
Figure 2 plots the anomaly correlation between the observed and simulated groundwater data. The mean anomaly correlation between observed GRACE and simulated groundwater data (Fig. 2a) is 0.23 (median 0.27), whilst the mean anomaly correlation between the point IGRAC observed data and simulated groundwater data (Fig. 2b, c, d) is 0.32 (median 0.35). The distribution of anomaly correlation coefficients is similar across the two observational datasets (Fig. 2e). Positive correlations dominate across most of the world, with consistently strong correlations observed across Europe and southern USA. The correlation is weakest south of the Sahara desert and strongest in the Arabian desert, both areas which are relatively dry. The model performs slightly better than average in the regions with abstractions in the 95th percentile. In these areas the mean anomaly correlation with the GRACE data is 0.36 (compared to the global average of 0.23) and the median is 0.39 (compared to the global average of 0.27).
In several of the areas where the anomaly correlations are lower, we find nuances in the GRACE data which can begin to explain these patterns. Since GRACE is a measurement of total water storage, in tropical regions such as the Amazon or central Africa, the GRACE signal can be dominated by changes in surface water and root zone soil moisture rather than changes in groundwater storage. In more arid regions, the lower anomaly correlations can be partially explained by the time it takes for surface water to reach the groundwater system, meaning that low correlations are not unexpected (Akl et al., 2025; Hohensinn et al., 2026). Previous studies using the IGRAC groundwater point observations have also found challenges when using this data for model evaluation. van Jaarsveld et al. (2026) identified that in many of the slow moving systems (e.g. the Sahel, Namibia), the observed and simulated data can show opposing trends, but note that in many of these cases the magnitude of change is very small. As a result in many locations the correlation can over exaggerate the differences in groundwater levels. Finally, we are also aware of flaws in the model input data, for example in sub-Saharan Africa where the forcing data is not always representative (Liu et al., 2023). Nonetheless, there are several regions where it is likely that the model does not have a strong anomaly correlation, and in these places the results should be interpreted with caution.
The groundwater model simulates drought events of a similar average duration to those recorded in the observational record (see Fig. S1 in the Supplement). The mean drought duration across the IGRAC observational data is 5.4 months and the median drought duration is 3.4 months. At the same locations, the simulated groundwater data has drought events with a mean duration of 6.4 months and a median duration of 2.9 months suggesting that the model records a greater number of long groundwater droughts at these locations which are not seen in the observational record. When comparing the global GRACE observational data to the simulated groundwater droughts, we see that GRACE records a mean drought duration of 5.5 months and a median of 4.3. Comparatively, in the regions which overlap with the GRACE coverage, the model simulates a mean drought duration of 9.9 months and a median of 5.4 months (note that this value differs from above because of only including data which overlaps with the observed GRACE data) suggesting that again the model simulates a greater number of long groundwater droughts. This is likely because of slower model response times and a higher degree of auto-correlation.
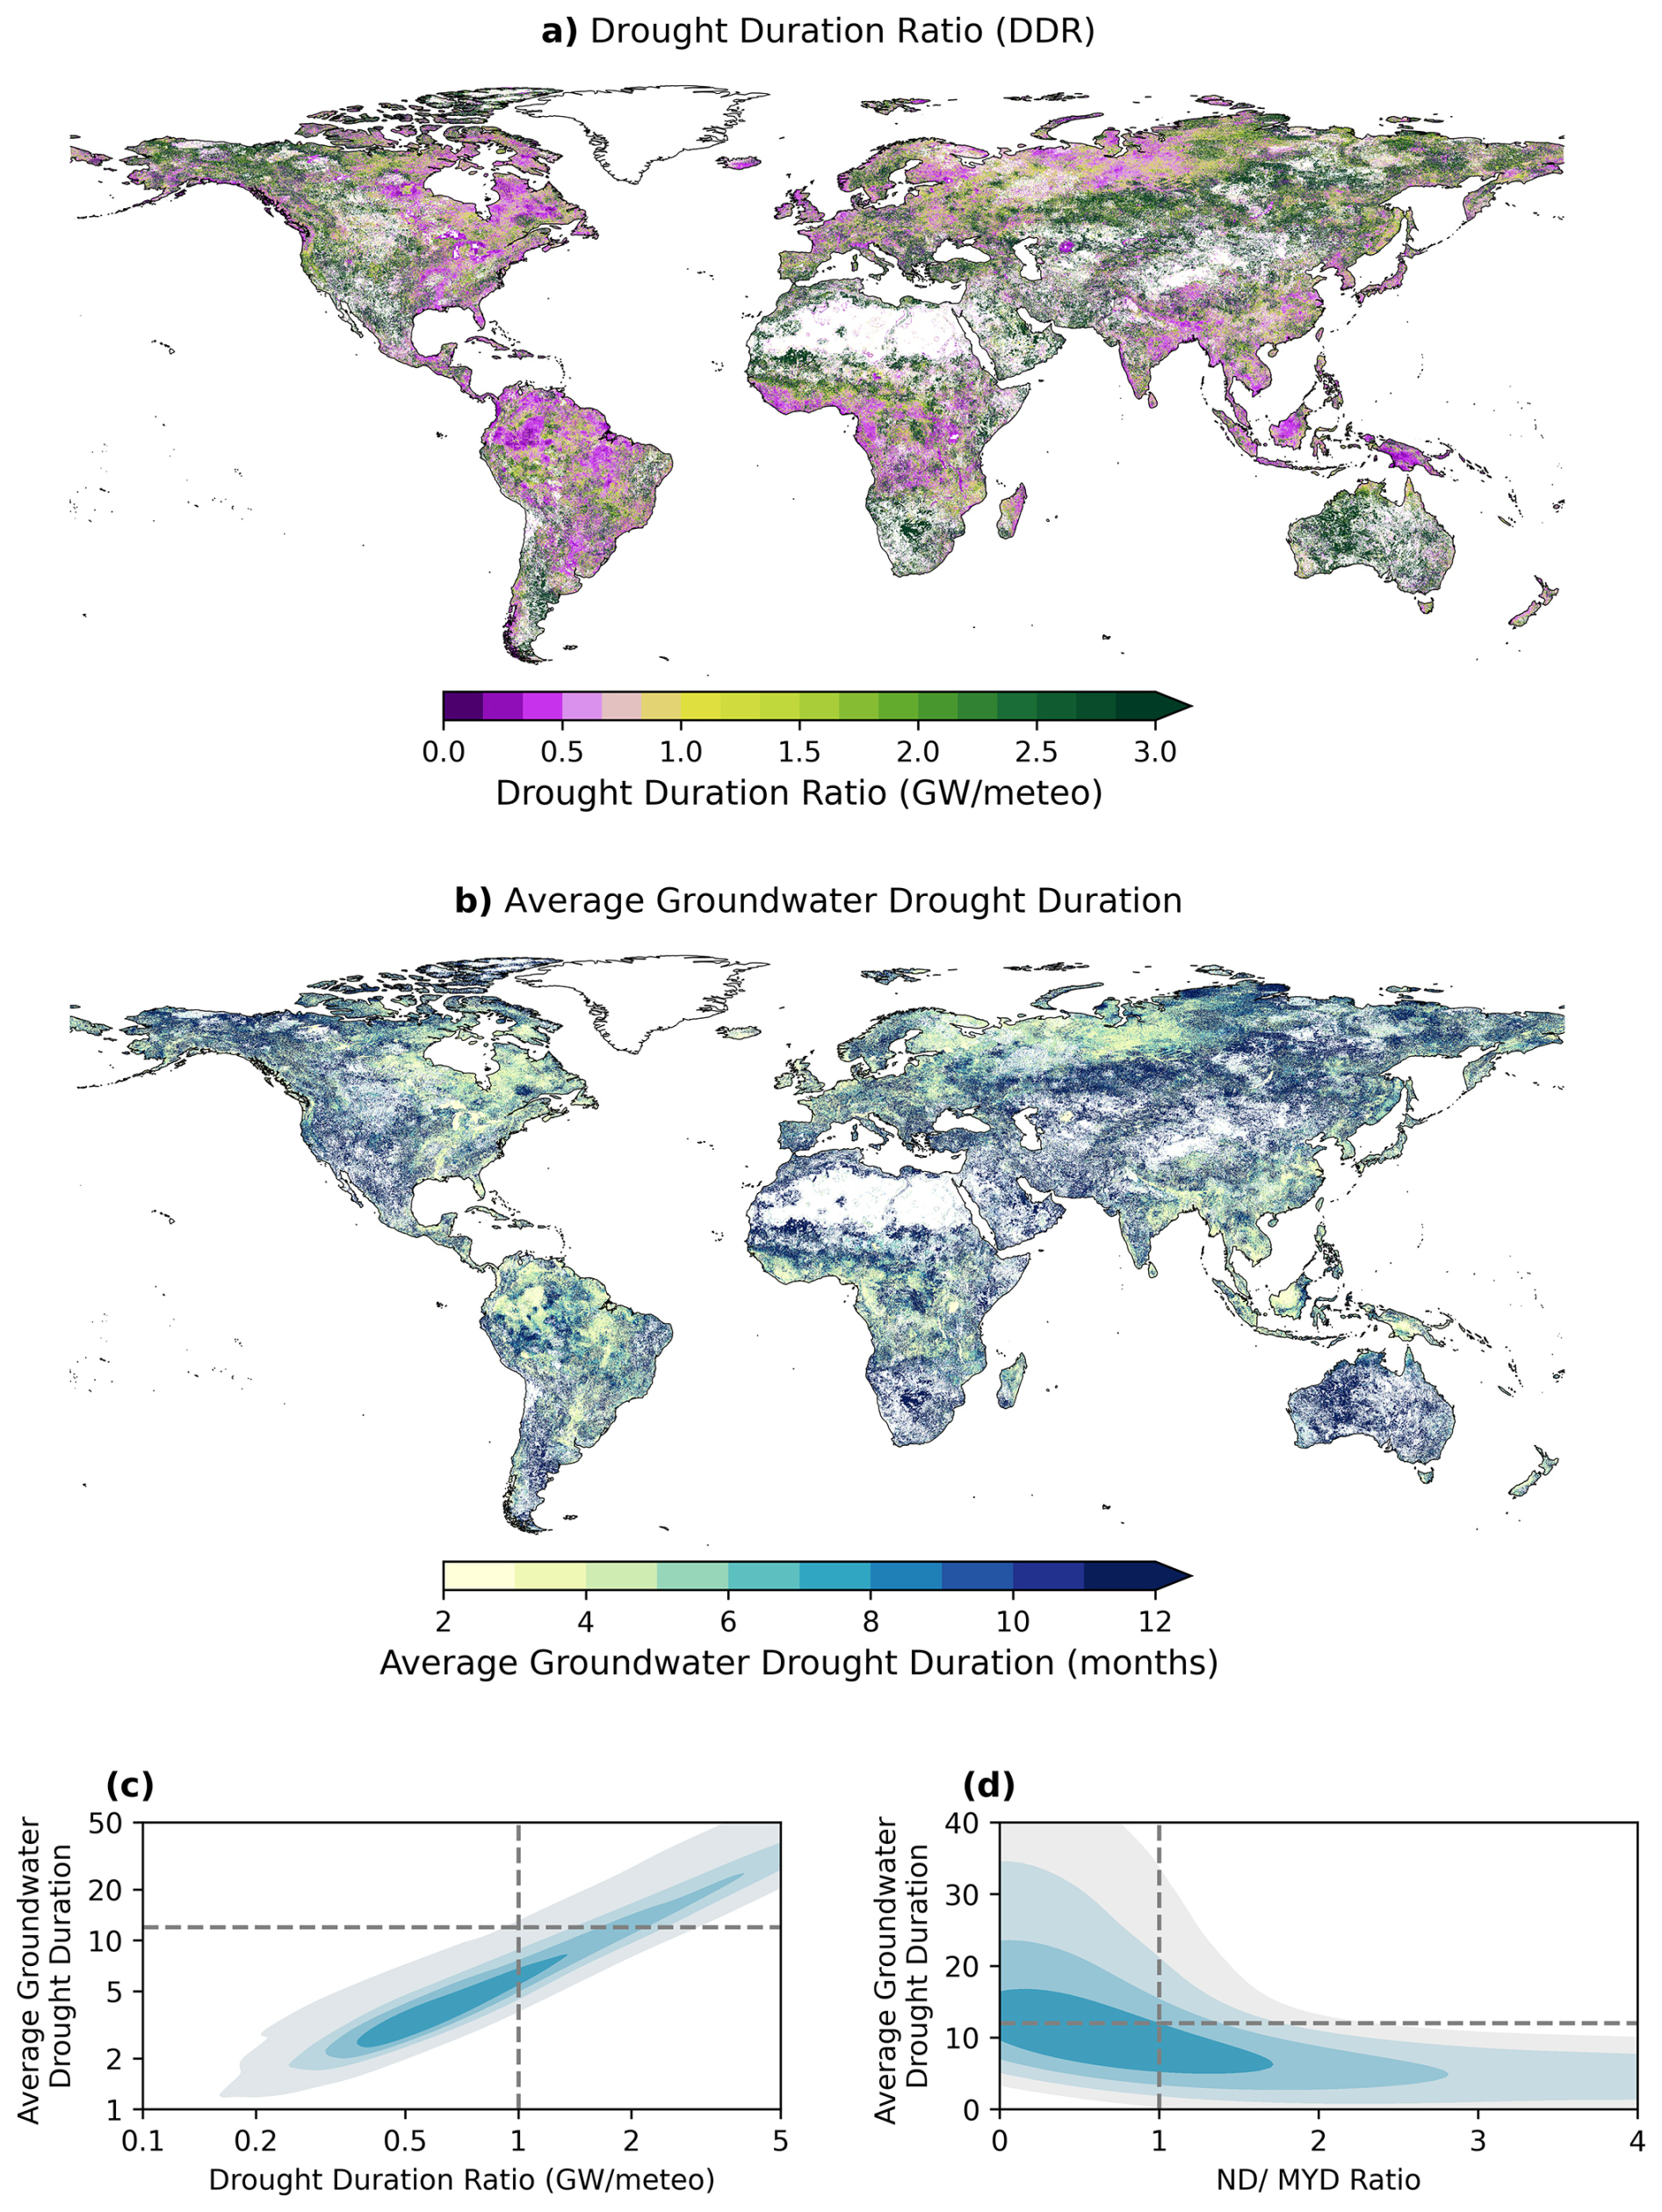
Figure 3(a) Global distribution of the Drought Duration Ratio. (b) Global distribution of Mean Groundwater Drought Duration. (c) Relationship between average Groundwater Drought Duration and the Drought Duration Ratio. The horizontal line denotes the threshold used to classify multi-year droughts, while the vertical line indicates where groundwater drought duration exceeds meteorological drought duration. (d) Relationship between Average Groundwater Drought Duration and the ratio of months spent in normal versus multi-year drought. The bottom left quadrant highlights locations where the average groundwater drought duration is less than 12 months, yet a greater proportion of time is spent in multi-year drought than in normal drought (ND MYD <1).
3.2 The propagation of meteorological to groundwater drought
3.2.1 Drought Duration
Figure 3a displays the global pattern of the Drought Duration Ratio. Roughly half of groundwater cells (49 %) have average drought durations shorter than the corresponding meteorological drought (ratio less than one, purple), with the remaining half (51 %) exhibiting longer groundwater droughts (ratio more than one, green). 17 % of points have an average groundwater drought duration ±25 % the length of the associated meteorological drought (yellow). Throughout this manuscript where we refer to global percentages we are referencing the percentage of groundwater grid cells that fulfil a criteria, not the area-weighted fraction which we found produced very similar results.
This pattern is predominantly driven by the spatial variation in the average length of a groundwater drought (Fig. 3b, c), since this is much more variable than the average length of a meteorological drought (see Fig. S2). Regions where the DDR is less than 1 tend to be regions where the average groundwater drought is less than 6 months. The pattern of groundwater drought is broadly in line with the global climate zones and precipitation regimes, where regions with low seasonal variation but high precipitation and generally high water availability coincide with regions with on average shorter groundwater droughts (Konapala et al., 2020; Beck et al., 2018). The longer groundwater droughts and regions with higher DDR tend to be those with deeper water tables and higher aridity (Ruijsch et al., 2025; van Jaarsveld et al., 2026). The mean groundwater drought duration is 20.4 months whilst the median is 6.8 months (comparatively the mean length of an SPEI-12 drought is 6.7 months and the median is 6.3 months). The global mean groundwater drought duration is heavily skewed toward longer drought. Meaning that the average drought duration is heavily affected by a number of particularly long drought events. 35 % of global groundwater grid cells have an average drought duration which is multi-year (where a multi-year drought is defined as a drought which lasts 12 months or more). This number is sensitive to the definition of a multi-year drought and would fall to 26 % if the definition required a drought to be 18 months and 21 % if it was 24 months. Multi-year droughts are also common amongst regions with high groundwater abstractions, where areas which have modelled abstractions in or above the 95th percentile have a mean drought duration of 14.7 months. The median, however, is only 5.8 months, suggesting that the mean is skewed up by long but less frequent drought events. In general, the worlds water scarcity hot spots (e.g. the Murray-Darling, Central Valley in California, Spain and the North China Plain) tend to have higher DDR's and longer groundwater drought durations, but there is some variation, for example in the Ganges where areas with lower DDR are still present.
In approximately 12 % of groundwater cells, more time is spent in multi-year drought than normal drought (ND MYD ratio <1) despite the average drought duration being below 12 months (these points fall in the bottom left quadrant in Fig. 3d). In these locations, the average drought duration is skewed lower by a number of short drought events which mask the presence of at least one dominant multi-year groundwater drought. These tend to be locations where average water table depth is close to the surface water level (see Sect. S3). The opposite to this is rarely true, with less than 1 % of points having a ND/MYD ratio of more than 1 and an average drought duration of more than 12 months, meaning that the average drought duration is rarely multi-year unless a larger portion of the timeseries is classified as MYD compared to ND.
3.2.2 Groundwater response types
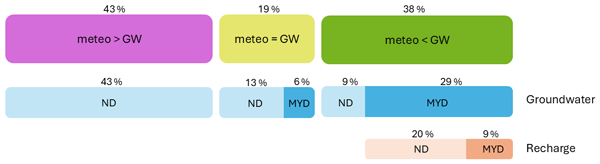
Based on the Drought Duration Ratio, Fig. 4 shows the separation of global groundwater data into the three response types introduced in Sect. 2.3.2. These types describe the relationship between meteorological and groundwater drought duration. Within each type, the data are further divided according to whether the average groundwater drought is normal or multi-year.
In 19 % of the world, groundwater drought appears to be primarily driven by meteorology (meteo = GW). Within this type, 32 % of the data (6 % of global data) has a multi-year average groundwater drought duration, while the remaining 68 % (13 % of global data) has an average duration of less than one year. Consequently, in regions where meteorology is classified as the main driver of groundwater drought, we can expect mostly normal droughts.
The meteo < GW type contains 38 % of global groundwater data. Of this, 76 % (29 % of global data) has a multi-year average groundwater drought duration, while 24 % (9 % of global data) has a normal average duration. However, 90 % of the data in this type (34.2 % of global data) spends more months in multi-year drought (MYD) than in normal drought (ND). This suggests that, in 57 % of cases where the average indicates a normal drought, the mean is biased downward by a series of short events. In these locations, significant multi-year droughts are common but interspersed with short events, making the average duration potentially unrepresentative. Areas with deeper groundwater have a higher proportion of data falling into this category (55 % of the groundwater tables deeper than 53 m falls in the meteo < GW type), as do regions classified as arid (56 % of data which has a Koppen climate classification of arid falls into the meteo < GW type).
For locations in the meteo < GW type with an average groundwater drought duration which is multi-year, we also examine recharge drought duration. 69 % of data in this category (20 % of global groundwater grid cells) have an average recharge drought duration of less than 12 months which is subsequently extended into a multi-year groundwater drought. This indicates that processes within the saturated zone are primarily responsible for amplifying the meteorological drought signal. In the remaining 31 %, multi-year groundwater droughts are instead driven by processes in the unsaturated zone (where recharge drought durations are on average multi-year).
A large amount of data still falls into the meteo > GW type (43 %), but almost all of these locations have a normal groundwater drought duration. For these regions we see that anomalies in the groundwater system typically have a faster response time than the 12 months inherent in SPEI-12. Although these fast-responding systems make up a large portion of the meteo > GW type, there are also locations with very shallow groundwater or strong connectivity to the surface water that exhibit similar behaviour. We will discuss this in more detail in the Discussion. In general, regions that fall into the meteo > GW response type tend to be shallower (58 % of groundwater tables less than 5 m deep fall into this response type) and are more likely to be in Tropical and Temperate regions. See Sect. S9 for more information on how the climate regimes and groundwater depth relate to the response types.
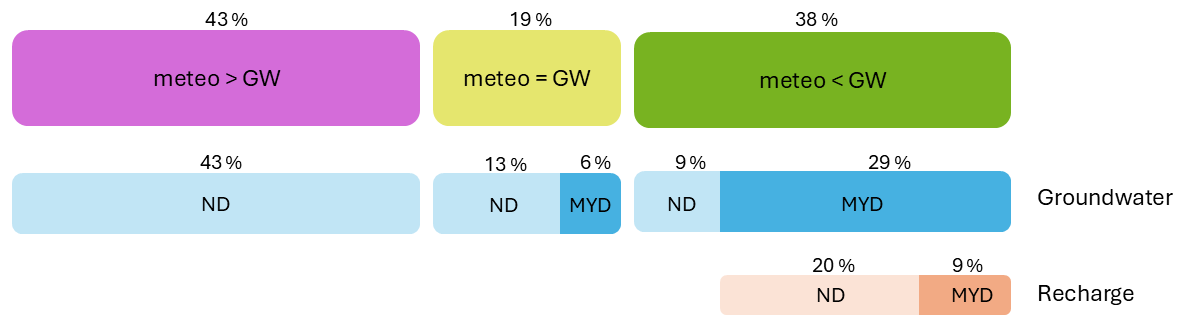
Figure 4Global groundwater response types (top row) with data assigned. In the second row (blue) the data associated with each type is divided based on whether the average groundwater drought is a multi-year drought (MYD) or normal drought (ND), and in the third row, the data which has a multi-year average drought duration is further sub-divided based on whether the average duration of a recharge drought is multi-year or normal.
3.2.3 Groundwater processes
To demonstrate some of the key processes driving the drought classification in Fig. 4, Fig. 5 plots three representative pairs of groundwater and SPEI-12 time series. In Fig. 5a we observe the groundwater system extending the meteorological signal by pooling multiple meteorological droughts into one prolonged groundwater drought. To define pooling we calculate the mean number of meteorological droughts that overlap with each groundwater drought. We refer to this as a “pooling metric”. In this timeseries we can also see the groundwater lagging behind the meteorology. Although these processes do not always co-exist, in practise, points with a pooling metric >2 tend to be associated with a lagged or delayed groundwater response. Amongst the points where a statistically significant correlation could be established between the groundwater timeseries and SPEI-12, those which also have significant pooling have an average lag of 5.8 months, compared to 1.1 months where there is no pooling of meteorological drought events. Places with a lag also tend to have deeper groundwater, where the mean water table depth at locations with lag 12 is ∼97.8 vs. ∼40.4 m for the data with no lag. Both of these processes are associated with data predominantly in the meteo < GW category, where 76 % of data with a lag more than 1 falls into this category.
Figure 5b demonstrates an example of a location where the average groundwater drought duration is skewed lower by a series of short groundwater drought events, meaning that despite the presence of multiple intense multi-year droughts the average drought duration remains less than 12 months. This behaviour appears to be associated with points which have water table depths close to the surface level. By definition this behaviour falls into the meteo > GW category, despite spending more time in MYD than ND (purple in Fig. 5e with ND MYD below 1).
Finally, Fig. 5c demonstrates the mismatch between fast-responding groundwater time series (top) and SPEI-12 (bottom). Places which demonstrate this behaviour almost always fall into the meteo > GW category where we almost never observe multi-year groundwater droughts and groundwater has a much higher variability. This is quantified in Fig. 5f where the standard deviation of first differences is much higher amongst the points in the meteo > GW category (purple).
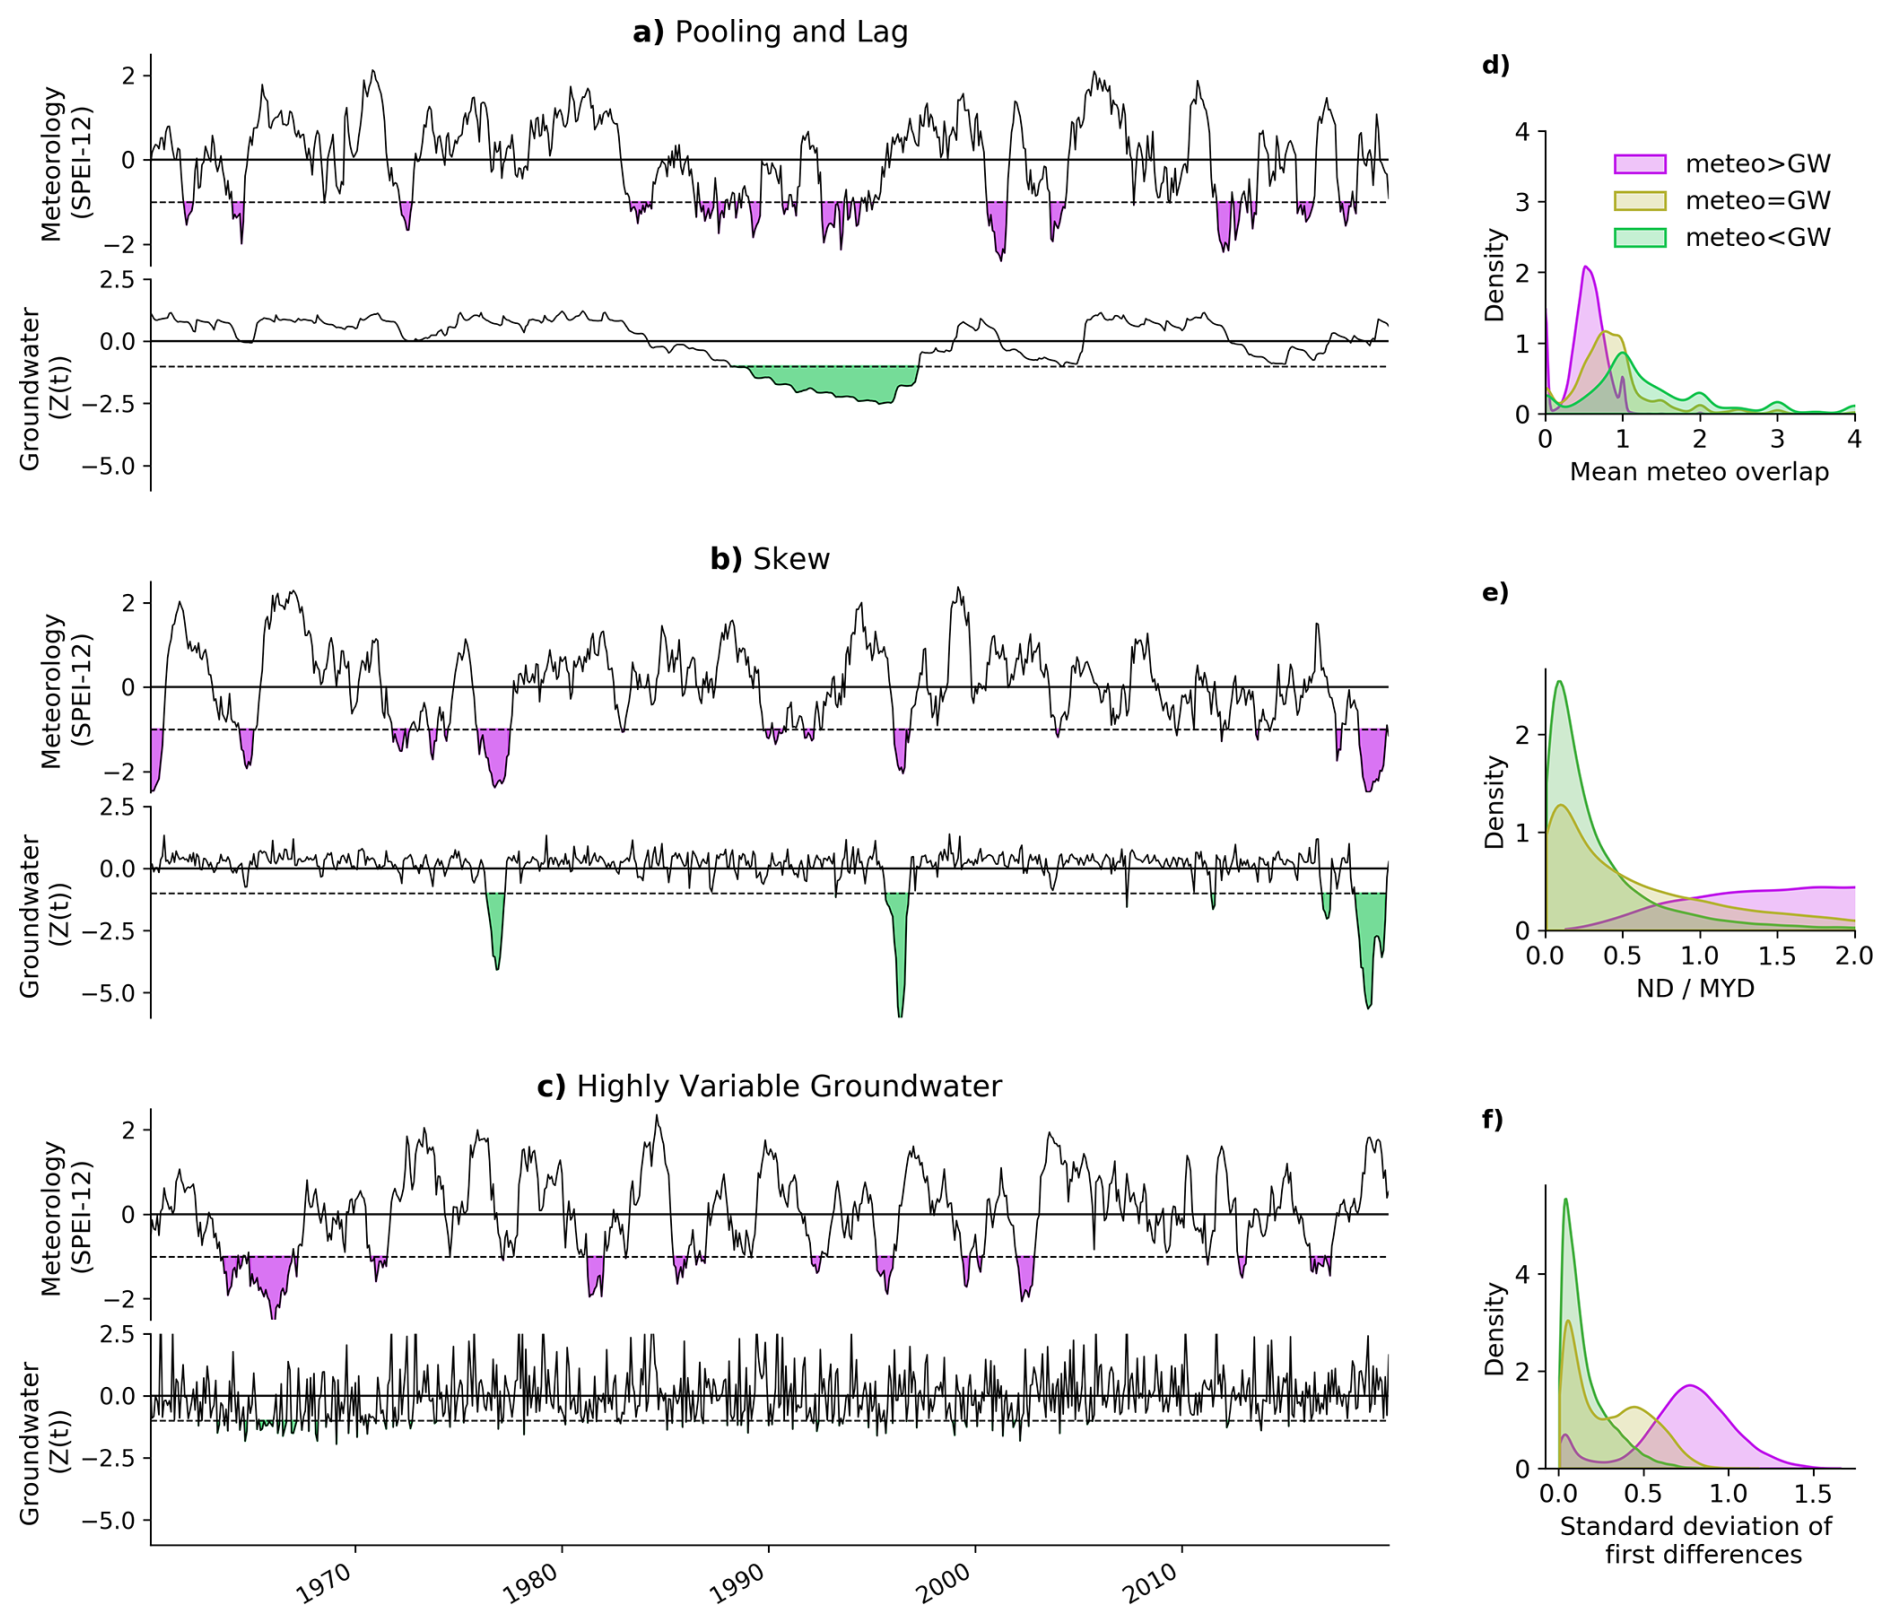
Figure 5Time series demonstrating key groundwater processes where (a) demonstrates a lag between meteorology and groundwater timeseries and the pooling of meteorological drought events, (b) visualises the process which leads to a skew in average groundwater drought duration, and (c) shows a mismatch in groundwater and meteorological accumulation periods. Each of these processes is associated with a histogram which characterises the types in which these behaviours are typically observed. Subplot (d) compares the distribution of points in each groundwater type to the pooling metric which calculates the average number of meteorological droughts which overlap with each groundwater drought and indicates pooling. Subplot (e) compares the distribution of points in each groundwater type to the ND MYD ratio which is equivilent to the number of months spent in normal drought divided by the number of months spent in multi-year drought, and subplot (f) compares the distribution of points in each groundwater type to the standard deviation of first differences which characterises the variability of the groundwater timeseries.
3.2.4 Drought synchronicity and SPEI-12 discriminatory ability (anomaly correlation and ROC-AUC score)
The anomaly correlation between the monthly standardized groundwater table depth and the SPEI-12 is displayed in Fig. 6a. The correlations are highest across Europe, eastern USA, central Africa and large parts of South America and lowest in Australia, Argentina, western USA and across central Asia. The anomaly correlations in regions with high groundwater abstractions (e.g. areas in the 95th percentile) are comparable to the global mean (mean anomaly correlation = 0.36 and median = 0.39). The global mean anomaly correlation achieved between SPEI-12 and simulated groundwater is 0.36 and the median is 0.42. 81.3 % of global groundwater grid cells have a statistically significant anomaly correlation (p=0.05) at lag 0. Visually, places with a long average groundwater drought duration also have a lower anomaly correlation (Fig. 6a versus Fig. 2b). Comparatively, places with a DDR close to 1 tend to have a higher anomaly correlation (Fig. 6d), implying that the systems are closely connected. The lowest correlations are most common in the meteo < GW type where there is more of a disconnect between the meteorology and groundwater which is dictated by the geo-physical properties of the saturated and unsaturated zones (Fig. 6a, d).
Figure 6c plots the distribution of statistically significant anomaly correlation values (>0.073), grouped based on the groundwater lag (see Fig. S4 for global map of dominant lag). We compare data from lag 0–lag 12 and find that places with a higher lag tend to also have lower anomaly correlations (Fig. 6c). 56 % of the data with a lag of one month or more is from the meteo < GW type, 15 % from meteo = GW and 5 % from meteo > GW suggesting that a lag is more common in areas where the groundwater anomalies are the result of pooling the meteorological drought signal.
In Fig. 6b we visualise the global ROC AUC score, a measure of how well SPEI-12 can discriminate groundwater drought from non-drought. A value of more than 0.5 indicates a groundwater drought is more likely to coincide with a meteorological drought than if it were left to random chance. 84 % of global ROC values exceed 0.5. The spatial pattern is very similar to the anomaly correlation. Similarly, areas with a high ROC score tend to be those where the Drought Duration Ratio is close to 1 (Fig. S5b). Regions with a long lag also tend to have a lower ROC score (Fig. S5a).
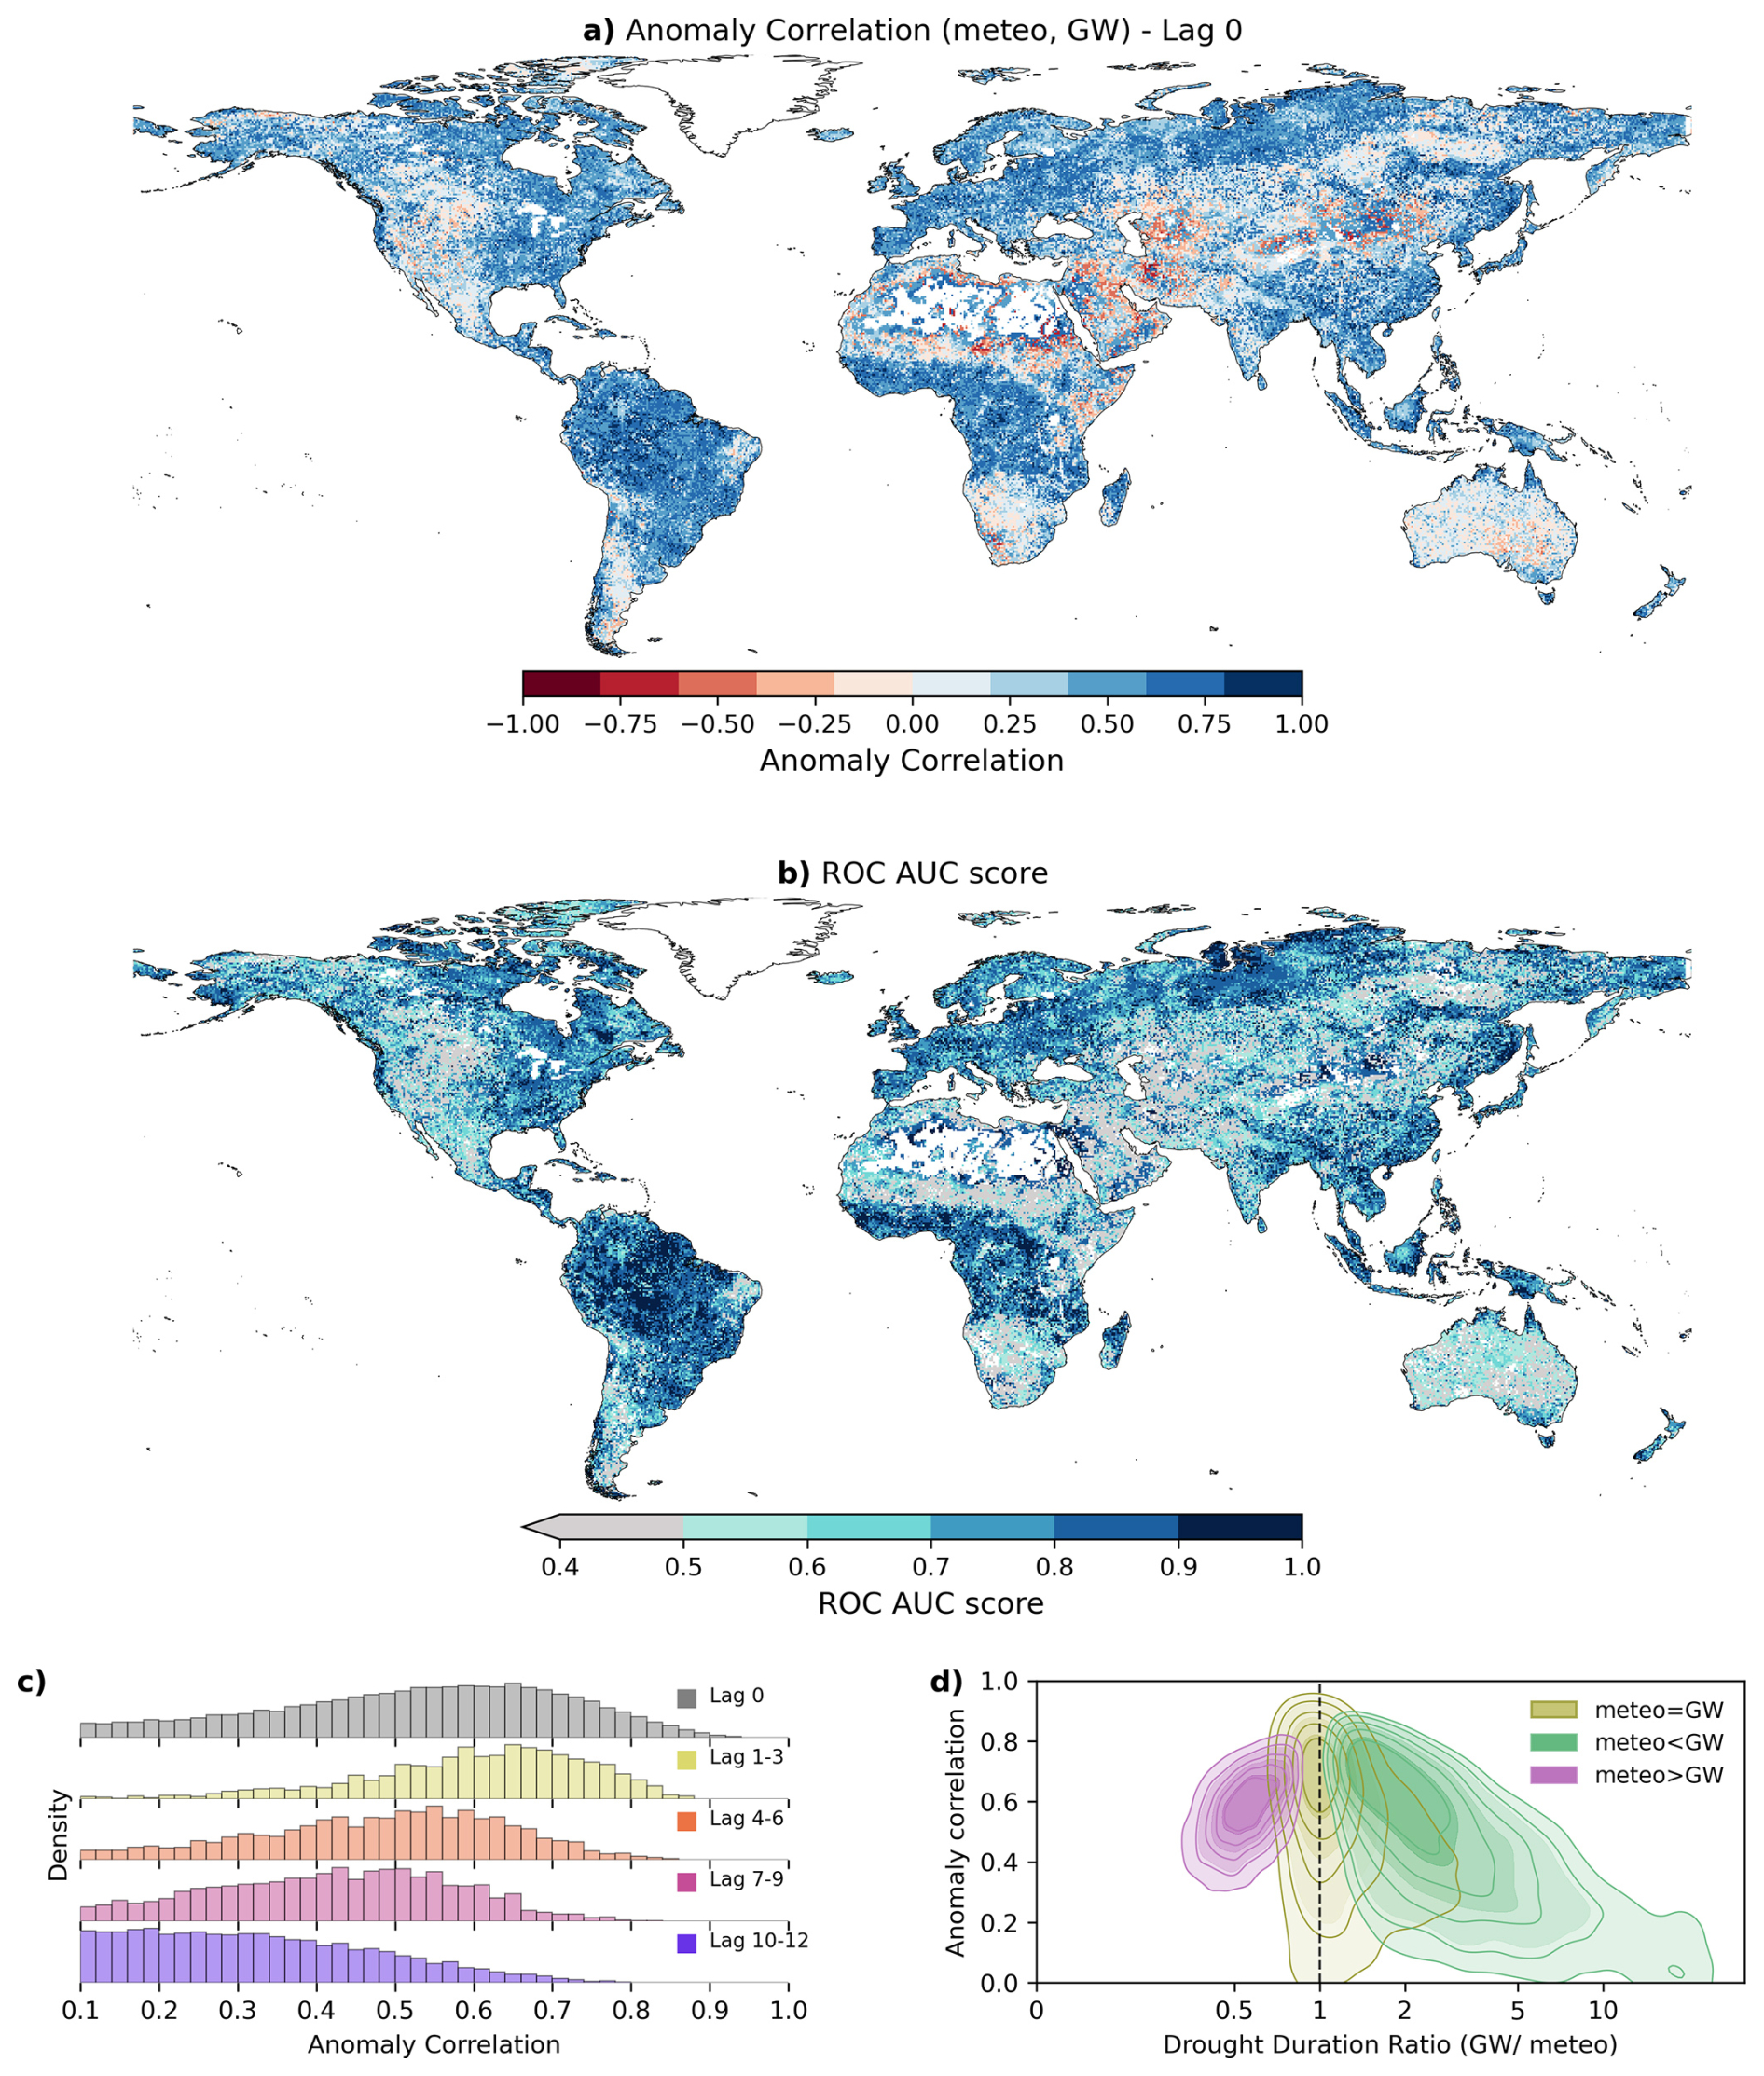
Figure 6(a) Anomaly Correlation between standardized groundwater table depth and SPEI-12, (b) global distribution of Receiver Operating Characteristic Area Under the Curve (ROC-AUC) score, (c) histogram displaying the distribution of anomaly correlation scores for groundwater data with lags between 1 and 12 months. (d) density plot representing the relationship between the anomaly correlation and the Drought Duration Ratio, plots are coloured based on their groundwater response type.
4.1 Main findings and implications
To the authors knowledge, this global analysis is the first to use hyper-resolution data to focus specifically on the drivers and patterns of multi-year groundwater drought. The lack of comprehensive global groundwater data has in the past meant that groundwater has been excluded from global drought propagation analysis (Fuentes et al., 2022; Wang et al., 2025; Han et al., 2019), or has been represented by coarse and temporally limited data (Akl et al., 2025). Although drought propagation has received significant attention at local, regional and national scales, the variability in the global patterns and drivers of groundwater drought mean that these findings cannot be easily extrapolated for actionable use.
Our results suggest that subsurface geo-physical properties are the primary drivers that modulate meteorological droughts into multi-year groundwater droughts. Although drought propagation begins with the meteorology, we find that in much of the world groundwater resources are substantially disconnected from the meteorological input and that the sub-surface significantly amplifies and modifies the drought signal (meteo < GW). Less than 2 % of global groundwater grid cells have an average meteorological drought duration of more than one year, but by comparison, 35 % of global groundwater grid cells have an average groundwater drought duration which is multi-year.
Disentangling the relationship between meteorology and groundwater exposes areas which are vulnerable to multi-year drought in the present day, but also identifies those which will be more vulnerable in the future. At present, the regions where meteorology and groundwater are connected to one another do not frequently experience multi-year drought (only 6 % of global data has a multi-year average groundwater drought duration and also falls into the meteo = GW category). However, in the future, we expect an increase in the frequency and magnitude of multi-year meteorological droughts (Van Der Wiel et al., 2023; Pascale et al., 2021; Rakovec et al., 2022), and thus regions in this category will be increasingly at risk from multi-year groundwater drought. An increase in the frequency or duration of meteorological droughts might also push more points into the meteo < GW category. If meteorological droughts are lengthened, or more frequent, then there will be less time for recovery between drought events, which might encourage increased pooling of meteorological droughts into groundwater droughts (Ebeling et al., 2025). This process may also amplify the relationship between meteorology and groundwater for points already in the meteo < GW category (increasing the DDR), since increased pooling would extend the meteorological signal in a non-linear way. It is also likely that increases in groundwater abstractions or pumping might push data from the meteo = GW category to the meteo < GW category (Rusli et al., 2024). Although we have not considered the impacts of abstractions on the typology we have presented in this paper, in many regions this is likely to have a significant impact on groundwater trends and should thus be considered in future work. However, strong trends in groundwater levels also have impacts on the proper characterisation of drought anomalies and thus require methodological advances in drought studies (Wanders et al., 2015).
Understanding the dynamics of multi-year drought propagation can inform local drought mitigation and help to predict and prepare for drought impacts (Minea and Albulescu, 2025; Parry et al., 2018). This is particularly important in the context of multi-year groundwater drought, since groundwater is often used to supplement surface water and sustain vegetation (Mu et al., 2021), so a prolonged absence of this resource can have wide-reaching implications. The typology that we implement in this study provides a simple baseline for understanding global patterns of groundwater responsiveness, which in turn can inform drought mitigation. For example, in regions where the meteorology and the groundwater are connected (which in our analysis makes up 19 % of global groundwater grid cells), the magnitude and timing of a drought can be anticipated based on the observed anomalies in the meteorological conditions. This has significant advantages for early-warning systems, which can be particularly beneficial for managing groundwater abstractions and the conjunctive use of groundwater and surface water. If we know the systems to be closely connected, then the end of a meteorological drought (which is much easier to measure and observe) is likely to also signal the end of a groundwater drought. It is also beneficial to understand whether or not a location falls into the meteo < GW type, since in these cases even a short meteorological drought might signal the start of a multi-year groundwater drought for which society needs to prepare. Contrastingly, in places where the meteorological droughts tend to be longer than the groundwater droughts, a multi-year groundwater drought is extremely unlikely since multi-year meteorological droughts are rare.
4.2 Processes and properties which extend the meteorological drought signal
Consistent with findings from other studies (Ebeling et al., 2025; Minea and Albulescu, 2025), our analysis confirms that even regions which are subject to similar meteorological forcing may exhibit a very different groundwater response. The modulation of meteorological drought is controlled by the presence (or absence) of several key groundwater processes which are tied to local catchment characteristics and aquifer properties.
Lag, attenuation, pooling and lengthening are all well-established mechanisms of drought propagation which we observe in this study (Van Loon, 2015; Brauns et al., 2020). The existence of a multi-year groundwater drought is often facilitated by the lengthening of the meteorological signal, and we find that the most extreme examples of this are usually accompanied by pooling of several meteorological drought events. In these cases, the clustering of meteorological droughts could be made more likely by persistent weather patterns and decadal climate variability (Rust et al., 2019).
In general, the places where groundwater lags behind SPEI-12 also tend to be locations which substantially amplify the meteorological signal and are more likely to encounter a multi-year groundwater drought. In agreement with other studies, we find that longer lags tend to be associated with deeper groundwater and have longer average drought durations and lower anomaly correlations (Schreiner-McGraw and Ajami, 2021; Ebeling et al., 2025). Understanding the groundwater lag also has significant benefits for drought forecasting, where the characteristics of a meteorological drought can be used to anticipate the upcoming groundwater response.
Outside of the more well-established drought propagation processes, our analysis also identified a cluster of points which have a notably bimodal distribution of drought events. In these locations more time is spent in multi-year drought than normal drought, but the average drought duration is skewed down (to less than 12 months) by frequent short drought events. Groundwater here is typically shallow, and close to surface and potentially connected to surface water. We hypothesize that these regimes might have a mechanism whereby the groundwater system can buffer shorter, or less intense meteorological droughts, but when recharge is reduced beyond a certain threshold the groundwater becomes disconnected from the surface water, descending into an intense, multi-year drought event. Since small changes in groundwater management could prevent or trigger this mechanism, it is important that we can predict where and when this process might occur.
4.3 Difficulties associated with drought definition
Throughout this analysis we encountered several difficulties associated with the definition of groundwater and meteorological drought. Firstly, variability in the response time of groundwater to meteorological anomalies meant that it was hard to characterise groundwater droughts with one uniform meteorological drought index. Although this was made more difficult by the diversity inherent in global data, other studies have also found this to be a challenge on smaller, more regional scales (Minea and Albulescu, 2025; Ebeling et al., 2025; Hellwig et al., 2022; Kumar et al., 2016). For this study we chose to use SPEI with a 12 month accumulation which was consistent with multi-year drought literature (Ruijsch et al., 2025; Van Mourik et al., 2025), but also aligned with other global studies which found the average groundwater accumulation period to be close to 12 months (Liu et al., 2023; Ndehedehe et al., 2023). However, mismatches in SPEI-12 and groundwater accumulation still result in a portion of data falling into the meteo > GW type. In these locations the groundwater responds to the meteorology faster than the 12 month accumulation inherent in SPEI-12 and this results in shorter groundwater drought events. Since the main focus of this study was to identify the drivers of multi-year groundwater droughts, and they are not common in these fast-responding regions (there are no places with a multi-year average groundwater drought duration in the meteo > GW type), this has not hindered our analysis, but should be considered if this analysis was to focus on the drivers of shorter events. For a sensitivity analysis which demonstrates how the SPEI accumulation period impacts the distribution of data across our typology see Sect. S7. Furthermore, in many locations it is also not possible to distinguish the climatological controls on drought from the anthropogenic controls. Our study assumes that drought (and drought duration) are a reflection of the meteorological signal, when in some cases the drought and its persistence are actually a function of human activity (e.g. groundwater pumping). Therefore in regions with a high level of human interference, groundwater drought should not be considered as solely the manipulation of the meteorological signal.
Another challenge for groundwater drought definition was the presence of trends. Globally, many groundwater aquifers are experiencing significant decline both from unsustainable abstractions and from climate change (Jasechko et al., 2024; Nazari et al., 2025; Berghuijs et al., 2024). These trends remove the stationarity assumption that is often used in drought characterisation and can artificially inflate or deflate drought length. Solutions such as de-trending the data have not been successful in other global groundwater drought studies (e.g. Herbert and Döll, 2025; Wanders et al., 2015), so instead, here we implement a simple screening to remove drought events likely to be a function of trends. By removing droughts which have already begun on the first timestep or not ended on the final timestep of our groundwater simulations, we see that the 54 % of global groundwater cells which have on average a multi-year groundwater drought duration is reduced to 35 %. To supplement this initial screening we also redistributed the global groundwater data into the response types after excluding places where a significant trend is observed. To calculate which locations are impacted by trends we fit a linear regression to the standardized monthly groundwater anomaly timeseries and calculated the total change in standardized anomaly over the time period. Where this is more than 3 standard deviations of change across the period and the p value is <0.01 we conclude there is a significant trend. Masking out this regions makes only a very small change to the global distribution of response types. The meteo > GW category goes from containing 43 % of data to 38 % when we mask out locations with trends, meteo = GW stays at 20 % and meteo < GW changes from 38 % to 43 %. This minimal change assures us that our initial screening procedure is removing most of the significant trend-influenced drought events, but it also highlights a potential artifact of the methodology where in a small number of locations, removing one particularly long event can instead skew the average groundwater drought duration down, leading to a slightly higher proportion of data in the meteo < GW category.
Finally, we also had difficulty defining droughts in regions with very little variability. In these locations, the monthly standardized anomaly was very small and thus sensitive to small changes in groundwater table depth.
4.4 Model limitations
The validation of global groundwater models is notoriously difficult due to mismatches in spatial resolution and representation between observed groundwater data and model simulations of groundwater. The relatively low anomaly correlations and mismatches in drought duration calculated between observed and simulated data should influence the confidence we have in the classification of groundwater response types and interpretation of the data in regions where the model does not perform well or can not be evaluated. In regions where the anomaly correlation is low, the model may not be well suited for regional use and the results must be interpreted with caution. While the ROC AUC scores show a skillful representation of the model, the magnitude of the anomalies in groundwater simulations could be better represented, as shown by the lower anomaly correlations. This indicates that while the groundwater anomalies are represented in the correct direction (either too wet or too dry) their magnitude is not always correctly estimated. There are several reasons why the anomaly correlations may be low which are unrelated to GLOBGM. Firstly, because of errors in the observational dataset. As discussed in Sect. 3.1, in many places the GRACE data is not suitable for direct comparison to the groundwater data, and the signal should not be compared to groundwater table depth. This has been observed by many other studies in the literature who have identified problems with using this data for drought-based evaluation (Akl et al., 2025; Van Loon et al., 2017; Long et al., 2013). Although we tried to couple the GRACE evaluation with perhaps more reliable point observations, these are reasonably scarce. Similarly, comparing the length of droughts simulated by GRACE to those simulated by GLOBGM can be misleading. Using GRACE data alone only 9 % of global groundwater cells have a multi-year average drought duration, compared with 35 % using GLOBGM. This is likely to be influenced by the shorter length of this timeseries (18 years of GRACE data compared with 60 years simulated by GLOBGM), especially since it has already been shown that meteorological multi-year droughts can be clustered in time (Van Mourik et al., 2025). As well as the limitations involved in comparing GRACE's total water storage to simulated groundwater table depth, the difference in resolution between the datasets (∼300 vs. 1 km) is also likely to influence the number of multi-year groundwater droughts in the record, where a coarser resolution can result in a more muted drought signal.
As a groundwater community, we need to push for more global groundwater data to aid model evaluation, but in its absence, we suggest that there is still value in running models in regions where they cannot be validated. Since GLOBGM has been proven to perform as well as, or better than many alternative global groundwater models (van Jaarsveld et al., 2026), we believe there is still value in using the results for global analysis. Currently the model's performance is on par or better than other global dynamic groundwater model simulations. Choosing suitable metrics for model evaluation is also tricky, and in this case, in many areas the anomaly correlation could be over exaggerating a mis-match in simulated and observed data in regions with little water table variability where small trends oppose each other. It is also likely that the meteorological forcing input to GLOBGM could be decreasing the anomaly correlations in some regions such as sub-Saharan Africa and north-eastern Siberian (van Jaarsveld et al., 2026; Liu et al., 2023). Uncertainties remain large for the sub-surface parameterization, however in the absence of better parameterization we have used the state-of-the-art available parameters to perform GLOBGM groundwater simulations. It is possible that the groundwater abstractions implemented in GLOBGM contribute to poor model performance in some regions. However, in general, GLOBGM simulates large scale groundwater depletion signals well, identifying many of the established regions of known depletion e.g. the Arabian Peninsula and California's Central Valley. It also recreates some of the regions where groundwater supplies are recovering e.g. the Guarani Aquifer System in South America (van Jaarsveld et al., 2026).
4.5 Avenues for future work
This study has identified several new research avenues which could further enhance our understanding of multi-year groundwater drought. Firstly, although GLOBGM includes groundwater abstractions, this study has not attempted to disentangle their influence on groundwater drought. Future work could leverage the modelling framework introduced here to test how varying levels of groundwater abstractions impact multi-year groundwater drought development and evaluate whether changes to groundwater pumping could be an effective strategy for drought mitigation. Secondly, it would be beneficial to perform a similar analysis using model simulations which are forced with future climate data. Understanding how the drivers and patterns of multi-year drought might change in the future under climate change is important for preparedness and could inform long-term policy and planning. Finally, it would also be interesting to perform a similar analysis on the event-scale. Our work considers only the average relationship between groundwater and meteorological drought events, but this many vary on an event-to-event basis.
This study presents the first hyper-resolution, global-scale analysis of the drivers and patterns of multi-year groundwater drought. We find that in many parts of the world the subsurface significantly modulates the meteorological drought signal, resulting in frequent multi-year groundwater drought. By categorising the global groundwater data into types which describe the responsiveness of the groundwater to the meteorology, we provide a new framework for understanding the global vulnerability to multi-year drought. Our findings offer novel insights into drought planning and mitigation, whilst emphasising the differences in groundwater response across the world.
GLOBGMv1.1 simulations based on van Jaarsveld et al. (2026) can be accessed via: https://doi.org/10.24416/UU01-AKSHOX (van Jaarsveld, 2025).
The supplement related to this article is available online at https://doi.org/10.5194/esd-17-1609-2026-supplement.
The conceptualisation of this research was carried out by SS and NW. The data was provided by BvJ who also assisted SS with the data processing. SS, NW, JvM, DR and SH developed the framework for drought definition. All analysis was carried out by SS. All authors helped to write and edit the manuscript.
The contact author has declared that none of the authors has any competing interests.
Views and opinions expressed are those of the author(s) only and do not necessarily reflect those of the European Union or the European Research Council. Neither the European Union nor the granting authority can be held responsible for them.
Publisher's note: Copernicus Publications remains neutral with regard to jurisdictional claims made in the text, published maps, institutional affiliations, or any other geographical representation in this paper. The authors bear the ultimate responsibility for providing appropriate place names. Views expressed in the text are those of the authors and do not necessarily reflect the views of the publisher.
This research has been supported by the European Research Council, HORIZON EUROPE European Research Council (grant nos. 101075354 and 101019185) and the Nederlandse Organisatie voor Wetenschappelijk Onderzoek, Exacte en Natuurwetenschappen (grant no. VI.Vidi.223.009).
This paper was edited by Christian Franzke and reviewed by two anonymous referees.
Akl, M., Thomas, B. F., and Clarke, P. J.: Global Groundwater Drought Assessment Revisited: A Holistic Re-Evaluation of the GRACE-Groundwater Drought Index Across Major Aquifers, Water Resour. Res., 61, e2025WR040389, https://doi.org/10.1029/2025WR040389, 2025. a, b, c
Apurv, T. and Cai, X.: Impact of Droughts on Water Supply in U.S. Watersheds: The Role of Renewable Surface and Groundwater Resources, Earth's Future, 8, e2020EF001648, https://doi.org/10.1029/2020EF001648, 2020. a
Ashraf, S., Nazemi, A., and AghaKouchak, A.: Anthropogenic drought dominates groundwater depletion in Iran, Sci. Rep., 11, 9135, https://doi.org/10.1038/s41598-021-88522-y, 2021. a
Athukoralalage, D., Brookes, J., McDowell, R. W., and Mosley, L. M.: Impact of hydrological drought occurrence, duration, and severity on Murray-Darling basin water quality, Water Res., 252, 121201, https://doi.org/10.1016/j.watres.2024.121201, 2024. a
Bäthge, A., Ruz Vargas, C., Lischeid, G., Collenteur, R., Cuthbert, M., Fleckenstein, J., Flörke, M., De Graaf, I., Gnann, S., Hartmann, A., Huggins, X., Moosdorf, N., Wada, Y., Wagener, T., and Reinecke, R.: A Global-Scale Time Series Dataset for Groundwater Studies within the Earth System, Sci. Data, 13, 401, https://doi.org/10.1038/s41597-026-06966-1, 2026. a
Beck, H. E., Zimmermann, N. E., McVicar, T. R., Vergopolan, N., Berg, A., and Wood, E. F.: Present and future Köppen-Geiger climate classification maps at 1 km resolution, Sci. Data, 5, 180–214, https://doi.org/10.1038/sdata.2018.214, 2018. a
Berghuijs, W. R., Collenteur, R. A., Jasechko, S., Jaramillo, F., Luijendijk, E., Moeck, C., Van Der Velde, Y., and Allen, S. T.: Groundwater recharge is sensitive to changing long-term aridity, Nat. Clim. Change, 14, 357–363, https://doi.org/10.1038/s41558-024-01953-z, 2024. a
Bierkens, M. F. P. and Wada, Y.: Non-renewable groundwater use and groundwater depletion: a review, Environ. Res. Lett., 14, 063002, https://doi.org/10.1088/1748-9326/ab1a5f, 2019. a, b
Bourgault, P., Huard, D., Smith, T. J., Logan, T., Aoun, A., Lavoie, J., Dupuis, É., Rondeau-Genesse, G., Alegre, R., Barnes, C., Laperrière, A. B., Biner, S., Caron, D., Ehbrecht, C., Fyke, J., Keel, T., Labonté, M.-P., Lierhammer, L., Low, J.-F., Quinn, J., Roy, P., Squire, D., Stephens, A., Tanguy, M., and Whelan, C.: xclim: xarray-based climate data analytics, J. Open Source Softw., 8, 5415, https://doi.org/10.21105/joss.05415, 2023. a
Brauns, B., Cuba, D., Bloomfield, J. P., Hannah, D. M., Jackson, C., Marchant, B. P., Heudorfer, B., Van Loon, A. F., Bessière, H., Thunholm, B., and Schubert, G.: The Groundwater Drought Initiative (GDI): Analysing and understanding groundwater drought across Europe, Proc. IAHS, 383, 297–305, https://doi.org/10.5194/piahs-383-297-2020, 2020. a, b
Büchner, M. and Reyer, C.: ISIMIP3a atmospheric composition input data, ISIMIP Repository [data set], https://doi.org/10.48364/ISIMIP.664235.1, 2022. a
Cai, W., Purich, A., Cowan, T., Van Rensch, P., and Weller, E.: Did Climate Change–Induced Rainfall Trends Contribute to the Australian Millennium Drought?, J. Climate, 27, 3145–3168, https://doi.org/10.1175/JCLI-D-13-00322.1, 2014. a
Cárdenas Belleza, G. A., Bierkens, M. F. P., and Van Vliet, M. T. H.: Sectoral water use responses to droughts and heatwaves: analyses from local to global scales for 1990–2019, Environ. Res. Lett., 18, 104008, https://doi.org/10.1088/1748-9326/acf82e, 2023. a
Castle, S. L., Thomas, B. F., Reager, J. T., Rodell, M., Swenson, S. C., and Famiglietti, J. S.: Groundwater depletion during drought threatens future water security of the Colorado River Basin, Geophys. Res. Lett., 41, 5904–5911, https://doi.org/10.1002/2014GL061055, 2014. a
Chen, Y., Zhang, Y., Tian, J., Nourani, V., Ma, N., Zhang, X., Xu, Z., Huang, Q., Tang, Z., Wei, H., and Yang, X.: Groundwater exhibits spatially opposing trends during the Australian Millennium Drought, Environ. Res. Lett., 19, 074016, https://doi.org/10.1088/1748-9326/ad521d, 2024. a, b
Condon, L. E., Kollet, S., Bierkens, M. F. P., Fogg, G. E., Maxwell, R. M., Hill, M. C., Fransen, H. H., Verhoef, A., Van Loon, A. F., Sulis, M., and Abesser, C.: Global Groundwater Modeling and Monitoring: Opportunities and Challenges, Water Resour. Res., 57, e2020WR029500, https://doi.org/10.1029/2020WR029500, 2021. a, b
Cook, B. I., Mankin, J. S., Marvel, K., Williams, A. P., Smerdon, J. E., and Anchukaitis, K. J.: Twenty-First Century Drought Projections in the CMIP6 Forcing Scenarios, Earth's Future, 8, e2019EF001461, https://doi.org/10.1029/2019EF001461, 2020. a
Ebeling, P., Musolff, A., Kumar, R., Hartmann, A., and Fleckenstein, J. H.: Groundwater head responses to droughts across Germany, Hydrol. Earth Syst. Sci., 29, 2925–2950, https://doi.org/10.5194/hess-29-2925-2025, 2025. a, b, c, d, e
Famiglietti, J. S., Lo, M., Ho, S. L., Bethune, J., Anderson, K. J., Syed, T. H., Swenson, S. C., De Linage, C. R., and Rodell, M.: Satellites measure recent rates of groundwater depletion in California's Central Valley, Geophys. Res. Lett., 38, 2010GL046442, https://doi.org/10.1029/2010GL046442, 2011. a
Fowler, K., Peel, M., Saft, M., Peterson, T. J., Western, A., Band, L., Petheram, C., Dharmadi, S., Tan, K. S., Zhang, L., Lane, P., Kiem, A., Marshall, L., Griebel, A., Medlyn, B. E., Ryu, D., Bonotto, G., Wasko, C., Ukkola, A., Stephens, C., Frost, A., Gardiya Weligamage, H., Saco, P., Zheng, H., Chiew, F., Daly, E., Walker, G., Vervoort, R. W., Hughes, J., Trotter, L., Neal, B., Cartwright, I., and Nathan, R.: Explaining changes in rainfall–runoff relationships during and after Australia's Millennium Drought: a community perspective, Hydrol. Earth Syst. Sci., 26, 6073–6120, https://doi.org/10.5194/hess-26-6073-2022, 2022. a
Fuentes, I., Padarian, J., and Vervoort, R. W.: Spatial and Temporal Global Patterns of Drought Propagation, Front. Environ. Sci., 10, 788248, https://doi.org/10.3389/fenvs.2022.788248, 2022. a
GRACE-FO, D. N. W.: JPL GRACE and GRACE-FO Mascon Ocean, Ice, and Hydrology Equivalent Water Height CRI Filtered RL06.3Mv04, EarthData [data set], https://doi.org/10.5067/TEMSC-3JC634, 2024. a
Han, Z., Huang, S., Huang, Q., Leng, G., Wang, H., Bai, Q., Zhao, J., Ma, L., Wang, L., and Du, M.: Propagation dynamics from meteorological to groundwater drought and their possible influence factors, J. Hydrol., 578, 124102, https://doi.org/10.1016/j.jhydrol.2019.124102, 2019. a, b, c
Hauswirth, S. M., Van Jaarsveld, B., Salwey, S. A. B., and Wanders, N.: Patterns and drivers of global groundwater drought recovery, Environ. Res.-Water, 2, 045002, https://doi.org/10.1088/3033-4942/aea63d, 2026. a
Heberger, M.: Australia's Millennium Drought: Impacts and Responses, in: The World's Water, edited by: Gleick, P. H., 97–125, Island Press/Center for Resource Economics, Washington, DC, ISBN 978-1-61091-048-4, https://doi.org/10.5822/978-1-59726-228-6_5, 2012. a
Hellwig, J., Liu, Y., Stahl, K., and Hartmann, A.: Drought propagation in space and time: the role of groundwater flows, Environ. Res. Lett., 17, 094008, https://doi.org/10.1088/1748-9326/ac8693, 2022. a, b
Herbert, C. and Döll, P.: Assessing Groundwater Drought Hazard in Groundwater Depletion Regions: Recommendations for Large-Scale Drought Early Warning Systems, Water Resour. Res., 61, e2024WR038684, https://doi.org/10.1029/2024WR038684, 2025. a
Hohensinn, R., Gou, J., Meyer, U., Humphrey, V., Dorigo, W., Boergens, E., Soja, B., Gruber, A., Jensen, L., Eicker, A., Rast, M., and Güntner, A.: Water storage trends derived from the GRACE/-FO global gravity-based groundwater product (G3P), EGUsphere [preprint], https://doi.org/10.5194/egusphere-2026-975, 2026. a
Huggins, X., Gleeson, T., Castilla-Rho, J., Holley, C., Re, V., and Famiglietti, J. S.: Groundwater Connections and Sustainability in Social-Ecological Systems, Groundwater, 61, 463–478, https://doi.org/10.1111/gwat.13305, 2023. a
IGRAC: The Global Groundwater Monitoring Network (GGMN), https://doi.org/10.58154/6Z0Y-DA34, 2024. a, b
Jasechko, S., Seybold, H., Perrone, D., Fan, Y., Shamsudduha, M., Taylor, R. G., Fallatah, O., and Kirchner, J. W.: Rapid groundwater decline and some cases of recovery in aquifers globally, Nature, 625, 715–721, https://doi.org/10.1038/s41586-023-06879-8, 2024. a, b, c
Konapala, G., Mishra, A. K., Wada, Y., and Mann, M. E.: Climate change will affect global water availability through compounding changes in seasonal precipitation and evaporation, Nat. Commun., 11, 3044, https://doi.org/10.1038/s41467-020-16757-w, 2020. a
Kumar, R., Musuuza, J. L., Van Loon, A. F., Teuling, A. J., Barthel, R., Ten Broek, J., Mai, J., Samaniego, L., and Attinger, S.: Multiscale evaluation of the Standardized Precipitation Index as a groundwater drought indicator, Hydrol. Earth Syst. Sci., 20, 1117–1131, https://doi.org/10.5194/hess-20-1117-2016, 2016. a
Leblanc, M., Tweed, S., Van Dijk, A., and Timbal, B.: A review of historic and future hydrological changes in the Murray-Darling Basin, Glob. Planet. Change, 80–81, 226–246, https://doi.org/10.1016/j.gloplacha.2011.10.012, 2012. a
Le Brocque, A. F., Kath, J., and Reardon-Smith, K.: Chronic groundwater decline: A multi-decadal analysis of groundwater trends under extreme climate cycles, J. Hydrol., 561, 976–986, https://doi.org/10.1016/j.jhydrol.2018.04.059, 2018. a
Leijnse, M., F P Bierkens, M., H M Gommans, K., Lin, D., Tait, A., and Wanders, N.: Key drivers and pressures of global water scarcity hotspots, Environ. Res. Lett., 19, 054035, https://doi.org/10.1088/1748-9326/ad3c54, 2024. a, b
Liu, P.-W., Famiglietti, J. S., Purdy, A. J., Adams, K. H., McEvoy, A. L., Reager, J. T., Bindlish, R., Wiese, D. N., David, C. H., and Rodell, M.: Groundwater depletion in California's Central Valley accelerates during megadrought, Nat. Commun., 13, 7825, https://doi.org/10.1038/s41467-022-35582-x, 2022. a
Liu, Y., Shan, F., Yue, H., Wang, X., and Fan, Y.: Global analysis of the correlation and propagation among meteorological, agricultural, surface water, and groundwater droughts, J. Environ. Manage., 333, 117460, https://doi.org/10.1016/j.jenvman.2023.117460, 2023. a, b, c, d
Long, D., Scanlon, B. R., Longuevergne, L., Sun, A. Y., Fernando, D. N., and Save, H.: GRACE satellite monitoring of large depletion in water storage in response to the 2011 drought in Texas, Geophys. Res. Lett., 40, 3395–3401, https://doi.org/10.1002/grl.50655, 2013. a
Minea, I. and Albulescu, A.-C.: Drought Over Time: an Investigation of the Impact of Meteorological Drought on Groundwater and Surface Water in the East of Romania, Earth Syst. Environ., 9, 1959–1981, https://doi.org/10.1007/s41748-025-00725-9, 2025. a, b, c
Mishra, V., Dangar, S., Tiwari, V. M., Lall, U., and Wada, Y.: Summer Monsoon Drying Accelerates India's Groundwater Depletion Under Climate Change, Earth's Future, 12, e2024EF004516, https://doi.org/10.1029/2024EF004516, 2024. a
Mu, M., De Kauwe, M. G., Ukkola, A. M., Pitman, A. J., Guo, W., Hobeichi, S., and Briggs, P. R.: Exploring how groundwater buffers the influence of heatwaves on vegetation function during multi-year droughts, Earth Syst. Dynam., 12, 919–938, https://doi.org/10.5194/esd-12-919-2021, 2021. a
Nazari, S., Reinecke, R., and Moosdorf, N.: Global estimates of groundwater withdrawal trends and uncertainties, Environ. Res. Lett., 20, 094043, https://doi.org/10.1088/1748-9326/adf6ca, 2025. a, b
Ndehedehe, C. E., Ferreira, V. G., Adeyeri, O. E., Correa, F. M., Usman, M., Oussou, F. E., Kalu, I., Okwuashi, O., Onojeghuo, A. O., Getirana, A., and Dewan, A.: Global assessment of drought characteristics in the Anthropocene, Resources, Environment and Sustainability, 12, 100105, https://doi.org/10.1016/j.resenv.2022.100105, 2023. a
Parry, S., Wilby, R., Prudhomme, C., Wood, P., and McKenzie, A.: Demonstrating the utility of a drought termination framework: prospects for groundwater level recovery in England and Wales in 2018 or beyond, Environ. Res. Lett., 13, 064040, https://doi.org/10.1088/1748-9326/aac78c, 2018. a
Pascale, S. and Ragone, F.: Widespread Multi-Year Droughts in Italy: Identification and Causes of Development, Int. J. Climatol., 45, e8827, https://doi.org/10.1002/joc.8827, 2025. a
Pascale, S., Kapnick, S. B., Delworth, T. L., and Cooke, W. F.: Increasing risk of another Cape Town “Day Zero” drought in the 21st century, P. Natl. Acad. Sci. USA, 117, 29495–29503, https://doi.org/10.1073/pnas.2009144117, 2020. a
Pascale, S., Kapnick, S. B., Delworth, T. L., Hidalgo, H. G., and Cooke, W. F.: Natural variability vs forced signal in the 2015–2019 Central American drought, Clim. Change, 168, 16, https://doi.org/10.1007/s10584-021-03228-4, 2021. a
Pauloo, R. A., Escriva-Bou, A., Dahlke, H., Fencl, A., Guillon, H., and Fogg, G. E.: Domestic well vulnerability to drought duration and unsustainable groundwater management in California's Central Valley, Environ. Res. Lett., 15, 044010, https://doi.org/10.1088/1748-9326/ab6f10, 2020. a
Pokhrel, Y., Felfelani, F., Satoh, Y., Boulange, J., Burek, P., Gädeke, A., Gerten, D., Gosling, S. N., Grillakis, M., Gudmundsson, L., Hanasaki, N., Kim, H., Koutroulis, A., Liu, J., Papadimitriou, L., Schewe, J., Müller Schmied, H., Stacke, T., Telteu, C.-E., Thiery, W., Veldkamp, T., Zhao, F., and Wada, Y.: Global terrestrial water storage and drought severity under climate change, Nat. Clim. Change, 11, 226–233, https://doi.org/10.1038/s41558-020-00972-w, 2021. a
Portmann, F. T., Siebert, S., and Döll, P.: MIRCA2000–Global monthly irrigated and rainfed crop areas around the year 2000: A new high-resolution data set for agricultural and hydrological modeling, Global Biogeochem. Cy., 24, 2008GB003435, https://doi.org/10.1029/2008GB003435, 2010. a
Rakovec, O., Samaniego, L., Hari, V., Markonis, Y., Moravec, V., Thober, S., Hanel, M., and Kumar, R.: The 2018–2020 Multi-Year Drought Sets a New Benchmark in Europe, Earth's Future, 10, e2021EF002394, https://doi.org/10.1029/2021EF002394, 2022. a, b
Richey, A. S., Thomas, B. F., Lo, M., Reager, J. T., Famiglietti, J. S., Voss, K., Swenson, S., and Rodell, M.: Quantifying renewable groundwater stress with GRACE, Water Resour. Res., 51, 5217–5238, https://doi.org/10.1002/2015WR017349, 2015. a
Rodell, M., Famiglietti, J. S., Wiese, D. N., Reager, J. T., Beaudoing, H. K., Landerer, F. W., and Lo, M.-H.: Emerging trends in global freshwater availability, Nature, 557, 651–659, https://doi.org/10.1038/s41586-018-0123-1, 2018. a
Rohde, M. M., Albano, C. M., Huggins, X., Klausmeyer, K. R., Morton, C., Sharman, A., Zaveri, E., Saito, L., Freed, Z., Howard, J. K., Job, N., Richter, H., Toderich, K., Rodella, A.-S., Gleeson, T., Huntington, J., Chandanpurkar, H. A., Purdy, A. J., Famiglietti, J. S., Singer, M. B., Roberts, D. A., Caylor, K., and Stella, J. C.: Groundwater-dependent ecosystem map exposes global dryland protection needs, Nature, 632, 101–107, https://doi.org/10.1038/s41586-024-07702-8, 2024. a
Ruijsch, D., Van Mourik, J., Biemans, H., Hauswirth, S. M., and Wanders, N.: Thrive or Wither: Exploring the Impacts of Multiyear Droughts on Vegetation, J. Geophys. Res.-Biogeo., 130, e2025JG008992, https://doi.org/10.1029/2025JG008992, 2025. a, b, c
Rusli, S. R., Bense, V. F., Mustafa, S. M. T., and Weerts, A. H.: The impact of future changes in climate variables and groundwater abstraction on basin-scale groundwater availability, Hydrol. Earth Syst. Sci., 28, 5107–5131, https://doi.org/10.5194/hess-28-5107-2024, 2024. a
Rust, W., Holman, I., Bloomfield, J., Cuthbert, M., and Corstanje, R.: Understanding the potential of climate teleconnections to project future groundwater drought, Hydrol. Earth Syst. Sci., 23, 3233–3245, https://doi.org/10.5194/hess-23-3233-2019, 2019. a
Saccò, M., Mammola, S., Altermatt, F., Alther, R., Bolpagni, R., Brancelj, A., Brankovits, D., Fišer, C., Gerovasileiou, V., Griebler, C., Guareschi, S., Hose, G. C., Korbel, K., Lictevout, E., Malard, F., Martínez, A., Niemiller, M. L., Robertson, A., Tanalgo, K. C., Bichuette, M. E., Borko, Å., Brad, T., Campbell, M. A., Cardoso, P., Celico, F., Cooper, S. J. B., Culver, D., Di Lorenzo, T., Galassi, D. M. P., Guzik, M. T., Hartland, A., Humphreys, W. F., Ferreira, R. L., Lunghi, E., Nizzoli, D., Perina, G., Raghavan, R., Richards, Z., Reboleira, A. S. P. S., Rohde, M. M., Fernández, D. S., Schmidt, S. I., Van Der Heyde, M., Weaver, L., White, N. E., Zagmajster, M., Hogg, I., Ruhi, A., Gagnon, M. M., Allentoft, M. E., and Reinecke, R.: Groundwater is a hidden global keystone ecosystem, Glob. Change Biol., 30, e17066, https://doi.org/10.1111/gcb.17066, 2024. a
Scanlon, B. R., Fakhreddine, S., Rateb, A., De Graaf, I., Famiglietti, J., Gleeson, T., Grafton, R. Q., Jobbagy, E., Kebede, S., Kolusu, S. R., Konikow, L. F., Long, D., Mekonnen, M., Schmied, H. M., Mukherjee, A., MacDonald, A., Reedy, R. C., Shamsudduha, M., Simmons, C. T., Sun, A., Taylor, R. G., Villholth, K. G., Vörösmarty, C. J., and Zheng, C.: Global water resources and the role of groundwater in a resilient water future, Nat. Rev. Earth Environ., 4, 87–101, https://doi.org/10.1038/s43017-022-00378-6, 2023. a
Schreiner-McGraw, A. P. and Ajami, H.: Delayed response of groundwater to multi-year meteorological droughts in the absence of anthropogenic management, J. Hydrol., 603, 126917, https://doi.org/10.1016/j.jhydrol.2021.126917, 2021. a, b, c
Siebert, S. and Döll, P.: Quantifying blue and green virtual water contents in global crop production as well as potential production losses without irrigation, J. Hydrol., 384, 198–217, https://doi.org/10.1016/j.jhydrol.2009.07.031, 2010. a
Sousa, P. M., Blamey, R. C., Reason, C. J. C., Ramos, A. M., and Trigo, R. M.: The “˜Day Zero” Cape Town drought and the poleward migration of moisture corridors, Environ. Res. Lett., 13, 124025, https://doi.org/10.1088/1748-9326/aaebc7, 2018. a
Sutanudjaja, E. H., van Beek, R., Wanders, N., Wada, Y., Bosmans, J. H. C., Drost, N., van der Ent, R. J., de Graaf, I. E. M., Hoch, J. M., de Jong, K., Karssenberg, D., López López, P., Peßenteiner, S., Schmitz, O., Straatsma, M. W., Vannametee, E., Wisser, D., and Bierkens, M. F. P.: PCR-GLOBWB 2: a 5 arcmin global hydrological and water resources model, Geosci. Model Dev., 11, 2429–2453, https://doi.org/10.5194/gmd-11-2429-2018, 2018. a, b, c
Taylor, R. G., Scanlon, B., Döll, P., Rodell, M., Van Beek, R., Wada, Y., Longuevergne, L., Leblanc, M., Famiglietti, J. S., Edmunds, M., Konikow, L., Green, T. R., Chen, J., Taniguchi, M., Bierkens, M. F. P., MacDonald, A., Fan, Y., Maxwell, R. M., Yechieli, Y., Gurdak, J. J., Allen, D. M., Shamsudduha, M., Hiscock, K., Yeh, P. J.-F., Holman, I., and Treidel, H.: Ground water and climate change, Nat. Clim. Change, 3, 322–329, https://doi.org/10.1038/nclimate1744, 2013. a, b
United Nations University – Institute for Environment and Human Security (UNU-EHS), Mena Benavides, M., Eberle, C., United Nations University – Institute for Environment and Human Security (UNU-EHS), Narvaez, L., and United Nations University – Institute for Environment and Human Security (UNU-EHS): Technical Report: Groundwater depletion, Tech. rep., United Nations University - Institute for Environment and Human Security (UNU-EHS), https://doi.org/10.53324/CUAA8911, 2023. a
Van Der Wiel, K., Batelaan, T. J., and Wanders, N.: Large increases of multi-year droughts in north-western Europe in a warmer climate, Clim. Dynam., 60, 1781–1800, https://doi.org/10.1007/s00382-022-06373-3, 2023. a, b, c
Van Dijk, A. I. J. M., Beck, H. E., Crosbie, R. S., De Jeu, R. A. M., Liu, Y. Y., Podger, G. M., Timbal, B., and Viney, N. R.: The Millennium Drought in southeast Australia (2001–2009): Natural and human causes and implications for water resources, ecosystems, economy, and society, Water Resour. Res., 49, 1040–1057, https://doi.org/10.1002/wrcr.20123, 2013. a, b
van Jaarsveld, B.: GLOBGM_CMIP6: A Global Hyper-Resolution Groundwater Dataset for Assessing Historical and Future Groundwater Dynamics Under Climate and Socioeconomic Change – [globgm_historical_reference_gswp3-w5e5], Utrecht University [data set], https://doi.org/10.24416/UU01-AKSHOX, 2025. a
van Jaarsveld, B., Wanders, N., Otoo, N. G., Sutanudjaja, E. H., Verkaik, J., Zamrsky, D., and Bierkens, M. F. P.: Global hyper-resolution modeling of historical and future groundwater dynamics, Earth Syst. Dynam., 17, 1201–1236, https://doi.org/10.5194/esd-17-1201-2026, 2026. a, b, c, d, e, f, g, h, i, j, k, l, m
Van Lanen, H. A. J., Wanders, N., Tallaksen, L. M., and Van Loon, A. F.: Hydrological drought across the world: impact of climate and physical catchment structure, Hydrol. Earth Syst. Sci., 17, 1715–1732, https://doi.org/10.5194/hess-17-1715-2013, 2013. a, b
Van Loon, A. F.: Hydrological drought explained, WIREs Water, 2, 359–392, https://doi.org/10.1002/wat2.1085, 2015. a
Van Loon, A. F., Kumar, R., and Mishra, V.: Testing the use of standardised indices and GRACE satellite data to estimate the European 2015 groundwater drought in near-real time, Hydrol. Earth Syst. Sci., 21, 1947–1971, https://doi.org/10.5194/hess-21-1947-2017, 2017. a
Van Mourik, J., Ruijsch, D., Van Der Wiel, K., Hazeleger, W., and Wanders, N.: Regional drivers and characteristics of multi-year droughts, Weather and Climate Extremes, 48, 100748, https://doi.org/10.1016/j.wace.2025.100748, 2025. a, b, c, d
Verkaik, J., Sutanudjaja, E. H., Oude Essink, G. H. P., Lin, H. X., and Bierkens, M. F. P.: GLOBGM v1.0: a parallel implementation of a 30 arcsec PCR-GLOBWB-MODFLOW global-scale groundwater model, Geosci. Model Dev., 17, 275–300, https://doi.org/10.5194/gmd-17-275-2024, 2024. a, b, c
Vicente-Serrano, S. M., Beguería, S., and López-Moreno, J. I.: A Multiscalar Drought Index Sensitive to Global Warming: The Standardized Precipitation Evapotranspiration Index, J. Climate, 23, 1696–1718, https://doi.org/10.1175/2009JCLI2909.1, 2010. a
Wada, Y. and Bierkens, M. F. P.: Sustainability of global water use: past reconstruction and future projections, Environ. Res. Lett., 9, 104003, https://doi.org/10.1088/1748-9326/9/10/104003, 2014. a
Wada, Y., Van Beek, L. P. H., Wanders, N., and Bierkens, M. F. P.: Human water consumption intensifies hydrological drought worldwide, Environ. Res. Lett., 8, 034036, https://doi.org/10.1088/1748-9326/8/3/034036, 2013. a
Wanders, N., Wada, Y., and Van Lanen, H. A. J.: Global hydrological droughts in the 21st century under a changing hydrological regime, Earth Syst. Dynam., 6, 1–15, https://doi.org/10.5194/esd-6-1-2015, 2015. a, b
Wang, S., Huang, S., Wang, C., Zhang, X., Wu, J., Gulakhmadov, A., Niyogi, D., and Chen, N.: Global anthropogenic effects on meteorological–hydrological–soil moisture drought propagation: Historical analysis and future projection, J. Hydrol., 653, 132755, https://doi.org/10.1016/j.jhydrol.2025.132755, 2025. a
Watkins, M. M., Wiese, D. N., Yuan, D., Boening, C., and Landerer, F. W.: Improved methods for observing Earth's time variable mass distribution with GRACE using spherical cap mascons, J. Geophys. Res.-Sol. Ea., 120, 2648–2671, https://doi.org/10.1002/2014JB011547, 2015. a
Wunsch, A., Liesch, T., and Broda, S.: Deep learning shows declining groundwater levels in Germany until 2100 due to climate change, Nat. Commun., 13, 1221, https://doi.org/10.1038/s41467-022-28770-2, 2022. a, b
Xie, Z., Huete, A., Restrepo-Coupe, N., Ma, X., Devadas, R., and Caprarelli, G.: Spatial partitioning and temporal evolution of Australia's total water storage under extreme hydroclimatic impacts, Remote Sens. Environ., 183, 43–52, https://doi.org/10.1016/j.rse.2016.05.017, 2016. a