the Creative Commons Attribution 4.0 License.
the Creative Commons Attribution 4.0 License.
 | 14 Jul 2025
A multi-model analysis of the decadal prediction skill for the North Atlantic ocean heat content
Teresa Carmo-Costa
Roberto Bilbao
Jon Robson
Ana Teles-Machado
Decadal predictions can skilfully forecast upper-ocean temperatures in many regions worldwide. The North Atlantic, in particular, shows high predictive skill for the ocean heat content (OHC). This multi-model study analyses eight CMIP6 climate models with comparable decadal prediction (Decadal Climate Prediction Project, DCPP) and historical (HIST) ensembles to document differences in North Atlantic (NA) upper-OHC skill and investigates the underlying causes. The decadal predictions consistently identify two main regions with high predictive capacity and added value of initialization: the Labrador Sea (LS) and the eastern North Atlantic. A region east of the Grand Banks (EGB) is also found to exhibit negative skill scores, with its extent and location varying widely across models, possibly due in part to observational uncertainties affecting both forecast verification and local initialization.
Special attention is given to the Labrador Sea and its surroundings, a region characterized by high inter-model spread in OHC prediction skill in both DCPP and HIST experiments. These differences hinder the identification of the relative contributions of external forcings and internal variability to local OHC predictability. To address this, we explore the relationship between the local OHC skill in the HIST ensemble and various mean-state properties in the Labrador Sea, revealing a strong link between the skill in those experiments and both the mean local surface fluxes and density stratification.
Benchmarking these mean-state properties against observations and reanalyses suggests that the multi-model mean likely offers the most realistic estimate of the forced signal, accounting for approximately 16 % of the total OHC variance in the Labrador Sea. These findings underscore the critical role of stratification and atmospheric forcing biases in shaping predictive skill and highlight the potential of multi-model ensembles to advance our understanding of decadal predictability.
- Article
(13571 KB) - Full-text XML
- BibTeX
- EndNote


The global oceans have absorbed approximately 93 % of the excess energy in the climate system over the recent decades (e.g. IPCC, 2021, and citations therein). This energy accumulation is commonly quantified by the ocean heat content (OHC), a vertically integrated variable that captures changes in heat storage within the ocean. Among the regions with significant warming, the North Atlantic (NA) ocean stands out for its pronounced increase in OHC within the upper 2000 m since the 1960s (e.g. Levitus et al., 2000, 2012; Palmer et al., 2007; Durack et al., 2018; Zanna et al., 2019; Johnson and Lyman, 2020). While the slow nature of past OHC changes provides a high degree of predictability, considerable uncertainty remains across observational products regarding their geographical distribution (e.g. Häkkinen et al., 2015; Palmer et al., 2017), which can limit their local predictive skill. This study aims to improve our understanding of the factors controlling OHC predictability in the NA.
The warming trends that the upper layers of the NA Ocean have experienced over the last 70 years can largely explained be by changes in anthropogenic forcings (e.g. Gleckler et al., 2012; Bilbao et al., 2019). However, the distribution of OHC trends is not geographically uniform, and some regions have exhibited considerable multidecadal variability (e.g. Carmo-Costa et al., 2021). While most of the NA Ocean has warmed, the centre of the subpolar North Atlantic (SPNA) has been subject to a long-term cooling trend (e.g. Johnson and Lyman, 2020) typically referred to as the NA warming hole (Drijfhout et al., 2012; Rahmstorf et al., 2015; Keil et al., 2020). This phenomenon has been primarily characterized using sea surface temperature (SST) observations. The main mechanism proposed to explain the cooling involves a reduction in northward heat advection, in turn responding to either a shift in the North Atlantic gyre circulation (Piecuch et al., 2017) or a weakening of the Atlantic Meridional Overturning Circulation (AMOC) (Drijfhout et al., 2012; Rahmstorf et al., 2015; Robson et al., 2016; Keil et al., 2020), with several studies suggesting that it emerged in response to the increasing greenhouse gas concentrations (Caesar et al., 2021), although other studies suggest that it can be explained by internal ocean variability (Bonnet et al., 2021b; Latif et al., 2022). It is also unlikely that the recent AMOC weakening has been caused by Greenland ice sheet melting (Devilliers et al., 2021).
Internal variability in the North Atlantic region at interannual to decadal timescales could also explain some of the regional changes in the OHC. The North Atlantic Oscillation (NAO) is an important driver of AMOC variability through its influence on Labrador Sea (LS) deep-water formation. Positive NAO phases enhance winter surface cooling and can thus help overcome the local vertical density stratification, promoting the occurrence of deep-ocean mixing events. In addition, interannual NAO variations are also known to force local OHC anomalies across the North Atlantic subpolar gyre mediated via changes in the surface buoyancy fluxes and wind stress (Oldenburg et al., 2021). An illustrative example was the record-breaking cold anomaly that the central SPNA experienced in spring 2015 (commonly referred to as the Cold Blob; Yeager et al., 2016; Josey et al., 2018), emerging in response to exceptionally rare (both in terms of magnitude and persistence) positive NAO conditions (Yeager, 2020; Maroon et al., 2021), which enhanced local heat loss. This extremely cold central SPNA state has been linked to the occurrence of a major heatwave in central Europe in the summer of 2015 (Mecking et al., 2019). Likewise, the broader North Atlantic region exhibits significant multidecadal variability, which is particularly prominent in sea surface temperatures, but also affects the OHC (Moat et al., 2024). These variations have been linked to numerous climate impacts, including the intensity and frequency of Atlantic hurricane activity and Sahel rainfall (Balaguru et al., 2018; Buckley and Marshall, 2016; Zhang and Delworth, 2006), and to hydroclimate and temperature conditions in North America and Europe (Enfield et al., 2001; Sutton and Hodson, 2005; Kwon et al., 2020; Josey et al., 2018).
Understanding the causes of the regional OHC changes in the North Atlantic, by disentangling the contributions from internal and externally forced variability and the underlying uncertainties, is therefore crucial for better anticipating how the climate will evolve in the coming years. There are two major types of simulations within the Climate Model Intercomparison Project phase 6 (CMIP6; Eyring et al., 2016) initiative that can be jointly used to understand the contributions of external forcings and internal variability processes to the recent climate evolution and to understand the sources of predictability of the North Atlantic’s ocean–atmosphere system (Meehl et al., 2014): historical simulations and decadal predictions. Historical experiments are transient simulations that typically branch off from a preindustrial control run and are driven by time-evolving radiative forcings representative of the observed historical evolution of greenhouse gas concentrations, volcanic and anthropogenic aerosols, and solar variability. By design, they are used to investigate how the Earth system has responded to recent changes in external forcings and to evaluate the models’ mean-state performance against observations (Eyring et al., 2016). To robustly extract the externally forced response, large ensembles of historical simulations are often employed, as they sample a wide range of internal variability states whose climate effects largely cancel out in the ensemble mean (Milinski et al., 2020). Decadal climate predictions performed under the Decadal Climate Prediction Project (DCPP; Boer et al., 2016) also use the same historical forcings but are additionally initialized by assimilating observations to align the model's internal state with that of the real world. This initialization step is crucial for tapping, in theory, into the predictability arising from internal variability sources. The standard approach to assess predictive skill involves performing ensembles of 10-year-long retrospective predictions, initialized annually from 1960 to the present, in order to evaluate whether the predicted trajectories align with the observed ones at different forecast lead times.
Previous studies have shown that decadal prediction systems can skilfully predict the NA Ocean's variability for both SST and OHC (e.g. Keenlyside et al., 2008; Pohlmann et al., 2009; Robson et al., 2012; Mignot et al., 2016; Kröger et al., 2018; Borchert et al., 2018; Robson et al., 2018; Yeager et al., 2018; Bilbao et al., 2021; Volpi et al., 2021; Carmo-Costa et al., 2021; Polkova et al., 2023), along with other related variables such as the NAO (Athanasiadis et al., 2020; Smith et al., 2020) or the Atlantic Multidecadal Variability (AMV) (Doblas-Reyes et al., 2013; Volpi et al., 2017; Borchert et al., 2018; Delgado-Torres et al., 2022), and that initialization has a positive impact on the predictive skill. However, there are both qualitative and quantitative differences across decadal prediction systems when it comes to predictability time range, areas with significant predictive capacity, and magnitude of the associated skill. Several multi-model studies have shown how different model biases in the Labrador Sea, from near-surface densities (Menary and Hermanson, 2018), upper-ocean mean stratification (Ortega et al., 2021; Kim et al., 2023a), or local co-variability between temperature and salinity (Menary et al., 2015), can degrade important aspects of the North Atlantic decadal variability, including its predictability. Furthermore, model drifts and initial shocks have been shown to impact the quality of decadal climate predictions (Kröger et al., 2018; Polkova et al., 2019; Bilbao et al., 2021), although it remains unclear whether anomaly initialization methods, specifically designed to minimize such drifts, provide real predictive advantages over traditional full-field initialization approaches (Smith et al., 2013; Hazeleger et al., 2013; Volpi et al., 2017; Kröger et al., 2018; Polkova et al., 2023). Understanding the differences in skill across models, particularly the factors that control and enhance the regional predictability, is essential to informing and improving the next generation of decadal prediction systems.
The concrete goal of this study is to assess the predictive skill of the upper 700 m OHC in the North Atlantic using decadal prediction systems and historical simulations from CMIP6, also exploring the processes and methodological factors behind the inter-model differences. In particular, we investigate the relative role of external forcings in the predictive skill and how it varies regionally. We also examine whether some skill limitations or improvements can be associated with specific methodological choices, such as the initialization strategy and model resolution considered. A special focus is placed on the Labrador Sea OHC, where models show important differences in predictive skill, to evaluate the impact of several local drivers and preconditioners on the skill. This paper is organized as follows: Section 2 describes the observational products, models, and simulations used; the criteria for the final ensemble selection; and some data processing considerations. Sect. 3.1, 3.2, 3.3, and 3.4 present the results in four separate scientific blocks: (i) a multi-model evaluation of the upper-OHC skill in the NA Ocean to assess the consistency of the results across models and identify outlier behaviours and regions of interest; (ii) a deeper investigation of the role of external forcings and long-term trends in the upper-OHC skill in the Labrador Sea (identified in i as a region of interest for its large inter-model differences); (iii) an inter-model comparison of key Labrador Sea mean-state model properties that could potentially condition the local OHC variability and skill; and (iv) an analysis of how those model properties affect the inferred predictive role of external forcings on Labrador Sea OHC variability, introducing some observational references to constrain the inter-model uncertainty. The final section summarizes the main results and discusses them in light of previous studies.
This analysis considers both historical (named HIST hereafter) and DCPP component A (Boer et al., 2016) retrospective decadal prediction ensembles of the CMIP6 initiative to explore the effects of external forcings and internally generated variability on the observed OHC variability and the ability of current climate models to predict it. We will focus on the OHC in the upper 700 m (referred to as OHC700 hereafter) and the main preconditioners and large-scale drivers of its regional variability and predictability, paying special interest to the major inter-model differences.
2.1 Climate model selection
The model selection was based on three criteria: (1) both the HIST and DCPP experiments were available via the Earth System Grid Federation (ESGF) portal for each model; (2) both the HIST and DCPP experiments were driven with the CMIP6 external forcings to ensure complete consistency in the forced signals; and (3), in both sets of experiments, the relevant output variables for our analyses, such as 3D salinity (so in CMIP convention), 3D potential ocean temperature (thetao), 2D sea level pressure (psl), downward surface heat fluxes (hfds), and sea ice concentration (siconc), were available at monthly frequency for the period 1960–2014 (which is their overlap period). Also, except for two justified exceptions (details below), models with fewer than 10 ensemble members for HIST and/or DCPP were excluded. A total of 8 AOGCMs were retained based on the selection criteria. For models that provided more than 10 ensemble members, in either the HIST or DCPP experiments, only 10 members were retained to maximize the consistency across models. By default, we took members r1–10, except for EC-Earth3 historical simulations, for which we used 10 members performed at the BSC (i.e. r2, r7, r12, r17–22, r24). This ensemble size is the minimum that is recommended for the DCPP-A protocol in (Boer et al., 2016) and is the most common ensemble size across the models considered. Both HadGEM3-GC31-MM and MPI-ESM1-2-HR contributed with fewer than 10 ensemble members (4 HIST members and 5 DCPP members, respectively), but, since both have comparatively higher horizontal resolution (0.25° and 0.4°, respectively), they were included to assess if there is any added value, either in process representation or predictive skill, when horizontal resolution is increased. More details on the models considered in this analysis and their characteristics can be seen in Table 1.
Swart et al. (2019)Cherchi et al. (2019); Nicolì et al. (2023)Bilbao et al. (2021); Döscher et al. (2022)Sellar et al. (2020); Kay et al. (2022)Bonnet et al. (2021a)Müller et al. (2018); Li et al. (2019)Yukimoto et al. (2019)Bethke et al. (2021)Table 1Summary of key features in the AOGCMs used in this study.
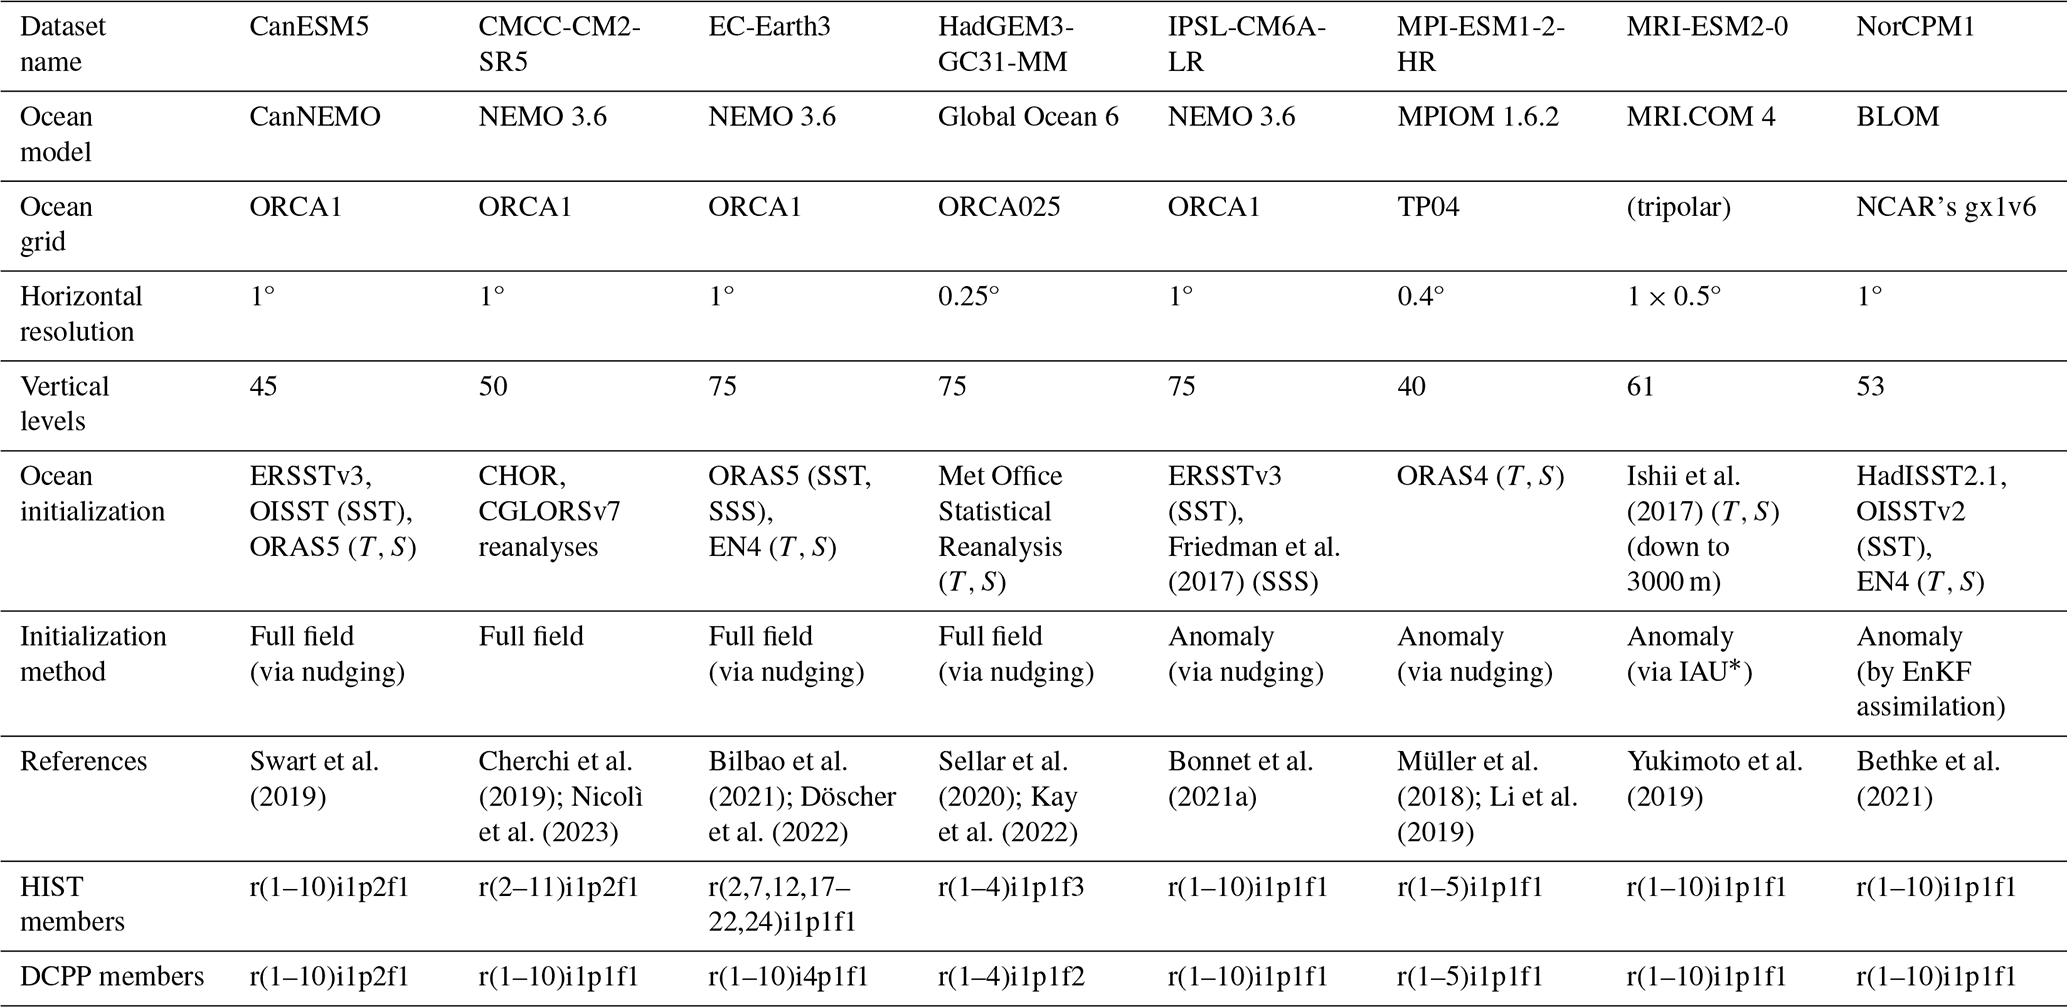
* IAU: incremental analysis updates.
2.2 Verification datasets
We used the EN4 version 2.2 ocean temperature and salinity objective analysis dataset based on optimal interpolation (Good et al., 2013) to evaluate the predicted OHC700 and the ocean stratification. Three ocean reanalyses (ECDA3.1 (Chang et al., 2013), ORAS4 (Balmaseda et al., 2013), ORAS5 (Zuo et al., 2019)), the same used in Carmo-Costa et al. (2021), were additionally considered and compared with EN4 to identify the regions with high and low OHC700 observational uncertainty (Fig. A1).
To understand the processes driving local OHC700 skill, we analysed additional variables, such as sea level pressure, surface heat fluxes, and sea ice concentration. To determine how realistically the systems simulate these variables, we compared them with other observationally based datasets. For the atmospheric variables, we used the global atmospheric reanalysis ERA5 (Hersbach et al., 2020), as it provides a complete and physically coherent description of recent atmospheric variability that is constrained by observations. These include monthly sea level pressure fields (necessary to compute the NAO) and net surface heat fluxes (derived from thermal radiation, surface solar radiation, surface sensible heat flux, and surface latent heat flux). Finally, to evaluate the sea ice concentration, we used the monthly fields of HadISST.2.2.0.0 (Titchner and Rayner, 2014), hereinafter simply HadISST.
2.3 Data pre-processing
Data from both models and verification products were regridded to a common regular 1°×1° resolution grid. All model outputs were regridded using the Earth System Model Evaluation Tool (ESMValTool; Righi et al., 2020) versions 2.4.0 to 2.7.0, which was particularly useful for its ability to process all models, experiments, start dates, and variables in a consistent way. For other pre-processing tasks that were less computationally intensive, such as the calculation of yearly averages or the regridding of the ERA5 reference data, the Climate Data Operators tool version 1.9.10 (https://mpimet.mpg.de/cdo, last access: 9 July 2025) was preferred. Additionally, we used ESMValTool to compute the OHC700 and potential density anomaly (σ; computed for the reference level of 1000 m). The post-processed outputs were then analysed with the s2dverification/s2dv package (Manubens et al., 2018; Guemas et al., 2019) for R software and Python scripts that were developed purposely for this research. Both the NAO and the linear regression analysis were also computed with s2dverification/s2dv.
2.4 Forecast verification
To evaluate the forecast quality of the models, we used the anomaly correlation coefficient (ACC). The statistical significance of ACC differences was assessed following the methodology proposed by Siegert et al. (2017), a statistical test developed for cases where competing forecasting systems are strongly correlated with one another.
An important aspect to consider when comparing predictive skill between a DCPP experiment and its HIST counterpart is the selection of a common period for forecast evaluation, to ensure that differences in skill only arise from the effect of initialization (as prediction skill can be sensitive to the evaluation period). Our evaluation period is fixed and starts in 1970 – the first year for which the DCPP ensemble provides predictions for the full forecast range (1st to 10th year) – and finishes in 2014, which is the last year covered by the HIST ensemble. Linear trends in our analysis were also computed for this same period.
Not all models in this analysis were initialized in the same month. One model was initialized on 1 October (NorCPM1), several were initialized on 1 November (CMCC-CM2-SR5, EC-Earth3, HadGEM3-GC31-MM, MPI-ESM1-2-HR, and MRI-ESM2-0), and the others were initialized on 1 January (CanESM5 and IPSL-CM6A-LR). Therefore, for practical reasons, in all models, we computed all forecast years (FY1–10) from January through December, discarding the first months from those models initialized in October and November. Additionally, we computed the boreal winter mean (defined from December to February, referred to as DJF hereafter), which is important for some of the processes and drivers investigated (such as the NAO). The forecast winters were numbered according to their January and February forecast years, which means that, for example, DJF2 refers to the winter that includes the December month of FY1 but months January and February of FY2. We discarded DJF1 from all analyses, since some systems do not fully predict the first winter (as it requires December of FY0).
3.1 Multi-model OHC700 skill assessment
We firstly evaluate the ACC for OHC700 in all the prediction systems for three different forecast times (years 2, 5, and 10) and in all the historical ensembles. Overall, all decadal prediction systems show positive correlations for most of the NA at all the different forecast ranges (Fig. 1, columns 1–3), with higher correlations typically taking place in the Labrador Sea and along the eastern flank of the basin and negative correlations developing in a region located east of the Grand Banks (EGB; approx. 40–55° N and 40–25° W, with small regional differences across models). We note that, over the EGB region, the ocean reanalyses and EN4 show the highest discrepancies in terms of OHC variability (Fig. A1); therefore the associated skill scores are expected to be more uncertain and should be interpreted with caution. We also note that no systematic overall improvement at any forecast time is observed for systems based on full-field initialization compared to those using anomaly initialization, and vice versa (first 4 rows vs. last 4 rows in Fig. 1). The ACC patterns for HIST are generally close to those in the predictions, although with a tendency for more widespread negative correlations and lower positive correlation values than in the predictions. The largest added value of initialization, as indicated by the ACC differences between the DCPP and HIST ensembles, is found predominantly in the subpolar gyre region (Fig. A2). Residual correlations, introduced by (Smith et al., 2019), help to more clearly identify regions where initialization is beneficial for prediction. These correlations (Fig. A3) reveal another area with a strong added value of initialization in the eastern North Atlantic. However, this result should be interpreted with caution, as residual correlations assume that models accurately represent the forced signals in observations – an assumption that may not hold in regions where the HIST ensemble exhibits high inter-model differences.
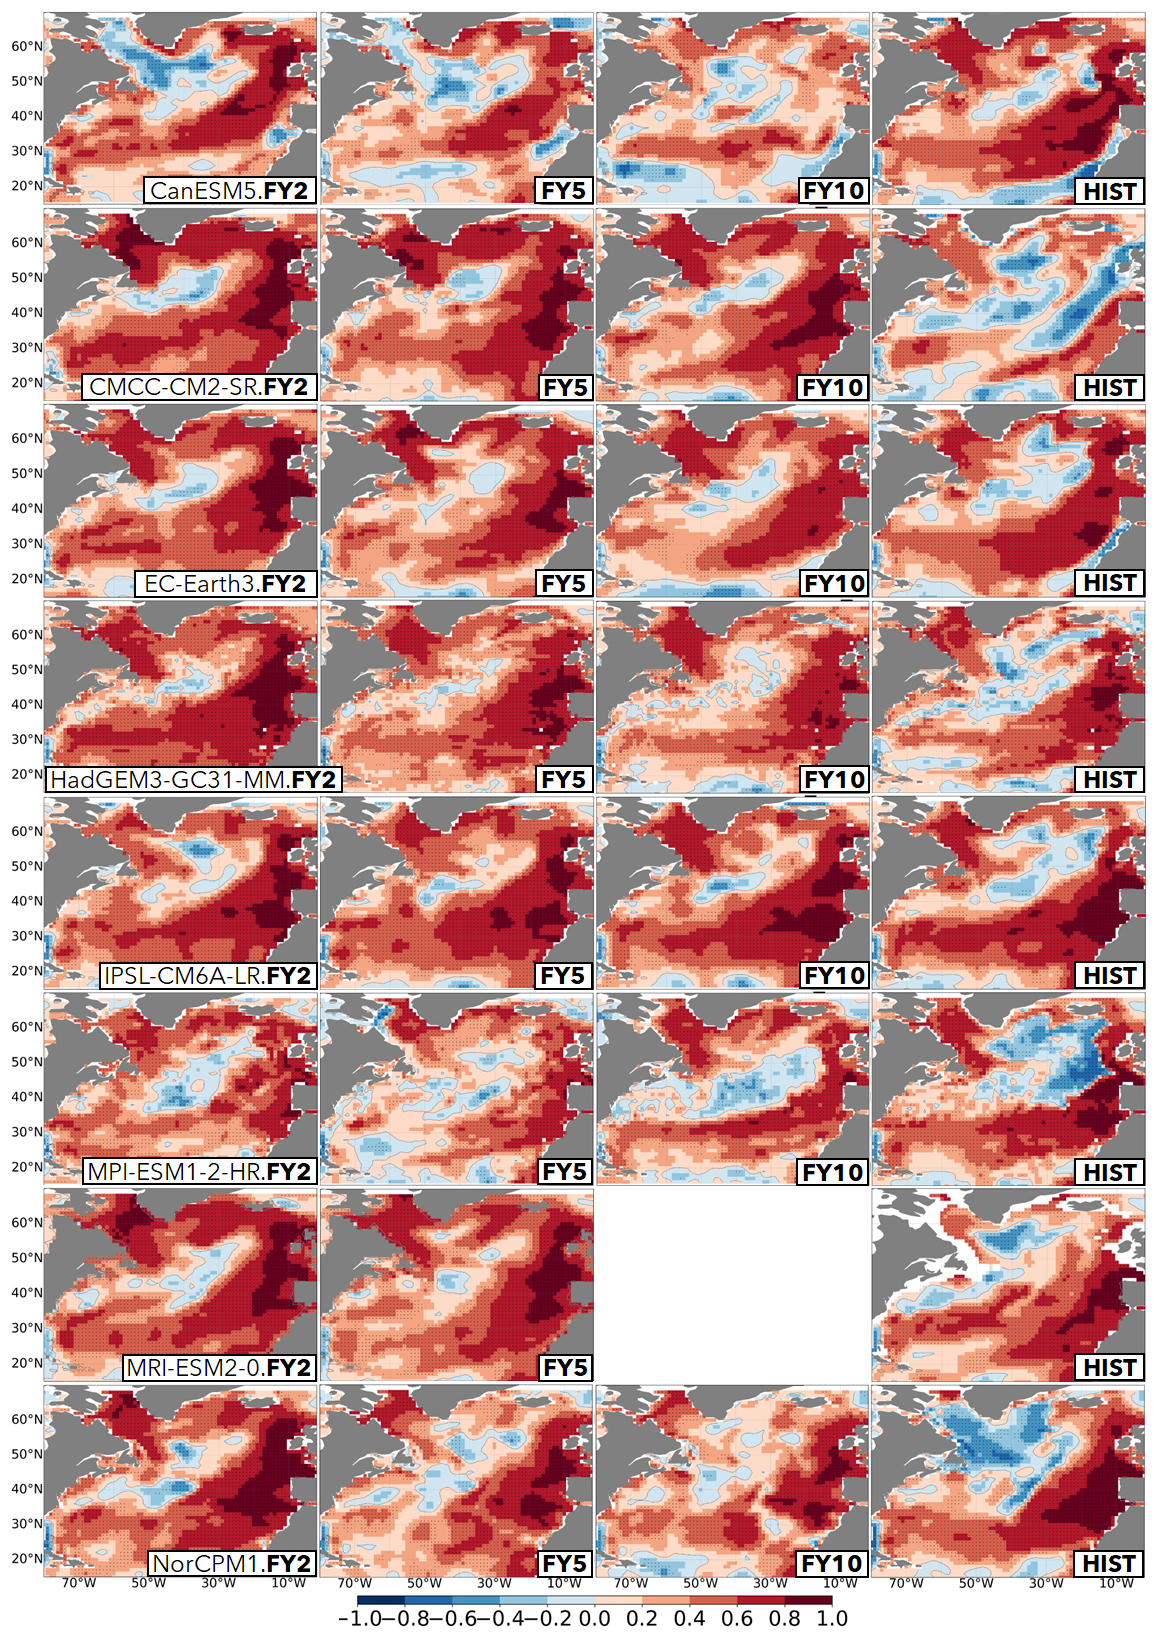
Figure 1ACC maps for the OHC700 in the DCPP (forecast years 2, 5, and 10; columns 1–3, respectively) and HIST ensembles (column 4). Stippling indicates cells with correlation values statistically significant at the 95 % confidence level. All ACC values are evaluated against EN4 for the period 1970–2014. Each row shows the results for a different model.
We now turn our attention to some specific cases of distinct individual model behaviour in Fig. 1. While, in most models, ACC values tend to be highest in FY2 and usually decrease as the FY progresses, as expected due to the effect of initialization, this is not the case for IPSL-CM6A-LR and CanESM5. In both models, ACC is higher in FY5 and even FY10 than in FY2 over the Labrador Sea (LS) and the EGB region. The comparatively lower skill in FY2 than in subsequent forecast years for IPSL-CM6A-LR and CanESM5 might be caused by a strong initialization adjustment, as their historical ensembles show comparatively higher ACC values than the DCPP at FY2. Another system showing a rapid loss of skill in the LS and EGB regions is NorCPM1, where negative correlations emerge by FY5 and FY10. In this case, it might reflect a deficiency in the representation of the forced signals, which could be related to a reported problem in the transient land-use specification in North America, with downstream impacts in the subpolar North Atlantic area (Bethke et al., 2021; Passos et al., 2023). Its HIST ensemble has a large area of negative skill values over the LS and its surroundings. Interestingly, in this same region, NorCPM1 predictions show the highest levels of skill at FY2, which suggests that initialization can temporarily correct the errors in the land-use forcing.
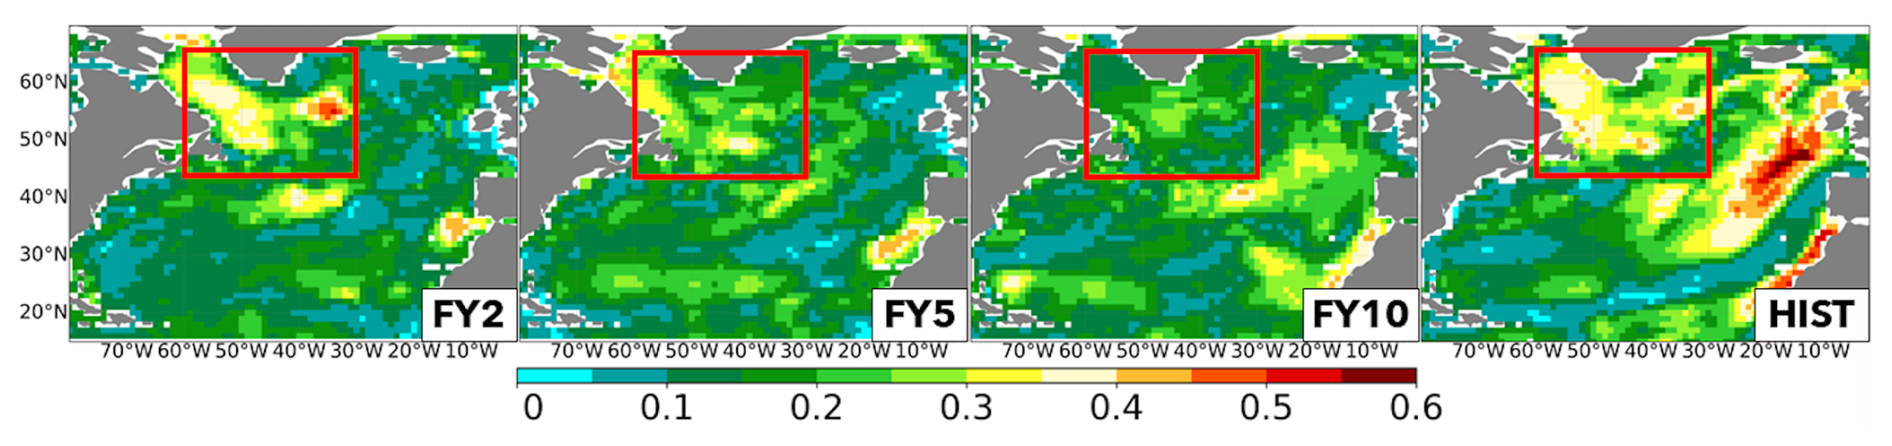
Figure 2Standard deviation across models of the ACC values for OHC700 in DCPP (forecast years 2, 5, and 10; columns 1–3, respectively) and HIST ensembles (column 4). The red box encloses the Labrador Sea region, chosen to compute all area-weighted averages mentioned hereinafter, with boundary coordinates 45–65° N and 60–30° W.
Figure 2 describes the inter-model differences in ACC shown in Fig. 1, as diagnosed by the standard deviation of the ACC values across models. The HIST experiments have higher ACC spread than the DCPP experiments over most of the NA at all forecast years. The largest standard deviation values (and thereby inter-model differences) are found for HIST along the eastern North Atlantic (up to 0.6) and in the LS (up to 0.4). In the DCPP experiments, the inter-model spread tends to change with forecast year, without much spatial consistency in terms of the regions with the largest standard deviations. The LS (red rectangle in Fig. 2; 45–65° N and 60–30° W.) emerges as a region in which inter-model differences in skill are prominent at all forecast times. We note that the selected box extends into the Irminger Sea, which also shows important inter-model spread. We also note that this is a characteristic region of deep vertical mixing, with common precursors and drivers whose representation may vary across models, and could explain the inter-model spread. Hence, in the rest of the study, we will focus on this region to understand its inter-model differences in OHC skill.
3.2 Role of forcings and long-term trends in Labrador Sea OHC skill
To better understand the differences in skill, the predicted and observed evolutions of LS OHC700 anomalies are shown in Fig. 3. At FY2 and FY5, all systems but CanESM5 predict the observed evolution reasonably well, characterized by a very weak cooling trend until the mid-90s, after which a warming trend starts to unfold. CanESM5's long-term trend is characterized by a cooling, completely failing to represent the warming after the 90s. This could be related to the use of ORAS5 for initialization (Sospedra-Alfonso et al., 2021), which has been reported to have non-stationary trends in the region (Tietsche et al., 2020). At longer forecast times (FY10), all models except CanESM5 and NorCPM1 simulate a long-term warming trend of similar amplitude to the observed one, although none of the models capture the relative cooling well between 1990–1995.
Interestingly, in the HIST ensemble, only two models, IPSL-CM6A-LR and CanESM5, simulate a clear warming trend consistent with the observed one. The other models show a rather flat evolution, and NorCMP1 shows a cooling trend. We also note that none of the HIST ensembles simulate the cooling until the mid-90s or the subsequent rapid warming partly captured by the DCPP experiments, supporting a key role of initialization in the decadal variability around the trend.
Figure 4 shows that the relationship between the OHC700 trends (as derived for the period 1970–2014; see Sect. 2.4) and the OHC700 skill in the LS is largely linear across models. In other words, models with stronger OHC700 trends in the LS tend to have higher OHC700 skill in this region, which is particularly evident in the HIST ensemble and in the first forecast years of the DCPP ensemble, although with some notable differences. While, for HIST, all the models show a wide range in the magnitudes of the simulated trends, in the first forecast years of the DCPP ensemble, all models predict similar trends to the observed one, except for CanESM5, which has previously been mentioned as an outlier. This clear correction of the predicted trend via initialization can imply that (1) the observed LS trend is only driven by internal variability processes or that (2) external forcings contribute to the trend but require realistic background climate conditions – achieved through initialization – to represent it accurately. Interestingly, predicting the trend well does not always lead to high levels of OHC700 skill, as noted for IPSL-CM6A-LR at FY2 in Fig. 4.
To further investigate the impact of the long-term trends on the OHC700 skill in the LS, Fig. 5 portrays the ACC values as a function of FY when both DCPP and the observed data are linearly detrended (dashed blue line) and compares them with the skill for the original time series (solid blue line). In all models, except for CanESM5, the forecast skill systematically decreases when the trend is removed, even though the drop in skill is not always significant with respect to the un-detrended ACC values (red crosses in Fig. 5). This confirms that an important part of the skill comes from the representation of the trend. Figure 5 also shows the forecast skill of the HIST ensemble, which, compared with the DCPP skill, can inform us about the predictive role of the forcings. The results are largely model-dependent. In some systems, HIST and DCPP have similar ACC values that are only significantly different in the first FYs, which suggests a predominantly forced origin of the skill. Other models, like MRI-ESM2-0, HadGEM3-GC31-MM, and CMCC-CM2-SR5, show high and significant ACC values for DCPP, while, for HIST, the ACC values are indistinguishable from zero. The interpretation of these latter systems is more complex, as the high predictive value of initialization could imply that internal variability is the dominant factor leading to the OHC700 skill, but it is also possible that the corresponding HIST ensembles simulate an unrealistic, externally forced variability that is largely corrected via initialization. It is also possible that external forcings exert only a prominent role in OHC predictability for some specific areas within the wide Labrador Sea box considered. Indeed, all models but NorCPM1 show positive skill for their historical ensemble in the westernmost part of the region and poorer skill on its easternmost side (Fig. 1).
Figure 5 thus illustrates how the large uncertainties in the representation of the forced signals, together with the initialization shocks in some of the systems (CanESM5, EC-Earth3, IPSL-CM6A-LR), prevent us from learning about the true origin of the LS OHC700 predictability. The underlying problem is that we do not know how much of the observed variability is actually driven by the forcings. In the next two sections (3.3 and 3.4), we will explore (i) how different precursors and drivers of LS decadal variability are represented across models and experiments to ultimately investigate (ii) whether they can explain some of the inter-model differences in the forced LS OHC700 predictive skill.
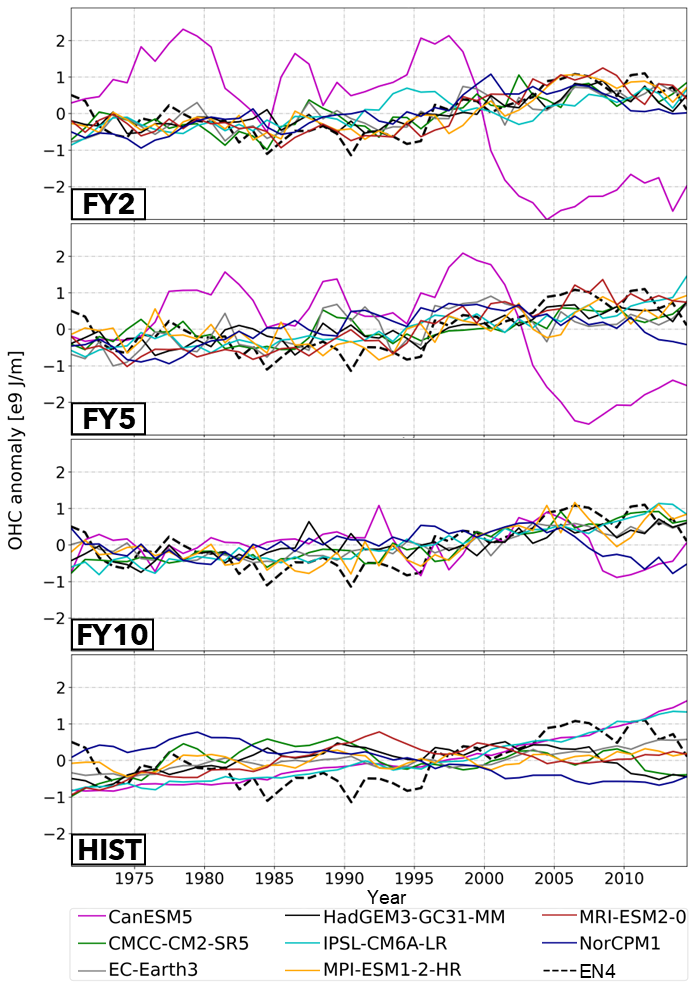
Figure 3Time series of the spatially averaged OHC700 anomalies in the Labrador Sea region (red box in Fig. 2), for the DCPP (forecast years 2, 5, and 10) and HIST ensembles. The corresponding time series for EN4 observations is added as a dashed line.
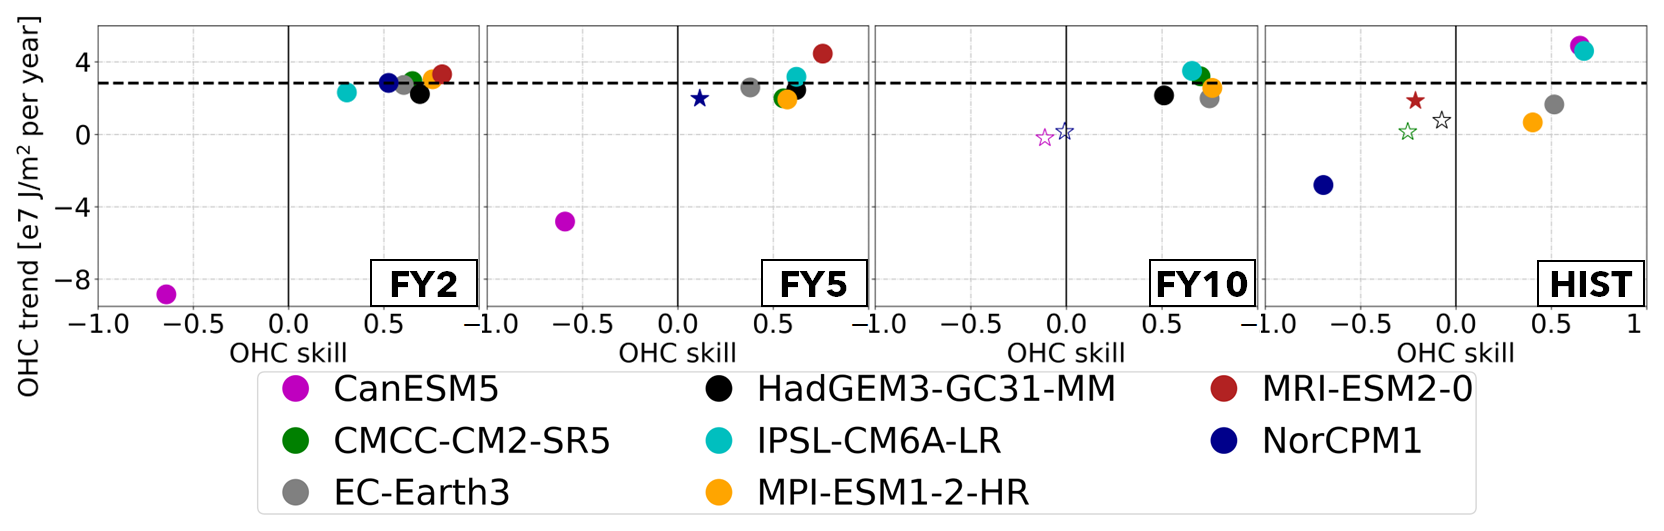
Figure 4Scatter plot of the relationship between the skill of OHC in the Labrador Sea region (red box in Fig. 2) and the local OHC700 trend in both the DCPP (forecast years 2,5, and 10; columns 1–3, respectively) and HIST ensembles (column 4), all based on yearly averages. All trends were computed for the period of interest, 1970–2014 (see Sect. 2.4 for more information). Stars represent non-significant correlation values at the 95 % confidence level. Empty symbols represent non-significant trend values at the 95 % confidence level. The dashed black horizontal line represents the trends for EN4 observations.
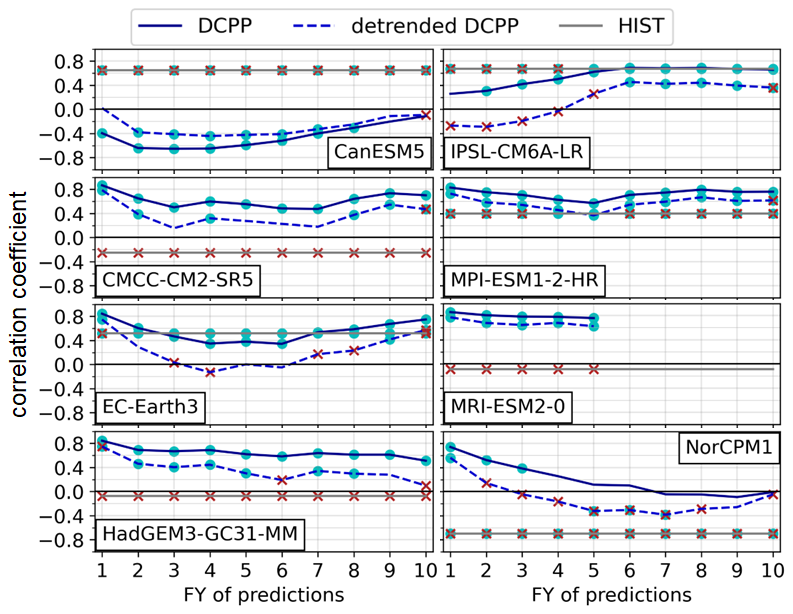
Figure 5ACC of the spatially averaged OHC700 in the Labrador Sea (red box in Fig. 2) as a function of FY. Skill values are shown for the DCPP (blue lines) and HIST (grey lines) ensembles and are evaluated against EN4. In DCPP, skill is also computed after detrending both the forecast anomalies and the EN4 anomalies (detrended DCPP; dashed blue lines). Cyan dots indicate ACC values that are significantly different from zero at the 95 % confidence level. Red crosses indicate that the HIST or the detrended DCPP ACC values are significantly different from the DCPP values. We note that ACC values are constant for HIST at all forecast years, since the evaluation period is fixed for their computation.
3.3 Evaluation of main preconditioners and drivers of LS OHC700 variability across models
In this section, we explore the underlying differences across models of two important factors controlling Labrador Sea temperature variability: (1) LS stratification and (2) surface atmospheric forcing. The former is a preconditioning factor for the occurrence of deep convection in the region, whereas the latter is a direct driver of convection and OHC variability via its influence on local air–sea heat fluxes. We note, however, that these factors can also interact with each other. For instance, in strongly stratified models where deep convection is suppressed, atmospheric forcing may instead lead to sea ice formation. In the following, we will evaluate how models simulate these important processes and whether they are improved via initialization.
3.3.1 The preconditioning role of density stratification
It is well known that the LS is an important region where oceanic processes, such as deep-ocean convection, can drive large-scale ocean temperature changes (Robson et al., 2016; Ortega et al., 2021). It is, however, less clear if these processes influence the local OHC skill or if OHC persistence is the dominant factor (Buckley et al., 2019). Some prediction systems, like the one based on EC-Earth3, show high OHC predictive skill in the NA even after LS convection collapses due to initialization effects (Bilbao et al., 2021), which suggests that other processes besides the local deep mixing might also be relevant.
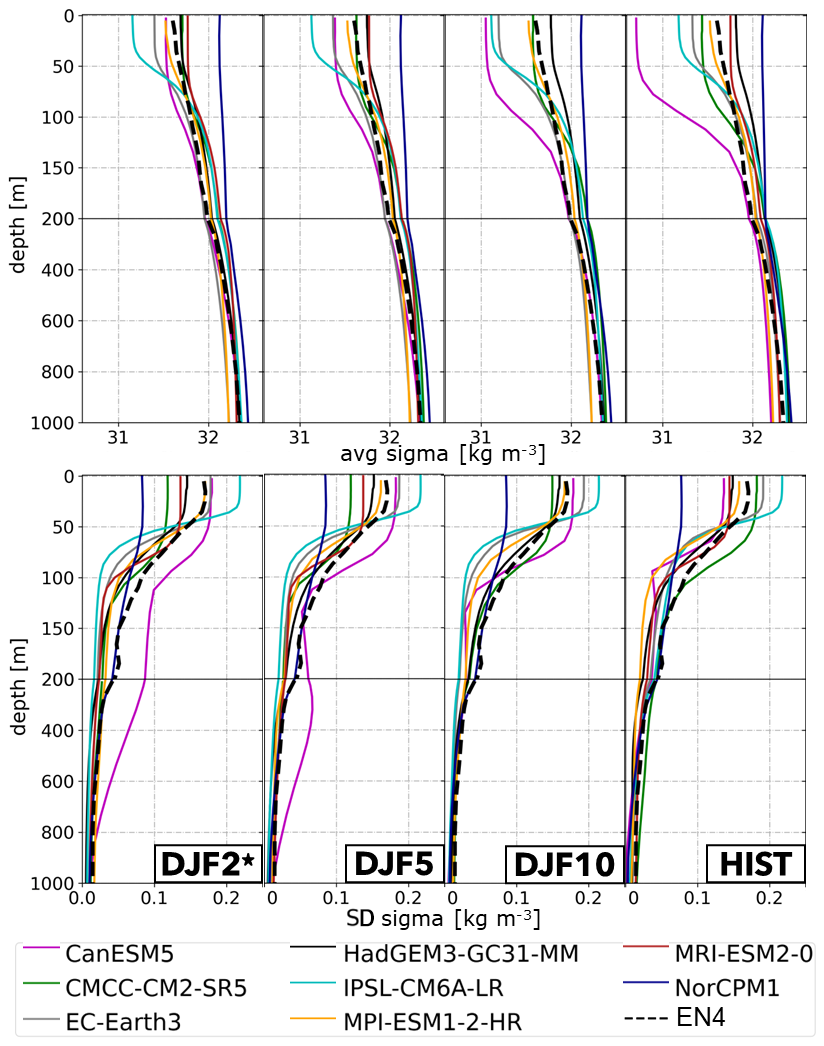
Figure 6Top: mean-state climatology of the spatially averaged LS potential density anomaly in DJF (referred to 1000 m; sigma1) as a function of depth. The observational reference EN4 is included as a dashed black line. From left to right, it shows the results for the DCPP (in forecast winters DJF2, DJF5, and DJF10) and HIST (in DJF) ensembles over the period 1970–2014. Bottom: the same as in the top row but for the standard deviation in time of the spatially averaged LS potential density anomaly.
In the LS, deep convection takes place in winter (Yashayaev and Loder, 2016), when the local cooling exerted by the atmosphere can be strong enough to overcome the local density stratification, which acts as a preconditioner. Important model biases in density stratification can therefore potentially mitigate and even suppress deep-ocean convection and in this way limit the forecast skill, especially in anomaly initialized systems in which potential model biases are not corrected during initialization.
Figure 6 shows the climatological wintertime (DJF) potential density profiles for the LS area in DCPP and HIST. The HIST panel, which describes the intrinsic mean–model biases, shows that IPSL-CM6A-LR, EC-Earth3, and especially CanESM5 have overly stratified LS densities, as compared to EN4, while NorCPM1 stands out as a model with virtually no LS density stratification. These are two opposite problems that interestingly seem to arise from biases in the salinity profile (bottom panel of Fig. A4). When looking into the DCPP experiments, NorCPM1 still shows the overly weak LS stratification. In contrast, full-field initialization seems to efficiently correct the strong stratification problems, especially in CanESM5, although in EC-Earth3 stratification is degraded in DJF10 compared to HIST, likely due to the initialization shock reported in Bilbao et al. (2021).
We now revisit the potential density profiles but focusing on how differently the models represent the temporal variations at different levels, as these can reveal other important model biases affecting the vertical mixing. NorCPM1 and IPSL-CM6A-LR portray the largest differences with respect to EN4 for both DCPP and HIST (bottom panel of Fig. 6), particularly near the surface, where the variance is higher due to the exchanges with the atmosphere. NorCPM1 shows substantially weaker variability at the surface, while IPSL-CM6A-LR shows the largest variability. This might derive from their radically different mean winter stratification (top panel of Fig. 6). In NorCPM1, the very weak stratification ensures a rather sustained mixing, which damps the year-to-year variability. In contrast, in IPSL-CM6A-LR, stratification is relatively strong, favouring a mixing that is much too intermittent. There is no clear benefit from initialization in the variability profiles for most models. In fact, initializing the models seems to worsen the density variability for CanESM5 in DJF2-DJF5, which can again be linked to the non-stationarity errors inherited from ORAS5.
Next, we will explore whether the differences in stratification can condition the local forcing from the atmosphere.
3.3.2 The North Atlantic Oscillation as a key driver of LS variability
Many studies have highlighted the key driving role of the NAO on the interannual variability in LS temperature, salinity, and convection (e.g. Eden and Jung, 2001; Guemas and Salas, 2008; Ortega et al., 2012; Yashayaev and Loder, 2016) and, through it, on the AMOC; however, to our knowledge, no study to date has explored whether and how structural model differences in the representation of the NAO affect the local air–sea heat exchanges.
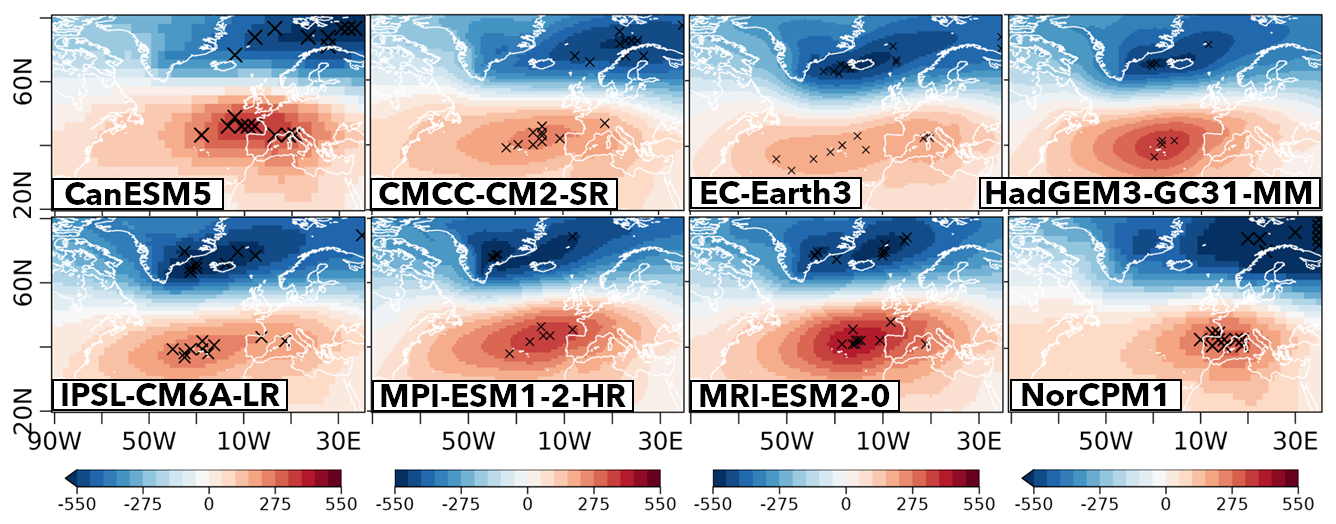
Figure 7Spatial patterns of the NAO (as described by the first EOF of DJF sea level pressure) in the different HIST ensembles. The EOF is computed with all individual model members concatenated in time. Each cross represents the positive and negative centres of action (defined at the place where the NAO pattern attains its maximum and minimum sea level pressure anomalies) when the EOF is computed individually for each member, thus indicating the intra-model spread.
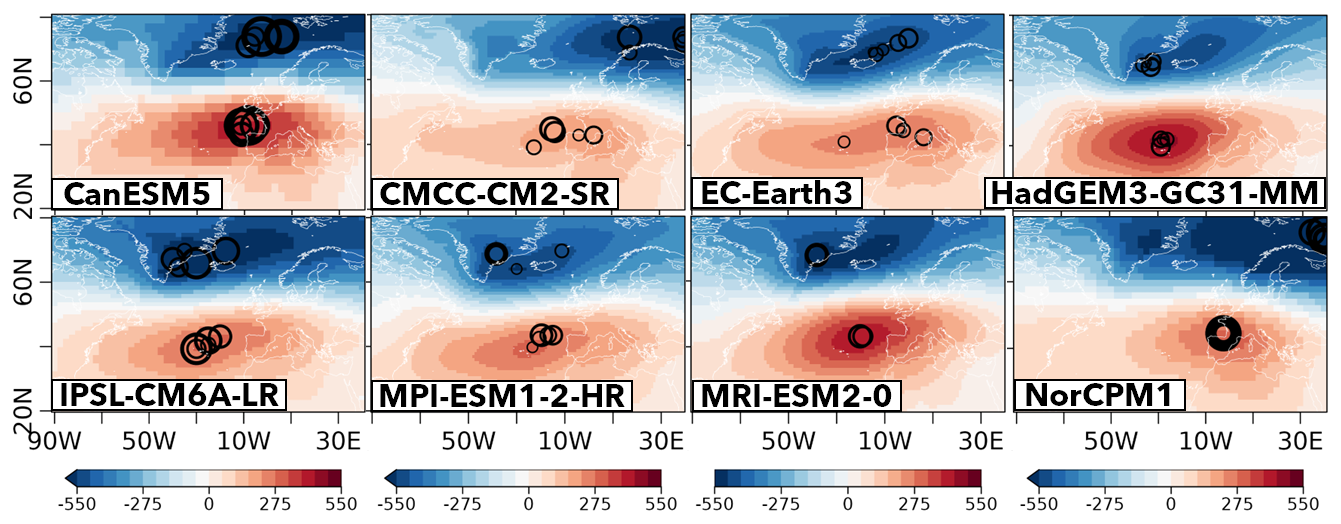
Figure 8Same as in Fig. 7 but for DCPP experiments. In this case, the colour shading represents the NAO pattern at DJF2, and the circles (in increasing size) represent the centres of action of the ensemble mean for DJF2, 4, 6, 8, and 10, thus illustrating any potential shifts with forecast time.
Figures 7 and 8 show the NAO pattern (defined as the first EOF of sea level pressure in DJF) for the HIST and DCPP experiments, respectively. As expected, the low-pressure system (also known as the Icelandic Low, IL) tends to be centred around Iceland, and the high-pressure system (also called the Azores High, AH) is centred between Azores and the western border of the Iberian Peninsula. There are some notable differences across models and experiments. In the HIST experiments (Fig. 7), both the AH and IL show substantial variations in their location across models and also across members (indicated by the crosses). Overall, the AH tends to be more located near the Azores archipelago, although some individual model members, including all NorCPM1 ones, develop their maxima near the Iberian Peninsula.
Important differences across models are also found in terms of the IL location for both types of experiments. CanESM5 (more obvious in HIST), CMCC-CM2-SR5, and NorCPM1 tend to have the IL located further to the east (i.e. over the Norwegian Sea and Scandinavia), much like the NAO structure of ERA5 for the study period of 1970–2014 (Fig. A6). The other models have their centres of action over Iceland and Greenland, which is more in line with the traditional NAO definition (Hurrell, 1995).
There seems to be an overall agreement between the NAO patterns in the HIST and DCPP ensembles (Fig. 8). In the DCPP experiments, the centres of action of the ensemble mean remain largely unchanged with forecast time (indicated by the circles of increasing size). This suggests that full-field initialization, despite improving the representation of the SST patterns driving the NAO (e.g. Gastineau and Frankignoul, 2015), does not correct the position of its simulated centres of action, which are located too far to the east in models like CMCC-CM2-SR5 and CanESM5.
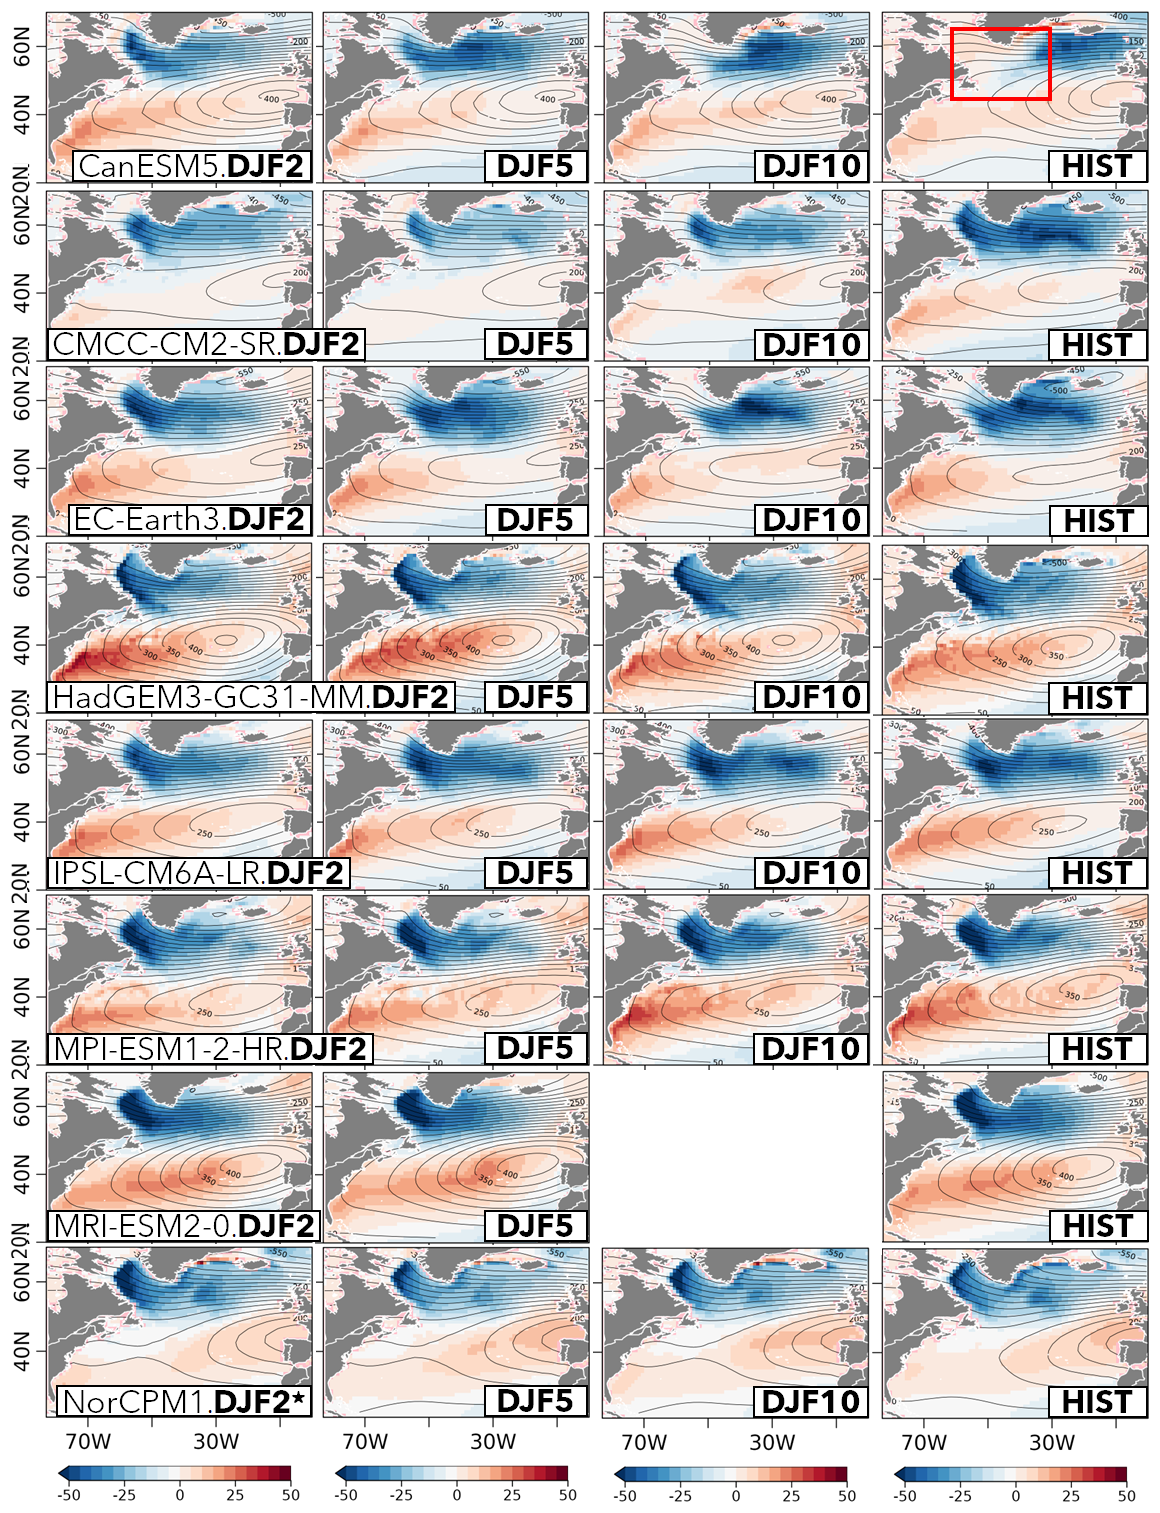
Figure 9Regression maps of the NAO index onto net surface heat fluxes (hfds) for the DCPP (in forecast winters DJF2, DJF5, and DJF10; columns 1–3, respectively) and HIST ensembles (in DJF; column 4). Negative (positive) values represent upward (downward) heat fluxes (in W m−2). The contour lines represent the corresponding NAO pattern. The red box in the upper-right plot depicts the LS region used in the analyses.
The relative position between the AH and IL centres of action can critically condition how the NAO affects the surface winds, whose speed is proportional to the local gradient in sea level pressure. This can be crucial in the Labrador Sea, where the surface winds promote deep-ocean convection by cooling the surface. Models such as NorCPM1 and CMCC-CM2-SR5, in which both centres of action are placed far from the Labrador Sea, shifting the maximum sea level pressure towards the east, might therefore induce a weaker local forcing. We now investigate whether this is the case by computing the linear regression of the NAO index with the surface heat fluxes (Fig. 9), as represented by the CMIP6 variable hfds. In the HIST experiments (rightmost column), all models show that the NAO exerts a strong cooling in the Labrador and Irminger seas, except in CanESM5, where both regions are unrealistically covered by sea ice (Fig. A7). Interestingly, the HIST panel additionally suggests that having the IL centre displaced to the east, like for NorCPM1 and CMCC-CM2-SR5, does not necessarily lead to a lack of surface forcing in the LS. This result suggests that other factors influencing the local heat loss are at play.
For the DCPP ensemble, the regression maps (Fig. 9) show a clear beneficial effect of initialization in the representation of the NAO's surface forcing, especially over the LS. In that region, all models show a more consistent picture at DJF2 and a better agreement with the equivalent regressions in ERA5 (Fig. A6), suggesting that having more realistic conditions in stratification, sea ice, or both does help to improve the NAO's influence on the local OHC (e.g. via improved vertical mixing), even in cases where its centres of action are displaced compared to ERA5 (e.g. CMCC-CM2-SR5). As the forecast time progresses, differences start to emerge, particularly in the systems that are full-field-initialized (e.g. CanESM5, EC-Earth3, CMCC-CM2-SR5) following the development of the intrinsic model biases. Indeed, full-field initialization not only helps to simulate a more realistic forcing of the NAO, but it also critically improves the climatological surface heat fluxes in winter (Fig. A5 compared to Fig. A6), mean-state improvements that are very clear in the LS in DJF2 for CanESM5, CMCC-CM2-SR5, and EC-Earth3. These improvements are less noticeable for HadGEM3-GC31-MM, which is also full-field-initialized, because this model had a more realistic background mean-state density stratification, as evidenced in Fig. 6 for its HIST run. Figure A5 also distinguishes NorCPM1 as a model with overly large climatological heat losses into the atmosphere in both the LS and EGB as compared to the other models and ERA5.
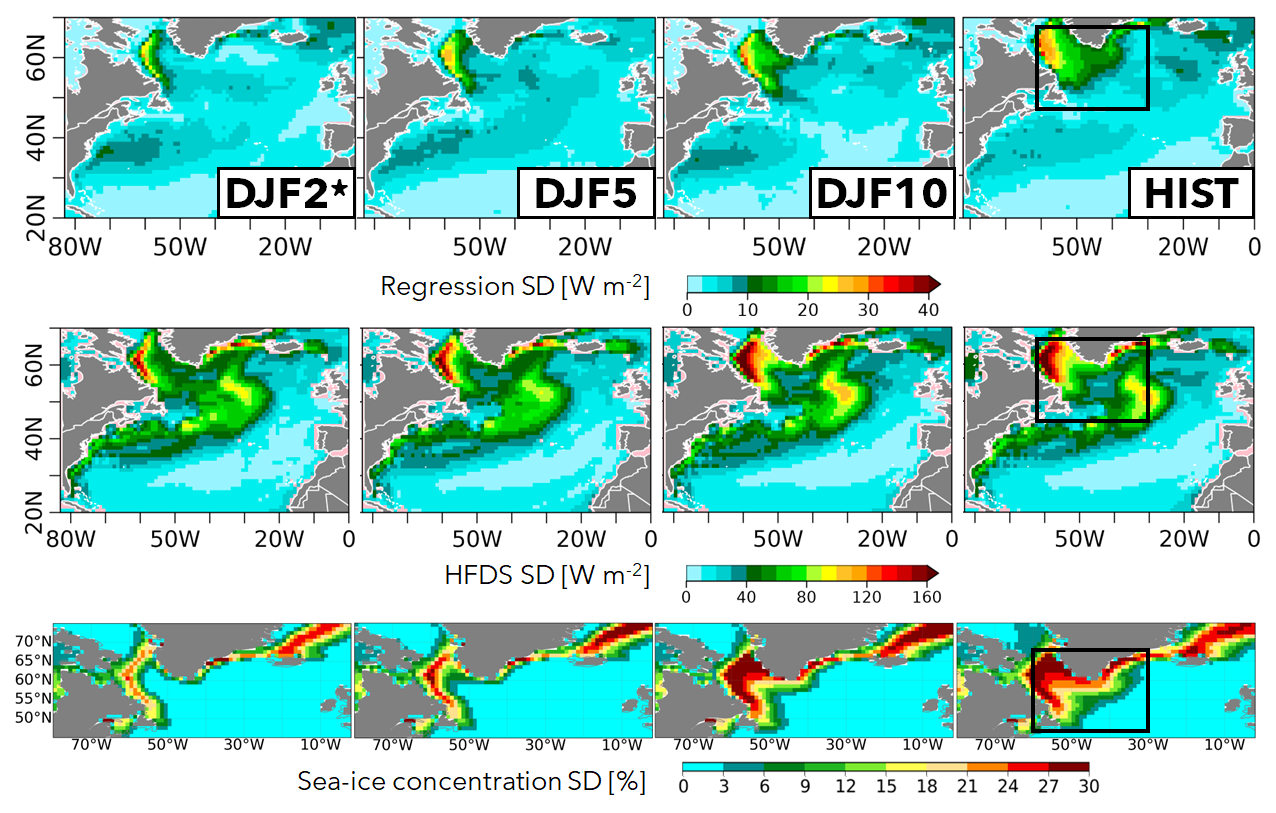
Figure 10Top: inter-model spread for the regression coefficients in Fig. 9, as defined by the standard deviation across models. Middle: the same as above but for the climatological net surface heat fluxes in DJF. Bottom: the same as above but for the climatological sea ice concentration in DJF. The black box in the rightmost column depicts the LS region used in the analyses.
To help identify the specific regions where the NAO introduces larger differences across models in terms of local surface heat fluxes, Fig. 10 (top row) shows the standard deviation in model space for the regression coefficients shown in Fig. 9. It clearly illustrates that the major differences occur over the LS, especially on its western side, thus supporting that the representation of the NAO and its forcing may contribute to the differences in OHC700 skill across models (Fig. 2). This is true for both sets of experiments, although the area of high standard deviation values is larger in HIST. The differences across models are reduced with initialization and become more prominent in the LS as forecast time progresses, and by DJF10 they remain geographically more confined than for the HIST experiment.
Because winter heat fluxes are not exclusively linked to the NAO, the differences across models in terms of climatological winter surface heat fluxes alone are plotted in the middle row of Fig. 10. Strong multi-model differences are also evident, with much higher standard deviation values. These are not only limited to the LS, which clearly stands out as the region with the highest inter-model spread, but are also quite large over the EGB region.
Considering that sea ice can act as a barrier that shields the ocean from the atmospheric influence, and in this way condition the climatological heat fluxes, the inter-model spread of the winter sea ice concentration (when it reaches its maximum extent) is also presented in the bottom row of Fig. 10. While in HIST and DJF10 there is a large spread in LS climatological sea ice, which can mostly be associated to CanESM5 and EC-Earth3 (Fig. A7), in the forecast winters DJF2 and DJF5, the differences are confined to a narrow band at the westernmost side of the LS. This is also where the surface heat flux regressions onto the NAO and the climatological surface heat fluxes showed the largest inter-model spread. Therefore, it would seem that all three model properties are intricately related in that region.
3.4 Understanding uncertainties in the externally forced LS OHC700 variability and predictability
An accurate characterization of the externally forced component of North Atlantic OHC variability is fundamental to understanding decadal predictability and evaluating model performance, as it is possible that some models show higher predictive skill for the wrong reasons. This last section seeks to narrow down the large uncertainties identified in the LS OHC700 externally forced signal, which is unknown for the real world, as observations include both internal and forced variability. We can, however, contrast the HIST simulations against observationally based climatological values for the previously analysed key physical properties (i.e. stratification, NAO regression, surface heat fluxes, and sea ice concentration), as these are largely determined by the background forcing conditions. To this end, a set of scatter plots was assembled in Fig. 11.
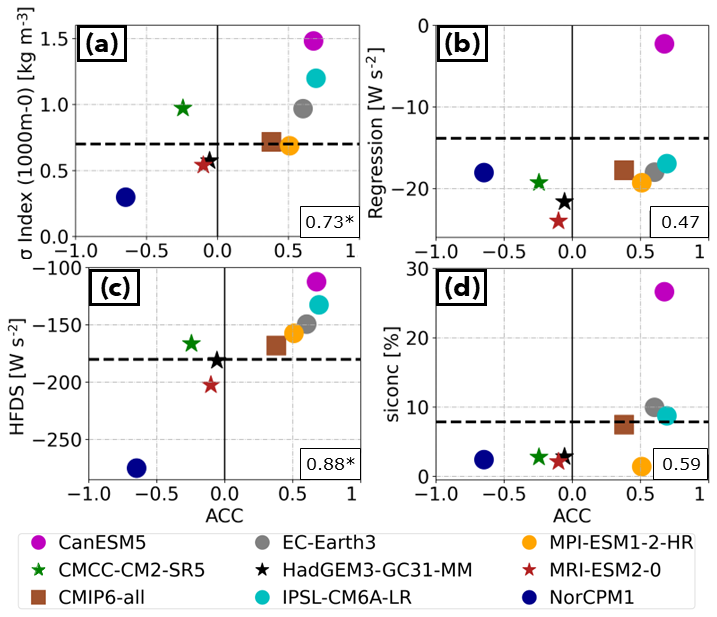
Figure 11(a) Scatter plot of the relationship between the ACC skill in the Labrador Sea OHC700 and the climatological value of the index of the Labrador Sea density stratification in the HIST ensembles. The stratification index is computed as the density difference between 1000 m and the surface. The 1000 m level was chosen based on the visual inspection of the vertical profiles (Fig. 6) as a characteristic level of the mean properties of the ocean subsurface. Larger values of the index correspond to models where the LS is more stratified. Panel (b) is the same as panel (a) but between the ACC skill in the Labrador Sea OHC700 and the regressed values of the NAO index onto the Labrador Sea net surface heat fluxes in DJF. Panel (c) is the same as panel (a) but between the ACC skill in the Labrador Sea OHC700 and the climatological Labrador Sea net surface heat fluxes in DJF. Panel (d) is the same as panel (a) but between the ACC skill in the Labrador Sea OHC700 and climatological DJF sea ice concentrations in the Labrador Sea. In all panels, stars represent non-significant correlation values at the 95 % confidence level. The dashed black horizontal line represents the respective reference dataset: (a) EN4, (b, c) ERA5, and (d) HadISST. The linear relationship between the different pairs of metrics is measured with correlation values in the model space, shown for each plot in the lower-right corners, with asterisks indicating if the correlation coefficient is significant at the 95 % confidence level.
We find a strong linear relationship between the forced OHC700 skill and the stratification index, with stronger stratification linked to higher skill. This result is robust for different definitions of the stratification index considered (not shown). A possible interpretation of this linear relationship is that stronger mean stratification limits the occurrence of deep convection events, especially those triggered by internal climate variability processes (which in HIST runs cannot be in phase with the observations), allowing better capture of the long-term trends. This would be consistent with the fact that ACC values for Labrador OHC700 are shown in Fig. 4 to be strongly related with its associated long-term trends. However, it is important to note that the models with the largest forced OHC700 skill also largely overestimate the local stratification when compared to an observational reference, which raises questions about their realism.
The relationship between the OHC700 skill and the climatological winter surface heat fluxes (hfds) in the LS (Fig. 11c) is also highly linear. In this case, however, both variables exhibit an inverse relationship: models like NorCPM1 or MRI-ESM2-0 that have stronger climatological surface heat fluxes in the LS (i.e. that lose more heat to the atmosphere) tend to have lower ACC values for OHC700, and vice versa. One potential explanation for this relationship is that, with stronger heat fluxes, the local stratification can be overcome more easily, which therefore allows a higher presence of spurious unforced signals that degrade the agreement with the observations (i.e. lower the ACC value). Interestingly, even though higher ACC values are linked to weaker surface heat forcings, the observed ERA5 climatologies suggest that the models with the highest forced skill are not particularly realistic. It should be noted, however, that ERA5 does not include all of the air–sea ice fluxes that are included in the HIST fluxes and might be important at the western side of the Labrador Sea.
For the two other preconditioners identified in Sect. 3.3.2 (i.e. the local NAO surface forcing and the climatological sea ice conditions), we do not find a clear linear relationship with the forced OHC700 LS skill. Despite this, CanESM (the model with the highest ACC values) is identified in both cases as a clear outlier when compared with observation-based references.
All the above results thus suggest that high ACC values in some of the historical ensembles are not necessarily indicative of good model performance. The underlying issue is that the true split between the forced and the internally generated variability in the real world is unknown, which hinders the identification of the models that simulate the forced signal better. Interestingly, the observation-based references included in the scatter plots are generally close to the multi-model mean value, supporting its standard use to derive our best estimate of the real forced signal. This multi-model mean has a forced OHC700 skill in the LS of ∼0.4, which would imply a significant but not dominant contribution of the external forcings to Labrador Sea OHC700 variability (as it would explain around 16 % of the total variance).
In this study, the predictive skill of the North Atlantic upper-ocean heat content has been explored in a multi-model context, using CMIP6 ensembles of historical and decadal climate prediction experiments from eight different models. By analysing both ensembles of experiments, it has been possible to investigate how and to what extent the external forcings contribute to the regional predictability of the OHC, also assessing the benefits of initialization. The bulk of the analysis has been delimited to the Labrador Sea region, where important skill differences across models were found. To further understand these inter-model differences, we have explored whether they can be linked to the capability of the underlying models to represent key ocean–atmosphere processes and properties that are tightly connected to the local OHC700 variability, such as the preconditioning role of density stratification and the NAO influence on the surface heat fluxes.
The main findings of the paper are summarized as follows:
-
Initialized decadal predictions largely agree on the regions with high predictive capacity for the OHC, which mostly concentrate on the Labrador Sea region and the eastern flank of the North Atlantic. All of them also show a region with negative skill located east of the Grand Banks, albeit with important differences regarding the exact location and extension of the negative ACC values, which largely vary across the models and experiment types. It remains unclear how much of this low skill is attributable to the large local observational uncertainties, which affect both the verification datasets and the quality of the initial conditions, as these latter are derived from assimilated observations. From these three regions, the largest inter-model differences in terms of predictive spread occur in the Labrador Sea, where some models experience initial shocks, as identified by Polkova et al. (2023), degrading the skill some years after initialization.
-
In the Labrador Sea region, no clear picture emerges from the multi-model ensemble of how much predictive capacity for the OHC arises from external forcings, as large inter-model differences in ACC are found for the OHC of the HIST experiments. The added predictive value of initialization, determined as the difference in skill between DCPP and HIST ensembles, is also highly variable across models. This model dependence of the results highlights the importance of using multi-model approaches, as analyses focused on individual models, such as the one in Carmo-Costa et al. (2021), can potentially lead to misleading generalizations.
-
In the HIST experiments, we have identified a strong linear relationship between the skill for Labrador Sea OHC and the local density stratification, along with a strong inverse linear relationship between the same skill and the climatological local surface heat fluxes. Since both stronger stratification and weaker surface heat fluxes suppress vertical mixing, we interpret that models with higher OHC skill are those where deep mixing occurs only sporadically, thereby reducing the influence of spurious signals from internal variability, which tend to lower correlation values. Interestingly, Hegerl et al. (2021) previously established a connection between density stratification in the North Atlantic subpolar gyre and local prediction skill for SST in models, showing that a more realistic stratification enhances skill levels. However, it is challenging to directly compare their findings with ours, as their analysis focused on a broader region, initialized predictions, and assessed absolute stratification errors without considering their directionality.
-
The HIST experiments with higher ACC for the Labrador Sea OHC also have larger biases in the mean-state stratification and heat fluxes, bringing their realism into question. The multi-model mean of the HIST experiments compares particularly well with observations and is likely to provide a more realistic estimate of the predictability attributable to the forcings, which, according to the multi-model mean, would account for ∼16 % of the total OHC variance in the Labrador Sea. We note that this number is roughly consistent with the percentage of Atlantic Multidecadal Variability (AMV) accounted for by external forcings from 1870 to 2012 in the analysis of Qin et al. (2020), which is derived from observations. Even if both quantities, the Labrador Sea OHC and the AMV, represent different domains and are derived from different variables, they are linked physically, as Labrador Sea OHC is strongly linked to local deep mixing, which is an important driver of the AMOC, and, through it, the AMV (Knight et al., 2005).
-
Our multi-model DCPP ensemble includes 4 systems using anomaly initialization and 4 systems using full-field initialization, which has allowed us to assess their relative merits. We have found that, overall, full-field initialization helps improve the representation of the selected key mean model features in the first forecast years, including the background stratification and the surface forcing from the NAO, but it does not necessarily lead to systematic improvements in Labrador Sea OHC skill, as already found in previous studies for the North Atlantic (Hazeleger et al., 2013; Volpi et al., 2017). No systematic benefit of anomaly initialization has been identified either, although, for the case of NorCPM1, we have found significant OHC skill along the full forecast for the westernmost side of the Labrador Sea, despite an overly weak mean stratification and some reported local errors in the forced signals.
-
Regarding the impact of enhanced resolution, neither of the two systems with eddy-permitting ocean components (HadGEM3-GC31-MM and MPI-ESM1-2-HR) show superior performance in terms of upper-OHC skill in the Labrador Sea compared to the other coarser-resolution models, with CMCC-CM2-SR5, EC-Earth3, and MRI-ESM2-0 showing very similar skill values at all FYs. This means that no particular benefit is obtained from the larger computing costs incurred by these higher resolutions, at least not for the subpolar latitudes in these DCPP experiments. It is possible, however, that the benefits of the higher resolution have been partly masked by the reduced ensemble sizes available for those models, as it has been previously shown that a larger ensemble size has a positive impact on the North Atlantic skill (Delgado-Torres et al., 2022; Athanasiadis et al., 2020). It is also possible that achieving significant skill improvements requires higher resolutions than those considered in this study. In fact, the first decadal predictions using an eddy-resolving ocean model, performed with CESM1.3 (Yeager et al., 2023; Kim et al., 2023b), demonstrated notable and widespread skill improvements compared to their low-resolution counterparts, although no real improvements were found in the North Atlantic, likely due to local issues in the initial conditions.
This study has linked the differences in upper-OHC skill to different mean-state biases across models, providing insights in relevant aspects of model fidelity that can be considered to guide the development phase of future climate prediction systems. A deeper fundamental understanding of the key sources of OHC predictive skill could be achieved by performing more holistic approaches, including heat budget analyses and the investigation of advective processes (similar to the propagation mechanisms described in Ortega et al., 2015, and Langehaug et al., 2022), which are beyond the scope of this study. Novel approaches are also needed to cleanly disentangle the relative contributions from external forcings and internal variability to the predictive skill, as the added predictive value of initialization can arise from internal processes and from a better representation of the forced response.
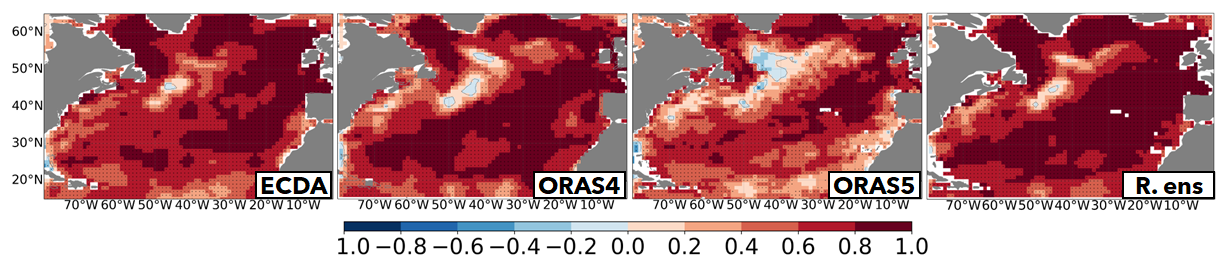
Figure A1Correlation maps between the OHC700 in EN4 and the OHC700 in ECDA, ORAS4, ORAS5, and the multi-reanalyses ensemble mean, computed over the period 1970–2014.
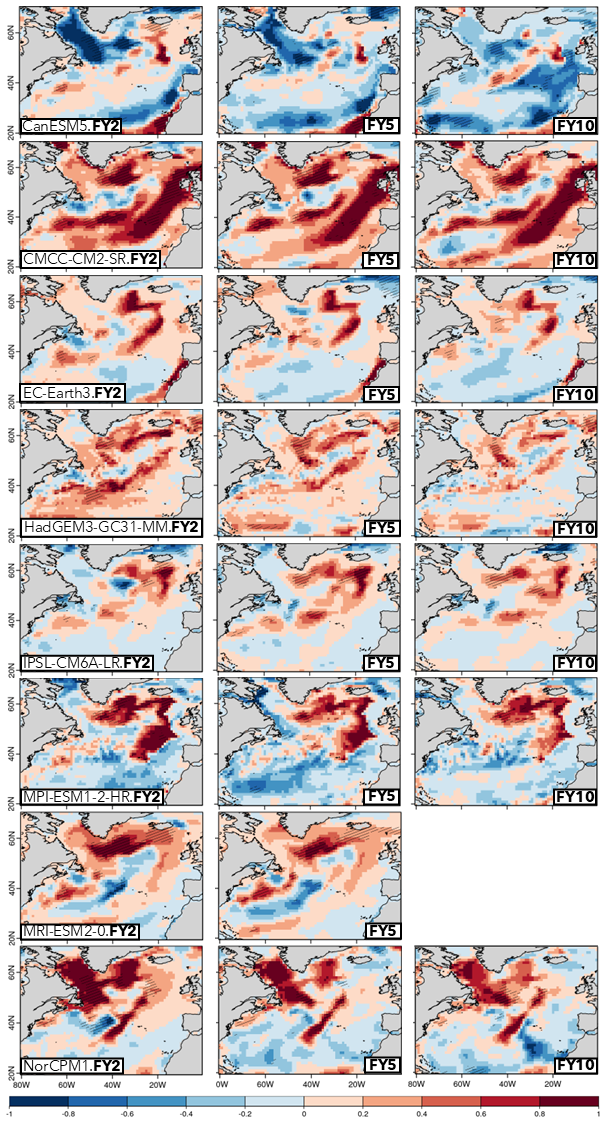
Figure A2The same as in Fig. 1 but for the difference in ACC values between the DCPP and HIST ensembles.
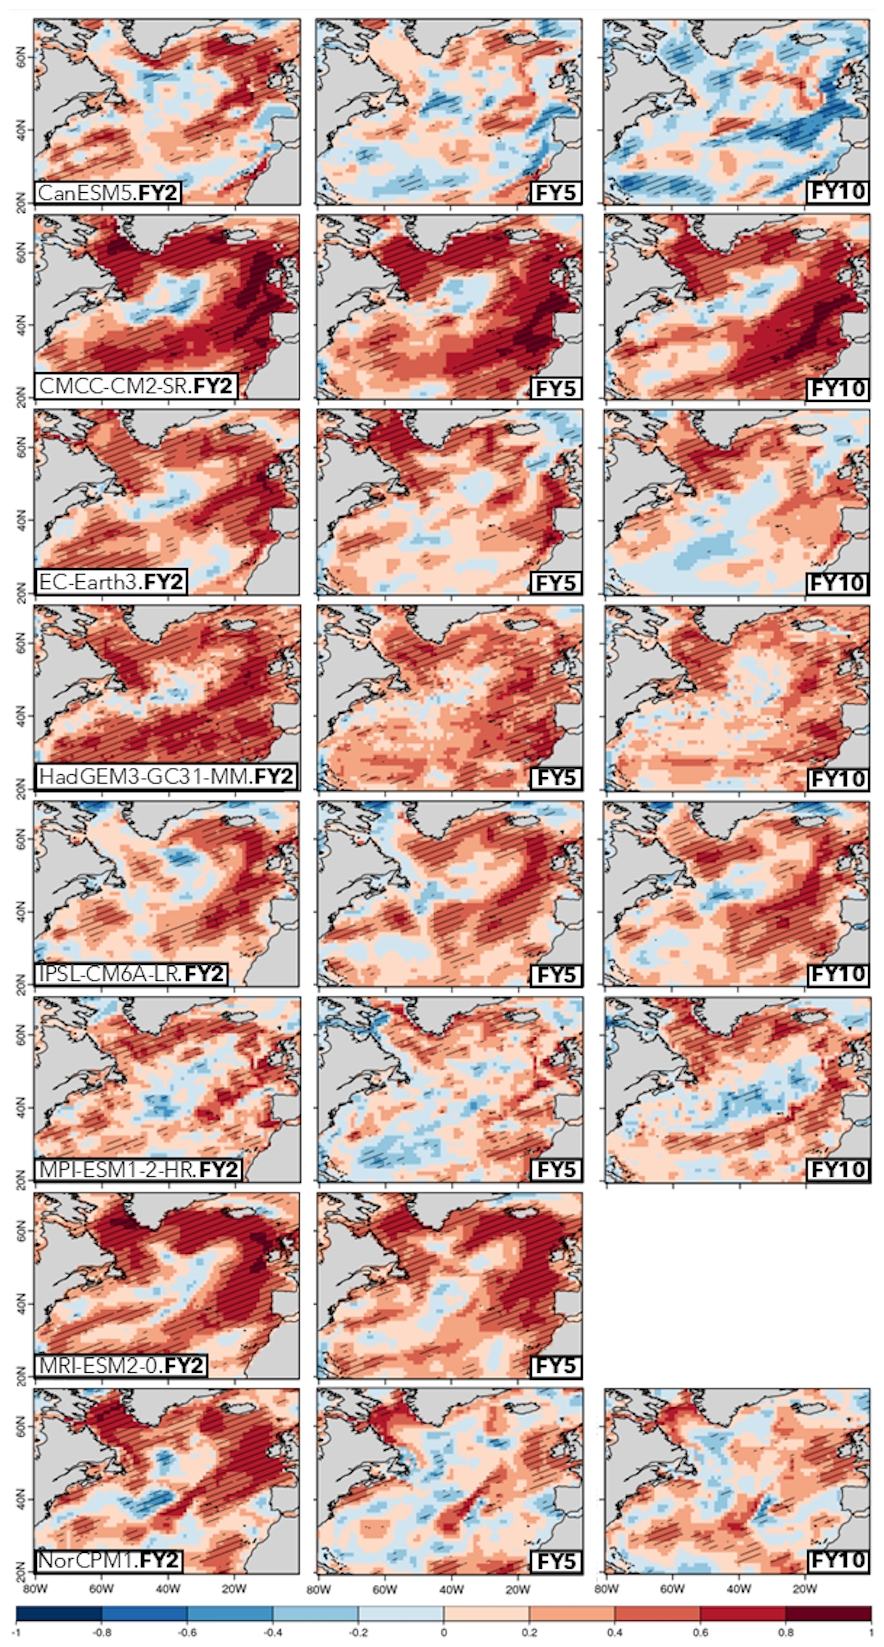
Figure A3The same as in Fig. 1 but for the residual correlations in each DCPP ensemble.
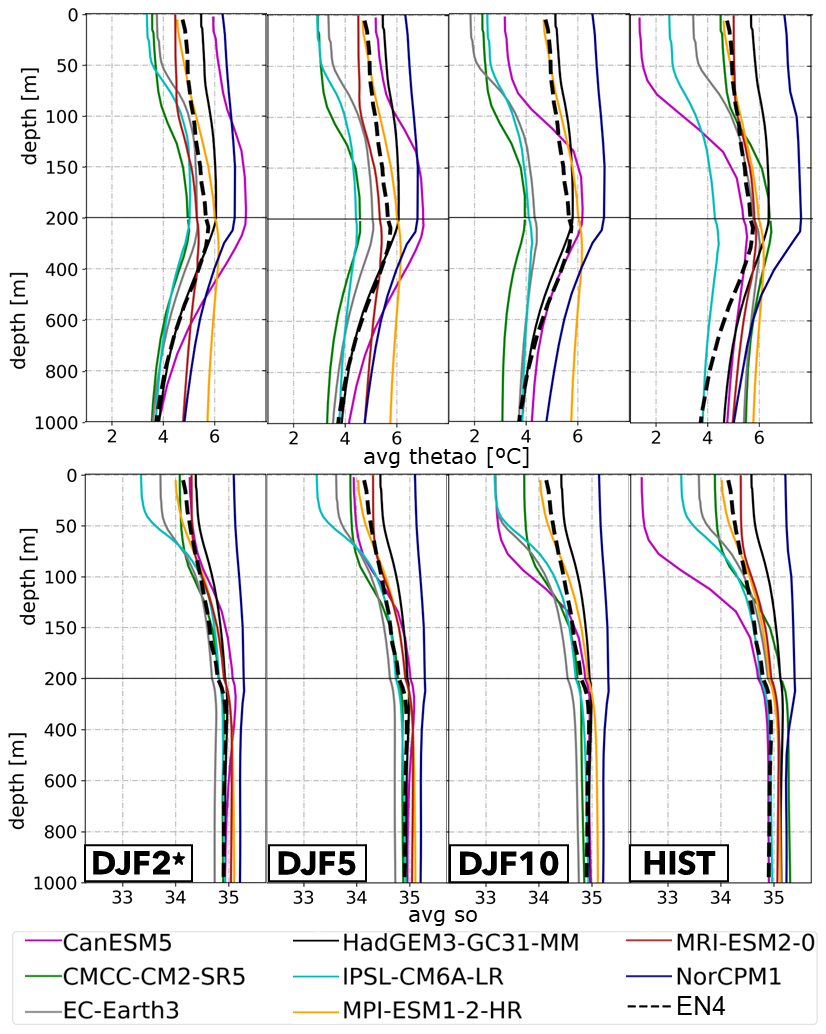
Figure A4As in Fig. 6 but for the climatological vertical profiles of potential temperature (top) and salinity (bottom).
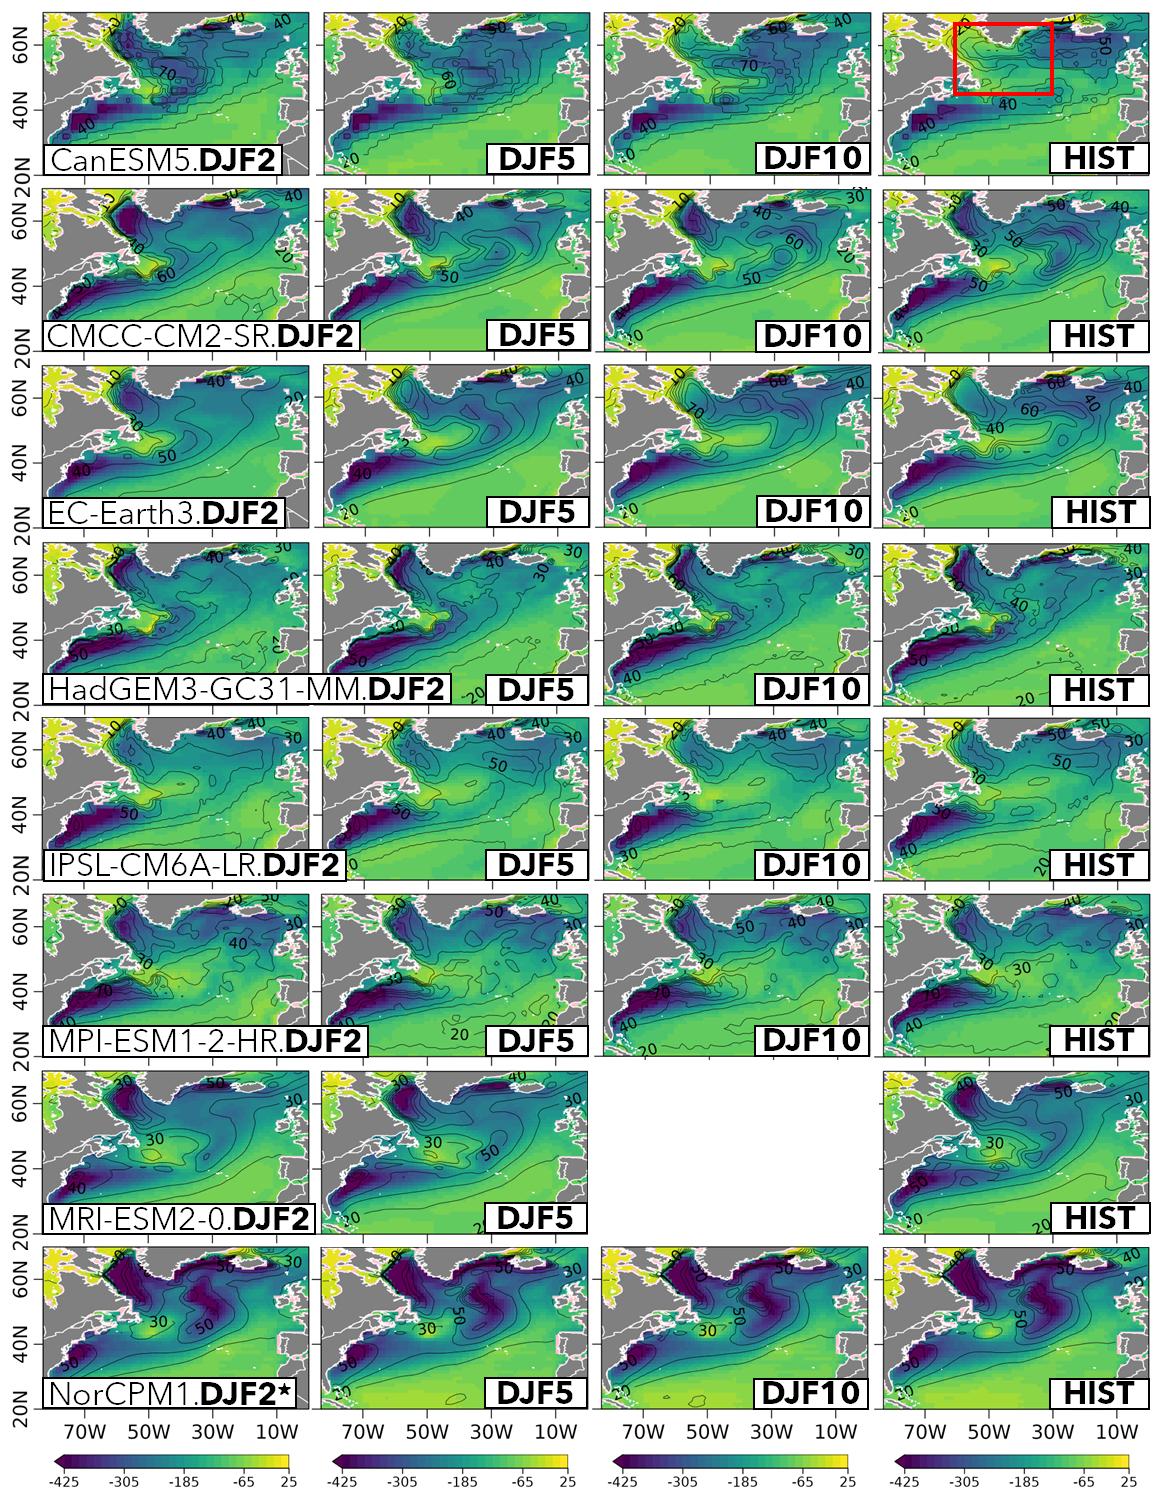
Figure A5Climatological DJF net surface heat fluxes for the DCPP (in forecast winters DJF2, DJF5, and DJF10; columns 1–3, respectively) and HIST ensembles (in DJF; column 4). Negative (positive) values represent upward (downward) heat fluxes (in W m−2). The contour lines represent the associated standard deviation in time for the period 1970–2014. The red box in the upper-right plot depicts the LS region used in the analyses.
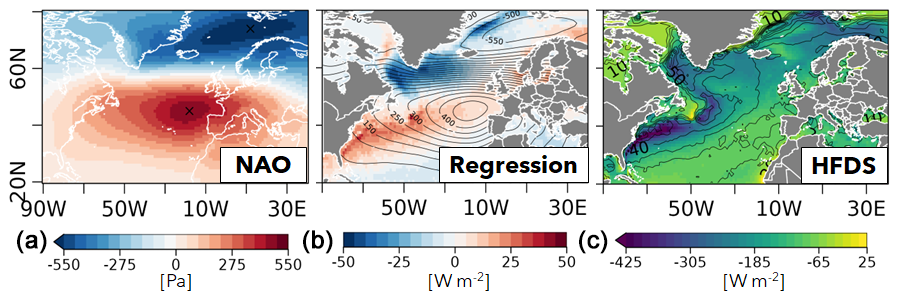
Figure A6(a) Spatial pattern of the NAO in the ERA5 reanalysis, computed as in Fig. 7. (b) Regression map of the NAO index onto the DJF net surface heat fluxes in the ERA5 reanalysis. (c) Climatological DJF net surface fluxes in the ERA5 reanalyses.
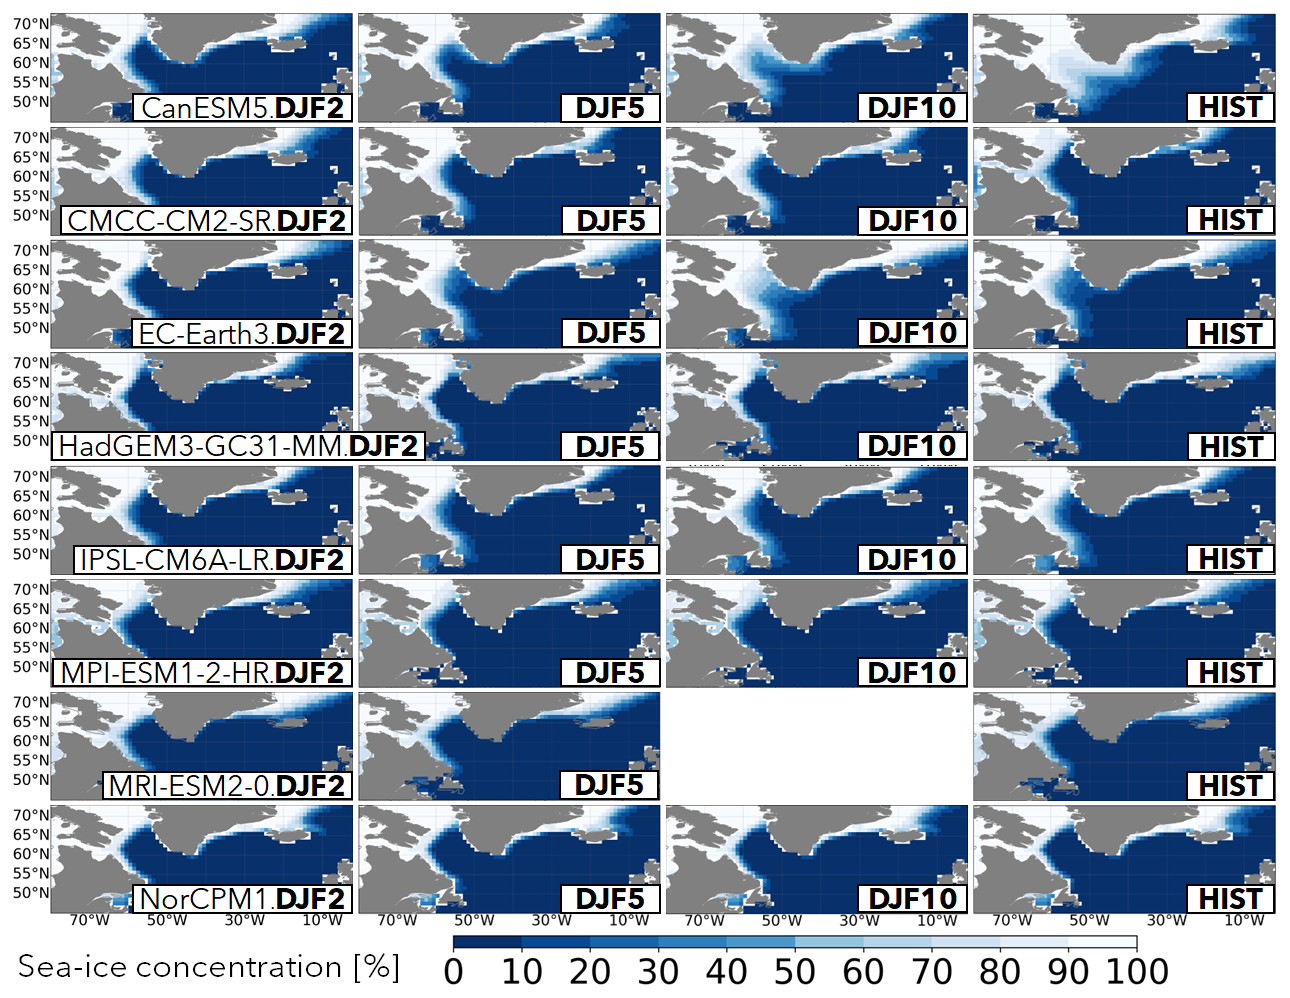
Figure A7Sea ice concentration (siconc) maps for the initialized predictions for the forecast winters DJF2, DJF5, and DJF10 (columns 1–3, respectively) and for DJF in the HIST ensemble (column 4).
All code developed for this study was based on ESMValTool, CDO, R, or Python. Scripts can be made available by the main author upon reasonable request.
The CMIP6 simulation data used in this study are publicly available through the Earth System Grid Federation (ESGF), a distributed data infrastructure operated by climate modelling centres worldwide. Data can be accessed via the ESGF search portal hosted by the Program for Climate Model Diagnosis and Intercomparison (PCMDI) at Lawrence Livermore National Laboratory: https://aims2.llnl.gov/search (ESGF, 2025). EN4 version 4.2.2 can be found at https://www.metoffice.gov.uk/hadobs/en4/download-en4-2-2.html (Met Office, 2022); we used the analysis files produced with the bias correction method from Gouretski and Reseghetti (2010). ERA5 can be downloaded from https://doi.org/10.24381/cds.143582cf (Hersbach et al., 2017), and HadISST version 2.2.0.0 is available at https://www.metoffice.gov.uk/hadobs/hadisst2 (Met Office, 2024).
TCC wrote the original draft with input from all authors, especially RB and PO. TCC wrote the scripts to analyse the data and to plot the figures. All authors contributed to the conceptualization of the study and to the interpretation of the results.
The contact author has declared that none of the authors has any competing interests.
Publisher’s note: Copernicus Publications remains neutral with regard to jurisdictional claims made in the text, published maps, institutional affiliations, or any other geographical representation in this paper. While Copernicus Publications makes every effort to include appropriate place names, the final responsibility lies with the authors.
The authors thank all collaborators and institutions who contributed to this research. We give special thanks to colleagues involved in the SARDINHA2020 and ROADMAP projects for support with oceanographic analyses. We are also grateful to technical teams who provided modelling assistance and to reviewers whose comments helped improve the manuscript.
This research has received financial support from multiple institutions and funding programmes. Teresa Carmo-Costa was supported by the Fundação para a Ciência e a Tecnologia (FCT) through grant numbers FCT-UIDB/50019/2020, PD/BD/142785/2018, and COVID/BD/152668/2022. Ana Teles-Machado acknowledges support from the SARDINHA2020 programme (MAR2020) and the ROADMAP project (grant no. JPIOCEANS/0001/2019). Roberto Bilbao received funding from the European Commission through the H2020 project EUCP (grant no. 776613) and the Horizon Europe project Impetus4Change (grant no. 101081555). Pablo Ortega was funded by the Spanish Ministry of Economy, Industry and Competitiveness via a Ramón y Cajal grant (grant no. RYC-2017-22772). Jon Robson was supported by NERC through the WISHBONE (grant no. NE/T013516/1), CANARI (grant no. NE/W004984/1), and ALPACA (grant no. NE/Y005279/1) projects, as well as by UKRI through the EPOC project.
This paper was edited by Andrey Gritsun and reviewed by Iuliia Polkova, Didier Swingedouw, and one anonymous referee.
Athanasiadis, P. J., Yeager, S., Kwon, Y.-O., Bellucci, A., Smith, D. W., and Tibaldi, S.: Decadal predictability of North Atlantic blocking and the NAO, npj Climate and Atmospheric Science, 3, 20, https://doi.org/10.1038/s41612-020-0120-6, 2020. a, b
Balaguru, K., Foltz, G. R., and Leung, L. R.: Increasing Magnitude of Hurricane Rapid Intensification in the Central and Eastern Tropical Atlantic, Geophys. Res. Lett., 45, 4238–4247, https://doi.org/10.1029/2018GL077597, 2018. a
Balmaseda, M. A., Mogensen, K., and Weaver, A. T.: Evaluation of the ECMWF ocean reanalysis system ORAS4, Q. J. Roy. Meteor. Soc., 139, 1132–1161, https://doi.org/10.1002/qj.2063, 2013. a
Bethke, I., Wang, Y., Counillon, F., Keenlyside, N., Kimmritz, M., Fransner, F., Samuelsen, A., Langehaug, H., Svendsen, L., Chiu, P.-G., Passos, L., Bentsen, M., Guo, C., Gupta, A., Tjiputra, J., Kirkevåg, A., Olivié, D., Seland, Ø., Solsvik Vågane, J., Fan, Y., and Eldevik, T.: NorCPM1 and its contribution to CMIP6 DCPP, Geosci. Model Dev., 14, 7073–7116, https://doi.org/10.5194/gmd-14-7073-2021, 2021. a, b
Bilbao, R., Wild, S., Ortega, P., Acosta-Navarro, J., Arsouze, T., Bretonnière, P.-A., Caron, L.-P., Castrillo, M., Cruz-García, R., Cvijanovic, I., Doblas-Reyes, F. J., Donat, M., Dutra, E., Echevarría, P., Ho, A.-C., Loosveldt-Tomas, S., Moreno-Chamarro, E., Pérez-Zanon, N., Ramos, A., Ruprich-Robert, Y., Sicardi, V., Tourigny, E., and Vegas-Regidor, J.: Assessment of a full-field initialized decadal climate prediction system with the CMIP6 version of EC-Earth, Earth Syst. Dynam., 12, 173–196, https://doi.org/10.5194/esd-12-173-2021, 2021. a, b, c, d, e
Bilbao, R. A. F., Gregory, J. M., Bouttes, N., Palmer, M. D., and Stott, P.: Attribution of ocean temperature change to anthropogenic and natural forcings using the temporal, vertical and geographical structure, Clim. Dynam., 53, 5389–5413, https://doi.org/10.1007/s00382-019-04910-1, 2019. a
Boer, G. J., Smith, D. M., Cassou, C., Doblas-Reyes, F., Danabasoglu, G., Kirtman, B., Kushnir, Y., Kimoto, M., Meehl, G. A., Msadek, R., Mueller, W. A., Taylor, K. E., Zwiers, F., Rixen, M., Ruprich-Robert, Y., and Eade, R.: The Decadal Climate Prediction Project (DCPP) contribution to CMIP6, Geosci. Model Dev., 9, 3751–3777, https://doi.org/10.5194/gmd-9-3751-2016, 2016. a, b, c
Bonnet, R., Boucher, O., Deshayes, J., Gastineau, G., Hourdin, F., Mignot, J., Servonnat, J., and Swingedouw, D.: Presentation and Evaluation of the IPSL-CM6A-LR Ensemble of Extended Historical Simulations, J. Adv. Model. Earth Sy., 13, e2021MS002565, https://doi.org/10.1029/2021MS002565, 2021a. a
Bonnet, R., Swingedouw, D., Gastineau, G., Boucher, O., Deshayes, J., Hourdin, F., Mignot, J., Servonnat, J., and Sima, A.: Increased risk of near term global warming due to a recent AMOC weakening, Nat. Commun., 12, 6108, https://doi.org/10.1038/s41467-021-26370-0, 2021b. a
Borchert, L. F., Müller, W. A., and Baehr, J.: Atlantic ocean heat transport influences interannual-to-decadal surface temperature predictability in the North Atlantic Region, J. Climate, 31, 6763–6782, https://doi.org/10.1175/JCLI-D-17-0734.1, 2018. a, b
Buckley, M. W. and Marshall, J.: Observations, inferences, and mechanisms of the Atlantic Meridional Overturning Circulation: A review, Rev. Geophys., 54, 5–63, https://doi.org/10.1002/2015RG000493, 2016. a
Buckley, M. W., DelSole, T., Lozier, M. S., and Li, L.: Predictability of North Atlantic Sea surface temperature and upper-ocean heat content, J. Climate, 32, 3005–3023, https://doi.org/10.1175/JCLI-D-18-0509.1, 2019. a
Caesar, L., McCarthy, G. D., Thornalley, D. J., Cahill, N., and Rahmstorf, S.: Current Atlantic Meridional Overturning Circulation weakest in last millennium, Nat. Geosci., 14, 118–120, https://doi.org/10.1038/s41561-021-00699-z, 2021. a
Carmo-Costa, T., Bilbao, R., Ortega, P., Teles-Machado, A., and Dutra, E.: Trends, variability and predictive skill of the ocean heat content in North Atlantic: an analysis with the EC-Earth3 model, Clim. Dynam., 58, 1311–1328, https://doi.org/10.1007/s00382-021-05962-y, 2021. a, b, c, d
Chang, Y. S., Zhang, S., Rosati, A., Delworth, T. L., and Stern, W. F.: An assessment of oceanic variability for 1960–2010 from the GFDL ensemble coupled data assimilation, Clim. Dynam., 40, 775–803, https://doi.org/10.1007/s00382-012-1412-2, 2013. a
Cherchi, A., Fogli, P. G., Lovato, T., Peano, D., Iovino, D., Gualdi, S., Masina, S., Scoccimarro, E., Materia, S., Bellucci, A., and Navarra, A.: Global Mean Climate and Main Patterns of Variability in the CMCC-CM2 Coupled Model, J. Adv. Model. Earth Sy., 11, 185–209, https://doi.org/10.1029/2018MS001369, 2019. a
Delgado-Torres, C., Donat, M. G., Gonzalez-Reviriego, N., Caron, L.-P., Athanasiadis, P. J., Bretonnière, P.-A., Dunstone, N. J., Ho, A.-C., Nicoli, D., Pankatz, K., Paxian, A., Pérez-Zanón, N., Cabré, M. S., Solaraju-Murali, B., Soret, A., and Doblas-Reyes, F. J.: Multi-Model Forecast Quality Assessment of CMIP6 Decadal Predictions, J. Climate, 35, 4363–4382, https://doi.org/10.1175/JCLI-D-21-0811.1, 2022. a, b
Devilliers, M., Swingedouw, D., Mignot, J., Deshayes, J., Garric, G., and Ayache, M.: A realistic Greenland ice sheet and surrounding glaciers and ice caps melting in a coupled climate model, Clim. Dynam., 57, 2467–2489, https://doi.org/10.1007/s00382-021-05816-7, 2021. a
Doblas-Reyes, F. J., Andreu-Burillo, I., Chikamoto, Y., García-Serrano, J., Guemas, V., Kimoto, M., Mochizuki, T., Rodrigues, L. R. L., and van Oldenborgh, G. J.: Initialized near-term regional climate change prediction, Nat. Commun., 4, 1–9, https://doi.org/10.1038/ncomms2704, 2013. a
Döscher, R., Acosta, M., Alessandri, A., Anthoni, P., Arsouze, T., Bergman, T., Bernardello, R., Boussetta, S., Caron, L.-P., Carver, G., Castrillo, M., Catalano, F., Cvijanovic, I., Davini, P., Dekker, E., Doblas-Reyes, F. J., Docquier, D., Echevarria, P., Fladrich, U., Fuentes-Franco, R., Gröger, M., v. Hardenberg, J., Hieronymus, J., Karami, M. P., Keskinen, J.-P., Koenigk, T., Makkonen, R., Massonnet, F., Ménégoz, M., Miller, P. A., Moreno-Chamarro, E., Nieradzik, L., van Noije, T., Nolan, P., O'Donnell, D., Ollinaho, P., van den Oord, G., Ortega, P., Prims, O. T., Ramos, A., Reerink, T., Rousset, C., Ruprich-Robert, Y., Le Sager, P., Schmith, T., Schrödner, R., Serva, F., Sicardi, V., Sloth Madsen, M., Smith, B., Tian, T., Tourigny, E., Uotila, P., Vancoppenolle, M., Wang, S., Wårlind, D., Willén, U., Wyser, K., Yang, S., Yepes-Arbós, X., and Zhang, Q.: The EC-Earth3 Earth system model for the Coupled Model Intercomparison Project 6, Geosci. Model Dev., 15, 2973–3020, https://doi.org/10.5194/gmd-15-2973-2022, 2022. a
Drijfhout, S., van Oldenborgh, G. J., and Cimatoribus, A.: Is a decline of AMOC causing the warming hole above the North Atlantic in observed and modeled warming patterns?, J. Climate, 25, 8373–8379, https://doi.org/10.1175/JCLI-D-12-00490.1, 2012. a, b
Durack, P. J., Gleckler, P. J., Purkey, S. G., Johnson, G. C., Lyman, J. M., and Boyer, T. P.: Ocean Warming: From the Surface to the Deep in Observations and Models, Oceanography, 31, 41–51, https://doi.org/10.5670/oceanog.2018.227, 2018. a
Eden, C. and Jung, T.: North Atlantic interdecadal variability: Oceanic response to the North Atlantic oscillation (1865–1997), J. Climate, 14, 676–691, https://doi.org/10.1175/1520-0442(2001)014<0676:NAIVOR>2.0.CO;2, 2001. a
Enfield, D. B., Mestas-Nunez, A. M., and Trimble, P. J.: The Atlantic Multidecadal Oscillation and its relation to rainfall and river flows in the continental U.S., Geophys. Res. Lett., 28, 2077–2080, https://doi.org/10.1029/2000GL012745, 2001. a
ESGF: CMIP6, Earth System Grid Federation [data set], https://aims2.llnl.gov/search, last access: 9 July 2025. a
Eyring, V., Bony, S., Meehl, G. A., Senior, C. A., Stevens, B., Stouffer, R. J., and Taylor, K. E.: Overview of the Coupled Model Intercomparison Project Phase 6 (CMIP6) experimental design and organization, Geosci. Model Dev., 9, 1937–1958, https://doi.org/10.5194/gmd-9-1937-2016, 2016. a, b
Gastineau, G. and Frankignoul, C.: Influence of the North Atlantic SST Variability on the Atmospheric Circulation during the Twentieth Century, J. Climate, 28, 1396–1416, https://doi.org/10.1175/JCLI-D-14-00424.1, 2015. a
Gleckler, P. J., Santer, B. D., Domingues, C. M., Pierce, D. W., Barnett, T. P., Church, J. A., Taylor, K. E., AchutaRao, K. M., Boyer, T. P., Ishii, M., and Caldwell, P. M.: Human-induced global ocean warming on multidecadal timescales, Nat. Clim. Change, 2, 524–529, https://doi.org/10.1038/nclimate1553, 2012. a
Good, S. A., Martin, M. J., and Rayner, N. A.: EN4: Quality controlled ocean temperature and salinity profiles and monthly objective analyses with uncertainty estimates, J. Geophys. Res.-Oceans, 118, 6704–6716, https://doi.org/10.1002/2013JC009067, 2013. a
Gouretski, V. and Reseghetti, F.: On depth and temperature biases in bathythermograph data: Development of a new correction scheme based on analysis of a global ocean database, Deep-Sea Res. Pt. II, 57, 812–833, https://doi.org/10.1016/j.dsr.2010.03.011, 2010. a
Guemas, V. and Salas, M. D.: Simulation of the Atlantic meridional overturning circulation in an atmosphere-ocean global coupled model. Part I: A mechanism governing the variability of ocean convection in a preindustrial experiment, Clim. Dynam., 31, 29–48, https://doi.org/10.1007/s00382-007-0336-8, 2008. a
Guemas, V., Manubens, N., Garcia-Serrano, J., Fuckar, N., Caron, L.-P., Bellprat, O., Rodrigues, L., Torralba, V., Hunter, A., Prodhomme, C., Menegoz, M., Manubens, D., Ardilouze, C., Batte, L., Lienert, F., Giner, J., Baudouin, J.-P., Gonzalez, N., Auger, L., Cortesi, N., Exarchou, E., Cruz, R., Andreu-Burillo, I., Saurral, R., Manubens, D., Lienert, F., Garcia-Serrano, J., Batte, L., Caron, L.-P., Rodrigues, L., Menegoz, M., Fuckar, N., Manubens, N., Bellprat, O., Torralba, V., and Guemas, V.: Package 's2dverification': Set of Common Tools for Forecast Verification, Tech. rep., BSC, Barcelona, 2019. a
Häkkinen, S., Rhines, P. B., and Worthen, D. L.: Heat content variability in the North Atlantic Ocean in ocean reanalyses, Geophys. Res. Lett., 42, 2901–2909, https://doi.org/10.1002/2015GL063299, 2015. a
Hazeleger, W., Guemas, V., Wouters, B., Corti, S., Andreu-Burillo, I., Doblas-Reyes, F. J., Wyser, K., and Caian, M.: Multiyear climate predictions using two initialization strategies, Geophys. Res. Lett., 40, 1794–1798, https://doi.org/10.1002/grl.50355, 2013. a, b
Hegerl, G. C., Ballinger, A. P., Booth, B. B. B., Borchert, L. F., Brunner, L., Donat, M. G., Doblas-Reyes, F. J., Harris, G. R., Lowe, J., Mahmood, R., Mignot, J., Murphy, J. M., Swingedouw, D., and Weisheimer, A.: Toward Consistent Observational Constraints in Climate Predictions and Projections, Frontiers in Climate, 3, 678109, https://doi.org/10.3389/fclim.2021.678109, 2021. a
Hersbach, H., Bell, B., Berrisford, P., Hirahara, S., Horányi, A., Muñoz-Sabater, J., Nicolas, J., Peubey, C., Radu, R., Schepers, D., Simmons, A., Soci, C., Abdalla, S., Abellan, X., Balsamo, G., Bechtold, P., Biavati, G., Bidlot, J., Bonavita, M., De Chiara, G., Dahlgren, P., Dee, D., Diamantakis, M., Dragani, R., Flemming, J., Forbes, R., Fuentes, M., Geer, A., Haimberger, L., Healy, S., Hogan, R. J., Hólm, E., Janisková, M., Keeley, S., Laloyaux, P., Lopez, P., Lupu, C., Radnoti, G., de Rosnay, P., Rozum, I., Vamborg, F., Villaume, S., and Thépaut, J. N.: The ERA5 global reanalysis, Q. J. Roy. Meteor. Soc., 146, 1999–2049, https://doi.org/10.1002/qj.3803, 2020. a
Hersbach, H., Bell, B., Berrisford, P., Hirahara, S., Horányi, A., Muñoz‐Sabater, J., Nicolas, J., Peubey, C., Radu, R., Schepers, D., Simmons, A., Soci, C., Abdalla, S., Abellan, X., Balsamo, G., Bechtold, P., Biavati, G., Bidlot, J., Bonavita, M., De Chiara, G., Dahlgren, P., Dee, D., Diamantakis, M., Dragani, R., Flemming, J., Forbes, R., Fuentes, M., Geer, A., Haimberger, L., Healy, S., Hogan, R.J., Hólm, E., Janisková, M., Keeley, S., Laloyaux, P., Lopez, P., Lupu, C., Radnoti, G., de Rosnay, P., Rozum, I., Vamborg, F., Villaume, S., and Thépaut, J.-N.: Complete ERA5 from 1940: Fifth generation of ECMWF atmospheric reanalyses of the global climate, Copernicus Climate Change Service (C3S) Data Store (CDS) [data set], https://doi.org/10.24381/cds.143582cf, 2017. a
Hurrell, J. W.: Decadal Trends in the North Atlantic Oscillation: Regional Temperatures and Precipitation, Science, 269, 7–10, https://doi.org/10.1126/science.269.5224.676, 1995. a
IPCC: Climate Change 2021: The Physical Science Basis. Contribution of Working Group I to the Sixth Assessment Report of the Intergovernmental Panel on Climate Change, in press, Cambridge University Press, Cambridge, United Kingdom and New York, NY, USA, https://doi.org/10.1017/9781009157896, 2021. a
Johnson, G. C. and Lyman, J. M.: Warming trends increasingly dominate global ocean, Nat. Clim. Change, 10, 757–761, https://doi.org/10.1038/s41558-020-0822-0, 2020. a, b
Josey, S. A., Hirschi, J. J.-M., Sinha, B., Duchez, A., Grist, J. P., and Robert Marsh: The Recent Atlantic Cold Anomaly: Causes, Consequences, and Related Phenomena, Annu. Rev. Mar. Sci., 10, 475–501, https://doi.org/10.1146/annurev-marine-121916-063102, 2018. a, b
Kay, G., Dunstone, N. J., Smith, D. M., Betts, R. A., Cunningham, C., and Scaife, A. A.: Assessing the chance of unprecedented dry conditions over North Brazil during El Niño events, Environ. Res. Lett., 17, 064016, https://doi.org/10.1088/1748-9326/ac6df9, 2022. a
Keenlyside, N. S., Latif, M., Jungclaus, J., Kornblueh, L., and Roeckner, E.: Advancing decadal-scale climate prediction in the North Atlantic sector, Nature, 453, 84–88, https://doi.org/10.1038/nature06921, 2008. a
Keil, P., Mauritsen, T., Jungclaus, J., Hedemann, C., Olonscheck, D., and Ghosh, R.: Multiple drivers of the North Atlantic warming hole, Nat. Clim. Change, 10, 667–671, https://doi.org/10.1038/s41558-020-0819-8, 2020. a, b
Kim, H.-J., An, S.-I., Park, J.-H., Sung, M.-K., Kim, D., Choi, Y., and Kim, J.-S.: North Atlantic Oscillation impact on the Atlantic Meridional Overturning Circulation shaped by the mean state, npj Climate and Atmospheric Science, 6, 25, https://doi.org/10.1038/s41612-023-00354-x, 2023a. a
Kim, W. M., Yeager, S. G., Danabasoglu, G., and Chang, P.: Exceptional multi-year prediction skill of the Kuroshio Extension in the CESM high-resolution decadal prediction system, npj Climate and Atmospheric Science, 6, 118, https://doi.org/10.1038/s41612-023-00444-w, 2023b. a
Knight, J. R., Allan, R. J., Folland, C. K., Vellinga, M., and Mann, M. E.: A signature of persistent natural thermohaline circulation cycles in observed climate, Geophys. Res. Lett., 32, 1–4, https://doi.org/10.1029/2005GL024233, 2005. a
Kröger, J., Pohlmann, H., Sienz, F., Marotzke, J., Baehr, J., Köhl, A., Modali, K., Polkova, I., Stammer, D., Vamborg, F. S., and Müller, W. A.: Full-field initialized decadal predictions with the MPI earth system model: an initial shock in the North Atlantic, Clim. Dynam., 51, 2593–2608, https://doi.org/10.1007/s00382-017-4030-1, 2018. a, b, c
Kwon, Y. O., Seo, H., Ummenhofer, C. C., and Joyce, T. M.: Impact of multidecadal variability in Atlantic SST on winter atmospheric blocking, J. Climate, 33, 867–892, https://doi.org/10.1175/JCLI-D-19-0324.1, 2020. a
Langehaug, H. R., Ortega, P., Counillon, F., Matei, D., Maroon, E., Keenlyside, N., Mignot, J., Wang, Y., Swingedouw, D., Bethke, I., Yang, S., Danabasoglu, G., Bellucci, A., Ruggieri, P., Nicoli, D., and Orthun, M.: Propagation of Thermohaline Anomalies and Their Predictive Potential along the Atlantic Water Pathway, J. Climate, 35, 2111–2131, https://doi.org/10.1175/JCLI-D-20-1007.1, 2022. a
Latif, M., Sun, J., Visbeck, M., and Hadi Bordbar, M.: Natural variability has dominated Atlantic Meridional Overturning Circulation since 1900, Nat. Clim. Change, 12, 455–460, https://doi.org/10.1038/s41558-022-01342-4, 2022. a
Levitus, S., Antonov, J. I., Boyer, T. P., and Stephens, C.: Warming of the World Ocean, Science, 287, 2225–2229, https://doi.org/10.1126/science.287.5461.2225, 2000. a
Levitus, S., Antonov, J. I., Boyer, T. P., Baranova, O. K., Garcia, H. E., Locarnini, R. A., Mishonov, A. V., Reagan, J. R., Seidov, D., Yarosh, E. S., and Zweng, M. M.: World ocean heat content and thermosteric sea level change (0–2000 m), 1955–2010, Geophys. Res. Lett., 39, 1–5, https://doi.org/10.1029/2012GL051106, 2012. a
Li, H., Ilyina, T., Müller, W. A., and Landschützer, P.: Predicting the variable ocean carbon sink, Sci. Adv., 5, 1–9, https://doi.org/10.1126/sciadv.aav6471, 2019. a
Manubens, N., Caron, L. P., Hunter, A., Bellprat, O., Exarchou, E., Fučkar, N. S., Garcia-Serrano, J., Massonnet, F., Ménégoz, M., Sicardi, V., Batté, L., Prodhomme, C., Torralba, V., Cortesi, N., Mula-Valls, O., Serradell, K., Guemas, V., and Doblas-Reyes, F. J.: An R package for climate forecast verification, Environ. Modell. Softw., 103, 29–42, https://doi.org/10.1016/j.envsoft.2018.01.018, 2018. a
Maroon, E. A., Yeager, S. G., Danabasoglu, G., and Rosenbloom, N.: Was the 2015 North Atlantic Subpolar Cold Anomaly Predictable?, J. Climate, 34, 5403–5423, https://doi.org/10.1175/JCLI-D-20-0750.1, 2021. a
Mecking, J. V., Drijfhout, S. S., Hirschi, J. J., and Blaker, A. T.: Ocean and atmosphere influence on the 2015 European heatwave, Enviro. Res. Lett., 14, 114035, https://doi.org/10.1088/1748-9326/ab4d33, 2019. a
Meehl, G. A., Moss, R., Taylor, K. E., Eyring, V., Stouffer, R. J., Bony, S., and Stevens, B.: Climate model intercomparisons: Preparing for the next phase, Eos, 95, 77–78, https://doi.org/10.1002/2014EO090001, 2014. a
Menary, M. B. and Hermanson, L.: Limits on determining the skill of North Atlantic Ocean decadal predictions, Nat. Commun., 9, 1694, https://doi.org/10.1038/s41467-018-04043-9, 2018. a
Menary, M. B., Hodson, D. L., Robson, J. I., Sutton, R. T., Wood, R. A., and Hunt, J. A.: Exploring the impact of CMIP5 model biases on the simulation of North Atlantic decadal variability, Geophys. Res. Lett., 42, 5926–5934, https://doi.org/10.1002/2015GL064360, 2015. a
Met Office: Quality-controlled ocean temperature and salinity profiles and monthly objective analyses with uncertainty estimates, Met Office [data set], https://www.metoffice.gov.uk/hadobs/en4/download-en4-2-2.html, last access: 11 March 2022. a
Met Office: HadISST2.2.0.0: Monthly global sea ice concentration and sea surface temperature data, Met Office [data set], https://www.metoffice.gov.uk/hadobs/hadisst2, last access: 30 July 2024. a
Mignot, J., García-Serrano, J., Swingedouw, D., Germe, A., Nguyen, S., Ortega, P., Guilyardi, E., and Ray, S.: Decadal prediction skill in the ocean with surface nudging in the IPSL-CM5A-LR climate model, Clim. Dynam., 47, 1225–1246, https://doi.org/10.1007/s00382-015-2898-1, 2016. a
Milinski, S., Maher, N., and Olonscheck, D.: How large does a large ensemble need to be?, Earth Syst. Dynam., 11, 885–901, https://doi.org/10.5194/esd-11-885-2020, 2020. a
Moat, B. I., Sinha, B., Berry, D. I., Drijfhout, S. S., Fraser, N., Hermanson, L., Jones, D. C., Josey, S. A., King, B., Macintosh, C., Megann, A., Oltmanns, M., Sanders, R., and Williams, S.: Ocean Heat Convergence and North Atlantic Multidecadal Heat Content Variability, J. Climate, 37, 4723–4742, https://doi.org/10.1175/JCLI-D-23-0370.1, 2024. a
Müller, W. A., Jungclaus, J. H., Mauritsen, T., Baehr, J., Bittner, M., Budich, R., Bunzel, F., Esch, M., Ghosh, R., Haak, H., Ilyina, T., Kleine, T., Kornblueh, L., Li, H., Modali, K., Notz, D., Pohlmann, H., Roeckner, E., Stemmler, I., Tian, F., and Marotzke, J.: A Higher-resolution Version of the Max Planck Institute Earth System Model (MPI-ESM1.2-HR), J. Adv. Model. Earth Sy., 10, 1383–1413, https://doi.org/10.1029/2017MS001217, 2018. a
Nicolì, D., Bellucci, A., Ruggieri, P., Athanasiadis, P. J., Materia, S., Peano, D., Fedele, G., Hénin, R., and Gualdi, S.: The Euro-Mediterranean Center on Climate Change (CMCC) decadal prediction system, Geosci. Model Dev., 16, 179–197, https://doi.org/10.5194/gmd-16-179-2023, 2023. a
Oldenburg, D., Wills, R. C. J., Armour, K. C., Thompson, L., and Jackson, L. C.: Mechanisms of Low-Frequency Variability in North Atlantic Ocean Heat Transport and AMOC, J. Climate, 34, 4733–4755, https://doi.org/10.1175/JCLI-D-20-0614.1, 2021. a
Ortega, P., Montoya, M., González-Rouco, F., Mignot, J., and Legutke, S.: Variability of the Atlantic meridional overturning circulation in the last millennium and two IPCC scenarios, Clim. Dynam., 38, 1925–1947, https://doi.org/10.1007/s00382-011-1081-6, 2012. a
Ortega, P., Mignot, J., Swingedouw, D., Sévellec, F., and Guilyardi, E.: Reconciling two alternative mechanisms behind bi-decadal variability in the North Atlantic, Prog. Oceanogr., 137, 237–249, https://doi.org/10.1016/j.pocean.2015.06.009, 2015. a
Ortega, P., Robson, J. I., Menary, M., Sutton, R. T., Blaker, A., Germe, A., Hirschi, J. J.-M., Sinha, B., Hermanson, L., and Yeager, S.: Labrador Sea subsurface density as a precursor of multidecadal variability in the North Atlantic: a multi-model study, Earth Syst. Dynam., 12, 419–438, https://doi.org/10.5194/esd-12-419-2021, 2021. a, b
Palmer, M. D., Haines, K., Tett, S. F. B., and Ansell, T. J.: Isolating the signal of ocean global warming, Geophys. Res. Lett., 34, L23610, https://doi.org/10.1029/2007GL031712, 2007. a
Palmer, M. D., Roberts, C. D., Balmaseda, M., Chang, Y. S., Chepurin, G., Ferry, N., Fujii, Y., Good, S. A., Guinehut, S., Haines, K., Hernandez, F., Köhl, A., Lee, T., Martin, M. J., Masina, S., Masuda, S., Peterson, K. A., Storto, A., Toyoda, T., Valdivieso, M., Vernieres, G., Wang, O., and Xue, Y.: Ocean heat content variability and change in an ensemble of ocean reanalyses, Clim. Dynam., 49, 909–930, https://doi.org/10.1007/s00382-015-2801-0, 2017. a
Passos, L., Langehaug, H. R., Årthun, M., Eldevik, T., Bethke, I., and Kimmritz, M.: Impact of initialization methods on the predictive skill in NorCPM: an Arctic – Atlantic case study, Clim. Dynam., 60, 2061–2080, https://doi.org/10.1007/s00382-022-06437-4, 2023. a
Piecuch, C. G., Ponte, R. M., Little, C. M., Buckley, M. W., and Fukumori, I.: Mechanisms underlying recent decadal changes in subpolar North Atlantic Ocean heat content, J. Geophys. Res.-Oceans, 122, 7181–7197, https://doi.org/10.1002/2017JC012845, 2017. a
Pohlmann, H., Jungclaus, J. H., Köhl, A., Stammer, D., and Marotzke, J.: Initializing decadal climate predictions with the GECCO oceanic synthesis: Effects on the North Atlantic, J. Climate, 22, 3926–3938, https://doi.org/10.1175/2009JCLI2535.1, 2009. a
Polkova, I., Brune, S., Kadow, C., Romanova, V., Gollan, G., Baehr, J., Glowienka-Hense, R., Greatbatch, R. J., Hense, A., Illing, S., Köhl, A., Kröger, J., Müller, W. A., Pankatz, K., and Stammer, D.: Initialization and Ensemble Generation for Decadal Climate Predictions: A Comparison of Different Methods, J. Adv. Model. Earth Sy., 11, 149–172, https://doi.org/10.1029/2018MS001439, 2019. a
Polkova, I., Swingedouw, D., Hermanson, L., Köhl, A., Stammer, D., Smith, D., Kröger, J., Bethke, I., Yang, X., Zhang, L., Nicolì, D., Athanasiadis, P. J., Karami, M. P., Pankatz, K., Pohlmann, H., Wu, B., Bilbao, R., Ortega, P., Yang, S., Sospedra-Alfonso, R., Merryfield, W., Kataoka, T., Tatebe, H., Imada, Y., Ishii, M., and Matear, R. J.: Initialization shock in the ocean circulation reduces skill in decadal predictions of the North Atlantic subpolar gyre, Frontiers in Climate, 5, 1273770, https://doi.org/10.3389/fclim.2023.1273770, 2023. a, b, c
Qin, M., Dai, A., and Hua, W.: Quantifying Contributions of Internal Variability and External Forcing to Atlantic Multidecadal Variability Since 1870, Geophys. Res. Lett., 47, e2020GL089504, https://doi.org/10.1029/2020GL089504, 2020. a
Rahmstorf, S., Box, J. E., Feulner, G., Mann, M. E., Robinson, A., Rutherford, S., and Schaffernicht, E. J.: Exceptional twentieth-century slowdown in Atlantic Ocean overturning circulation, Nat. Clim. Change, 5, 475–480, https://doi.org/10.1038/nclimate2554, 2015. a, b
Righi, M., Andela, B., Eyring, V., Lauer, A., Predoi, V., Schlund, M., Vegas-Regidor, J., Bock, L., Brötz, B., de Mora, L., Diblen, F., Dreyer, L., Drost, N., Earnshaw, P., Hassler, B., Koldunov, N., Little, B., Loosveldt Tomas, S., and Zimmermann, K.: Earth System Model Evaluation Tool (ESMValTool) v2.0 – technical overview, Geosci. Model Dev., 13, 1179–1199, https://doi.org/10.5194/gmd-13-1179-2020, 2020. a
Robson, J., Ortega, P., and Sutton, R.: A reversal of climatic trends in the North Atlantic since 2005, Nat. Geosci., https://doi.org/10.1038/ngeo2727, 2016. a, b
Robson, J., Polo, I., Hodson, D. L., Stevens, D. P., and Shaffrey, L. C.: Decadal prediction of the North Atlantic subpolar gyre in the HiGEM high-resolution climate model, Clim. Dynam., 50, 921–937, https://doi.org/10.1007/s00382-017-3649-2, 2018. a
Robson, J. I., Sutton, R. T., and Smith, D. M.: Initialized decadal predictions of the rapid warming of the North Atlantic Ocean in the mid 1990s, Geophys. Res. Lett., 39, 1–6, https://doi.org/10.1029/2012GL053370, 2012. a
Sellar, A. A., Walton, J., Jones, C. G., Wood, R., Abraham, N. L., Andrejczuk, M., Andrews, M. B., Andrews, T., Archibald, A. T., de Mora, L., Dyson, H., Elkington, M., Ellis, R., Florek, P., Good, P., Gohar, L., Haddad, S., Hardiman, S. C., Hogan, E., Iwi, A., Jones, C. D., Johnson, B., Kelley, D. I., Kettleborough, J., Knight, J. R., Köhler, M. O., Kuhlbrodt, T., Liddicoat, S., Linova-Pavlova, I., Mizielinski, M. S., Morgenstern, O., Mulcahy, J., Neininger, E., O'Connor, F. M., Petrie, R., Ridley, J., Rioual, J. C., Roberts, M., Robertson, E., Rumbold, S., Seddon, J., Shepherd, H., Shim, S., Stephens, A., Teixiera, J. C., Tang, Y., Williams, J., Wiltshire, A., and Griffiths, P. T.: Implementation of U.K. Earth System Models for CMIP6, J. Adv. Model. Earth Sy., 12, 1–27, https://doi.org/10.1029/2019MS001946, 2020. a
Siegert, S., Bellprat, O., Ménégoz, M., Stephenson, D. B., and Doblas-Reyes, F. J.: Detecting improvements in forecast correlation skill: Statistical testing and power analysis, Mon. Weather Rev., 145, 437–450, https://doi.org/10.1175/MWR-D-16-0037.1, 2017. a
Smith, D. M., Eade, R., and Pohlmann, H.: A comparison of full-field and anomaly initialization for seasonal to decadal climate prediction, Clim. Dynam., 41, 3325–3338, https://doi.org/10.1007/s00382-013-1683-2, 2013. a
Smith, D. M., Eade, R., Scaife, A. A., Caron, L.-P., Danabasoglu, G., DelSole, T. M., Delworth, T., Doblas-Reyes, F. J., Dunstone, N. J., Hermanson, L., Kharin, V., Kimoto, M., Merryfield, W. J., Mochizuki, T., Müller, W. A., Pohlmann, H., Yeager, S., and Yang, X.: Robust skill of decadal climate predictions, npj Climate and Atmospheric Science, 2, 1–10, https://doi.org/10.1038/s41612-019-0071-y, 2019. a
Smith, D. M., Scaife, A. A., Eade, R., Athanasiadis, P., Bellucci, A., Bethke, I., Bilbao, R., Borchert, L. F., Caron, L. P., Counillon, F., Danabasoglu, G., Delworth, T., Doblas-Reyes, F. J., Dunstone, N. J., Estella-Perez, V., Flavoni, S., Hermanson, L., Keenlyside, N., Kharin, V., Kimoto, M., Merryfield, W. J., Mignot, J., Mochizuki, T., Modali, K., Monerie, P. A., Müller, W. A., Nicolí, D., Ortega, P., Pankatz, K., Pohlmann, H., Robson, J., Ruggieri, P., Sospedra-Alfonso, R., Swingedouw, D., Wang, Y., Wild, S., Yeager, S., Yang, X., and Zhang, L.: North Atlantic climate far more predictable than models imply, Nature, 583, 796–800, https://doi.org/10.1038/s41586-020-2525-0, 2020. a
Sospedra-Alfonso, R., Merryfield, W. J., Boer, G. J., Kharin, V. V., Lee, W.-S., Seiler, C., and Christian, J. R.: Decadal climate predictions with the Canadian Earth System Model version 5 (CanESM5), Geosci. Model Dev., 14, 6863–6891, https://doi.org/10.5194/gmd-14-6863-2021, 2021. a
Sutton, R. T. and Hodson, D. L. R.: Atlantic Ocean Forcing of North American and European Summer Climate, Science, 309, 115–118, https://doi.org/10.1126/science.1109496, 2005. a
Swart, N. C., Cole, J. N. S., Kharin, V. V., Lazare, M., Scinocca, J. F., Gillett, N. P., Anstey, J., Arora, V., Christian, J. R., Hanna, S., Jiao, Y., Lee, W. G., Majaess, F., Saenko, O. A., Seiler, C., Seinen, C., Shao, A., Sigmond, M., Solheim, L., von Salzen, K., Yang, D., and Winter, B.: The Canadian Earth System Model version 5 (CanESM5.0.3), Geosci. Model Dev., 12, 4823–4873, https://doi.org/10.5194/gmd-12-4823-2019, 2019. a
Tietsche, S., Balmaseda, M., Zuo, H., Roberts, C., Mayer, M., and Ferranti, L.: The importance of North Atlantic Ocean transports for seasonal forecasts, Clim. Dynam., 55, 1995–2011, https://doi.org/10.1007/s00382-020-05364-6, 2020. a
Titchner, H. A. and Rayner, N. A.: The Met Office Hadley Centre sea ice and sea surface temperature data set, version 2: 1. Sea ice concentrations, J. Geophys. Res.-Atmos., 119, 2864–2889, https://doi.org/10.1002/2013JD020316, 2014. a
Volpi, D., Guemas, V., and Doblas-Reyes, F. J.: Comparison of full field and anomaly initialisation for decadal climate prediction: towards an optimal consistency between the ocean and sea-ice anomaly initialisation state, Clim. Dynam., 49, 1181–1195, https://doi.org/10.1007/s00382-016-3373-3, 2017. a, b, c
Volpi, D., Meccia, V. L., Guemas, V., Ortega, P., Bilbao, R., Doblas-Reyes, F. J., Amaral, A., Echevarria, P., Mahmood, R., and Corti, S.: A Novel Initialization Technique for Decadal Climate Predictions, Frontiers in Climate, 3, 1–14, https://doi.org/10.3389/fclim.2021.681127, 2021. a
Yashayaev, I. and Loder, J. W.: Recurrent replenishment of Labrador Sea Water and associated decadal-scale variability, J. Geophys. Res.-Oceans, 121, 8095–8114, https://doi.org/10.1002/2016JC012046, 2016. a, b
Yeager, S.: The abyssal origins of North Atlantic decadal predictability, Clim. Dynam., 55, 2253–2271, https://doi.org/10.1007/s00382-020-05382-4, 2020. a
Yeager, S., Kim, W., and Robson, J.: What caused the Atlantic Cold Blob of 2015?, US CLIVAR Var, 14, 24–31, 2016. a
Yeager, S. G., Danabasoglu, G., Rosenbloom, N. A., Strand, W., Bates, S. C., Meehl, G. A., Karspeck, A. R., Lindsay, K., Long, M. C., Teng, H., and Lovenduski, N. S.: Predicting near-term changes in the earth system: A large ensemble of initialized decadal prediction simulations using the community earth system model, B. Am. Meteorol. Soc., 99, 1867–1886, https://doi.org/10.1175/BAMS-D-17-0098.1, 2018. a
Yeager, S. G., Chang, P., Danabasoglu, G., Rosenbloom, N., Zhang, Q., Castruccio, F. S., Gopal, A., Cameron Rencurrel, M., and Simpson, I. R.: Reduced Southern Ocean warming enhances global skill and signal-to-noise in an eddy-resolving decadal prediction system, npj Climate and Atmospheric Science, 6, 107, https://doi.org/10.1038/s41612-023-00434-y, 2023. a
Yukimoto, S., Kawai, H., Koshiro, T., Oshima, N., Yoshida, K., Urakawa, S., Tsujino, H., Deushi, M., Tanaka, T., Hosaka, M., Yabu, S., Yoshimura, H., Shindo, E., Mizuta, R., Obata, A., Adachi, Y., and Ishii, M.: The meteorological research institute Earth system model version 2.0, MRI-ESM2.0: Description and basic evaluation of the physical component, J. Meteorol. Soc. Jpn, 97, 931–965, https://doi.org/10.2151/jmsj.2019-051, 2019. a
Zanna, L., Khatiwala, S., Gregory, J. M., Ison, J., and Heimbach, P.: Global reconstruction of historical ocean heat storage and transport, P. Natl. Acad. Sci. USA, 116, 1126–1131, https://doi.org/10.1073/pnas.1808838115, 2019. a
Zhang, R. and Delworth, T. L.: Impact of Atlantic multidecadal oscillations on India/Sahel rainfall and Atlantic hurricanes, Geophys. Res. Lett., 33, L17712, https://doi.org/10.1029/2006GL026267, 2006. a
Zuo, H., Balmaseda, M. A., Tietsche, S., Mogensen, K., and Mayer, M.: The ECMWF operational ensemble reanalysis–analysis system for ocean and sea ice: a description of the system and assessment, Ocean Sci., 15, 779–808, https://doi.org/10.5194/os-15-779-2019, 2019. a