the Creative Commons Attribution 4.0 License.
the Creative Commons Attribution 4.0 License.
 | 26 Apr 2024
Impact of volcanic eruptions on CMIP6 decadal predictions: a multi-model analysis
Pablo Ortega
Didier Swingedouw
Leon Hermanson
Panos Athanasiadis
Rosie Eade
Marion Devilliers
Francisco Doblas-Reyes
Nick Dunstone
An-Chi Ho
William Merryfield
Juliette Mignot
Dario Nicolì
Margarida Samsó
Reinel Sospedra-Alfonso
Stephen Yeager
In recent decades, three major volcanic eruptions of different intensity have occurred (Mount Agung in 1963, El Chichón in 1982 and Mount Pinatubo in 1991), with reported climate impacts on seasonal to decadal timescales that could have been potentially predicted with accurate and timely estimates of the associated stratospheric aerosol loads. The Decadal Climate Prediction Project component C (DCPP-C) includes a protocol to investigate the impact of volcanic aerosols on the climate experienced during the years that followed those eruptions through the use of decadal predictions. The interest of conducting this exercise with climate predictions is that, thanks to the initialisation, they start from the observed climate conditions at the time of the eruptions, which helps to disentangle the climatic changes due to the initial conditions and internal variability from the volcanic forcing.
The protocol consists of repeating the retrospective predictions that are initialised just before the last three major volcanic eruptions but without the inclusion of their volcanic forcing, which are then compared with the baseline predictions to disentangle the simulated volcanic effects upon climate. We present the results from six Coupled Model Intercomparison Project Phase 6 (CMIP6) decadal prediction systems. These systems show strong agreement in predicting the well-known post-volcanic radiative effects following the three eruptions, which induce a long-lasting cooling in the ocean. Furthermore, the multi-model multi-eruption composite is consistent with previous work reporting an acceleration of the Northern Hemisphere polar vortex and the development of El Niño conditions the first year after the eruption, followed by a strengthening of the Atlantic Meridional Overturning Circulation the subsequent years. Our analysis reveals that all these dynamical responses are both model- and eruption-dependent.
A novel aspect of this study is that we also assess whether the volcanic forcing improves the realism of the predictions. Comparing the predicted surface temperature anomalies in the two sets of hindcasts (with and without volcanic forcing) with observations we show that, overall, including the volcanic forcing results in better predictions. The volcanic forcing is found to be particularly relevant for reproducing the observed sea surface temperature (SST) variability in the North Atlantic Ocean following the 1991 eruption of Pinatubo.
- Article
(15545 KB) - Full-text XML
-
Supplement
(7693 KB) - BibTeX
- EndNote


Decadal climate predictions have become a major tool for forecasting the climate of the next few years out to several decades (e.g. Hermanson et al., 2022). On these timescales, part of the predictability arises from internal variability, in particular in the slowly evolving components of the climate system (e.g. the ocean). This predictability can be improved by initialising the model with the observed state to put the model in phase with observed internal variability. The other main source of predictability relates to the changes in external radiative forcings (i.e. changes in the climate system energy balance), which can be of natural (e.g. solar irradiance and volcanic aerosols) or anthropogenic (e.g. greenhouse gas concentrations, land use changes and anthropogenic aerosols) origin. At the global scale, most of the observed surface temperature changes can be explained by the warming caused by the increasing atmospheric greenhouse gas concentrations, which are partly compensated for by the cooling caused by anthropogenic aerosols, and the sporadic cooling episodes that followed the major volcanic eruptions. Hence, including the volcanic forcing and correctly simulating its impacts is a major input for reproducing the observed climate variability in the immediate years after their occurrence. Furthermore, from a climate forecasting perspective, if a major volcanic eruption were to occur, it would be necessary to run new forecasts including the respective forcing since the former may significantly impact how the climate evolves in the following years.
In recent decades three major tropical volcanic eruptions have occurred: Mount Agung (1963), El Chichón (1982) and Mount Pinatubo (1991). These eruptions of varying intensity (7, 8 and 18 Tg of SO2, respectively) had climate impacts on seasonal to decadal timescales with high predictive potential (e.g. Timmreck et al., 2016; Ménégoz et al., 2018a; Hermanson et al., 2020). Explosive volcanic eruptions affect climate by injecting large quantities of sulfur dioxide (as well as other gases like water vapour, CO2 and dust) into the stratosphere, where it oxidises to form sulfate aerosols. The presence of sulfate aerosols in the stratosphere has two main effects: (1) reflecting part of the incoming solar radiation, causing a negative radiative forcing that cools the Earth's surface, an effect that may last for several years (until the aerosols return to the surface), and (2) absorbing infrared radiation and blocking the outgoing longwave radiation, which may lead to a local warming of the stratosphere (Robock, 2000). These temperature adjustments may subsequently lead to other climate impacts on seasonal to decadal timescales (see Marshall et al., 2022, for a review), such as atmospheric and oceanic dynamical changes, which may modulate climate variability.
Observational and modelling studies have shown the increased likelihood of a positive phase of the Northern Annular Mode (NAM) or a positive North Atlantic Oscillation (NAO) like response in the first winter following the eruptions (e.g. Robock, 2000; Christiansen, 2008). The positive NAM/NAO response has been explained by the acceleration of the Northern Hemisphere polar vortex as a result of the anomalous Equator-to-pole temperature gradient in the stratosphere, caused by the post-volcanic stratospheric warming in the lower latitudes (e.g. Graf et al., 1993; Stenchikov et al., 2002). Such a response has been linked to warming over the northern Eurasian continent in winter, consistent with studies based on observations (e.g. Robock and Mao, 1992; Shindell et al., 2004), although these are limited to few large volcanic eruptions. Paleoclimate studies based on proxy reconstructions show a robust NAO response for eruptions larger than Pinatubo (e.g. Ortega et al., 2015; Michel et al., 2020). Modelling studies have shown a wide range of results. While some modelling studies have concluded that Coupled Model Intercomparison Project Phase 5 (CMIP5) climate models might be unrealistic by underestimating the Northern Hemisphere polar vortex response (e.g. Driscoll et al., 2012; Charlton-Perez et al., 2013), Bittner et al. (2016) showed that, disregarding the smaller eruptions and only including Krakatoa (1883) and Pinatubo (1991), the models on average do simulate a strengthening of the vortex. More recent studies have highlighted the need for large ensembles and/or very strong volcanic eruptions (e.g. Tambora in 1815) to detect climate signals such as the NH polar vortex strengthening or the Eurasian winter surface warming, as these can be overwhelmed by internal variability (e.g. Ménégoz et al., 2018b; Polvani et al., 2019; Azoulay et al., 2021; DallaSanta and Polvani, 2022). Furthermore, it is still unclear whether these signals might be underestimated due to the signal-to-noise ratio problem affecting the North Atlantic atmospheric circulation in the current generation of Earth system models (Scaife and Smith, 2018). In fact, Hermanson et al. (2020) show that the NAO anomaly in the first winter after the eruption is about 7 times weaker in the climate predictions than in the observations, despite the stratospheric heating having the right magnitude.
Volcanic eruptions also impact the tropical Pacific Ocean variability. Despite some discrepancies across studies regarding the response of the El Niño–Southern Oscillation (ENSO) to volcanic eruptions, most studies show an El Niño-like response in the first year following an eruption (e.g. Meehl et al., 2015; Maher et al., 2015; Swingedouw et al., 2017; McGregor et al., 2020; Hermanson et al., 2020). Three main mechanisms have been proposed that trigger changes in the ENSO state following a large tropical volcanic eruption: (1) the “ocean dynamical thermostat” mechanism (ODT) (Clement et al., 1996), (2) Maritime Continent land–ocean temperature gradient (Predybaylo et al., 2017) and (3) altered Walker circulation in response to the reduction of tropical precipitation over Africa (Khodri et al., 2017). There is no consensus as to which mechanism dominates. For example, Pausata et al. (2023) show with idealised climate model simulations that the northern Africa teleconnection mechanism plays the largest role in the Norwegian Earth system model, while the ODT mechanism is absent. However, mechanisms might be different for other models, and it is important to keep in mind that widespread observations following major tropical eruptions are limited to the recent eruptions of Mount Agung, El Chichón and Mount Pinatubo, all coinciding with developing El Niño events, which might have conditioned the response (Lehner et al., 2016).
Decadal prediction studies have found that the inclusion of volcanic forcing degrades the forecast skill in the tropical Pacific region on multi-annual to decadal timescales (e.g. Timmreck et al., 2016; Meehl et al., 2015; Wu et al., 2023), indicating that models may not be realistically simulating part of the response to volcanic eruptions. Wu et al. (2023) show that following the eruptions of Agung, El Chichón and Pinatubo the observed tropical Pacific warming is better predicted by CESM1 decadal hindcasts that do not include the volcanic forcing, while decadal hindcasts (and non-initialised historical simulations) that include the volcanic forcing simulate a cooling that was not observed. Likewise, Schurer et al. (2023) show that in HadCM3 simulations the cooling response following major volcanic eruptions is overestimated unless the correct ENSO evolution is assimilated.
The Atlantic Ocean is another region of relevance following volcanic eruptions. The Atlantic multidecadal variability (AMV) is a North Atlantic basin-wide sea surface temperature (SST) fluctuation on decadal timescales (Knight et al., 2005). Previous studies have shown that volcanic eruptions can impact the AMV via the direct surface cooling induced by the changes in radiation (Otterå et al., 2010; Swingedouw et al., 2017). The AMV can also respond indirectly to the volcanic eruptions in response to induced changes in the Atlantic Meridional Overturning Circulation (AMOC) and associated heat transports (e.g. Zhang et al., 2019). Studies have shown that on multiannual to decadal timescales, the strength of the AMOC increases in response to large volcanic eruptions (e.g. Stenchikov et al., 2009; Mignot et al., 2011; Ding et al., 2014; Otto-Bliesner et al., 2016; Swingedouw et al., 2015; Hermanson et al., 2020; Fang et al., 2021; Borchert et al., 2021). Two main mechanisms have been proposed to explain this strengthening: (1) an initial dynamical adjustment to the negative surface wind stress anomaly over the subpolar North Atlantic (Mignot et al., 2011; Zanchettin et al., 2012) and (2) reduced sea surface temperature and increased salinity (due to reduced precipitation) enhancing deep convection and a subsequent weakening of density stratification in the Labrador Sea (e.g. Iwi et al., 2012; Ortega et al., 2012; Stenchikov et al., 2009; Swingedouw et al., 2015). Despite the general consensus on the AMOC strengthening, its magnitude has been shown to be sensitive to the background conditions, eruption magnitude and climate model considered (Ding et al., 2014; Swingedouw et al., 2015). The strengthening of the AMOC may lead to a warming of the North Atlantic subpolar gyre several years later (Swingedouw et al., 2015), implying that variability in this region could be strongly related to the volcanic forcing. For example, Borchert et al. (2021) show that a significant proportion of the observed subpolar gyre SST variations in recent decades may be a response to the eruptions of Agung in 1963, El Chichón in 1982 and Pinatubo in 1991. This might be related to the mechanism proposed in Swingedouw et al. (2015), which suggested that the response to subsequent major volcanic eruptions could modulate the decadal variability of the AMOC via constructive or destructive interferences, a mechanism that is also consistent with more recent climate model simulations (Borchert et al., 2021).
This study will comprehensively analyse the climate response following the eruptions of Mount Agung (1963), El Chichón (1982) and Mount Pinatubo (1991) using a multi-model set of decadal predictions which follow a purposefully designed experimental protocol and builds upon the study of Hermanson et al. (2020). We analyse simulations from six decadal prediction systems contributing to the CMIP6 Decadal Climate Prediction Project (DCPP Boer et al., 2016). The DCPP jointly with VolMIP (Zanchettin et al., 2016) defined a set of coordinated experiments (component C) directed toward understanding the influence of volcanic eruptions on decadal prediction and the consequences for decadal prediction. The fact that these simulations are decadal hindcasts which are initialised with the observed state implies that the climate response might be more realistic (with respect to non-initialised simulations) and directly comparable to observations, as internal variability can modulate the response to the volcanic forcing. With respect to the earlier analyses carried out in Hermanson et al. (2020), this study uses more recent models and a larger ensemble, which allows us to better detect potentially weak signals, and longer forecast outlooks up to 9 years, which allows us to investigate the response on longer timescales. Another addition with respect to Hermanson et al. (2020) is that we explore the differences among the three eruptions and prediction systems when possible. Finally, to fully exploit the decadal prediction protocol we compare the predicted surface temperature anomalies with observations to infer the importance of including the volcanic forcing, attribute observed changes and determine to what extent the initial conditions can improve the agreement in the three hindcasts. The paper is organised as follows. Section 2 provides a description of the DCPP protocol, a description of the decadal forecast systems used and the statistical methods used. In Sect. 3 we present the results evaluating the global mean and regional impacts of volcanic eruptions, focusing on the short- and longer-term responses and the particular responses in the Pacific and Atlantic oceans. The final section discusses and summarises the key results of this study.
In this study we use six state-of-the-art decadal predictions (the details of each system are summarised in Table 1) that follow the CMIP6 DCPP protocols A and C (Boer et al., 2016). The DCPP component A consists of 10-member ensembles of 10-year-long retrospective predictions initialised from an observation-based state every year from 1960 to 2018 that are forced with CMIP6 historical values of atmospheric composition and/or emissions. With the objective of isolating the impact of the major volcanic eruptions that occurred during this period, the DCPP component C proposed repeating the predictions initialised right before the eruptions of Mount Agung (1963), El Chichón (1982) and Mount Pinatubo (1991) but replacing the volcanic forcing by the “background” volcanic aerosol forcing, computed as the mean over the period 1850–2014. This study analyses and compares the two sets of prediction ensembles for the 1962, 1981 and 1990 start dates. This makes a total of 2×60 members to characterise the multi-model response per eruption and 2×180 members when the eruptions are combined. The impact of the volcanic eruptions is determined by subtracting the predictions with and without the volcanic aerosols (DCPP-A – DCPP-C). Since both prediction ensembles are initialised in the same way, we assume the forecast drift to be the same, and it is therefore removed. These decadal prediction systems are initialised on either 30 October or 31 December, depending on the model; therefore, we discard the first 2 months of the models initialised on 30 October and consider January of the year of the eruptions to be the nominal start date.
Sospedra-Alfonso et al. (2021)Yeager et al. (2018)Nicolì et al. (2023)Bilbao et al. (2021)Estella-Perez et al. (2020)Williams et al. (2018)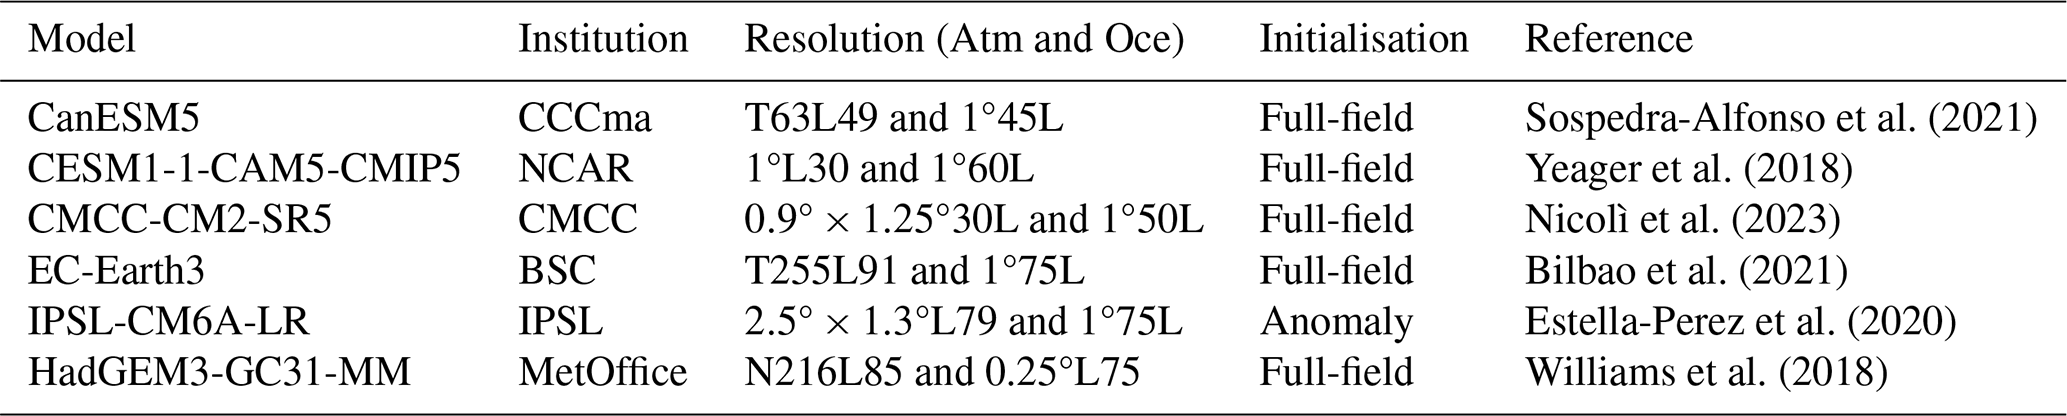
These prediction systems use prescribed CMIP6 volcanic forcings (Luo, 2018; Thomason et al., 2018), except for CESM1-1-CAM5-CMIP5, which uses prescribed volcanic forcing from Ammann et al. (2003). In these models the volcanic aerosols are represented by monthly mean and zonal mean aerosol optical properties, which are prescribed in the radiation code with a vertical profile in the stratosphere. Figure 1 shows the CMIP6 stratospheric aerosol optical depth (AOD) at 530 nm for the eruptions of Agung in March 1963, for El Chichón in February 1982 and Pinatubo in June 1991. Note that while the main stratospheric AOD perturbation is due to these three large volcanic eruptions, the impact of smaller eruptions is also included in the CMIP6 forcing. It is expected that the uncertainty in the forcing is larger for the eruption of Agung than for the other two eruptions (e.g. Niemeier et al., 2019), since this eruption occurred during the pre-satellite era and it is estimated with the AER-2D model (Arfeuille et al., 2014) from ground-based measurements. The global mean AOD (Fig. 1a) shows that the 1991 eruption of mount Pinatubo was the largest eruption of the three. The eruptions of Agung and El Chichón are more or less comparable in magnitude, although the tropical average (30° N–30° S) for El Chichón is half the magnitude of the other two eruptions (Fig. 1b). There are evident differences in the geographical distribution of the forcing among the eruptions. The eruption of Pinatubo was approximately hemispherically symmetric, while the eruption of Agung mainly affected the Southern Hemisphere and the eruption of El Chichón the Northern Hemisphere (Fig. 1c and d). These differences are relevant to explain the climate impacts, as will be discussed in later sections.
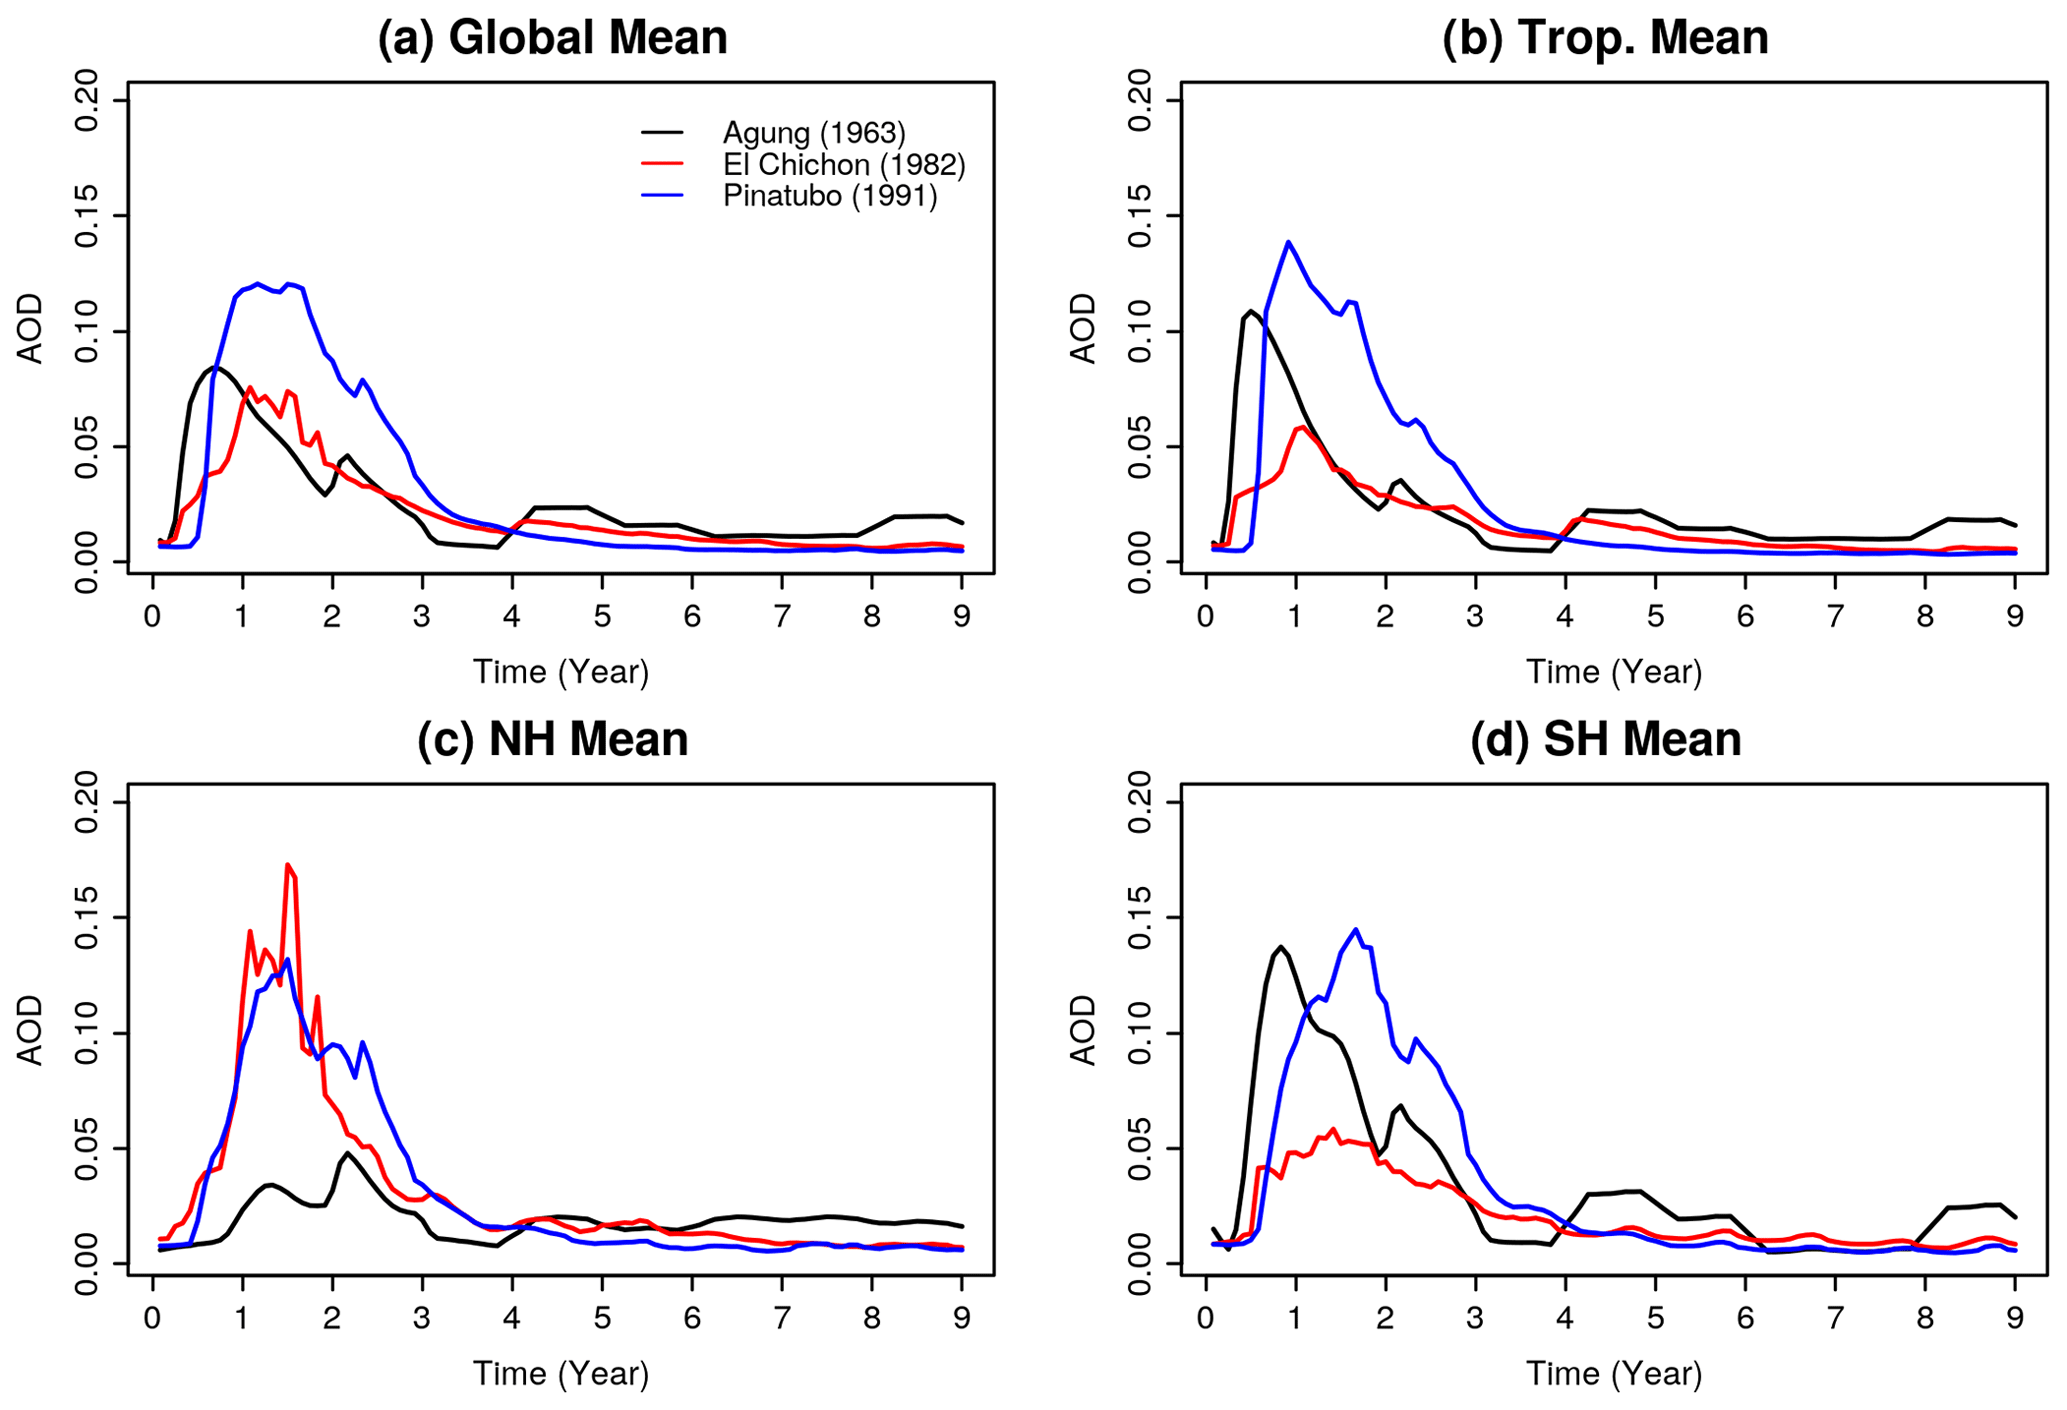
Figure 1CMIP6 aerosol forcing optical depth at 530 nm for the eruptions of Mount Agung, El Chichón and Mount Pinatubo for different regions. t=0 is the eruption year for each eruption (starting in 1963, 1982 and 1991, respectively).
In these models, as in the previous generation (Hermanson et al., 2020), ozone concentrations vary slowly and therefore the impacts arising from ozone depletion by the volcanic aerosols are not represented in these experiments.
The differences (DCPP-A minus DCPP-C) for both time series and fields is significance-tested by creating a distribution of 10-member mean differences by bootstrap with replacement of ensemble members from 1000 repetitions. If the differences fall outside of the 2.5 %–97.5 % quantile range of the distribution (equivalent to p≤0.05) we reject the null hypothesis (no difference between the DCPP-A and DCPP-C hindcasts) and the differences are considered significant. For the time series plots, the uncertainty is shown by the 10th and the 90th percentiles of the multi-model ensemble (formed by individual model members). For the multi-model maps, in addition to the statistical significance of the differences, we also show the agreement among decadal prediction systems, which is shaded when all the models agree on the sign of the anomaly.
In this paper we compare the predicted surface temperature in the three hindcasts of DCPP-A and the DCPP-C experiments, initialised in 1963, 1982 and 1991, against observations. To compute the anomalies we compute the lead-time-dependent climatology for the period 1970–2005 using the DCPP-A decadal hindcasts initialised in 1960–2015. Forecast drift is assumed to be equal in the DCPP-A and DCPP-C hindcast sets. The observational datasets used for verification are HadCRUT5 (Morice et al., 2021) for near-surface temperature and HadSST.4.0.1.0 (Kennedy et al., 2019) for sea surface temperature. To determine whether the predicted anomalies in the DCPP-A or the DCPP-C hindcast are closer to the observations we use the root mean square error (RMSE). When considering spatial fields we compute the area-weighted RMSE. Note that here the RMSE is not used as a forecast skill metric, but rather to compare the error in each of the hindcast sets and determine the impact of the volcanic forcing.
3.1 Global mean volcanic response
Figure 2 shows the global mean net top-of-atmosphere (TOA) radiation flux response (DCPP-A minus DCPP-C) to the individual volcanic eruptions and the mean of the three. The TOA flux is computed as the incoming shortwave (i.e. the rsdt CMIP6 variable) minus the outgoing shortwave (i.e. rsut) and longwave radiation (i.e. rlut) fluxes. The climate predictions show a statistically significant post-volcanic decrease in global mean TOA which is consistent across the models, generally peaking in the first boreal winter. There are differences, however, in the magnitude of the response and the recovery following the three volcanic eruptions, coherent with the volcanic aerosol forcing (Fig. 1). After the eruption of Agung, the negative TOA anomalies reach approximately −1.7 ± 0.4 W m−2 (model mean ± the inter-model standard deviation) and recover within the next months. The TOA response for the eruption of El Chichón is the weakest and the only one in which the model spread overlaps with the zero line, with the ensemble mean response reaching approximately −0.9 ± 0.2 W m−2 and recovering within the next year. The response to the eruption of Pinatubo shows the strongest TOA negative anomalies of the three, reaching approximately −2.3 ± 0.3 W m−2 and recovering in approximately 2 years. These results are consistent with those of Zanchettin et al. (2022).
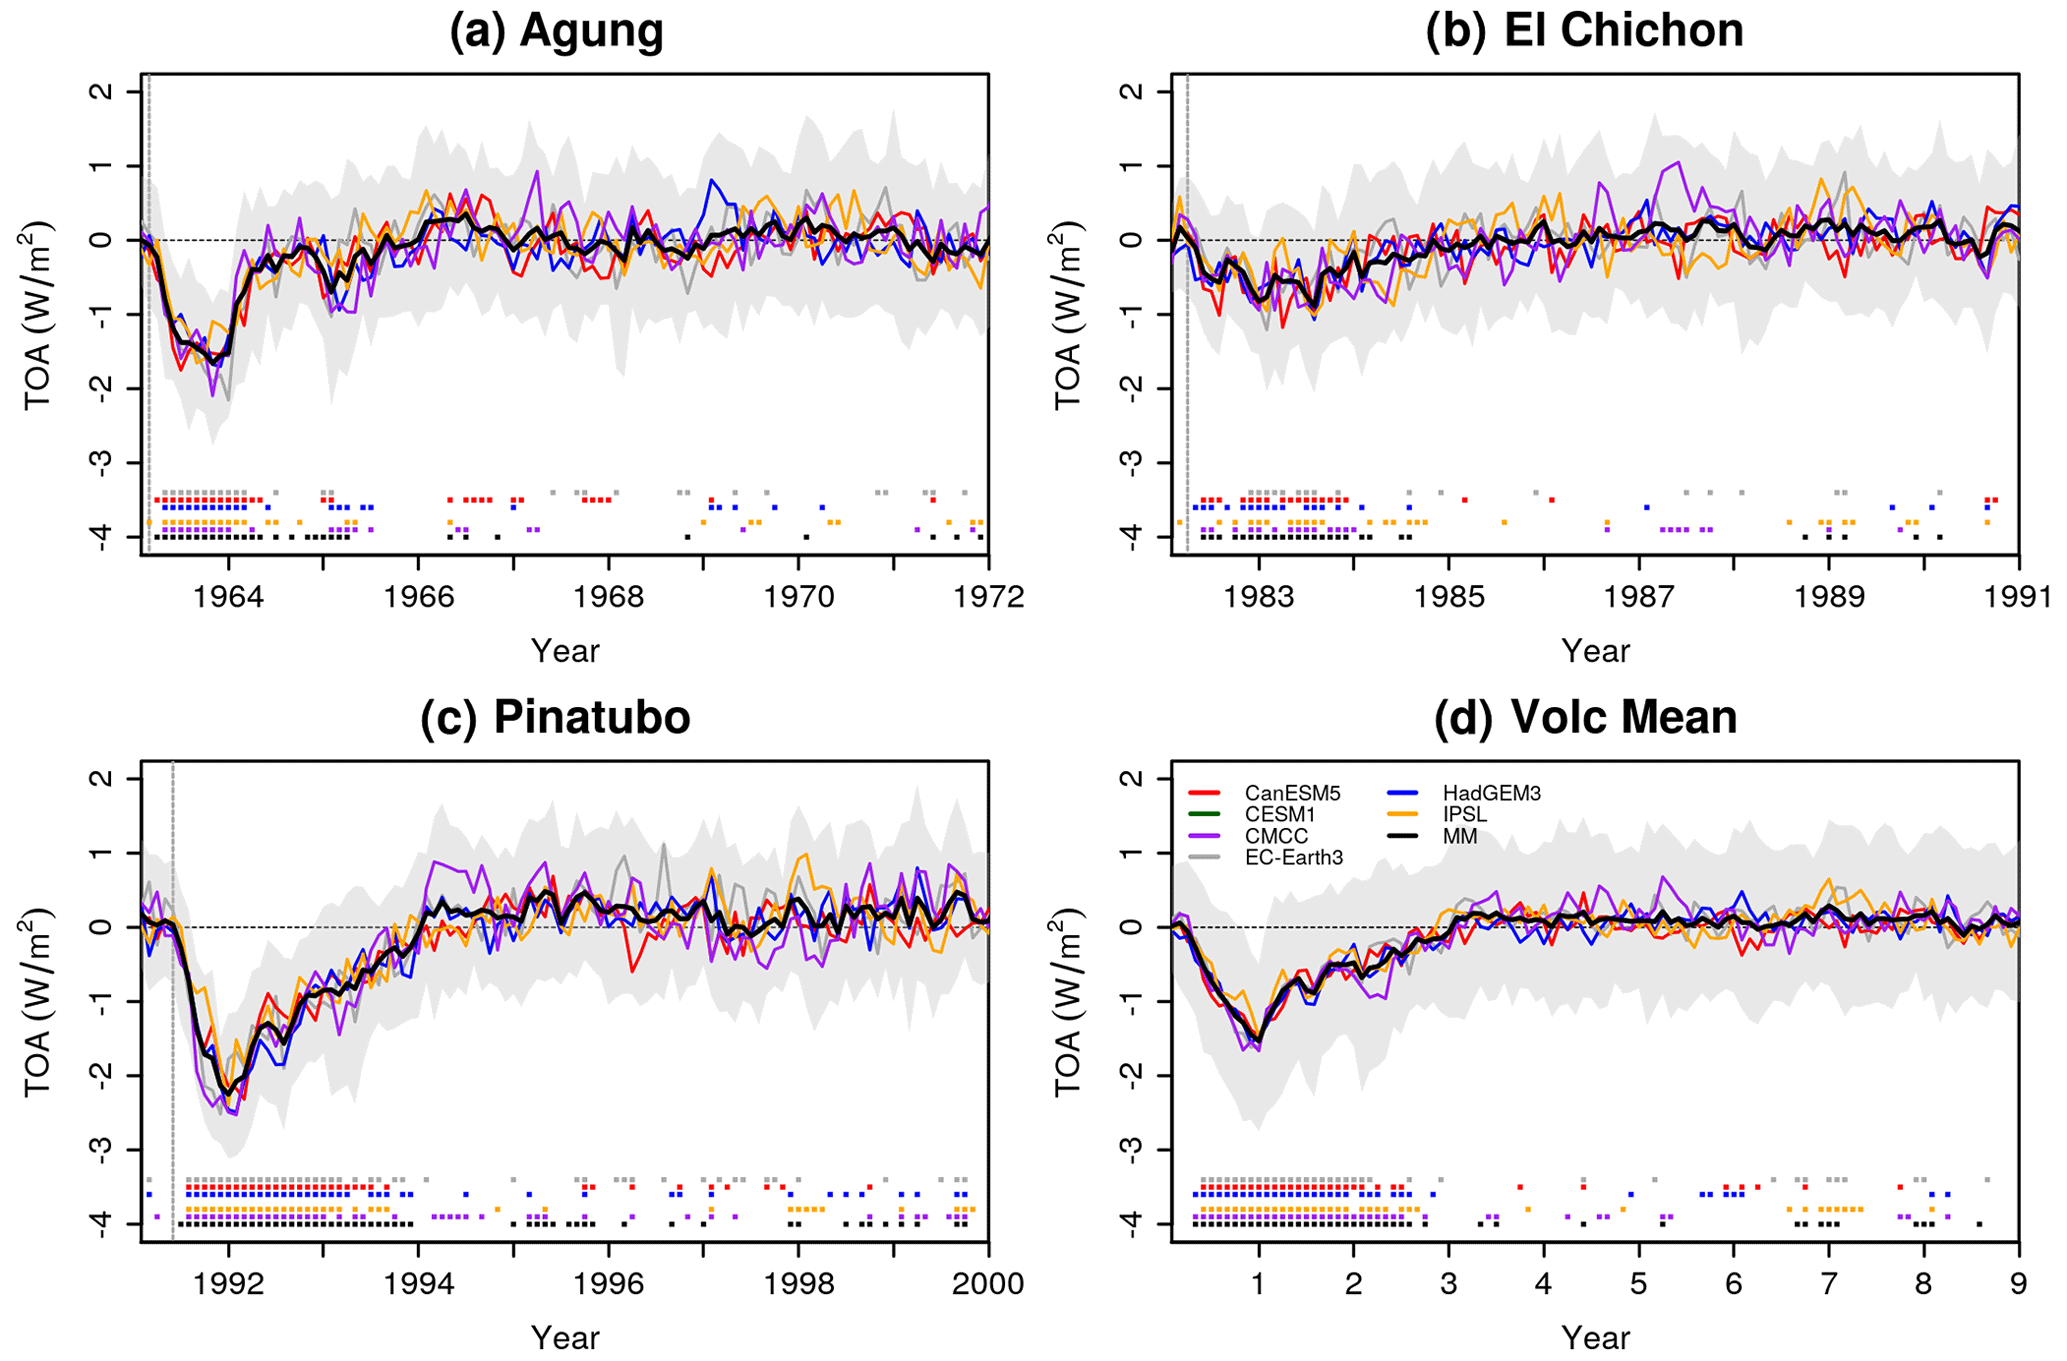
Figure 2Global mean top-of-atmosphere radiation response (W m−2) to the volcanic eruptions (DCPP-A minus DCPP-C). The ensemble mean for each model and the multi-model mean are shown. The shading is the multi-model member spread calculated as the 10th and 90th percentiles of the entire ensemble. Filled squares at the bottom part of the figure indicate statistically significant differences (see the Methods section). The vertical dashed grey lines indicate the approximate time of the eruptions. The data for CESM1-1-CAM5-CMIP5 were not included since they are not available. Figure inspired by Zanchettin et al. (2022).
In response to the negative TOA anomalies following the volcanic eruptions, the global mean surface temperature decreases (Fig. 3). The cooling anomalies peak in the second year and subsequently recover in approximately 5 years. Similarly to the TOA response, the prediction systems generally show a comparable global mean surface temperature response for the individual eruptions, although noisier, and the differences are larger across the eruptions. For the eruptions of Agung and El Chichón, the minimum global mean surface temperature anomalies are comparable (the model mean ± the inter-model standard deviation is −0.21 ± 0.05 and −0.17 ± 0.04 °C, respectively) even though the TOA anomalies differences are larger, indicating there are potential non-linearities in the response or multiple mechanisms at play. The eruption of Mount Pinatubo shows the largest global mean surface temperature anomaly of −0.35 ± 0.06 °C (model mean ± the inter-model standard deviation), coherent with the larger TOA anomalies. There is considerable inter-model spread in the response to both the Agung and El Chichón eruptions, while for Pinatubo the models show stronger agreement, probably because of the greater signal-to-noise ratio. The good overlap between the temperature anomalies reported here and found in Zanchettin et al. (2022) (multi-model mean of about −0.33 °C) for the eruption of Pinatubo suggests that the influence from the initial conditions and the background state is small, at least for the global mean.
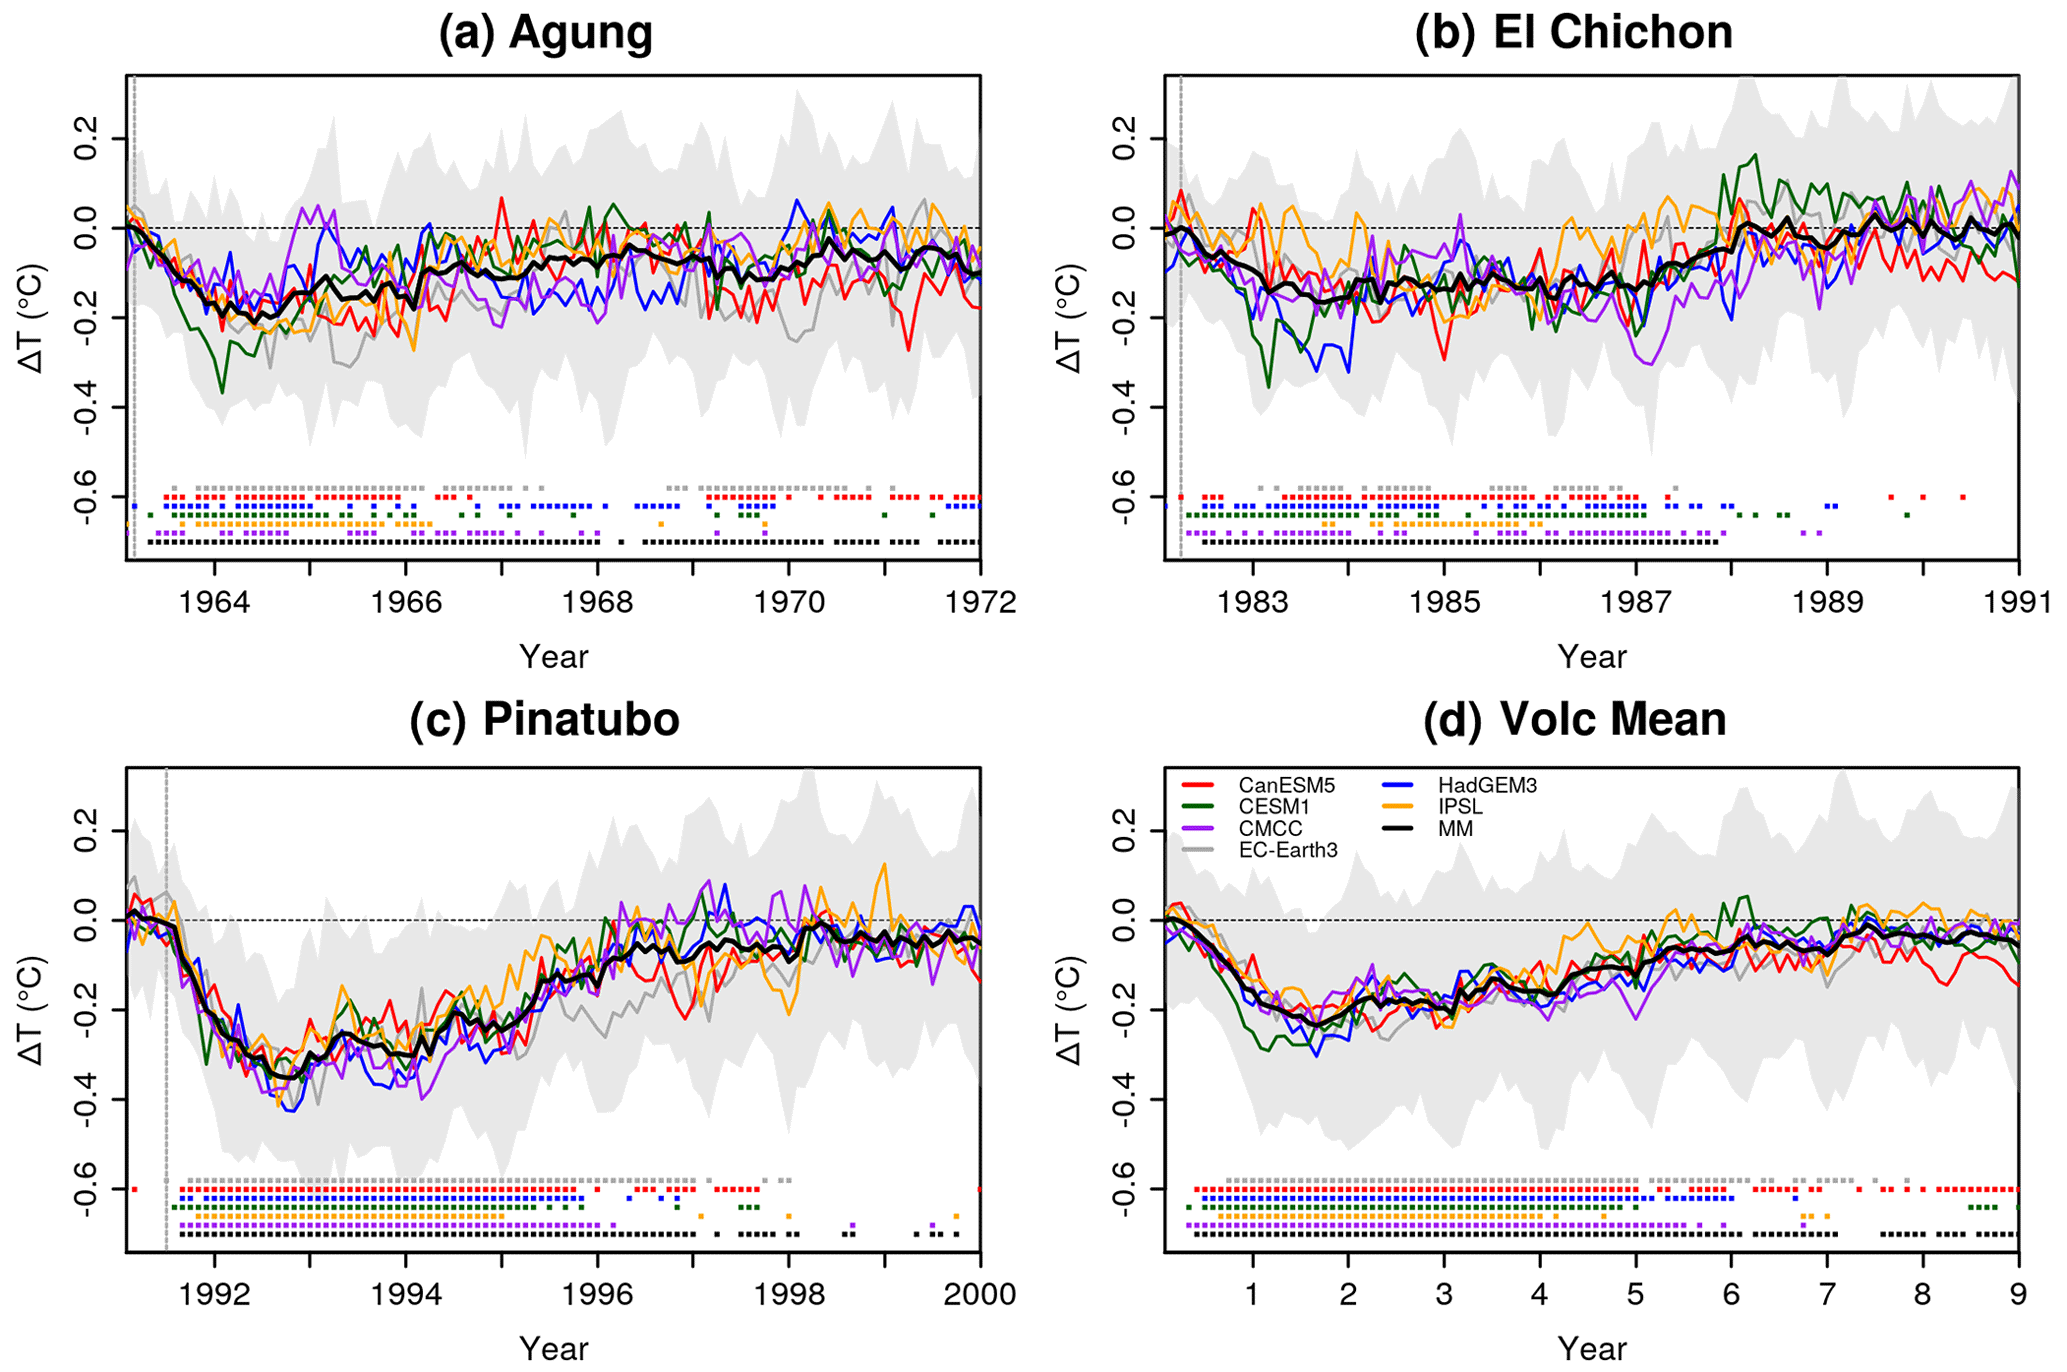
Figure 3Global mean surface air temperature response (°C) to the volcanic eruptions (DCPP-A minus DCPP-C). The ensemble mean for each model and the multi-model mean are shown. The shading is the multi-model member spread calculated as the 10th and 90th percentiles of the entire ensemble. Filled squares on the bottom part of the figure indicate statistically significant differences (see the Methods section). The vertical dashed grey lines indicate the approximate time of the eruptions.
Figure 4 shows the changes in ocean heat content (OHC) in the upper 300 m, an integrated variable with large inertia for which the volcanic signals can persist longer in time (e.g. Stenchikov et al., 2009). The volcanic signals are detected throughout the whole decade following the eruptions, with minimum OHC values peaking around the fourth year following the eruption and a slow recovery that still yields statistically significant anomalies in the ensemble mean by the end of the forecasts in each of the individual eruptions. Likewise, all systems simulate long-lasting significant responses, with some inter-model differences in the peak timing and the recovery rate.
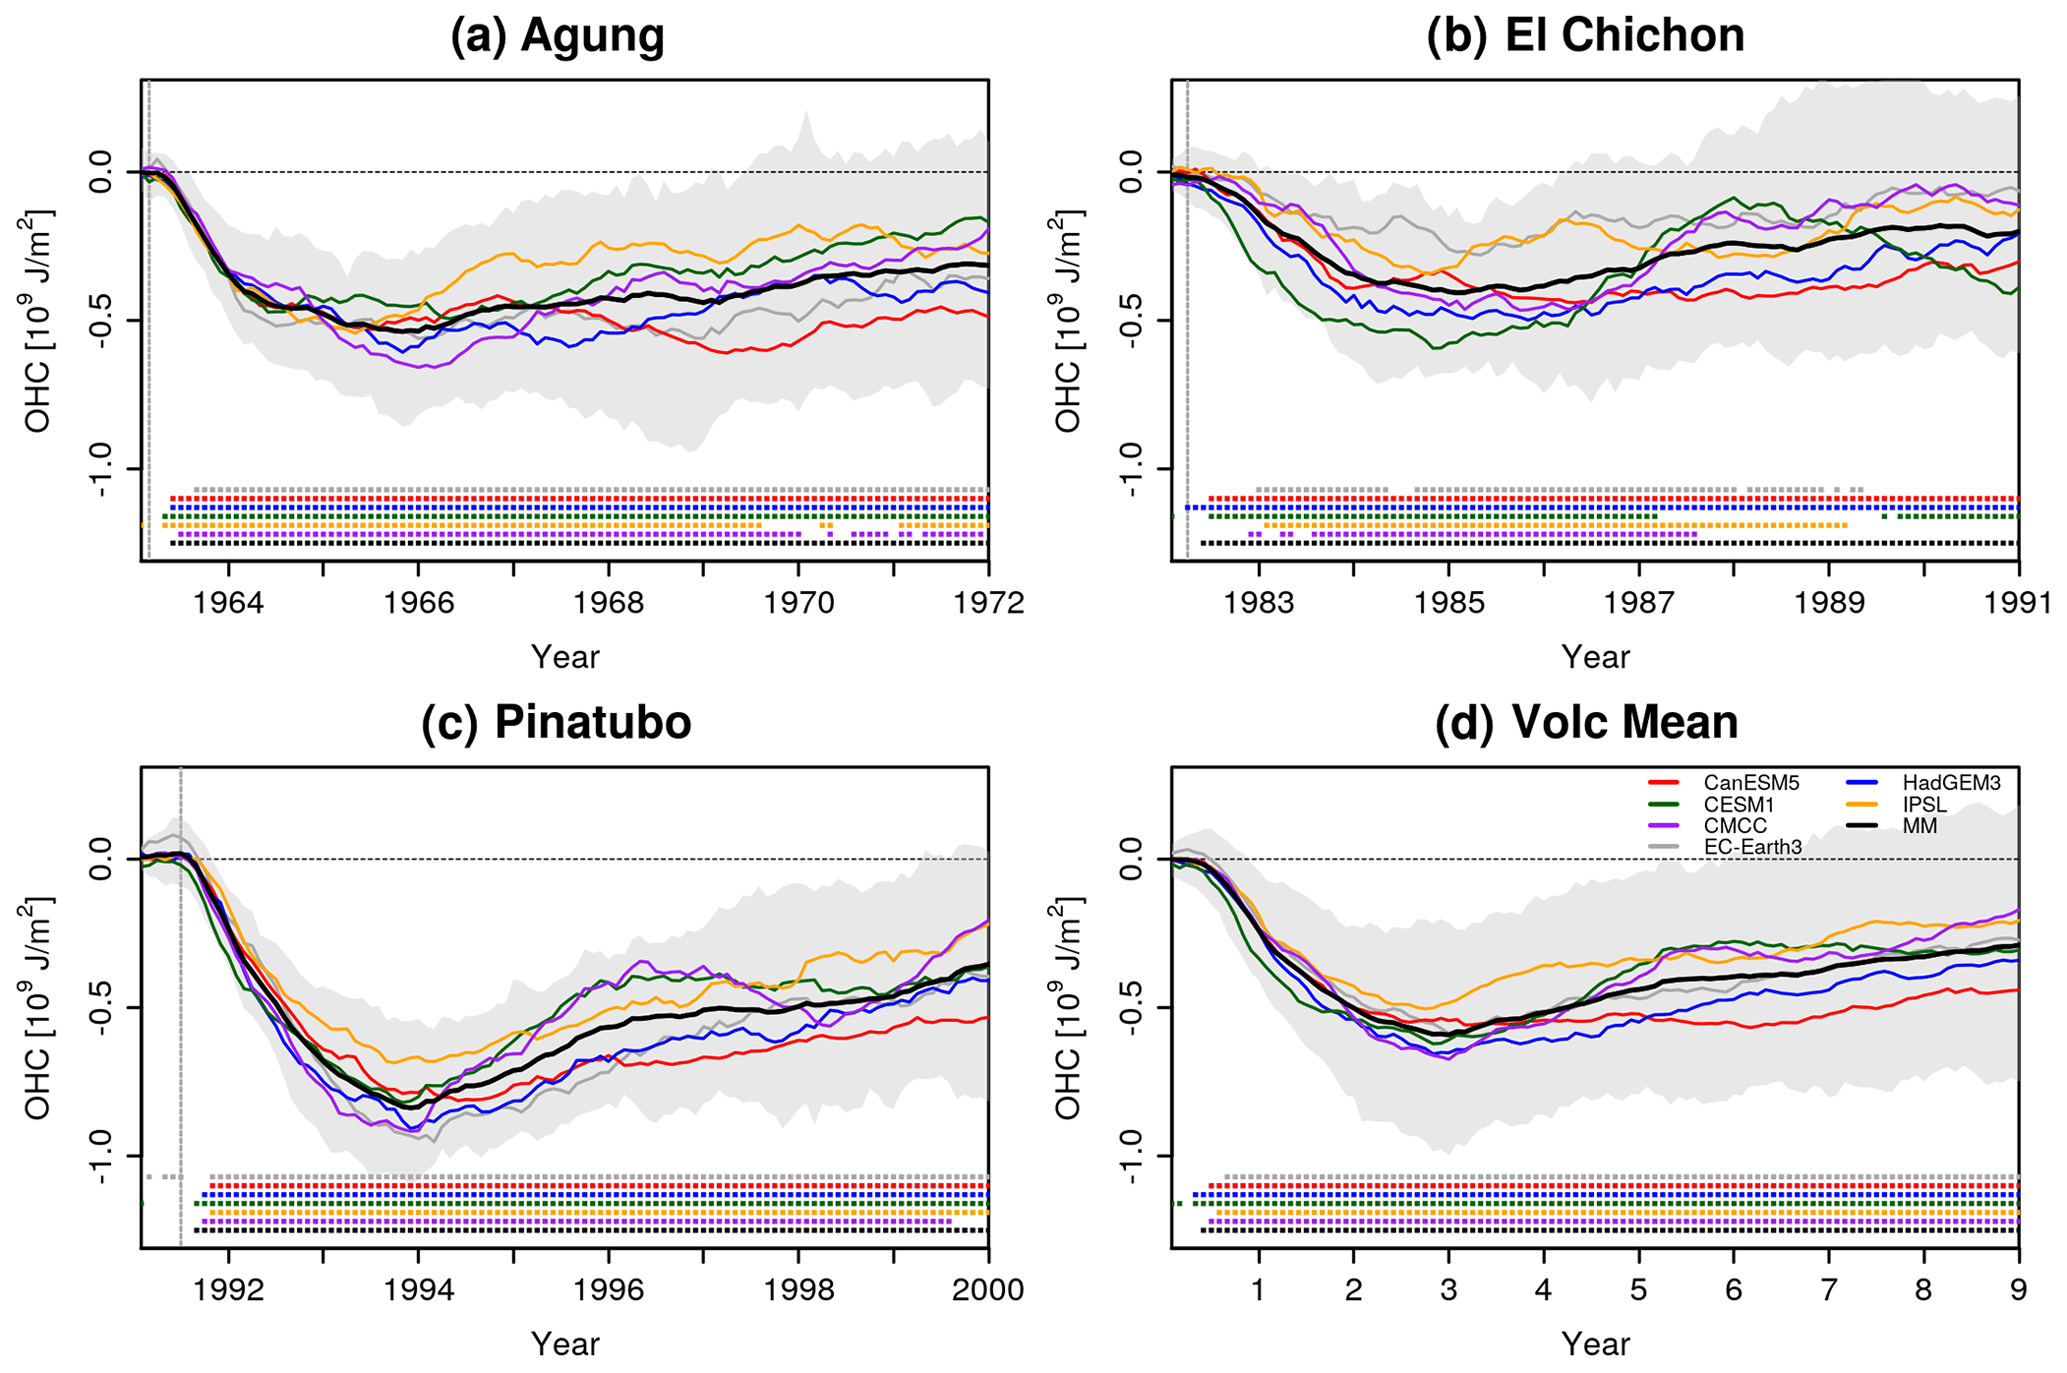
Figure 4Global ocean heat content response (J m−2) to the volcanic eruptions (DCPP-A minus DCPP-C). The ensemble mean for each model and the multi-model mean are shown. The shading is the multi-model member spread calculated as the 10th and 90th percentiles of entire ensemble. Filled squares at the bottom part of the figure indicate statistically significant differences (see the Methods section). The vertical dashed grey lines indicate the approximate time of the eruptions.
Having characterised the global mean response to the three volcanic eruptions, we compare the global mean near-surface air temperature anomalies predicted in both the DCPP-A and DCPP-C hindcasts against observations. Figure 5 shows that overall the DCPP-A predictions, which include the volcanic forcing, reproduce the HadCRUT5 temperature anomalies more closely than the DCPP-C. The DCPP-A hindcasts generally simulate the observed cooling tendencies in the initial years following the eruptions and the observed anomalies (from HadCRUT5) are generally within the 10th and 90th percentiles. In contrast, the DCPP-C hindcasts are generally warmer and observations tend to fall more frequently below the 10th and 90th percentiles. This is shown by lower RMSE of the DCPP-A hindcasts in comparison to the DCPP-C (Table S1). In particular, the volcanic forcing following the eruption of Pinatubo is remarkably important to simulate the observed global mean surface temperature variability in the early 90s, as without the forcing the observations are out of the models' envelope in the 2 years following the eruption.
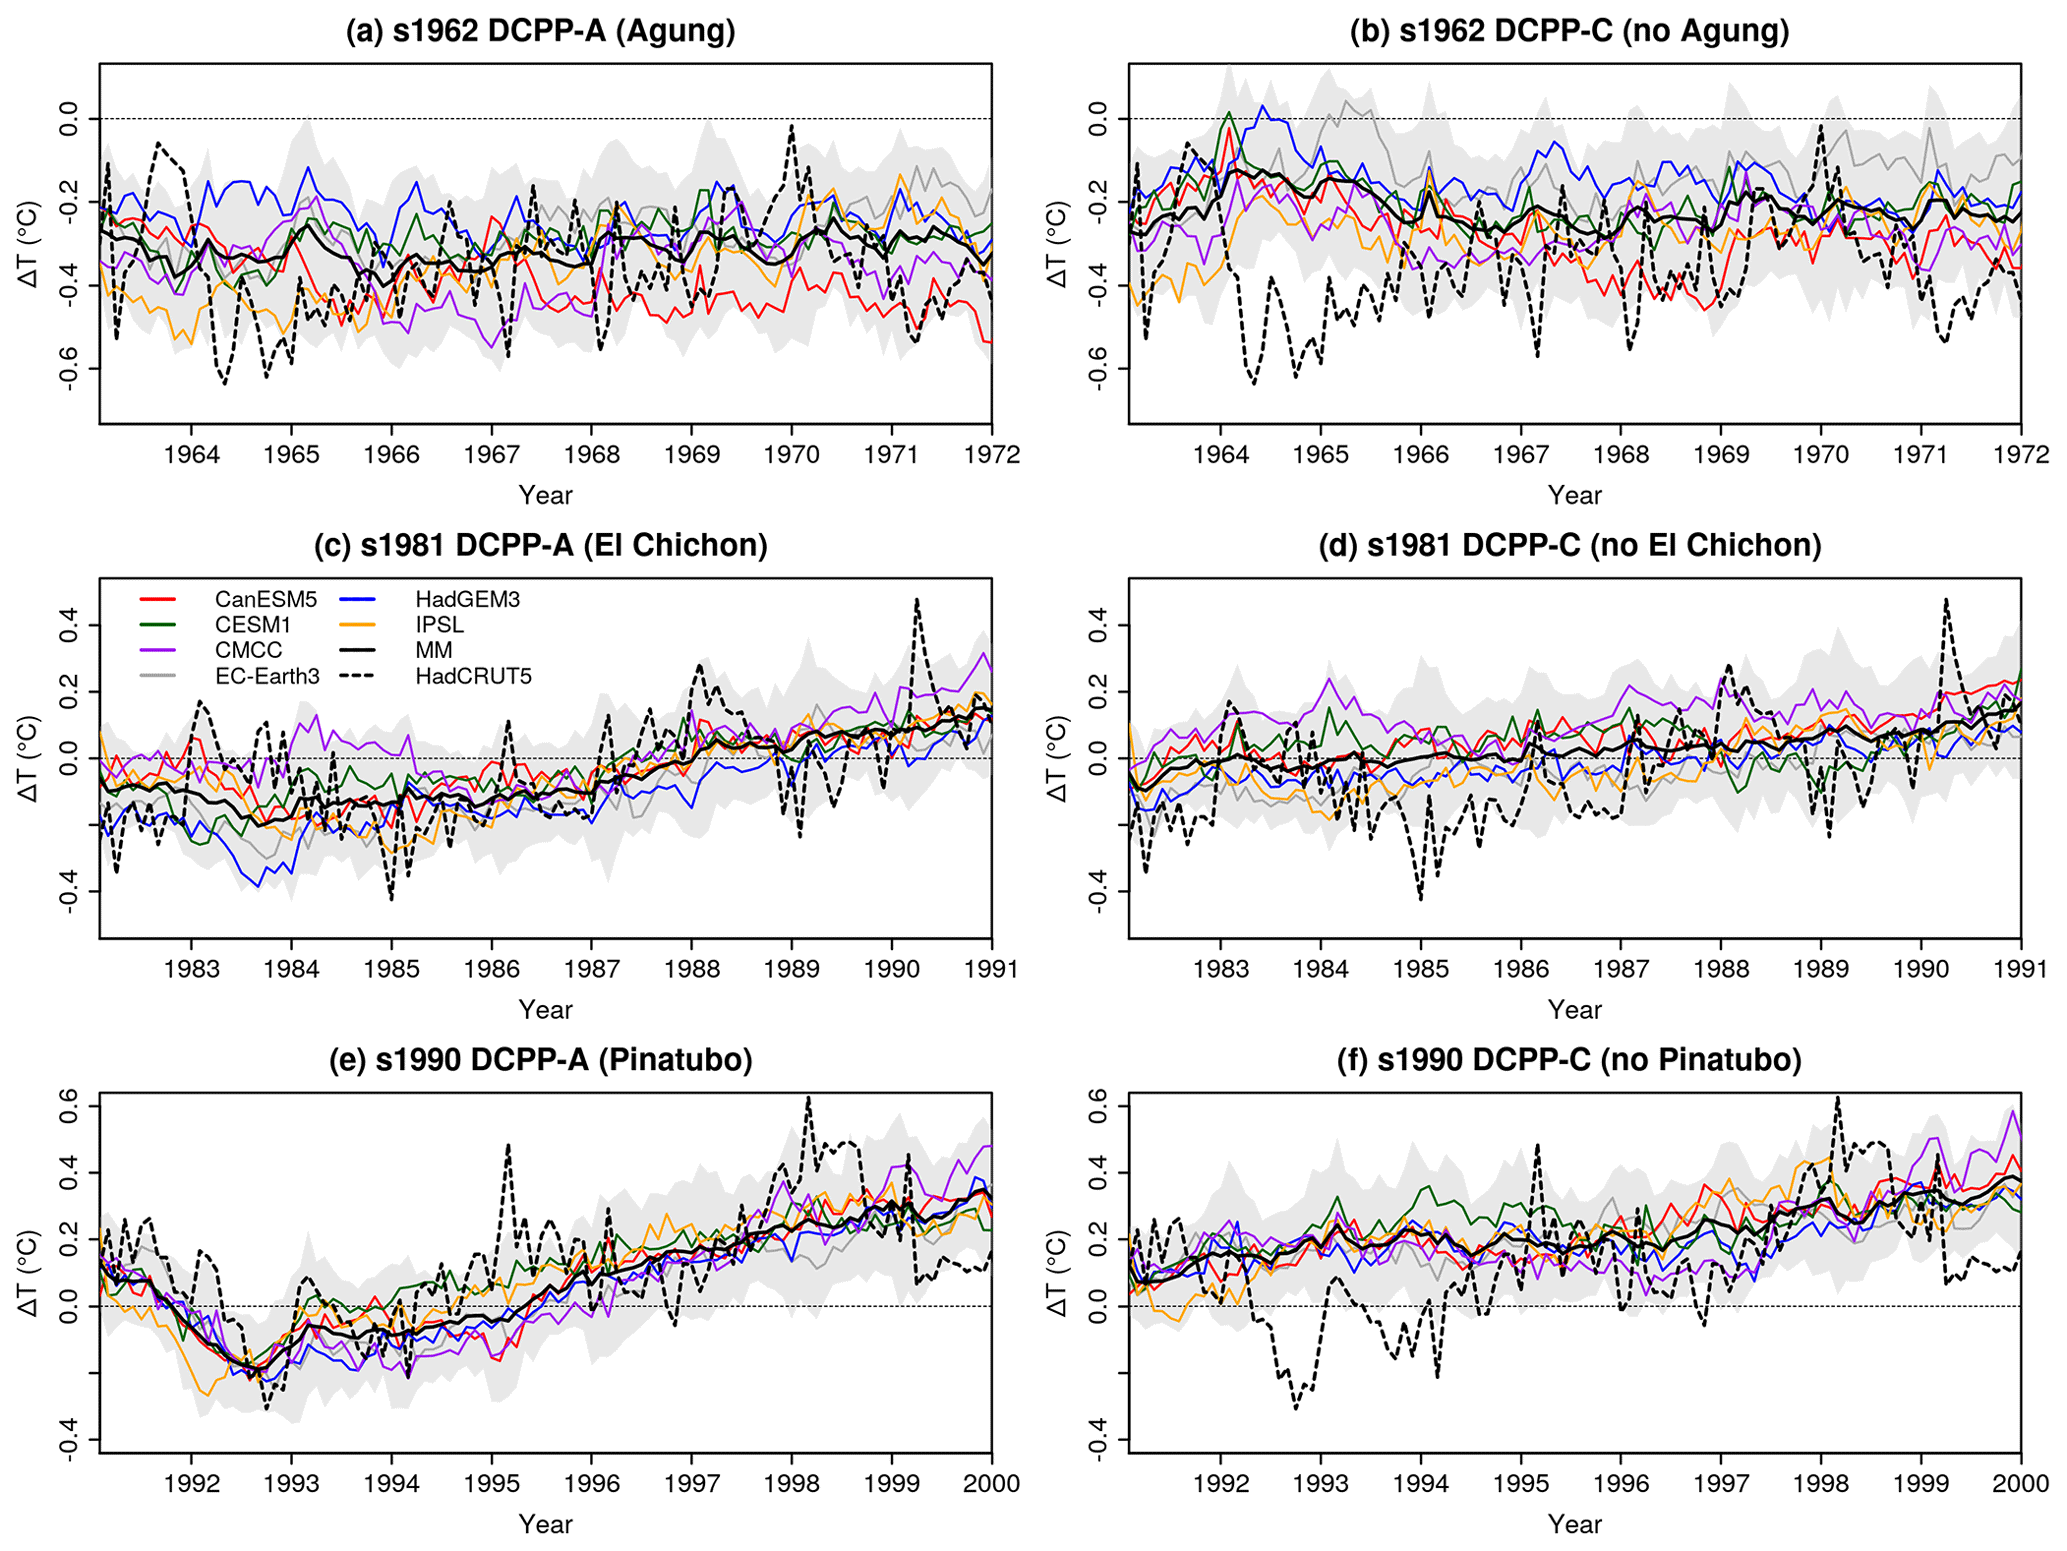
Figure 5Monthly mean global near-surface temperature anomalies (°C) of the predictions initialised in 1962, 1981 and 1990 for the DCPP-A (with volcanic forcing) and DCPP-C (without volcanic forcing) experiments. HadCRUT5 is used as the observational reference (dashed line). The anomalies have been computed with respect to the period 1970–2005 (see the Methods section for further information). The shading is the multi-model member spread calculated as the 10th and 90th percentiles of the entire ensemble.
3.2 Spatiotemporal characteristics of the volcanic response
The surface air temperature response in the first year (computed June–May to characterise the post-eruption anomalies) following the volcanic eruptions (Fig. 6) shows a distinct pattern, largely consistent across the volcanic eruptions (as shown by the shading in Fig. 6). It is characterised by a generalised cooling that is largest in the tropics and subtropics and a warming in the Eurasian Arctic sector (discussed further in Sect. 3.3). The magnitudes of the anomalies tend to be greater over land than over the ocean, in agreement with response to radiative forcing (e.g. Eyring et al., 2021). Despite the overall similarities in the surface temperature response among the eruptions, there are some differences which can be explained by the magnitude and geographical pattern of the TOA anomalies following each eruption (Fig. S1). For the eruption of Agung the TOA anomalies mainly occur in the Southern Hemisphere (Fig. S1a), and therefore the surface temperature anomalies are larger over the tropics and Southern Hemisphere (Fig. 6a). In contrast, for the eruption of El Chichón the TOA anomalies occur mainly in the Northern Hemisphere (Fig. S1b) and the surface temperature anomalies are larger over the tropics and the Northern Hemisphere (Fig. 6b). The eruption of Pinatubo caused a hemispherically symmetric response (Fig. S1c) with surface temperature anomalies that were stronger over the tropics and at high latitudes (Fig. 6c).
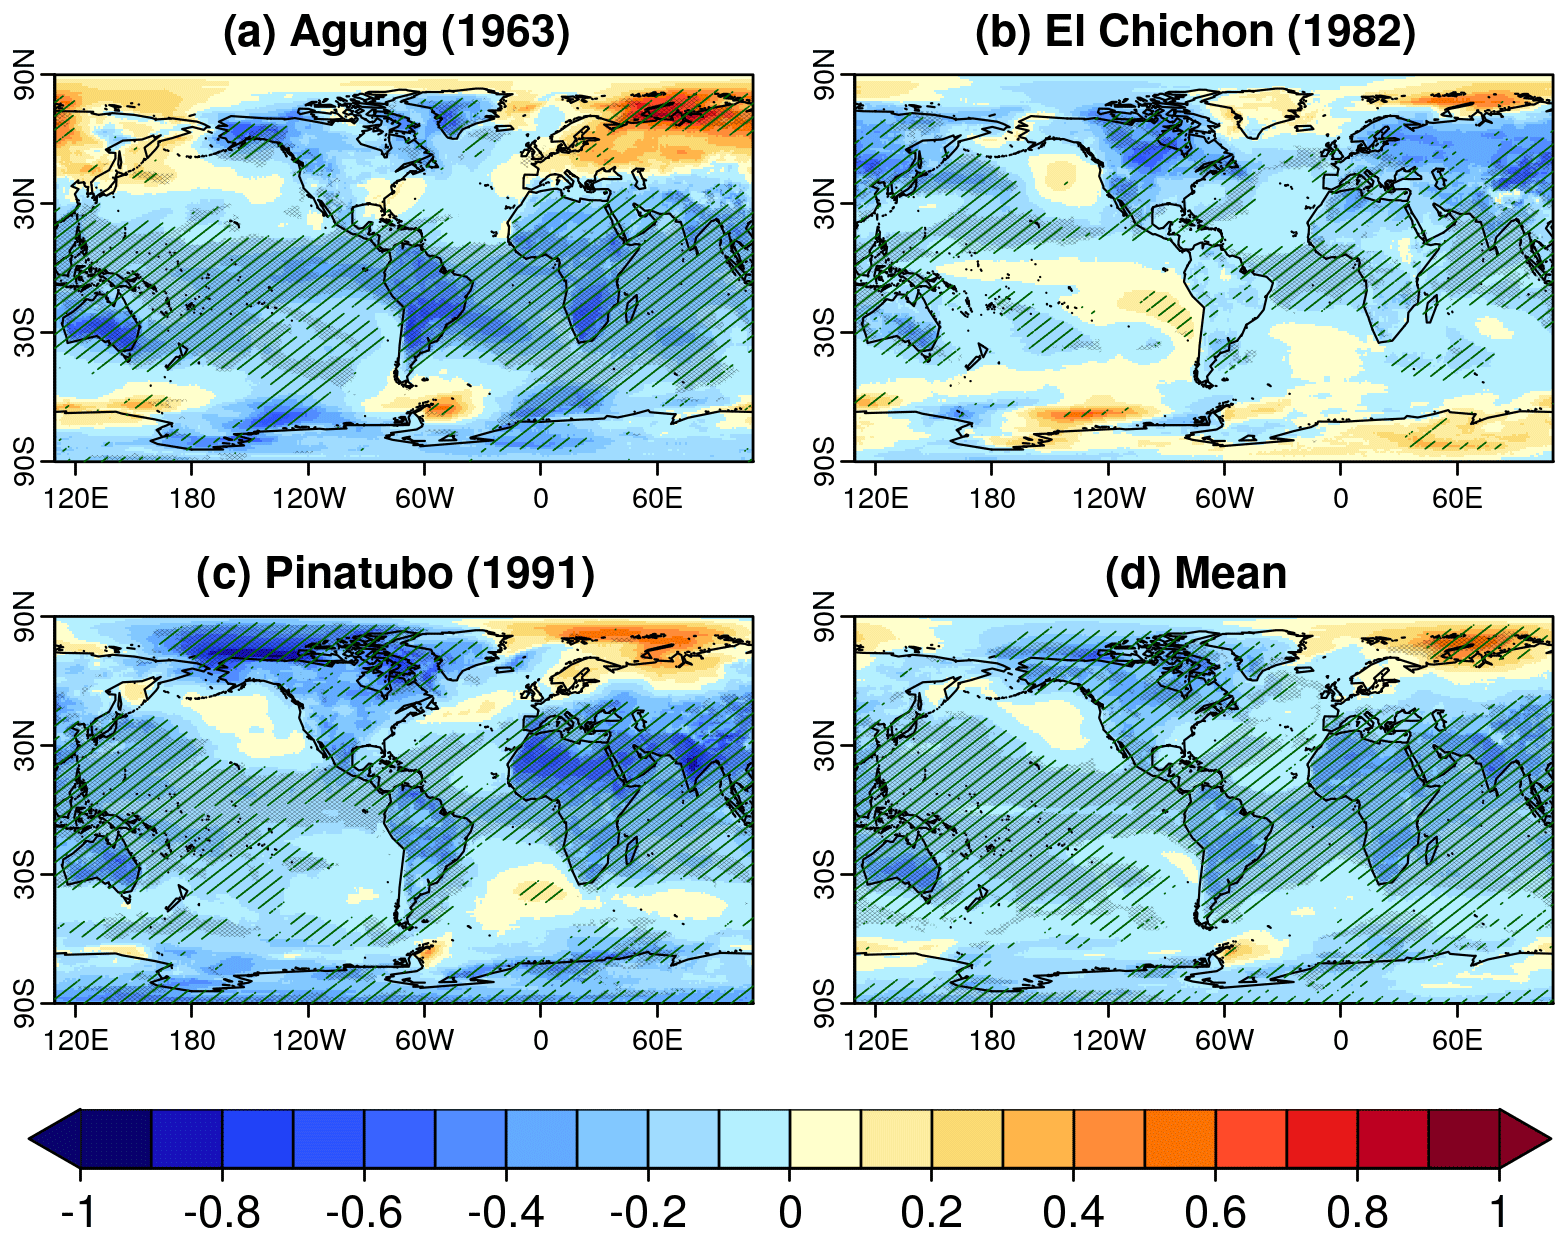
Figure 6Model mean near-surface air temperature (°C) response (DCPP-A minus DCPP-C) during the first year following the volcanic eruptions (June–May). Hatching indicates statistically significant anomalies, while the shading indicates model agreement (see the Methods section).
For years 2–5 (computed as June–May), the cooling spreads worldwide in response to the volcanic forcing (Fig. 7a–d). There are evident differences among the eruptions, associated with the magnitude and geographical pattern of the forcing as described previously. For the eruption of Agung the largest surface temperature anomalies are located over the tropics and especially in the Southern Hemisphere sector (Fig. 7a), while following the eruption of El Chichón the strongest surface temperature anomalies are located over the polar latitudes of the Northern Hemisphere, probably linked to the Arctic amplification phenomenon (Fig. 7b). The eruption of Pinatubo shows stronger surface temperature anomalies worldwide, albeit with maxima over the Arctic like for El Chichón (Fig. 7c). The mean response to the three eruptions is consistent with the one to Pinatubo, with surface temperature anomalies that are statistically significant worldwide (Fig. 7d).
At later forecast times (years 6–9) the surface temperature anomalies largely decrease in magnitude (Fig. 7e–h), consistent with the recovery timescale after the eruptions (Fig. 3). The response on these timescales is partly related to the magnitude of the eruption. For the eruption of Agung we find that negative surface temperature anomalies persist over the tropics and the Southern Hemisphere (Fig. 7e). For the eruption of El Chichón, which is the weakest of the three, there are barely any significant anomalies remaining (Fig. 7f). Finally, for the eruption of Pinatubo, we find some regions with significant anomalies which are particularly strong over the Arctic (Fig. 7g).
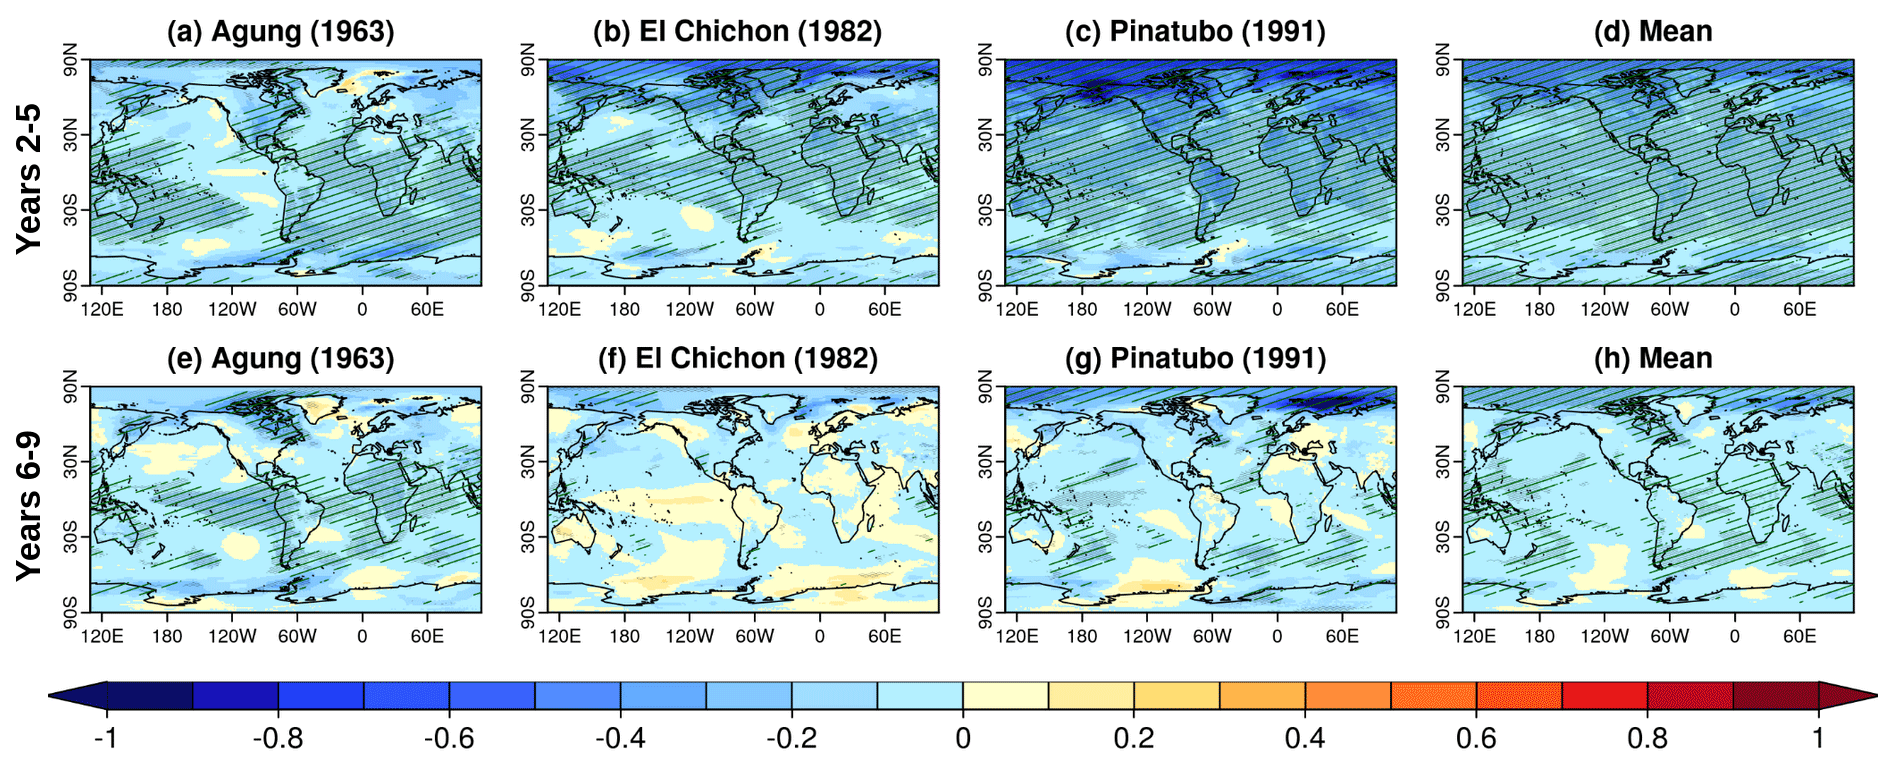
Figure 7Multi-model mean near-surface air temperature (°C) response (DCPP-A minus DCPP-C) during years 2–5 (first row) and years 6–9 (second row) following the eruptions of Mount Agung (1963), El Chichón (1982) and Mount Pinatubo (1991) as well as the mean of the three volcanoes (left to right). The annual mean is defined from June to May. Hatching indicates statistically significant anomalies, while shading indicates model sign consistency (see the Methods section).
To determine the importance of volcanic forcing at the regional scale, we evaluate the predicted surface temperature anomalies in the three DCPP-A and DCPP-C hindcast sets against the HadCRUT5 observational dataset. We focus on the multi-model ensemble mean for year 1, years 2–5 and years 6–9. Overall, we find that the volcanic forcing only leads to a generalised improvement in forecast years 2–5, as indicated by the lower global RMSE the three DCPP-A hindcasts with respect to DCPP-C (Table S2; by 12 % for Agung and El Chichón and 16 % for Pinatubo). Figure 8 shows that the multi-model mean surface temperature anomaly patterns for years 2–5 (when the volcanic radiative impact is strongest) predicted by the DCPP-A hindcasts are cooler than the DCPP-C, as expected, and closer to the observations. In comparison with the observed anomaly patterns, the multi-model predicted pattern is smoother and does not reproduce most of the regional variations. This is probably because at this forecast range the multi-model pattern is mostly due to the radiatively forced response and the observed regional variations are due to noise. For the first forecast year and forecast years 6–9, although the volcanic forcing has a distinct surface temperature imprint following the eruptions (Figs. 6 and 7), the fact that we do not find a detectable improvement in the DCPP-A hindcasts over DCPP-C (Table S2) might be because the local volcanic response is overwhelmed by internally generated variability and/or the regional response to the volcanic forcing is not correctly simulated by the models.
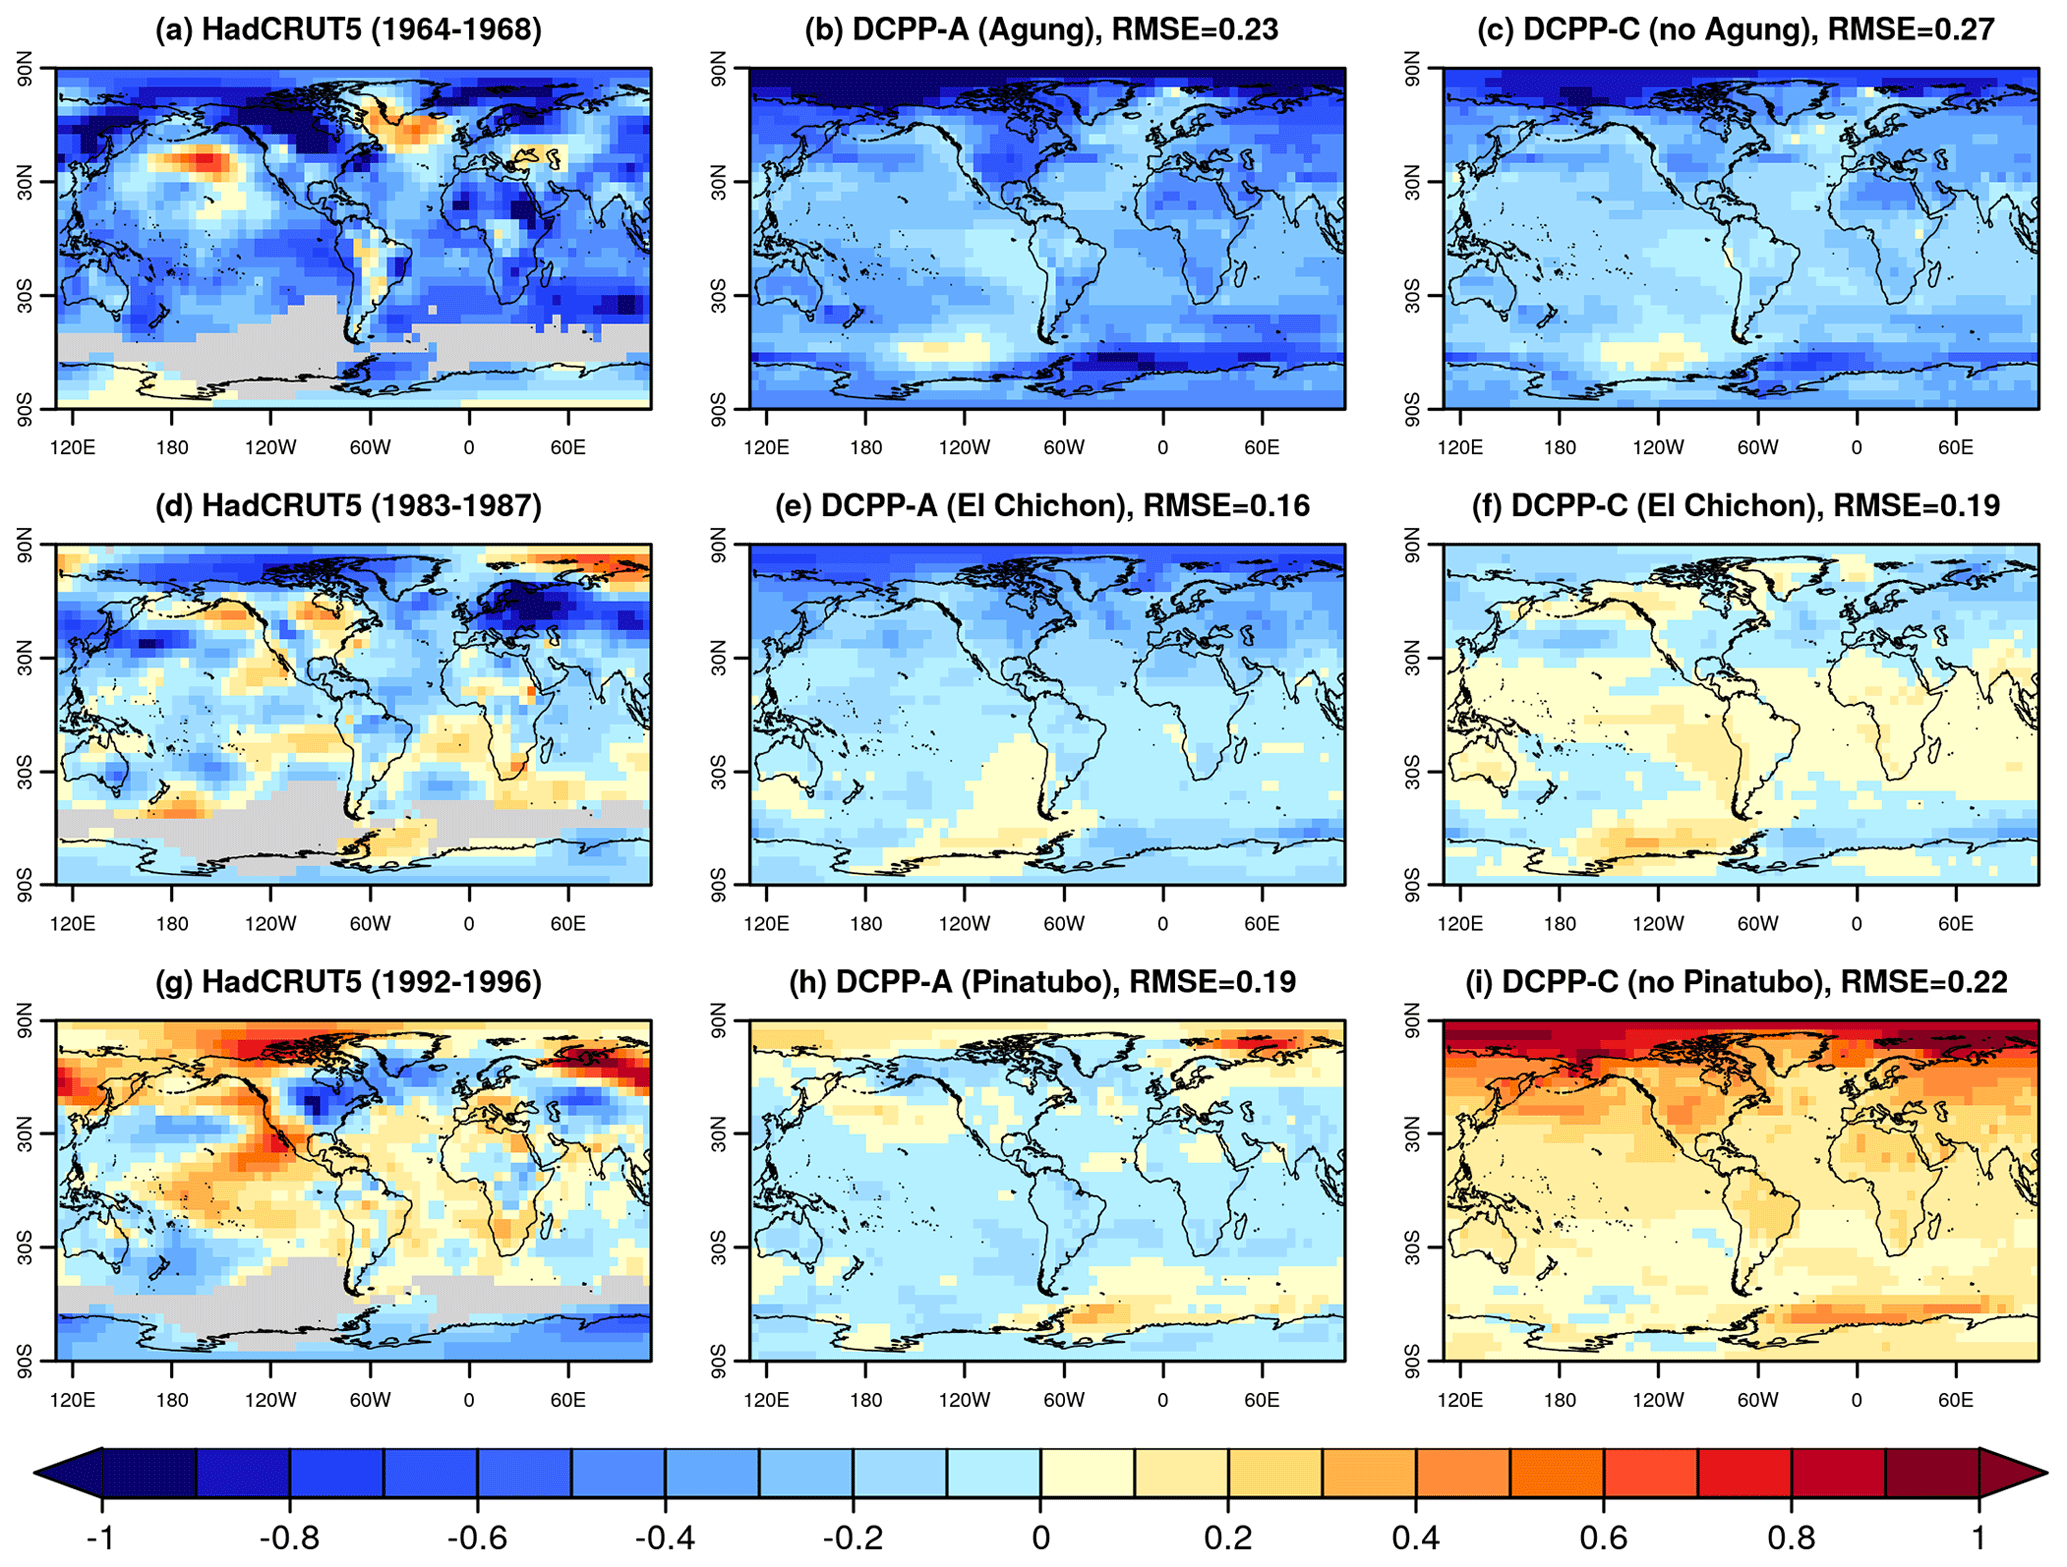
Figure 8Near-surface air temperature anomalies (°C) for years 2 to 5 of the multi-model mean predictions initialised in 1962, 1981 and 1990 for the DCPP-A (with volcanic forcing) and DCPP-C (without volcanic forcing) experiments and HadCRUT5. The anomalies have been computed with respect to the period 1970–2005 (see the Methods section). Note that the anomalies are computed from June–May.
3.3 Northern Hemisphere atmospheric response
The models consistently simulate a surface warming over northern Eurasia and/or the Barents–Kara seas in the first year after the eruptions (Fig. 6), although it is only statistically significant for Agung and the composite of the three eruptions. A focus on the seasonal surface temperature changes reveals that after the eruptions of Agung and Pinatubo, the surface warming over northern Eurasia and the Barents–Kara seas reaches its maximum magnitude and extent in the first winter (Fig. 9a and c), although only small regions show statistically significant anomalies. Interestingly, for the Agung eruption the warming is already present in the first JJA and SON (Fig. S2a–d). In contrast, following the eruption of El Chichón there are no warm anomalies present over the Eurasian continent in the first DJF (Fig. 9b), which shows cool anomalies instead (not statistically significant) and very weak and localised warm anomalies over the Barents–Kara seas. Due to the disparate responses among the eruptions, the composite of the three eruptions shows positive yet not significant anomalies in both DJF and the earlier seasons (Fig. S2). These results are consistent with studies suggesting that the Eurasian warming might be too weak and hence overwhelmed by unforced variability to all major eruptions (DallaSanta and Polvani, 2022).
Coherent with the surface temperature anomalies, for the Agung and the Pinatubo eruptions the sea level pressure anomalies feature a positive NAM-like pattern during the first post-eruption winter (Fig. 9e and g), not occurring for the eruption of El Chichón (Fig. 9f). The positive NAM-like pattern in the first post-eruption winter is associated with the warming of the tropical lower stratosphere in the months following the volcanic eruptions (Fig. 10a–d), which increases the poleward temperature gradient and might explain the acceleration of the polar vortex (Fig. 10e–h), in line with previous studies (e.g. Hermanson et al., 2020). The lower-stratospheric temperatures in the tropics show a strong increase following the three eruptions, peaking approximately 6 months after the eruption and lasting for 3 years (Fig. 10a–d), thereby increasing the poleward temperature gradient (not shown). Four of the forecast systems (CanESM5, CMCC-CM2-SR5, EC-Earth3 and HadGEM3-GC31-MM) cluster together, while IPSL-CM6A-LR and CESM1-1-CAM5-CMIP5 tend to simulate greater anomalies in response to the eruptions. In the case of CESM1-1-CAM5-CMIP5 this could be because this model was forced with CESM-specific volcanic forcing (Ammann et al., 2003) rather than CMIP6. The temperature anomalies are coherent with the magnitude of the volcanic forcings; the multi-model mean reaches 4.7 ± 0.7, 2.4 ± 1.4 and 5.6 ± 1.7 °C for the eruptions of Agung, El Chichón and Pinatubo, respectively.
Accompanying the stratospheric warming there is a detectable acceleration of the polar vortex following the eruptions of Agung and Pinatubo in the first winter in both the model mean and the eruption mean (Fig. 10e, g and h). Not all individual models show this acceleration though, probably because a larger ensemble size is needed to overcome the low signal-to-noise ratio and detect the response. Furthermore, a stronger stratospheric temperature response does not necessarily produce a stronger polar vortex response. In the case of the eruption of El Chichón the warm anomalies in the tropical lower stratosphere are weaker (Fig. 10b), which does not seem to result in an acceleration of the polar vortex and explains why a positive phase of the NAM and its associated warming over Eurasia are not simulated (Fig. 10f). The sea level pressure anomalies do resemble a positive NAM-like pattern in autumn, when weak warm anomalies are present over northern Eurasia (Figs. S2f and S3f), but this is not accompanied by a detectable acceleration of the polar vortex.
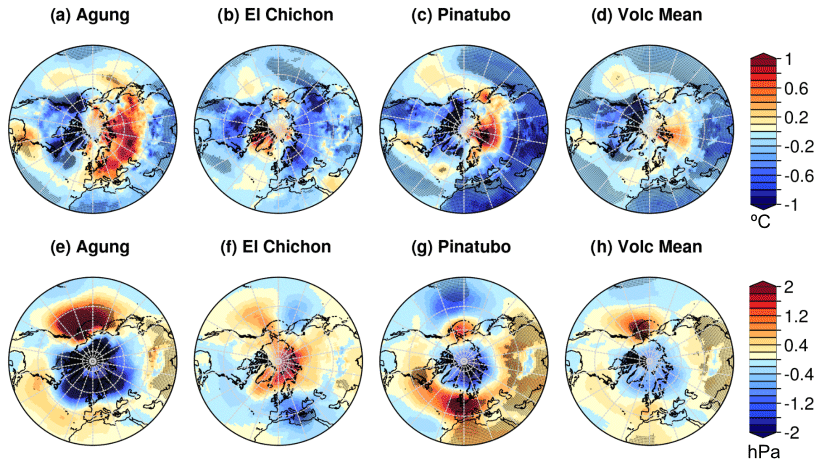
Figure 9Multi-model and multi-eruption response (DCPP-A minus DCPP-C) of surface air temperature (a–d) and sea level pressure (e–h) in the first boreal winter (DJF) following the volcanic eruptions. The ensemble mean for each model and the multi-model mean are shown. Shading indicates statistically significant anomalies.
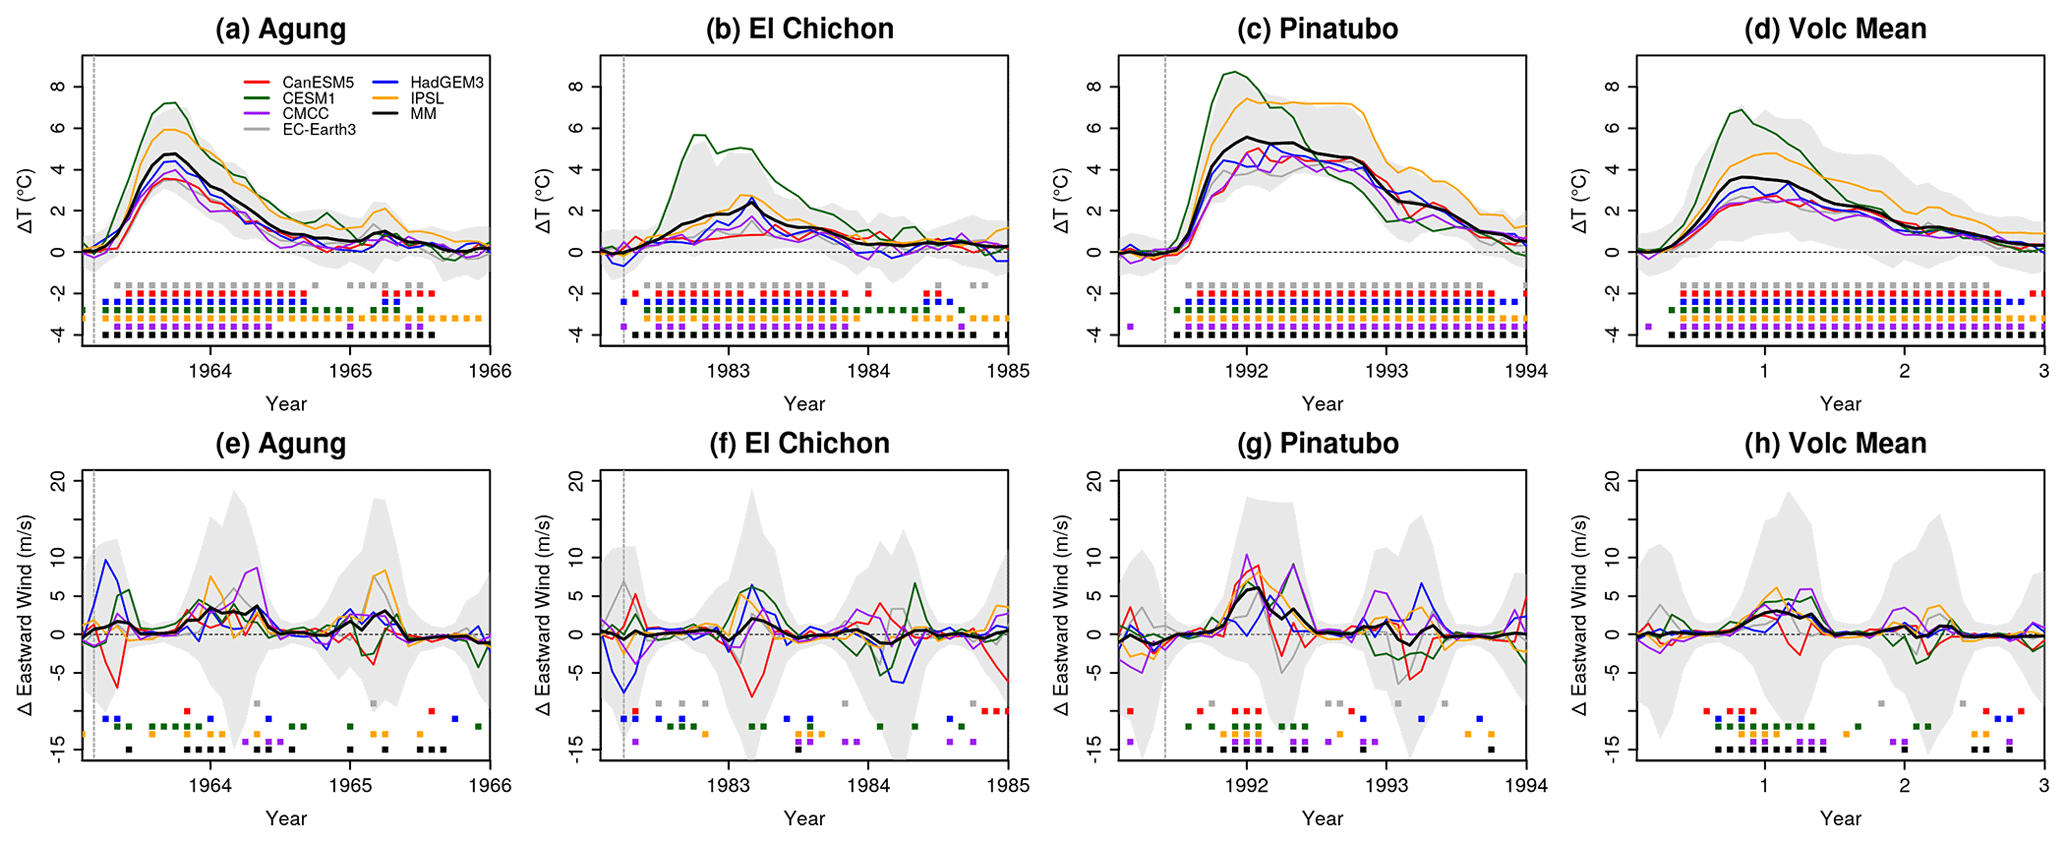
Figure 10Stratospheric air temperature in the tropics (30° N–30° S at 50 hPa) and polar vortex (average zonal velocity over 55–75° N at 50 hPa) response (DCPP-A minus DCPP-C) following the volcanic eruptions. The ensemble mean for each model and the multi-model mean are shown. The shading is the multi-model member spread calculated as the 10th and 90th percentiles. Filled squares on the bottom part of the figure indicate statistically significant differences (see the Methods section).
3.4 Response in the Pacific Ocean
Many studies have reported the impact of volcanic eruptions on the variability of the Pacific Ocean from seasonal to decadal timescales. We start by documenting the impact of volcanic eruptions on ENSO in our simulations. To isolate the dynamical response of ENSO from the surface cooling effect we define the Niño 3.4 SST index relative to the tropical SST mean (20° N–20° S) as in Khodri et al. (2017). Figure 11 shows that there is a large uncertainty in the relative Niño3.4 response to the volcanic eruptions and no consistent response across the individual models. This is partly due to the small ensemble size for the individual models (10 ensemble members), since large ensembles have been previously shown to be required to detect such signals (e.g. Ménégoz et al., 2018a; Hermanson et al., 2020). Only when considering the model mean and multi-eruption composite do we find a clear and statistically significant response. It is characterised by the development of weak El Niño-like conditions in the year of the eruptions which peak in the following year and then a transition to La Niña-like conditions in the second and third years following the eruption. There are, however, some differences among the volcanic eruptions, as the multi-model El Niño response is stronger and significant only for the eruptions of Agung and Pinatubo (Fig. 11a and c), while the delayed La Niña response is clear and significant for Pinatubo and marginally significant (i.e. only during a season) for El Chichón (Fig. 11b). From the individual models CMCC-CM2-SR5 is the only one consistently showing the El Niño-like and La Niña-like responses after the three eruptions; all the rest are not significant in almost all cases. HadGEM3-GC31-MM and CESM1-1-CAM5-CMIP5 also show a significant positive ENSO response in the multi-eruption composite, with CESM1-1-CAM5-CMIP5 showing a subsequent significant La Niña-like response. None of the other three systems simulate the El Niño/La Niña response. Note that the results for the IPSL-CM6A-LR model contrast with those of Zanchettin et al. (2022), who show in their idealised Pinatubo experiments (volc-pinatubo-full experiment) that this model does simulate the El Niño/La Niña responses.
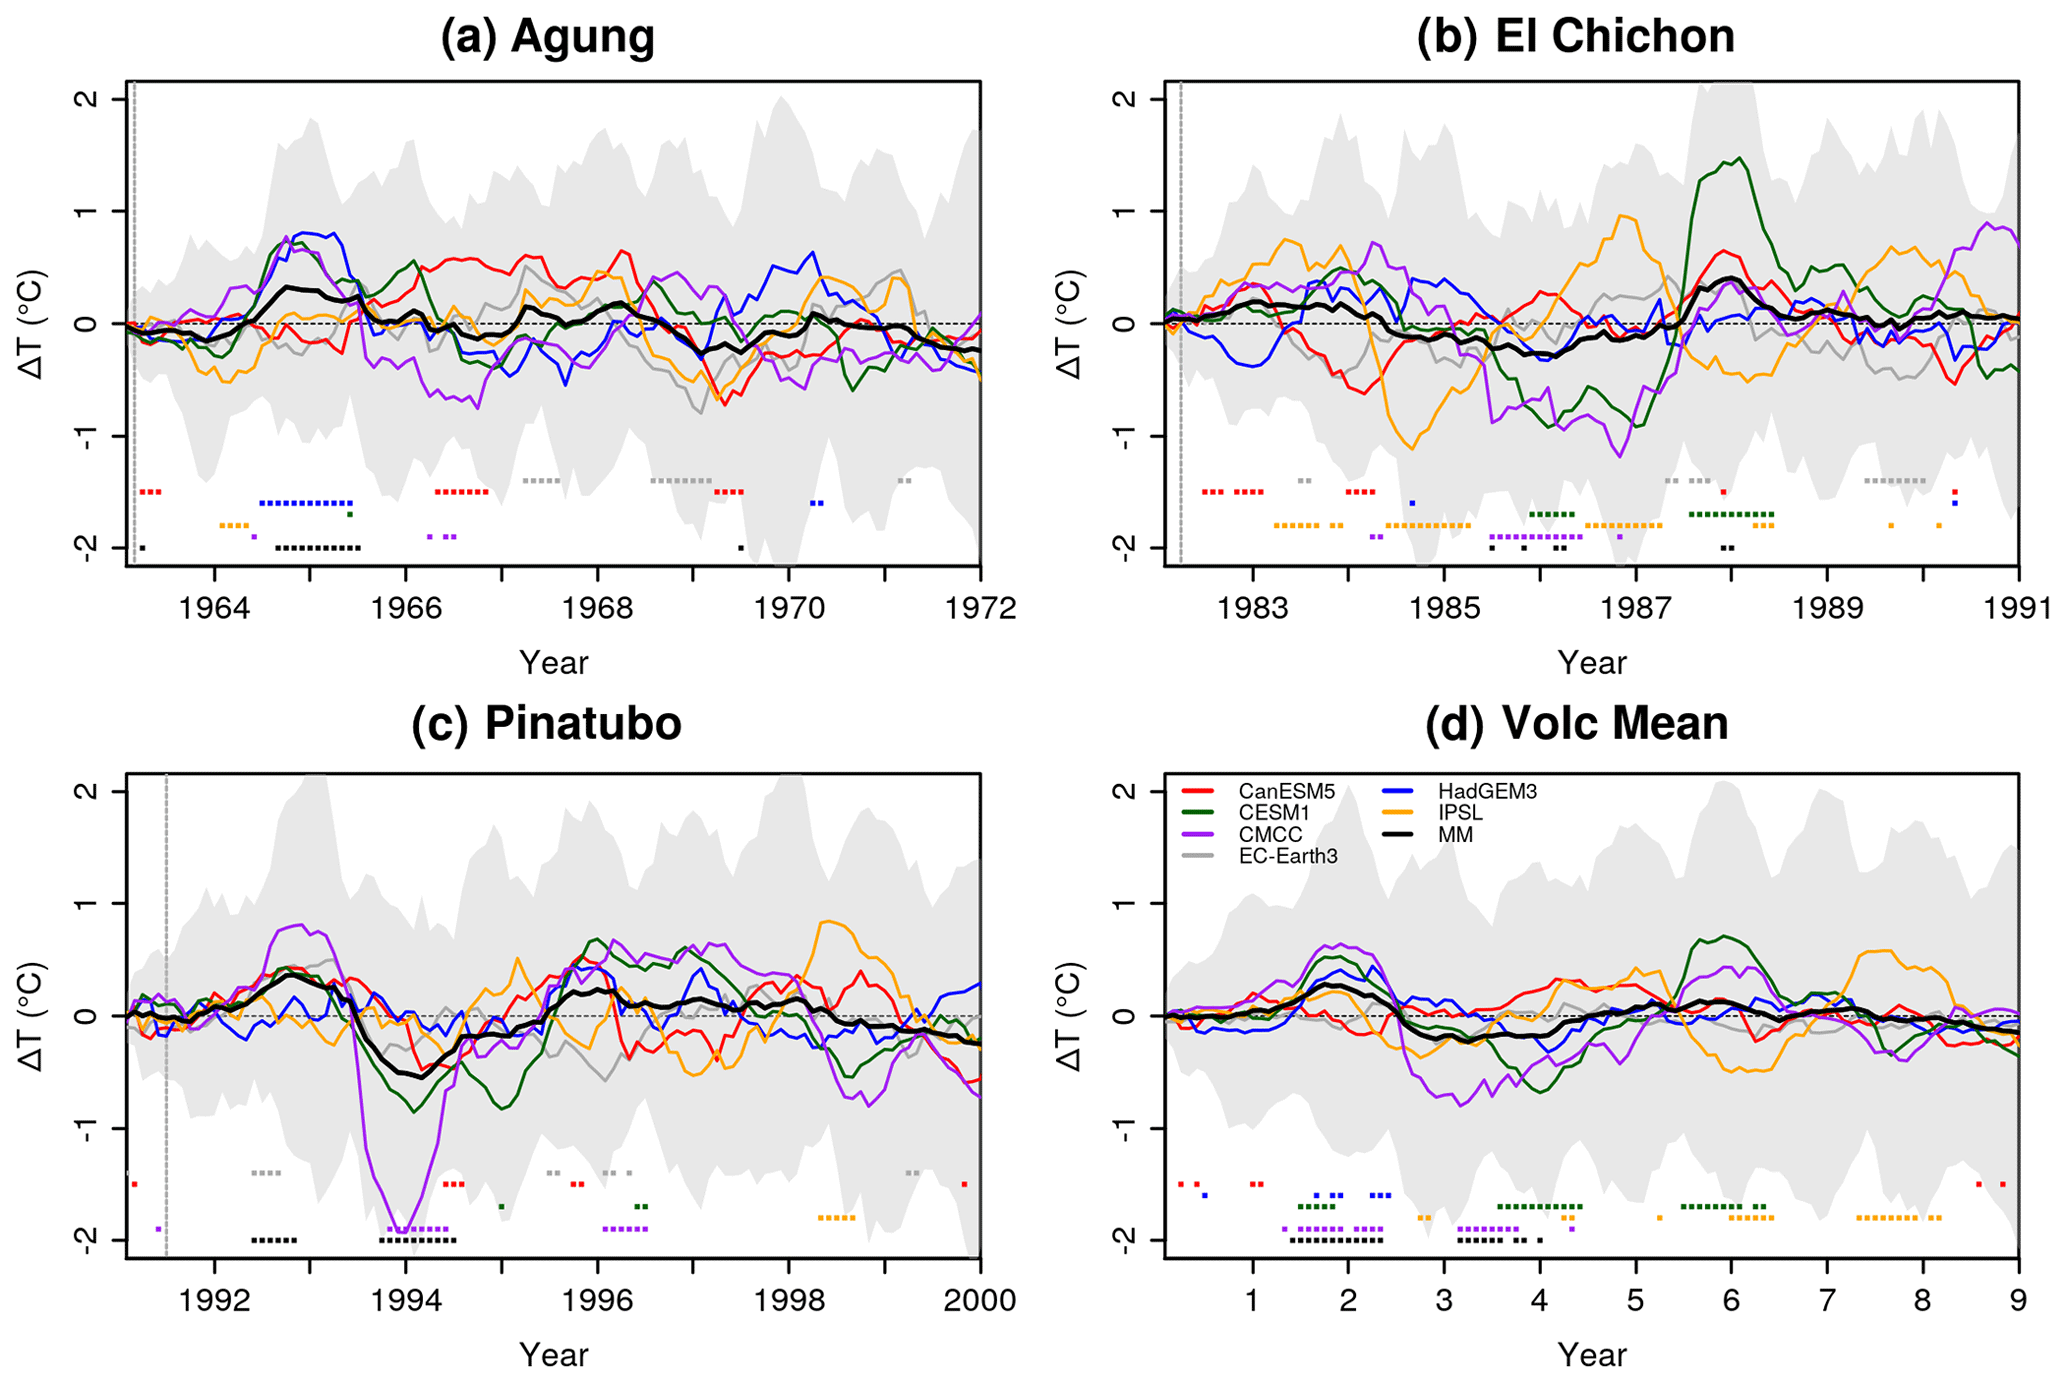
Figure 11Relative Niño 3.4 index response following the eruptions of (a) Mount Agung (1963), (b) El Chichón (1982) and (c) Mount Pinatubo (1991) as well as (d) the mean of the three eruptions. Filled squares on the bottom part of the figure indicate statistically significant differences (see the Methods section). The ensemble mean for each model and the multi-model mean are shown. The shading is the multi-model member spread calculated as the 10th and 90th percentiles. The vertical dashed lines indicate the approximate time of the eruptions.
To further explore the development of the El Niño-like conditions we look at the model mean composite responses in surface air temperature and precipitation in the tropics in JJA and DJF of the first and second years following the eruptions. The eruption mean response shows the development of a Niño-like state from the first JJA to the second DJF (Fig. 12), comparable to the results shown in Hermanson et al. (2020). In the year of the eruption, the tropics cool, especially over the continents, and there is a reduction in precipitation over Africa and the Maritime Continent (Fig. 12b and d). In the following year's winter, the eastern and central equatorial Pacific show enhanced warming relative to the rest of the tropics, accompanied by the characteristic El Niño-like precipitation pattern (Fig. 12g and h).
While combining the different eruptions is a way to increase the ensemble size and improve the detection of weak signals, in this case it is probable that due to the different characteristics of each eruption, timing and background climate state, the mechanisms at play are not the same for each eruption and therefore their impact on ENSO also changes. It is beyond the scope of this study to determine which mechanisms might dominate the response in the individual eruptions since these seem to vary from one model to another (Fig. 11a-c). Nonetheless we find that overall, for the eruptions of Agung and Pinatubo, the El Niño-like state develops and peaks in the first year following the eruptions, while for the eruption of El Chichón the El Niño-like state occurs in the same year of the eruption. In the case of the Agung, initially a weak La Niña-like conditions develop in the year of the eruption (Fig. S4a and b) accompanied by a northern shift of the Intertropical Convergence Zone (ITCZ) (Fig. S5a and b); then the conditions shift to El Niño-like with a lack of cooling relative to the rest of the tropics (Fig. S4c and d) and accompanied by increased precipitation (Fig. S5c and d). For the eruption of El Chichón, we find an El Niño-like state developing and peaking in the year of the eruption (Fig. S4e and f). The responses to the eruptions of Agung and El Chichón are broadly consistent with the results of Pausata et al. (2020), who show using idealised simulations with NorESM1-M that the ENSO response to NH and SH eruptions differs due to shifts in the ITCZ as a result of the asymmetric hemispheric cooling. Finally, for the eruption of Pinatubo, which due to its intensity and location had an approximately hemispherically symmetric forcing and also induced the strongest cooling anomalies (Fig. S4j–m), El Niño-like conditions develop and peak in the year following the eruption. In this case the response is in broad agreement with the mechanism proposed in Khodri et al. (2017), which starts with reduced precipitation over tropical Africa (Fig. S5j and k), leading to the propagation of anomalous atmospheric Kelvin waves that weaken the trade winds over the western Pacific.
The ocean state has been found to be another relevant factor modulating the ENSO response in climate model simulations (e.g. Predybaylo et al., 2020). Observations show that in the months prior to the three volcanic eruptions considered in this study, El Niño phases were already developing, peaking later in the first winter following the eruptions (e.g. McGregor et al., 2020). Figure S6 shows that the observed ENSO anomalies in the first months after the eruptions were reasonably well predicted for Agung and less so for El Chichón, but not for Pinatubo, in both DCPP-A and DCPP-C sets. The very small differences identified between the two forecast ensembles suggest that the volcanic forcing has a weak impact, which could either imply that the observed ENSO signal in the first year was not forced by the eruptions or that the models systematically fail to simulate the true mechanism of response. At later forecast times, the models also misrepresent the observed ENSO anomalies.
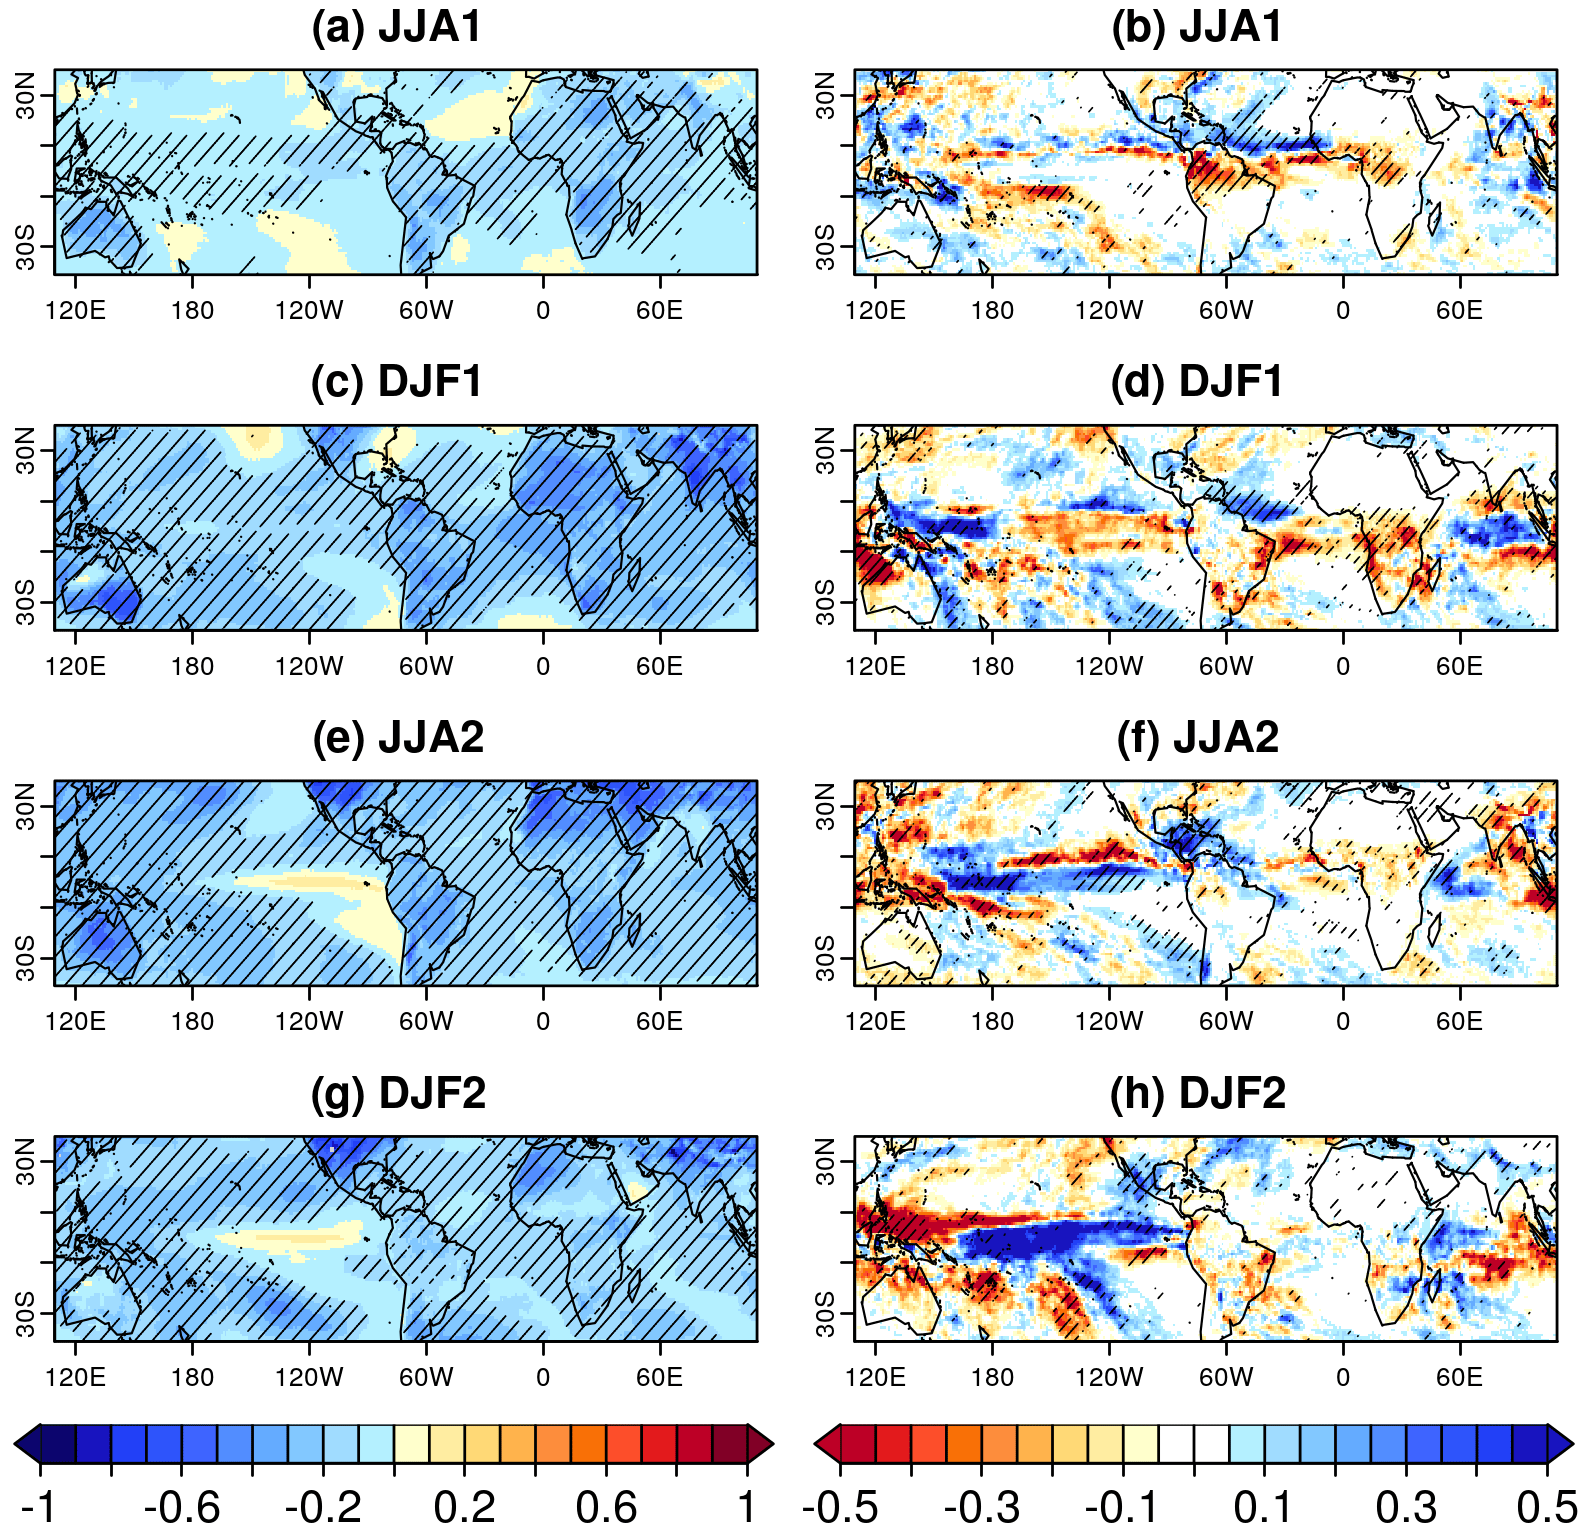
Figure 12Multi-model and multi-eruption surface air temperature (°C) and precipitation (mm d−1) responses following the eruptions in the tropics. Hatching indicates statistically significant anomalies (see the Methods section).
Previous studies have shown that including the volcanic forcing in decadal climate predictions can degrade the skill of SST over the central-eastern tropical Pacific Ocean on multiyear to decadal timescales (Timmreck et al., 2016; Wu et al., 2023). In these predictions, the tropical Pacific SST (averaged over 20° S–20° N, 120° E–80° W as in Wu et al., 2023) experiences a net cooling during the first 4 years following the eruptions, although with important differences among the models and volcanic eruptions regarding the magnitude of the cooling (Fig. S7). At later forecast times (years 6–10) there is no significant response to the volcanic forcing, with no evident differences between the ensembles. To evaluate whether the volcanic forcing has a detrimental impact on these predictions we compare the forecast anomalies of the DCPP-A and DCPP-C hindcasts with SST observations. Figure 13 shows that for the eruptions of Agung and El Chichón the differences between the DCPP-A and DCPP-C hindcasts are small (Table S3), although including the volcanic aerosols may improve the initial years of the forecasts. For the eruption of Agung, 1964 is too warm unless volcanic aerosols are included (Fig. 13a and b), and for the eruption of El Chichón, the multi-model tendency for 1983–1985 is better reproduced in DCPP-A compared to DCPP-C (Fig. 13c and d). In contrast, for the eruption of Pinatubo, including the volcanic forcing negatively impacts the prediction initialised in 1990 in all systems by causing a local cooling that was not observed. This is also evident from the RMSE values shown in table S3.
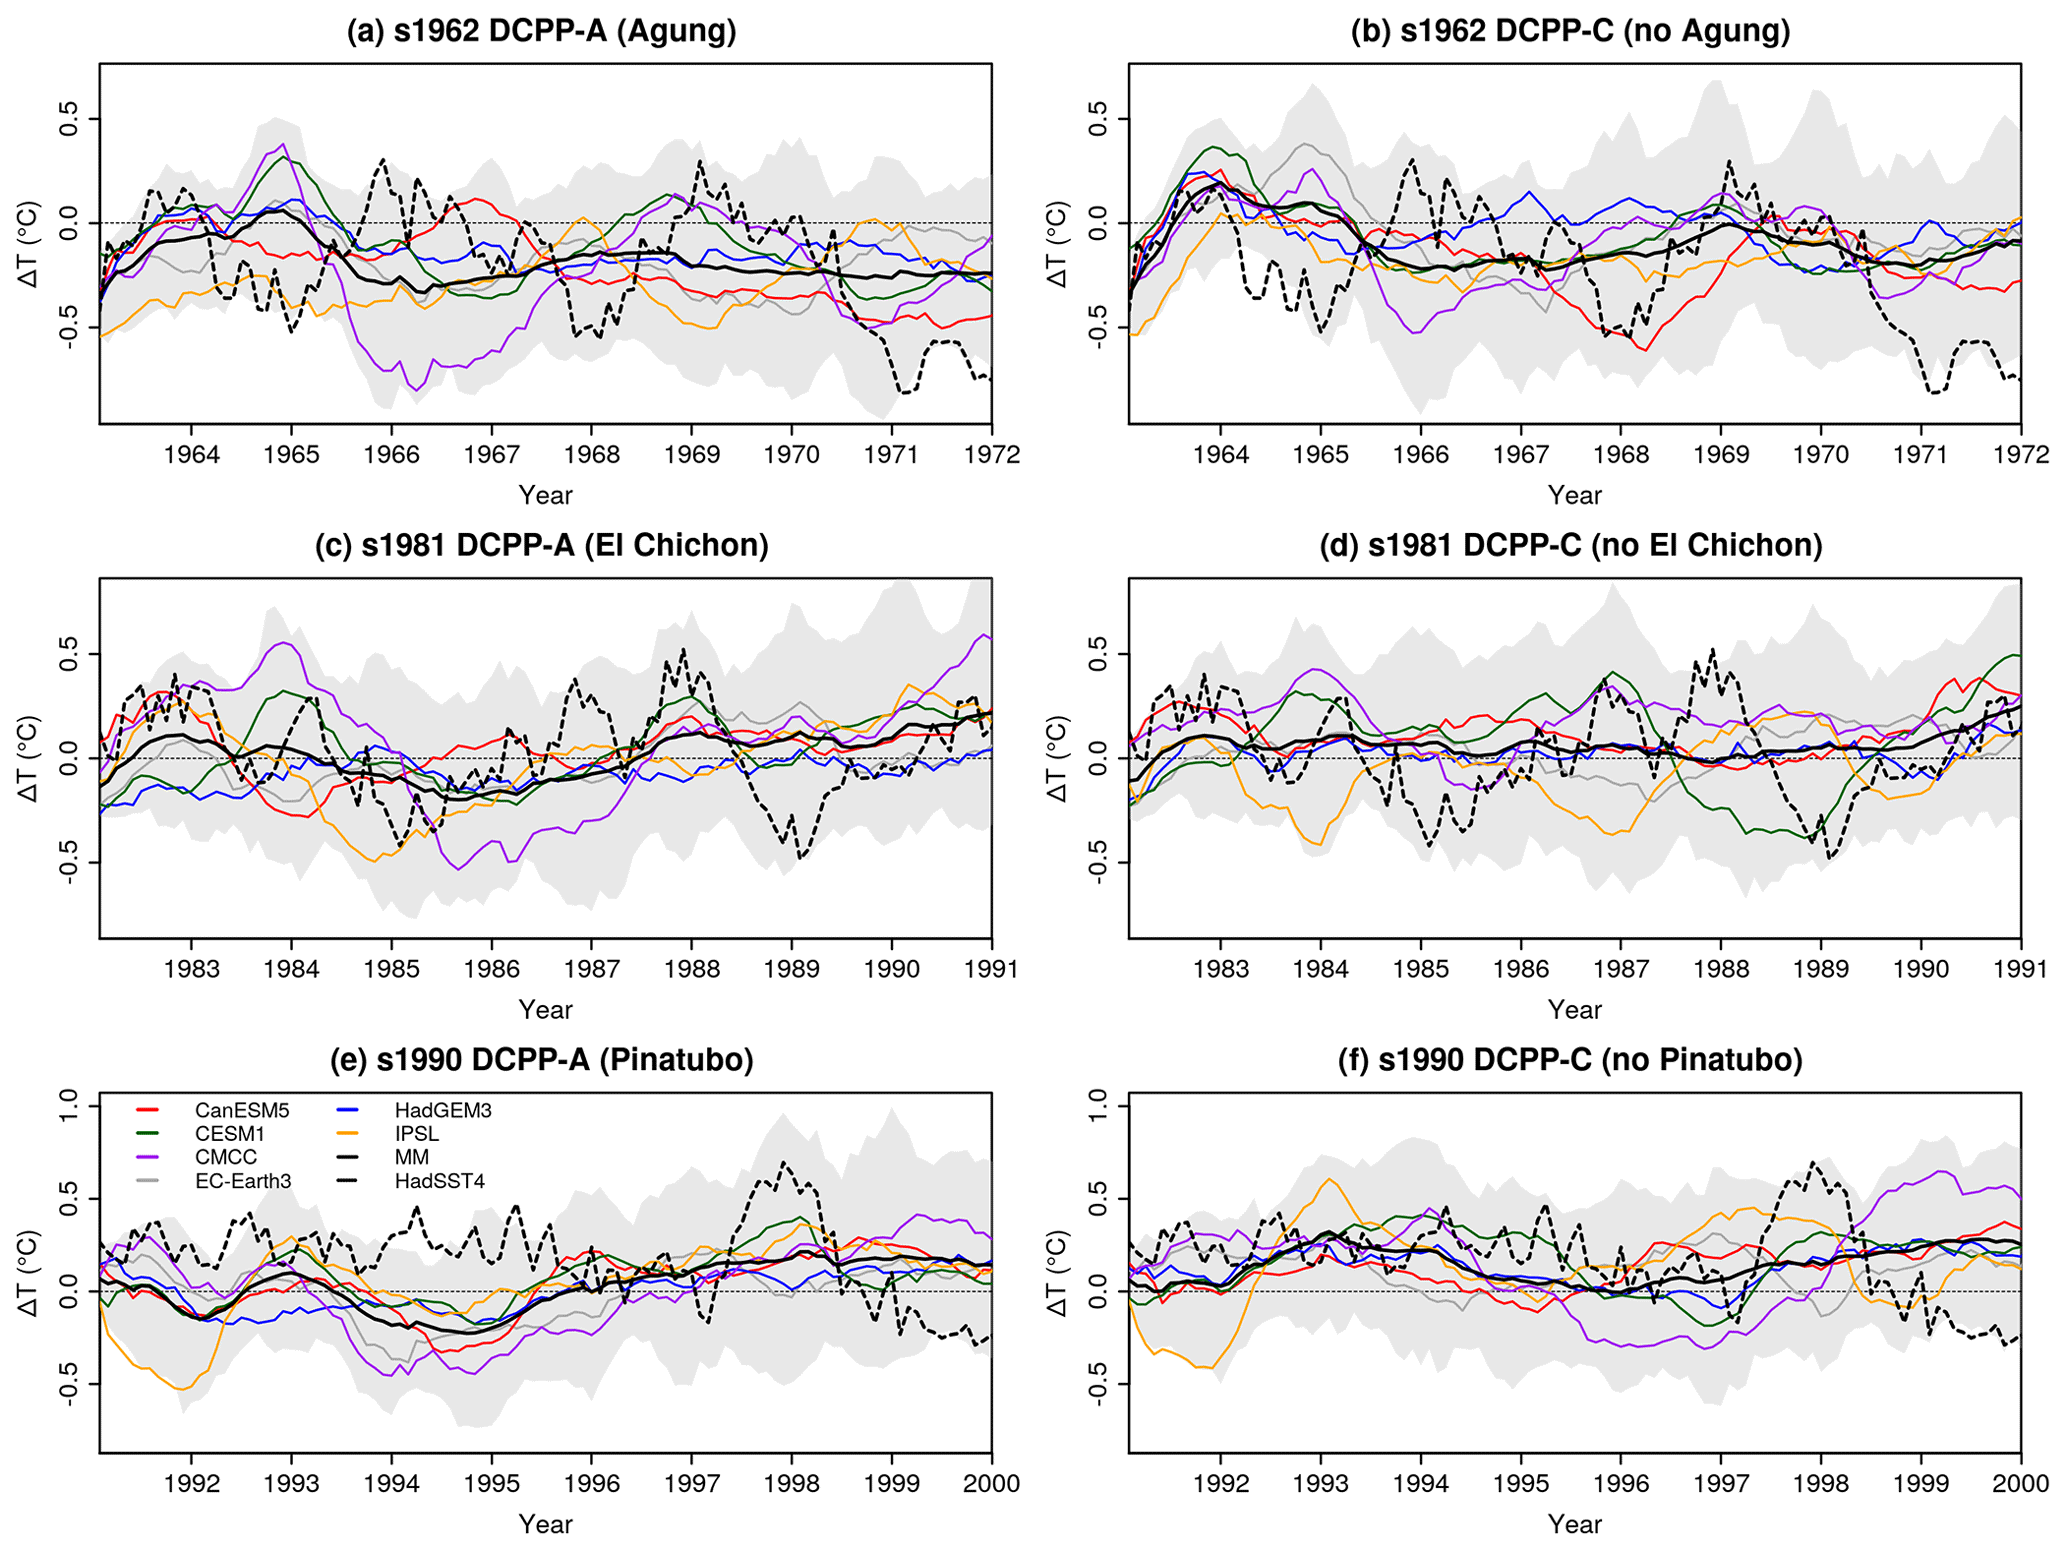
Figure 13Tropical Pacific (20° S–20° N, 160° E–80° W) SST anomalies (°C) in the predictions initialised in 1962, 1981 and 1990 for the DCPP-A (with volcanic forcing) and DCPP-C (without volcanic forcing) experiments. HadISSTv4 is used as the observational reference (dashed line). The anomalies have been computed with respect to the period 1970–2005 (see the Methods section for further information). The ensemble mean for each model and the multi-model mean are shown. The shading is the multi-model member spread calculated as the 10th and 90th percentiles of the entire ensemble.
3.5 Response in the North Atlantic Ocean
The North Atlantic Ocean is a region where the impact of volcanic eruptions has been shown to persist on decadal timescales (e.g. Ortega et al., 2012; Swingedouw et al., 2015, 2017; Hermanson et al., 2020; Borchert et al., 2021; Fang et al., 2021). Volcanic eruptions will always tend to cause a direct cooling of North Atlantic SSTs via the worldwide reduction in incoming shortwave radiative fluxes (e.g. Swingedouw et al., 2017). As shown for the global mean surface temperature, in the North Atlantic Ocean, the SST decreases following the eruptions with a subsequent recovery (Fig. S8). There are important differences regarding the magnitude of the cooling and the recovery time, which are larger across the volcanic eruptions than across models. Comparing the predicted SST anomalies of the DCPP-A and DCPP-C hindcasts with SST observations shows that overall the volcanic forcing positively impacts the predictions (also shown by the RMSE values in Table S4). This is particularly relevant following the eruption of Pinatubo, for which including the volcanic forcing is necessary to realistically simulate the North Atlantic SST variability in all models, at least in the first few years (Fig. 14).
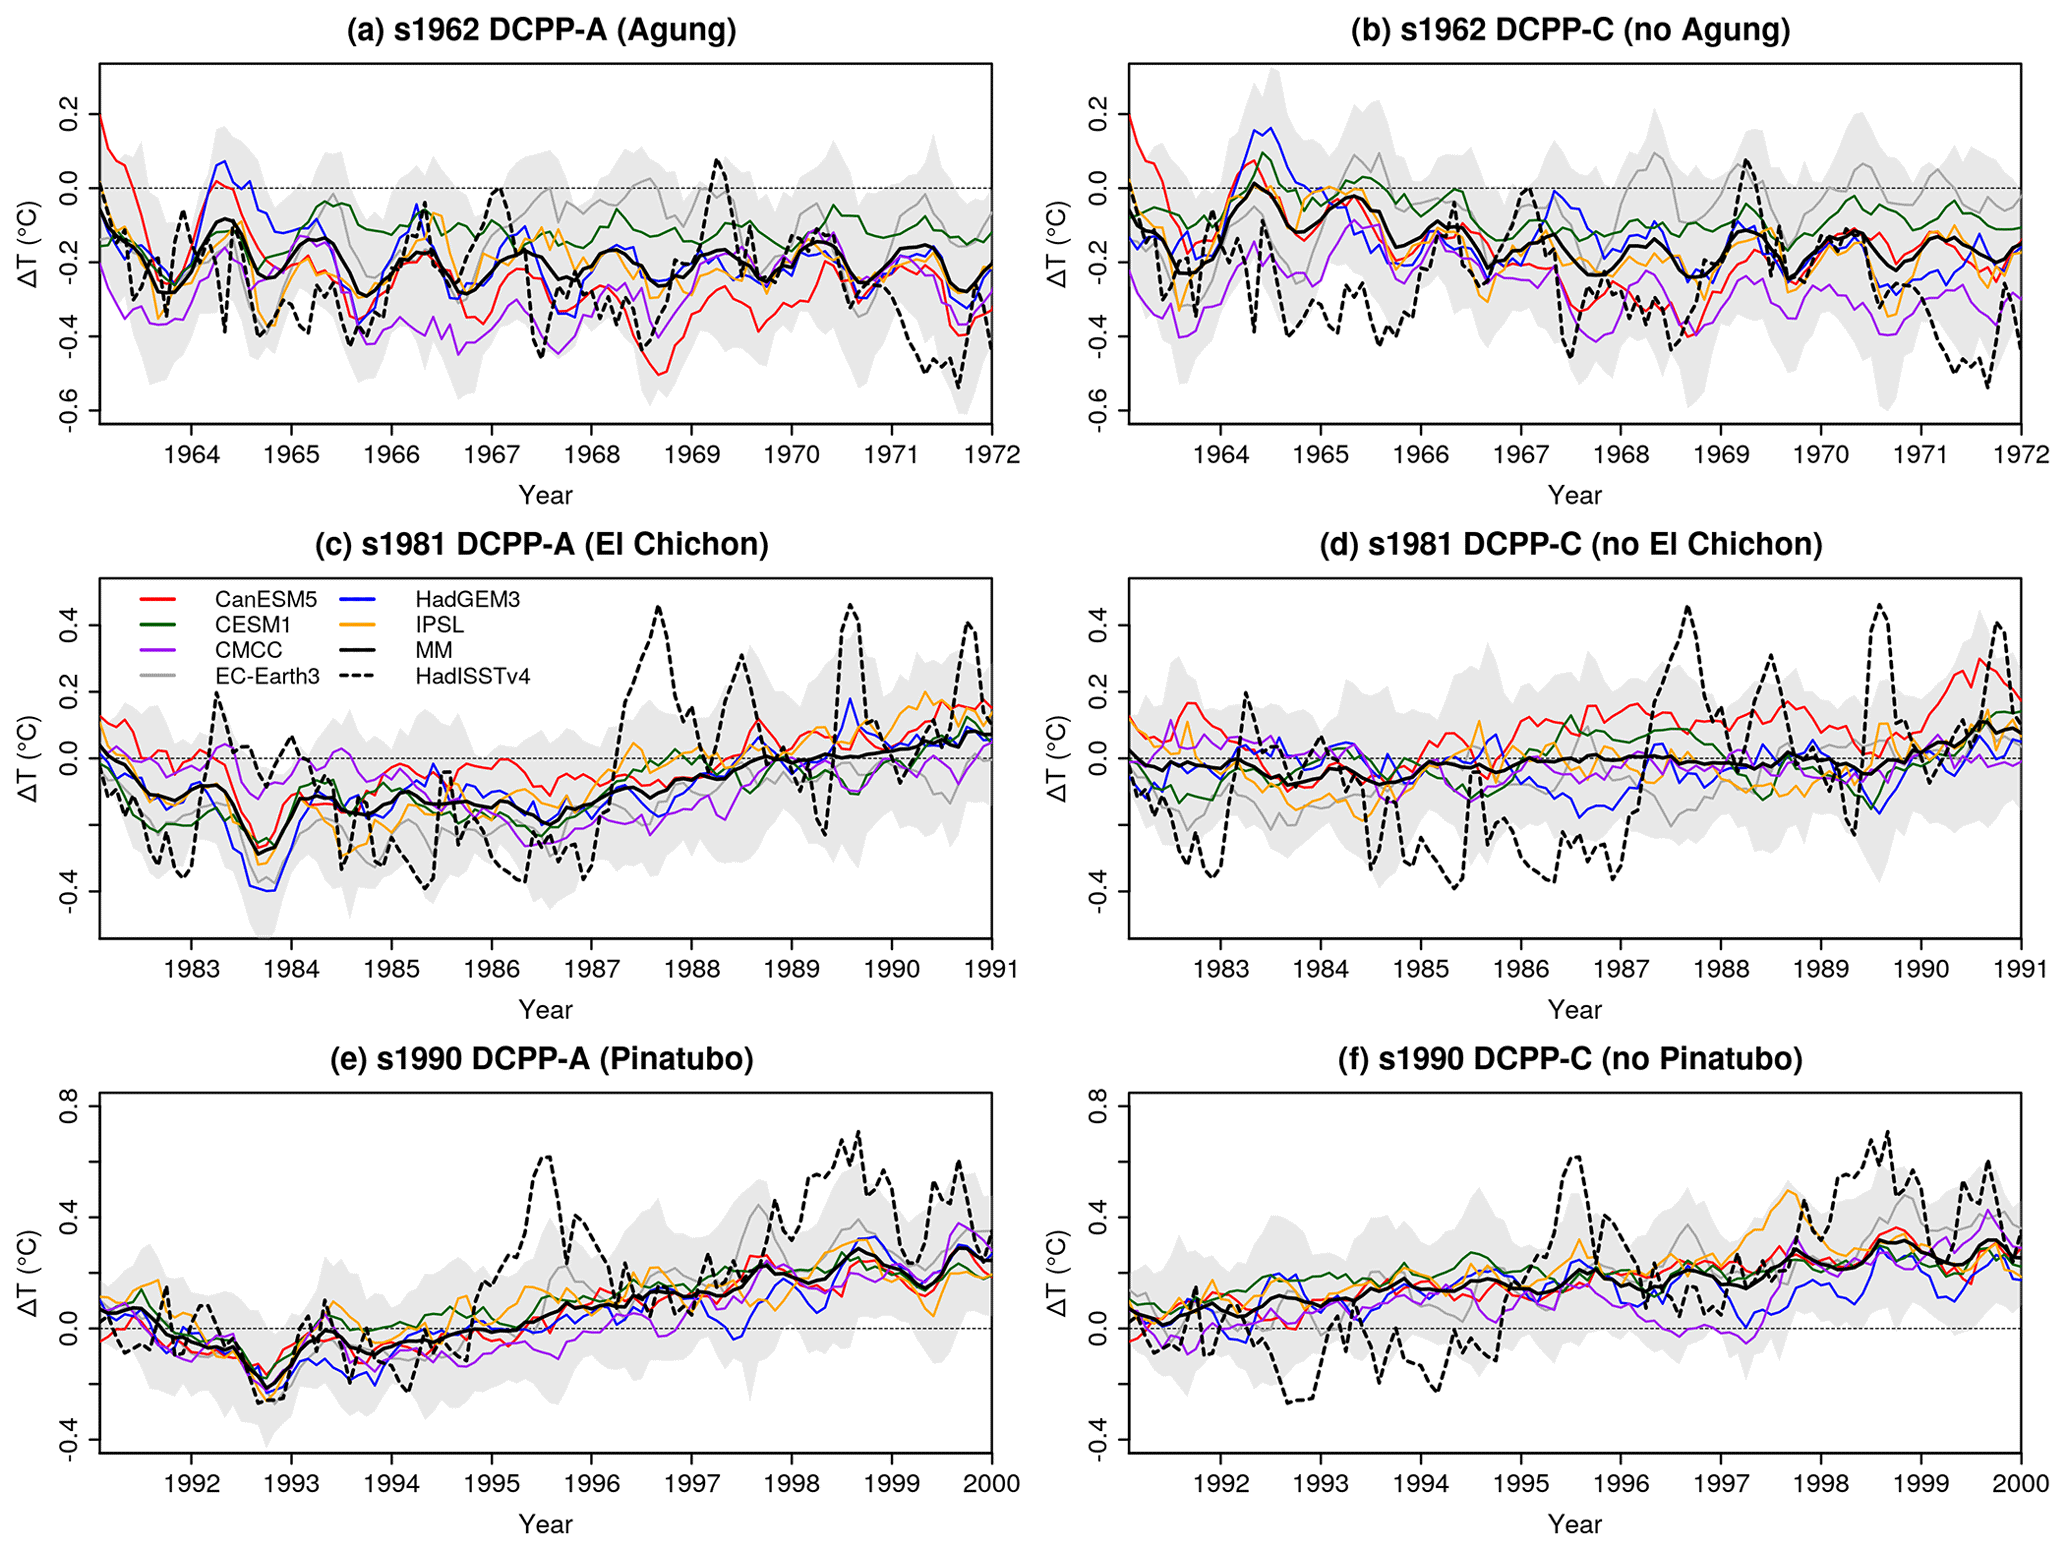
Figure 14North Atlantic (0–60° N, 80° W–0°) SST anomalies (°C) in the predictions initialised in 1962, 1981 and 1990 for the DCPP-A (with volcanic forcing) and DCPP-C (without volcanic forcing) experiments. HadISSTv4 is used as the observational reference (dashed line). The anomalies have been computed with respect to the period 1970–2005 (see the Methods section for further information). The ensemble mean for each model and the multi-model mean are shown. The shading is the multi-model member spread calculated as the 10th and 90th percentiles of all members.
To isolate the changes that are specific to the North Atlantic Ocean, which might additionally arise from internal variability processes, we compute the AMV index as a standardised anomaly relative to the global SST mean (between 60° N–60° S) (Trenberth and Shea, 2006). We find that for this AMV index there is no significant impact due to the volcanic forcing (Fig. S9). As previous studies have shown, the AMOC plays a key role in modulating the AMV, associated with changes in ocean transport convergence on timescales longer than 10 years (e.g. Knight et al., 2005; Kim et al., 2018; Oelsmann et al., 2020; Fang et al., 2021). Furthermore, other studies have shown that the dynamical adjustment timescale of the Atlantic circulation in response to the volcanic forcing can be up to 15 years (e.g. Mignot et al., 2011; Swingedouw et al., 2015). Therefore, the predictions might be too short to reflect an impact due to the volcanic forcing on the AMV.
To further explore if the AMV response could be explained by changes in North Atlantic Ocean dynamics, we investigate the changes in the mixed layer depth and the AMOC (i.e. precursors to AMV changes). First we consider the multi-model and multi-eruption composites for the mixed layer depth in the subpolar North Atlantic. Figure 15a–d show a significant enhancement of the deep mixed layer in late winter and early spring (when the mixed layer depth in this region attains its maximum) in the first 3 years following the eruptions, with a maximum in the Labrador Sea (Fig. 15a–d). The mixed layer depth is usually interpreted as a proxy for deep convection, and in many models enhanced deep mixing in the subpolar North Atlantic is associated with strengthening of the AMOC a few years later (e.g. Dong and Sutton, 2005; Ortega et al., 2011). Indeed, Fig. 15e–h show that the mean AMOC stream function also experiences a small but significant strengthening in response to the volcanic forcing during years 2–9 after the eruption. The sign of the response is consistent for all the individual eruptions and the magnitude of both the mixed layer deepening and the AMOC strengthening seems to depend on the magnitude of the volcanic forcing, with responses in order of decreasing magnitude for Pinatubo, Agung and El Chichón.
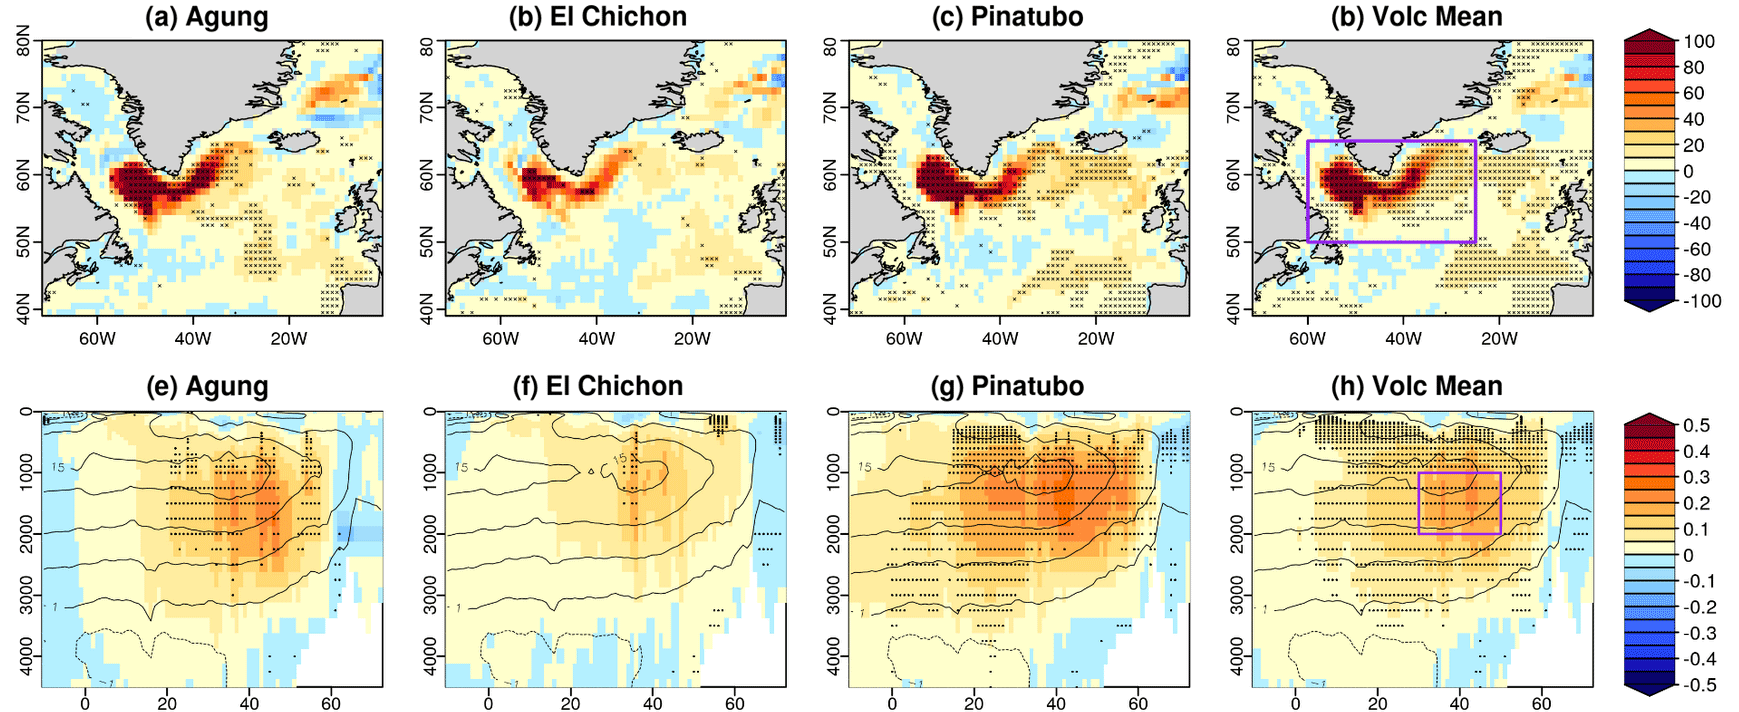
Figure 15Multi-model and multi-eruption composites response for the mixed layer (February–March–April) depth (m) for years 1–3 and overturning stream function (Sv) years 2–9 to the volcanic eruptions. Stippling indicates statistically significant anomalies (see the Methods section).
We now explore the temporal evolution of the responses in the whole ensemble for two indices of the mixed layer depth and AMOC by averaging over the purple boxes in Fig. 15d and h, respectively. Figure 16 shows that the response of these indices has a large spread among the models, with HadGEM3-GC31-MM and CMCC-CM2-SR5 dominating the multi-model signal and the rest of the models not simulating a consistent or a significant response. Hence, Fig. 15 should be interpreted with care as the result is dominated by these models.
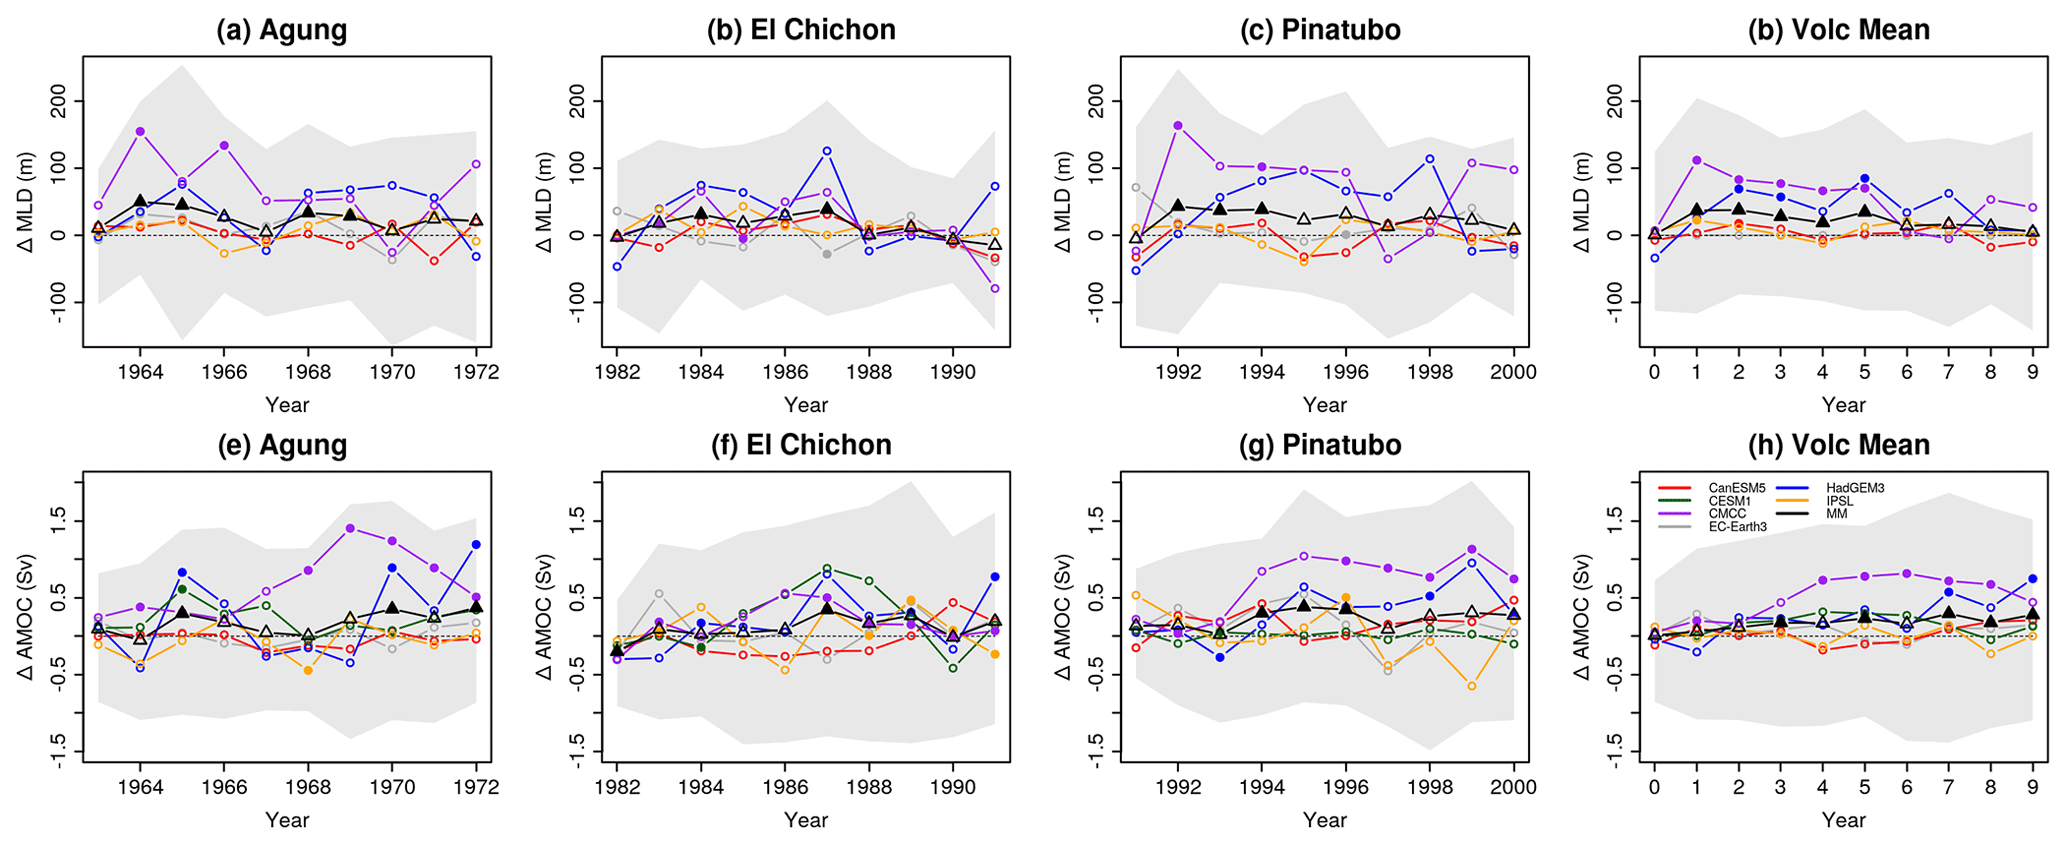
Figure 16Volcanic response (DCPP-A minus DCPP-C) of the mixed layer depth in the subpolar North Atlantic (50–65° N, 60–35° W) in February–March–April (top row) and the annual mean overturning stream function averaged over 30–50° N and 1000–2000 m (bottom row). Filled circles and triangles indicate statistically significant differences (see the Methods section). The ensemble mean for each model and the multi-model mean are shown. The shading is the multi-model member spread calculated as the 10th and 90th percentiles of the entire ensemble. The mixed layer depth for CESM1-1-CAM5-CMIP5 was not available and therefore could not be included.
To further explore the origin of the inter-model differences in the AMOC response we look at the background density stratification conditions in each model to infer their preconditioning role in convection. Figure 17a–c show the change in the multi-eruption composite profiles of temperature, salinity and density in the Labrador Sea due to the effect of the volcanic eruptions in the first three winters (DJF) after their occurrence. We focus on DJF, which is a couple of months before the peak season for convection, because it includes both the preconditioning signal and the response to the vertical mixing, which hinders the interpretation of the results. CMCC-CM2-SR5, HadGEM3-GC31-MM and IPSL-CM6A-LR show significant changes in temperature, salinity and density in response to the volcanic forcing, which mostly imply a cooling, a salinification and a densification of the upper ocean levels. The simulated increase in upper density erodes the mean stratification and is thus consistent with a subsequent enhancement in convection. As previously shown, this is indeed the case for the CMCC-CM2-SR5 and HadGEM3-GC31-MM models (Fig. 16), for which the specific processes at play might differ as salinity changes seem to dominate the density changes in CMCC-CM2-SR5, while for HadGEM3-GC31-MM temperature changes seem to be more important. The reason for the lack of responsiveness of the mixed layer depth in IPSL-CM6A-LR, despite the significant surface densification exerted by the volcanic forcing, is the very strongly stratified mean state density conditions that it presents in the region, which are linked to very fresh upper-ocean conditions (Fig. 17d–f). In the rest of the models no significant changes in temperature or salinity are observed in response to the eruptions, which explains why neither the mixed layer depth nor the AMOC show a significant response.
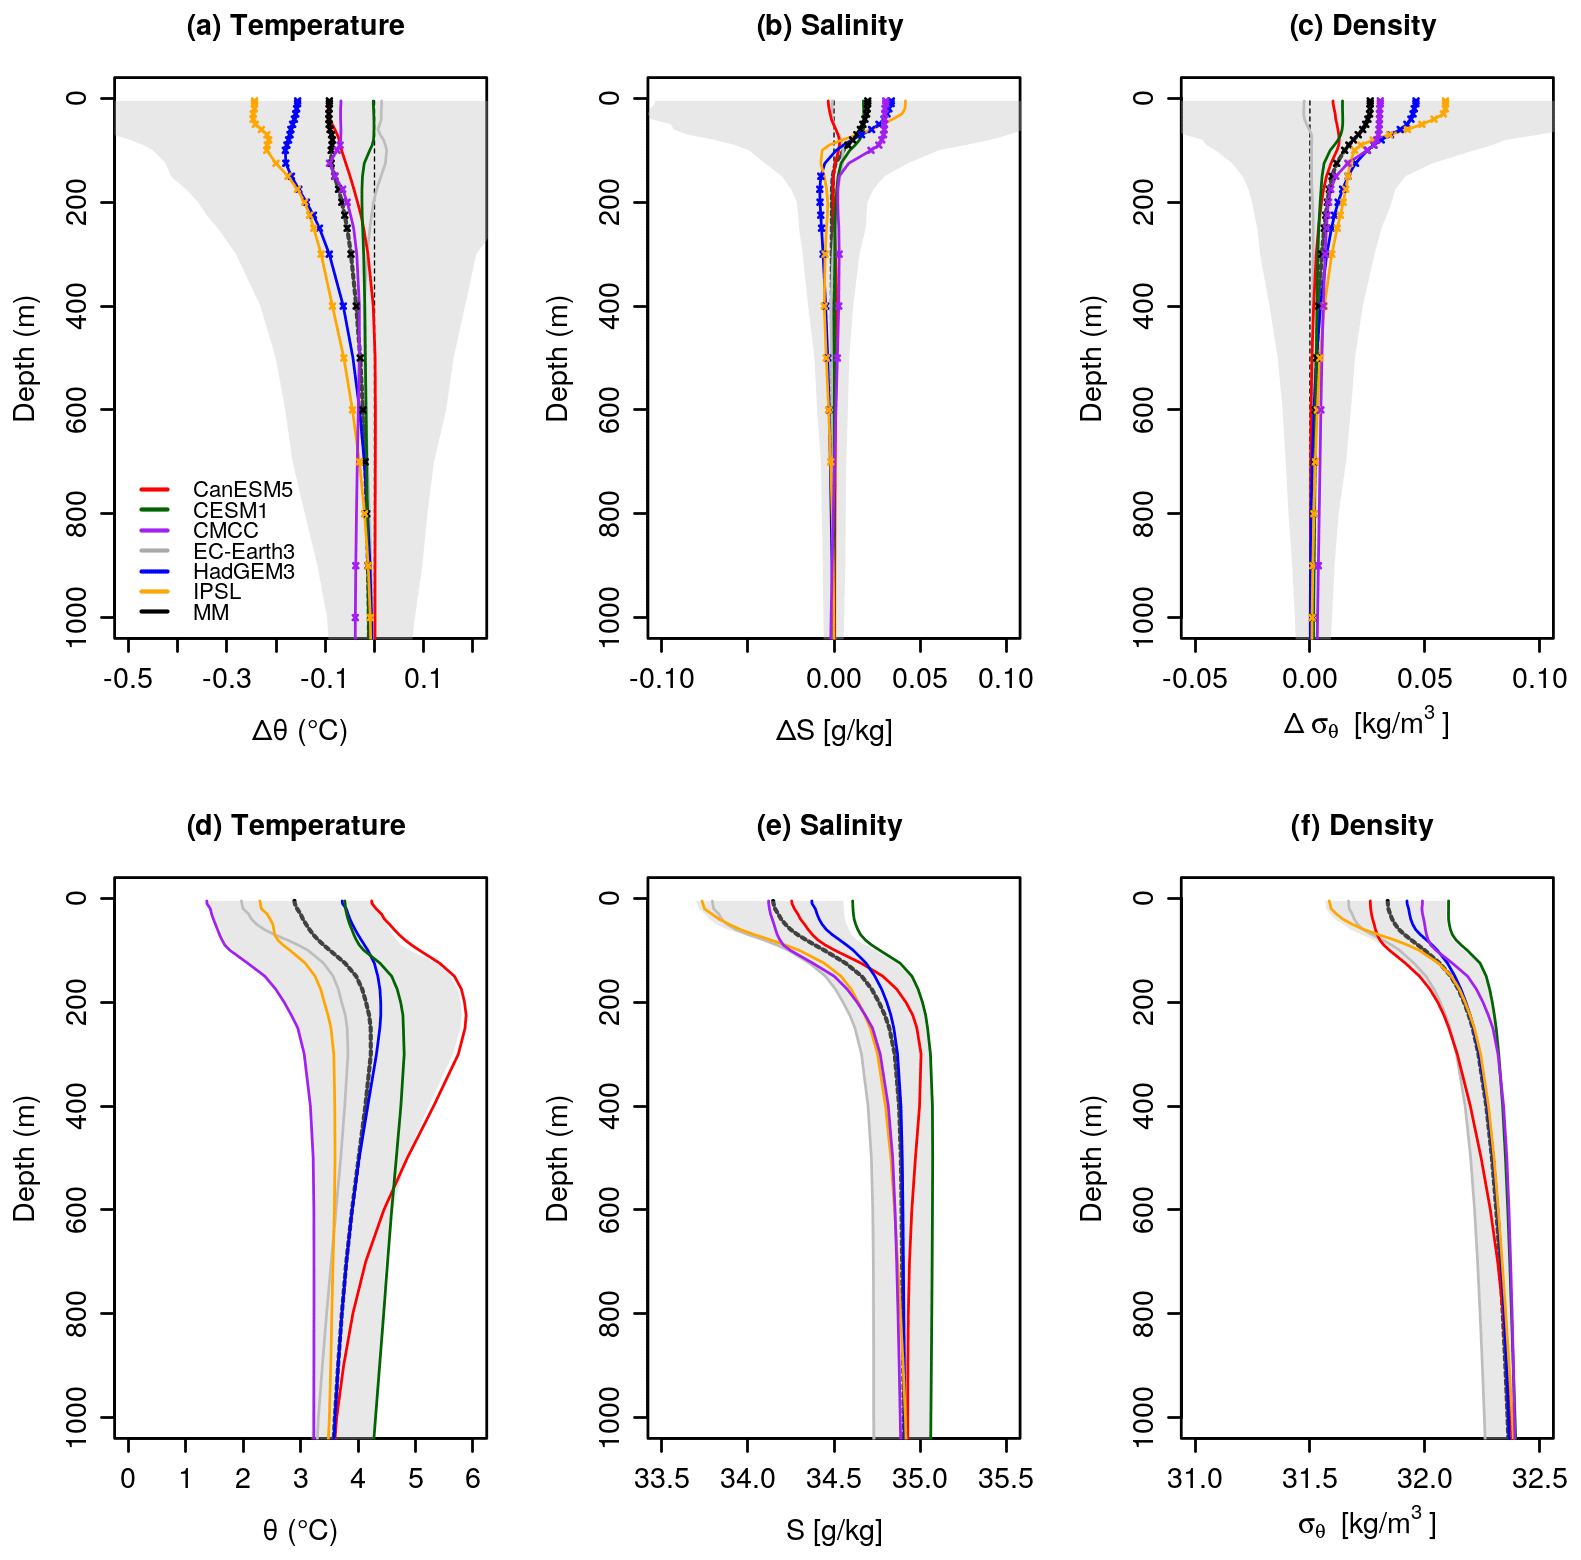
Figure 17Multi-eruption mean response of the DJF Labrador Sea (50–65° N, 60–35° W) potential temperature, salinity and potential density profiles in years 1–3 after the eruptions (a–c) and absolute DJF Labrador Sea potential temperature, salinity and potential density (sigma1) profiles in years 1–3 after the eruptions in the predictions without volcanic forcing (d–f). Crosses indicate statistically significant differences (see the Methods section). The ensemble mean for each model and the multi-model mean are shown. The shading is the multi-model member spread calculated as the 10th and 90th percentiles.
DCPP includes a coordinated protocol to improve our understanding of the effects of volcanic aerosols on past climate variability through the use of decadal predictions. It involves repeating three sets of retrospective predictions initialised just before the major eruptions of Agung (1963), El Chichón (1982) and Pinatubo (1991), but without their associated volcanic forcing (DCPP-C Boer et al., 2016). In this study we have analysed and compared these prediction sets with baseline predictions that include all forcings using six different CMIP6 decadal prediction systems. This sensitivity analysis is conducted with climate predictions to simulate a more realistic climatic response to the forcings, as the initialisation process is expected to phase the model with the observed climate state at the time of the eruptions. This method is also likely to improve on assessments of volcanic impacts based on historical simulations, where anomalies are constructed relative to an uncertain pre-volcanic climatology. A similar study was performed in Hermanson et al. (2020), only focusing on the mean multi-model and multi-eruption response. Our new analysis takes a step forward in ambition by using a new generation of decadal prediction systems, a fully consistent common protocol (which was not the case for Hermanson et al., 2020), larger ensembles and longer forecast outlooks to characterise the radiative and dynamical responses to these three eruptions, also investigating their differences across models and eruptions. Furthermore, we have compared the predicted surface temperature in the three DCPP-A (with volcanic forcing) and DCPP-C (without volcanic forcing) hindcasts with observations to thus determine whether including the volcanic forcing qualitatively improves the predictions. The main findings are summarised in the following.
All the decadal prediction systems in this study simulate the well-known post-volcanic radiative effects (reductions in the global net TOA radiation fluxes, surface temperature and ocean heat content) with small inter-model differences in the ensemble mean response. These results also confirm that the response strongly depends on the magnitude and spatial structure of the forcing. The eruption of Pinatubo was the largest and consequently exhibits the strongest reduction and most persistent anomalies in TOA radiation fluxes, surface temperature and ocean heat content. It is worth noting that the inter-model differences in the ensemble mean response are smaller when the magnitude of the volcanic forcing is larger (i.e. Pinatubo), as the signal-to-noise ratio improves. The geographical pattern of the surface temperature response is generally consistent across the models, and some features are common for the three eruptions. For example, the first year following the eruptions is characterised by a cooling of the tropics and subtropics and a warming over the Eurasian Arctic sector, although the warming is only statistically significant for the eruption of Agung and the multi-eruption composite. This suggests that the background conditions imposed by the initial conditions may have modulated such a response or that due to the signal-to-noise paradox it can only be seen by chance or in a large ensemble. In the subsequent years the cooling spreads globally, with the strongest anomalies being found over the Arctic. There also are evident differences in the responses to the volcanic eruptions that can be explained by latitudinal structure of the associated volcanic forcings. While the eruption of Agung (located at 8° S) mainly affected the Southern Hemisphere, the eruption of El Chichón (located at 17° N) impacted the Northern Hemisphere, which can be easily seen in the TOA radiation and surface temperature anomaly patterns of the response. In contrast, the stronger eruption of Pinatubo (located at 15° N) had a more meridionally symmetric response, probably reflecting a more effective redistribution of the volcanic ashes by the stratospheric circulation.
Since the dynamical responses are more sensitive to climatic noise, we first analyse the multi-model and multi-eruption composite, formed by 180 members, to detect the common response. We note that this approach is useful to increase the ensemble size but can also mask some responses by including weaker eruptions (see Bittner et al., 2016). The resulting composite response of the Northern Hemisphere atmospheric circulation is consistent with previous studies showing strong tropical warming in the lower stratosphere accompanied by a strengthening of the Northern Hemisphere polar vortex in the first winter, which resembles a positive NAO-like pattern (e.g. Hermanson et al., 2020). However, this NAO-like response is not statistically significant, which could be because the eruptions considered are not strong enough to trigger a response that outweighs the internal variability (see DallaSanta and Polvani, 2022) and/or because the models might be underestimating the signals due to the signal-to-noise paradox, which is a common model bias where the predictable signal is much smaller than in observations (e.g. Scaife and Smith, 2018). The response of ENSO is consistent with previous studies showing the development of weak El Niño-like conditions in the first year after the eruption which then transition to weak La Niña-like conditions in the second and third years (e.g. Hermanson et al., 2020). In the North Atlantic Ocean we have shown that there is a significant enhancement of the mixed layer depth in the Labrador Sea during the three boreal winters following the eruptions and a weak but significant strengthening of the AMOC during years 2–9 after the eruptions, which is consistent with previous findings (e.g. Swingedouw et al., 2017). We have related these responses to a reduction in density stratification in the Labrador Sea.
A novelty of this study is that we have also explored the intra-ensemble spread, revealing important differences in the dynamical responses across both the prediction systems and eruptions. Multi-model composites for individual eruptions show that the acceleration of the Northern Hemisphere polar vortex only occurs in the eruptions of Agung and Pinatubo, but not for El Chichón. The lack of a response for El Chichón is probably related to a combination of factors, including its weak intensity, the geographical pattern of the forcing and the background climate conditions. In the case of the ENSO response, we have shown that for the eruptions of Agung and Pinatubo, El Niño-like conditions develop and peak in the first year following the eruptions, while for the eruption of El Chichón, El Niño-like conditions occur in the same year of the eruption. We argue that these differences probably stem from differences in the geographical pattern of the volcanic forcing (see Pausata et al., 2020), the timing of the eruption and the background ocean state (see Predybaylo et al., 2020). We have also shown that there are important inter-model differences in these dynamical responses. For example, not all models simulate an acceleration of the Northern Hemisphere polar vortex. The ENSO response is also model-dependent since some models show a strong response and others remain unresponsive. Similarly, for the North Atlantic Ocean we have shown that the multi-model response is explained exclusively by two of the models (CMCC-CM2-SR5 and HadGEM3-GC31-MM), which show coherent changes in Labrador Sea stratification, the mixed layer depth and the AMOC.
A final novel aspect of our study is that we have investigated whether including the volcanic forcing has an overall beneficial effect on the predictions. We have shown that for the global mean surface air temperature, the DCPP-A hindcasts predict the observed post-volcanic cooling significantly better. At the local scale, even though the volcanic forcing has a characteristic regional surface air temperature response pattern which evolves with forecast time, an improvement in the DCPP-A hindcasts is only seen for forecast years 2–5, when the volcanic signal is strongest. For other forecast times considered (year 1 and years 6–9), either the local volcanic signals are overwhelmed by internal variability or the regional response to the volcanic forcing is not correctly simulated by the models. In particular we have shown that the volcanic forcing seems to have a weak impact on ENSO and in the case of Pinatubo degrades the predicted SST anomalies in the tropical Pacific Ocean, as previously shown in Wu et al. (2023) for the CESM1 decadal predictions. This is not the case for the other two eruptions, which simulate a similar response in the tropical Pacific whether the volcanic aerosols are included or not. In contrast, in the North Atlantic Ocean, the volcanic forcing seems to be particularly important for reproducing the observed SST anomalies in the first few years following the eruptions. We also note that the hindcast corresponding to the eruption of Pinatubo is overall better at predicting the observed anomalies than for the eruptions of Agung and El Chichón. This could be because the eruption of Pinatubo had a stronger climatic impact and/or because the volcanic forcing is better constrained by the satellite observations available.
The results of this multi-model study provide further insights on the effects of volcanic eruptions on climate and their predictability. We note, however, that further work is required to narrow down the associated uncertainties and understand the mechanisms if we want to leverage the predictability of any new major volcanic eruption. Another caveat is that we are limited by the observational record and hindcast period to three major volcanic eruptions, which is a small sample size. This should be taken into account in the comparison between the hindcasts and observations since some of the apparent improvements, in particular those related to dynamical variables, might be occurring by chance. The volcanic eruptions covered by our hindcasts only account for three possible background climate states, which might substantially differ from the prevailing climate state when the new major eruption happens. Idealised simulations such as those proposed by VolMIP (Zanchettin et al., 2016, 2022) considering different initial states based on the phase of different modes of climate variability could provide complementary insights to our study. Another source of uncertainty comes from the volcanic forcing itself (Toohey et al., 2014). For example, we have shown that CESM1-1-CAM5-CMIP5 has a considerably stronger tropical lower-stratospheric temperature response than other models, which could be explained by the fact that it is the only model that did not use the CMIP6 forcing. This could indeed explain the differences in response in other variables too. Understanding the sensitivity to the volcanic forcing is particularly relevant in a real-time climate prediction context and an experimental protocol that specifies hypothetical eruptions at different strengths, but with the same initial conditions, could be particularly elucidating. SPARC (Stratosphere–Troposphere Processes and their role in Climate), a core project of and the World Climate Research Program (WCRP), has recently launched the Volcanic Response Plan (VolRES) for the next major eruption, where the volcanic forcing of the future eruption would be estimated using quick tools such as the Easy Volcanic Aerosol model (e.g. Toohey et al., 2016; Aubry et al., 2020), which, however, comes with important simplifications. A final limitation of the current DCPP-C protocol is that, since it only reruns three start dates from the DCPP-A hindcasts, it does not allow for an assessment of the impact of these volcanic eruptions on the forecast skill (as in Timmreck et al., 2016; Ménégoz et al., 2018a; Wu et al., 2023), as the lead-time-dependent climatologies cannot be properly removed. Therefore, we recommend that future DCPP-C exercises consider rerunning all the hindcasts that overlap with these three volcanic eruptions.
For data retrieval, loading, processing and calculating metrics, and visualisation, the startR (Automatically Retrieve Multidimensional Distributed Data Sets; R package version 2.3.0, Manubens et al., 2023) and s2dv (A Set of Common Tools for Seasonal to Decadal Verification; R package version 2.0.0, Ho et al., 2023) R libraries have been used. The density profiles were computed using the Earth System Model Evaluation Tool (Righi et al., 2020). The code to reproduce the results and figures presented in this study can be made available upon request.
The climate model data used in this study are openly available from the Earth System Grid Federation (ESGF) at the following URL: https://esgf-node.llnl.gov/search/cmip6/ (last access: 18 April 2024).
The supplement related to this article is available online at: https://doi.org/10.5194/esd-15-501-2024-supplement.
Data curation: ACH and MS. Formal analysis: RB. Investigation: all authors. Methodology: all authors. Visualisation: RB. Writing – original draft preparation: RB. Writing – review and editing: all authors.
The contact author has declared that none of the authors has any competing interests.
Publisher's note: Copernicus Publications remains neutral with regard to jurisdictional claims made in the text, published maps, institutional affiliations, or any other geographical representation in this paper. While Copernicus Publications makes every effort to include appropriate place names, the final responsibility lies with the authors.
We thank the Decadal Climate Prediction Project (DCPP) for designing the experimental protocol, the climate modelling groups for producing the simulations and making the output available, and the Earth System Grid Federation (ESGF) for archiving the data and providing access. We also thank Davide Zanchettin and an anonymous reviewer for their thoughtful comments that improved this paper.
This research has been supported by the Departament de Recerca i Universitats de la Generalitat de Catalunya for the Climate Variability and Change (CVC) Research Group (reference: 2021 SGR 00786). Roberto Bilbao was supported by the European Union's Horizon 2020 research project CONFESS (grant no. 101004156). Pablo Ortega was supported by the Spanish Ministry of Economy, Industry and Competitiveness through Ramon y Cajal (grant no. RYC-2017-22772). Stephen Yeager acknowledges the support of the Regional and Global Model Analysis (RGMA) component of the Earth and Environmental System Modeling Program of the Office of Biological and Environmental Research (BER) (award no. DE-SC0022070).
This paper was edited by Claudia Timmreck and reviewed by Davide Zanchettin and one anonymous referee.
Ammann, C. M., Meehl, G. A., Washington, W. M., and Zender, C. S.: A monthly and latitudinally varying volcanic forcing dataset in simulations of 20th century climate, Geophys. Res. Lett., 30, 1657, https://doi.org/10.1029/2003GL016875, 2003. a, b
Arfeuille, F., Weisenstein, D., Mack, H., Rozanov, E., Peter, T., and Brönnimann, S.: Volcanic forcing for climate modeling: a new microphysics-based data set covering years 1600–present, Clim. Past, 10, 359–375, https://doi.org/10.5194/cp-10-359-2014, 2014. a
Aubry, T. J., Toohey, M., Marshall, L., Schmidt, A., and Jellinek, A. M.: A New Volcanic Stratospheric Sulfate Aerosol Forcing Emulator (EVA_H): Comparison With Interactive Stratospheric Aerosol Models, J. Geophys. Res.-Atmos., 125, e2019JD031303, https://doi.org/10.1029/2019JD031303, 2020. a
Azoulay, A., Schmidt, H., and Timmreck, C.: The Arctic Polar Vortex Response to Volcanic Forcing of Different Strengths, J. Geophys. Res.-Atmos., 126, e2020JD034450, https://doi.org/10.1029/2020JD034450, 2021. a
Bilbao, R., Wild, S., Ortega, P., Acosta-Navarro, J., Arsouze, T., Bretonnière, P.-A., Caron, L.-P., Castrillo, M., Cruz-García, R., Cvijanovic, I., Doblas-Reyes, F. J., Donat, M., Dutra, E., Echevarría, P., Ho, A.-C., Loosveldt-Tomas, S., Moreno-Chamarro, E., Pérez-Zanon, N., Ramos, A., Ruprich-Robert, Y., Sicardi, V., Tourigny, E., and Vegas-Regidor, J.: Assessment of a full-field initialized decadal climate prediction system with the CMIP6 version of EC-Earth, Earth Syst. Dynam., 12, 173–196, https://doi.org/10.5194/esd-12-173-2021, 2021. a
Bittner, M., Schmidt, H., Timmreck, C., and Sienz, F.: Using a large ensemble of simulations to assess the Northern Hemisphere stratospheric dynamical response to tropical volcanic eruptions and its uncertainty, Geophys. Res. Lett., 43, 9324–9332, https://doi.org/10.1002/2016GL070587, 2016. a, b
Boer, G. J., Smith, D. M., Cassou, C., Doblas-Reyes, F., Danabasoglu, G., Kirtman, B., Kushnir, Y., Kimoto, M., Meehl, G. A., Msadek, R., Mueller, W. A., Taylor, K. E., Zwiers, F., Rixen, M., Ruprich-Robert, Y., and Eade, R.: The Decadal Climate Prediction Project (DCPP) contribution to CMIP6, Geosci. Model Dev., 9, 3751–3777, https://doi.org/10.5194/gmd-9-3751-2016, 2016. a, b, c
Borchert, L. F., Menary, M. B., Swingedouw, D., Sgubin, G., Hermanson, L., and Mignot, J.: Improved Decadal Predictions of North Atlantic Subpolar Gyre SST in CMIP6, Geophys. Res. Lett., 48, e2020GL091307, https://doi.org/10.1029/2020GL091307, 2021. a, b, c, d
Charlton-Perez, A. J., Baldwin, M. P., Birner, T., Black, R. X., Butler, A. H., Calvo, N., Davis, N. A., Gerber, E. P., Gillett, N., Hardiman, S., Kim, J., Krüger, K., Lee, Y.-Y., Manzini, E., McDaniel, B. A., Polvani, L., Reichler, T., Shaw, T. A., Sigmond, M., Son, S.-W., Toohey, M., Wilcox, L., Yoden, S., Christiansen, B., Lott, F., Shindell, D., Yukimoto, S., and Watanabe, S.: On the lack of stratospheric dynamical variability in low-top versions of the CMIP5 models, J. Geophys. Res.-Atmos., 118, 2494–2505, https://doi.org/10.1002/jgrd.50125, 2013. a
Christiansen, B.: Volcanic Eruptions, Large-Scale Modes in the Northern Hemisphere, and the El Niño–Southern Oscillation, J. Clim., 21, 910–922, https://doi.org/10.1175/2007JCLI1657.1, 2008. a
Clement, A. C., Seager, R., Cane, M. A., and Zebiak, S. E.: An Ocean Dynamical Thermostat, J. Clim., 9, 2190–2196, https://doi.org/10.1175/1520-0442(1996)009<2190:AODT>2.0.CO;2, 1996. a
DallaSanta, K. and Polvani, L. M.: Volcanic stratospheric injections up to 160 Tg(S) yield a Eurasian winter warming indistinguishable from internal variability, Atmos. Chem. Phys., 22, 8843–8862, https://doi.org/10.5194/acp-22-8843-2022, 2022. a, b, c
Ding, Y., Carton, J. A., Chepurin, G. A., Stenchikov, G., Robock, A., Sentman, L. T., and Krasting, J. P.: Ocean response to volcanic eruptions in Coupled Model Intercomparison Project 5 simulations, J. Geophys. Res.-Ocean., 119, 5622–5637, https://doi.org/10.1002/2013JC009780, 2014. a, b
Dong, B. and Sutton, R. T.: Mechanism of Interdecadal Thermohaline Circulation Variability in a Coupled Ocean–Atmosphere GCM, J. Clim., 18, 1117–1135, https://doi.org/10.1175/JCLI3328.1, 2005. a
Driscoll, S., Bozzo, A., Gray, L. J., Robock, A., and Stenchikov, G.: Coupled Model Intercomparison Project 5 (CMIP5) simulations of climate following volcanic eruptions, J. Geophys. Res.-Atmos., 117, D17105, https://doi.org/10.1029/2012JD017607, 2012. a
Estella-Perez, V., Mignot, J., Guilyardi, E., Swingedouw, D., and Reverdin, G.: Advances in reconstructing the AMOC using sea surface observations of salinity, Clim. Dynam., 55, 1432–0894, https://doi.org/10.1007/s00382-020-05304-4, 2020. a
Eyring, V., Gillett, N., Achuta Rao, K., Barimalala, R., Barreiro Parrillo, M., Bellouin, N., Cassou, C., Durack, P., Kosaka, Y., McGregor, S., Min, S., Morgenstern, O., and Sun, Y.: Human Influence on the Climate System, in: Climate Change 2021: The Physical Science Basis. Contribution of Working Group I to the Sixth Assessment Report of the Intergovernmental Panel on Climate Change, edited by Masson-Delmotte, V., Zhai, P., Pirani, A., Connors, S. L., Péan, C., Berger, S., Caud, N., Chen, Y., Goldfarb, L., Gomis, M. I., Huang, M., Leitzell, K., Lonnoy, E., Matthews, J. B. R., Maycock, T. K., Waterfield, T., Yelekçi, O., Yu, R., and Zhou, B., book section 3, Cambridge University Press, Cambridge, UK and New York, NY, USA, https://doi.org/10.1017/9781009157896.005, 2021. a
Fang, S.-W., Khodri, M., Timmreck, C., Zanchettin, D., and Jungclaus, J.: Disentangling Internal and External Contributions to Atlantic Multidecadal Variability Over the Past Millennium, Geophys. Res. Lett., 48, e2021GL095990, https://doi.org/10.1029/2021GL095990, 2021. a, b, c
Graf, H., Kirchner, I., Robock, A., and Schult, I.: Pinatubo eruption winter climate effects: model versus observations, Clim. Dynam., 9, 81–93, https://doi.org/10.1007/BF00210011, 1993. a
Hermanson, L., Bilbao, R., Dunstone, N., Ménégoz, M., Ortega, P., Pohlmann, H., Robson, J. I., Smith, D. M., Strand, G., Timmreck, C., Yeager, S., and Danabasoglu, G.: Robust Multiyear Climate Impacts of Volcanic Eruptions in Decadal Prediction Systems, J. Geophys. Res.-Atmos., 125, e2019JD031739, https://doi.org/10.1029/2019JD031739, 2020. a, b, c, d, e, f, g, h, i, j, k, l, m, n, o, p
Hermanson, L., Smith, D., Seabrook, M., Bilbao, R., Doblas-Reyes, F., Tourigny, E., Lapin, V., Kharin, V. V., Merryfield, W. J., Sospedra-Alfonso, R., Athanasiadis, P., Nicoli, D., Gualdi, S., Dunstone, N., Eade, R., Scaife, A., Collier, M., O’Kane, T., Kitsios, V., Sandery, P., Pankatz, K., Früh, B., Pohlmann, H., Müller, W., Kataoka, T., Tatebe, H., Ishii, M., Imada, Y., Kruschke, T., Koenigk, T., Karami, M. P., Yang, S., Tian, T., Zhang, L., Delworth, T., Yang, X., Zeng, F., Wang, Y., Counillon, F., Keenlyside, N., Bethke, I., Lean, J., Luterbacher, J., Kolli, R. K., and Kumar, A.: WMO Global Annual to Decadal Climate Update: A Prediction for 2021–25, Bull. Am. Meteorol. Soc., 103, E1117–E1129, https://doi.org/10.1175/BAMS-D-20-0311.1, 2022. a
Ho, A.-C., Perez-Zanon, N., Bilbao, R., Cos, J., Delgado, C., Lledó, L., Manrique, A., Verfaillie, D., Rifa, E., and BSC-CNS: s2dv: A Set of Common Tools for Seasonal to Decadal Verification v2.0.0, The Comprehensive R Archive Network (CRAN) [code], https://cran.r-project.org/web/packages/s2dv/index.html (last access: 18 April 2024), 2023. a
Iwi, A. M., Hermanson, L., Haines, K., and Sutton, R. T.: Mechanisms Linking Volcanic Aerosols to the Atlantic Meridional Overturning Circulation, J. Clim., 25, 3039–3051, https://doi.org/10.1175/2011JCLI4067.1, 2012. a
Kennedy, J. J., Rayner, N. A., Atkinson, C. P., and Killick, R. E.: An Ensemble Data Set of Sea Surface Temperature Change From 1850: The Met Office Hadley Centre HadSST.4.0.0.0 Data Set, J. Geophys. Res.-Atmos., 124, 7719–7763, https://doi.org/10.1029/2018JD029867, 2019. a
Khodri, M., Izumo, T., Vialard, J., Janicot, S., Cassou, C., Lengaigne, ., Mignot, J., Gastineau, G., Guilyardi, E., Lebas, N., Robock, A., and McPhaden, M. J.: Tropical explosive volcanic eruptions can trigger El Niño by cooling tropical Africa, Nat. Commun., 8, 2041–1723, https://doi.org/10.1038/s41467-017-00755-6, 2017. a, b, c
Kim, W. M., Yeager, S. G., and Danabasoglu, G.: Key Role of Internal Ocean Dynamics in Atlantic Multidecadal Variability During the Last Half Century, Geophys. Res. Lett., 45, 13449–13457, https://doi.org/10.1029/2018GL080474, 2018. a
Knight, J. R., Allan, R. J., Folland, C. K., Vellinga, M., and Mann, M. E.: A signature of persistent natural thermohaline circulation cycles in observed climate, Geophys. Res. Lett., 32, L20708, https://doi.org/10.1029/2005GL024233, 2005. a, b
Lehner, F., Schurer, A. P., Hegerl, G. C., Deser, C., and Frölicher, T. L.: The importance of ENSO phase during volcanic eruptions for detection and attribution, Geophys. Res. Lett., 43, 2851–2858, https://doi.org/10.1002/2016GL067935, 2016. a
Luo, B.: Stratospheric aerosol data for use in CMIP6 models, ftp://iacftp.ethz.ch/pub_read/luo/CMIP6/Readme_Data_Description.pdf (last access: 18 April 2023), 2018. a
Maher, N., McGregor, S., England, M. H., and Gupta, A. S.: Effects of volcanism on tropical variability, Geophys. Res. Lett., 42, 6024–6033, https://doi.org/10.1002/2015GL064751, 2015. a
Marshall, L. R., Maters, E. C., Schmidt, A., Timmreck, C., Robock, A., and Toohey, M.: Volcanic effects on climate: recent advances and future avenues, Bull. Volcanol., 84, 1–31, https://doi.org/10.1007/s00445-022-01559-3, 2022. a
Manubens, N., Ho, A.-C., Perez-Zanon, N., Rifa, E., Agudetse, V., de Paula Kinoshita, B., Vegas, J., Bretonniere, P. A., Serrano, R., and BSC-CNS: startR: Automatically Retrieve Multidimensional Distributed Data Sets v2.3.1, The Comprehensive R Archive Network (CRAN) [code], https://cran.r-project.org/web/packages/startR/index.html (last access: 18 April 2024), 2023. a
McGregor, S., Khodri, M., Maher, N., Ohba, M., Pausata, F. S. R., and Stevenson, S.: The Effect of Strong Volcanic Eruptions on ENSO, Chap. 12, 267–287, American Geophysical Union (AGU), ISBN 9781119548164, https://doi.org/10.1002/9781119548164.ch12, 2020. a, b
Meehl, G. A., Teng, H., Maher, N., and England, M. H.: Effects of the Mount Pinatubo eruption on decadal climate prediction skill of Pacific sea surface temperatures, Geophys. Res. Lett., 42, 10840–10846, https://doi.org/10.1002/2015GL066608, 2015. a, b
Ménégoz, M., Bilbao, R., Bellprat, O., Guemas, V., and Doblas-Reyes, F. J.: Forecasting the climate response to volcanic eruptions: prediction skill related to stratospheric aerosol forcing, Environ. Res. Lett., 13, 064022, https://doi.org/10.1088/1748-9326/aac4db, 2018a. a, b, c
Ménégoz, M., Cassou, C., Swingedouw, D., Ruprich-Robert, Y., Bretonnière, P.-A., and Doblas-Reyes, F.: Role of the Atlantic Multidecadal Variability in modulating the climate response to a Pinatubo-like volcanic eruption, Clim. Dynam., 51, 1863–1883, https://doi.org/10.1007/s00382-017-3986-1, 2018b. a
Michel, S., Swingedouw, D., Chavent, M., Ortega, P., Mignot, J., and Khodri, M.: Reconstructing climatic modes of variability from proxy records using ClimIndRec version 1.0, Geosci. Model Dev., 13, 841–858, https://doi.org/10.5194/gmd-13-841-2020, 2020. a
Mignot, J., Khodri, M., Frankignoul, C., and Servonnat, J.: Volcanic impact on the Atlantic Ocean over the last millennium, Clim. Past, 7, 1439–1455, https://doi.org/10.5194/cp-7-1439-2011, 2011. a, b, c
Morice, C. P., Kennedy, J. J., Rayner, N. A., Winn, J. P., Hogan, E., Killick, R. E., Dunn, R. J. H., Osborn, T. J., Jones, P. D., and Simpson, I. R.: An Updated Assessment of Near-Surface Temperature Change From 1850: The HadCRUT5 Data Set, J. Geophys. Res.-Atmos., 126, e2019JD032361, https://doi.org/10.1029/2019JD032361, 2021. a
Nicolì, D., Bellucci, A., Ruggieri, P., Athanasiadis, P. J., Materia, S., Peano, D., Fedele, G., Hénin, R., and Gualdi, S.: The Euro-Mediterranean Center on Climate Change (CMCC) decadal prediction system, Geosci. Model Dev., 16, 179–197, https://doi.org/10.5194/gmd-16-179-2023, 2023. a
Niemeier, U., Timmreck, C., and Krüger, K.: Revisiting the Agung 1963 volcanic forcing – impact of one or two eruptions, Atmos. Chem. Phys., 19, 10379–10390, https://doi.org/10.5194/acp-19-10379-2019, 2019. a
Oelsmann, J., Borchert, L., Hand, R., Baehr, J., and Jungclaus, J.: Linking Ocean Forcing and Atmospheric Interactions to Atlantic Multidecadal Variability in MPI-ESM1.2, Geophys. Res. Lett., 47, e2020GL087259, https://doi.org/10.1029/2020GL087259, 2020. a
Ortega, P., Hawkins, E., and Sutton, R.: Processes governing the predictability of the Atlantic meridional overturning circulation in a coupled GCM, Clim. Dynam., 37, 1771–1782, https://doi.org/10.1007/s00382-011-1025-1, 2011. a
Ortega, P., Montoya, M., González-Rouco, F., Mignot, J., and Legutke, S.: Variability of the Atlantic meridional overturning circulation in the last millennium and two IPCC scenarios, Clim. Dynam., 38, 1925–1947, https://doi.org/10.1007/s00382-011-1081-6, 2012. a, b
Ortega, P., Lehner, F., Swingedouw, D., Masson-Delmotte, V., Raible, C. C., Casado, M., and Yiou, P.: A model-tested North Atlantic Oscillation reconstruction for the past millennium, Nature, 523, 1476–4687, https://doi.org/10.1038/nature14518, 2015. a
Otterå, O. H., Bentsen, M., Drange, H., and Suo, L.: External forcing as a metronome for Atlantic multidecadal variability, Nat. Geosci., 3, 688–694, https://doi.org/10.1038/ngeo955, 2010. a
Otto-Bliesner, B. L., Brady, E. C., Fasullo, J., Jahn, A., Landrum, L., Stevenson, S., Rosenbloom, N., Mai, A., and Strand, G.: Climate Variability and Change since 850 CE: An Ensemble Approach with the Community Earth System Model, Bull. Am. Meteorol. Soci., 97, 735–754, https://doi.org/10.1175/BAMS-D-14-00233.1, 2016. a
Pausata, F. S. R., Zanchettin, D., Karamperidou, C., Caballero, R., and Battisti, D. S.: ITCZ shift and extratropical teleconnections drive ENSO response to volcanic eruptions, Sci. Adv., 6, eaaz5006, https://doi.org/10.1126/sciadv.aaz5006, 2020. a, b
Pausata, F. S. R., Zhao, Y., Zanchettin, D., Caballero, R., and Battisti, D. S.: Revisiting the Mechanisms of ENSO Response to Tropical Volcanic Eruptions, Geophys. Res. Lett., 50, e2022GL102183, https://doi.org/10.1029/2022GL102183, 2023. a
Polvani, L. M., Banerjee, A., and Schmidt, A.: Northern Hemisphere continental winter warming following the 1991 Mt. Pinatubo eruption: reconciling models and observations, Atmos. Chem. Phys., 19, 6351–6366, https://doi.org/10.5194/acp-19-6351-2019, 2019. a
Predybaylo, E., Stenchikov, G. L., Wittenberg, A. T., and Zeng, F.: Impacts of a Pinatubo-size volcanic eruption on ENSO, J. Geophys. Res.-Atmos., 122, 925–947, https://doi.org/10.1002/2016JD025796, 2017. a
Predybaylo, E., Stenchikov, G., Wittenberg, A. T., and Osipov, S.: El Niño/Southern Oscillation response to low-latitude volcanic eruptions depends on ocean pre-conditions and eruption timing, Commun. Earth Environ., 12, 2662–4435, https://doi.org/10.1038/s43247-020-0013-y, 2020. a, b
Righi, M., Andela, B., Eyring, V., Lauer, A., Predoi, V., Schlund, M., Vegas-Regidor, J., Bock, L., Brötz, B., de Mora, L., Diblen, F., Dreyer, L., Drost, N., Earnshaw, P., Hassler, B., Koldunov, N., Little, B., Loosveldt Tomas, S., and Zimmermann, K.: Earth System Model Evaluation Tool (ESMValTool) v2.0 – technical overview, Geosci. Model Dev., 13, 1179–1199, https://doi.org/10.5194/gmd-13-1179-2020, 2020. a
Robock, A.: Volcanic eruptions and climate, Rev. Geophys., 38, 191–219, https://doi.org/10.1029/1998RG000054, 2000. a, b
Robock, A. and Mao, J.: Winter warming from large volcanic eruptions, Geophys. Res. Lett., 19, 2405–2408, https://doi.org/10.1029/92GL02627, 1992. a
Scaife, A. A. and Smith, D.: A signal-to-noise paradox in climate science, npj Clim. Atmos. Sci., 1, 28, https://doi.org/10.1038/s41612-018-0038-4, 2018. a, b
Schurer, A. P., Hegerl, G. C., Goosse, H., Bollasina, M. A., England, M. H., Mineter, M. J., Smith, D. M., and Tett, S. F. B.: Quantifying the contribution of forcing and three prominent modes of variability to historical climate, Clim. Past, 19, 943–957, https://doi.org/10.5194/cp-19-943-2023, 2023. a
Shindell, D. T., Schmidt, G. A., Mann, M. E., and Faluvegi, G.: Dynamic winter climate response to large tropical volcanic eruptions since 1600, J. Geophys. Res.-Atmos., 109, D05104, https://doi.org/10.1029/2003JD004151, 2004. a
Sospedra-Alfonso, R., Merryfield, W. J., Boer, G. J., Kharin, V. V., Lee, W.-S., Seiler, C., and Christian, J. R.: Decadal climate predictions with the Canadian Earth System Model version 5 (CanESM5), Geosci. Model Dev., 14, 6863–6891, https://doi.org/10.5194/gmd-14-6863-2021, 2021. a
Stenchikov, G., Robock, A., Ramaswamy, V., Schwarzkopf, M. D., Hamilton, K., and Ramachandran, S.: Arctic Oscillation response to the 1991 Mount Pinatubo eruption: Effects of volcanic aerosols and ozone depletion, J. Geophys. Res.-Atmos., 107, ACL 28-1–ACL 28-16, https://doi.org/10.1029/2002JD002090, 2002. a
Stenchikov, G., Delworth, T. L., Ramaswamy, V., Stouffer, R. J., Wittenberg, A., and Zeng, F.: Volcanic signals in oceans, J. Geophys. Res.-Atmos., 114, D16104, https://doi.org/10.1029/2008JD011673, 2009. a, b, c
Swingedouw, D., Ortega, P., Mignot, J., Guilyardi, E., Masson-Delmotte, V., Butler, P. G., Khodri, M., and Séférian, R.: Bidecadal North Atlantic ocean circulation variability controlled by timing of volcanic eruptions, Nat. Commun., 6, 2041–1723, https://doi.org/10.1038/ncomms7545, 2015. a, b, c, d, e, f, g
Swingedouw, D., Mignot, J., Ortega, P., Khodri, M., Menegoz, M., Cassou, C., and Hanquiez, V.: Impact of explosive volcanic eruptions on the main climate variability modes, Glob. Planet. Change, 150, 24–45, https://doi.org/10.1016/j.gloplacha.2017.01.006, 2017. a, b, c, d, e
Thomason, L. W., Ernest, N., Millán, L., Rieger, L., Bourassa, A., Vernier, J.-P., Manney, G., Luo, B., Arfeuille, F., and Peter, T.: A global space-based stratospheric aerosol climatology: 1979–2016, Earth Syst. Sci. Data, 10, 469–492, https://doi.org/10.5194/essd-10-469-2018, 2018. a
Timmreck, C., Pohlmann, H., Illing, S., and Kadow, C.: The impact of stratospheric volcanic aerosol on decadal-scale climate predictions, Geophys. Res. Lett., 43, 834–842, https://doi.org/10.1002/2015GL067431, 2016. a, b, c, d
Toohey, M., Krüger, K., Bittner, M., Timmreck, C., and Schmidt, H.: The impact of volcanic aerosol on the Northern Hemisphere stratospheric polar vortex: mechanisms and sensitivity to forcing structure, Atmos. Chem. Phys., 14, 13063–13079, https://doi.org/10.5194/acp-14-13063-2014, 2014. a
Toohey, M., Stevens, B., Schmidt, H., and Timmreck, C.: Easy Volcanic Aerosol (EVA v1.0): an idealized forcing generator for climate simulations, Geosci. Model Dev., 9, 4049–4070, https://doi.org/10.5194/gmd-9-4049-2016, 2016. a
Trenberth, K. E. and Shea, D. J.: Atlantic hurricanes and natural variability in 2005, Geophys. Res. Lett., 33, L12704, https://doi.org/10.1029/2006GL026894, 2006. a
Williams, K. D., Copsey, D., Blockley, E. W., Bodas-Salcedo, A., Calvert, D., Comer, R., Davis, P., Graham, T., Hewitt, H. T., Hill, R., Hyder, P., Ineson, S., Johns, T. C., Keen, A. B., Lee, R. W., Megann, A., Milton, S. F., Rae, J. G. L., Roberts, M. J., Scaife, A. A., Schiemann, R., Storkey, D., Thorpe, L., Watterson, I. G., Walters, D. N., West, A., Wood, R. A., Woollings, T., and Xavier, P. K.: The Met Office Global Coupled Model 3.0 and 3.1 (GC3.0 and GC3.1) Configurations, J. Adv. Model. Earth Syst., 10, 357–380, https://doi.org/10.1002/2017MS001115, 2018. a
Wu, X., Yeager, S. G., Deser, C., Rosenbloom, N., and Meehl, G. A.: Volcanic forcing degrades multiyear-to-decadal prediction skill in the tropical Pacific, Sci. Adv., 9, eadd9364, https://doi.org/10.1126/sciadv.add9364, 2023. a, b, c, d, e, f
Yeager, S. G., Danabasoglu, G., Rosenbloom, N. A., Strand, W., Bates, S. C., Meehl, G. A., Karspeck, A. R., Lindsay, K., Long, M. C., Teng, H., and Lovenduski, N. S.: Predicting Near-Term Changes in the Earth System: A Large Ensemble of Initialized Decadal Prediction Simulations Using the Community Earth System Model, Bull. Am. Meteorol. Soc., 99, 1867–1886, https://doi.org/10.1175/BAMS-D-17-0098.1, 2018. a
Zanchettin, D., Timmreck, C., Graf, H.-F., Rubino, A., Lorenz, S., Lohmann, K., Krüger, K., and Jungclaus, J. H.: Bi-decadal variability excited in the coupled ocean–atmosphere system by strong tropical volcanic eruptions, Clim. Dynam., 39, 419–444, https://doi.org/10.1007/s00382-011-1167-1, 2012. a
Zanchettin, D., Khodri, M., Timmreck, C., Toohey, M., Schmidt, A., Gerber, E. P., Hegerl, G., Robock, A., Pausata, F. S. R., Ball, W. T., Bauer, S. E., Bekki, S., Dhomse, S. S., LeGrande, A. N., Mann, G. W., Marshall, L., Mills, M., Marchand, M., Niemeier, U., Poulain, V., Rozanov, E., Rubino, A., Stenke, A., Tsigaridis, K., and Tummon, F.: The Model Intercomparison Project on the climatic response to Volcanic forcing (VolMIP): experimental design and forcing input data for CMIP6, Geosci. Model Dev., 9, 2701–2719, https://doi.org/10.5194/gmd-9-2701-2016, 2016. a, b
Zanchettin, D., Timmreck, C., Khodri, M., Schmidt, A., Toohey, M., Abe, M., Bekki, S., Cole, J., Fang, S.-W., Feng, W., Hegerl, G., Johnson, B., Lebas, N., LeGrande, A. N., Mann, G. W., Marshall, L., Rieger, L., Robock, A., Rubinetti, S., Tsigaridis, K., and Weierbach, H.: Effects of forcing differences and initial conditions on inter-model agreement in the VolMIP volc-pinatubo-full experiment, Geosci. Model Dev., 15, 2265–2292, https://doi.org/10.5194/gmd-15-2265-2022, 2022. a, b, c, d, e
Zhang, R., Sutton, R., Danabasoglu, G., Kwon, Y.-O., Marsh, R., Yeager, S. G., Amrhein, D. E., and Little, C. M.: A Review of the Role of the Atlantic Meridional Overturning Circulation in Atlantic Multidecadal Variability and Associated Climate Impacts, Rev. Geophys., 57, 316–375, https://doi.org/10.1029/2019RG000644, 2019. a