the Creative Commons Attribution 4.0 License.
the Creative Commons Attribution 4.0 License.
Dakar Niño under global warming investigated by a high-resolution regionally coupled model
Rubén Vázquez
William Cabos
Claudia Gutiérrez
Dmitry V. Sein
Marie-Lou Bachèlery
In this study, we investigated interannual variability in sea surface temperature (SST) along the northwestern African coast, focusing on strong Dakar Niño and Niña events and their potential alterations under the RCP8.5 emission scenario for global warming, using a high-resolution regional coupled model. Our model accurately reproduces the SST seasonal cycle along the northwestern African coast, including its interannual variability in terms of amplitude, timing, and the position of maximum variability. Comparing Dakar Niño variability between the 1980–2010 and 2069–2099 periods, we found that it intensifies under a warmer climate without changing its location and timing. The intensification is more pronounced during Dakar Niñas (cold SST events) than during Dakar Niños (warm SST events). In the future, SST variability will be correlated with ocean temperature and vertical motion at deeper layers. The increase in Dakar Niño variability can be explained by the larger variability in meridional wind stresses, which is likely to be amplified in the future by enhanced land–sea thermal contrast and associated sea-level-pressure anomalies extending from the Iberian Mediterranean area. A heat budget analysis of the mixed layer suggests that surface heat flux and horizontal-advection anomalies are comparably important for Dakar Niño and Niña events in the present climate. However, the future intensification of Dakar Niños and Niñas is likely to be driven by surface heat flux (latent heat flux and shortwave radiation). While horizontal- and vertical-advection anomalies also contribute to the intensification, their roles are secondary.
- Article
(11279 KB) - Full-text XML
-
Supplement
(3643 KB) - BibTeX
- EndNote
Climatologically, the Senegal–Mauritania Frontal Zone (SMFZ; located around 9–14° N and 20–16° W) is one of the most pronounced oceanic frontal zones generated along the eastern boundary current system (Oettli et al., 2021, and Fig. 1b). The cold water of the southward-flowing Canary Current and Senegal–Mauritania upwelling system (Barton et al., 1998; Perez-Hernandez et al., 2013; Vázquez et al., 2022) meets the relatively warm tropical water, creating a steep sea surface temperature (SST) gradient (Ndoye et al., 2014; Sylla et al., 2019). The northern boundary of the SMFZ is around 19° N, where the Canary Current joins with the North Equatorial Current (e.g. Santana-Falcon et al., 2020) around Cape Blanc (e.g. Pastor et al., 2008). The Canary Current upwelling system is tightly connected with the equatorward alongshore wind associated with the Azores anticyclone (e.g. Davis et al., 1997) and is highly influenced by the latitudinal migration of the Intertropical Convergence Zone (ITCZ; Sylla et al., 2019). Due to enriched nutrients from the ocean subsurface, the SMFZ and Canary Current upwelling region also feature an active marine ecosystem (e.g. Aristegui et al., 2009; Gomez-Letona et al., 2017), playing an important role in local and regional fisheries, such as those for Sardinella, from northwestern Africa to the Iberian coasts in the northern tropical-to-subtropical Atlantic (e.g. Arrasate-Lopez et al., 2012; Becognee et al., 2006; Ndoye et al., 2014).
Apart from these climatological mean-state features, the SMFZ shows intense interannual variability in SST (shown in Fig. 1b), with extreme warm anomalies known as the Dakar Niño (Oettli et al., 2016). The Dakar Niño is primarily associated with local wind anomalies. It peaks between March and April, and surface heat flux plays a crucial role in its development (Oettli et al., 2016). A similar mode of SST variability is found in the southeastern tropical Atlantic, known as the Benguela Niño (Bachelery et al., 2020; Koungue et al., 2021, 2019; Rouault et al., 2018). There, the interannual variability is not only driven by local wind fluctuations but also strongly linked to western equatorial winds that trigger the propagation of equatorial Kelvin waves and coastal trapped waves off the African coast (Bachelery et al., 2020; Koungue et al., 2021, 2019; Rouault et al., 2018). The interannual SST variability in the Dakar system has a major influence on marine ecosystems. For instance, Lopez-Parages et al. (2020) showed that the distribution of round sardinella tends to be modified following the Dakar Niño-like pattern initialized by El Niño variability in the tropical Pacific.
For sustainable development, including that of the fishery sector, understanding climate variability under global warming draws increasing attention not only from the scientific community but also from societies, stakeholders, and governments. Climate projections from Earth system models (ESMs), such as the sixth phase of the Coupled Model Intercomparison Project (CMIP6; Eyring et al., 2016), are among the most common tools used to investigate future climate change. These ESMs are state-of-the-art models that have been improved in many aspects for the simulation of the climate system and for their use in climate prediction (e.g. Bracegirdle et al., 2020; Priestley et al., 2020; Choudhury et al., 2022). However, model biases in the tropical Atlantic climate are a long-standing issue, even in CMIP6, and are very common in most state-of-the-art ESMs (Richter and Xie, 2008; Cabos et al., 2017; Voldoire et al., 2019; Richter and Tokinaga, 2020). These biases are among the main sources of uncertainty in climate projections, and, therefore, there is a necessity to utilize ESMs with fewer systematic biases to assess more plausible climate projections. Partially due to the model errors mentioned above and the relatively recent discovery of the Dakar Niño (with the first paper on this topic by Oettli et al., 2016), there are few studies on how Dakar Niño variability will evolve under global warming, while studies on equatorial Atlantic variability have been reported recently (Crespo et al., 2022; Yang et al., 2022).
Several methodologies have been proposed in previous studies to alleviate model errors, including the implementation of better parameterization (e.g. Deppenmeier et al., 2020), surface flux correction and anomaly coupling (e.g. Dippe et al., 2018; Toniazzo and Koseki, 2018; Voldoire et al., 2019), and interactive model ensembles (e.g. Shen et al., 2016; Counillon et al., 2023; Schevenhoven et al., 2023). Apart from these methodologies, resolution refinement is also beneficial for improving model performance in the tropical Atlantic (e.g. De La Vara et al., 2020). However, Sylla et al. (2022), by assessing the archives of the High Resolution Model Intercomparison Project (HighResMIP; Haarsma et al., 2016), stressed the limited benefits of model refinement in improving the Canary Current upwelling system. On the other hand, Vázquez et al. (2022) suggest that a high-resolution regional coupled model (on a mesoscale eddy-permitting scale) is capable of accurately representing the Canary Current upwelling systems and the surface wind field.
This study, therefore, aims to unveil how Dakar Niño variability might change in the future climate using the reliable high-resolution regional coupled model used in Vázquez et al. (2022). This paper is structured as follows. Section 2 provides details on the regional coupled model, the experimental setup, and the reanalysis data. In Sect. 3, we present the results of model simulations, with a brief evaluation comparing them with reanalysis data. In Sect. 4, we offer discussions on the processes that can change the Dakar Niño, employing a heat budget analysis following Oettli et al. (2016). The details of the heat flux budget are given in Sect. 4.2. Finally, we summarize the study findings in Sect. 4.3.
The configurations used in this study for the regionally coupled model ROM (e.g. Sein et al., 2015, 2020) are the same as those discussed in Vázquez et al. (2022). ROM consists of a regional atmospheric component, namely a limited-area regional model (REMO; e.g. Jacob, 2001), and a global oceanic component, which is the Max Planck Institute Ocean Model (MPIOM; e.g. Marsland et al., 2003; Jungclaus et al., 2013). REMO has a 25 km horizontal resolution with 27 hybrid vertical levels. MPIOM adapts an orthogonal, curvilinear horizontal grid system with shifted poles, allowing us to refine the focused region while maintaining a global domain (for more details, see Sein et al., 2015). In our setting, MPIOM has a horizontal resolution of 5 to 10 km around the Iberian Peninsula and Cape Ghir at 31° N, 10° W, upscaling gradually to 100 km in the Southern Ocean. The configuration domain of ROM utilized in this study is shown in Fig. 1. Air–sea coupling between REMO and MPIOM is active within the yellow rectangle shown in Fig. 1. Outside of the active regional coupling, MPIOM is forced by prescribed atmospheric forcing, while REMO is laterally forced by the same prescribed atmospheric forcing.
In this study, ROM is integrated from 1950 to 2099 under both historical conditions and Representative Concentration Pathway 8.5 (RCP8.5) forcing, where the anthropogenic emissions of greenhouse gases increase until the end of the century. The global atmospheric forcing is derived from the low-resolution Max Planck Institute ESM (MPI-ESM-LR; Block and Mauritsen, 2013; Giorgetta et al., 2013). A detailed evaluation of the ROM configurations for the 1950–2005 historical period, using observational products and forced by ERA-Interim (Dee et al., 2011), is extensively demonstrated by Cabos et al. (2020, 2017) and Vázquez et al. (2022, 2024). Here, we analyse data from 1980 to 2010 as representative of historical climate conditions and data from 2069 to 2099 as indicative of future climate change, referring to them as ROMP and ROMF, respectively, hereafter. For a brief evaluation of the ROM simulation, atmosphere and ocean reanalysis data provided by the European Centre for Medium-Range Weather Forecasts' ERA5 (Hersbach et al., 2020) and ORAS5 (Zuo et al., 2019) products for 1980–2010, along with satellite data from the European Space Agency (ESA) SST Climate Change Initiative (CCI) product (Good, 2019) for 1981–2010, are used.
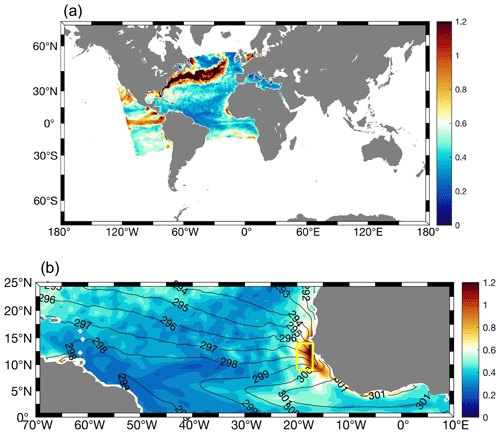
Figure 1(a) Schematic of the ROM domain used in this study. The area where the atmosphere and ocean are coupled is highlighted in colour and represents the SST standard deviation of the ROMP simulation for March (in kelvin). (b) A zoomed-in view of panel (a), with the SST climatology of ROMP for March (in kelvin) indicated by contours. The yellow box indicates the Dakar Index region.
3.1 Climatology and interannual variability
First, we assess the SMFZ seasonal cycle and its interannual variability, as shown in Fig. 2. The results show a clear seasonal-cycle displacement of the SMFZ, with cold water penetrating further southwards from February to April and being pushed further northwards from August to October (Fig. 2a–d). This seasonal meridional migration of the SST front is linked to the seasonal cycle of the Canary Current upwelling system (e.g. Cropper et al., 2014; Pardo et al., 2011; Sylla et al., 2019) and is associated with the northward migration of the ITCZ in the summer months, which displaces surface water masses meridionally. Additionally, during winter to early spring, the Mauritania Current flows southwards to around 14° N. Inversely, associated with the relaxation of trade winds (e.g. Lazaro et al., 2005), the Mauritania Current shifts northwards to reach Cape Blanc (around 20° N), which is associated with the cessation of upwelling south of this latitude (Mittelstaedt, 1991). This results in a 2.5-fold increase in northward flow during summer compared to the upwelling season, transporting waters of mainly South Atlantic origin into the SMFZ (Klenz et al., 2018). The steep SST gradient is consistent with the SST seasonal cycle and is located at 10–12° N from February to April and at 20–22° N from August to October. Coinciding with the position of the front, enhanced interannual variability appears in November and persists until May, with a maximum peak of 1.2 K at 10–12° N between February and April (Fig. 2e). This period coincides with the preferred season of the Dakar Niño and Niña (Oettli et al., 2016). Another moderate peak of variability is observed from August to October at 20–22° N when the SST gradient reaches its second maximum. Similar to these patterns of the SMFZ and the Dakar Niño, the Angola–Benguela Frontal Zone (ABFZ; e.g. Colberg and Reason, 2006; Koseki et al., 2019) and Benguela Niño variability also peak between February and April (e.g. Aristegui et al., 2009; Rouault et al., 2018; Koungue et al., 2019; Bachelery et al., 2020; Koseki and Koungue, 2021; Koungue et al., 2021). However, there are dissimilarities between the two coastal interannual modes: the seasonal displacement of the SMFZ is significantly wider than that of the ABFZ, whose position is almost seasonally fixed (e.g. Koseki et al., 2019). The ESA SST shows a similar pattern of seasonality in SST variability and the SST gradient (Fig. 2b and f). Compared to ERA5, the ESA SST is cooler in all months. This discrepancy could be due to the relatively poor representation of coastal upwelling in ERA5 (which is coarser than the ESA SST product) and the fact that ERA5 has a warm bias (Vázquez et al., 2022). Conversely, the SST meridional gradient is much steeper in the ESA SST product than in ERA5, likely because the ESA SST product has a finer resolution (0.05°) than ERA5 (0.25°).
The ROMP simulation accurately reproduces the SMFZ, as shown in Fig. 2c compared to Fig. 2a. At lower latitudes (from the Equator to 12° N), ROMP has cold SST biases throughout the entire year with respect to ERA5 and the ESA SST product. Such cold SST biases can also be seen at higher latitudes (18 to 30° N), but they are more moderate (Fig. 2b). According to Vázquez et al. (2023), coupling and higher-resolution SST enhance the representation of the North African coastal low-level jet (Soares et al., 2019), which is a key feature of the surface wind field along the North African coast. This accurate representation of the SMFZ is due to its finer resolution, which allows for the inclusion of mesoscale eddies and filaments in our focus region, in contrast to common coupled climate models, such as CMIP5 (Vázquez et al., 2022). SST variability is also realistically represented in ROMP (Fig. 2g). The variability is maximized from March to April and is slightly delayed compared to observations. However, its amplitude is as strong as that of ERA5 but weaker than that of the ESA SST product (Fig. 2e, f, and g). The secondary peak from August to October is also well captured.
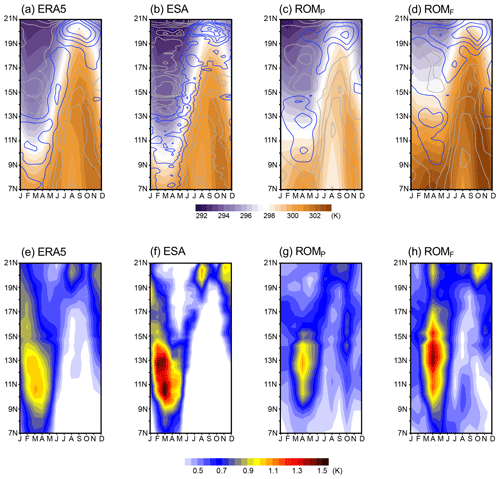
Figure 2Hovmöller plots of (a–d) sea surface temperature (SST; colours) and the absolute values of the meridional SST gradient (K (100 km)−1; contours); the interval corresponds to 0.2 K (100 km)−1. The meridional SST gradient greater than 0.5 K (100 km)−1 is shown in blue. Data are averaged between 21 and 17° W for ERA5, the ESA SST product, ROMP, and ROMF. (e–h) Same as panels (a)–(d) but for the standard deviation of detrended SST. Units are given in kelvin.
Under the highest-emission scenario, this region experiences significant warming: 3 °C in the SMFZ and 1 °C at higher latitudes (Fig. 2d). However, the location of the SMFZ is almost identical between ROMP and ROMF (not shown). Interestingly, Dakar Niño variability is strengthened during both peaks in ROMF, while its timing does not change (Figs. 2h and S1 in the Supplement). This response contrasts with recent studies on equatorial Atlantic variability (Crespo et al., 2022; Yang et al., 2022). The possible mechanism for this enhancement will be discussed in the next subsection. This study will focus on the month of March as it has been determined to be the peak month of the event. Note that despite the slight differences in the timing of the SST variability peak compared to observations, the simulated March variability is comparably intense (Fig. 2). Therefore, we will focus on March throughout the rest of the paper (Fig. S1 provides a time series of the SST standard deviation averaged over 9–14° N).
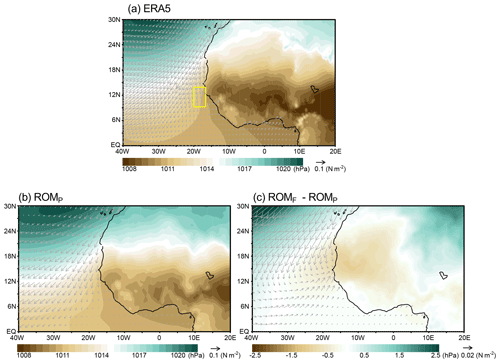
Figure 3March climatological sea-level pressure (SLP; colours), expressed in hectopascals, and wind stress (arrows) in (a) ERA5 and (b) ROMP. (c) The difference in SLP and wind stress climatology for March between ROMF and ROMP. The yellow box indicates the Dakar Index region. EQ: Equator.
As shown in Fig. S2, associated with the intense upwelling, the thermocline (20 °C isotherm) tilts zonally (i.e. more shallowly in the east) in the reanalysis (Fig. S2a). ROMP can represent this zonal tilting of the thermocline well, with a steep vertical gradient found around 40–60 m depth along the coast (Fig. S2b). Under global warming, the thermocline tends to be deeper, while the coastal vertical gradient seems stronger than in ROMP between 40 and 60 m depth (Fig. S2b and c).
In March, a low-pressure system dominates over western Africa between 6 and 15° N, while the Azores high-pressure system sits over the North Atlantic. Due to this contrast in surface pressure, strong southerly winds blow along the western African coast (Fig. 3a). ROMP simulates this atmospheric circulation realistically, although the low pressure over the Sahel is slightly underestimated (Fig. 3b). In the future, continental low pressure is expected to partially deepen, especially near the coastal area (10–24° N, 15–0° E, as shown in Fig. 3c), where the surface temperature at 2 m is expected to intensively warm by 5° in ROMF (not shown). This strong terrestrial warming can be explained by desert amplification (Cook and Vizy, 2015; Zhou, 2016). Corresponding to this deepened low pressure, a cyclonic circulation anomaly is detected around 15° N, 15° W, in Fig. 3c. This anomaly pattern is similar to that seen in climate projections by CMIP5 (Sylla et al., 2019). While upwelling-favourable wind intensifies at higher latitudes (18–30° N), onshore wind anomalies form at lower latitudes (12–15° N).
3.2 Dakar Niño
In this subsection, we investigate the modification of Dakar Niños and Niñas under the highest-emission scenario, employing lag-correlation and composite analyses. These analyses are based on the March Dakar Index, defined as detrended interannual SST anomalies averaged over a box corresponding to 9–14° N, 21–17° W (Oettli et al., 2016). Dakar Niño and Niña events are identified by March Dakar Index anomalies that exceed or fall below ±1 standard deviation of the mean Dakar Index. As shown in Fig. 4a, in ERA5, there are seven Dakar Niño and six Dakar Niña events over 31 years. This result of event detection is consistent with that discussed in Oettli et al. (2016); however, our study utilizes ERA5, while Oettli et al. (2016) employed HadISST (Hadley Centre Sea Ice and Sea Surface Temperature) data.
In comparison, our ROM simulations, ROMP and ROMF, have seven and nine Dakar Niño events and eight and six Dakar Niña events for present and future climates, respectively. Note that there is no possible consistency in the timing of Dakar Niño and Niña events between ERA5 and ROMP as the ROMP simulation is a historical run lasting 31 years. However, the frequency of the events is similar. Under global warming, the frequency of the events does not seem to be strongly influenced (Fig. 4c), although negative events are stronger than in the present climate (Fig. 4b and c). As shown in Fig. S1, the standard deviation of SST in ROMF intensifies from March to May.
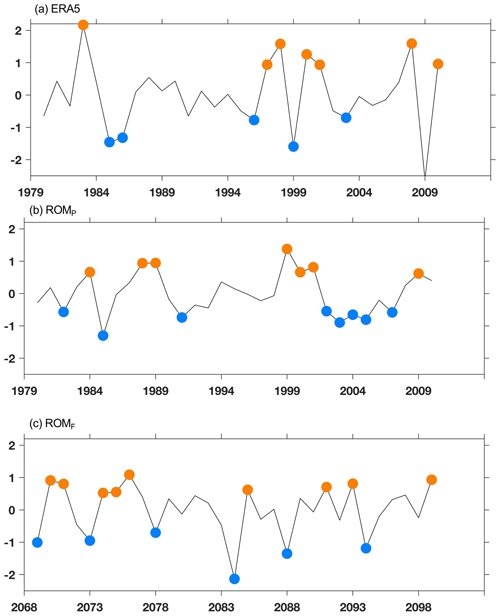
Figure 4Time series of the Dakar Index (detrended SST averaged between 9–14° N and 20–17° W) for (a) ERA5, (b) ROMP, and (c) ROMF. The orange and blue dots indicate Dakar Niño and Niña events, respectively.
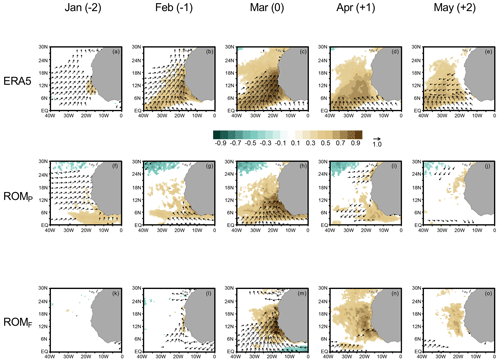
Figure 5Lag-correlation plots illustrate the relationship between the March Dakar Index (SST over 9–14° N, 21–17° W) and both wind stress (vectors) and SST (colours). Only correlations satisfying p<0.05 are shown for (a–e) ERA5, (f–j) ROMP, and (k–o) ROMF. Vectors indicating significant correlations of the zonal and meridional wind components are shown. From left to right, the panels show lag correlations from January (−2) to May (+2).
As shown by Oettli et al. (2016), using reanalysis data from the Global Ocean Data Assimilation System (GODAS), Dakar Niños are strongly correlated with regional coastal wind variability. We also investigate this relationship using surface wind stress and SSTs from ERA5 and ROM simulations. In ERA5, a positive surface wind correlation (southwesterly) and a positive SST correlation are found along the western African coast. In January, SST anomalies from ERA5, averaged over the Dakar Niño box, are positively correlated with SSTs along the western African coast, as well as with southwesterly surface wind anomalies (Fig. 5a). This correlation strengthens in March, which is the peak of the event. This pattern indicates that northeasterly winds are reduced in Dakar Niños (Fig. 5c). In March, the significant correlation of surface wind is localized south of 15° N. After the Dakar Niño peak, the surface wind correlation is pronounced only around the Equator and offshore from April to May (Fig. 5d and e). The area positively correlated with SST shifts westward, particularly around 6 to 10° N, from April to May (Fig. 5d and e), and this might be related to Rossby wave propagation, which can influence the equatorial Atlantic zonal mode in summer (e.g. Martin-Rey and Lazar, 2019). In ROMP, the life cycle of Dakar Niño variability is, to some extent, simulated realistically, and the surface wind is significantly correlated in January (Fig. 5f). Positive SST anomalies develop from January to March, while the connection between the Dakar Niño index and the wind field in February is not well simulated (Fig. 5f–h). The surface wind in March is more locally correlated compared to ERA5 (Fig. 5c and h). After the peak, the positive SST correlation decays but does not seem to clearly propagate westwards. However, a signal of westward propagation can be detected at 41 m depth (around 6° N) in ROMP (Fig. S3). Although the evolution of the ROMF-simulated Dakar Niño and the correlated surface wind in January and February are not as clear as in ROMP (Fig. 5k and l), the surface wind is correlated more broadly along the coast during March, extending up to 18° N (Fig. 5m), while it is limited to 12° N in ROMP (Fig. 5h). After the peak, the positive SST correlation moves westwards more clearly, similar to ERA5, even though its phase speed is slower than that of ERA5 (Fig. 5n and o).
As illustrated in Fig. 5, ROM simulations show a tight connection between SST and interannual variability in surface winds. Along the western African coastal region, the thermocline is shallow due to wind-driven coastal Ekman divergence (Figs. S2 and S4). Consequently, differences in the vertical structure of temperature and vertical-motion variability between the present and future climates are also expected. Figure 6 shows the correlation between the Dakar Index and the interannual temperature and vertical-velocity anomalies off the coast of the SMFZ in the ROM simulation during March. In ROMP, the significant positive correlation (0.8 to 0.9) is concentrated between the surface and 40 m depth and decreases to 0.4 at 100 m depth (Fig. 6a). In contrast, the ocean temperature in ROMF shows a significant correlation (0.5) with the Dakar Index deeper in the water column, down to 160 m depth (Fig. 6c). Similar results are also obtained for the vertical-motion anomalies (Fig. 6b and d). Negative correlations of vertical motion remain stronger and deeper in ROMF (significant until 80 m) than in ROMP (significant until 40 m). This indicates that the Dakar Niño and Niña will have a deeper signature in the future.
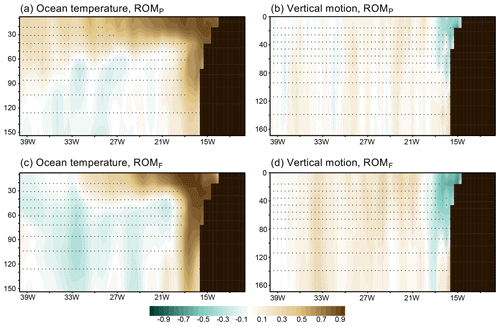
Figure 6Vertical–longitudinal section of the correlation between the Dakar Index and (a, c) ocean temperature or (b, d) vertical motion, averaged between 9 and 14° N for (a, b) ROMP and (c, d) ROMF. The dots denote no significance in the correlation.
Correlation analysis provides coherence between targeted variables regardless of their signs. Since Oettli et al. (2016) showed some symmetric features (e.g. the magnitude of warm and cold events), we can now compare the vertical ocean structures during Dakar Niño and Niña events in the present and future climates. Figure 7a–d show composites of ocean temperature anomalies during the Dakar Niño and Niña in ROMP and ROMF, respectively. Similar to the correlation plot (Fig. 6), the temperature anomalies in ROMP are large around 40 m depth during the Niño and Niña events, and their magnitudes are almost identical (±1.8 K; Fig. 7a and b). Interestingly, the temperature anomalies in ROMF around 40 m depth are more pronounced during Dakar Niñas than during Dakar Niños (Fig. 7c and d). In addition, the temperature anomaly associated with Dakar Niñas is detected more deeply in ROMF than in ROMP (Fig. 7b and d). This indicates that the amplification of variability under global warming is mainly induced by Dakar Niñas in our simulation. While the ocean experiences overall warming from the surface to the subsurface due to climate change, this warming is not uniform (Fig. 7e). The ocean surface warms more efficiently than the subsurface. The difference in warming is particularly large around 40 m and at upper levels, where the temperature anomalies due to Dakar Niño/Niña variability and its changes are the most intense (Fig. 7a–d). In addition to the change in vertical motion, this strengthened stratification at 40 m depth could be a factor in the strengthened Dakar Niño/Niña variability.
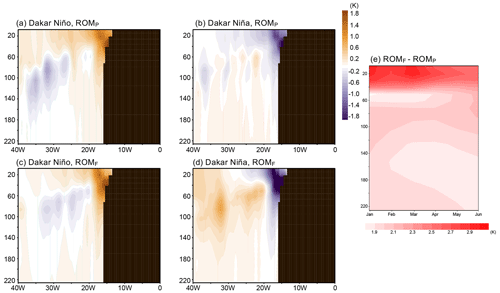
Figure 7(a–d) Composite vertical–longitudinal sections of the temperature anomalies (kelvin) for the Dakar Niño/Niña with respect to ROMP and ROMF for March. (e) Vertical–temporal section of the monthly climatological ocean temperature difference between ROMF and ROMP, averaged over 9–14° N and 20–16° W.
4.1 Why is Dakar Niño/Niña variability amplified?
The simulations of the high-resolution regionally coupled model ROM have shown that Dakar Niño/Niña variability from March to April will intensify under global warming, particularly during Dakar Niñas events. According to Oettli et al. (2016), the Dakar Niño is associated with changes in local alongshore surface wind, and, as shown in Fig. 5, SST variability is well correlated with coastal winds, consistent with the findings by Oettli et al. (2016). To further understand this relationship, the surface wind changes are investigated in more detail here.
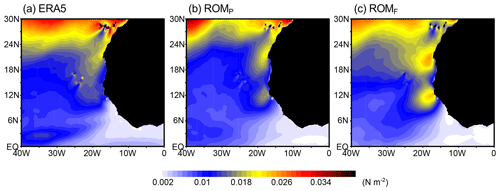
The standard deviation of meridional wind stress anomalies is presented in Fig. 8. In the observations, high variability associated with the Azores high-pressure system (e.g. Davis et al., 1997) is found between 24 and 30° N (Fig. 8a). Additionally, meridional wind variability is relatively strong along the northwestern African coast down to 9° N. The ROMP simulation is able to effectively capture the spatial pattern of meridional wind variability, with the largest coastal variability centred around 20° N (Fig. 8b). However, ROMP somewhat overestimates the variability around 12° N, 20° W, resulting in the formation of two cores of high variability – in the observations, the second core around 12° N is much smaller and is located more offshore, as shown in Fig. 8a. Under global warming (Fig. 8c), coastal wind variability is increased, while the positions of the two cores remain unchanged. In contrast, meridional wind variability over the open ocean between 24 and 30° N seems to decrease (Fig. 8b and c), indicating that higher wind variability in the future might be more influenced by local effects around the coastal region.
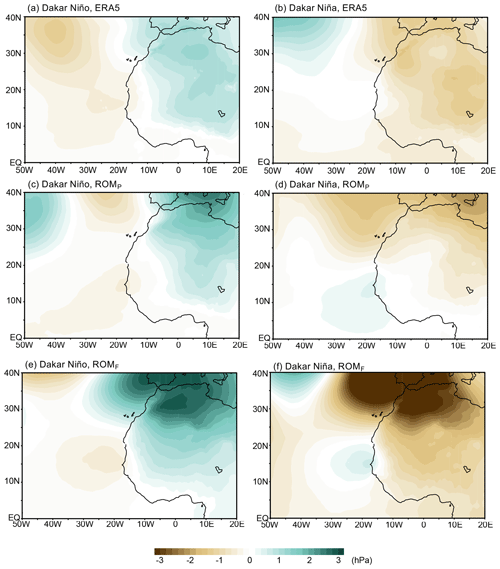
A possible explanation for the localized change in surface wind is the land–sea heat contrast proposed by Bakun (1990). According to Bakun (1990), in the context of global warming, terrestrial regions will heat up more intensely than the ocean, which will increase the land–sea heat contrast and consequently strengthen the equatorward coastal low-level jet and corresponding upwelling. Figure 9 shows the composite anomalies of 2 m temperature during Dakar Niños and Niñas in ERA5 and ROM simulations. In ERA5, the 2 m temperature anomalies reveal a land–sea thermal contrast, but the 2 m temperature anomalies over land (with signs opposite to those of Dakar Niños and Niñas near the coast) are located farther inland from the western African coast (around 0 to 20° E; Fig. 9a and b). ROMP can reproduce the terrestrial 2 m temperature anomalies realistically in the case of the Dakar Niño and Niña, although its amplitude is weaker compared to that of ERA5 (Fig. 9c and d). Conversely, the land–sea thermal contrast associated with the 2 m temperature anomalies becomes more pronounced in ROMF (Fig. 9c and f). During Dakar Niño events, the magnitude of the cool anomaly over the continent is almost identical in both present and future climates, but spatially, the land–surface temperature anomaly shifts towards the west, potentially weakening the zonal surface temperature gradient, particularly around the coastal region between 9 and 12° N (Fig. 9b). In the case of Dakar Niñas, the land surface temperature anomaly also shifts towards the west, similar to the pattern observed in Dakar Niños, but a larger amplitude is found in ROMF than in ROMP (Fig. 9c and d). This situation can strengthen the zonal thermal contrast, and alongshore (upwelling-favourable) winds can be generated more effectively. In terms of climatology, the ROM simulations show that desert amplification (e.g. Cook and Vizy, 2015; Zhou, 2016) becomes more pronounced in western Africa under the RCP8.5 scenario (not shown).
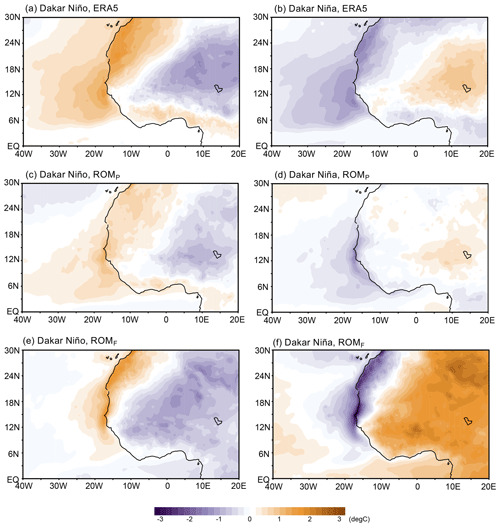
Figure 9Composite anomalies of 2 m temperature averaged across (a, c, e) Dakar Niño and (b, d, f) Dakar Niña events for (a, b) ERA5, (c, d) ROMP, and (e, f) ROMF in March. Note that “degC” stands for degrees Celsius.
These land–sea thermal-contrast anomalies can also be seen by examining sea-level-pressure (SLP) anomalies (Fig. 10). In ERA5, the SLP anomalies show a dipole pattern roughly over the Atlantic Ocean and the continent (Fig. 10a and b). While the SLP anomaly over the Atlantic is likely associated with the Azores high-pressure system, the SLP anomalies over the Sahara connect to the SLP anomalies over the Mediterranean, and the SLP anomaly over the continent appears to be more responsible for creating the SLP zonal gradient along the coast, particularly in the case of Dakar Niñas (Fig. 10b). ROMP can represent this.
The SLP anomaly pattern connects to the Mediterranean, although the Azores High anomalies are not as clear as in ERA5 (Fig. 10c and d). However, the cores of the continental SLP anomalies are located around 0 to 20° E, which is in line with ERA5. In ROMF, the continental SLP anomalies intensify as the 2 m temperature anomalies are strengthened (Figs. 9e–f and 10e–f). The SLP anomaly gradient runs across the coastal region of western Africa, and this situation is favourable for meridional surface wind anomalies during Dakar Niños (reducing the equatorward wind anomaly) and Dakar Niñas (increasing the equatorward wind anomaly). Notably, the Mediterranean SLP anomalies are intensively strengthened in both cases, leading to stronger Sahara SLP anomalies and creating a sharper zonal SLP gradient along the western Africa coast. This finding is consistent with reports that show that interannual variability in temperature is expected to increase in the future due to intensification in the Mediterranean region under global warming (Giorgi and Lionello, 2008) and that Mediterranean SLP anomalies are also expected to be amplified in the future.
4.2 Heat budget analysis in the ocean mixed layer
As suggested in Figs. 6, 7, 9, and 10, meridional surface wind variability is strengthened, which can consequently influence ocean dynamics and thermodynamics, including vertical motion, ocean currents, and surface turbulent fluxes. According to Oettli et al. (2016), surface heat flux plays a crucial role in generating Dakar Niño and Niña events, while entrainment is a secondary effect. Here, we investigate which processes will change in a future climate scenario, thereby affecting Dakar Niño and Niña events occurring in the future. To quantify this, we examine the heat budget in the ocean mixed layer during Dakar Niño and Niña events. Following Vijith et al. (2020), the heat budget in the ocean mixed layer is estimated as follows:
Here, the brackets indicate a quantity averaged within the ocean mixed layer. D represents the ocean mixed-layer depth (an output of ROM). wOML and ΔT denote the vertical velocity at the bottom of the ocean mixed layer and the temperature difference between the ocean mixed layer and the layer just below it (assuming the temperature within the ocean mixed layer is vertically homogeneous). Q is the net surface heat flux. Moreover, ρ and Cp are constant values for density (1000 kg m−3) and the specific heat of seawater (4200 J kg−1 K−1), respectively. R is a residual term (which includes entrainment) that we do not examine in this study. Note that the heat budget terms are estimated from monthly-mean data on velocity and temperature due to limited data availability; therefore, some non-linear and transient components are missing from the heat budget.
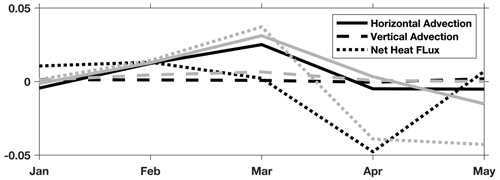
Figure 11Monthly time series of lag-composite differences in horizontal advection (solid line), surface net heat flux (dotted line), and vertical thermal advection (dashed line) between Dakar Niño and Dakar Niña events (Niño minus Niña) for ROMP (black) and ROMF (grey) within the Dakar Index box. March has a lag value of 0. Units are given in K d−1.
In the present climate, the contributions of surface heat flux and horizontal thermal advection to the Dakar events are roughly comparable between January and March, while the timing of the peak differs (Fig. 11). Note that Fig. 11 shows the lag-composite difference between Dakar Niños and Niñas to emphasize the anomalies observed during Dakar Niños (the anomalies during Dakar Niñas should be the opposite). Contrastingly, vertical advection does not play a significant role in inducing Dakar events. The relatively large contribution of horizontal advection differs from the argument made by Oettli et al. (2016). In agreement with Oettli et al. (2016), the mixed-layer heat budget of the ORAS5 reanalysis shows the crucial role of surface net heat flux anomalies in Dakar Niños (the definition of the events in ORAS5 is the same as that in ERA5, as shown in Fig. S6a). It also indicates a magnitude of horizontal advection comparable to that of ROMP (note that vertical-velocity data are not provided in the ORAS5 monthly data).
Each component of the heat budget increases in the future climate, supporting our results pertaining to amplified Dakar Niño and Niña events. Specifically, surface heat flux plays a more significant role in amplifying the Dakar Niño, particularly in March. The anomalies in horizontal and vertical thermal advection also intensify, with their magnitudes of enhancement being almost identical between February and March in the future (the differences between the current and future climates correspond to 0.006 and 0.0057 K d−1, respectively, in March). For vertical advection, the stronger stratification at the upper layer (Fig. 7e) might enhance the contribution of vertical advection, particularly in Dakar Niñas (Fig. 7d). The future climatology of surface ocean currents is slightly weakened around our focus area (as illustrated in the comparison between ROMP and ROMF in the red rectangle in Fig. S5). However, the composite anomaly between Dakar Niño and Niña events shows a larger difference in the future climate within the Dakar Index box (Fig. S5). This indicates that stronger meridional wind variability along the coast can induce more local/regional surface ocean current changes in the future climate than in the present climate. As Oettli et al. (2016) suggested, the ocean mixed-layer depth tends to be thinner/thicker during Dakar Niño/Niña events (see Fig. S7). This might help to increase the contribution of surface heat flux in the future climate because a thinner mixed layer can experience more warming due to stronger surface heat flux during Dakar Niño events. Because of this amplified mechanism in March, the SST anomalies may persist longer into April in the future climate than in the present climate (Fig. 5).
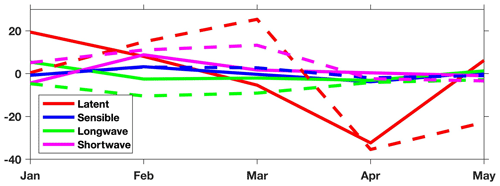
The surface heat flux anomalies are divided into four elements, as shown in Fig. 12. In the present climate, latent heat flux dominates from January to February, with shortwave radiation also playing a role in February. This distribution is similar to that described by Oettli et al. (2016). However, the contribution of shortwave radiation is not as dominant as in Oettli et al. (2016). According to Oettli et al. (2016), shortwave radiation is a primary contributor to the heat flux anomaly for Dakar Niños. Our ROM simulations might underestimate anomalous shortwave radiation, potentially due to climatological dust forcing (Pietikäinen et al., 2012). Chen et al. (2021) suggested that Saharan dust significantly influences shortwave radiation flux directly and surface turbulent fluxes indirectly. The sensible heat and longwave radiation are quite minor, consistent with the findings of Oettli et al. (2016).
In the future, each component of surface heat flux is expected to become stronger, especially latent heat flux and shortwave radiation. The enhancement of surface heat flux in March is attributed mainly to latent heat flux and secondarily to shortwave radiation. The enhancement of latent heat flux can be explained by stronger alongshore wind variability, as shown in Fig. 8. It is necessary, albeit outside the scope of the current study, to investigate how the Saharan dust anomaly and cloud anomaly affect surface heat flux and, correspondingly, Dakar Niño events. This will be addressed in future work.
4.3 Conclusion and future work
This study has investigated future changes in Dakar Niño variability in March by employing the high-resolution regionally coupled model ROM, comparing the periods 1980–2010 and 2066–2099 under the highest-emission scenario. Our model simulations show an intensification of interannual variability in the SST along the northeastern tropical Atlantic, with a notable increase in the amplitude of Dakar Niña events (cool SST anomalies). This result is consistent with Yang et al. (2021), who focus on basin-scale variability in the northern tropical Atlantic. In contrast, Prigent et al. (2023) reported a weakening of the Benguela Niño under global warming. This result is in contrast with our results, underscoring the need to demonstrate insightful comparisons between these two coastal climate modes to discuss the similarities and dissimilarities between the Dakar and Benguela Niños. For example, recently, Chang et al. (2023) showed the different responses of eastern coastal upwelling systems to climate change in the Northern and Southern hemispheres using a set of HighResMIP models, emphasizing the importance of such comparative studies.
The stronger variability in SST in the SMFZ under global warming can be explained by stronger surface heat flux anomalies (primarily latent heat flux and secondarily shortwave radiation), partially associated with local alongshore wind variability. The contributions of anomalies in horizontal and vertical thermal advection also tend to amplify the Dakar Niño/Niña, while their roles are secondary. Alongshore wind variability can be enhanced by the well-developed thermal-contrast anomaly around the western African coast, as discussed by Bakun (1990). Moreover, we found that the corresponding Saharan sea-level-pressure (SLP) anomalies extend from the Mediterranean region and that the Mediterranean SLP is strengthened. In addition, the stronger ocean stratification at 40m depth might also cause the reinforcement of Dakar Niño/Niña variability. This stronger stratification is due to vertically heterogeneous warming between the surface and subsurface (e.g. Vázquez et al., 2023). The ocean surface current anomalies during Dakar Niño and Niña events may also change due to stronger meridional wind stress in the future, particularly within the Dakar Index box.
Our discussion and argument focus on local-scale and regional-scale changes in surface wind and land–sea thermal/surface pressure contrasts. However, it is essential to acknowledge broader climate teleconnections. As previous studies suggest, tropical Pacific interannual variability, such as that seen in El Niños, tends to initialize northern tropical Atlantic variability, including Dakar Niños, via an atmospheric bridge (e.g. Oettli et al., 2016; Lopez-Parages et al., 2020). Accordingly, we will need to consider such teleconnections and their future changes. In addition, over the north Atlantic, other dominant climate modes, such as the North Atlantic Oscillation (NAO; e.g. Hurrell et al., 2001), play a crucial role in climate and weather variability over the Euro-Mediterranean region by modulating the Azores high-pressure system (e.g. Brandimarte et al., 2011; Lopez-Moreno et al., 2011). Therefore, it will be necessary to explore the linkages between Dakar Niños and other climate modes, such as the NAO and El Niño–Southern Oscillation (ENSO), in order to gain a more comprehensive understanding of how these patterns interact and evolve under global warming.
The codes used in this study can be accessed via the Zenodo repository, available at https://doi.org/10.5281/zenodo.10244333 (Koseki et al., 2023).
The data used in this study can be accessed via the Zenodo repository, available at https://doi.org/10.5281/zenodo.10244333 (Koseki et al., 2023).
The supplement related to this article is available online at: https://doi.org/10.5194/esd-15-1401-2024-supplement.
SK, RV, and WC contributed to conceptualizing the study and had discussions about the results. The analyses were primarily conducted by SK. DVS and WC performed all the simulations used in this study. CG and MLB contributed to improving the interpretation of the results and discussions. All co-authors contributed to drafting the paper and revising it.
The contact author has declared that none of the authors has any competing interests.
Publisher's note: Copernicus Publications remains neutral with regard to jurisdictional claims made in the text, published maps, institutional affiliations, or any other geographical representation in this paper. While Copernicus Publications makes every effort to include appropriate place names, the final responsibility lies with the authors.
All authors would like to express their gratitude to the two anonymous reviewers for their critical, helpful, and constructive comments and discussions. Thanks to these reviewers, our paper has been improved, and the discussion of the results has become significantly more insightful. The simulations were performed at the German Climate Computing Center (DKRZ) and were granted by the DKRZ's Scientific Steering Committee (WLA) under project no. ba0987. All authors would like to express their gratitude to Noel S. Keenlyside from the BCCR, University of Bergen, for his constructive comments and discussions on this work.
Shunya Koseki was supported by the EU Horizon 2020 TRIATLAS project (grant no. 817578) and the Giner de los Ríos 2021–2022 programme hosted by the University of Alcalá. Rubén Vázquez was supported through a doctoral grant from the University of Ferrara and the University of Cádiz via the Spanish Ministry of Science, Innovation and Universities (grant no. I+D+I PID2021-128656OB-100) and through Plan Propio UCA (2022–2023). William Cabos and Claudia Gutiérrez were funded by a University of Alcalá project (grant no. PIUAH21/CC-058) and the Spanish Ministry of Science, Innovation and Universities through grant no. I+D+I PID2021-128656OB-100. Dmitry V. Sein was supported by the joint Sino–German research project ACE (grant nos. 2019YFE0125000 and 01LP2004A) and MHESRF scientific task no. FMWE-2024-0028. Marie-Lou Bachèlery received funding from the European Union's Horizon 2020 research and innovation programme for the project BENGUP under a Marie Skłodowska-Curie Action (grant no. 101025655).
This paper was edited by Ben Kravitz and reviewed by two anonymous referees.
Aristegui, J., Barton, E. D., Alvarez-Salgado, X. A., Santos, A. M. P., Figueiras, F. G., Kifani, S., Hernandez-Leon, S., Mason, E., Machu, E., and Demarcq, H.: Sub-regional ecosystem variability in the Canary Current upwelling, Prog. Oceanogr., 83, 33–48, https://doi.org/10.1016/j.pocean.2009.07.031, 2009.
Arrasate-Lopez, M., Tuset, V. M., Santana, J. I., Garcia-Mederos, A., Ayza, O., and Gonzalez, J. A.: Fishing methods for sustainable shrimp fisheries in the Canary Islands (North-West Africa), Afr. J. Mar. Sci., 34, 331–339, https://doi.org/10.2989/1814232x.2012.725281, 2012.
Bachelery, M. L., Illig, S., and Rouault, M.: Interannual Coastal Trapped Waves in the Angola-Benguela Upwelling System and Benguela Nino and Nina events, J. Marine Syst., 203, 103262, https://doi.org/10.1016/j.jmarsys.2019.103262, 2020.
Bakun, A.: Global Climate Change and Intensification of Coastal Ocean Upwelling, Science, 247, 198–201, https://doi.org/10.1126/science.247.4939.198, 1990.
Barton, E. D., Aristegui, J., Tett, P., Canton, M., Garcia-Braun, J., Hernandez-Leon, S., Nykjaer, L., Almeida, C., Almunia, J., Ballesteros, S., Basterretxea, G., Escanez, J., Garcia-Weill, L., Hernandez-Guerra, A., Lopez-Laatzen, F., Molina, R., Montero, M. F., Navarro-Perez, E., Rodriguez, J. M., van Lenning, K., Velez, H., and Wild, K.: The transition zone of the Canary Current upwelling region, Prog. Oceanogr., 41, 455–504, https://doi.org/10.1016/S0079-6611(98)00023-8, 1998.
Becognee, P., Almeida, C., Barrera, A., Hernandez-Guerra, A., and Hernandez-Leon, S.: Annual cycle of clupeiform larvae around Gran Canaria Island, Canary Islands, Fish. Oceanogr., 15, 293–300, https://doi.org/10.1111/j.1365-2419.2005.00390.x, 2006.
Block, K. and Mauritsen, T.: Forcing and feedback in the MPI-ESM-LR coupled model under abruptly quadrupled CO2, J. Adv. Model. Earth Sy., 5, 676–691, https://doi.org/10.1002/jame.20041, 2013.
Bracegirdle, T. J., Holmes, C. R., Hosking, J. S., Marshall, G. J., Osman, M., Patterson, M., and Rackow, T.: Improvements in Circumpolar Southern Hemisphere Extratropical Atmospheric Circulation in CMIP6 Compared to CMIP5, Earth Space Sci., 7, e2019EA001065, https://doi.org/10.1029/2019EA001065, 2020.
Brandimarte, L., Di Baldassarre, G., Bruni, G., D'Odorico, P., and Montanari, A.: Relation Between the North-Atlantic Oscillation and Hydroclimatic Conditions in Mediterranean Areas, Water Resour. Manag., 25, 1269–1279, https://doi.org/10.1007/s11269-010-9742-5, 2011.
Cabos, W., Sein, D. V., Pinto, J. G., Fink, A. H., Koldunov, N. V., Alvarez, F., Izquierdo, A., Keenlyside, N., and Jacob, D.: The South Atlantic Anticyclone as a key player for the representation of the tropical Atlantic climate in coupled climate models, Clim. Dynam., 48, 4051–4069, https://doi.org/10.1007/s00382-016-3319-9, 2017.
Cabos, W., de la Vara, A., Alvarez-Garcia, F. J., Sanchez, E., Sieck, K., Perez-Sanz, J. I., Limareva, N., and Sein, D. V.: Impact of ocean-atmosphere coupling on regional climate: the Iberian Peninsula case, Clim. Dynam., 54, 4441–4467, https://doi.org/10.1007/s00382-020-05238-x, 2020.
Chang, P., Xu, G. P., Kurian, J., Small, R. J., Danabasoglu, G., Yeager, S., Castruccio, F., Zhang, Q. Y., Rosenbloom, N., and Chapman, P.: Uncertain future of sustainable fisheries environment in eastern boundary upwelling zones under climate change, Commun. Earth Environ., 4, 19, https://doi.org/10.1038/s43247-023-00681-0, 2023.
Chen, S. H., Huang, C. C., Kuo, Y. C., Tseng, Y. H., Gu, Y., Earl, K., Chen, C. Y., Choi, Y., and Liou, K. N.: Impacts of Saharan Mineral Dust on Air-Sea Interaction over North Atlantic Ocean Using a Fully Coupled Regional Model, J. Geophys. Res.-Atmos., 126, e2020JD033586, https://doi.org/10.1029/2020JD033586, 2021.
Choudhury, B. A., Rajesh, P. V., Zahan, Y., and Goswami, B. N.: Evolution of the Indian summer monsoon rainfall simulations from CMIP3 to CMIP6 models, Clim. Dynam., 58, 2637–2662, https://doi.org/10.1007/s00382-021-06023-0, 2022.
Colberg, F. and Reason, C. J. C.: A model study of the Angola Benguela Frontal Zone: Sensitivity to atmospheric forcing, Geophys. Res. Lett., 33, L19608, https://doi.org/10.1029/2006gl027463, 2006.
Cook, K. H. and Vizy, E. K.: Detection and Analysis of an Amplified Warming of the Sahara Desert, J. Climate, 28, 6560–6580, https://doi.org/10.1175/Jcli-D-14-00230.1, 2015.
Counillon, F., Keenlyside, N. S., Wang, S., Devilliers, M., Gupta, A., Koseki, S., and Shen, M.-L.: Framework for an ocean-connected supermodel of the Earth System, J. Adv. Model. Earth Sy., 15, e2022MS003310, https://doi.org/10.1029/2022MS003310, 2023.
Crespo, L. R., Prigent, A., Keenlyside, N., Koseki, S., Svendsen, L., Richter, I., and Sanchez-Gomez, E.: Weakening of the Atlantic Nino variability under global warming, Nat. Clim. Change, 12, 822–827, https://doi.org/10.1038/s41558-022-01453-y, 2022.
Cropper, T. E., Hanna, E., and Bigg, G. R.: Spatial and temporal seasonal trends in coastal upwelling off Northwest Africa, 1981–2012, Deep-Sea Res. Pt. I, 86, 94–111, https://doi.org/10.1016/j.dsr.2014.01.007, 2014.
Davis, R. E., Hayden, B. P., Gay, D. A., Phillips, W. L., and Jones, G. V.: The North Atlantic subtropical anticyclone, J. Climate, 10, 728–744, https://doi.org/10.1175/1520-0442(1997)010<0728:Tnasa>2.0.Co;2, 1997.
Dee, D. P., Uppala, S. M., Simmons, A. J., Berrisford, P., Poli, P., Kobayashi, S., Andrae, U., Balmaseda, M. A., Balsamo, G., Bauer, P., Bechtold, P., Beljaars, A. C. M., van de Berg, L., Bidlot, J., Bormann, N., Delsol, C., Dragani, R., Fuentes, M., Geer, A. J., Haimberger, L., Healy, S. B., Hersbach, H., Holm, E. V., Isaksen, L., Kallberg, P., Kohler, M., Matricardi, M., McNally, A. P., Monge-Sanz, B. M., Morcrette, J. J., Park, B. K., Peubey, C., de Rosnay, P., Tavolato, C., Thepaut, J. N., and Vitart, F.: The ERA-Interim reanalysis: configuration and performance of the data assimilation system, Q. J. Roy. Meteor. Soc., 137, 553–597, https://doi.org/10.1002/qj.828, 2011.
de la Vara, A., Cabos, W., Sein, D. V., Sidorenko, D., Koldunov, N. I. V., Koseki, S., Soares, P. M. M., and Danilov, S.: On the impact of atmospheric vs oceanic resolutions on the representation of the sea surface temperature in the South Eastern Tropical Atlantic, Clim. Dynam., 54, 4733–4757, https://doi.org/10.1007/s00382-020-05256-9, 2020.
Deppenmeier, A. L., Haarsma, R. J., LeSager, P., and Hazeleger, W.: The effect of vertical ocean mixing on the tropical Atlantic in a coupled global climate model, Clim. Dynam., 54, 5089–5109, https://doi.org/10.1007/s00382-020-05270-x, 2020.
Dippe, T., Greatbatch, R. J., and Ding, H.: On the relationship between Atlantic Nio variability and ocean dynamics, Clim. Dynam., 51, 597–612, https://doi.org/10.1007/s00382-017-3943-z, 2018.
Eyring, V., Bony, S., Meehl, G. A., Senior, C. A., Stevens, B., Stouffer, R. J., and Taylor, K. E.: Overview of the Coupled Model Intercomparison Project Phase 6 (CMIP6) experimental design and organization, Geosci. Model Dev., 9, 1937–1958, https://doi.org/10.5194/gmd-9-1937-2016, 2016.
Giorgetta, M. A., Jungclaus, J., Reick, C. H., Legutke, S., Bader, J., Bottinger, M., Brovkin, V., Crueger, T., Esch, M., Fieg, K., Glushak, K., Gayler, V., Haak, H., Hollweg, H. D., Ilyina, T., Kinne, S., Kornblueh, L., Matei, D., Mauritsen, T., Mikolajewicz, U., Mueller, W., Notz, D., Pithan, F., Raddatz, T., Rast, S., Redler, R., Roeckner, E., Schmidt, H., Schnur, R., Segschneider, J., Six, K. D., Stockhause, M., Timmreck, C., Wegner, J., Widmann, H., Wieners, K. H., Claussen, M., Marotzke, J., and Stevens, B.: Climate and carbon cycle changes from 1850 to 2100 in MPI-ESM simulations for the Coupled Model Intercomparison Project phase 5, J. Adv. Model. Earth Sy., 5, 572–597, https://doi.org/10.1002/jame.20038, 2013.
Giorgi, F. and Lionello, P.: Climate change projections for the Mediterranean region, Global Planet. Change, 63, 90–104, https://doi.org/10.1016/j.gloplacha.2007.09.005, 2008.
Gomez-Letona, M., Ramos, A. G., Coca, J., and Aristegui, J.: Trends in Primary Production in the Canary Current Upwelling System-A Regional Perspective Comparing Remote Sensing Models, Front. Mar. Sci., 4, 370, https://doi.org/10.3389/fmars.2017.00370, 2017.
Good, S. A., Embury, O., Bulgin, C. E., and Mittaz, J.: ESA Sea Surface Temperature Climate Change Initiative (SST_cci): Level 4 Analysis Climate Data Record, version 2.0, Centre for Environmental Data Analysis [data set], 22 August 2019, https://doi.org/10.5285/aced40d7cb964f23a0fd3e85772f2d48, 2019.
Haarsma, R. J., Roberts, M. J., Vidale, P. L., Senior, C. A., Bellucci, A., Bao, Q., Chang, P., Corti, S., Fučkar, N. S., Guemas, V., von Hardenberg, J., Hazeleger, W., Kodama, C., Koenigk, T., Leung, L. R., Lu, J., Luo, J.-J., Mao, J., Mizielinski, M. S., Mizuta, R., Nobre, P., Satoh, M., Scoccimarro, E., Semmler, T., Small, J., and von Storch, J.-S.: High Resolution Model Intercomparison Project (HighResMIP v1.0) for CMIP6, Geosci. Model Dev., 9, 4185–4208, https://doi.org/10.5194/gmd-9-4185-2016, 2016.
Hersbach, H., Bell, B., Berrisford, P., Hirahara, S., Horanyi, A., Munoz-Sabater, J., Nicolas, J., Peubey, C., Radu, R., Schepers, D., Simmons, A., Soci, C., Abdalla, S., Abellan, X., Balsamo, G., Bechtold, P., Biavati, G., Bidlot, J., Bonavita, M., De Chiara, G., Dahlgren, P., Dee, D., Diamantakis, M., Dragani, R., Flemming, J., Forbes, R., Fuentes, M., Geer, A., Haimberger, L., Healy, S., Hogan, R. J., Holm, E., Janiskova, M., Keeley, S., Laloyaux, P., Lopez, P., Lupu, C., Radnoti, G., de Rosnay, P., Rozum, I., Vamborg, F., Villaume, S., and Thepaut, J. N.: The ERA5 global reanalysis, Q. J. Roy. Meteor. Soc., 146, 1999–2049, https://doi.org/10.1002/qj.3803, 2020.
Hurrell, J. W., Kushnir, Y., and Visbeck, M.: Climate – The North Atlantic oscillation, Science, 291, 603–605, https://doi.org/10.1126/science.1058761, 2001.
Jacob, D.: A note to the simulation of the annual and inter-annual variability of the water budget over the Baltic Sea drainage basin, Meteorol. Atmos. Phys., 77, 61–73, https://doi.org/10.1007/s007030170017, 2001.
Jungclaus, J. H., Fischer, N., Haak, H., Lohmann, K., Marotzke, J., Matei, D., Mikolajewicz, U., Notz, D., and von Storch, J. S.: Characteristics of the ocean simulations in the Max Planck Institute Ocean Model (MPIOM) the ocean component of the MPI-Earth system model, J. Adv. Model. Earth Sy., 5, 422–446, https://doi.org/10.1002/jame.20023, 2013.
Klenz, T., Dengler, M., and Brandt, P.: Seasonal Variability of the Mauritania Current and Hydrography at 18° N, J. Geophys. Res.-Oceans, 123, 8122–8137, https://doi.org/10.1029/2018jc014264, 2018.
Koseki, S. and Koungue, R. A. I.: Regional atmospheric response to the Benguela Ninas, Int. J. Climatol., 41, E1483–E1497, https://doi.org/10.1002/joc.6782, 2021.
Koseki, S., Giordani, H., and Goubanova, K.: Frontogenesis of the Angola–Benguela Frontal Zone, Ocean Sci., 15, 83–96, https://doi.org/10.5194/os-15-83-2019, 2019.
Koseki, S., Vázquez, R., Cabos, W., Gutierrez, C., Sein, D., and Bacherery, M.-L.: ROM data and code for Dakar Niño variability under global warming investigated by a high-resolution regionally coupled model, Zenodo [data set], https://doi.org/10.5281/zenodo.10244334, 2023.
Koungue, R. A. I., Rouault, M., Illig, S., Brandt, P., and Jouanno, J.: Benguela Ninos and Benguela Ninas in Forced Ocean Simulation From 1958 to 2015, J. Geophys. Res.-Oceans, 124, 5923–5951, https://doi.org/10.1029/2019jc015013, 2019.
Koungue, R. A. I., Brandt, P., Luebbecke, J., Prigent, A., Martins, M. S., and Rodrigues, R. R.: The 2019 Benguela Nino, Front. Mar. Sci., 8, 800103, https://doi.org/10.3389/fmars.2021.800103, 2021.
Lazaro, C., Fernandes, M. J., Santos, A. M. P., and Oliveira, P.: Seasonal and interannual variability of surface circulation in the Cape Verde region from 8 years of merged T/P and ERS-2 altimeter data, Remote Sens. Environ., 98, 45–62, https://doi.org/10.1016/j.rse.2005.06.005, 2005.
Lopez-Moreno, J. I., Vicente-Serrano, S. M., Moran-Tejeda, E., Lorenzo-Lacruz, J., Kenawy, A., and Beniston, M.: Effects of the North Atlantic Oscillation (NAO) on combined temperature and precipitation winter modes in the Mediterranean mountains: Observed relationships and projections for the 21st century, Global Planet. Change, 77, 62–76, https://doi.org/10.1016/j.gloplacha.2011.03.003, 2011.
Lopez-Parages, J., Auger, P. A., Rodriguez-Fonseca, B., Keenlyside, N., Gaetan, C., Rubino, A., Arisido, M. W., and Brochier, T.: El Nino as a predictor of round sardinella distribution along the northwest African coast, Prog. Oceanogr., 186, 102341, https://doi.org/10.1016/j.pocean.2020.102341, 2020.
Marsland, S. J., Haak, H., Jungclaus, J. H., Latif, M., and Roske, F.: The Max-Planck-Institute global ocean/sea ice model with orthogonal curvilinear coordinates, Ocean Model., 5, 91–127, https://doi.org/10.1016/S1463-5003(02)00015-X, 2003.
Martin-Rey, M. and Lazar, A.: Is the boreal spring tropical Atlantic variability a precursor of the Equatorial Mode?, Clim. Dynam., 53, 2339–2353, https://doi.org/10.1007/s00382-019-04851-9, 2019.
Mittelstaedt, E.: The Ocean Boundary Along the Northwest African Coast – Circulation and Oceanographic Properties at the Sea-Surface, Prog. Oceanogr., 26, 307–355, https://doi.org/10.1016/0079-6611(91)90011-A, 1991.
Ndoye, S., Capet, X., Estrade, P., Sow, B., Dagorne, D., Lazar, A., Gaye, A., and Brehmer, P.: SST patterns and dynamics of the southern Senegal-Gambia upwelling center, J. Geophys. Res.-Oceans, 119, 8315–8335, https://doi.org/10.1002/2014jc010242, 2014.
Oettli, P., Yuan, C., and Richter, I.: 10 – The other coastal Niño/Niña – the Benguela, California, and Dakar Niños/Niñas, in: Tropical and Extratropical Air-Sea Interactions. Modes of Climate Variations, Elsevier, 237–266, https://doi.org/10.1016/B978-0-12-818156-0.00010-1, 2021.
Oettli, P., Morioka, Y., and Yamagata, T.: A Regional Climate Mode Discovered in the North Atlantic: Dakar Nino/Nina, Sci. Rep.-UK, 6, 18782, https://doi.org/10.1038/srep18782, 2016.
Pardo, P. C., Padin, X. A., Gilcoto, M., Farina-Busto, L., and Perez, F. F.: Evolution of upwelling systems coupled to the long-term variability in sea surface temperature and Ekman transport, Clim. Res., 48, 231–246, https://doi.org/10.3354/cr00989, 2011.
Pastor, M. V., Pelegri, J. L., Hernandez-Guerra, A., Font, J., Salat, J., and Emellanov, M.: Water and nutrient fluxes off Northwest Africa, Cont. Shelf Res., 28, 915–936, https://doi.org/10.1016/j.csr.2008.01.011, 2008.
Perez-Hernandez, M. D., Hernandez-Guerra, A., Fraile-Nuez, E., Comas-Rodriguez, I., Benitez-Barrios, V. M., Dominguez-Yanes, J. F., Velez-Belchi, P., and De Armas, D.: The source of the Canary current in fall 2009, J. Geophys. Res.-Oceans, 118, 2874–2891, https://doi.org/10.1002/jgrc.20227, 2013.
Pietikäinen, J.-P., O'Donnell, D., Teichmann, C., Karstens, U., Pfeifer, S., Kazil, J., Podzun, R., Fiedler, S., Kokkola, H., Birmili, W., O'Dowd, C., Baltensperger, U., Weingartner, E., Gehrig, R., Spindler, G., Kulmala, M., Feichter, J., Jacob, D., and Laaksonen, A.: The regional aerosol-climate model REMO-HAM, Geosci. Model Dev., 5, 1323–1339, https://doi.org/10.5194/gmd-5-1323-2012, 2012.
Priestley, M. D. K., Ackerley, D., Catto, J. L., Hodges, K. I., McDonald, R. E., and Lee, R. W.: An Overview of the Extratropical Storm Tracks in CMIP6 Historical Simulations, J. Climate, 33, 6315–6343, https://doi.org/10.1175/Jcli-D-19-0928.1, 2020.
Prigent, A., Koungue, R. A. I., Lübbecke, J. F., Brandt, P., Harlass, J., and Latif, M.: Future weakening of southeastern tropical Atlantic Ocean interannual sea surface temperature variability in a global climate model, Clim. Dynam., 62, 1997–2016, https://doi.org/10.1007/s00382-023-07007-y, 2023.
Richter, I. and Tokinaga, H.: An overview of the performance of CMIP6 models in the tropical Atlantic: mean state, variability, and remote impacts, Clim. Dynam., 55, 2579–2601, https://doi.org/10.1007/s00382-020-05409-w, 2020.
Richter, I. and Xie, S. P.: On the origin of equatorial Atlantic biases in coupled general circulation models, Clim. Dynam., 31, 587–598, https://doi.org/10.1007/s00382-008-0364-z, 2008.
Rouault, M., Illig, S., Lubbecke, J., and Koungue, R. A. I.: Origin, development and demise of the 2010-2011 Benguela Nino, J. Marine Syst., 188, 39–48, https://doi.org/10.1016/j.jmarsys.2017.07.007, 2018.
Santana-Falcon, Y., Mason, E., and Aristegui, J.: Offshore transport of organic carbon by upwelling filaments in the Canary Current System, Prog. Oceanogr., 186, 102322, https://doi.org/10.1016/j.pocean.2020.102322, 2020.
Sein, D. V., Mikolajewicz, U., Groger, M., Fast, I., Cabos, W., Pinto, J. G., Hagemann, S., Semmler, T., Izquierdo, A., and Jacob, D.: Regionally coupled atmosphere-ocean-sea ice-marine biogeochemistry model ROM: 1. Description and validation, J. Adv. Model. Earth Sy., 7, 268–304, https://doi.org/10.1002/2014ms000357, 2015.
Sein, D. V., Groger, M., Cabos, W., Alvarez-Garcia, F. J., Hagemann, S., Pinto, J. G., Izquierdo, A., de la Vara, A., Koldunov, N. V., Dvornikov, A. Y., Limareva, N., Alekseeva, E., Martinez-Lopez, B., and Jacob, D.: Regionally Coupled Atmosphere-Ocean-Marine Biogeochemistry Model ROM: 2. Studying the Climate Change Signal in the North Atlantic and Europe, J. Adv. Model. Earth Sy., 12, e2019MS001646, https://doi.org/10.1029/2019MS001646, 2020.
Shen, M. L., Keenlyside, N., Selten, F., Wiegerinck, W., and Duane, G. S.: Dynamically combining climate models to “supermodel” the tropical Pacific, Geophys. Res. Lett., 43, 359–366, https://doi.org/10.1002/2015gl066562, 2016.
Soares, P. M. M., Lima, D. C. A., Semedo, A., Cardoso, R. M., Cabos, W., and Sein, D.: The North African coastal low level wind jet: a high resolution view (vol 53, pg 1211, 2019), Clim. Dynam., 53, 1231–1231, https://doi.org/10.1007/s00382-018-4475-x, 2019.
Sylla, A., Mignot, J., Capet, X., and Gaye, A. T.: Weakening of the Senegalo-Mauritanian upwelling system under climate change, Clim. Dynam., 53, 4447–4473, https://doi.org/10.1007/s00382-019-04797-y, 2019.
Sylla, A., Sanchez Gomez, E., Mignot, J., and López-Parages, J.: Impact of increased resolution on the representation of the Canary upwelling system in climate models, Geosci. Model Dev., 15, 8245–8267, https://doi.org/10.5194/gmd-15-8245-2022, 2022.
Toniazzo, T. and Koseki, S.: A Methodology for Anomaly Coupling in Climate Simulation, J. Adv. Model. Earth Sy., 10, 2061–2079, https://doi.org/10.1029/2018ms001288, 2018.
Vázquez, R., Parras-Berrocal, I., Cabos, W., Sein, D. V., Mananes, R., and Izquierdo, A.: Assessment of the Canary current upwelling system in a regionally coupled climate model, Clim. Dynam., 58, 69–85, https://doi.org/10.1007/s00382-021-05890-x, 2022.
Vázquez, R., Parras-Berrocal, I., Koseki, S., Cabos, W., Sein, D. V., and Izquierdo, A.: Seasonality of coastal upwelling trends in the Mauritania-Senegalese region under RCP8.5 climate change scenarios, Sci. Total Environ., 898, 166391, https://doi.org/10.1016/j.scitotenv.2023.166391, 2023.
Vázquez, R., Parras-Berrocal, I. M., Cabos, W., Sein, D., Mañanes, R., Bolado-Penagos, M., and Izquierdo, A.: Climate change in the Canary/Iberia upwelling region: the role of ocean stratification and wind, Environ. Res. Lett., 19, 074064, https://doi.org/10.1088/1748-9326/ad5ab4, 2024.
Vijith, V., Vinayachandran, P. N., Webber, B. G. M., Matthews, A. J., George, J. V., Kannaujia, V. K., Lotliker, A. A., and Amol, P.: Closing the sea surface mixed layer temperature budget from in situ observations alone: Operation Advection during BoBBLE, Sci. Rep.-UK, 10, 7062, https://doi.org/10.1038/s41598-020-63320-0, 2020.
Voldoire, A., Exarchou, E., Sanchez-Gomez, E., Demissie, T., Deppenmeier, A. L., Frauen, C., Goubanova, K., Hazeleger, W., Keenlyside, N., Koseki, S., Prodhomme, C., Shonk, J., Toniazzo, T., and Traore, A. K.: Role of wind stress in driving SST biases in the Tropical Atlantic, Clim. Dynam., 53, 3481–3504, https://doi.org/10.1007/s00382-019-04717-0, 2019.
Yang, Y., Wu, L. X., Cai, W. J., Jia, F., Ng, B., Wang, G. J., and Geng, T.: Suppressed Atlantic Nino/Nina variability under greenhouse warming, Nat. Clim. Change, 12, 814–821, https://doi.org/10.1038/s41558-022-01444-z, 2022.
Yang, Y., Wu, L. X., Guo, Y., Gan, B. L., Cai, W. J., Huang, G., Li, X. C., Geng, T., Jing, Z., Li, S. J., Liang, X., and Xie, S. P.: Greenhouse warming intensifies north tropical Atlantic climate variability, Sci. Adv., 7, eabg9690, https://doi.org/10.1126/sciadv.abg9690, 2021.
Zhou, L. M.: Desert Amplification in a Warming Climate, Sci. Rep.-UK, 6, 31065, https://doi.org/10.1038/srep31065, 2016.
Zuo, H., Balmaseda, M. A., Tietsche, S., Mogensen, K., and Mayer, M.: The ECMWF operational ensemble reanalysis–analysis system for ocean and sea ice: a description of the system and assessment, Ocean Sci., 15, 779–808, https://doi.org/10.5194/os-15-779-2019, 2019.


