the Creative Commons Attribution 4.0 License.
the Creative Commons Attribution 4.0 License.
 | 19 Aug 2024
Tipping point detection and early warnings in climate, ecological, and human systems
Vasilis Dakos
Chris A. Boulton
Joshua E. Buxton
Jesse F. Abrams
Beatriz Arellano-Nava
David I. Armstrong McKay
Sebastian Bathiany
Lana Blaschke
Niklas Boers
Daniel Dylewsky
Carlos López-Martínez
Isobel Parry
Paul Ritchie
Bregje van der Bolt
Larissa van der Laan
Els Weinans
Sonia Kéfi
Tipping points characterize the situation when a system experiences abrupt, rapid, and sometimes irreversible changes in response to only a gradual change in environmental conditions. Given that such events are in most cases undesirable, numerous approaches have been proposed to identify if a system is approaching a tipping point. Such approaches have been termed early warning signals and represent a set of methods for identifying statistical changes in the underlying behaviour of a system across time or space that would be indicative of an approaching tipping point. Although the idea of early warnings for a class of tipping points is not new, in the last 2 decades, the topic has generated an enormous amount of interest, mainly theoretical. At the same time, the unprecedented amount of data originating from remote sensing systems, field measurements, surveys, and simulated data, coupled with innovative models and cutting-edge computing, has made possible the development of a multitude of tools and approaches for detecting tipping points in a variety of scientific fields. However, we miss a complete picture of where, how, and which early warnings have been used so far in real-world case studies. Here we review the literature of the last 20 years to show how the use of these indicators has spread from ecology and climate to many other disciplines. We document what metrics have been used; their success; and the field, system, and tipping points involved. We find that, despite acknowledged limitations and challenges, in the majority of the case studies we reviewed, the performance of most early warnings was positive in detecting tipping points. Overall, the generality of the approaches employed – the fact that most early warnings can in theory be observed in many dynamical systems – explains the continuous multitude and diversification in their application across scientific domains.
- Article
(3403 KB) - Full-text XML
-
Supplement
(3019 KB) - BibTeX
- EndNote
- Included in Encyclopedia of Geosciences


Tipping points characterize a situation when a system experiences abrupt, rapid, and sometimes irreversible changes. Such shifts occur when a threshold is crossed and the system transitions from its current state to a contrasting one (van Nes et al., 2016). Given that tipping points are associated with abrupt, rapid, and sometimes irreversible changes, numerous approaches have been proposed to identify if a system is getting closer to such a point. These approaches are often referred to as early warning signals (EWSs), and they represent a powerful generic tool for anticipating tipping points in a variety of systems (Scheffer et al., 2009). The general mechanism behind EWSs is that, as a dynamical system approaches a tipping point, it becomes slower at recovering from small perturbations (Wissel, 1984), and this critical slowing down (CSD) of the system leaves signatures in the temporal and spatial dynamics of the system (Drake et al., 2020). EWSs rely on identifying exactly such changes in the underlying behaviour of a system across time or space prior to a tipping point.
Table 1Available software tools for the estimation of early warnings with temporal and spatial datasets.
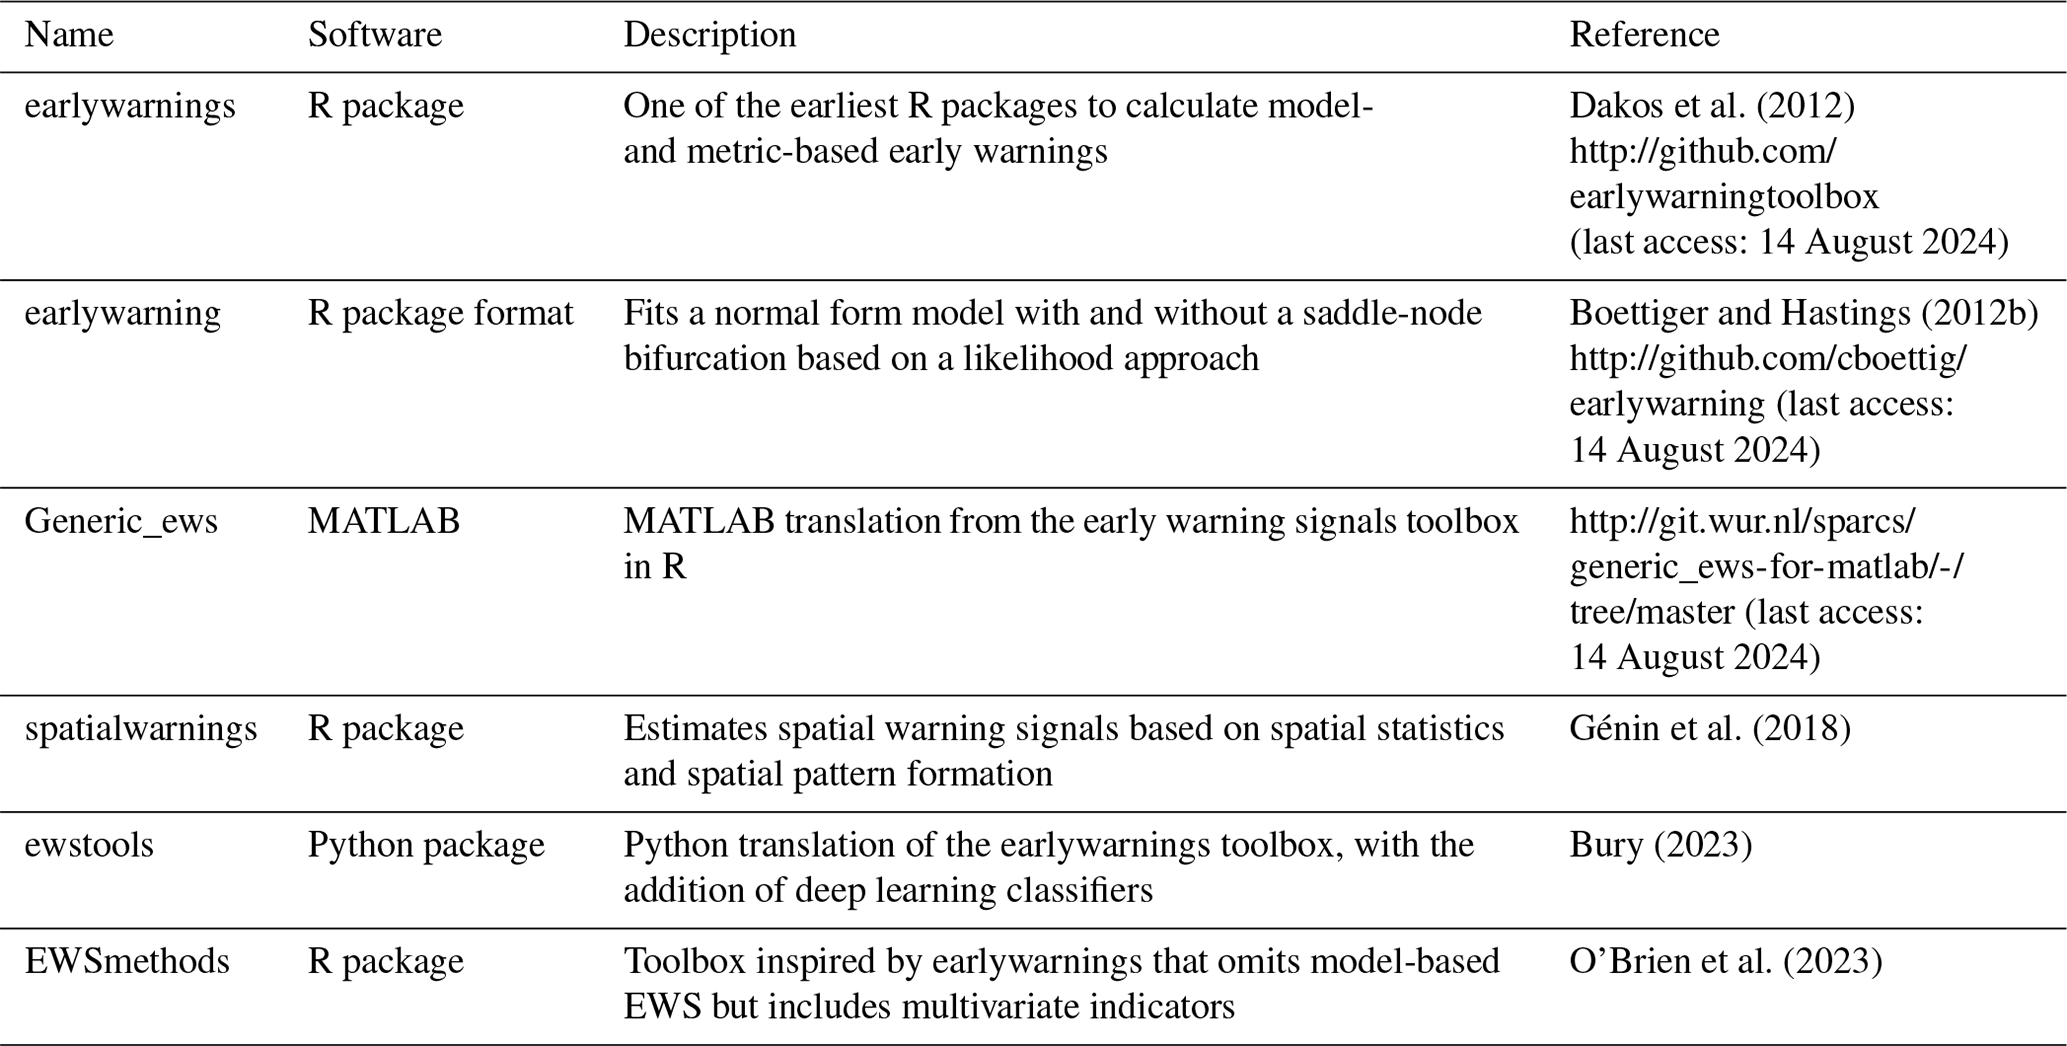
Early, after their introduction in the literature, it became clear that EWSs did not allow the anticipation of all types of tipping points in advance (Hastings and Wysham, 2010) and that they are not unique to tipping point responses but also occur when systems are undergoing smoother transitions (Kéfi et al., 2013). These realizations imply that some shifts (typically referred to as abrupt shifts or regime shifts) may require alternative or additional signals (Boettiger et al., 2013; Dakos et al., 2015). Thus, a rich research programme has been triggered in the theory behind tipping point anticipation and the development of tools (Table 1) for quantifying changes in dynamical patterns of system behaviours that could be used as early warnings preceding tipping points and abrupt shifts in general. Different terms have been used to describe the great variety of metrics proposed in the literature, like “early warning systems” (Lenton, 2013b), “observation-based early warning signals” (Boers, 2021), “statistical stability indicators” (Bathiany et al., 2016), “critical slowing down (CSD) indicators” (Tang et al., 2022), “leading indicators” (Carpenter et al., 2008), “resilience indicators” (Dakos et al., 2015), “generic indicators” (Scheffer et al., 2015), “dynamical indicators of resilience” (DiOR) (Scheffer et al., 2018), “indicators of transitions” (Clements and Ozgul, 2018), and “universal early warning signals” (Dylewsky et al., 2023). In the rest of the paper, we will use the term “early warnings” to refer to this whole family of indicators.
Whatever the term used, while early warnings are well grounded in theory, the challenge remains to apply them to real-world systems. A number of review and synthesis papers have summarized the theoretical aspects of early warnings and provided partial accounts of their empirical applications (Alberto et al., 2021; Bestelmeyer et al., 2011; Dakos and Kéfi, 2022; Lenton, 2011, 2013b; Litzow and Hunsicker, 2016; Nijp et al., 2019; Scheffer et al., 2012a, 2015). However, although the utility of early warnings has led to early warnings proliferating beyond ecology and climate and being applied across a variety of scientific domains, we miss a complete picture of where, how, and which early warnings have been used so far in real-world case studies.
Here, after summarizing the basics of the theory underlying early warnings and giving an overview of their taxonomy, we review the literature for the use of early warnings in empirical studies across all scientific fields. We document what metrics have been used; their success; and the field, system, and tipping points involved. We then classify this information in order to provide an overview of the progress, limitations, and opportunities in the empirical application of early warnings after 15 years of research on the topic.
The theory behind tipping point anticipation is mostly based on destabilizing stable fixed equilibrium points. In such cases, there are three ways that a tipping point may theoretically occur (Lenton, 2013a). A system may undergo a bifurcation when a parameter (or multiple parameters) in the system changes beyond a critical threshold and the stability of the state the system occupies is lost, thus causing the system to shift to an alternative state (bifurcation tipping or B-tipping). Noise-induced tipping can occur when a system is shifted outside its stable basin of attraction by some form of stochastic forcing (N-tipping). A third class, known as rate-induced tipping (R-tipping), occurs when a parameter rapidly changes and the system is no longer able to track its stable state (Ashwin et al., 2011). Tipping points also occur through phase transitions, a long-studied set of emergent phenomena in physics which resemble the characteristics of the B-tipping described above (Hagstrom and Levin, 2021; Sole et al., 1996).
The majority of the early warnings discussed below are primarily developed to detect cases where there is a gradual approach towards a bifurcation-tipping event causing a loss of system state stability. Rate-induced tipping could also show early warning (Ritchie and Sieber, 2016). Noise-induced tipping is likely to occur unpredictably; therefore early warnings are less expected. In a realistic scenario with constant stochasticity and conditions gradually changing, tipping is commonly a combination of a movement towards bifurcation and noise pushing the system before the bifurcation actually occurs. In such cases, noise-induced tipping becomes more likely, as it is easier for the system to leave its current basin of attraction when it is closer to the bifurcation, and this increase in the probability of tipping can be identified through particular early warnings (Sect. 2.2).
Although most of the theory behind early warning signals is related to saddle-node (or fold) bifurcations, other types of bifurcations have also been considered, like transcritical, pitchfork, or Hopf bifurcations (more general codimension-1 bifurcations; Kuznetsov, 1995). Such bifurcations are smooth (also called continuous) in contrast to the abrupt (i.e. discontinuous) fold bifurcations associated with tipping points, yet it has been shown that similar early warning signals can be applied for them (Boettiger et al., 2013; Kéfi et al., 2013). A full list of bifurcation types (discontinuous and continuous) and their relationship to CSD can be found in Thompson and Sieber (2011). In this paper, the early warnings considered are mostly developed in the context of the discontinuous fold bifurcation.
Table 2A taxonomy of early warnings depending on whether or not the warning is based on critical slowing down (CSD). CSD-based early warnings are mostly associated with bifurcation tipping (B-tipping), while non-CSD-based ones are associated both with B-tipping and noise-induced tipping (N-tipping; see also Sect. 2.1). A second dichotomy is based on whether the warning is a statistical metric based on the dynamical patterns of the system or whether it is based on a process model that is as simple as possible. In parentheses is the type of data (temporal and/or spatial) used to estimate the early warning.
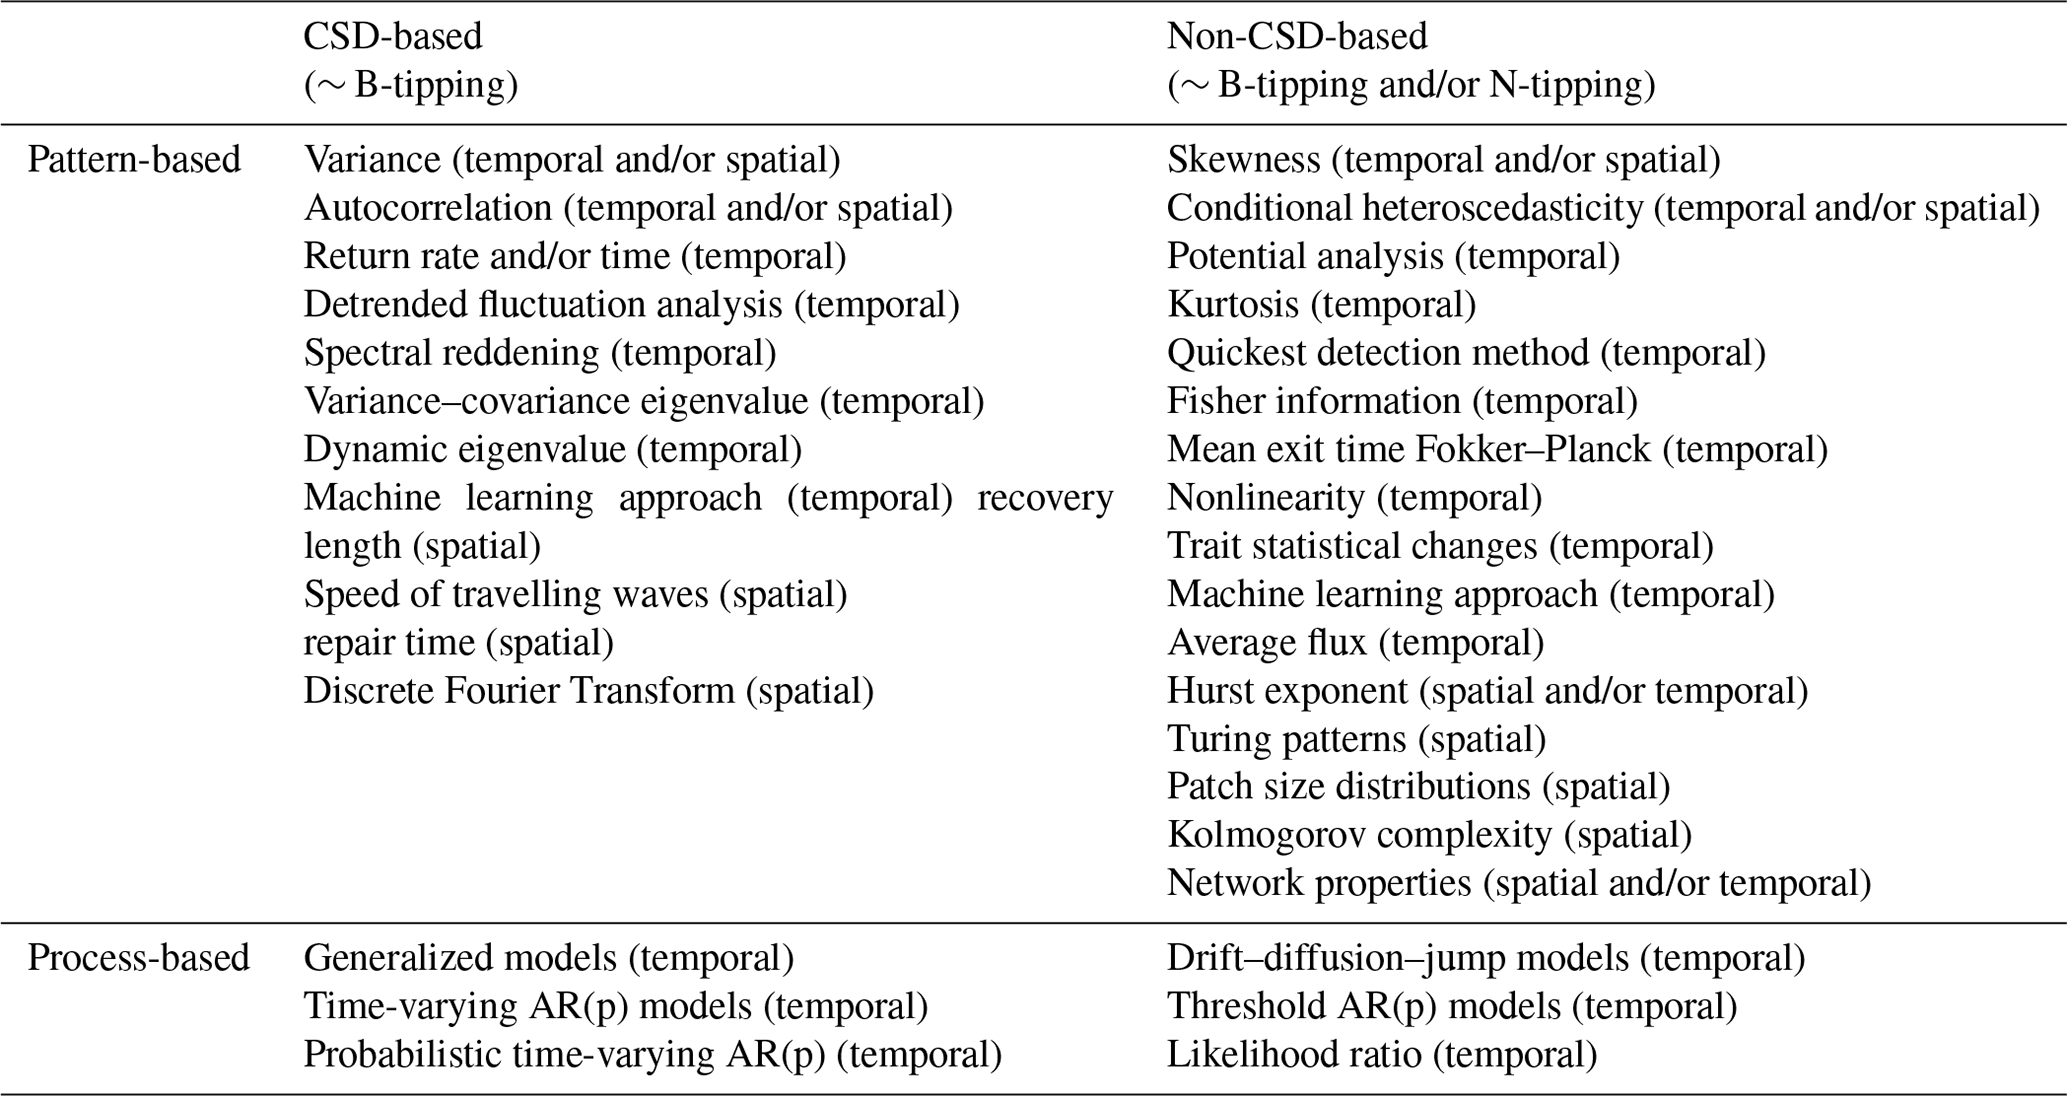
We hereafter present a representative (but not complete) overview of the early warnings mostly used, both theoretically and empirically. These signals can be classified in different ways depending, for instance, on the type of mechanism or tipping point (e.g. CSD-based, non-CSD-based), the type of data used (e.g. temporal, spatial, trait, abundance data), and the approach employed (e.g. analysing patterns, fitting models, network methods). In Table 2, we suggest a taxonomy of early warnings based on the mechanism and the approach used. We then present their basics without going into the details. A full description and the methods to estimate them can be found elsewhere (Clements and Ozgul, 2018; Dakos et al., 2012; Génin et al., 2018; Kéfi et al., 2014; Lenton, 2011; Scheffer et al., 2015) and in dedicated software packages (Table 1).
2.1 Early warnings based on critical slowing down (CSD-based)
The early warnings most used are based on searching for evidence of “critical slowing down” (CSD) in the system. Essentially, as the system is forced towards a tipping point, the state it currently occupies starts to lose its stability, and the restoring feedbacks that “pull” the system back to that state after it is perturbed start to degrade. This causes the system to respond more sluggishly to these perturbations and thus slow down (Wissel, 1984). Figure 1 shows this concept visually using the “ball in the well” analogy. When the system is more stable, represented by the well with steeper sides, the recovery is faster as the ball (representing the state of the system) returns faster. A system close to tipping, represented by a shallower well, has a slower recovery as the ball takes longer to return. Eventually, the restoring feedbacks of the system may become so weak that the stability of the current state may be lost, and the system may transition to a new stable state. Mathematically, CSD occurs as the leading eigenvalue of the system approaches 0 from below. However, in reality, we do not have the equations that govern the system's dynamics, and, as such, we have to estimate the occurrence of CSD with methods that aim to infer CSD mostly from the patterns of the system dynamics or by fitting very simple and generic process-based models (Table 2).
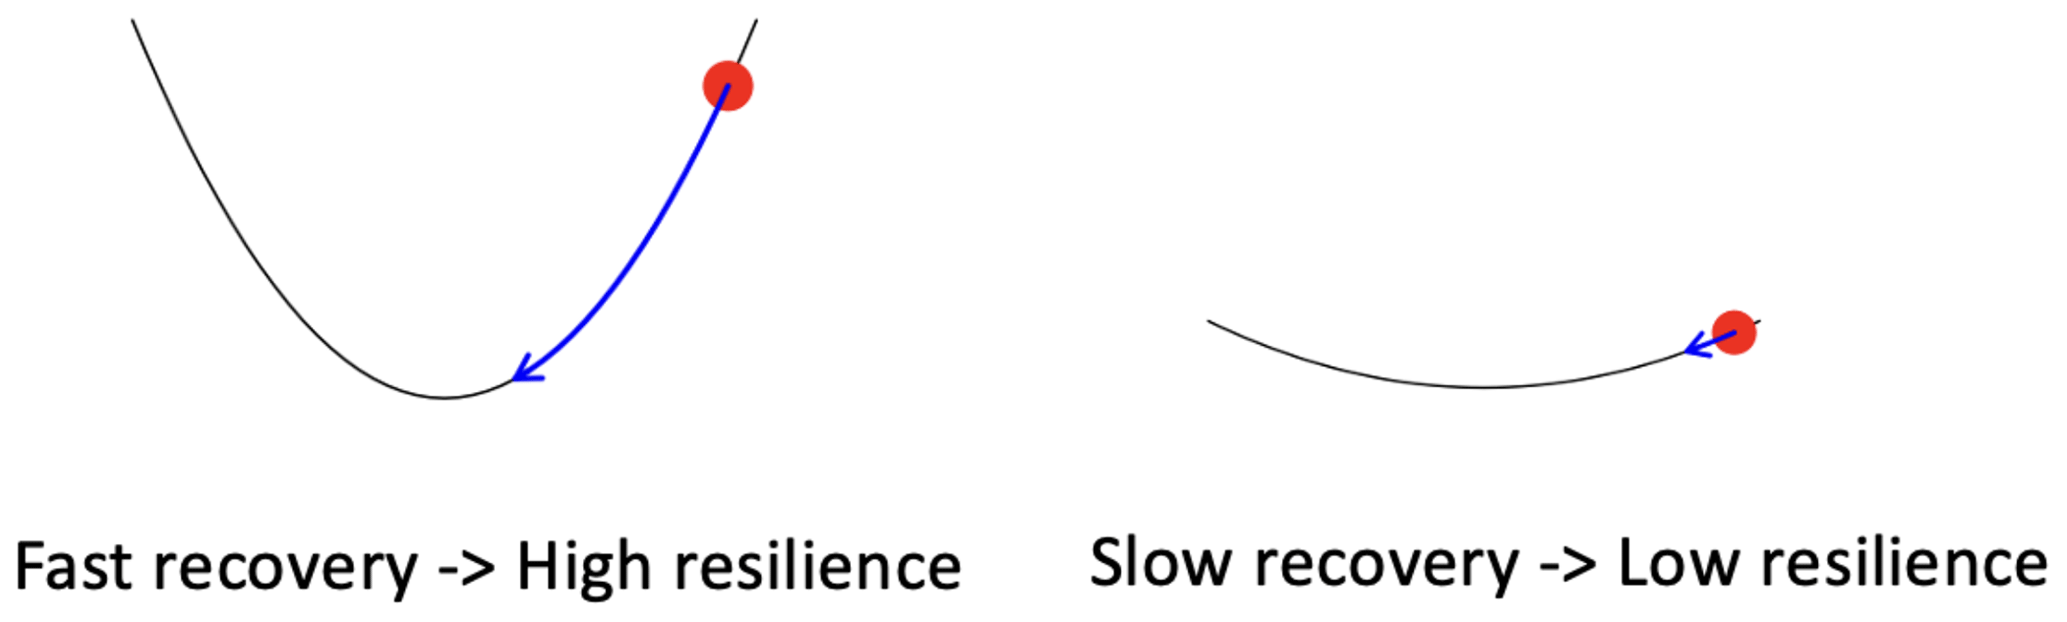
Figure 1Using the “ball in the well” analogy to compare a system that is far from tipping (left) and a system that is close to tipping (right). The system that is further away from tipping recovers faster from perturbations, with the steeper sides of the well describing the stronger restoring feedbacks of the system. Closer to tipping, the sides of the well are shallower, such that the system will take longer to return from the same perturbation because the restoring feedbacks are weaker.
Return rate, autocorrelation, and variance
Using statistical techniques makes it possible to detect CSD based on the dynamical patterns a system is generating. The most direct way to detect CSD is to consider the rate at which a system returns to its initial state following a perturbation (return rate or return time). A resilient system with strong restoring feedbacks will return to its initial state faster than one which is near to a tipping point (Wissel, 1984). However, this method requires the occurrence of a well-defined perturbation and clear knowledge of when the equilibrium state of the system has been reached, neither of which are always clearly defined in the real world.
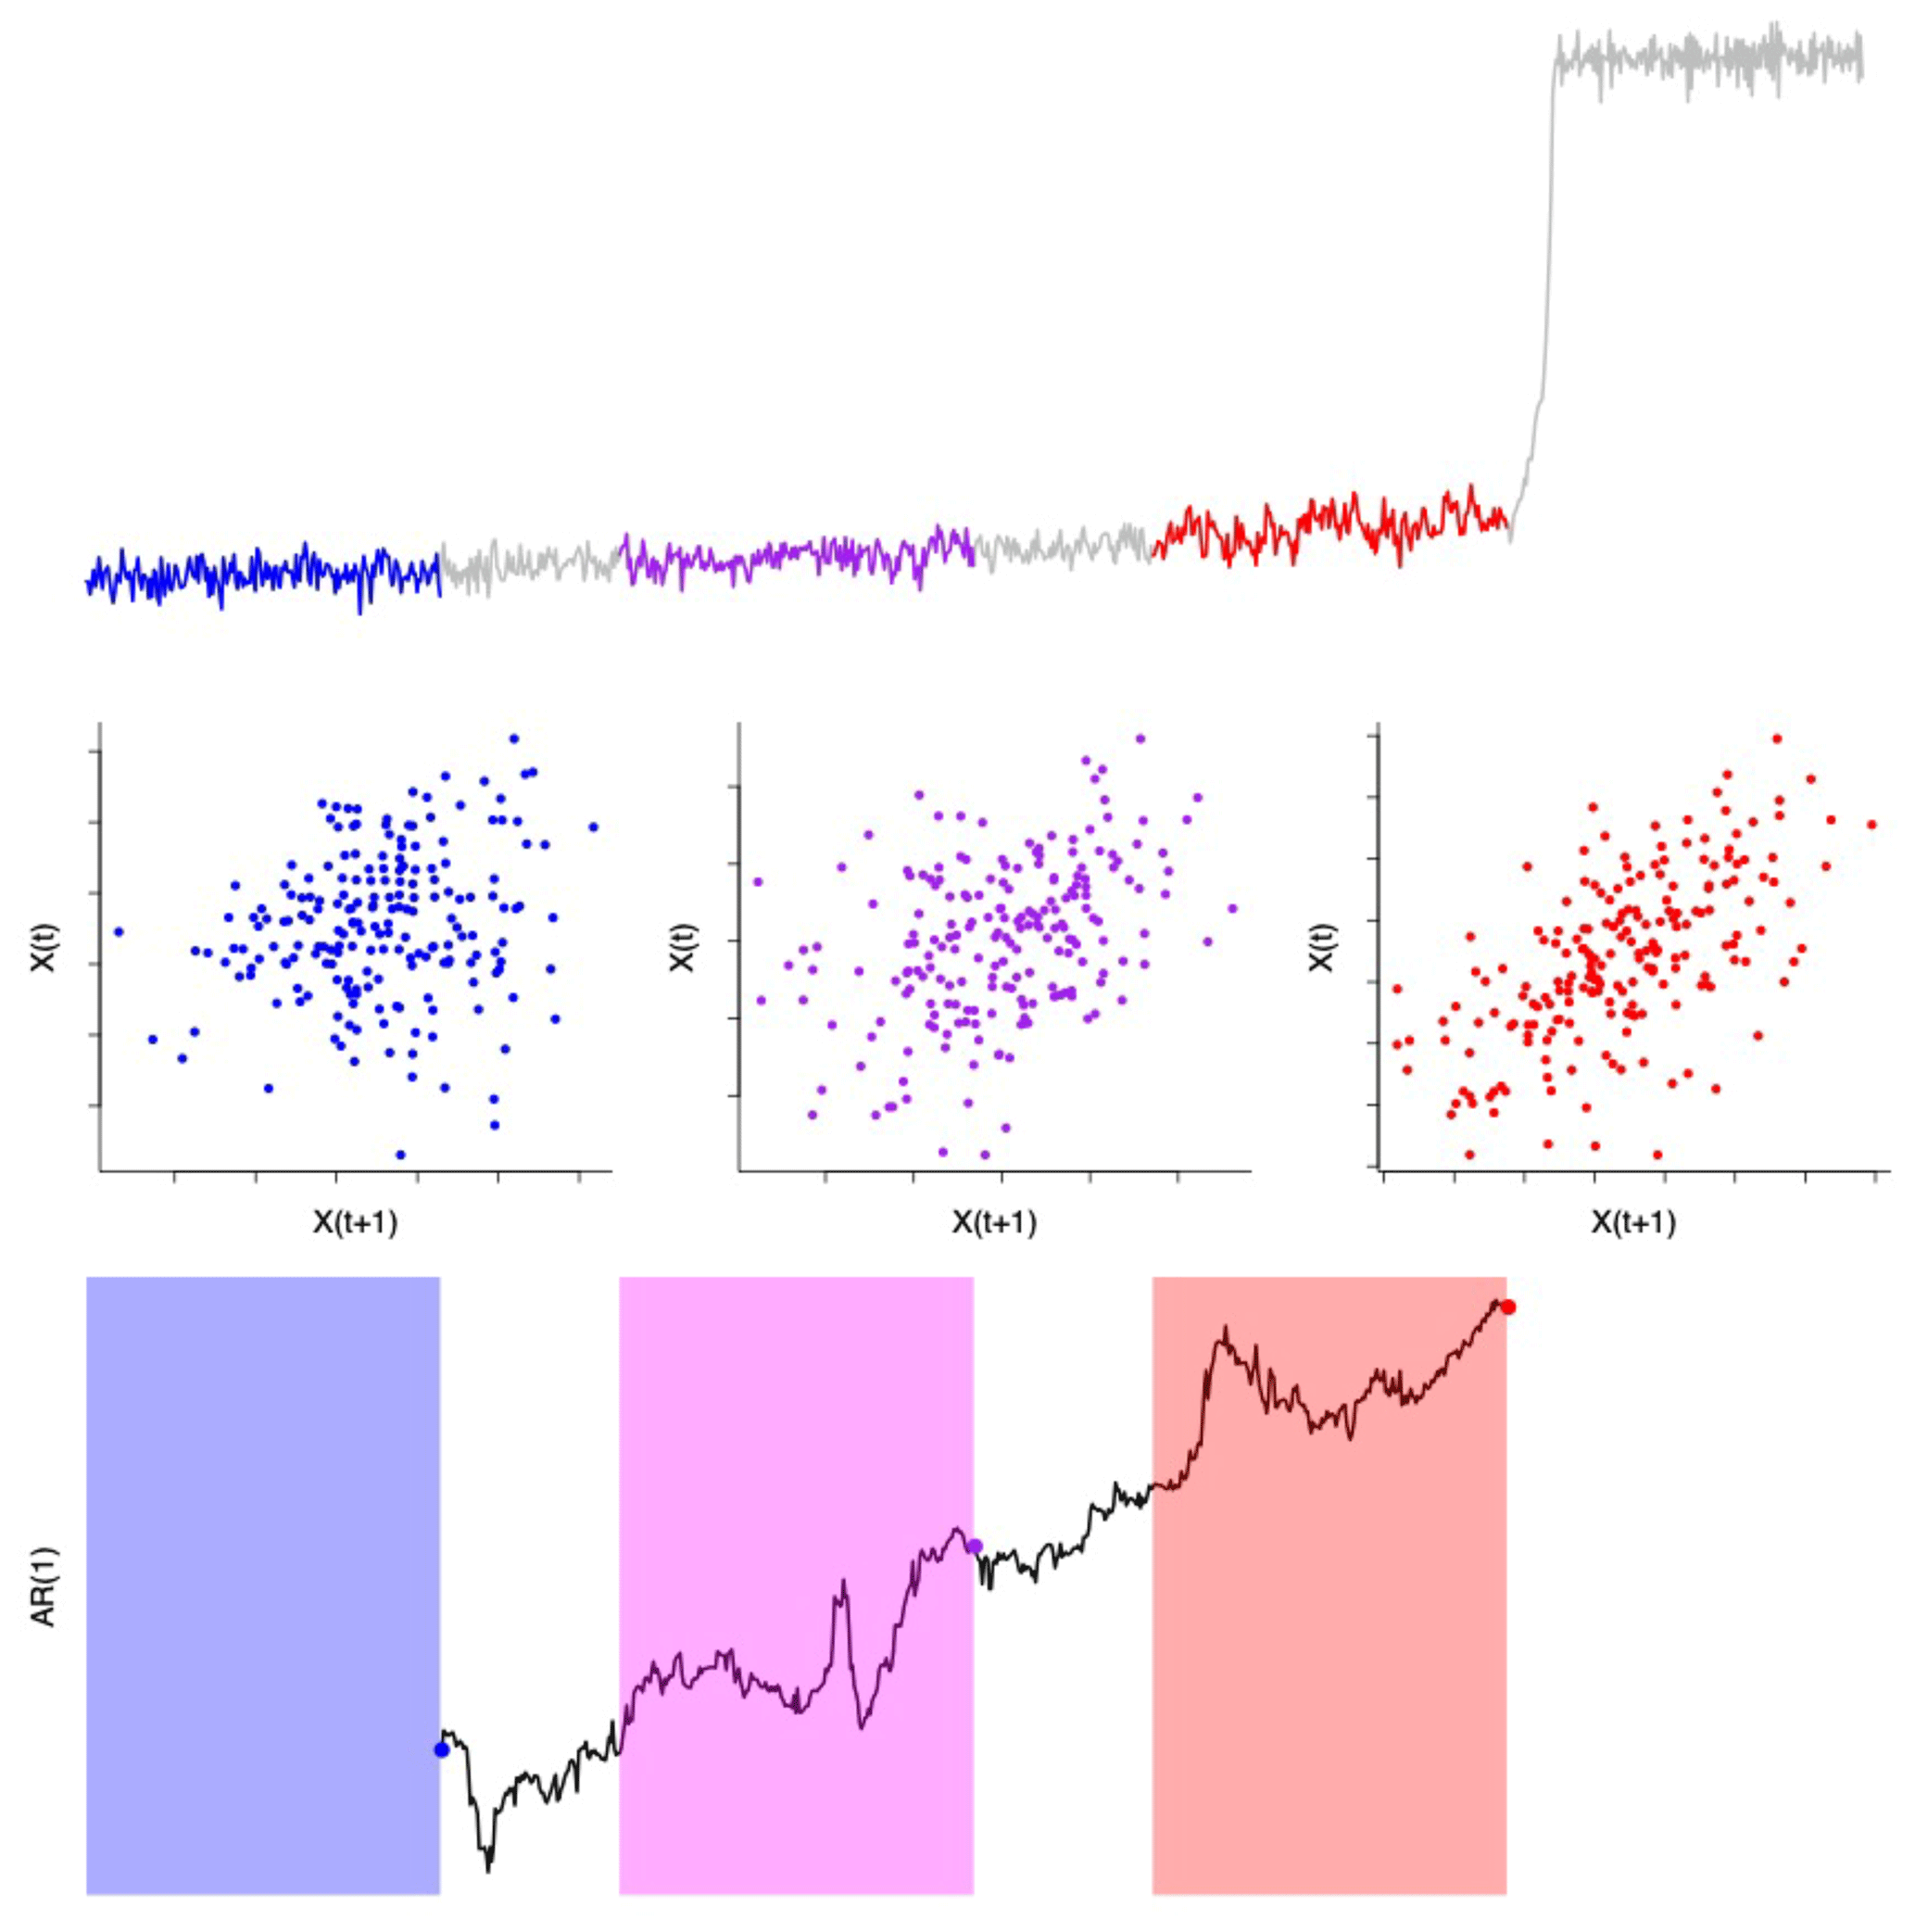
Figure 2A comparison of the lag-1 autocorrelation (AR(1)) for a system that is far from tipping (blue), getting close to tipping (purple), and close to tipping (red). As the time series approaches tipping (top row), there is no correlation between subsequent values of the time series in the blue part of the time series (far from tipping). However, closer to tipping, in the purple and then red regions of the time series, there are correlations and thus higher AR(1) values. In the time series itself there are clear deviations towards the end compared to the beginning, suggesting that CSD occurs as the tipping point approaches. The early warnings are calculated on a moving window (coloured regions in the bottom plot). Here, AR(1) is shown at the end of the window used to calculate it, with examples shown as coloured points to match those windows on the detrended time series.
As the system approaches a tipping point and its recovery slows down, each time step X(t) is more correlated to the previous time step X(t−1) (as shown in Fig. 2). This can be measured with lag-1 autocorrelation, or AR(1), which tends towards 1 as a system experiences CSD prior to tipping to an alternate state. Visually, this can be viewed by observing a scatterplot of a time series of the system against the time series lagged by 1 time point (Fig. 2). When the system is far from tipping (top row of Fig. 2), there is no relationship between the current state and the state at the previous point in time (low AR(1)). As the system approaches the tipping point, CSD means that there is a strong correlation between the system state now and at the previous point in time (and thus a higher AR(1)). Larger deviations in the red section of the time series can be seen, further showing this slowing down and increase in AR(1).
Similarly, as the system struggles to return to its initial state as resilience is lost, the variance of the system is also expected to increase, as the system can sample more of the “state space” (all the possible states the system can be in) due to the shallower well. However, this is often recorded alongside an increase in AR(1) because other factors can lead to a change in variance, such as how the system is forced externally.
Spatial analogues of the temporal variance and temporal AR(1) exist, too, with a similar underlying theory to the one for the temporal ones: as a system approaches a tipping point and responds more sluggishly to external perturbations and samples more of the state space, it is expected that there will be a higher spatial autocorrelation (Dakos et al., 2010) and spatial variance (Guttal and Jayaprakash, 2009).
Just like AR(1) and variance, all other CSD-based early warnings aim at detecting characteristic changes in the dynamical patterns of the system either by directly estimating a statistical property (e.g. spectral reddening) or by fitting a statistical model (e.g. detrended fluctuation analysis) (Table 2). A parallel approach involves more complex methods to predict the movement towards tipping points that involve the use of simple process-based models. One such example is that of using a generalized model that integrates knowledge about the system into a model, which may allow us to estimate changes in the leading eigenvalue of the system once minimal model assumptions have been made (Lade and Gross, 2012).
2.2 Early warnings not based on critical slowing down (non-CSD-based)
CSD-based early warnings rely on the assumption that the system state shows only small deviations around the equilibrium state of the system. However, this assumption does not hold in the presence of strong stochasticity. In other cases, either CSD is hard to measure or more idiosyncratic metrics have been suggested to act as alternatives to CSD-based warnings. Below, we outline a few of the most representative non-CSD-based early warnings (Table 2).
2.2.1 Skewness
As the current equilibrium state of the system is losing resilience and the probability to shift to an alternative equilibrium increases, the temporal distribution of states of the system is expected to become increasingly skewed toward the alternative state. This can be quantified by the skewness of the system. The skewness may increase or decrease, depending on whether the alternative equilibrium is larger or smaller than the current equilibrium (Guttal and Jayaprakash, 2008). Similarly to the change in skewness observed between the two states with temporal data, it is also possible to observe this change in skewness in the spatial domain (Guttal and Jayaprakash, 2009).
2.2.2 Flickering
“Flickering” is the situation where strong stochasticity can “push” a system temporarily into the basin of attraction of the alternative state before returning to the current state with increasing likelihood as the system is approaching tipping (Dakos et al., 2013; Wang et al., 2012). Flickering can be measured either by a simple increase in variance (Dakos et al., 2013) or by more complex statistical approaches, e.g. quickest detection method (Carpenter et al., 2014) and heteroscedasticity (Seekell et al., 2012; Seekell and Dakos, 2015).
2.2.3 Potential analysis
Information about a system at multiple sampling points through time or multiple locations across space can allow us to reconstruct a “stability landscape” of the system – or potential, which gives an idea of the most frequent states of the systems observed in systems experiencing different environmental conditions and history (Livina et al., 2010). Multimodality in such a landscape for a given set of environmental conditions suggests that the system could exhibit alternative stable states for that range of conditions (Abis and Brovkin, 2019; Hirota et al., 2011; Scheffer et al., 2012b; Staver et al., 2011), although seasonality patterns should be accounted for to reduce misinterpretation of externally forced “states”.
2.2.4 Spatial patterns
A number of ecosystems have a clear spatial structure which is self-organized (e.g. drylands, peatlands, salt marshes, mussel beds; Rietkerk et al., 2008). Theoretical models have shown that the size and shape of the spatial patterns change in a consistent way along stress gradients, and, as such, they are good indicators of ecosystem degradation (von Hardenberg et al., 2001; Kéfi et al., 2007; Rietkerk et al., 2004). Probably one of the most studied examples is the case of dryland ecosystems, where changes in the shape of regular patterns (Rietkerk et al., 2004) and in the patch size distribution (Kéfi et al., 2007) could inform us about the stress experienced by the ecosystem (Dakos et al., 2011).
2.2.5 Fitting a threshold model
An alternative approach to pattern-based early warnings is based on fitting process-based models on the time series of a system prior to a tipping point. This approach mainly consists of fitting the simplest dynamical model with a tipping point (i.e. a saddle-node normal form) (Ditlevsen and Ditlevsen, 2023) and testing its likelihood compared to a model without a tipping point (Boettiger and Hastings, 2012b) or of fitting threshold models assuming simple autoregressive state-space models (Ives and Dakos, 2012; Laitinen et al., 2021).
2.2.6 Structural changes
A novel way to detect tipping points involves monitoring structural change properties (e.g. connectivity, node centrality) in network systems (i.e. a network of interacting components) like spatially connected sites, interacting actors, or species in a community (Cavaliere et al., 2016; Mayfield et al., 2020; Yin et al., 2016). Alternatively, the temporal correlation between components in multivariate systems has been used to construct an interaction network and analyse its structural properties (Tirabassi et al., 2014).
2.2.7 Trait changes
Another idiosyncratic approach involves monitoring changes in the statistical moments of fitness-related traits (e.g. body size) (Clements and Ozgul, 2018). Such trait changes have been found in populations under stress where there are changes in the traits of individuals (i.e. decreasing mean and increasing variance in body size) (Clements and Ozgul, 2016; Spanbauer et al., 2016). These trait-based and the above-mentioned structural-based signals are case-specific and idiosyncratic to the details of the system, as there is no universal mechanism that would generate an expected pattern related to the approach of tipping points.
We performed a (non-exhaustive) literature review on the empirical (not theoretical) use of warning signals. We first did a topic search (TS) that included title, abstract, and keywords in the Web of Science for the period from 1 January 2004 to 1 April 2023 with the following terms. TS = ((“tipping point∗” or “tipping” or “catastrophic bifurcation∗” or “catastrophic shift∗” or “regime shift∗” or “abrupt shift∗” or “critical transition∗”) and (“early warning∗” or “early warning∗” or “warning sign∗” OR “resilience indicator∗” or “leading indicator∗” OR “precursor∗”)). We selected the year 2004 as the starting date of our search, despite the fact that CSD was known in ecology much earlier (Wissel, 1984) and that signatures of catastrophic bifurcations were theoretically described for dynamical systems (Gilmore, 1981). Our choice was driven by the fact that 2004 is around the time of the first studies in climate (Held and Kleinen, 2004; Kleinen et al., 2003) and ecology (Carpenter and Brock, 2006) where the theoretical idea of using CSD as a warning signal emerged, while a few years later the first review on early warnings on critical transitions was published (Scheffer et al., 2009). Within this time period, our topic search returned 887 unique publications. For completeness, we also ran the same topic search before 2004 going back to 1960, and we retrieved 11 publications of which only 1 was related to bifurcations. Clearly, we might have missed relevant records with the TS we selected. For example, had we also included the term “phase transition∗”, we would have retrieved 3916 records. We decided not to include this term, as it pertains to a specific and rich field of physics, but with our TS we are confident to have a rather complete overview of the tipping point (and related terms) literature.
We screened all 887 publications to select only the ones where there was an empirical application of early warnings (i.e. an indicator was measured on real data to signal the occurrence of a tipping point). This screening led to 229 papers that we classified as ones that included at least one empirical application of early warnings. For each paper, we collected the following information: “domain” (e.g. climate, ecology), “system” (e.g. Arctic sea ice, fisheries, mental depression), the “tipping point” described, data source (e.g. lab experiment, field survey, remote-sensed datasets, social data), “data type” (i.e. temporal, spatial, spatiotemporal), “indicator” (i.e. the specific warning signal(s) used), and “performance” (whether the performance of the early warning was reported in the paper as positive, negative, mixed (in the case of multiple signals used or multiple datasets analysed), or inconclusive). To facilitate the analysis, we regrouped the “data source” and “indicator” categories into broader groups (see Sect. S1 in the Supplement). We also created two extra categories: we classified systems under a specific “field”, and we introduced an “indicator type” based on whether the early warning was CSD-based or non-CSD based. We then excluded the running year 2023 and summarized results in terms of unique publications using simple statistics and alluvial plots in R (4.3.1).
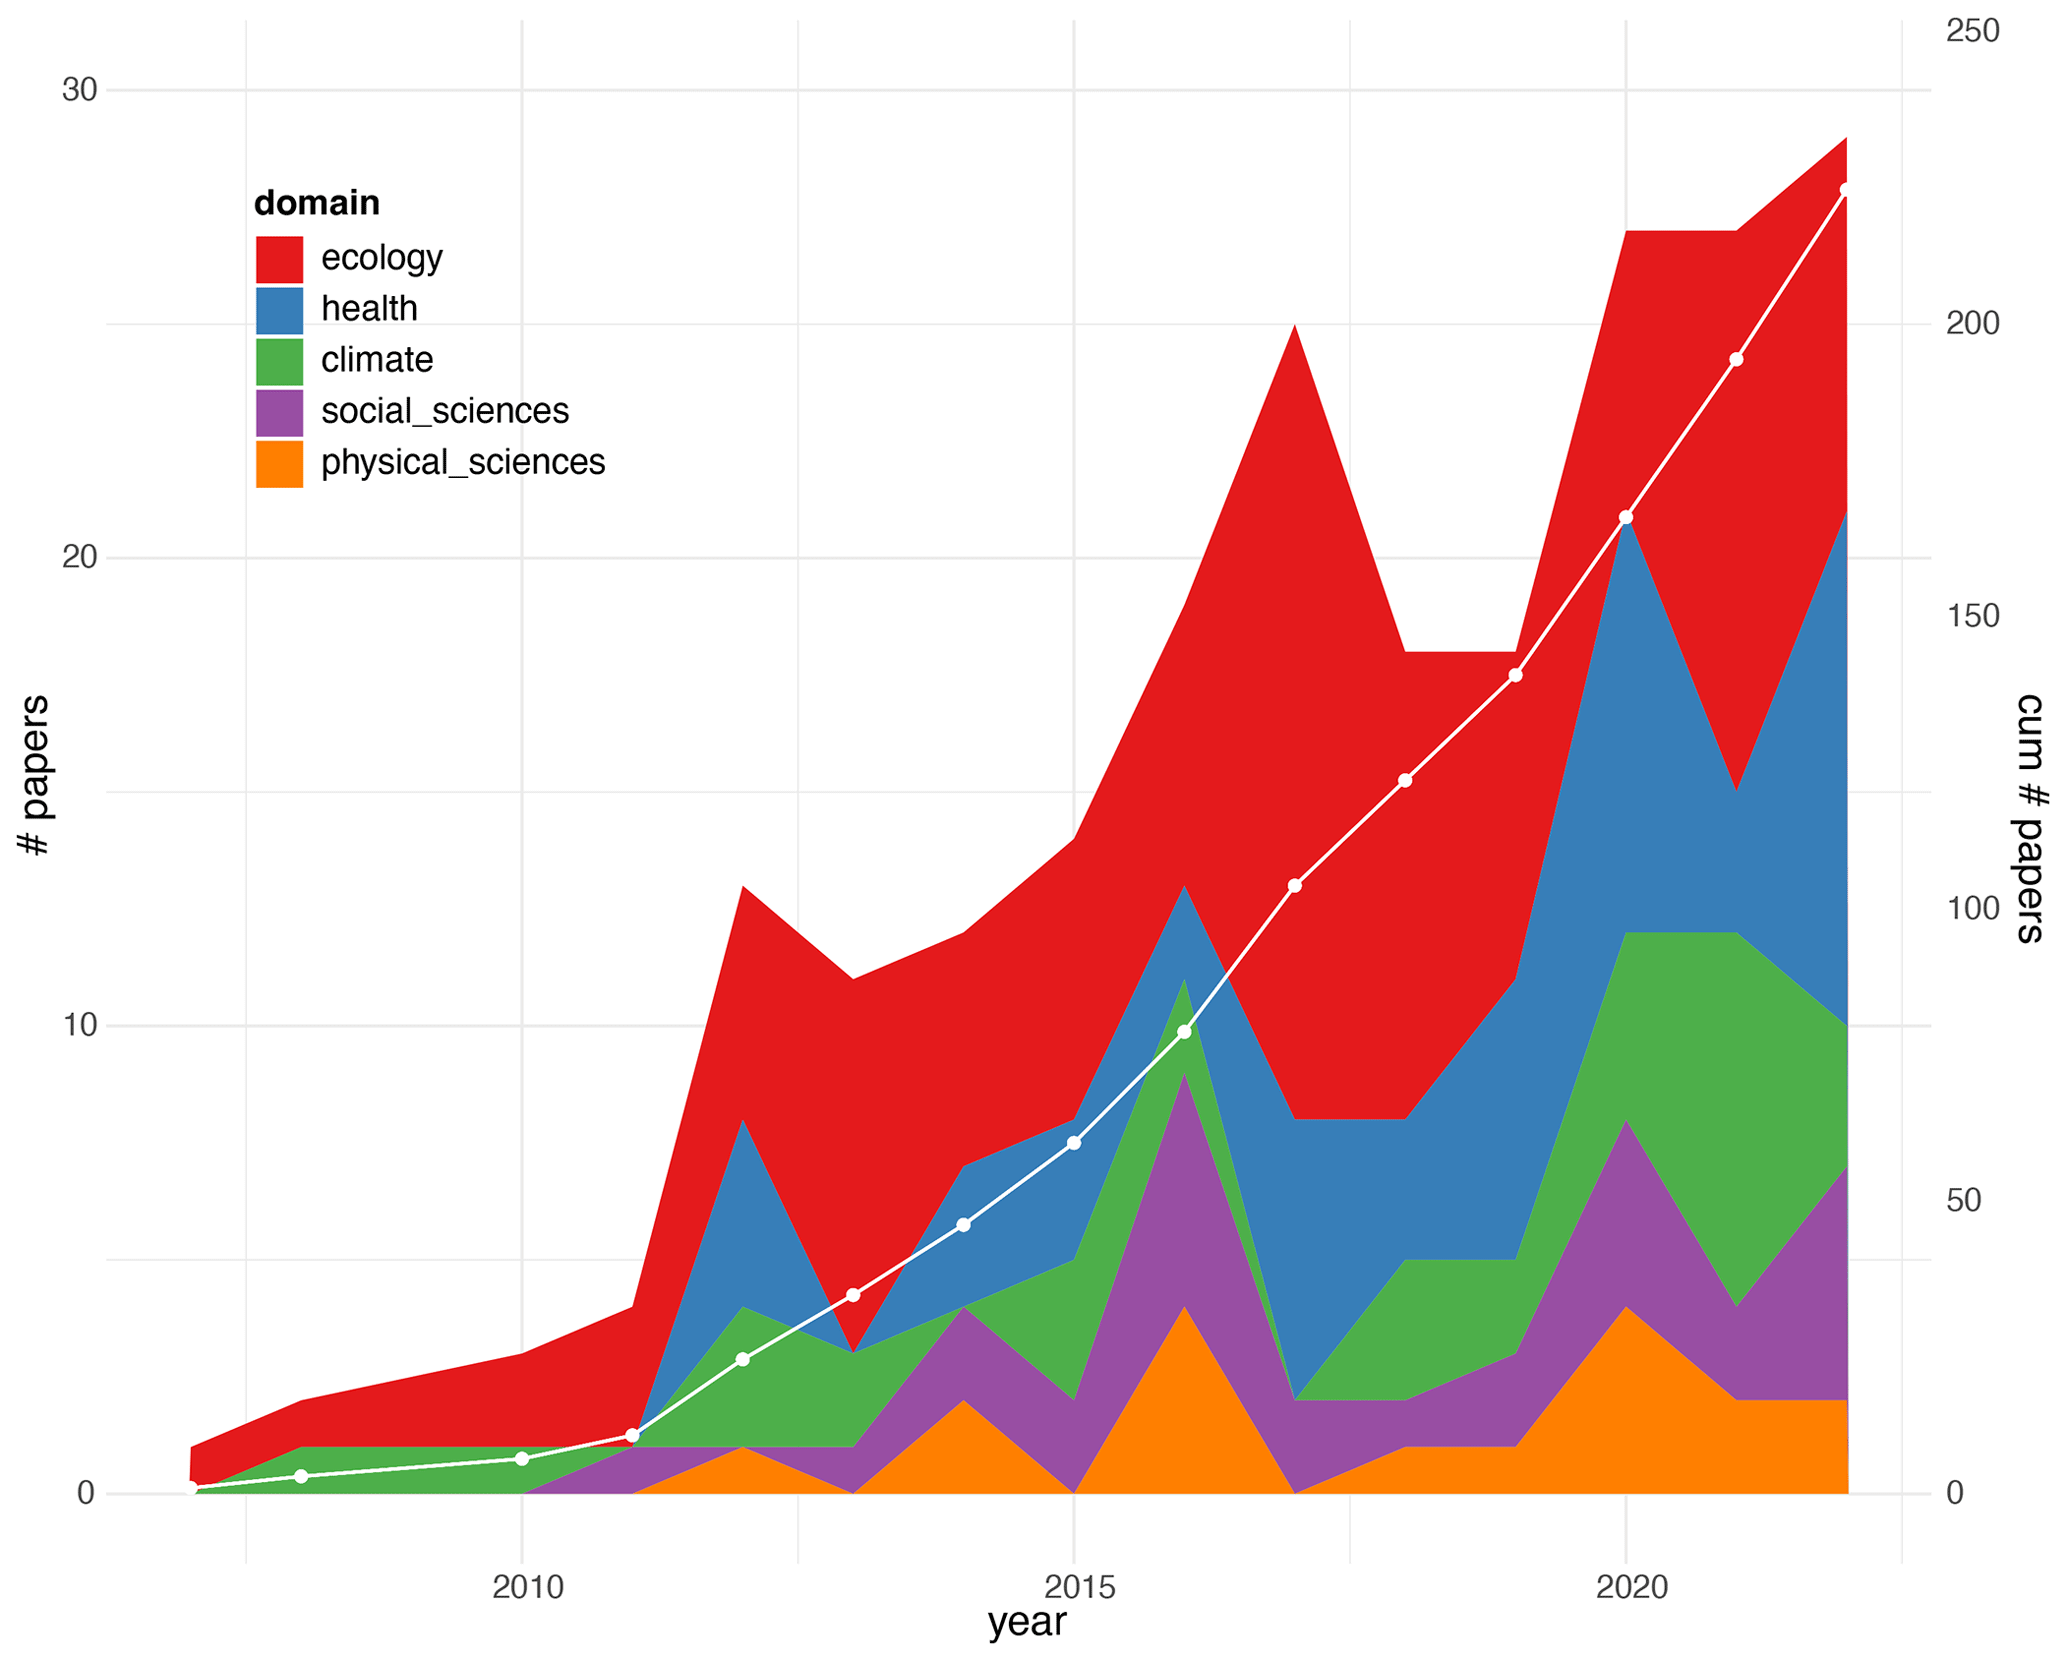
Figure 3Evolution of studies applying early warnings in empirical datasets. The total 229 papers we identified through our literature review between 2004 and 2022 were classified within five main scientific domains (ecology, health, climate, social sciences, and physical sciences). The dotted white line shows the cumulative number of papers.
3.1 Overall use of early warnings across disciplines
We were able to classify the total 229 papers published from 2004 to 2023 into five main domains: ecology, climate, health, social sciences, and physical sciences. We found that empirical papers first appeared in 2007 in the domains of ecology and climate but that the first papers in health, social sciences, and physical sciences were only published after 2010 and 2011 (Fig. 3). This change may be associated with the highly cited review by Scheffer et al. (2009) that introduced (and popularized) the terms “early warning signals” and “critical transitions”. Since then, the number of empirical studies has quickly increased but has remained dominated by ecology (43.6 % of the papers overall), followed by health (22.6 %), climate (14.6 %), social sciences (12 %), and physical sciences (7.6 %) – showing the diversification of the uses of early warning (Fig. 3).
The higher number of publications in the health domain compared to the climate domain is unexpected. We found a large number of studies in the medical field (Fig. S1 in the Supplement) that form a distinct group on the emergence of human diseases, such as cancer (Liu et al., 2020), which use a non-CSD context-specific early warning (“dynamic_network_biomarkers”; see also Sect. 3.3). Zooming into within each domain, we observed that the most ecological studies are on terrestrial and freshwater fields (Fig. S1), namely on drylands and in forest and lake ecosystems (Table S1 in the Supplement). The majority of climate studies are on past climate transitions and modern records (Fig. S1, Table S2), while the social studies are split between societal shifts (like in politics, social behaviour, and transport) and finance transitions (Fig. S1, Table S4). Lastly, studies on physical sciences appear more heterogeneous, including tipping points in materials, power systems, and even astronomy (Fig. S1, Table S5).
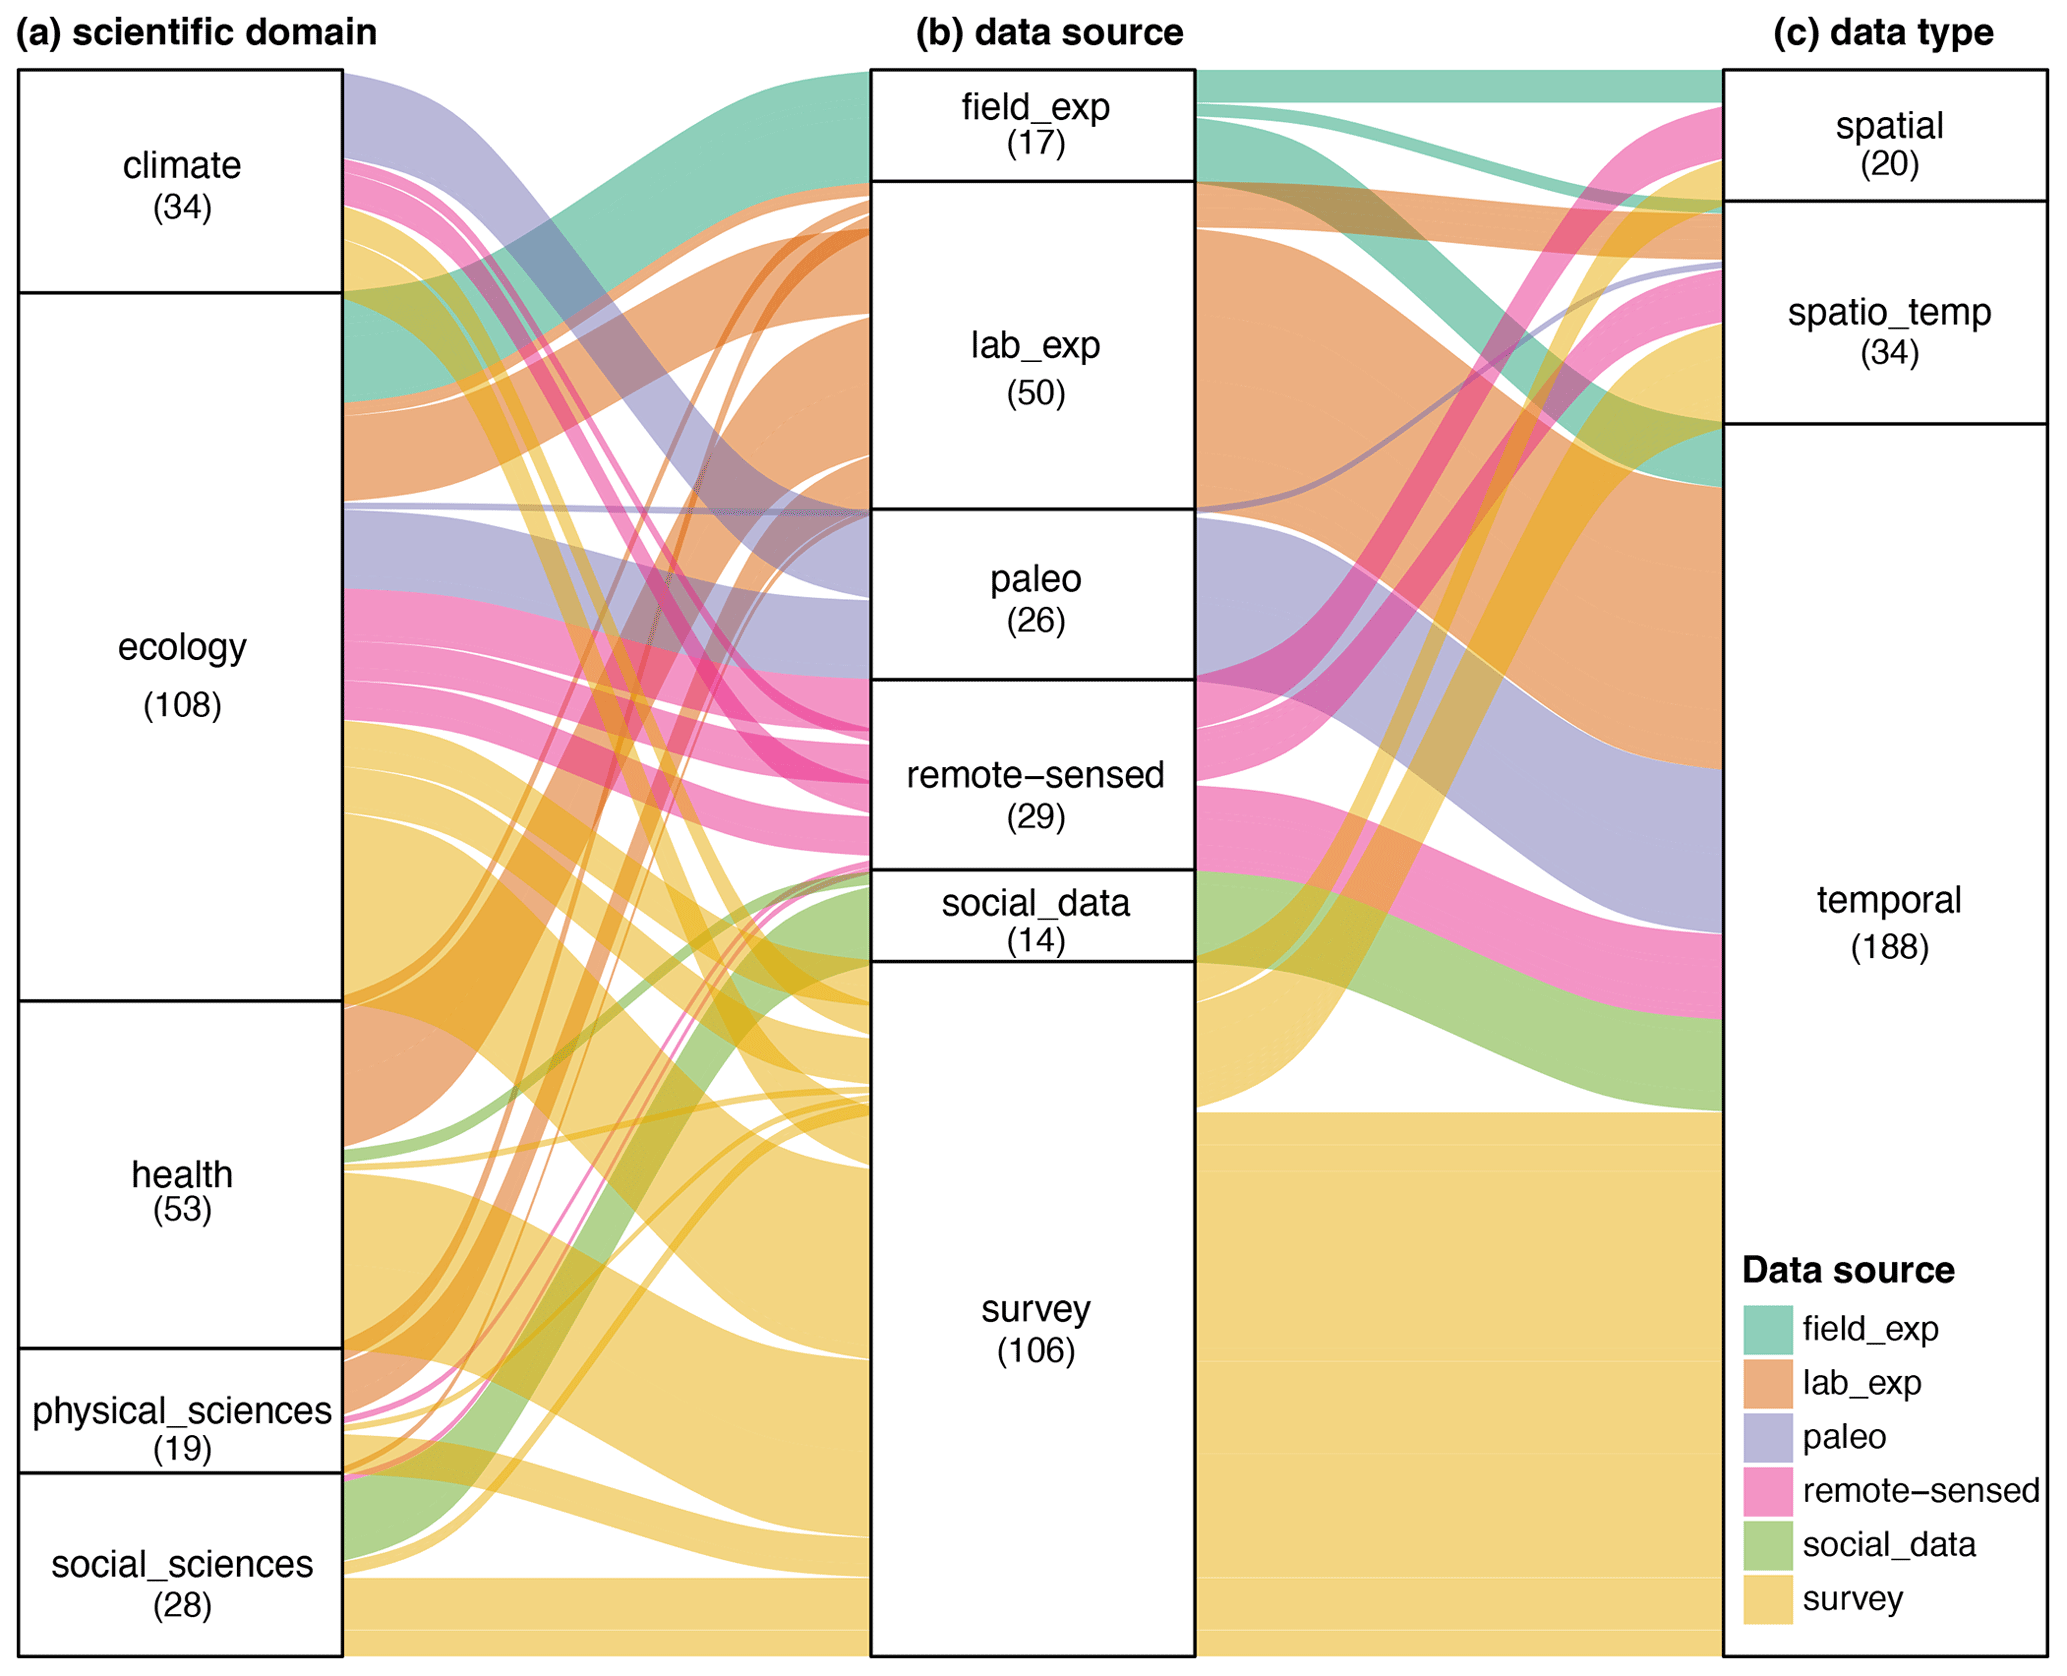
Figure 4Alluvial plot connecting scientific domains, data sources, and data types. Colours indicate the data source used for the estimation of early warnings. The size of the boxes in each column represents the proportion of each category. The figure is “read” from the middle column (b, “data source”) to either the right (c, “data type”) or the left (a, “scientific domain”). The thickness of the lines is proportional to the studies of a given data source that belong to a certain domain (from the “data source” column, b, to the “domain” column, a) or is proportional to the specific data type used (from the “data source” column, b, to the “data type” column, c). For example, for the “data source” field experiment (light green), all studies using field experiments belong to the “ecology” domain, while field experiments are split into three types of data (spatial, spatiotemporal, and temporal). field_exp: field experiment; lab_exp: lab experiment; palaeo: palaeo-reconstructed data; remote-sensed: data through remote sensing; social_data: financial data and from social media; survey: data from surveys (field, lab, social).
3.2 Multiple sources of data used
Across scientific domains, the vast majority of early warnings were analysed on temporal data (77.7 %), while the spatial data were used in only 8 % of all studies (Fig. 4) only pertaining to ecology (Fig. S2). Survey data made up the majority of the data sources (43.8 %; including field surveys, social survey data, data from weather stations or other monitoring devices, medical data from hospitalization records to electroencephalograms (EEGs)), followed by data from lab experiments (20.7 %), remote sensing (12 %), palaeo-reconstructions (10 %), and field experiments (7 %). This partitioning can mostly be explained by our classification, meaning that we have grouped together a heterogeneity of data sources (e.g. field surveys, historical climate data, social study surveys, hospitalization records; Sect. S1). However, it also reflects the availability of each data source (e.g. most survey and palaeo data were readily available and reanalysed in the context of tipping points) or the difficulty in their acquisition (e.g. field experiments are harder to execute compared to lab experiments). Looking at how data sources are used across domains, ecology is the only domain where all kinds of data sources have been used. What is also interesting to note is that two sources of data are increasingly used: survey data and remote-sensed data (Fig. S3). Specifically, the latter were the latest to be used (2011) but show a consistent rising pattern over the last years, mainly due to the fact that satellite products span a long enough time period by now (∼ 20 years) to allow the estimation of early warnings.
A closer look at studies using remote-sensed products reveals a focus on the analysis of temporal early warning in land environments, mainly forests (e.g Boulton et al., 2022; Majumder et al., 2019; Saatchi et al., 2021) and drylands (e.g Veldhuis et al., 2022; Uden et al., 2019; Wu et al., 2023), but this also extends to the cryosphere, focusing on the analysis of the Arctic and the Antarctic ice sheets (AlMomani and Bollt, 2021; Carstensen and Weydmann, 2012). The spatial resolution of remote-sensed data has also been exploited for the identification of spatial early warning, especially regarding desertification (Berdugo et al., 2017) and vegetation analyses (Majumder et al., 2019). Overall, we found that the use of remote sensing products offers two distinct yet complementary approaches to detect early warning: high-level products, which correspond to physical variables, for instance sea surface temperature (SST) (Wu et al., 2015), or different types of indices like the normalized difference vegetation index (NDVI) (Liu et al., 2019) and low-level products or direct sensor observables.
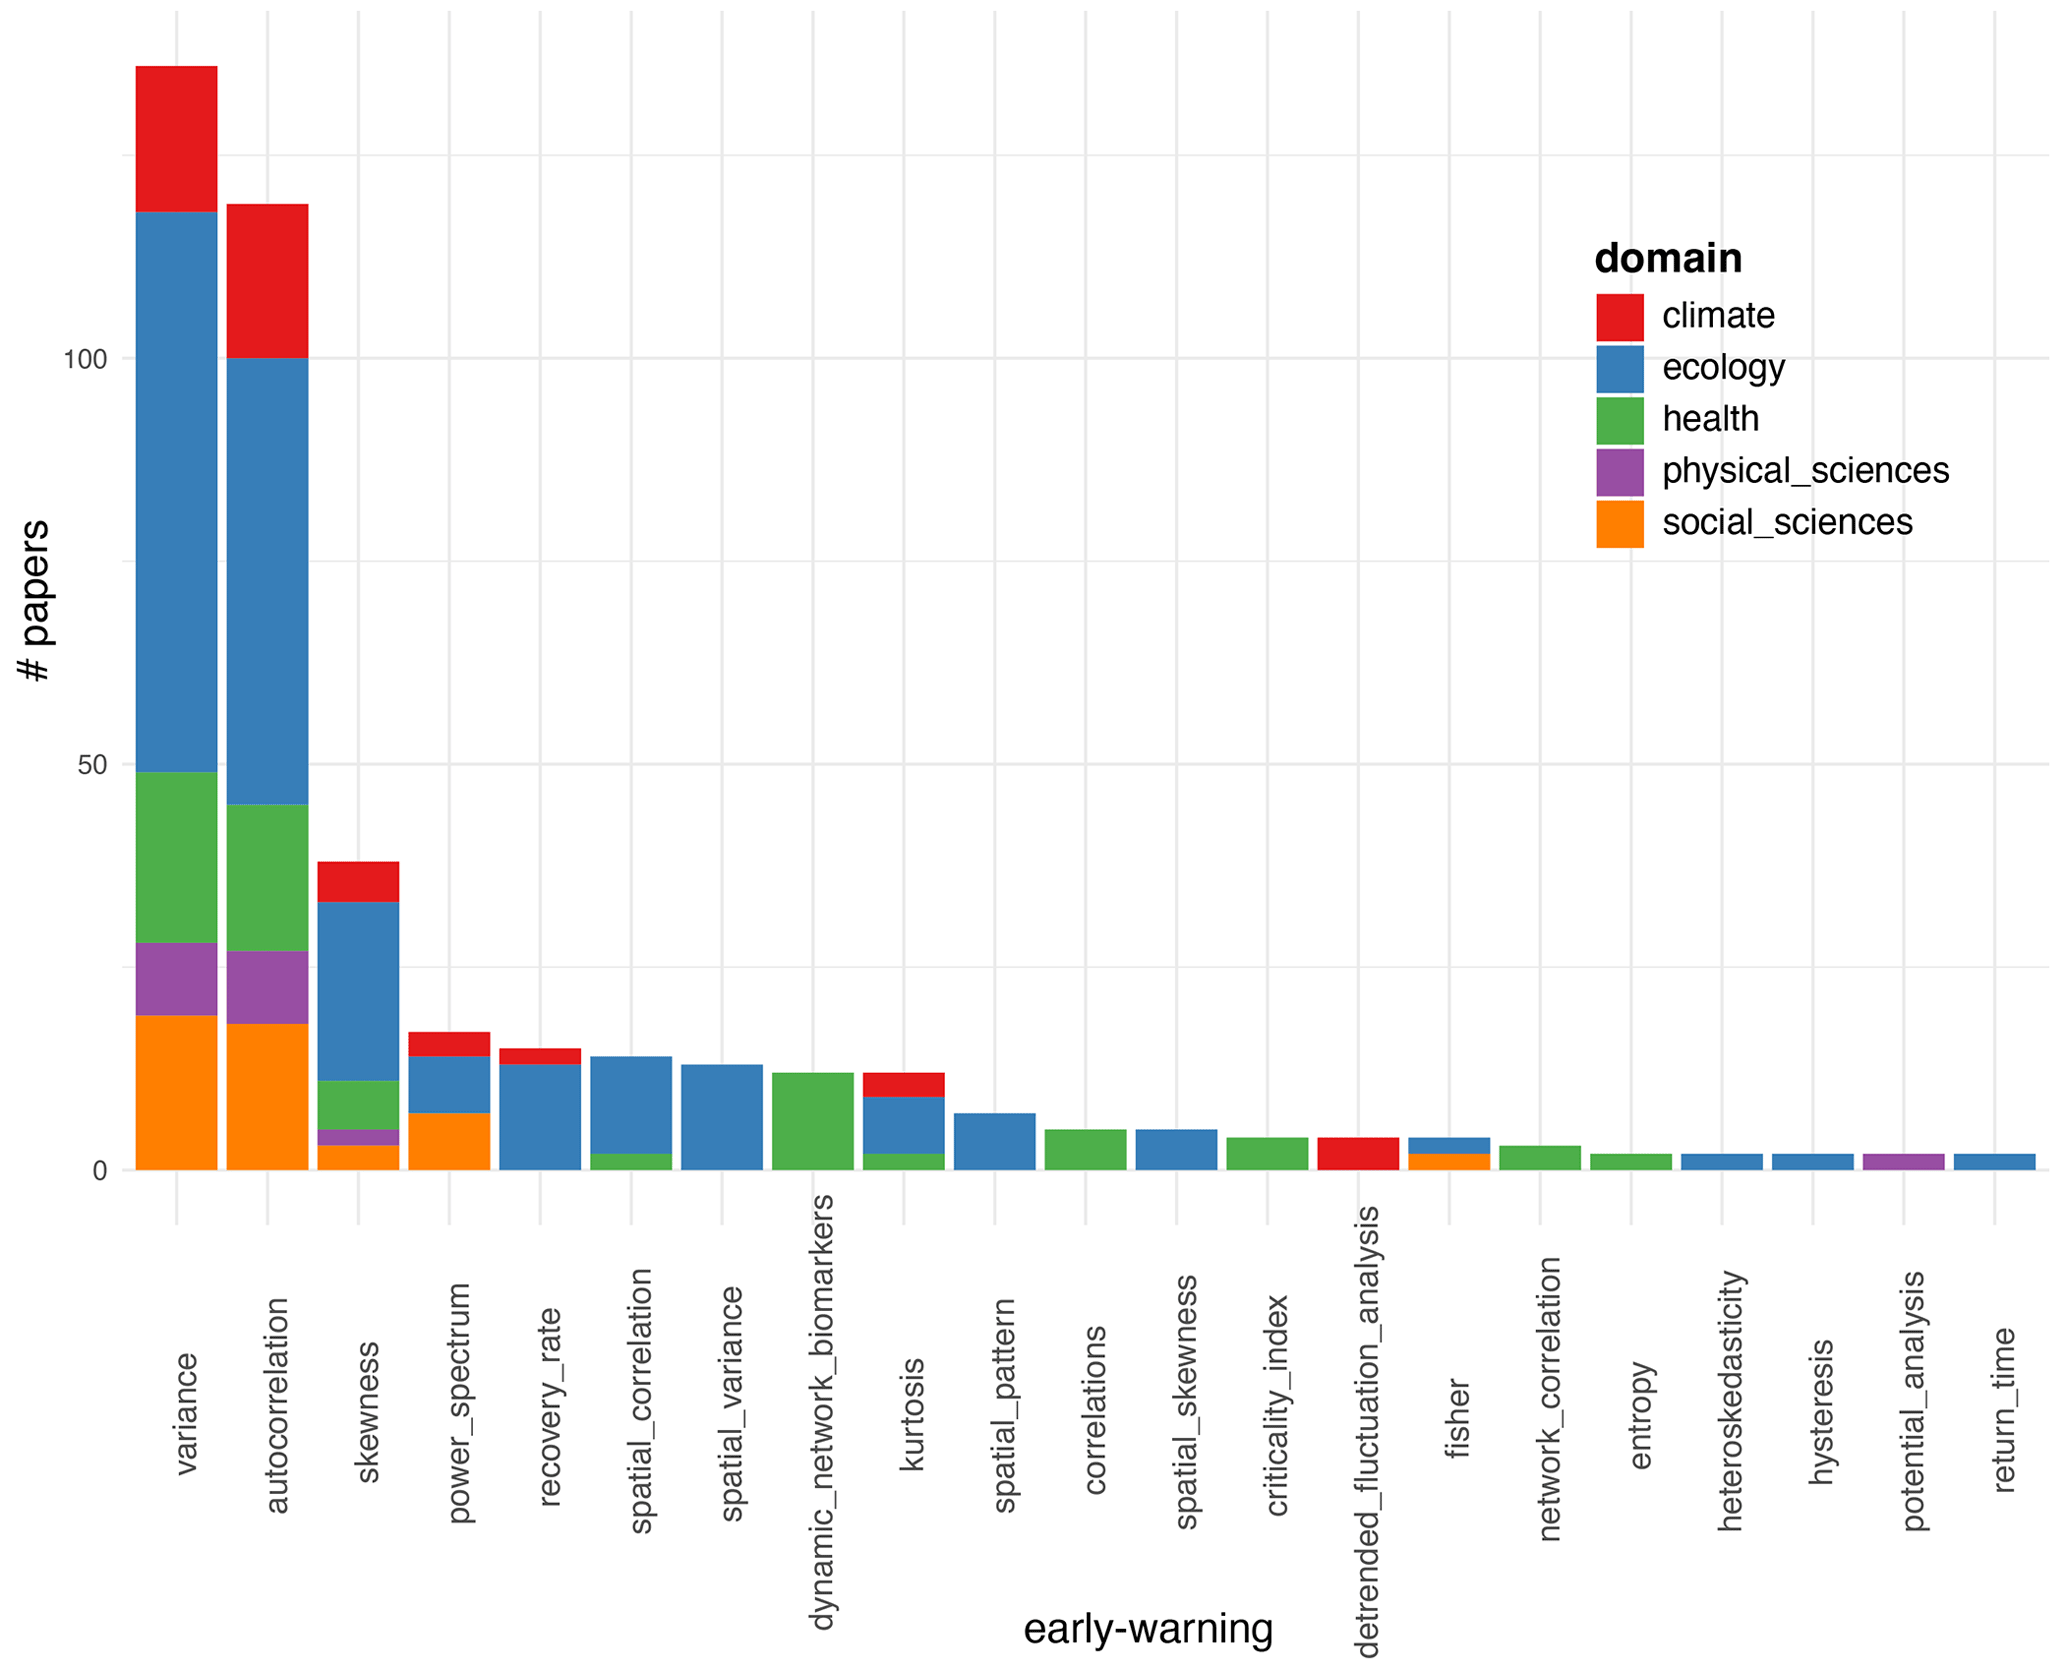
Figure 5Number of papers of the 21 early warnings used more than once in our literature review. Each bar is partitioned into the five scientific domains.
3.3 A growing list of early warnings
We recorded 65 different early warnings after reclassifying some into the same group (for example, variance, coefficient of variation, and standard deviation were reclassified as “variance”; Sect. S1). As expected, the majority were CSD-based warnings (74.9 %), while 25.1 % were non-CSD-based ones. Out of the 65 reclassified early warnings, only 21 were used more than once (the remaining 44 early warnings were used only once; Figs. 5, S5). Variance and autocorrelation were the dominantly used early warnings across all domains, followed by skewness (Fig. 5). Besides these 3 early warnings, the remaining 18 were used selectively within particular domains. The most striking are “spatial variance” (only used in ecological studies) and “dynamic network biomarkers” (only used in health studies; see also Sect. 3.1). Within domains (Fig. S4), ecology is the domain with the highest heterogeneity in the early warnings (18 out of the 21 used more than once), followed by health (10) and climate (7).
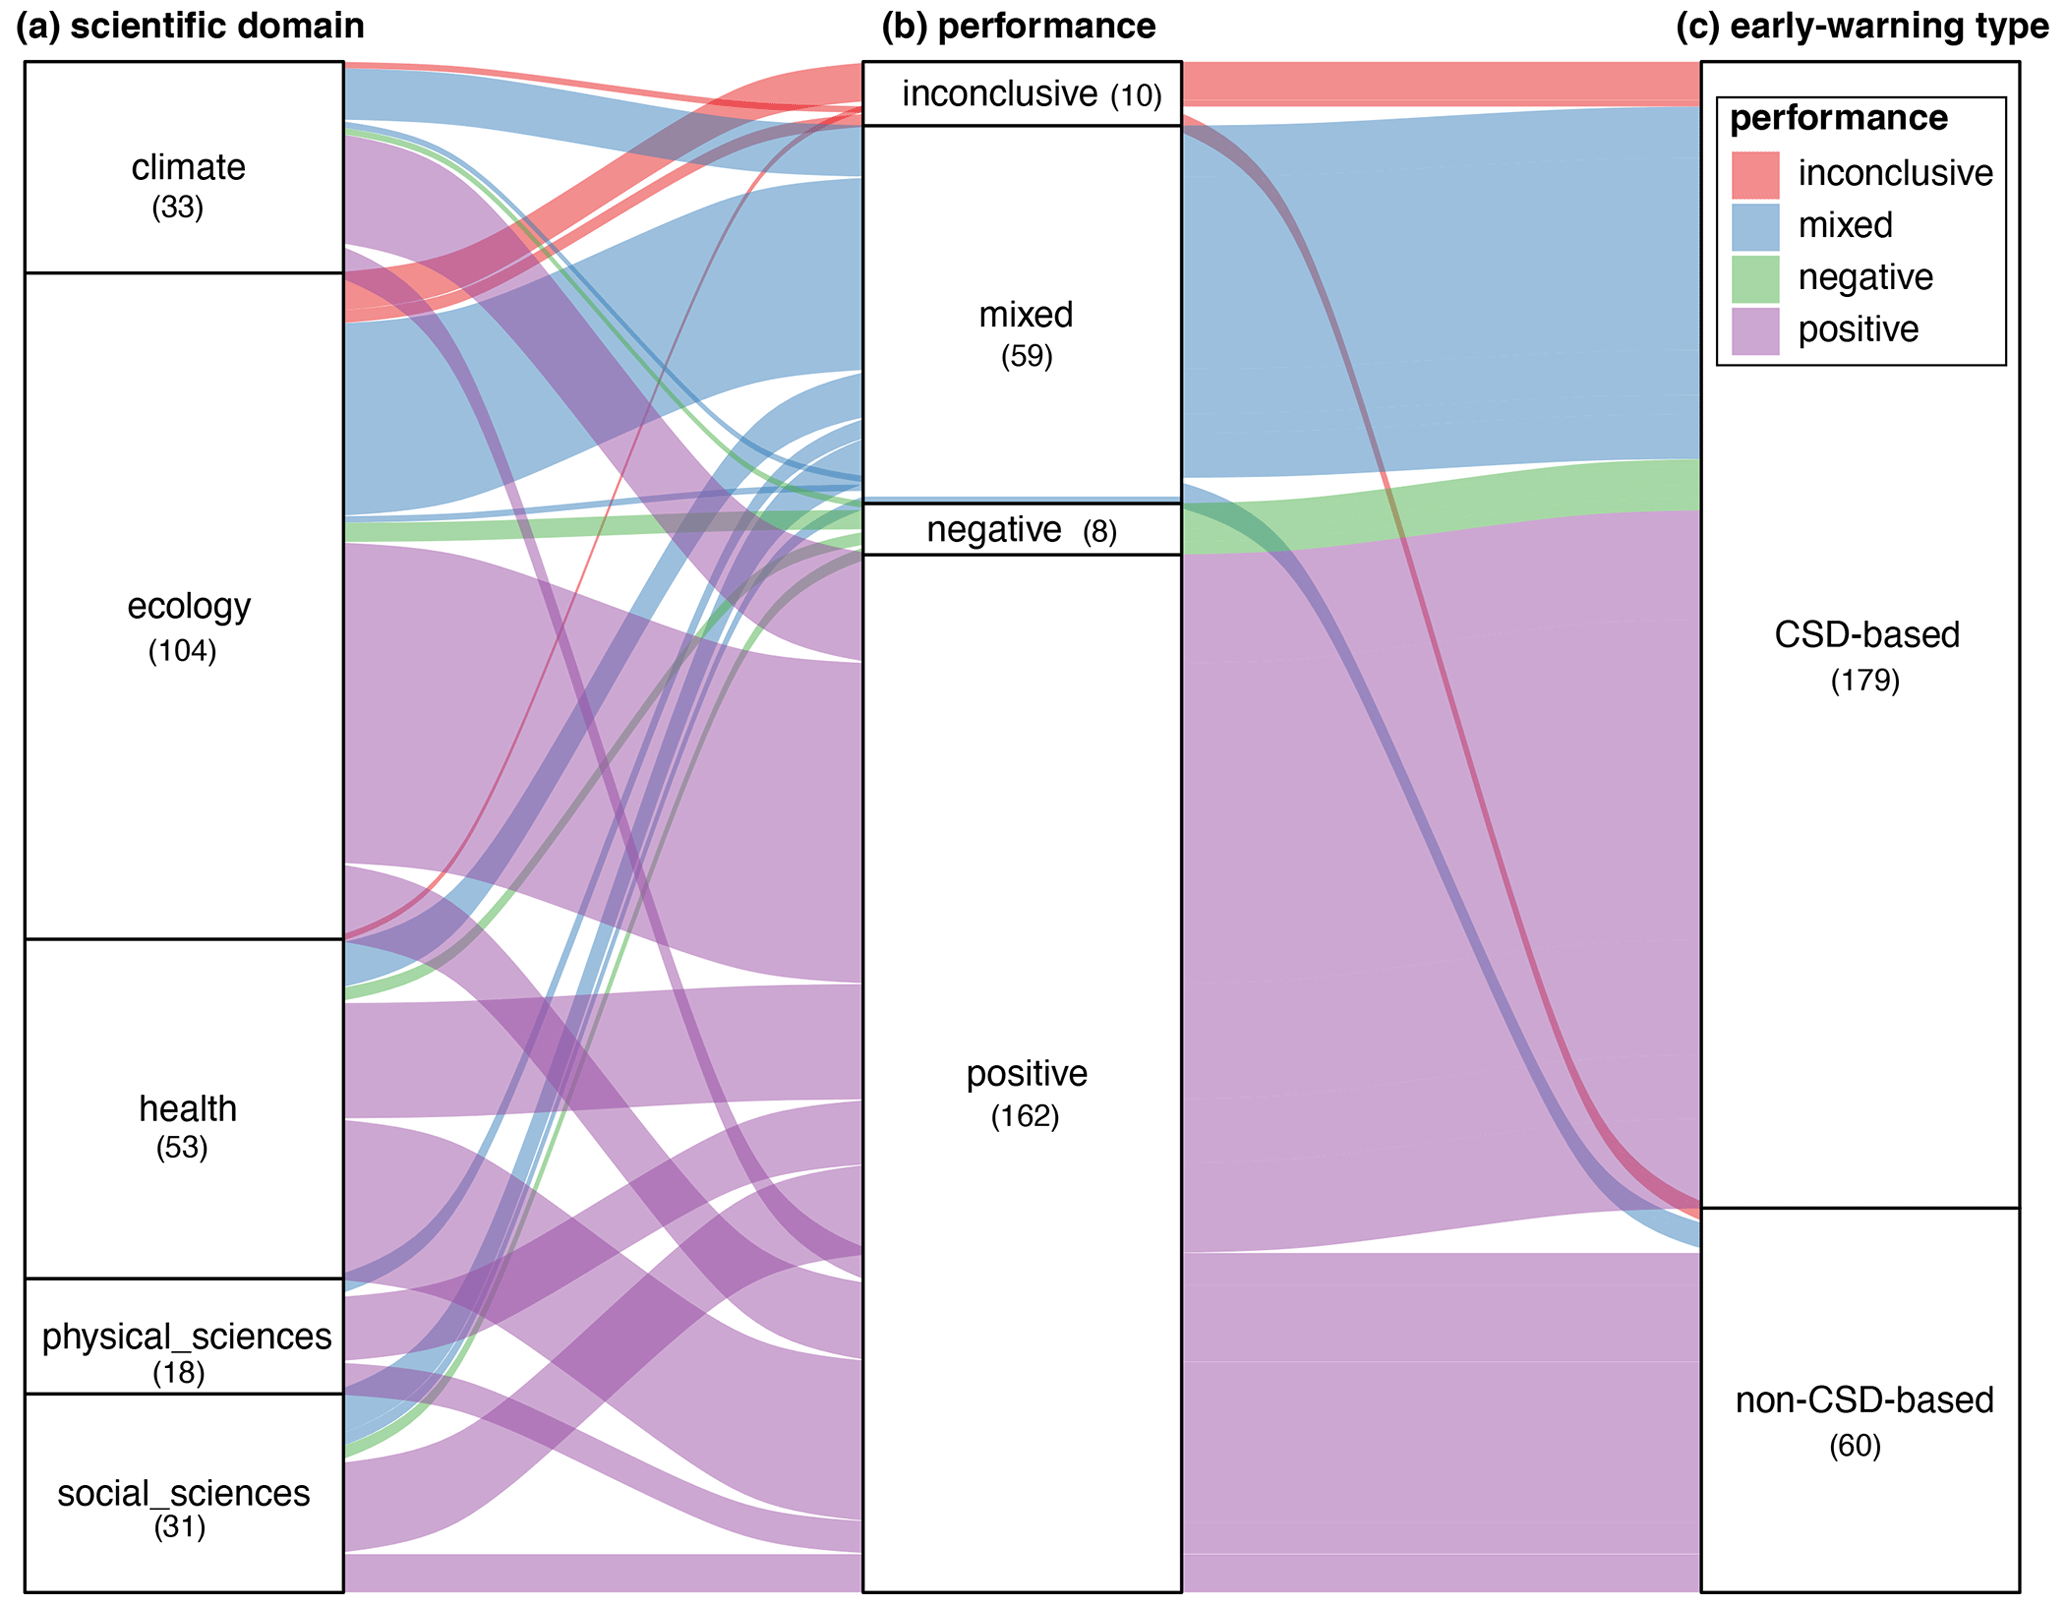
Figure 6Alluvial plot connecting scientific domains, the performance of the early warnings, and the type of early warning (CSD-based vs non-CSD-based). Colours indicate the performance. The size of the boxes in each column represents the proportion of each category. The figure is “read” from the middle column (“performance”, b) to either the right (“early warning type”, c) or the left (“scientific domain”, a). The thickness of the lines is proportional to the performance that belongs to a certain domain (from the “performance” column, b, to the “domain” column, a) or is proportional to the type of early warning (from the “performance” column, b, to the “early warning type” column, c). For example, for the “performance” mixed (blue), studies with mixed performance were done with both CSD-based and non-CSD-based warnings (“early warning type” column, c), while the CSD-based mixed were found in all domains and the non-CSD-based were split among climate, ecology, and social sciences (“scientific domain” column, a). “Positive” performance indicates there was a warning identified, “negative” indicates no warning was identified, and “mixed” indicates positive and negative performances when tested in multiple datasets or when testing more than one early warning in the same dataset. For “inconclusive”, the results could indicate neither a positive nor a negative warning.
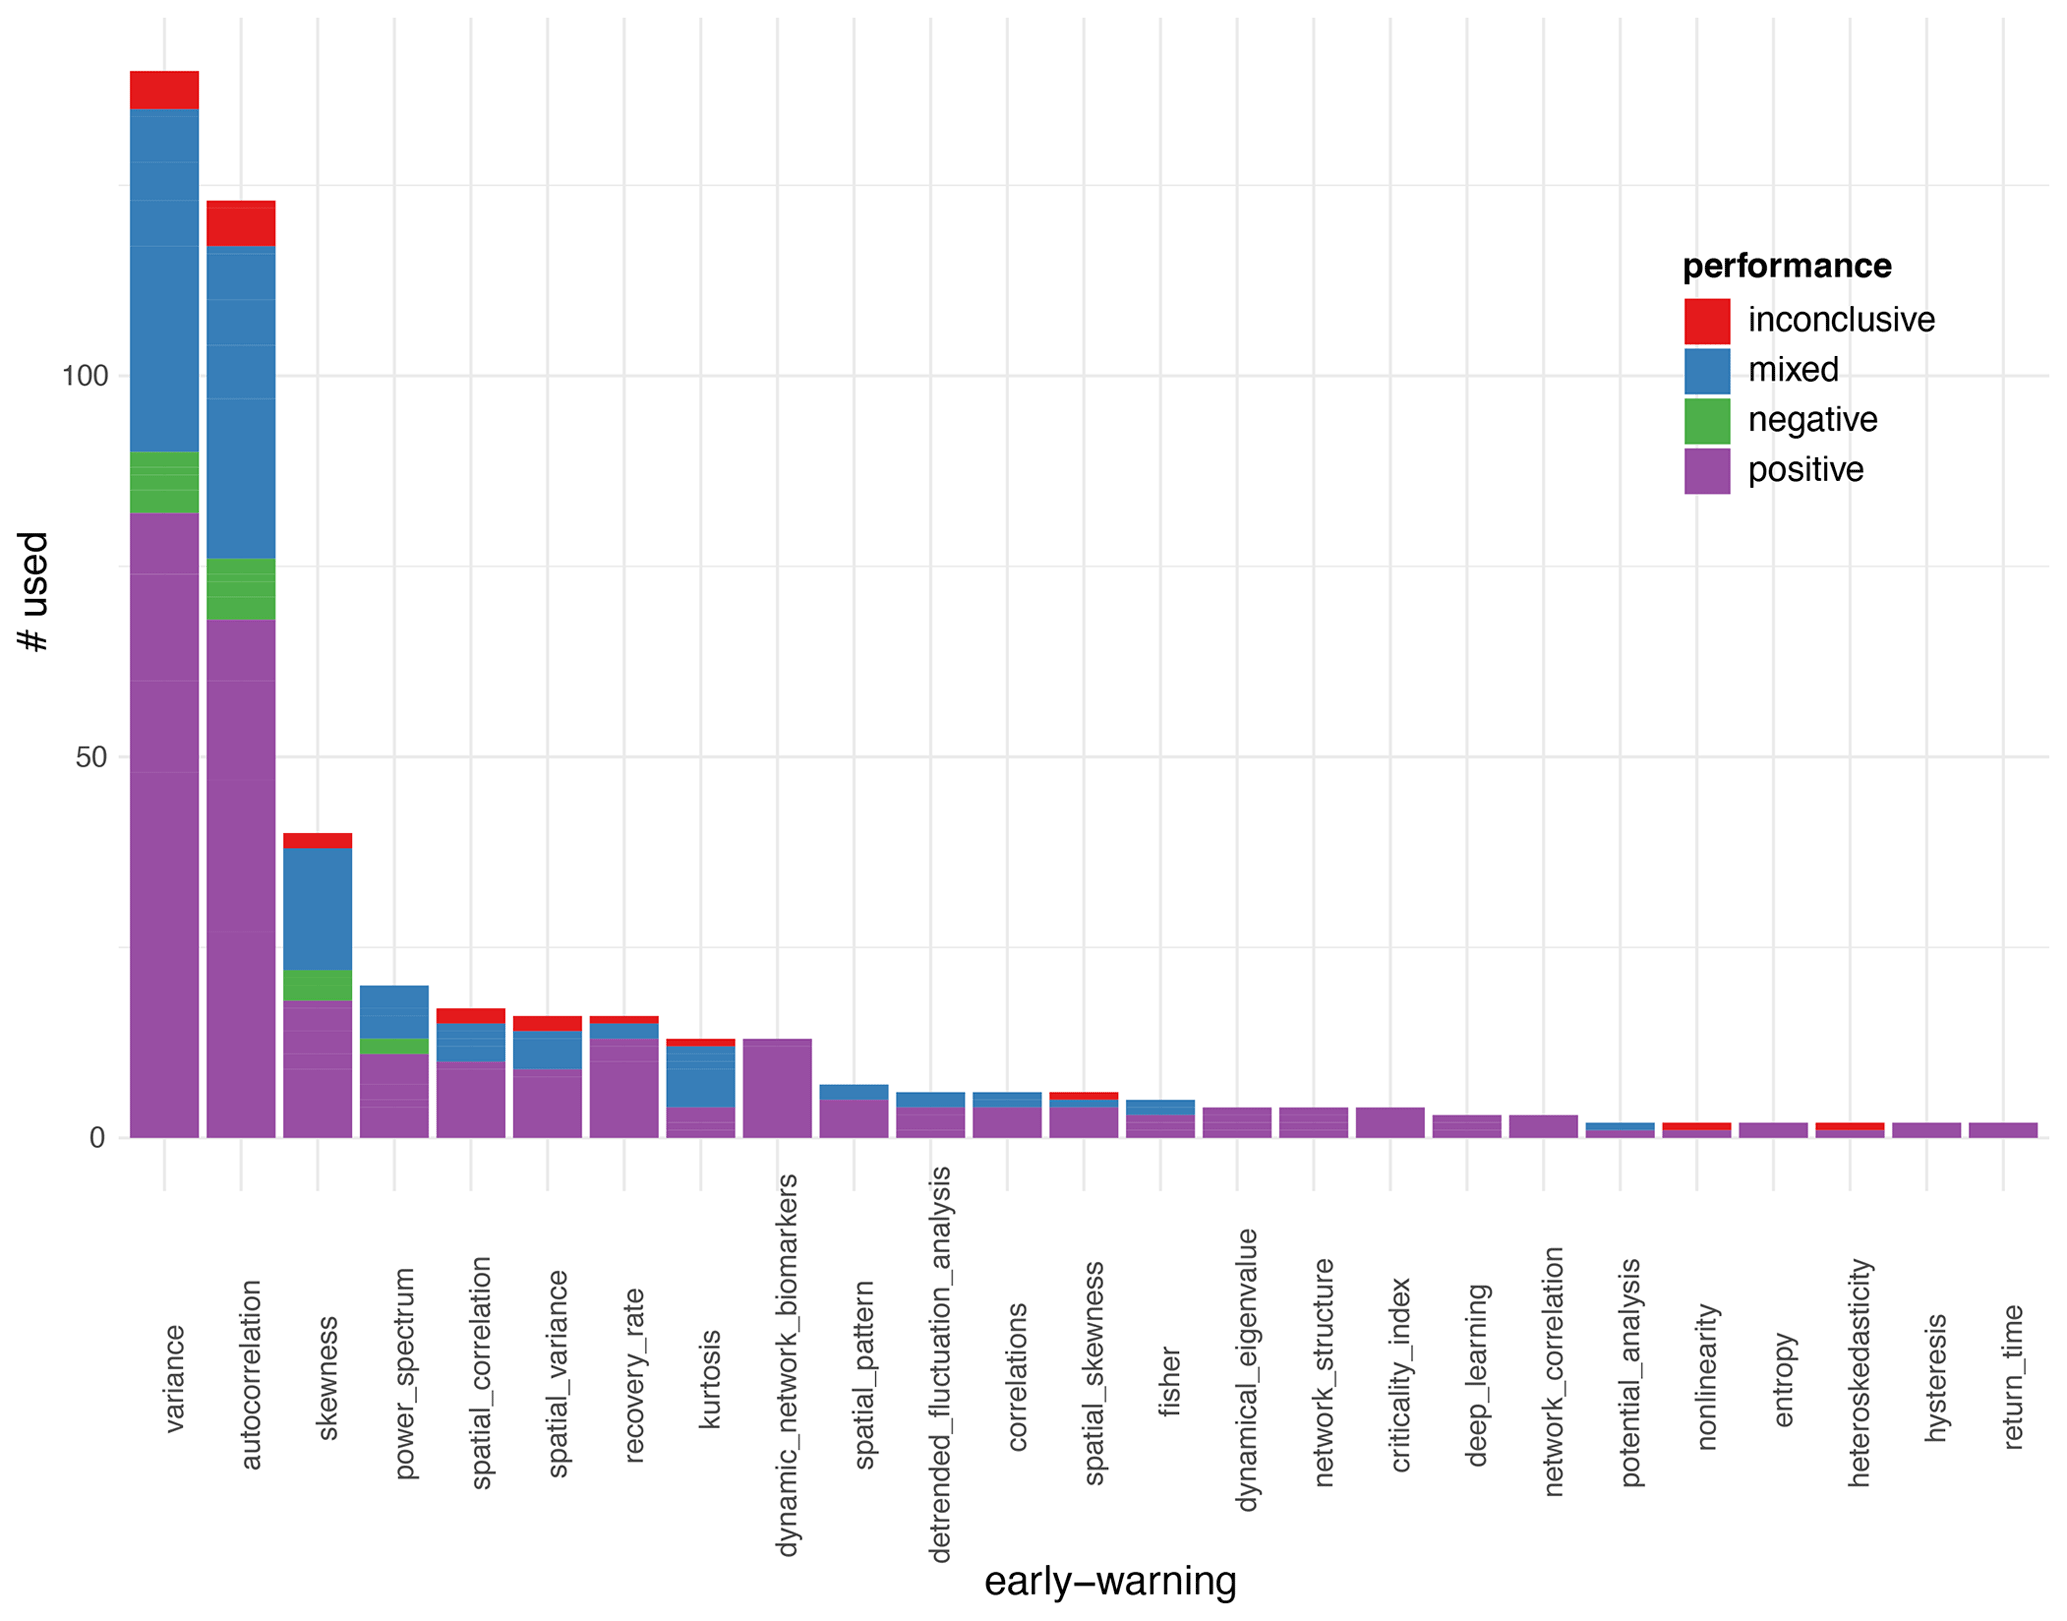
Figure 7Early warnings (used > 1) and their performance. “Positive” performance indicates there was a warning identified, “negative” indicates no warning was identified, and “mixed” indicates positive and negative performances when tested in multiple datasets or when testing more than one early warning in the same dataset. For “inconclusive”, the results could indicate neither a positive nor a negative warning.
3.4 A positively skewed performance of early warnings
Of all studies, 67.8 % reported a positive performance of all 65 reclassified early warnings across all domains (Fig. 6). Only 3.4 % of the studies reported negative performances (i.e. no expected warning or opposite to expected warning). Studies in ecology reported the most negative results, followed by climate and health, with none reported for physical or social sciences. The performance in the rest of the studies was either mixed (i.e. positive or negative in studies which analysed multiple early warnings or datasets; 24.7 %) or inconclusive (i.e. a statistically weak result; 4.8 %). This is an impressively positively skewed result potentially reflecting the known bias in publishing significant results (Fanelli, 2012) or in post hoc analysis where a tipping point has already been documented and early warnings have been applied in hindsight (Boettiger and Hastings, 2012a). Interestingly, all the negative results included CSD-based warnings, while for non-CSD warnings only a small fraction reported inconclusive or mixed results (Fig. 6). This difference could be attributed to the fact that non-CSD warnings are at times idiosyncratically developed for the specific system under study compared to the more generic CSD-based warnings. Indeed, focusing on the 21 early warnings that were used more than once (Sect. 3.3), such system-specific indicators (such as the “dynamical_network_biomarkers”) always had a positive result (Fig. 7). Overall, the least-used warnings were associated with a positive performance, whereas the most-used ones (like variance, autocorrelation, skewness, and power spectrum) showed all types of performance. There was no early warning that had predominantly negative or mixed results except for kurtosis (Fig. 7). There was no particular difference in the performance across domains of the early warnings used more than once (Fig. S5).
The idea of early warnings based on CSD is relatively old. In the book Catastrophe Theory for Scientists and Engineers (1981), Gilmore already talked about “catastrophe flags” for indicators of CSD (Gilmore, 1981). After an early ecological paper (Wissel, 1984), the topic generated an enormous amount of interest, mainly theoretical, 20 years later, with the first empirical tests being on past climate tipping points (Dakos et al., 2008; Livina and Lenton, 2007). Our review of the literature of the last 2 decades shows how the use of these indicators has since spread to many other disciplines. Indeed, the generality of the approach – the fact that CSD can be observed in many dynamical systems, independent of the details of the underlying dynamical equations – created an opportunity for testing their validity on many systems and explains the enthusiasm they generated and the diversification of applications which followed.
4.1 Early warning applications: a success story?
Our literature overview suggests that the 65 early warning signals identified successfully detected a tipping point almost 70 % of the times they were used. This is an impressively positive result which should nonetheless be treated with caution. Firstly, in many cases, the empirical studies were conducted on systems that are either relatively simple or under controlled lab conditions, making them mostly proof-of-principle demonstrations (Dai et al., 2012; Veraart et al., 2012). Secondly, most empirical studies were restricted to hindsight application, meaning that an a priori knowledge of a tipping point may introduce bias towards detecting CSD indicators (Boettiger and Hastings, 2012a; Spears et al., 2017). Thirdly, the documented publication bias against negative or insignificant results (Fanelli, 2012; Franco et al., 2014) probably applies in the case of the early warning research given the attention this specific topic has attracted in recent years. One important aspect that we have not considered in the comparative analysis of the reviewed literature is the fact that each paper uses different statistical methods, different hypothesis-testing approaches (like surrogate data and Bayesian and frequentist p-values), and different significance levels to conclude on the identification of an early warning or not. To what extent such differences may even induce p-hacking is unclear, but it needs to be acknowledged in future work.
However, these considerations do not reduce the value and prospect of early warning research. For instance, one of their biggest values lies in the possible detection of an approaching tipping point. A number of studies have demonstrated the potential proximity of tipping points in modern climate data using early warnings (Boers, 2021; Boulton and Lenton, 2015; Ditlevsen and Ditlevsen, 2023). It has also become increasingly clear that early warnings can be very useful for comparing the resilience of similar ecosystems across space (e.g. (Forzieri et al., 2022; Lenton et al., 2022; Verbesselt et al., 2016) to provide an approximate estimate of resilience that can help prioritize management. In this way, with “resilience maps”, rather than speculating about the proximity to a potential threshold, we can rank situations at a given moment and place.
4.2 Challenges
There are a number of conceptual, operational, and methodological challenges that can blur the detection of early warnings on real data (Dakos et al., 2015). For these reasons, some studies have highlighted their failure at detecting early warnings on data (Burthe et al., 2016), while others have raised caution about their uninformed use without knowing more about the system's drivers and underlying mechanisms (Boettiger et al., 2013). Our review can be used as a starting point in trying to understand when and why early warnings can fail or not by looking at how they have been applied within the domains we have identified, as their performance seems to be idiosyncratic to the data type and case study used. In what follows, we discuss more generally some of the most important challenges related to the use of early warnings.
4.2.1 Fast changes, slow responses, stochasticity, multiple drivers, and limited data challenge early warning performance
The detection of early warnings relies on the assumption that the system is approaching a transition gradually. A system should be externally forced on a slow timescale towards the tipping point while experiencing perturbations on a shorter timescale such that CSD-based early warning signals can be estimated. In theory, it is generally assumed that the short-term noise is independent and identically distributed with a mean of zero. This is unlikely to be the case with climate systems experiencing extreme weather events, for example, which are likely becoming more prevalent with the changing climate. There have been three “1-in-100-year” droughts in the Amazon rainforest since 2005 (Erfanian et al., 2017; Lewis et al., 2011) which clearly alter the signals observed. For cases like these, it is worth measuring early warnings on the drivers themselves. If these show early warnings, then it is likely that signals observed in the system itself are being driven by changes in forcing rather than by a gradual movement towards tipping. However, early warnings of the drivers as a false-positive check make sense only in the case where the drivers are independent from the system variable. For instance, in the case of the Amazon, early warnings of rainfall can be seen as indicators of the Amazon tipping itself because of the strong moisture recycling feedback present rather than an external factor inducing early warnings on Amazon vegetation dynamics.
Things get even more complicated when more than one driver is acting on the system. In most cases, the assumption is that there is a single driver with a monotonic directional change towards the tipping point or that there are multiple drivers which all have the same effect and directionality. However, it has been shown experimentally that, in the presence of multiple drivers, contradictory early warnings may arise even if both drivers would produce similar patterns in early warnings acting in isolation (Dai et al., 2015).
When monitoring a system, longer time series are desirable to detect the upcoming tipping point. For instance, the best-case studies found in this literature review from remote-sensed products, which have been available since ∼ 1972, have approximately 50-year-long time series. However, due to sensor degradation and upgrades, it can be challenging to get a long time series from a single sensor, and products are often created from combined data sources. This can interfere with most of the early warnings if this merging changes the signal-to-noise ratio (SNR) across time (Smith et al., 2023). For example, newer sensors will measure with a greater radiometric accuracy, increasing the SNR and in turn “erroneously” increasing the AR(1) as far as an early warning is concerned. This increase in SNR will also decrease variance, thus allowing the user to check for anticorrelation between AR(1) and variance to see if the early warnings are being influenced or not.
As well as questions around data availability and noise behaviour, the inherent timescale of the system being studied can hinder our ability to detect tipping points. While tipping is by definition a “fast” process, for slow-moving systems like the thermohaline circulation (AMOC), this tipping event occurs over decades; therefore, it could be difficult to detect that the tipping point has been passed using early warnings. Another example of this is the Amazon rainforest, where, at least in modelled vegetation, there is a slow response of the forest based on the climate change that it has been subjected to (Jones et al., 2009). It could take decades for dieback to occur even under a constant climate such that a tipping point could be passed long before it is actually realized (Hughes et al., 2013). This “committed response” has been explored in a number of GCM experiments (Boulton et al., 2017; Jones et al., 2009), but it is unclear how early warnings would be affected by this (van Der Bolt et al., 2021).
4.2.2 Non-specificity of early warnings
The generic and universal character of most (but in particular CSD-based) early warnings comes at a price of these warnings not being specific to abrupt and irreversible tipping points. Instead they can also be used to detect smooth and reversible transitions (Kéfi et al., 2013). This limitation suggests that we need additional indicators, in particular system-specific indicators (Boettiger et al., 2013). In the case of spatially structured ecosystems such as drylands, studies have shown that temporal early warnings could fail (Dakos et al., 2011), in which case the use of the changes in the patterns themselves could provide a good alternative (Kéfi et al., 2007; Rietkerk et al., 2004). In the same way, specific indicators have been developed in health sciences for the monitoring of disease emergence (Table S3).
System-specific early warnings may also be a better prospect, where understanding processes in the system can help us to monitor its resilience in novel ways (Boulton et al., 2013). However, the original idea behind the development of early warnings was based on the premise that this knowledge is missing or insufficient; thus a pattern-based approach could be more informative (Scheffer et al., 2009). Therefore, the challenge is to strike the right level of system-specific warnings and to combine them with the generic ones. For instance, trait-based (Clements and Ozgul, 2016) and function-based (Hu et al., 2022) warnings have been recently suggested as complementary to the existing generic warning signals. A first step towards that direction could be to map the 65 classified early warnings we reviewed on a gradient of generic to system-specific indicators.
4.2.3 Multivariate (high-dimensional) systems
Most early warnings are well-tailored for unidimensional systems, meaning systems described by a single observable (e.g. vegetation cover). However, real dynamical systems are typically high-dimensional, and the quantification of early warnings in those multivariate systems presents challenges. For instance, two different variables may give conflicting information or obscure a clear signal (Boerlijst et al., 2013; Weinans et al., 2021). In theory, one expects that the variables directly involved in the interactions to cause a tipping point are the best to monitor (Carpenter et al., 2014). However, it is challenging to know from which variable(s) to measure early warnings in a multivariate system (Dakos, 2018).
Two main approaches in the analysis of multivariate systems have recently been developed. One relies on conceiving the system as a network, where the nodes are the variables and whose dynamics are followed through time, and evaluating changes in the structure of the network. For instance, as the system moves towards a tipping point, changes in degree distributions of such a network are representative for an approaching tipping point (Lu et al., 2021). Recent research explores a complementary approach where causal links are calculated instead of correlation links and where the strength of the causal link works as the indicator of resilience (Nowack et al., 2020).
Alternatively, dimension-reduction techniques can capture overall network dynamics into a representative statistic. For instance, principal component analysis (PCA; often referred to as empirical orthogonal function (EOF) in climate science) can be used to get directions of change (Held and Kleinen, 2004; Weinans et al., 2019). Data can be projected onto the leading principal component, effectively yielding a univariate time series on which the univariate early warning can be applied (Bathiany et al., 2013; Boulton and Lenton, 2015; Held and Kleinen, 2004). This analysis does not make any a priori assumptions about the interactions between the different network nodes and is therefore quite flexible in its use. However, it requires large amounts of high-quality data to yield accurate results. The underlying assumption is that, as the system approaches the tipping point, the dynamics become more correlated, leading to a high explained variance of a PCA and clear directionality in the dynamics (Lever et al., 2020).
4.2.4 Tipping cascades
A more peculiar challenge in the application of early warnings is their ability to detect cascading tipping points, where a tipping point in one system has a knock-on effect on another system, causing that to also tip (Klose et al., 2020; van de Leemput et al., 2018; Saade et al., 2023). Unless these systems are linked in such a way that early warnings can be observed in both systems, the cascade is likely to present as a shock to the second system such that it would be unpredictable whilst monitoring it in isolation (Bathiany et al., 2013). For systems where tipping in one system causes the connected system partially towards a tipping point (known as a “two-phase transition”), a stepwise jump in early warnings in the second system can be detected. For coupled systems where the tipping in the second system happens instantaneously (a “joint cascade”) or soon after the tipping in the first system (a “domino cascade”), early warnings are unlikely to be detectable (Klose et al., 2021).
4.3 Opportunities
These challenges associated with the use of early warnings are also accompanied by a number of opportunities to improve their detection in real data. Below we outline a few of the most promising ones.
4.3.1 Composite metrics
Although there exists a multitude of early warnings (CSD-based and non-CSD-based; generic and system-specific; and on spatial, structural, and temporal data), few studies have compared in a systematic way how these warnings behave one against the other or across different systems (Dakos et al., 2011; Veldhuis et al., 2022). Apart from the CSD-based warnings where their relationships are mathematically known (Kuehn, 2012), we simply do not know what similar information early warnings provide. Understanding the interrelationships between all types of the early warnings most used will be crucial to improve their use for detecting tipping points. Composite metrics – where multiple early warnings are combined (Drake and Griffen, 2010), abundance-based with trait-based warnings are compared (Clements and Ozgul, 2016), or machine learning has been used to train models of multiple warnings as predictors (Brett and Rohani, 2020) – have been suggested to improve the significance and detectability of approaching tipping points. Given the increasing capacity to monitor the multivariate aspects of most systems (discussed in Sect. 4.2.3) and the increasing availability of such data (see Sect. 4.3.2), we are not far from estimating multiple early warnings on multiple dimensions of a system. The next step is to develop meaningful ways to best combine them for detecting tipping points.
4.3.2 Increasing data availability: open databases and remote-sensed data
Over the last decade, data from long-term databases and remote sensing have grown to become the primary sources for capturing temporal and spatial early warnings for tipping points. Especially for remote sensing data, this coincides with the expansion of freely available Earth observation datasets combined with access to cloud-based systems which provide the computational power to process this increase in data (Gorelick et al., 2017). A primary focus has been on the temporal analysis of optical imagery from satellites such as the Moderate Resolution Imaging Spectroradiometer (MODIS) (Liu et al., 2019; Majumder et al., 2019) or from the AVHRR (Lenton et al., 2022). Additionally, the vegetation optical depth (VOD) derived from microwave passive radiometers (Moesinger et al., 2020) has been employed to analyse early warnings, with temporal records since the late 1970s (Boulton et al., 2022; Smith et al., 2023). Overall, the continued growth of remotely sensed datasets is likely to drive further temporal early warning research, while the emergence of new satellite sensors with enhanced spatial resolutions (in the order of metres) will also enable an improved analysis of spatial early warning at large scales. However, such development requires a profound understanding of the acquisition systems to effectively control and account for parameters that may impact the extraction of early warnings.
4.3.3 New approaches: machine learning
The success of neural networks for time series classification problems has inspired the development of machine learning (ML) techniques for early warning detection. There is a natural synergy to this approach in that the same CSD phenomena manifest across a wide range of systems approaching tipping points, so the notoriously data-intensive task of training a neural network can be accomplished using plentiful synthetic data and still produce a result which can plausibly be applied to empirical data.
Deep learning models which combine convolutional layers have been shown to outperform methods using statistical CSD-based warnings (e.g. variance, AR(1)) in a variety of both real and simulated case studies (Bury et al., 2021; Deb et al., 2022). Furthermore, these models have exhibited success in inferring the type of upcoming bifurcation from observed pre-transition dynamics and have performed well in extensions to phase transitions on spatiotemporal lattices (Dylewsky et al., 2023). Other ML techniques can also tell us something about how far systems are from tipping. For example, random forest models could be used to determine the factors that determine autocorrelation in forest areas on a global scale and thus how close to tipping these forest areas could be based on driving variables (Forzieri et al., 2022), or they can help us determine the factors the influence the occurrence of tipping points (Berdugo et al., 2022). However, one should always bear in mind that ML will be as good as their training sets. Testing these approaches on existing datasets will help understand their potential along with testing them in cases of noise- or rate-tipping. Taking into consideration their limitations (Lapeyrolerie and Boettiger, 2022), combining ML techniques with “traditional” early warnings could become promising for monitoring systems that may be approaching tipping points.
The unprecedented amount of data originating from remote sensing systems, field measurements, surveys, and simulated data, coupled with innovative models and cutting-edge computing, has made possible the development of a multitude of tools and approaches for detecting tipping points in a variety of scientific fields. Early warnings can tell us that “something” important may be about to happen, but they do not tell us what precisely that “something” may be and when exactly it will happen (Dakos et al., 2015). The next step is to test the real potential of early warnings as preventive and management tools in anticipating natural and human-induced changes to come.
Literature review data can be found in Sect. S3 in the Supplement.
The supplement related to this article is available online at: https://doi.org/10.5194/esd-15-1117-2024-supplement.
VD, CAB, JEB, and SK developed research and drafted the paper. VD led the literature review analysed by VD, CAB, JEB, JFA, DIAM, DD, CLM, BvdB, LvdL, EW, and SK. VD and SK ran the analyses. All authors commented on the final text.
The contact author has declared that none of the authors has any competing interests.
Publisher's note: Copernicus Publications remains neutral with regard to jurisdictional claims made in the text, published maps, institutional affiliations, or any other geographical representation in this paper. While Copernicus Publications makes every effort to include appropriate place names, the final responsibility lies with the authors.
This article is part of the special issue “Tipping points in the Anthropocene”. It is a result of the “Tipping Points: From Climate Crisis to Positive Transformation” international conference hosted by the Global Systems Institute (GSI) and University of Exeter (12–14 September 2022), as well as the associated creation of a Tipping Points Research Alliance by GSI and the Potsdam Institute for Climate Research, Exeter, Great Britain, 12–14 September 2022.
Chris A. Boulton, Joshua E. Buxton, and David I. Armstrong McKay were supported by the Bezos Earth Fund via the Global Tipping Points Report project. Carlos López-Martínez was supported by INTERACT project PID2020-114623RB-C32 funded by MCIN/AEI/10.13039/501100011033.
This paper was edited by Jonathan Donges and reviewed by Juan Rocha and two anonymous referees.
Abis, B. and Brovkin, V.: Alternative tree-cover states of the boreal ecosystem: A conceptual model, Global Ecol. Biogeogr., 28, 612–627, https://doi.org/10.1111/geb.12880, 2019.
Alberto, J., Stelzer, A., Padric, J., Adrian, R., and Willem, B.: Early warning signals of regime shifts for aquatic systems: Can experiments help to bridge the gap between theory and real-world application?, Ecol. Complex., 47, 100944, https://doi.org/10.1016/j.ecocom.2021.100944, 2021.
AlMomani, A. A. and Bollt, E.: An early warning sign of critical transition in the Antarctic ice sheet – a data-driven tool for a spatiotemporal tipping point, Nonlin. Processes Geophys., 28, 153–166, https://doi.org/10.5194/npg-28-153-2021, 2021.
Ashwin, P., Wieczorek, S., Vitolo, R., and Cox, P.: Tipping points in open systems: bifurcation, noise-induced and rate-dependent examples in the climate system, Philos. T. R. Soc. A, 13, 20, https://doi.org/10.1098/rsta.2011.0306, 2011.
Bathiany, S., Claussen, M., and Fraedrich, K.: Detecting hotspots of atmosphere–vegetation interaction via slowing down – Part 1: A stochastic approach, Earth Syst. Dynam., 4, 63–78, https://doi.org/10.5194/esd-4-63-2013, 2013.
Bathiany, S., van der Bolt, B., Williamson, M. S., Lenton, T. M., Scheffer, M., van Nes, E. H., and Notz, D.: Statistical indicators of Arctic sea-ice stability – prospects and limitations, The Cryosphere, 10, 1631–1645, https://doi.org/10.5194/tc-10-1631-2016, 2016.
Berdugo, M., Kéfi, S., Soliveres, S., and Maestre, F. T.: Plant spatial patterns identify alternative ecosystem multifunctionality states in global drylands, Nat. Ecol. Evol., 1, 0003, https://doi.org/10.1038/s41559-016-0003, 2017.
Berdugo, M., Gaitán, J. J., Delgado-Baquerizo, M., Crowther, T. W., and Dakos, V.: Prevalence and drivers of abrupt vegetation shifts in global drylands, P. Natl. Acad. Sci. USA, 119, 1–10, https://doi.org/10.1073/pnas.2123393119, 2022.
Bestelmeyer, B. T., A. M. Ellison, Fraser, W. R., Gorman, K. B., Holbrook, S. J., Laney, C. M., Ohman, M. D., Peters, D. P. C., Pillsbury, F. C., Rassweiler, A., Schmitt, R. J., and Sharm, S.: Analysis of abrupt transitions in ecological systems, Ecosphere, 2, 129, https://doi.org/10.1890/ES11-00216.1, 2011.
Boerlijst, M. C., Oudman, T., and de Roos, A. M.: Catastrophic Collapse Can Occur without Early Warning: Examples of Silent Catastrophes in Structured Ecological Models, PLOS ONE, 8, e62033, https://doi.org/10.1371/journal.pone.0062033, 2013.
Boers, N.: Observation-based early-warning signals for a collapse of the Atlantic Meridional Overturning Circulation, Nat. Clim. Change, 11, 680–688, https://doi.org/10.1038/s41558-021-01097-4, 2021.
Boettiger, C. and Hastings, A.: Early warning signals and the prosecutor's fallacy, P. R. Soc. B, 279, 4734–4739, https://doi.org/10.1098/rspb.2012.2085, 2012a.
Boettiger, C. and Hastings, A.: Quantifying limits to detection of early warning for critical transitions, J. R. Soc. Interface, 9, 2527–39, https://doi.org/10.1098/rsif.2012.0125, 2012b.
Boettiger, C., Ross, N., and Hastings, A.: Early warning signals: the charted and uncharted territories, Theor. Ecol., 6, 255–264, https://doi.org/10.1007/s12080-013-0192-6, 2013.
Boulton, C. A. and Lenton, T. M.: Slowing down of North Pacific climate variability and its implications for abrupt ecosystem change, P. Natl. Acad. Sci. USA, 112, 11496–11501, https://doi.org/10.1073/pnas.1501781112, 2015.
Boulton, C. a., Good, P., and Lenton, T. M.: Early warning signals of simulated Amazon rainforest dieback, Theor. Ecol., 6, 373–384, https://doi.org/10.1007/s12080-013-0191-7, 2013.
Boulton, C. A., Booth, B. B. B., and Good, P.: Exploring uncertainty of Amazon dieback in a perturbed parameter Earth system ensemble, Glob. Change Biol., 23, 5032–5044, https://doi.org/10.1111/gcb.13733, 2017.
Boulton, C. A., Lenton, T. M., and Boers, N.: Pronounced loss of Amazon rainforest resilience since the early 2000s, Nat. Clim. Change, 12, 271–278, https://doi.org/10.1038/s41558-022-01287-8, 2022.
Brett, T. S. and Rohani, P.: Dynamical footprints enable detection of disease emergence, PLOS Biol., 18, e3000697, https://doi.org/10.1371/journal.pbio.3000697, 2020.
Burthe, S. J., Henrys, P. A., Mackay, E. B., Spears, B. M., Campbell, R., Carvalho, L., Dudley, B., Gunn, I. D. M., Johns, D. G., Maberly, S. C., May, L., Newell, M. A., Wanless, S., Winfield, I. J., Thackeray, S. J., and Daunt, F.: Do early warning indicators consistently predict nonlinear change in long-term ecological data?, 53, 666–676, https://doi.org/10.1111/1365-2664.12519, 2016.
Bury, T. M.: ewstools: A Python package for early warning signals of bifurcations in time series data, J. Open Source Softw., 8, 8–11, https://doi.org/10.21105/joss.05038, 2023.
Bury, T. M., Sujith, R. I., Pavithran, I., Scheffer, M., Lenton, T. M., Anand, M., and Bauch, C. T.: Deep learning for early warning signals of regime shifts, P. Natl. Acad. Sci. USA, 450, e2106140118, https://doi.org/10.1073/pnas.2106140118, 2021.
Carpenter, S. R. and Brock, W. A.: Rising variance: a leading indicator of ecological transition, Ecol. Lett., 9, 311–318, https://doi.org/10.1111/j.1461-0248.2005.00877.x, 2006.
Carpenter, S. R., Brock, W. A., Cole, J. J., Kitchell, J. F., and Pace, M. L.: Leading indicators of trophic cascades, Ecol. Lett., 11, 128–38, https://doi.org/10.1111/j.1461-0248.2007.01131.x, 2008.
Carpenter, S. R., Brock, W. A., Cole, J. J., and Pace, M. L.: A new approach for rapid detection of nearby thresholds in ecosystem time series, Oikos, 123, 290–297, https://doi.org/10.1111/j.1600-0706.2013.00539.x, 2014.
Carstensen, J. and Weydmann, A.: Tipping Points in the Arctic: Eyeballing or Statistical Significance?, AMBIO, 41, 34–43, https://doi.org/10.1007/s13280-011-0223-8, 2012.
Cavaliere, M., Yang, G., Danos, V., and Dakos, V.: Detecting the Collapse of Cooperation in Evolving Networks, Sci. Rep.-UK, 6, 30845, https://doi.org/10.1038/srep30845, 2016.
Clements, C. F. and Ozgul, A.: Including trait-based early warning signals helps predict population collapse, Nat. Commun., 7, 1–8, https://doi.org/10.1038/ncomms10984, 2016.
Clements, C. F. and Ozgul, A.: Indicators of transitions in biological systems, Ecol. Lett., 21, 905–919, https://doi.org/10.1111/ele.12948, 2018.
Dai, L., Vorselen, D., Korolev, K. S., and Gore, J.: Generic Indicators for Loss of Resilience Before a Tipping Point Leading to Population Collapse, Science, 336, 1175–1177, https://doi.org/10.1126/science.1219805, 2012.
Dai, L., Korolev, K. S., and Gore, J.: Relation between stability and resilience determines the performance of early warning signals under different environmental drivers, P. Natl. Acad. Sci. USA, 112, 201418415, https://doi.org/10.1073/pnas.1418415112, 2015.
Dakos, V.: Identifying best-indicator species for abrupt transitions in multispecies communities, Ecol. Indic., 94, 494–502, https://doi.org/10.1016/j.ecolind.2017.10.024, 2018.
Dakos, V. and Kéfi, S.: Ecological resilience: what to measure and how, Environ. Res. Lett., 17, 043003, https://doi.org/10.1088/1748-9326/ac5767, 2022.
Dakos, V., Scheffer, M., van Nes, E. H., Brovkin, V., Petoukhov, V., and Held, H.: Slowing down as an early warning signal for abrupt climate change., P. Natl. Acad. Sci. USA, 105, 14308–12, https://doi.org/10.1073/pnas.0802430105, 2008.
Dakos, V., van Nes, E. H., Donangelo, R., Fort, H., and Scheffer, M.: Spatial correlation as leading indicator of catastrophic shifts, Theor. Ecol., 3, 163–174, https://doi.org/10.1007/s12080-009-0060-6, 2010.
Dakos, V., Kéfi, S., Rietkerk, M., van Nes, E. H., and Scheffer, M.: Slowing down in spatially patterned ecosystems at the brink of collapse, Am. Nat., 177, E153–166, https://doi.org/10.1086/659945, 2011.
Dakos, V., Carpenter, S. R., Brock, W. A., Ellison, A. M., Guttal, V., Ives, A. R., Kéfi, S., Livina, V., Seekell, D. A., van Nes, E. H., and Scheffer, M.: Methods for Detecting Early Warnings of Critical Transitions in Time Series Illustrated Using Simulated Ecological Data, PLoS ONE, 7, e41010, https://doi.org/10.1371/journal.pone.0041010, 2012.
Dakos, V., van Nes, E. H., and Scheffer, M.: Flickering as an early warning signal, Theor. Ecol., 6, 309–317, https://doi.org/10.1007/s12080-013-0186-4, 2013.
Dakos, V., Carpenter, S. R., Nes, E. H. V., and Scheffer, M.: Resilience indicators: prospects and limitations for early warnings of regime shifts, Philos. T. R. Soc. B, 370, 20130263, https://doi.org/10.1098/rstb.2013.0263, 2015.
Deb, S., Sidheekh, S., Clements, C. F., Krishnan, N. C., and Dutta, P. S.: Machine learning methods trained on simple models can predict critical transitions in complex natural systems, Roy. Soc. Open Sci., 9, 211475, https://doi.org/10.1098/rsos.211475, 2022.
Ditlevsen, P. and Ditlevsen, S.: Warning of a forthcoming collapse of the Atlantic meridional overturning circulation, Nat. Commun., 14, 4254, https://doi.org/10.1038/s41467-023-39810-w, 2023.
Drake, J. M. and Griffen, B. D.: Early warning signals of extinction in deteriorating environments, Nature, 467, 456–459, https://doi.org/10.1038/nature09389, 2010.
Drake, J. M., O'Regan, S. M., Dakos, V., Kéfi, S., Rohani, P., Drake, J. M., O'Regan, S. M., Dakos, V., Kéfi, S., and Rohani, P.: Alternative stable states, tipping points, and early warning signals of ecological transitions, in: Theoretical Ecology: Concepts and Applications, edited by: McCann, K. S. and Gellner, G., Oxford University Press, 263–284, https://doi.org/10.1093/oso/9780198824282.003.0015, 2020.
Dylewsky, D., Lenton, T. M., Scheffer, M., Bury, T. M., Fletcher, C. G., Anand, M., and Bauch, C. T.: Universal early warning signals of phase transitions in climate systems, J. R. Soc. Interface, 20, 20220562, https://doi.org/10.1098/rsif.2022.0562, 2023.
Erfanian, A., Wang, G., and Fomenko, L.: Unprecedented drought over tropical South America in 2016: significantly under-predicted by tropical SST, Sci. Rep.-UK, 7, 5811, https://doi.org/10.1038/s41598-017-05373-2, 2017.
Fanelli, D.: Negative results are disappearing from most disciplines and countries, Scientometrics, 90, 891–904, https://doi.org/10.1007/s11192-011-0494-7, 2012.
Forzieri, G., Dakos, V., McDowell, N. G., Ramdane, A., and Cescatti, A.: Emerging signals of declining forest resilience under climate change, Nature, 608, 534–539, https://doi.org/10.1038/s41586-022-04959-9, 2022.
Franco, A., Malhotra, N., and Simonovits, G.: Publication bias in the social sciences: Unlocking the file drawer, Science, 345, 1502–1505, https://doi.org/10.1126/science.1255484, 2014.
Génin, A., Majumder, S., Sankaran, S., Danet, A., Guttal, V., Schneider, F. D., and Kéfi, S.: Monitoring ecosystem degradation using spatial data and the R package spatialwarnings, Methods Ecol. Evol., 9, 2067–2075, https://doi.org/10.1111/2041-210X.13058, 2018.
Gilmore, R.: Catastrophe theory for scientists and engineers, John Wiley & Sons, ISBN 0-486-67539-4, 1981.
Gorelick, N., Hancher, M., Dixon, M., Ilyushchenko, S., Thau, D., and Moore, R.: Google Earth Engine: Planetary-scale geospatial analysis for everyone, Remote Sens. Environ., 202, 18–27, https://doi.org/10.1016/j.rse.2017.06.031, 2017.
Guttal, V. and Jayaprakash, C.: Changing skewness: an early warning signal of regime shifts in ecosystems, Ecol. Lett., 11, 450–460, https://doi.org/10.1111/j.1461-0248.2008.01160.x, 2008.
Guttal, V. and Jayaprakash, C.: Spatial variance and spatial skewness: leading indicators of regime shifts in spatial ecological systems, Theor. Ecol., 2, 3–12, https://doi.org/10.1007/s12080-008-0033-1, 2009.
Hagstrom, G. and Levin, S.: Phase Transitions and the Theory of Early Warning Indicators for Critical Transitions, arXiv [preprint], https://doi.org/10.48550/arXiv.2110.12287, 23 October 2021.
Hastings, A. and Wysham, D. B.: Regime shifts in ecological systems can occur with no warning, Ecol. Lett., 13, 464–472, https://doi.org/10.1111/j.1461-0248.2010.01439.x, 2010.
Held, H. and Kleinen, T.: Detection of climate system bifurcations by degenerate fingerprinting, Geophys. Res. Lett., 31, 1–4, https://doi.org/10.1029/2004GL020972, 2004.
Hirota, M., Holmgren, M., van Nes, E. H., and Scheffer, M.: Global resilience of tropical forest and savanna to critical transitions, Science, 334, 232–235, 2011.
Hu, Z., Dakos, V., and Rietkerk, M.: Using functional indicators to detect state changes in terrestrial ecosystems, Trends Ecol. Evol., 37, 1036–1045, https://doi.org/10.1016/j.tree.2022.07.011, 2022.
Hughes, T. P., Linares, C., Dakos, V., van de Leemput, I. A., and van Nes, E. H.: Living dangerously on borrowed time during slow, unrecognized regime shifts, Trends Ecol. Evol., 28, 149–55, https://doi.org/10.1016/j.tree.2012.08.022, 2013.
Ives, A. R. and Dakos, V.: Detecting dynamical changes in nonlinear time series using locally linear state-space models, Ecosphere, 3, 1–15, https://doi.org/10.1890/ES11-00347.1, 2012.
Jones, C., Lowe, J., Liddicoat, S., and Betts, R.: Committed terrestrial ecosystem changes due to climate change, Nat. Geosci., 2, 484–487, https://doi.org/10.1038/ngeo555, 2009.
Kéfi, S., Rietkerk, M., Alados, C. L., Pueyo, Y., Papanastasis, V. P., ElAich, A., de Ruiter, P. C., Alados, L., and Ruiter, P. C. D.: Spatial vegetation patterns and imminent desertification in Mediterranean arid ecosystems, Nature, 449, 213–217, https://doi.org/10.1038/nature06111, 2007.
Kéfi, S., Dakos, V., Scheffer, M., Van Nes, E. H., and Rietkerk, M.: Early warning signals also precede non-catastrophic transitions, Oikos, 122, 641–648, 2013.
Kéfi, S., Guttal, V., Brock, W. A., Carpenter, S. R., Ellison, A. M., Livina, V. N., Seekell, D. A., Scheffer, M., van Nes, E. H., and Dakos, V.: Early Warning Signals of Ecological Transitions: Methods for Spatial Patterns, PLOS ONE, 9, e92097, https://doi.org/10.1371/journal.pone.0092097, 2014.
Kleinen, T., Held, H., Petschel-held, G., and Held, Á. H.: The potential role of spectral properties in detecting thresholds in the Earth system: application to the thermohaline circulation, Ocean Dynam., 53, 53–63, https://doi.org/10.1007/s10236-002-0023-6, 2003.
Klose, A. K., Karle, V., Winkelmann, R., and Donges, J. F.: Emergence of cascading dynamics in interacting tipping elements of ecology and climate: Cascading dynamics in tipping elements, Roy. Soc. Open Sci., 7, 200599, https://doi.org/10.1098/rsos.200599, 2020.
Klose, A. K., Wunderling, N., Winkelmann, R., and Donges, J. F.: What do we mean, “tipping cascade”?, Environ. Res. Lett., 16, 1–11, https://doi.org/10.1088/1748-9326/ac3955, 2021.
Kuehn, C.: A Mathematical Framework for Critical Transitions: Normal Forms, Variance and Applications, J. Nonlinear Sci., 23, 457–510, https://doi.org/10.1007/s00332-012-9158-x, 2012.
Kuznetsov, Y. A.: Elements of Applied Bifurcation Theory, Springer-Verlag, New York, https://doi.org/10.1007/978-1-4757-3978-7, 591 pp., 1995.
Lade, S. J. and Gross, T.: Early warning signals for critical transitions: A generalized modeling approach, PLOS Comput. Biol., 8, e1002360, https://doi.org/10.1371/journal.pcbi.1002360, 2012.
Laitinen, V., Dakos, V., and Lahti, L.: Probabilistic early warning signals, Ecol. Evol., 1–14, https://doi.org/10.1002/ece3.8123, 2021.
Lapeyrolerie, M. and Boettiger, C.: Limits to ecological forecasting: Estimating uncertainty for critical transitions with deep learning, Meth. Ecol. Evol., 14, 785–798, https://doi.org/10.1111/2041-210X.14013, 2022.
Lenton, T. M.: Early warning of climate tipping points, Nat. Clim. Change, 1, 201–209, 2011.
Lenton, T. M.: Environmental Tipping Points, 38, 1–29, https://doi.org/10.1146/annurev-environ-102511-084654, 2013a.
Lenton, T. M.: What early warning systems are there for environmental shocks?, Environ. Sci. Policy, 27, S60–S75, https://doi.org/10.1016/j.envsci.2012.06.011, 2013b.
Lenton, T. M., Buxton, J. E., Armstrong McKay, D. I., Abrams, J. F., Boulton, C. A., Lees, K., Powell, T. W. R., Boers, N., Cunliffe, A. M., and Dakos, V.: A resilience sensing system for the biosphere, Philos. T. R. Soc. B, 377, 20210383, https://doi.org/10.1098/rstb.2021.0383, 2022.
Lever, J. J., van de Leemput, I. A., Weinans, E., Quax, R., Dakos, V., van Nes, E. H., Bascompte, J., and Scheffer, M.: Foreseeing the future of mutualistic communities beyond collapse, Ecol. Lett., 23, 2–15, https://doi.org/10.1111/ele.13401, 2020.
Lewis, S. L., Brando, P. M., Phillips, O. L., Van Der Heijden, G. M. F., and Nepstad, D.: The 2010 Amazon Drought, Science, 331, 554–554, https://doi.org/10.1126/science.1200807, 2011.
Litzow, M. A. and Hunsicker, M. E.: Early warning signals, nonlinearity, and signs of hysteresis in real ecosystems, Ecosphere, 7, e01614, https://doi.org/10.1002/ecs2.1614, 2016.
Liu, L., Shao, Z., Lv, J., Xu, F., Ren, S., Jin, Q., Yang, J., Ma, W., Xie, H., Zhang, D., and Chen, X.: Identification of Early Warning Signals at the Critical Transition Point of Colorectal Cancer Based on Dynamic Network Analysis, Front. Bioeng. Biotechnol., 8, 530, https://doi.org/10.3389/fbioe.2020.00530, 2020.
Liu, Y., Kumar, M., Katul, G. G., and Porporato, A.: Reduced resilience as an early warning signal of forest mortality, Nat. Clim. Change, 9, 880–885, https://doi.org/10.1038/s41558-019-0583-9, 2019.
Livina, V. N. and Lenton, T. M.: A modified method for detecting incipient bifurcations in a dynamical system, Geophys. Res. Lett., 34, 1–5, https://doi.org/10.1029/2006GL028672, 2007.
Livina, V. N., Kwasniok, F., and Lenton, T. M.: Potential analysis reveals changing number of climate states during the last 60 kyr, Clim. Past, 6, 77–82, https://doi.org/10.5194/cp-6-77-2010, 2010.
Lu, Z., Yuan, N., Yang, Q., Ma, Z., and Kurths, J.: Early Warning of the Pacific Decadal Oscillation Phase Transition Using Complex Network Analysis, Geophys. Res. Lett., 48, e2020GL091674, https://doi.org/10.1029/2020GL091674, 2021.
Majumder, S., Tamma, K., Ramaswamy, S., and Guttal, V.: Inferring critical thresholds of ecosystem transitions from spatial data, Ecology, 100, e02722, https://doi.org/10.1002/ecy.2722, 2019.
Mayfield, R. J., Langdon, P. G., Doncaster, C. P., Dearing, J. A., Wang, R., Nazarova, L. B., Medeiros, A. S., and Brooks, S. J.: Metrics of structural change as indicators of chironomid community stability in high latitude lakes, Quaternary Sci. Rev., 249, 106594, https://doi.org/10.1016/j.quascirev.2020.106594, 2020.
Moesinger, L., Dorigo, W., de Jeu, R., van der Schalie, R., Scanlon, T., Teubner, I., and Forkel, M.: The global long-term microwave Vegetation Optical Depth Climate Archive (VODCA), Earth Syst. Sci. Data, 12, 177–196, https://doi.org/10.5194/essd-12-177-2020, 2020.
Nijp, J. J., Temme, A. J. A. M., van Voorn, G. A. K., Kooistra, L., Hengeveld, G. M., Soons, M. B., Teuling, A. J., and Wallinga, J.: Spatial early warning signals for impending regime shifts: A practical framework for application in real-world landscapes, Glob. Change Biol., 25, 1905–1921, https://doi.org/10.1111/gcb.14591, 2019.
Nowack, P., Runge, J., Eyring, V., and Haigh, J. D.: Causal networks for climate model evaluation and constrained projections, Nat. Commun., 11, 1415, https://doi.org/10.1038/s41467-020-15195-y, 2020.
O'Brien, D. A., Deb, S., Sidheekh, S., Krishnan, N. C., Sharathi Dutta, P., and Clements, C. F.: EWSmethods: an R package to forecast tipping points at the community level using early warning signals, resilience measures, and machine learning models, Ecography, 2023, e06674, https://doi.org/10.1111/ecog.06674, 2023.
Rietkerk, M., Dekker, S. C., de Ruiter, P. C., and van de Koppel, J.: Self-Organized Patchiness and Catastrophic Shifts in Ecosystems, Science, 305, 1926–1929, https://doi.org/10.1126/science.1101867, 2004.
Rietkerk, M., van de Koppel, J., and Koppel, J. V. D.: Regular pattern formation in real ecosystems, Trends Ecol. Evol., 23, 169–175, https://doi.org/10.1016/j.tree.2007.10.013, 2008.
Ritchie, P. and Sieber, J.: Early-warning indicators for rate-induced tipping, Chaos, 26, 093116, https://doi.org/10.1063/1.4963012, 2016.
Saade, C., Fronhofer, E. A., Pichon, B., and Kéfi, S.: Landscape Structure Affects Metapopulation-Scale Tipping Points, Am. Nat., 202, E17–E30, https://doi.org/10.1086/724550, 2023.
Saatchi, S., Longo, M., Xu, L., Yang, Y., Abe, H., André, M., Aukema, J. E., Carvalhais, N., Cadillo-Quiroz, H., Cerbu, G. A., Chernela, J. M., Covey, K., Sánchez-Clavijo, L. M., Cubillos, I. V., Davies, S. J., De Sy, V., De Vleeschouwer, F., Duque, A., Sybille Durieux, A. M., De Avila Fernandes, K., Fernandez, L. E., Gammino, V., Garrity, D. P., Gibbs, D. A., Gibbon, L., Gowae, G. Y., Hansen, M., Lee Harris, N., Healey, S. P., Hilton, R. G., Johnson, C. M., Kankeu, R. S., Laporte-Goetz, N. T., Lee, H., Lovejoy, T., Lowman, M., Lumbuenamo, R., Malhi, Y., Albert Martinez, J.-M. M., Nobre, C., Pellegrini, A., Radachowsky, J., Román, F., Russell, D., Sheil, D., Smith, T. B., Spencer, R. G. M., Stolle, F., Tata, H. L., Torres, D. del C., Tshimanga, R. M., Vargas, R., Venter, M., West, J., Widayati, A., Wilson, S. N., Brumby, S., and Elmore, A. C.: Detecting vulnerability of humid tropical forests to multiple stressors, One Earth, 4, 988–1003, https://doi.org/10.1016/j.oneear.2021.06.002, 2021.
Scheffer, M., Bascompte, J., Brock, W. A., Brovkin, V., Carpenter, S. R., Dakos, V., Held, H., van Nes, E. H., Rietkerk, M., and Sugihara, G.: Early-warning signals for critical transitions, Nature, 461, 53–59, https://doi.org/10.1038/nature08227, 2009.
Scheffer, M., Carpenter, S. R., Lenton, T. M., Bascompte, J., Brock, W., Dakos, V., van de Koppel, J., van de Leemput, I. A., Levin, S. A., van Nes, E. H., Pascual, M., and Vandermeer, J.: Anticipating Critical Transitions, Science, 338, 344–348, https://doi.org/10.1126/science.1225244, 2012a.
Scheffer, M., Hirota, M., Holmgren, M., Van Nes, E. H., and Chapin, F. S.: Thresholds for boreal biome transitions., P. Natl. Acad. Sci. USA, 109, 21384–9, https://doi.org/10.1073/pnas.1219844110, 2012b.
Scheffer, M., Carpenter, S. R., Dakos, V., and van Nes, E. H.: Generic Indicators of Ecological Resilience: Inferring the Chance of a Critical Transition, Annu. Rev. Ecol. Evol. S., 46, 145–167, https://doi.org/10.1146/annurev-ecolsys-112414-054242, 2015.
Scheffer, M., Bolhuis, J. E., Borsboom, D., Buchman, T. G., Gijzel, S. M. W., Goulson, D., Kammenga, J. E., Kemp, B., van de Leemput, I. A., Levin, S., Martin, C. M., Melis, R. J. F., van Nes, E. H., Romero, L. M., and Olde Rikkert, M. G. M.: Quantifying resilience of humans and other animals, P. Natl. Acad. Sci. USA, 115, 201810630, https://doi.org/10.1073/pnas.1810630115, 2018.
Seekell, D. A. and Dakos, V.: Heteroskedasticity as a leading indicator of desertification in spatially explicit data, Ecol. Evol., 5, 2185–2192, https://doi.org/10.1002/ece3.1510, 2015.
Seekell, D. A., Carpenter, S. R., Cline, T. J., and Pace, M. L.: Conditional Heteroskedasticity Forecasts Regime Shift in a Whole-Ecosystem Experiment, Ecosystems, 15, 741–747, https://doi.org/10.1007/s10021-012-9542-2, 2012.
Smith, T., Zotta, R.-M., Boulton, C. A., Lenton, T. M., Dorigo, W., and Boers, N.: Reliability of resilience estimation based on multi-instrument time series, Earth Syst. Dynam., 14, 173–183, https://doi.org/10.5194/esd-14-173-2023, 2023.
Sole, R. V., Manrubia, S. C., Luque, B., Delgado, J., Bascompte, J., Solé, R. V., Manrubia, S. C., Luque, B., Delgado, J., and Bascompte, J.: Phase transitions and complex systems, Complexity, 1, 13–26, 1996.
Spanbauer, T. L., Allen, C. R., Angeler, D. G., Eason, T., Fritz, S. C., Garmestani, A. S., Nash, K. L., Stone, J. R., Stow, C. A., and Sundstrom, S. M.: Body size distributions signal a regime shift in a lake ecosystem, P. R. Soc. B, 283, https://doi.org/10.1098/rspb.2016.0249, 2016.
Spears, B. M., Futter, M. N., Jeppesen, E., Huser, B. J., Ives, S., Davidson, T. A., Adrian, R., Angeler, D. G., Burthe, S. J., Carvalho, L., Daunt, F., Gsell, A. S., Hessen, D. O., Janssen, A. B. G., Mackay, E. B., May, L., Moorhouse, H., Olsen, S., Søndergaard, M., Woods, H., and Thackeray, S. J.: Ecological resilience in lakes and the conjunction fallacy, Nat. Ecol. Evol., 1, 1616–1624, https://doi.org/10.1038/s41559-017-0333-1, 2017.
Staver, A. C., Archibald, S., and Levin, S. A.: The Global Extent and Determinants of Savanna and Forest as Alternative Biome States, Science, 334, 230–232, https://doi.org/10.1126/science.1210465, 2011.
Tang, Y., Zhu, X., He, C., Hu, J., and Fan, J.: Critical slowing down theory provides early warning signals for sandstone failure, Front. Earth Sci., 10, 934498, https://doi.org/10.3389/feart.2022.934498, 2022.
Thompson, J. M. T. and Sieber, J.: Predicting climate tipping as a noisy bifurcation: a review, Int. J. Bifurcat Chaos, 21, 399–423, https://doi.org/10.1142/s0218127411028519, 2011.
Tirabassi, G., Viebahn, J., Dakos, V., Dijkstra, H. A., Masoller, C., Rietkerk, M., and Dekker, S. C.: Interaction network based early-warning indicators of vegetation transitions, Ecol. Complex., 19, 148–157, https://doi.org/10.1016/j.ecocom.2014.06.004, 2014.
Uden, D. R., Twidwell, D., Allen, C. R., Jones, M. O., Naugle, D. E., Maestas, J. D., Allred, B. W., and Wallace, K. J.: Spatial Imaging and Screening for Regime Shifts, Front. Ecol. Evol., 7, 1–16, https://doi.org/10.3389/fevo.2019.00407, 2019.
van de Leemput, I. A., Dakos, V., Scheffer, M., and van Nes, E. H.: Slow Recovery from Local Disturbances as an Indicator for Loss of Ecosystem Resilience, Ecosystems, 21, 141–152, https://doi.org/10.1007/s10021-017-0154-8, 2018.
van Der Bolt, B., van Nes, E. H., and Scheffer, M.: No warning for slow transitions, J. R. Soc. Interface, 18, 20200935, https://doi.org/10.1098/rsif.2020.0935, 2021.
van Nes, E. H., Arani, B. M. S., Staal, A., van der Bolt, B., Flores, B. M., Bathiany, S., and Scheffer, M.: What Do You Mean, `Tipping Point'?, Trends Ecol. Evol., 31, 902–904, https://doi.org/10.1016/j.tree.2016.09.011, 2016.
Veldhuis, M. P., Martinez-Garcia, R., Deblauwe, V., and Dakos, V.: Remotely-sensed slowing down in spatially patterned dryland ecosystems, Ecography, 2022, e06139, https://doi.org/10.1111/ecog.06139, 2022.
Veraart, A. J. A. J., Faassen, E. J. E. J., Dakos, V., Van Nes, E. H. E. H., Lürling, M., Scheffer, M., and Lurling, M.: Recovery rates reflect distance to a tipping point in a living system, Nature, 481, 357–359, https://doi.org/10.1038/nature10723, 2012.
Verbesselt, J., Umlauf, N., Hirota, M., Holmgren, M., Van Nes, E. H., Herold, M., Zeileis, A., and Scheffer, M.: Remotely sensed resilience of tropical forests, Nat. Clim. Change, 6, 1028–1031, https://doi.org/10.1038/nclimate3108, 2016.
von Hardenberg, J., Meron, E., Shachak, M., Zarmi, Y., and Hardenberg, J. V.: Diversity of vegetation patterns and desertification, Phys. Rev. Lett., 8719, 198101, https://doi.org/10.1103/PhysRevLett.87.198101, 2001.
Wang, R., Dearing, J. A., Langdon, P. G., Zhang, E., Yang, X., Dakos, V., and Scheffer, M.: Flickering gives early warning signals of a critical transition to a eutrophic lake state, Nature, 492, 419–422, https://doi.org/10.1038/nature11655, 2012.
Weinans, E., Lever, J. J., Bathiany, S., Quax, R., Bascompte, J., Van Nes, E. H., Scheffer, M., and Van De Leemput, I. A.: Finding the direction of lowest resilience in multivariate complex systems, J. R. Soc. Interface, 16, https://doi.org/10.1098/rsif.2019.0629, 2019.
Weinans, E., Quax, R., van Nes, E. H., and Leemput, I. A. van de: Evaluating the performance of multivariate indicators of resilience loss, Sci. Rep.-UK, 11, 9148, https://doi.org/10.1038/s41598-021-87839-y, 2021.
Wissel, C.: A universal law of the characteristic return time near thresholds, Oecologia, 65, 101–107, 1984.
Wu, H., Hou, W., Yan, P.-C., Zhang, Z.-S., and Wang, K.: A study of the early warning signals of abrupt change in the Pacific decadal oscillation, Chinese Phys. B, 24, 089201, https://doi.org/10.1088/1674-1056/24/8/089201, 2015.
Wu, S., Liu, L., Li, D., Zhang, W., Liu, K., Shen, J., and Zhang, L.: Global desert expansion during the 21st century: Patterns, predictors and signals, Land Degrad. Dev., 34, 377–388, https://doi.org/10.1002/ldr.4466, 2023.
Yin, Z., Dekker, S. C., Rietkerk, M., van den Hurk, B. J. J. M., and Dijkstra, H. A.: Network based early warning indicators of vegetation changes in a land–atmosphere model, Ecol. Complex., 26, 68–78, https://doi.org/10.1016/j.ecocom.2016.02.004, 2016.
- Article
(3403 KB) - Full-text XML