the Creative Commons Attribution 4.0 License.
the Creative Commons Attribution 4.0 License.
 | 08 Sep 2023
A 20-year satellite-reanalysis-based climatology of extreme precipitation characteristics over the Sinai Peninsula
Mohsen Soltani
Bert Hamelers
Abbas Mofidi
Christopher G. Fletcher
Arie Staal
Stefan C. Dekker
Patrick Laux
Joel Arnault
Harald Kunstmann
Ties van der Hoeven
Maarten Lanters
Extreme precipitation events and associated flash floods caused by synoptic cyclonic systems profoundly impact society and the environment, particularly in arid regions. This study brings forward a satellite-reanalysis-based approach to quantify extreme precipitation characteristics over the Sinai Peninsula (SiP) in Egypt from a statistical–synoptic perspective for the period of 2001–2020. With a multi-statistical approach developed in this research, SiP's wet and dry periods are determined. Using satellite observations of precipitation and a set of derived precipitation indices, we characterize the spatiotemporal variations of extreme rainfall climatologies across the SiP. Then, using the reanalysis datasets, synoptic systems responsible for the occurrence of extreme precipitation events along with the major tracks of cyclones during the wet and dry periods are described. Our results indicate that trends and spatial patterns of the rainfall events across the region are inconsistent in time and space. The highest precipitation percentiles (∼20 mm per month), frequencies (∼15 d per month with rainfall ≥10 mm d−1), standard deviations (∼9 mm month per month), and monthly ratios (∼18 %) are estimated in the northern and northeastern parts of the region during the wet period, especially in early winter; also, a substantial below-average precipitation condition (drier trend) is clearly observed in most parts except for the south. Mediterranean cyclones accompanied by the Red Sea and Persian troughs are responsible for the majority of extreme rainfall events year-round. A remarkable spatial relationship is found between SiP's rainfall and the atmospheric variables of sea level pressure, wind direction, and vertical velocity. A cyclone-tracking analysis indicates that 125 cyclones (with rainfall ≥10 mm d−1) formed within, or transferred to, the Mediterranean basin and precipitated over the SiP during wet periods compared to 31 such cyclones during dry periods. It is estimated around 15 % of cyclones with sufficient rainfall >40 mm d−1 would be capable of leading to flash floods during the wet period. This study, therefore, sheds new light on the extreme precipitation characteristics over the SiP and its association with dominant synoptic-scale mechanisms over the eastern Mediterranean region.
- Article
(17056 KB) - Full-text XML
-
Supplement
(6915 KB) - BibTeX
- EndNote


Extreme precipitation events can have fundamental impacts on society and human well-being by causing mortality (Trenberth et al., 2007; Toreti et al., 2010; Wannous and Velasquez 2017; Charlton-Perez et al., 2019) and by causing property and ecological damage (Zhang et al., 2005; IPCC, 2013; Nastos et al., 2013; Boucek et al., 2016). Precipitation extremes are recognized as one of the severest natural disasters, among many others (Arnous and Omar, 2018). Nevertheless, these events are vital for the water resources of the region, especially in water-limited environments (Peleg et al., 2012; Givati et al., 2019; Levy et al., 2020); however, they also constitute the main trigger of flash floods in arid and hyper-arid areas such as the Sinai Peninsula (Fig. 1), which hereafter is referred to as the SiP in this study (Ocakoglu et al., 2002; David-Novak et al., 2004; El-Magd et al., 2010; Farahat et al. 2017; Gado, 2020).
The eastern Mediterranean is one of the main cyclogenetic regions of the Mediterranean basin (Krichak et al., 1997) and globally (Ulbrich et al., 2012; Neu et al., 2013), which in many cases is associated with precipitation extremes (Flaounas et al., 2015, 2018). As such, most of the heavy precipitation events in this region strongly rely on the presence and frequency of intense Mediterranean cyclones (Trigo et al., 2002; Kotroni et al., 2006; Pfahl and Wernli, 2012; Lionello et al., 2016), accompanied by other precipitation-producing systems at the synoptic scale, sometimes of tropical or subtropical origin (Krichak et al., 1997; Hochman et al., 2020).
A multitude of observational, numerical, and synoptic studies have been carried out in relation to the extreme precipitation events over the eastern Mediterranean region to date, such as extreme rainfall analysis (e.g., Alpert et al., 2002; Ben David-Novak et al., 2004; Kostopoulou and Jones, 2005; Ben-Zvi, 2009; Mathbout et al., 2018), trends in extreme precipitation (e.g., Yosef et al., 2009; Shohami et al., 2011; Ziv et al., 2013; Ajjur and Riffi, 2020), satellite remote-sensing-based analysis of precipitation extremes (e.g., Gabella et al., 2006; Mehta and Yang, 2008; Nastos et al., 2013; Yucel and Onen, 2014), numerical modeling and climate change projections of heavy precipitation (e.g., Tous et al., 2016; Romera et al., 2017; Toros et al., 2018; Zoccatelli et al., 2020; Zittis et al., 2020), flash floods and water resources attributed to extreme rainfall events (e.g., Morin et al., 2007; Samuels et al., 2009; Koutroulis and Tsanis, 2010; Tarolli et al., 2012; Varlas et al., 2018; Zoccatelli et al., 2019; Spyrou et al., 2020; Rinat et al., 2021), synoptic analysis of precipitation extremes and floods (e.g., Dayan et al., 2001, 2015; Kahana et al., 2002; Alpert et al., 2004; Tsvieli and Zangvil, 2005; Peleg and Morin, 2012; Raveh-Rubin and Wernli, 2015; Toreti et al., 2016), and cyclogenesis and cyclone tracking (e.g., Alpert and Ziv, 1989; Alpert and Shay-El, 1994; Flocas et al., 2010; Flaounas et al., 2015, 2018; Almazroui et al., 2014; Zappa et al., 2015; Ziv et al., 2015).
However, the literature review for the SiP reveals that very limited studies have been carried out so far, mainly on the flash floods associated with heavy rainfall events through a ground- and satellite-based data analysis approach (e.g., Roushdi et al., 2016; Dadamouny and Schnittler, 2016; Arnous and Omar, 2018; Morsy et al., 2019; Baldi et al., 2020) to numerical model experiments (e.g., Cools et al., 2012; El Afandi et al., 2013; Morad, 2016; Prama et al., 2020; Omran, 2020; ElFakharany and Mansour, 2021). In such circumstances, Mohamed and El-Raey (2019) pointed out that limited numbers of extreme precipitation events with high intensities and short durations that typically result in flash floods are allegedly the only sources of renewable water resources in the SiP. Therefore, it seems necessary to understand, in the first place, the spatiotemporal distribution of extreme precipitation events across the SiP and, in the second place, to discover the corresponding synoptic–dynamical mechanisms responsible for the occurrence of such events over the region. To our best knowledge, no study has yet attempted to quantify the extreme precipitation characteristics (e.g., spatiotemporal variations, anomalies, frequencies, and spatial patterns) associated with the synoptic–regional atmospheric circulation and the cyclone tracking over SiP – and not over the eastern Mediterranean basin, as described and presented in this study. Yet, the wet and dry periods of the SiP have not been fully studied; it is of importance to follow-up SiP research (e.g., assessing the rate of precipitation recycling during the naturally dry period of the year). Therefore, to bridge the abovementioned research gaps, in this study, the following major research questions are addressed in particular during the SiP's wet and dry periods.
-
How are the extreme precipitation climatologies spatiotemporally distributed across the SiP?
-
Which synoptic-scale systems are responsible for the occurrence of SiP's extreme precipitation events?
-
What are the major tracks of cyclones and their frequencies over the eastern Mediterranean region?
In this research, our data analysis spans the period from 1 January 2001 to 31 December 2020. First, SiP's wet and dry months are determined using a multi-statistical approach developed in this study. Next, we use satellite remote-sensing precipitation to quantify the spatiotemporal variations, anomaly, monthly regime, frequency, and spatial patterns of the extreme precipitation events, together with the computation of a set of extreme climate indices, separately during the wet and dry periods. Then, the dominant synoptic atmospheric circulation patterns and moisture conditions corresponding to SiP's extreme precipitation events in wet and dry periods are explored using the reanalysis data at multiple levels of the atmosphere. Finally, a daily-based frequency of the precipitation-producing systems (cyclone tracking) is tracked and plotted over the region for the wet and dry periods.
2.1 The description of the study area
The Sinai Peninsula (SiP, lat: 27.6–31.4∘ N, long: 32.2–34.9∘ E) is located in the northeast of Egypt with an area of 61 000 km2 (Fig. 1) covering about 6 % of Egypt's area (Mohamed et al., 2014; Badreldin and Goossens, 2013). The region lies in an arid to hyper-arid belt of North Africa and belongs to the Saharan–Mediterranean climate classification (Dadamouny and Schnittler, 2016). Nevertheless, it is one of the coldest regions in Egypt due to its high altitudes and mountainous topography, where the highest elevations are found toward the southern parts (e.g., Mount Catherine, the highest mountain in Egypt with an elevation of 2642 a.g.l. – above ground level; see Fig. 1). Overall, the SiP is characterized by a Mediterranean climate in the north and a semidesert to desert climate in the south (El-Sayed and Habib, 2008).
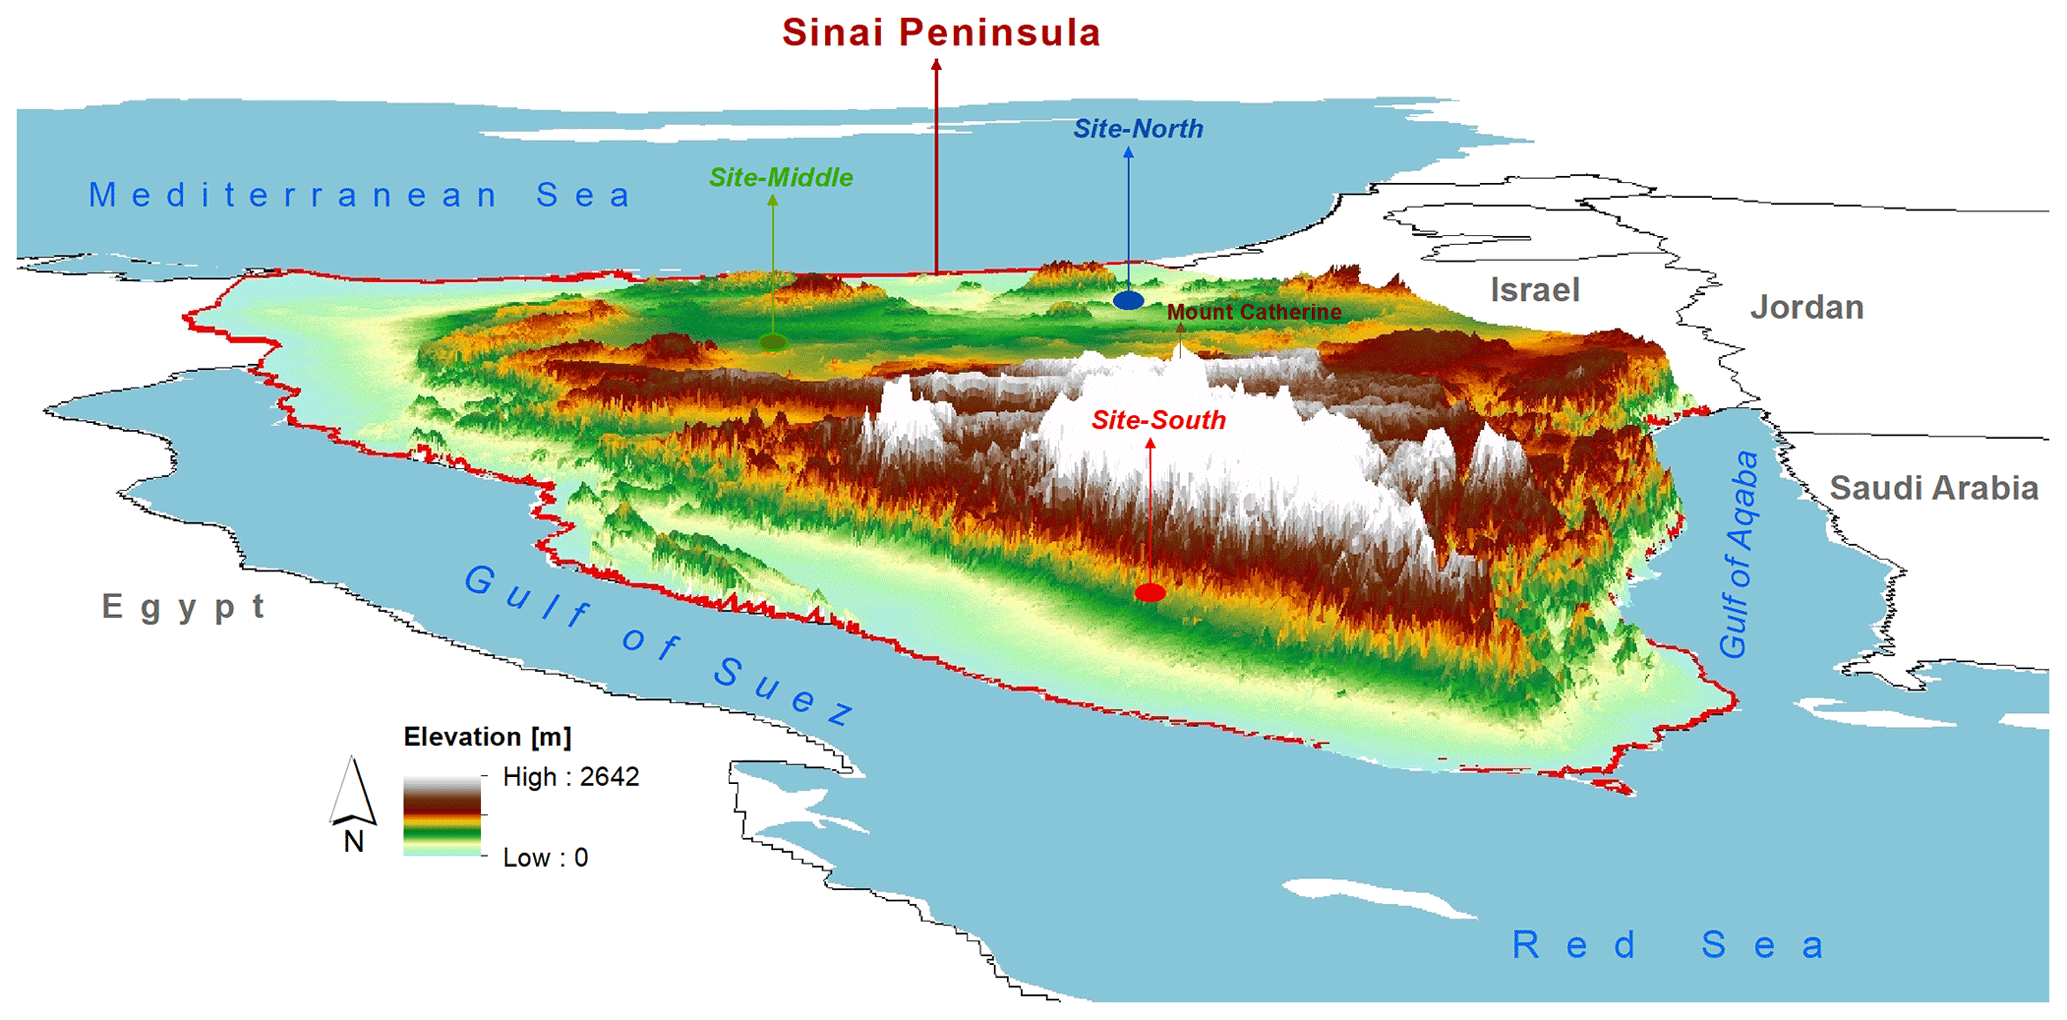
Figure 1The location of the Sinai Peninsula (SiP) in northeastern Egypt with the underlying three-dimensional topography. Three selected sites in the north (site-north: 30.7∘ N, 33.09∘ E), middle (site-middle: 30.01∘ N, 33.50∘ E), and south (site-south: 28.50∘ N, 33.70∘ E) of the SiP are shown here, used for the site-scale-based calculation of precipitation anomalies.
2.2 Datasets
2.2.1 Satellite Global Precipitation Measurement (GPM)
The Global Precipitation Measurement (GPM) is an international satellite mission to provide quasi-global precipitation estimates with a high temporal resolution (30 min, daily and monthly) and spatial resolution (0.1∘) through the Integrated Multi-satellitE Retrievals (IMERG) product. The GPM mission follows the Tropical Rainfall Measuring Mission (TRMM), aiming to improve satellite-based precipitation observation capability. GPM-IMERG provides different rainfall estimates that are combined from active and passive instruments in the GPM constellation (https://gpm.nasa.gov/, last access: 25 September 2020). Further details are given by Huffman et al. (2014). The GPM data have been employed in several studies over the Mediterranean region (e.g., Retalis et al., 2018; Petracca et al., 2018; Caracciolo et al., 2018; Cinzia Marra et al., 2019; Hourngir et al., 2021). In this study, we used the IMERG version 6 GPM-L3 final precipitation product (30 min daily) to estimate the extreme precipitation characteristics for 20 years (2001–2020) over the SiP.
2.2.2 NCEP/NCAR and ERA5 reanalysis data
To investigate the synoptic–dynamical climatology associated with SiP's rainfall events, the required variables were obtained from the National Centers for Environmental Prediction and National Center for Atmospheric Research (NCEP/NCAR) (https://psl.noaa.gov/data/gridded/data.ncep.reanalysis.html, last access: 10 February 2021; Kalnay, 1996) as well as the fifth generation of the European Centre for Medium-Range Weather Forecasts (ERA5) (Hersbach et el., 2020) https://www.ecmwf.int/en/forecasts/datasets/reanalysis-datasets/era5 (last access: 12 October 2021). NCEP/NCAR and ERA5 have provided reanalysis datasets with multiple time steps at the surface and pressure levels of the atmosphere since 1948 and 1979 with a global and horizontal grid, respectively. In the literature, these datasets have been used over the Mediterranean region in several studies, especially with regard to the synoptic analysis of precipitation, blocking systems, and storm and cyclone tracking (e.g., Krichak et al., 2002; Trigo et al., 2004; Tolika et al., 2006; Trigo, 2006; Lois, 2009; Barkhordarian et al., 2013; Almazroui and Awad, 2016; Almazroui et al., 2014, 2017; Varlas et al., 2018; Kotsias et al., 2020). First, in this research, NCEP/NCAR data were used to study the pressure fields due to their coarser resolution, as it is believed that large-scale pressure systems such as cyclonic and anticyclonic patterns could be better represented at coarse resolution, especially at lower atmospheric levels over complex environments. Second, ERA5 data were used to quantify the moisture condition as well as the wind stream structure and profile related to the wet and dry periods at a finer resolution. The following reanalysis meteorological datasets or derived variables at multiple levels were employed: NCEP/NCAR (daily, 250 km grid) sea level pressure (SLP) (hPa), geopotential height (HGT) (m), relative vorticity (RV) (10−5 S−1), zonal (U) and meridional (V) wind components (m s−1), and vertical velocity (omega: Pa s−1), along with ERA5 (daily, 25 km grid) relative humidity RH (%) as well as U and V wind components (m s−1).
2.3 Data analysis approach
2.3.1 Determining SiP's wet and dry periods
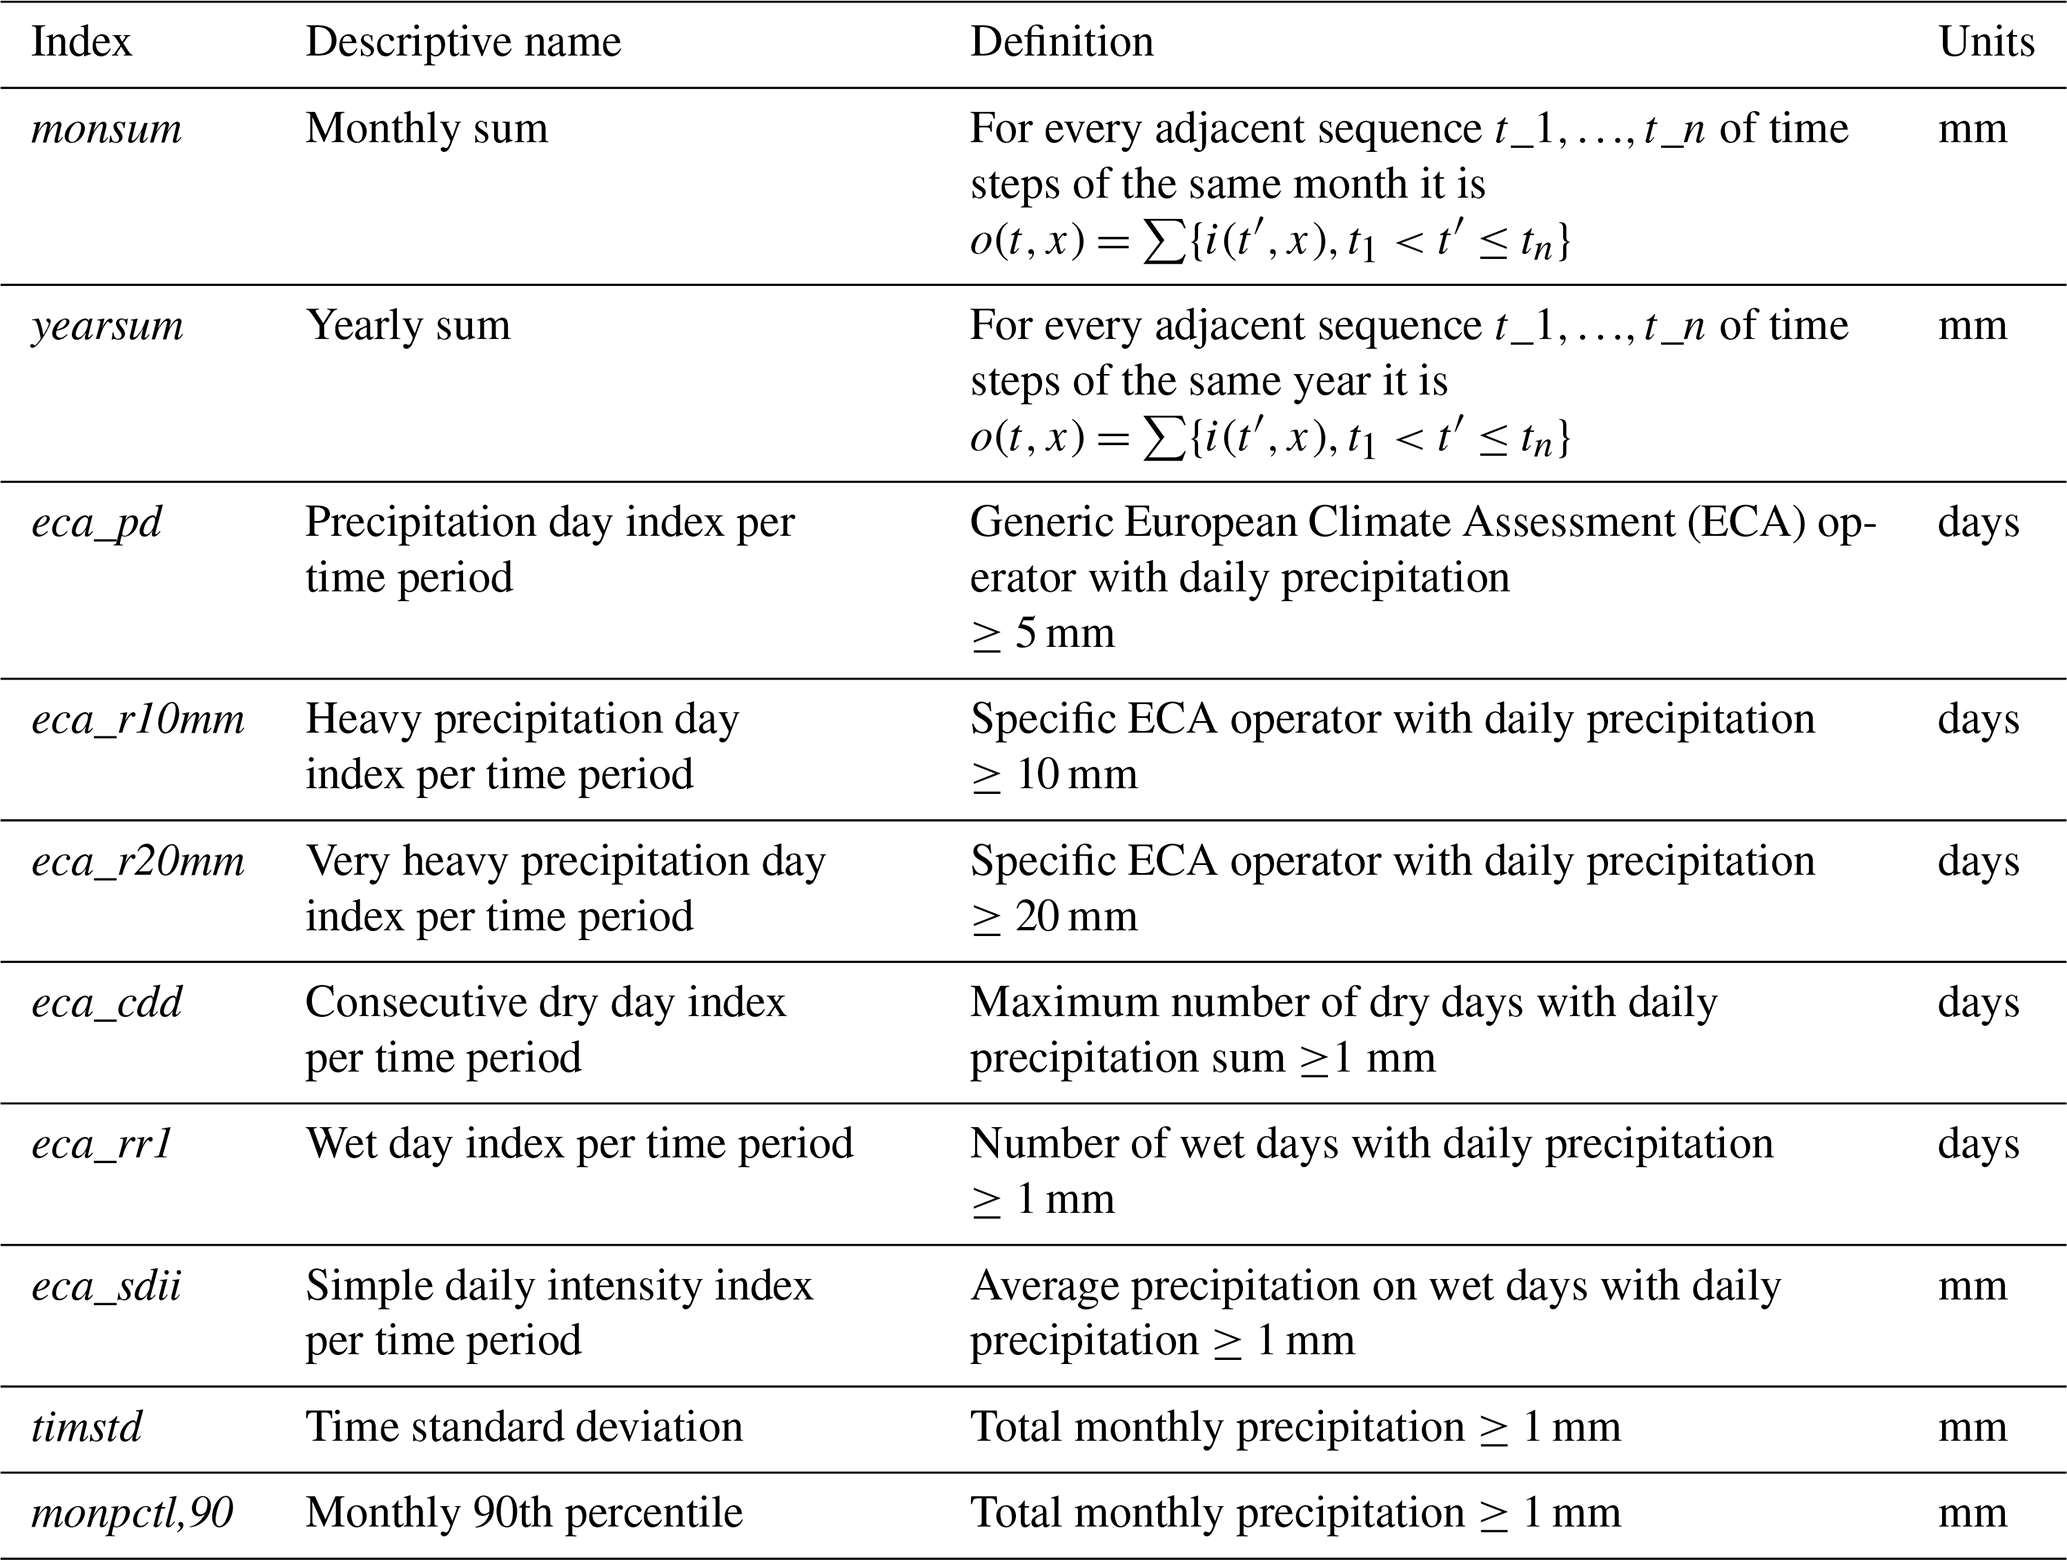
In this research, months with the lowest (or no rainfall) and highest amounts and frequencies of precipitation events are determined throughout the year in the SiP. This is important, as in follow-up SiP research the aim is to assess the regreening impacts on local hydrometeorological processes such as precipitation recycling in the SiP under a vegetated surface scenario during a naturally dry period of the year. Thus, we developed a multi-statistical approach to split the wet and dry months of the year for the period 2001–2020. This is achieved via a combination of the results obtained from three statistical measures: (i) monthly 90th percentile (Fig. 3a), (ii) frequency of occurrence of precipitation with a threshold of ≥10 mm d−1 (Fig. 3b) – after examining other thresholds of ≥5 mm d−1 and ≥20 mm d−1 (see Figs. S1 and S2), and (iii) monthly rainfall standard deviations (Fig. 3c). These methods were calculated using a set of statistical functions described in the following subsection (see Table 1). Therefore, using the approach developed in this study, wet months are determined from October to March, defined as the wet period, and dry months from April to September are defined as dry periods in SiP.
2.3.2 Estimate of the extreme precipitation indices and statistical values
The spatiotemporal analysis and statistical measures for the satellite GPM-based daily precipitation time series were carried out for the entire SiP region. For this, a set of climate functions and indices (see Table 1 for details) was computed for the period of 2001–2020 using the Climate Data Operator (CDO) (Schulzweida, 2020) developed at the Max Planck Institute for Meteorology (https://code.mpimet.mpg.de/projects/cdo, last access: 12 July 2020).
Table 1CDO functions and climate indices used in this study (Schulzweida, 2020).
2.3.3 Calculation of the precipitation spatiotemporal variations
The spatiotemporal patterns of the daily precipitation climatology (annual and biannual) over the period of 2001–2020 in the SiP were analyzed using empirical orthogonal function (EOF) analysis. According to Dawson (2016), the main aim of EOF analysis is to reduce the dimensionality of a spatial–temporal dataset by transforming it to a new basis in terms of variance. This transformation turns the input spatial–temporal dataset into a set of maps representing patterns of variance and a time series for each map that determines the contribution of that map to the original dataset at each time step. Thus, the spatial patterns are the EOFs and are considered to be basis functions in terms of variance. The associated time series are the principal components (PCs) and are the temporal coefficients of the EOFs. In this study, we used a Python-based eofs package (Dawson, 2016) to perform the EOF analysis.
Furthermore, the trends of the annual and seasonal changes in the precipitation events were also estimated for three selected sites across the SiP (see Fig. 1 for the locations) using anomaly-based analysis. The climatology mean precipitation values and spatial distributions were the two main criteria for the selection of the sites. In this way, each chosen site is representative of its surrounding area in terms of both the precipitation magnitude and spatial patterns. Thus, the selected sites in the northern, southern, and middle parts indicate the max, min, and average amounts of precipitation received across the SiP, respectively, over a 20-year time period. For this analysis, the precipitation anomalies (annual and seasonal) are calculated in three steps: (i) calculating the climatology mean of the data, (ii) subtracting the mean value from each year and season value, and (iii) drawing the trend of slopes using the least-squares method. Here, winter includes DJF months (December, January, and February) and autumn includes SON months (September, October, and November). The anomalies for spring and summer periods were found to be close to zero and are therefore excluded. It is noted that we also performed 95 % and 99 % bootstrapped confidence intervals for the mean and median values of the original dataset (seasonal and annual) for the selected sites. The results are given in Table S1.
2.3.4 Synoptic analysis
To explore the climatology of the synoptic, dynamic, and moisture conditions at multiple levels of the atmosphere responsible for the occurrence of the (extreme) precipitation events over the SiP, the reanalysis dataset obtained from NCEP/NCAR and ERA5 was investigated. In the first place, the wet period and dry period were determined as explained earlier (see Sect. 2.3.1). In the second place, using the satellite reanalysis variables (see Sect. 2.2.), the dominant synoptic features, dynamical circulation patterns, and moisture conditions accompanied by the spatial correlations between SiP's rainfall and key meteorological variables were computed and analyzed for the wet and dry periods for the climatology period of 2001–2020.
2.3.5 Cyclone tracking
In line with the synoptic analysis, the daily trajectories of the rainy systems precipitated over the SiP were tracked and plotted for the wet and dry periods using a manual approach developed in this study. In our approach, we merely aimed to detect and track cyclones precipitating ≥10 mm in the SiP. It is, however, challenging for an automated algorithm to detect a low system (sometimes with multiple centers, cyclones) that may or not have generated rainfall with a given threshold over a given domain. Yet, its performance is not totally error-free, in particular over heterogeneous regions with a complex atmospheric planetary boundary layer (PBL) like the Mediterranean region (e.g., Raible et al., 2008; Flaounas et al., 2014; Prantl et al., 2021). Our manual-based cyclone-tracking approach developed in this research consists of three major steps as follows.
- i.
First, a set of daily total precipitation patterns over the SiP was produced using GPM data separately for the wet and dry periods; by doing so, a total of 156 events (out of 7305 d) were identified, which precipitated ≥10 mm over the SiP. Accordingly, synoptic-scale daily composites of SLP, 850 hPa RV, and streamflow were produced using the reanalysis dataset for the entire study period (2001–2020, 7305 d). Here, the 850 hPa relative vorticity and streamflow were used along with SLP to better identify the lows (Flaounas et al., 2014).
- ii.
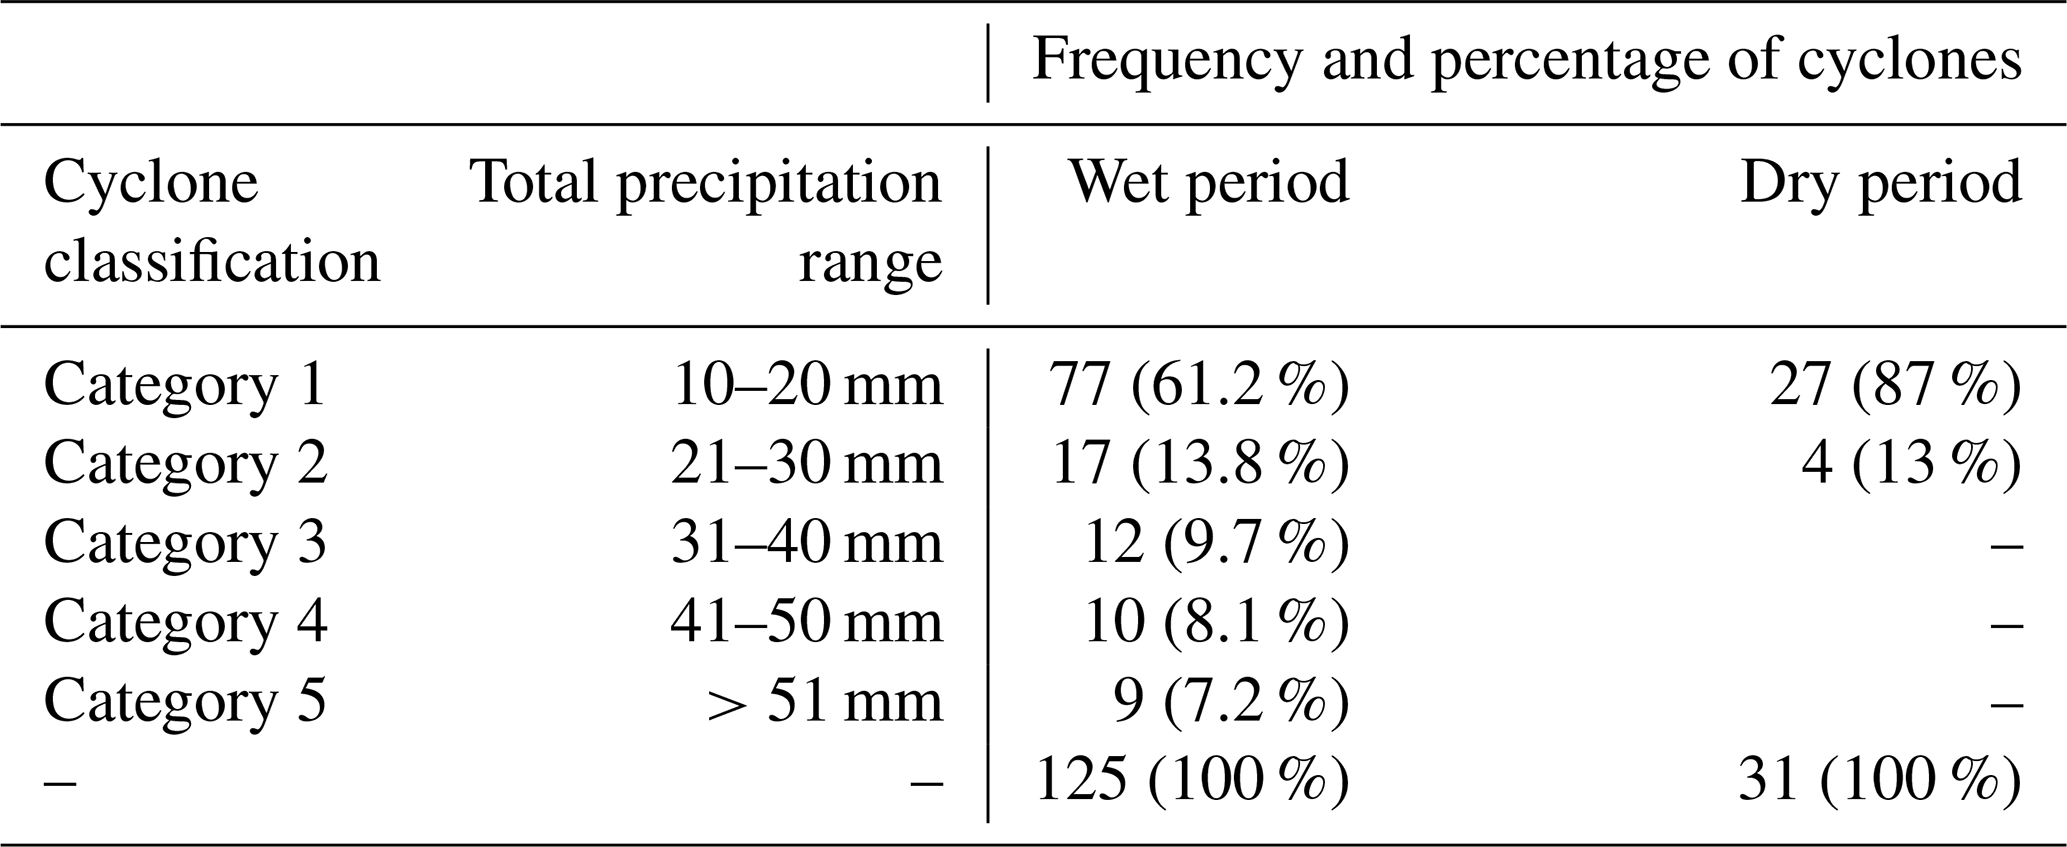
Second, to identify the cyclogenesis and lysis of the selected events, the composite maps of SLP, RV, and streamflow for several days before and after SiP's precipitation events were monitored and tracked carefully. Every daily movement (X–Y coordinates) of the corresponding cyclone was recorded from the beginning where the low system was born (cyclogenesis) until it disappeared (cyclolysis). This process was carried out one by one for all 156 cases with rainfall ≥10 mm. All the events were classified into five categories based on the rainfall magnitude as follows: category 1 (10–20 mm), category 2 (21–30 mm), category 3 (31–40 mm), category 4 (41–50 mm), and category 5>(51 mm).
- iii.
Third, cyclone-tracking charts for the wet and dry periods were separately produced using the information obtained from the former steps.
3.1 Climatology analysis of the precipitation characteristics
3.1.1 The precipitation spatial patterns and extreme indices
The spatial precipitation patterns in terms of the climatology average, the rainiest month, and the wettest day for the period of 2001–2020 in SiP are illustrated in Fig. 2a–c, respectively. The climatology map of precipitation markedly demonstrates that the northeastern and southwestern parts of the SiP receive the highest (between 100 and 150 mm yr−1) and the lowest (between 20 and 30 mm yr−1) amounts of annual rainfall, respectively (Fig. 2a). This implies that precipitation is unevenly distributed over the SiP. However, most parts of the region do not receive precipitation as high as 40 mm yr−1, except for the northern areas close to the Mediterranean Sea. With respect to the occurrence of precipitation extremes, we discovered that the rainiest month (out of 240 months) was March 2020 (Fig. 2b) with a wide range of rainfall values from 15 to 30 mm per month in the south and from 50 to 70 mm per month in the north. Interestingly, the wettest day (out of 7305 d) also occurred in the same month and year, which is 12 March 2020 (Fig. 2c); thus, it is not surprising to see an analogous spatial pattern when compared to the rainiest month but with less magnitude.
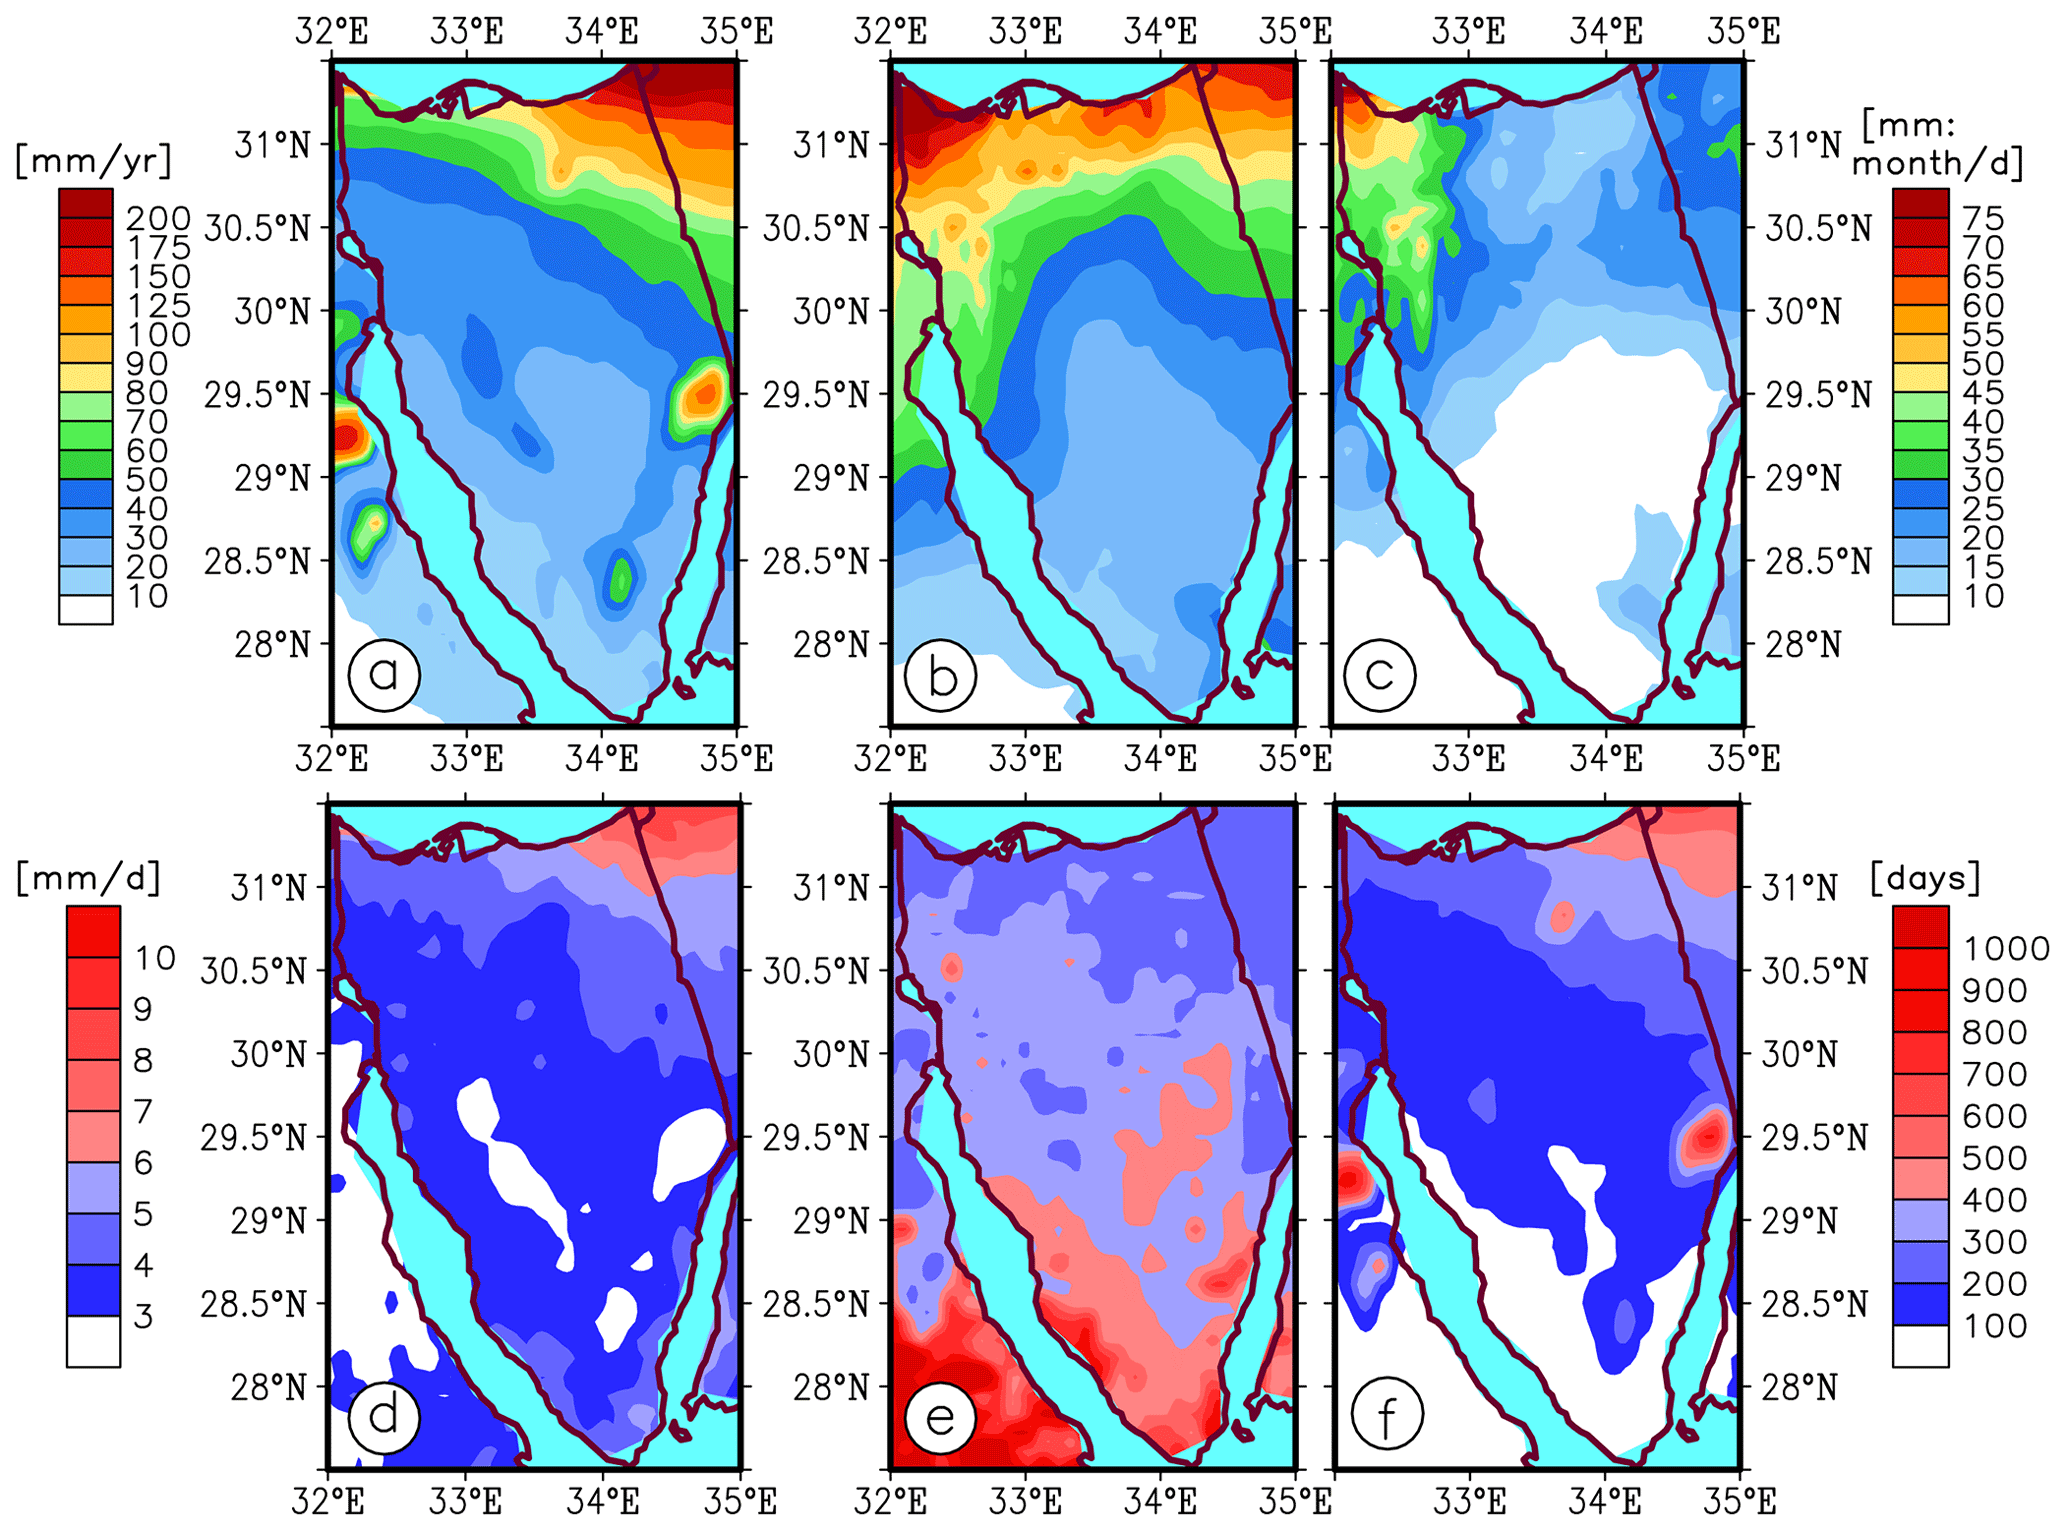
Figure 2The precipitation spatial patterns and extreme indices: (a) climatology map of mean annual precipitation (2001–2020); (b) the wettest month, i.e., March 2020 (out of 240 months), (c) the wettest day, i.e., 12 March 2020 (out of 7305 d). Extreme daily precipitation indices with a threshold of ≥1 mm d−1: d) daily intensity index (SDII), (e) consecutive dry days (CDDs), and (f) wet day index (RR1) for the period 2001–2020 over the Sinai Peninsula (SiP).
Additionally, we also identified the 12 rainiest months out of 240 months (see Fig. S3) and the 12 wettest days out of 7305 d (see Fig. S4). It was found that 9 out of 12 extreme month and day cases occurred in the winter season (January, February, and March) with the highest frequency of occurrence in January (five cases), while only 3 out of 12 cases took place in autumn (October and December). Further, we plotted monthly precipitation climatologies (2001–2020) together with ranks of 12 months (out of 240) with the highest amount of rainfall received in the SiP (Fig. S5). The most extreme precipitation event occurred in March 2020 over the past 2 decades, followed by February 2019 and January 2013. The severest storm was recorded during 11–13 March, and the peak rainfall hours (>30 mm) occurred in the afternoon of 12 March 2020, as shown by the onset and termination of the most powerful rainy system in hourly intervals of the subplot in Fig. S5c. It may be worth mentioning that the exceptional storm event of 11–13 March 2020 over the SiP is comprehensively investigated via a data analysis and simulation experiment approach in follow-up research. Overall, in almost all the precipitation cases either in climatologies or extremes, a similar spatial precipitation pattern was captured, meaning that the maxima were recorded in the north and the minima in the south of the SiP.
As shown in Fig. 2d–f, the dryness and wetness conditions across the SiP were also explored by computing the simple daily intensity index (SDII), number of consecutive dry days (CDDs), and number of wet days (RR1). It can be seen that the highest SDII is observed in the northeast with an intensity of ≥6 mm d−1. Interestingly, the lowest SDII is not seen in the south (even though the minimum precipitation magnitude and frequency are located there – see Fig. 2a), but in central parts of the SiP with ≤3 mm d−1 (Fig. 2d). CDD is remarkable in the south with ≥500 out of 7305 d, indicating that these areas receive less than 1 mm of rainfall for a long period; however, it gradually decreases northward with ≤300 d (Fig. 2e). Unlike CDD, it is not surprising to observe that RR1 is the lowest in the south (≤100 d) and innermost parts (≤200 d), but it rapidly increases towards the northeast of the region (≥350 d), as shown in Fig. 2f. These results are in good agreement with the abovementioned findings over the SiP.
3.1.2 The wet and dry period monthly precipitation patterns: a multi-statistical analysis
- i.
Percentile approach (Fig. 3a). The monthly 90th percentile of precipitation reveals that percentiles ≥10 mm per month are merely observed from October to March (wet period), while for the period from April to September (dry period) very low or no rainfall is measured, suggesting a prolonged naturally dry period in the SiP. Further, temporally, the winter months receive higher values (of extreme rainfall with 90th percentile) when compared to the autumn months (with <25 mm per month) during the wet period. Spatially, percentile maxima >50 mm per month are only seen in SiP's northeast across the year.
- ii.
Frequency approach (Fig. 3b). The frequency of occurrence of heavy precipitation ≥10 mm d−1 on a monthly basis is almost limited to the wet period of winter months (ranging from 1 to 40 d per month) and autumn months (ranging from 1 to 25 d per month). It is noteworthy that the frequency of occurrence of rainfall ≥20 mm d−1 was reduced by half in comparison with ≥10 mm d−1 occurring mostly in the late autumn and early winter episodes, yet this is limited to only a small part of the northeastern SiP (see Fig. S2). Further, the annual frequency of occurrence of the SiP's rainfall extremes shows that the highest and lowest frequencies with a threshold of ≥5 mm d−1 occurred in the north (ranging between 100 and 250) and south of the SiP (ranging between 20 and 40), respectively. Higher thresholds of ≥10 and ≥20 mm d−1 , however, follow the same spatial pattern as the threshold of ≥5 mm d−1 across the region, but with lower frequencies (see Fig. S1). Nevertheless, the distribution of the frequencies, regardless of their thresholds, is in very good agreement with the spatial pattern of precipitation climatology (Fig. 2a).
- iii.
Standard deviation approach (Fig. 3c). The magnitude of precipitation variability, as given by the standard deviation (SD), reveals a similar spatial pattern to the percentile and frequency patterns across the SiP region. This implies that the northern SiP shows the highest variability with at least 10 mm per month during the wet period, while the reverse is true for the dry period with almost no rainfall except for April and May with the lowest standard deviation (<7 mm per month). Also, variability is largest in March over the northern SiP from a spatial view.
Overall, the results obtained from the three statistics used are quite concordant and compatible with respect to the SiP's spatial precipitation variability on a monthly basis and suggest that (extreme) precipitation events are inherently limited to the wet period from October to March, whereas months from April to September receive very low or no rainfall at all during the dry period (Fig. 3).
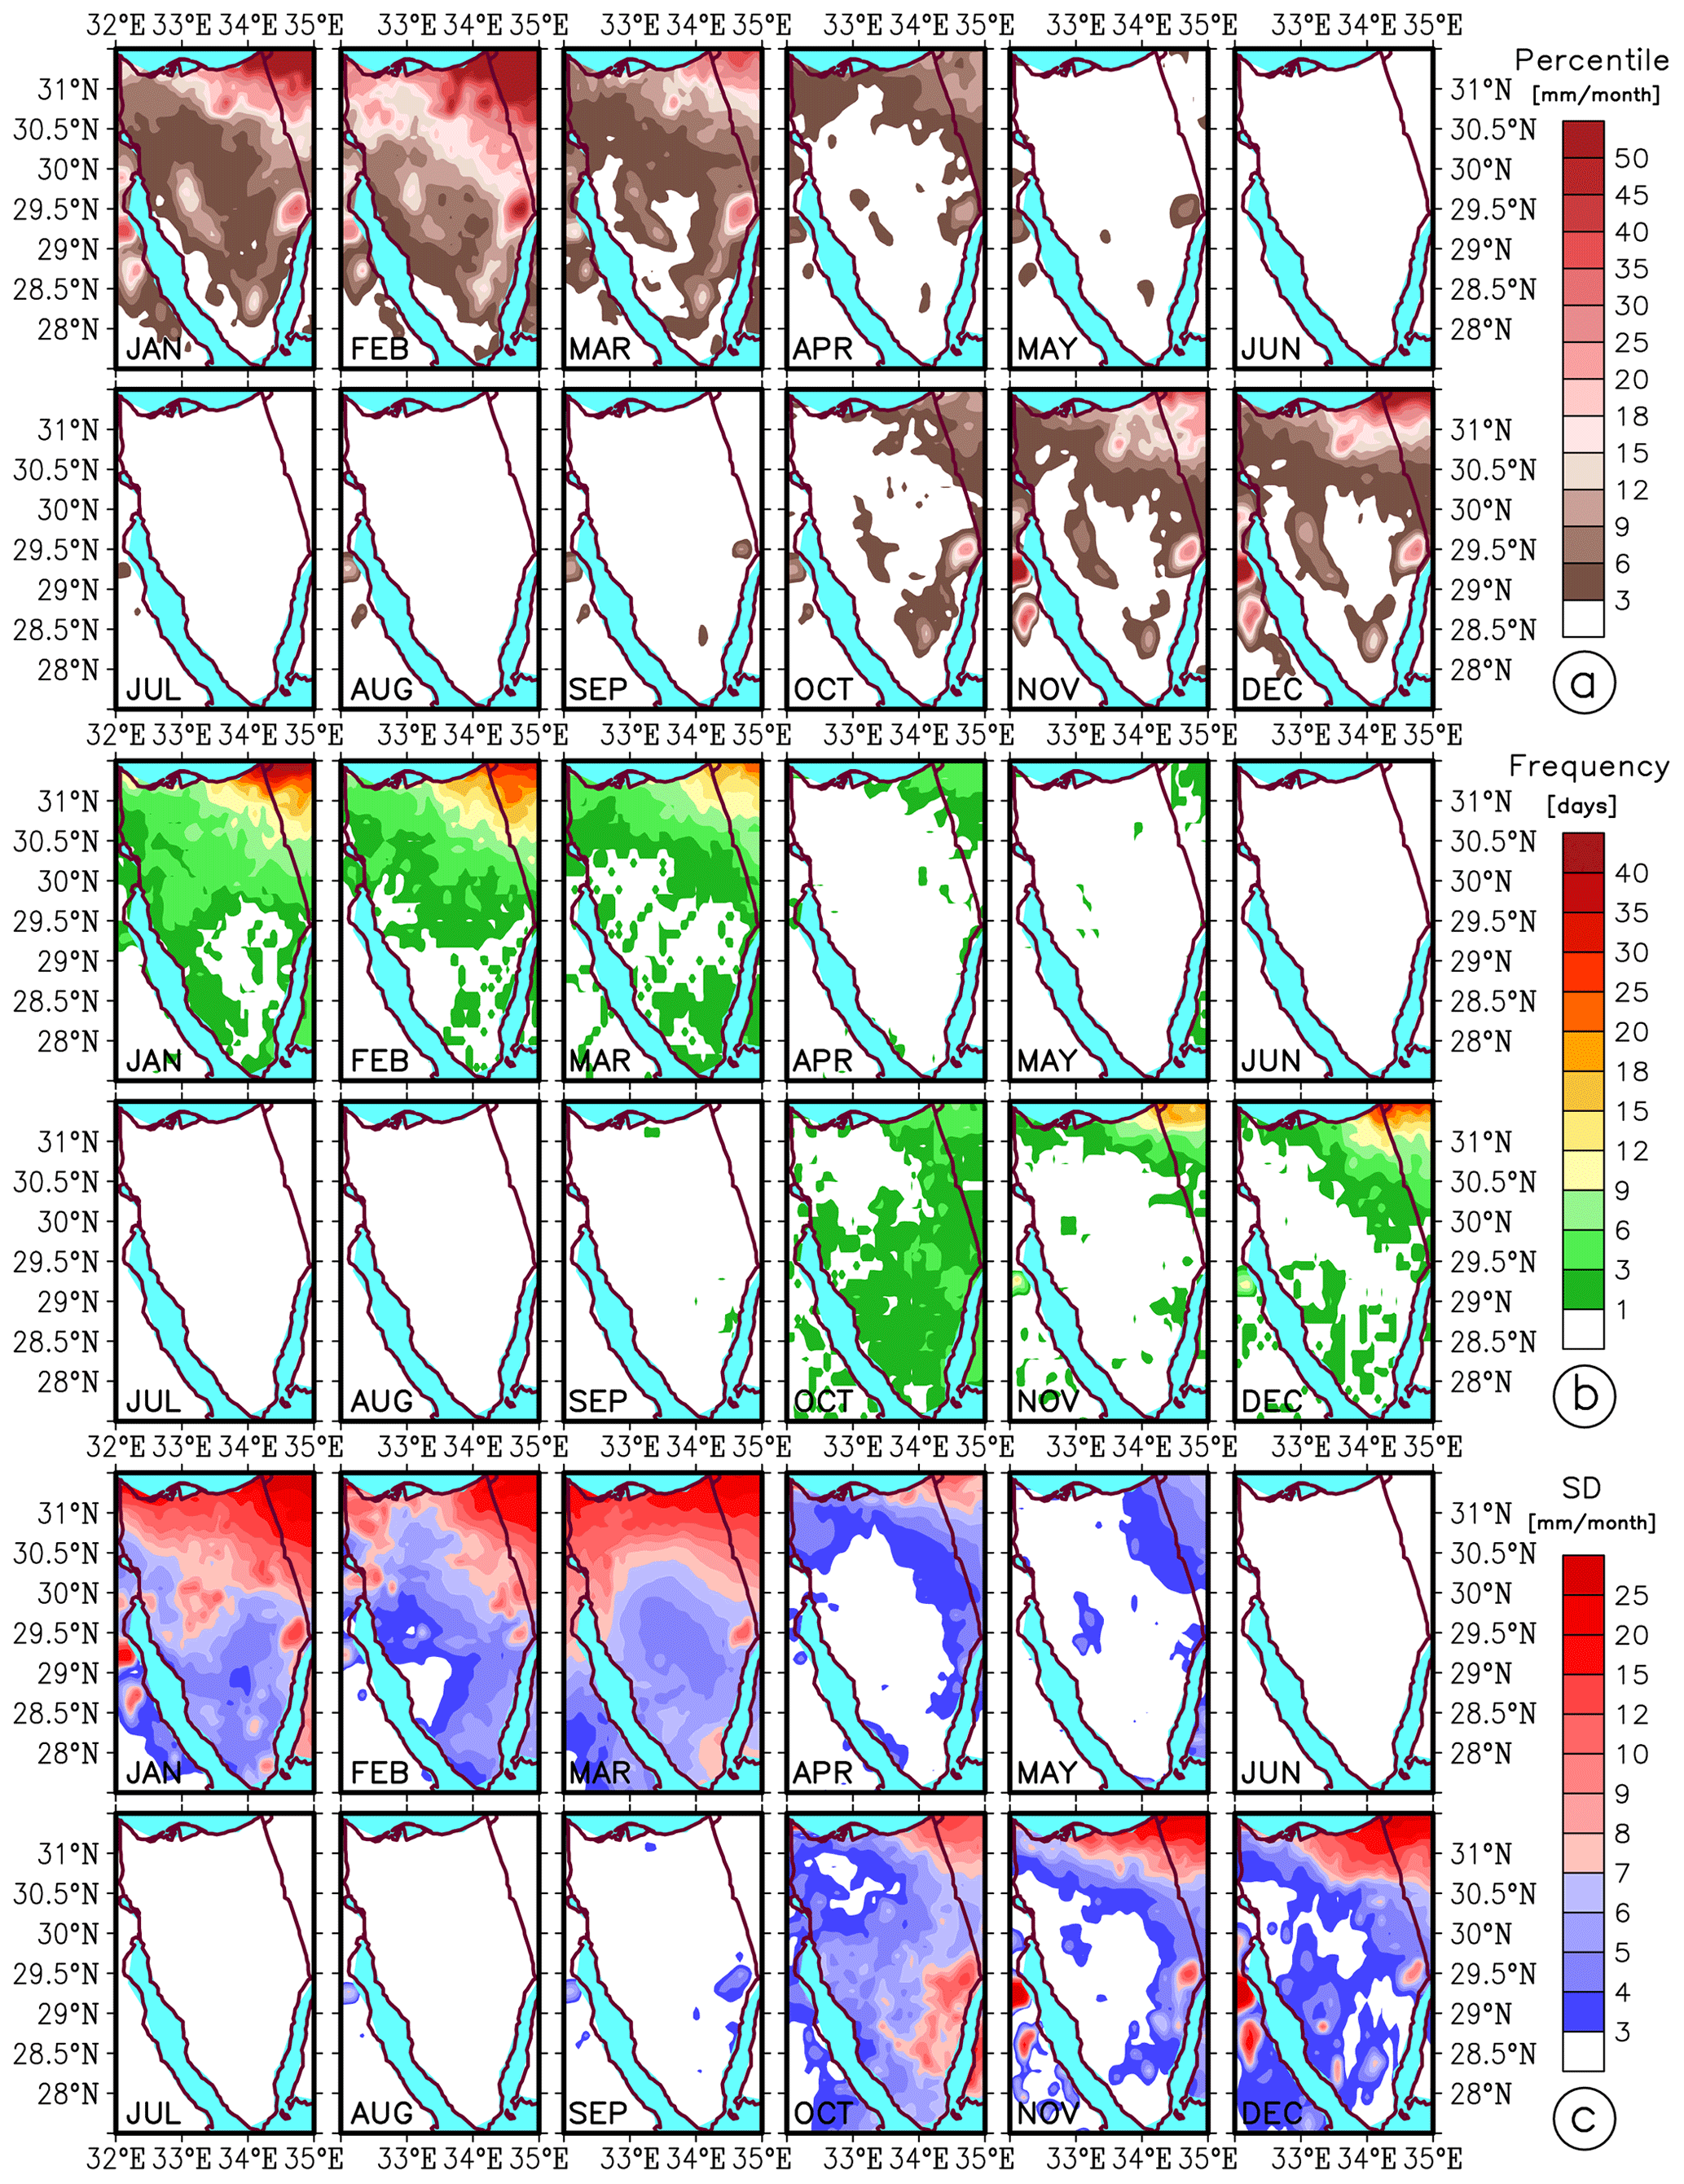
Figure 3A multi-statistical analysis of the precipitation on a monthly basis: (a) the 90th percentile of rainfall climatology, (b) frequency of occurrence of rainfall events with a threshold of ≥10 mm d−1, and (c) grid-based standard deviation estimates of rainfall for the period of 2001–2020 over the Sinai Peninsula (SiP).
3.1.3 Spatiotemporal variations of the precipitation: EOF-based analysis
To investigate the patterns of precipitation variabilities in time and space in the SiP, EOF analysis was performed on the monthly precipitation dataset on the annual scale (Fig. 4). The first two leading EOFs account for 60 % and 11 % of the variance. The EOF1 spatial pattern is entirely in negative mode SiP-wide, indicating a below-average rainfall condition (drier trend), especially in the northern SiP (Fig. 4a). Correspondingly, the PC1 time series indicates a dominant negative temporal variability of EOF1 for the entire period (Fig. 4b). Conversely, it is seen that EOF2 values are mostly in positive mode, showing an above-average rainfall condition (wetter trend) in most parts, in particular in the southern SiP (Fig. 4c), and the positive temporal variability of the EOF2 is mostly seen in recent years, as shown in the PC2 time series (Fig. 4d). However, the northern SiP remains in negative mode, suggesting a severely decreasing trend in the annual precipitation rate when it is combined with EOF1, with 60 % of variance explained.
Besides annual analysis, seasonal spatiotemporal variabilities of the EOF patterns were also calculated separately for the wet period (Fig. S6) and dry period (Fig. S7). We found that annual EOFs and PCs strongly resemble the seasonal EOF spatial patterns and PC temporal variabilities in the SiP's wet period. This implies that both wet period patterns and annual patterns capture a decreasing trend in the north and an insignificant increasing trend in the south of the SiP. It is also noted that grid-based spatiotemporal variations obtained by the EOF analysis are in good agreement with the site-scale anomaly-based temporal changes in the annual and seasonal precipitation trends observed at selected sites across the SiP region (see Fig. S8 for details).
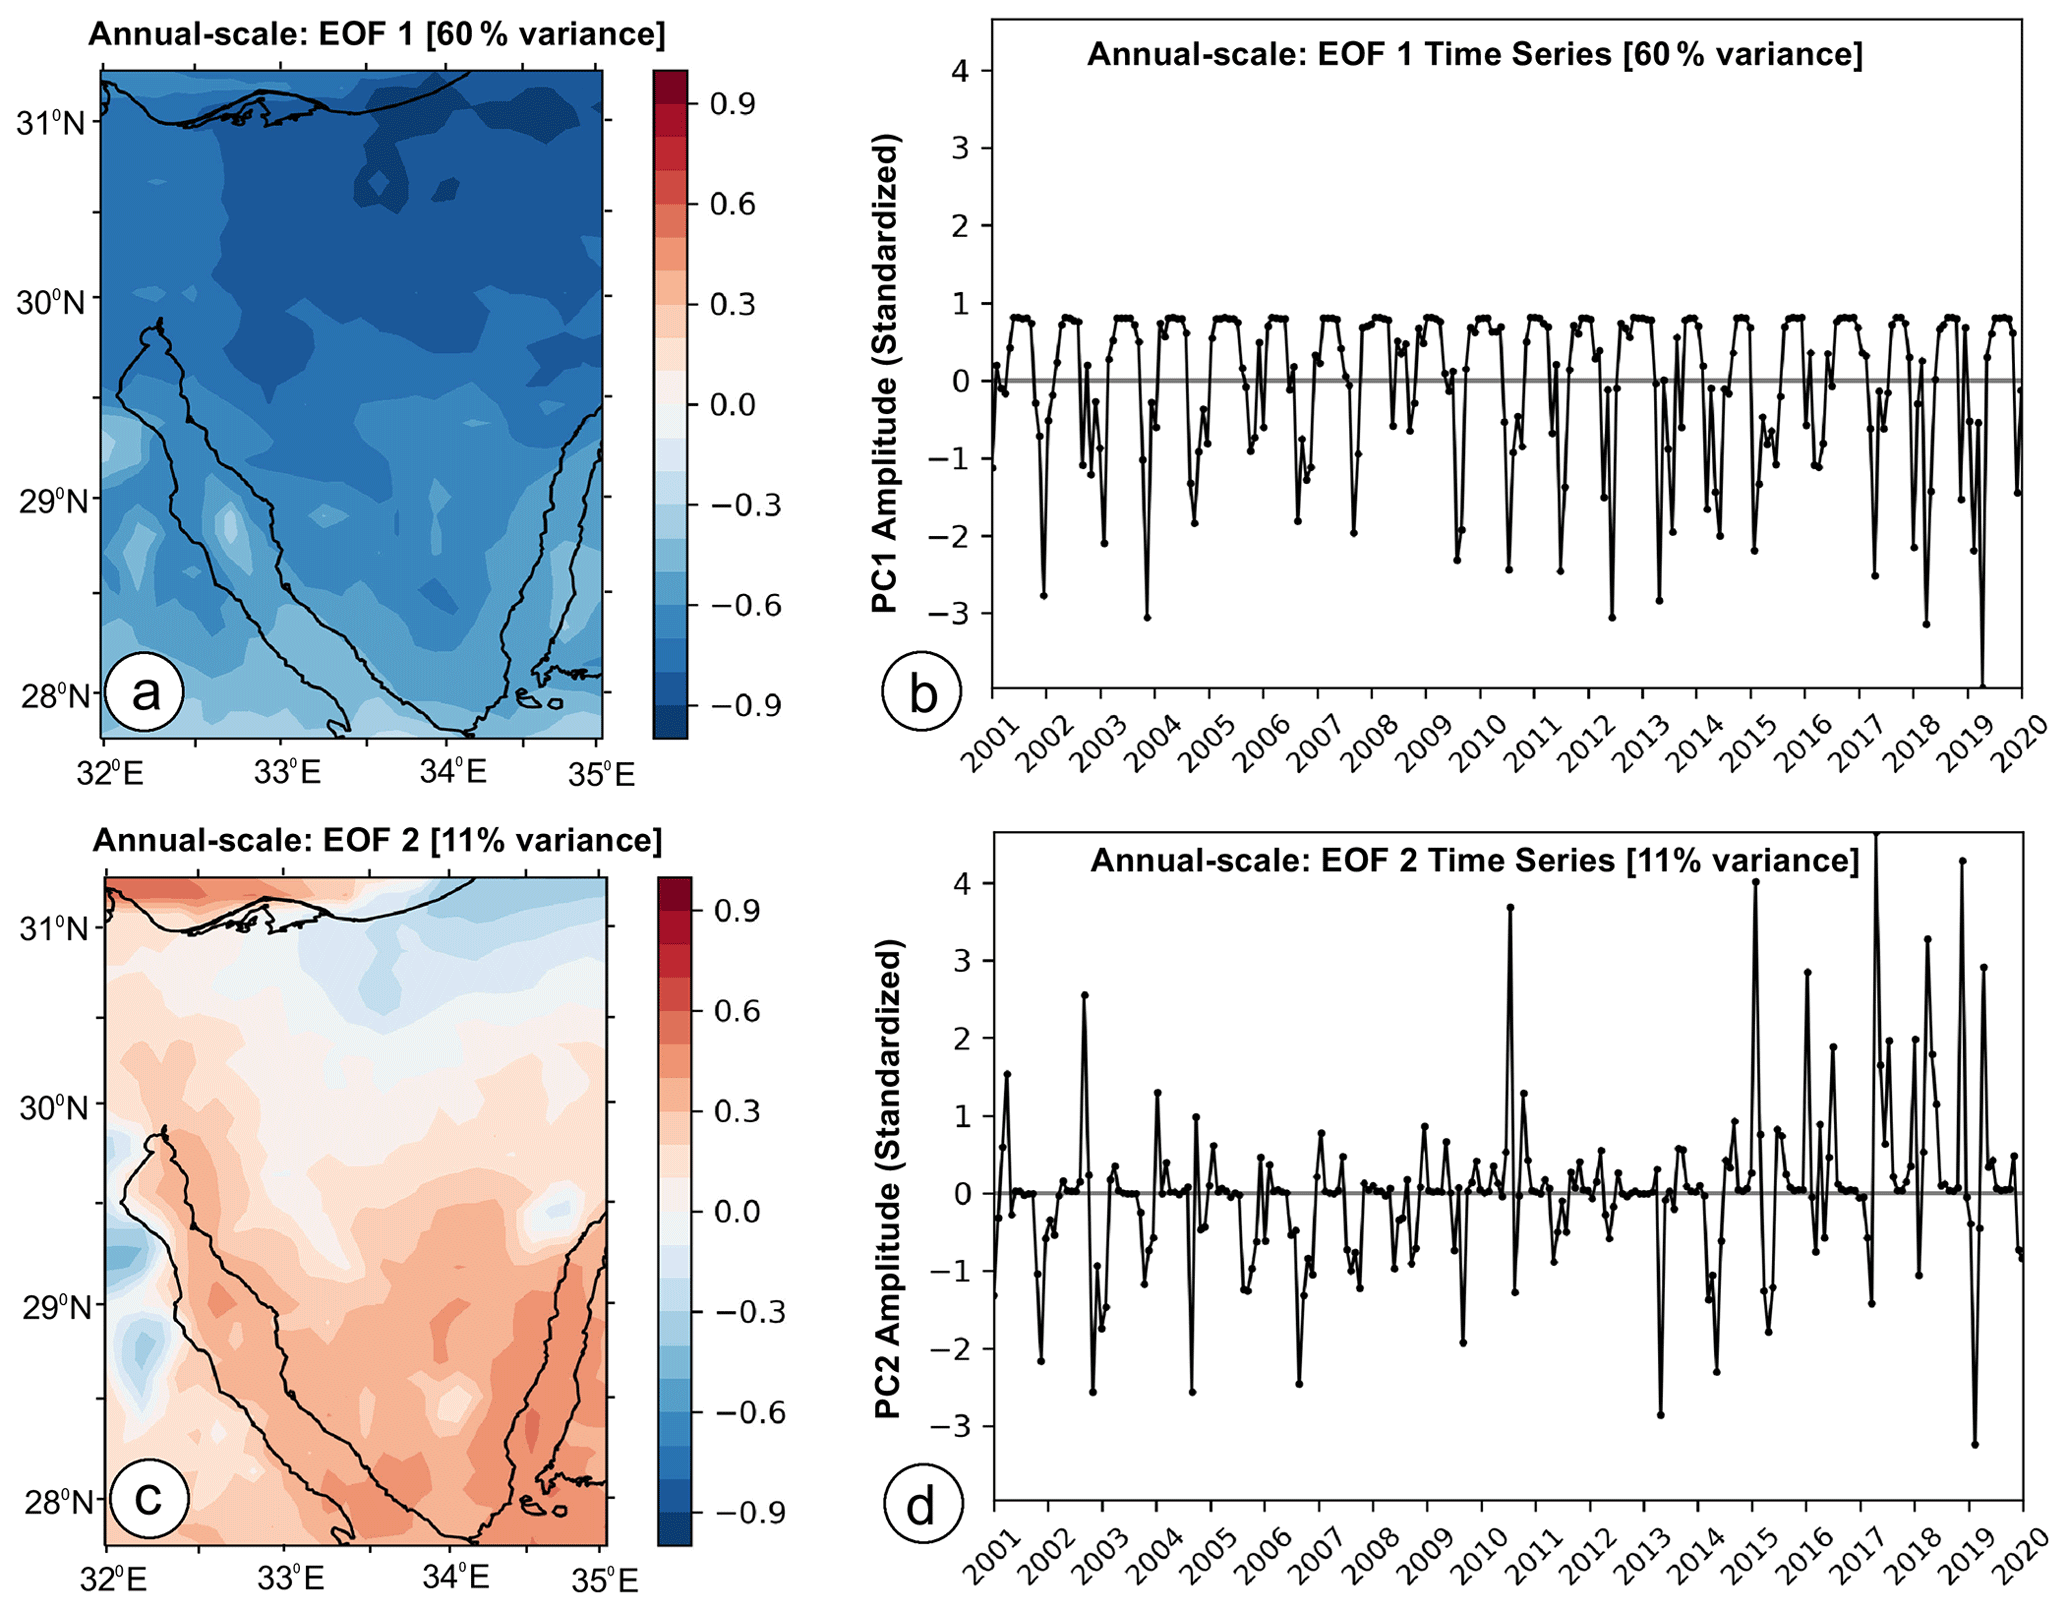
Figure 4The two leading EOF spatial patterns (a, c) and associated time series (b, d) of the monthly mean precipitation dataset (at annual scale) for the period of 2001–2020 (240 months) in the Sinai Peninsula (SiP). The values of EOFs (a, c) are expressed as correlation coefficients.
3.1.4 Monthly regime of the precipitation climatology
Figure 5 represents the precipitation regime climatology concerning the ratios and standard deviation estimates on a monthly basis over the SiP. High (>20 %) ratios of monthly precipitation over annual precipitation are estimated in the winter months of January and February, mostly found in the middle to north of the SiP. March indicates some patches of high ratios in the south and northwest also, as shown in Fig. 5a. However, the period of April to September (colored in black in the legend) receives less than 20 % of the annual precipitation. This implies that the spring and summer months experience longer dry weather periods than the winter season. Considering the autumn months, the areas with a 20 % ratio of annual precipitation remain largely out of the SiP domain, except for a few mini-patches. Therefore, winter is the rainiest season throughout the SiP. The monthly SD estimates (Fig. 5h) also follow a pattern similar to the ratios across the year. This means that temporally winter (summer) months hold the highest (lowest) variation values, and spatially the northern (southern) SiP possesses the highest (lowest) values with a max value of 17.0 mm per month estimated in March in the northeast of the SiP. It is also noted that the full ratios of monthly to annual precipitation for individual months of the year are illustrated in Fig. S9, and the full grid-based SD estimates for the entire SiP on a monthly basis are represented in Fig. 3c, which could provide further details on SiP's precipitation regime climatology.
Furthermore, to compare the precipitation monthly ratios across the SiP, bar charts for the given sites covering the whole SiP were plotted (Fig. 5b–g). The highest and lowest ratios are found in winter and summer months, respectively. However, with a closer look, it becomes clear that the chosen sites do vary in terms of magnitude and trends in the monthly precipitation ratios. For instance, at most sites the highest monthly ratio is observed in February (>18 %), except for the sites located in the SiP southwest (which is January with >19 % – Fig. 5d) and southeast (which is March with >17 % – Fig. 5g). Likewise, an inconsistent seasonal trend is also remarkable for the autumn months, meaning that the northern sites indicate a positive trend from the late summer to the end of autumn (Fig. 5a, b, e). The southern sites, however, represent a contrasting pattern with respect to the monthly rainfall regime (Fig. 5d, f, g).
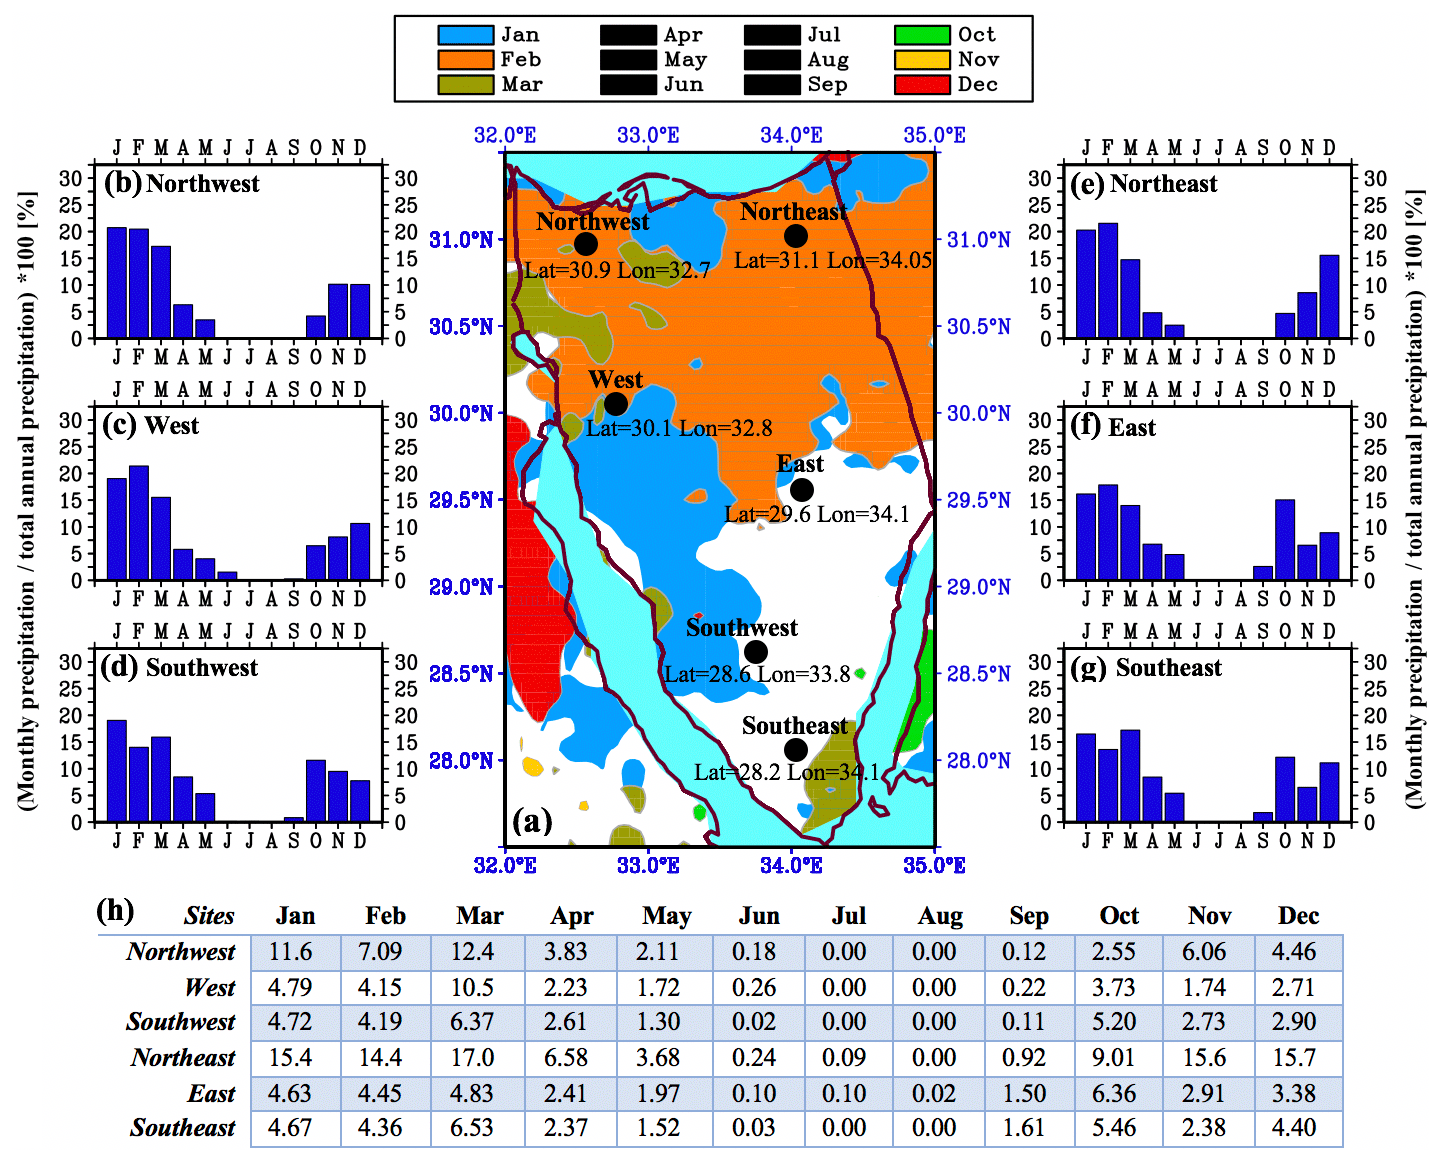
Figure 5Monthly precipitation regime: (a) ratio of monthly precipitation to the annual total precipitation (%), where only ratios >20 % are plotted for each month; panels (b–g) indicate the monthly ratios (January to December) for the selected sites, and panel (h) represents the standard deviation estimates (mm per month) on a monthly basis for each site shown in (a) across the Sinai Peninsula (SiP) for the climatology period of 2001–2020. It is also noted that in (a), monthly ratios from April to September (colored in black in the legend) are below 20 % and thus not plotted here, but full ratios (%) are illustrated in Fig. S9 on a monthly basis. In addition to (h), a full grid-based standard deviation estimate for the entire SiP on a monthly basis is also represented in Fig. 3c.
3.2 Synoptic analysis of the wet and dry periods
Spatial distributions of the monthly mean precipitation amounts and magnitudes indicated a remarkable difference between the wet period (5–70 mm per month) and dry period (1–3 mm per month) for the climatology period of 2001–2020 over the SiP. However, despite large dissimilarity in precipitation values of the wet and dry periods, their spatial pattern climatologies largely resemble each other (see Fig. S10). This implies that the amount of rainfall in both periods is notably increased from the southern parts towards the northeast of the SiP. In the following subsections, therefore, the large- and regional-scale atmospheric systems corresponding to the occurrence of precipitation events during the wet and dry periods of the SiP are explored from a synoptic, dynamic, and moisture condition perspective.
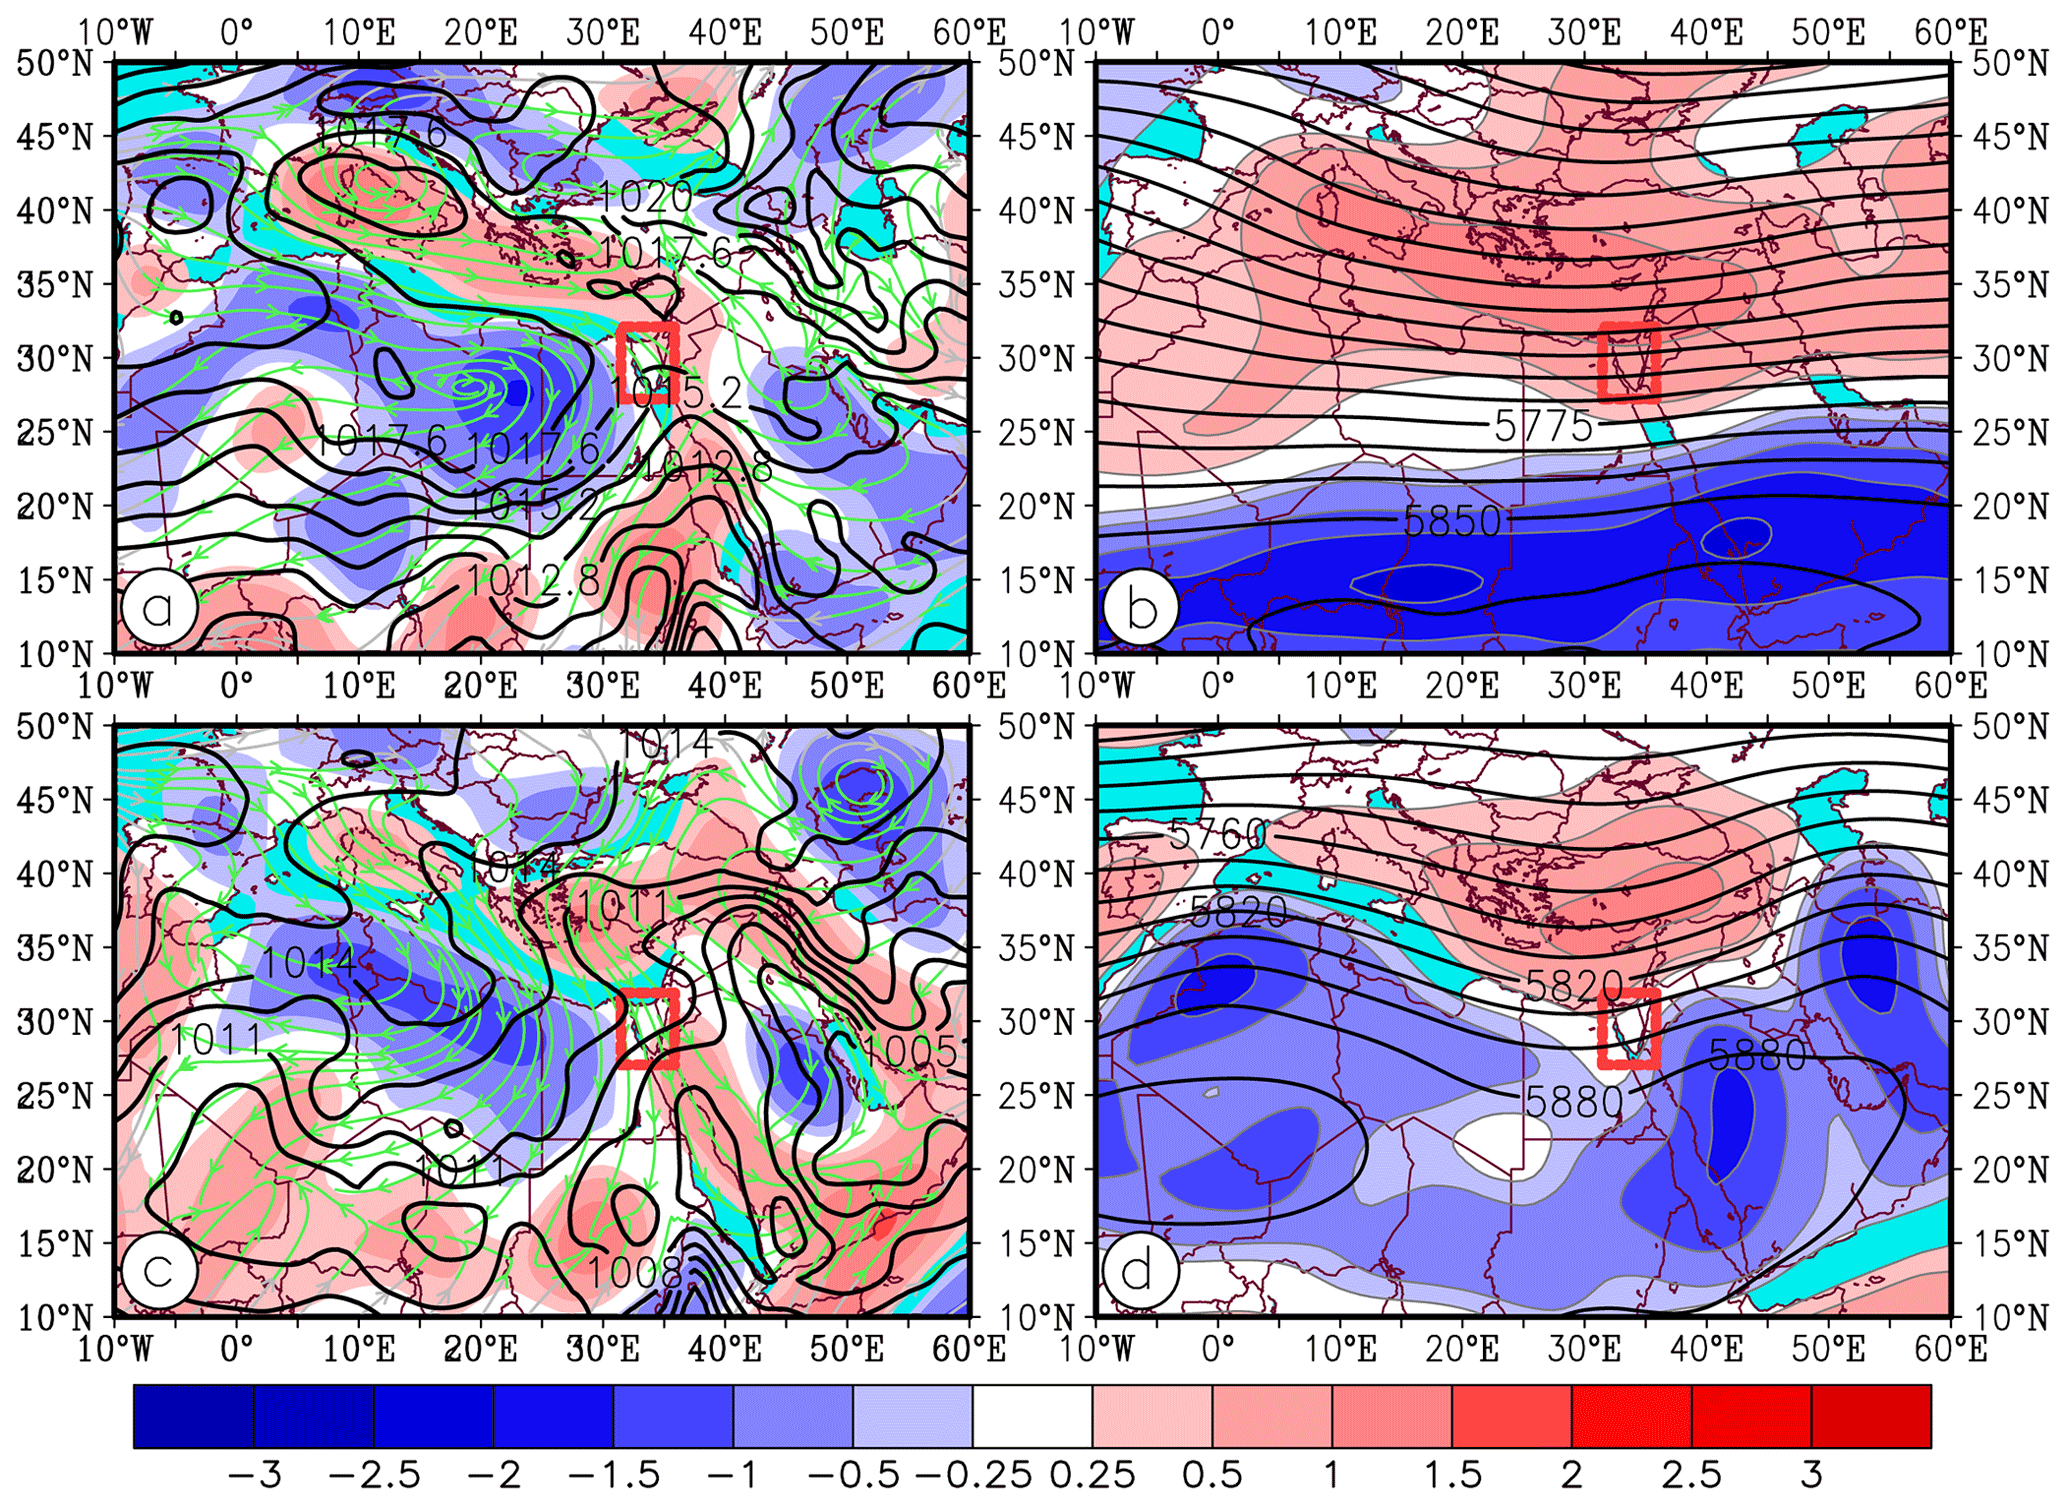
Figure 6Climatology synoptic condition during the wet period from October to March (a, b) and dry period from April to September (c, d) during the period of 2001–2020 over the Sinai Peninsula (SiP) (red box in each panel). (a) Composites of sea level pressure (black contours, hPa), 925 hPa relative vorticity (shading, 10−5 S−1), and streamflow (green streamline). (b) 500 hPa composite of geopotential height (isolines, m) and relative vorticity (shading, 10−5 S−1). (c, d) Same as in (a) and (b), respectively, but for the dry period.
3.2.1 Synoptic patterns and atmospheric circulation structure
Figure 6 represents the climatology of the synoptic patterns and cyclogenesis at the surface and 500 hPa atmospheric levels during the wet and dry periods over the Mediterranean basin including the SiP (marked by a red box). In the wet period at the surface level (Fig. 6a), two major sources of strong cyclonic activities (cyclogenesis) are observed over the Mediterranean western part (at the lee of the Alps over Gulf of Genoa) and eastern part (at the lee of Taurus Mountains over Cyprus) – see Fig. 12 for the locations. These areas are found by the closed SLP contours along with strong positive vorticity in the western and eastern parts of the Mediterranean Sea, respectively. The Cyprus low is allegedly responsible for the occurrence of the majority of rainfall events over the eastern Mediterranean including the SiP. For instance, about 80 % of the rainfall in the cold period of Israel is associated with Cyprus cyclone systems, as pointed out by Saaroni et al. (2010). In the wet period, the Red Sea trough, as a lower-level system, is another significant synoptic system that influences the eastern Mediterranean region, but mostly in the autumn (Ziv et al., 2021). As shown in Fig. 6a, this trough is developed as a result of the coexistence of the eastern African cyclone, namely the Sudan low and Saudi Arabian anticyclone. Its high impact on the eastern Mediterranean area depends on the position of the Red Sea trough axis: that is, the eastern position, as pointed out by, e.g., Saaroni et al. (1998) and Tsvieli and Zangvil (2005). However, the impact of the Red Sea trough on SiP's precipitation is limited compared to the northeastern parts of the Mediterranean basin, mostly due to the geographical location of the SiP. In line with lower levels, the pressure pattern at 500 hPa shows a synoptic-scale trough (of the persistent low center) with high positive vorticity, providing a suitable condition for the occurrence of rainfall events over the Mediterranean region extending towards the Middle Eastern areas (Fig. 6b).
In contrast to the wet period, the surface-level pattern of the dry period differs strongly over the region (Fig. 6c). In the dry period, hardly any cyclones are produced in the western Mediterranean as it is dominated by high-pressure systems extending from the North Atlantic Ocean and north of Africa. Limited low-pressure systems, however, are typically developed over the eastern Mediterranean. This is due to the formation of a trough extending from the Persian Gulf (which develops as the result of the topographic impact of the Zagros Mountains in western Iran) via the Taurus Mountains in southern Turkey into the eastern Mediterranean basin (see Fig. 12 for the locations). The SiP region located in the southeastern Mediterranean basin, as shown in Fig. 6c, is highly influenced by the ridge of the North African so-called Azores anticyclone rather than the Persian trough that mostly impacts the northeastern Mediterranean. Thus, at the midlevel of 500 hPa geopotential height, the eastern Mediterranean is mostly subjected to persistent air subsidence, and only a limited trough is formed with relatively high positive vorticity over the eastern Mediterranean (Fig. 6d). This prevents rainfall to a large extent over the region during the dry period. Therefore, the SiP receives much less precipitation in terms of magnitude and frequency compared to that received over the northeastern parts (such as Israel) of the Mediterranean basin. These results are in good agreement with the findings reported by Alpert et al. (1990) and Saaroni and Ziv (2000).
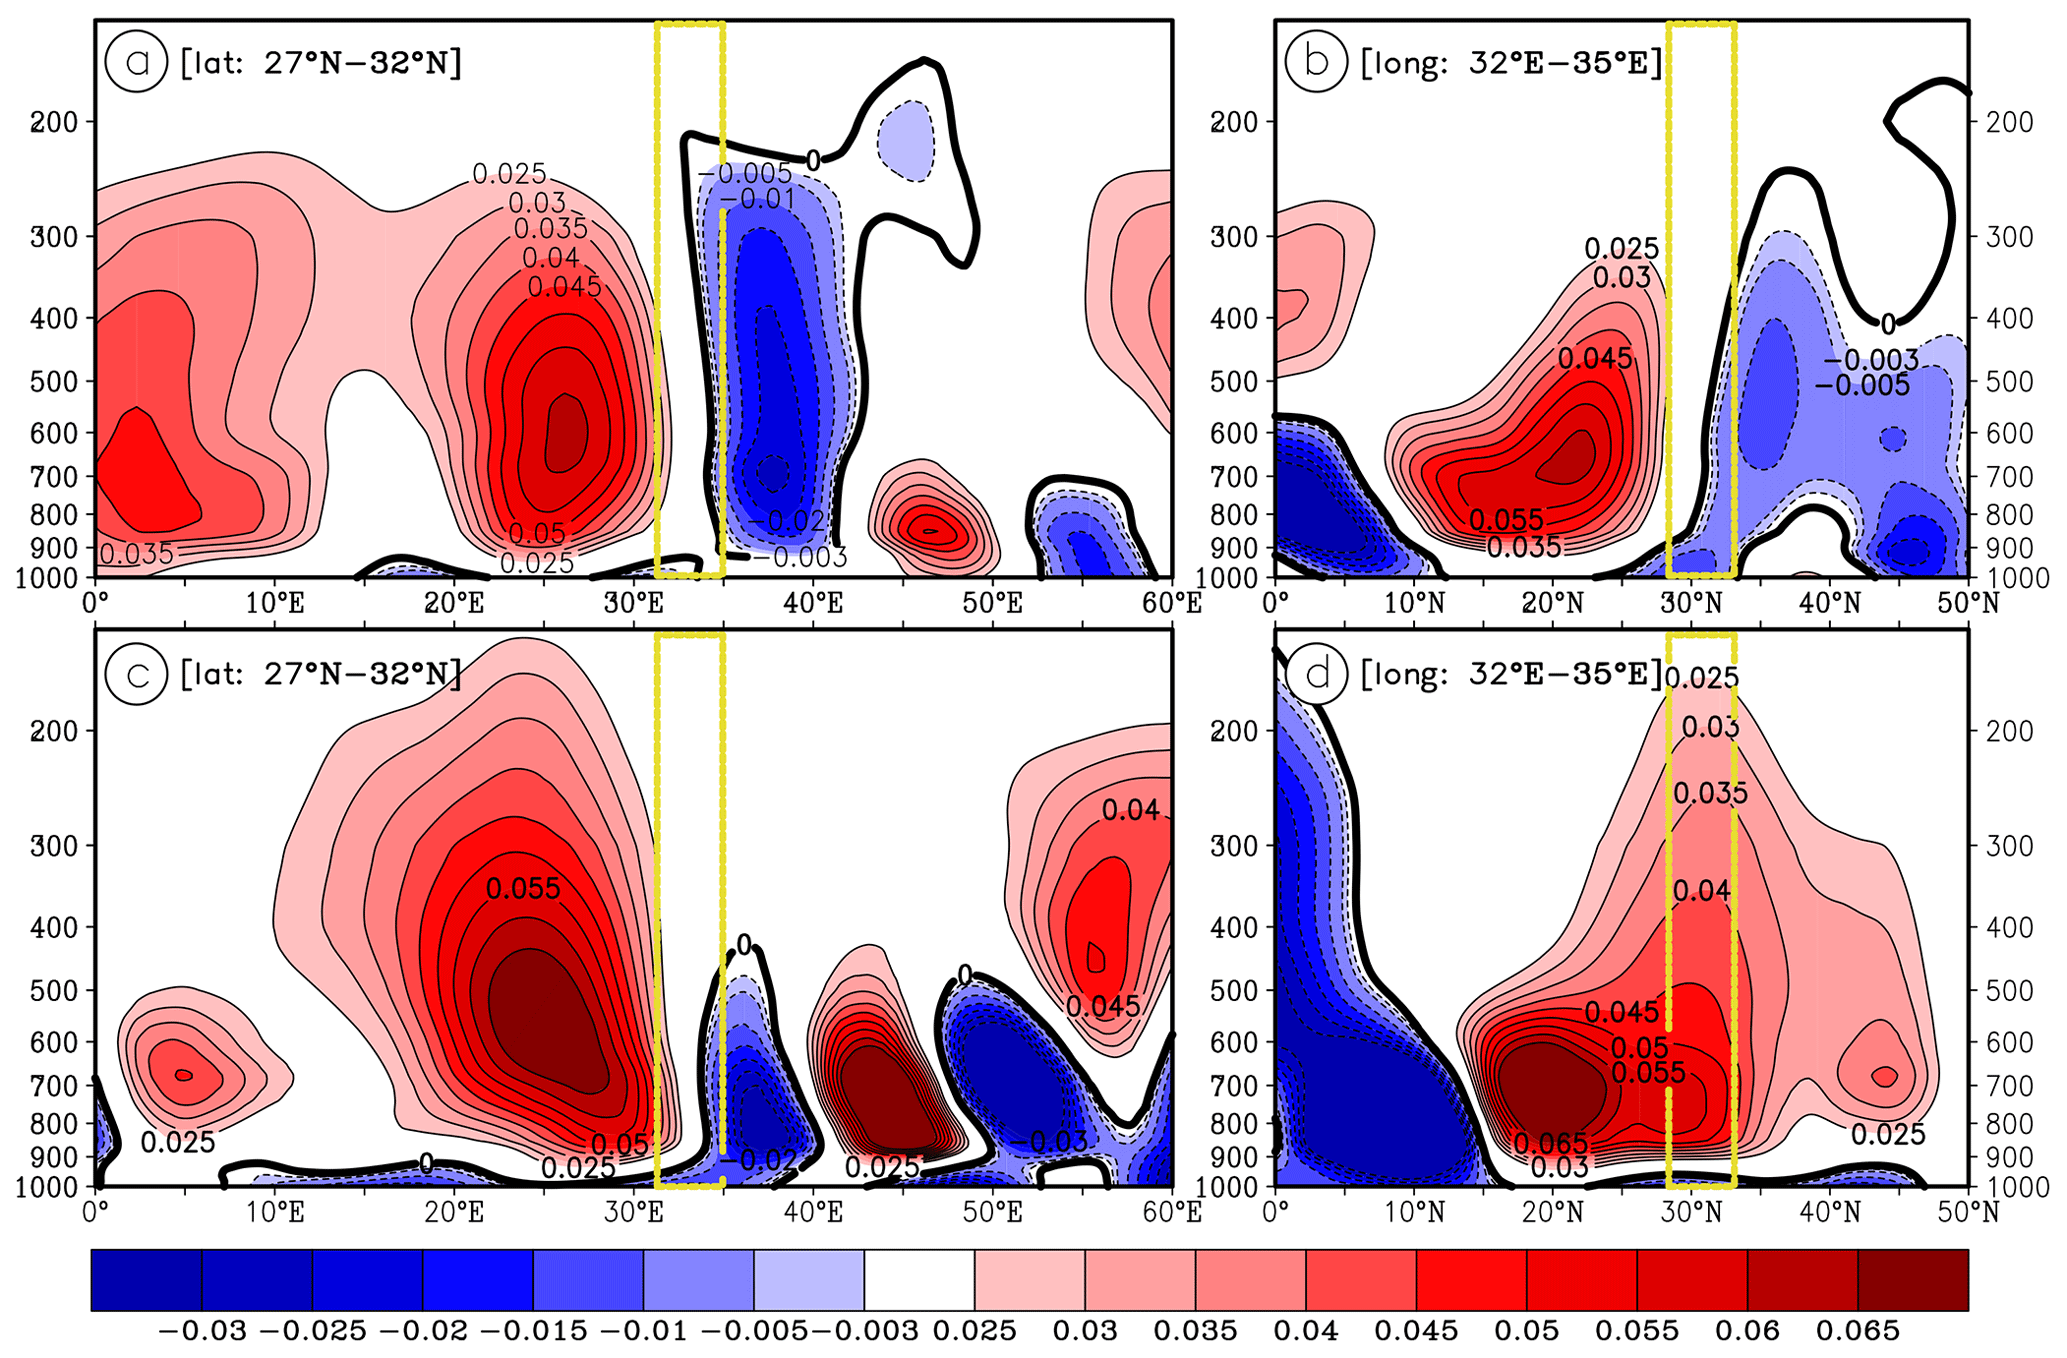
Figure 7Vertical velocity cross-section (omega: Pa s−1) for the wet period of October to March (a, b) and dry period of April to September (c, d) over the period of 2001–2020. Omega values averaged for the latitudes 27–32∘ N across the longitude (a, c) and for the longitudes 32–35∘ E across the latitude (b, d). The yellow box in the panels indicates the location of the Sinai Peninsula (SiP).
Besides the synoptic pressure systems described above, the vertical velocity motions (omega) could further reveal discrepancies between the wet and dry periods from a dynamical perspective. An increase in synoptic precipitation events over the wet period is inevitably attributed to the existence and duration of strong rising parcels of air and upward vertical streams over the SiP and in the nearby regions. The omega cross-section along the longitude (Fig. 7a) represents a maximum core with a negative value of −0.03 Pa s−1 at 800–700 hPa levels (above 36∘ E) extending up to 250 hPa. It also indicates that, unlike the western parts, the eastern parts of the SiP experience a relatively strong rising condition at multiple levels of the atmosphere during the wet period. A similar pattern analogous to the longitude cross-section is also observed along the latitude (Fig. 7b). This means that the maximum core of vertical velocity with the value of −0.006 Pa s−1 is seen towards the northeast of the Sinai (below 35∘ N), in particular at higher levels. However, when it comes to the dry period, a much weaker negative omega is observed, mostly limited to lower levels of the atmosphere along the longitude (Fig. 7c), and it is allegedly positive (sinking), in particular in the southern parts of the Sinai along the latitude (Fig. 7d). In such circumstances, the rising of air is strictly restricted. This (Fig. 7) therefore further clarifies, among others, why the northeastern parts of the SiP receive a higher (intense) amount of precipitation compared to the rest of the SiP: that is, partially due to the stronger vertical velocity motions in both the dry and especially wet periods.
3.2.2 Moisture transport and wind structure
Figure 8 illustrates the climatology of moisture conditions and wind patterns separately for the wet and dry periods in the SiP (red box) and in the nearby areas. Overall, a remarkable difference is observed with regard to the moisture availability during the wet and dry periods in the region, especially over the SiP. During the wet period, the prevailing westerlies at 850 hPa (which is typically considered the condensation level) over the Mediterranean Sea along with the presence of an anticyclonic circulation pattern over the north of Africa transferred abundant moisture (on average 50 %–70 %) to the eastern parts of the Mediterranean basin including the SiP (Fig. 8a). Also, the vertical cross-sections of moisture content and wind profile at pressure levels indicate that the majority of the moisture needed for condensation is found at lower levels (950–850 hPa) over the region (Fig. 8b). The abovementioned moisture and wind patterns, however, largely differ (RH reduced on average 25 %–45 %) during the dry period at the 850 hPa level (Fig. 8c) and pressure levels (Fig. 8d). This could be the result of the displacement of northern Africa's high-pressure center towards the higher latitudes (from 25 to 30∘ N), which resulted in the development of northwesterly streams over the region. Thus, unlike the wet period, less moisture is transferred into the SiP during the dry period.
3.2.3 Spatial correlation analysis
In this section, daily-scale relationships of SiP's precipitation associated with the regional atmospheric variations responsible for the occurrence of wet and dry periods are explored. Figure 9a and b show the spatial correlation patterns between SiP's rainfall and regional sea level pressure (SLP) during the wet period and the dry period, respectively. A negative correlation () is seen over the SiP. This indicates that there is a strong association between higher rainfall events (magnitude and frequency) and lower surface pressure fields over the eastern Mediterranean including the SiP in the wet period (Fig. 9a). In contrast, a positive correlation (r=0.25) is found between the rainfall and SLP over SiP (Fig. 9b), highlighting the dominance of high-pressure fields over the region that restrict rising of the air during the dry period. The spatial patterns at the midlevel of 700 hPa also represent a negative correlation () between SiP's rainfall and geopotential height (HGT) during the wet period (Fig. 9c).
A similar spatial pattern with a higher correlation coefficient () is also observed in the dry period. However, a significant decrease in the region's rainfall could be justified by the predominance of subtropical high-pressure centers and an increase in HGT during the dry period; thus, a meaningful relationship is formed between the two (Fig. 9d). The potential vorticity (PV) at the low level of 1000 hPa correlates positively with the rainfall in both wet and dry periods, indicating a cyclonic circulation in the lower atmosphere over the SiP region. However, positive PV (r=0.12) dominated the eastern Mediterranean including the SiP during the wet period (Fig. 9e), whereas its impact remarkably diminished over the region in the dry period (Fig. 9f), resulting in a decrease in precipitation in the eastern Mediterranean basin.
A coupling correlation pattern, as shown in Fig. 10, is observed concerning the precipitation and the meridional wind (V wind) at the 925 hPa level over the SiP during the wet period (Fig. 10a). This indicates that SiP's precipitation is positively correlated (r=0.12) with the southerlies found across the Middle East with a core in Mesopotamia (see Fig. 12 for the locations) but negatively correlated () with the northerlies found over the central–eastern Mediterranean and north of Africa. This provides a suitable condition for moisture transport from the Red Sea (by the southerlies) and the Mediterranean Sea (by the northerlies) into the study area. In contrast, the region is dominated by southerly winds during the dry period (Fig. 10b), which limits the role of the Mediterranean in feeding the region with abundant moisture; thus, rain events are largely reduced. Interestingly, likewise, for the V wind, a similar coupling pattern is also observed between precipitation and zonal wind (U wind) at the 925 hPa level over the area during the wet period (Fig. 10c). In such circumstances, SiP's rainfall positively correlates (r=0.15) with westerlies over the eastern Mediterranean basin. However, in the dry period (Fig. 10d), SiP's precipitation is largely associated with the negative predominant westerlies over Mesopotamia and the north of Saudi Arabia. Finally, SiP's wet period precipitation correlates negatively () with the omega in the lower atmosphere (at 850 hPa, Fig. 10e) over the eastern Mediterranean basin, indicating a strong vertical velocity. The relationships of SiP's rainfall and vertical velocity are largely weakened () during the dry period (Fig. 10f), thus limiting the rising of air to a large extent.
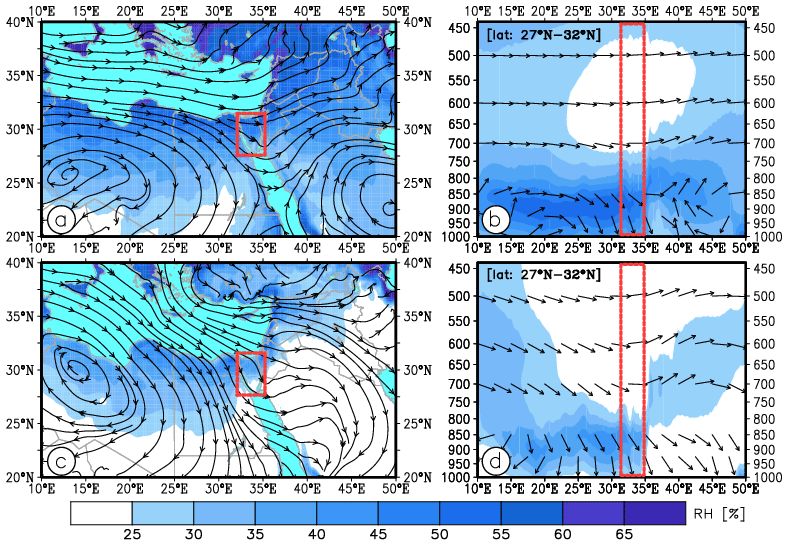
Figure 8Climatology moisture condition (2001–2020) during the wet period (a, b) and dry period (c, d): panels (a, c) indicate 850 hPa relative humidity (RH) and wind streams, and panels (b, d) indicate the vertical cross-sections of RH and wind profiles averaged for latitudes 27–32∘ N. The red box in the panels indicates the location of the Sinai Peninsula (SiP).
3.3 Cyclone tracking in the wet and dry periods
Figure 11 displays the daily tracks of cyclones precipitating ≥10 mm d−1 over the SiP in wet and dry periods for the climatology period of 2001–2020. Total numbers of cyclones during the wet and dry periods were found to be 125 and 31 cases, respectively. The cyclones of each period were classified into five categories (see Table 2) based on the total rainfall received across the SiP. During the wet period, the majority of the cyclone systems (75 %) occur within categories 1 and 2 (rainfall ranged 10–30 mm d−1). This implies that less significant storms have struck the SiP during the wet period. Yet, about 15 % of the cyclones (with a rainfall >40 mm d−1) are potentially able to produce torrential rainfall, which may lead to flash floods over the region. Concerning cyclogenesis, the Mediterranean Sea plays a significant role in either cyclogenesis or strengthening the cyclones passing through the area (Alpert and Shay, 1994; Flocas et al., 2010; Almazroui et al., 2014); this point becomes clear by looking at Fig. 11a. However, considerable numbers of the cyclonic systems are also generated either in the North Atlantic Ocean (then, transferred into the region via passenger cyclones) or as the result of the Red Sea trough (Krichak et al., 1997; de Vries et al., 2013; Hochman et al., 2020).
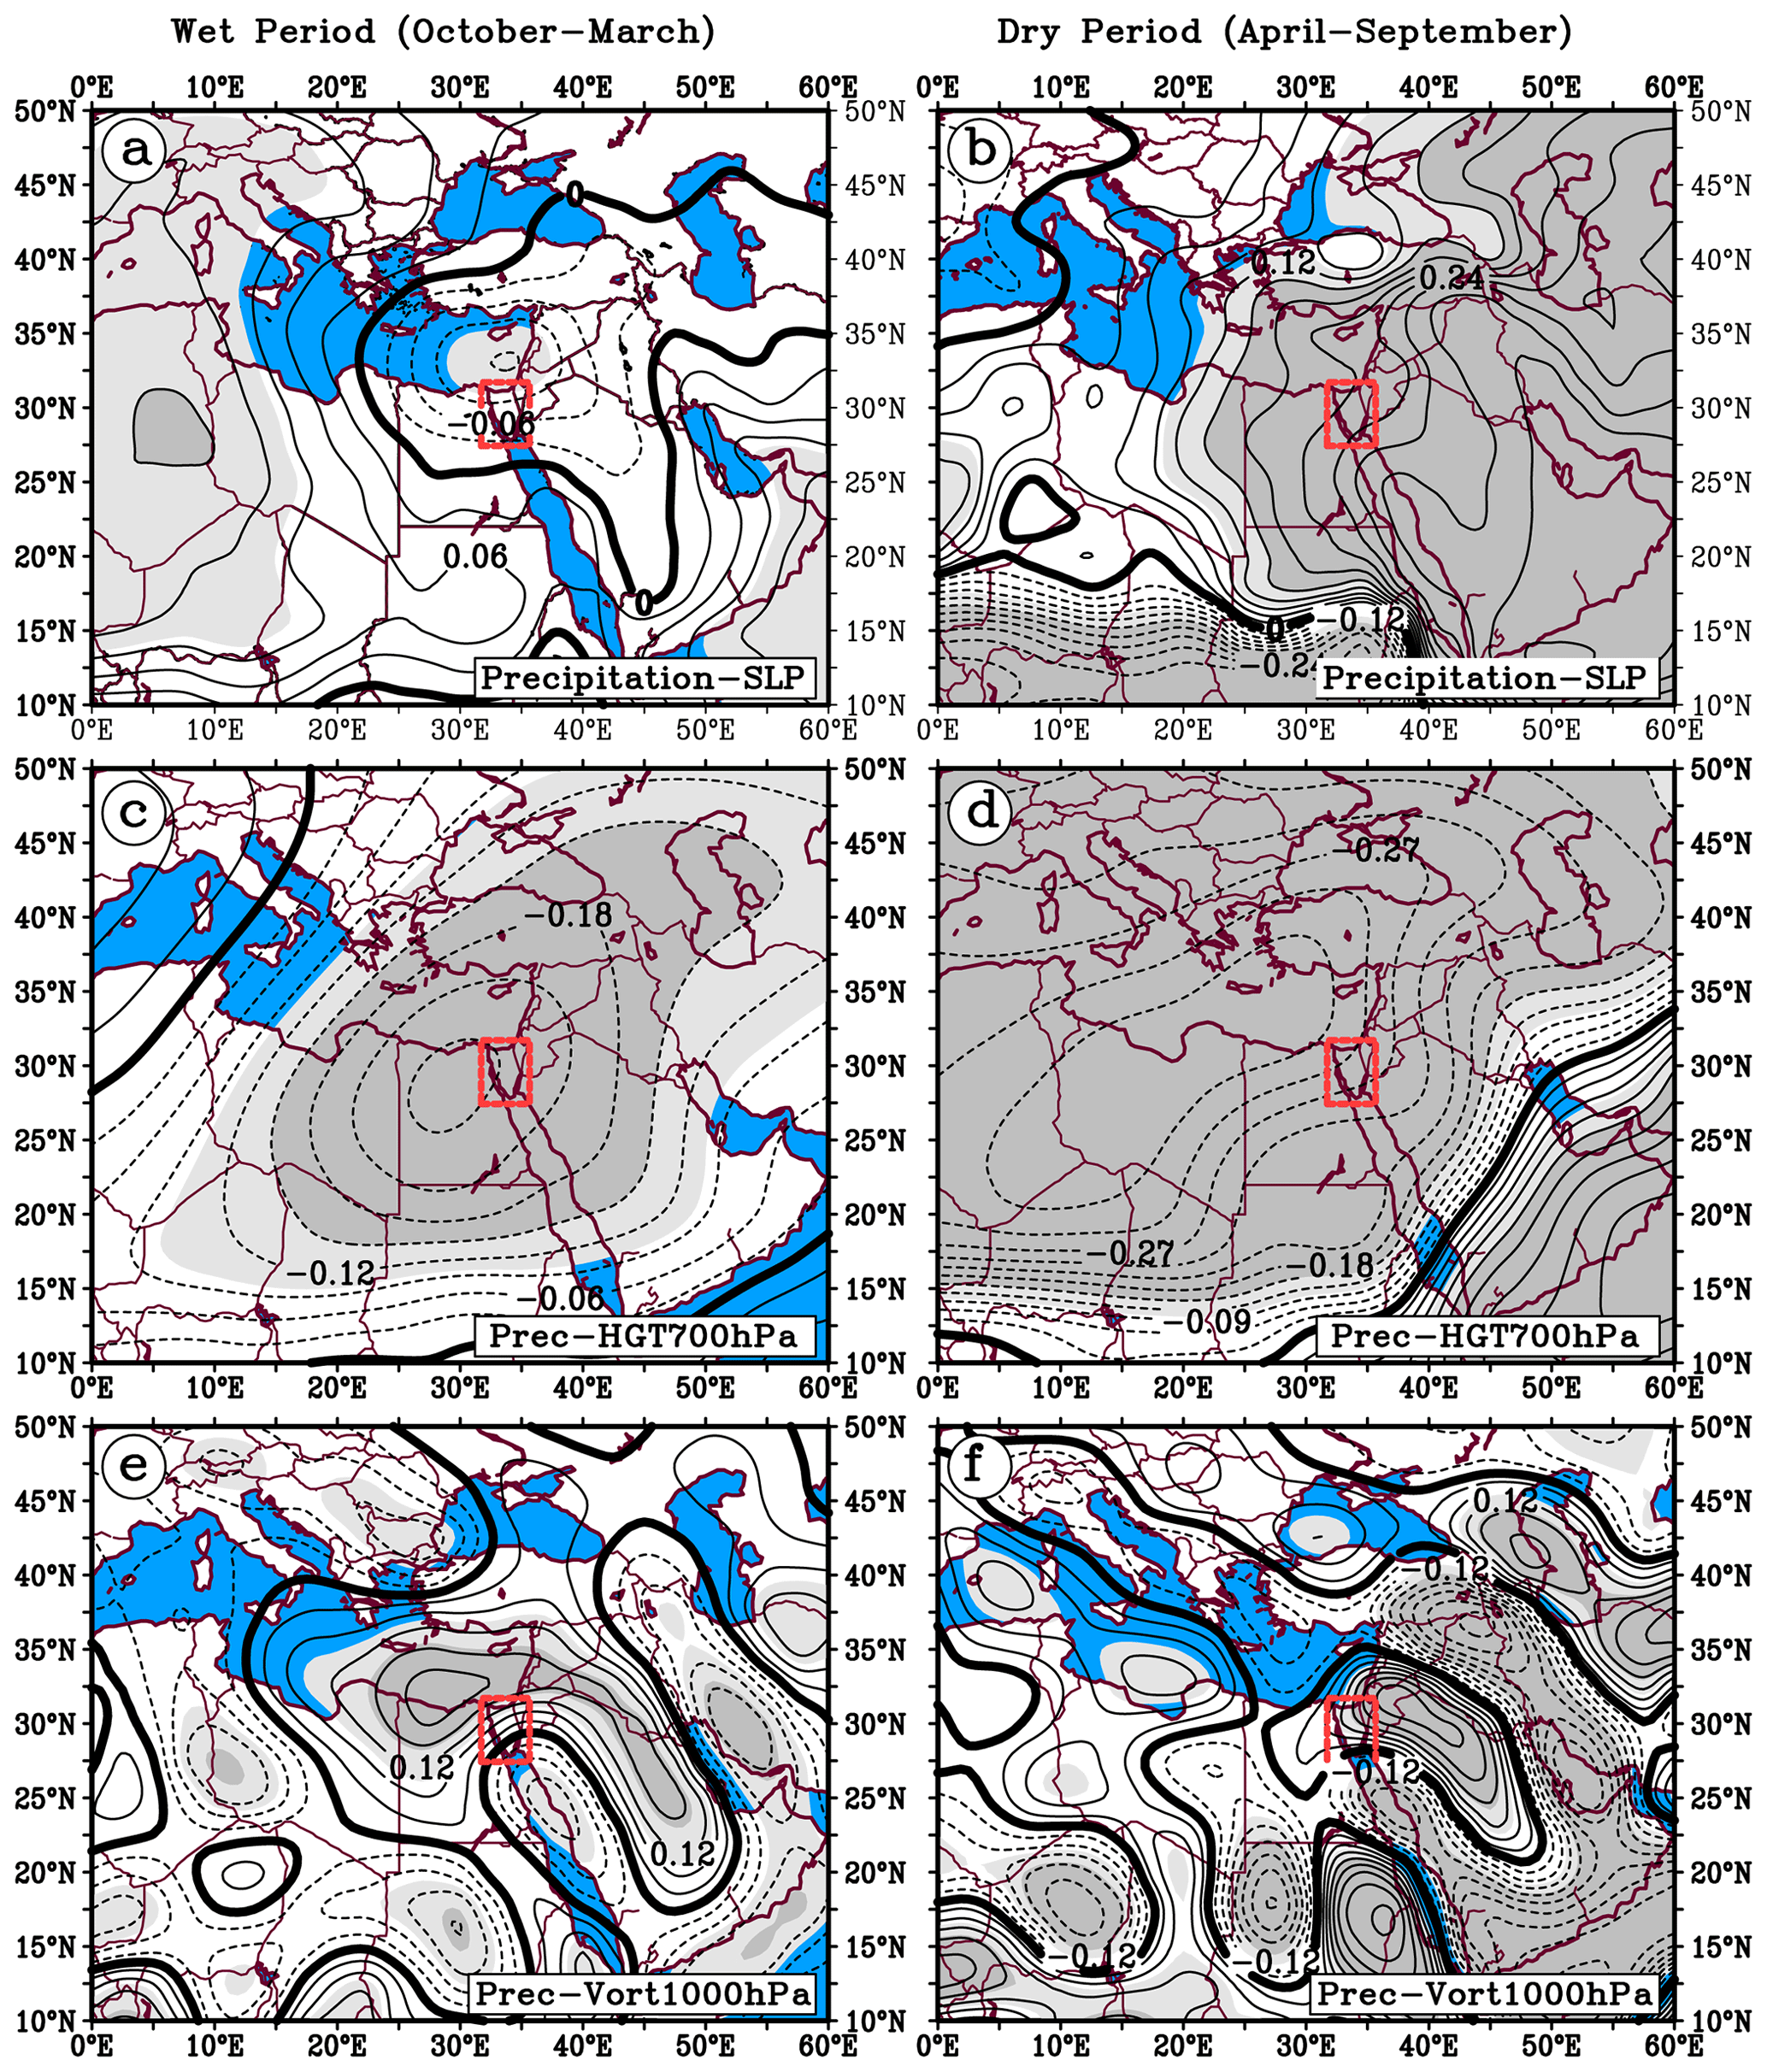
Figure 9Spatial correlation patterns between the daily precipitation amount averaged over the Sinai Peninsula (SiP) (red box in each panel) and key regional atmospheric variables in the wet period (a, c, e) and dry period (b, d, f) for the period of 2001–2020. In each panel, the correlation is calculated between precipitation and (a, b) SLP, (c, d) geopotential height (HGT) at 700 hPa, and (e, f) relative vorticity (RV) at 1000 hPa. Statistical significance at the 95 % and 99 % levels is shown in light gray and dark gray, respectively.
Figure 11b also shows the daily tracks of 31 cyclones that passed through the SiP region during the dry period. Unlike the wet period (Fig. 11a), not only the number of cyclones was significantly reduced but also their magnitudes. The highest frequency of cyclones, according to Table 2, occurs in category 1 with 27 cyclones (87 %), followed by only 4 cyclones (13 %) in category 2, which formed within the Mediterranean (unlike category 2 of the wet period) and then moved eastwards. Interestingly, no cyclonic systems with rainfall >10 mm d−1 have taken place within the past 20 years during the dry period over the SiP.
Table 2Cyclone-tracking characteristics over the Sinai Peninsula (SiP) for the period 2001–2020.
The main focus of this study remains on quantifying extreme precipitation events from a statistical and synoptic perspective over the SiP in the eastern Mediterranean basin over the past 2 decades. SiP's literature is poor, meaning that, although several (relevant) studies have been conducted over the eastern Mediterranean (e.g., Krichak et al., 1997; Alpert et al., 2002; Gabella et al., 2006; Nastos et al., 2013; Mathbout et al., 2018; Rinat et al., 2021), minimal studies are available over the SiP, mostly focused on heavy rainfall-related flash floods (El Afandi et al., 2013; Dadamouny and Schnittler, 2016; Arnous and Omar, 2018; Baldi et al., 2020; ElFakharany and Mansour, 2021). Thus, the novelty of this research is a combination of satellite reanalysis approaches for a climatology data analysis. This enabled us to quantify the precipitation characteristics (e.g., spatial patterns, spatiotemporal variability, frequency, standard deviation, and monthly regime) and to discover the major synoptic systems (e.g., cyclogenesis, atmospheric circulation pattern, moisture condition, spatial correlation, and cyclone tracking) contributing to the occurrence of heavy rainfall across the SiP region.
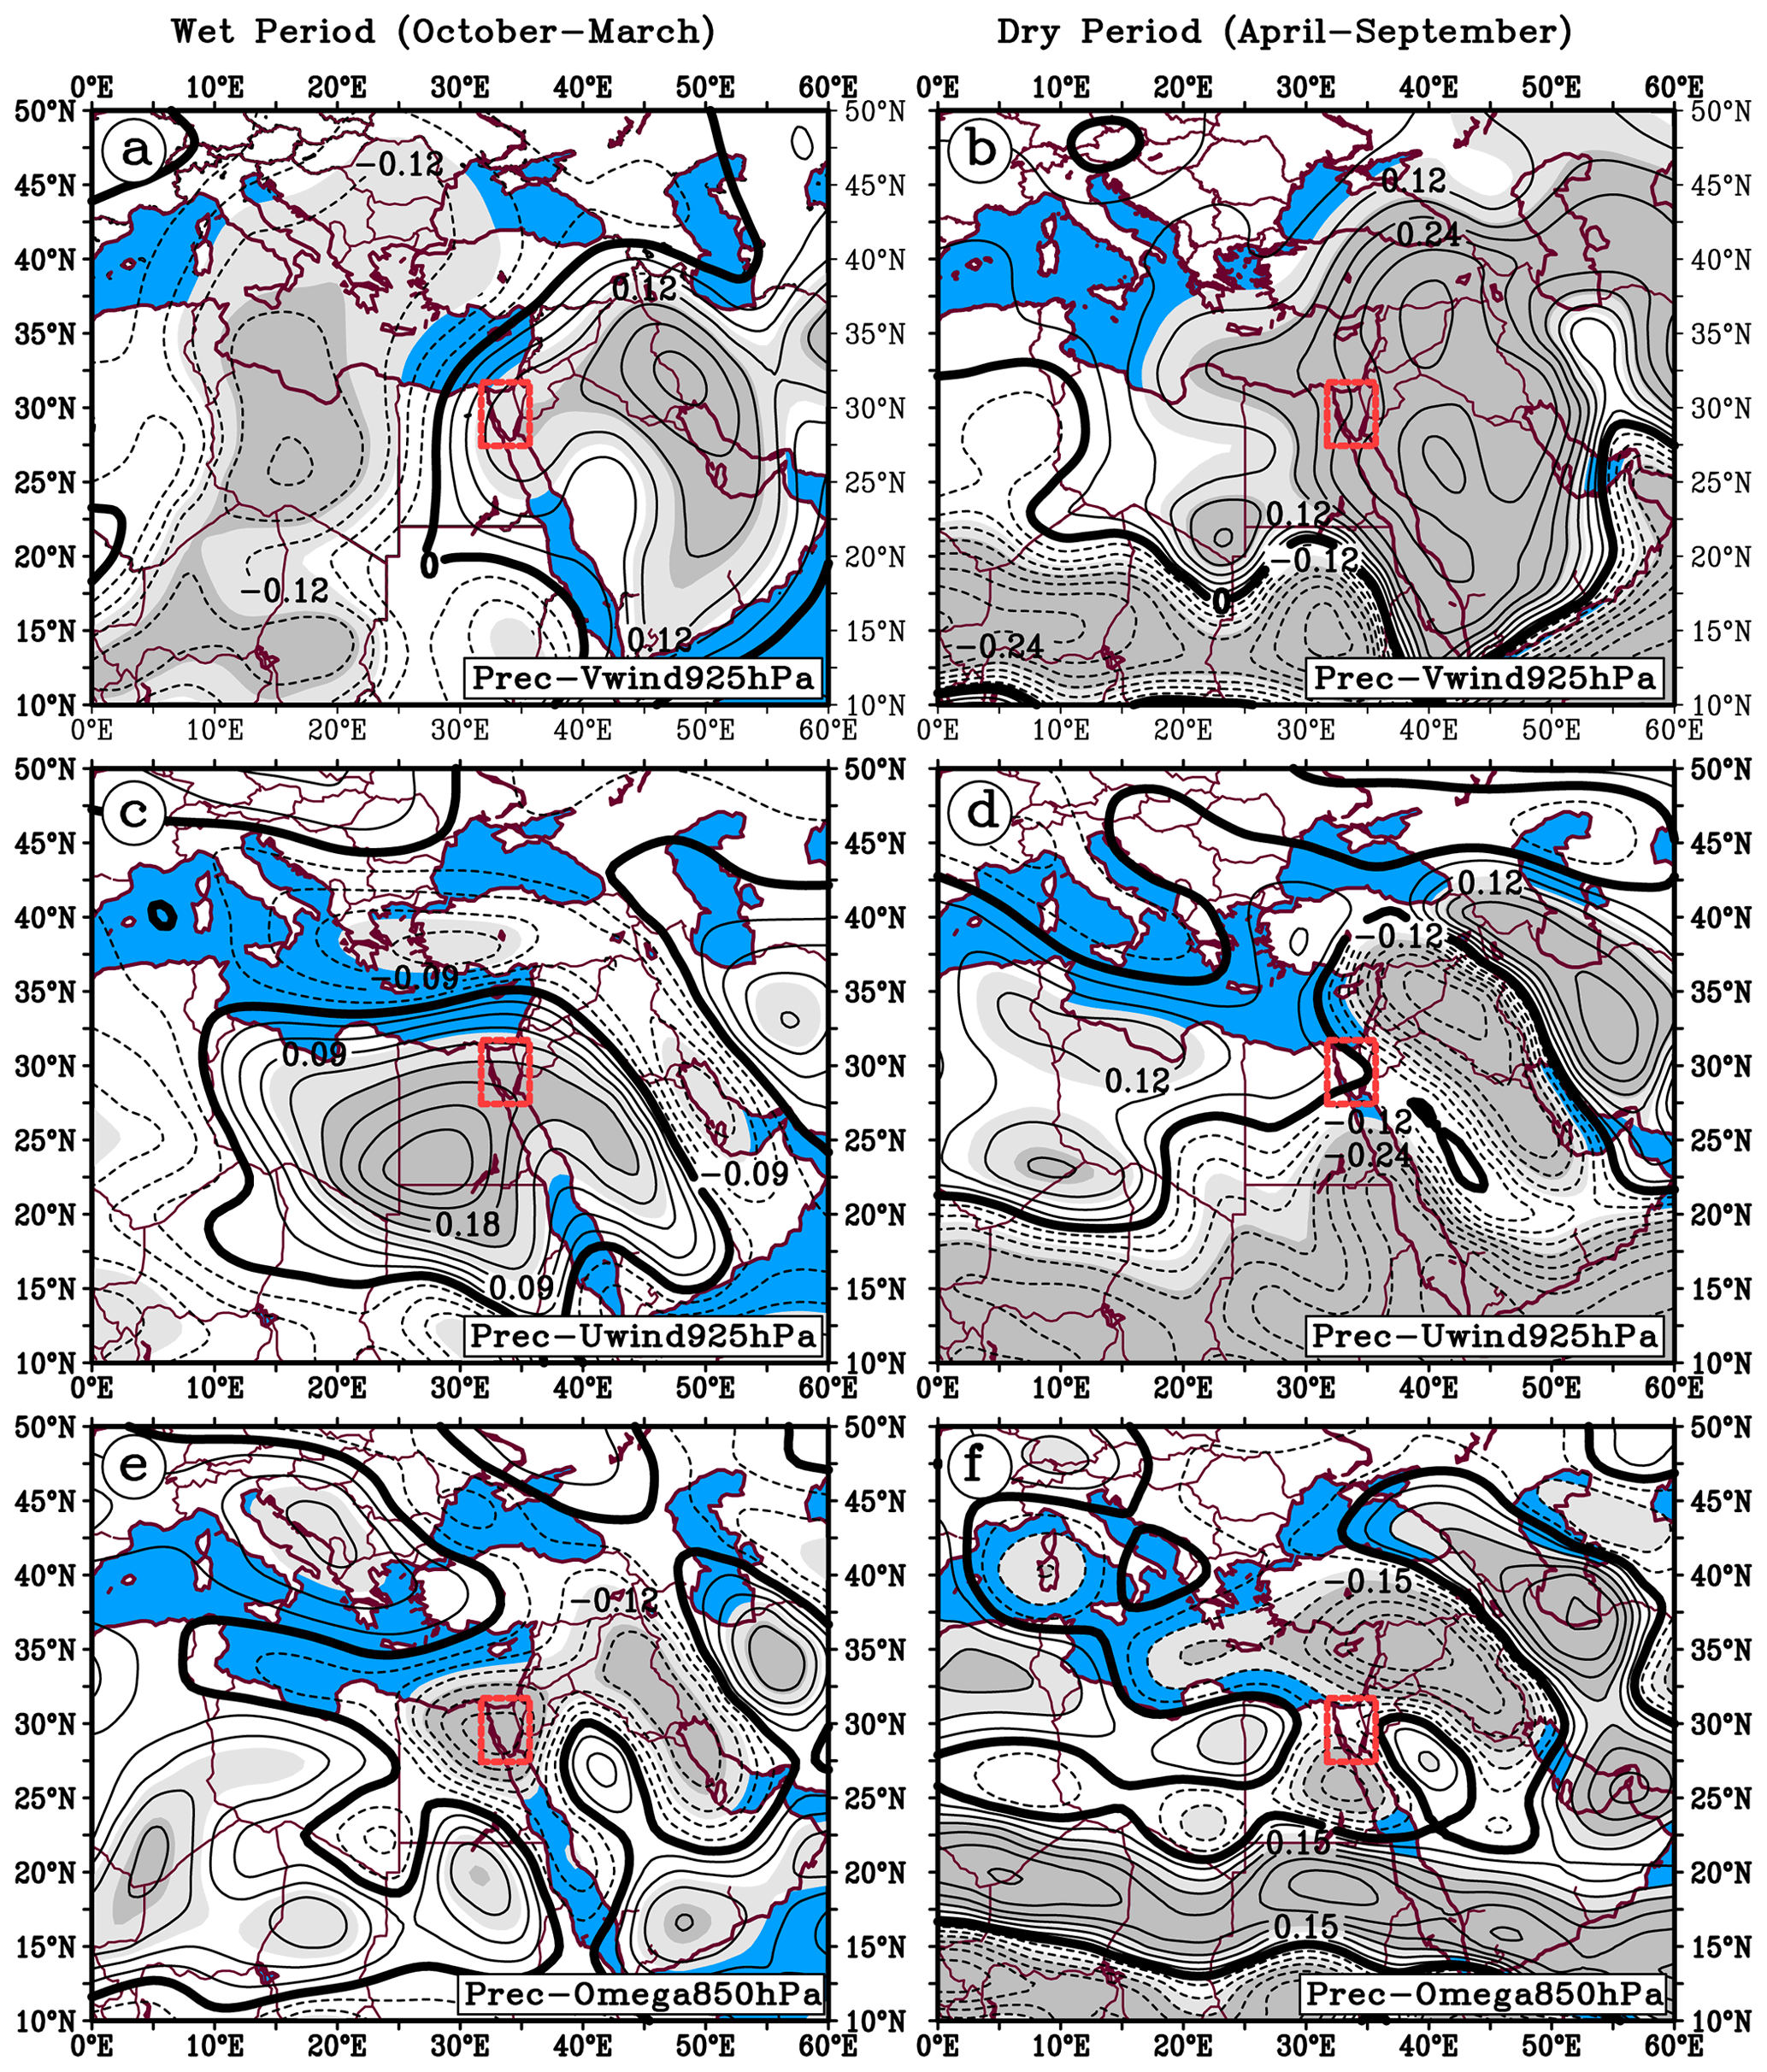
Figure 10Same as Fig. 9, but for the correlations between precipitation and (a, b) meridional wind (V wind) at 925 hPa, (c, d) zonal wind (U wind) at 925 hPa, and (e, f) vertical velocity (omega) at 850 hPa.
Our statistical analysis, as one of the first analyses over the SiP, revealed that distributions of rainfall events highly vary in time and space across the SiP. From a spatial perspective, we found that the precipitation climatologies are quite unevenly distributed across SiP such that the northern and northeastern parts receive the highest rainfall with >100 mm yr−1 and the southern and southwestern parts the lowest with <30 mm yr−1 (Fig. 2a). Using a multi-statistical approach developed in this research (Fig. 3), SiP's wet period (October–March) and dry period (April–September) were determined. The outcomes of the three statistics for the 90th percentiles, frequencies with a threshold of ≥10 mm d−1, and standard deviations were in good agreement concerning SiP's rainfall variability in time and space. Overall, profound dissimilarity was found in monthly precipitation values during the wet and dry periods (ranging from 5–70 to 1–3 mm per month, respectively); yet, their spatial patterns largely resembled each other. This means that the rainfall amount notably increased from the south towards the northeast of the SiP in both periods (Fig. S10).
The EOF-based spatiotemporal variability analysis showed that the precipitation rate is insignificantly increasing in the southern SiP (Fig. 4). This positive trend, however, may contribute to increasing the occurrence of flash floods in the southern SiP, where a higher elevation gradient is found (see Fig. 1). Opposite to the south, however, EOF patterns (especially for the cold period) revealed a severe below-average rainfall condition (drier trend) in the northern half of the SiP; this was also captured by the anomaly-based wintertime rainfall trend (Fig. S8a). EOF analysis and anomaly-based results are consistent with previous findings over the eastern Mediterranean basin such as in Israel and the Gaza Strip, as pointed out by Yosef et al. (2009), Ziv et al. (2013), and Ajjur and Riffi (2020). With respect to the temporal precipitation regime (Fig. 5), it was found that the highest monthly precipitation ratios occur in early winter, mostly limited to the northern SiP. This implies that the remaining months could experience a mild to severe prolonged dry weather (drought) condition.
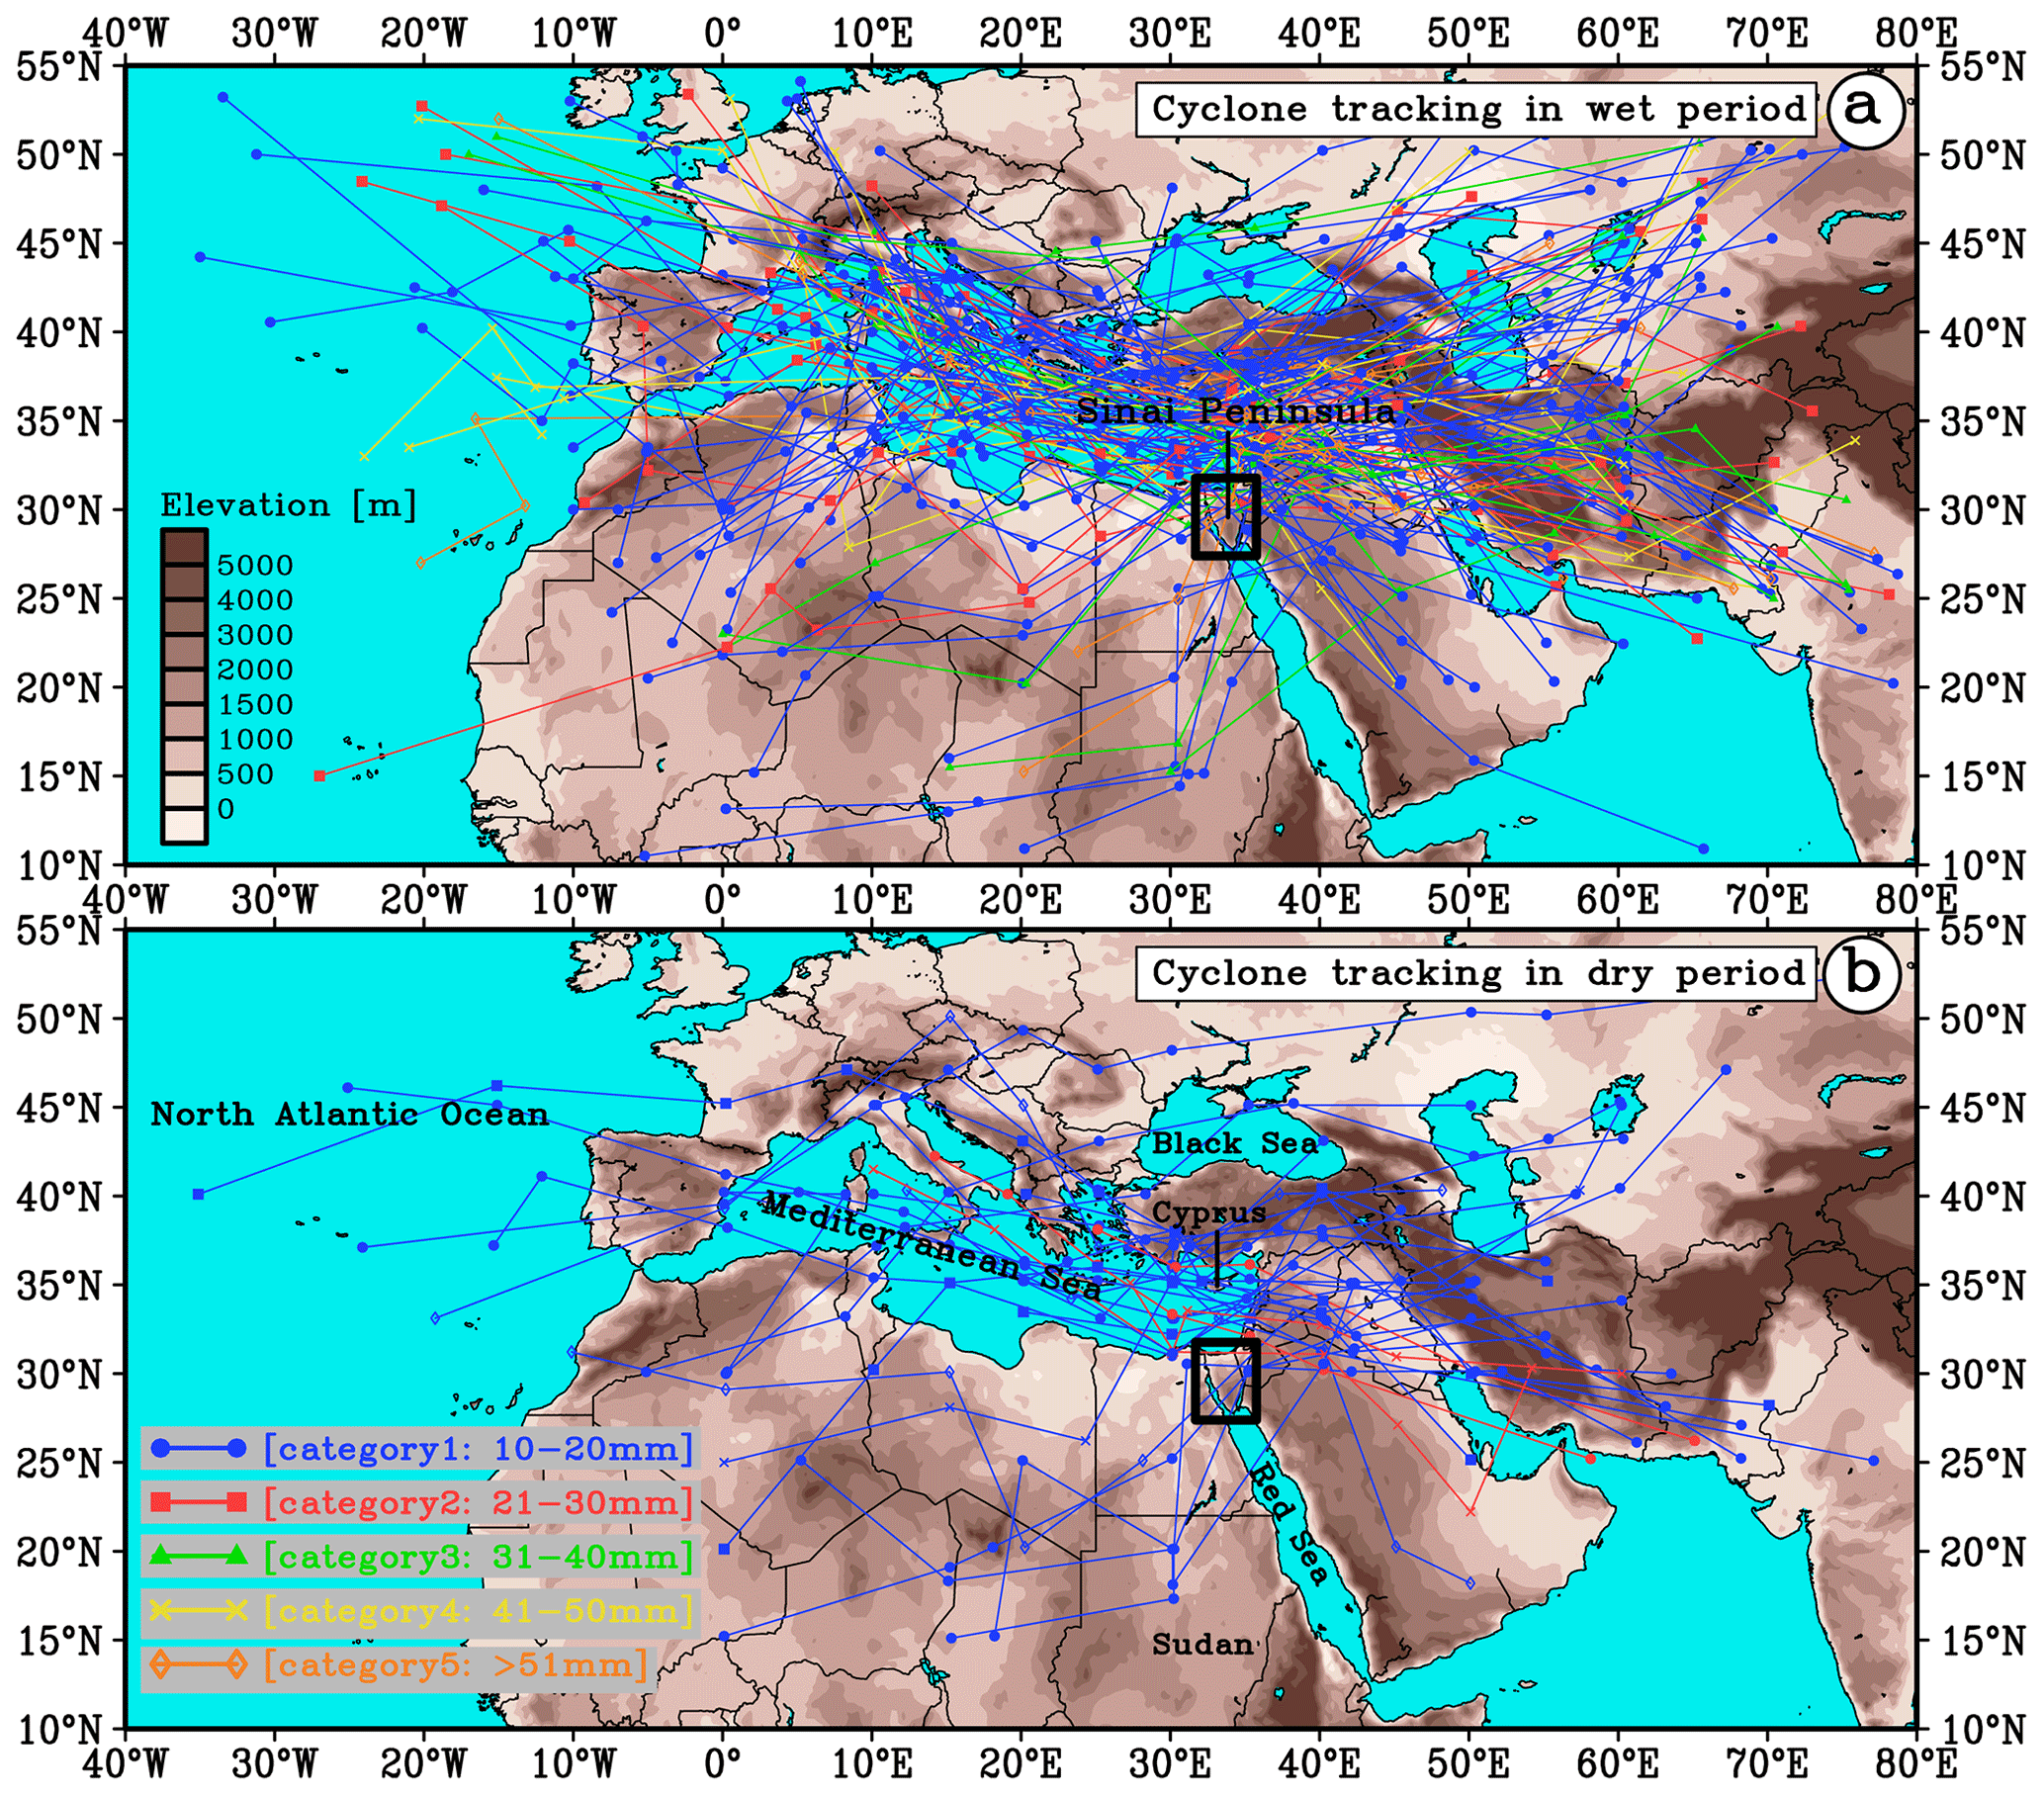
Figure 11Daily track of cyclones that precipitated (≥10 mm d−1) over the Sinai Peninsula (SiP) during (a) the wet period from October to March and (b) dry period from April to September for the period of 2001–2020 (7305 d). Details of all cyclones (156) classified into five categories are given in Table 2.
Our synoptic analysis (Fig. 6) was conducted to explore the association of synoptic systems with precipitation occurrence over the SiP during wet and dry periods (2001–2020). Basically, the majority of the cyclones (rainy systems) affecting the study area are generated within the Mediterranean basin itself and the nearby regions, which spatiotemporally are smaller and have shorter lifetimes compared to those of the North Atlantic systems; a similar result was also reported by Trigo et al. (1999) and Buzzi et al. (2005). Yet, they are capable of inducing extreme precipitation events and floods in some cases (Homar et al., 2007). Accordingly, we also found that during the wet period (Fig. 12a), two major sources of cyclonic activities (cyclogenesis) are responsible for the majority of the rainfall events over the region; these are located in the western part (at the lee of the Alps over the Gulf of Genoa) and eastern part (at the lee of the Taurus Mountains over Cyprus) of the Mediterranean Sea. The cyclones formed over Cyprus allegedly play a significant role in the occurrence of rainfall over the eastern Mediterranean (Saaroni et al., 2010). Another key synoptic system that plays a secondary role in the eastern Mediterranean's rainfall during the wet period is the Red Sea trough, which is developed as a result of the coexistence of the Sudan low and Saudi Arabian anticyclone (Fig. 12a). However, the Red Sea trough allegedly has a limited contribution to SiP's rainfall compared to the northeastern parts of the Mediterranean basin such as over Israel (Saaroni et al., 1998, and Tsvieli and Zangvil, 2005). During the dry period (Fig. 12b), the number of Mediterranean cyclones is significantly reduced due to the predominance of high-pressure systems extending from the Atlantic and north of Africa. This situation largely prevents the rising of the air and, in turn, condensation, which limit precipitation genesis over the region during the dry period. However, as a result of the northwestwards extension of the Persian trough into the eastern Mediterranean basin, a limited number of cyclones could develop and produce rainfall over the eastern Mediterranean (Alpert et al., 1990; Saaroni and Ziv, 2000) including the SiP region, as shown in Fig. 12b.
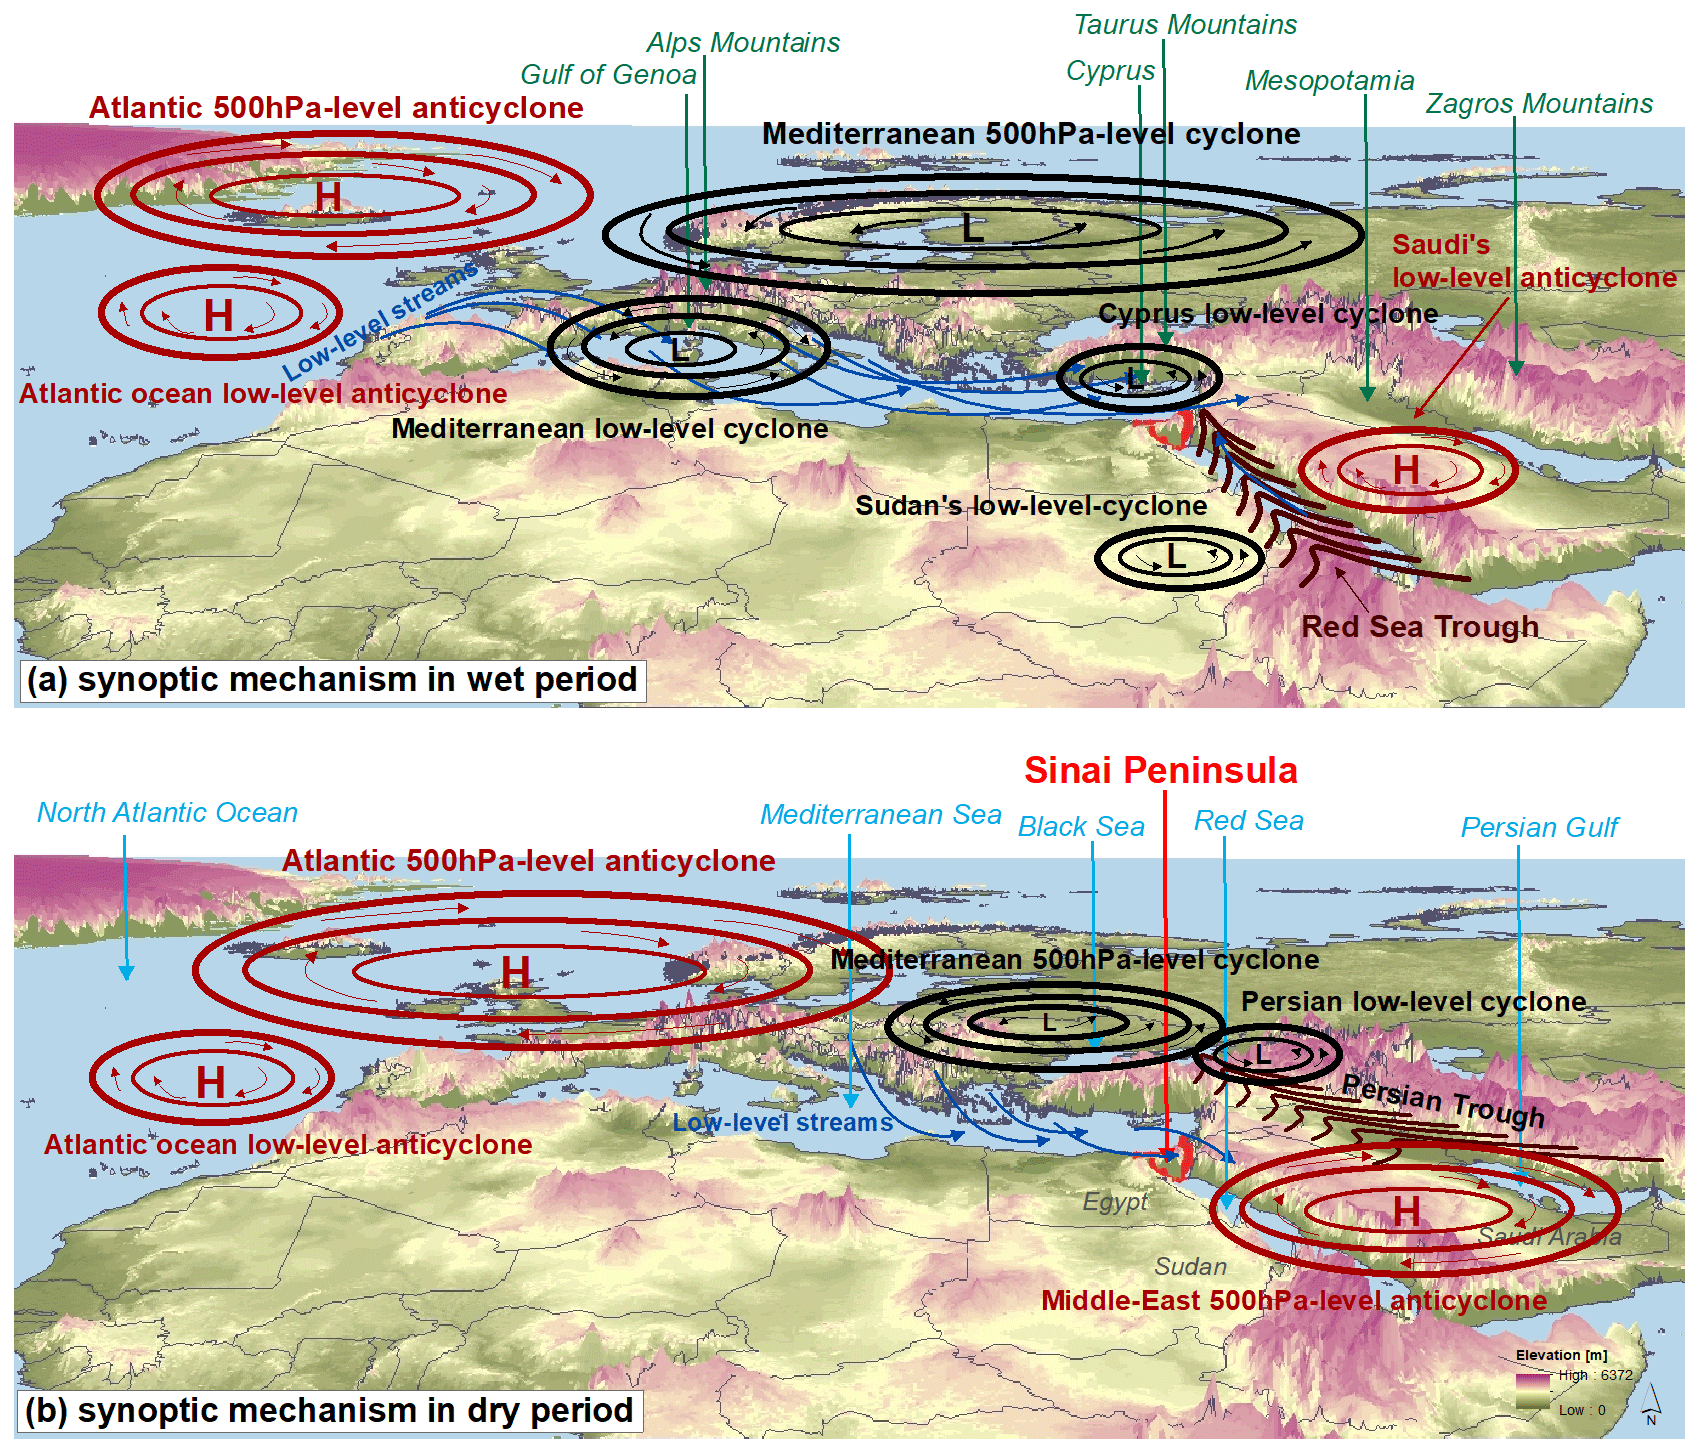
Figure 12Schematic representation of the dominant synoptic systems corresponding to the precipitation events over the Sinai Peninsula (SiP) (and the eastern Mediterranean basin) in (a) the wet period from October to March and (b) the dry period from April to September for the climatology period of 2001–2020. In the maps, L and H denote the low-pressure (cyclone) and high-pressure (anticyclone) systems, respectively.
With respect to the relationships of SiP's rainfall against key regional atmospheric variables (Figs. 9 and 10), we found meaningful correlations that varied remarkably during the wet and dry periods. In this context, a special coupling correlation pattern was observed between SiP's rainfall against U-wind and V-wind components in the wet period. However, despite a clear association between rainfall and atmospheric variables, their correlation coefficients were found to be relatively low (). A couple of major controlling factors, among others, could explain these low r values. The first is a long time series of the variables in each episode (>3600 d), and the second is a very low rate of annual rainfall over the SiP (on average 10–100 mm yr−1). The former, for instance, we did examine with fewer time series (e.g., 100 d), but then r values doubled (or tripled in some cases). Therefore, seemingly with a longer time series, more smoothed correlation coefficients could be expected. It is also noted that we found that the magnitude of correlations in the dry period is notably high. This could be explained by a semi-stationary structure of the pressure systems over the region, which, despite a low number of rainy days, play a crucial role in the increase in r values of the dry period compared to those of the wet period. This implies that the presence of low-pressure patterns at lower atmospheric levels over the eastern Mediterranean during the dry period of the year is allegedly associated with lower precipitation.
Finally, a daily track of cyclones precipitating (≥10 mm d−1) over the SiP was drawn separately for the wet period (125 cyclones, Fig. 11a) and the dry period (31 cyclones, Fig. 11b). All cyclones were classified into five categories (see Table 2) based on the total precipitation received SiP-wide. Basically, the occurrence and frequency of rainfall events in the eastern Mediterranean region (including SiP) are largely associated with the passage of cyclonic systems (Ulbrich et al., 2012), in which most of the cyclones are generated within the Mediterranean Sea basin, in particular during the winter season (Campins et al., 2000; Nissen et al., 2010). Amongst them, some cyclones are capable of inducing extreme precipitation and floods in the region (Buzzi et al., 2005; Homar et al., 2007). We found that about 15 % of the cyclones (rainfall >40 mm d−1) in wet periods are potentially able to produce torrential rainfall, leading to flash floods over the SiP. Unlike the wet period (Fig. 11a), both the numbers of cyclones (from 125 to 31) and their magnitudes (from five to two categories) were significantly reduced in the dry period (Fig. 11b). Considering the monthly frequency of cyclones passing through the region, during the wet period February receives the highest numbers of cyclones with 26 out of 125 (20.8 %), followed by January (no. 25, 20 %), December (no. 24, 19.2 %), March (no. 21, 16.8 %), November (no. 16, 12.8 %), and finally October with the lowest number of 13 (10.4 %). We also found that the cyclone on 12 March 2020 constituted the most significant rainy system (>70 mm d−1) that has occurred in the SiP region (and perhaps in the surrounding areas) over the past 2 decades. This is followed by the second more extreme one that occurred on 27 December 2006, with more than 62 mm d−1 of rainfall over the SiP. The monthly frequency of cyclones during the dry period also showed that April has by far the highest with a total of 20 out of 31 (65 %), followed by May (no. 9, 29 %) and September (no. 2, 6 %), with zero for the rest of the months (i.e., June, July, and August). The cyclones on 5 April 2006 (27 mm d−1) and 30 September 2012 (24 mm d−1) were found to be extreme ones.
The GPM satellite remote-sensing precipitation and reanalysis NCEP/NCAR and ERA5 datasets accompanied by a set of CDO functions and indices were employed in this research to explore extreme precipitation characteristics over the Sinai Peninsula (SiP), particularly during wet and dry periods for the period 2001–2020. This was achieved by (i) quantifying the spatiotemporal variability, anomaly, monthly regime, frequency, standard deviation, and spatial patterns of the extreme precipitation events; (ii) investigating the synoptic-scale systems responsible for the occurrence of rainfall; and (iii) determining the major tracks of cyclones during the wet and dry periods. The key findings are therefore summarized in three major points.
- i.
Spatiotemporal characteristics of rainfall. Using a multi-statistical approach based on the 90th percentiles, frequency of days with rainfall ≥10 mm d−1, and spatial standard deviation SD, SiP's wet (October–March) and dry (April–September) periods were determined. The climatology of SiP's precipitation showed that the northeastern and southwestern regions receive the highest (>100 mm yr−1) and lowest (<30 mm yr−1) annual rainfall, respectively. Also, the distributions of extreme precipitation frequencies resembled each other, regardless of their thresholds. This means that the highest and lowest frequencies occur in wet and dry periods, respectively. Also, trends and patterns of the precipitation events did not show spatiotemporal coherency across the study area, and EOF analysis indicated a substantial drier condition in most parts, especially in the northern SiP. Further, the rainfall regime revealed that high ratios of annual precipitation and their SDs are mostly estimated in winter months.
- ii.
Synoptic atmospheric systems. The majority of cyclones precipitating over the SiP are generated within the Mediterranean basin (leeward of the Alps and Taurus Mountains over the Gulf of Genoa and Cyprus, respectively), accompanied by the Red Sea trough at lower levels during the wet period. These systems are either absent or significantly weakened during the dry period; however, limited lows are developed as a result of the Persian trough extending northwestwards. A high resemblance in the seasonal rainfall spatial patterns (regardless of magnitude) during the wet and dry periods across the SiP was observed. Also, spatial correlations of SiP's precipitation against key regional variables at multiple levels revealed meaningful correlation patterns, yet varied largely across the year. The relationships of SiP's rainfall against SLP, U–V winds, and vertical velocity were found to be remarkable.
- iii.
Cyclone tracking. A total of 125 and 31 cyclones (rainfall ≥10 mm d−1) were tracked during the wet and dry periods, respectively. Amongst them, 75 % of cyclones produced rainfall ranging 10–30 mm d−1, while about 15 % generated torrential rainfall with >40 mm d−1, which is capable of leading to flash floods in the wet period. However, both the frequency (from 125 to 31 cyclones) and magnitude (from five to two classes) of the cyclones were reduced during the dry period when compared to the wet period.
The satellite GPM, NCEP/NCAR, and ERA5 reanalysis datasets used in this study are publicly available at https://gpm.nasa.gov/ (last access: 25 September 2020, Huffman et al., 2014), https://doi.org/10.1175/1520-0477(1996)077<0437:TNYRP>2.0.CO;2 (Kalnay et al., 1996), and https://doi.org/10.1002/qj.3803 (Hersbach et al., 2020), respectively; the eofs library of the Python package used herein is publicly available at https://doi.org/10.5334/jors.122 (Dawson, 2016).
The supplement related to this article is available online at: https://doi.org/10.5194/esd-14-931-2023-supplement.
MS, BH, AM, SCD, JA, and PL designed the study. MS, AM, SCD, and PL developed the research goals, and MS wrote the initial paper. MS and AM designed and produced the figures and tables. All authors contributed to the interpretation of results and improvement of the paper.
Publisher's note: Copernicus Publications remains neutral with regard to jurisdictional claims in published maps and institutional affiliations.
This research was financially supported by the European centre of excellence for sustainable water technology (Wetsus). AS is supported by the Dutch Research Council (NWO) Talent Program grant VI.Veni.202.170. The authors would like to acknowledge the Max Planck Institute for Meteorology for developing the CDO tool functions used in this study to estimate a set of climate indices. Special thanks go to the NASA/Goddard Space Flight Center for providing the GPM-IMERG (V06B) satellite rainfall data. We also appreciate the use of the NOAA-NCEP/NCAR and ECMWF-ERA5 reanalysis datasets in this research.
This paper was edited by Sagnik Dey and reviewed by two anonymous referees.
Alpert, P. and Ziv, B.: The Sharav cyclone: Observations and some theoretical considerations, J. Geophys. Res., 94, 18495–18514, https://doi.org/10.1029/JD094iD15p18495, 1989.
Alpert, P. and Shay-El, Y.: The moisture source for the winter cyclones in the eastern Mediterranean, Israel Meteorological Research Papers (IMRP), 5, 20–27, 1994.
Alpert, P., Abramsky, R., and Neeman, B. U.: The prevailing summer synoptic system in Israel – Subtropical High, not Persian Trough, Isr. J. Earth Sci., 39, 93–102. 1990.
Alpert, P., Ben-Gai, T., Baharad, A., Benjamini, Y., Yekutieli, D., Colacino, M., Diodato, L. Ramis, C., Homar, V., Romero, R., Michaelides, S., Manes, A.: The paradoxical increase of Mediterranean extreme daily rainfall in spite of decrease in total values, Geophys. Res. Lett., 29, 1536, https://doi.org/10.1029/2001GL013554, 2002.
Alpert, P., Osetinsky, I., Ziv, B., and Shafir, H.: Semi-objective classification for daily synoptic systems: application to the eastern Mediterranean climate change, Int. J. Climatol., 24, 1001–1011, https://doi.org/10.1002/joc.1036, 2004.
Ajjur, S. and Riffi, M.: Analysis of the observed trends in daily extreme precipitation indices in Gaza Strip during 1974–2016, Int. J. Climatol., 40, 6189–6200, https://doi.org/10.1002/joc.6576, 2020.
Almazroui, M. and Awad, A. M.: Synoptic regimes associated with the eastern Mediterranean wet season cyclone tracks, Atmos. Res., 180, 92–118, https://doi.org/10.1016/j.atmosres.2016.05.015, 2016.
Almazroui, M., Awad, A. M., Nazrul Islam, M., and Al-Khalaf, A. K.: A climatological study: wet season cyclone tracks in the East Mediterranean region, Theor. Appl. Climatol., 120, 351–365, https://doi.org/10.1007/s00704-014-1178-z, 2014.
Almazroui, M., Awad, A. M., and Nazrul Islam, M.: Characteristics of the internal and external sources of the Mediterranean synoptic cyclones for the period 1956–2013, Theor. Appl. Climatol., 133, 811–827, https://doi.org/10.1007/s00704-017-2218-2, 2017.
Arnous, M. O. and Omar, A. E.: Hydrometeorological hazards assessment of some basins in Southwestern Sinai area, Egypt. J. Coast. Conserv., 22, 721–743, https://doi.org/10.1007/s11852-018-0604-2, 2018.
Baldi, M., Amin, D., Al Zayed, I. S., and Dalu, G.: Climatology and Dynamical Evolution of Extreme Rainfall Events in the Sinai Peninsula-Egypt, Sustainability, 12, 6186, https://doi.org/10.3390/su12156186, 2020.
Badreldin, N. and Goossens, R.: A satellite-based disturbance index algorithm for monitoring mitigation strategies effects on desertification change in an arid environment, Mitig. Adapt. Strateg. Glob. Change, 20, 263–276, https://doi.org/10.1007/s11027-013-9490-y, 2013.
Barkhordarian, A., Von Storch, H., and Bhend, J.: The expectation of future precipitation change over the Mediterranean region is different from what we observe, Clim. Dynam, 40, 225–244, https://doi.org/10.1007/s00382-012-1497-7, 2013.
Ben David-Novak, H., Morin, E., Enzel, Y.: Modern extreme storms and the rainfall thresholds for initiating debris flows on the hyperarid western escarpment of the Dead Sea, Israel. Geol. Soc. Am. Bull., 116, 718–728, https://doi.org/10.1130/B25403.1, 2004.
Ben-Zvi, A.: Rainfall intensity-duration-frequency relationships derived from large partial duration series, J. Hydrol., 367, 104–114, https://doi.org/10.1016/j.jhydrol.2009.01.007, 2009.
Boucek, R. E., Gaiser, E. E., Liu, H., and Rehage, J. S.: A review of subtropical community resistance and resilience to extreme cold spells, Ecosphere, 7, e01455, https://doi.org/10.1002/ecs2.1455, 2016.
Buzzi, A., Richard, E., and Romero, R.: Summary Report on MEDEX Studies and Scientific Results on Mediterranean Cyclones Causing High Impact Weather, MEDEX Project,http://medex.aemet.uib.es/index.html (last access: 30 October 2021), 2005.
Campins, J., Genoves, A., Jansa, A., Guijarro, J. A., and Ramis, C.: A catalogue and a classification of surface cyclones for the western Mediterranean, Int. J. Climatol., 20, 969–984, https://doi.org/10.1002/1097-0088(200007)20:9<969::AID-JOC519>3.0.CO;2-4, 2000.
Caracciolo, D., Francipane, A., Viola, F., Valerio Noto, L., and Deidda, R.: Performances of GPM satellite precipitation over the two major Mediterranean islands, Atmos. Res., 213, 309–322, https://doi.org/10.1016/j.atmosres.2018.06.010, 2018.
Charlton-Perez, A. J., Aldridge, R. W., Grams, C. M., and Lee, R.: Winter pressures on the UK health system dominated by the Greenland blocking weather regime, Weather Clim. Extr., 25, 100218, https://doi.org/10.1016/j.wace.2019.100218, 2019.
Cinzia Marra, A., Federico, S., Montopoli, M., Avolio, E., Baldini, L., Casella, D., D'Adderio, L. P., Dietrich, S., Sanò, P., Torcasio, R. C., and Panegrossi, G.: The Precipitation Structure of the Mediterranean Tropical-Like Cyclone Numa: Analysis of GPM Observations and Numerical Weather Prediction Model Simulations, Remote Sens., 2019, 1690, https://doi.org/10.3390/rs11141690, 2019.
Cools, J., Vanderkimpen, P., El Afandi, G., Abdelkhalek, A., Fockedey, S., El Sammany, M., Abdallah, G., El Bihery, M., Bauwens, W., and Huygens, M.: An early warning system for flash floods in hyper-arid Egypt, Nat. Hazards Earth Syst. Sci., 12, 443–457, https://doi.org/10.5194/nhess-12-443-2012, 2012.
David-Novak, H. B., Morin, E., and Enzel, Y.: Modern extreme storms and the rainfall thresholds for initiating debris flows on the hyperarid western escarpment of the Dead Sea Israel, GSA Bull., 116, 718–728, https://doi.org/10.1130/B25403.1, 2004.
Dayan, U., Ziv, B., Margalit, A., Morin, E., and Sharon, D.: A severe autumn storm over the middle-east: synoptic and mesoscale convection analysis, Theor. Appl. Climatol., 69, 103–122, https://doi.org/10.1007/s007040170038, 2001.
Dayan, U., Nissen, K., and Ulbrich, U.: Review Article: Atmospheric conditions inducing extreme precipitation over the eastern and western Mediterranean, Nat. Hazards Earth Syst. Sci., 15, 2525–2544, https://doi.org/10.5194/nhess-15-2525-2015, 2015.
Dadamouny, M. A. and Schnittler, M.: Trends of climate with rapid change in Sinai, Egypt, J. Water Clim. Change, 7, 393–414, https://doi.org/10.2166/wcc.2015.215, 2016.
Dawson, A.: eofs: A Library for EOF Analysis of Meteorological, Oceanographic, and Climate Data, [code], J. Open Res. Softw., 4, e14, https://doi.org/10.5334/jors.122, 2016.
de Vries, A. J., Tyrlis, E., Edry, D., Krichak, S. O., Steil, B., Lelieveld, J.: Extreme precipitation events in the Middle East: Dynamics of the Active Red Sea Trough, J. Geophys. Res., 118, 7087–7108, https://doi.org/10.1002/jgrd.50569, 2013.
El-Magd, A. I., Hermas, E., and El-Bastawesy, M.: GIS modelling of the spatial variability of flash flood hazard in Abu Dabbab Catchment, Red Sea Region, Egypt, Egypt. J. Remote Sens. Sp. Sci. 13, 81–88, https://doi.org/10.1016/j.ejrs.2010.07.010, 2010.
El Afandi, G., Morsy, M., and El Hussieny, F.: Heavy Rainfall Simulation over Sinai Peninsula Using the Weather Research and Forecasting Model, Int. J. Atmos. Sci., 11, 241050, https://doi.org/10.1155/2013/241050, 2013.
ElFakharany, M. A., and Mansour, N. M.: Morphometric analysis and flash foods hazards assessment for Wadi Al Aawag drainage Basins, southwest Sinai, Egypt, Environ. Earth Sci., 80, 168 https://doi.org/10.1007/s12665-021-09457-1, 2021.
El-Sayed, E. A. and Habib, E.: Advanced Technique for Rainfall-Runoff Simulation in Arid Catchments Sinai, Egypt. The 3rd International Conf. on Water Resources & Arid Environment (2008) and First Arab Forum, Riyadh, Saudi Arabia, 16–19 November 2008, 2008.
Farahat, M. S., Elmoustafa, A. M., and Hasan, A. A.: Developing flash foods inundation maps using remote sensing data, a case study: Wadi AL-Arish, Sinai, Egypt, Am. J. Eng. Res., (AJER) 6, 172–181, 2017.
Flocas, H., Simmonds, L., Kouroutzoglou, J., Keay, K., Hatzaki, M., Bricolas, V., and Asimakopoulos, D.: On Cyclonic Tracks over the Eastern Mediterranean, J. Climate, 23, 5243–5257, https://doi.org/10.1175/2010JCLI3426.1, 2010.
Flaounas, E., Kotroni, V., Lagouvardos, K., and Flaounas, I.: CycloTRACK (v1.0) – tracking winter extratropical cyclones based on relative vorticity: sensitivity to data filtering and other relevant parameters, Geosci. Model Dev., 7, 1841–1853, https://doi.org/10.5194/gmd-7-1841-2014, 2014.
Flaounas, E., RavehRubin, S., Wernli, H., Drobinski, P., and Bastin, S.: The dynamical structure of intense Mediterranean cyclones, Clim. Dynam., 44, 2411–2427, https://doi.org/10.1007/s00382-014-2330-2, 2015.
Flaounas, E., Kotroni, V., Lagouvardos, K., Gray, S., Rysman, J. F., and Claud, C.: Heavy rainfall in Mediterranean cyclones, Part I: Contribution of deep convection and warm conveyor, Clim. Dynam., 50, 29352949, https://doi.org/10.1007/s003820173783x, 2018.
Gado T. A.: Statistical Behavior of Rainfall in Egypt, in: Flash Floods in Egypt, edited by: Negm, A., Advances in Science, Technology & Innovation (IEREK Interdisciplinary Series for Sustainable Development), Springer, https://doi.org/10.1007/978-3-030-29635-3_2, 2020.
Givati, A., Thirel, G., Rosenfeld, D., and Paz, D.: Climate change impacts on streamflow at the upper Jordan River based on an ensemble of regional climate models, J. Hydrol., 21, 92–109, https://doi.org/10.1016/j.ejrh.2018.12.004, 2019.
Gabella, M., Michaelides, S., Constantinides, P., and Perona, G.: Climatological validation of TRMM precipitation radar monthly rain products over Cyprus during the first 5 years (December 1997 to November 2002), Meteorol. Z., 15, 559–564, https://doi.org/10.1127/0941-2948/2006/0158, 2006.
Hersbach, H., Bell, B., Berrisford, P., Hirahara, S. et al.: The ERA5 global reanalysis, [code], Q. J. Roy. Meteor. Soc., 146, 1999–2049, https://doi.org/10.1002/qj.3803, 2020.
Hochman, A., Rostkier-Edelstein, D., Kunin, P., and Pinto, J. G.: Changes in the characteristics of “wet” and “dry” Red Sea Trough over the Eastern Mediterranean in CMIP5 climate projections, Theor. Appl. Clim., 143, 781–794, https://doi.org/10.1007/s00704-020-03449-0, 2020.
Homar, V., Jansà, A., Campins, J., Genovés, A., and Ramis, C.: Towards a systematic climatology of sensitivities of Mediterranean high impact weather: a contribution based on intense cyclones, Nat. Hazards Earth Syst. Sci., 7, 445–454, https://doi.org/10.5194/nhess-7-445-2007, 2007.
Hourngir, D., Panegrossi, G., Casella, D., Sanò, P., D'Adderio, L. P., and Liu, C.: A 4-Year Climatological Analysis Based on GPM Observations of Deep Convective Events in the Mediterranean Region, Remote Sens., 13, 1685, https://doi.org/10.3390/rs13091685, 2021.
Huffman, G. J., Bolvin, D. T., Braithwaite, D., Hsu, K., Joyce, R., and Xie, P.: NASA Global Precipitation Measurement (GPM) Integrated Multi-satellitE Retrievals for GPM (IMERG), NASA Report, https://gpm.nasa.gov/ [data set], (last access: 25 September 2020) 1–35, 2014.
IPCC Climate Change: The Physical Science Basis, Contribution of Working Group I to the Fifth Assessment Report of the Intergovernmental Panel on Climate Change, edited by: Stocker, T. F., Qin, D., Plattner, G. K., Tignor, M., Allen, S. K., Boschung, J., Nauels, A., Xia, Y., Bex, V., and Midgley, P. M., Cambridge University Press, Cambridge, United Kingdom and New York, NY, USA, 1535 pp., 2013.
Kahana, R., Ziv, B., Enzel, Y., and Dayan, U.: Synoptic climatology of major floods in the Negev desert, Israel, Int. J. Climatol., 22, 867–882, https://doi.org/10.1002/joc.766, 2002.
Kalnay, E.,, Kanamitsu, M., Kistler, R., Collins, W., Deaven, D., Gandin. L., et al.: The NCEP/NCAR 40-year reanalysis project, [data set], B. Am. Meteorol. Soc., 77, 437–471, https://doi.org/10.1175/1520-0477(1996)077<0437:TNYRP>2.0.CO;2, 1996.
Koutroulis, A. G. and Tsanis, I. K.: A method for estimating flash flood peak discharge in a poorly gauged basin: Case study for the 13–14 January 1994 flood, Giofiros basin, Crete, Greece, J. Hydrol., 385, 150–164, https://doi.org/10.1016/j.jhydrol.2010.02.012, 2010.
Kostopoulou, E. and Jones, P. D.: Assessment of climate extremes in the Eastern Mediterranean, Meteorol. Atmos. Phys., 89, 69–85, https://doi.org/10.1007/s00703-005-0122-2, 2005.
Kotsias, G., Lolis, C., Hatzianastassiou, N., Lionello, P., and Bartzokas, A.: An objective definition of seasons for the Mediterranean region, Int. J. Clim., 41, 1889–1905, https://doi.org/10.1002/joc.6819, 2020.
Kotroni, V., Lagouvardos, K., and Defer, E.: The Antalya 5 December 2002 Storm: Observations and Model Analysis, J. Appl. Meteorol. Clim., 45, 576–590, https://doi.org/10.1175/JAM2347.1, 2006.
Krichak, S. O., Kishcha P., and Alpert, P.: Decadal trends of main Eurasian oscillations and the Eastern Mediterranean precipitation, Theor. Appl. Climatol., 72, 209–220, https://doi.org/10.1007/s007040200021, 2002.
Krichak, S. O., Alpert, P., and Krishnamurti, T. N.: Red Sea Trough/Cyclone Development- Numerical Investigation, Meteorol, Atmos. Phys., 63, 159–169, https://doi.org/10.1007/BF01027382, 1997.
Levy, Y., Burg, A., Yechieli, Y., and Gvirtzman, H.: Displacement of springs and changes in groundwater flow regime due to the extreme drop in adjacent lake levels: The Dead Sea rift, J. Hydrol., 587, 124928, https://doi.org/10.1016/j.hydrol.2020.124928, 2020.
Lionello, P., Trigo, I., Gil, V., Liberato, M. R., et al.: Objective climatology of cyclones in the Mediterranean region: a consensus view among methods with different system identification and tracking criteria, Tellus A, 68, 29391, https://doi.org/10.3402/tellusa.v68.29391, 2016.
Lois, C. J.: Winter cloudiness variability in the Mediterranean region and its connection to atmospheric circulation features, Theor. Appl. Climatol., 96, 357–373, https://doi.org/10.1007/s00704-008-0046-0, 2009.
Mathbout, S., Lopez-Bustins, A., Roye, D., Martin-Vide, J., Bech, J., and Rodrigo, F. S.: Observed Changes in Daily Precipitation Extremes at Annual Timescale Over the Eastern Mediterranean During 1961–2012, Pure Appl. Geophys., 175, 3875–3890, https://doi.org/10.1007/s00024-017-1695-7, 2018.
Mehta, A. V. and Yang, S.: Precipitation climatology over Mediterranean Basin from ten years of TRMM measurements, Adv. Geosci., 17, 87–91, https://doi.org/10.5194/adgeo-17-87-2008, 2008.
Morsy, M., Sayad, T., and Khamees, A. S.: Towards instability index development for heavy rainfall events over Egypt and the Eastern Mediterranean, Meteorol. Atmos. Phys., 132, 255–272, https://doi.org/10.1007/s00703-019-00686-5, 2019.
Morin, E., Harats, N., Jacoby, Y., Arbel, S., Getker, M., Arazi, A., Grodek, T., Ziv, B., and Dayan, U.: Studying the extremes: hydrometeorological investigation of a flood-causing rainstorm over Israel, Adv. Geosci., 12, 107-114, https://doi.org/10.5194/adgeo-12-107-2007, 2007.
Mohamed, S. A. and El-Raey, M. E.: Vulnerability assessment for flash foods using GIS spatial modeling and remotely sensed data in ElArish City, North Sinai, Egypt, Nat. Hazards, 102, 707–728, https://doi.org/10.1007/s11069-019-03571-x, 2019.
Morad, N. A.: Assessment of the rainfall storm events of January 2010 and March 2014 for the catchment modelling of Wadi-El-Arish and Wadi-Wardan basins, Sinai, Egypt, Egypt. J. Desert Res., 66, 137–168, https://doi.org/10.21608/ejdr.2016.5772, 2016.
Nastos, P. T., Kapsomenakis, J., and Douvis, K. C.: Analysis of precipitation extremes based on satellite and high-resolution gridded data set over Mediterranean basin, Atmos. Res., 131, 46–59, https://doi.org/10.1016/j.atmosres.2013.04.009, 2013.
Neu, U., Akperov, M. G., Bellenbaum, N., Benestad, R., et al.: IMILAST: A Community Effort to Intercompare Extratropical Cyclone Detection and Tracking Algorithms, B. Am. Meteorol. Soc., 94, 529–547, https://doi.org/10.1175/BAMS-D-11-00154.1, 2013.
Nissen, K. M., Leckebusch, G. C., Pinto, J. G., Renggli, D., Ulbrich, S., and Ulbrich, U.: Cyclones causing wind storms in the Mediterranean: characteristics, trends and links to large-scale patterns, Nat. Hazards Earth Syst. Sci., 10, 1379–1391, https://doi.org/10.5194/nhess-10-1379-2010, 2010.
Ocakoglu, F., Gokceoglu, C., and Ercanoglu, M.: Dynamics of a complex mass movement triggered by heavy rainfall: a case study from NW Turkey, Geomorphology, 42, 341, https://doi.org/10.1016/S0169-555X(01)00094-0, 2002.
Omran, E.-S. E.: Egypt's Sinai Desert Cries: Flash Flood Hazard, Vulnerability, and Mitigation, in: Flash Floods in Egypt, edited by: Negm, A. M., Springer Nature Switzerland AG 2020, Adv. Sci., https://doi.org/10.1007/978-3-030-29635-3_11, 2020.
Petracca, M., D'Adderio, L. P., Porcu, F., Vulpiani, G., Sebastianelli, S., and Puca, S.: Validation of GPM Dual-Frequency Precipitation Radar (DPR) Rainfall Products over Italy, J. Hydrometeorol., 19, 907–925, https://doi.org/10.1175/JHM-D-17-0144.1, 2018.
Prama, M., Omran, A., Schröder, D., and Abouelmagd, A.: Vulnerability assessment of flash floods in Wadi Dahab Basin, Egypt, Environ. Earth Sci., 79, 114, https://doi.org/10.1007/s12665-020-8860-5, 2020.
Peleg, N. and Morin, E.: Convective rain cells: Radar-derived spatiotemporal characteristics and synoptic patterns over the eastern Mediterranean, J. Geophys. Res., 117, D15116, https://doi.org/10.1029/2011JD017353, 2012, 2012.
Peleg, N., Morin, E., Gvirtzman, H., and Enzel, Y.: Rainfall, spring discharge and past human occupancy in the Eastern Mediterranean, Clim. Change, 112, 769–789, https://doi.org/10.1007/s10584-011- 0232-4, 2012.
Pfahl, S. and Wernli, H.: Quantifying the relevance of atmospheric blocking for co-located temperature extremes in the Northern Hemisphere on (sub-)daily time scales, Geophys. Res. Lett., 39, L12807, https://doi.org/10.1029/2012GL052261, 2012.
Prantl, M., Žák, M., and Prantl, D.: CycloneDetector (v1.0) – Algorithm for detecting cyclone and anticyclone centers from mean sea level pressure layer, Geosci. Model Dev. Discuss. [preprint], https://doi.org/10.5194/gmd-2021-266, 2021.
Raible, C. C., Della-Marta, P. M., Schwierz, C., Wernli, H., and Blender, R.: Northern Hemisphere Extratropical Cyclones: A Comparison of Detection and Tracking Methods and Different Reanalyses, Month. Weather Rev., 136, 880–897, https://doi.org/10.1175/2007MWR2143.1, 2008.
Retalis, A., Katsanos, D., Tymvios, F., and Michaelides, S.: Validation of the First Years of GPM Operation over Cyprus, Remote Sens., 2018, 1520, https://doi.org/10.3390/rs10101520, 2018.
Romera, R., Gaertner, M.A., Sánchez, E., Domínguez, M., González-Alemán, J. J., and Miglietta, M. M.: Climate change projections of medicanes with a large multi-model ensemble of regional climate models, Global Planet. Change, 151, 134–143, https://doi.org/10.1016/j.gloplacha.2016.10.008, 2017.
Rinat, Y., Marra, F., Armon, M., Metzger, A., Levi, Y., Khain, P., Vadislavsky, E., Rosensaft, M., and Morin, E.: Hydrometeorological analysis and forecasting of a 3 d flash-flood-triggering desert rainstorm, Nat. Hazards Earth Syst. Sci., 21, 917–939, https://doi.org/10.5194/nhess-21-917-2021, 2021.
Raveh-Rubin, S. and Wernli, H.: Large-scale wind and precipitation extremes in the Mediterranean: a climatological analysis for 1979–2012, Q. J. Roy. Meteor. Soc., 141, 2404–2417, https://doi.org/10.1002/qj.2531, 2015.
Roushdi, M., Mostafa, H., and Kheireldin, K.: Present and future climate extreme indices over Sinai Peninsula, Egypt, World academy of science, engineering and technology, Int. J. Geol. Environ. Eng., 10, 85–90, 2016.
Saaroni, H., Ziv, B., Bitan, A., and Alpert, P.: Easterly wind storms over Israel, Theor. Appl. Climatol., 59, 61–77, https://doi.org/10.1007/s007040050013, 1998.
Saaroni, H. and Ziv, B.: Summer rain episodes in a Mediterranean climate, the case of Israel: climatological-dynamical analysis, Int. J. Climatol., 20, 191–209, https://doi.org/10.1002/(SICI)1097-0088(200002)20:2< 191::AID-JOC464>3.0.CO;2-E, 2000.
Saaroni, H., Halfon, N., Ziv, B., Alpert, P., and Kutiel, H.: Links between the rainfall regime in Israel and location and intensity of Cyprus lows, Int. J. Climatol., 30, 1014–1025, https://doi.org/10.1002/joc.1912, 2010.
Samuels, R., Rimmer, A., and Alpert, P.: Effect of extreme rainfall events on the water resources of the Jordan River, J. Hydrol., 375, 513–523, https://doi.org/10.1016/j.jhydrol.2009.07.001, 2009.
Schulzweida, U.: CDO User Guide (V.1.9.9), Zenodo, https://doi.org/10.5281/zenodo.4246983, 2020.
Shohami, D., Dayan, U., an Morin, E.: Warming and drying of the eastern Mediterranean: Additional evidence from trend analysis, J. Geophys. Res-Atmos., 116, D22101, https://doi.org/10.1029/2011JD016004, 2011.
Spyrou, C., Varlas, G., Pappa, A., Mentzafou, A., Katsafados, P., Papadopoulos, A., Anagnostou, M. N., and Kalogiros, J.: Implementation of a Nowcasting Hydrometeorological System for Studying Flash Flood Events: The Case of Mandra, Greece, Remote Sens., 12, 2784, https://doi.org/10.3390/rs12172784, 2020.
Tolika, K., Maheras, P., and Flocas, H. A.: Arseni-Papadimitriou, A.: An evaluation of a general circulation model (GCM) and the NCEP-NCAR reanalysis data for winter precipitation in Greece, Int. J. Climatol., 26, 935–955, https://doi.org/10.1002/joc.1290, 2006.
Toreti, A., Giannakaki, P., and Martius, O.: Precipitation extremes in the Mediterranean region and associated upper-level synopticscale flow structures, Clim. Dynam., 47, 1925–1941, https://doi.org/10.1007/s00382-015-2942-1, 2016.
Tsvieli, Y. and Zangvil, A.: Synoptic climatological analysis of wet and dry Red Sea toughs over Israel, Int. J. Climatol., 25, 1997–2015, https://doi.org/10.1002/joc.1232, 2005.
Trenberth, K. E., Jones, P. D., Ambenje, P., Bojariu, R., Easterling, D., Klein, T. A., Parker, D., Rahimzadeh, F., Renwick, J. A., Rusticucci, M., Soden, B., and Zhai, P.: Observations: surface and atmospheric climate change, in: Climate Change 2007: The Physical Science Basis, Contribution of Working Group 1 to the Fourth Assessment Report of the Intergovernmental Panel on Climate Change, edited by: Solomon, S., Qin, D., Manning, M., Chen, Z., Marquis, M., Averyt, K. B., Tignor, M., and Miller, H. L., Cambridge University Press: Cambridge and New York, NY, 235–336, 2007.
Tarolli, P., Borga, M., Morin, E., and Delrieu, G.: Analysis of flash flood regimes in the North-Western and South-Eastern Mediterranean regions, Nat. Hazards Earth Syst. Sci., 12, 1255–1265, https://doi.org/10.5194/nhess-12-1255-2012, 2012.
Trigo, I. F., Davies, T. D., and Bigg, G. R.: Objective climatology of cyclones in the Mediterranean region, J. Climate, 12, 1685–1696, https://doi.org/10.1175/1520-0442(1999)012< 1685:OCOCIT>2.0.CO;2, 1999.
Trigo, I., Bigg, G. R., and Davies, T. D.: Climatology of Cyclogenesis Mechanisms in the Mediterranean, Month. Weather Rev., 130, 549–569, https://doi.org/10.1175/1520-0493(2002)130< 0549:COCMIT>2.0.CO;2, 2002.
Trigo, R. M., Trigo, I. F., and DaCamara, C. C.: Climate impact of the European winter blocking episodes from the NCEP/NCAR Reanalyses, Clim. Dynam., 23, 17–28, https://doi.org/10.1007/s00382-004-0410-4, 2004.
Trigo, I. F.: Climatology and interannual variability of storm tracks in the Euro-Atlantic sector: a comparison between ERA-40 and NCEP/NCAR reanalyses, Clim. Dynam., 26, 127–143, https://doi.org/10.1007/s00382-005-0065-9, 2006.
Tous, M., Zappa, G., Romero, R., Shaffrey, L., and Vidale, P. L.: Projected changes in medicanes in the HadGEM3 N512 high-resolution global climate model, Clim. Dynam., 47, 1913–1924, https://doi.org/10.1007/s00382-015-2941-2, 2016.
Toros, H., Kahraman, A., Tilev-Tanriover, S., Geertsema, G., and Cats, G.: Simulating Heavy Precipitation with HARMONIE, HIRLAM, and WRF-ARW: A Flash Flood Case Study in Istanbul, Turkey, Europ. J. Sci. Technol., 13, 1–12, https://doi.org/10.31590/ejosat.417535, 2018.
Toreti, A., Xoplaki, E., Maraun, D., Kuglitsch, F. G., Wanner, H., and Luterbacher, J.: Characterisation of extreme winter precipitation in Mediterranean coastal sites and associated anomalous atmospheric circulation patterns, Nat. Hazards Earth Syst. Sci., 10, 1037–1050, https://doi.org/10.5194/nhess-10-1037-2010, 2010.
Ulbrich, U., Lionello, P., Belušic, D., Jacobeit, J., Knippertz, P., Kuglitsch, F. G., et al.: Climate of the Mediterranean: Synoptic Patterns, Temperature, Precipitation, Winds, and Their Extremes, in book: The Climate of the Mediterranean Region, Elsevier, 301–346, https://doi.org/10.1016/B978-0-12-416042-2.00005-7, 2012.
Varlas, G., Anagnostou, M., Spyrou, C., Papadopoulos, A., Kalogiros, J., Mentzafou, A., Michaelides, S., Baltas, E., Karymbalis, E., and Katsafados, P.: A Multi-Platform Hydrometeorological Analysis of the Flash Flood Event of 15 November 2017 in Attica, Greece, Remote Sens., 11, 45, https://doi.org/10.3390/rs11010045, 2018.
Wannous, C. and Velasquez, G.: United Nations Office for Disaster Risk Reduction (UNISDR)-UNISDR's Contribution to Science and Technology for Disaster Risk Reduction and the Role of the International Consortium on Landslides (ICL) Open image in new window, edited by: Sassa, K., Mikoš, M., and Yin, Y.: Advancing Culture of Living with Landslides, WLF 2017, Springer, Cham., https://doi.org/10.1007/978-3-319-59469-9_6, 2017.
Yucel, I. and Onen, A.: Evaluating a mesoscale atmosphere model and a satellite-based algorithm in estimating extreme rainfall events in northwestern Turkey, Nat. Hazards Earth Syst. Sci., 14, 611–624, https://doi.org/10.5194/nhess-14-611-2014, 2014.
Yosef, Y., Saaroni, H., and Alpert, P.: Trends in Daily Rainfall Intensity over Israel 1950/1–2003/4, The Open Atmospheric Science Journal, 2009, 3, 196–203, https://doi.org/10.2174/1874282300903010196, 2009.
Zappa, G., Hawcroft, M. K., Shaffrey, L., Black, E., and Brayshaw, D. J.: Extratropical cyclones and the projected decline of winter Mediterranean precipitation in the CMIP5 models, Clim. Dynam., 45, 1727–1738, https://doi.org/10.1007/s00382-014-2426-8, 2015
Zhang, X., Aguilar, E., Sensoy, S., Melkonyan, H., Tagiyeva, U., Ahmed, N., Kutalade, N., Rahimzadeh, F., Taghipour, A,. Hantosh, T. H., Alpert, P., Semawi, M., Ali, M. K., Al-Shabibi, M. H. S., Al-Oulan, Z., Zatari, T., Khelet, I. A. D., Hamoud, S., Sagir, R., Demircan, M., Eken, M., Adiguzel, M., Alexander, L., Peterson, T. C., and Wallis, T.: Trends in Middle East climate indices from 1950 to 2003, J. Geophys. Res.-Atmos, 110, D22104, https://doi.org/10.1029/2005JD006181, 2005.
Zittis, G., Bruggeman, A., and Camera, C.: 21st Century Projections of Extreme Precipitation Indicators for Cyprus, Atmosphere, 11, 343, https://doi.org/10.3390/atmos11040343, 2020.
Ziv, B., Saaroni, H., Paramount, R., Harpaz, T., and Alpert, P.: Trends in rainfall regime over Israel, 1975–2010, and their relationship to large-scale variability, Reg. Environ. Change, 14, 1751–1764, https://doi.org/10.1007/s10113-013-0414-x, 2013.
Ziv, B., Harpaz, T., Saaroni, H., and Blender, R.: A new methodology for identifying daughter cyclogenesis: application for the Mediterranean Basin, Int. J. Climatol., 35, 3847–3861, https://doi.org/10.1002/joc.4250, 2015.
Ziv, B., Saaroni, H., Etkin, A., Harpaz, T., and Shendrik, L.: Formation of cyclones over the East Mediterranean within Red-Sea Troughs, Int. J. Climatol., 42, 577–596, https://doi.org/10.1002/joc.7261, 2021.
Zoccatelli, D., Marra, F., Armon, M., Rinat, Y., Smith, J. A., and Morin, E.: Contrasting rainfall-runoff characteristics of floods in desert and Mediterranean basins, Hydrol. Earth Syst. Sci., 23, 2665–2678, https://doi.org/10.5194/hess-23-2665-2019, 2019.
Zoccatelli, D., Marra, F., Smith, J., Goodrich, D., Unkrich, C., Rosensaft, M., and Morin, E.: Hydrological modelling in desert areas of the eastern Mediterranean, J. Hydrol., 587, 124879, https://doi.org/10.1016/j.jhydrol.2020.124879, 2020.