the Creative Commons Attribution 4.0 License.
the Creative Commons Attribution 4.0 License.
 | 25 Jan 2023
Northern-high-latitude permafrost and terrestrial carbon response to two solar geoengineering scenarios
Yangxin Chen
Qian Zhang
John C. Moore
Olivier Boucher
Andy Jones
Thibaut Lurton
Michael J. Mills
Ulrike Niemeier
Roland Séférian
Simone Tilmes
The northern-high-latitude permafrost contains almost twice the carbon content of the atmosphere, and it is widely considered to be a non-linear and tipping element in the earth's climate system under global warming. Solar geoengineering is a means of mitigating temperature rise and reduces some of the associated climate impacts by increasing the planetary albedo; the permafrost thaw is expected to be moderated under slower temperature rise. We analyze the permafrost response as simulated by five fully coupled earth system models (ESMs) and one offline land surface model under four future scenarios; two solar geoengineering scenarios (G6solar and G6sulfur) based on the high-emission scenario (ssp585) restore the global temperature from the ssp585 levels to the moderate-mitigation scenario (ssp245) levels via solar dimming and stratospheric aerosol injection. G6solar and G6sulfur can slow the northern-high-latitude permafrost degradation but cannot restore the permafrost states from ssp585 to those under ssp245. G6solar and G6sulfur tend to produce a deeper active layer than ssp245 and expose more thawed soil organic carbon (SOC) due to robust residual high-latitude warming, especially over northern Eurasia. G6solar and G6sulfur preserve more SOC of 4.6 ± 4.6 and 3.4 ± 4.8 Pg C (coupled ESM simulations) or 16.4 ± 4.7 and 12.3 ± 7.9 Pg C (offline land surface model simulations), respectively, than ssp585 in the northern near-surface permafrost region. The turnover times of SOC decline slower under G6solar and G6sulfur than ssp585 but faster than ssp245. The permafrost carbon–climate feedback is expected to be weaker under solar geoengineering.
- Article
(10030 KB) - Full-text XML
- BibTeX
- EndNote


The extent of northern-high-latitude permafrost is estimated to be 12.9–17.8 million km2 and accounts for 9 %–14 % of the exposed land surface area (Gruber, 2012). The carbon content of permafrost is nearly twice that of the atmosphere (Tarnocai et al., 2009), with approximately 1035 Pg organic carbon stored in the northern near-surface permafrost (upper 3 m of soil) region (Hugelius et al., 2014), accounting for roughly half of the global soil carbon (Strauss et al., 2017). In the past several decades, the northern high latitudes experienced greater warming than the lower latitudes, recognized as Arctic amplification, and this rapid warming trend is expected to continue in the future (Serreze et al., 2011; Biskaborn et al., 2019). Continued climate warming over the northern high latitudes, accelerated microbial decomposition, and higher climatological temperature sensitivity of soil carbon in cold regions (Schuur et al., 2008; Koven et al., 2017) render the permafrost soil carbon increasingly vulnerable to loss (Crowther and Bradford, 2013; MacDougall et al., 2016; Burke et al., 2017; Varney et al., 2020). Significant amounts of soil organic carbon (SOC) would be decomposed and released into the atmosphere from the northern-high-latitude thawing permafrost (Field and Raupach, 2004), increasing the atmospheric CO2 concentrations and activating positive permafrost carbon–climate feedback to accelerate climate warming (Koven et al., 2011; MacDougall et al., 2012).
The degradation of northern-high-latitude permafrost has been widely studied using climate models. According to an earlier study, under a high-greenhouse-gas-emission scenario, only 1 million km2 of near-surface permafrost will remain by 2100 (Lawrence and Slater, 2005). The CMIP5 (the Coupled Model Intercomparison Project Phase 5; Taylor et al., 2012) climate models show a linear relationship between the permafrost extent and near-surface air temperature over the observed continuous and discontinuous permafrost region, with an average loss of 1.67 million km2 in permafrost area under 1 ∘C of warming (Slater and Lawrence, 2013). With increased climate sensitivity (Zelinka et al., 2020; Meehl et al., 2020) and warmer climate projections (Wyser et al., 2020), the CMIP6 (Coupled Model Intercomparison Project Phase 6; Eyring et al., 2016) models project a loss of permafrost area between 3.1 and 3.8 million km2 (25th and 75th percentiles) and a decrease in annual-mean frozen volume in the top 2 m of soil of between 10 % and 40 % per degree of global-mean annual surface air temperature increase (Burke et al., 2020). Simulations using the land surface model JSBACH show that, compared to 2005, the frozen carbon in the northern near-surface permafrost region at 2100 is reduced by 193 and 387 Pg C, respectively, under the representative concentration pathway 4.5 (rcp45) and 8.5 (rcp85) scenarios (Kleinen and Brovkin, 2018). While an analysis of ensemble simulations from five land surface models shows no significant net losses of near-surface permafrost soil carbon before 2100 under both rcp45 and rcp85 scenarios, permafrost in northern high latitudes would likely act as a net carbon source to the atmosphere after the 21st century under rcp85, when soil carbon release could not be compensated by vegetation production (McGuire et al., 2018). The substantial degradation of near-surface permafrost under the rcp85 scenario would lead to an additional warming of around 0.1 ∘C by 2100 and 0.38 ∘C by 2200, according to large-ensemble simulations performed by a reduced-complexity carbon cycle climate model (Schneider von Deimling et al., 2012).
Geoengineering is considered to be a theoretical option to offset the radiative forcing by anthropogenic factors in addition to mitigation measures. Solar geoengineering as an efficient geoengineering option is designed to mitigate global temperature and reduce some of the associated climate change by deflecting incoming solar radiation back to space and therefore altering the earth's radiative energy budget (Crutzen, 2006; Kravitz et al., 2013a; Zhang et al., 2015; Fawzy et al., 2020). Solar geoengineering has often been simulated by reducing the solar constant (known as solar dimming) or by stratospheric aerosol injection (SAI), and experiments designed for implementation in many climate models have been designed (Kravitz et al., 2011). The SAI geoengineering changes the physical climate system and atmospheric chemistry and presents an impact on the terrestrial ecosystem and the carbon cycle (Muri et al., 2015; Cao, 2018; Plazzotta et al., 2019; Lee et al., 2021), such as enhancing terrestrial photosynthesis by changing the ratio of direct to diffuse sunlight (Xia et al., 2016). In an SAI geoengineering simulation with an rcp85 greenhouse gas emissions scenario based on linearly increasing the stratospheric mass ratio of SO4 with the NorESM1-ME model, soil carbon storage slightly increases due to stabilized surface temperature and reduction in heterotrophic respiration rate (Tjiputra et al., 2016). Enhanced CO2 fertilization effects under geoengineered climate also exert considerable impacts on the carbon cycle compared to a climate of the same warming level without geoengineering (Plazzotta et al., 2019; Lee et al., 2021). In solar dimming geoengineering plus aggressive mitigation simulated with an earth system model of intermediate complexity, the terrestrial biosphere sequestered more atmospheric CO2 by 2100 via enhancement of tropical net primary production with greater accumulation in global total vegetation and soil carbon storages; the carbon–climate feedback affects the solar dimming needed (Cao and Jiang, 2017).
The high-latitude permafrost region and its potential carbon–climate feedback under solar geoengineering have been rarely studied. Lee et al. (2019) studied the responses of the northern-high-latitude permafrost and ecosystem under SAI geoengineering scenarios with the NorESM1-ME model and found that SAI geoengineering can slow down the permafrost degradation, and the ecosystem is affected by both the inhibited warming and enhanced CO2 fertilization effects. Lee et al. (2019) also note that the permafrost extent and soil temperature would rebound back to non-geoengineered states in 2 decades following the termination of SAI geoengineering. Chen et al. (2020) used the soil temperature and net primary production simulated by several earth system models (ESMs) to drive the Permafrost Carbon Network Incubation–Panarctic Thermal scaling model (PInc-PanTher; Koven et al., 2015) under the Geoengineering Model Intercomparison Project (GeoMIP) G4 scenario, which uses rcp45 emissions with SAI geoengineering. They found that the soil carbon in the permafrost region released as CO2 is halved, and that released as CH4 is reduced by 40 % compared to the rcp45 experiment. The PInc-PanTher approach assumes that soil carbon stocks do not decompose when frozen, but once thawed the soil carbon stocks follow predefined decomposition trajectories as a function of soil temperature; this simplified approach neglects many important permafrost processes (Koven et al., 2015). Besides, an indirect estimate of soil carbon loss in the near-surface permafrost region ranges from 27 to 122 Pg C for rcp85 emissions with solar geoengineering maintaining constant 21st-century radiative forcing (Keith et al., 2017).
Different solar geoengineering strategies would exert different impacts on regional climate states (Kravitz et al., 2016) and might drive the northern-high-latitude permafrost ecosystem response differently (Lee et al., 2019, 2021). Solar dimming geoengineering produces uneven patterns of significant cooling, with the polar regions being warmer and the tropics being cooler compared to scenarios of the same level of radiative forcing without geoengineering (Kravitz et al., 2013a; Yu et al., 2015; Russotto and Ackerman, 2018; Visioni et al., 2021). Similarly, equatorial SAI schemes in which sulfate aerosols or their precursors were injected into the equatorial stratosphere also tend to exhibit higher polar-mean annual temperature (Muri et al., 2018; Visioni et al., 2021), the so-called residual polar warming (Henry and Merlis, 2020). The residual polar warming under solar geoengineering has been mainly attributed to seasonal differences in radiative forcing; shortwave reductions can only occur when the sun is above the horizon, whereas longwave greenhouse gas forcing occurs year-round. Whether the residual polar warming affects the efficacy of solar geoengineering in slowing down permafrost degradation has not been studied. Given very limited existing studies and associated large uncertainty, the response of the northern-high-latitude permafrost under solar geoengineering deserves further investigation. Additionally, given the climate model differences in dealing with stratospheric aerosols and their chemistry, using a multi-model approach helps quantify the uncertainties associated with the responses.
In this study, we investigate the responses of the northern-high-latitude permafrost ecosystem under two solar geoengineering scenarios using multiple models. Our study is organized as follows: in Sect. 2, the observation-based datasets, model simulations, and methods are presented. In Sect. 3, we present the responses of northern-high-latitude permafrost and terrestrial carbon to solar geoengineering. Section 4 presents the discussion and conclusions.
2.1 Observation-based datasets
The Northern Circumpolar Soil Carbon Database version 2 (NCSCDv2) (Hugelius et al., 2013, 2014) provides estimated SOC storage in the upper 3 m of soil over the northern circumpolar permafrost region identified by the International Permafrost Association (IPA) permafrost map (Brown et al., 1997). The dataset aggregates pedons from regional soil maps homogenized to the USDA soil taxonomy, allowing SOC storage to be calculated. In pedons where the dataset is incomplete, gap-filling was used to complete calculations over the whole IPA permafrost map. The soil organic carbon content (SOCC) (units of kg C m−2) over the northern circumpolar permafrost region from NCSCDv2 is available at four soil layers (0–30, 0–100, 100–200, and 200–300 cm depth), and a horizontal resolution of 0.5∘ × 0.5∘ is used in this study.
2.2 Model simulations
We examine the permafrost extent and terrestrial carbon fluxes and stocks simulated by five fully coupled CMIP6 ESMs participating in the Geoengineering Model Intercomparison Project (GeoMIP) that have carried out the G6solar and G6sulfur simulations and compare with results from the ssp245 and ssp585 simulations (Table 1). G6solar reduces radiative forcing from a high-tier emission scenario (Shared Socioeconomic Pathway ssp585; Meinshausen et al., 2020) to medium-tier emission scenario (ssp245) levels with uniform reduction in solar constant. G6sulfur is based on ssp585 as well, whereas it reduces radiative forcing from ssp585 to ssp245 levels through stratospheric aerosol injection from 10∘ S to 10∘ N along a single longitude band (Kravitz et al., 2015).
Given that the complexity of permafrost processes varies considerably in the five ESMs (Table 1), we also use the latest version of the Community Land Model version 5 (CLM5; Lawrence et al., 2019) to carry out the anomaly-forcing simulations to examine the responses of northern-high-latitude permafrost and terrestrial carbon under the climate warming signals derived from each ESM's future-scenario simulations. The anomaly-forcing method can effectively capture the relative changes between scenarios in terms of near-surface climate fields required to drive an offline land surface model. This method has been used by the Permafrost Carbon Network model intercomparison project (McGuire et al., 2018). Comparing the results of the anomaly-forcing CLM5 simulations and the ESM simulations is helpful to understand the main sources of uncertainties in the projected responses of northern-high-latitude permafrost and terrestrial carbon under solar geoengineering scenarios.
The CLM5 is a state-of-the-art land surface model that includes substantial processes associated with permafrost simulation, such as canopy snow processes, cryoturbation, decomposition limitation for frozen soils, and vertically resolved soil carbon content (Lawrence et al., 2018). CLM5 can reasonably reproduce historical permafrost extent and soil carbon storage in the northern-high-latitude near-surface permafrost region (Lawrence et al., 2019). CLM5 offers a built-in function supporting the anomaly-forcing method by applying pre-calculated future monthly anomaly signals to user-defined historical sub-daily reference forcing data (Lawrence et al., 2015). In this study, monthly anomaly-forcing datasets are created for each ESM's four future-climate scenarios (G6solar, G6sulfur, ssp245, and ssp585) against their corresponding historical simulation during the period 2005–2014, including temperature, radiation, precipitation, pressure, wind, and specific humidity. CLM5 reconstructs new sub-daily forcing data by applying the pre-calculated monthly anomaly forcing on top of the 3-hourly Global Soil Wetness Project forcing dataset (GSWP3; http://hydro.iis.u-tokyo.ac.jp/GSWP3/, last access: 21 January 2023), which is also used to drive CLM5 for its spin-up and historical simulation from 1850 to 2014.
All ensemble members of each experiment are averaged for each model and bilinearly regridded to a common resolution of 0.5∘ × 0.5∘. The models used for analysis have varying representations of terrestrial carbon pools, and we combine litter and soil carbon in the analysis and refer to the sum as soil carbon. The simulated permafrost extent and SOC in the northern near-surface permafrost region (upper 3 m of soil) during the baseline period (1995–2014) are compared with the IPA permafrost map (Brown et al., 1997) and NCSCDv2 (Hugelius et al., 2013, 2014) datasets. Changes in permafrost extent, active layer thickness (ALT), carbon fluxes, and carbon stocks over the permafrost region under the four scenarios at the end of the 21st century (2080–2099) relative to the baseline period are analyzed.
Table 1Summary of land scheme, the constitution of soil carbon, and simulations for each CMIP6 earth system model.
1 Model vertically resolving soil organic carbon and considering cryoturbation effects on soil organic carbon; 2 cSoil denotes soil organic carbon pool, cLitter denotes litter carbon pool, and cCwd denotes coarse wood debris pool.
2.3 Deriving permafrost extent and ALT
Two different methods are used to derive permafrost extent. First, we follow the procedures detailed in Chadburn et al. (2017) to derive the probability of permafrost in the northern high latitudes by ensemble-mean near-surface air temperature for each experiment of each model based on an observation-based mean annual air temperature (MAAT)–permafrost probability relationship, which was updated in an earlier work by Gruber (2012). In this approach, the probability of permafrost is a cumulative normal distribution function of MAAT at each grid cell: , where mean ∘C and standard derivation σ=2.59 ∘C (Chadburn et al., 2017). All grid cells with the probability of finding permafrost ≥ 0.01 are considered to be permafrost regions, those with the probability ≥ 0.5 are considered to be continuous and discontinuous permafrost, and those with the probability <0.5 are considered to be sporadic and isolated permafrost patches. This approach is also used by Burke et al. (2020) in evaluating permafrost physics in the CMIP6 models and their sensitivity to climate change. Following Burke et al. (2020), and the permafrost area is defined as the area of grid cells with the permafrost probability ≥ 0.01, the permafrost extent is defined as the area of grid cells weighted by the permafrost probability in each grid cell. The PF50 % area, on the other hand, is the area of the grid cells where the probability of finding permafrost is ≥ 0.5, and it is not weighted by the proportion of permafrost. To facilitate analysis, we choose the five ESMs' ensemble-mean PF50 % region during the baseline period (1995–2014) as a common region to compare the surface climate, terrestrial carbon fluxes, and carbon stocks among different scenarios. This baseline PF50 % region is determined by firstly calculating permafrost probability for each grid cell for each model during the baseline period, then calculating the multi-model ensemble-mean permafrost probability and deriving the area of all grid cells with multi-model ensemble-mean permafrost probability ≥ 0.5.
The second method identifies the existence of permafrost as those grid cells in which the annual maximum ALT is within the upper 3 m of soil. In this case, the permafrost area is defined as the area of grid cells with the annual maximum ALT ≤ 3 m. Given the coarse vertical discretization of land surface models, the monthly soil temperatures at model layers' centers (or nodes) were linearly interpolated along the soil depth; the maximum depth throughout the year where the soil temperature crosses 0 ∘C is defined as ALT (Lawrence et al., 2012). This method and its variations have been widely used in permafrost studies (e.g., Dankers et al., 2011; Lawrence et al., 2012; Peng et al., 2016; Andresen et al., 2020).
3.1 Changes in surface climate
Solar geoengineering is designed to reduce shortwave radiation at the land surface, which alters the surface-absorbed solar radiation (RN). Most notable changes in RN under G6solar and G6sulfur occur in boreal summer (Fig. 1c–d), while in winter only minor changes occur due to the lack of solar insolation (Fig. 1a, b). In summer, G6solar shows a small decrease in RN over northern North America and a small increase in RN over northern Eurasia relative to ssp245 (Fig. 1c), but G6sulfur shows a considerable decrease in RN over both northern North America and northern Eurasia (Fig. 1d) for the period 2080–2099. The averaged RN change over the baseline PF50 % region in summer is −0.7 ± 2.7 (mean ± 1 standard deviation, same thereafter) and −7.4 ± 3.1 W m−2 for G6solar and G6sulfur relative to ssp245, respectively. In contrast, ssp585 shows a large increase in RN (5.3 ± 5.8 W m−2) with respect to ssp245 in summer due to it having the largest snow extent retreat among the four scenarios in the period 2080–2099 (not shown). RN is a primary component of the surface energy budget and a fundamental force driving the exchanges of energy, water, and carbon between land and atmosphere (Sellers et al., 1997). The different change in seasonality of RN indicates that the surface climate would be different under G6solar and G6sulfur.
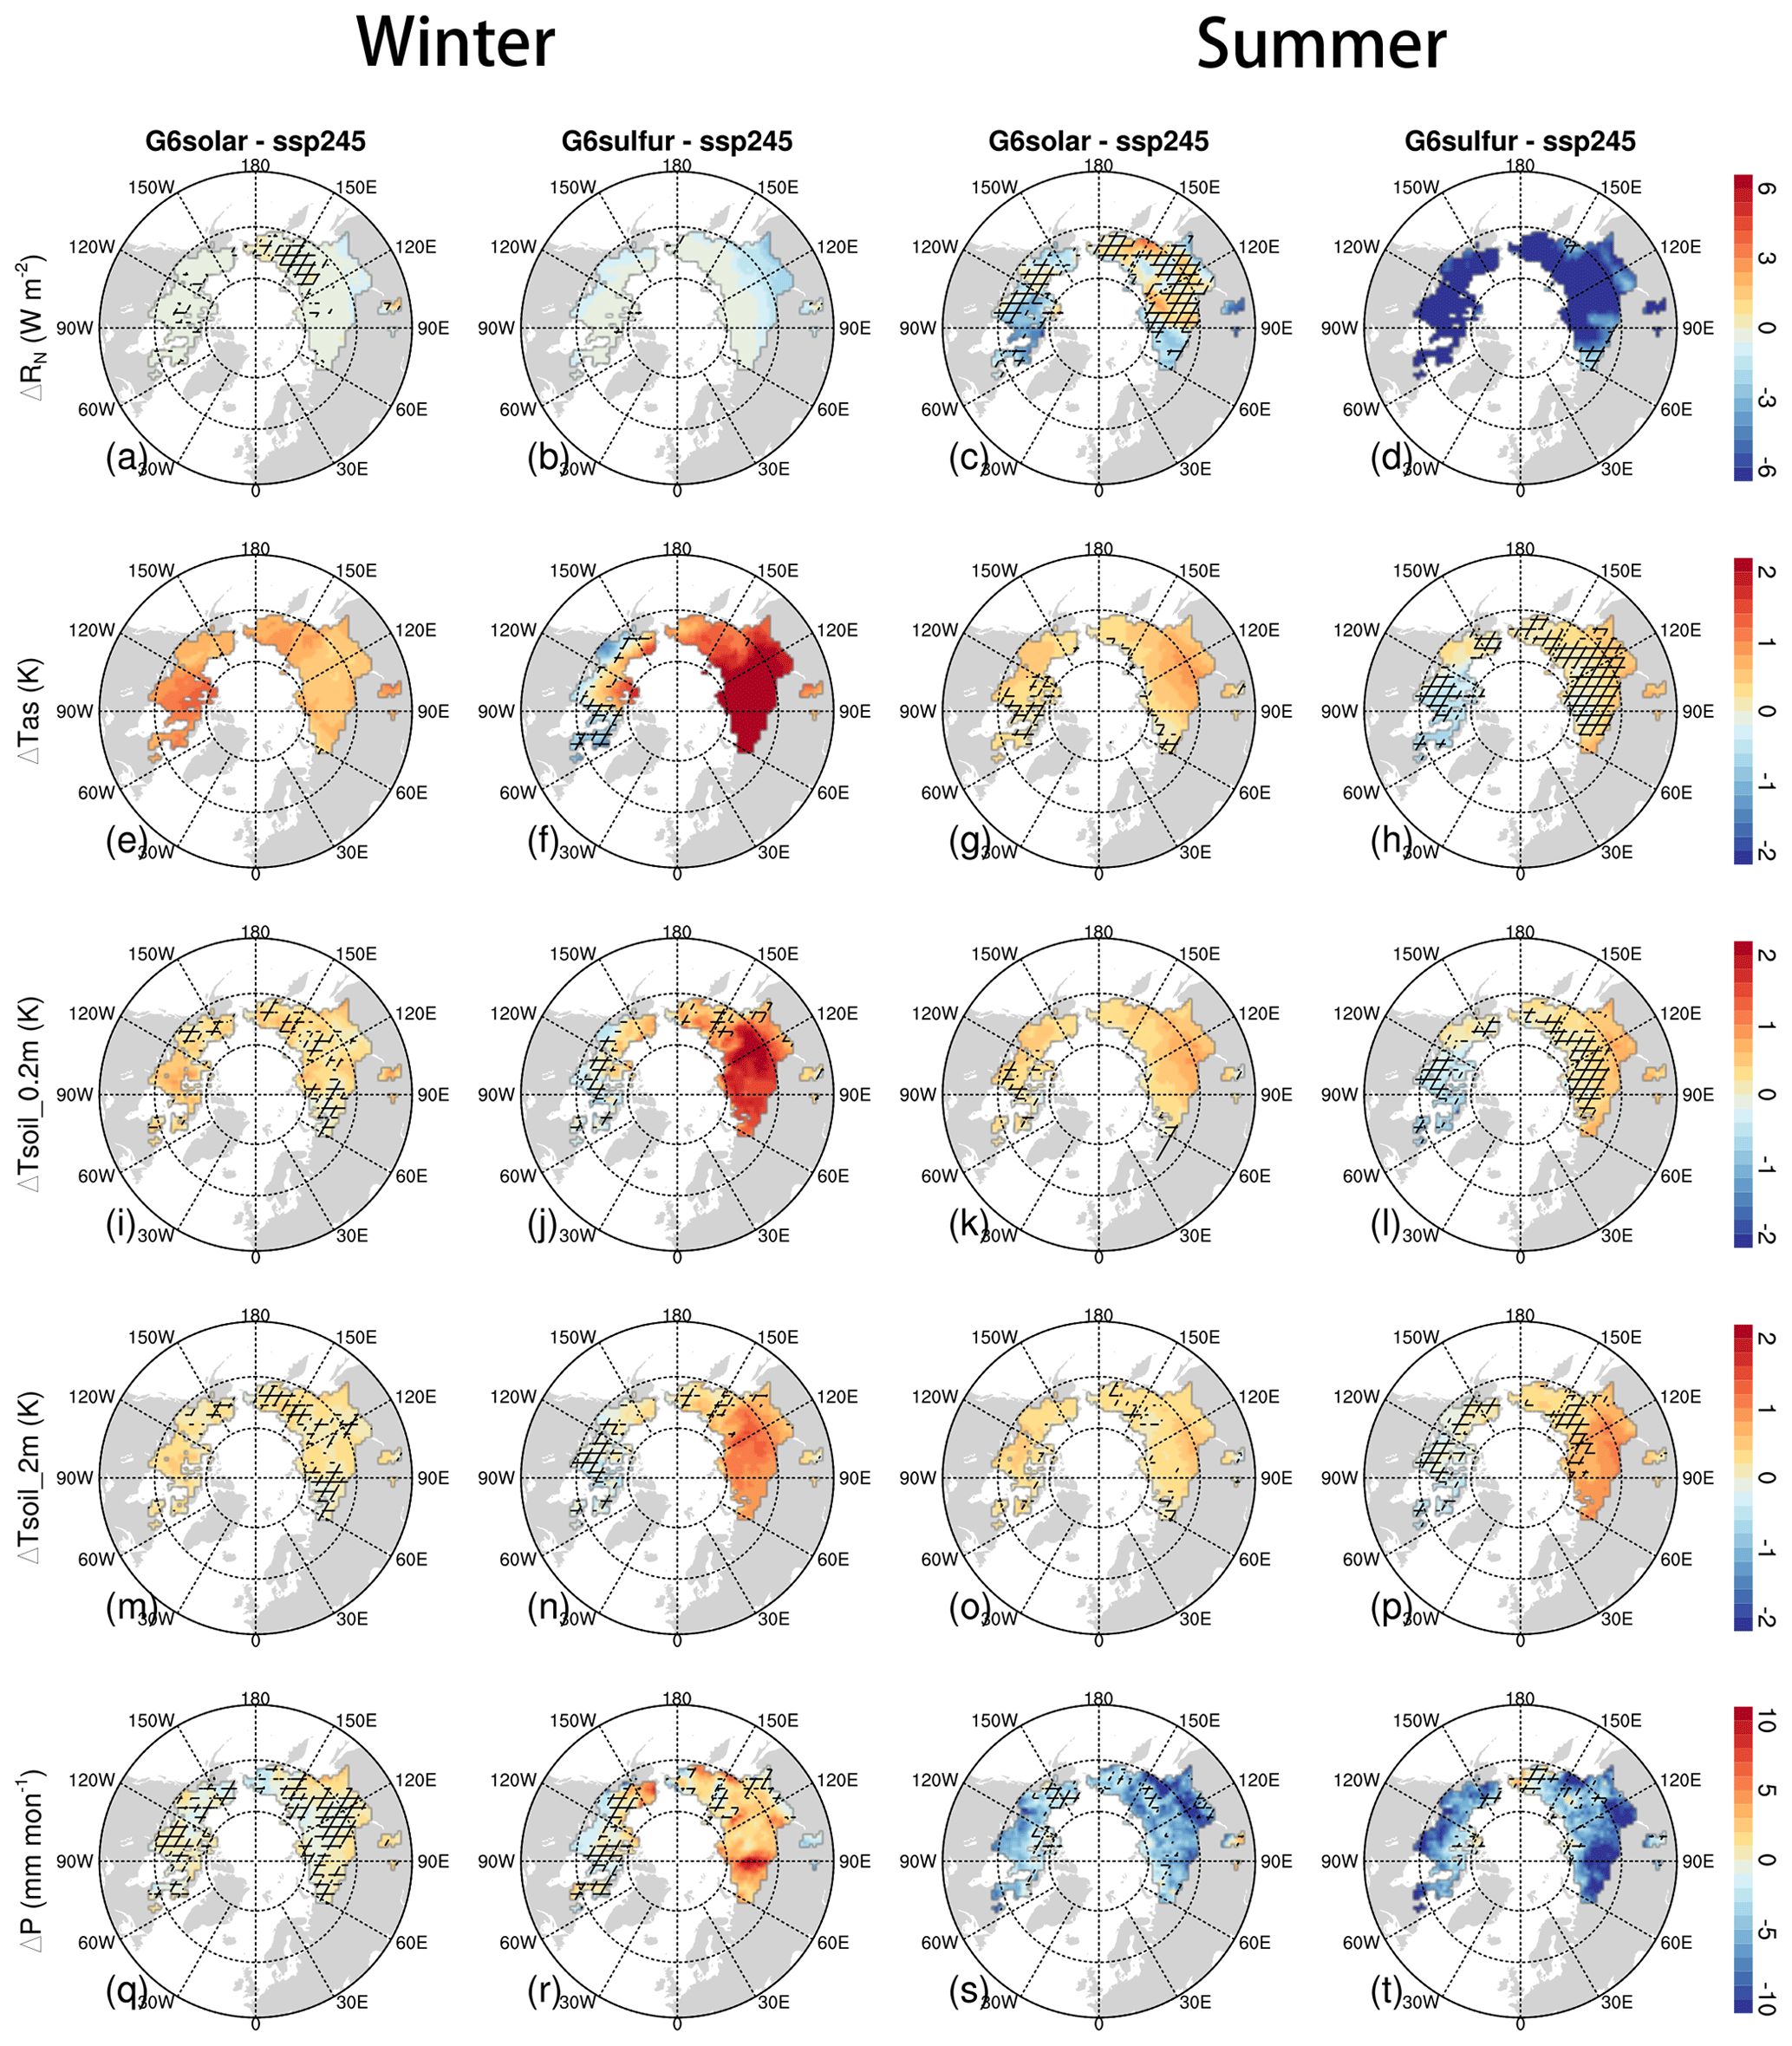
Figure 1The multi-model mean changes in surface-absorbed shortwave radiation (ΔRN; a, b, c, d), near-surface air temperature (ΔTas; e, f, g, h), 0.2 m soil temperature (ΔTsoil_0.2m; i, j, k, l), 2 m soil temperature (ΔTsoil_2m; m, n, o, p), and precipitation (ΔP; q, r, s, t) under G6solar and G6sulfur relative to ssp245 for the period 2080–2099 over the baseline PF50 % region. The left two columns show changes in winter (December, January, and February); the right two columns show changes in summer (June, July, and August). The hatched area in each panel indicates where fewer than 80 % of the ESMs (four out of five) agree on the sign of changes.
The mean annual near-surface air warming over the baseline PF50 % region is about twice the global-mean annual warming by the period 2080–2099, but the mean annual near-surface air temperature is still well below 0 ∘C under G6solar, G6sulfur, and ssp245 and rises above the freezing point under ssp585 (0.5 ± 0.8 ∘C), when the permafrost thaws nearly completely. In all models G6solar and G6sulfur reduce global-mean annual near-surface air temperature to within 0.2 ∘C of ssp245 levels (Visioni et al., 2021). However, G6solar and G6sulfur show a large residual warming pattern over the high-latitude permafrost region (Fig. 1e, f, g, h), with 0.4 ± 0.1 and 0.6 ± 0.6 ∘C more than ssp245 on annual average, respectively. The residual warming is more profound in winter over northern Eurasia, where G6solar shows year-round residual warming (0.6 ± 0.2 ∘C for winter and 0.5 ± 0.1 ∘C for summer), while under G6sulfur there is stronger seasonality in the year-round residual warming (2.1 ± 0.8 ∘C for winter, 0.2 ± 0.5 ∘C for summer). The relatively warmer summer across the baseline PF50 % region under G6solar relative to ssp245 is a robust feature among the five ESMs.
The impact of residual near-surface air warming on soil temperature depends on the thermal insulation of snow, litter layers, and soil organic matter. The five ESMs used in this study all adopt multi-layered snow schemes and consider the thermal effects of soil organic matter, but no explicit litter layer (Table 1); the thermal insulation mainly comes from snowpack and soil organic matter. The largest differences between near-surface air temperature and soil surface temperature occur in winter, when the snowpack creates strong thermal insulation. In the PF50 % region, the differences in snow coverage and snow depth are statistically insignificant between G6solar and ssp245, while the snow depth under G6sulfur is slightly thicker than ssp245 due to more snowfall in winter (Fig. 1r). However, the averaged thermal offset (measured as soil temperature at 0.2 m depth minus near-surface air temperature) over the PF50 % region in winter during the period 2080–2099 is 4.0 ± 2.4, 3.9 ± 2.3, and 4.1 ± 2.4 ∘C for G6solar, G6sulfur, and ssp245, respectively; their differences are considerably smaller than the magnitude of winter residual warming in near-surface air. As a result, the spatial patterns of residual warming in near-surface air and 0.2 m depth soil are similar (Fig. 1, second row vs. third row).
The profound residual winter warming in near-surface air affects summer soil temperatures at deep layers. In winter, the magnitude of residual warming in soil at 0.2 m depth (Fig. 1i, j) is relatively smaller than near-surface air (Fig. 1e, f), mostly due to thermal insulation of snow layers, and the residual warming attenuates further at 2 m depth soil (Fig. 1m, n). In summer, the residual warming in near-surface air (Fig. 1g, h) is less pronounced in both G6solar and G6sulfur than winter. However, G6sulfur shows a greater 2 m soil warming in northern Eurasia with respect to ssp245 (Fig. 1p), and the residual warming in soil at 2 m depth is even more pronounced and more robust among the models than the residual warming in near-surface air (Fig. 1h). In the baseline PF50 % region over northern Eurasia, the soil at 2 m depth shows 0.2 ± 0.3 and 0.8 ± 0.8 ∘C residual warming in winter and 0.3 ± 0.2 and 0.6 ± 0.7 ∘C residual warming in summer, respectively, under G6solar and G6sulfur relative to ssp245. The anomaly-forcing CLM5 simulations show similar residual warming at 2 m depth soil, with 0.2 ± 0.3 and 0.7 ± 0.7 ∘C in winter and 0.2 ± 0.2 and 0.6 ± 0.5 ∘C in summer under G6solar and G6sulfur, respectively, with respect to ssp245. The increase in summer soil temperature due to the profound residual winter warming in near-surface air would affect summer permafrost thawing (Burn and Zhang, 2010).
Precipitation under solar geoengineering is generally less than climate scenarios of the same warming level without geoengineering due to atmospheric heating imbalance (Niemeier et al., 2013; Kravitz et al., 2013b), enhanced atmospheric stability (Ferraro et al., 2014), and weaker hydrological cycle (Bala et al., 2010; Schmidt et al., 2012; Tilmes et al., 2013; Simpson et al., 2019), and this holds over the northern-high-latitude permafrost region as well. G6solar shows similar precipitation changes to ssp245 during the non-summer seasons, and G6sulfur shows a relatively small increase in precipitation relative to ssp245 during the non-summer seasons, but the precipitation clearly decreases in both G6solar and G6sulfur relative to ssp245 during summer (Fig. 1q, r, s, t), when the incoming solar radiation has maximum reductions. In winter, the total precipitation increases by 0.1 ± 1.4 and 4.5 ± 3.0 mm for G6solar and G6sulfur, respectively, relative to ssp245 over the baseline PF50 % region for the period 2080–2099. In summer, the total precipitation decreases by 14.6 ± 8.3 and 18.7 ± 11.3 mm for G6solar and G6sulfur, respectively, relative to ssp245, and the precipitation reduction is robust among the five ESMs. The larger precipitation reduction in G6sulfur than G6solar can be ascribed to larger RN reduction in G6sulfur (Fig. 1c, d), as the absorption of longwave radiation by the sulfate aerosols requires a stronger reduction in net downward shortwave surface fluxes than in the case of G6solar and enhances atmospheric heating imbalance (Niemeier et al., 2013).
3.2 Changes in permafrost extent and ALT
The permafrost extent derived from the MAAT simulated by the five ESMs is in the range of 12.1–17.5 million km2 (multi-model ensemble mean: 13.9 million km2) for the period 1960–1990, which is comparable to 12.0–18.2 million km2 (mean: 15.5 million km2) from the reconstructed permafrost map for the same period (Chadburn et al., 2017) and the actual area underlain by permafrost (12.21–16.98 million km2; Zhang et al., 2000). The baseline permafrost extent for the period 1995–2014 is in the range of 11.0–15.5 million km2 (multi-model ensemble mean: 12.3 million km2), covering all permafrost zones on the IPA permafrost map and extending further south (Fig. 2b). Our results agree well with existing studies, such as the permafrost extent of 15.1 ± 2.6 million km2 for the period 2000–2014 (Aalto et al., 2018) and 13.9 million km2 for the period 2000–2016 (Obu et al., 2019). The baseline permafrost of more than 50 % probability, the baseline PF50 % region (corresponding to MAAT <−4.38 ∘C), is located entirely on the IPA permafrost map, with a total area of 12.3 million km2.
The soil-temperature-derived permafrost area ranges from 2.4 million km2 (IPSL-CM6A-LR) to 19.0 million km2 (CNRM-ESM2-1) for the period 1960–1990; it is considerably different from the range (12.1–17.5 million km2) derived from the MAAT, and it is also different from the observational estimate (12.21–16.98 million km2; Zhang et al., 2000). The permafrost area derived from the soil temperature of CLM5 simulation for the period 1960–1990 is 12.3 million km2, which is in the range of observational estimates and close to the multi-model ensemble-mean permafrost extent (13.9 million km2) derived from the MAAT for the same period. The CLM5-simulated permafrost area is 11.1 million km2 for the baseline period 1995–2014, and it is about 1.2 million km2 smaller than the baseline PF50 % region derived from the MAAT. Burke et al. (2020) have shown that CLM5 can simulate the relationship between MAAT and mean annual ground temperature (MAGT) at the top of the permafrost much closer to the observations than other land schemes used in CMIP6 models, and this relationship is important for realistic permafrost simulation. Furthermore, the anomaly-forcing CLM5 simulations reproduce the residual warming in soil as the five ESM simulations under G6solar and G6sulfur. Therefore, the permafrost extent and ALT derived from soil temperatures of the anomaly-forcing CLM5 simulations can be used to study how the northern-high-latitude permafrost responds under G6solar and G6sulfur.
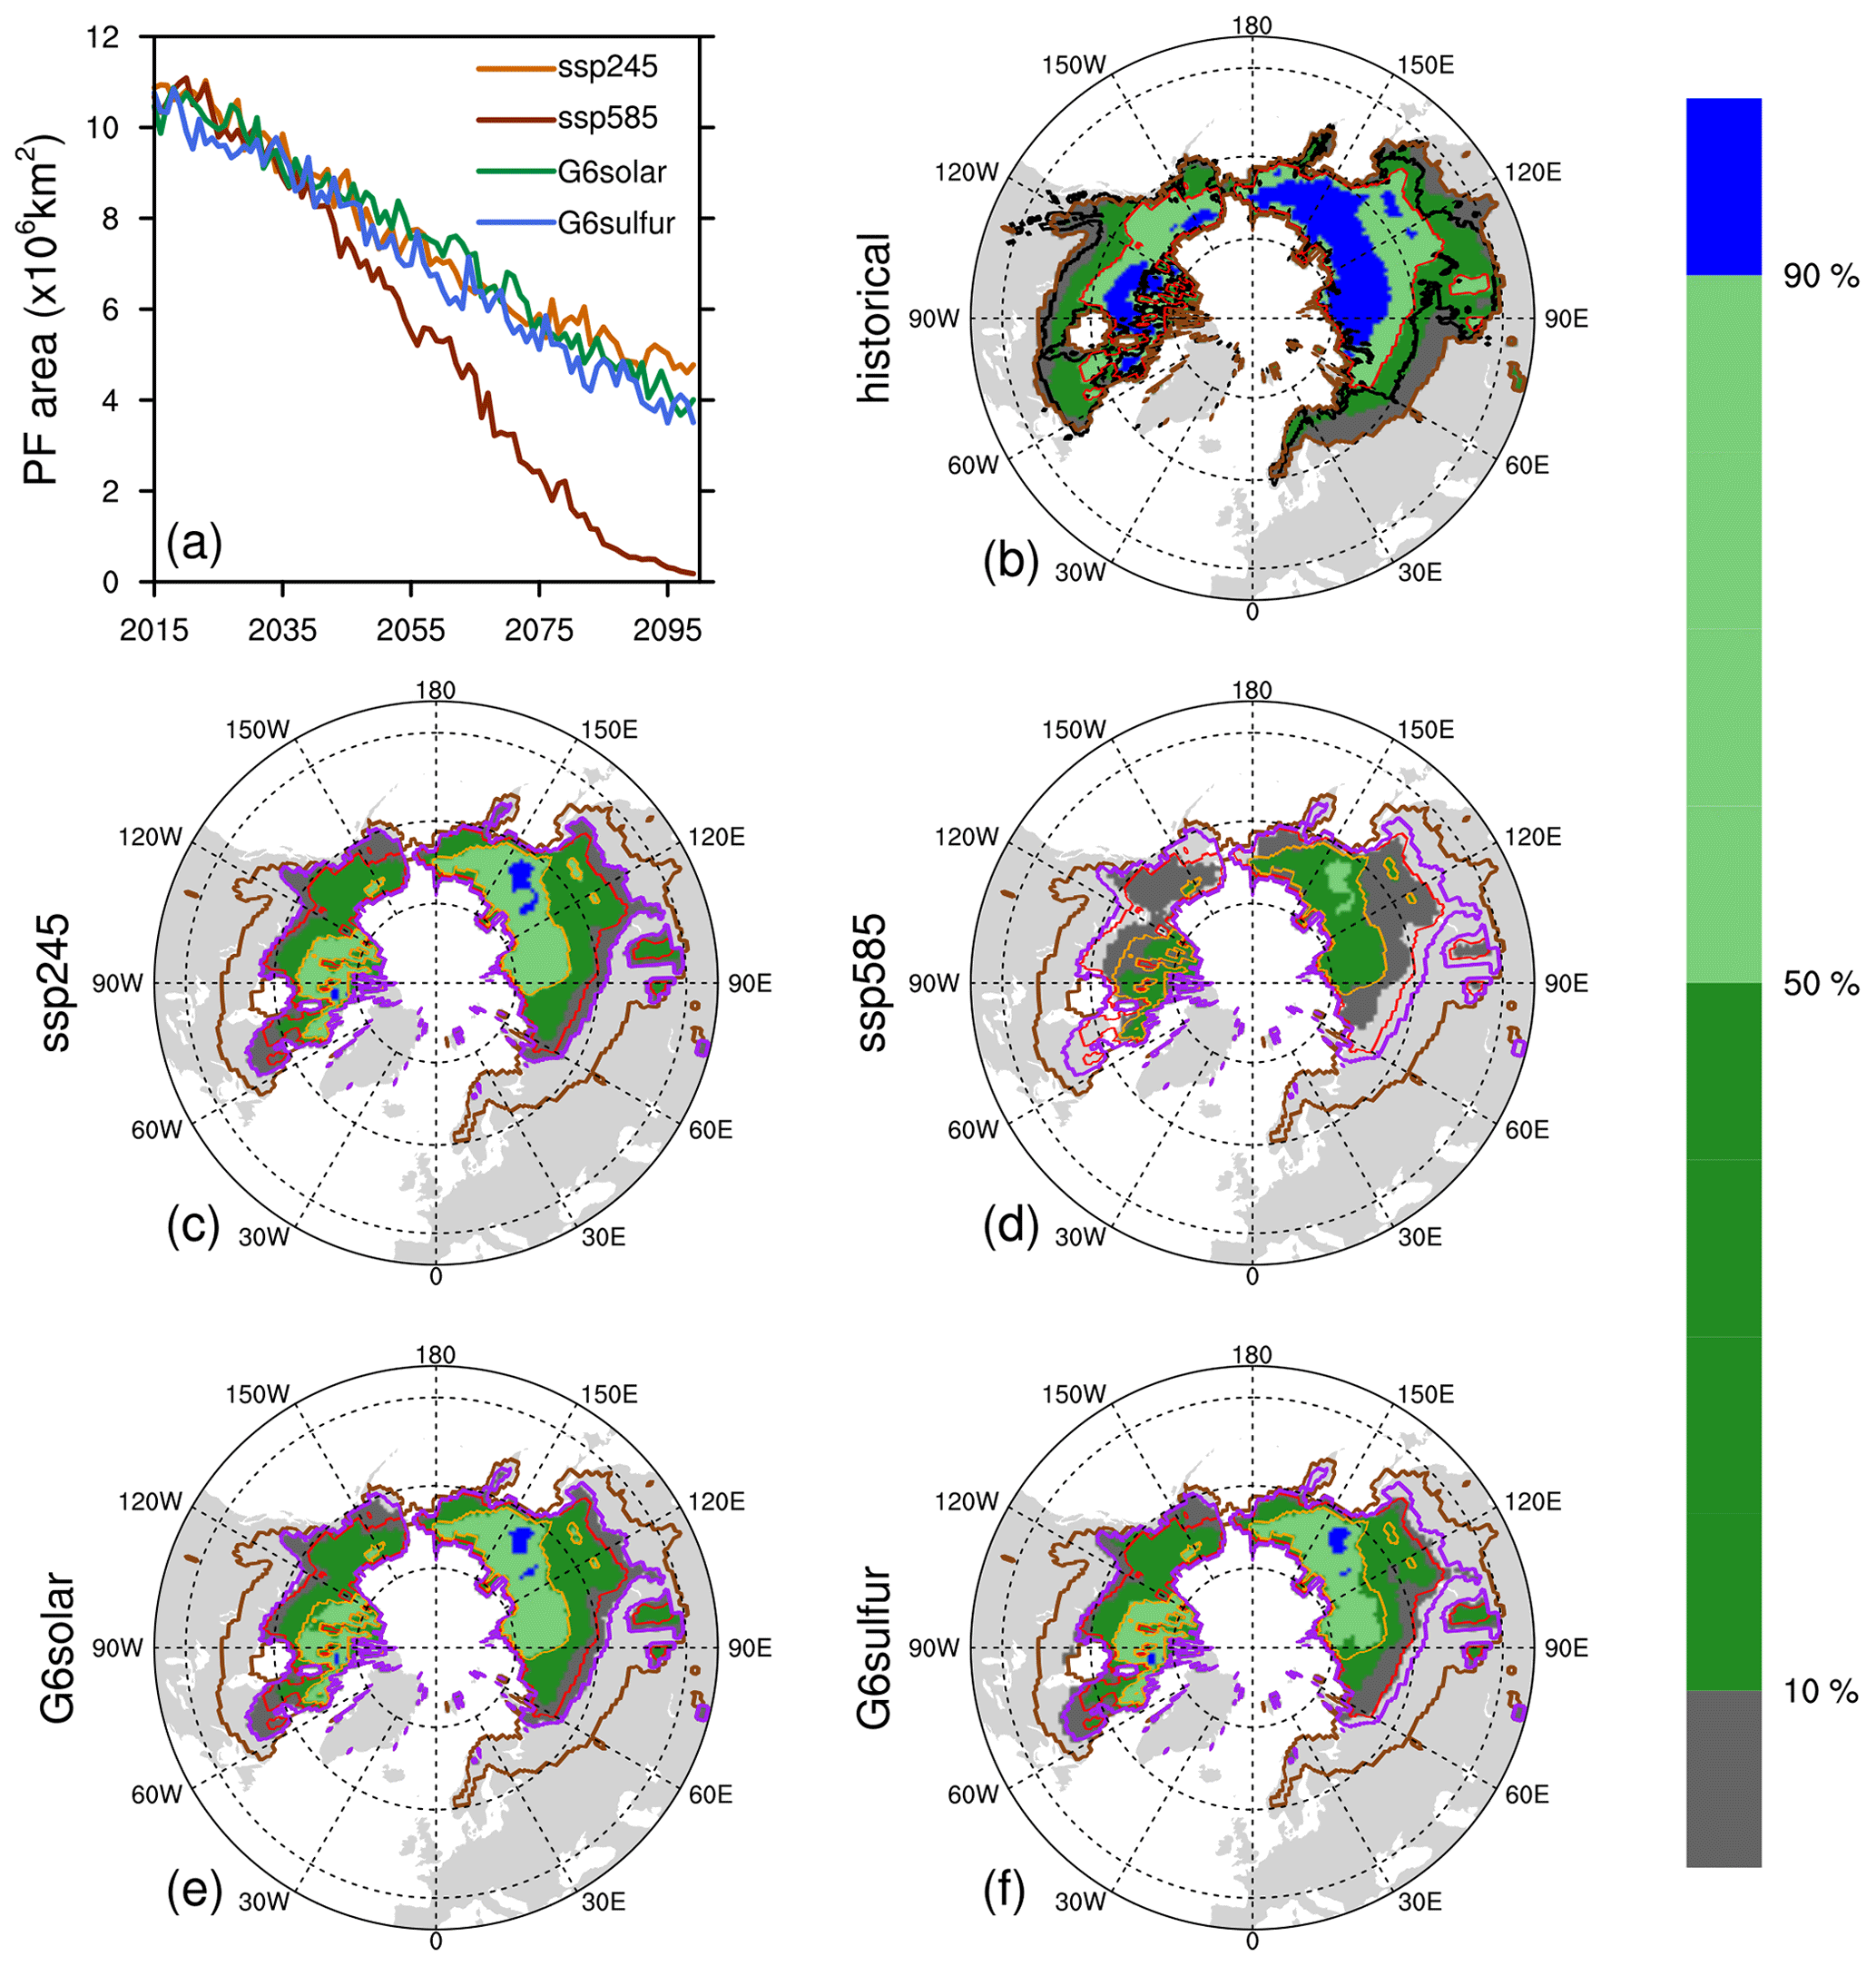
Figure 2Permafrost area and probability derived according to the observation-based MAAT–permafrost probability relationship (Chadburn et al., 2017). Panel (a) shows change in multi-model mean area of the PF50 % region under ssp245, ssp585, G6solar, and G6sulfur during the period 2015–2099. Panels (b)–(f) show multi-model mean permafrost probability (shading) and region (curves) for the last 20 years of each experiment. The black curve in (b) denotes the permafrost region defined by the IPA permafrost map. The brown and purple curves denote the multi-model mean permafrost regions (permafrost probability ≥0.01) for historical and ssp245 simulations, respectively. The red and orange curves denote the multi-model mean permafrost regions where the permafrost probability ≥0.5 for historical and ssp245 simulations, respectively.
The residual warming over the high-latitude permafrost region under G6solar and G6sulfur relative to ssp245 generates some disparities in the permafrost distribution. For the high-warming scenario ssp585, the majority of permafrost will thaw by the period 2080–2099 (Fig. 2a), with a remnant area of only 1.4 million km2 that is mostly sporadic and isolated patches (1.2 million km2; Fig. 2d) according to the permafrost probability derived from the MAAT. For G6solar, G6sulfur, and ssp245, however, about 41 %, 39 %, and 45 % of the baseline permafrost is preserved, respectively (5.0, 4.8, and 5.5 million km2 for G6solar, G6sulfur, and ssp245, respectively), and the majority of preserved permafrost is maintained as continuous and discontinuous permafrost, with areas of 3.1, 2.9, and 3.5 million km2, respectively. The modest losses of continuous and discontinuous permafrost zones under G6solar and G6sulfur relative to ssp245 mainly appear at the southern edge, central Canada, and the central Siberian highlands (Fig. 2c, e, f). The area of sporadic and isolated patches under G6solar, G6sulfur, and ssp245 shows little differences (1.9, 1.9, and 2.0 million km2 for G6solar, G6sulfur, and ssp245, respectively), as they could be transformed from continuous and discontinuous permafrost under a warmer climate.
The permafrost area derived from the soil temperatures of anomaly-forcing CLM5 simulations retreats a litter slower than the area of PF50 % derived from the ESM-simulated MAAT (Figs. 2a, 3a). The remnant permafrost area given by the anomaly-forcing CLM5 simulations is 6.4 ± 1.5, 6.2 ± 1.6, 6.5 ± 1.6, and 2.8 ± 1.4 million km2 for the period 2080–2099 under G6solar, G6sulfur, ssp245, and ssp585, respectively, and they are about 1.4 million km2 larger than the area of PF50 % derived from the ESM-simulated MAAT for all scenarios (5.0, 4.8, 5.5, and 1.4 million km2 for G6solar, G6sulfur, ssp245, and ssp585, respectively). The systematical differences in the permafrost retreating speed and remnant permafrost area given by two methods are mainly due to their methodological differences in detecting the existence of permafrost. The observation-based MAAT–permafrost probability relationship tends to show equilibrium response of permafrost (Chadburn et al., 2017), which is usually larger than the transient response of permafrost simulated by the anomaly-forcing CLM5 simulations.

Figure 3Changes in permafrost area as defined by the annual maximum active layer thickness (ALT) within 3 m under ssp245, ssp585, G6solar, and G6sulfur during the period 2015–2099 (a) and spatial distribution of annual maximum ALT changes (color-filled contour) in G6solar relative to G6sulfur (b), G6solar relative to ssp245 (c), and G6sulfur relative to ssp245 (d) averaged for the period 2080–2099 in the anomaly-forcing CLM5 simulations. In panels (b), (c), and (d), the black line denotes the permafrost region for the baseline period 1995–2014 of the CLM5 historical simulation, and the green line denotes the averaged permafrost region for the period 2080–2099 of the CLM5 ssp245 simulations. For G6solar, G6sulfur, and ssp245, the results are averaged for all five anomaly CLM5 simulations of each scenario.
The ALT is generally deeper under G6solar and G6sulfur than ssp245 across much of northern Eurasia despite their permafrost region being similar according to the anomaly-forcing CLM5 simulations (Fig. 3c, d), while ALT over northern North America tends to be deeper under G6solar and shallower under G6sulfur than ssp245. The average ALT over northern Eurasia is 0.03 ± 0.07 and 0.11 ± 0.14 m deeper under G6solar and G6sulfur, respectively, than ssp245, while the average ALT over northern North America is only 0.02 ± 0.07 m deeper under G6solar and −0.09 ± 0.10 m shallower under G6sulfur than ssp245. Comparing with G6sulfur, the average ALT over northern Eurasia is 0.08 ± 0.10 m shallower under G6solar, but the average ALT over northern North America is 0.10 ± 0.10 m deeper under G6solar (Fig. 3b). The differences in ALT reflect the regional differences in residual soil warming under G6solar and G6sulfur with respect to ssp245 (Fig. 1o, p). Despite the fact that G6solar and G6sulfur have a slightly smaller permafrost extent than ssp245 due to the residual soil warming, they still preserve much more northern-high-latitude permafrost by prohibiting ALT thickening compared with ssp585.
3.3 Changes in terrestrial carbon fluxes and stocks
3.3.1 Terrestrial carbon fluxes
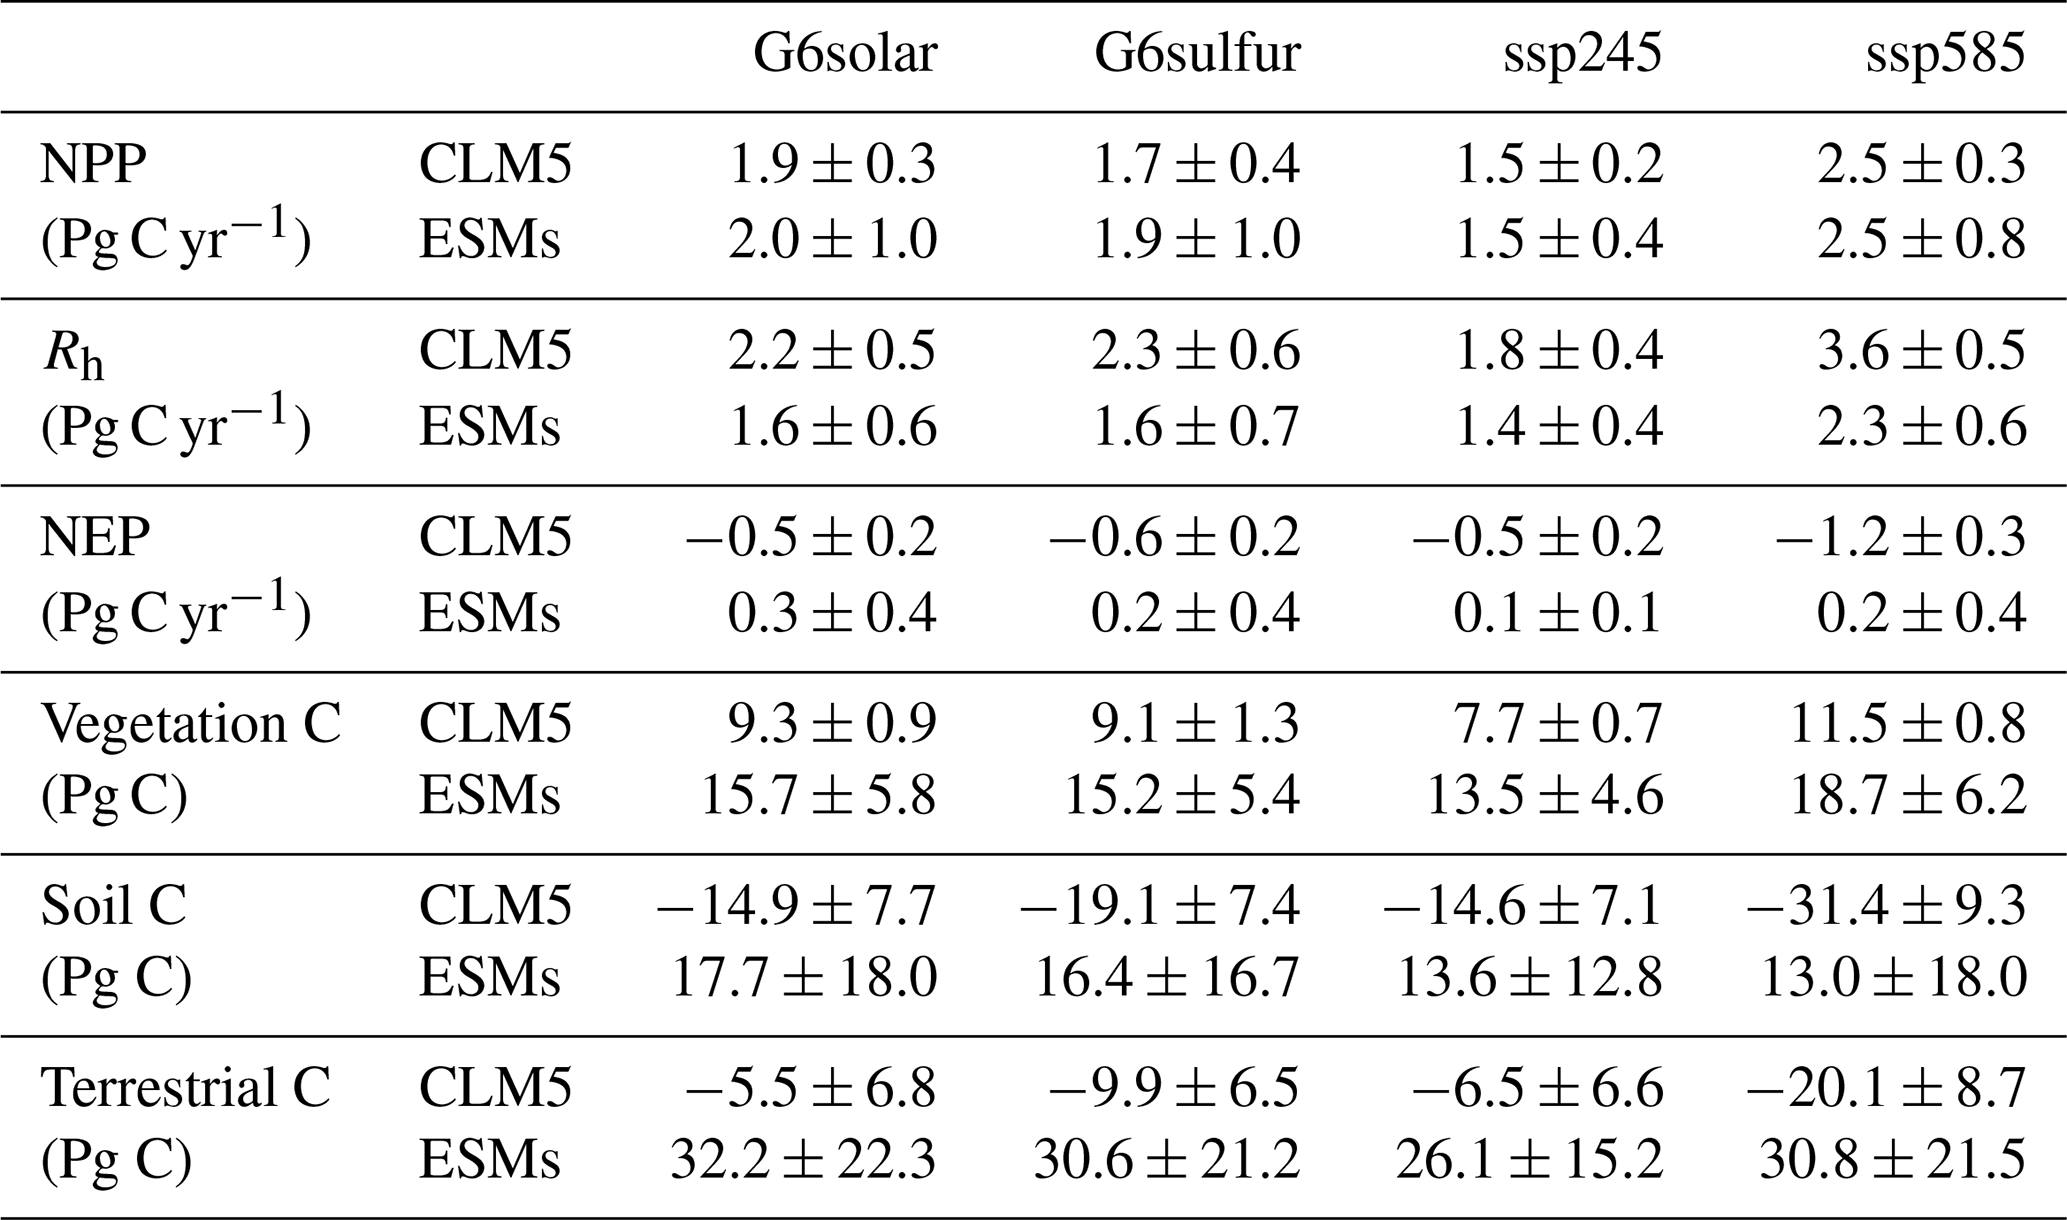
The net primary production (NPP) in the baseline permafrost region follows an upward trend under the four scenarios during the 21st century as climate warms (Fig. 4a). Compared with the baseline period 1995–2014 over the PF50 % region, the five ESMs projected multi-model ensemble-mean NPP increases of 2.0 ± 1.0, 1.9 ± 1.0, 1.5 ± 0.4, and 2.5 ± 0.8 Pg C yr−1 for G6solar, G6sulfur, ssp245, and ssp585, respectively, in the period 2080–2099. The anomaly-forcing CLM5 simulations projected NPP increases of 1.9 ± 0.3, 1.7 ± 0.4, 1.5 ± 0.2, and 2.5 ± 0.3 Pg C yr−1 for G6solar, G6sulfur, ssp245, and ssp585, respectively (Table 2). Warmer climate over the permafrost region under the ssp585 scenario alleviates the temperature limitation on the high-latitude ecosystem and results in larger increases in NPP. Surface cooling by implementing G6solar and G6sulfur geoengineering suppresses plant growth at high latitudes relative to ssp585, and the increasing rates in NPP are slower under G6solar and G6sulfur than that for ssp585, although the three scenarios share the same atmospheric CO2 concentrations. On the other hand, relative warmer summer temperature and stronger CO2 fertilization effects under G6solar and G6sulfur facilitate vegetation growth and enhance NPP increasing more than ssp245. The relative differences in NPP seasonal cycle among the four scenarios mainly occur from the start of the growing season (April) to late autumn (October), and the amplitude of relative seasonal difference is nearly the same for the ESM simulations and CLM5 simulations under each scenario (Fig. 5a). Differences in NPP under G6solar and G6sulfur relative to ssp245 peak in June for the ESM simulations and July for the CLM5 simulations; the relatively larger NPP in G6solar than that of G6sulfur is consistent with warmer temperature and more absorbed surface shortwave radiation under G6solar during summer (Fig. 1c, g). G6solar and G6sulfur growth starts later in spring than with ssp585 and ends earlier in autumn, which is in line with an earlier study concluding that the reductions in plant primary production at high latitudes under solar geoengineering scenarios are mainly attributable to the shorter growth season (Duan et al., 2020). Therefore, the higher level of atmospheric CO2 concentrations and the warmer climate under G6solar and G6sulfur than for ssp245 enhance plant photosynthesis and net primary production, even though soil tends to be slightly drier as precipitation is reduced in summer under G6solar and G6sulfur (Fig. 1s, t), indicating that temperature and CO2 fertilization effects at high latitudes play more important roles than soil moisture in plant carbon uptake.
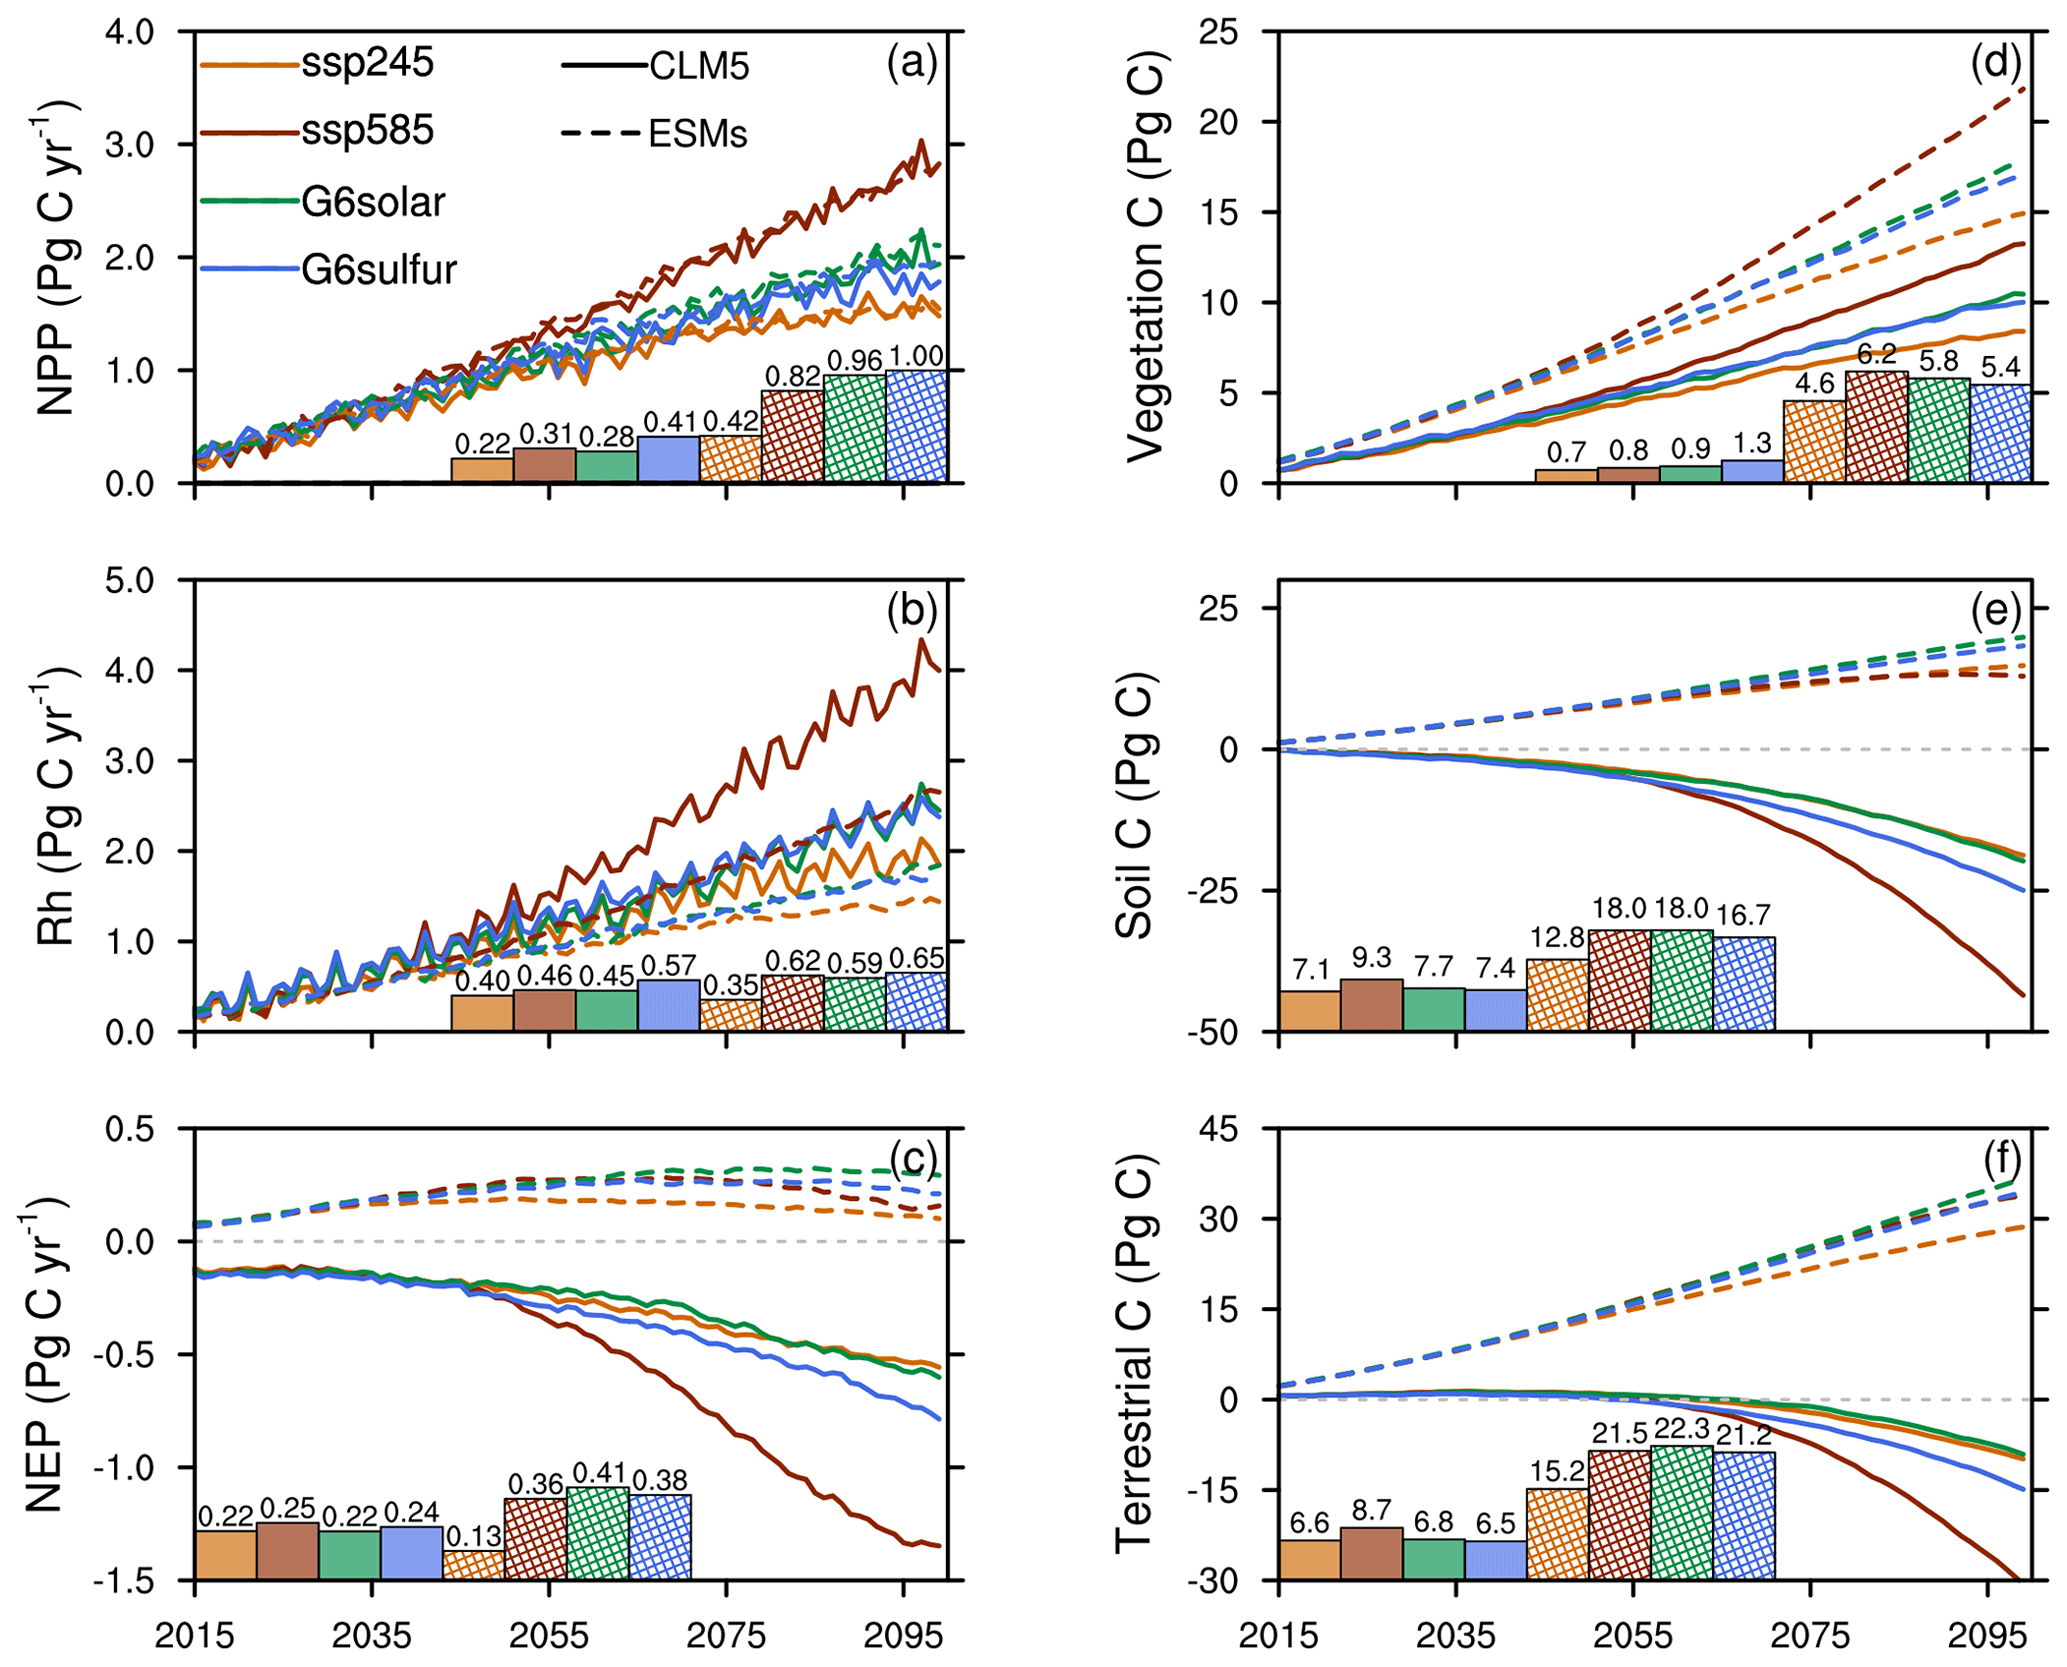
Figure 4The multi-model mean changes in terrestrial carbon fluxes and carbon storages over the baseline permafrost region during the period 2015–2099 relative to the baseline period 1995–2014 under ssp245, ssp585, G6solar, and G6sulfur. The left column shows changes in NPP (a), Rh (b), and NEP (c). The right column shows changes in vegetation (d), soil (e) and terrestrial (f) carbon storages. In each panel, bar charts denote 1 standard deviation from the multi-model mean averaged over the period 2080–2099, and the number above each bar denotes its magnitude. Solid lines and filled solid bars represent the anomaly-forcing CLM5 simulations. Dashed lines and hatched bars represent the ESM simulations. In panel (c), an 11-year running average is applied to an NEP time series to filter its large inter-annual variation.
Soil carbon heterotrophic respiration (Rh) in the baseline permafrost region rises in all four scenarios because of warmer soil temperatures (Fig. 4b). Compared with the baseline period, the five ESMs projected multi-model ensemble-mean Rh increases of 1.6 ± 0.6, 1.6 ± 0.7, 1.4 ± 0.4, and 2.3 ± 0.6 Pg C yr−1 in the period 2080–2099 for G6solar, G6sulfur, ssp245, and ssp585, respectively. The anomaly-forcing CLM5 simulations projected Rh increases of 2.2 ± 0.5, 2.3 ± 0.6, 1.8 ± 0.4, and 3.6 ± 0.5 Pg C yr−1 for G6solar, G6sulfur, ssp245, and ssp585, respectively (Table 2). Warmer winter soil temperature over the high-latitude permafrost region under G6solar and G6sulfur relative to ssp245 does not significantly accelerate soil carbon decomposition in winter because the soil is well frozen, which effectively inhibits microbial activities (Fig. 5b). In other seasons, soil carbon decomposition increases under G6solar and G6sulfur relative to ssp245, especially in summer. The main difference between the ESM simulations and the CLM5 simulations occurs in summer as well, in which the CLM5 simulations show larger increases in Rh than the ESM simulations under G6solar and G6sulfur with respect to ssp245. The relative increases in Rh in summer are not only due to warmer summer temperature accelerating microbial activity, but also due to deeper ALT turning more previously frozen SOC into a thawed state under a warmer decomposition environment. Compared with G6solar and G6sulfur, there is a significant Rh increase in winter under ssp585 in the period 2080–2099 as most of the soil over the baseline permafrost region does not refreeze due to heating from deep layers. The relative increases in Rh during spring, summer and autumn are more profound under ssp585 than G6solar and G6sulfur, showing the significant alleviating effects of G6solar and G6sulfur on soil carbon decomposition in the northern-high-latitude permafrost region.
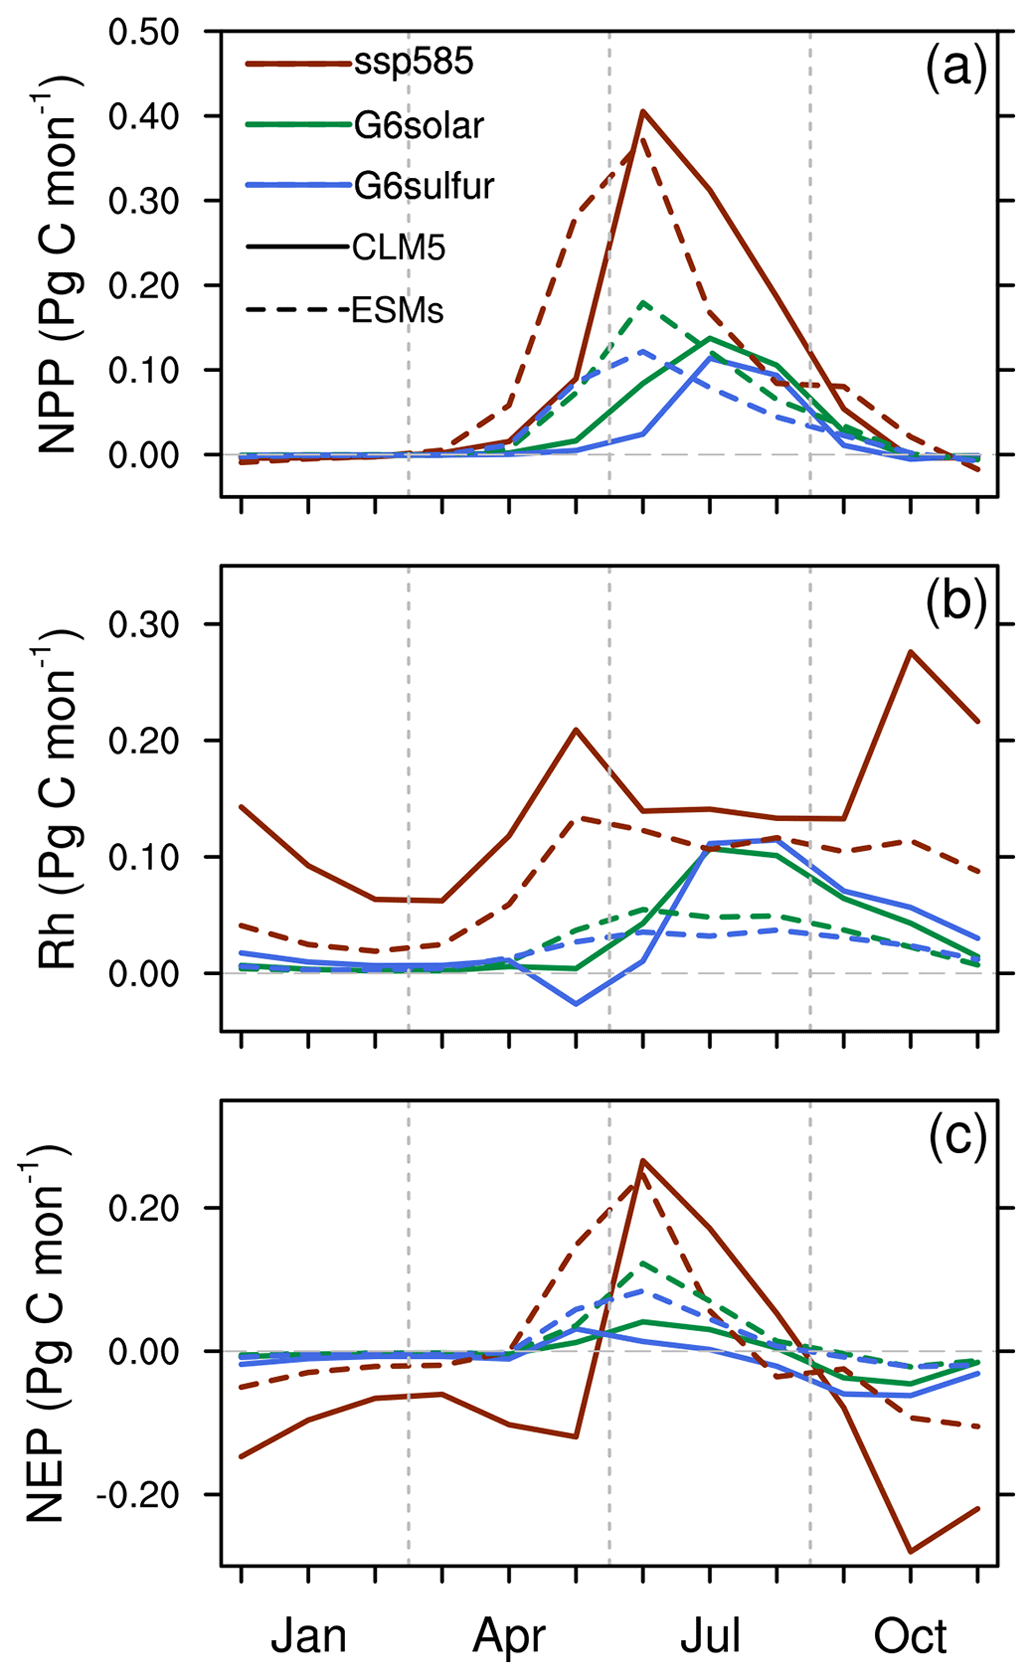
Figure 5The multi-model mean changes in monthly climatology of NPP (a), Rh (b), and NEP (c) over the baseline permafrost region for the period 2080–2099 under ssp585, G6solar, and G6sulfur relative to ssp245. Solid lines represent the anomaly-forcing CLM5 simulations. Dashed lines represent the ESM simulations.
The net ecosystem production (NEP) changes oppositely between the ESM simulations and the CLM5 simulations over the baseline permafrost region. During the baseline period in the permafrost region, the ESMs and CLM5 simulate nearly the same NEP: 0.2 ± 0.4 Pg C yr−1 for ESMs and 0.2 Pg C yr−1 for CLM5. The five ESMs projected multi-model ensemble-mean NEP increases of 0.3 ± 0.4, 0.2 ± 0.4, 0.1 ± 0.1, and 0.2 ± 0.4 Pg C yr−1 under G6solar, G6sulfur, ssp245, and ssp585, respectively, for the period 2080–2099 (Table 2), suggesting that the northern permafrost region would be a carbon sink, but the ability of carbon uptake for ssp245 and ssp585 declines around the middle of the 21st century, while for G6solar and G6sulfur the decline in carbon uptake is delayed until the 2080s. The delayed decline in carbon uptake tends to indicate that the northern permafrost region would switch to a carbon source in the future even under G6solar and G6sulfur geoengineering implementations. In contrast, the anomaly-forcing CLM5 simulations projected NEP decreases of 0.5 ± 0.2, 0.6 ± 0.2, 0.5 ± 0.2, and 1.2 ± 0.3 Pg C yr−1 under G6solar, G6sulfur, ssp245, and ssp585, respectively, for the period 2080–2099 (Table 2), suggesting that the northern permafrost region would be a carbon source under all four scenarios (Fig. 4c). During the baseline period in the permafrost region, both CLM5 and ESMs simulate a slightly larger NPP (2.4 Pg C yr−1 for CLM5, 2.7 ± 0.7 Pg C yr−1 for ESMs) than Rh (2.2 Pg C yr−1 for CLM5, 2.5 ± 0.6 Pg C yr−1 for ESMs). During the 21st century, CLM5 and ESMs simulate similar NPP increases (Fig. 4a), but CLM5 simulates a much faster increase in Rh than do the ESMs (Fig. 4b), therefore leading to opposite changes in NEP. In terms of spatial changes, Rh increases considerably in the northernmost permafrost region, which becomes a carbon source (negative NEP) for the period 2080–2099 under all four scenarios in the anomaly-forcing CLM5 simulations (Fig. 6, left column and middle column), whereas this region maintains a carbon sink (positive NEP) in the ESM simulations. The relative differences in the seasonal cycle of NEP under G6solar, G6sulfur, and ssp585 relative to ssp245 follow the seasonal differences in NPP and Rh (Fig. 5c). The enhanced carbon uptake in plants under G6solar and G6sulfur during the growing season is less counteracted by soil heterotrophic respiration during summer and autumn in the ESM simulations, but it is largely counteracted by soil heterotrophic respiration in the CLM5 simulations. The impact of residual warming in G6sulfur and G6solar on terrestrial carbon fluxes mostly occurs in summer, not in winter.
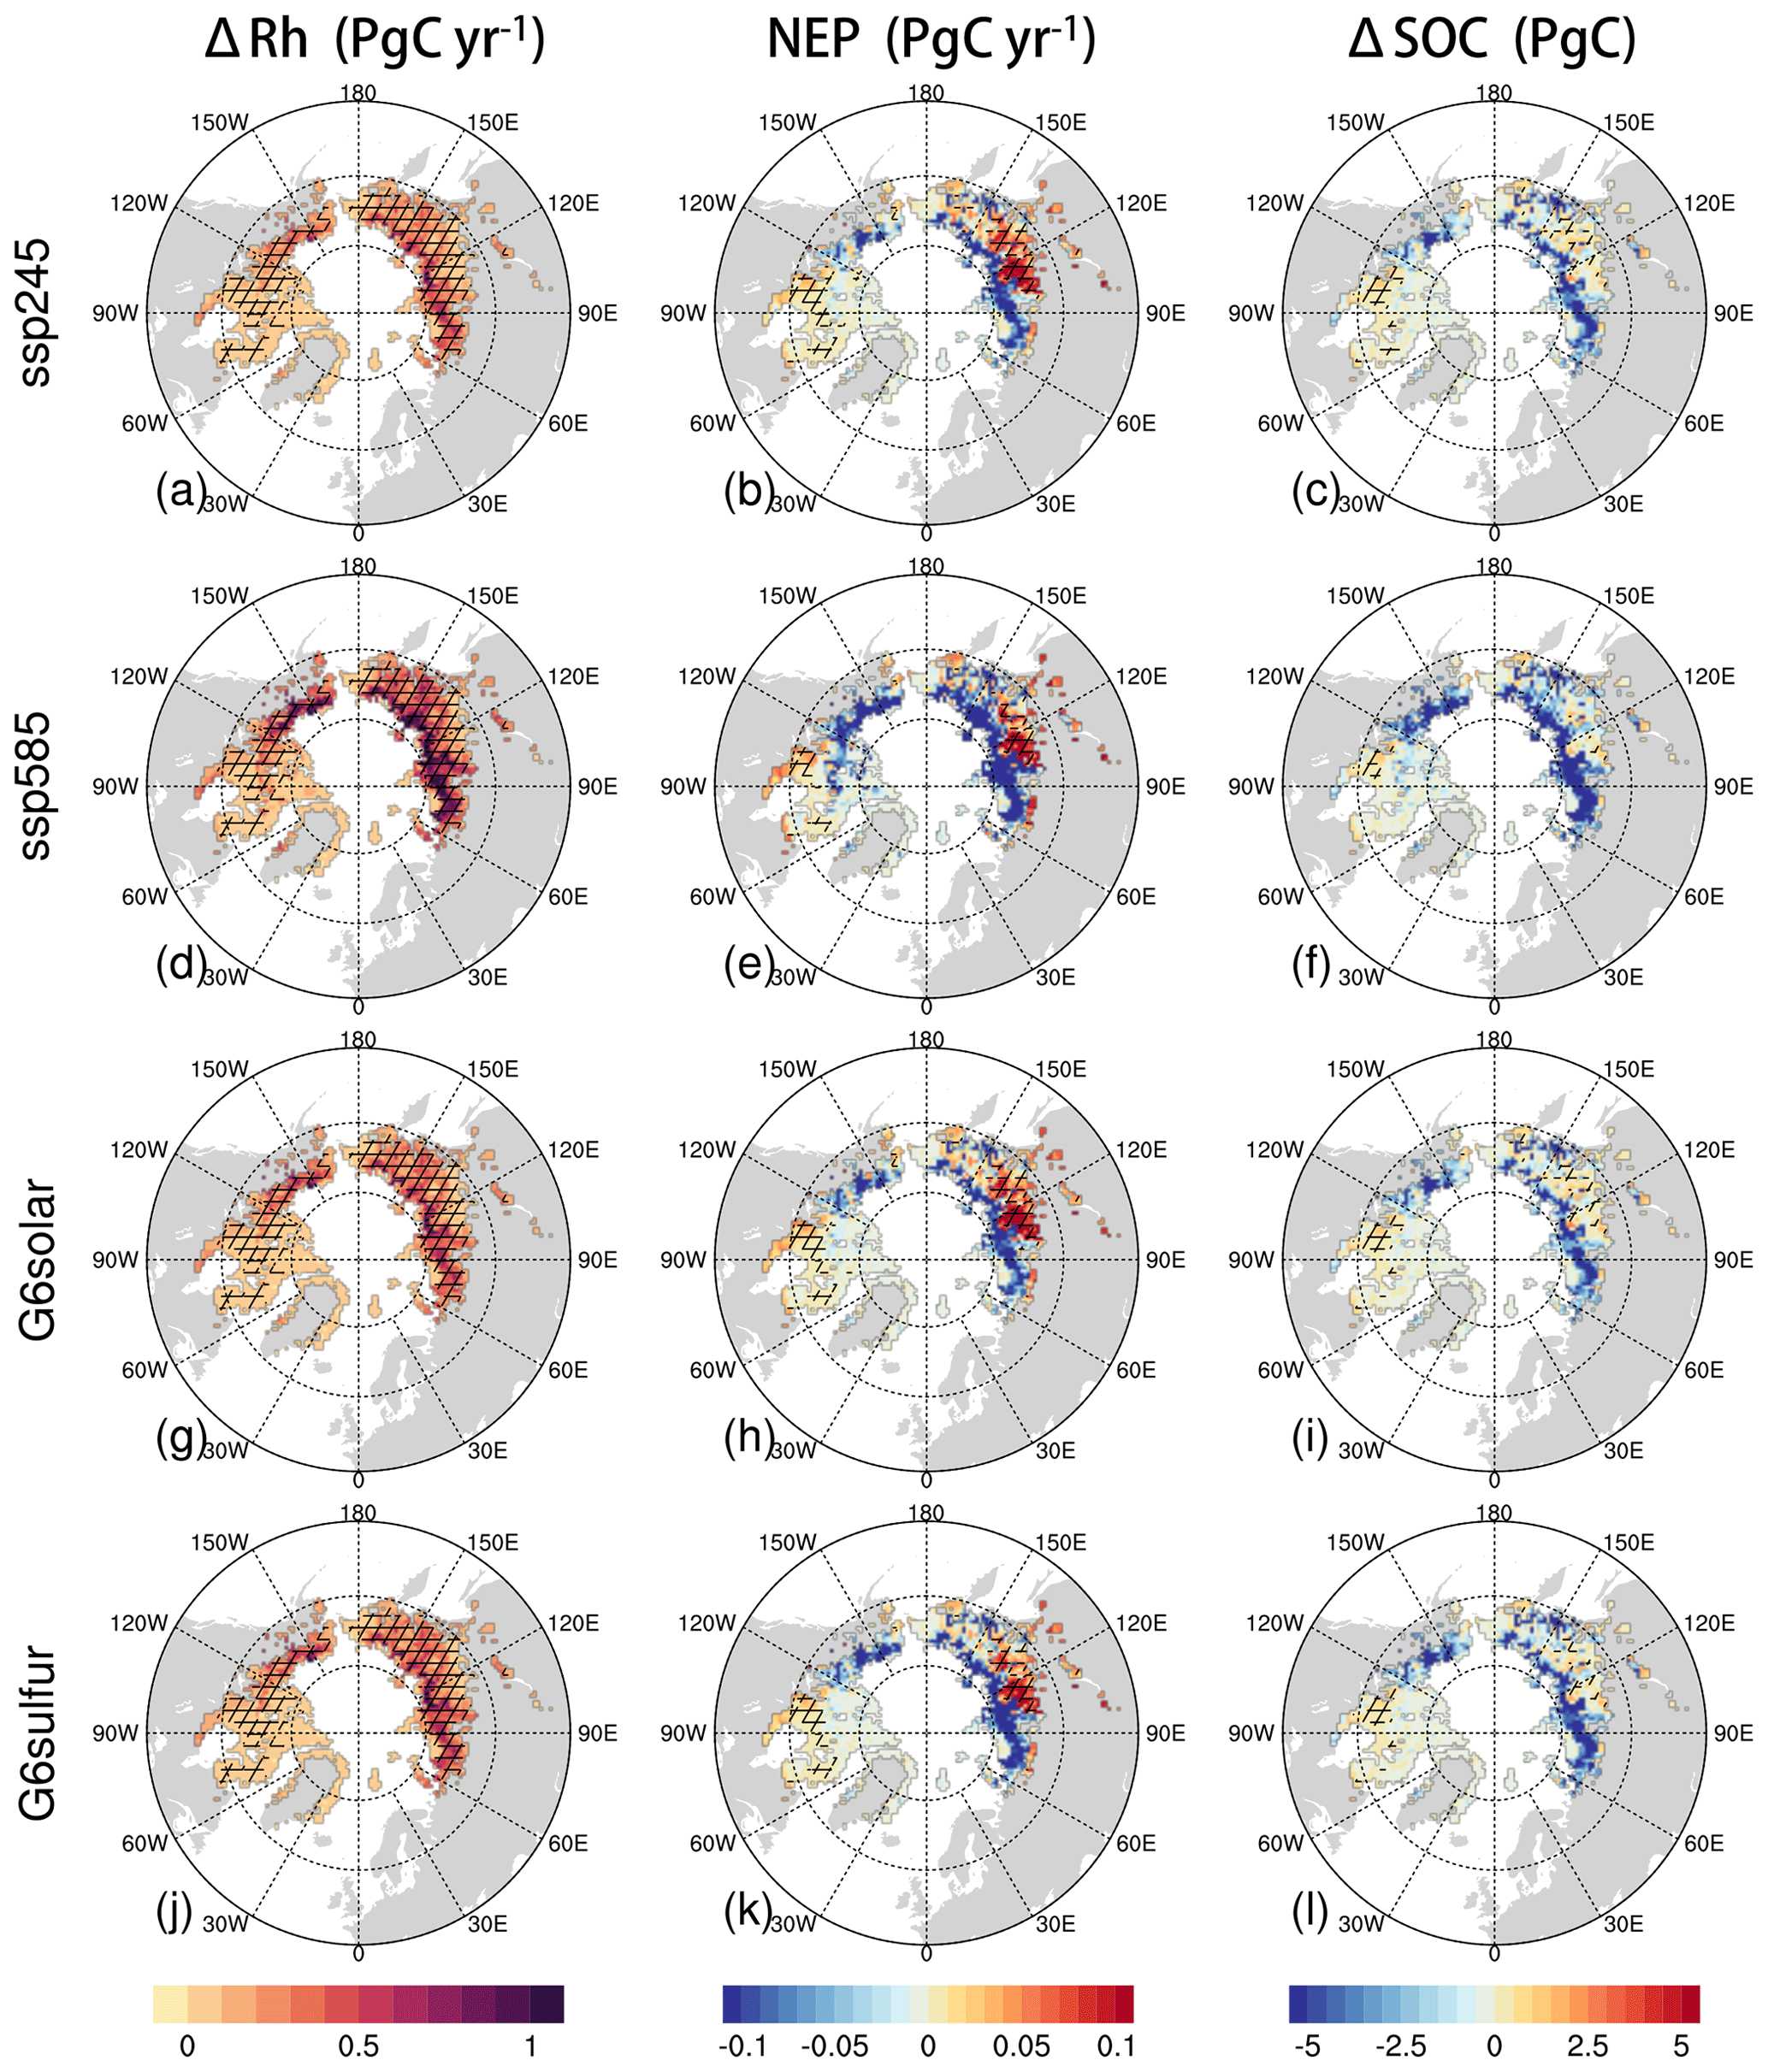
Figure 6The multi-model mean changes in Rh (left column) and soil carbon storage (right column) averaged for the period 2080–2099 under ssp245, ssp585, G6solar, and G6sulfur relative to the baseline period 1995–2014 over the baseline permafrost region in the anomaly-forcing CLM5 simulations. The middle column shows NEP for the period 2080–2099. The hatched area indicates where the sign of the plotted field is the same for the anomaly-forcing CLM5 simulations and corresponding ESM simulations in terms of multi-model mean.
3.3.2 Terrestrial carbon stocks
The enhanced plant photosynthesis under higher atmospheric CO2 concentrations and warmer climate results in gains in vegetation carbon over the permafrost region (Fig. 4d). In the baseline permafrost region, the ESM simulations projected vegetation carbon increases of 15.7 ± 5.8, 15.2 ± 5.4, 13.5 ± 4.6, and 18.7 ± 6.2 Pg C under G6solar, G6sulfur, ssp245, and ssp585, respectively, for the period 2080–2099. The anomaly-forcing CLM5 simulations projected vegetation carbon increases of 9.3 ± 0.9, 9.1 ± 1.3, 7.7 ± 0.7, and 11.5 ± 0.8 Pg C, respectively (Table 2). The NPP in the baseline period and its increases in the 21st century are only slightly larger in the ESM simulations than the CLM5 simulations; however due to the cumulative effect, the increases in vegetation carbon are considerably larger in the ESM simulations than the CLM5 simulations. Except for IPSL-CM6A-LR under G6sulfur, all models show that vegetation carbon gains under G6solar and G6sulfur are greater than that under ssp245. IPSL-CM6A-LR shows a smaller NPP for G6sulfur than ssp245 from the 2070s, and this slows down the gains in vegetation carbon under G6sulfur, with 0.6 Pg C less than that for ssp245 for the period 2080–2099. The litter carbon pool is expected to increase as the vegetation carbon increases. Four of the five ESMs (CESM2-WACCM, CNRM-ESM2-1, IPSL-CM6A-LR, and MPI-ESM1-2-LR) have litter carbon pools available and show increases of 8.2 ± 3.9, 7.4 ± 3.6, 5.9 ± 2.2, and 6.5 ± 3.0 Pg C for G6solar, G6sulfur, ssp245, and ssp585, respectively. However, the CLM5 simulations projected that the litter carbon pool only increases by 0.6 ± 0.4, 0.1 ± 0.6, 0.6 ± 0.4, and −0.0 ± 0.5 Pg C, respectively. Gains in litter carbon pool have direct impacts on soil carbon inputs, along with enhanced soil decomposition rates under warmer soil temperatures.
The total SOC increases in the ESM simulations and decreases in the CLM5 simulations for all four scenarios (Fig. 4e); the opposite changes in SOC mainly result from the corresponding Rh changes over the baseline permafrost region (Fig. 4b). In the baseline permafrost region, the ESMs projected total SOC increases of 17.7 ± 18.0, 16.4 ± 16.7, 13.6 ± 12.8, and 13.0 ± 18.0 Pg C under G6solar, G6sulfer, ssp245, and ssp585, respectively, for the period 2080–2099. The CLM5 projected total SOC decreases of 14.9 ± 7.7, 19.1 ± 7.4, 14.6 ± 7.1, and 31.4 ± 9.3 Pg C, respectively (Table 2). In terms of spatial changes in SOC, the CLM5 simulations project that SOC loss mainly occurs over the northernmost permafrost region (Fig. 6, right column), where soil respiration increases considerably, and NEP becomes negative, whereas the ESM simulations project SOC gain in the northernmost permafrost region, as the soil carbon decomposition cannot offset increased soil carbon inputs due to enhanced vegetation carbon uptake. For ssp585, both the slower SOC accumulation in the ESM simulations and larger SOC loss in the CLM5 simulations are mainly due to enhanced soil carbon decomposition under much warmer temperatures compared with G6solar and G6sulfur. Thus, G6solar and G6sulfur preserve more soil carbon compared with ssp585 in both groups of simulations.
There is a large spread in SOC storage over the baseline permafrost region among the five ESMs, which affects the SOC available to participate in microbial decomposition under warmer conditions. In the five ESMs, only CESM2-WACCM simulates a baseline SOC of 847.3 Pg C over the northern permafrost region, which is comparable to the observational estimate of 1091.3 Pg C according to the NCSCDv2 dataset. However, CESM2-WACCM projects net loss in SOC by 1.3, 0.8, 2.8, and 11.7 Pg C during the 21st century for G6solar, G6sulfur, ssp245, and ssp585, respectively, as a result of its large baseline SOC stock and rapid soil carbon decomposition under warming. The other four ESMs all project gains in SOC over the permafrost region under all four scenarios. The SOC losses in the CLM5 simulations driven by the anomaly climate signals derived from the four CESM2-WACCM scenarios are 7.1, 8.5, 7.8, and 25.8 Pg C for G6solar, G6sulfur, ssp245, and ssp585, respectively. CESM2-WACCM adopts the same CLM5 as its land component but simulates much smaller SOC losses under the four scenarios compared with the anomaly-forcing CLM5 simulations. This is mostly due to differences in baseline SOC in the permafrost region (847.3 Pg C for CESM2-WACCM, 1089.8 Pg C for stand-alone CLM5), the baseline permafrost region used for calculation (12.3 million km2 for CESM2-WACCM, 11.1 million km2 for stand-alone CLM5), and near-surface climatology in two kinds of simulations.
The total terrestrial carbon stock changes in the same way as the SOC and reflects the corresponding changes in NEP (Fig. 4c, f). In the baseline permafrost region, the ESM simulations projected terrestrial carbon increases of 32.2 ± 22.3, 30.6 ± 21.2, 26.1 ± 15.2, and 30.8 ± 21.5 Pg C under G6solar, G6sulfur, ssp245, and ssp585, respectively, for the period 2080–2099. The CLM5 simulations projected terrestrial carbon decreases of 5.5 ± 6.8, 9.9 ± 6.5, 6.5 ± 6.6, and 20.1 ± 8.7 Pg C, respectively. For CESM2-WACCM, although it projects net loss in SOC during the 21st century for all four scenarios, gains in vegetation carbon offset soil carbon loss, and terrestrial carbon increases by 10.7, 10.4, 8.1, and 5.0 Pg C for G6solar, G6sulfur, ssp245, and ssp585, respectively. Whereas in the CLM5 simulations driven by the anomaly climate signals derived from the four CESM2-WACCM scenarios, the terrestrial carbon stock changes by 1.8, −0.0, 0.1, and −14.0 Pg C for G6solar, G6sulfur, ssp245, and ssp585, respectively. However, the terrestrial carbon stock decreases in all CLM5 simulations driven by the anomaly climate signals derived from the other four ESMs, suggesting that the northern-high-latitude permafrost region tends to be a weak carbon source even under the mitigation scenario ssp245 and geoengineering scenarios G6solar and G6sulfur.
3.3.3 Uncertainties in projected changes in carbon fluxes and stocks
The uncertainties in projected responses in the high-latitude permafrost region in the ESM simulations mainly contain two parts: uncertainties due to different near-surface climate changes in individual climate scenarios and uncertainties due to inter-model differences in representing land surface processes, whereas the uncertainties in projected responses in the anomaly-forcing CLM5 simulations are mainly due to uncertainties in near-surface climate change.
In addition to the impacts of different near-surface climate, the different changes in NPP mirror more directly structural and parametric differences in land surface models, in particular the carbon assimilation scheme that depends on nutrient limitation. The ESMs which represent the land nitrogen cycle (CESM2-WACCM, MPI-ESM1-2-LR, and UKESM1-0-LL) simulate similar NPP magnitudes (about 3 Pg C yr−1) for the baseline period 1995–2014. Except for CNRM-ESM2-1, NPP increases similarly under G6solar, G6sulfur, and ssp245 in the other four ESMs (not shown), consistent with their comparable land carbon–concentration feedback parameters βL (Table A1 in Arora et al., 2020), whereas for CNRM-ESM2-1, NPP increases similarly under G6solar, G6sulfur, and ssp585 (not shown), probably due to it having the largest land carbon–concentration feedback parameter of the five ESMs (Table A1 in Arora et al., 2020). The land carbon–concentration feedback parameter of CESM2-WACCM is close to the average of that of the five ESMs, and CESM2-WACCM adopts CLM5 as its land component. This explains the very similar ensemble-mean NPP increases for the ESM simulations and the CLM5 simulations (Fig. 4a). Furthermore, the across-model spreads of changes in NPP of the CLM5 simulations are about half of that in the ESM simulations (Fig. 4a), indicating that the differences in near-surface climate change and the differences in land surface processes represented by the ESMs exert similar impacts on the NPP uncertainties.
The spread of changes in Rh is of similar magnitude for the CLM5 simulations and the ESM simulations (Fig. 4b), seeming to imply that differences in the near-surface climate dominate the spread of changes in Rh, while differences in land surface processes produce much smaller impacts. However, the structural and parametric differences in land surface models can affect the magnitude of soil carbon stock in the permafrost region and its total decomposition (Shu et al., 2020). The baseline soil carbon stock in the permafrost region is 1089.8 Pg C in the CLM5 simulation, and it ranges from 48.5 (IPSL-CM6A-LR) to 847.3 Pg C (CESM2-WACCM) in the ESM simulations. Under the same warming levels, larger soil carbon stock implies that more of it would be exposed under thawed conditions and participate in decomposition, and then it amplifies the uncertainties in changes in Rh under the same spread of warming. Therefore, the spread of changes in Rh for the ESM simulations contains the effects due to different baseline soil carbon stocks, which can be attributed to the structural and parametric differences in land surface schemes. The impacts of near-surface climate differences on the spread of changes in Rh tend to be smaller in the ESM simulations than the CLM5 simulations.
The opposite changes in soil carbon stocks and terrestrial carbon stocks between the ESM simulations and the CLM5 simulations can be ascribed to the considerably different baseline soil carbon stocks in the northern permafrost region as well. In the ESM simulations, enhanced soil carbon decomposition cannot offset increased vegetation carbon uptake. Whereas in the CLM5 simulations, the vegetation carbon uptake is smaller than the ESM simulations, but the soil carbon decomposition is much larger than the ESM simulations, the combined effects lead to soil carbon loss in the permafrost region. As the ESM-simulated baseline soil carbon stocks are considerably smaller than the observational estimate, the simulated soil carbon decomposition tends to be biased lower. The baseline soil carbon storage is the key factor to determine whether the northern permafrost region is a carbon source or a carbon sink under the solar geoengineering scenarios.
Table 2Changes in NPP, Rh, NEP, vegetation, and soil and terrestrial carbon storages over the baseline permafrost region for the period 2080–2099 relative to the baseline period 1995–2014 in the anomaly-forcing CLM5 simulations and the ESM simulations.
3.4 Drivers of SOC change
3.4.1 Soil carbon inputs
Soil carbon inputs are derived from changes in SOC and the organic carbon that is decomposed. The collective increases in NPP lead to soil carbon input growth under all four scenarios (Fig. 7a). In the baseline permafrost region during the 21st century, the five ESMs projected annual soil carbon input increases of 1.8 ± 0.8, 1.7 ± 0.8, 1.4 ± 0.4, and 2.2 ± 0.7 Pg C yr−1 under G6solar, G6sulfur, ssp245, and ssp585, respectively, and the CLM5 simulated annual soil carbon input increases of 1.8 ± 0.2, 1.7 ± 0.3, 1.4 ± 0.2, and 2.4 ± 0.2 Pg C yr−1, respectively. For the ESM simulations in the period 2080–2099, the annual soil carbon inputs in the baseline PF50 % region vary considerably among the models with the smallest amounts in IPSL-CM6A-LR (3.2, 2.8, 3.1, and 3.4 Pg C yr−1 for G6solar, G6sulfur, ssp245, and ssp585, respectively) and the largest amounts in CNRM-ESM2-1 (6.6, 6.6, 5.4, and 6.8 Pg C yr−1 for G6solar, G6sulfur, ssp245, and ssp585, respectively). However, the ratio of soil carbon inputs to NPP is similar for all scenarios: 93.1 ± 2.3 %, 93.7 ± 2.0 %, 94.1 ± 2.0 %, and 91.8 ± 2.8 % of NPP for G6solar, G6sulfur, ssp245, and ssp585, respectively. The majority of annual NPP becomes soil carbon inputs in the permafrost region just as it does for global terrestrial NPP in CMIP5 models (Todd-Brown et al., 2014); therefore, the changes in soil carbon inputs are almost the same as changes in NPP. The less efficient conversion of NPP to soil carbon under ssp585 might be due to more frequent wildfires in the warmer climate with more dry ground fuel in degraded permafrost (Krause et al., 2014; Turetsky et al., 2015; Veraverbeke et al., 2017), and four of the five models (except for UKESM1-0-LL) analyzed in this study simulate wildfires.
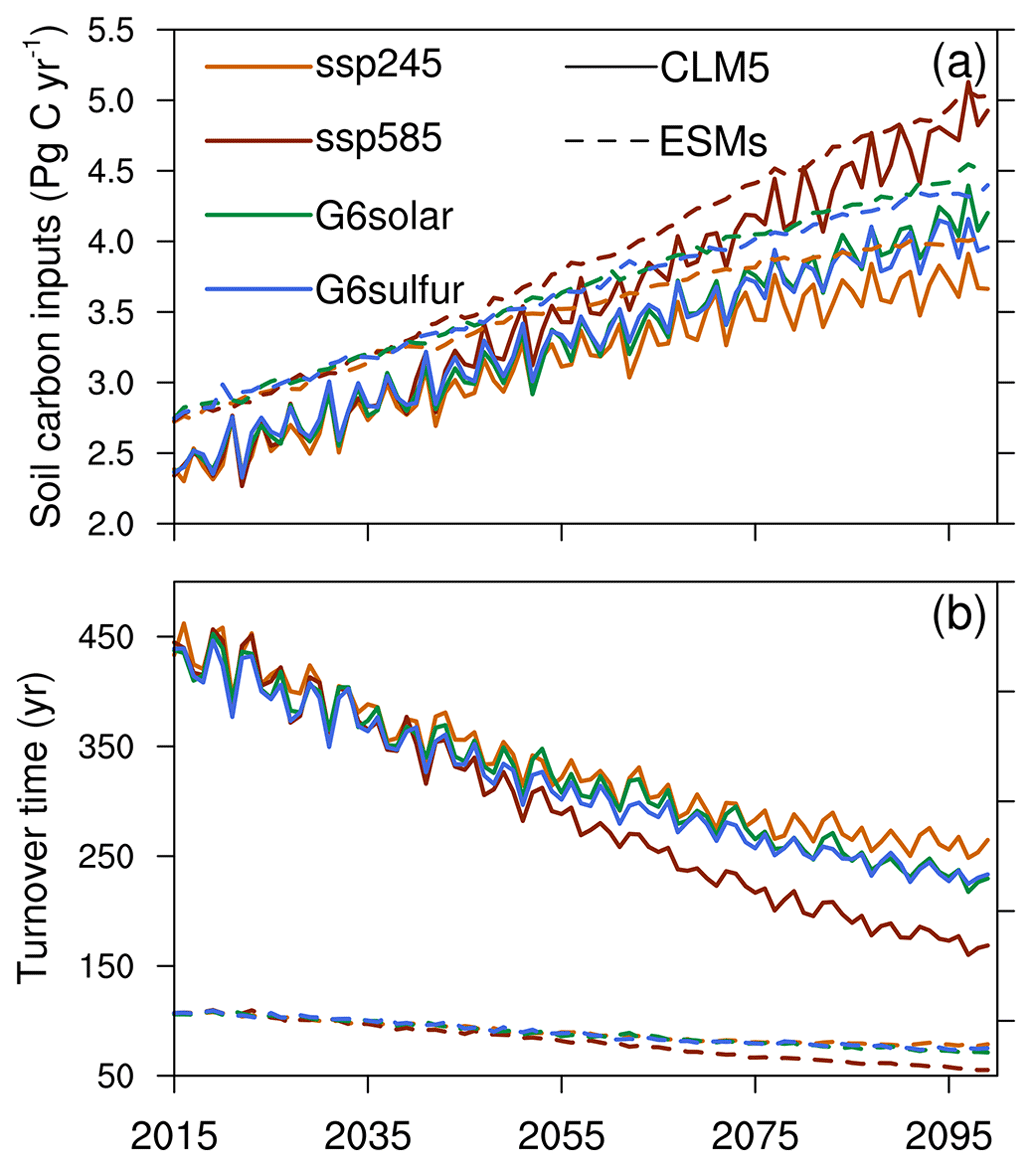
Figure 7The multi-model mean changes in soil carbon inputs (a) and soil carbon turnover time (b) over the baseline permafrost region during the period 2015–2099 under ssp245, ssp585, G6solar, and G6sulfur. Solid lines represent the anomaly-forcing CLM5 simulations. Dashed lines represent the ESM simulations.
3.4.2 Turnover times
Changes in turnover times arise from both soil carbon input change from litterfall related to carbon–concentration feedback and heterotrophic respiration change associated with carbon–climate feedback. The SOC turnover times are calculated as the ratio of total SOC stock and heterotrophic respiration for each model (Todd-Brown et al., 2014). Over the baseline permafrost region, the five ESMs projected turnover time decreases of 39.7 ± 47.6, 38.1 ± 43.7, 35.2 ± 42.5, and 53.9 ± 67.8 years under G6solar, G6sulfur, ssp245, and ssp585, respectively, whereas the CLM5 simulations projected turnover time decreases of 244.9 ± 24.8, 246.2 ± 29.9, 221.5 ± 27.6, and 303.4 ± 17.1 years, respectively (Fig. 7b). The five ESMs show a wide spread in near-surface permafrost SOC turnover times during the baseline period and their changes during the 21st century, mainly due to their large differences in the SOC stocks (Varney et al., 2022), and poor representation of near-surface permafrost SOC dynamics may also lead to inaccurate turnover time (Shu et al., 2020). Of the five ESMs, only CESM2-WACCM explicitly considers vertically heterogeneities in SOC resulting from the cryoturbation mixing, which would slow down SOC decomposition, and simulates a much longer turnover time (336 years) than the other four models (32–108 years) for the baseline period, but it is still shorter than the turnover time of 488 years given by the CLM5 simulation for the same period. The decline in near-surface permafrost SOC turnover time over the 21st century of the CLM5 is about 14 times the ESMs due to the large SOC simulated in CLM5. However, the magnitude of SOC turnover times and its decline in CLM5 are in line with a land surface model including a detailed description of vertical heterogeneity in permafrost soils (Shu et al., 2020); ssp585 shows the largest increases in soil carbon inputs and largest decreases in turnover time, while ssp245 shows the smallest increase in soil carbon inputs and smallest decrease in turnover time (Fig. 7), illustrating that changes in turnover times arise mostly from the heterotrophic respiration change associated with carbon–climate feedback rather than carbon–concentration feedback over the northern permafrost region. This is further evidenced by the results that the turnover time changes under G6solar and G6sulfur are more like ssp245 in two groups of simulations (Fig. 7b).
Increases in soil carbon inputs and decomposition oppose each other in changing SOC (Todd-Brown et al., 2014), and the soil carbon decomposition is partially influenced by soil carbon inputs. Given their dependence, we calculate the semipartial correlation between SOC and either soil carbon input or heterotrophic respiration to better understand their influences on changing SOC. Plazzotta et al. (2019) used the same method to analyze the influences of climate drivers on carbon fluxes. In the ESM simulations, the semipartial correlations between SOC and soil carbon inputs are 0.06 ± 0.07, 0.06 ± 0.09, 0.03 ± 0.09, and 0.12 ± 0.02 for G6solar, G6sulfur, ssp245, and ssp585, respectively, and the semipartial correlations between SOC and soil carbon decomposition are 0.01 ± 0.11, 0.01 ± 0.19, 0.04 ± 0.10, and −0.06 ± 0.11, respectively. Very few semipartial correlations are significant at the 0.05 level for individual ESM simulations. In the CLM5 simulations, the semipartial correlations between SOC and soil carbon inputs are 0.03 ± 0.05, 0.09 ± 0.07, 0.06 ± 0.10, and 0.14 ± 0.03, respectively, and the semipartial correlations between SOC and soil carbon decomposition are −0.22 ± 0.04, −0.29 ± 0.06, −0.27 ± 0.10, and −0.30 ± 0.03, respectively. Nearly all semipartial correlations between SOC and soil carbon decomposition are significant at the 0.05 level for individual CLM5 simulations, but not the semipartial correlations between SOC and soil carbon inputs. The significant semipartial correlation between SOC and soil carbon decomposition in the CLM5 simulations further confirms that the opposite responses of SOC in the ESM simulations and CLM5 simulations are due to soil carbon decomposition, which can be ascribed to the magnitudes of baseline SOC stocks.
3.4.3 Changes in thawed SOC
As ALT deepens under warmer climates, more previously frozen SOC becomes vulnerable to decomposition within thawed soil volume, especially during summer, when both annual ALT and SOC decomposition rates reach their maximum. The permafrost extent and near-surface permafrost SOC in the CLM5 historical simulation are both close to the observational estimates, and CLM5 has a sensitivity of thawed permafrost volume to global MAAT close to the median of the CMIP6 models (Burke et al., 2020). Hence, CLM5-simulated near-surface permafrost SOC thaw and exposure to accelerated decomposition conditions during summer would be representative under the future-climate scenarios.
CLM5 simulates a baseline permafrost area of 11.1 million km2, where the top 3 m of soil is not completely thawed (Fig. 3); the annual maximum thawed volume and SOC of the upper 3 m of soil are 13.6 × 10³ km3 and 332.7 Pg C, respectively. For the period 2080–2099 under G6solar, G6sulfur, ssp245, and ssp585, the annual maximum thawed volume increases by 10.4 (± 2.9) × 103, 10.3 (± 3.1) × 103, 10.1 (± 3.0) × 103, and 15.9 (± 2.2) × 103 km3, respectively, and the annual maximum thawed amount of SOC increases by 147.2 ± 49.1, 153.7 ± 51.9, 142.9 ± 51.5, and 239.9 ± 26.8 Pg C, respectively. Consequently, the proportion of exposed near-surface permafrost SOC increases from 30.5 % in the baseline period to 44.0 (± 4.5) %, 44.6 (± 4.8) %, 43.6 (± 4.7) %, and 52.5 (± 2.5) % in the period 2080–2099 under the combined effects of ALT deepening and soil carbon accumulation; ssp585 has nearly all permafrost in the upper 3 m of soil thawed by the period 2080–2099, with almost all the near-surface permafrost SOC exposed to accelerated decomposition conditions, potentially releasing more greenhouse gases to the atmosphere and amplifying climate warming through the permafrost carbon–climate feedback. Conversely, the frozen soil volume and SOC under G6solar and G6sulfur are close to that under ssp245 (Fig. 8a, b). G6solar and G6sulfur prevent more frozen SOC from being exposed to decomposition and alleviate the permafrost carbon–climate feedback.
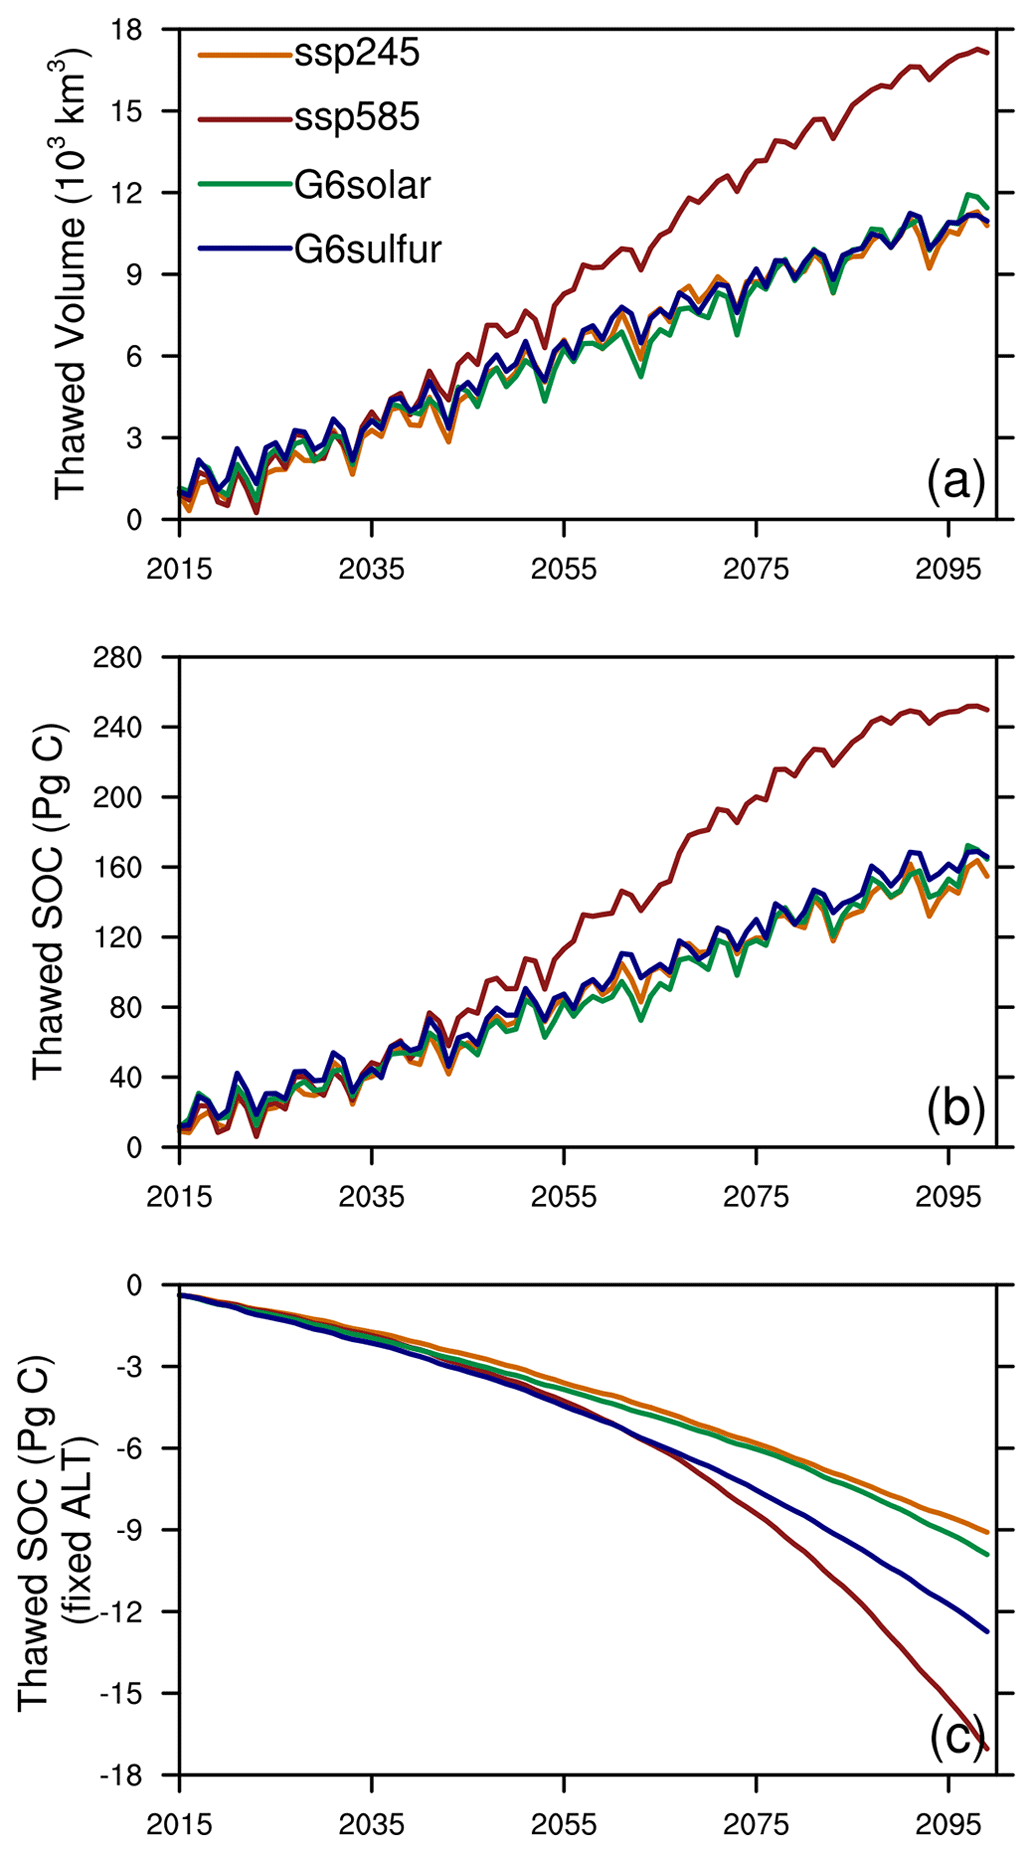
Figure 8Changes in annual maximum thawed permafrost volume (a) and soil organic carbon (b, c) projected by CLM5 for ssp245, ssp585, G6solar, and G6sulfur. Panel (c) shows annual maximum thawed permafrost SOC with the ALT fixed in the baseline period 1995–2014.
Changes in the exposed SOC depend not only on the varying ALT but also on varying SOC in the permafrost region; their relative importance in modulating annual maximum thawed SOC can be illustrated by fixing ALT in the baseline period and evaluating how the exposed SOC changes. Figure 8c shows that the amount of exposed SOC in the baseline thawed volume decreases considerably slower than the overall trend of SOC loss simulated by CLM5 under the four scenarios through the 21st century (Fig. 4e). Hence, the time-varying SOC exerts relatively smaller impacts on the changes in the thawed SOC and subsequent SOC loss. It is ALT deepening that dominates the changes in the amount of thawed SOC under different warming scenarios. For models with smaller residual high-latitude warming, such as CESM2-WACCM, the spatial distributions of ALT among G6solar, G6sulfur, and ssp245 are close; hence the annual maximum thawed SOC is also similar. For models with larger residual high-latitude warming, such as CNRM-ESM2-1, the annual maximum thawed SOC is considerably larger under G6solar and G6sulfur than that under ssp245, although it is still much less than that under ssp585. Therefore, G6solar and G6sulfur alleviate the permafrost carbon–climate feedback mainly by reducing the ALT deepening. If the residual warming over high-latitude permafrost regions is well controlled, solar geoengineering would be more effective in alleviating permafrost carbon–climate feedback.
The soil stores the majority of organic carbon in the terrestrial biosphere, with the largest stocks in the northern-high-latitude permafrost regions (Hengl et al., 2014), which is widely considered to be a non-linear tipping point element in the earth's climate system (Lenton et al., 2008). How the northern-high-latitude permafrost soil carbon responds in the future has drawn significant attention (Schuur et al., 2015), but its response to solar geoengineering has been rarely studied. This study compares changes in the northern permafrost and terrestrial carbon under the G6solar and G6sulfur solar geoengineering scenarios with that under the ssp245 and ssp585 scenarios.
The five ESMs participating in GeoMIP can reasonably reproduce the historical permafrost extent derived from the MAAT, but the models could not reconstruct the historical permafrost extent well using the ESM-simulated soil temperatures, which reflects their divergence in land–atmosphere coupling, defects in hydrothermal parameterizations, and even compensation errors over cold regions (Wang et al., 2016; Burke et al., 2020). For example, IPSL-CM6A-LR and MPI-ESM1-2-LR do not consider the latent heat of water-phase change (Burke et al., 2020) and have weak thermal insulation of the top surface layer in summer (not shown); these tend to have the ground thawed quickly in summer. However, due to the compensation effects of snow thermal insulation, MPI-ESM1-2-LR simulates colder soil temperatures than IPSL-CM6A-LR and produces a much larger permafrost extent (2.4 and 13.6 million km2 for IPSL-CM6A-LR and MPI-ESM1-2-LR, respectively, for the period 1960–1990) because MPI-ESM1-2-LR has much weaker snow thermal insulation than IPSL-CM6A-LR. For UKESM1-0-LL, its recently added multi-layered snow scheme produces a much larger snow thermal insulation in winter than the observations, and the model cannot properly simulate soil temperatures in the northern high latitudes and has ALT around 2 m irrespective of MAAT (Burke et al., 2020). On the other hand, all ESMs largely underestimate the carbon stocks except for CESM2-WACCM; it is also a common problem of many CMIP5 and CMIP6 models (Todd-Brown et al., 2013; Ito et al., 2020; Varney et al., 2022). Most ESMs lack adequate representation of the permafrost carbon cycle (Melnikova et al., 2020; Varney et al., 2022), such as vertically resolving SOC and storing SOC via cryoturbation mixing and yedoma deposits, which are important processes for preserving organic material in frozen soil (Koven et al., 2009, 2011; Beer, 2016; Zhu et al., 2016). As the baseline permafrost extent and soil carbon stocks can affect the modeling of heterotrophic respiration and the fate of soil carbon in newly thawed permafrost (McGuire et al., 2016), the biases of permafrost extent and soil carbon stocks in the ESMs might introduce significant biases in their projections. Given this situation, we analyze the response of northern-high-latitude permafrost in two groups of simulations: one group from GeoMIP's ESM simulations and the other group from the anomaly-forcing CLM5 simulations.
G6solar and G6sulfur show significant residual warming over the northern high latitudes relative to ssp245, even though global-mean temperatures were changed from ssp585 to ssp245 levels. The residual warming in near-surface air is more profound over northern Eurasia in winter under G6sulfur, and this affects the permafrost degradation in summer. The winter surface residual warming at high latitudes under SAI geoengineering has been previously reported by Jiang et al. (2019), Simpson et al. (2019), Banerjee et al. (2021), and Visioni et al. (2021), and it is attributed to seasonal differences in radiative forcing and dynamical effects of injected stratospheric aerosol (Jones et al., 2021). The broad-scale patterns of temperature perturbation over northern Eurasia during boreal winter under SAI geoengineering resemble those associated with a positive phase of the North Atlantic Oscillation (NAO) observed subsequent to large tropical volcanic eruptions (Shindell et al., 2004; Jones et al., 2021); similar results were found in another SAI geoengineering experiment manifested as altered seasonal cycles of temperature and snow at northern high latitudes (Jiang et al., 2019). In addition, even without the dynamical effects of SAI, the difference in the vertical structure of temperature change between increasing CO2, decreasing insolation, and decreasing atmospheric energy transport also produces residual surface warming at northern high latitudes under solar geoengineering (Henry and Merlis, 2020).
G6solar and G6sulfur show mild reductions in summer precipitation relative to ssp245 over the northern-high-latitude permafrost region and similar precipitation to ssp245 in other seasons. The mild reduction in summer precipitation would be expected to only slightly modify surface soil moisture, and it is not likely to significantly affect the vegetation growth and environment for SOC decomposition according to the sensitivity analysis for CMIP5 models (Todd-Brown et al., 2013, 2014). The slight increase in winter snowfall under G6sulfur relative to ssp245 produces very small impacts on changing the thermal insulation of snowpack with regards to ssp245. Therefore, the main factors affecting the northern-high-latitude permafrost ecosystem are the residual warming and enhanced CO2 fertilization effects (Govindasamy et al., 2002; Glienke et al., 2015) under G6solar and G6sulfur compared with ssp245.
G6solar and G6sulfur can slow permafrost degradation compared to ssp585. Based on the observationally constructed relationship between MAAT and permafrost probability, only 11 % of the baseline permafrost (12.3 million km2) will be preserved in the period 2080–2099 under ssp585, and most of them are sporadic and isolated patches confined to the northernmost part of the Arctic. G6solar, G6sulfur, and ssp245 would preserve 41 %, 39 %, and 45 % of the baseline permafrost extent, respectively, for the period 2080–2099. The surviving continuous and discontinuous permafrost under the mitigation and geoengineering scenarios is mostly in the central and eastern parts of both northern Canada and northern Siberia. Based on the anomaly-forcing CLM5 simulations, the permafrost area defined as ALT within the upper 3 m of soil declines a little slower under the four scenarios than that derived from the MAAT; 58 %, 56 %, 59 %, and 26 % of the baseline permafrost area would be preserved in the period 2080–2099 under G6solar, G6sulfur, ssp245, and ssp585, respectively. Different permafrost degradation given by the two methods can be ascribed to the methodological differences in detecting permafrost existence.
Due to enhanced CO2 fertilization effects relative to ssp245 and more temperature limitation relative to ssp585 in the northern-high-latitude region, G6solar and G6sulfur have vegetation carbon increasing faster than ssp245 and slower than ssp585. Soil carbon inputs change in the same way as the NPP. The turnover times of soil carbon decline slower under G6solar and G6sulfur compared with ssp585, and its changes are more like that under ssp245, suggesting that the soil heterotrophic respiration dominates the changes in turnover time and a more important role of carbon–climate feedback than the carbon–concentration feedback over the northern-high-latitude permafrost region. G6solar and G6sulfur preserve more soil carbon in the northern-high-latitude permafrost region with regards to ssp585 due to weakened heterotrophic respiration. A total of 4.6 ± 4.6 and 3.4 ± 4.8 Pg more soil carbon would be protected under G6solar and G6sulfur, respectively, than ssp585 according to the ESM simulations, and 16.4 ± 4.7 and 12.3 ± 7.9 Pg more soil carbon would be protected, respectively, according to the CLM5 simulations. As G6solar and G6sulfur preserve more soil carbon than ssp585, if G6solar and G6sulfur geoengineering were terminated in an uncontrolled way the soil temperature would rebound rather quickly to ssp585 levels (Lee et al., 2019) and trigger rapid permafrost carbon–climate feedback.
The projected SOC change in the northern permafrost region and whether this region acts as a carbon source or a carbon sink under G6solar and G6sulfur depend on the simulated baseline SOC storage. The ESM simulations have baseline SOC storages considerably smaller than the observational estimate and project SOC to increase under the four scenarios. The CLM5 simulations have a baseline SOC storage close to the observational estimate and project SOC to decrease under the four scenarios. The analysis based on semipartial correlations shows that the opposite responses of SOC in the ESM and CLM5 simulations are due to accelerated soil carbon decomposition in the CLM5 simulations. At the same time, the ESM simulations show that the northern-high-latitude permafrost region remains a carbon sink throughout the 21st century under the four scenarios because the increases in plant productivity offset accelerated decomposition rates (McGuire et al., 2018), whereas the CLM5 simulations show that the northern-high-latitude permafrost region would switch to a carbon source during the 21st century because the accelerated decomposition rates exceed increases in plant productivity. However, in either case, G6solar and G6sulfur tend to store more terrestrial carbon in the northern-high-latitude ecosystems than ssp585.
Our results suggest that G6solar and G6sulfur cannot restore the northern-high-latitude permafrost system under ssp585 to that under ssp245 due to the residual high-latitude warming (Kravitz et al., 2013a; Henry and Merlis, 2020) and the decoupling of temperature and atmospheric CO2 concentrations under solar geoengineering, which means asynchronous changes in heterotrophic respiration and CO2 fertilization effects. Compared to ssp245, G6solar and G6sulfur have a deeper active layer across much of northern Eurasia due to the robust residual winter warming over northern Eurasia, especially under G6sulfur. As a result of the deeper active layer, G6solar and G6sulfur also have more thawed SOC vulnerable to decomposition than ssp245. In addition, G6solar and G6sulfur accumulate more vegetation carbon than ssp245, whereas the soil carbon storages under G6solar and G6sulfur tend to be smaller in the CLM5 simulations and larger in the ESM simulations compared with ssp245.
This study analyzes the response of high-latitude permafrost under solar geoengineering without assessing its feedback in regional or global climate systems. Cao and Jiang (2017) find that the carbon cycle–climate feedback raises the amount of required solar geoengineering to reach the targeted warming levels without considering the permafrost carbon–climate feedback. How much the permafrost carbon–climate feedback would change the efficiency of solar geoengineering depends on specific warming targets and pathways to reach them (Gasser et al., 2018; Kleinen and Brovkin, 2018); these require specifically designed geoengineering experiments to access and are beyond the current scope of GeoMIP. Earth system models are an indispensable tool to examine the effects of different solar geoengineering methods, but only a few models have conducted the G6solar and G6sulfur experiments, and few studies have focused on the regional carbon cycle responses to solar geoengineering. We encourage more modeling groups to focus on high latitudes and perform the GeoMIP-type experiments.
All CMIP6 and GeoMIP simulation data used in this work are available from the Earth System Grid (https://esgf-node.llnl.gov/search/cmip6/; WCRP, 2022). The NCSCD v2 SOC dataset is available from https://bolin.su.se/data/ncscd/ (NCSCDv2, 2022).
DJ designed the research. YC performed the analysis and wrote the initial manuscript. DJ, QZ, and JCM revised the manuscript. OB, AJ, TL, MJM, UN, RS, and ST performed the simulations and offered valuable comments on the manuscript.
At least one of the (co-)authors is a member of the editorial board of Earth System Dynamics. The peer-review process was guided by an independent editor, and the authors also have no other competing interests to declare.
Publisher's note: Copernicus Publications remains neutral with regard to jurisdictional claims in published maps and institutional affiliations.
This article is part of the special issue “Resolving uncertainties in solar geoengineering through multi-model and large-ensemble simulations (ACP/ESD inter-journal SI)”. It is not associated with a conference.
We acknowledge the World Climate Research Programme for coordinating and promoting CMIP and all participants of CMIP6 and GeoMIP. We thank the Super Computing Center of Beijing Normal University for providing computing resources. We thank Eleanor J. Burke for providing the computer code calculating permafrost probability with the observation-based relationship.
This research has been supported by the National Natural Science Foundation of China (grant no. 41875126). Andy Jones was supported by the Met Office Hadley Centre Climate Programme funded by BEIS. Ulrike Niemeier has been supported by the Deutsche Forschungsgemeinschaft VollImpact research unit (FOR2820; grant no. 398006378) and used resources of the Deutsches Klimarechenzentrum (DKRZ) granted by its Scientific Steering Committee (WLA) under project ID bm0550. Roland Séférian acknowledges the European Union's Horizon 2020 research and innovation program under grant agreement no. 101003536 (ESM2025 – Earth System Models for the Future) and H2020 CONSTRAIN under the grant agreement no. 820829. The IPSL-CM6 experiments were performed using the HPC resources of TGCC under the allocations 2020-A0080107732 and 2021-A0100107732 (project gencmip6) provided by GENCI (Grand Equipement National de Calcul Intensif).
This paper was edited by Anping Chen and reviewed by two anonymous referees.
Aalto, J., Karjalainen, O., Hjort, J., and Luoto, M.: Statistical Forecasting of Current and Future Circum-Arctic Ground Temperatures and Active Layer Thickness, Geophys. Res. Lett., 45, 4889–4898, https://doi.org/10.1029/2018GL078007, 2018.
Andresen, C. G., Lawrence, D. M., Wilson, C. J., McGuire, A. D., Koven, C., Schaefer, K., Jafarov, E., Peng, S., Chen, X., Gouttevin, I., Burke, E., Chadburn, S., Ji, D., Chen, G., Hayes, D., and Zhang, W.: Soil moisture and hydrology projections of the permafrost region – a model intercomparison, The Cryosphere, 14, 445–459, https://doi.org/10.5194/tc-14-445-2020, 2020.
Bala, G., Caldeira, K., and Nemani, R.: Fast versus slow response in climate change: implications for the global hydrological cycle, Clim. Dynam., 35, 423–434, https://doi.org/10.1007/s00382-009-0583-y, 2010.
Banerjee, A., Butler, A. H., Polvani, L. M., Robock, A., Simpson, I. R., and Sun, L.: Robust winter warming over Eurasia under stratospheric sulfate geoengineering – the role of stratospheric dynamics, Atmos. Chem. Phys., 21, 6985–6997, https://doi.org/10.5194/acp-21-6985-2021, 2021.
Beer, C.: Permafrost sub-grid heterogeneity of soil properties key for 3-D soil processes and future climate projections, Front. Earth Sci., 4, 81, https://doi.org/10.3389/feart.2016.00081, 2016.
Biskaborn, B. K., Smith, S. L., Noetzli, J., Matthes, H., Vieira, G., Streletskiy, D. A., Schoeneich, P., Romanovsky, V. E., Lewkowicz, A. G., Abramov, A., Allard, M., Boike, J., Cable, W. L., Christiansen, H. H., Delaloye, R., Diekmann, B., Drozdov, D., Etzelmüller, B., Grosse, G., Guglielmin, M., Ingeman-Nielsen, T., Isaksen, K., Ishikawa, M., Johansson, M., Johannsson, H., Joo, A., Kaverin, D., Kholodov, A., Konstantinov, P., Kröger, T., Lambiel, C., Lanckman, J., Luo, D., Malkova, G., Meiklejohn, I., Moskalenko, N., Oliva, M., Phillips, M., Ramos, M., Sannel, A. B. K., Sergeev, D., Seybold, C., Skryabin, P., Vasiliev, A., Wu, Q., Yoshikawa, K., Zheleznyak, M., and Lantuit, H.: Permafrost is warming at a global scale, Nat. Commun., 10, 1–11, https://doi.org/10.1038/s41467-018-08240-4, 2019.
Boucher, O., Servonnat, J., Albright, A. L., Aumont, O., Balkanski, Y., Bastrikov, V., Bekki, S., Bonnet, R., Bony, S., and Bopp, L.: Presentation and evaluation of the IPSL-CM6A-LR climate model, J. Adv. Model. Earth Sy., 12, 2019MS002010, https://doi.org/10.1029/2019MS002010, 2020.
Brown, J., Ferrians Jr, O. J., Heginbottom, J. A., and Melnikov, E. S.: Circum-arctic map of permafrost and ground ice conditions Washington, DC, U.S. Geological Survey in Cooperation with the Circum-Pacific Council for Energy and Mineral Resources, Circum-Pacific Map Series CP-45, scale , 1 sheet, https://doi.org/10.3133/cp45, 1997.
Burke, E. J., Ekici, A., Huang, Y., Chadburn, S. E., Huntingford, C., Ciais, P., Friedlingstein, P., Peng, S., and Krinner, G.: Quantifying uncertainties of permafrost carbon-climate feedbacks, Biogeosciences, 14, 3051–3066, https://doi.org/10.5194/bg-14-3051-2017, 2017.
Burke, E. J., Zhang, Y., and Krinner, G.: Evaluating permafrost physics in the Coupled Model Intercomparison Project 6 (CMIP6) models and their sensitivity to climate change, The Cryosphere, 14, 3155–3174, https://doi.org/10.5194/tc-14-3155-2020, 2020.
Burn, C. R. and Zhang, Y.: Sensitivity of active-layer development to winter conditions north of treeline, Mackenzie delta area, western Arctic coast, in: Proceedings of the 6th Canadian Permafrost Conference, The 63rd Canadian Geotechnical Conference, Calgary, Alberta, 12–16 September 2010, 1458–1465, http://pubs.aina.ucalgary.ca/cpc/CPC6-1458.pdf (last access: 21 January 2023), 2010.
Cao, L.: The Effects of Solar Radiation Management on the Carbon Cycle, Curr. Clim. Change Rep., 4, 41–50, https://doi.org/10.1007/s40641-018-0088-z, 2018.
Cao, L. and Jiang, J.: Simulated Effect of Carbon Cycle Feedback on Climate Response to Solar Geoengineering, Geophys. Res. Lett., 44, 12–484, https://doi.org/10.1002/2017GL076546, 2017.
Chadburn, S. E., Burke, E. J., Cox, P. M., Friedlingstein, P., Hugelius, G., and Westermann, S.: An observation-based constraint on permafrost loss as a function of global warming, Nat. Clim. Change, 7, 340–344, https://doi.org/10.1038/nclimate3262, 2017.
Chen, Y., Liu, A., and Moore, J. C.: Mitigation of Arctic permafrost carbon loss through stratospheric aerosol geoengineering, Nat. Commun., 11, 1–10, https://doi.org/10.1038/s41467-020-16357-8, 2020.
Crowther, T. W. and Bradford, M. A.: Thermal acclimation in widespread heterotrophic soil microbes, Ecol. Lett., 16, 469–477, https://doi.org/10.1111/ele.12069, 2013.
Crutzen, P. J.: Albedo Enhancement by Stratospheric Sulfur Injections: A Contribution to Resolve a Policy Dilemma?, Climatic Change, 77, 211–219, https://doi.org/10.1007/s10584-006-9101-y, 2006.
Dankers, R., Burke, E. J., and Price, J.: Simulation of permafrost and seasonal thaw depth in the JULES land surface scheme, The Cryosphere, 5, 773–790, https://doi.org/10.5194/tc-5-773-2011, 2011.
Decharme, B., Delire, C., Minvielle, M., Colin, J., Vergnes, J. P., Alias, A., Saint Martin, D., Séférian, R., Sénési, S., and Voldoire, A.: Recent Changes in the ISBA-CTRIP Land Surface System for Use in the CNRM-CM6 Climate Model and in Global Off-Line Hydrological Applications, J. Adv. Model. Earth Sy., 11, 1207–1252, https://doi.org/10.1029/2018MS001545, 2019.
Delire, C., Séférian, R., Decharme, B., Alkama, R., Calvet, J. C., Carrer, D., Gibelin, A. L., Joetzjer, E., Morel, X., Rocher, M., and Tzanos, D.: The Global Land Carbon Cycle Simulated With ISBA-CTRIP: Improvements Over the Last Decade, J. Adv. Model. Earth Sy., 12, e2019MS001886, https://doi.org/10.1029/2019MS001886, 2020.
Duan, L., Cao, L., Bala, G., and Caldeira, K.: A Model-Based Investigation of Terrestrial Plant Carbon Uptake Response to Four Radiation Modification Approaches, J. Geophys. Res.-Atmos., 125, e2019JD031883, https://doi.org/10.1029/2019JD031883, 2020.
Eyring, V., Bony, S., Meehl, G. A., Senior, C. A., Stevens, B., Stouffer, R. J., and Taylor, K. E.: Overview of the Coupled Model Intercomparison Project Phase 6 (CMIP6) experimental design and organization, Geosci. Model Dev., 9, 1937–1958, https://doi.org/10.5194/gmd-9-1937-2016, 2016.
Fawzy, S., Osman, A. I., Doran, J., and Rooney, D. W.: Strategies for mitigation of climate change: a review, Environ. Chem. Lett., 18, 2069–2094, https://doi.org/10.1007/s10311-020-01059-w, 2020.
Ferraro, A. J., Highwood, E. J., and Charlton-Perez, A. J.: Weakened tropical circulation and reduced precipitation in response to geoengineering, Environ. Res. Lett., 9, 014001, https://doi.org/10.1088/1748-9326/9/1/014001, 2014.
Field, C. B. and Raupach, M. R. (Eds.): The global carbon cycle: integrating humans, climate, and the natural world, Island Press, ISBN: 1559635266, 2004.
Gasser, T., Kechiar, M., Ciais, P., Burke, E. J., Kleinen, T., Zhu, D., Huang, Y., Ekici, A., and Obersteiner, M.: Path-dependent reductions in CO2 emission budgets caused by permafrost carbon release, Nat. Geosci., 11, 830–835, https://doi.org/10.1038/s41561-018-0227-0, 2018.
Glienke, S., Irvine, P. J., and Lawrence, M. G.: The impact of geoengineering on vegetation in experiment G1 of the GeoMIP, J. Geophys. Res.-Atmos., 120, 10196–10213, https://doi.org/10.1002/2015JD024202, 2015.
Govindasamy, B., Thompson, S., Duffy, P. B., Caldeira, K., and Delire, C.: Impact of geoengineering schemes on the terrestrial biosphere, Geophys. Res. Lett., 29, 11–18, https://doi.org/10.1029/2002GL015911, 2002.
Gruber, S.: Derivation and analysis of a high-resolution estimate of global permafrost zonation, The Cryosphere, 6, 221–233, https://doi.org/10.5194/tc-6-221-2012, 2012.
Hausfather, Z., Marvel, K., Schmidt, G. A., Nielsen-Gammon, J. W., and Zelinka, M.: Climate simulations: recognize the “hot model” problem, Nature, 605, 26–29, https://doi.org/10.1038/d41586-022-01192-2, 2022.
Hengl, T., de Jesus, J. M., MacMillan, R. A., Batjes, N. H., Heuvelink, G. B., Ribeiro, E., Samuel-Rosa, A., Kempen, B., Leenaars, J. G., Walsh, M. G., and Gonzalez, M. R.: SoilGrids1km – global soil information based on automated mapping, PLoS One, 9, e105992, https://doi.org/10.1371/journal.pone.0105992, 2014.
Henry, M. and Merlis, T. M.: Forcing Dependence of Atmospheric Lapse Rate Changes Dominates Residual Polar Warming in Solar Radiation Management Climate Scenarios, Geophys. Res. Lett., 47, e2020GL087929, https://doi.org/10.1029/2020GL087929, 2020.
Huang, Y., Guenet, B., Wang, Y. L., and Ciais, P.: Global Simulation and Evaluation of Soil Organic Matter and Microbial Carbon and Nitrogen Stocks Using the Microbial Decomposition Model ORCHIMIC v2.0, Global Biogeochem. Cy., 35, e2020GB006836, https://doi.org/10.1029/2020GB006836, 2021.
Hugelius, G., Bockheim, J. G., Camill, P., Elberling, B., Grosse, G., Harden, J. W., Johnson, K., Jorgenson, T., Koven, C. D., Kuhry, P., Michaelson, G., Mishra, U., Palmtag, J., Ping, C.-L., O'Donnell, J., Schirrmeister, L., Schuur, E. A. G., Sheng, Y., Smith, L. C., Strauss, J., and Yu, Z.: A new data set for estimating organic carbon storage to 3 m depth in soils of the northern circumpolar permafrost region, Earth Syst. Sci. Data, 5, 393–402, https://doi.org/10.5194/essd-5-393-2013, 2013.
Hugelius, G., Strauss, J., Zubrzycki, S., Harden, J. W., Schuur, E. A. G., Ping, C. L., Schirrmeister, L., Grosse, G., Michaelson, G. J., Koven, C. D., O'Donnell, J. A., Elberling, B., Mishra, U., Camill, P., Yu, Z., Palmtag, J., and Kuhry, P.: Estimated stocks of circumpolar permafrost carbon with quantified uncertainty ranges and identified data gaps, Biogeosciences, 11, 6573–6593, https://doi.org/10.5194/bg-11-6573-2014, 2014.
Ito, A., Hajima, T., Lawrence, D. M., Brovkin, V., Delire, C., Guenet, B., Jones, C. D., Malyshev, S., Materia, S., McDermid, S. P., Peano, D., Pongratz, J., Robertson, E., Shevliakova, E., Vuichard, N., Warlind, D., Wiltshire, A., and Ziehn, T.: Soil carbon sequestration simulated in CMIP6-LUMIP models: implications for climatic mitigation, Environ. Res. Lett., 15, 124061, https://doi.org/10.1088/1748-9326/abc912, 2020.
Jiang, J., Cao, L., MacMartin, D. G., Simpson, I. R., Kravitz, B., Cheng, W., Visioni, D., Tilmes, S., Richter, J. H., and Mills, M. J.: Stratospheric Sulfate Aerosol Geoengineering Could Alter the High-Latitude Seasonal Cycle, Geophys. Res. Lett., 46, 14153–14163, https://doi.org/10.1029/2019GL085758, 2019.
Jones, A., Haywood, J. M., Jones, A. C., Tilmes, S., Kravitz, B., and Robock, A.: North Atlantic Oscillation response in GeoMIP experiments G6solar and G6sulfur: why detailed modelling is needed for understanding regional implications of solar radiation management, Atmos. Chem. Phys., 21, 1287–1304, https://doi.org/10.5194/acp-21-1287-2021, 2021.
Keith, D. W., Wagner, G., and Zabel, C. L.: Solar geoengineering reduces atmospheric carbon burden, Nat. Clim. Change, 7, 617–619, https://doi.org/10.1038/nclimate3376, 2017.
Kleinen, T. and Brovkin, V.: Pathway-dependent fate of permafrost region carbon, Environ. Res. Lett., 13, 094001, https://doi.org/10.1088/1748-9326/aad824, 2018.
Koven, C. D., Friedlingstein, P., Ciais, P., Khvorostyanov, D., Krinner, G., and Tarnocai, C.: On the formation of high-latitude soil carbon stocks: Effects of cryoturbation and insulation by organic matter in a land surface model, Geophys. Res. Lett., 36, L21501, https://doi.org/10.1029/2009GL040150, 2009.
Koven, C. D., Ringeval, B., Friedlingstein, P., Ciais, P., Cadule, P., Khvorostyanov, D., Krinner, G., and Tarnocai, C.: Permafrost carbon-climate feedbacks accelerate global warming, P. Natl. Acad. Sci. USA, 108, 14769–14774, https://doi.org/10.1073/pnas.1103910108, 2011.
Koven, C. D., Lawrence, D. M., and Riley, W. J.: Permafrost carbon–climate feedback is sensitive to deep soil carbon decomposability but not deep soil nitrogen dynamics, P. Natl. Acad. Sci. USA, 112, 3752–3757, https://doi.org/10.1073/pnas.1415123112, 2015.
Koven, C. D., Hugelius, G., Lawrence, D. M., and Wieder, W. R.: Higher climatological temperature sensitivity of soil carbon in cold than warm climates, Nat. Clim. Change, 7, 817–822, https://doi.org/10.1038/nclimate3421, 2017.
Krause, A., Kloster, S., Wilkenskjeld, S., and Paeth, H.: The sensitivity of global wildfires to simulated past, present, and future lightning frequency, J. Geophys. Res.-Biogeo., 119, 312–322, https://doi.org/10.1002/2013JG002502, 2014.
Kravitz, B., Robock, A., Boucher, O., Schmidt, H., Taylor, K. E., Stenchikov, G., and Schulz, M.: The Geoengineering Model Intercomparison Project (GeoMIP), Atmos. Sci. Lett., 12, 162-167, https://doi.org/10.1002/asl.316, 2011.
Kravitz, B., Robock, A., Forster, P. M., Haywood, J. M., Lawrence, M. G., and Schmidt, H.: An overview of the Geoengineering Model Intercomparison Project (GeoMIP), J. Geophys. Res.-Atmos., 118, 13103–13107, https://doi.org/10.1002/2013JD020569, 2013a.
Kravitz, B., Rasch, P. J., Forster, P. M., Andrews, T., Cole, J. N. S., Irvine, P. J., Ji, D., Kristjánsson, J. E., Moore, J. C., Muri, H., Niemeier, U., Robock, A., Singh, B., Tilmes, S., Watanabe, S., and Yoon, J.: An energetic perspective on hydrological cycle changes in the Geoengineering Model Intercomparison Project, J. Geophys. Res.-Atmos., 118, 13087–13102, https://doi.org/10.1002/2013JD020502, 2013b.
Kravitz, B., Robock, A., Tilmes, S., Boucher, O., English, J. M., Irvine, P. J., Jones, A., Lawrence, M. G., MacCracken, M., Muri, H., Moore, J. C., Niemeier, U., Phipps, S. J., Sillmann, J., Storelvmo, T., Wang, H., and Watanabe, S.: The Geoengineering Model Intercomparison Project Phase 6 (GeoMIP6): simulation design and preliminary results, Geosci. Model Dev., 8, 3379–3392, https://doi.org/10.5194/gmd-8-3379-2015, 2015.
Kravitz, B., MacMartin, D. G., Wang, H., and Rasch, P. J.: Geoengineering as a design problem, Earth Syst. Dynam., 7, 469–497, https://doi.org/10.5194/esd-7-469-2016, 2016.
Krinner, G., Viovy, N., de Noblet-Ducoudré, N., Ogée, J., Polcher, J., Friedlingstein, P., Ciais, P., Sitch, S., and Prentice, I. C.: A dynamic global vegetation model for studies of the coupled atmosphere-biosphere system, Global Biogeochem. Cy., 19, GB1015, https://doi.org/10.1029/2003GB002199, 2005.
Lauritzen, P. H., Nair, R. D., Herrington, A. R., Callaghan, P., Goldhaber, S., Dennis, J. M., Bacmeister, J. T., Eaton, B. E., Zarzycki, C. M., Taylor, M. A., Ullrich, P. A., Dubos, T., Gettelman, A., Neale, R. B., Dobbins, B., Reed, K. A., Hannay, C., Medeiros, B., Benedict, J. J., and Tribbia, J. J.: NCAR Release of CAM-SE in CESM2.0: A Reformulation of the Spectral Element Dynamical Core in Dry-Mass Vertical Coordinates With Comprehensive Treatment of Condensates and Energy, J. Adv. Model. Earth Sy., 10, 1537–1570, https://doi.org/10.1029/2017MS001257, 2018.
Lawrence, D. M. and Slater, A. G.: A projection of severe near-surface permafrost degradation during the 21st century, Geophys. Res. Lett., 32, L24401, https://doi.org/10.1029/2005GL025080, 2005.
Lawrence, D. M., Slater, A. G., and Swenson, S. C.: Simulation of Present-Day and Future Permafrost and Seasonally Frozen Ground Conditions in CCSM4, J. Clim., 25, 2207–2225, https://doi.org/10.1175/JCLI-D-11-00334.1, 2012.
Lawrence, D. M., Koven, C. D., Swenson, S. C., Riley, W. J., and Slater, A. G.: Permafrost thaw and resulting soil moisture changes regulate projected high-latitude CO2 and CH4 emissions, Environ. Res. Lett., 10, 94011, https://doi.org/10.1088/1748-9326/10/9/094011, 2015.
Lawrence, D. M., Fisher, R., Koven, C. D., Oleson, K., Swenson, S., Vertenstein, M., Andre, B., Bonan, G., Ghimire, B., van Kampenhout, L., Kennedy, D., Kluzek, E., Knox, R., Lawrence, P., Li, F., Li, H., Lombardozzi, D., Lu, Y., Perket, J., Riley, W., Sacks, W., Shi, M., Wieder, W, Xu, C., Ali, A., Badger, A., Bisht, G., Broxtom, P., Brunke, M., Buzan, J., Clark, M., Craig, T., Dahlin, K., Drewniak, B., Emmons, L., Fisher, J., Flanner, M., Gentine, P., Lenaerts, J., Levis, S., Leung, L. R., Lipscomb, W., Pelletier, J., Ricciuto, D. M., Sanderson, B., Shuman, J., Slater, A., Subin, Z., Tang, J., Tawfik, A., Thomas, Q., Tilmes, S., Vitt, F., and Zeng, X.: Technical Description of version 5.0 of the Community Land Model (CLM), http://www.cesm.ucar.edu/models/cesm2/land/CLM50_Tech_Note.pdf, 2018 (last access: 21 January 2023).
Lawrence, D. M., Fisher, R. A., Koven, C. D., Oleson, K. W., Swenson, S. C., Bonan, G., Collier, N., Ghimire, B., Kampenhout, L., Kennedy, D., Kluzek, E., Lawrence, P. J., Li, F., Li, H., Lombardozzi, D., Riley, W. J., Sacks, W. J., Shi, M., Vertenstein, M., Wieder, W. R., Xu, C., Ali, A. A., Badger, A. M., Bisht, G., Broeke, M., Brunke, M. A., Burns, S. P., Buzan, J., Clark, M., Craig, A., Dahlin, K., Drewniak, B., Fisher, J. B., Flanner, M., Fox, A. M., Gentine, P., Hoffman, F., Keppel Aleks, G., Knox, R., Kumar, S., Lenaerts, J., Leung, L. R., Lipscomb, W. H., Lu, Y., Pandey, A., Pelletier, J. D., Perket, J., Randerson, J. T., Ricciuto, D. M., Sanderson, B. M., Slater, A., Subin, Z. M., Tang, J., Thomas, R. Q., Val Martin, M., and Zeng, X.: The Community Land Model Version 5: Description of New Features, Benchmarking, and Impact of Forcing Uncertainty, J. Adv. Model. Earth Sy., 11, 4245–4287, https://doi.org/10.1029/2018MS001583, 2019.
Lee, H., Ekici, A., Tjiputra, J., Muri, H., Chadburn, S. E., Lawrence, D. M., and Schwinger, J.: The Response of Permafrost and High-Latitude Ecosystems Under Large-Scale Stratospheric Aerosol Injection and Its Termination, Earth's Future, 7, 605–614, https://doi.org/10.1029/2018EF001146, 2019.
Lee, H., Muri, H., Ekici, A., Tjiputra, J., and Schwinger, J.: The response of terrestrial ecosystem carbon cycling under different aerosol-based radiation management geoengineering, Earth Syst. Dynam., 12, 313–326, https://doi.org/10.5194/esd-12-313-2021, 2021.
Lenton, T. M., Held, H., Kriegler, E., Hall, J. W., Lucht, W., Rahmstorf, S., and Schellnhuber, H. J.: Tipping elements in the Earth's climate system, P. Natl. Acad. Sci. USA, 105, 1786–1793, https://doi.org/10.1073/pnas.0705414105, 2008.
MacDougall, A. H. and Knutti, R.: Projecting the release of carbon from permafrost soils using a perturbed parameter ensemble modelling approach, Biogeosciences, 13, 2123–2136, https://doi.org/10.5194/bg-13-2123-2016, 2016.
MacDougall, A. H., Avis, C. A., and Weaver, A. J.: Significant contribution to climate warming from the permafrost carbon feedback, Nat. Geosci., 5, 719–721, https://doi.org/10.1038/ngeo1573, 2012.
Mauritsen, T., Bader, J., Becker, T., Behrens, J., Bittner, M., Brokopf, R., Brovkin, V., Claussen, M., Crueger, T., Esch, M., Fast, I., Fiedler, S., Fläschner, D., Gayler, V., Giorgetta, M., Goll, D. S., Haak, H., Hagemann, S., Hedemann, C., Hohenegger, C., Ilyina, T., Jahns, T., Jimenéz De La Cuesta, D., Jungclaus, J., Kleinen, T., Kloster, S., Kracher, D., Kinne, S., Kleberg, D., Lasslop, G., Kornblueh, L., Marotzke, J., Matei, D., Meraner, K., Mikolajewicz, U., Modali, K., Möbis, B., Müller, W. A., Nabel, J. E. M. S., Nam, C. C. W., Notz, D., Nyawira, S. S., Paulsen, H., Peters, K., Pincus, R., Pohlmann, H., Pongratz, J., Popp, M., Raddatz, T. J., Rast, S., Redler, R., Reick, C. H., Rohrschneider, T., Schemann, V., Schmidt, H., Schnur, R., Schulzweida, U., Six, K. D., Stein, L., Stemmler, I., Stevens, B., Storch, J. S., Tian, F., Voigt, A., Vrese, P., Wieners, K. H., Wilkenskjeld, S., Winkler, A., and Roeckner, E.: Developments in the MPI-M Earth System Model version 1.2 (MPI-ESM1.2) and Its Response to Increasing CO2, J. Adv. Model. Earth Sy., 11, 998–1038, https://doi.org/10.1029/2018MS001400, 2019.
McGuire, A. D., Koven, C., Lawrence, D. M., Clein, J. S., Xia, J., Beer, C., Burke, E., Chen, G., Chen, X., Delire, C., Jafarov, E., MacDougall, A. H., Marchenko, S., Nicolsky, D., Peng, S., Rinke, A., Saito, K., Zhang, W., Alkama, R., Bohn, T. J., Ciais, P., Decharme, B., Ekici, A., Gouttevin, I., Hajima, T., Hayes, D. J., Ji, D., Krinner, G., Lettenmaier, D. P., Luo, Y., Miller, P. A., Moore, J. C., Romanovsky, V., Schädel, C., Schaefer, K., Schuur, E. A. G., Smith, B., Sueyoshi, T., and Zhuang, Q.: Variability in the sensitivity among model simulations of permafrost and carbon dynamics in the permafrost region between 1960 and 2009, Global Biogeochem. Cy., 30, 1015–1037, https://doi.org/10.1002/2016GB005405, 2016.
McGuire, A. D., Lawrence, D. M., Koven, C., Clein, J. S., Burke, E., Chen, G., Jafarov, E., MacDougall, A. H., Marchenko, S., Nicolsky, D., Peng, S., Rinke, A., Ciais, P., Gouttevin, I., Hayes, D. J., Ji, D., Krinner, G., Moore, J. C., Romanovsky, V., Schädel, C., Schaefer, K., Schuur, E. A. G., and Zhuang, Q.: Dependence of the evolution of carbon dynamics in the northern permafrost region on the trajectory of climate change, P. Natl. Acad. Sci. USA, 115, 3882–3887, https://doi.org/10.1073/pnas.1719903115, 2018.
Meehl, G. A., Senior, C. A., Eyring, V., Flato, G., Lamarque, J. F., Stouffer, R. J., Taylor, K. E., and Schlund, M.: Context for interpreting equilibrium climate sensitivity and transient climate response from the CMIP6 Earth system models, Sci. Adv., 6, eaba1981, https://doi.org/10.1126/sciadv.aba1981, 2020.
Meinshausen, M., Nicholls, Z. R. J., Lewis, J., Gidden, M. J., Vogel, E., Freund, M., Beyerle, U., Gessner, C., Nauels, A., Bauer, N., Canadell, J. G., Daniel, J. S., John, A., Krummel, P. B., Luderer, G., Meinshausen, N., Montzka, S. A., Rayner, P. J., Reimann, S., Smith, S. J., van den Berg, M., Velders, G. J. M., Vollmer, M. K., and Wang, R. H. J.: The shared socio-economic pathway (SSP) greenhouse gas concentrations and their extensions to 2500, Geosci. Model Dev., 13, 3571–3605, https://doi.org/10.5194/gmd-13-3571-2020, 2020.
Melnikova, I., Boucher, O., Cadule, P., Ciais, P., Gasser, T., Quilcaille, Y., Shiogama, H., Tachiiri, K., Yokohata, T., and Tanaka, K.: Carbon Cycle Response to Temperature Overshoot Beyond 2 ∘C: An Analysis of CMIP6 Models, Earth's Future, 9, e2020EF001967, https://doi.org/10.1029/2020EF001967, 2021.
Muri, H., Niemeier, U., and Kristjánsson, J. E.: Tropical rainforest response to marine sky brightening climate engineering, Geophys. Res. Lett., 42, 2951–2960, https://doi.org/10.1002/2015GL063363, 2015.
Muri, H., Tjiputra, J., Otterå, O. H., Adakudlu, M., Lauvset, S. K., Grini, A., Schulz, M., Niemeier, U., and Kristjánsson, J. E.: Climate Response to Aerosol Geoengineering: A Multimethod Comparison, J. Clim., 31, 6319–6340, https://doi.org/10.1175/JCLI-D-17-0620.1, 2018.
NCSCDv2: Northern Circumpolar Soil Carbon Database version 2, Bolin Centre Database, Bolin Centre for Climate Research, Stockholm University [data set], https://bolin.su.se/data/ncscd/, last access: 12 January, 2022.
Niemeier, U., Schmidt, H., Alterskjaer, K., and Kristjánsson, J. E.: Solar irradiance reduction via climate engineering: Impact of different techniques on the energy balance and the hydrological cycle, J. Geophys. Res.-Atmos., 118, 11905–11917, https://doi.org/10.1002/2013JD020445, 2013.
Obu, J., Westermann, S., Bartsch, A., Berdnikov, N., Christiansen, H. H., Dashtseren, A., Delaloye, R., Elberling, B., Etzelmüller, B., Kholodov, A., Khomutov, A., Kääb, A., Leibman, M. O., Lewkowicz, A. G., Panda, S. K., Romanovsky, V., Way, R. G., Westergaard-Nielsen, A., Wu, T., Yamkhin, J., and Zou, D.: Northern Hemisphere permafrost map based on TTOP modelling for 2000–2016 at 1 km2 scale, Earth-Sci. Rev., 193, 299–316, https://doi.org/10.1016/j.earscirev.2019.04.023, 2019.
Peng, S., Ciais, P., Krinner, G., Wang, T., Gouttevin, I., McGuire, A. D., Lawrence, D., Burke, E., Chen, X., Decharme, B., Koven, C., MacDougall, A., Rinke, A., Saito, K., Zhang, W., Alkama, R., Bohn, T. J., Delire, C., Hajima, T., Ji, D., Lettenmaier, D. P., Miller, P. A., Moore, J. C., Smith, B., and Sueyoshi, T.: Simulated high-latitude soil thermal dynamics during the past 4 decades, The Cryosphere, 10, 179–192, https://doi.org/10.5194/tc-10-179-2016, 2016.
Plazzotta, M., Séférian, R., and Douville, H.: Impact of Solar Radiation Modification on Allowable CO2 Emissions: What Can We Learn From Multimodel Simulations?, Earth's Future, 7, 664–676, https://doi.org/10.1029/2019EF001165, 2019.
Reick, C. H., Gayler, V., Goll, D., Hagemann, S., Heidkamp, M., Nabel, J. E. M. S., Raddatz, T., Roeckner, E., Schnur, R., and Wilkenskjeld, S.: JSBACH 3 – The land component of the MPI Earth System Model: documentation of version 3.2, Hamburg, MPI für Meteorologie, 287 pp., https://doi.org/10.17617/2.3279802, 2021.
Russotto, R. D. and Ackerman, T. P.: Energy transport, polar amplification, and ITCZ shifts in the GeoMIP G1 ensemble, Atmos. Chem. Phys., 18, 2287–2305, https://doi.org/10.5194/acp-18-2287-2018, 2018.
Schmidt, H., Alterskjær, K., Bou Karam, D., Boucher, O., Jones, A., Kristjánsson, J. E., Niemeier, U., Schulz, M., Aaheim, A., Benduhn, F., Lawrence, M., and Timmreck, C.: Solar irradiance reduction to counteract radiative forcing from a quadrupling of CO2: climate responses simulated by four earth system models, Earth Syst. Dynam., 3, 63–78, https://doi.org/10.5194/esd-3-63-2012, 2012.
Schneider von Deimling, T., Meinshausen, M., Levermann, A., Huber, V., Frieler, K., Lawrence, D. M., and Brovkin, V.: Estimating the near-surface permafrost-carbon feedback on global warming, Biogeosciences, 9, 649–665, https://doi.org/10.5194/bg-9-649-2012, 2012.
Schuur, E. A. G., Bockheim, J., Canadell, J. G., Euskirchen, E., Field, C. B., Goryachkin, S. V., Hagemann, S., Kuhry, P., Lafleur, P. M., Lee, H., Mazhitova, G., Nelson, F. E., Rinke, A., Romanovsky, V. E., Shiklomanov, N., Tarnocai, C., Venevsky, S., Vogel, J. G., and Zimov, S. A.: Vulnerability of Permafrost Carbon to Climate Change: Implications for the Global Carbon Cycle, BioScience, 58, 701–714, https://doi.org/10.1641/B580807, 2008.
Schuur, E. A. G., McGuire, A. D., Schädel, C., Grosse, G., Harden, J. W., Hayes, D. J., Hugelius, G., Koven, C. D., Kuhry, P., Lawrence, D. M., Natali, S. M., Olefeldt, D., Romanovsky, V. E., Schaefer, K., Turetsky, M. R., Treat, C. C., and Vonk, J. E.: Climate change and the permafrost carbon feedback, Nature, 520, 171–179, https://doi.org/10.1038/nature14338, 2015.
Séférian, R., Nabat, P., Michou, M., Saint-Martin, D., Voldoire, A., Colin, J., Decharme, B., Delire, C., Berthet, S., Chevallier, M., Senesi, S., Franchisteguy, L., Vial, J., Mallet, M., Joetzjer, E., Geoffroy, O., Gueremy, J. F., Moine, M. P., Msadek, R., Ribes, A., Rocher, M., Roehrig, R., Salas-y-Melia, D., Sanchez, E., Terray, L., Valcke, S., Waldman, R., Aumont, O., Bopp, L., Deshayes, J., Ethe, C., and Madec, G.: Evaluation of CNRM Earth System Model, CNRM-ESM2-1: Role of Earth System Processes in Present-Day and Future Climate, J. Adv. Model. Earth Sy., 11, 4182–4227, https://doi.org/10.1029/2019MS001791, 2019.
Sellar, A. A., Jones, C. G., Mulcahy, J. P., Tang, Y., Yool, A., Wiltshire, A., O'Connor, F. M., Stringer, M., Hill, R., Palmieri, J., Woodward, S., Mora, L., Kuhlbrodt, T., Rumbold, S. T., Kelley, D. I., Ellis, R., Johnson, C. E., Walton, J., Abraham, N. L., Andrews, M. B., Andrews, T., Archibald, A. T., Berthou, S., Burke, E., Blockley, E., Carslaw, K., Dalvi, M., Edwards, J., Folberth, G. A., Gedney, N., Griffiths, P. T., Harper, A. B., Hendry, M. A., Hewitt, A. J., Johnson, B., Jones, A., Jones, C. D., Keeble, J., Liddicoat, S., Morgenstern, O., Parker, R. J., Predoi, V., Robertson, E., Siahaan, A., Smith, R. S., Swaminathan, R., Woodhouse, M. T., Zeng, G., and Zerroukat, M.: UKESM1: Description and Evaluation of the U.K. Earth System Model, J. Adv. Model. Earth Sy., 11, 4513–4558, https://doi.org/10.1029/2019MS001739, 2019.
Sellers, P. J., Hall, F. G., Kelly, R. D., Black, A., Baldocchi, D., Berry, J., Ryan, M., Ranson, K. J., Crill, P. M., Lettenmaier, D. P., Margolis, H., Cihlar, J., Newcomer, J., Fitzjarrald, D., Jarvis, P. G., Gower, S. T., Halliwell, D., Williams, D., Goodison, B., Wickland, D. E., and Guertin, F. E.: BOREAS in 1997: Experiment overview, scientific results, and future directions, J. Geophys. Res.-Atmos., 102, 28731–28769, https://doi.org/10.1029/97JD03300, 1997.
Serreze, M. C. and Barry, R. G.: Processes and impacts of Arctic amplification: A research synthesis, Glob. Planet. Change, 77, 85–96, https://doi.org/10.1016/j.gloplacha.2011.03.004, 2011.
Shindell, D. T.: Dynamic winter climate response to large tropical volcanic eruptions since 1600, J. Geophys. Res., 109, D05104, https://doi.org/10.1029/2003JD004151, 2004.
Shu, S., Jain, A. K., Koven, C. D., and Mishra, U.: Estimation of Permafrost SOC Stock and Turnover Time Using a Land Surface Model with Vertical Heterogeneity of Permafrost Soils, Global Biogeochem. Cy., 34, e2020GB006585, https://doi.org/10.1029/2020GB006585, 2020.
Simpson, I. R., Tilmes, S., Richter, J. H., Kravitz, B., MacMartin, D. G., Mills, M. J., Fasullo, J. T., and Pendergrass, A. G.: The Regional Hydroclimate Response to Stratospheric Sulfate Geoengineering and the Role of Stratospheric Heating, J. Geophys. Res.-Atmos., 124, 12587–12616, https://doi.org/10.1029/2019JD031093, 2019.
Slater, A. G. and Lawrence, D. M.: Diagnosing Present and Future Permafrost from Climate Models, J. Clim., 26, 5608–5623, https://doi.org/10.1175/JCLI-D-12-00341.1, 2013.
Strauss, J., Schirrmeister, L., Grosse, G., Fortier, D., Hugelius, G., Knoblauch, C., Romanovsky, V., Schädel, C., Schneider Von Deimling, T., Schuur, E. A. G., Shmelev, D., Ulrich, M., and Veremeeva, A.: Deep Yedoma permafrost: A synthesis of depositional characteristics and carbon vulnerability, Earth-Sci. Rev., 172, 75–86, https://doi.org/10.1016/j.earscirev.2017.07.007, 2017.
Tarnocai, C., Canadell, J. G., Schuur, E. A. G., Kuhry, P., Mazhitova, G., and Zimov, S.: Soil organic carbon pools in the northern circumpolar permafrost region, Global Biogeochem. Cy., 23, GB2023, https://doi.org/10.1029/2008GB003327, 2009.
Taylor, K. E., Stouffer, R. J., and Meehl, G. A.: An Overview of CMIP5 and the Experiment Design, B. Am. Meteorol. Soc., 93, 485–498, https://doi.org/10.1175/BAMS-D-11-00094.1, 2012.
Tilmes, S., Fasullo, J., Lamarque, J., Marsh, D. R., Mills, M., Alterskjaer, K., Muri, H., Kristjánsson, J. E., Boucher, O., Schulz, M., Cole, J. N. S., Curry, C. L., Jones, A., Haywood, J., Irvine, P. J., Ji, D., Moore, J. C., Karam, D. B., Kravitz, B., Rasch, P. J., Singh, B., Yoon, J., Niemeier, U., Schmidt, H., Robock, A., Yang, S., and Watanabe, S.: The hydrological impact of geoengineering in the Geoengineering Model Intercomparison Project (GeoMIP), J. Geophys. Res.-Atmos., 118, 11036–11058, https://doi.org/10.1002/jgrd.50868, 2013.
Tjiputra, J. F., Grini, A., and Lee, H.: Impact of idealized future stratospheric aerosol injection on the large-scale ocean and land carbon cycles, J. Geophys. Res.-Biogeo., 121, 2–27, https://doi.org/10.1002/2015JG003045, 2016.
Todd-Brown, K. E. O., Randerson, J. T., Post, W. M., Hoffman, F. M., Tarnocai, C., Schuur, E. A. G., and Allison, S. D.: Causes of variation in soil carbon simulations from CMIP5 Earth system models and comparison with observations, Biogeosciences, 10, 1717–1736, https://doi.org/10.5194/bg-10-1717-2013, 2013.
Todd-Brown, K. E. O., Randerson, J. T., Hopkins, F., Arora, V., Hajima, T., Jones, C., Shevliakova, E., Tjiputra, J., Volodin, E., Wu, T., Zhang, Q., and Allison, S. D.: Changes in soil organic carbon storage predicted by Earth system models during the 21st century, Biogeosciences, 11, 2341–2356, https://doi.org/10.5194/bg-11-2341-2014, 2014.
Turetsky, M. R., Benscoter, B., Page, S., Rein, G., van der Werf, G. R., and Watts, A.: Global vulnerability of peatlands to fire and carbon loss, Nat. Geosci., 8, 11–14, https://doi.org/10.1038/ngeo2325, 2015.
Varney, R. M., Chadburn, S. E., Friedlingstein, P., Burke, E. J., Koven, C. D., Hugelius, G., and Cox, P. M.: A spatial emergent constraint on the sensitivity of soil carbon turnover to global warming, Nat. Commun., 11, 1–8, https://doi.org/10.1038/s41467-020-19208-8, 2020.
Varney, R. M., Chadburn, S. E., Burke, E. J., and Cox, P. M.: Evaluation of soil carbon simulation in CMIP6 Earth system models, Biogeosciences, 19, 4671–4704, https://doi.org/10.5194/bg-19-4671-2022, 2022.
Veraverbeke, S., Rogers, B. M., Goulden, M. L., Jandt, R. R., Miller, C. E., Wiggins, E. B., and Randerson, J. T.: Lightning as a major driver of recent large fire years in North American boreal forests, Nat. Clim. Change, 7, 529–534, https://doi.org/10.1038/nclimate3329, 2017.
Visioni, D., MacMartin, D. G., Kravitz, B., Boucher, O., Jones, A., Lurton, T., Martine, M., Mills, M. J., Nabat, P., Niemeier, U., S Ef Erian, R., and Tilmes, S.: Identifying the sources of uncertainty in climate model simulations of solar radiation modification with the G6sulfur and G6solar Geoengineering Model Intercomparison Project (GeoMIP) simulations, Atmos. Chem. Phys., 21, 10039–10063, https://doi.org/10.5194/acp-21-10039-2021, 2021.
WCRP: CMIP6 project data, Earth System Grid Federation [data set], https://esgf-node.llnl.gov/search/cmip6/, last access: 12 January 2022.
Wang, W., Rinke, A., Moore, J. C., Ji, D., Cui, X., Peng, S., Lawrence, D. M., McGuire, A. D., Burke, E. J., Chen, X., Decharme, B., Koven, C., MacDougall, A., Saito, K., Zhang, W., Alkama, R., Bohn, T. J., Ciais, P., Delire, C., Gouttevin, I., Hajima, T., Krinner, G., Lettenmaier, D. P., Miller, P. A., Smith, B., Sueyoshi, T., and Sherstiukov, A. B.: Evaluation of air–soil temperature relationships simulated by land surfacemodels during winter across the permafrost region, The Cryosphere, 10, 1721–1737, https://doi.org/10.5194/tc-10-1721-2016, 2016.
Wyser, K., van Noije, T., Yang, S., von Hardenberg, J., O'Donnell, D., and Döscher, R.: On the increased climate sensitivity in the EC-Earth model from CMIP5 to CMIP6, Geosci. Model Dev., 13, 3465–3474, https://doi.org/10.5194/gmd-13-3465-2020, 2020.
Xia, L., Robock, A., Tilmes, S., and Neely III, R. R.: Stratospheric sulfate geoengineering could enhance the terrestrial photosynthesis rate, Atmos. Chem. Phys., 16, 1479–1489, https://doi.org/10.5194/acp-16-1479-2016, 2016.
Yu, X., Moore, J. C., Cui, X., Rinke, A., Ji, D., Kravitz, B., and Yoon, J.: Impacts, effectiveness and regional inequalities of the GeoMIP G1 to G4 solar radiation management scenarios, Global Planet. Change, 129, 10–22, https://doi.org/10.1016/j.gloplacha.2015.02.010, 2015.
Zelinka, M. D., Myers, T. A., McCoy, D. T., Po Chedley, S., Caldwell, P. M., Ceppi, P., Klein, S. A., and Taylor, K. E.: Causes of Higher Climate Sensitivity in CMIP6 Models, Geophys. Res. Lett., 47, e2019GL085782, https://doi.org/10.1029/2019GL085782, 2020.
Zhang, T., Heginbottom, J. A., Barry, R. G., and Brown, J.: Further statistics on the distribution of permafrost and ground ice in the Northern Hemisphere, Polit. Geography, 24, 126–131, https://doi.org/10.1080/10889370009377692, 2000.
Zhang, Z., Moore, J. C., Huisingh, D., and Zhao, Y.: Review of geoengineering approaches to mitigating climate change, J. Clean. Prod., 103, 898–907, https://doi.org/10.1016/j.jclepro.2014.09.076, 2015.
Zhu, D., Peng, S., Ciais, P., Zech, R., Krinner, G., Zimov, S., and Grosse, G.: Simulating soil organic carbon in yedoma deposits during the Last Glacial Maximum in a land surface model, Geophys. Res. Lett., 43, 5133–5142, 2016.