the Creative Commons Attribution 4.0 License.
the Creative Commons Attribution 4.0 License.
 | 15 Mar 2022
Climate change in the Baltic Sea region: a summary
H. E. Markus Meier
Madline Kniebusch
Christian Dieterich
Matthias Gröger
Eduardo Zorita
Ragnar Elmgren
Kai Myrberg
Markus P. Ahola
Alena Bartosova
Erik Bonsdorff
Florian Börgel
Rene Capell
Ida Carlén
Thomas Carlund
Jacob Carstensen
Ole B. Christensen
Volker Dierschke
Claudia Frauen
Morten Frederiksen
Elie Gaget
Anders Galatius
Jari J. Haapala
Antti Halkka
Gustaf Hugelius
Birgit Hünicke
Jaak Jaagus
Mart Jüssi
Jukka Käyhkö
Nina Kirchner
Erik Kjellström
Karol Kulinski
Andreas Lehmann
Göran Lindström
Wilhelm May
Paul A. Miller
Volker Mohrholz
Bärbel Müller-Karulis
Diego Pavón-Jordán
Markus Quante
Marcus Reckermann
Anna Rutgersson
Oleg P. Savchuk
Martin Stendel
Laura Tuomi
Markku Viitasalo
Ralf Weisse
Wenyan Zhang
Based on the Baltic Earth Assessment Reports of this thematic issue in Earth System Dynamics and recent peer-reviewed literature, current knowledge of the effects of global warming on past and future changes in climate of the Baltic Sea region is summarised and assessed. The study is an update of the Second Assessment of Climate Change (BACC II) published in 2015 and focuses on the atmosphere, land, cryosphere, ocean, sediments, and the terrestrial and marine biosphere. Based on the summaries of the recent knowledge gained in palaeo-, historical, and future regional climate research, we find that the main conclusions from earlier assessments still remain valid. However, new long-term, homogenous observational records, for example, for Scandinavian glacier inventories, sea-level-driven saltwater inflows, so-called Major Baltic Inflows, and phytoplankton species distribution, and new scenario simulations with improved models, for example, for glaciers, lake ice, and marine food web, have become available. In many cases, uncertainties can now be better estimated than before because more models were included in the ensembles, especially for the Baltic Sea. With the help of coupled models, feedbacks between several components of the Earth system have been studied, and multiple driver studies were performed, e.g. projections of the food web that include fisheries, eutrophication, and climate change. New datasets and projections have led to a revised understanding of changes in some variables such as salinity. Furthermore, it has become evident that natural variability, in particular for the ocean on multidecadal timescales, is greater than previously estimated, challenging our ability to detect observed and projected changes in climate. In this context, the first palaeoclimate simulations regionalised for the Baltic Sea region are instructive. Hence, estimated uncertainties for the projections of many variables increased. In addition to the well-known influence of the North Atlantic Oscillation, it was found that also other low-frequency modes of internal variability, such as the Atlantic Multidecadal Variability, have profound effects on the climate of the Baltic Sea region. Challenges were also identified, such as the systematic discrepancy between future cloudiness trends in global and regional models and the difficulty of confidently attributing large observed changes in marine ecosystems to climate change. Finally, we compare our results with other coastal sea assessments, such as the North Sea Region Climate Change Assessment (NOSCCA), and find that the effects of climate change on the Baltic Sea differ from those on the North Sea, since Baltic Sea oceanography and ecosystems are very different from other coastal seas such as the North Sea. While the North Sea dynamics are dominated by tides, the Baltic Sea is characterised by brackish water, a perennial vertical stratification in the southern subbasins, and a seasonal sea ice cover in the northern subbasins.


1.1 Overview
In this study, the results concerning the climate change of the various articles of this thematic issue, the so-called Baltic Earth Assessment Reports (BEARs) coordinated by the Baltic Earth programme (https://baltic.earth, last access: 15 February 2022; Meier et al., 2014) and other relevant literature, are summarised and assessed. We focus on the knowledge gained during 2013–2020 of past, present, and future climate changes in the Baltic Sea region. The methodology of all BEARs follows the earlier assessments of climate change in the Baltic Sea region (BACC Author Team, 2008; BACC II Author Team, 2015). The aim of this review is to inform and update scientists, policymakers, and stakeholders about recent research results. The focus is on the atmosphere, hydrosphere, cryosphere, lithosphere, and biosphere. In contrast to the earlier assessments, we do not investigate the impact of climate change on human society. We start (Sect. 1) with a summary of key messages from the earlier assessments of climate change in the Baltic Sea region, a description of the Baltic Sea region and its climate, a comparison of the Baltic Sea with other coastal seas, and a summary of current knowledge of global climate change assessed in the latest Intergovernmental Panel on Climate Change (IPCC) reports (see Table 1 of contents). In Sect. 2, the methods for the literature assessment, proxy data, instrumental measurements, climate model data, and uncertainty estimates are outlined. In Sect. 3, the results of the assessment for selected variables (Table 2) under past (palaeoclimate), present (historical period with instrumental data), and future (until 2100) climate conditions are presented, inter alia, by summarising the results in various papers of this special issue by Lehmann et al. (2022), Kuliński et al. (2021), Rutgersson et al. (2022), Weisse et al. (2021), Gröger et al. (2021a), Christensen et al. (2022), Meier et al. (2022), and Viitasalo and Bonsdorff (2021) and by other relevant review studies. In Sect. 4, the interactions of climate with other anthropogenic drivers are summarised from Reckermann et al. (2022). As the adjacent North Sea has different physical characteristics and topographical features but is located in a similar climatic zone as the Baltic Sea, we compare the results of this assessment with the results of the North Sea Region Climate Change Assessment (NOSCCA; Quante and Colijn, 2016; Sect. 5). Knowledge gaps (Sect. 6), key messages (Sect. 7), and conclusions (Sect. 8) finalise the study. Acronyms used in this study are defined in Table 3.
Table 2Variables of this assessment and references to the corresponding sections of this review and to the corresponding Baltic Earth Assessment Reports (1 – Lehmann et al., 2022; 2 – Kuliński et al., 2021; 3 – Rutgersson et al., 2022; 4 – Weisse et al., 2021; 5 – Reckermann et al., 2022; 6 – Gröger et al., 2021a; 7 – Christensen et al., 2022; 8 – Meier et al., 2022; 9 – Viitasalo and Bonsdorff, 2021).

Table 3List of acronyms (in alphabetical order), their definitions, comments, and references.
1.2 The BACC and BEAR projects
This assessment is an update to the two BACC books, published as comprehensive textbooks in 2008 and 2015 (BACC Author Team, 2008; BACC II Author Team, 2015). The acronym BACC (BALTEX Assessment of Climate Change) refers to the Baltic Earth precursor programme BALTEX (Baltic Sea Experiment; Reckermann et al., 2011). From the beginning, BALTEX tried to approach the following three basic questions: (1) what is the evidence for past and present regional climate change? (2) What are the model projections for future regional climate change? (3) Which impacts can we already observe in terrestrial and marine ecosystems?
The first ideas for a comprehensive appraisal of the current knowledge on climate change and its impact on the Baltic Sea region evolved in 2004 as it became evident that there was a demand for this, in particular by the Baltic Marine Environment Protection Commission, called the Helsinki Commission (HELCOM; BALTEX, 2005). A steering group of leading experts from the Baltic Sea region was enlisted, which elaborated a grand chapter structure at several preparatory workshops and meetings and also recruited a group of lead authors. In total, more than 80 scientists from 12 countries and all relevant scientific disciplines contributed to the first regional climate change assessment (BACC Author Team, 2008), which underwent a rigorous review process.
In 2011, a second edition of the BACC book was initiated as an update, but also as a complement to the first book, by including new topics like an overview of the changes since the last glaciation and a new section on regional drivers and attribution. The Second Assessment of Climate Change for the Baltic Sea Basin (BACC II Author Team, 2015) was published in 2015, using the same procedures and principles, but with a new steering and author group and under the auspices of Baltic Earth, the successor of BALTEX. Close collaboration with HELCOM was envisaged from the very beginning, with HELCOM using material from both BACC assessments for their own climate change assessment reports (HELCOM, 2007, 2013b).
In 2018, the Baltic Earth Science Steering Group decided to produce a series of new assessment reports, the BEARs, on the current, six Baltic Earth Grand Challenges (i.e. (i) salinity dynamics in the Baltic Sea, (ii) land–sea biogeochemical linkages in the Baltic Sea region, (iii) natural hazards and extreme events in the Baltic Sea region, (iv) sea level dynamics in the Baltic Sea, (v) regional variability in water and energy exchanges, and (vi) multiple drivers for regional Earth system changes; see Baltic Earth, 2017), Earth system models (ESMs), and projections for the Baltic Sea region. The BEARs are comprehensive, peer-reviewed review articles in a journal format, and the update to BACC II (this article) is one of the 10 envisaged contributions summarising the current knowledge on regional climate change and its impacts, knowledge gaps, and advice for future work. For further details about our knowledge on climate change, the reader is referred to the other BEARs. The close collaboration with HELCOM is continued in the joint HELCOM–Baltic Earth Expert Network of Climate Change (EN CLIME), which was assembled to produce a Baltic Earth – HELCOM Climate Change Fact Sheet for the Baltic Sea region (https://helcom.fi/helcom-at-work/groups/state-and-conservation/en-clime/, last access: 15 February 2022; https://baltic.earth/projects/en_clime/index.php.en, last access: 15 February 2022; https://helcom.fi/media/publications/Baltic-Sea-Climate-Change-Fact-Sheet-2021.pdf, last access: 15 February 2022).
Hence, this thematic issue comprises nine BEARs, and in addition, this summary is of the current knowledge about past, present, and future climate changes for the Baltic Sea region (BACC III). In the following, a few keywords characterising the BEARs' contents are listed:
-
Salinity dynamics of the Baltic Sea (Lehmann et al., 2022). Water and energy cycles with focus on Baltic Sea salinity during past climate variability, meteorological patterns at various space and timescales and mesoscale variability in precipitation, variations in river runoff and various types of inflows of saline water, exchange of water masses between various subbasins, and vertical mixing processes. The paper also includes the observed trends of salinity during the last >100 years.
-
Biogeochemical functioning of the Baltic Sea (Kuliński et al., 2021). Terrestrial biogeochemical processes and nutrient loads to the Baltic Sea, transformations of C, N, and P in the coastal zone, organic matter production and remineralisation, oxygen availability, burial and turnover of C, N, P in the sediments, the Baltic Sea CO2 system and seawater acidification, role of specific microorganisms in Baltic Sea biogeochemistry, and interactions between biogeochemical processes and chemical contaminants.
-
Natural hazards and extreme events in the Baltic Sea region (Rutgersson et al., 2022). Extremes in wind, waves, and sea level, sea effect snowfall, river floods, hot and cold spells in the atmosphere, marine heatwaves, droughts, ice seasons, ice ridging, phytoplankton blooms, and some implications of extreme events for society (including forest fires, coastal flooding, offshore windmills, and shipping).
-
Sea level dynamics and coastal erosion in the Baltic Sea region (Weisse et al., 2021). Sea level dynamics and coastal erosion in past and future climates. The current knowledge about the diverse processes affecting mean and extreme sea level changes is assessed.
-
Coupled regional Earth system modelling in the Baltic Sea region (Gröger et al., 2021a). Status report on coupled regional Earth system modelling with a focus on the coupling between atmosphere and ocean and atmosphere and land surface, including dynamic vegetation, ocean, sea ice and waves and atmosphere and hydrological components to close the water cycle.
-
Atmospheric regional climate projections for the Baltic Sea region until 2100 (Christensen et al., 2022). Comparison of coupled and uncoupled regional future climate model projections. As the number of atmospheric scenario simulations of the EURO-CORDEX programme (Kjellström et al., 2018; Teichmann et al., 2018; Jacob et al., 2018) is large, uncertainties can be better estimated, and the effects of mitigation measures can be better addressed compared to earlier assessments.
-
Global climate change (Meier et al., 2022). New projections with a coupled physical–biogeochemical ocean model of future climate, considering global sea level rise, regional climate change, and nutrient input scenarios are compared with previous studies, and the differences are explained by differing scenario assumptions and experimental setups.
-
Climate change and the Baltic Sea ecosystem: direct and indirect effects on species, communities and ecosystem function (Viitasalo and Bonsdorff, 2021). This is a discussion of the impact of past and future climate changes on the marine ecosystem.
-
Human impacts and their interactions in the Baltic Sea region (Reckermann et al., 2022). The interlinking of factors controlling environmental changes. Changing climate is only one of the many anthropogenic and natural impacts that effect the environment. Other investigated factors are coastal processes, hypoxia, acidification, submarine groundwater discharge, marine ecosystems, non-indigenous species, land use and land cover (called natural) and agriculture and nutrient loads, aquaculture, fisheries, river regulations and restorations, offshore wind farms, shipping, chemical contaminants, unexploded and dumped warfare agents, marine litter and microplastics, tourism, and coastal management (called human induced).
1.3 Summary of BACC I and II key messages
The following information is directly cited from the BACC II Author Team (2015).
“The key findings of the BACC I assessment were as follows:
-
The Baltic Sea region is warming, and the warming is almost certain to continue throughout the twenty-first century.
-
It is plausible that the warming is at least partly related to anthropogenic factors.
-
So far, and as is likely to be the case for the next few decades, the signal is limited to temperature and to directly related variables, such as ice conditions.
-
Changes in the hydrological cycle are expected to become obvious in the coming decades.
-
The regional warming is almost certain to have a variety of effects on terrestrial and marine ecosystems – some will be more predictable (such as the changes in phenology) than others.
The key findings of the BACC II assessment […] are as follows:
-
The results of the BACC I assessment remain valid.
-
Significant additional material has been found and assessed. Some previously contested issues have been resolved (such as trends in sea-surface temperature).
-
The use of multi-model ensembles seems to be a major improvement; there are first detection studies, but attribution is still weak.
-
Regional climate models still suffer from biases related to the heat and water balances. The effect of changing atmospheric aerosol load to date cannot be described; first efforts at describing the effect of land-use change have now been done.
-
Data homogeneity is still a problem and is sometimes not taken seriously enough.
-
The issue of multiple drivers on ecosystems and socioeconomics is recognized, but more efforts to deal with them are needed.
-
In many cases, the relative importance of different drivers of change, not only climate change, needs to be evaluated (e.g. atmospheric and aquatic pollution and eutrophication, overfishing, and changes in land cover).
-
Estimates of future concentrations and deposition of substances such as sulfur and nitrogen oxides, ammonia/ammonium, ozone, and carbon dioxide depend on future emissions and climate conditions. Atmospheric warming seems relatively less important than changes in emissions. The specification of future emissions is plausibly the biggest source of uncertainty when attempting to project future deposition or ocean acidification.
-
In the narrow coastal zone, the combination of climate change and land uplift acting together creates a particularly challenging situation for plant and animal communities in terms of adaptation to changing environmental conditions.
-
Climate change is a compounding factor for major drivers of changes in freshwater biogeochemistry, but evidence is still often based on small-scale studies in time and space. The effect of climate change cannot yet be quantified on a basin-wide scale.
-
Climate model scenarios show a tendency towards future reduced salinity, but due to the large bias in the water balance projections, it is still uncertain whether the Baltic Sea will become less or more saline.
-
Scenario simulations suggest that the Baltic Sea water may become more acidic in the future. Increased oxygen deficiency, increased temperature, changed salinity, and increased ocean acidification are expected to affect the marine ecosystem in various ways and may erode the resilience of the ecosystem.
-
When addressing climate change impacts on, for example, forestry, agriculture, urban complexes, and the marine environment in the Baltic Sea basin, a broad perspective is needed which considers not only climate change but also other significant factors such as changes in emissions, demographic and economic changes, and changes in land use.
-
Palaeoecological “proxy” data indicate that the major change in anthropogenic land cover in the Baltic Sea catchment area occurred more than two thousand years ago. Climate model studies indicate that past anthropogenic land-cover change had a significant impact on past climate in the northern hemisphere and the Baltic Sea region, but there is no evidence that land cover change since AD 1850 was even partly responsible for driving the recent climate warming.”
For comparison, the findings of this assessment study can be found in Sect. 8.
1.4 Baltic Sea region characteristics
1.4.1 Climate variability in the Baltic Sea region
The Baltic Sea region (including the Kattegat) is located between maritime temperate and continental sub-Arctic climate zones, in the latitude–longitude box 54–66∘ N × 9–30∘ E (Fig. 1). The climate of the Baltic Sea region has a large variability due to the opposing effects of moist and relatively mild marine airflows from the North Atlantic Ocean and the Eurasian continental climate. The regional weather regimes vary, depending on the exact location of the polar front and the strength of the westerlies, and both seasonal and interannual variations are considerable. The westerlies are particularly important in winter, when the temperature difference between the marine and continental air masses is large.
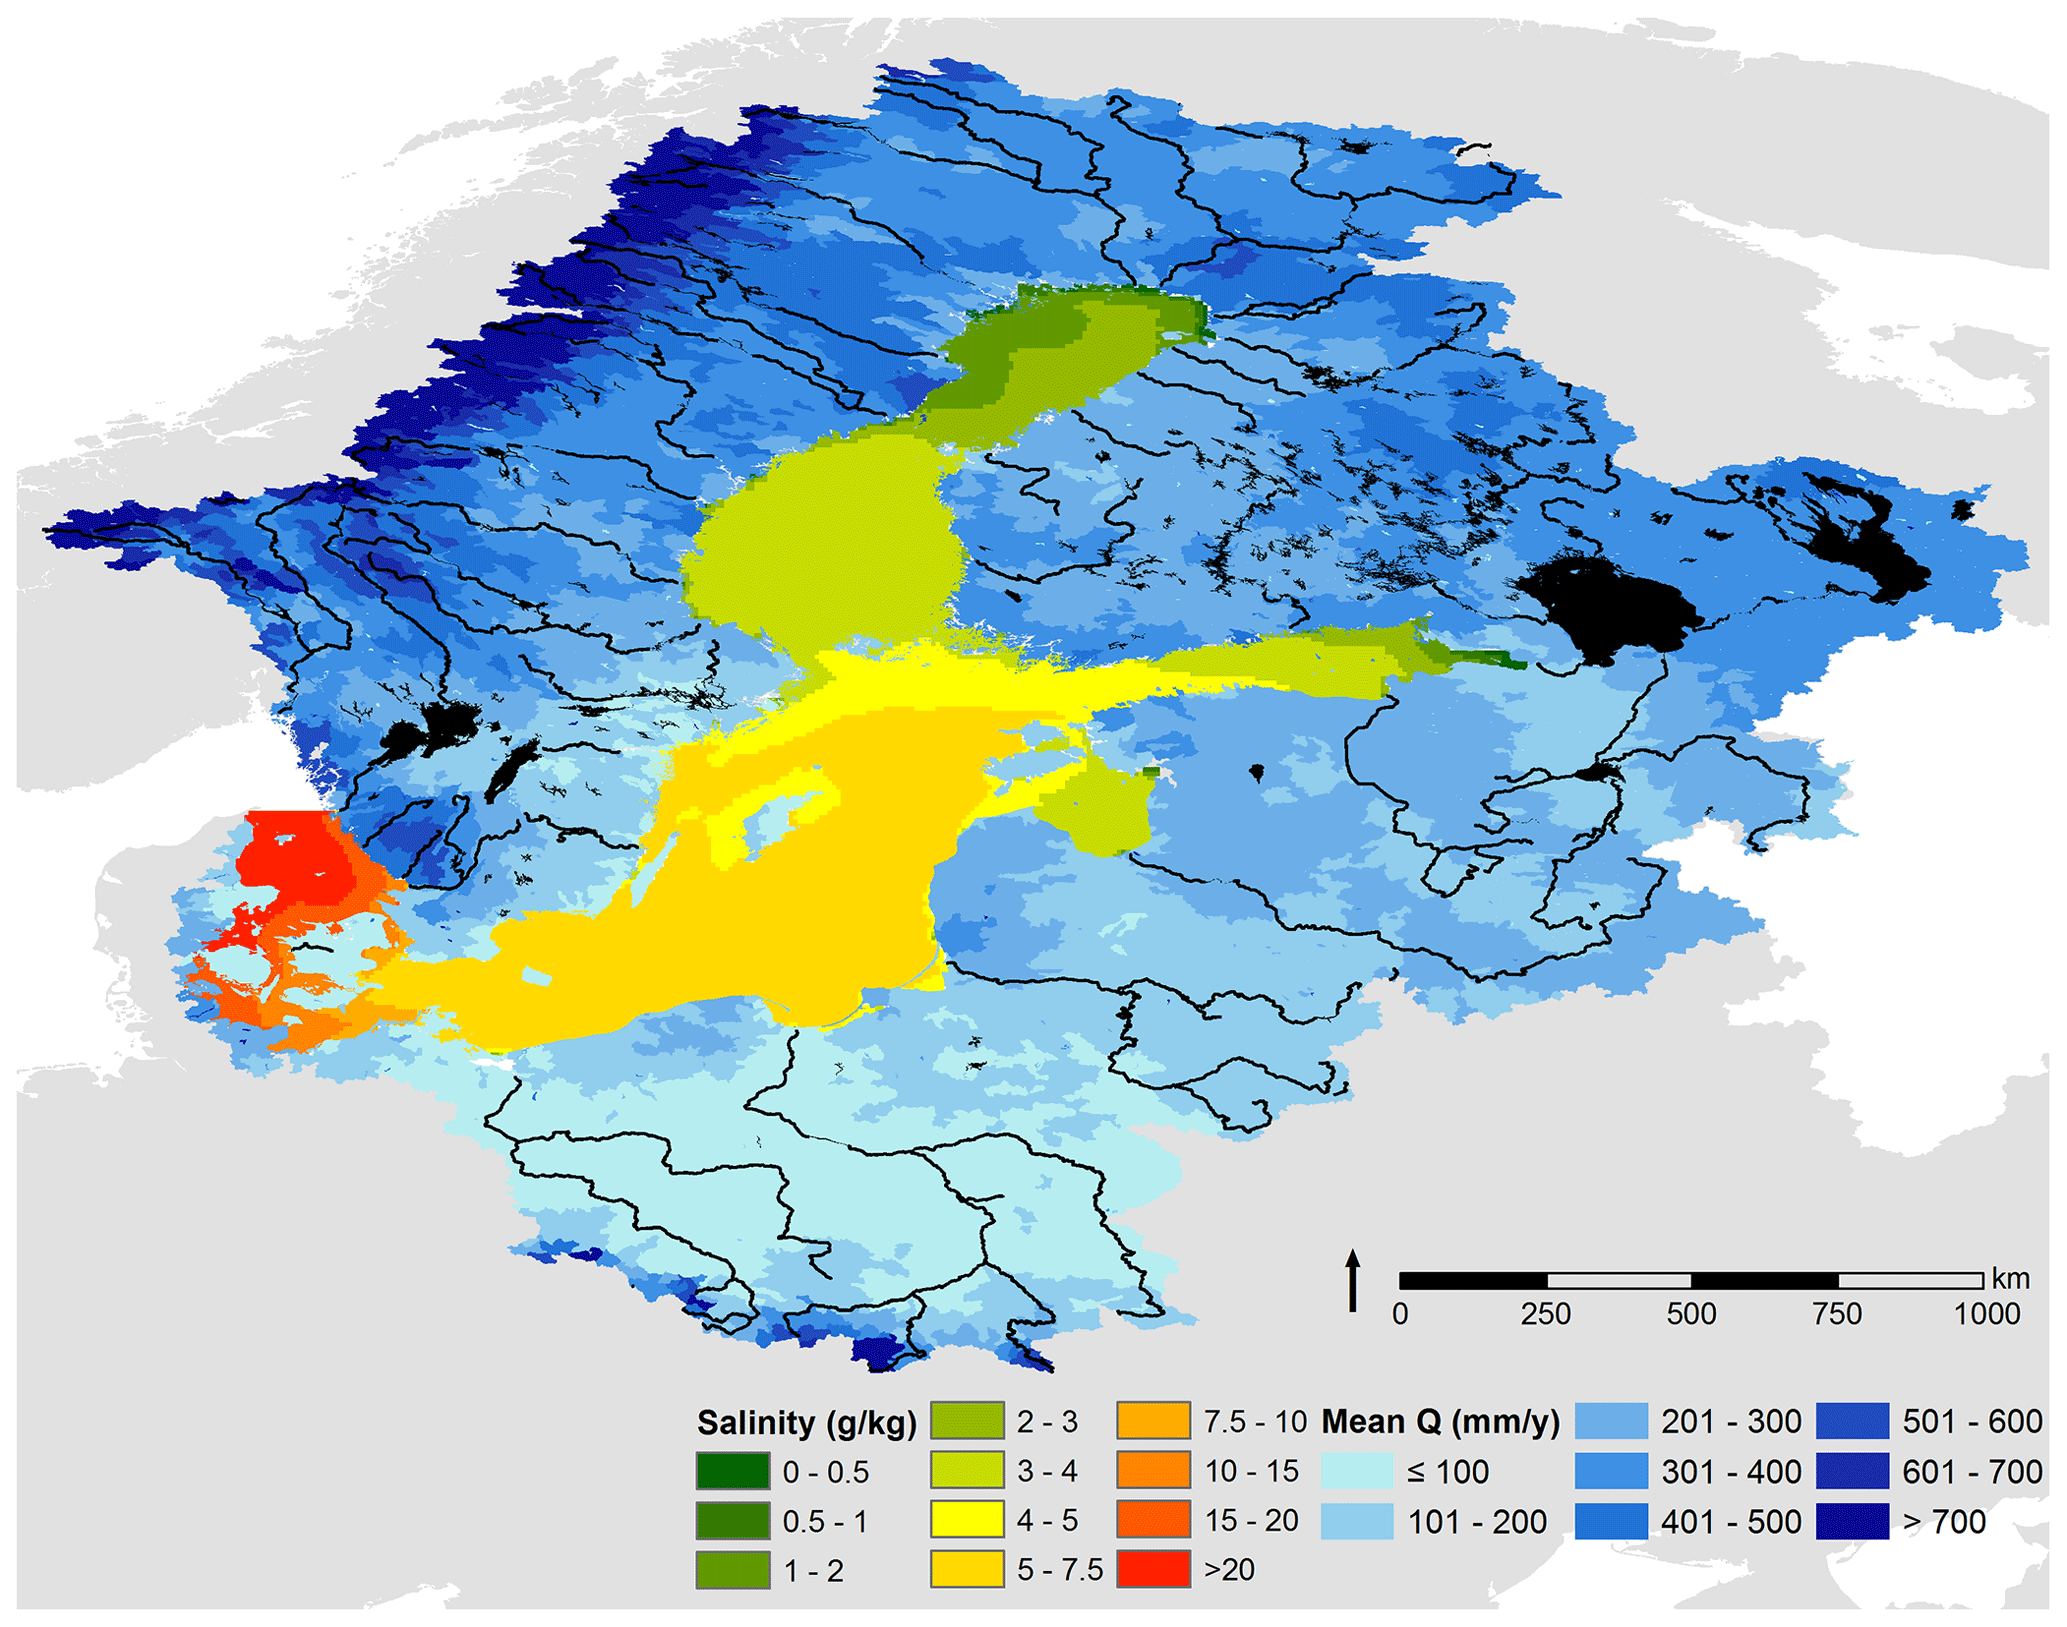
Figure 1The Baltic Sea and its catchment area, with the climatological mean salinity (in grams per kilogram; hereafter g kg−1) and river runoff (in millimetres per year; hereafter mm yr−1) shown. Source: Meier et al., 2014.
The southern and western parts of the Baltic Sea belong to the central European mild climate zone in the westerly circulation. The northern part locates at the polar front and the winter climate is cold and dry due to cold arctic air outbreaks from the east. In terms of classical meteorology, during winter, the polar front fluctuates over the Baltic Sea region, but during summer, it is located farther to the north. Depending on the particular year, the central part of the Baltic Sea can be either on the mild or the cold side of the polar front. The temperature difference between winter and summer is much larger in the north. During warm summers and cold winters, the air pressure field is smooth and winds are weak, and blocking high-pressure situations are common. During such periods, the weather can be very stable for several weeks.
The climate of the Baltic Sea region is strongly influenced by the large-scale atmospheric variability (e.g. Andersson, 2002; Tinz, 1996; Meier and Kauker, 2003; Omstedt and Chen, 2001; Zorita and Laine, 2000; Lehmann et al., 2002). In particular, the North Atlantic Oscillation (NAO), blocking, and, on longer timescales, circulation patterns related to the Atlantic Multidecadal Oscillation (AMO) play important roles for the climate of the Baltic Sea region. The AMO consists of an unforced component, which is the result of atmosphere–ocean interactions (e.g. Wills et al., 2018), and a forced component. It has been shown that external forcing, such as solar activity, ozone, and volcanic and anthropogenic aerosols are also important drivers altering variance and phase of the AMO (Mann et al., 2020, 2021; Watanabe and Tatebe, 2019). However, the relative importance of its forced and unforced components is still debated (Mann et al., 2021).
The NAO is the dominant mode of near-surface pressure variability over the North Atlantic, and its influence is strongest in winter (Hurrell et al., 2003) when it accounts for almost one-third of the sea level pressure variance (e.g. Kauker and Meier, 2003). During the positive (negative) phase of the NAO, the Icelandic Low and Azores High pressure systems are stronger (weaker), leading to a stronger (weaker) than normal westerly flow (Hurrell, 1995). Positive NAO phases are associated with mild temperatures and increased precipitation and storminess, whereas negative NAO phases are characterised by warm summers, cold winters, and less precipitation (Hurrell et al., 2003). Increasing winter temperatures in the Baltic Sea have also been linked to an observed northward shift in the storm tracks (BACC II Author Team, 2015). There is a large interannual to interdecadal variability in the NAO, reflecting interactions with and changes in surface properties, including sea surface temperature (SST) and sea ice cover. This makes it difficult to detect a possible long-term trend in the NAO.
Atmospheric blocking occurs when persistent high-pressure systems interrupt the normally westerly flow over the middle and high latitudes, e.g. the North Atlantic. By redirecting the pathways of midlatitude cyclones, blockings lead to negative precipitation anomalies in the region of the blocking anticyclone and positive anomalies in the surrounding areas (Sousa et al., 2017). In this way, blockings can also be associated with extreme events, such as heavy precipitation (Lenggenhager and Martius, 2019) or drought (Schubert et al., 2014).
The AMO describes fluctuations in North Atlantic SST with a period of 50–90 years (Knight et al., 2006). Thus, only a few distinct AMO phases have been observed in the 150-year instrumental record. A recent model study suggested that variations in the AMO may influence atmospheric circulation that leads to additional precipitation during positive AMO phases over the Baltic Sea region (Börgel et al., 2018). However, the ensemble mean response of the CMIP6 control runs showed an increase in precipitation during negative AMO phases. Furthermore, it was found that the AMO altered the zonal position of the NAO and affected the regional imprint of the NAO for the Baltic Sea region (Börgel et al., 2020).
1.4.2 A unique brackish water basin
The Baltic Sea is a unique brackish water basin in the world ocean which has a salinity less than 24.7 g kg−1 in all areas (Leppäranta and Myrberg, 2009; Voipio, 1981; Magaard and Rheinheimer, 1974; Feistel et al., 2008; Omstedt et al., 2014). The sea is very shallow (with a mean depth of only 54 m) and can be characterised as a number of subbasins (Fig. 2). The Baltic Sea has the only connection to the North Sea through the Danish straits (Fig. 2). The exchange of water between the Baltic Sea and North Sea through the narrow straits is quite limited. The Baltic Sea has a positive freshwater balance, with an average salinity of about 7.4 g kg−1 (e.g. Meier and Kauker, 2003); this is only one-fifth of the salinity of the world ocean, and thus, water masses are brackish. The Baltic Sea is located between mild maritime and continental sub-Arctic climate zones and is partly ice covered in every winter. However, it is completely frozen over only during extremely cold winters. The highly variable coastal geomorphology and the extended archipelago areas make the Baltic Sea unique (see Sect. 5).
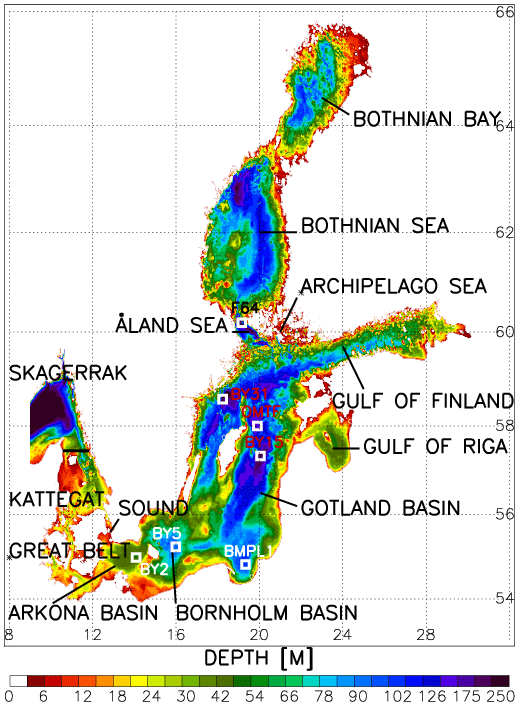
Figure 2The bottom topography of the Baltic Sea and the locations of the monitoring stations of Arkona Deep (BY2), Bornholm Deep (BY5), Gdańsk Deep (BMPL1), Gotland Deep (BY15), Northern Deep (OMTF0286), Landsort Deep (BY31), and Åland Sea (F64). The Baltic proper comprises the Arkona Basin, Bornholm Basin, and Gotland Basin. Data source: Seifert and Kayser (1995); see https://www.io-warnemuende.de/topography-of-the-baltic-sea.html (last access: 5 March 2022).
The world ocean has only four large brackish water basins (Leppäranta and Myrberg, 2009). These are, from the largest to the smallest, the Black Sea (Ivanov and Belokopytov, 2013), located between Europe and Asia Minor, the Baltic Sea, the Gulf of Ob in the Kara Sea (Volkov et al., 2002), and Chesapeake Bay (Kjerfve, 1988), on the east coast of the United States of America. All these sea areas developed into brackish water basins during the Holocene. During the most recent (Weichselian) glaciation period, the Black Sea was a freshwater lake, the Baltic Sea and the Gulf of Ob were under the Eurasian ice sheet, and Chesapeake Bay was a river valley (Leppäranta and Myrberg, 2009). The mean depth of the Black Sea is ∼1200 m, and due to the strong salinity stratification and extremely slow deepwater renewal, the water masses below 200 m are anoxic. The Sea of Azov in the northeastern part of the Black Sea is often frozen during the winter. The Gulf of Ob is the long (800 km), narrow estuary of the River Ob in the Kara Sea in the Russian Arctic and is ice covered in winter. Finally, Chesapeake Bay is a small, very shallow basin and a drowned river valley or ria in the humid subtropical climate zone, with hot summers and ice formation in river mouths in some winters.
Table 4 gives basic information of the brackish water seas and other basins comparable with the Baltic Sea. Most similar to the brackish water seas is Hudson Bay (Roff and Legendre, 1986). It is an oceanic, semi-enclosed basin, with a positive freshwater balance and a salinity of about 30 g kg−1. In contrast, small Mediterranean seas with a negative freshwater balance and salinities above 40 g kg−1 are found in the tropical zone, e.g. the Red Sea and Persian Gulf. The largest lakes are comparable in size to the Baltic Sea, and the Caspian Sea is even larger in volume.
Table 4Comparison of the Baltic Sea with other intracontinental seas and large lakes.

The Baltic Sea basin is a very old geomorphological depression. Prior to the Weichselian glaciation, this basin contained the Eemian Sea, which extended from the North Sea to the Barents Sea, making Fennoscandia an island. At the end of the Weichselian glaciation, 13 500 years ago, the Baltic Ice Lake was formed by glacier meltwater. During the Holocene, fresh and brackish phases followed, dictated by the balance of glacier retreats and progressions, land uplift, and eustatic changes of the global sea level (Tikkanen and Oksanen, 2002). The present brackish phase commenced 7000 years ago, and since about 2000 years ago, the salinity has been close to the present level. Postglacial land uplift has slowly changed the Baltic Sea landscape, making it possible to observe how land rises from the sea and how terrestrial life gradually takes over. People living in the region have adapted to this slow, long-term change.
1.4.3 The Baltic Sea – a specific European sea
The basic features of the European seas reveal key differences in areal extent, depth profile, salinity level, freshwater budget, climate, and tidal motions (Table 5). The Baltic Sea and the North Sea are shallow, with a mean depth of less than 100 m; the Baltic can be described as a coastal sea, with a mean depth of only 54 m. The Black Sea and the Mediterranean Sea are much deeper, with mean depths of approximately 1200 and 1500 m, respectively, whereas the northeastern Atlantic reaches the full oceanic depth of ca. 4 km and fringed by much shallower continental shelf areas at about 400 m. These depth differences influence, among other things, the mixing of the water column, variability in temperature, and distribution of benthic ecosystems (Myrberg et al., 2019).
Table 5Main characteristics of physical features of European seas (Leppäranta and Myrberg, 2009; Sündermann and Pohlmann, 2011; http://www.ospar.org, last access: 8 February 2022; British Oceanographic Data Centre). The greater North Sea – being the neighbouring sea area to the Baltic Sea – is a subregion of the NE Atlantic, but other European subregions are not listed (from Myrberg et al., 2019). Note: N/A is not applicable.
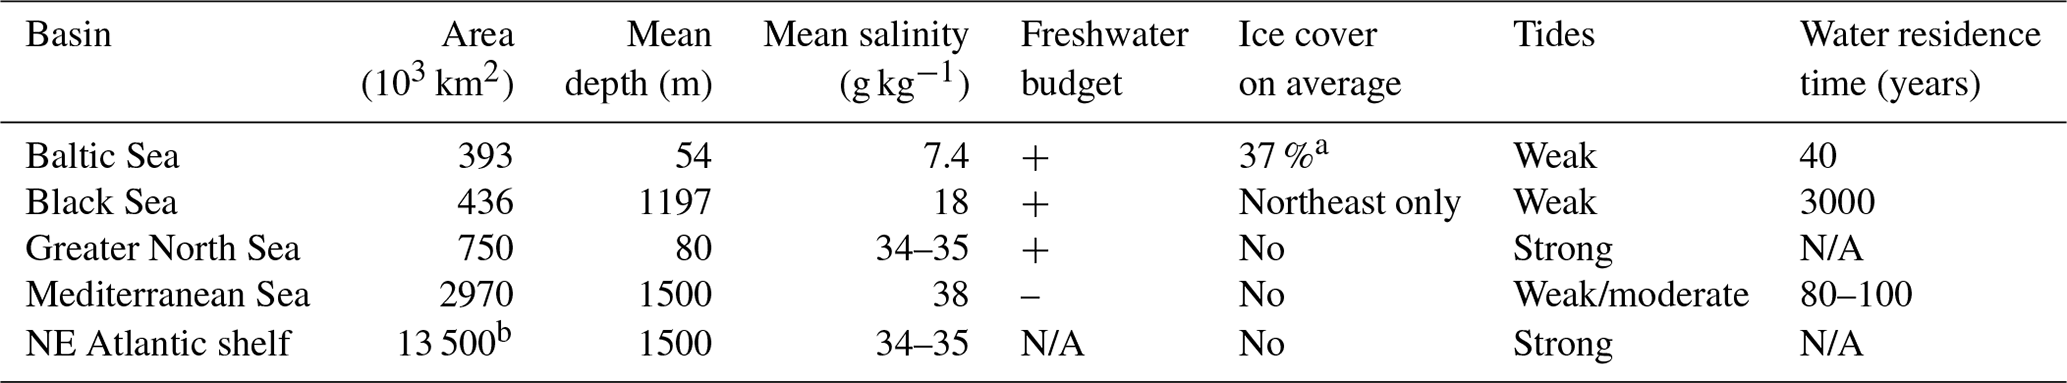
a Mean maximal ice cover between 2000–2017 (see Fig. 14).
b Defined as the OSPAR Convention area, including the greater North Sea.
Among the European seas, the Baltic Sea physics stand out in terms of the small tidal amplitudes, low salinity, strong stratification, and anoxic conditions. Additionally, frequent and spatially extensive upwelling and regular seasonal ice cover are typical of the Baltic Sea (Leppäranta and Myrberg, 2009). We summarise our points as follows:
-
The Baltic Sea is permanently stratified due to a large salinity (density) difference between the fresh upper layer and the more saline bottom layer. This limits ventilation, leading to oxygen deficiency in the bottom layer. For instance, in autumn 2016, some 70 000 km2 of the seabed experienced permanent hypoxia. Irregular Major Baltic Inflows (MBIs; Matthäus and Franck, 1992; Mohrholz, 2018) are the main mechanism transporting oxygen-rich waters from the North Sea to Baltic Sea deeps. The associated salt transport, in turn, intensifies vertical stratification and eventually enlarges the hypoxic area (Conley et al., 2002).
-
In the small, semi-enclosed Baltic Sea, almost any winds are likely to blow parallel to some section of the coast and, thus, cause coastal upwelling. At the Swedish southeastern coast, upwelling occurs 25 %–40 % of time (Lehmann et al., 2012). At times, about one-third of the entire Baltic Sea may be under the influence of upwelling.
-
Among European seas, ice is a unique feature of the Baltic Sea that strongly limits air-sea interaction and modifies the Baltic Sea ecosystem in many ways.
The salinity in the Baltic Sea is not only an oceanographic variable, as in other more ventilated seas, but also integrates the complete water and energy cycles with their specific Baltic Sea features. Baltic Sea salinity, and especially its low mean value and the large variations, is also an elementary factor controlling the marine ecosystem. The salinity dynamics are governed by several factors, including net precipitation, river runoff, surface outflow of brackish Baltic Sea water, and the compensating deep inflow of higher salinity water from the Kattegat. The latter is strongly controlled by the prevailing atmospheric forcing conditions. Due to freshwater supply from the Baltic Sea catchment area and due to the limited water exchange with the world ocean, surface salinity varies from >20 g kg−1 in Kattegat to <2 g kg−1 in the Bothnian Bay and is close to zero at the mouth of the Neva River in the easternmost end of the Gulf of Finland. In the vertical direction, the dynamics of the Baltic Sea are characterised by a permanent, two-layer system because of a pronounced, perennial vertical gradient in salinity. In summer, a shallow thermocline is also formed, complicating the vertical structure.
1.5 Global climate change
In the following, a brief overview is given of the latest global climate assessments, based on the IPCC Fifth (AR5; IPCC, 2014b) and Sixth Assessment Report (AR6; IPCC, 2021a), including results so far available from the current Coupled Model Intercomparison Project (CMIP) phase 6 (Eyring et al., 2016). The focus is on large-scale changes in climate that are of particular relevance for the Baltic Sea region (mainly in the North Atlantic and Arctic regions). Furthermore, whenever feasible, changes are described in terms of pattern scaling, which relies on the fact that, for many quantities, the geographical change patterns are sufficiently consistent across models and scenarios to emerge from the background noise (IPCC, 2014a). Hence, changes in, for example, local temperatures can be scaled to changes per degree Celsius of global mean temperature change relative to a defined historical period, e.g. 1986–2005 for EURO-CORDEX (Christensen et al., 2019).
Our future climate change assessment relies on the concentration-driven scenarios RCP2.6, RCP4.5, and RCP8.5 from the CMIP5 suite (RCP – Representative Concentration Pathway), corresponding to changes in radiative forcing for the 21st century. Hence, policy-targeted goals inspired by the United Nations Framework Convention on Climate Change (UNFCCC; United Nations Climate Change, 2015) to limit global mean warming below 2.0 or 1.5 ∘C compared to the preindustrial level, i.e. prior to the 20th century (the Paris Agreement), are not considered in many scenario simulations but referred to in studies within the EURO-CORDEX framework (Kjellström et al., 2018; Teichmann et al., 2018; Jacob et al., 2018) and for a broader region. In order to achieve the goal of a significant reduction of the risks and impacts of climate change, the Paris Agreement commits the participating countries to aim “to reach global peaking of greenhouse gas emissions as soon as possible” and “to undertake rapid reductions thereafter in accordance with best available science, so as to achieve a balance between anthropogenic emissions by sources and removals by sinks of greenhouse gases in the second half of this century” (United Nations Climate Change, 2015). Furthermore, the countries “should take action to conserve and enhance, as appropriate, sinks and reservoirs of greenhouse gases […], including forests” (United Nations Climate Change, 2015).
RCP8.5 is a totally unmitigated scenario and assumes a radiative forcing of +8.5 W m−2 in the year 2100, as compared to the preindustrial period. Assumptions for RCP8.5 are described in Riahi et al. (2011). RCP8.5 has been criticised because it assumes continued use of coal for energy production, translating into greenhouse gas emissions that are too high (Hausfather and Peters, 2020). Moderate mitigation actions are reflected by RCP4.5 (Thomson et al., 2011), and RCP2.6 was developed for effective mitigation scenarios aiming at limiting global mean warming to ∘C (van Vuuren et al., 2011). With respect to global development, RCP2.6 and RCP8.5 might be unrealistic (Hausfather and Peters, 2020). However, both scenarios can be used as envelopes of plausible pathways of future greenhouse gas emissions or to represent stronger feedbacks in the climate system than assumed in the default derivation of the scenarios.
Confidence levels expressing evidence and agreement are provided, following the definitions of the IPCC (see Sect. 2.3).
1.5.1 Atmosphere
1.5.1(1) Surface air temperature
For the three considered scenarios, the IPCC AR5 (IPCC, 2014a, b; Collins et al., 2013) reported a likely increase in global mean air temperature for the period 2081–2100 relative to 1986–2005 in the likely range (5th to 95th percentile of CMIP5 models) between 0.3 to 1.7 ∘C (RCP2.6), 1.1 to 2.6 ∘C (RCP4.5), and 2.6 to 4.8 ∘C (RCP8.5). The corresponding mean changes are 1.0 ∘C (RCP2.6), 1.8 ∘C (RCP4.5), and 3.7 ∘C (RCP8.5; IPCC, 2014b).
The large-scale geographical patterns of change remain stable among CMIP5 models and are consistent with the results of the IPCC AR4 (IPCC, 2007). The dominant feature is a strong warming of the Arctic north of 67.5∘ N that exceeds global mean warming by a factor of 2.2 to 2.4 as a multi-model mean value. The Arctic warming is strongest for the winter season, when sea ice retreat and reduced snow cover provide positive feedbacks (Arctic amplification), and weakest in summer, when melting sea ice consumes latent heat and the ice-free ocean absorbs heat (IPCC, 2014b). Besides these thermodynamic processes, the lateral transport of latent heat into the Arctic increases under global warming. The weakest warming is found over the Southern Ocean and in the North Atlantic south of Greenland, with minimum values per degree of global warming of about 0.25 ∘C ∘C−1 (Fig. 12.10 in IPCC, 2014b). This is partly due to a deeper ocean mixed layer that promotes vigorous oceanic heat uptake in these regions compared to others. Generally, land masses warm at a rate of 1.4 to 1.7 times more than open ocean regions, leading to a pronounced land–sea pattern in the temperature anomaly. The difference in heat capacity plays some role in the land–sea warming contrast during the transient phase of warming, but it is not its main reason. As first shown by Joshi et al. (2008), the overall land–sea contrast is, to a large extent, caused by the dryness of land surfaces, which makes it impossible for evaporation to increase as much in a warmer climate as it does over the oceans. The mechanistic pathway also involves atmospheric dynamics. For further details, the reader is referred to, for example, Byrne and O'Gorman (2018).
1.5.1(2) Precipitation
Projected global precipitation changes scale nearly linear with global mean temperature changes and range from +0.05 mm d−1 or ∼2 % (RCP2.6) to 0.15 mm d−1 or ∼5 % (RCP8.5; IPCC, 2014a). As a result of an accelerated global water cycle, the contrast between dry and wet regions in annual mean precipitation increases. Likewise, there is high confidence that the contrast between wet and dry seasons will become more pronounced (IPCC, 2014a). In the mid- to high latitudes, yearly mean precipitation generally increases, with the strongest response over the Arctic, exceeding +12 % ∘C−1 almost everywhere. Note that this normalisation is by the global mean warming, as already mentioned above.
Precipitation changes vary greatly among models. High-latitude land masses will likely receive more precipitation due to the higher moisture content of the lower atmosphere and an increased moisture transport from the tropics (IPCC, 2014a). In the Northern Hemisphere, the poleward branch of the Hadley cell will expand farther north, causing a northward expansion of the subtropical dry zone and reducing precipitation in affected regions. Further dynamical changes probably include a poleward shift of midlatitude storm tracks (Seager et al., 2010; Scheff and Frierson, 2012) which is, however, of low confidence, especially for the North Atlantic region (IPCC, 2014a).
1.5.2 Cryosphere
The IPCC AR5 postulates a reduction in the average February Arctic sea ice extent, ranging from 8 % for RCP2.6 to 34 % for RCP8.5. For the monthly mean summer minimum in September, reductions range from 43 % for RCP2.6 to 94 % for RCP8.5. These values are given medium confidence because of biases in the simulation of present day trends and a large spread across models. For September, ice-free conditions are reached before 2090 in 90 % of all CMIP5 models.
The permafrost area is projected to decrease in a likely range from 24±16 % for RCP2.6 to 69±20 % for RCP8.5.
Arctic autumn and spring snow cover are projected to decrease by 5 %–10 % under RCP2.6 and 20 %–35 % under RCP8.5 (high confidence). In high mountain areas, projected decreases in mean winter snow depth are in a likely range of 10 %–40 % for RCP2.6 and 50 %–90 % for RCP8.5. The likely range of projected inland glacier mass reduction (ice sheets excluded) between 2015 and 2100 varies from 18±7 % for RCP2.6 to 36±11 % for RCP8.5. Regions with mostly smaller glaciers (e.g. central Europe and Scandinavia) are projected to lose over 80 % of their current ice mass by 2100 under RCP8.5 (medium confidence), with many glaciers disappearing regardless of future emissions (very high confidence).
1.5.3 Ocean
1.5.3(1) Sea level
For 2081–2100, the global mean sea level (GMSL) is projected to rise between 0.40 m under RCP2.6 (likely range 0.26–0.55 m) and 0.63 m under RCP8.5 (likely range 0.45–0.82 m) relative to 1986–2005 (IPCC, 2014b; their Chapter 13 and Table 13.5). In all scenarios, thermal expansion gives the largest contribution to GMSL rise, accounting for about 30 % to 55 % of the projections. Glaciers are the next largest contributor, accounting for about 15 %–35 %. By 2100, the Greenland Ice Sheet's projected contribution to GMSL rise is 0.07 m (likely range 0.04–0.12 m) under RCP2.6 and 0.15 m (likely range 0.08–0.27 m) under RCP8.5. The Antarctic Ice Sheet is projected to contribute 0.04 m (likely range 0.01–0.11 m) under RCP2.6 and 0.12 m (likely range 0.03–0.28 m) under RCP8.5. The incomplete knowledge about melting of ice sheets is, however, intensively discussed (Bamber et al., 2019).
Based on the same suite of model projections from CMIP5, the IPCC Special Report on the Ocean and Cryosphere in a Changing Climate (IPCC, 2019a) has updated these numbers by including new estimates of the contribution from Antarctica, for which new ice sheet modelling results were available (Oppenheimer et al., 2019). While the differences in projected changes until 2100 are small for RCP2.6, projected changes for RCP8.5 increased by about 10 cm compared to AR5 (see Sect. 3.3.5(4)).
It is important to note that sea level rise will continue in all RCP scenarios. This is made clear by the following quote from IPCC's AR6 (IPCC, 2021a): “In the longer term, sea level is committed to rise for centuries to millennia due to continuing deep ocean warming and ice sheet melt, and will remain elevated for thousands of years (high confidence). Over the next 2000 years, global mean sea level will rise by about 2 to 3 m if warming is limited to 1.5 ∘C, 2 to 6 m if limited to 2 ∘C and 19 to 22 m with 5 ∘C of warming, and it will continue to rise over subsequent millennia (low confidence).”
1.5.3(2) Water temperature and salinity
By the end of the century, the projected global ocean warming ranges from about 1 ∘C (RCP2.6) to more than 3 ∘C (RCP8.5) at the surface and from 0.5 ∘C (RCP2.6) to 1.5 ∘C (RCP8.5) at a depth of 1 km. The subtropical waters of the Southern Ocean and the North Atlantic are projected to become saltier, whereas almost all other regions become fresher, in particular the northern North Atlantic (IPCC, 2014a). The freshening at high latitudes in the North Atlantic and Arctic basin is consistent with a weaker AMOC and a decline in the volume of sea ice, as well as with the intensified water cycles (IPCC, 2019a).
By the end of the century, the annual mean stratification of the top 200 m (averaged between 60∘ S–60∘ N, relative to 1986–2005) is projected to increase in the very likely range of 1 %–9 % for RCP2.6 and 12 %–30 % for RCP8.5 (IPCC, 2019a).
1.5.3(3) Atlantic Meridional Overturning Circulation
Based on the CMIP5 models, the Atlantic Meridional Overturning Circulation (AMOC) is estimated to be reduced by 11 % (1 % to 24 %) under RCP2.6 and 34 % (12 % to 54 %) under RCP8.5. There is low confidence in the projected evolution of the AMOC beyond the 21st century (IPCC, 2014a).
1.5.4 Marine biosphere
By 2081–2100, global net primary productivity relative to 2006–2015 will very likely decline by 4 %–11 % for RCP8.5, due to the combined effects of warming and changes in stratification, light, nutrients, and predation, with regional variations between low and high latitudes (IPCC, 2019a).
Globally, and relative to 2006–2015, the oxygen content of the ocean by 2081–2100 is very likely to decline by 1.6 %–2.0 % for the RCP2.6 scenario or by 3.2 %–3.7 % for the RCP8.5 scenario (IPCC, 2019a). While warming is the primary driver of deoxygenation in the open ocean, eutrophication is projected to increase in estuaries due to human activities and due to intensified precipitation, which increase riverine nitrogen loads under both RCP2.6 and RCP8.5 scenarios, both by the mid-century (2031–2060) and later (2071–2100; Sinha et al., 2017). Moreover, stronger stratification in estuaries due to warming is expected to increase the risk of hypoxia by reducing vertical mixing (IPCC, 2019a; Hallett et al., 2018; Warwick et al., 2018; Du et al., 2018).
1.5.5 Coupled Model Intercomparison Project 6
In this study, the CMIP5, instead of the successor CMIP6, scenario simulation results have been used for the regionalisation of climate change because dynamical downscaling experiments based on CMIP6 projections are still lacking, while the IPCC Sixth Assessment Report (AR6; IPCC, 2021a) relies on the updated generation of ESMs from CMIP6 (Eyring et al., 2016). In CMIP6, RCP scenarios have been replaced by SSP (Shared Socioeconomic Pathway) scenarios, offering a wider range of scenarios than during CMIP5 (Arias et al., 2021). In particular, scenarios aiming to limit global warming to 1.5 and 2.0 ∘C and overshoot scenarios, including negative emissions in the second part of the century, are now available. The lowest of these scenarios, SSP1-1.9, which was designed to limit the global warming to 1.5 ∘C above the preindustrial level, has lower radiative forcing than RCP2.6. For the other SSP scenarios, the effective radiative forcing tends to be slightly higher than for the nominally corresponding RCP scenarios (e.g. SSP5-8.5 is slightly higher than RCP8.5).
A key result in IPCC AR6 (IPCC, 2021a) was the narrowed uncertainty range of the estimated response to an instantaneous doubling of CO2 (equilibrium climate sensitivity – ECS) as a consequence of the improved scientific understanding and accumulation of new data. Largely based on the review by Sherwood et al. (2020), the IPCC AR6 concluded a likely range of 2.5–4∘ C for the ECS.
A subset of the current CMIP6 models have been shown to be more sensitive to greenhouse gases than previous generations of CMIP models. Thus, the ECS is higher in CMIP6 models (1.8–5.6 ∘C) than in CMIP5 models (1.5–4.5 ∘C) and their predecessors (Meehl et al., 2020). Indeed, the first transient simulations with the CMIP6 EC-Earth ESM found stronger warming than with earlier versions, with about half of the increase attributed to differences between CMIP5 and CMIP6 greenhouse gas forcing (Wyser et al., 2020).
However, it turns out that models with the highest projected warmings fail to capture past warming trends well, and therefore, recent studies argue that those models should not be used for climate assessments and policy decisions (Forster et al., 2020; Nijsse et al., 2019; Tokarska et al., 2020; Brunner et al., 2020). Furthermore, systematic errors in many CMIP5 and CMIP6 models prevent the simulation of the observed 1951–2014 summer warming trend in western Europe, and neither a higher resolution nor a better representation of the sea surface is likely to improve this (Boé et al., 2020b).
Despite the differences in model sensitivity between CMIP5 and CMIP6, CMIP6 results generally confirmed the findings of CMIP5 but added value to the uncertainty assessment because of a larger number of participating ESMs. Hence, from the dynamical downscaling of CMIP6 scenario simulations, major changes on our conclusions for the Baltic Sea region cannot be expected. To illustrate differences between CMIP5 and CMIP6, we compare, with the help of the IPCC AR6 interactive atlas (Iturbide et al., 2021; Gutiérrez et al., 2021), applying the land only mask, CMIP5, and CMIP6 results in two regions, northern Europe (NEU) and western and central Europe (WCE), which together comprise a large part of the Baltic Sea region. We assume that this analysis is relevant, although the two selected regions also include other adjacent areas.
The comparison of the two regions for all CMIP5 and all CMIP6 models under RCP8.5 and SSP5-8.5, respectively (about 30 for both experiments), shows for seasonal and annual mean temperature increases at the same global warming levels similar results (Table 6). Notably, the CMIP6 models appear to show a somewhat larger summer warming signal than in CMIP5 and a lower increase in winter temperatures, in particular for higher warming levels. Note that these comparisons are made for warming levels, which means that differences between scenarios, i.e. RCP8.5 and SSP5-8.5, are removed.
Table 6Ensemble mean changes in temperature (degrees Celsius) and precipitation (percent) at selected future global mean surface temperature (GMST) levels (1.5 to 4.0 ∘C) compared to preindustrial (PI) conditions during 1850–1900. Listed are annual (ANN), winter (December to January – DJF), and summer (June to August – JJA) means from CMIP5, CMIP6, and their differences for northern Europe (NEU) and western and central Europe (WCE). N is the number of considered members in the two ensembles. Note that CMIP5 and CMIP6 are driven under RCP8.5 and SSP5-8.5 scenarios, respectively. Data source: IPCC AR6 Interactive Atlas; Iturbide et al., 2021; Gutiérrez et al., 2021; https://interactive-atlas.ipcc.ch/ (last access: 25 November 2021).
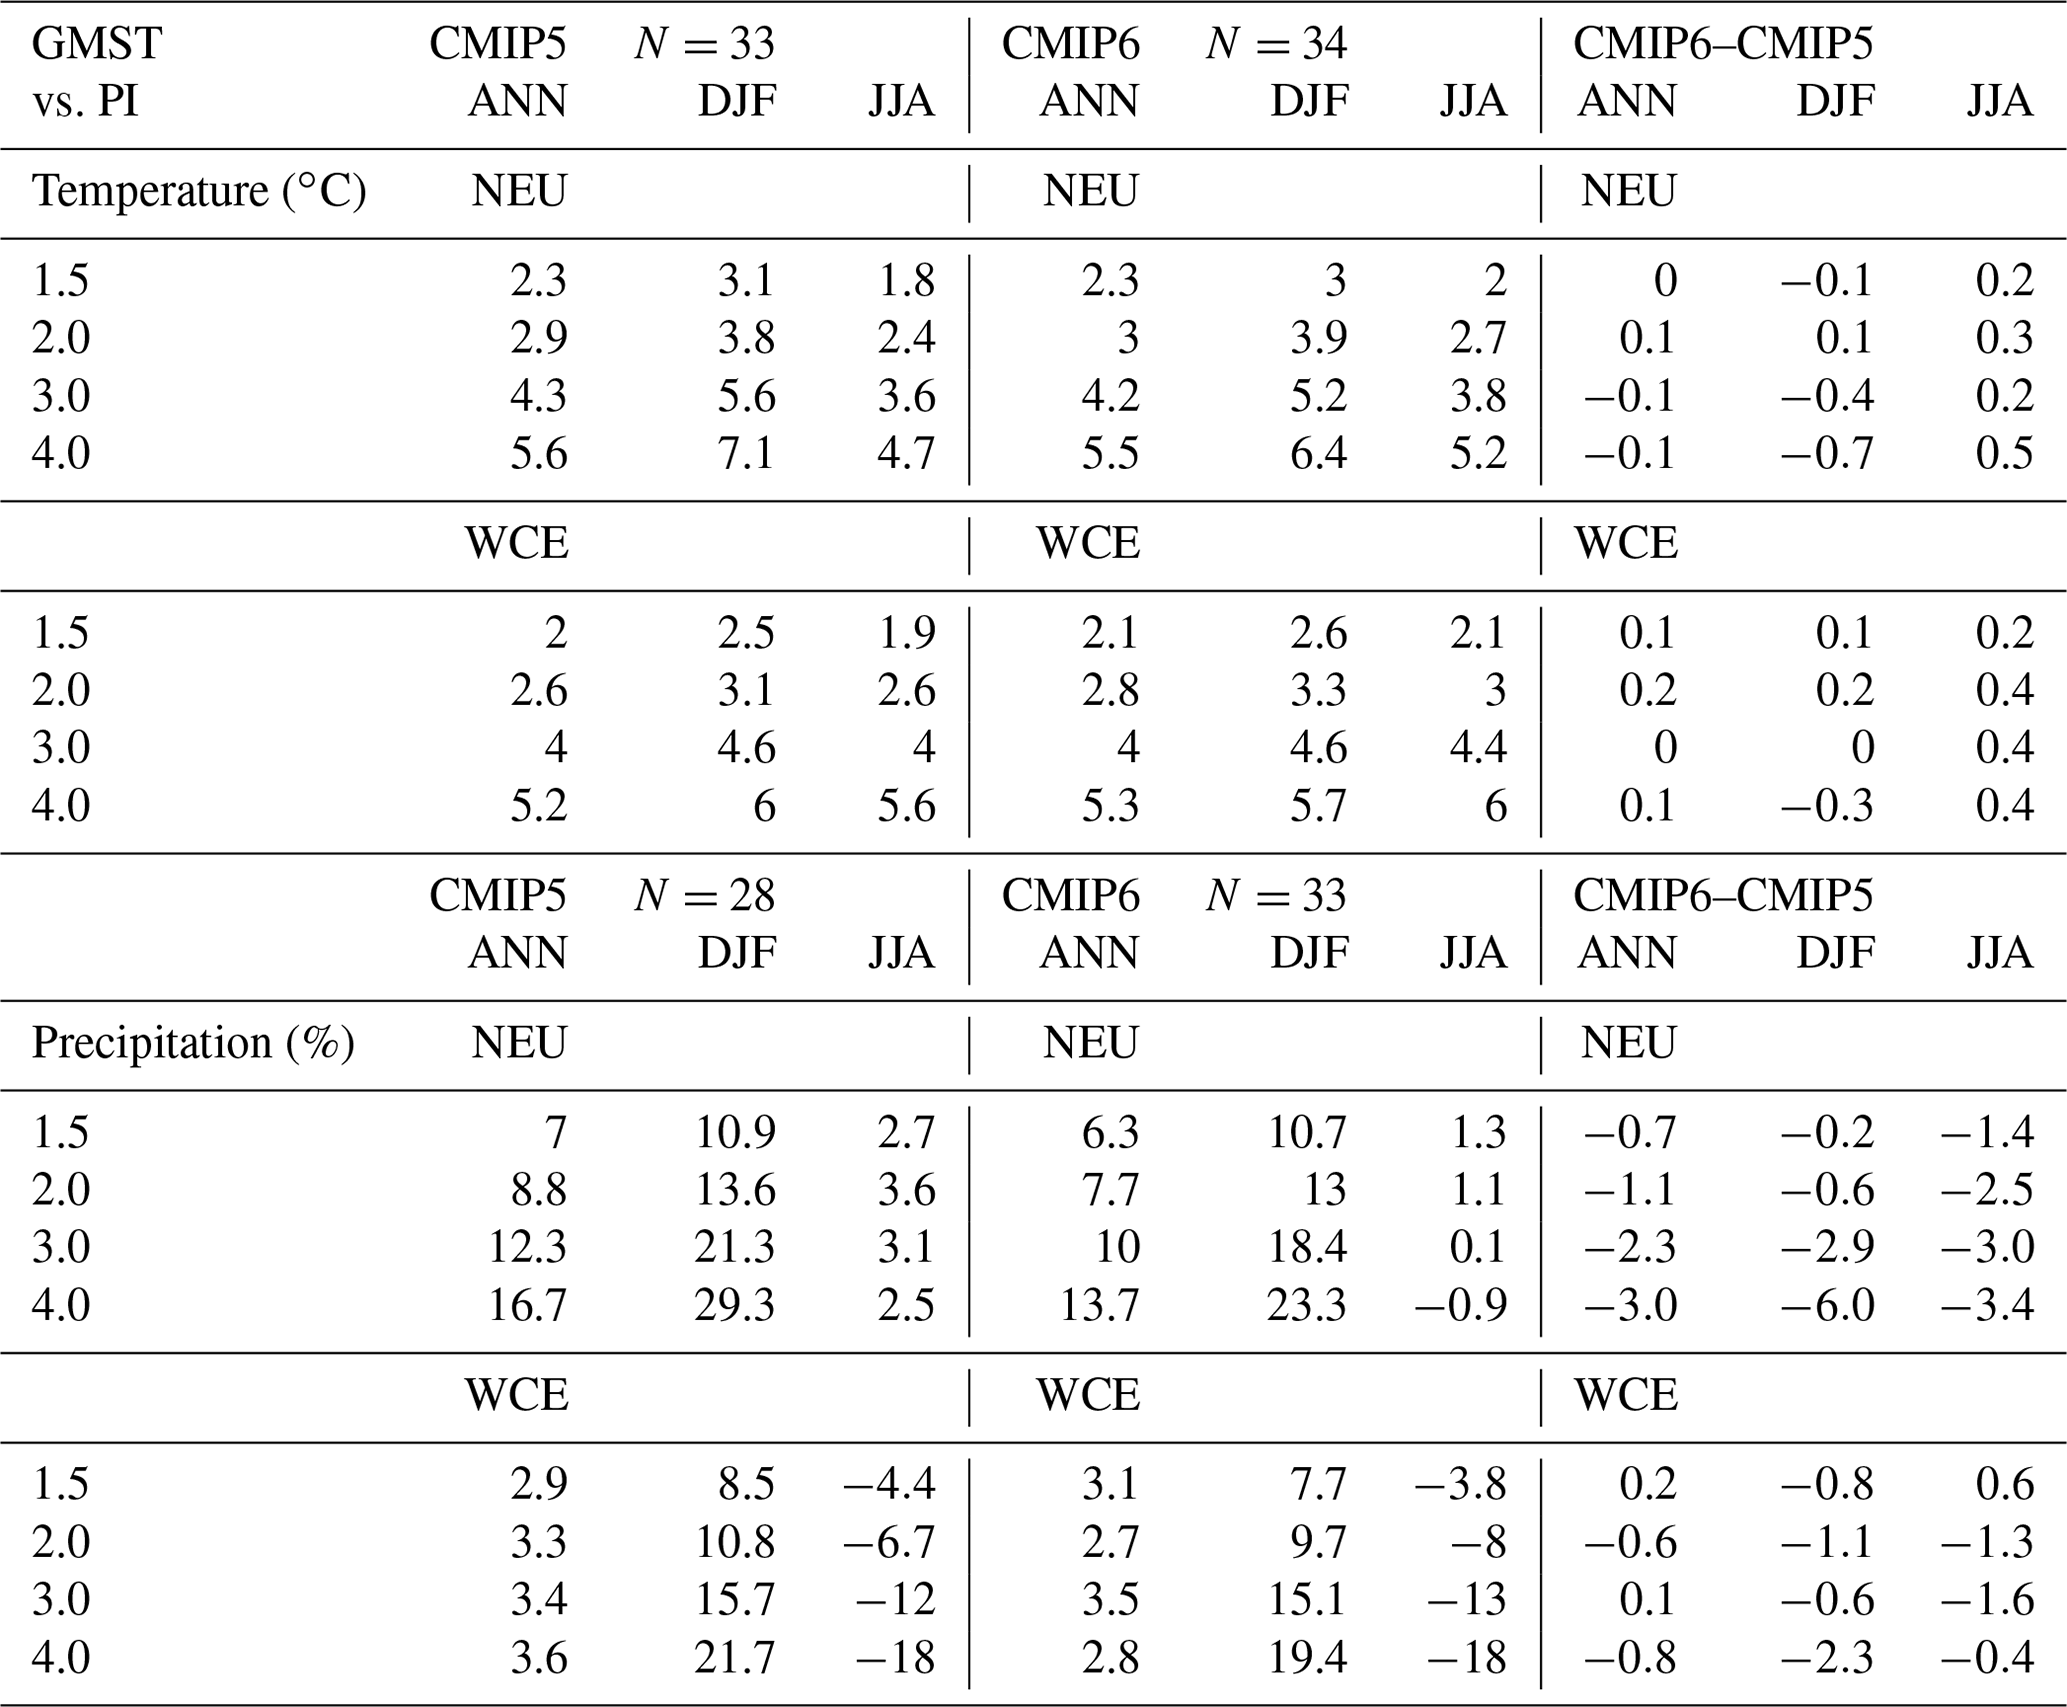
In addition, precipitation changes are similar. Differences in the annual mean precipitation changes between CMIP5 and CMIP6 are less than 3 % (Table 6). Precipitation increase in NEU is somewhat smaller in CMIP6 than in CMIP5. Also, in WCE, the winter precipitation increase is somewhat smaller in CMIP6. In summer, WCE shows even an stronger reduction in precipitation in CMIP6 compared to CMIP5 for all warming levels, apart from +1.5 ∘C.
Also, for various time slices, the differences between temperature and precipitation changes between CMIP5 and CMIP6 models under RCP8.5 and SSP5-8.5, respectively, are relatively small (Table 7). The identified differences can be attributed to differences in ESMs and emission scenarios. The largest differences between CMIP5 and CMIP6 in temperature changes between 1850–1900 and 2081–2100 are found in WCE during summer, with CMIP6 models showing more pronounced warming by 0.9 ∘C than the CMIP5 models. The larger climate change signals in CMIP6 compared to CMIP5 results are confirmed by a subset of ESMs from CMIP5 and CMIP6 analysed by Coppola et al. (2021). During all seasons, the precipitation increases in NEU are somewhat smaller in CMIP6 than in CMIP5, in particular during summer, and the precipitation decrease in WCE during summer is larger (Table 7).
Table 7As in Table 6 but with ensemble mean changes in temperature (degrees Celsius) and precipitation (percent) at selected future time slices (2021–2040, 2041–2060, and 2081–2100) compared to preindustrial (PI) conditions during 1850–1900.

Table 8 also includes scenario simulation results from EURO-CORDEX regional climate models (RCMs), i.e. 47 simulations. Note that the changes are calculated relative to a different reference period (1986–2005) compared to Tables 6 and 7 (1850–1900). Hence, the values of temperature and precipitation changes differ from the other two tables. For EURO-CORDEX, the temperature changes are smaller than in CMIP5, and for precipitation, there is generally a smaller increase during the winter but more positive values during the summer (larger increase in NEU or smaller decrease in WCE). That RCMs may change the results compared to the underlying GCMs also on large regional scales is well known and has previously been shown for different subsets of EURO-CORDEX RCMs (e.g. Sørland et al., 2018; Coppola et al, 2021).
Table 8As in Table 6, with ensemble mean changes in temperature (degrees Celsius) and precipitation (percent) at selected future global mean surface temperature (GMST) levels (1.5 to 4.0∘C) compared to preindustrial (PI) conditions during 1986–2005. In addition to CMIP5 and CMIP6, EURO-CORDEX ensemble mean scenario simulations are also shown. Note that the regional climate models of EURO-CORDEX are driven by different ESMs than the presented ESMs of the CMIP5 ensemble.

In the following, we list selected examples of publications comparing CMIP5 and CMIP6 results, with relevance for the Baltic Sea region. Nie et al. (2019) compared the historical forcings in CMIP5 and CMIP6 simulations. As more CMIP6 models include aerosol–cloud interactions than in CMIP5, the effect of the stronger aerosol forcing results in an approximately 10 % strengthening of the AMOC in the multi-model mean during 1850–1985, which is a larger change than was seen in CMIP5 models before (Menary et al., 2020). Moreno-Chamarro et al. (2021) concluded that the horizontal resolution of the ESMs is more important for the calculation of winter precipitation changes over NEU than the differences between CMIP5 and CMIP6 models. Furthermore, there is robust evidence that CMIP6 models simulate blocking frequency and persistence better than CMIP5 models, presumably because of the higher resolution in CMIP6 models (Schiemann et al., 2020). Li et al. (2021) compared extreme precipitation and drought changes between CMIP5 and CMIP6 models and found differing results in various regions. According to Seneviratne and Hauser (2020) climate change results in extreme temperature and heavy precipitation reveal a close similarity between CMIP5 and CMIP6 ensembles in the regional climate sensitivity of the projected multi-model mean change as a function of global warming, although global (transient and equilibrium) climate sensitivity in the two multi-model ensembles differ. Statistical–empirical downscaling was used by Kreienkamp et al. (2020) to investigate temperature and precipitation changes for Germany using selected ESMs of CMIP5 and CMIP6. The SSTs around the North Atlantic subpolar gyre are better simulated than their CMIP5 predecessors, largely due to the more accurate modelling of the influence of natural climate forcing factors (Borchert et al., 2021). Finally, CMIP6 ESMs generally project greater ocean warming, acidification, deoxygenation, and nitrate reductions but lesser primary production declines than those from CMIP5 under comparable radiative forcing (Kwiatkowski et al., 2020). However, the intermodel spread in net primary production changes in CMIP6 projections increase compared to CMIP5.
2.1 Assessment of the literature
A total of 33 variables representing the components of the Earth system (atmosphere, land, terrestrial biosphere, cryosphere, ocean and sediment, and marine biosphere) of the Baltic Sea region were selected (Table 2). Scientific peer-reviewed publications and reports of scientific institutes since 2013 on past, present, and future climate changes in these variables were assessed by 47 experts (see Table 1 for the author contributions). The year 2013 was chosen as a starting point for the oldest publications because earlier material was already included in the last assessment by the BACC II Author Team (2015). Information about climate change available in the BEARs (Sect. 1.1) was summarised, and cross-references can be found in Table 2.
For the selected 33 variables and even in more general terms, knowledge gaps (Sect. 6) and key messages (Sect. 7) as well as overall conclusions (Sect. 8) were formulated. Key messages, with new information compared to the results of the BACC II Author Team (2015), are marked. The identified changes of the selected variables of the Earth system and their estimated uncertainties, following the definitions of the IPCC reports as outlined in Sect. 2.3, are summarised in Table 15. The attribution of a changing variable to climate change, here the deterministic response to changes in external anthropogenic forcing such as greenhouse gas and aerosol emissions, is illustrated by Fig. 35. This study does not claim to be complete, neither with regard to the limited selection of variables, which characterise the Earth system, nor with regard to the discussed and assessed publications.
The assessment was done without influence from any political, economic, or ideological group or party. The results of the BEARs, including this summary about climate change impacts in the Baltic Sea region, were used by the joint HELCOM–Baltic Earth Expert Network of Climate Change (EN CLIME) for the compilation of the Climate Change Fact Sheet for the Baltic Sea region (see Sect. 1.2).
For further details about the assessment methods, the reader is referred to the BACC Author Team (2008) and the BACC II Author Team (2015).
2.2 Proxy data, instrumental measurements, and climate model data
In addition to selected figures that are reproduced from the literature, for the assessment, previously published datasets were analysed and discussed.
2.2.1 Past climate
For the Holocene climate evolution, palaeo-pollen data with a decadal resolution, reconstructing seasonal temperature and precipitation changes compared to preindustrial climate (Mauri et al., 2015), were analysed (Fig. 3). More accurate tree ring data, resolving annual summer mean temperatures, are available for the past millennium (Luterbacher et al., 2016) and have been discussed here (Fig. 4). For further details, the reader is referred to Sect. 3.1.
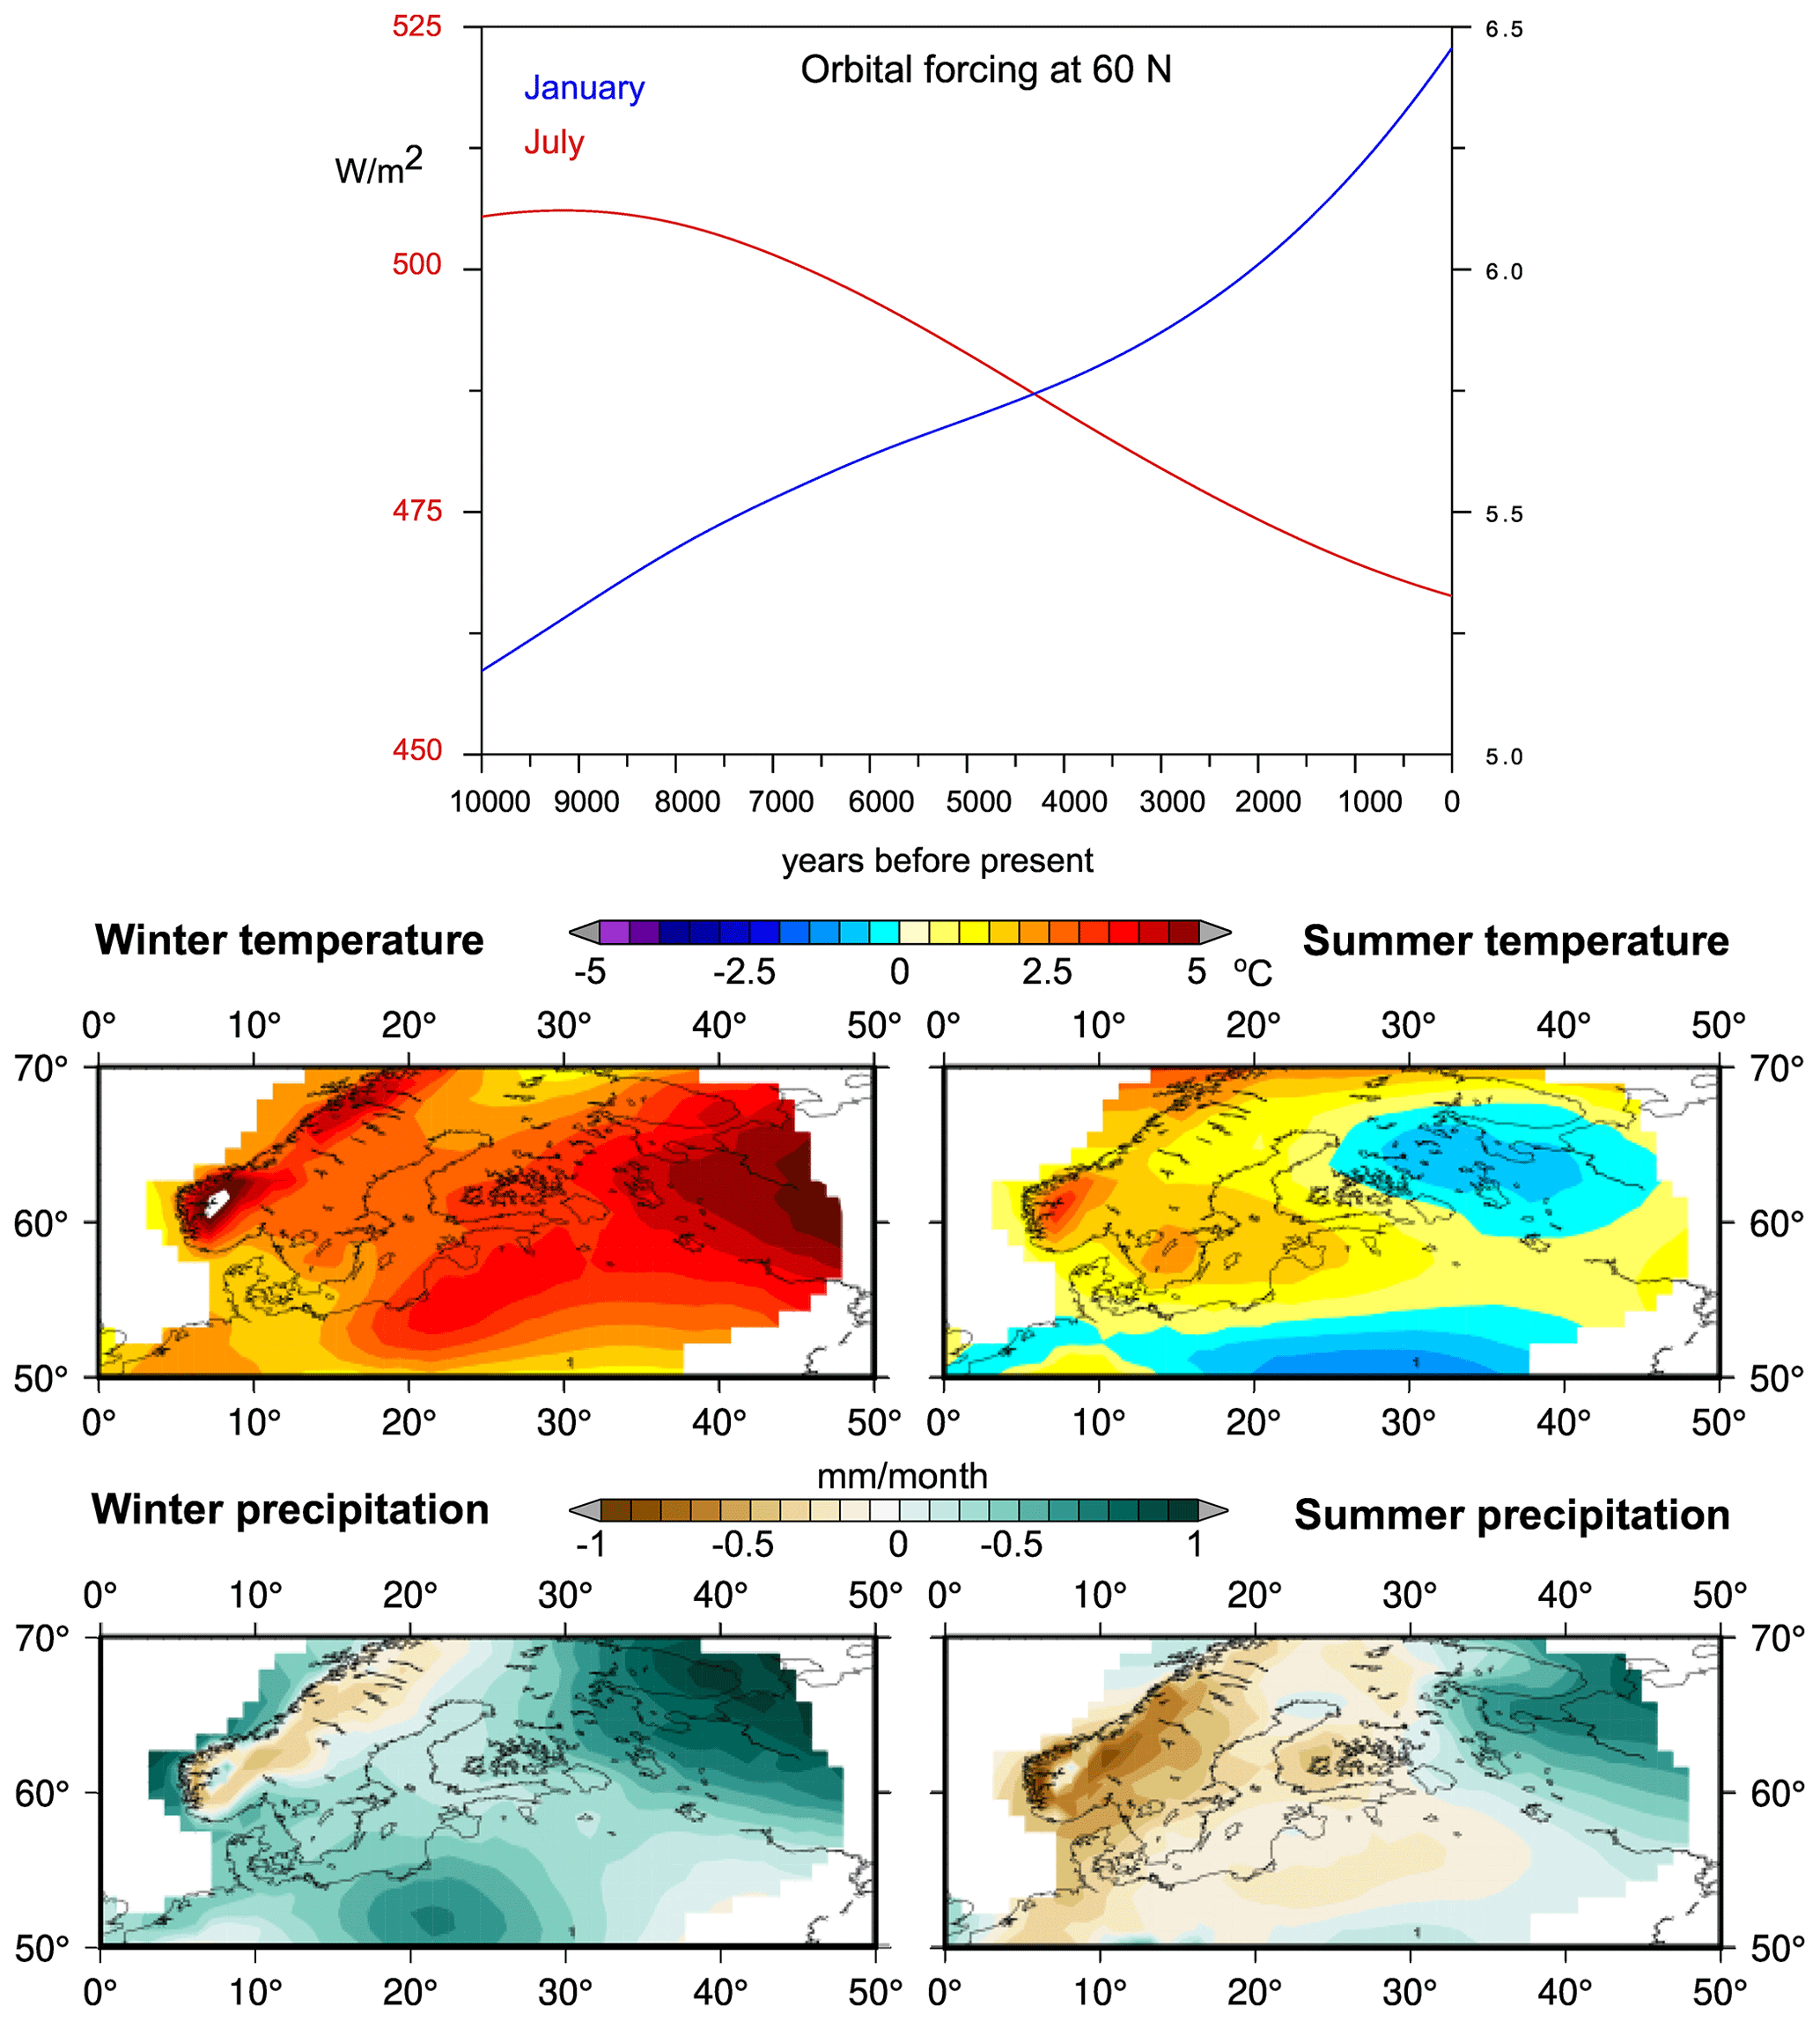
Figure 3Orbital forcing (irradiance) at 60∘ N in January and July and the anomalies of reconstructed seasonal temperature and precipitation compared to preindustrial climate in the Baltic Sea region at the Mid-Holocene Optimum (6000 BP). Data source: irradiance data by Laskar et al. (2004) and temperature and precipitation data by Mauri et al. (2015).
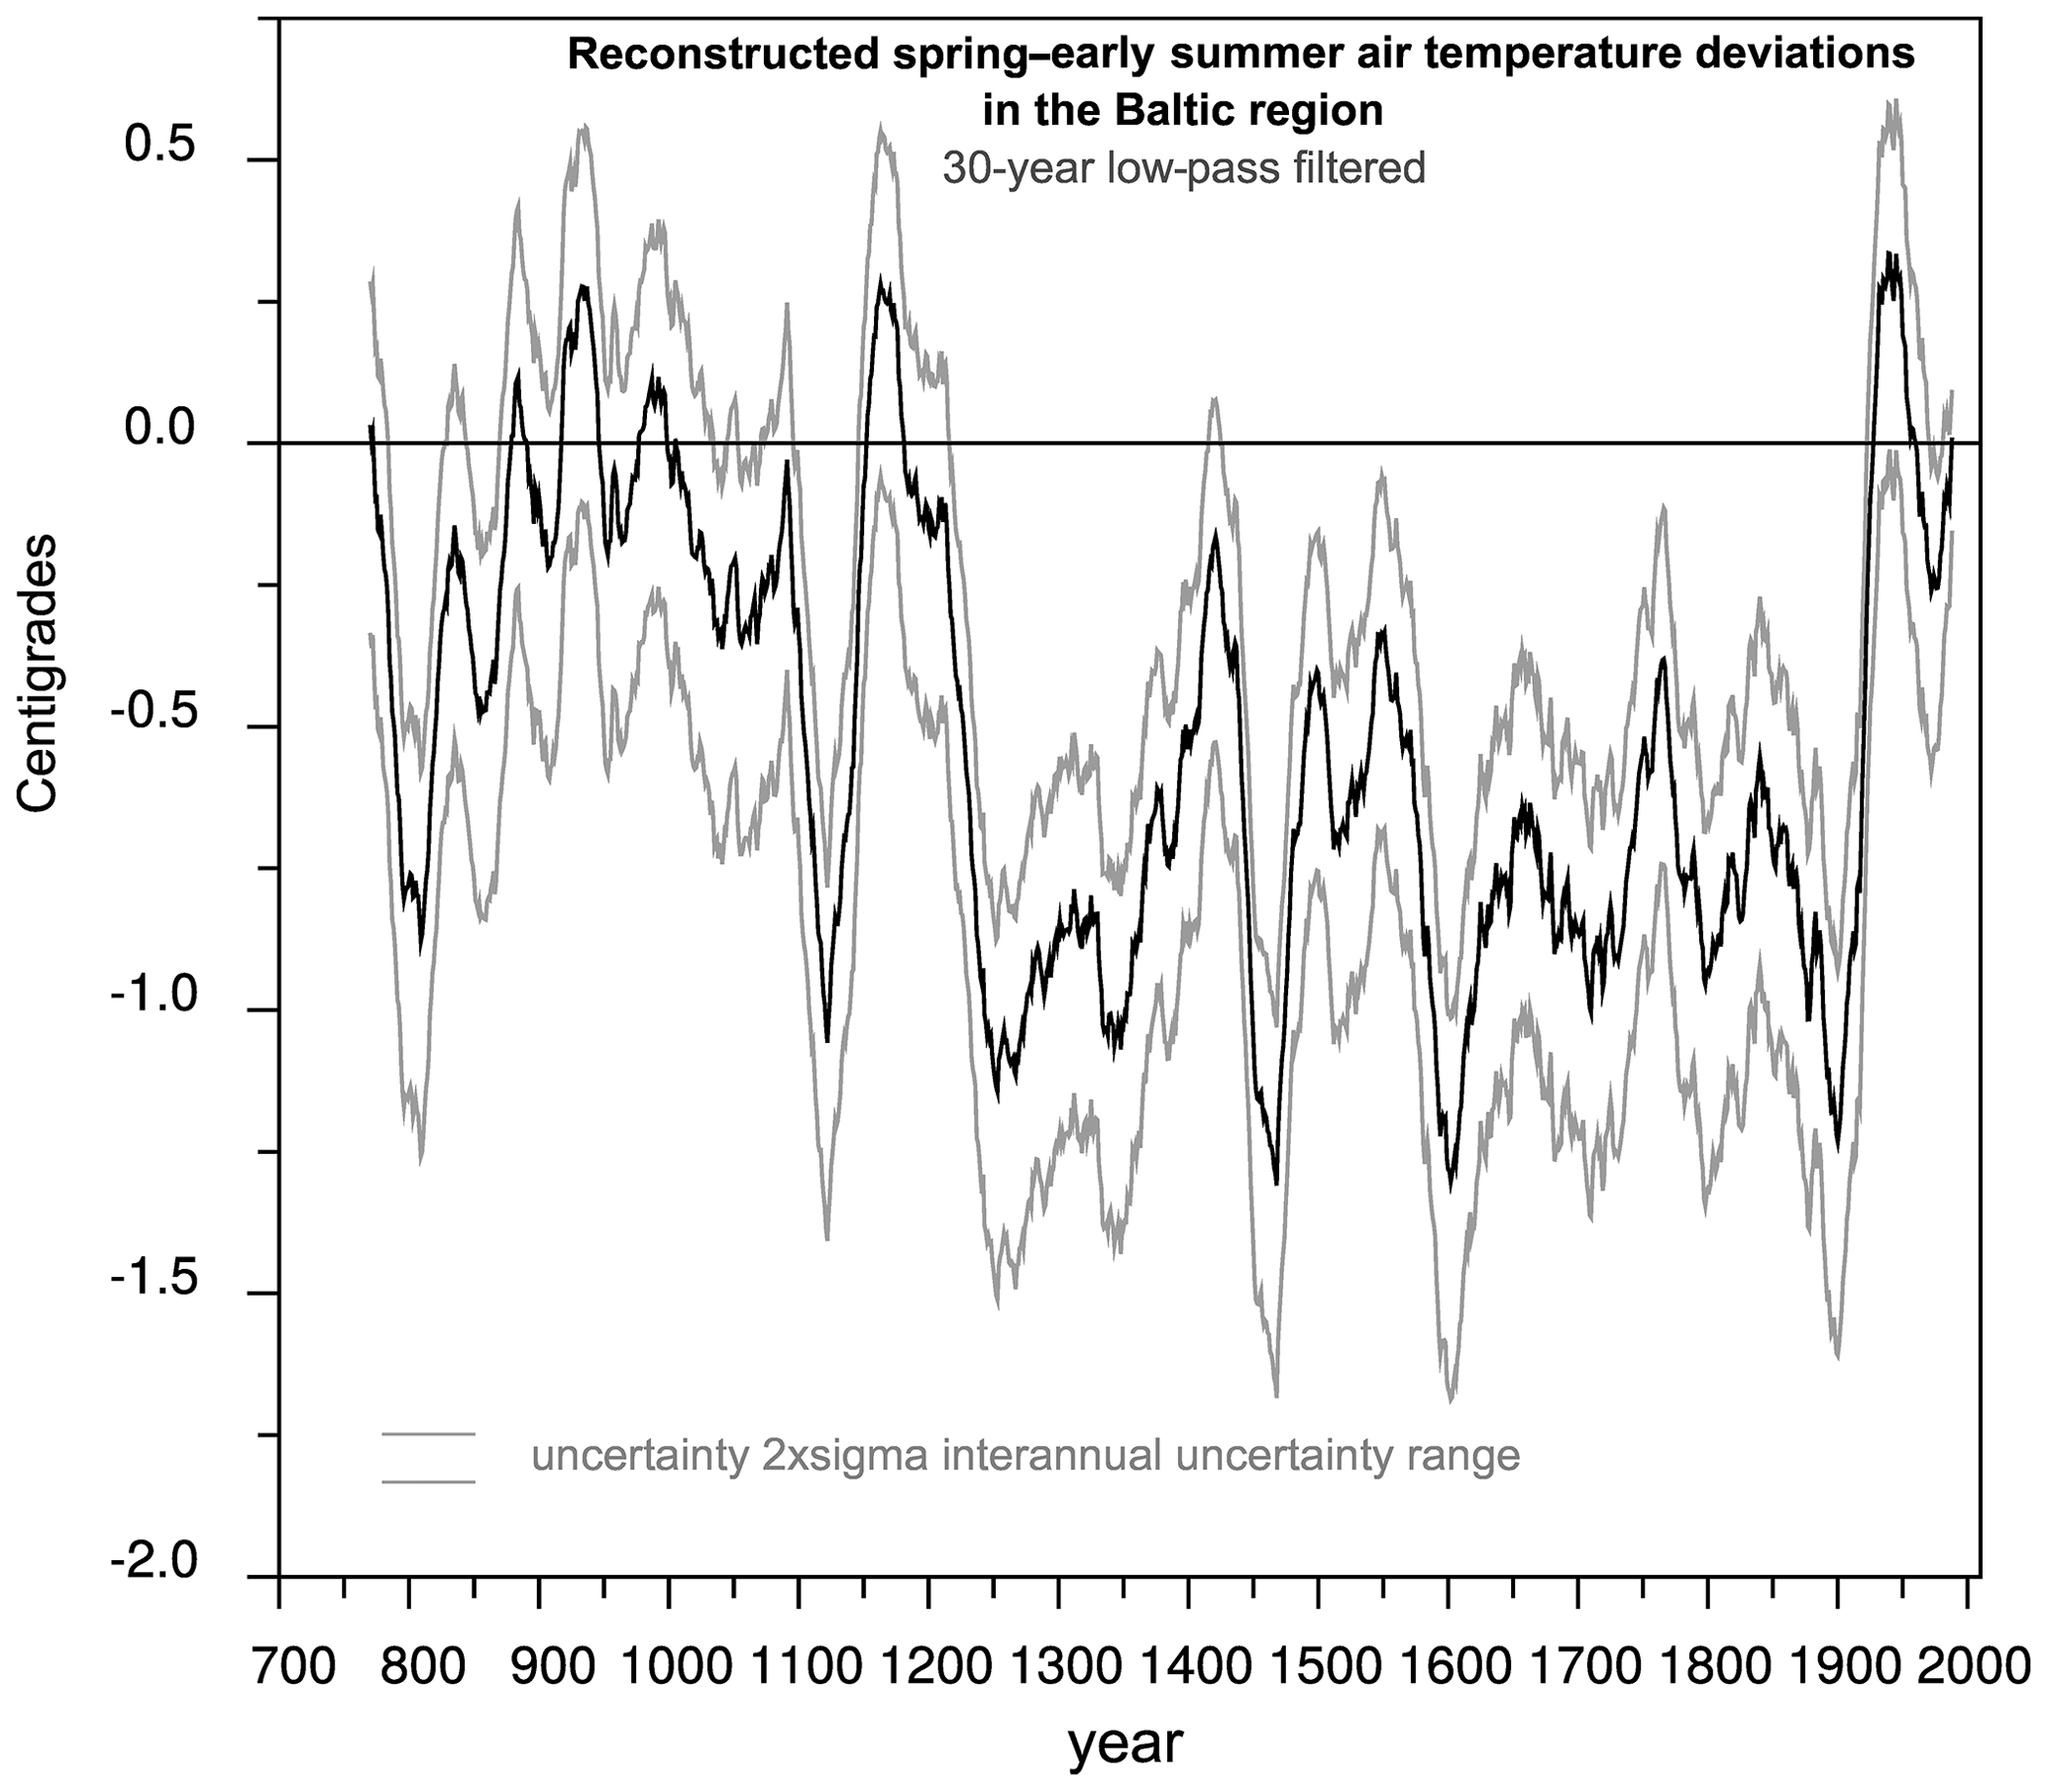
Figure 4Reconstructed spring–early summer air temperature deviations in the Baltic Sea region (land areas in the box 0–40∘ E × 55–70∘ N; deviations from the 20th century mean). The record is smoothed by a 30-year low-pass filter. The approximate uncertainty range has been estimated here from the data provided by the original publication at interannual and grid cell scale. Data source: Luterbacher et al. (2016).
2.2.2 Present climate
Historical station data of sea level pressure and SST were used to calculate climate indices such as the NAO (sea level pressure differences; Fig. 5) and the AMO (SST anomalies; Fig. 6), describing decadal to multidecadal variability in the large-scale atmospheric circulation. Furthermore, selected records of variables such as air temperature (Fig. 8), river runoff (Fig. 10), land nutrient inputs (Fig. 11; Table 10), glacier masses (Fig. 12; Table 11), maximum sea ice extent (Fig. 14), ice thickness data (Figs. 15 and 16), length of the ice season (Fig. 17), sea level (Fig. 24), and gridded datasets of air temperature, e.g. the land-based CRUTEM4 data (Jones et al., 2012; Fig. 7; Table 9), and of precipitation, e.g. Copernicus data (Fig. 9), were analysed.
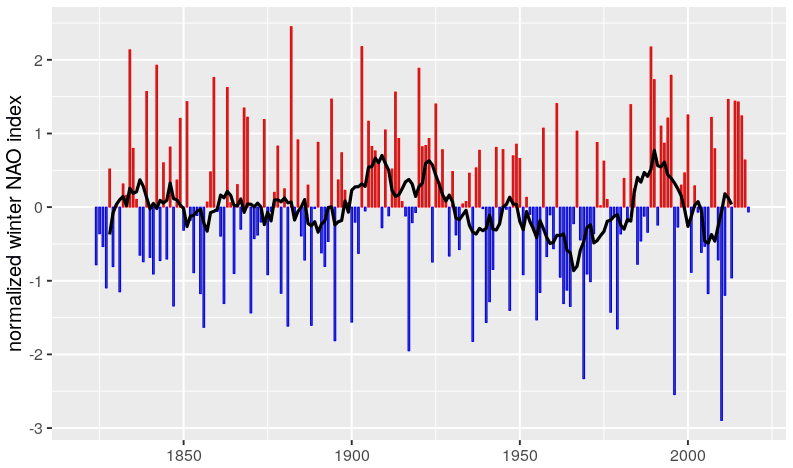
Figure 5Normalized winter (December through March – DJFM) mean NAO index during 1821/1822–2018/2019. Red – positive; blue – negative; black – 10-year running mean. The normalisation is the (data mean (data))/standard deviation (data). Data source: https://crudata.uea.ac.uk/cru/data/nao/nao.dat (last access: 17 February 2022).
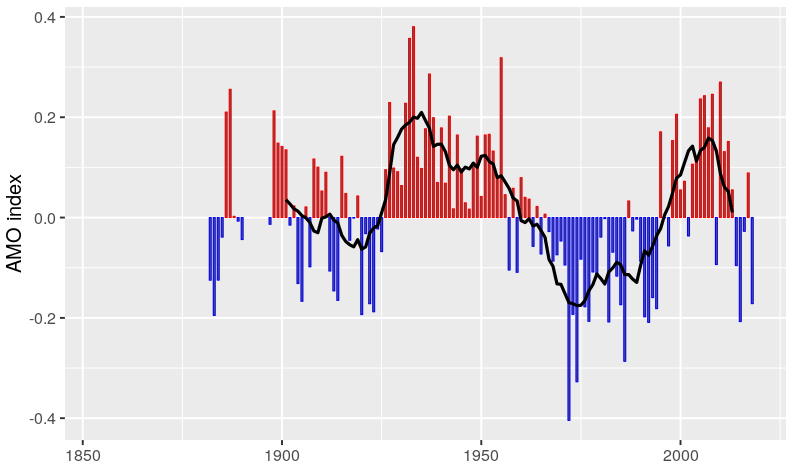
Figure 6Normalized annual mean AMO index during 1882–2018. Red – positive; blue – negative; black – 10-year running mean. The normalisation is the (data mean (data))/standard deviation (data). Data source: https://climexp.knmi.nl/data/iamo_hadsst_ts.dat (last access: 17 February 2022).
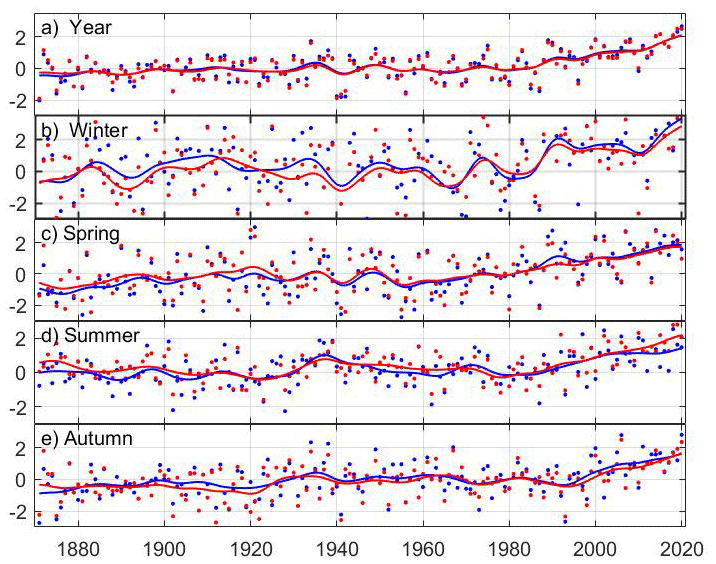
Figure 7Annual and seasonal mean near-surface air temperature anomalies for the Baltic Sea basin for 1871–2020. The baseline period is 1961–1990. Blue and red show the Baltic Sea basin region north and south, respectively, of 60∘ N. Dots are the individual years, and smoothed curves show the variability on timescales longer than 10 years. Data source: CRUTEM4v dataset (Jones et al., 2012).
For the Baltic Sea, intensive environmental monitoring started more than 100 years ago. In 1898, an agreement between various Baltic Sea countries on simultaneous investigations on a regular basis at a few selected deep stations was signed, and in 1902 the International Council for the Exploration of the Sea (ICES) started its work. Examples from the national monitoring programmes for water temperature (Figs. 18–20) and salinity (Figs. 21 and 22) are shown, illustrating climate variability and climate change of the Baltic Sea.
In addition, some institutes, such as the Swedish Meteorological and Hydrological Institute (SMHI), provide environmental/climate indices, e.g. averaged sea level station data corrected for land uplift (Fig. 23) and hypoxic and anoxic areas (Fig. 25).
Since 1979, satellite data have become available, complementing traditional Earth observing systems and having the advantage of a spatially high resolution (e.g. Karlsson and Devasthale, 2018).
Atmospheric reanalysis products, i.e. the combination of model data and observations (e.g. NCEP/NCAR, ERA40, ERA-Interim, ERA5, and UERRA), were important for calculating the water and energy budgets of the Baltic Sea region (BACC Author Team, 2008; BACC II Author Team, 2015). More recently, ocean reanalysis products have also been developed (e.g. Liu et al., 2017, 2019; Axell et al., 2019) and were, for instance, used for the evaluation of models (e.g. Placke et al., 2018).
Furthermore, various gridded datasets for North Sea SSTs exist and were compared (Fig. 34).
All datasets presented here are publicly online available. For further details on various datasets, the reader is referred to Rutgersson et al. (2022).
Table 9Linear surface air temperature trends (in Kelvin per decade) for the period 1878–2020 over the northern (>60∘ N) and southern (<60∘ N) Baltic Sea drainage basin (1878–2020 is selected for comparison with Rutgersson et al., 2014, with an equally long time period). Trends are significant at p<0.05. Data are from the updated CRUTEM4v dataset (Jones et al., 2012). Data source: CRUTEM4v dataset (Jones et al., 2012).
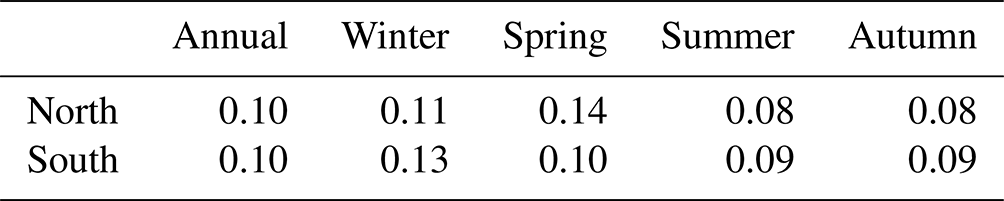
Table 10Average (2013–2017) riverine and coastal nutrient inputs (103 t N (P) yr−1) to the major basins of the Baltic Sea. For abbreviated basin names, see Fig. 11. TN and TP are total nitrogen and total phosphorus inputs, respectively. Data source: updated from Savchuk (2018); see https://www.researchgate.net/publication/358726567_Long-term_times-series_of_the_annual_N_and_P_pools_in_the_major_basins_of_the_Baltic_Sea_1970-2020 (last access: 6 March 2022).
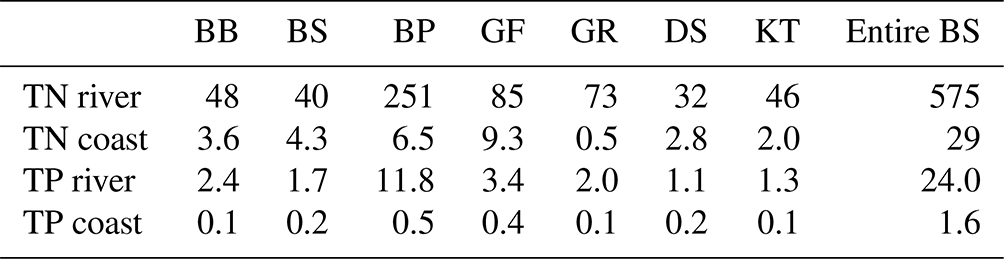
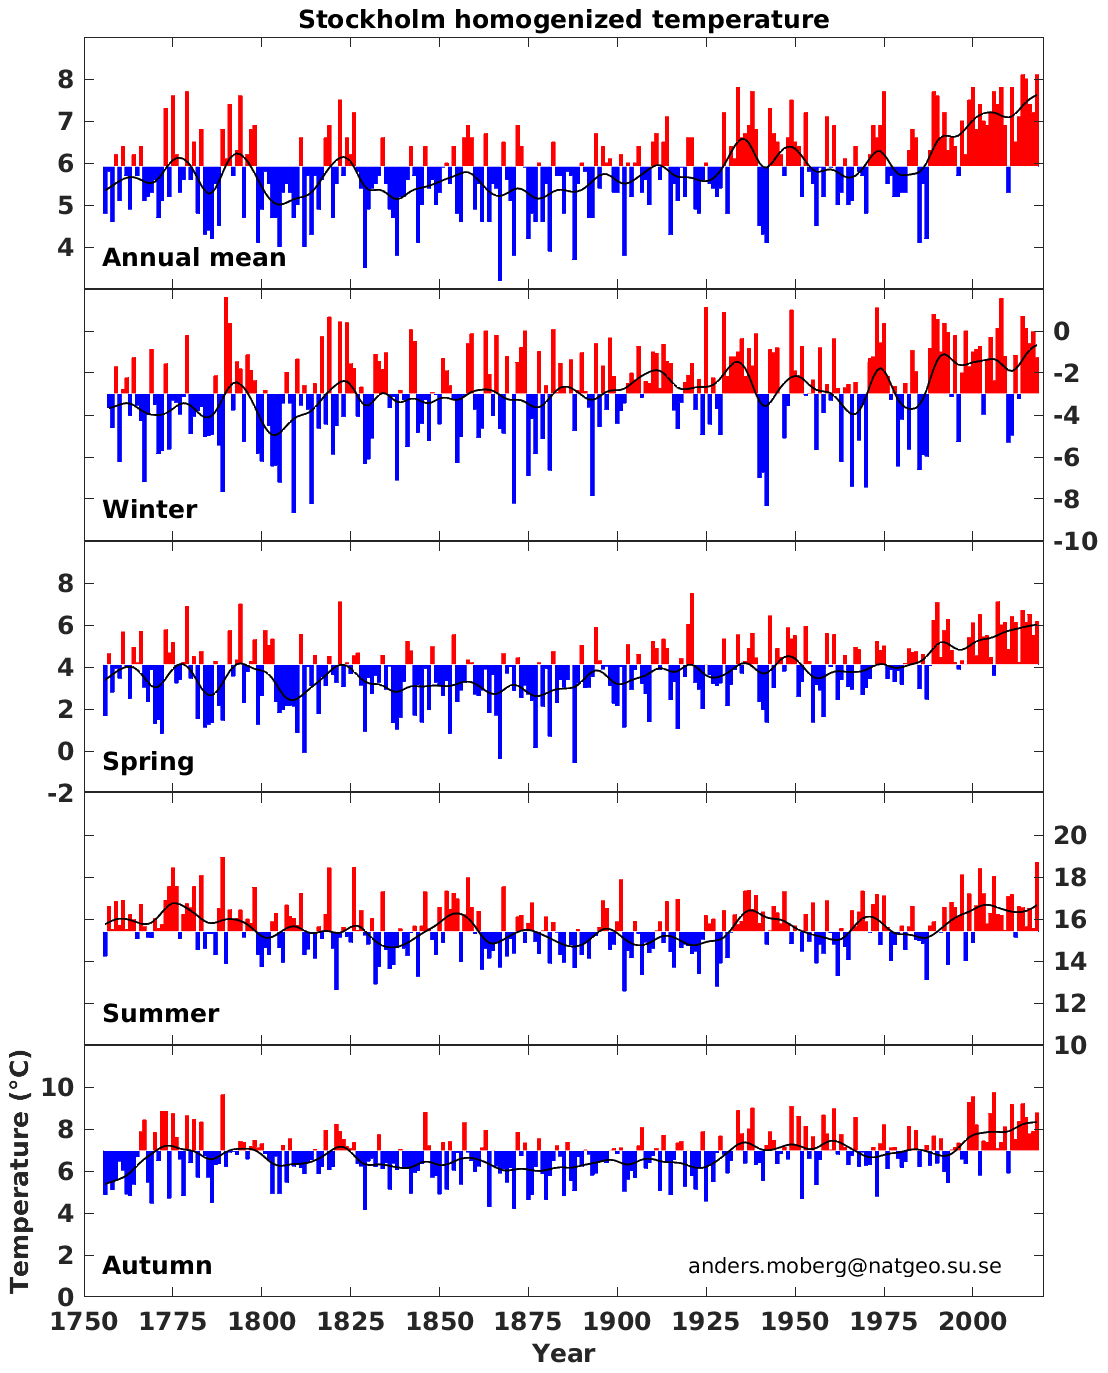
Figure 8Homogenised annual and seasonal mean temperature in Stockholm during 1756–2018. Each coloured bar shows the annual mean temperature, in red or blue, depending on whether the temperature is above or below the average during the reference period 1961–1990. The black curve represents smoothed 10-year mean temperatures. Source: https://bolin.su.se/data/stockholm-historical-temps-monthly (last access: 17 February 2022); Anders Moberg, Stockholm University, Sweden.
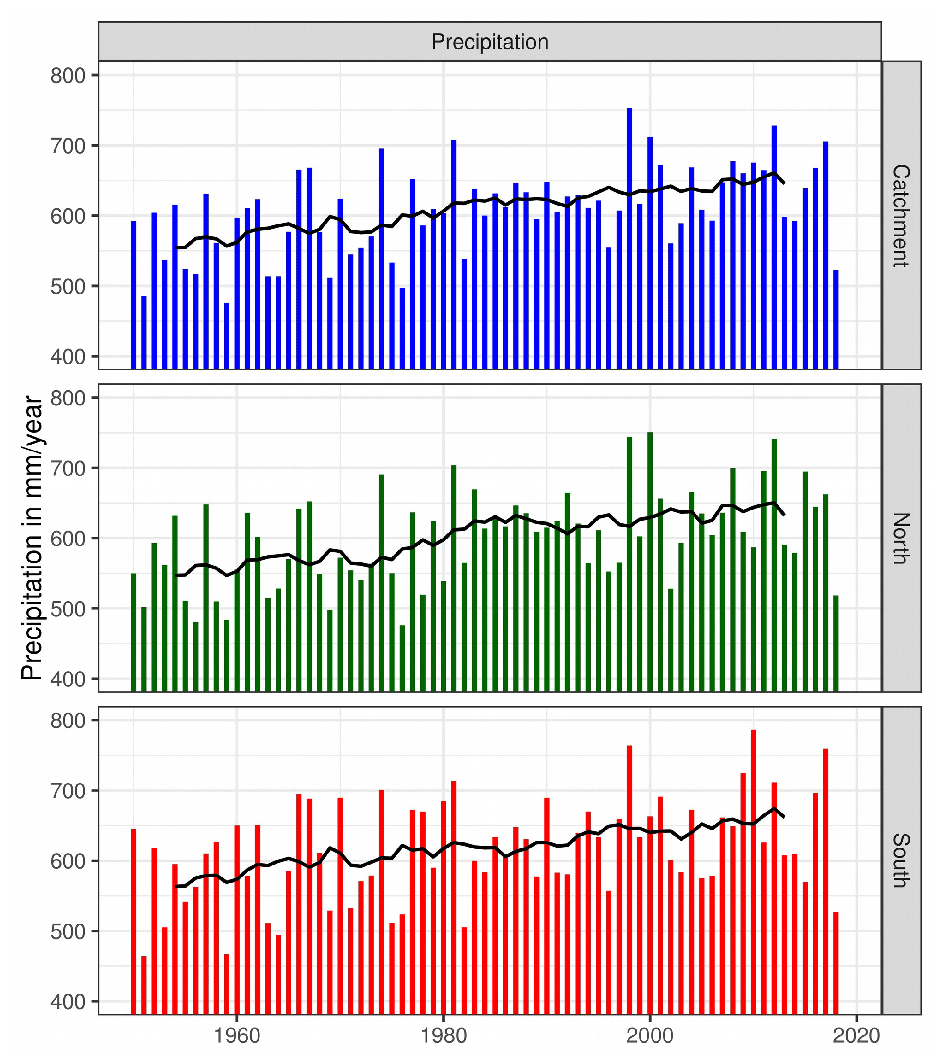
Figure 9Mean annual precipitation over land in millimetres per year (hereafter mm yr−1) in the Baltic Sea catchment area during 1950–2018. Blue is the whole catchment area, green is the area north of 59∘ N, red is the area south of 59∘ N, black is the 10-year running mean, and the bars are the annual sum. Data source: http://surfobs.climate.copernicus.eu/dataaccess/access_eobs.php#datafiles (last access: 17 February 2022). Trends are as follows: 1.44 mm yr−1 (total), 1.51 mm yr−1 (north), 1.37 mm yr−1 (south), and significant at 99 %, using the phase-scrambling method (Kniebusch et al., 2019b).
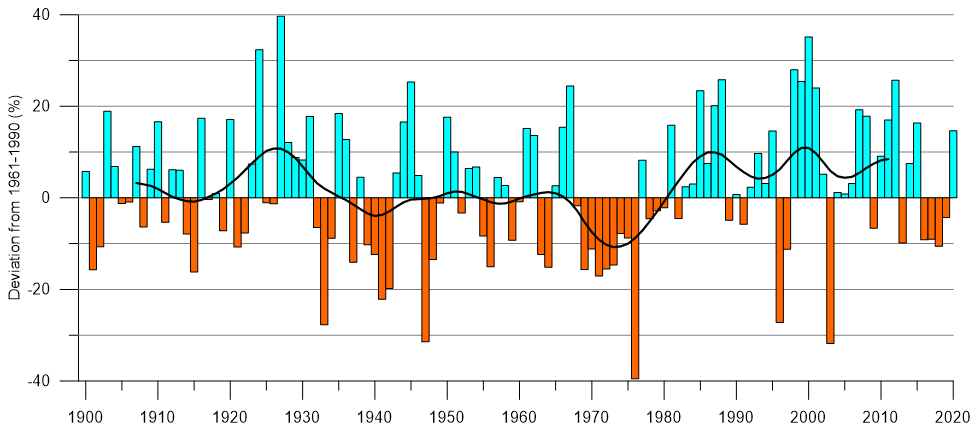
Figure 10Area-weighted river runoff anomalies relative to 1960–1990 (in percent) from Sweden to the Baltic Sea. The black solid curve denotes Gaussian filtered data with a standard deviation of 3 years. Data source: https://www.smhi.se (last access: 5 March 2022).
2.2.3 Future climate
For the BEARs, regionalisation with the help of dynamical downscaling of general circulation or global climate models (GCMs) or ESMs from CMIP3 and CMIP5 analysed by IPCC (2014b, 2019b) are assessed. The scenario simulations of CMIP5 are driven by greenhouse gas concentration scenarios and the Representative Concentration Pathways, RCP2.6, 4.5, and 8.5 (see Sect. 1.5).
Uncoupled atmospheric regional climate simulations for the 21st century from the EURO-CORDEX framework, calculated with several RCMs and global ESMs, were analysed by Christensen et al. (2022), and the conclusions are summarised here. The choice of working with regional climate model projections, downscaling a limited subset of all available CMIP5 GCMs, implies that the resulting ensemble may not represent all available data properly. Previous studies of parts of the 72-member EURO-CORDEX RCP8.5 ensemble (a sparsely filled GCM–RCM matrix with 11 RCMs downscaling 12 GCM projections in total) assessed here, and presented in more detail by Christensen et al. (2022), illustrated this hypothesis.
By investigating 18 of these RCM simulations (eight RCMs downscaling nine GCMs), Kjellström et al. (2018) found that the nine-member GCM ensemble showed a lower temperature response for northern and eastern Europe compared to the entire CMIP5 ensemble. In addition, it was found that the RCMs can – to some degree – alter the results of the driving GCMs (as also discussed by Sørland et al., 2018). In a more recent study, Coppola et al. (2021) investigated a 55-member ensemble with the same 11 RCMs downscaling the same 12 GCMs as assessed by Christensen et al. (2022). They compared the 55-member ensemble to the driving 12 GCMs and concluded that the RCMs modify the results. In their analysis, Coppola et al. (2021) also considered a set of 12 CMIP6 GCMs, finding that these show a stronger warming signal than the 12 CMIP5 GCMs. This was related to the higher equilibrium climate sensitivity in several global models of the new generation.
Furthermore, coupled atmosphere–sea ice–ocean simulations for the Baltic Sea and North Sea regions with one so-called regional climate system model (RCSM, Dieterich et al., 2013, 2019; Bülow et al., 2014; Wang et al., 2015; Gröger et al., 2015, 2019, 2021b) driven by eight ESMs and three greenhouse gas concentration scenarios, i.e. RCP2.6, 4.5, and 8.5, were compared with atmosphere-only RCM simulations by Christensen et al. (2022). In this study, we present figures of these internally consistent results from the coupled atmosphere–sea ice–ocean scenario simulations, e.g. for air temperature and precipitation (Fig. 26; Tables 12 and 13) and for SST (Fig. 30; Table 14). The state-of-the-art coupled modelling is discussed by Gröger et al. (2021a). For further details about the comparison between coupled and uncoupled scenario simulations, the reader is referred to Christensen et al. (2022).
Table 11Mass balances for the Swedish glaciers Storglaciären, Rabots glaciär, Mårmaglaciären, and Riukojietna. General references are given as footnotes in connection with balance years and long-term monitoring intervals, respectively. Selected specific references are given as footnotes in connection with the glacier names and also include the neighbouring glaciers, Kårsa and Kebnepakte. Data source: SITES data portal at https://data.fieldsites.se/portal/ (last access: 10 February 2022); World Glacier Monitoring Service, 2021; Swedish Infrastructure for Ecosystem Science, 2021a, b, c).
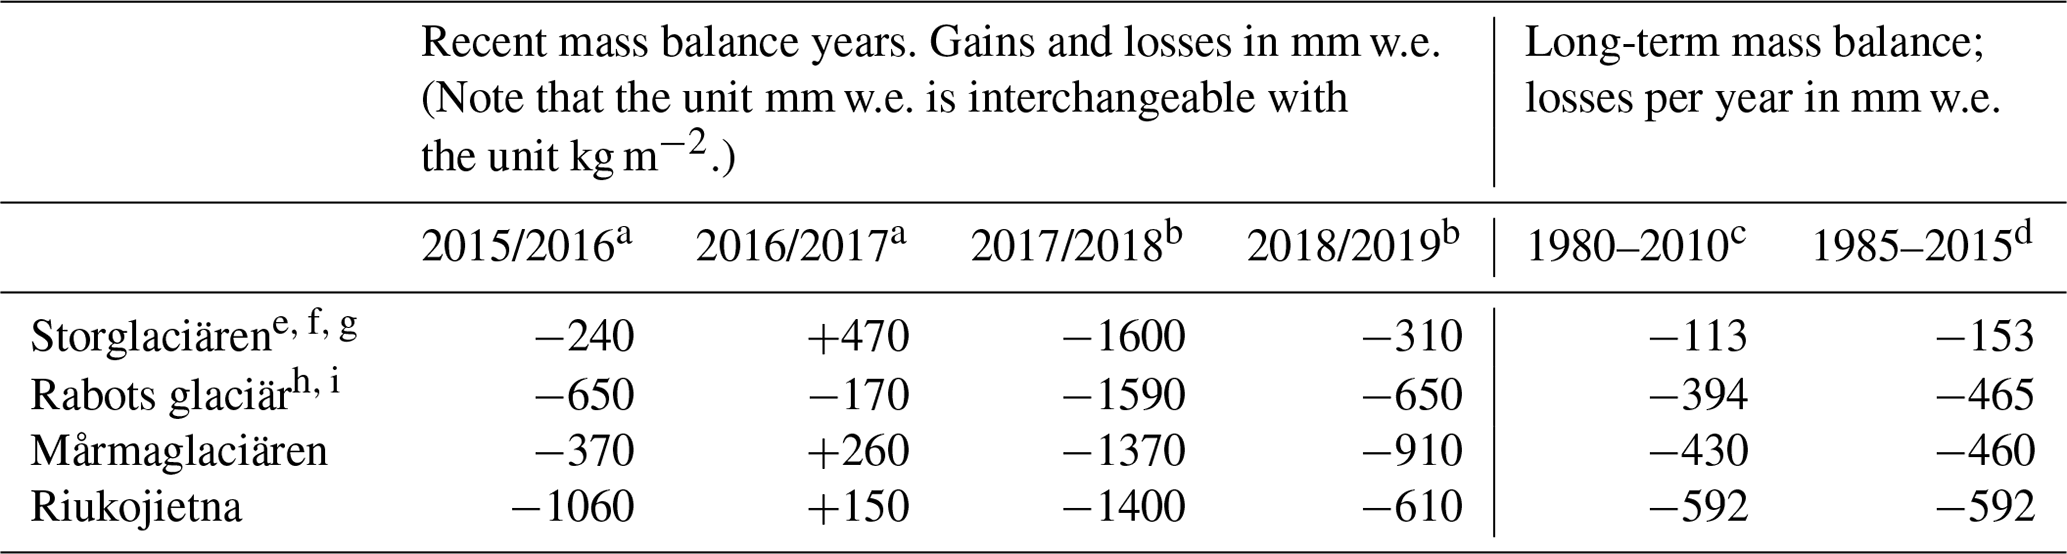
a World Glacier Monitoring Service (2020). b World Glacier Monitoring Service (2021). c Blunden and Arndt (2015). d Hartfield et al. (2018). e Mercer (2016). f Holmlund and Holmlund (2019). g Kirchner et al. (2019). h Brugger and Pankratz (2015). i Williams et al. (2016).
Table 12Air temperature (T2 m) changes (degrees Celsius) between 1976–2005 and 2069–2098, averaged over each season, and the annual mean over the Baltic Sea catchment area and over the Baltic Sea calculated from nine dynamically downscaled ESM simulations. In addition to the ensemble mean change, the 5th and 95th percentiles indicating the ensemble spread are listed (in parentheses). Data source: Gröger et al., 2021b.

What are novel compared to the assessment by the BACC II Author Team (2015) are the high-resolution projections of glacier masses including Scandinavian glaciers (Hock et al., 2019). These results are reproduced in Fig. 28.
Oceanographic regional climate model projections for the Baltic Sea until 2100, driven by the atmospheric surface fields of the above-mentioned RCSM by Dieterich et al. (2019), have been developed and analysed by Saraiva et al. (2019a, b) and Meier et al. (2021a, 2022). In Meier et al. (2021a, 2022), global sea level rise was also considered, which is a driver of the Baltic Sea climate variability that was previously neglected (see Hordoir et al., 2015; Arneborg, 2016; Meier et al., 2017). Here, we compare the latest scenario simulation results by Saraiva et al. (2019b) with previous projections by Meier et al. (2021b, 2022) for, e.g. SST, sea surface and bottom salinities, sea level (Fig. 31), bottom oxygen concentration (Fig. 32), and Secchi depth (Fig. 33),
For further details about the latest oceanographic regional climate model projections for the Baltic Sea, the reader is referred to Meier et al. (2022).
2.3 Uncertainty estimates
Uncertainties of future projections were estimated basically following the IPCC (2014a) guidance note for lead authors of the Fifth Assessment Report on consistent treatment of uncertainties (Mastrandrea et al., 2010). These uncertainty estimates are based upon a matrix of consensus and evidence reported in the literature. For the high confidence of a statement, high levels of both consensus and cases of evidence are required.
In this assessment, we applied a three-level confidence scale measuring the low, medium, and high confidence of identified climate changes (as defined in Sect. 2.1) of the selected 33 Earth system variables according to current knowledge (Table 15). We assessed the sign of a change but not its magnitude. Only detected or projected changes undoubtedly attributed to climate change were considered and synthesised in Fig. 35. Changes likely not caused by increasing greenhouse gas concentrations or changing aerosol emissions were not considered. Other external drivers of climate and environmental variability are internal random variations in the climate system, land use, eutrophication, contaminants, litter, river regulations, fishery, aquaculture, underwater noise, traffic, spatial planning, etc. (see Reckermann et al., 2022).
Note that our likelihood terminology of an outcome or a result differs from the IPCC's. We do not differentiate between probabilities such as virtually certain 99 %–100 %, very likely 90 %–100 %, likely 66 %–100 %, about as likely as not 33 %–66 %, unlikely 0 %–33 %, very unlikely 0 %–10 %, and exceptionally unlikely 0 %–1 % as the IPCC assessment report does. For many variables, the probability information does not exist at the regional scale because large ensembles of regional scenario simulations do not exist.
Key messages of this assessment that are new compared to the previous assessment by the BACC II Author Team (2015) are specially marked (Sect. 7).
Table 13Relative precipitation changes (percent) between 1976–2005 and 2069–2098, averaged over each season, and the annual mean over the Baltic Sea catchment area and over the Baltic Sea calculated from nine dynamically downscaled ESM simulations. In addition to the ensemble mean change, the 5th and 95th percentiles indicating the ensemble spread are listed (in parentheses). Data source: Gröger et al., 2021b.
Table 14Sea surface temperature (SST) changes (degrees Celsius) between 1976–2005 and 2069–2098, averaged over each season, and the annual mean over the Baltic Sea calculated from nine dynamically downscaled ESM simulations. In addition to the ensemble mean change, the 5th and 95th percentiles indicating the ensemble spread are listed (in parentheses). Data source: Gröger et al., 2021b.
3.1 Past climate change
3.1.1 Key messages from previous assessments
Climate variations may be triggered by changes in drivers external to the climate system or may be due to internal processes that reflect the nonlinear, chaotic interactions between the different components of the climate system. The analysis of past climate variations is, therefore, useful for two purposes. One is to estimate the response of climate to changes in the external forcing. The second is to better understand the mechanisms of internal climate variations. Since future climate change will include a mixture of both types of climate variations, the analysis of past climate variations is also necessary for better estimations of future climate change.
The past climate of the Baltic Sea region can be reconstructed from palaeo-pollen and dendroclimatological records with different time resolutions and degrees of accuracy. Palaeo-pollen data in lake sediments give information about the dominant plant species of a certain period. Combining the environmental ranges of those species in terms of annual maximum temperatures, minimum temperatures, and total annual precipitation allows an approximate reconstruction of past climate conditions over the past millennia, with time resolutions of a few decades (e.g. Kühl et al., 2002). Dendroclimatological data of tree ring widths, wood density, and sometimes also carbon and oxygen isotopic composition in tree rings can be dated as exactly as at annual scales.
As described by the BACC II Author Team (2015), the climate history of the Baltic Sea region during the Holocene, i.e. the last 12 000 years, involved very large climate changes – much larger than those during the 20th century. These climate changes were caused by strong changes in external forcing factors, in particular the Earth's orbit. These changes first brought about a warming that terminated the Last Ice Age about 13 000 years BP, then caused a period of very warm temperatures (∼3∘ above preindustrial levels) centred around 6000 years BP (the Holocene Thermal Maximum), followed by a slow temperature decline towards preindustrial levels. During this long period, other shorter-lived climate events, with durations of a few centuries, caused abrupt drops in temperature. These events, e.g. the Younger Dryas (12 000 years BP) or the 8.2 K event (8200 years BP), were possibly related to abrupt changes in the North Atlantic circulation, when sudden melting of portions of the remnants of the North American ice sheet disturbed the circulation of the North Atlantic Ocean and disrupted the poleward heat transport.
In general, annual precipitation is believed to have changed with the slow multicentennial-scale changes in temperature. Warmer periods, in particular the Mid-Holocene Optimum, tended to be wetter, although the regional heterogeneity may have been larger than for temperature.
Following the end of the last glaciation, the coastlines of the Baltic Sea underwent changes due to the interplay between the rising global sea level and the local rebound of the Earth's crust after the disappearance of the Fennoscandian ice sheet. The weight of this ice sheet depressed Fennoscandia by about 500 m, and its slow, viscous rebound continues until today, with a rate of about 10 mm yr−1 at the northern Baltic Sea coast. Due to this interplay, the Baltic Sea experienced periods of open or closed connections to the North Sea that governed the transport of salinity and heat and the nature of the Baltic Sea ecosystems (Groß et al., 2018).
The climate evolution during more recent historical times – the past 1000 years (Sect. 3.1.3) – can be reconstructed with better accuracy and higher time resolution due to better dendrochronological data availability. These data show the imprint of the Medieval Warm Period (approx. 900–1350 AD), the Little Ice Age (approx. 1550–1850 AD), and the Contemporary Warm Period (1850–present) on the Baltic Sea region. These periods were likely caused by long-term internal climate variability and changes in the external forcing (volcanic eruptions and solar radiation) and, during the Contemporary Warm Period, also by the increase in anthropogenic greenhouse gases (Hegerl et al., 2003).
In the Baltic Sea, this succession of warm–cold–warm temperatures was accompanied by changes in the deepwater oxygen content, with low oxygen conditions in warmer periods (see Sect. 3.1.2). The reasons for these oxygen variations are still not fully understood but may be relevant for the future should future warming also cause lower oxygen concentrations.
3.1.2 New palaeoclimate reconstructions
Since the publication of the BACC II report (BACC II Author Team, 2015), new reconstructions of the evolution of the European climate over the Holocene and over the past millennium have become available. Like previous reconstructions, the new ones are based on palaeo-pollen data and now comprise summer and winter temperatures and summer and winter precipitation. They are available for 1000 year time segments (Mauri et al., 2015). The reconstructions of the late spring–summer temperature evolution over the past millennium are based on dendroclimatological data, as in the previous reconstructions, but they are now based on wood density measurements, which reflect the slow climate variations better than tree ring width. These reconstructions are available for western Europe from 755 CE onwards (Luterbacher et al., 2016). In this study, only the results for a regular geographical box approximately covering the Baltic Sea region are discussed.
In addition, new regional climate simulations since the publication of the BACC II report have demonstrated the connections between the Baltic Sea and North Atlantic climates on multidecadal timescales better (Schimanke et al., 2012; Schimanke and Meier, 2016; Börgel et al., 2018, 2020; Kniebusch et al., 2019a).
3.1.3 Holocene climate evolution
The picture of the Holocene climate evolution from the BACC II report (BACC II Author Team, 2015) is essentially confirmed, but the regional details are now clearer (Mauri et al., 2015). Between 7000 and 5000 years BP, the Baltic Sea region (especially the western Baltic Sea) experienced a period with summer temperatures about 2.5–3 ∘C warmer than in the preindustrial reference period (before the 20th century). However, according to these reconstructions, the eastern Baltic Sea region (Finland and the Baltic states, i.e. Lithuania, Latvia, and Estonia) did not experience a Mid-Holocene Optimum in summer, when temperatures were similar to the preindustrial period. In contrast, winter temperatures showed a clear Mid-Holocene Optimum over the whole Baltic Sea region, lasting about 8000–4000 years BP, with winter temperatures roughly 3 ∘C warmer than during the preindustrial period. In the eastern Baltic Sea, winter temperatures were even slightly higher, especially between 6000–5000 years BP. As a result, annual mean temperatures during the millennia of the Mid-Holocene Optimum were generally warmer than in the preindustrial period. This warming was limited to the winter in the eastern Baltic Sea, where the amplitude of the annual temperature cycle was clearly lower than in the preindustrial period.
The warm temperatures in the Baltic Sea region during the Mid-Holocene Optimum are not surprising and basically agree with the previous review (BACC II Author Team, 2015). They also agree with evidence from regions farther north, indicating that the Arctic Ocean in summer may have been ice-free during this period (Jakobsson et al., 2010). These findings do not contradict the anthropogenic effect on climate observed during recent decades. During the Mid-Holocene Optimum, the orbital configuration of the Earth was different and favoured warmer temperatures at northern high latitudes, especially in summer, as explained later. For the analysis of climate impacts on ecosystems, it is relevant that high latitudes were exposed to warm temperatures and reduced sea ice cover just a few millennia ago. However, at that time, temperature changed at a much slower pace – around 2–3 ∘C over several millennia – compared to the present and projected rates of about 2 ∘C in just a few decades.
For precipitation, the new reconstructions give a regionally more nuanced view of climate evolution during the Holocene. The BACC II report (BACC II Author Team, 2015) indicated that warmer climates were generally more humid. The new reconstructions (Mauri et al., 2015) modulate this vision and constrain the wetter conditions to the eastern Baltic Sea region, both in summer and winter seasons, with a stronger signal in winter. Precipitation anomalies in the eastern Baltic Sea region were of the order of + 1–2 mm per month relative to preindustrial climate. In the western Baltic Sea region, the Mid-Holocene Optimum tended to be slightly drier than the preindustrial reference period, both in summer and winter, with precipitation deficits of the order of 1–2 mm per month.
The main external forcing that drove the millennial climate evolution over the Holocene period is the changing orbital configuration of the Earth (the so-called Milankovitch cycles), as explained in the BACC-II report (BACC II Author Team, 2015), and especially the variation in the time of the year of the perihelion (when the Earth is nearest to the Sun). The perihelion is now at the beginning of January, but ∼ 10 000 years BP, it was in July. This changes the seasonal distribution of solar insolation and determines the rate of melting of winter snow and its possible survival into the next winter. The solar insolation at 60∘ N at the top of the atmosphere during the Holocene, derived from Laskar et al. (2004), is depicted in Fig. 3. The shift of the perihelion from summer to winter diminishes summer insolation – and, in principle, summer temperature – and increases winter insolation during the past few millennia. The long-term evolution of temperatures would, however, not be a linear response to the long-term evolution of the seasonal insolation. For instance, the presence or absence of ice sheets may influence the timing of the response to increasing insolation during the early Holocene, delaying the Holocene temperature maximum with respect to the annual insolation maximum. In wintertime, the insolation is rather weak, so its effect may be overwhelmed by other factors, such as changes in the large-scale atmospheric and oceanic heat transports.
For the Fifth IPCC Assessment Report (IPCC, 2014b), the Mid-Holocene climate was simulated with 14 global ESMs within CMIP5 (Schmidt et al., 2011). These models were essentially the same as those used for future climate projections, although, in some cases, with a few simplifications required by limitations in computer power and by the long timescales involved. These models were driven by known external forcings, including the orbital forcing. The common evaluation of these simulations with reconstructions helps us to interpret the reconstructions and sheds light on model limitations. An important aspect in this comparison was that the spatial resolution of global models was relatively coarse, about 2×2 degrees longitude × latitude, so that smaller details within the Baltic Sea region cannot be properly represented.
The simulations showed some agreements with the reconstructions but also clear, not-yet-resolved disagreements (Mauri et al., 2014). In summer, all models showed temperatures 2–3∘ warmer during the Mid-Holocene Optimum than in the preindustrial climate (Fig. 3). However, no model showed the gradient with clearer warming in the western Baltic Sea, as seen in the reconstructions. For wintertime, the disagreement was much clearer. Whereas reconstructions show a clear warming over the whole region, the 14 models displayed widely varying patterns of temperature change. Only three models agreed with the reconstructions. For precipitation, the models disagreed with the west (wet) to east (dry) dipole shown by the reconstructions for summer and winter precipitation (Fig. 3). Not a single simulation showed this pattern of summer precipitation change, and in general, the simulated precipitation deviations were much smaller than in the reconstructions. This disagreement regarding temperature (especially in winter) and precipitation, known as the Mid-Holocene conundrum, is not unique to the Baltic Sea region and was also found for the Mediterranean (Mauri et al., 2014; Liu et al., 2014). Errors in the applied external (orbital) forcing can be ruled out, as this forcing can be accurately calculated during this period. The reasons for the disagreement are still unknown. They may involve the influence of chaotic internal climate variations (unlikely over such long timescales), model deficiencies, or reconstruction inaccuracies.
3.1.4 The past millennium
For shorter periods closer to the present, like the past 1 or 2 millennia, the data available for reconstructing past climate are denser and more accurate. Abundant dendroclimatological information is available, dated to the exact year, in contrast to the uncertain decadal-scale dating of palaeo-pollen data. Recently, temperature reconstructions for western Europe, spatially resolved and approximately covering the last 1200 years, have become available (Luterbacher et al., 2016) and are presented here in some detail for the Baltic Sea region. These data are based on the analysis of wood density in tree rings. Wood density is more sensitive to the growing season temperature than tree ring width. In addition, tree ring width variations usually contain multidecadal-scale variations that are too weak, even when the year-to-year variations in temperature may be well captured. This makes wood density a better proxy for temperature reconstructions at these latitudes.
Figure 4 shows the reconstructed growing season temperature (spring–early summer) for the period 755–2000 CE, averaged over the Baltic Sea region, based on the European reconstructions by Luterbacher et al. (2016). The reconstructed spring–early summer temperature displays warmer conditions around 950 CE, confirmed also by the previous pollen-based reconstructions (Mauri et al., 2015), and colder conditions between 1200 and 1850 CE, followed by the recent warming. This temperature evolution confirms that presented by the BACC II Author Team (2015). The temperatures in the Medieval Warm Period and the Contemporary Warm Period (mid-20th century) are similar within their respective error bars. According to these reconstructions, the Little Ice Age was, on average, about 0.8∘ colder than the 20th century.
There is no new analysis of the causes of this temperature evolution specific to the Baltic Sea region. For Europe as a whole, for which the reconstructions display a similar temporal pattern, the main identified forcings were volcanic activity – more intense during the Little Ice Age and weaker during the Medieval Warm Period – and solar activity, with roughly the reverse temporal signal (Luterbacher et al., 2016). In the context of industrialisation since the 19th century, anthropogenic greenhouse gases have become the dominant forcing.
The CMIP5 project also included simulations of the past millennium with ESMs, although with fewer models than for the Mid-Holocene. These simulations have been compared with the temperature reconstructions for Europe, yielding agreement in general. However, for the Baltic Sea region, the simulated temperature changes tend to be smaller than those reconstructed, especially for the transition between the Medieval Warm Period and the Little Ice Age, with a modelled temperature difference of only ∼0.2∘ (compare with Fig. 4 by Luterbacher et al., 2016).
Climate fluctuations are driven not only by the external forcings but also by the chaotic internal dynamics of the Earth system. Regional climate simulations indicate that North Atlantic temperature variability influences Baltic Sea temperatures (Kniebusch et al., 2019a) and precipitation (Börgel et al., 2018). North Atlantic temperatures tend to fluctuate internally at multidecadal timescales, i.e. the AMO, which influences the atmospheric circulation of the Baltic Sea region. Furthermore, the interaction between internal modes of climate variability has recently been identified as a key driver for the state of the Baltic Sea. Internal fluctuations in the North Atlantic are likely to influence the spatial position of the NAO, affecting the regional importance of this climate mode for the Baltic Sea (Börgel et al., 2020).
Climate simulations also indicate an impact of internally driven climate variability on the frequency of wind extremes. In the present climate, the wintertime wind regime in the Baltic Sea is linked to the NAO, but at the longer timescales of the preindustrial period, variations in wind extremes appear related neither to the mean wind conditions nor to the external climate forcings (Bierstedt et al., 2015). In the recent centuries, the main driver of trends of wind extremes over land appears to be land use changes such as de- and reforestation (Bierstedt et al., 2015; Gröger et al., 2021a, and references therein).
An important question is how North Atlantic variations can influence the state of the Baltic Sea, especially its oxygen conditions, since freshwater input and water temperature (less strongly) affect the stratification of the water column and, therefore, the exchange of oxygen between the surface and deeper layers. Temperature also modulates algal blooms and, thus, dissolved oxygen when bacteria use oxygen to decompose dead algae. An analysis of sediment cores indicated that the Mid-Holocene Optimum, the Roman Period (2000 years BP), and the Medieval Warm Period were all periods of oxygen deficiency at the bottom of the Baltic Sea. Low oxygen conditions are also observed during the Contemporary Warm Period, unique in their extent on a 1000 year perspective (Norbäck Ivarsson et al., 2019, and references therein). Hence, factors other than temperature, like nutrient input into the Baltic Sea, can also affect oxygen conditions, and thus, the reasons for those hypoxic phases during the past millennia are not yet completely clear (Schimanke et al., 2012). It had been suggested that agricultural nutrient input was large enough to influence oxygen conditions during the Medieval Warm Period already, and perhaps it was also modulated by changes in river runoff due to the described climate fluctuations (Zillén and Conley, 2010). However, a detailed analysis of new sediment records find little evidence of anthropogenic eutrophication before the industrial period (Norbäck Ivarsson et al., 2019; Ning et al., 2018; van Helmond et al., 2018). In view of the large temperature increases projected for this region in the next decades, further study of the influence of climate on oxygen conditions is warranted.
3.2 Present climate change
This section assesses our knowledge of Baltic Sea region climate variability during the past ∼200 years, based on instrumental records, model-based reconstructions, and reanalyses. We focus on changes in means, extremes, trends, and decadal to multidecadal climate variability.
3.2.1 Atmosphere
3.2.1(1) Large-scale atmospheric circulation
Long-term trends in NAO could not be detected (e.g. Deser et al., 2017; Marshall et al., 2020). For the period 1960–1990, a positive trend in NAO, with more zonal circulation, mild and wet winters, and increased storminess in central and northern Europe was found (Hurrell et al., 2003; Gillett et al., 2013; Ruosteenoja et al., 2020). However, from the mid-1990s to the early 2010s, there was a tendency towards more negative NAO indices, i.e. a more meridional circulation and more cold spells in winter (Fig. 5).
There is no consensus on how strongly the interannual NAO variability is forced externally (Stephenson et al., 2000; Feldstein, 2002; Rennert and Wallace, 2009). Several external forcing mechanisms have been proposed, most prominently SST (Rodwell et al., 1999; Marshall et al., 2001) and sea ice in the Arctic (Strong and Magnusdottir, 2011; Peings and Magnusdottir, 2016; Kim et al., 2014; Nakamura et al., 2015). However, other authors (Screen et al., 2013; Sun et al., 2016; Boland et al., 2017) found no dependence on sea ice extent. Furthermore, the impact of changes in the Arctic on midlatitude dynamics is still under debate (Dethloff et al., 2006; Francis and Vavrus, 2012; Barnes, 2013; Cattiaux and Cassou, 2013; Vihma, 2017). However, Scaife and Smith (2018) suggested that the atmospheric circulation in climate models might not be sensitive enough to changes in, for instance, sea surface conditions.
A weakening of the zonal wind, eddy kinetic energy, and amplitude of Rossby waves in summer (Coumou et al., 2015), as well as an increased waviness of the jet stream associated with Arctic warming (Francis and Vavrus, 2015) in winter have been identified, which may be linked to an increase in blocking frequencies. Blackport and Screen (2020) argued that previously observed correlations between surface temperature gradients and the amplitude of Rossby waves have broken down in recent years. Therefore, previously observed correlations may have to be reinterpreted as internal variability. On the other hand, it has been shown that observed trends in blocking are sensitive to the choice of the blocking index, and that there is a huge natural variability that complicates the detection of forced trends (Woollings et al., 2018), compromising the robustness of observed changes in blocking.
With ongoing global warming, the Arctic will warm faster than the rest of the Earth. This decrease in the poleward temperature gradient will tend to weaken the westerlies and increase the likelihood of blockings. On the other hand, maximum warming (compared to other tropospheric levels) will occur just below the tropical tropopause due to the enhanced release of latent heat, which tends to increase the poleward gradient, strengthen upper-level westerlies, and affect the vertical stability, thus altering the vertical shear in midlatitudes. It is not clear which of these two factors will have the largest effect on the jet streams (Stendel et al., 2021).
The atmospheric circulation over Europe naturally varies significantly on decadal timescales (Dong et al., 2017; Ravestein et al., 2018). Proposed drivers for these circulation changes include polar and tropical amplification, stratospheric dynamics, and the AMOC (Haarsma et al., 2015; Shepherd et al., 2018; Zappa and Shepherd, 2017). The attribution of drivers is more straightforward for local changes, in particular for the soil moisture feedback, for which an enhancement of heatwaves due to a lack of soil moisture has been demonstrated (Seneviratne et al., 2013; Teuling, 2018; Whan et al., 2015). Räisänen (2019) found only a weak effect of circulation changes on the observed annual mean temperature trends for 1979–2018 in Finland, but circulation changes have considerably modified the trends in individual months. In particular, circulation changes explain the lack of observed warming in June, the very modest warming in October in southern Finland, and about a half of the very large warming in December.
As part of its natural variability, the North Atlantic warmed from the late 1970s to 2014 (Fig. 6). Recently, the AMO began transitioning to a negative phase again (Frajka-Williams et al., 2017). Palaeoclimate reconstructions and model simulations suggest that the AMO might change its dominant frequency over time (Knudsen et al., 2011; Wang et al., 2017). The impact of the AMO on climate is, however, independent of its frequency (Börgel et al., 2018, 2020). Its influence on regional climate has been analysed in several studies (Enfield et al., 2001; Knight et al., 2006; Sutton and Hodson, 2005; Ting et al., 2011; Casanueva et al., 2014; Ruprich-Robert et al., 2017; Peings and Magnusdottir, 2014), with some dealing with the Baltic Sea (Börgel et al., 2018, 2020; Kniebusch et al., 2019a). Kniebusch et al. (2019a) suggested that the influence of the AMO on the warming of Baltic Sea SSTs during 1980–2008 might have been at least as strong as that induced by humans (IPCC, 2014b).
3.2.1(2) Air temperature
A significant increase in surface air temperature in the Baltic Sea region during the last century has been shown previously (e.g. BACC Author Team, 2008; Rutgersson et al., 2014; BACC II Author Team, 2015). The temperature increase was not monotonous but accompanied by large multidecadal variations that divided the 20th century into the following three main phases: (1) warming from the beginning of the century until the 1930s, (2) slight cooling until 1960s, and (3) a distinct warming during the last decades of the time series that has continued also during 2014–2020 (Figs. 7 and 8; Table 9).
Linear trends of the annual mean temperature anomalies during 1878–2020 were 0.10 ∘C per decade north of 60∘ N as well as south of 60∘ N in the Baltic Sea region. This is larger than the global mean temperature trend and slightly larger compared to the earlier BACC reports. Over the Baltic Sea surface, air temperature trends were smaller than over land. During 1856–2005, surface air temperature over the Baltic Sea increased by 0.06 and 0.08 ∘C per decade in the central Baltic Sea and in Bothnian Bay, respectively (Kniebusch et al., 2019a).
There is a large variability in the annual and seasonal mean temperatures, particularly during winter, but the warming is seen for all seasons (being the largest during spring in the northern part of the region).
Both daily minimum and daily maximum temperatures have increased. A decrease in the daily temperature range (DTR) has been observed in many regions of the world, but there is no clear signal for the entire Baltic Sea region (see for example, Jaagus et al., 2014, for a DTR analysis of the Baltic states).
These changes have also resulted in seasonality changes in that the growing season has lengthened by about 5 d per decade in the period 1965–2016 (Cornes et al., 2019). From this follows that the cold season has become shorter.
Extreme air temperatures can be high or low, but extended periods of extreme temperatures (spells or waves) are often the most influential. When averaged over land areas, warm spell duration increased during recent decades (Rutgersson et al., 2022). For some regions, the annual number of days defined to belong in warm spells increased from 6–8 to 14 during recent decades. Along with more frequent and longer warm spells came decreases in the frequency, duration, and severity of cold spells, based both on observations (Easterling et al., 2016) and model results. The length of the frost season and the annual number of frost days also decreased (Sillmann et al., 2013).
3.2.1(3) Solar radiation and cloudiness
Multidecadal variations in solar radiation at the Earth's surface, called dimming and brightening, have been observed in Europe and other parts of the world, particularly in the Northern Hemisphere (Wild et al., 2005, 2017; Wild, 2012).
One of the world's longest time series of global radiation, i.e. incoming solar radiation at the Earth's surface, is from Stockholm, where measurements started in 1922. Recently, a first attempt to homogenise this time series was made by Josefsson (2019). No significant trend was found over the whole time series, but there were large variations over 1–3 decades. Other long time series of global radiation in northern Europe are from Potsdam, Germany, (Wild et al., 2021), and Tõravere, Estonia, (Russak, 2009). All three time series show a minimum in global radiation around the mid-1980s. Then a clear increase or brightening of about 5 %–8 % followed, until at least 2005. Before the 1980s minimum, there was a period of dimming at all stations but with differences in the details. In Potsdam, there was rather stable dimming with decreasing solar radiation from the late 1940s until the mid-1980s. In Tõravere, the dimming period started around the mid-1960s, while in Stockholm the dimming phase started around 1950 but with a temporary interruption with increased solar radiation around 1970.
Current 20th century reanalyses models provide results for surface solar radiation. However, most of them fail to capture multidecadal surface radiation variability in central and southern Europe (Wohland et al., 2020). The CERA20C reanalysis, which shows best results for central and southern Europe, still gives questionable results over Scandinavia, showing a weak increase instead of a decrease in surface solar radiation during the presumed dimming period before 1980.
Satellite data allowing analyses of cloudiness and solar radiation at the Earth's surface have been available since the early 1980s. For Europe, important work has been done within the EUMETSAT Satellite Application Facility on Climate Monitoring (CM SAF). Several satellite data records have been validated and used in climate studies (e.g. Urraca et al., 2017; Pfeifroth et al., 2018). At the highest latitudes of the Baltic Sea region, there are, however, larger inaccuracies (Riihelä et al., 2015) or often no data at all due to the low standing Sun and slant viewing geometry from the satellites.
The satellite data only cover the latest brightening period observed at ground-based stations in Europe. While the geographical patterns of global average cloud conditions agree well among several satellite cloud datasets, there are clear differences in the distribution and size of trends (Karlsson and Devasthale, 2018). However, there seems to be consensus on a decreasing trend in total cloud fraction of about 1–2 % per decade over the Baltic Sea region during 1984–2009.
Recent CM SAF satellite products on solar irradiance at the Earth's surface, the SARAH-2 and CLARA-A2 datasets, both agree well with station data, according to Pfeifroth et al. (2018). In many cases, this holds both for climatological averages and for trend detection. The average trend for the period 1983–2015 is about + 3 W m−2 per decade, both at the stations closest to the Baltic Sea and in the SARAH-2 dataset. The three long-term stations mentioned above are all used as reference stations for the satellite data validation. For example, the ongoing monitoring at stations spread all over Sweden show an average increase of about 8 % (corresponding to + 4 W m−2 per decade) from 1983 until 2005–2006 (SMHI, 2021). In later years, the solar radiation levelled off, but, inter alia, the extremely sunny year of 2018 in northern Europe contributed to keeping the trend increasing over time.
The multidecadal variations in the solar radiation at the Earth's surface were most probably caused by a combination of changes in cloudiness and in anthropogenic aerosols. Which of the two drivers gives the largest contribution is still an open question and might differ among regions. Aerosol concentrations over northern Europe decreased during the brightening period from the mid-1980s onwards (Ruckstuhl et al., 2008; Russak, 2009; Markowicz and Uscka-Kowalkowska, 2015; Glantz et al., 2019). Russak (2009) considered changes in cloudiness caused by variations in atmospheric circulation to be the most important factor in Estonia, but aerosol changes also played a role. In an early study of the modern radiation measurements in Sweden, the strong increase in solar radiation 1983–1997 was also accompanied by a clear decrease in total cloud cover, especially during the half-year of summer (Persson, 1999). The satellite datasets SARAH-2 and CLARA-A2 were both derived using an aerosol climatology as input. This underlines the important role of changes in cloudiness for surface solar radiation. Stjern et al. (2009) also stressed the importance of the contribution of clouds and the atmospheric circulation for dimming and brightening periods in northern Europe.
Other studies, e.g. Ruckstuhl et al. (2008) and Wild et al. (2021), concluded that aerosol effects under clear skies is the main contributor to the multidecadal variations in solar radiation in central Europe. Aerosol-induced multidecadal variations in surface solar radiation could be expected also over oceans (Wild, 2016), but long-term measurements are lacking. The interaction between aerosols and clouds, the indirect aerosol effects, also needs to be better understood and quantified.
3.2.1(4) Precipitation
During the 20th century in the Baltic Sea region, changes in precipitation were spatially more variable than for temperature (BACC II Author Team, 2015). Irregularly distributed precipitation measurement stations make it difficult to determine statistically significant trends and regime shifts. Sweden has shown an overall increasing trend in precipitation since the 1900s, in particular since the mid-20th century (Chen et al., 2020). In Finland, the overall increase detected for 1961–2010 is neither regionally consistent nor always statistically significant (Aalto et al., 2016). The same holds for the Baltic states (Jaagus et al., 2018). In the south of the Baltic Sea region, changes were small and not significant. Nevertheless, precipitation averaged over the Baltic Sea catchment area has increased since 1950 due to an increase in winter (Fig. 9). The number of heavy precipitation days is largest in summer. Compared to southern Europe, precipitation extremes in the Baltic Sea region are not as intense, with the 95th percentile of wet day precipitation amounts typically ranging from 8 to 20 mm (Cardell et al., 2020). Extreme precipitation intensity increased during the period 1960–2018. An index for the annual maximum 5 d precipitation (Rx5d) shows significant increases of up to 5 mm per decade over the eastern part of the Baltic Sea catchment (EEA, 2019b). The change is more pronounced in winter than in summer.
3.2.1(5) Wind
In situ observations allow direct analysis of winds, in particular over the sea (e.g. Woodruff et al., 2011). However, in situ measurements, especially over land, are often locally influenced, and inhomogeneities make the straightforward use of such data difficult, even for recent decades. Therefore, many studies use reanalyses rather than direct wind observations. But the analysis of storm track activity for longer periods using reanalysis data suffers necessarily from inaccuracies associated with changing data assimilation and observations before and after the introduction of satellites, resulting in large variations in storm track changes across assessments (Wang et al., 2016; Chang and Yau, 2016). Another concern about wind trends in reanalyses, especially over land, is related to an appropriate consideration of the effects of land use changes on surface roughness.
Owing to inherent inhomogeneities and the large climate variability in the Baltic Sea region, it is unclear whether there is a general trend in wind speed in the recent climate. Results regarding changes or trends in the wind climate are strongly dependent on the period and region considered (Feser et al., 2015). Due to the strong link to large-scale atmospheric variability over the North Atlantic, conclusions about changes over the Baltic Sea region are perhaps best made in a wider spatial context, considering, inter alia, the NAO.
Recent trend estimates for the total number of cyclones over the Northern Hemisphere extratropics during 1979–2010 revealed a large spread across the reanalysis products, strong seasonal differences, and decadal-scale variability (Tilinina et al., 2013; Wang et al., 2016; Chang et al., 2012, 2016; Matthews et al., 2016). Common to all reanalysis datasets is a weak upward trend in the number of moderately deep and shallow cyclones but also a decrease in the number of deep cyclones, in particular for the period 1989–2010. Chang et al. (2016) reported a minor reduction in cyclone activity in the Northern Hemisphere summer due to a decrease in baroclinic instability as a consequence of Arctic temperatures rising faster than at low latitudes. Chang et al. (2012) also noticed that state-of-the-art models (CMIP5) generally underestimate this trend. In the Northern Hemisphere winter, recent studies reported a decrease in storm track activity related to Arctic warming (Ceppi and Hartmann, 2015; Shaw et al., 2016; Wills et al., 2019; Stendel et al., 2021).
Despite large decadal variations, there is still a positive trend in the number of deep cyclones (<980 hPa) over the last 6 decades, which is consistent with results based on the NCEP (National Centers for Environmental Prediction) reanalysis since 1958 over the northern North Atlantic (Lehmann et al., 2011). Using an analogue-based field reconstruction of daily pressure fields over central to northern Europe (Schenk and Zorita, 2012), the increase in deep lows over the region might have been unprecedented since 1850 (Schenk, 2015). However, for limited areas, the conclusions were rather uncertain.
The effect of differential temperature trends on storm tracks has been recently addressed, both in terms of upper tropospheric tropical warming (Zappa and Shepherd, 2017) and lower tropospheric Arctic amplification (Wang et al., 2017), including the direct role of Arctic sea ice loss (Zappa et al., 2018) and a possible interaction of these factors (Shaw et al., 2016). The remote and local SST influence has been further examined by Ciasto et al. (2016), who confirmed the sensitivity of the storm tracks to the SST trends generated by the models and suggested that the primary greenhouse gas influence on storm track changes was indirect, acting through its influence on SSTs. The importance of the stratospheric polar vortex for storm track changes has recently also received attention (Zappa and Shepherd, 2017).
3.2.1(6) Air pollution, air quality, and atmospheric nutrient deposition
Air pollution continues to significantly impair the health of the European population, particularly in urban areas. Brandt et al. (2013) estimated the total number of premature deaths due to air pollution in Europe in the year 2000 to be ∼ 680 000 yr−1. Although this number was predicted to decrease to approximately 450 000 by 2020, it is still a matter of concern. Particulate matter (PM) concentrations were reported to be the primary reason for adverse health effects. Estimates indicated that PM2.5 concentrations in 2016 were responsible for ∼ 412 000 premature deaths in Europe, due to long-term exposure (EEA, 2019a).
The state of air pollution is often expressed as air quality when human health is in focus. The ambient air quality in the Baltic Sea region is dominated by anthropogenic emissions, and natural emissions play only a minor role. These emissions have shown an overall decreasing trend in recent years (EEA, 2019a), as reflected in the ambient concentrations reported in the EMEP (European Monitoring and Evaluation Programme) status report (Fagerli et al., 2018). To quantify air quality, concentrations of certain gases and particulate matter are used as measures. The general conclusions in the field of air quality reported by the BACC II Author Team (2015) still hold today, i.e. that land-based emissions and concentrations of major constituents continue to decrease due to emission control measures, with the possible exception of certain emissions from the shipping sector. Sulfur emissions from shipping have continued to decrease strongly in the Baltic Sea from 2015, due to much lower limit values for the sulfur content of ship fuel in the emission control areas. A noticeable decrease in nitrogen emissions due to the newly (2021) implemented nitrogen emission control area (NECA) is expected in the next decade.
In Europe, the pollutants most harmful to human health are PM, nitrogen dioxide (NO2), and ground-level ozone (O3). About 14 % of the EU-28 urban population was exposed to O3 concentrations above the EU target value threshold (EEA, 2019a). When compared to other European countries, air pollution was relatively low in Scandinavia, except for a few urban traffic hotspots, with annual mean NO2 concentrations elevated to near the limit value (EEA, 2019b). In this comparison, northern Germany is located in the lower mid-field, while northern Poland is among the more polluted countries, especially with PM. Biomonitoring samples analysed for toxic metals by Schröder et al. (2016) tended to show lowest concentrations in northern Europe.
Contributions to air pollution and pollutant deposition in coastal areas by shipping can be substantial. Major pollutants from shipping are SO2, NOx, and PM (including black carbon). The BACC II assessment estimated emissions from shipping in the Baltic Sea region. Several studies have recently been published, including Jonson et al. (2015), Claremar et al. (2017), and Karl et al. (2019b), which used chemistry transport models to predict ambient concentrations from known emissions. They showed, as expected, that the highest air pollution concentrations due to ship exhaust are found near major shipping lanes and harbours, but also that considerable concentrations of NO2 and PM reach populated land areas. This effect is pronounced in the southwestern Baltic Sea area (Quante et al., 2021). Exact numbers from such modelling should still be interpreted with care, as shown by Karl et al. (2019a), who compared output from three state-of-the-art chemistry transport models for the Baltic Sea area.
The most important recent change in shipping emissions in the North Sea and Baltic Sea are due to the 2015 strengthening of the fuel sulfur content limit for the sulfur emission control areas (SECAs), by lowering the maximum allowed sulfur content from 1 % to 0.1 %. Model calculations indicated large reductions in sulfur deposition in countries bordering these two sea areas after the implementation of the lowered sulfur limit (Gauss et al., 2017). Barregard et al. (2019) estimated the contribution of Baltic Sea shipping emissions to PM2.5 before 2014 and after 2016, when the new SECA regulation of marine fuel sulfur was implemented. These authors also estimated human exposure to PM2.5 from shipping and its health effects in the countries around the Baltic Sea. They concluded that PM2.5 emissions from Baltic Sea shipping, and resulting health impacts, decreased substantially after the 2015 SECA regulation. Population exposure studies estimating the influence of shipping emissions for selected Baltic Sea harbour cities were published for Rostock, Riga, and Gdańsk–Gdynia by Ramacher et al. (2019) and for Gothenburg by Tang et al. (2020). Ramacher et al. (2019) found that shipping emissions strongly influence NO2 exposure in the port areas (50 %–80 %), while the average influence in home, work, and other environments is lower (3 %–14 %) but still with strong influence close to the ports. It should, however, be noted that the reduction in sulfur emissions to the atmosphere by the use of new cleaning techniques (e.g. open-loop scrubbers) can increase the risk of acidification and marine pollution (Turner et al., 2017, 2018).
Johansson et al. (2020) published a first comprehensive assessment of emissions from leisure boats in the Baltic Sea. While the modelled NOx and PM2.5 emissions from leisure boats are clearly lower than those from commercial shipping, these first estimates suggest that carbon monoxide (CO) emissions from leisure boats equal 70 % of the registered shipping emissions, and non-methane volatile organic carbon (NMVOC) emissions equal 160 %. It should be noted that most of the leisure boat emissions occur in summer and often occur near areas for nature conservation and tourism. Most of these emissions can be attributed to Swedish, Finnish, and Danish leisure boats, but the leisure boat fleet has the potential for large future increases also in Russia, Estonia, Latvia, Lithuania, and Poland.
Air pollution leads to environmental degradation by affecting natural ecosystems and biodiversity. Ground-level ozone (O3) can damage crops, forests, and other vegetation, impairing growth and reducing biodiversity. According to a recent study by Proietti et al. (2021), for the period 2000–2014, no statistically significant trend in the O3 mean concentration in northern Europe could be identified due to the large internal variability. The annual mean ozone concentration is reported to be slightly below 35 ppb (parts per billion), as compared to 43 to 45 ppb in the Mediterranean region, for which a significant decreasing trend is found. The exposure index AOT40 (sum of the hourly exceedances above 40 ppb for daylight hours during the growing season) significantly declined in all European regions except for northern Europe, for which a positive but not significant trend is seen. At the nation level, among the six European countries showing a positive trend were Denmark, Germany, and Sweden (Proietti et al., 2021). A clear difference in trends between rural sites and other station typologies is found for Europe for the period 2000 to 2017. That is, for traffic sites, a substantial increase in annual mean O3 concentration was observed, in contrast to rural stations, for which a slight decrease was found (Colette and Rouïl, 2020). Regarding the monitored population exposed to a large number of days with high ozone concentrations, all countries in Europe showed a decrease from 2000 to 2014 (NDGT60 >25 d yr−1; Fleming et al., 2018).
Harmful exposure and impacts of air pollutants on ecosystems are assessed using the concept of critical loads (CLs; Nilsson and Grennfelt, 1988). The CL is the total amount of pollutants that an ecosystem can tolerate without risking unacceptable damage. The most harmful air pollutants in terms of damage to ecosystems, in addition to O3, are reduced and oxidised nitrogen. It is estimated that about 62 % of the European ecosystem area is still exposed to high levels of NOx, leading to exceedances of CLs for eutrophication of open water bodies in all European countries in 2016 (EEA, 2019a). Hotspots of exceedances of CLs for acidification in 2016 were the Netherlands and its borders with Germany and Belgium, southern Germany, and also the Czech Republic. However, most of Europe including the Baltic Sea region did not exceed the CLs for acidification (EEA, 2019a).
Since the 1980s, the total nitrogen deposition on the Baltic Sea has decreased substantially due to an overall reduction in European emissions, but emission and deposition reductions have stalled since the mid-2000s (Colette et al., 2015; Gauss et al., 2021). Atmospheric phosphorus deposition remains highly uncertain in amount and trends (HELCOM, 2015; Kanakidou et al., 2018; Ruoho-Airola et al., 2012).
Air quality and climate interact in several ways. On the one hand, air pollutants can affect climate both directly and indirectly by changing the radiative balance of the atmosphere. On the other hand, climate change alters meteorological conditions, which may affect the concentrations of air pollutants via several pathways, since the air quality is strongly dependent on weather (Jacob and Winner, 2009). The effects of important meteorological and climate variables on surface O3 and PM were discussed in a comprehensive review by Doherty et al. (2017). The connection between high temperatures and increased ground-level ozone concentrations is well established. Increases in temperature related to climate change (i.e. during heatwaves) are expected to lead to higher ozone concentrations in certain regions with the required precursor concentrations. Other important meteorological factors influencing air pollution concentrations are a possible change in the number of midlatitude cyclones and in the number of occurrences of, and the duration of, stagnant weather conditions (Jacob and Winner, 2009).
3.2.2 Land
3.2.2(1) River discharge
The total river discharge to the Baltic Sea is approximately 14 000 m3 s−1 (Bergström and Carlsson, 1994). This is substantially more than the direct net precipitation (precipitation minus evaporation) on the Baltic Sea itself, which has been estimated at 1000–2000 m3 s−1 (Meier and Kauker, 2003; Meier and Döscher, 2002; Meier et al., 2019d; see also the discussion by Leppäranta and Myrberg, 2009). In other words, most of the fresh water entering the Baltic Sea comes from the terrestrial part of the catchment. Therefore, the freshwater input to the Baltic Sea cannot be described entirely with only climatic parameters. Non-climatic drivers of runoff include river regulation by dams and reservoirs, land use changes in the catchment, and water uptake for irrigation. Although dams are known to have altered the seasonality of discharge (e.g. McClelland et al., 2004; Adam et al., 2007; Adam and Lettenmaier, 2008), they do not seem to be responsible for annual discharge changes. In the long-term, net precipitation over the catchment area and river runoff are strongly correlated (Meier and Kauker, 2003).
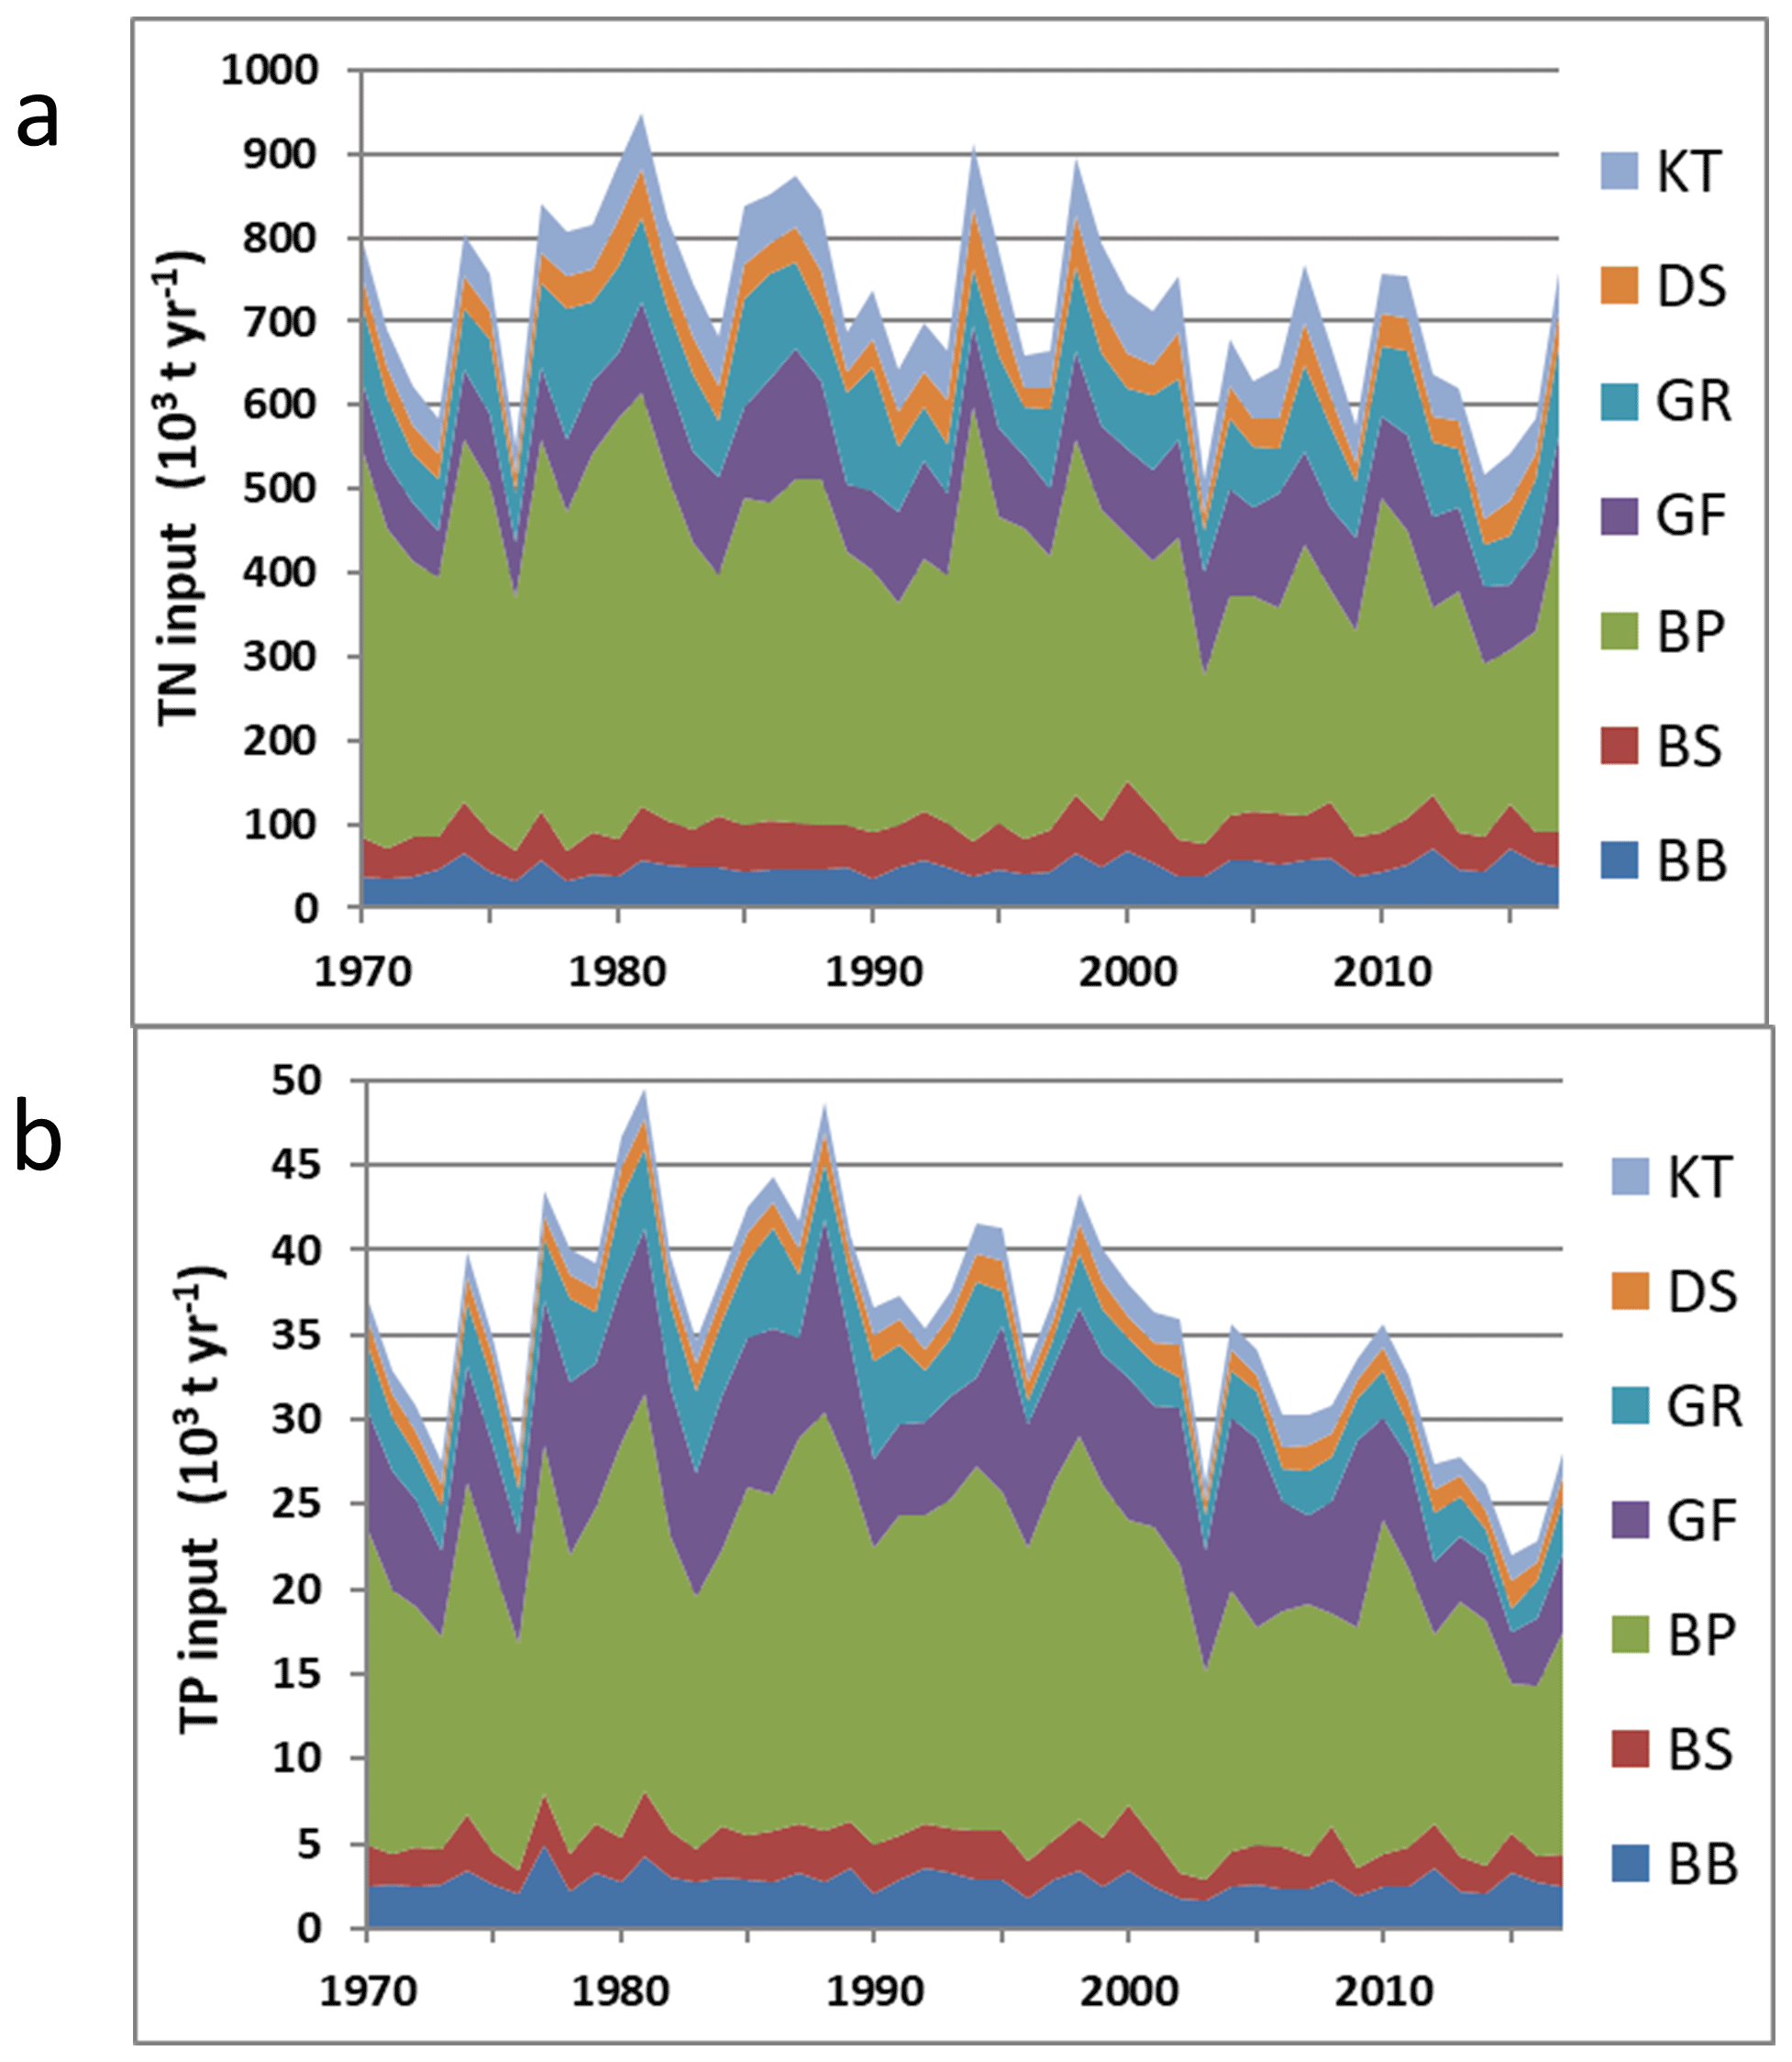
Figure 11Long-term dynamics (1970–2017) of annual nitrogen (a) and phosphorus (b) riverine inputs to the major Baltic Sea basins. BB – Bothnian Bay; BS – Bothnian Sea; BP – Baltic proper; GF – Gulf of Finland; GR – Gulf of Riga; DS – Danish straits; KT – Kattegat. Time (in years) is on the horizontal axis. Data source: updated from Savchuk (2018); see https://www.researchgate.net/publication/358726567_Long-term_times-series_of_the_annual_N_and_P_pools_in_the_major_basins_of_the_Baltic_Sea_1970-2020 (last access: 6 March 2022).
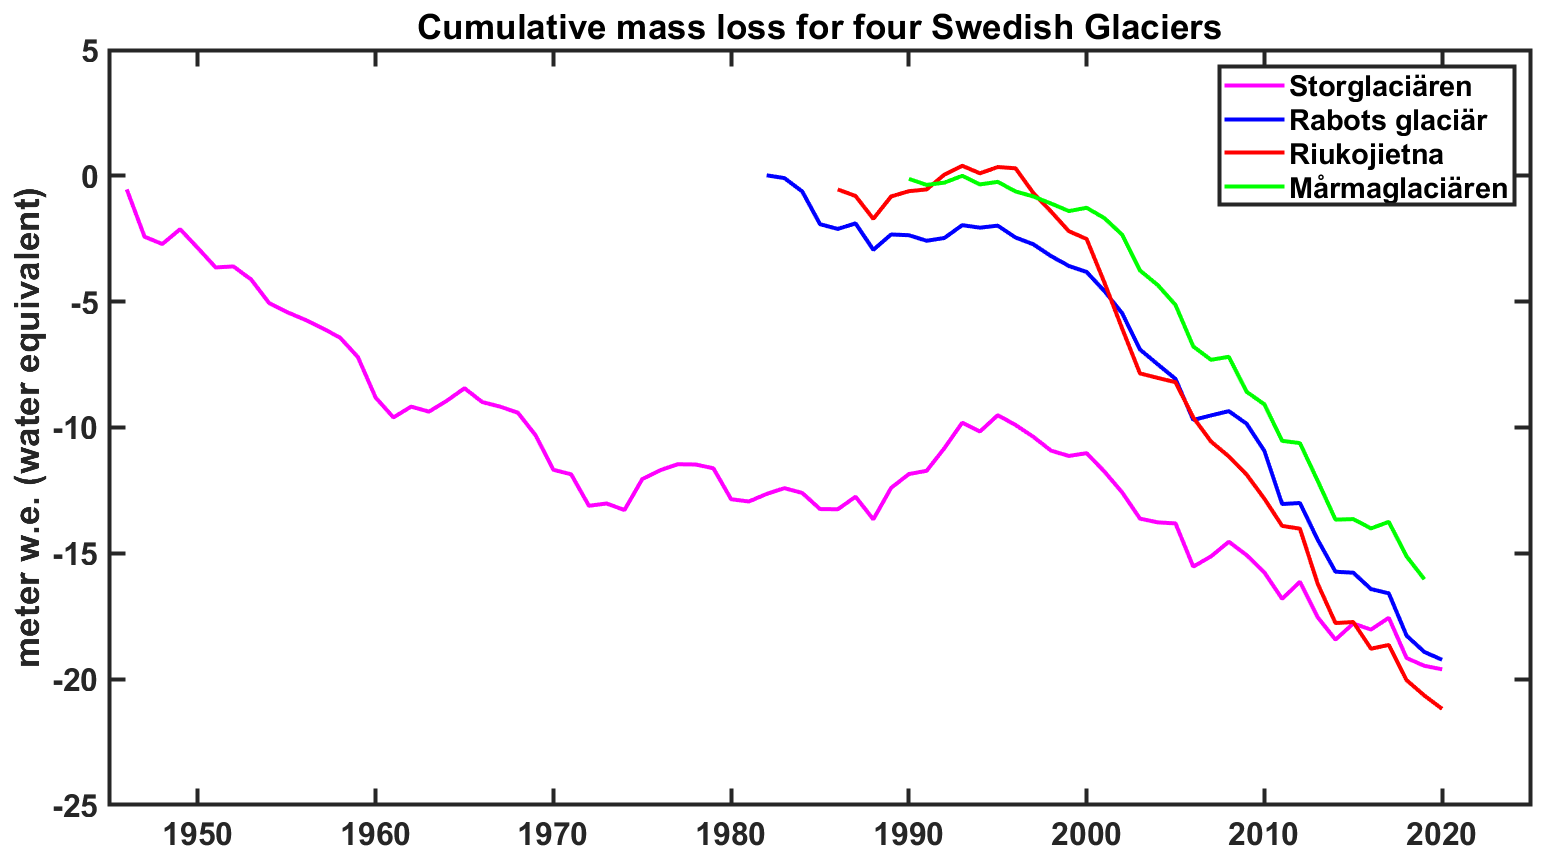
Figure 12Cumulative mass loss for four Swedish glaciers, i.e. Storglaciären (since 1946), Rabots glaciär (since 1982; no data for 2004 and 2007 and, hence, interpolated), Riukojietna (since 1986; data for 2004 interpolated), and Mårmaglaciären (since 1990; no data for 2020). Data source: SITES data portal at https://data.fieldsites.se/portal/ (last access: 10 February 2022); World Glacier Monitoring Service, 2021; Swedish Infrastructure for Ecosystem Science, 2021a, b, c).
For the period 1850–2008, the total river discharge from the Baltic Sea catchment area, reconstructed from observations (Bergström and Carlsson, 1994; Cyberski et al., 2000; Hansson et al., 2011; Mikulski, 1986) and hydrological model results (Graham, 1999), showed no statistically significant trend but a pronounced multidecadal variability, with a period of about 30 years (Meier et al., 2019d). Furthermore, summed river flow observations in the period 1900–2018 (Lindström, 2019) and a historical reconstruction of the annual river discharge for the past 500 years showed no statistically significant trend either (Hansson et al., 2011). However, river runoff from northern Sweden, part of the catchment area of the Bothnian Bay, has significantly increased since the 1980s compared to 1911–2018 (Lindström, 2019).
There are indeed substantial regional and decadal variations in the river flow. Stahl et al. (2010) studied the near-natural rivers of Europe over the period 1942–2004 and found a clear overall pattern of positive trends in annual streamflow in the northern areas. Kniebusch et al. (2019b) also identified a statistically significant positive trend in the river discharge to the Bothnian Bay for 1921–2004. In Estonian rivers, regime shifts in annual specific runoff corresponded to the alternation of wet and dry periods (Jaagus et al., 2017). A dry period started in 1963–1964, followed by a wet period from 1978, with the latest dry period commencing at the beginning of the 21st century.
For the period 1920–2005, positive trends in streamflow at stations of a pan-Nordic dataset dominate annual mean, winter, and spring figures, whereas summer trends are statistically not significant (Wilson et al., 2010). A clear signal of earlier snowmelt floods and a tendency towards more severe summer droughts in southern and eastern Norway were found.
The observed temperature increases have affected streamflow in the northern Baltic Sea region for 1920–2002 in a manner corresponding well to the projected consequences of a continued rise in global temperature in terms of increasing winter time discharges (Hisdal et al., 2010). However, the regional impacts of precipitation change on both the observed and projected changes in streamflow are still unclear, as the combined effects of changes in precipitation and temperature are still not well known (Stahl et al., 2010).
In the northern Baltic Sea region, all the way south to the Gulf of Finland, runoff is strongly linked to the climate indices air temperature, wind, and rotational circulation components. In the southern region, runoff is associated more with the strength and torque of the cyclonic or anticyclonic pressure systems (Hansson et al., 2011).
In the Baltic states, changes in streamflow over the 20th century showed a redistribution of runoff over the year, with a significant increase in winter and a tendency for decreasing spring floods (Reihan et al., 2007; Sarauskiene et al., 2015; Jaagus et al., 2017). A similar winter trend has also been found for the reconstructed river discharge to the entire Baltic Sea since the 1970s (Meier and Kauker, 2003).
For the period 1911–2010, a trend of observed annual maximum daily flows in Sweden could not be detected (Arheimer and Lindström, 2015). However, in particular, the annual minimum daily flows in northern Sweden considerably increased in the period 1911–2018 (Lindström, 2019). Analysing a pan-European database, Blöschl et al. (2017) showed that river floods over the past 5 decades occurred earlier in spring due to (1) an earlier spring snowmelt in northeastern Europe, (2) delayed winter storms associated with polar warming around the North Sea, and (3) earlier soil moisture maxima in western Europe.
3.2.2(2) Land nutrient inputs
The Baltic Sea catchment area of 1.7 × 10⁶ km2, which is more than 4 times larger than the sea surface area of the Baltic Sea (see Fig. 1), is populated by over 84 × 106 inhabitants. Stretching between 49–69∘ N and 10–38∘ E, the catchment exhibits significant gradients in both natural (precipitation, river discharge, temperature, etc.) and anthropogenic (population density and occupation and agricultural and industrial development, etc.) environmental factors. These factors change both in time (phenological changes, long-term trends, and lags due to land cover processes) and space (north–south gradients in climate and land use and east–west gradients in socioeconomic features and climate), thus determining heterogeneity and variation in land nutrient inputs that drive long-term eutrophication of the Baltic Sea (Savchuk, 2018, and references therein; Kuliński et al., 2021).
Estimates of nutrient inputs had been attempted since the 1980s (e.g. Larsson et al., 1985; Stålnacke et al., 1999) and are now being compiled within a permanent process of the HELCOM Pollution Load Compilation (PLC; e.g. Sonesten et al., 2018). However, these data officially reported to HELCOM by the participating riparian states have been, and are still, suffering from gaps and inconsistencies. Therefore, the best available estimates have been reconstructed in attempt to both fill in such gaps and correct possible sources of inconsistencies (Savchuk et al., 2012; Svendsen and Gustafsson, 2020). For long-term studies of the Baltic Sea ecosystem, a historical reconstruction of nutrient inputs since 1850 has been made available (Gustafsson et al., 2012).
According to HELCOM (HELCOM, 2018a; Savchuk, 2018) and updated estimates (Sonesten et al., 2018), substantial reductions in land nutrient inputs, comprising riverine inputs and direct point sources at the coast, have been achieved since the 1980s (Fig. 11; Table 10). Since there are no statistically significant trends in annual river discharge (Sect. 3.2.2(1)), these reductions are attributed to socioeconomic development, including the expansion of the wastewater treatment and the reduction in atmospheric nitrogen deposition (Gauss et al., 2021) over the entire Baltic Sea drainage basin and not to climate-related effects (HELCOM, 2018a; Svendsen and Gustafsson, 2020). As an example, the coastal point sources of total nitrogen (TN) and total phosphorus (TP) decreased 3- and 10-fold, respectively, compared to the 1990s (Savchuk et al., 2012) and today contribute fewer nutrients to the Baltic Sea than they did in 1900 (Savchuk et al., 2008; Kuliński et al., 2021).
Agriculture is the main source of anthropogenic diffuse nutrient inputs, which comprise 47 % of the riverine nitrogen and 36 % of the riverine phosphorus inputs (Sonesten et al., 2018). In turn, mineral fertiliser dominates the anthropogenic nutrient inputs to the Baltic Sea catchment, in particular in its intensely farmed southern part (Hong et al., 2017). However, during 2000–2010, only about 17 % of the net anthropogenic nitrogen and only about 4.7 % of the net anthropogenic phosphorus input to the catchment were exported with rivers to the sea (Hong et al., 2017). While denitrification might have removed part of the nitrogen applied in agriculture, the remaining phosphorus has accumulated in the drainage basin. A global budget estimated that agriculture has increased the soil storage of phosphorus in the drainage basin by 50 Mt during 1900–2010 (Bouwman et al., 2013), and a regional approach calculated an increase by 40 Mt during 1900–2013 (McCrackin et al., 2018). However, McCrackin et al. (2018) estimated that about 60 % of these phosphorus inputs were retained in a stable pool and did not contribute noticeably to the riverine export. About 40 % accumulated in a mobile pool with a residence time of 27 years. McCrackin et al. (2018) suggested that leakage from this mobile legacy pool is the, though slowly declining, dominant source of present riverine phosphorus inputs.
3.2.3 Terrestrial biosphere
Previous assessments
Referring to the comprehensive review of climate-related changes in terrestrial ecosystems in the first BACC report (BACC Author Team, 2008), Smith et al. (2008), concluded that climate change during the preceding 30–50 years had already caused measurable changes in terrestrial ecosystems in the Baltic Sea region, e.g. an advancement of spring phenological phases in some plants, upslope displacement of the alpine treeline, and increased land surface greenness in response to improved growth conditions and a richer CO2 supply. But as nearly all ecosystems in the region were managed to some extent, the climate impacts might be alleviated or intensified by human interventions, e.g. by choosing favourable tree species in forestry. The observed trends were expected to continue for at least several decades, assuming that continued future increases in the atmospheric CO2 concentration will cause continued warming.
In the second BACC report (BACC II Author Team, 2015), climate effects on terrestrial ecosystems were less in focus, with a section related to forests and natural vegetation in the chapter on environmental impacts on coastal ecosystems, birds, and forests (Niemelä et al., 2015) and as part of the chapter on socioeconomic impacts on forestry and agriculture (Krug et al., 2015). On the other hand, the second BACC report also considered anthropogenic land cover changes as a driver of regional climate change (Gaillard et al., 2015). Niemelä et al. (2015) concluded that the observed positive effects of climate change on forest growth would continue, in particular for boreal forest stands that benefitted more than temperate forest stands. The species composition of natural vegetation in the Baltic Sea region was expected to undergo changes, with a predominantly northward shift of the hemiboreal and temperate mixed forests. Terrestrial carbon storage was likely to increase in the region, but land use change could play an important modifying role, affecting this storage both positively and negatively. Krug et al. (2015) concluded that there were regional differences in how the vulnerability and productivity of forestry systems were affected by climate change, with the southern and eastern parts of the Baltic Sea region likely to experience reduced production and the northern and western parts increased production. Gaillard et al. (2015) found no indication that deforestation in the Baltic Sea region since 1850 could have been a major cause of the observed climate warming.
Acknowledging the importance of the land component in the climate system, the IPCC recently published its special report entitled “Climate Change and Land” on climate change, desertification land degradation, sustainable land management, food security, and greenhouse gas fluxes in terrestrial ecosystems (IPCC, 2019b). This is because land, including its water bodies, provides the basis for human livelihoods and wellbeing through primary productivity, the supply of food, fresh water, and multiple other ecosystem services.
Biophysical and biogeochemical interactions
The land surface and its terrestrial ecosystems in the Baltic Sea region interact with the atmosphere and are, thus, coupled to the local and regional climate. These interactions determine the exchanges of heat, water, and momentum between the land surface and the atmosphere via biophysical processes, the exchange of greenhouse gases, e.g. CO2, CH4 and N2O, and emissions of black carbon from forest fires, aerosol precursors, e.g. biogenic volatile compounds, or organic carbon aerosols via biogeochemical processes altering the atmospheric composition.
The nature of the biophysical and biogeochemical interactions between the land surface and the atmosphere and their effects on climate are studied by comparing the effects of forests with that of open land, e.g. grassland, pastures, or cropland (e.g. Bonan, 2016). Details on the nature of these feedbacks are given in Gröger et al. (2021b).
On average, across the globe, forests absorb atmospheric CO2 and, thus, reduce net radiation and have a cooling effect on climate. In equilibrium, forest ecosystems, are expected to be carbon neutral, with carbon loss through phenological turnover, mortality, and decomposition over large areas on average, matching plant productivity. CO2 fertilisation is considered a strong driver for the terrestrial carbon sink, but demographic recovery following past land use, e.g. afforestation and replanting of harvested forest stands, likely provides an equally important explanation for net carbon uptake by forests in industrialised regions of North America, Europe, and Asia (Pugh et al., 2019). Deforestation, on the other hand, can lead to a release of carbon and to an increase in net radiation and, thus, has a warming effect on climate (Friedlingstein et al., 2020, and references therein). In contrast to the biophysical effects and some of the other biogeochemical interactions, the biogeochemical interactions associated with the carbon cycle have global impacts and operate at very long timescales.
Anthropogenic land use and land cover changes
Using remote sensing data, Jin et al. (2019) investigated recent trends in springtime plant phenology in the Baltic Sea region and the sensitivities of phenological trends to temperature and precipitation, in spring, winter, and summer. Considering the entire region and combining all vegetation types, the authors found an advancement of the growing season by 0.30 d yr−1 over the period 2000–2016. The advancement was particularly strong for evergreen needleleaf forests (0.47 d yr−1) and weaker for cropland and grassland (0.14 d yr−1). Evergreen needleleaf forests, together with deciduous broadleaf forests, dominate the northern part of the Baltic Sea region, while the southern part is mainly grassland and cropland. Jin et al. (2019) found that the most important driver of the advancement of the growing season is spring mean temperature, with an advancement rate of 2.47 d (∘C)−1 of spring warming when considering the entire area and all vegetation types. In this study, spring was defined as the 3 months preceding the start of the growing season. Spring drying could further increase the advancement rate by a 0.18 d cm−1 decrease in precipitation. While the sensitivity of the start of the growing season to climate conditions in spring is comparable for the entire Baltic Sea region, the sensitivity to climate conditions in the previous summer and winter seasons differs between the northern and southern parts of the region. In both seasons, an increase in the mean temperature was found to advance the growing season in the southern part of the Baltic Sea region but to delay the start of the growing season in the northern part, which is in contrast to the spring warming. These sensitivities were markedly stronger for summer than for winter. These trends in plant phenology in spring result in changes of the land cover early in the year, thus affecting climate through biophysical and biogeochemical interactions with the atmosphere.
Considering the mechanisms for the delayed start of the growing season in Fennoscandia in relation to a warming in the preceding summer and winter seasons, Jin et al. (2019) evaluated the effects on plant dormancy. A winter warming could, for instance, prolong the chilling accumulation required to break winter dormancy of trees. Later summer temperatures, on the other hand, could affect bud dormancy initiation, while reduced soil moisture associated with higher summer and autumn temperatures could delay the leafing and flowering of plants. However, the details of the mechanisms involved have not yet been explored.
Observations reveal a local impact of changes in forest cover on near-surface temperatures, due to biophysical effects that depend on the geographical latitude, roughly separating the boreal regions and the temperate zone of the Northern Hemisphere. When investigating the effects of small-scale clearings at sites in the Americas and Asia, M. Zhang et al. (2014) found, on both continents, that annual mean temperatures cooled over open land north of about 35∘ N and warmed south of this latitude. Changes in forest cover have, however, different effects on daily minimum and daily maximum temperatures. M. Zhang et al. (2014) found that the warming effect over open land south of 35∘ N was related to an increase in daily maximum temperatures, with little change in daily minimum temperatures, while the cooling effect to the north was due to a decrease in daily minimum temperatures. Lee et al. (2011) showed consistent results for North America, where the cooling effect of 0.85±0.44 ∘C over non-forested areas north of 45∘ N was due to a decrease in daily minimum temperatures associated with the reduced roughness length. At night, open land cools more than forests, regardless of the geographical latitude. This is confirmed by Alkama and Cescatti (2016), who analysed the impacts of recent losses in forest cover on near-surface and land surface temperatures in the boreal zone. For both, the authors found cooling trends in daily minimum and warming trends in daily maximum temperatures in response to deforestation and opposite tendencies after afforestation. These effects were somewhat stronger for land surface temperatures than air temperatures.
RCMs have been used to investigate the biophysical effects of changes in forest cover on climate in Europe. Strandberg and Kjellström (2019), for instance, used simulations with the Rossby Centre Atmosphere (RCA) RCM to assess the climate effect of maximal afforestation or deforestation in Europe, focusing on seasonal mean temperatures and precipitation, and daily temperature extremes. Maximum afforestation and deforestation were inferred from a simulation with the LPJ-GUESS dynamical vegetation model, providing a map for potential natural forest cover for Europe in equilibrium with present-day climate (Gröger et al., 2021a). To simulate maximum afforestation, present-day land cover classes, which represent considerable agricultural activity in Europe (particularly in western, central, and southern Europe) were replaced by the potential natural forest cover. In the case of deforestation, on the other hand, the potential natural forest cover was converted to grassland in the model.
The simulations indicated that afforestation in Europe generally increased evapotranspiration, which, in turn, led to colder near-surface temperatures. In western, central, and southern Europe, the cooling in winter due to afforestation was between 0.5 and 2.5 ∘C. The cooling effect was somewhat stronger in summer, exceeding 2.5 ∘C in large parts of western and southeastern Europe. Deforestation had the opposite effect, with warmer near-surface temperatures due to decreased evapotranspiration, typically in the range between 0.5 and 2 ∘C in western and central Europe and reaching up to 3 ∘C in southeastern Europe. In regions with low evapotranspiration, however, changes in the surface albedo were relatively more important for temperatures. During summer, warming by deforestation affected the entire Baltic Sea region (in the range between 0.5 and 1.5 ∘C), while the cooling associated with afforestation only affected its southern part. Over parts of Scandinavia, afforestation actually resulted in a slight warming of about 0.5 ∘C. In winter, the cooling effect of afforestation was only evident over the southern part of the Baltic Sea region, while deforestation had no effect on winter temperatures.
Strandberg and Kjellström (2019) found relatively strong biophysical effects of afforestation or deforestation in Europe on daily maximum temperatures in summer. Deforestation markedly increased daily maximum temperatures over the entire Baltic Sea region (typically between 2 and 6 ∘C), while afforestation lowered daily maximum temperatures in the southern part of the region by about 2 to 6 ∘C and slightly increased temperatures over parts of Scandinavia. In contrast to its cooling effect on mean winter temperatures, afforestation lead to a warming of the daily minimum temperatures in the southern part of the Baltic Sea region in the range between 2 and 6 ∘C.
In a similar study with the regional model REMO, Gálos et al. (2013) investigated the biophysical effects of afforestation in Europe on climate and also compared these effects to the climatic changes expected from future global warming. Potential afforestation was implemented by specifying deciduous forest cover at all vegetated areas that were not covered by forests at the end of the 20th century, mainly in western, central, and eastern Europe. Given the strong historical deforestation in central Europe, there is the potential for rather extensive afforestation in the southern part of the Baltic Sea region but less potential in the northern part, i.e. Scandinavia and Finland. The results indicated a cooling effect of the re-established forests in boreal summer exceeding 0.3 ∘C, mainly related to increased evapotranspiration from the trees, in combination with intensified fluxes of latent heat due to stronger vertical mixing. The stronger latent heat fluxes also enhanced precipitation by more than 10 % in some regions. These effects of potential afforestation counteracted the projected future changes in climate, i.e. somewhat reduced the magnitude of the pronounced future warming and markedly reduced the future drying in the boreal summer. In some cases, such as in northern Germany, the enhanced precipitation was found to completely offset the drying effect of future warming. More recent results (Meier et al., 2021b) have used rain gauge data to estimate precipitation changes induced by land cover change. Meier et al. (2021b) created a statistical model to show that reforestation of agricultural land can increase precipitation locally, especially in winter, and were able to separate the effects on both local and downwind precipitation regionally and seasonally. They also found that climate-change-induced summer precipitation reductions could be offset by reforestation, with a particularly strong effect in southwestern Europe. However, their analyses also indicate small precipitation increases in the Baltic Sea region, relative to a baseline scenario with no land cover change, consistent with the results of Gálos et al. (2013).
In a more regionalised study, Gao et al. (2014) applied an RCM to investigate the biophysical effects of peatland forestation in Finland before (1920) and after drainage (2000s). In Finland, as in other northern European countries, vast areas of naturally treeless or sparsely tree-covered peatland were drained for timber production in the second half of the 20th century. The total peatland area of Finland was estimated to be 9.7 × 10⁶ ha in the 1950s, but at the beginning of the 21st century, the area of peatland drained for forestry was estimated to 5.5 × 10⁶ ha. The authors found that the peatland forestation caused warming in spring, i.e. during the snowmelt season, and slight cooling in the growing season (May through October). The spring warming was mainly caused by decreased surface albedo and the cooling in the growing season by increased evapotranspiration.
3.2.4 Cryosphere
3.2.4(1) Snow
In the Baltic Sea region, snow cover is an important feature that greatly affects cold season weather conditions. It is characterised by very high interannual and spatial variability. Snow cover is a sensitive indicator of climate change, and its variations are closely related to air temperature in many regions. General climate warming is expected to reduce snow cover. Several thaw periods now interrupt snow cover, making it less stable. Total winter snowfall in northern Europe is projected to decrease but is still expected to increase in mid-winter in the very coldest regions (Räisänen, 2016).
Previous climate change assessments demonstrated a number of snow cover trends in recent decades in the Baltic Sea region (BACC Author Team, 2008; BACC II Author Team, 2015). A decrease in snow cover was observed in the south, while an increase in snow storage and the duration of snow cover was detected in the northeast and in the Scandinavian mountains. The spring snowmelt has become earlier in most parts of the region. As a result, the spring maximum river discharge has become smaller and earlier, shifting in many regions from April to March.
Recent investigations confirm these results. Snow cover in the Northern Hemisphere has decreased since mid-20th century (IPCC, 2014a), as also shown by satellite measurements (Estilow et al., 2015). The largest decline in the extent of snow cover has been observed in March–April and also in summer. Using the satellite-based National Oceanic and Atmospheric Administration (NOAA) Climate Data Record (CDR) for the period 1970–2019, it was shown that the annual snow cover fraction has reduced over most areas of the Northern Hemisphere by up to 2 % per decade (Zhu et al., 2021). Thereby, the annual snow cover area has reduced by 2×10⁵ km2 per decade.
In 1980–2008, the snow cover duration in northern Europe decreased by about 3–7 d per decade, and the trend was significant at many stations (Peng et al., 2013). Most of the reduction happened in spring, with the end date of snow cover 5 d earlier per decade, on average (Peng et al., 2013). Snow cover variability over Europe is closely related to temperature fluctuations, which, in turn, are determined by large-scale atmospheric circulation during the cold season (Ye and Lau, 2017). A recent study of European snow depth data in 1951–2017 demonstrated an accelerated decrease after the 1980s (Fontrodona Bach et al., 2018), with an average decline, excluding the coldest climates, of 12.2 % per decade for mean snow depth and 11.4 % per decade for its maximum. A decreasing trend in snow density was detected in the eastern Baltic Sea region in 1966–2008 (Zhong et al., 2014).
In Poland, rather large changes in snow cover parameters were found for 1952–2013 (Szwed et al., 2017). The duration of snow cover decreased in almost the whole country, but this change is mostly not statistically significant. The total reduction in snow cover duration was 1–3 weeks over the 62 years, but the mean and maximum snow depths did not change. The start date of snow cover has not changed, but the end date moved slightly earlier (Szwed et al., 2017). In a recent study, statistically significant decreasing trends in snow cover duration and of in snow depth, based on 40 Polish stations in 1967–2020, were found (Tomczyk et al., 2021). The trend values for the number of days with snow cover were from −3.5 to −4.9 d per decade.
The snow cover regime at 57 stations in the eastern Baltic Sea region (Lithuania, Latvia, and Estonia) in 1961–2015 was analysed by Rimkus et al. (2018). The mean decrease in snow cover duration was 3.3 d per decade and was statistically significant at 35 % of the measuring sites, mostly in the southern part of the region. There were no trends in maximum snow depth. An earlier study for Lithuania found similar results (Rimkus et al., 2014).
A detailed study of snow cover data at 22 stations in Estonia during the period 1950–1951 to 2015–2016 revealed remarkable decreasing trends (Viru and Jaagus, 2020). Snow cover duration decreased significantly at 16 stations, and the mean decrease was 4 d per decade. Start dates for permanent snow cover had a non-significant tendency to occur later. Permanent snow cover had a statistically significant trend to end earlier at almost all stations. There were no overall trends in maximum snow depth in Estonia in 1951–2016 (Viru and Jaagus, 2020).
Significant decreases in snow depth parameters were found in Finland in recent decades (Aalto et al., 2016; Luomaranta et al., 2019). Regional differences were substantial. In 1961–2014, the largest decrease in snow depth occurred in the southern, western, and central parts of Finland in late winter and early spring. In northern Finland, a decrease in snow depth was most evident in spring, with no change in the winter months, even though the amount of solid precipitation was found to increase in December–February (Luomaranta et al., 2019). Winter mean snow depth (Jylhä et al., 2014) and the annual maximum snow depth (Lehtonen, 2015) has decreased significantly at many stations in southern Finland. At the same time, the annual maximum snow depth has not changed in Finnish Lapland (Lépy and Pasanen, 2017; Merkouriadi et al., 2017).
For the century 1909–2008, a general decrease was detected in many snow cover parameters at three stations in different parts of Finland (Irannezhad et al., 2016). A sharp decline in annual peak snow water equivalent has been detected since 1959. The period of permanent snow cover shortened by 21–32 d per century. However, it should be noted that the study of Irannezhad et al. (2016) was based on a temperature index snowpack model using daily temperature and precipitation as input rather than directly using snow observations.
A decline in snow cover parameters was found also in Norway for 1961–2010 (Dyrrdal et al., 2012; Rizzi et al., 2017).
3.2.4(2) Glaciers
A recent basic inventory of Scandinavian glaciers is available through the Randolph Glacier Inventory (RGI Consortium, 2017; Pfeffer et al., 2014), a collection of digital outlines of the world's glaciers prepared to meet the needs of the Fifth IPCC Assessment Report (IPCC, 2014b; Vaughan et al., 2014). It has since been updated in support of the IPCC Special Report on the Ocean and Cryosphere in a Changing Climate (IPCC, 2019a; Hock et al., 2019). Of the 3417 Scandinavian glaciers reported in the Randolph Glacier Inventory (v6.0), 365, with a combined area of ca. 360 km2, lie within the Baltic Sea drainage basin, as defined by Vogt et al. (2007, 2008), and are all in the Scandinavian mountains. The combined glacier volume estimate (following Farinotti et al., 2019) for the Scandinavian glaciers reported in Hock et al. (2019) is 0.7±0.2 mm global sea level equivalent or 254±72 Gt. The rate of mass loss for all Scandinavian glaciers (not only in the Baltic Sea drainage basin) for the period 2006–2015 is 2±1 Gt yr−1, corresponding to a negligible 0.01±0.00 mm yr−1 of global sea level rise equivalent, yet with potential importance for local streamflow (Hock et al., 2019; Zemp et al., 2019). With a 90 %–100 % likelihood, atmospheric warming is the primary driver of glacier mass loss (Hock et al., 2019).
Most of the 365 glaciers in the Baltic Sea drainage basin are in Sweden (ca. 72 % by number; ca. 75 % by area), with the remaining ones in Norway. Both Sweden and Norway do nationally coordinated glacier monitoring, with the most recent results summarised in the Global Glacier Change Bulletin (GGCB) no. 3 (World Glacier Monitoring Service, 2021; World Glacier Monitoring Service, 2020) as, among other factors, glacier mass balance changes. A glacier mass balance year usually covers the period from 1 September to 31 August in the subsequent year. The GGCB includes four Swedish glaciers, two of which (Rabots glaciär and Storglaciären in the Kebnekaise massif, which has the world's longest continuous mass balance record, starting in 1945–1946) are so-called reference glaciers. This means that their dynamics are not dominated by non-climatically driven dynamics such as calving or surging, and that more than 30 years of ongoing measurements are available (Fig. 12). In Table 11, mass balances of the Swedish GGCB glaciers, following the World Glacier Monitoring Service (2021), are summarised. None of the Norwegian GGCB glaciers are in the Baltic Sea drainage basin.
These increasingly negative mass balances with time coincide with globally increasing air temperatures, with the latest 6 years, 2015–2020, being the warmest since instrumental recording began (World Meteorological Organization, 2020). Regional and local deviations in mass loss from that anticipated by long-term global warming are, however, expected. For example, slightly positive mass balances were observed for Mårmaglaciären, Storglaciären, and Riukojietna in 2016–2017 as a result of a cold summer (Swedish Infrastructure for Ecosystem Science, 2020; World Glacier Monitoring Service, 2021).
The ice summit of Kebnekaise Sydtopp (south peak) lost its status as Sweden's highest in September 2019 and 2020 when, due to melting of its ice-covered summit, its elevation dropped below that of the rocky, non-ice-covered Kebnekaise Nordtopp (north peak; Stockholm University – Department of Physical Geography, 2017, 2019, 2020).
3.2.4(3) Permafrost
The drainage basin of the Bothnian Bay is characterised by low mean annual air temperatures and includes boreal forest and mountain ecosystems, as well as large peatland areas. In this region, permafrost – ground frozen for at least 2 consecutive years – exists in high alpine environments and in peatlands. While almost all Baltic Sea drainage basin permafrost is found in the Bothnian Bay catchment, some isolated occurrences of permafrost are found in the upper reaches of alpine rivers farther south (mainly the Umeälven headwaters). Permafrost is a thermal state of ground, rock, soil, or sediment and occurs in regions with low mean annual air temperatures. Temperature is the strongest control on permafrost, but thin winter snow depth also favours permafrost aggradation and stability. In alpine permafrost, insolation is an important factor. In the upper Torne river catchment, incoming shortwave summer radiation causes a difference in the altitude of alpine permafrost from 850 m a.s.l. (above sea level) on shaded slopes to 1100 m a.s.l. on south-facing slopes (Ridefelt et al., 2008). In lowland areas, permafrost is more likely to form and persist in peatlands, where the low thermal conductivity of peat insulates the ground from warm summer air (Seppälä, 1986). Mire complexes with palsas, elevated peat mounds with an ice-rich permafrost core, are the most common form of lowland permafrost in the Baltic Sea drainage basin (Luoto et al., 2004). Palsa mires in the Baltic Sea basin are predominantly found in regions with a mean annual air temperature of <−3 ∘C and low mean annual precipitation (often <450 mm), based on the 1961–1990 climate period (Fronzek et al., 2006).
Earlier maps of the Northern Hemisphere permafrost extent showed relatively extensive Fennoscandian permafrost, especially in alpine regions (Brown et al., 1997). Recent advances in permafrost modelling reveal a more nuanced picture, where permafrost is spatially patchy, persisting at high elevations and in lowland regions with low precipitation and large expanses of peat plateaus (Obu et al., 2019; Gisnås et al., 2017). Consistent with the observation of permafrost warming and thawing (Biskaborn et al., 2019), models indicate substantial permafrost losses in recent decades. High-resolution modelling (1 km pixels) driven by remotely sensed land surface temperature showed that ca. 6200 km2 of permafrost in 1997 was reduced to 4800 km2 in 2018 (Obu et al., 2020). Most of this loss is modelled alpine permafrost (here defined as >700 m a.s.l.), decreasing from 4700 to 3700 km2, while lowland permafrost has decreased from 1500 to 1100 km2 (Fig. 13).
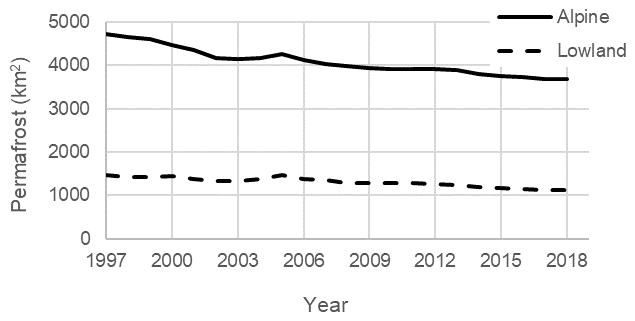
Figure 13Modelled permafrost extent of alpine (>700 m a.s.l.) and lowland permafrost for the years 1997–2018 in the Baltic Sea drainage basin. Data source: Permafrost data are from Obu et al. (2020), the extent of the catchment is from Hannerz and Destouni (2006), and the elevation data are from the U.S. Geological Survey (USGS) Global Multi-resolution Terrain Elevation Data 2010 (GMTED2010). Analyses are performed at 1 km resolution in an equal area projection.
3.2.4(4) Sea ice
Introduction
Sea ice is an essential indicator of climate change and variability in the Baltic Sea region. Not only does the existence of sea ice indicate the general severity of the winter due to its close correlation with winter air temperature, but, in addition, parameters such as the annual maximum sea ice extent of the Baltic Sea (MIB), duration of ice season, and maximum thickness of level ice have been monitored regularly in the Baltic Sea since the late 19th century. The MIB was observed even earlier.
The BACC II Author Team (2015) concluded that all sea ice observations demonstrated large interannual variations, but with a long-term, statistically significant, trend to milder ice conditions that is projected to continue in future (Fig. 14). In this section, we review recent ice climate research in the Baltic Sea and provide updated figures on sea ice trends and projections that largely confirm previous conclusions.
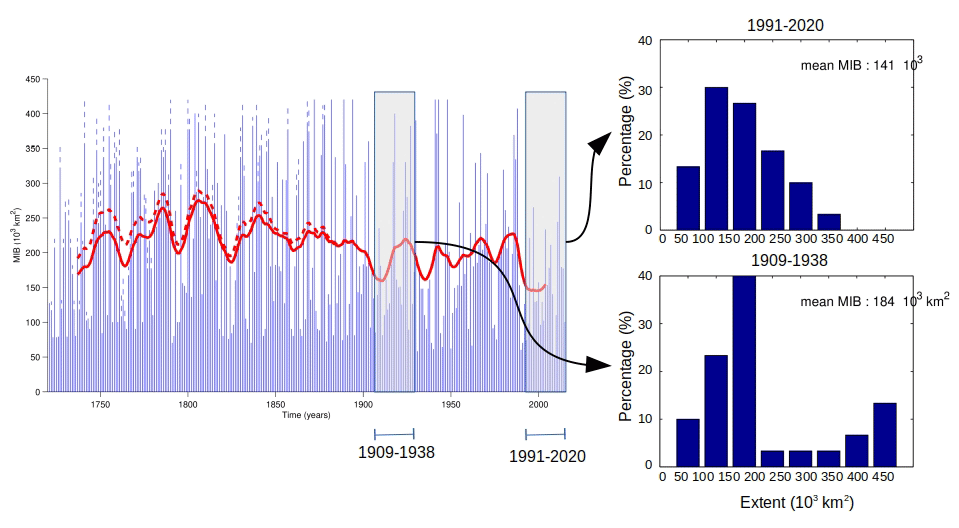
Figure 14The graph on the left shows the annual maximum sea ice extent of the Baltic Sea (MIB) in kilometres squared (km2) during 1720–2020. Blue bars show the annual mean, and red lines show the 15-year running means. The dashed bars represent the error range of the early observations (Vihma and Haapala, 2009). The error range of the 30-year moving average is indicated by two red curves, which converge into one when high-quality data became available. The graphs on the right show the 30-year distribution functions of MIB during 1909–1938 and 1991–2020. Data sources: https://www.eea.europa.eu/data-and-maps/daviz/maximum-extent-of-ice-cover-3#tab-chart_1 (last access: 17 February 2022); Finnish Meteorological Institute (https://en.ilmatieteenlaitos.fi/ice-season-in-the-baltic-sea, last access: 17 February 2022).
An important indicator of advancing climate change in the Baltic Sea region is that two of the latest six ice winters have been extremely mild (2015–2020). In winter 2015, the Bothnian Bay was not fully covered by ice (with a MIB of 51 000 km2), which is the first such extreme winter observed with certainty. The winter of 2020 was even milder, with a MIB of only 37 000 km2, and the lowest value in a time series that began in 1720.
Sea ice conditions in the Baltic Sea
Recently, on average, the northern sea areas of the Baltic Sea are ice covered every year from December to May. During the mildest winters, only the Bothnian Bay (in a few years even only partially) and coastal zones of other basins are ice covered. In the past, the entire Baltic Sea was ice covered only in the most severe winters, e.g. 1940, 1942, and 1947 (Vihma and Haapala, 2009).
In the fast ice regions near the coast, sea ice grows by thermodynamic processes only. Maximum sea ice thickness in the fast ice regions typically amounts to 40–70 cm in the Bothnian Bay and 10–40 cm in the Bothnian Sea, Gulf of Finland, and Gulf of Riga. Ice thickness is regularly monitored at tens of fast ice sites.
Observations of sea ice thickness in drift ice are much more limited. A recent study combined all airborne electromagnetic ice thickness measurements in the Bothnian Bay and derived the first estimate of the basin-scale ice thickness distribution in the Baltic Sea (Fig. 15; Ronkainen et al., 2018). An important finding of that study was that mean ice thickness in drift ice regions is greater than the thickness of fast ice and also greater than the ice thickness indicated on the ice charts. As expected, the data showed large interannual variability, but temporal and spatial coverage was not sufficient for conclusions on changes in drift ice thickness.
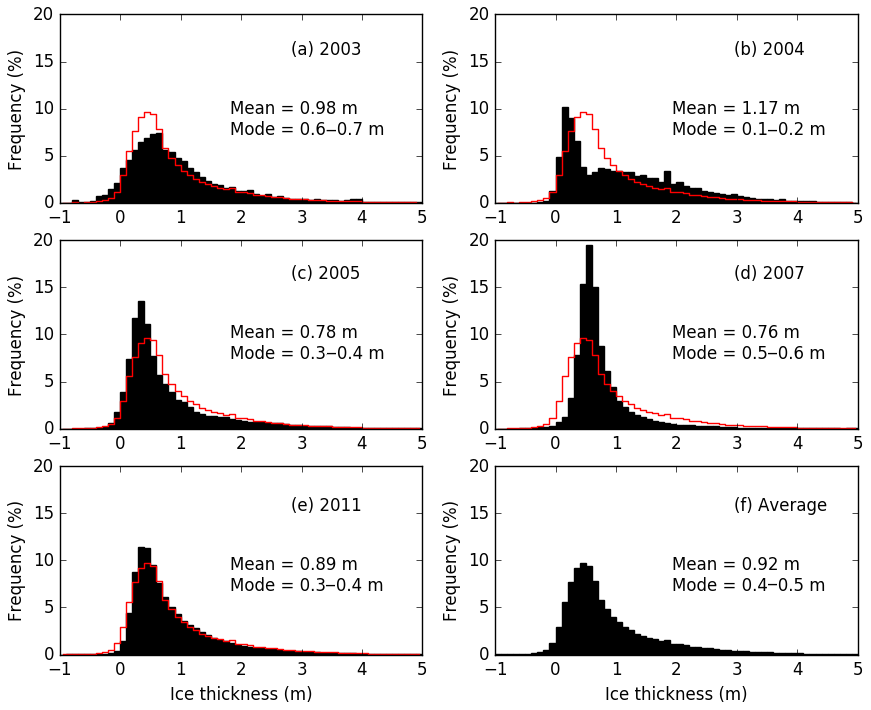
Figure 15Sea ice thickness distribution in the Bothnian Bay, as estimated from helicopter electromagnetic measurements during February–March in five winters (a–e), and its five-winter average (f), also shown as a red line in panels (a–e). Source: Ronkainen et al., 2018.
Individual ice ridges caused by compression and shearing of ice drift can be 30 m thick. The largest gradients in ice motion are found in the coastal zone (Leppäranta et al., 2012), where mean ice thickness over several square kilometres can be 1–3 m (Ronkainen et al., 2018).
In some circumstances, sea ice can accumulate towards the coast and cause spectacular on-shore ridges or a ride-up of several hundred metres from the shore to the land, causing damage to built structures (Leppäranta, 2013). Such events have been observed in exposed coastal regions, where the stability of fast ice can be overcome by combinations of storms, currents, and water level (Leppäranta, 2013). In the Bothnian Bay, such events can occur regardless of the severity of ice seasons. In the southern Baltic Sea, on-shore ice has been common during severe winters. During the last 10 years, such events were observed in 2010, 2011, 2012, and 2019 (Girjatowicz and Łabuz, 2020).
Observed changes
Long-term changes of the MIB (Seinä and Palosuo, 1996; Niskanen et al., 2009) are shown in Fig. 14. The trend of the MIB during the last 100 years (1921–2020) is − 6400 km2 per decade. This is almost twice the trend reported by the BACC II Author Team (2015), based on the period 1910–2011. Since 1987 no severe and no extremely severe ice winters and since 2012 only average, mild, or extremely mild winters have been observed. The latter sea ice conditions explain the accelerated trend after 2011.
The recent 30-year period (1991–2020) is definitely the mildest since 1720 (Uotila et al., 2015). The probability distribution of the MIB has shifted towards low values, with severe winters being very rare (Fig. 14). The 30-year mean MIB is now 139 000 km2, and the winter of 2021, with a MIB of 127 000 km2 on 15 February 2021 (Jouni Vainio, FMI, personal communication), was close to this mean. During the second-mildest 30-year period (1909–1938), the average MIB was 184 000 km2, and during the last 100 years it was 182 000 km2. The shape of the MIB probability distribution has changed, also indicating a change in sea ice extremes. According to the ice season classification (Seinä and Palosuo, 1996), the recent 30-year period includes only one severe ice winter (2011) and 13 mild ice winters.
Present ice conditions differ from the past to the extent that Rjazin and Pärn (2020) even suggested defining this change as a regime shift. They analysed changes in sea ice extent and air temperature in the Baltic Sea in 1982–2016, using a method of splitting the time series in two and concluded that a regime shift towards milder ice conditions occurred in 2006–2007.
Other studies complement these and BACC II conclusions. Kiani et al. (2018) examined the influence of atmospheric changes on ice roads between Oulu and Hailuoto. They used air temperature data to calculate freezing and thawing degree days and found that freezing degree days decreased and thawing degree days increased significantly during 1974–2009. As a consequence, the ice road season started later and ended earlier.
Merkouriadi and Leppäranta (2014) analysed ice thickness and freezing and break-up dates collected at Tvärminne Zoological Station, at the entrance to the Gulf of Finland. They found a decrease of almost 30 d in the ice-covered period and a reduction of 8 cm in annual maximum ice thickness in the last 40 years. Laakso et al. (2018) used observations from the Utö Atmospheric and Marine Research station during 1914–2016 and concluded that the length of the ice season has decreased from 10–70 d before 1988 to 0–35 d after 1988 in the northern Baltic Sea proper. Figures 16 and 17 show level ice thickness at Kemi and Loviisa and the length of the ice season at Kemi, Loviisa, and Utö, respectively. All graphs show statistically significant decreasing trends, except the level ice thickness at Kemi station, which was probably influenced by snow cover or changes in measurement location.
3.2.4(5) Lake ice
The recent change in ice phenology is probably the single most important climatically induced alteration in lake environments within the Baltic Sea catchment. The new literature demonstrates, almost unanimously, significant changes towards earlier ice break-up, later freeze-up, and shorter duration of ice cover across the Baltic Sea catchment, apart from the coldest climate regime in Lapland. The available centennial data indicate that the ice cover duration has decreased by several days per century, whereas the intensified warming in recent decades has produced a similar change per decade (Efremova et al., 2013; Filazzola et al., 2020; Kïaviòš et al., 2016; Knoll et al., 2019; Korhonen, 2019; Lopez et al., 2019; Nõges and Nõges, 2014; O'Reilly et al., 2015; Ptak et al., 2020; Sharma et al., 2016, 2020; Wrzesiński et al., 2015). However, very few lakes have responded only weakly to the warming trend, such as Lake Peipus in Estonia, probably due to increasing snowfall. In individual years, a positive wintertime NAO seems to be an important factor causing a short ice cover duration. Among the main properties that affect the ice cover of individual lakes are size, depth, and shoreline complexity.
3.2.5 Ocean and marine sediments
3.2.5(1) Water temperature
The main driver of annual mean water temperature variations and long-term changes is air temperature (Meier et al., 2019c, d; Kniebusch et al., 2019a; Dutheil et al., 2021). The Baltic Sea water temperature has risen the fastest at the sea surface (Meier et al., 2022). With time, the heat spreads downward through different processes, such as lateral inflows, vertical down-welling, and diffusion, and eventually the whole water column warms up, with the smallest trends in the cold intermediate layer between the thermo- and halocline (Meier et al., 2022).
Since the 1980s, marginal seas around the globe have warmed faster than the global ocean (Belkin, 2009), and the Baltic Sea has warmed the most (Belkin, 2009). Climate change and decadal variability led to an annual mean, area-averaged increase in Baltic SST of + 0.59∘ per decade for 1990–2018 (Siegel and Gerth, 2019) and of + 0.5∘ per decade for 1982–2013 (Stramska and Białogrodzka, 2015). Both figures were derived from satellite data. In accordance with earlier investigations (BACC Author Team, 2008; BACC II Author Team, 2015), SST variability in winter can be linked to the NAO (Stramska and Białogrodzka, 2015). However, the spatial maps of SST trends by Stramska and Białogrodzka (2015) differ from those by Lehmann et al. (2011), perhaps because of the differing horizontal resolution of the satellite data products. Linear trends for the Baltic Sea during 1982–2012 of 0.41∘ per decade are slightly larger than 0.37∘ per decade for the North Sea (Høyer and Karagali, 2016).
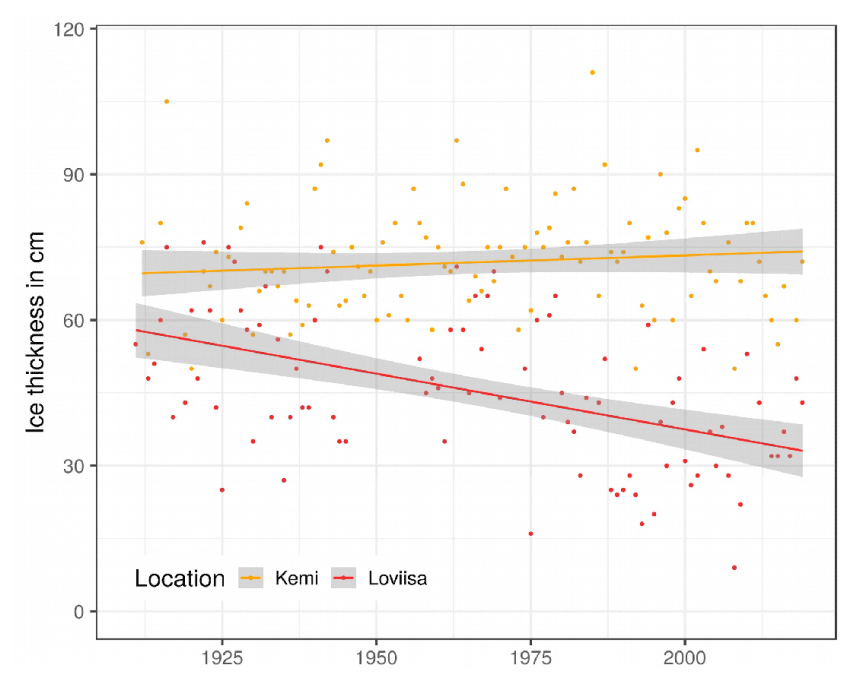
Figure 16Level ice thickness at Kemi, Finland, and Loviisa, Finland, during 1912–2019. Dots are the annual mean, and lines are the linear trend with 95 % confidence intervals. Data are available from the ice service of the Finnish Meteorological Institute, Helsinki, Finland, upon request (https://en.ilmatieteenlaitos.fi/ice-conditions, last access: 6 March 2022).
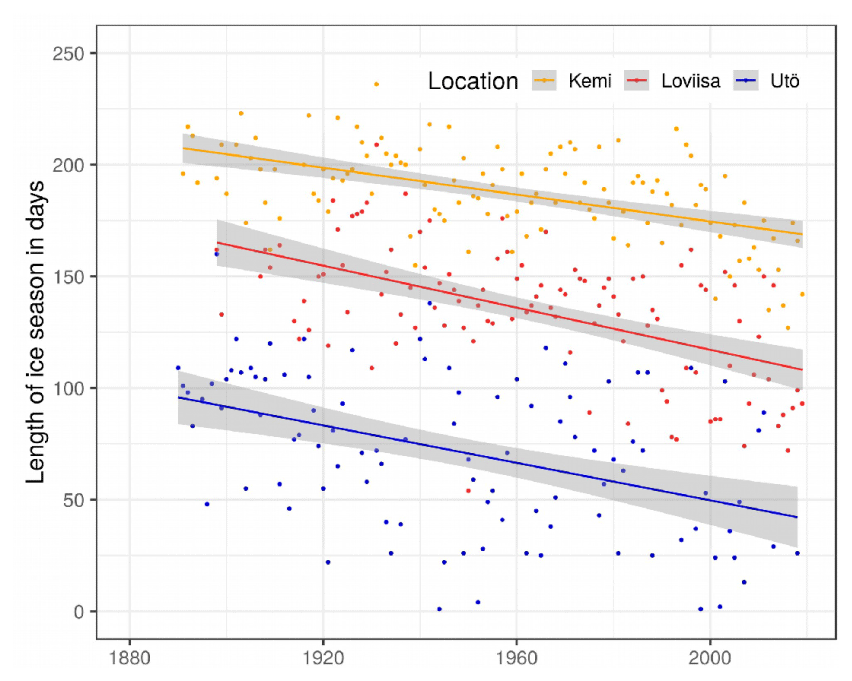
Figure 17Length of the ice season in days at Kemi, Loviisa, and Utö (Finland) during 1890–2019. Dots are the annual mean, and lines are the linear trend with 95 % confidence intervals. Data are available from the ice service of the Finnish Meteorological Institute, Helsinki, Finland, upon request (https://en.ilmatieteenlaitos.fi/ice-conditions, last access: 6 March 2022).
Using monitoring data, Liblik and Lips (2019) found that the upper layer has warmed by 0.3–0.6∘ per decade and the sub-halocline deep layer by 0.4–0.6∘ per decade in most of the Baltic Sea during 1982–2016. The total warming in the whole Baltic Sea at all monitoring stations was 1.07∘ over 35 years, approximately twice that of the upper 100 m in the Atlantic Ocean.
During 1856–2005, the reconstructed Baltic Sea average annual mean SST increased by 0.03 and 0.06∘ per decade in the northeastern and southwestern areas, respectively (Kniebusch et al., 2019a). The largest SST increase trends were found in the summer season in the northern Baltic Sea (Bothnian Bay). Bottom water temperature trends were smaller than SST trends, with the largest increase in the Bornholm Basin. Independent monitoring data support the results of the long-term reconstruction (Figs. 18 and 19; see also Meier et al., 2019c, d). The largest SST warming occurred in summer (May to September), while trends in winter were smaller (Kniebusch et al., 2019a; Liblik and Lips, 2019).

Figure 18Annual mean values of deseasonalised daily sea surface (left column) and bottom (right column) temperature (red dots) at seven monitoring stations during 1877–2018. For the location of the stations, see Fig. 2. The grey lines show the period when every station has data for every year (1954–2018). Data source: for Figs. 18, 19, 21, and 22, ICES data (https://www.ices.dk/data/data-portals/Pages/ocean.aspx, last access: 21 February 2022) for temperature and salinity (bottle data; i.e. from specific depths) were used. Postprocessing of the data was done, following Radtke et al. (2020), in order to overcome possible seasonal biases due to missing values in the observations. Therefore, gaps were statistically filled using GAMMs (general additive mixed models), taking the seasonality into account.
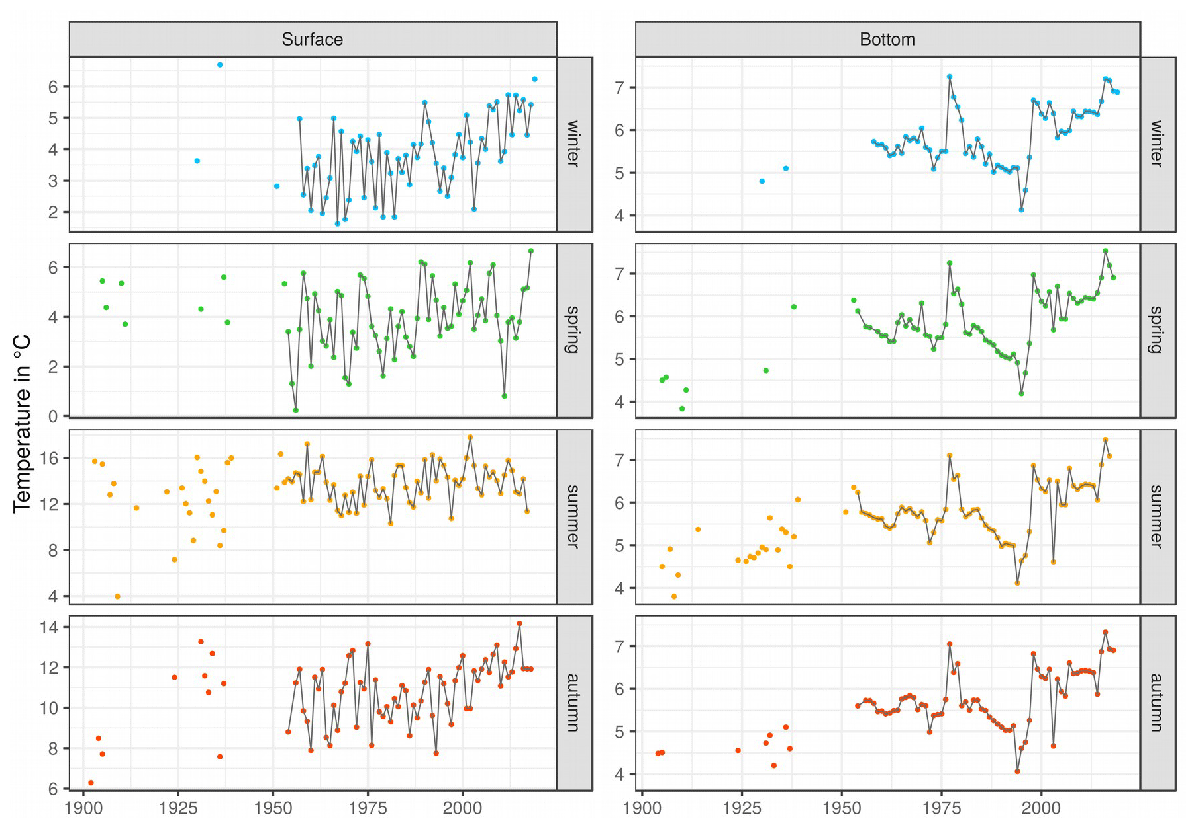
Figure 19Seasonal mean sea surface and bottom temperature values during 1877–2018 at Gotland Deep (BY15). Blue, green, yellow, and orange show winter, spring, summer, and autumn, respectively. The grey lines show the period when every station has data for every year (1954–2018).
During the more recent period of 1978–2007, the annual mean SST trend was 10 times higher, with a mean of 0.4∘ per decade (Kniebusch et al., 2019a). Trends increased more in the northeastern areas than in the southwestern areas and exceeded the contemporary trends in air temperature. See also the MARNET station data at Darss Sill and Arkona Deep in the southwestern Baltic Sea (Fig. 20).
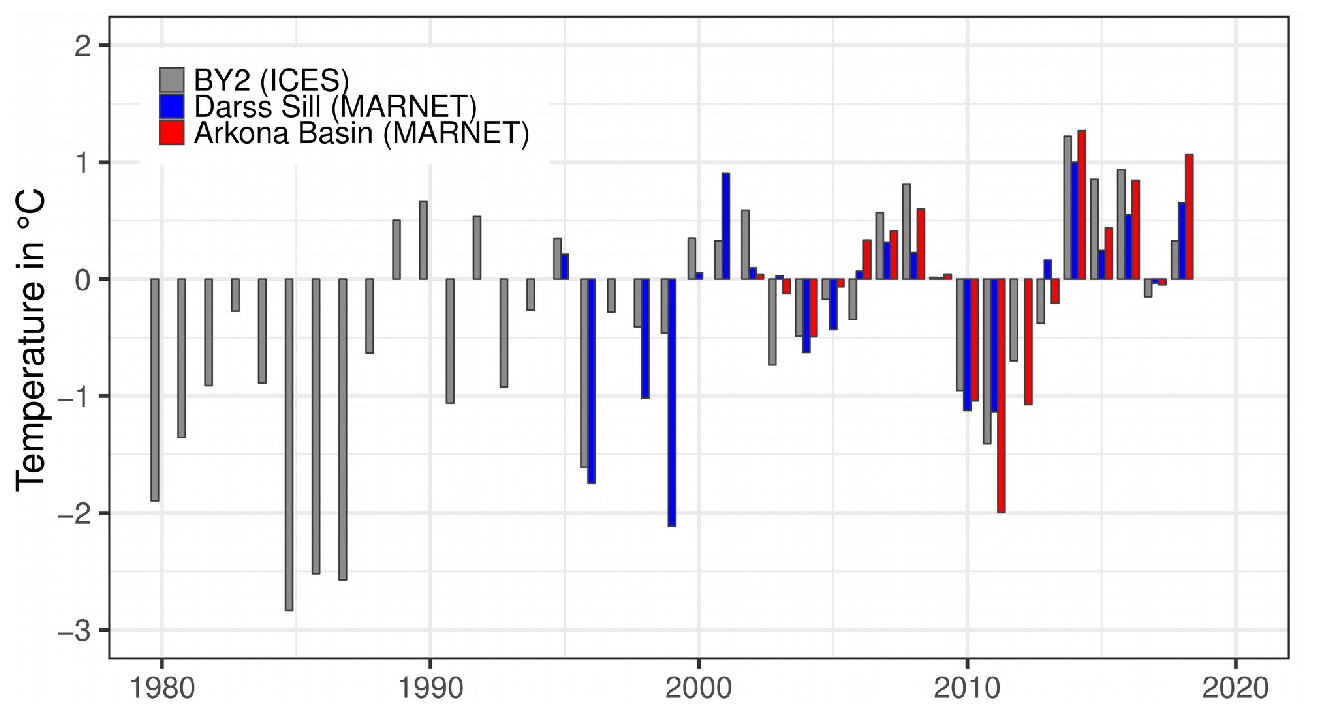
Figure 20Annual mean sea surface temperature anomalies, with respect to the reference period of 2002–2018, of deseasonalised measurements at the monitoring station BY2 (for the location, see Fig. 2) and the MARNET stations (Darss Sill and Arkona Basin) during 1980–2018. Data source: Oceanographic Data Center at the Federal Maritime and Hydrographic Agency (dod@bsh.de).
The seasonal ice cover clearly plays an important role in the Baltic Sea by decoupling the ocean and the atmosphere in winter and spring. Hence, the large trends in air temperature in winter were not reflected by the SST trends because the air temperature was still below the freezing point. During the melting period, the ice albedo feedback led to larger trends in SST than during the ice-covered period because of a prolonged warming period of seawater.
It has been suggested that the accelerated warming in 1982–2006 might partly be explained by a dominance of the positive phase of the AMO (Kniebusch et al., 2019a). Furthermore, historical eutrophication redistributed the heat in the ocean by warming the surface layer more than the underlying layers, in particular during spring and summer, because the increased water turbidity caused an enhanced absorption of sunlight close to the sea surface. However, modelling studies suggest that the historical eutrophication had no impact on SST trends (Löptien and Meier, 2011).
The summer of 2018 was the warmest on instrumental record in Europe and also the warmest summer in the past 30 years in the southern half of the Baltic Sea (Naumann et al., 2019), with surface water temperatures 4–5∘ above the 1990–2018 long-term mean. This heatwave was also observed in the bottom temperatures (Humborg et al., 2019). However, systematic studies on changes in Baltic Sea marine heatwaves are not available.
3.2.5(2) Salinity and saltwater inflows
During the last decade, many new insights have been gained about the salt balance of the Baltic Sea and the dynamics of inflow and mixing processes. The Major Baltic Inflow (MBI) in December 2014, in particular, triggered new investigations and is by far the most intensively observed and modelled inflow event. The pathways and timing of the inflowing water were tracked by observations (Mohrholz et al., 2015), and numerical modelling (Gräwe et al., 2015) could reproduce the salt mass and volume of the inflow, as calculated from observations. The inflow was found to be barotropically (pressure) controlled in the Danish straits but dominated by baroclinic (density stratification) processes on the pathway farther into the Baltic proper. At the Bornholm Gat and the Słupsk Furrow ,the water exchange showed the clear two-layer flow pattern of an estuarine circulation. The inflow-related studies were underpinned by theoretical work based on the famous Knudsen relation (Knudsen, 1900) for estuarine exchange flow and its extension to total exchange flow by Burchard et al. (2018). The contribution of the inflowing saline water to the spatial distribution of salt and the total salt budget depends essentially on mixing with ambient brackish waters. In the course of the inflow path, the character of the mixing process between the deep salty layer and the brackish water above changes with increasing depth and decreasing current velocities. In the entrance area, the mixing is dominated by the entrainment of brackish water into the eastward-spreading saline bottom water due to turbulence generated by shear instability. The sills between the consecutive Baltic basins are particular mixing hotspots (Neumann et al., 2017). In the deeper basins of the Baltic proper, boundary mixing driven by the interaction of currents and internal waves with the topography and mixing processes at sill overflows contribute to the upward salinity flux (Reissmann et al., 2009). Mixing in the eastern Gotland Basin was investigated during the Baltic Sea Tracer Release Experiment (BATRE). Using an inert tracer gas, the basin-scale vertical diffusivities were estimated to 10−5 m2 s−1, whereas the locally inferred diffusivities in the basin's interior were 1 order of magnitude lower (Holtermann et al., 2012). This finding holds also for the inflow of saline water in course of an MBI (Holtermann et al., 2017). The interior mixing is often controlled by double diffusive convection that leads to a typical staircase-like vertical stratification structure (Umlauf et al., 2018). The crucial role of boundary mixing at the basin rim was confirmed by Holtermann and Umlauf (2012) and Lappe and Umlauf (2016). Both studies identified near-boundary turbulence as the key process for basin-scale mixing. The main energy sources for boundary mixing are basin-scale topographic waves, deep rim currents, and near-inertial waves.
The temporal statistics of barotropic saline inflows were reviewed by Mohrholz (2018). In contrast to earlier investigations, Mohrholz (2018) found no long-term trend in inflow frequency but a pronounced multidecadal variability in 25 to 30 years. Lehmann and Post (2015) and Lehmann et al. (2017), who studied the frequency and intensity of large volume changes in the Baltic Sea due to inflows, likewise could not find a long-term trend. The distinction between MBIs and smaller inflows is artificial and does not correspond to the frequency distribution of the inflows, which shows an exponential decrease in frequency with increasing inflow intensity (Mohrholz, 2018). The classical MBIs are only responsible for about 20 % of the total salt input, while the rest is accounted for by medium and small inflows with much less pronounced interannual variability.
Palaeoclimate simulations nearly covering the recent millennium (Schimanke and Meier, 2016) have provided new insights into the long-term behaviour of the mean salinity of the Baltic Sea. In accordance with previous historical reconstruction studies (Schimanke and Meier, 2016; Meier and Kauker, 2003), Schimanke and Meier (2016) identified river discharge, net precipitation, and zonal winds as the main drivers of the decadal variability in Baltic Sea salinity. However, their relative contributions are not constant. Extreme periods with strong salinity decrease for about 10 years occurred once per century. Thus, the long stagnation period from 1976 to 1992 was obviously a rare but natural event, although its extreme duration might be caused by anthropogenic effects. The Baltic Sea salinity also has a natural centennial variability. Based on the same numerical simulations, Börgel et al. (2018) could show a strong coherence between the AMO climate mode and river runoff on timescales between 60 and 180 years. Accordingly, the Baltic Sea salinity and the AMO are correlated, probably due to the dominating impact of river discharge on salinity. The river runoff leads salinity changes by about 20 years during the entire modelling period of 850 years. Schimanke and Meier (2016) reported a similar lag of 15 years between river runoff and Baltic Sea salinity.
According to model results, multidecadal variations in runoff (Gailiušis et al., 2011; Meier et al., 2019d) explain about half the long-term variability in volume-averaged Baltic Sea salinity (Meier and Kauker, 2003). Radtke et al. (2020) found that the direct dilution effect was only responsible for about one-fourth of the multidecadal variability and proposed a link between river runoff and inflow activity. Furthermore, they found that the influence of vertical turbulent mixing is small. Saltwater inflows contribute to the multidecadal salinity variability, in particular for the bottom layer salinity. The positive trend of river runoff in the northern catchment area led to a significant increase in the north–south salinity gradient in the Baltic Sea surface water layer (Kniebusch et al., 2019b). The causal relationship between the trends in runoff and horizontal salinity gradient was confirmed by numerically sensitivity experiments. Additionally, their model simulations revealed a multidecadal oscillation of salinity, river runoff, and saltwater inflows of about 30 years, consistent with the long-term observations.
From observations during 1982–2016, Liblik and Lips (2019) detected decreasing surface (see also Vuorinen et al., 2015) and increasing bottom salinities, but no long-term trend in the total salt budget were found (see Fig. 21). Both temperature and salinity contribute to a strengthening of the vertical stratification. Enhanced freshwater fluxes combined with higher deepwater salinities intensify the vertical density gradient throughout the year.
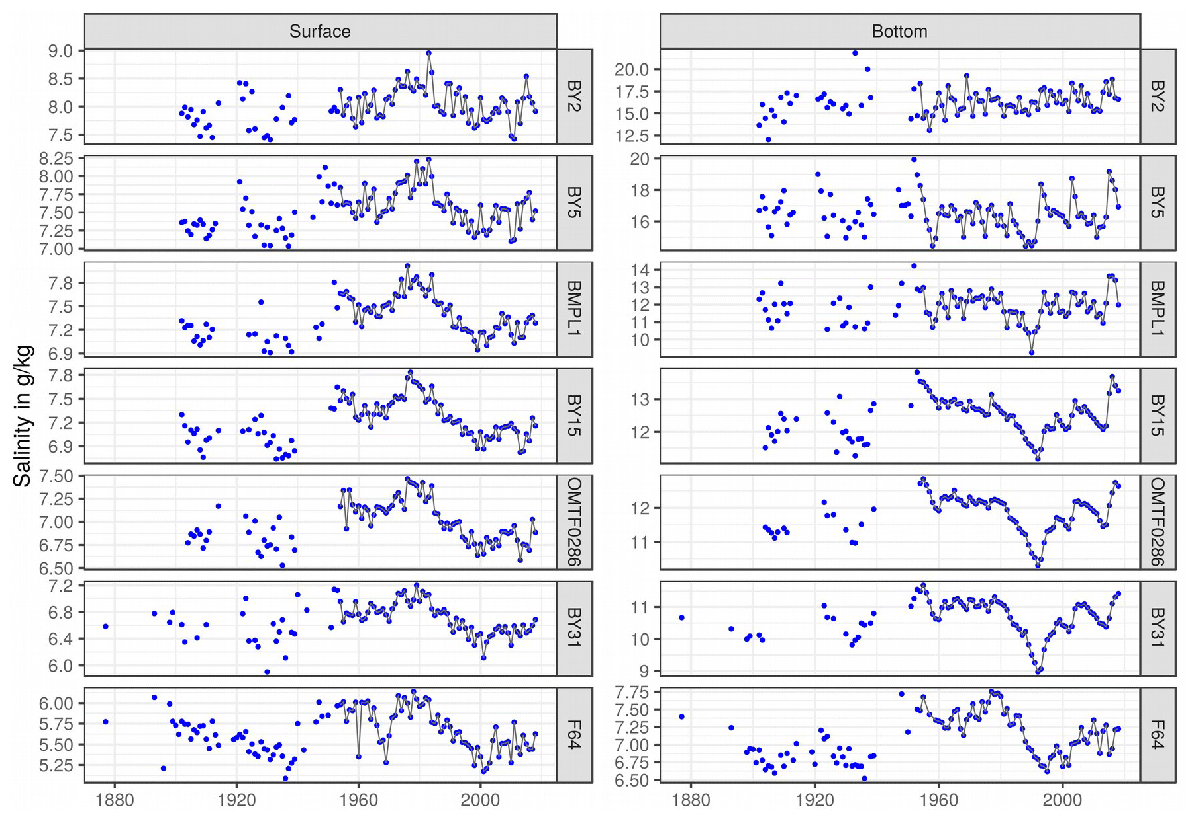
Figure 21Annual mean values of deseasonalised daily sea surface (left column) and bottom (right column) salinity (blue dots) at seven important stations during 1877–2018. The grey lines show the period when every station has data for every year (1954–2018).
3.2.5(3) Stratification and overturning circulation
A direct consequence of increasing stratification is that mixing between well-ventilated surface waters and badly ventilated deepwater weakens, making the Baltic Sea vulnerable to deoxygenation of bottom waters (Conley et al., 2002). An increase in seasonal thermal stratification (e.g. Gröger et al., 2019) can additionally lower the vertical nutrient transport from deeper layers to the euphotic zone, thereby limiting nutrient supply and potentially affecting algal and cyanobacterial blooms, at least at the species level. The latter potential effect has not yet been thoroughly investigated. However, the hypothesis was supported by the results of Lips and Lips (2008), who found a correlation between cyanobacteria bloom intensity in the Gulf of Finland and the frequency of upwelling events along both coasts.
Since the start of regular salinity measurements at the end of the 19th century, the saline stratification has been dominated by sporadic inflows from the adjacent North Sea and variations in river discharge (Fig. 22). While no long-term trends could be demonstrated in Baltic Sea salinity during 1921–2004 (Kniebusch et al., 2019b) or in halocline depth during 1961–2007 (Väli et al., 2013), a trend towards increased horizontal salinity difference between the northern and southern Baltic Sea was found during 1921–2004 (Sect. 3.2.5(2)). Furthermore, vertical stratification increased in most of the Baltic Sea during 1982–2016, with the seasonal thermocline strengthening by 0.33–0.39 kg m−3 and the perennial halocline by 0.70–0.88 kg m−3 (Liblik and Lips, 2019).
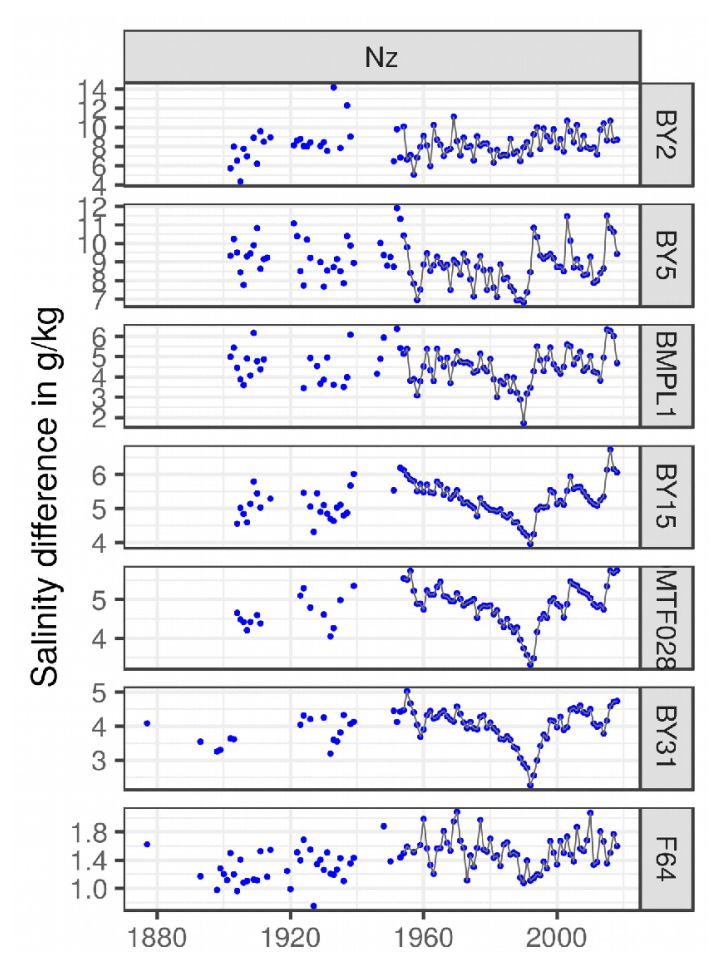
Figure 22Difference between bottom and surface salinity as a measure for the vertical stratification (blue dots) during 1877–2018. Only time steps when both values were available are considered. The grey lines show the period when every station has data for every year (1954–2018).
Sensitivity studies with a numerical model suggested that the basin-wide overturning circulation will decrease if the climate warms or when river runoff increases but will tend to increase if global sea level rises (Placke et al., 2021). However, historical multidecadal variations in the overturning circulation are mainly wind driven. Multidecadal variations in neither river runoff nor saltwater inflow have had an impact, according to Placke et al. (2021).
3.2.5(4) Sea level
For the era of continuously operated satellite altimetry, absolute mean sea level (relative to the reference geoid) increased in the Baltic Sea. Available estimates vary, depending on the exact period considered, but are broadly consistent with or slightly above the global average (3–4 mm yr−1; Oppenheimer et al., 2019; Nerem et al., 2018). For the period 1992–2012, Stramska and Chudziak (2013) estimated an increase of 3.3 mm yr−1, and for the period 1993–2015, Madsen et al. (2019) estimated an increase of 4 mm yr−1 in the Baltic Sea absolute mean sea level. For the period 1886–1889 to 2018, the analysis of Swedish mareograph data suggest a sea level rise of about 1-2 mm yr−1 (Figs. 23 and 24). Passaro et al. (2021) showed that the increase is not uniform across the Baltic Sea but varies between about 2 mm yr−1 in the western Baltic Sea and more than 5 mm yr−1 in the Gulf of Bothnia for the period 1995–2019. The acceleration of the sea level rise in the Baltic Sea was studied by Hünicke and Zorita (2016). They found that present acceleration is small and could only be detected through spatial averaging of observations.
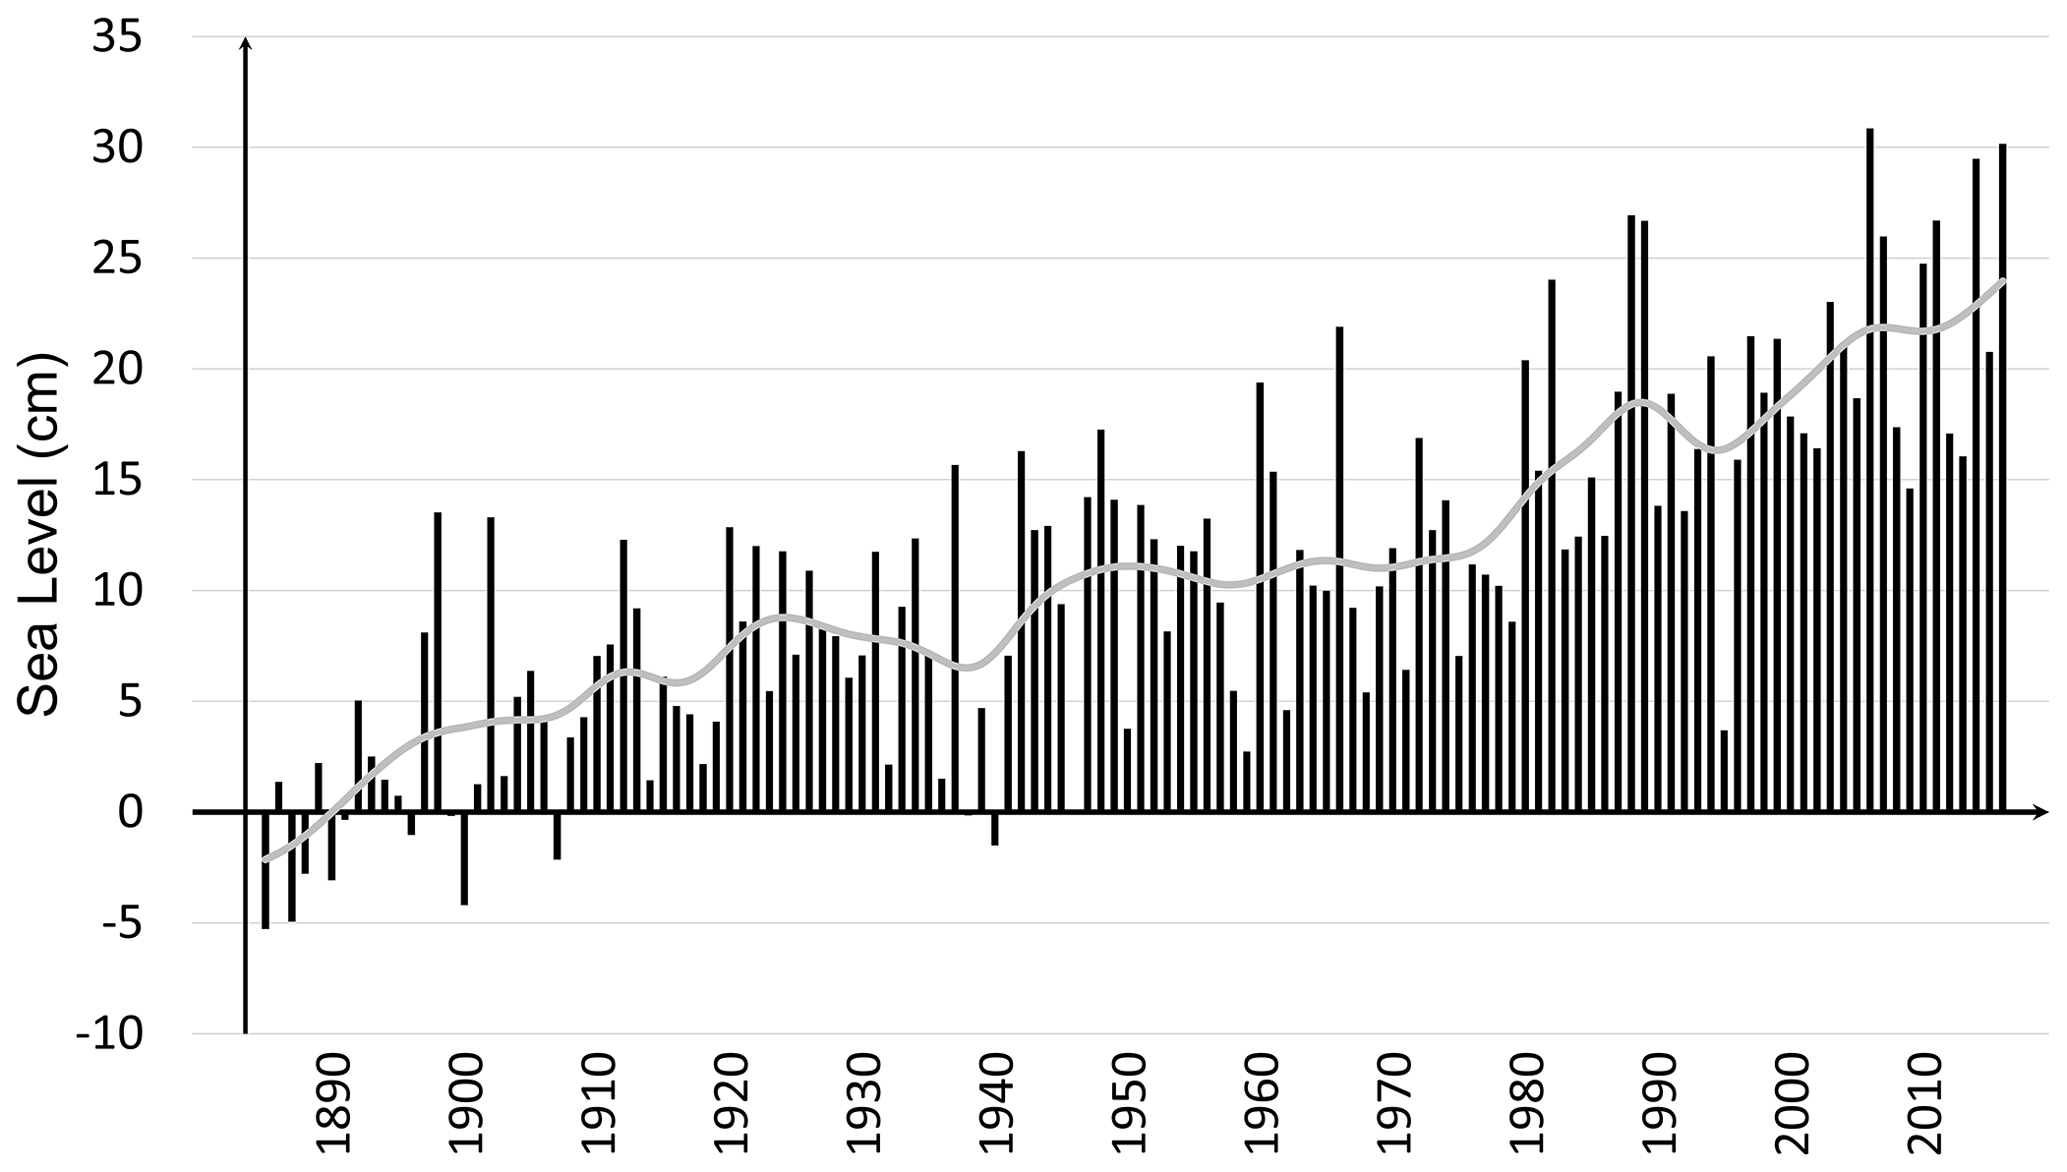
Figure 23Annual mean sea level changes in centimeters for 14 Swedish mareographs since 1886. The data are corrected for land uplift. The grey line shows a smoothed curve. Data source: https://www.smhi.se (last access: 5 March 2022) at the Swedish Meteorological and Hydrological Institute, Norrköping, Sweden, compiled by Berit Recklebe, Leibniz Institute for Baltic Sea Research Warnemünde, Rostock, Germany.
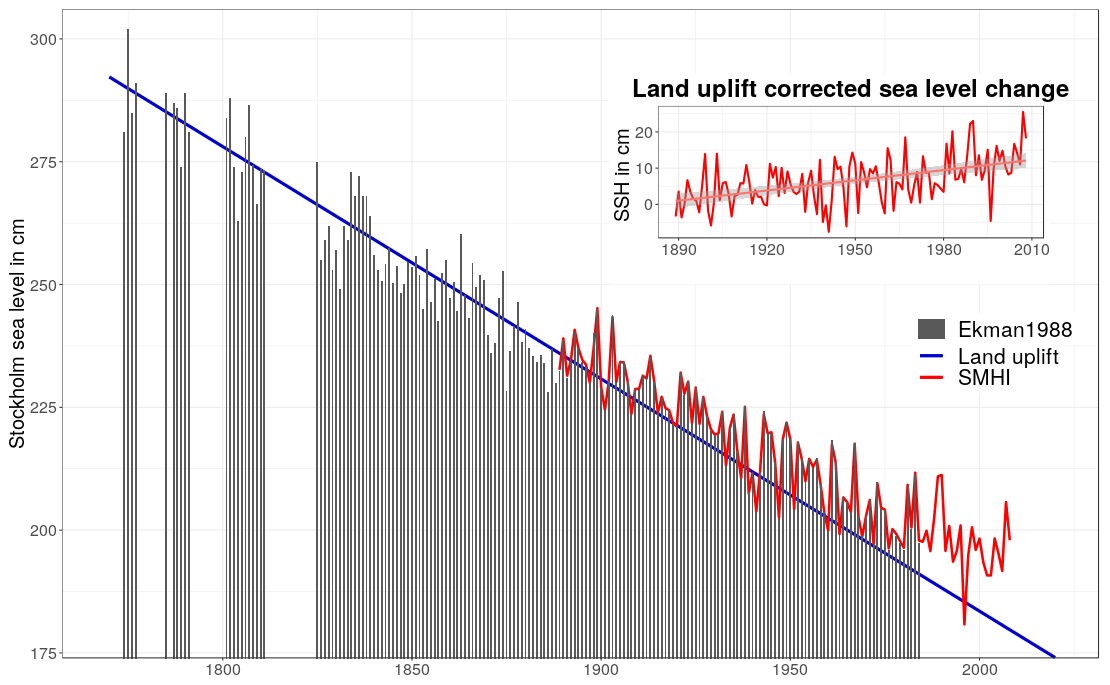
Figure 24Annual mean sea level in Stockholm during 1774–2018. Grey bars show the historic time series from Ekman (1988, 2003). Red is the SMHI data (RH2000, 1889–2018), and blue is the trend computed for 1774–1884 (estimated land uplift of 4.9 mm yr−1) and extrapolated until 2018. The SMHI data were adjusted to the historical data, considering the mean difference during the overlapping time period, to make both time series comparable. The sea level rise of the SMHI data were corrected by estimated land uplift amounts of 1.13 mm yr−1 during 1889–2018. Data source: https://www.smhi.se (last access: 5 March 2022) at the Swedish Meteorological and Hydrological Institute, Norrköping, Sweden.
Sea level changes relative to the coast are more complex, since land is rising in the northern Baltic Sea by up to about 10 mm yr−1 and sinking in the southern Baltic Sea by about 0.5 mm yr−1, relative to the Earth's centre of mass (Hünicke et al., 2015; Groh et al., 2017). In addition to the global mechanisms (thermal expansion due to warming and land–ice melting), sea level changes in the Baltic Sea are also affected by the changes in atmospheric circulation, water inflow from the North Sea, and changes in the freshwater budget (river runoff, precipitation, and evaporation). Precipitation and river runoff are linked to westerly winds and affect salinity and the salinity gradient across the Baltic Sea (Kniebusch et al., 2019b) and, thus, the sea level height and its gradient. Stronger-than-normal westerly winds are associated with increased transport across the Danish straits, which lead to an increase in the Baltic mean sea level. The correlations between the sea level height and westerly wind are higher in the eastern and northern parts and lower in the southern and western parts of the Baltic Sea. Westerly winds in the region became more intense from the 1960s to the early 1990s but weakened somewhat thereafter (Feser et al., 2015). Over longer periods, no significant long-term trend is detected (Feser et al., 2015).
The Baltic mean sea level shows a pronounced seasonal cycle, with a minimum in spring and maxima in late summer (in 1900–1930) or winter (in 1970–1998). According to Hünicke and Zorita (2008), the amplitude of the seasonal cycle increased over the 20th century. Other authors found different periods without systematic long-term trends (Barbosa and Donner, 2016) or even regional decreases (Männikus et al., 2020).
The Baltic sea level extremes are caused by strong atmospheric cyclones that are sometimes in interaction with seiches (Neumann, 1941; Wübber and Krauss, 1979; Matthäus and Franck, 1992; Wolski et al., 2014; Soomere and Pindsoo, 2016; Girjatowicz, 2004; Leppäranta, 2013; Orviku et al., 2011) or, more seldom and on smaller scales, by wind-induced meteotsunamis (Pellikka et al., 2020). Cyclones associated with strong onshore winds can cause coastal storm surges over several hours to about 1 d (Wolski and Wiśniewski, 2020). If the pathway of the cyclones is aligned along the west–east direction, they may also increase the volume of water in the Baltic Sea. Major inflow events are associated with volumes changes corresponding to an increase in the Baltic sea level of about 24 cm (Matthäus and Franck, 1992) at timescales of about 10 d or longer (Soomere and Pindsoo, 2016). Under such conditions, even moderate wind and wind surges may lead to coastal sea level extremes (e.g. Weisse and Weidemann, 2017). Extreme sea levels over a predefined threshold become more frequent with rising mean sea level (Pindsoo and Soomere, 2020). In addition, model results and an analysis of the observations indicate that changes in atmospheric forcing are responsible for the long-term increases in storm surges in some localised areas of the eastern Baltic Sea (Ribeiro et al., 2014). The presence of sea ice impedes the development of extreme sea levels by shielding the ocean surface from forcing by the wind. Coastal ice protects the coast from erosion by extreme sea levels, but a pileup of ice and ice growth down to the sea bottom can also result in the transport of bottom sediment when the ice drifts out to sea (Girjatowicz, 2004; Leppäranta, 2013; Orviku et al., 2011).
Storm surges caused by strong onshore winds represent a substantial hazard for the low-lying parts of the Baltic Sea coast and, in particular, the southwestern parts (Wolski et al., 2014), the Gulf of Finland (e.g. Suursaar and Sooäär, 2016), the Gulf of Riga (e.g. Männikus et al., 2020), and the Gulf of Bothnia (Averkiev and Klevanny, 2010). The highest surges were reported for the Gulf of Finland (about 4 m in 1824 in St. Petersburg) and the western Baltic Sea (more than 3 m in 1871; Wolski and Wiśniewski, 2020). For the Gulf of Riga and the western Baltic Sea, values around 2 and 1–1.5 m are frequent, respectively (Wolski and Wiśniewski, 2020). The 100-year storm surges are higher (up to 2.4 m) at the inner end of the basins, farthest away from the Baltic proper, than in the centre of the Baltic Sea (up to 1.2 m). No consistent long-term trend for an increase in extreme sea levels relative to the mean sea level of the Baltic Sea has been found, which is in agreement with earlier assessments (BACC II Author Team, 2015). This finding is supported by palaeoclimate model studies that show no influence on extreme sea levels in the North Sea in warmer climate periods compared to colder periods (Lang and Mikolajewicz, 2019) and by recent studies of sea level records that suggest a pronounced decadal to multidecadal variability in storm surges relative to the mean sea level (Marcos et al., 2015; Marcos and Woodworth, 2017; Wahl and Chambers, 2016). Although Ribeiro et al. (2014) argued for an increase in annual maximum sea level during 1916–2005, especially in the northern Baltic Sea, and attributed the trends to changes in wind, these results were likely affected by the long-term internal variability. Furthermore, extreme sea levels in the Gulf of Finland, especially in Neva Bay, are very sensitive to the position of storm tracks (Suursaar and Sooäär, 2007).
3.2.5(5) Waves
Instrumental wave measurements in the Baltic Sea have been made since the 1970s, first as measurement campaigns and then, since the 1990s, as continuous monitoring (e.g. Broman et al., 2006; Tuomi et al., 2011). As the spatial coverage of wave measurements is still quite sparse, and there are long-term data from few locations only, wave hindcasts have become a valuable tool for estimating the Baltic Sea wave climate (e.g. Björkqvist et al., 2018). Lately, satellite altimeter measurements have been used to estimate the changes in the Baltic Sea wave climate (Kudryavtseva and Soomere, 2017).
Hindcast studies (e.g. Räämet and Soomere, 2010; Tuomi et al., 2011; Björkqvist et al., 2020) are in good agreement with wave measurements and estimate the annual mean significant wave height (SWH) in the open sea areas of the Baltic Sea at 0.5–1.5 m. Wave growth in the Baltic Sea is hampered by the shape and small size of the basins. The highest mean values are recorded in the Baltic proper, with the longest and widest fetches. The gulfs have less severe wave climates (Björkqvist et al., 2020). In addition, wave growth in the northern Baltic Sea in winter is limited by the seasonal ice cover, leading to considerably lower mean and maximum values of SWH in the northernmost Gulf of Bothnia and the easternmost Gulf of Finland.
Although the measurement and hindcast periods have been quite short so far, some studies have also analysed trends in the Baltic Sea SWH. For example, Soomere and Räämet (2011) and Kudryavtseva and Soomere (2017) suggested that the trend in SWH has been increasing since the 1990s, but the results are site specific and, so far, rather inconclusive.
The seasonal wave climate is driven by the wind climate. The highest mean and maximum values of SWH are reached in autumn and winter, while summer typically has the mildest wave climate. In subbasins with a long ice season and a large ice extent, such as the Bothnian Bay, the seasonal variation in the SWH is slightly different, since the waves are damped by the ice.
So far, the northern Baltic proper holds the record measured value of Baltic Sea SWH. In December 2004, a SWH of 8.2 m was measured by the northern Baltic proper wave buoy, with a highest individual wave of ca. 14 m (Tuomi et al., 2011; Björkqvist et al., 2018). As the spatial coverage of the wave measurements has increased and milder ice winters have also allowed late autumn and even winter measurements in the northern parts of the Baltic Sea, 8 m SWH has also been measured in the Bothnian Sea in January 2019. Björkqvist et al. (2020) estimated a return period of 104 years for this event in the present climate. Hindcast statistics have suggested that even higher maximum values between 9.5–10.5 m may occur in areas, and the times for which wave buoy measurements are not available (Soomere et al., 2008; Tuomi et al., 2011; Björkqvist et al., 2018).
3.2.5(6) Sedimentation and coastal erosion
The glacial isostatic adjustment and eustatic sea level change impose a first-order control on Baltic Sea coastal landscape change (Harff et al., 2017). In the subsiding southern Baltic Sea region, wind-driven coastal currents and waves are the major drivers for erosion and sedimentation, especially along the sandy and clayey sections of sandy beaches, dunes and soft moraine cliffs (Zhang et al., 2015; Harff et al., 2017).
Owing to spatial variation in aero- and hydrodynamic conditions (winds, waves, and alongshore currents) and underlying geological structure (lithology and sediment composition), a diversity of morphological patterns have developed along the Baltic Sea coast. Because of the dominant westerly winds that blow 60 % of the year (Zhang et al., 2011) and a sheltering by land in the west, wind waves are larger in the southeastern Baltic Sea than in the southwest. As a result, sediment transport and dune development are more active and dynamic along the southeastern coast. Thus, the largest coastal dunes are found along the Polish coast, with wave lengths of >100 m and heights of >20 m (Ludwig, 2016), while dunes along the German coast normally have wave lengths less than 60 m and heights below 6 m (e.g. Lampe and Lampe, 2018). Under conditions favourable for wind-driven sand accumulation along sandy Baltic Sea coasts, a typical cross-shore profile features one or several foredune ridges, generally with a height of between 3 and 12 m above the mean sea level (Zhang et al., 2015; Łabuz et al., 2018). At the backshore, behind the established foredune ridges, drifting or stabilised dunes in transgressive forms, mainly parabolic or barchanoid types, are commonly developed. The source of sediment for dune development includes fluvioglacial sands from eroded cliffs, river-discharged sands, and older eroded dunes (Łabuz, 2015).
Because the wind–wave energy increases from west to east, so does erosion along the Baltic Sea coast. The mean annual erosional rate of the soft moraine cliffs and sandy dunes along the northern side of the southwestern Baltic Sea coast (southern Sweden and Denmark) is 1–2 m yr−1, which is larger than 0.4–1 m yr−1 along the southern side of the southwestern Baltic Sea coast (Germany). Erosion along the southern Baltic Sea coast increases eastward, with a mean annual rate of 0.5–1.5 m yr−1 in Poland and 0.5–4 m yr−1 in Latvia, Lithuania, and Russia (BACC II Author Team, 2015). Severe coastal erosion in the Baltic Sea region is often caused by storms. The maximum storm-induced erosion increases eastward from 2–3 m yr−1 at the southwestern Baltic Sea coast (southern Sweden, Denmark, and Germany) to 3–6 m yr−1 along the Polish coast and ∼10 m yr−1 along the coast of Lithuania and Russia (Kaliningrad). Each storm can erode soft Latvian cliffs 3–6 m, with a maximum of up to 20–30 m locally. Many sandy beaches along the Gulf of Finland have recently been severely damaged by frequent storm surges, despite extensive protective measures (BACC II Author Team, 2015).
The prevailing wind–wave pattern controls the spatial variations in not only coastline change rates but also submarine morphologies (Deng et al., 2019). In the southwestern Baltic Sea coast where wind–wave energy is relatively small, nearshore submarine morphology is generally featured by smooth transition from beach dunes/moraine cliffs to deeper water perturbed by one or two longshore bars. Morphological perturbations (e.g. the number and amplitude of longshore bars and rip current channels) become increasingly larger toward the east due to increased wind–wave energy. The wave incidence angle also impacts the nearshore submarine morphology, with, in general, a smaller angle leading to a larger morphological heterogeneity, i.e. a larger amplitude of perturbations. The amplitude of near-shore morphological perturbations may significantly affect coastal erosion because rip currents act as an efficient conduit for offshore sediment transport, despite the fact that they only occur sporadically along the Baltic Sea coast (Schönhofer and Dudkowska, 2021).
The sediments eroded from the soft moraine cliffs are composed of grain sizes from clay to pebbles. The fine-grained sediments are mostly transported outwards to the deeper seafloor (i.e. the Baltic Sea basins), either suspended in the water column or in a concentrated benthic fluffy layer (Emeis et al., 2002). Eroded fine-grained sediments from the moraine cliffs have been found to contribute to a major portion (40 %–70 %) of the Holocene deposits in the muddy Baltic Sea basins (Porz et al., 2021). Coarser material, such as sand, stays mostly nearshore, partly in the water and partly transported onto the beach and the dunes (Deng et al., 2014; Zhang et al., 2015).
3.2.5(7) Marine carbonate system and biogeochemistry
Studies summarised in BACC II showed that nitrate and phosphate concentrations in the winter surface water of the Baltic proper had increased by a factor of about 3 in the second half of the 20th century and reached a peak between 1980 and 1990. This change was consistent with the enhanced nutrient inputs to the Baltic Sea and caused eutrophication in the affected basin. Based on the available CO2 system data, it has been estimated that the net ecosystem production in the Baltic Sea has increased since the 1930s by a factor of about 2.5. The increase in net ecosystem production and poor ventilation of the deepwater layers due to the permanent stratification of the water column caused significant expansion of the anoxic and hypoxic areas in the Baltic Sea. Since the 1980s, nutrient inputs to the Baltic Sea have decreased. This led to a decrease in winter surface water nitrate concentrations. No decrease was, however, observed for phosphate, due to the long residence time of P in the Baltic Sea and reduced P storage in oxygen-deficient sediments by binding to Fe-oxyhydroxides.
3.2.5(7.1) Oxygen and nutrients
In the Baltic Sea, hypoxia (oxygen deficiency) and even anoxia has expanded considerably since the first oxygen measurements in 1898 (Gustafsson et al., 2012; Carstensen et al., 2014a; Fig. 25). In 2016, the maximum hypoxia area was about 70 000 km2, which is almost the combined area of Belgium and the Netherlands, whereas it was presumably very small or even absent 150 years ago (Carstensen et al., 2014a, b; Meier et al., 2019c, d). Hypoxia was caused mainly by increasing land nutrient inputs and atmospheric deposition that led to eutrophication of the Baltic Sea (Andersen et al., 2017; Savchuk, 2018). The impacts of other drivers like observed warming and eustatic sea level rise were smaller but still important (Carstensen et al., 2014a; Meier et al., 2019c). On annual to decadal timescales, halocline variations also had considerable influence on the hypoxic area (Conley et al., 2002; Väli et al., 2013).
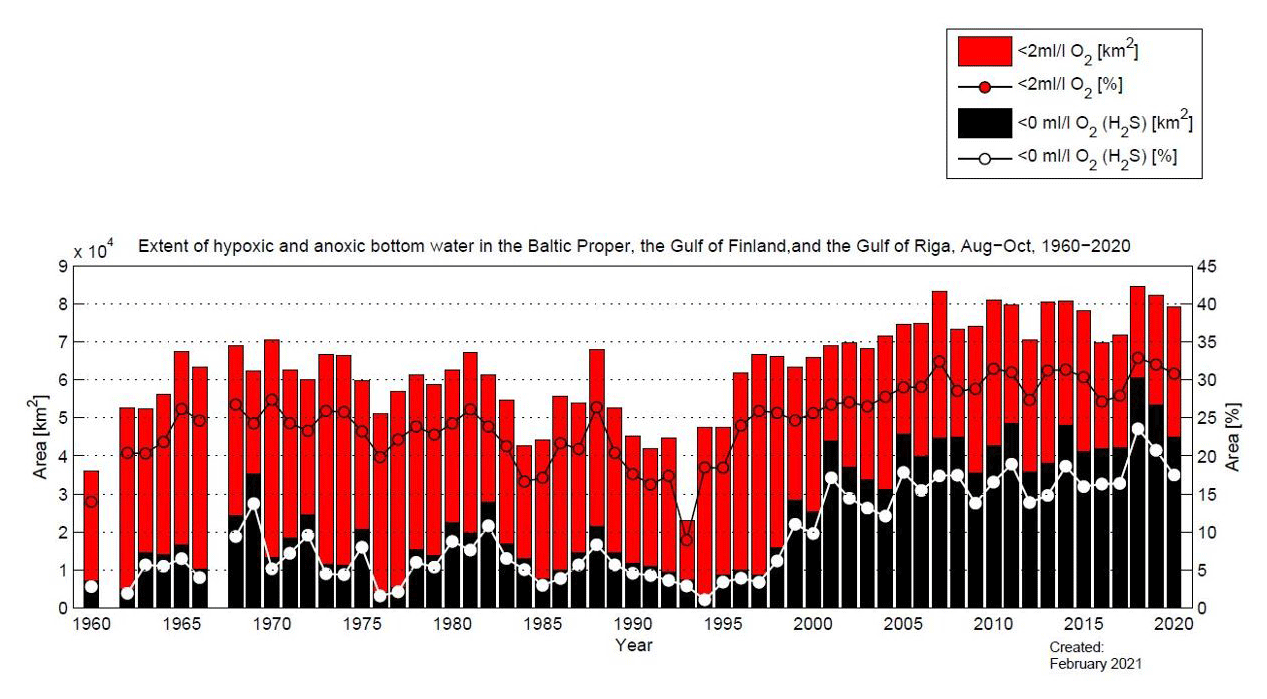
Figure 25The extent of hypoxic (<2 mL O2 L−1) and anoxic (<0 mL O2 L−1) bottom water (in 104 km2) in the Baltic proper, Gulf of Finland, and Gulf of Riga during regular cruises in August–October during 1960–2020. Source: https://www.smhi.se (last access: 5 March 2022) at the Swedish Meteorological and Hydrological Institute, Norrköping, Sweden.
Besides its detrimental effects on biota, hypoxia is responsible for the redox alterations of nitrogen and phosphorus integral stocks reaching in the Baltic proper hundreds of thousand tonnes annually. The dissolved inorganic nitrogen (DIN) pool is being depleted by denitrification, while the dissolved inorganic phosphorus (DIP) pool is increasing due to phosphate release in the water and sediment anoxic environments (e.g. Savchuk, 2013, 2018, and references therein). The resulting changes of nitrate and phosphate concentrations at the upper boundary of the halocline also affect neighbouring gulfs and export to the Bothnian Sea and Gulf of Finland waters with elevated phosphorus concentration (Rolff and Elfwing, 2015; Lehtoranta et al., 2017; Savchuk, 2018).
Despite the decrease in land nutrient inputs after the 1980s, the extent of hypoxia in the Baltic Sea remains unaltered. This is due to the long response time of the system to reductions in N and P inputs. According to recent computations, the residence times for TN and TP in the water and sediments of the Baltic Sea combined are 9 and 49 years, respectively (Gustafsson et al., 2017; Savchuk, 2018). Furthermore, recently observed oxygen consumption rates in the Baltic Sea are higher than earlier observed, counteracting the vertical oxygen supply and natural ventilation by oxygen-rich saltwater intrusions from the North Sea (Meier et al., 2018b). Although sediments are still the most important sinks of oxygen in the Baltic Sea, the increased rates of oxygen consumption were largely driven by water column processes with, for instance, bacterial nitrification as the most prominent process. Also, zooplankton and higher trophic level respiration were suggested to contribute more to oxygen consumption than 30 years ago (Meier et al., 2018b). However, the importance of the latter processes is still unknown. The present total oxygen consumption rate in the water column below 60 m depth in the Baltic proper, Gulf of Riga, and Gulf of Finland is estimated to be about 5 times that in the period 1850–1950 (Meier et al., 2018b).
Hypoxia also remains an important problem in the Baltic Sea coastal zone (Conley et al., 2011). Coastal hypoxia most often has an episodic or temporary character and is driven by the seasonal variations in organic matter supply, advective transport, and water column stratification (Carstensen and Conley, 2019). The latter is mostly caused by seasonal temperature changes, but changes in vertical stratification may, in some areas, be due to occasional inflows of saltier water and lower winds during summer. The coastal regions most affected by hypoxia are estuaries in the Danish straits and parts of Swedish and Finnish archipelagos located in the Baltic proper and Gulf of Bothnia (Conley et al., 2011). In contrast, hypoxia is rare along the southern and southeastern coastline (from Poland to Estonia), due to enhanced water circulation, as well as in the less productive coastal zone of the northern Baltic Sea. Despite the recently reduced nutrient inputs, bottom water oxygen concentrations have improved only in a few coastal ecosystems that have experienced the largest reductions (for instance, in the Stockholm Archipelago). In most of the 33 coastal sites evaluated by Caballero-Alfonso et al. (2015), oxygen conditions have deteriorated, especially along the Danish and Finnish coasts. This finding was explained as being a coupled effect of climate-change-related drivers, especially warming, which reduces oxygen solubility in water and strengthens thermal stratification, and a delay of the system in responding to nutrient reduction.
N and P are removed from the Baltic Sea by burial in sediments, but much N is also lost by denitrification (Gustafsson et al., 2017). Coastal regions constitute an efficient nutrient filter (Almroth-Rosell et al., 2016; Asmala et al., 2017) that remove about 16 % of N (by denitrification) and as much as 53 % of P (by burial) delivered from land (Asmala et al., 2017). The filter effect of the coastal zone is, however, highly diverse. Denitrification rates are highest in lagoons that receive large inputs of nitrate and labile organic material, while P is most efficiently buried in archipelagos (Carstensen et al., 2020). Additionally, Hoikkala et al. (2015) argued that dissolved organic matter (DOM) plays an important role for nutrient cycling in the Baltic Sea, since more than 25 % of bioavailable nutrients in riverine inputs and surface waters can be in organic form.
Furthermore, the exchange of nutrients between the coastal zone and the open sea (Eilola et al., 2012) and the role of MBIs for the phosphorus cycling (Eilola et al., 2014) were analysed. Eilola et al. (2014) concluded that the overall impact of MBIs on the annual uplift of nutrients from below the halocline to the surface waters is small because vertical transports are also comparably large during periods without MBIs. Instead, phosphorus released from the sediments between 60 and 100 m depth under anoxic conditions contributes to the eutrophication.
The cycling between nutrients and phytoplankton biomass was studied by Hieronymus et al. (2018), who found a regime shift between nutrient-limited phytoplankton variations before 1950 and a less nutrient-limited regime after 1950, with a larger impact of other variations such as those in water temperature.
3.2.5(7.2) Marine CO2 system
The marine CO2 system in the Baltic Sea is greatly influenced by the production and remineralisation of organic matter, as well as inputs of organic and inorganic carbon from land (Kuliński et al., 2017). The combination of all these factors makes the Baltic Sea pH and partial pressure of CO2 (pCO2) highly variable in space and time (Carstensen and Duarte, 2019). The Baltic Sea surface water is in almost permanent pCO2 disequilibrium with the atmosphere throughout the year (Schneider and Müller, 2018). In spring and summer, the surface seawater is undersaturated with respect to atmospheric CO2 as a consequence of biological production and the shallowing mixed layer depth. Thus, seawater pCO2 typically has two minima corresponding to the spring bloom and the mid-summer nitrogen fixation period. In autumn and winter, pCO2 increases due to the shifting balance between autotrophy and heterotrophy and the entrainment of deeper CO2-rich waters.
Remineralisation of terrestrial organic matter plays an important role in shaping pCO2 fields in the Baltic Sea. Kuliński et al. (2016) found that about 20 % of the dissolved organic carbon (DOC) delivered from the Vistula and Odra rivers is bioavailable, while Gustafsson et al. (2014) even estimated that 56 % of allochthonous (originating outside the Baltic Sea) DOC is remineralised in the Baltic Sea. High inputs of terrestrial organic matter that is subsequently partially remineralised in seawater turned the basins most affected by riverine runoff (Gulf of Bothnia, Gulf of Finland, and Gulf of Riga) to net CO2 sources to the atmosphere in the period 1980–2005. This outgassing was more than compensated by the high CO2 uptake in the open Baltic proper. In 1980–2005, the whole Baltic Sea was found to be, on average, a minor sink for atmospheric CO2, absorbing 4.3±3.9 g C m−2 yr−1, with the rate of atmospheric CO2 exchange highly sensitive to the inputs of terrestrial organic matter (Gustafsson et al., 2014).
The high seasonal variability in pCO2, enhanced by eutrophication, causes large seasonal fluctuations in surface water pH, amounting to about 0.5 in the central Baltic Sea (Kuliński et al., 2017) and even more, often exceeding 1, in productive coastal ecosystems (Carstensen and Duarte, 2019; Stokowski et al., 2021). Furthermore, low total alkalinity (AT; measures buffer capacity), prominent in the northern basins, makes the Baltic Sea potentially vulnerable to ocean acidification (OA), i.e. pH decrease caused by rising pCO2 in the atmosphere and, thus, also in seawater. However, Müller et al. (2016) showed that AT in the Baltic Sea has increased over time, which may partly be due to increasing inputs from land (Duarte et al., 2013). The highest trend, 7.0 µmol kg−1 yr−1, found in the Gulf of Bothnia, almost entirely mitigates the pH drop expected from rising pCO2 in the atmosphere alone. In the southern Baltic Sea, the AT increase is lower (3.4 µmol kg−1 yr−1) and reduces OA by about half. High seasonal pH variability, increasing AT, and variable productivity imply that OA is not measurable in the central and northern Baltic Sea. In the Danish straits, where no AT increase has been detected (Müller et al., 2016), a mean pH decrease of 0.004 years−1 was identified in coastal waters in the period of 1972–2016 (Carstensen et al., 2018), which is approximately twice the ocean trend.
Recent studies showed that the Baltic Sea CO2 system functions differently from the open ocean waters. These differences include a large CO2 input from the remineralisation of terrestrial organic matter (Gustafsson et al., 2014), which is a considerable contribution by organic alkalinity (Kuliński et al., 2014; Ulfsbo et al., 2015; Hammer et al., 2017), AT generation under hypoxic and anoxic conditions (Gustafsson et al., 2019; Łukawska-Matuszewska and Graca, 2018), and a borate alkalinity anomaly (Kuliński et al., 2018), making modelling a challenge. Due to the insufficient understanding of the processes involved, state-of-the-art biogeochemical models cannot yet reproduce the positive AT trend in the Baltic Sea.
3.2.6 Marine biosphere
3.2.6(1) Pelagic habitats
3.2.6(1.1) Microbial communities
Microbial communities respond to increases in SST and river runoff that enhance metabolism and augment the amount of substrate available for bacteria. By using a long time series from 1994 to 2006, an increased input of riverine dissolved organic matter (DOM) in the Bothnian Bay and Bothnian Sea was shown to suppress phytoplankton biomass production and shift the carbon flow towards microbial heterotrophy (Wikner and Andersson, 2012; Paczkowska et al., 2020). Berner et al. (2018) presented further evidence of changes in marine microbial communities.
3.2.6(1.2) Phytoplankton and cyanobacteria
The phytoplankton growing season has become considerably prolonged in recent decades (Kahru et al., 2016; Groetsch et al., 2016; Hjerne et al., 2019; Wasmund et al., 2019). In the Baltic proper, the duration of the growing season, arbitrarily indicated by a threshold of 3 mg Chl m−3 of a satellite-derived chlorophyll, has doubled from approximately 110 d in 1998 to 220 d in 2013 (Kahru et al., 2016). In the western Baltic Sea, it now extends from February to December (Wasmund et al., 2019). Wasmund et al. (2019) analysed data on chlorophyll a and microscopically determined biomass from 1988–2017 and found an earlier start of the growing season, which correlated with a slight increase in sunshine duration in spring, and a later end to the growing season, which correlated with warmer water in autumn. The shifts in the spring and autumn blooms led to a prolongation of the summer biomass minimum. However, time series were rather short (30 years), and trends in irradiance might be caused by internal variability (see Sect. 3.2.1(3)). The spring phytoplankton communities have shifted from a preponderance of early-blooming diatoms to dominance by later-blooming dinoflagellates (Wasmund, 2017; Wasmund et al., 2017) and the autotrophic ciliate Mesodinium rubrum (Klais et al., 2011; Hällfors et al., 2013; Hjerne et al., 2019), perhaps due to reduced ice thickness and increased winter wind speed since the 1970s (Klais et al., 2013). Wasmund (2017) suggested that the decline in the ratio between diatom and dinoflagellate biomasses between 1984 and 1991 was caused by warmer winters. Confidence in these results is, however, low.
In summer, the amount of cyanobacteria has increased, and the phytoplankton biomass maximum, which in the 1980s was in spring, is now in July–August. This shift has been explained by a complex interaction between warming, eutrophication, and increased top-down pressure (Suikkanen et al., 2013). There are, however, different opinions concerning the relative effects of eutrophication and climate on changes in phytoplankton biomass and community composition. In the long-term data, results vary according to area and species group (Wasmund et al., 2011; Groetsch et al., 2016). Some studies saw evidence of eutrophication effects modified by climate-induced variations in temperature and salinity (Hällfors et al., 2013; Olofsson et al., 2020). Others found no explanation for the gradual change in community composition and concluded that the Baltic Sea phytoplankton community is not in a steady state (Olli et al., 2011; Griffiths et al., 2020).
Cyanobacteria accumulations derived from satellite data for 1979–2018 show both short-term (2–3-year) oscillations and decadal-scale variations (Kahru and Elmgren, 2014; Kahru et al., 2018; Kahru et al., 2020). Cyanobacteria accumulations in the Baltic proper were common in the 1970s and early 1980s but rare during 1985–1990. They increased again starting in 1991 and especially since 1998. In the 1980s, the annual chlorophyll maximum in the Baltic proper was caused by the spring diatom bloom but has in recent decades shifted to the summer cyanobacteria bloom in July; the timing of this bloom has also advanced by about 20 d, from the end to the beginning of July (Kahru et al., 2016).
In the Baltic proper, the hypoxia-induced decrease in N : P ratio and increase in phosphate pool left over in the surface layer after the spring bloom led to intensification of the vicious circle (Vahtera et al., 2007), further augmented by increasing water temperature, and resulted in a conspicuous expansion of the surface diazotrophic cyanobacteria accumulations covering, in the 21st century, 150 000–200 000 km2 (e.g. Kahru and Elmgren, 2014; Savchuk, 2018, and references therein). Although mechanisms of the interannual oscillations of 2–3 years remain unexplained (Kahru et al., 2018), there is a strong correlation of the accumulations with hypoxia-related biogeochemical variables and water temperature at the decadal scale of 5–20 years (Kahru et al., 2020). In the Bothnian Sea, the decreased nitrogen import and increased phosphorus import from the Baltic proper has shifted the nutrient balance and made cyanobacteria accumulations a permanent feature (Kahru and Elmgren, 2014; Kuosa et al., 2017) and probably also increased production and sedimentation (Ahlgren et al., 2017; Kahru et al., 2018, 2020; Kuosa et al., 2017; Lehtoranta et al., 2017; Rolff and Elfwing, 2015; Savchuk, 2013; Vahtera et al., 2007).
Experimental evidence supports the idea that climate change can and will drive changes in the pelagic production from both ecological and evolutionary perspectives (Sommer et al., 2012; Hattich et al., 2022), and a thorough review of benthic–pelagic coupling in the Baltic Sea demonstrates ecosystem-wide consequences of altered pelagic primary production (Griffiths et al., 2017).
3.2.6(1.3) Zooplankton
Several studies have confirmed that marine copepod species have declined in abundance since the 1980s, while euryhaline or limnetic, often small species, have increased (Hänninen et al., 2015; Suikkanen et al., 2013; Kortsch et al., 2021). The observed decline of marine taxa has been linked to the reduction in surface water salinity since the 1980s (Vuorinen et al., 2015), whereas the increase in brackish water taxa has been positively influenced by the temperature increase, either directly or indirectly (Mäkinen et al., 2017). Small-scale effects on individual species may affect reproductive success and, hence, influence both populations and communities (Möller et al., 2015).
3.2.6(2) Benthic habitats
3.2.6(2.1) Macroalgae and vascular plants
Long-term changes in Baltic Sea macroalgae and charophytes have been attributed to changes in salinity, wind exposure, nutrient availability, and water transparency (Gubelit, 2015; Blindow et al., 2016; Rinne and Salovius-Laurén, 2020), and biotic interactions may also play a role (Haavisto and Jormalainen, 2014; Korpinen et al., 2007). The long-term decrease in water transparency from 1936 to 2017 has been estimated to have reduced seafloor areas in the northern Baltic Sea favourable for Fucus spp. by 45 % (Sahla et al., 2020). Overall, it is expected that climate change and its interaction with other environmental factors (e.g. eutrophication) will cause complex responses and influence carbon storage in both macroalgae and vascular plants in the Baltic Sea (Jonsson et al., 2018; Takolander et al., 2017; Röhr et al., 2016; Perry et al., 2019; Salo et al., 2020; Bobsien et al., 2021).
3.2.6(2.2) Zoobenthos
Soft-sediment benthic communities depend on variables that are influenced by climatic variability. On the southwestern coast of Finland, amphipods have been replaced by Baltic clam Limecola balthica and the invasive polychaetes of Marenzelleria spp., a change that is attributed to an increase in near-bottom temperature and fluctuations in salinity and oxygen (Rousi et al., 2013). Variations in zoobenthos in the Åland archipelago during 1983–2012 were associated with a salinity decline (Snickars et al., 2015), and the effects related to climate change have acted as drivers for the long-term progression of zoobenthic communities (Rousi et al., 2019; Weigel et al., 2015; Ehrnsten et al., 2020).
3.2.6(3) Non-indigenous species
Numerous non-indigenous species have gained a stronghold in the Baltic Sea ecosystem during the past few decades, and in many cases, these species have wider tolerance ranges than the native ones, thus making them highly competitive under changing climate including warmer, and possibly less saline, water, which is further impacted by other drivers such as eutrophication. The ecological impacts of these species may vary from filling vacant ecological niches to potentially outcompeting native species and, thus, influencing the entire food web structure and functioning (Weigel et al., 2015; Griffiths et al., 2017; Ojaveer et al., 2017).
3.2.6(4) Fish
Sprat and herring in the Baltic Sea are influenced by multiple factors, including fisheries, predation, food availability, and climatic variations. Sprat has benefited from the seawater warming (Voss et al., 2011). In 1990–2020, sprat populations were affected both by climate and top-down control, i.e. fisheries and predation by cod (Eero et al., 2016). In the 1980s, overfishing and a partly climate-change-induced decline in suitable spawning habitat (reproductive volume) interacted to drastically reduce the cod population (Hinrichsen et al., 2011; Casini et al., 2016), with cascade effects on its main prey, sprat and herring, and zooplankton (Casini et al., 2008).
The various effects of temperature and salinity on sprat and cod also resulted in a spatial mismatch between these species, which contributed to an increase in sprat stocks (Reusch et al., 2018). The freshening of the Baltic Sea surface water, with the associated decline in marine copepods (Hänninen et al., 2015), contributed to a halving of the weight-at-age of a 3-year-old herring, from 50–70 g in the late 1970s to 25–30 g in 2000s (Dippner et al., 2019).
Among coastal fish, pikeperch (Sander lucioperca) has recently expanded its distribution northwards along the coasts of the Bothnian Sea, apparently aided by warmer waters (Pekcan-Hekim et al., 2011). For many coastal piscivores (perch, pike, and pikeperch) and for cyprinids, coastal eutrophication is, however, equally or more important than climate (Bergström et al., 2016; Snickars et al., 2015). Long-term studies illustrate that it is hard to disentangle abiotic and biotic interactions, e.g. between fish and their food (benthos), and climate-related drivers thus appear significant on a multidecadal timescale across a large spatial scale (Törnroos et al., 2019).
3.2.6(5) Marine mammals
During the 20th century, the marine mammals of the Baltic Sea experienced large declines in abundance because of hunting of seals, by-catch of porpoises and exposure to harmful substances causing reduced fertility.
The breeding distributions of the ice-breeding seals in the Baltic Sea have evolved with ice coverage, with the seals breeding where and when ice optimal for breeding occurs. Breeding ringed seals need ice throughout their relatively long lactation period (>6 weeks) and also use ice as moulting habitat. Ringed seals prefer compact or consolidated pack ice as it provides cavities and snowdrifts suitable for the construction of the lairs (most importantly, the breeding lair; Sundqvist et al., 2012).
The implementation of specific management and protection measures has had a profoundly positive influence on the populations of several Baltic Sea mammal populations, particularly seals (Reusch et al., 2018). Reusch et al. (2018) attributed these changes also to reduced exposure to harmful substances and initial increases in overall fish stocks as a consequence of eutrophication, followed by a reduction in several commercial stocks due to overfishing.
Specific climate-change-related impacts on seals are difficult to detect, although reconstructions of historical habitats since the last glaciation have been attempted for some seal species (Ukkonen et al., 2014). Along with warmer winters, the availability of suitable breeding ice for ringed seals in the Bothnian Bay is decreasing (Sect. 3.2.4(4)). The breeding success of ringed seal was probably reduced by the exceptionally mild winter of 2007–2008 (Jüssi, 2012), and several similar or even milder ice winters have followed (Ilmatieteen laitos, 2020). The winters of 2019–2020, 2007–2008, and 2014–2015 are the mildest in the annual ice cover statistics for the Baltic Sea (Uotila et al., 2015). The southern breeding populations of the ringed seal in the Gulf of Finland, the Gulf of Riga, and Archipelago Sea are already facing the challenges of milder winters; the ice-covered area during the breeding season has been reduced, and overlying snow for breeding lairs has been absent from the southern areas of the ringed seal breeding range in most winters of the past decade (Ilmatieteen laitos, 2020). Thus, the only available breeding ice in the Gulf of Finland in 2020 was found very near St. Petersburg (Halkka, 2020).
For grey seals, the lower availability of suitable breeding ice in its core distribution area has led to more breeding on land in areas where drift ice used to be found (Jüssi et al., 2008). Grey seals are known to gather to breed in certain sea areas, regardless of the winter severity, so some land colonies may become overpopulated. As an example, in 2016, 3000 grey seal pups were born on three islets in the northern Gulf of Riga.
Flooding of seal haul-outs due to sea level rise will first occur in the southernmost Baltic Sea, where the relative sea level rise will be most rapid (EEA, 2019c), and haul-out sites are mainly low sand or shingle banks. In Kattegat, relative sea level rise is estimated to be lower, and while the haul-outs in the western part are low sand and shingle banks, similar to those in the southern Baltic Sea, haul-outs in eastern Kattegat are skerries with a higher profile. In the central and northern Baltic Sea, haul-outs are mainly skerries, and here, the relative sea level rise is estimated to be low or even negative in the 21st century (EEA, 2019c). Yet, in recent history, winter storm surges have been observed to flood grey seal breeding colonies and push limited ice with ringed seal pups onto shore in the Gulf of Riga and Pärnu Bay. In the southern Baltic Sea and western Kattegat, increasing sea levels may turn parts of larger islands or previously inhabited islands into suitable seal haul-outs, but this is hard to project and depends, among other things, on the future management and protection of such areas.
Sea levels in the southern Baltic Sea have been rising at up to 3 mm yr−1 since the 1970s (EEA, 2019c), and the available haul-out areas have, thus, seen reductions already. However, during this time, the relevant harbour and grey seal populations have been recovering at high rates from past depletion (Häkönen et al., 2018), with no documented or suspected effects of rising sea levels published.
The only cetacean resident in the Baltic Sea, the harbour porpoise (Phocoena phocoena), is a widespread species and seems to be rather tolerant of different temperatures and habitats. There are harbour porpoise populations in the waters around Greenland and along the coast of the Iberian Peninsula, Morocco, West Sahara, and in the Black Sea. However, the Baltic proper harbour porpoise population has been shown to differ genetically (Lah et al., 2016) and morphologically (Galatius et al., 2012) from neighbouring populations, which may imply local adaptations of which we are currently unaware. Sea ice limits the range available to the Baltic proper harbour porpoise population, since they need to come to the surface to breathe every 1–5 min. Hence, a decreasing ice cover is likely to increase the available range for the population. However, a change in the prey community resulting from climate-change-related factors could potentially have serious effects on this critically endangered (Hammond et al., 2008) population of a small whale, which is dependent on constant access to prey (Wisniewska et al., 2016).
3.2.6(6) Waterbirds
The winter distribution of many waterbirds has extended northwards in response to the increase in temperature and the decreasing extent of sea ice cover. This can be observed as an overall increase in the winter abundance of waterbirds because part of the population of some species (mainly diving ducks) that formerly wintered further to the southwest now remain in the Baltic Sea (Pavón-Jordán et al., 2019). Many species show decreasing trends in abundance in the southern parts of their wintering ranges (typically in western and southern Europe) but increases near the northern edge of their distribution, typically in the Baltic Sea region (MacLean et al., 2008; Skov et al., 2011; Aarvak et al., 2013; Lehikoinen et al., 2013; Pavón-Jordán et al., 2015; Nilsson and Haas, 2016; Marchowski et al., 2017; Fox et al., 2019). Similar shifts are seen in species that traditionally wintered in the Baltic Sea, but currently show declining wintering numbers there, as part of the population now winters in the White, Barents, and Kara seas (Fox et al., 2019).
Although the community composition changes rapidly, the changes are not fast enough to track the thermal isocline shifts (Devictor et al., 2012; Gaget et al., 2021). How species respond to changes in winter temperature seems, however, to be highly species or group specific (Pavón-Jordán et al., 2019). Many species now winter closer to their breeding areas, shortening the migration distances (Lehikoinen et al., 2006; Rainio et al., 2006; Gunnarsson et al., 2012).
Mainly owing to milder spring temperatures and related effects on vegetation and prey, many waterbirds migrate earlier in spring (Rainio et al., 2006) and, hence, arrive earlier in the breeding area (Vähätalo et al., 2004); some also start breeding earlier (van der Jeugd et al., 2009). Delayed autumn migrations have also been noted, but their relation to climate change is less clear (Lehikoinen and Jaatinen, 2012).
Earlier loss of sea ice was found to improve the pre-breeding body condition of female common eiders, leading to increasing fledging success in offspring (Lehikoinen et al., 2006). On the other hand, algal blooms promoted by higher seawater temperature have, in some cases, caused low quality in bivalve prey for common eiders, leading more birds to skip breeding (Larsson et al., 2014). Warmer seawater in winter also increases the energy expenditure of mussels, thus directly reducing their quality as prey for eiders (Waldeck and Larsson, 2013).
Most Baltic Sea waterbird species are migratory and affected by climate change also outside the Baltic Sea region, in the Arctic (breeding season), and in southern Europe and western Africa (wintering; Fox et al., 2015). This is important, given that climate warming is most pronounced in the Arctic and northern Eurasia and also above average in southern Europe and northern Africa (Allen et al., 2018).
3.2.6(7) Marine food webs
The entire marine food web of the Baltic Sea has been greatly impacted by climate-change-related drivers that have altered the physical environment and the physiological tolerance limits of several species, by causing the micro-evolution of Baltic Sea species and by interactive effects of climate change with other environmental drivers, such as eutrophication and hypoxia/anoxia (Niiranen et al., 2013; Wikner and Andersson, 2012; Schmidt et al., 2020; Pecuchet et al., 2020).
Integrated approaches encompassing all of the ecosystem components discussed above are needed in order to understand and manage the links among large-scale and long-term climate effects. These are driven by synergistic interactions of climate-change-related physical and chemical drivers with other factors, such as eutrophication or large-scale fisheries, which complicate human adaptation to the changing marine ecosystem (Niiranen et al., 2013; Blenckner et al., 2015; Hyytiäinen et al., 2021; Stenseth et al., 2020; Bonsdorff, 2021).
3.3 Future climate change
3.3.1 Atmosphere
3.3.1(1) Large-scale atmospheric circulation
Continued greenhouse-gas-induced warming is the key driver for future climate change, and changes in atmospheric circulation are relatively less important (IPCC, 2021a). However, as the regional climate in the Baltic Sea region is strongly governed by the large-scale circulation of the atmosphere, it is important to also consider changes in it when assessing future regional climate (e.g. Kjellström et al., 2018).
In the future, the NAO is very likely to continue to exhibit large natural variations similar to those observed in the past. In response to global warming, it is likely to become slightly more positive on average (Knudsen et al., 2011). Trends in the intensity and persistence of blocking remain to be determined (IPCC, 2014b). The AMO is expected to be very sensitive even to weak global warming, thus shortening the timescale of its response and weakening its amplitude (Wu et al., 2018; Wu and Liu, 2020). This will likely reduce the decadal variability in SSTs in the Northern Hemisphere. Recent studies indicate a degree of decadal predictability for blocking and the NAO influenced by the AMO (Athanasiadis et al., 2020; Wills et al., 2018; Jackson et al., 2015).
3.3.1(2) Air temperature
Table 12 lists the air temperature changes over the Baltic Sea catchment area and the Baltic Sea calculated from an ensemble of regional coupled atmosphere–ocean simulations (Gröger et al., 2021b). Due to the ice/snow albedo feedback, warming is larger in winter than in summer, and the land is warming faster than the Baltic Sea (Fig. 26a). Due to its proximity to the Arctic, the Baltic Sea region, including both land and sea, is warming faster than the global mean figures (Sect. 1.5.1(1)). The surface air temperature increase is expected to be largest in the northern Baltic Sea region, especially in winter. These statements are true for both uncoupled atmosphere (Christensen et al., 2022) and coupled atmosphere–ocean regional climate simulations (Gröger et al., 2019, 2021b).
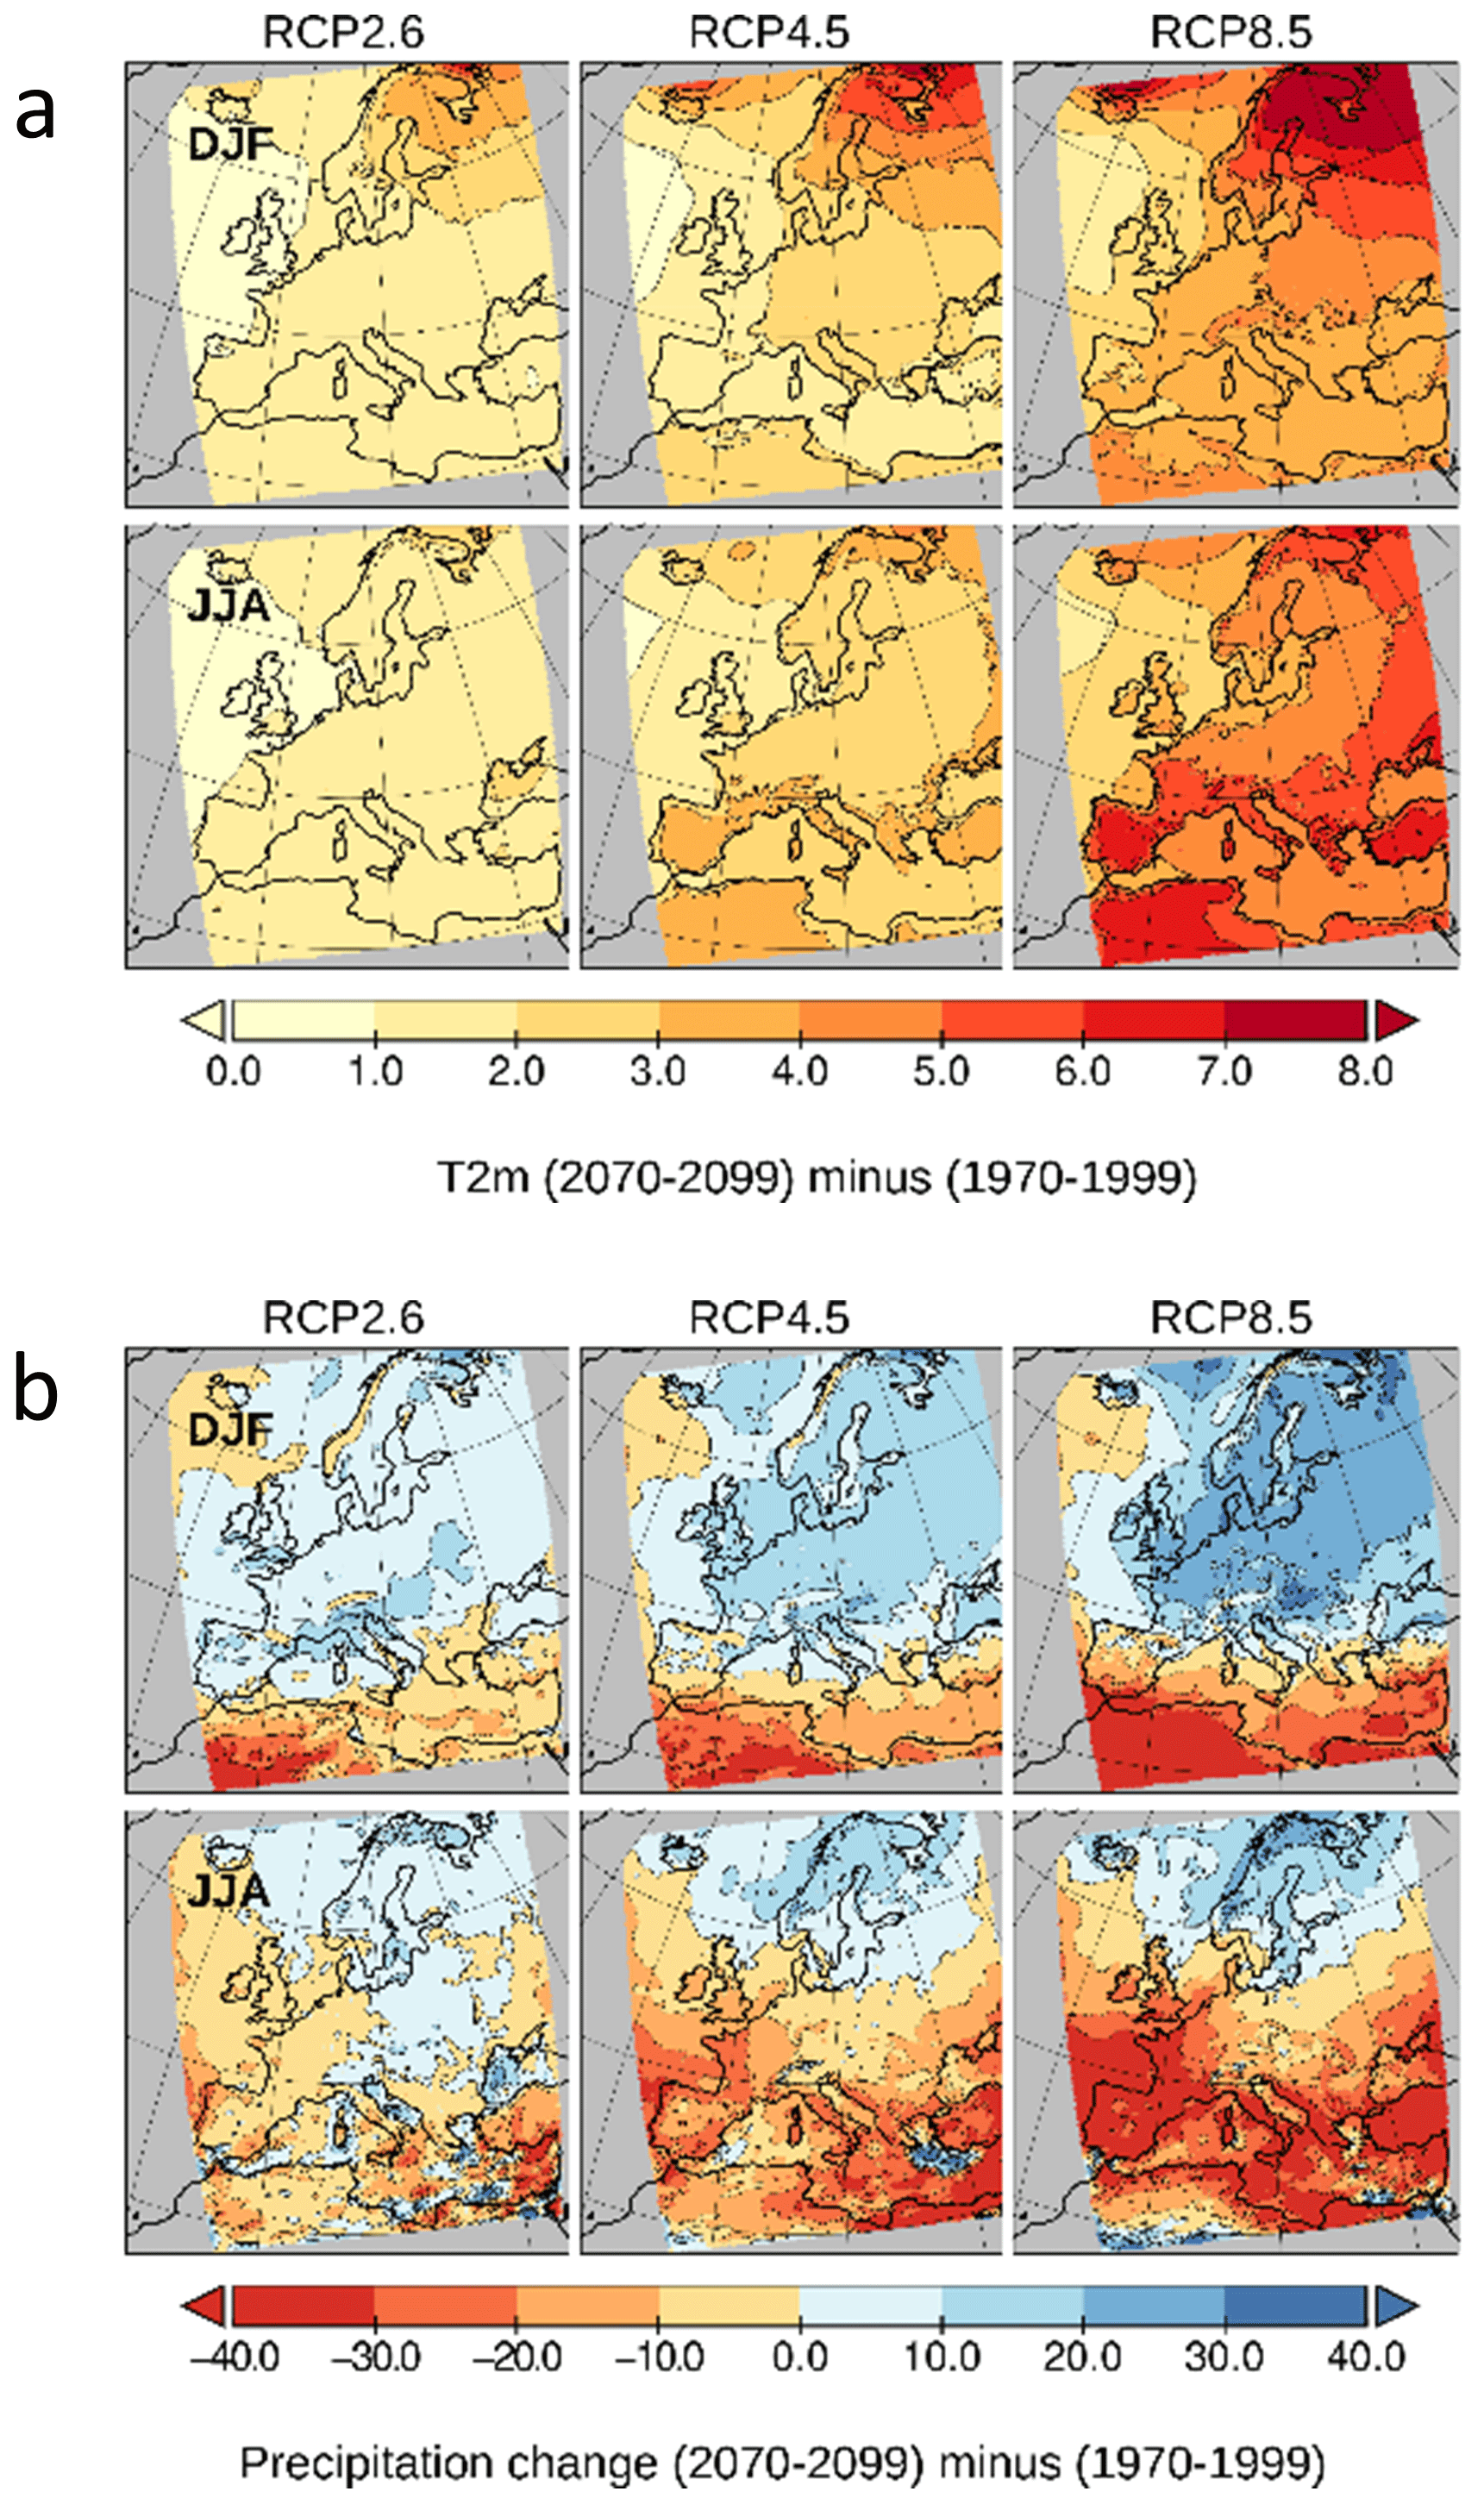
Figure 26(a) Ensemble mean 2 m air temperature change (degrees Celsius) between 1970–1999 and 2070–2099 for winter (December through February; upper panels) and summer (June through August; lower panels) under RCP2.6, RCP4.5, and RCP8.5. Panel (b) is the same as panel (a) but for precipitation change (percent). In total, eight different dynamically downscaled Earth system model (ESM) simulations are used. Data source: Gröger et al., 2021b.
For RCP2.6, the global annual mean surface air temperature change between 1976–2005 and 2069–2098, averaged over the simulations, is 1.0∘C. The corresponding global changes for RCP4.5 and RCP8.5 are 1.9 and 3.5∘C, respectively. Over land in the Baltic Sea region, the warming is larger in each of the three scenarios, amounting to 1.5, 2.6 and 4.3∘C, respectively (Table 12). Over the Baltic Sea, the increase is slightly smaller than over land (1.4, 2.4 and 3.9∘C, respectively) but still larger than the corresponding global mean increase in surface air temperature. The latter result was expected and found in coupled atmosphere–ocean scenario simulations (Table 12) but not in all atmosphere-only runs (Christensen et al., 2022).
Extreme air temperatures
Changes in daily minimum and maximum temperatures have similar spatial patterns to the mean air temperature changes, although with greater warming for minimum temperature (Fig. 27). Such a decrease in the diurnal temperature range can have a number of explanations. Based upon an ensemble of CMIP5 GCMs, Lindvall and Svensson (2015) suggested that increasing downwelling longwave radiation due to larger greenhouse gas concentrations increased cloudiness at high latitudes, and changes in the hydrological cycle and changes in shortwave incoming radiation might be an explanation for the decreased diurnal temperature range. In addition to these drivers, the difference in the diurnal temperature range in northern Europe is small in winter, implying that differences between daily maximum and minimum temperatures also substantially depend on synoptic-scale variability and air mass origin. As a consequence, reduced temperature variability on synoptic timescales, resulting from reduced temperature gradients between the Atlantic Ocean and Eurasia, may be a reason for the decreased diurnal temperature range.
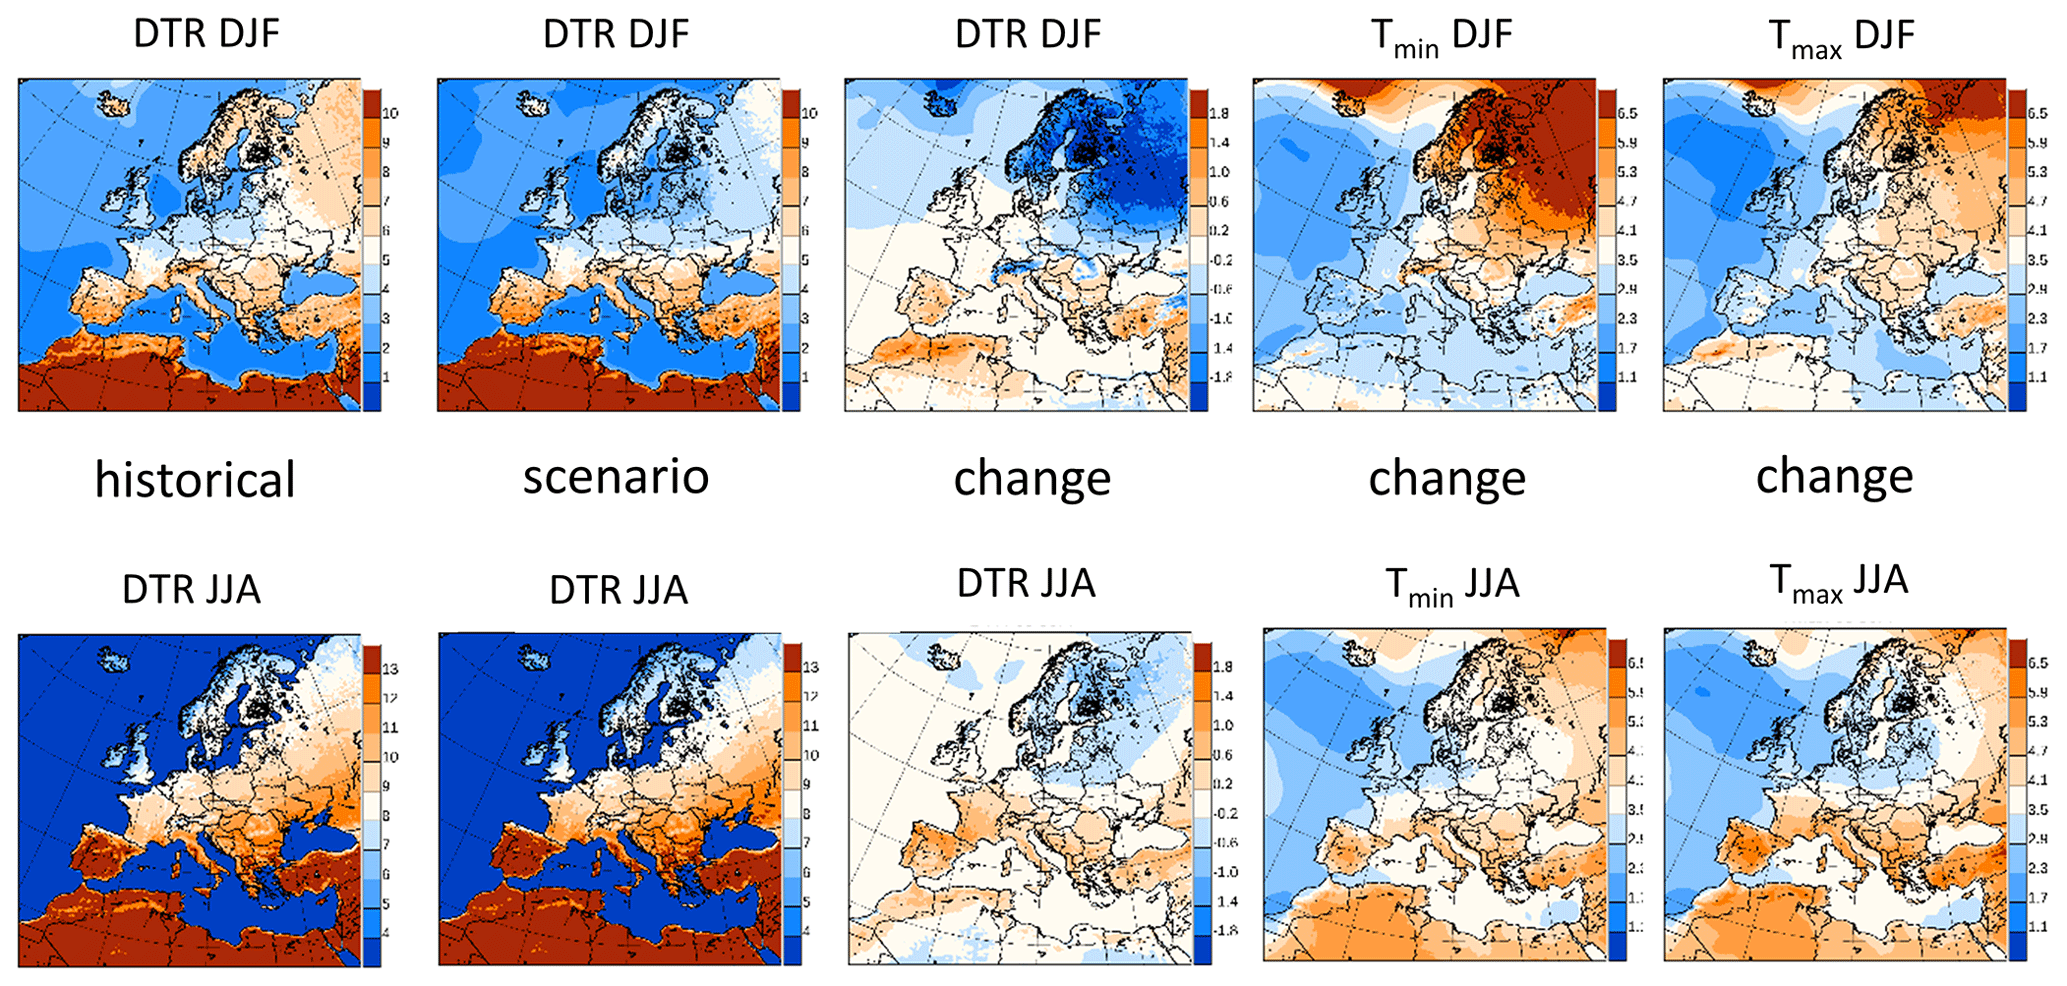
Figure 27From left to right, daily temperature range (DTR; in degrees Celsius) during historical (1981–2010) and future (2071–2100) periods and changes in daily temperature range, daily minimum, and daily maximum temperatures in RCP8.5, according to EURO-CORDEX scenario simulations (Christensen et al., 2022). The upper and lower panels show winter (December to February – DJF) and summer (June to August – JJA) means, respectively. Data source: Earth System Grid Federation (ESGF) network, http://esgf-data.dkrz.de (last access: 5 March 2022); see Christensen et al. (2022).
The number of hot spells is projected to increase, in particular in the southern Baltic Sea region (Gröger et al., 2021b). In coupled atmosphere–ocean simulations, the strongest increases in the annual mean number of consecutive days of tropical nights and the annual maximum number of tropical nights (with temperature above 20 ∘C all night) in the Baltic Sea region were projected to occur over the open sea (Gröger et al., 2021b). In contrast, projections of tropical nights with atmosphere-only models show no significant change (Gröger et al., 2021b; Meier et al., 2019a). Due to the sea ice/snow albedo feedback, the largest decline in the number of frost days was projected to occur over the northeastern Baltic Sea region, i.e. northern Scandinavia and adjacent northern Russia (Gröger et al., 2021b). In addition to the magnitude of the warming that is affected by the sea ice/snow albedo feedback, the baseline climate may also play a role. Further southwest, where the winters are milder, there are fewer frost days to start with and, therefore, less room for a further decrease in the future.
3.3.1(3) Solar radiation and cloudiness
There are a few studies on projected future solar radiation over Europe. Global climate models of the CMIP5 generation indicated an increase in surface solar radiation, which will be the highest over southern Europe and decrease towards the north, but still with a slight increase over the Baltic Sea (Bartók et al., 2017; Müller et al., 2019). The RCP scenarios even include a decrease in aerosol emissions, which enhances the warming and the increase in solar radiation in the global climate models.
However, some regional climate models instead showed a decrease in surface solar radiation over the Baltic Sea area, in winter, by about 10 % over most of the catchment (Bartók et al., 2017; Christensen et al., 2022). This change was largely attributed to increasing future cloud cover, due to a more zonal airflow, and was accompanied by increased winter precipitation. Thus, there are large differences in the modelled surface solar radiation between global and regional models (Bartók et al., 2017). Unknown future aerosol emissions add to the uncertainty. In most RCM scenario simulations, the effect of changing aerosol concentrations was not considered (Boé et al., 2020a).
Global mean energy balance components have improved with every new climate model generation. For the latest CMIP6, models show good agreement for clear-sky shortwave energy fluxes in today's climate, both between models and between models and reference data (Wild et al., 2021). However, there are still substantial discrepancies among the various CMIP6 models in their representation of several of the global annual mean energy balance components, and the intermodel spread increases further on regional, seasonal, and diurnal scales. Thus, future changes in solar radiation and cloudiness remain highly uncertain, not least on the regional scale.
3.3.1(4) Precipitation
Precipitation in winter and spring is projected to increase over the entire Baltic Sea catchment, while summer precipitation is projected to increase in the northern half of the basin only (Christensen et al., 2022). In the south, summer precipitation is projected to change very little, although with a large spread between different models including both increases and decreases. The projected increase in the north is a rather robust feature among the regional climate models but with a large spread in the amount. Ensemble mean precipitation changes from coupled atmosphere–ocean simulations are summarised in Table 13. For the Baltic Sea catchment area, projected annual mean precipitation changes for the three RCP scenarios amount to 5 %, 9 %, and 15 % (Table 13) and are much larger than global averages (Sect. 1.5.1(2)). Over the Baltic Sea, the changes are similar to those over the land area (6 %, 8 %, and 16 %).
As expressed by the Clausius–Clapeyron equation, warming increases the potential for extreme precipitation due to intensification of the hydrological cycle associated with the growth of atmospheric moisture content. For northern Europe, regional climate models indicate an overall increase in the frequency and intensity of heavy precipitation events in all seasons (Christensen and Kjellström, 2018; Rajczak and Schär, 2017; Christensen et al., 2022, and references therein). The largest increase in the number of high precipitation days is projected for autumn. Changes in more extreme events, like 10-, 20-, or 50-year events, are less certain.
Changes in dry spells are another feature of an intensified hydrological cycle. Coppola et al. (2021) found an increasing number of consecutive dry days without precipitation for countries south of the Baltic Sea, while no changes were reported in the north.
3.3.1(5) Wind
In general, projected changes in wind speed over the Baltic Sea region are not robust among ESMs (Kjellström et al., 2018; Gröger et al., 2021b). However, Ruosteenoja et al. (2019) found, in CMIP5 projections, a slight but significant wind speed increase in autumn and a decrease in spring over Europe and the North Atlantic. Furthermore, over sea areas where the ice cover is projected to diminish on average, such as the Bothnian Sea and the eastern Gulf of Finland, the mean wind is projected to increase systematically because of a warmer sea surface and reduced stability of the planetary boundary layer (Meier et al., 2011c; Gröger et al., 2021b; Räisänen, 2017).
Projections of the future behaviour of extratropical cyclones are inherently uncertain because changes in several drivers result in opposite effects on cyclone activity. With global warming, the lower troposphere temperature gradient between low and high latitudes decreases due to polar amplification. Near the tropopause and in the lower stratosphere, the opposite is true, thus implying competing lower and upper tropospheric effects on changes in baroclinicity (Grise and Polvani, 2014; Shaw et al., 2016; Stendel et al., 2021). An increase in water vapour enhances diabatic heating and tends to increase the intensity of extratropical cyclones (Willison et al., 2015; Shaw et al., 2016) and contribute to their propagation farther poleward (Tamarin-Brodsky and Kaspi, 2017; Tamarin and Kaspi, 2017). The opposite is true in parts of the North Atlantic region, e.g. south of Greenland. For this region the north–south temperature gradient is increasing, as the weakest warming in the entire Northern Hemisphere is over ocean areas south of Greenland. North of this local minimum, the opposite is true. The increase in the north–south gradient over the North Atlantic may be responsible for some ESMs showing an intensification of the low pressure activity and, thereby, higher wind speeds over a region from the British Isles and through parts of north-central Europe in winter (Leckebusch and Ulbrich, 2004; Ulbrich et al., 2008). These projections have been confirmed by Harvey et al. (2012). They compared the ensemble storm track response of CMIP3 and CMIP5 model simulations and found that both projections show an increase in storm activity in the midlatitudes, with a smaller spread in the CMIP5 simulations. In contrast to CMIP3, the CMIP5 ensemble showed a significant decrease in cyclone track density north of 60∘ N. Hence, pre-CMIP3 and CMIP3 studies showed a clear poleward shift of the North Atlantic storm track (e.g. Fischer-Bruns et al., 2005; Yin, 2005; Bengtsson et al., 2009), whereas the CMIP5 ensemble predicts only an eastward extension of the North Atlantic storm track (Zappa et al., 2013). The newest generation of models from CMIP6 resulted in significant reduction in biases in storm track representation compared to CMIP3 and CMIP5, but the response to climate change is quite similar compared to the previous assessments (Harvey et al., 2020). The eastward extension of the North Atlantic storm track seems to be a robust result as it is found in pre-CMIP3, CMIP3, and CMIP5 simulations (Feser et al., 2015). The response of CMIP6 models is similar to CMIP5 models, but it is considerably larger, probably due to the larger climate sensitivity in the CMIP6 models (Harvey et al., 2020). Furthermore, based on idealised simulations, Sinclair et al. (2020) found that warming would only lead to a slight decrease in the number and no change in the median intensity or lifetime of extratropical cyclones.
In summary, there is no clear consensus among climate change projections in how changes in the frequency and/or intensity of extratropical cyclones will affect the Baltic Sea region (Räisänen, 2017). However, in future climate, the frequency of severe wind gusts in summer associated with thunderstorms may increase (Rädler et al., 2019).
3.3.1(6) Air pollution, air quality, and atmospheric nutrient deposition
The main conclusions of the BACC II Author Team (2015) concerning projections of air quality in the Baltic Sea region still hold. The main factor determining future air quality in the region is regional emissions of air pollutants and not changes in meteorological factors related to climate change or in intercontinental pollution transport (e.g. Langner et al., 2012; Hedegaard et al., 2013).
Recent post-BACC II air quality modelling studies for the Baltic Sea area are Colette et al. (2013, 2015), Varotsos et al. (2013), Hendriks et al. (2016), and Watson et al. (2016). They concentrated mainly on particulate matter (PM) and ground-level ozone (O3), which are the pollutants most likely to be affected by changing climate parameters. These studies agree with current-day air quality trends in that the Baltic Sea region, in general, is less exposed to air pollution than the rest of Europe.
Jacob and Winner (2009) showed that climate change is likely to increase ground-level ozone in central and southern Europe. In a meta-analysis, Colette et al. (2015) assessed the significance and robustness of the impact of climate change on European ground-level ozone based on 25 model projections, including some driven by SRES (Special Report on Emission Scenarios; Nakićenović et al., 2000) and RCP scenarios. They indicated that an increase in ground-level ozone is not expected for the Baltic Sea region. A latitudinal gradient was found from an increase in large parts of continental Europe (+5 ppbv – parts per billion by volume) but a small decrease over Scandinavia (up to −1 ppbv). Studies that explicitly compared the magnitude of projected climate and anthropogenic emission changes (Langner et al., 2012; Colette et al., 2013; Varotsos et al., 2013) all confirmed that changes in emission of ozone precursors (NOx and VOCs) had the larger effect. For northern Europe, Varotsos et al. (2013) estimated that reductions in snow cover and solar radiation in a SRES A1B scenario lead to an ozone decrease of about 2 ppbv by 2050, as compared to present conditions.
Varotsos et al. (2013) stressed the importance of future biogenic isoprene emissions for ozone concentrations. In the 2050 climate, increases in ozone concentrations will be associated with increased biogenic isoprene emissions due to increased temperatures, whereas increased water vapour over the sea, and increased wind speeds, are associated with decreases. Hendriks et al. (2016) emphasised that isoprene emissions may increase significantly in coming decades if short-rotation coppice plantations are greatly expanded to meet the increased biofuel demand resulting from the EU decarbonisation targets. They investigated the competing effects of anticipated trends in land use, anthropogenic emissions of ozone precursors, and climate change on European ground-level ozone concentrations and related health and environmental effects by 2050. They found that increased ozone concentrations and associated health damage caused by a warming climate (+2 to 5 ∘C across Europe in summer) might be more than the reduction that can be achieved by cutting emissions of anthropogenic ozone precursors in Europe. This is an example for the dominance of the climate change effect over a pollutant emission reduction effect, which is an exception to the statement made at the beginning of this section.
Orru et al. (2013, 2019) and Geels et al. (2015) studied the effect of climate change on ozone-related mortality in Europe. Orru et al. (2019) presented their results on a country level, including all Baltic Sea EU countries. They concluded that, although mortality related to ground-level ozone is projected to be lower in the future (mainly due to decreased precursor emissions), the reduction could have been larger without climate change and an increasingly susceptible population.
In parts of the Baltic Sea region, considerable air pollution is due to shipping. Ship traffic in the region is projected to increase over the coming decades, which could lead to larger emissions (i.e. NOx and PM) than today unless stricter air quality regulations counter this potential trend. For the Baltic Sea, a nitrogen emission control area (NECA) will become effective in 2021. Karl et al. (2019a) designed future scenarios to study the effect of current and planned regulations of ship emissions and the expected fuel efficiency development on air quality in the Baltic Sea region. They showed that, in a business-as-usual scenario for 2040 (SECA-0.1 % and fuel efficiency regulation effective starting in 2015), the introduction of the NECA will reduce NOx emissions from ship traffic in the Baltic Sea by about 80 % in 2040. The reduction in NOx emissions from shipping translates to a ∼60 % decrease in NO2 summer mean concentrations in a wide corridor around the ship routes. The coastal population of northern Germany, Denmark, and western Sweden will be exposed to less NO2 in 2040 due to the introduction of the NECA. With lower atmospheric NOx levels, less ozone will be formed, and the estimated daily maximum O3 concentration over the Baltic Sea in summer 2040 will, on average, be 6 % lower than without the NECA. Compared to today, the introduction of the NECA will also reduce ship-related PM2.5 emissions by 72 % by 2040 (compared to −48 % without the NECA). Simulated nitrogen deposition on the Baltic Sea decreases by 40 %–44 %, on average, between 2012 and 2040. A similar study by Jonson et al. (2019) estimated that the contributions of Baltic Sea shipping to NO2 and PM2.5 concentrations, and to the deposition of nitrogen, will be reduced by 40 %–50 % from 2016 to 2030, mainly as a result of NECA.
The pollutant concentrations reported in this section may drop to as yet unknown lower values if the shipping sector is successful in meeting the International Maritime Organization (IMO) target in greenhouse gas emission reduction of 50 % by 2050. This reduction is only possible if low carbon alternative fuels are introduced. Employing a high-energy efficiency, as it is already considered in scenarios used by Karl et al. (2019a), will not be sufficient. The new fuels will also lead to altered emissions of pollutants.
3.3.2 Land
3.3.2(1) River discharge
Climate change may have an influence on the seasonal river flow regime as a direct response to changes in air temperature, precipitation, and evapotranspiration (BACC II Author Team, 2015; Blöschl et al., 2017).
For areas in the northern Baltic Sea region presently characterised by spring floods due to snowmelt, the floods are likely to occur earlier in the year, and their magnitude is likely to decrease owing to less snowfall, shorter snow accumulation period, and repeated melting during winter. As a consequence, sediment transport and the risk of inundation are likely to decrease.
In the southern part of the Baltic Sea region, increasing winter precipitation is projected to result in increased river discharge in winter. In addition, groundwater recharge is projected to increase in areas where infiltration capacity is not currently exceeded, resulting in higher groundwater levels. Decreasing precipitation combined with rising temperature and evapotranspiration during summer is projected to result in the drying of the root zone, increasing demands for irrigation in the southern Baltic Sea region.
Projections with a process-oriented hydrological model suggested that, under the RCP4.5 and RCP8.5 scenarios, the total river flow during 2069–2098 relative to 1976–2005 will increase 1 %–21 % and 6 %–20 %, respectively, illustrating the large inherent uncertainty in hydrological projections (Saraiva et al., 2019a). According to these and previous projections, the increase in river flow will mainly take place in the north, while total river flow to the south will decrease (Stonevičius et al., 2017; Šarauskienė et al., 2017). Winter flow will increase due to intermittent melting (Stonevičius et al., 2017). Projected discharge changes attributed to increasing air temperature are reflected in observed trends (Sect. 3.2.2(1)), whereas changes attributed to increasing precipitation are not necessarily so (Wilson et al., 2010).
Since the publication of BACC II (BACC II Author Team, 2015), ensemble sizes of scenario simulations with hydrological models have increased, enabling the estimate of uncertainties in projections (e.g. Roudier et al., 2016; Donnelly et al., 2017). Donnelly et al. (2014) focused on projecting changes in discharge to the Baltic Sea by using a semi-distributed conceptual hydrological model for the drainage basin (Balt-HYPE) combined with a small ensemble of climate projections under the SRES A1B and A2 scenarios. Results showed an increased overall discharge to the Baltic Sea, with a seasonal shift towards higher winter and lower summer flows and diminished seasonal snowmelt peaks. Efforts were made to assess the uncertainty in the model chain, and the simulated changes were not larger in magnitude than the ensemble spread, highlighting the importance of such uncertainty assessments in effect studies to frame the quantitative model results.
Arheimer and Lindström (2015) studied future changes in annual maximum and minimum daily flows. Their projections suggested that snow-driven spring floods in the northern central part of Sweden may occur about 1 month earlier than today, and rain-driven floods in the southern part of Sweden may become more frequent. The boundary between the two flood regimes is projected to shift northward.
Past observations (see Sect. 3.2.2(1)) and future projections (e.g. Graham, 2004) suggest a temporal shift in the seasonality of the river discharge, with decreasing flow in spring/summer and increasing flow in winter. Global warming and river regulation due to hydropower production cause similar changes. However, in snow-fed rivers globally, the impact of climate change is projected to be minor compared to river regulation (Arheimer et al., 2017).
3.3.2(2) Land nutrient inputs
Projected changes in riverine discharge and nutrient inputs from the Baltic Sea drainage basin to coastal waters have been studied using a number of modelling frameworks in recent years. Projecting the regional effects of future climate and environmental change on hydrology and nutrient turnover poses challenges in terms of (i) the complex nature of the modelled system, including human influence on riverine nutrient inputs and transport processes alike, which necessitates long projection model chains and leads to uncertainty in modelled hydrologically driven responses, and (ii) the significance of changes in human behaviour, e.g. in terms of land management, population, or nutrient emissions from point sources, which adds complexity to the formulation of scenarios for future change on top of the climate change signal. Hydrological impact studies in the catchment area (and elsewhere), therefore, often explicitly use simplifying assumptions in order to reduce the complexity of the modelled system and to focus on certain aspects of impacts of projected changes.
Hesse et al. (2015) reported increasing discharges in a model study of the Vistula lagoon catchment, using a hydrological model (SWIM), which also allows for nutrient load assessment, and climate change impact modelling based on a climate model ensemble. On average, results showed decreasing trends for nitrogen and phosphorus inputs, but a wide range of projections with individual ensemble members.
Hägg et al. (2014) used a split-model approach to project changes in TN and TP inputs to Baltic Sea subbasins. Changes in discharge were estimated with a hydrological model (catchment simulation software – CSIM) combined with a climate projection ensemble, which sampled a range of climate model and emission scenario combinations. Inputs were then calculated with a statistical model, based on modelled discharges and population as a proxy for human nutrient emissions, combining population change assumptions with climate projections. Results showed a general trend towards higher nutrient inputs across the region as a result of climate change, and a significant (i.e. potentially trend changing) influence of human nutrient input reduction scenarios, particularly in the southern half of the Baltic Sea catchment basin.
Øygarden et al. (2014) used measurements in a number of small agricultural catchments to establish functional relationships between precipitation, runoff, and nitrogen losses from agricultural land and qualitatively related their findings to projected precipitation changes across the Baltic Sea drainage basin under climate change scenarios and to anthropogenic measures to counteract the climate-driven effects on nutrients. The analyses showed a positive relationship between runoff and nitrogen losses, as well as between rainfall intensity and nitrogen losses, but stressed the wide range of feedback loops possible between climate change effects and anthropogenic measures through management or policy changes. Such data-driven approaches avoid uncertainties related to effect model chains at the expense of direct basin-wide quantitative effect projections.
The potential effects of nutrient input abatement scenarios under climate change conditions were investigated by Huttunen et al. (2015) in a study of Finnish catchments draining to the Baltic Sea. A national nutrient load model (VEMALA) was combined with a mini-ensemble of climate models, and then a number of agricultural scenarios were derived, based on crop yield and policy changes, and an economic model (DREMFIA) was used to translate scenario assumptions to changes in the nutrient load model for evaluation of effects. On average, increased precipitation led to increased annual discharge and a shift from spring to winter peaks, with TN and TP inputs increasing with the discharge. Here, adaptation scenarios had less of an effect than climate change, with some regional variation, but significantly different load reductions were found among assessed adaptation strategies, leading to the conclusion that adaptation measures are important for overall climate change effect mitigation in the region.
The relative importance of management decisions for TN and TP load effects was studied also by Bartosova et al. (2019), using a hydrological model (E-HYPE) applied for the entire Baltic Sea drainage basin. The ensemble approach combined climate and socioeconomic pathways based on IPCC Fifth Assessment data (Zandersen et al., 2019), where socioeconomic changes were directly translated into changes of the effect model set-up. The influence of nutrient input abatement strategies were shown to be in the same magnitude range as climate effects, thus indicating the importance of effective nutrient input mitigation strategies for the region. In order to increase this efficiency, Refsgaard et al. (2019) developed and explored the concept of spatially differentiated measures for TN load reductions in the Baltic Sea drainage basin, based on the realisation that measures are not uniformly efficient over large areas and should, therefore, not be uniformly applied either.
3.3.3 Terrestrial biosphere
In the following, we focus on the European drought in 2018 to study the impact of very warm conditions on the terrestrial ecosystem and on projections for the terrestrial ecosystems in the Arctic because of the particularly strong climate warming in the Arctic and potentially strong feedbacks from the release of CO2 and CH4 in the northernmost part of the Baltic Sea region. Finally, we discuss mitigation scenarios for land use and land cover changes associated with the Paris Agreement.
Terrestrial ecosystems in the European drought year 2018
The summer of 2018 saw extremely anomalous weather conditions over Europe, with high temperatures everywhere, and low precipitation and high incoming radiation in western, central, and northern Europe (Peters et al., 2020). These extreme weather conditions resulted in severe drought (indicated by soil moisture anomalies) in western, central, and northern Europe, including the entire Baltic Sea region. The impacts of the severe drought and heatwave in Europe in 2018 were investigated in a series of papers, ranging from individual sites to the continental scale (Peters et al., 2020).
Graf et al. (2020) studied the effects of the 2018 drought conditions on the annual energy balance at the land surface, in particular the balance between sensible and latent heat fluxes, across different terrestrial ecosystems at various sites in Europe. Graf et al. (2020) found a 9 % higher incoming solar radiation compared to their reference period across the drought-affected sites. The outgoing shortwave radiation mostly followed the incoming radiation, with an increase of 11.5 %, indicating a small increase in surface albedo. The incoming longwave radiation, on the other hand, did not change significantly, indicating that the effects of higher atmospheric temperatures and reduced cloudiness cancelled out, while outgoing longwave radiation increased by 1.3 % as a result of higher land surface temperatures. Overall, the net radiation increased by 6.3 % due to the extreme drought conditions. As for the non-radiative surface energy fluxes, the sensible heat flux showed a strong increase by 32 %, while the latent heat fluxes did not change significantly on average. Graf et al. (2020) attributed the negligible effect on latent heat fluxes to the opposing roles of increased grass reference evapotranspiration on the one hand and soil water depletion, stomatal closure, and plant development on the other. Evapotranspiration increased where and when sufficient water was available and later decreased only where stored soil water was depleted. As a consequence, latent heat fluxes typically decreased at sites with a severe precipitation deficit but often increased at sites with a comparable surplus of grass reference evapotranspiration but only a moderate precipitation deficit. Consistent with this, peatlands were identified as the only ecosystem with very strong increases in latent heat fluxes but insignificant changes in sensible heat fluxes under drought conditions. Crop sites, on the other hand, showed significant decreases in latent heat fluxes.
Lindroth et al. (2020) analysed the impact of the drought on Scandinavian forests, based on 11 forest ecosystem sites differing in species composition, i.e. spruce, pine, mixed, and deciduous. Compared to their reference year, in 2018 the forest ecosystem showed a slight decrease in evaporation at two of the sites, was nearly unchanged at most sites, and increased at two sites with pine forest. At the same time, the mean surface conductance during the growing season was reduced by 40 %–60 %, and the evaporative demand increased by 15 %–65 % due to the warm and dry weather conditions. The annual net ecosystem productivity (NEP) decreased at most sites, but the reasons differed. At some sites, the NEP decrease was due to an increase in ecosystem respiration (RE), while at others both RE and the gross primary productivity (GPP) decreased, with the decrease in GPP exceeding that in RE. At six sites, the annual NEP decreased by over 50 g C m−2 yr−1 in 2018. Across all sites considered, NEP anomalies varied from −389 to +74 g C m−2 yr−1. A multilinear regression analysis revealed that the anomalous NEP could, to a very large extent (93 %), be explained by anomalous heterotrophic respiration and reduced precipitation, with most of the variation (77 %) due to the heterotrophic component.
Rinne et al. (2020) studied the effects of the drought on greenhouse gas exchange in five northern mire ecosystems in Sweden and Finland. Due to low precipitation and high temperatures, the water table sank in most of the mires. This led not only to a lower CO2 uptake but also to lower CH4 emissions by the ecosystems. In total, three out of the five mires switched from sinks to sources of CO2. Estimates of the radiative forcing expected from the drought-related changes in greenhouse gas fluxes indicated an initial cooling effect due to the reduced CH4 emissions, lasting up to several decades, followed by a warming caused by the lower CO2 uptake. However, it is unknown whether these results can be generalised to all wetlands of the Baltic Sea region.
Terrestrial ecosystems in the Arctic region
Climate warming has been particularly strong at high northern latitudes, and climate change projections indicate that this trend will continue, due to the anticipated increase in anthropogenic climate forcing. This strong warming is expected to have major consequences for terrestrial ecosystems in Arctic and sub-Arctic regions.
Zhang et al. (2013) used the Arctic version of a dynamic global vegetation model (LPJ-GUESS, Smith et al., 2001), forced with a regionalised climate scenario (A1B anthropogenic emission scenario), to investigate land surface feedbacks from vegetation shifts and biogeochemical cycling in terrestrial ecosystems under future climate warming. They found marked changes in vegetation by the second half of the 21st century (2051–2080), i.e. a poleward advance of the boundary between forests and tundra, expansion of tundra covered with tall shrubs, and a shift from deciduous trees, e.g. birch, to evergreen boreal coniferous forest. These changes in vegetation were associated with decreases in surface albedo, particularly in winter due to the snow-masking effect, and with increases in evapotranspiration. The reduced surface albedo would tend to enhance the projected warming (positive feedback), while increased evapotranspiration would dampen it (negative effect). The terrestrial ecosystems continued to act as carbon sinks during the 21st century but at diminished rates in the second half of the century. The initial increase in carbon sequestration, due to a longer growing season and CO2 fertilisation, could be reduced and eventually reversed by increased soil respiration and greater CO2 release from increased wildfires. Peatlands were identified as hotspots of CH4 release, which would further enhance the projected warming (positive feedback).
Using a regional ESM (RCA-GUESS; Smith et al., 2011) over the Arctic region, W. Zhang et al. (2014) investigated the role that the biophysical effects of the projected future changes of the land surface play for the terrestrial carbon sink in the Arctic region under a future climate scenario based on a high emission scenario (RCP8.5). In total, two simulations were performed to determine the role of the biophysical interactions, i.e. one with and one without the biophysical feedbacks resulting from the simulated climatic changes to the terrestrial ecosystems in the model. In both simulations, the Arctic terrestrial ecosystems continued to sequester carbon until the 2060–2070s, after which they were projected to turn into weak sources of carbon, due to increased soil respiration and biomass burning. The biophysical effects were found to markedly enhance the terrestrial ecosystem carbon sink, particularly in the tundra areas. These two opposing feedback mechanisms, mediated by changes in surface albedo and evapotranspiration, contributed to the additional carbon sequestration. The decreased surface albedo in winter and spring notably amplified warming in spring (positive feedback), while the increased evapotranspiration led to a marked cooling during summer (negative feedback). These feedbacks stimulated vegetation growth due to an earlier start of the growing season, leading to changes in woody plant species and the distribution of vegetation. In a later study, Zhang et al. (2018) found that these biophysical feedbacks play essential roles also in climate scenario simulations with weaker anthropogenic climate forcing.
Mitigation
The beneficial effects of carbon sequestration by forest ecosystems on climate change may be reinforced, counteracted, or even offset by management-induced changes in surface albedo, land surface roughness, emissions of biogenic volatile compounds, transpiration, and sensible heat flux (see above). Luyssaert et al. (2018) investigated the trade-offs associated with using European forests to meet the climate objectives in the Paris Agreement. The authors argued that a more comprehensive assessment of forest management as a strategy to achieve the goals of the Paris Agreement should go beyond the reduction in atmospheric CO2 and, thus, of the radiative imbalance at the top of the atmosphere. They suggested two additional targets, namely that forest management should neither increase the near-surface temperature nor decrease precipitation because climate effects arising from the changes in the terrestrial biosphere would make adaptation to climate change more demanding. Analysing different forest management portfolios in Europe designed to maximise the carbon sink, maximise the forest albedo, or reduce near-surface temperatures, Luyssaert et al. (2018) found that only the portfolio designed to reduce near-surface temperatures accomplished two of the objectives, i.e. to dampen the rise in atmospheric CO2 and to reduce near-surface temperatures. This portfolio featured a decrease in the area of coniferous forest in favour of a considerable increase in the area of deciduous forest in northern Europe (from 130 000 to 480 000 km2).
3.3.4 Cryosphere
3.3.4(1) Snow
Generally, the relative decrease in snow amount is projected to be smaller in the colder northern and eastern parts of the Baltic Sea region than in the milder southern and western parts (e.g. Räisänen, 2021). There is agreement among the EURO-CORDEX RCMs that the average amount of snow accumulated in winter will decrease by around 50 % for land areas north of 60∘ N for the RCP8.5 scenario by 2071–2100, relative to 1981–2010 (Christensen et al., 2022). South of 60∘ N, the corresponding decrease is almost 80 %. The reduction in snow amount is slightly larger than in the figures presented by the BACC II Author Team (2015), which is consistent with larger average warming and, in the northern part of the area, a smaller precipitation increase projected in the RCP8.5 scenario compared to the SRES A1B scenario analysed by the BACC II Author Team (2015).
For Poland, two additional downscaling experiments were made to produce reliable high-resolution climate projections of precipitation and temperature using the RCP4.5 and RCP8.5 scenarios (Szwed et al., 2019). The results were used as input to a snow model (seNorge) to transform bias-adjusted daily temperature and precipitation into daily snow conditions. The snow model projected future snow depth to decrease in autumn, winter, and spring in both the near and far future. The maximum snow depth was projected to decrease 15 %–25 % by 2021–2050 in both scenarios. By 2071–2100, decreases under RCP4.5 and RCP8.5 were estimated to be 18 %–34 % and 44 %–60 %, respectively (Szwed et al., 2019).
3.3.4(2) Glaciers
The Special Report on the Ocean and Cryosphere in a Changing Climate (IPCC, 2019a) provided an assessment of future projected glacier mass reduction under various RCPs and treated Scandinavian glaciers separately (Hock et al., 2019). Previous projections, summarised in the Fifth Assessment Report of the IPCC (IPCC, 2014a; Vaughan et al., 2014), did not specifically focus on Scandinavian glaciers.
By 2100, likely (i.e. with a likelihood of 66 %–100 %) mass losses for high mountain glaciers are 22 %–44 % (RCP2.6) to 37 %–57 % (RCP8.5) of their mass in 2015. These losses exceed global projections for glacier mass loss of 18±7 % for RCP2.6 and 36±11 % for RCP8.5 (likely ranges; IPCC, 2019a). Glaciers in Scandinavia will lose more than 80 % of their current mass by 2100 under RCP8.5 (medium confidence), and many are projected to disappear, regardless of future emission scenarios (Fig. 28). Furthermore, river runoff from glaciers is projected to change regardless of emission scenario (high confidence) and to result in increased average winter runoff (high confidence) and in earlier spring peaks (high confidence; Hock et al., 2019).

Figure 28Mean projected glacier mass evolution between 2015 and 2100, relative to each region's glacier mass in 2015 (in percent) and ±1 standard deviation under RCP2.6, RCP4.5, and RCP8.5. Source: Hock et al., 2019; see their figure CB6.1.
Projections of future glacier mass loss depend crucially on climate projections providing surface air temperature and precipitation as forcing factors in process-based glacier models. For high mountain glaciers, such as those along the Scandinavian mountains that drain into the Baltic Sea, this is challenging, as the interplay of regional effects such as high mountain meteorology and elevation-dependent warming (Wang et al., 2016; Qixiang et al., 2018) with global climate is poorly understood (Hock et al., 2019). Surface air temperatures in mountain regions are projected to increase at an average rate of 0.3±0.2 ∘C per decade until 2050 (very high confidence), i.e. faster than the present global average of 0.2±0.1 ∘C per decade (Hock et al., 2019). Beyond 2050, surface air temperatures in high mountain regions are projected to increase under a high emission scenario (RCP8.5) and to stabilise at 2015–2050 levels under a low emission scenario (RCP2.6; IPCC, 2019a).
Projected changes in surface air temperature for the period 2071–2100 (compared to 1971–2000, under various emission scenarios) for the part of the Baltic Sea drainage basin that extends along the Scandinavian mountains (SMHI, 2020; Kjellström et al., 2016) will be of great importance for the assessment of future mass loss from glaciers draining into the Baltic Sea.
3.3.4(3) Permafrost
Due to recent warming, more than 20 % of the permafrost in the region was already lost in 1997–2018 (Fig. 13; Obu et al., 2020). As warming increases, so will the loss of permafrost (Sect. 1.5.2). Global projections show very limited permafrost in the region already at +2 ∘C (Chadburn et al., 2017), but they (including Chadburn et al., 2017) do not account for peatland permafrost, which can persist for centuries outside of its climate equilibrium (Osterkamp and Romanovsky, 1999). Much of the permafrost in the Baltic Sea region was very close to its climatic boundary even before the recent acceleration of climate warming. Much of the lowland permafrost in palsas and peat plateaus in this region is very close to the 0 ∘C thawing point and is likely relict permafrost persisting from the Little Ice Age (Sannel et al., 2016). Observations also show that lowland permafrost thaw has been going on for decades (Åkerman and Johansson, 2008). Preliminary analyses of permafrost loss in 1997–2018 suggest that this was roughly equally divided between alpine and lowland permafrost (22 % and 24 %, respectively; Fig. 13), which is in agreement with projections of loss of all types of Baltic permafrost in the future.
Permafrost thaw by climate warming is known to affect river runoff and its loads of carbon, nutrients, and contaminants such as mercury (Schuster et al., 2018; Vonk et al., 2015). The local effect of permafrost thaw in alpine headwaters can be significant (Lyon et al., 2009), but in the Baltic Sea basin, alpine permafrost thaw will likely have limited influence on the characteristics of river transport at their mouths on the Baltic Sea. This is because the alpine permafrost in the Baltic Sea drainage basin mainly affects solid bedrock or regolith, with almost no soil organic matter stored in permafrost (Fuchs et al., 2015). Thaw of permafrost in peatlands affects soils with very large stocks of organic material and has been suggested to cause large losses of peat carbon and nutrients into aquatic ecosystems (Hugelius et al., 2020). However, these projections are highly uncertain and based on studies of peatland thaw chronosequences in North America that may not be applicable to Fennoscandian permafrost peatlands (see Tang et al., 2018).
The extent of permafrost in the Baltic Sea drainage basin may decrease significantly in this century and, depending on which warming trajectory the Earth takes, may disappear altogether in the coming century. The thaw of alpine permafrost will have little effect on flows of water, carbon, and nutrients to the Baltic Sea. Thawing peatlands may increase the loads of carbon, nutrients, and mercury to the Baltic Sea, but these projections remain highly uncertain.
3.3.4(4) Sea ice
There are two new projections for sea ice in the Baltic Sea that have been produced after BACC II (BACC II Author Team, 2015). Luomaranta et al. (2014) used simplified regression and analytical models to estimate changes in sea ice extent (Fig. 29) and fast ice thickness. Due to their less demanding computational approach, they could base estimates on 28 CMIP5 models. As in the Arctic Ocean (Sect. 1.5.2), annual maximum ice extent and thickness were both estimated to decline in the future, but some sea ice will still form every year, even by the end of the century, which is in agreement with earlier studies (e.g. Haapala et al., 2001; Meier, 2002; Meier et al., 2004a). Under the RCP4.5 and RCP8.5 scenarios, the modelled mean maximum ice thicknesses in Kemi were projected to be 60 cm and nearly 40 cm, respectively, in 2081–2090. However, under the RCP8.5 scenario, two models projected Kemi to be ice free.
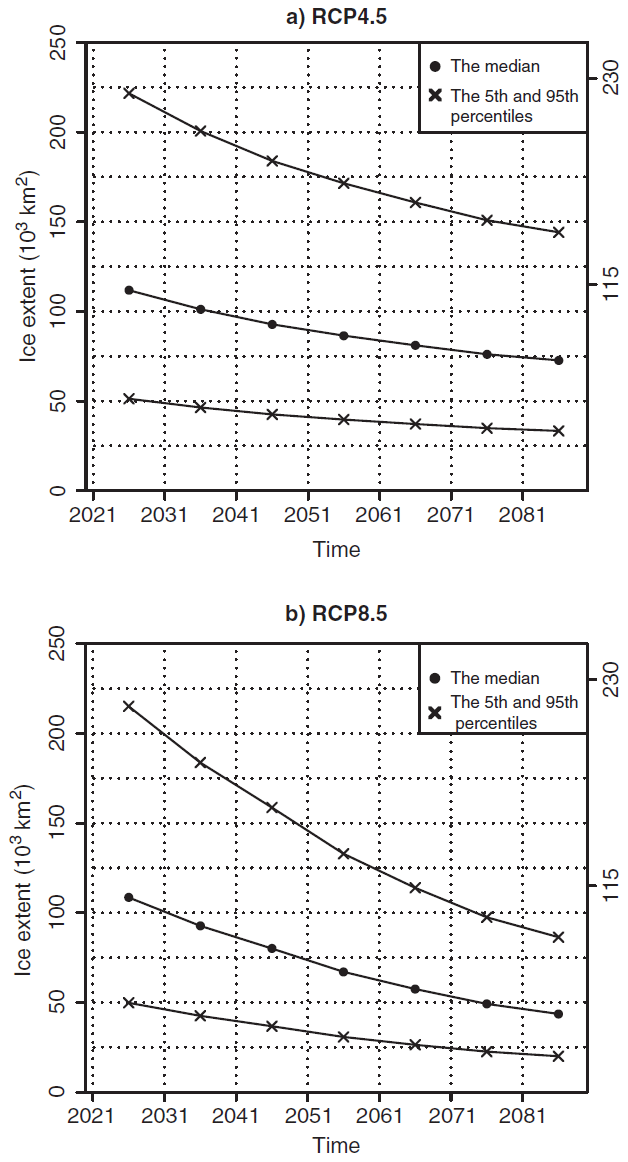
Figure 29Median, 5th, and 95th percentiles of the annual maximum sea ice extent of the Baltic Sea (in 103 km2) estimated from 28 CMIP5 models. The right-hand side vertical axis shows the upper class limits for mild and average ice winters. (a) RCP4.5. (b) RCP8.5. Source: Luomaranta et al., 2014; their Fig. 5 is distributed under the terms of the Creative Commons CC-BY 4.0 License (http://creativecommons.org/licenses/by/4.0/, last access: 17 February 2022).
Höglund et al. (2017) used a more advanced approach to examine changes in sea ice conditions with a coupled ice–ocean model (Hordoir et al., 2019; Pemberton et al., 2017). They used downscaled atmospheric data from the EC-Earth and the Max Planck Institute ESMs and simulated the response of the ice for the RCP4.5 and RCP8.5 projections. Average annual maximum ice extent at the end of the century was projected to be 90–100 000 and 30–40 000 km2 for the medium and high emission scenarios, respectively, and ice thickness was projected to decrease by 3–6 cm per decade. Höglund et al. (2017) also projected the mobility of the ice to increase but with little effect on future ridged ice production.
3.3.4(5) Lake ice
The latest model experiments demonstrate that the Baltic Sea catchment will experience a substantial reduction in lake ice cover in the future, with many lakes becoming ice covered only intermittently (Maberly et al., 2020; Sharma et al., 2019, 2021; Shatwell et al., 2019). This change will commence in the south and move northwards gradually. Lithuanian and Latvian lakes will lose their ice cover after +2 ∘C warming, and further warming will gradually move winter ice loss northwards, so that, at +8 ∘C warming, only lakes in northernmost Lapland will retain a winter ice cover (Maberly et al., 2020; Sharma et al., 2019, 2021; Shatwell et al., 2019).
3.3.5 Ocean and marine sediments
3.3.5(1) Water temperature
Ocean temperatures are rising at accelerating rates (IPCC, 2019a; Sect. 1.5.3(2)). For the end of this century, scenarios for the Baltic Sea projected a SST increase of 1.1 ∘C (0.8–1.6 ∘C, RCP2.6), 1.8 ∘C (1.1–2.5 ∘C, RCP4.5), and 3.2 ∘C (2.5–4.1 ∘C, RCP8.5) compared to 1976–2005 (Gröger et al., 2019, 2021b; see Table 14). In parentheses, the ensemble spreads indicated by the 5th and 95th percentiles are listed. These changes are slightly larger than the projected global SST changes (Sect. 1.5.3(2)). Ensembles other than the one by Gröger et al. (2019) gave similar results that vary between 1.9 ∘C (RCP4.5) and 2.9 ∘C (RCP8.5) for the ensemble mean temperature increase (Meier et al., 2022; see also Meier and Saraiva, 2020). By the end of the century, SST changes for the RCP8.5 scenarios significantly exceed natural variability. The largest open-sea warming is found in summer in the northern Baltic Sea, due to earlier melting of the sea ice (Figs. 30 and 31). Even higher warming of + 2–6 ∘C (the range denotes RCP2.6 and RCP8.5 scenarios) is projected for the Curonian Lagoon by the year 2100 (Jakimavičius et al., 2018). The north–south gradient and pronounced seasonality of SST trends would be reduced in the future due to vanishing sea ice (Dutheil et al., 2021).
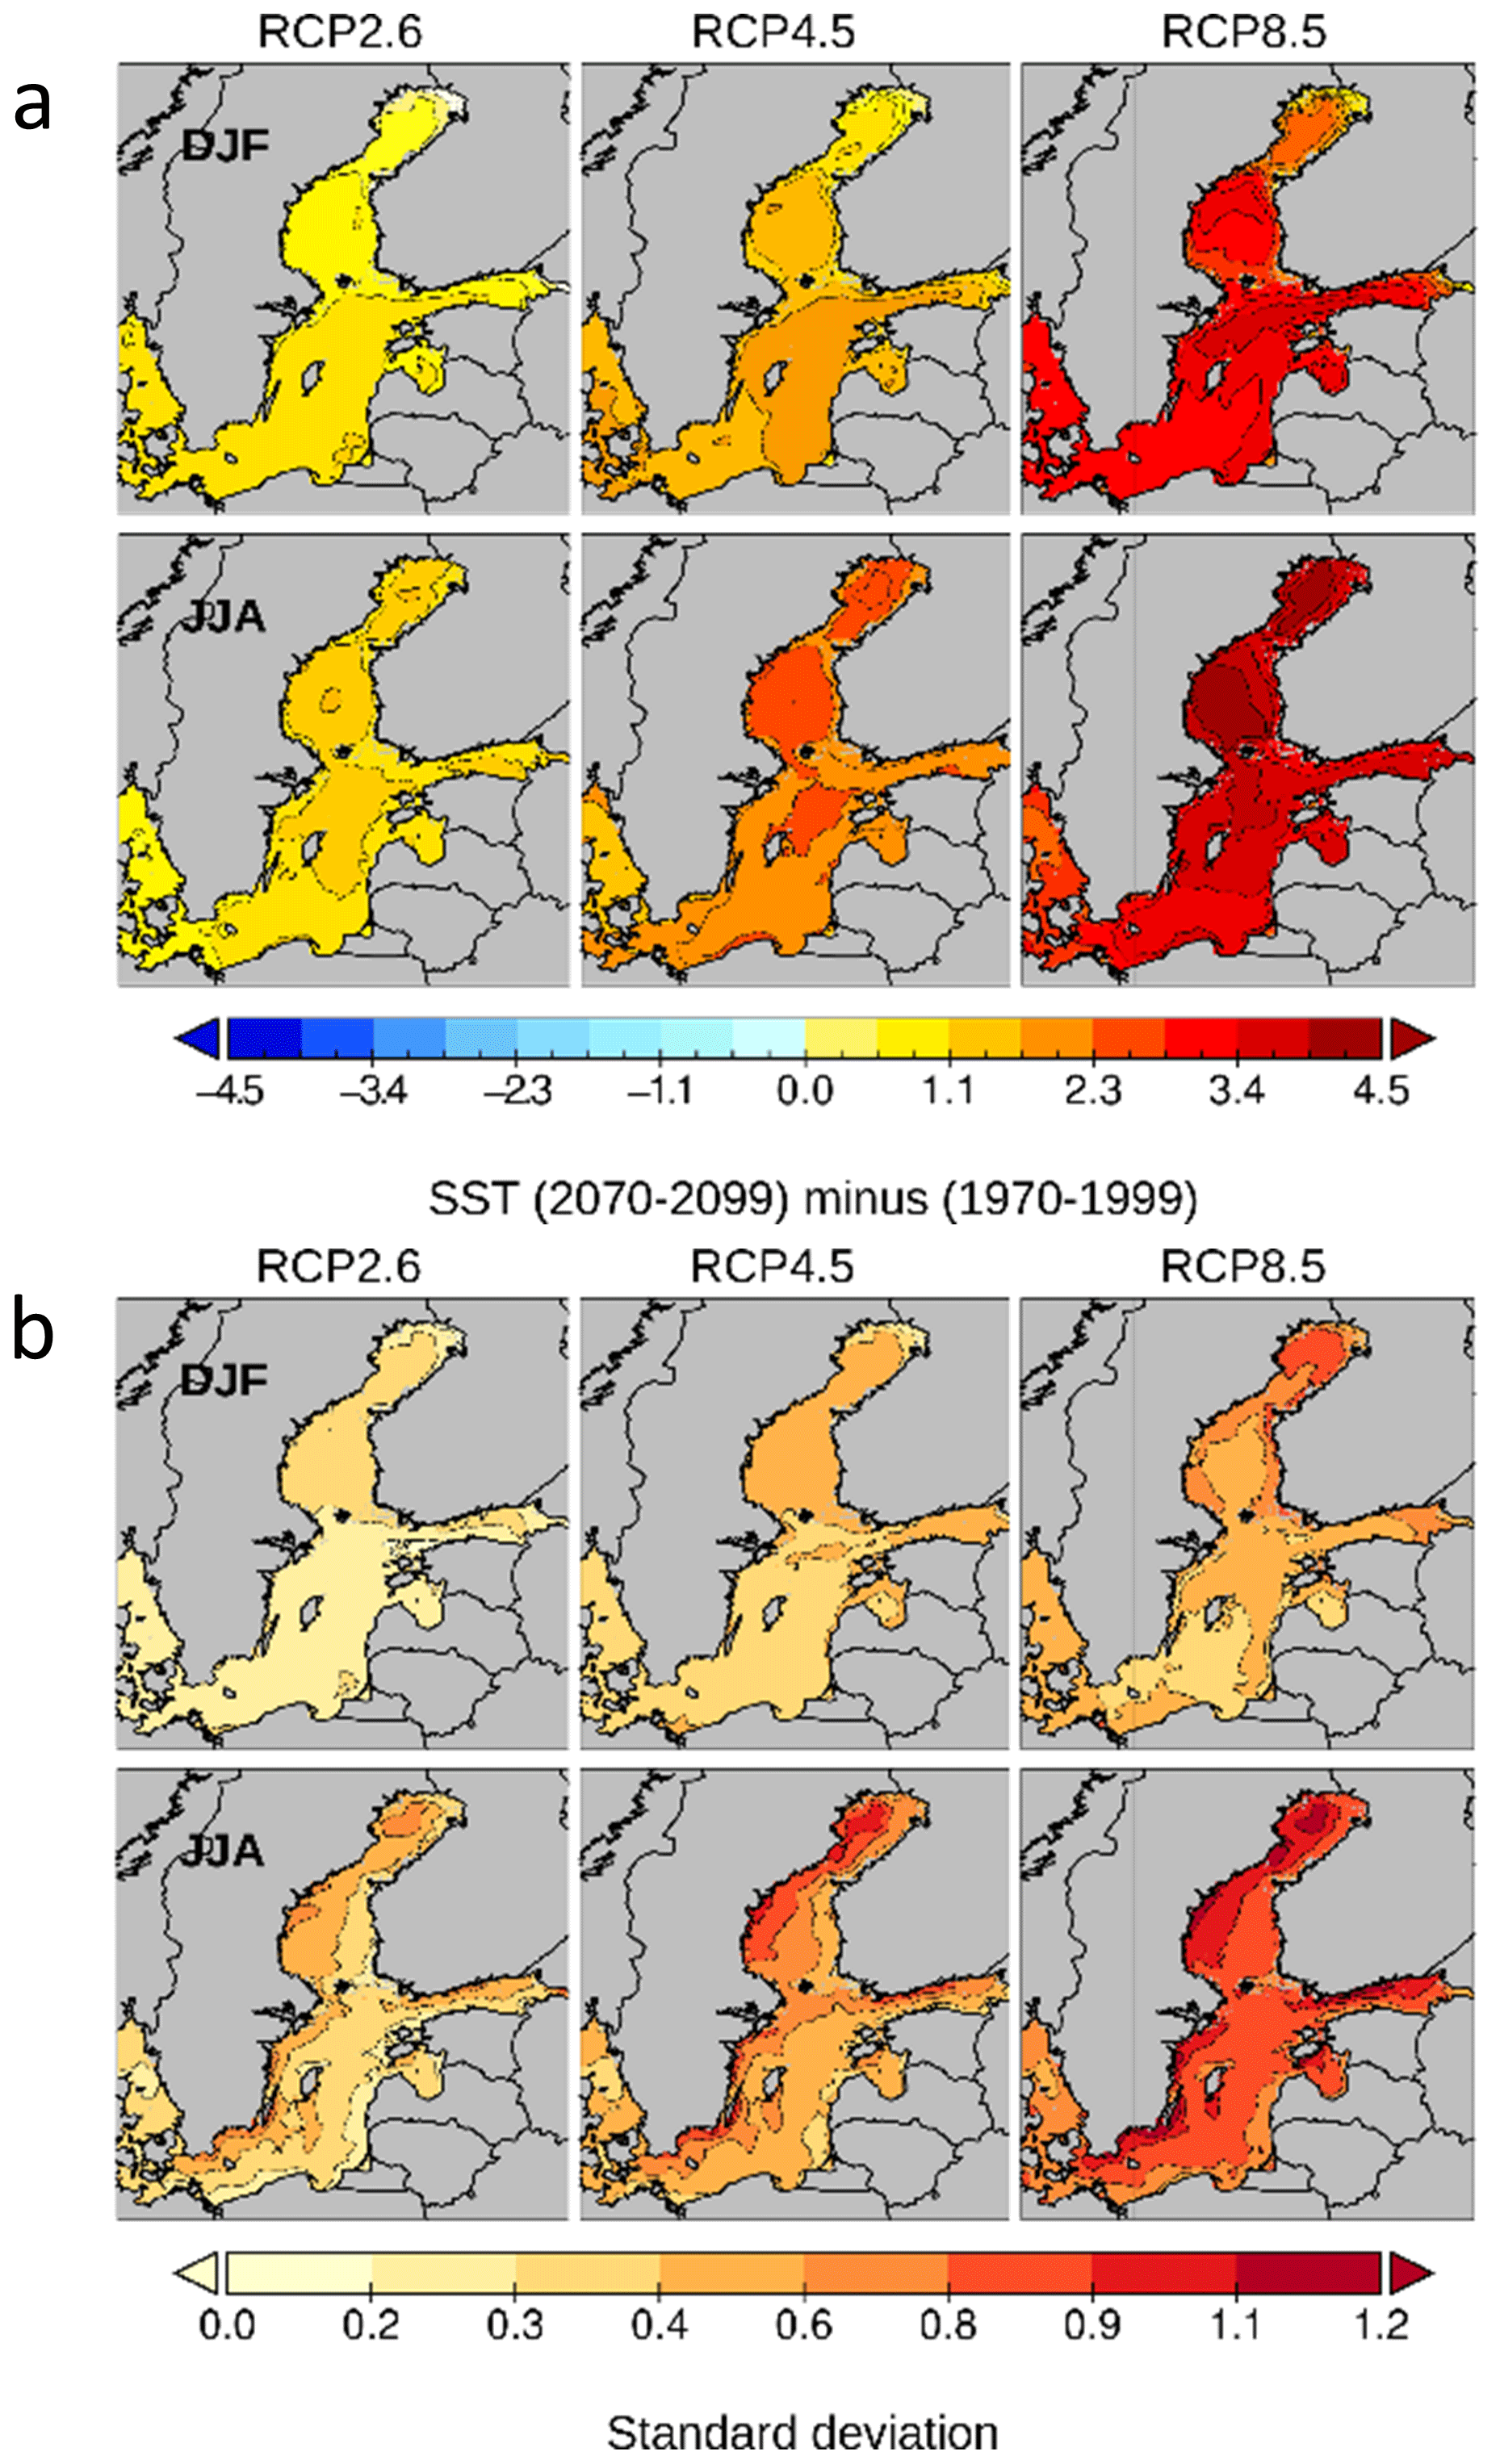
Figure 30(a) Ensemble mean sea surface temperature change (degrees Celsius) between 1970–1999 and 2070–2099 for winter (December through February; upper panels) and summer (June through August; lower panels) under RCP2.6, RCP4.5, and RCP8.5. Panel (b) is the same as panel (a) but for the standard deviation of the change, i.e. the ensemble spread (degrees Celsius). In total, eight different dynamically downscaled Earth system model (ESM) simulations are used. Data source: Gröger et al., 2019.
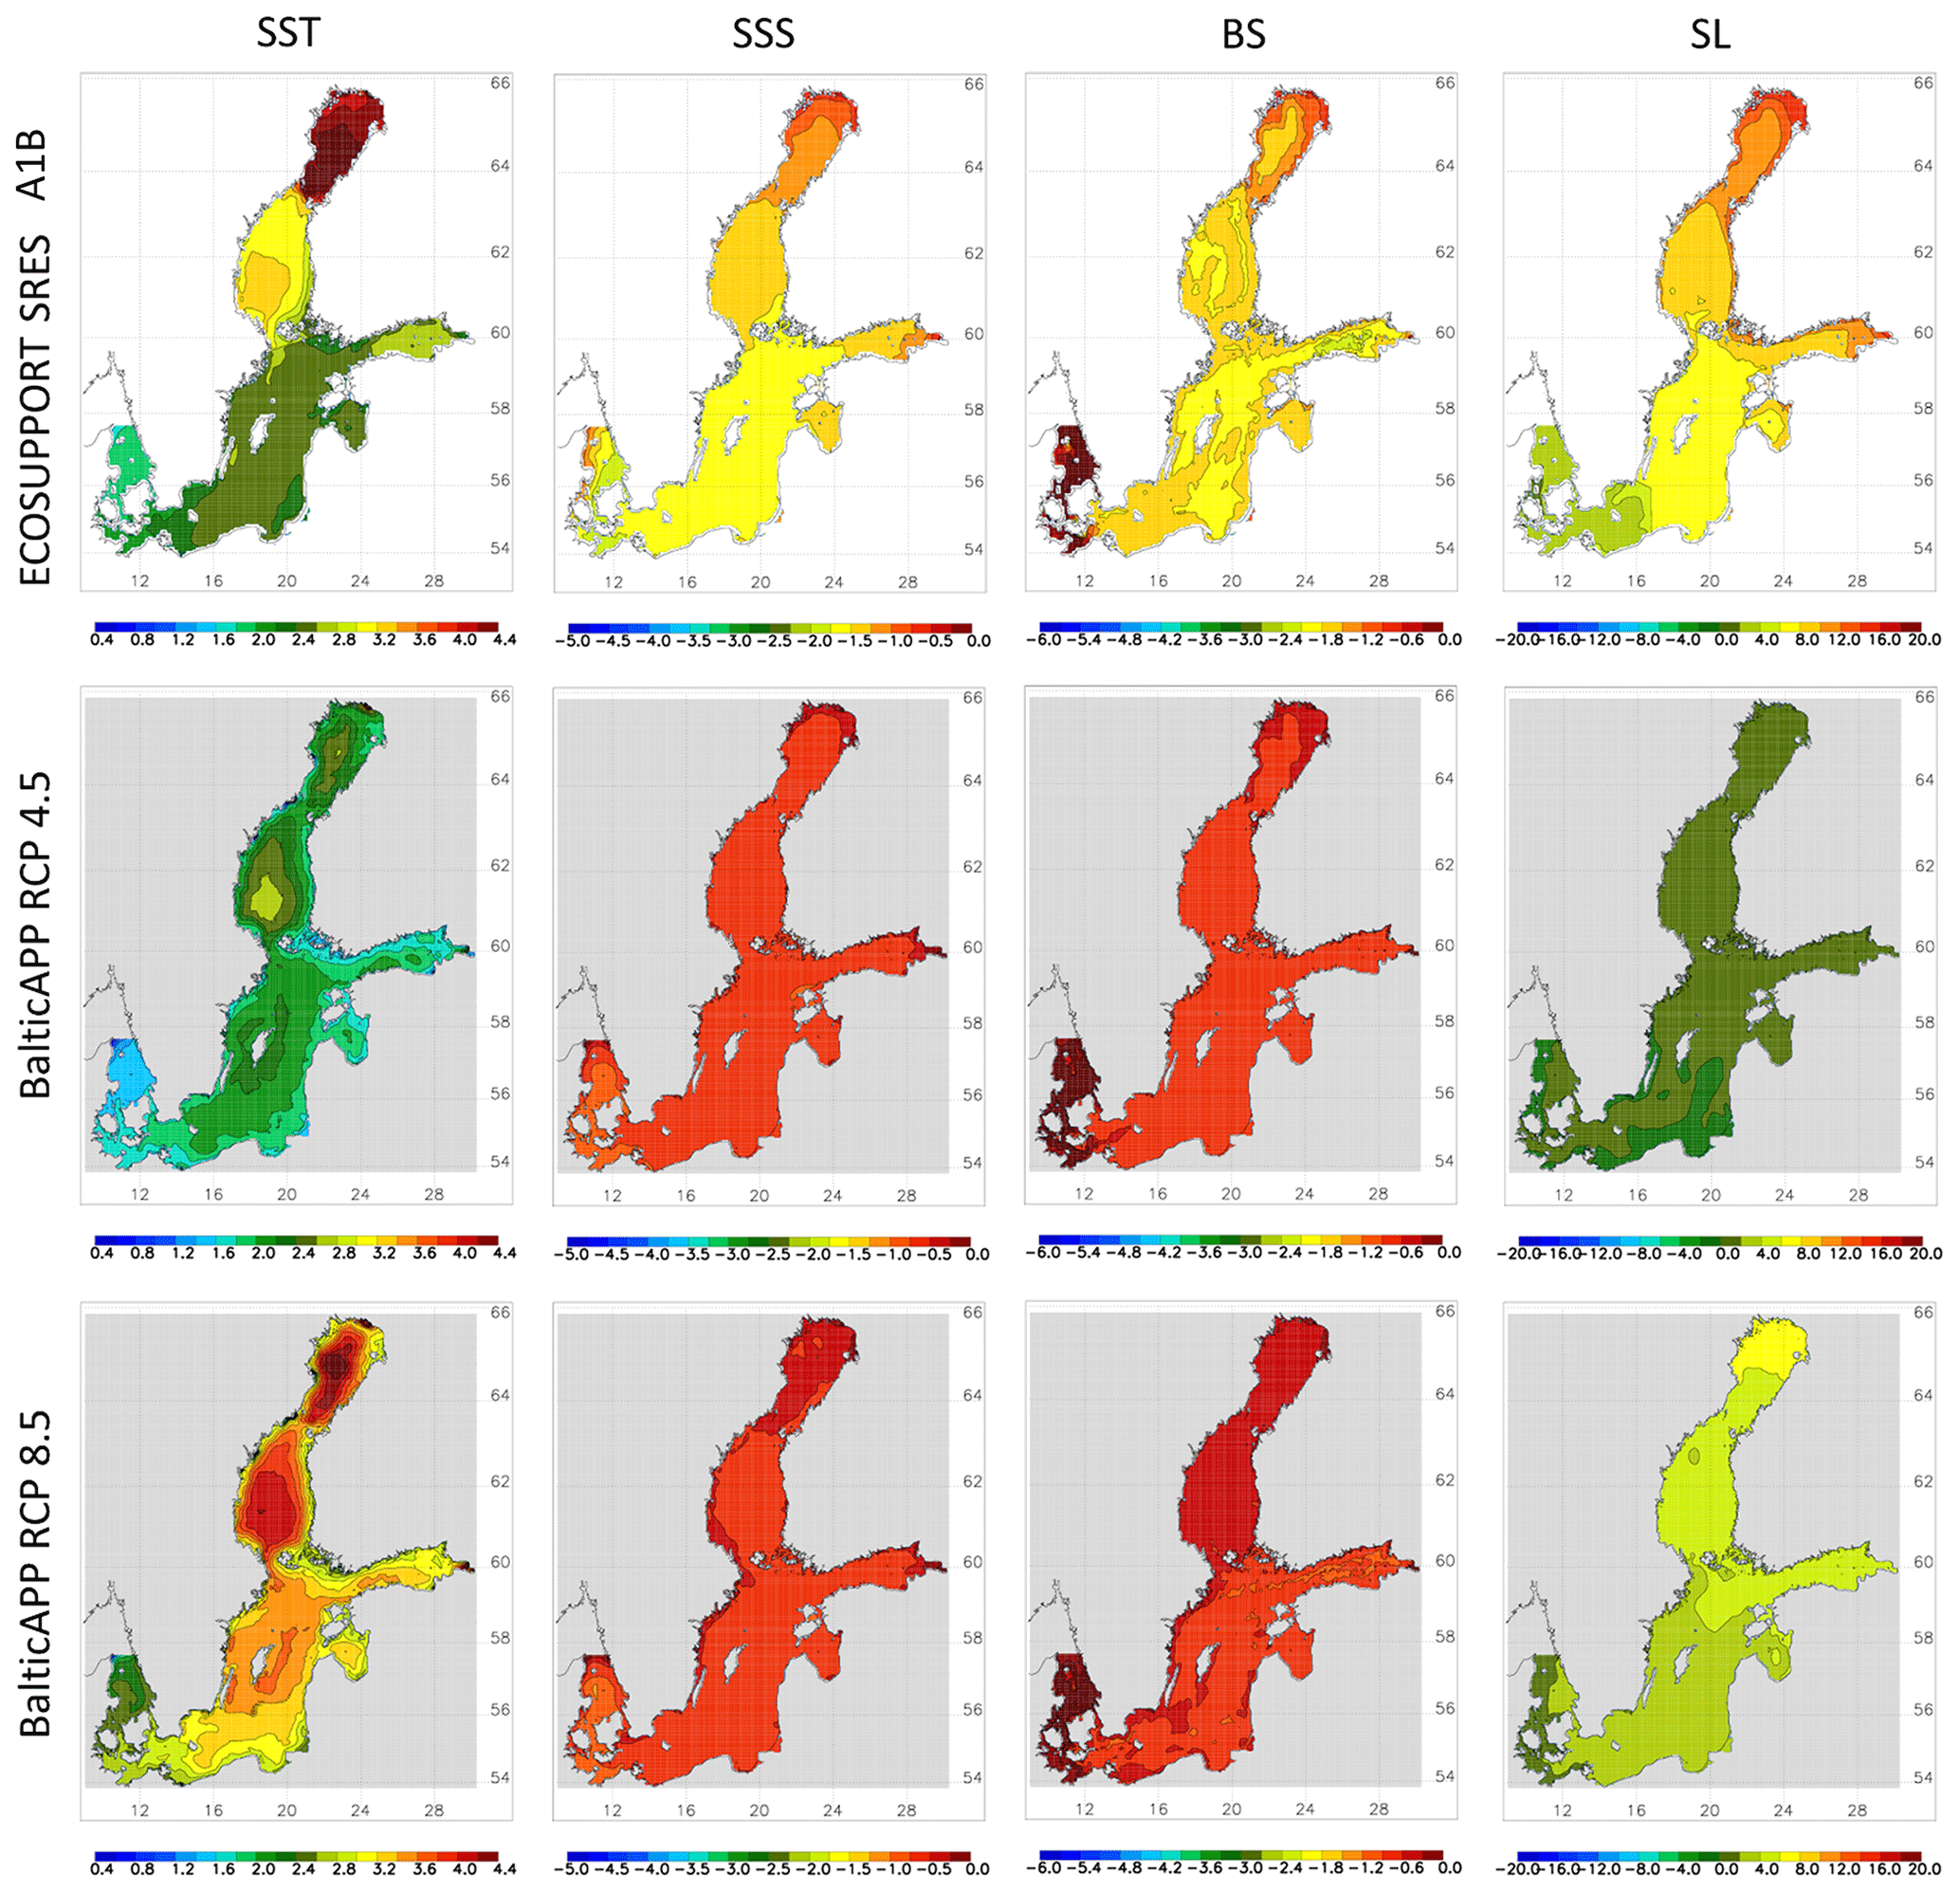
Figure 31Shown, from left to right, are the changes in summer (June to August) mean sea surface temperature (SST; degrees Celsius), annual mean sea surface salinity (SSS; grams per kilogram; hereafter g kg−1), and annual mean bottom salinity (BS; g kg−1) and winter (December to February) mean sea level (SL; centimetres) between 1978–2007 and 2069–2098. From top to bottom, the results of the ensembles by Meier et al. (2011a; ECOSUPPORT), under the A1B/A2 greenhouse gas emission scenario (white background), and by Saraiva et al. (2019b; BalticAPP), under RCP4.5 (grey background) and RCP8.5 (grey background), are depicted. Source: Meier et al., 2022.
The main driver of interannual variations in monthly mean SST is air temperature through the sensible heat fluxes (Meier et al., 2022). The second most important drivers are cloudiness over the open sea and latent heat flux and meridional and zonal wind velocities over coastal areas (the latter probably because of upwelling; Meier et al., 2022). In the vertical, the surface layer is warming more than the winter water, which is sandwiched between the surface layer and the halocline. Hence, the spring and summer thermoclines are becoming more intense (Gröger et al., 2019). Water temperature trends in the deepwater of those subbasins, such as the Bornholm Basin and Gotland Basin, that are sporadically ventilated by saltwater inflows originating from surface water were projected to be elevated as well (Meier et al., 2022). Projected changes in the vertical water temperature distribution are similar to those observed since 1850 (Kniebusch et al., 2019a).
For extreme events, projections suggest, inter alia, more tropical nights over the Baltic Sea, increasing the risk of record-breaking water temperatures (Meier et al., 2019a).
3.3.5(2) Salinity and saltwater inflows
Future changes in salinity will depend on changes in the wind fields over the Baltic Sea region (Lass and Matthäus, 1996), river runoff from the Baltic Sea catchment (Schinke and Matthäus, 1998), and mean sea level rise relative to the seabed of the sills in the entrance area (Meier et al., 2017, 2021a). A projected increase in river runoff will tend to decrease salinity, but sea level rise will have the opposite effect of tending to increase salinity because the water level above the sills at the Baltic Sea entrance would be higher, increasing the cross-sectional area of the Danish straits. As a result, saltwater imports from Kattegat would be larger. A 0.5 m higher sea level relative to the sill bottom at the end of the century would increase estimated Gotland Deep surface salinity by 0.7 g kg−1 and bottom salinity by 0.9 g kg−1 (Meier et al., 2017, 2021a). Furthermore, a hypothetically increasing westerly wind will block the freshwater flow out of the Baltic Sea. Consequently, the saltwater inflow is reduced due to mass conservation (Meier and Kauker, 2003).
Due to the large uncertainty in projected changes in wind fields over the Baltic Sea region (Sect. 3.3.1(5)) in changes in the freshwater supply from the catchment (Sect. 3.3.2(1)) and in global sea level rise (Sect. 3.3.5(4)), salinity projections showed a wide spread. No robust changes were identified because the two main drivers, river runoff and sea level rise, approximately compensate each other (Meier et al., 2021a). According to Saraiva et al. (2019b), river runoff would increase by about 1 % to 21 % at the end of the century, depending on the climate model under both RCP4.5 and RCP8.5. In the ensemble mean, such an increase would cause a decrease in surface and bottom salinity at the Gotland Deep of about 0.6–0.7 g kg−1, with a large spread among the ensemble members. Assuming a negligible global sea level rise, the intensity and frequency of MBIs were projected to slightly increase due to changes in the wind fields (Schimanke et al., 2014). Hence, in ensemble studies that considered all potential drivers, no significant changes in salinity were projected as the ensemble mean (Meier et al., 2021a). In the case of salinity, global climate model uncertainty was identified to be the largest of all uncertainties (Meier et al., 2021a).
3.3.5(3) Stratification and overturning circulation
Model-based estimations of future stratification are still rare and depend critically on how well the models project changes in the three-dimensional distributions of temperature and salinity. A first systematic attempt using a high-resolution coupled ocean–atmosphere model and five different global climate models explored future stratification under RCP8.5 (Gröger et al., 2019). They assumed a 10 % increase in river runoff (approximately the ensemble mean in Saraiva et al., 2019b) and an unchanged mean sea level in the North Sea at the end of the century. The ensemble consistently indicated a basin-wide intensification of the pycnocline by 9–35 % for nearly the whole Baltic Sea and a shallowing of the pycnocline depth in most regions, except for the Gulf of Bothnia (Gröger et al., 2019). The area with a pycnocline intensity >0.05 kg m−3 m−1 increased by 23 %–100 %. The warm season thermocline likewise intensified in nearly the entire Baltic Sea (Gröger et al., 2019).
All ensemble members indicated a strengthening of the zonal, wind-driven, near-surface overturning circulation in the southwestern Baltic Sea towards the end of the 21st century, whereas the zonal overturning at depth was reduced by ∼25 % (Gröger et al., 2019). In the Baltic proper, the meridional overturning showed no clear climate change signal. However, three out of five ensemble members indicated at least a northward expansion of the main overturning cell. In the Bothnian Sea, all ensemble members showed a significant weakening of the meridional overturning.
As the study by Gröger et al. (2019) and previous projections (e.g. Meier et al., 2006) did not consider global sea level rise, these scenario simulations are no longer considered plausible (Meier et al., 2021a, 2022). Considering all drivers of changes in salinity in the Baltic Sea (wind, river runoff, and global sea level rise), neither the saline-induced stratification nor the overturning circulation was projected to change systematically among climate models (Meier et al., 2022). It was found that, under a RCP4.5 or RCP8.5 scenario, a linearly rising mean sea level by the figures suggested by IPCC (2019b) would approximately counteract the effects of projected river runoff increases and wind changes on salinity.
3.3.5(4) Sea level
Global mean and, thus, Baltic Sea level will continue to rise at an increasing rate. During this century, melting ice sheets in Antarctica and Greenland are expected to contribute more to the total sea level than in the past (e.g. Mitrovica et al., 2018). The fingerprints from melting ice sheets in Antarctica on sea level rise will be more pronounced in the Northern Hemisphere and introduce large uncertainties for the Baltic sea level rise. On the other hand, ice melt in Greenland has a relatively modest effect on sea level in the Baltic Sea. Furthermore, the sea level in shelf seas such as the Baltic Sea will rise more strongly than one would expect from the thermostatic expansion of the local water column only, due to spill-over effects from the open ocean (Landerer et al., 2007; Bingham and Hughes, 2012). In addition, the long-term rate of coastal land rise is not easy to estimate accurately, due to the limited length of global positioning system (GPS) measurements and frequently revised geological model values.
Estimates for the ensemble mean global sea level rise by 2100, relative to 1986–2005, ranged from 43 cm (RCP2.6) to 84 cm (RCP8.5), with likely ranges of 29–56 cm and 61–110 cm, respectively (IPCC, 2019a; see Sect. 1.5.3(1)). Note that the figures in Sect. 1.5.3(1) refer to the mean changes between 1986–2005 and 2081–2100 and the previous IPCC AR5 (2014b) with 10 cm lower changes in sea level for RCP8.5 compared to IPCC, (2019a). In particular for RCP8.5, sea level rise projections by the Fifth IPCC Assessment Report (IPCC, 2014a) were somewhat lower than those from the more recent Special Report on the Ocean and Cryosphere in a Changing Climate (IPCC, 2019a) because of the updated contribution from Antarctica based upon new ice sheet modelling.
For the period 2090–2099, relative to 1980–1999, and based on the SRES A1B scenario, the projected absolute sea level rise in the Baltic Sea was estimated to be about 80 % of the global increase (Grinsted et al., 2015). These results were confirmed by other studies for other scenarios and slightly different reference periods (e.g. Kopp et al., 2014; Grinsted, 2015) and summarised by Pellikka et al. (2020) who, for the period 2000–2100, documented an ensemble mean absolute sea level rise in the Baltic Sea of about 87 % of the global mean sea level rise.
Altogether, considering land uplift and eustatic sea level rise, very likely ranges (5 %–95 % probability) of relative sea level change between 2000 and 2100 under the most pessimistic IPCC emissions scenario (RCP8.5) were projected to be, for example, + 29 to + 162 cm in Copenhagen (median + 68 cm), − 13 to + 117 cm in Stockholm (median + 25 cm), and + 21 to + 151 cm in St. Petersburg (median + 59 cm; Grinsted et al., 2015). For coastal sites in the northern Baltic Sea, relative sea level changes in the Gulf of Finland in 2000–2100 were projected to be + 29 cm (− 22 to + 92 cm), − 5 cm (− 66 to + 65 cm) for the Bothnian Sea, and − 27 cm (− 72 to + 28 cm) for the Bothnian Bay, where the land uplift is larger (Johansson et al., 2014). The ranges in the latter study were estimated from the 5 % and 95 % cumulative probabilities, considering several published scenarios from the Third and Fourth IPCC Assessment Reports. In a recent study based upon IPCC (2019a), Hieronymus and Kalén (2020) also estimated a sea level fall in the northern Baltic Sea and a 70 cm rise in the south by 2100, based upon the RCP8.5 scenario. These upper bounds of the sea level rise projections imply a very strong future acceleration of the present rates. Current observations seem to show an acceleration, but the present magnitude is still small (Hünicke and Zorita, 2016; see Sect. 3.2.5(4)).
Recent efforts since the IPCC AR5 report (IPCC, 2014a) that focused on the contribution of Antarctic ice sheets to global mean sea level rise have shown that warming ocean water, melting the ice sheets from below, can lead to instabilities in the ice sheet dynamics. The ice sheets flowing from land into the ocean are in contact with the ocean floor out to the grounding line. From there on outward, the ocean is melting the ice from below and the ice sheets become thinner and lighter. If the weight of the ice sheet becomes less than the weight of the ocean water it replaces, then it floats up and away. The grounding line retreats inland where the ice sheet is thicker and the ice flow larger and reinforces the ice loss (Mercer, 1978). This and related feedback loops could lead to an extra metre of sea level rise until the end of the century (e.g. Sweet et al., 2017). The most recent estimates based on expert judgement (Bamber et al., 2019) for global mean sea level rise in 2100, relative to 2000, including these potential contributions (including land water storage), were 69 and 111 cm for low and high sea level scenarios, respectively. For the high sea level scenario, the likely range (5 % to 95 %) was between 62 and 238 cm.
Future changes in sea level extremes in the Baltic Sea depend on future changes in mean sea level and future developments in large-scale atmospheric conditions associated with changing wind patterns. Model projections disagree regarding atmospheric circulation changes, and therefore, their relevance for extreme future sea levels remains unclear (Räisänen, 2017). For the Baltic Sea, changing mean sea levels are expected to have larger effects on future extremes than changing atmospheric circulation (Gräwe and Burchard, 2012). Sea ice loss in the future will further directly expose the northern Baltic coastline to stronger storm surges.
Recent projections of extreme sea levels along Europe's coasts have considered all drivers by linear superposition, i.e. absolute mean sea level rise and land uplift, tides (small in the Baltic Sea), storm surges, and waves (Vousdoukas et al., 2016, 2017). The results suggested that extreme sea levels will increase more than the mean sea level due to small changes in the large-scale atmospheric circulation, such as a northward shift of the Northern Hemisphere storm tracks and westerlies and increases in the NAO/Arctic Oscillation (AO; IPCC, 2014b). These changes in the large-scale atmospheric circulation of the Baltic Sea region are, however, not robust among GCMs, giving the projections of extreme sea levels by Vousdoukas et al. (2016, 2017) low confidence.
3.3.5(5) Waves
The few existing wave climate projections for the Baltic Sea indicate an increase in the mean wave conditions, either in the whole area (Groll et al., 2017) or in its northern part (Bonaduce et al., 2019). This increase in the mean conditions has been linked to two main drivers, i.e. (1) increased wind speeds and (2) reduced seasonal ice cover.
Groll et al. (2017) projected wave climate at the end of 21st century, based on two different scenarios. They found a slight increase in the median wind speeds for most of the Baltic Sea area, which led to an increase of up to 15 % in median SWH. Using only one climate scenario, Bonaduce et al. (2019) found that decreased wind speed in the southern Baltic Sea led to a decrease in mean SWH, whereas increased wind speeds in the north, especially in winter, led to increased mean SWH. As neither study used multi-model ensembles of scenario simulations (an exception for the western Baltic Sea is the work by Dreier et al., 2021), and as there is large uncertainty in the projected wind speeds and directions, which is not attributed to the decline in ice cover, the results may not be representative. The projected changes in SWH estimates are therefore inconclusive.
Based on CMIP5 simulations, Ruosteenoja et al. (2019) estimated that, in future, mean and extreme scalar wind speeds are not likely to significantly change in the Baltic Sea area. Hence, mean wave conditions would not change. They also estimated that the frequency of strong westerly winds will increase, while strong easterly winds will become less common. These type of changes might have more significance on the frequency of extreme SWH values and their spatial patterns.
For extreme values, these studies give even less reliable results. The results of Groll et al. (2017), Suursaar et al. (2016), and Bonaduce et al. (2019) all indicated large spatial variability in how the projected extremes changed. In addition to the wind speed, extreme values are quite sensitive to wind direction, since fetch varies with direction due to the geometry of the Baltic Sea. Mäll et al. (2020) simulated how wave conditions during three historical Baltic Sea storms would change under climate change conditions. The results showed slight, but not significant, changes in extreme SWH values during the storms.
Future changes in seasonal sea ice conditions in the northern Baltic Sea are more reliable, and their effect on the wave climate is easier to estimate (Rutgersson et al., 2022). Mild ice winters have already become common, and new records of the lowest annual maximum ice extent have been recorded (see Sect. 3.2.4(4)). In the Baltic Sea, the ice season partly overlaps with the seasons of the strongest winds, namely autumn and winter. The mean and extreme values of SWH are therefore expected to increase in areas like the Bothnian Sea, which now typically has ice cover in winter, but will have lost it in the future Baltic Sea climate.
3.3.5(6) Sedimentation and coastal erosion
As a consequence of the probably accelerating sea level rise, coastal erosion will increase regionally to fill the increased underwater accommodation space. How much erosion will increase will depend not only on the rate of sea level rise but also on the intensity of storms (Zhang et al., 2017).
Coastal erosion, accretion, and alongshore sediment transport are primarily controlled by winds and wind-induced waves in the Baltic Sea. Projecting the future rate of coastal erosion or accretion in the Baltic Sea is highly uncertain because of a lack of consensus in the prediction of future storms. Neglecting potential change in future storms and assuming an intermediate sea level rise scenario (RCP4.5), an increment of 0.1–0.3 m yr−1 in coastline erosion has been projected for some parts of the southern Baltic Sea coast (Zhang et al., 2017; Deng et al., 2015). Due to the prevailing westerly winds, the dominant sediment transport will continue to be eastwards along most of the southern Baltic Sea coast but with high variability along coastal sections, with a small incidence angle of incoming wind waves (Dudzińska-Nowak, 2017). It has been found that even a minor climate-change-driven rotation of the predominant wind directions over the Baltic Sea may substantially alter the structural patterns and pathways of wave-driven transport along large sections of the coastline (Viška and Soomere, 2013).
The presence of sea ice is an important factor moderating coastal erosion. Storm surges and wave run-up on the beach are much higher in ice-free periods than when there is even partial ice cover. The hydrodynamic forces are particularly effective in reshaping the shoreline when there is no ice and sediment is mobile (Ryabchuk et al., 2011). Due to global warming, both the area and duration of ice cover in the Baltic Sea will be reduced in future (Sect. 3.3.4(4)), thus increasing coastal erosion.
Foredunes will likely continue to form on prograding coasts but at rates influenced by the accelerating sea level rise (Zhang et al., 2017). Foredunes may tend to become higher, but with reduced prograding rate and wavelength, if sea level rise is accelerated or storm frequency increased. If the wind–wave climate is stable, the height of coastal foredunes on a prograding coast remains stable or increases linearly with a low to intermediate rate (<1.5 mm yr−1) of sea level rise. An accelerating rate of sea level rise and/or changing storm frequency will lead to a nonlinear growth in height (following a quadratic or a higher power law; Zhang et al., 2017; Lampe and Lampe, 2018). The critical threshold that separates linear and nonlinear foredune growth in response to sea level rise is likely to be reached before 2050 in the RCP8.5 scenario (Zhang et al., 2017).
The yet-to-be-determined anthropogenic influence affects sediment transport and coastal erosion as well. Sediment transport and coastal erosion are relevant for coastal management, construction, and protection strategies. In general, two main types of management strategies exist for the Baltic Sea coast, i.e. (1) coastal protection by soft or hard measures and (2) adaptation to coastal change, accepting that in some places the coast would be left in its natural state (BACC II Author Team, 2015). However, administrative efforts for coastal protection differ among Baltic Sea countries, even between neighbouring states or nations. It has been found that engineering structures (e.g. piers and seawalls) may influence coastline change at a much larger spatial scale than the dimension of the structure itself.
3.3.5(7) Marine carbonate system and biogeochemistry
The BACC II Author Team (2015) concluded that model simulations indicated that climate change has a potential to intensify eutrophication in the Baltic Sea. However, they also showed that the implementation of nutrient load reductions according to the Baltic Sea Action Plan (BSAP; HELCOM, 2013a) may not only mitigate this effect but may even decrease the hypoxic and anoxic areas in the Baltic Sea. Note that the nutrient load abatement calculations of the BSAP did not take the effect of climate change into account. In contrast, the business-as-usual nutrients input scenario may increase the hypoxic area by about 30 % and even more than double the area affected by anoxia by 2100.
As atmospheric CO2 rises, so will the concentration of CO2 in the Baltic Sea surface water. This will influence the mean future pH, while eutrophication and enhanced organic matter production/remineralisation will increase the amplitude of daily and seasonal pH fluctuations without affecting the mean values much. Taking various nutrient load input scenarios into account, projections suggested that pH in the Baltic Sea surface water will decrease; in the worst-case emission scenario (atmospheric pCO2 of 850 ppm – parts per million), the pH will drop by about 0.40 by 2100, while the decrease in a more optimistic emission scenario (550 ppm) will be smaller, i.e. about 0.26 (BACC II Author Team, 2015).
3.3.5(7.1) Oxygen and nutrients
Projected warming, increased precipitation, and global mean sea level rise may worsen eutrophication and oxygen depletion in the Baltic Sea by reducing air–sea fluxes and vertical transports of oxygen in the water column, intensifying internal nutrient cycling and increasing river-borne nutrient loads due to increased river runoff (Meier et al., 2011a, 2012b, c). However, the future response of deepwater oxygen conditions will depend mainly on nutrient loads from land (Saraiva et al., 2019a, b; Meier et al., 2021a; see Fig. 32). In contrast to the global ocean (see Sect. 1.5.4), future nutrient supplies will have a relatively larger effect on oxygen conditions and primary production than warming. With high nutrient loads, the changing climate will have a considerable negative effect, but if loads are kept low, climate effects can be small or negligible. Scenario simulations suggested that full implementation of the nutrient load reductions required by BSAP will significantly improve the eutrophication status of the Baltic Sea, irrespective of the driving global climate model (Saraiva et al., 2019b; Meier et al., 2021a) and regional coupled climate–environmental model (Meier et al., 2018a). Despite large inherent uncertainties of future projections, modelling studies suggested that the future Baltic Sea ecosystem may unprecedentedly change compared to the past 150 years (Meier et al., 2012a).
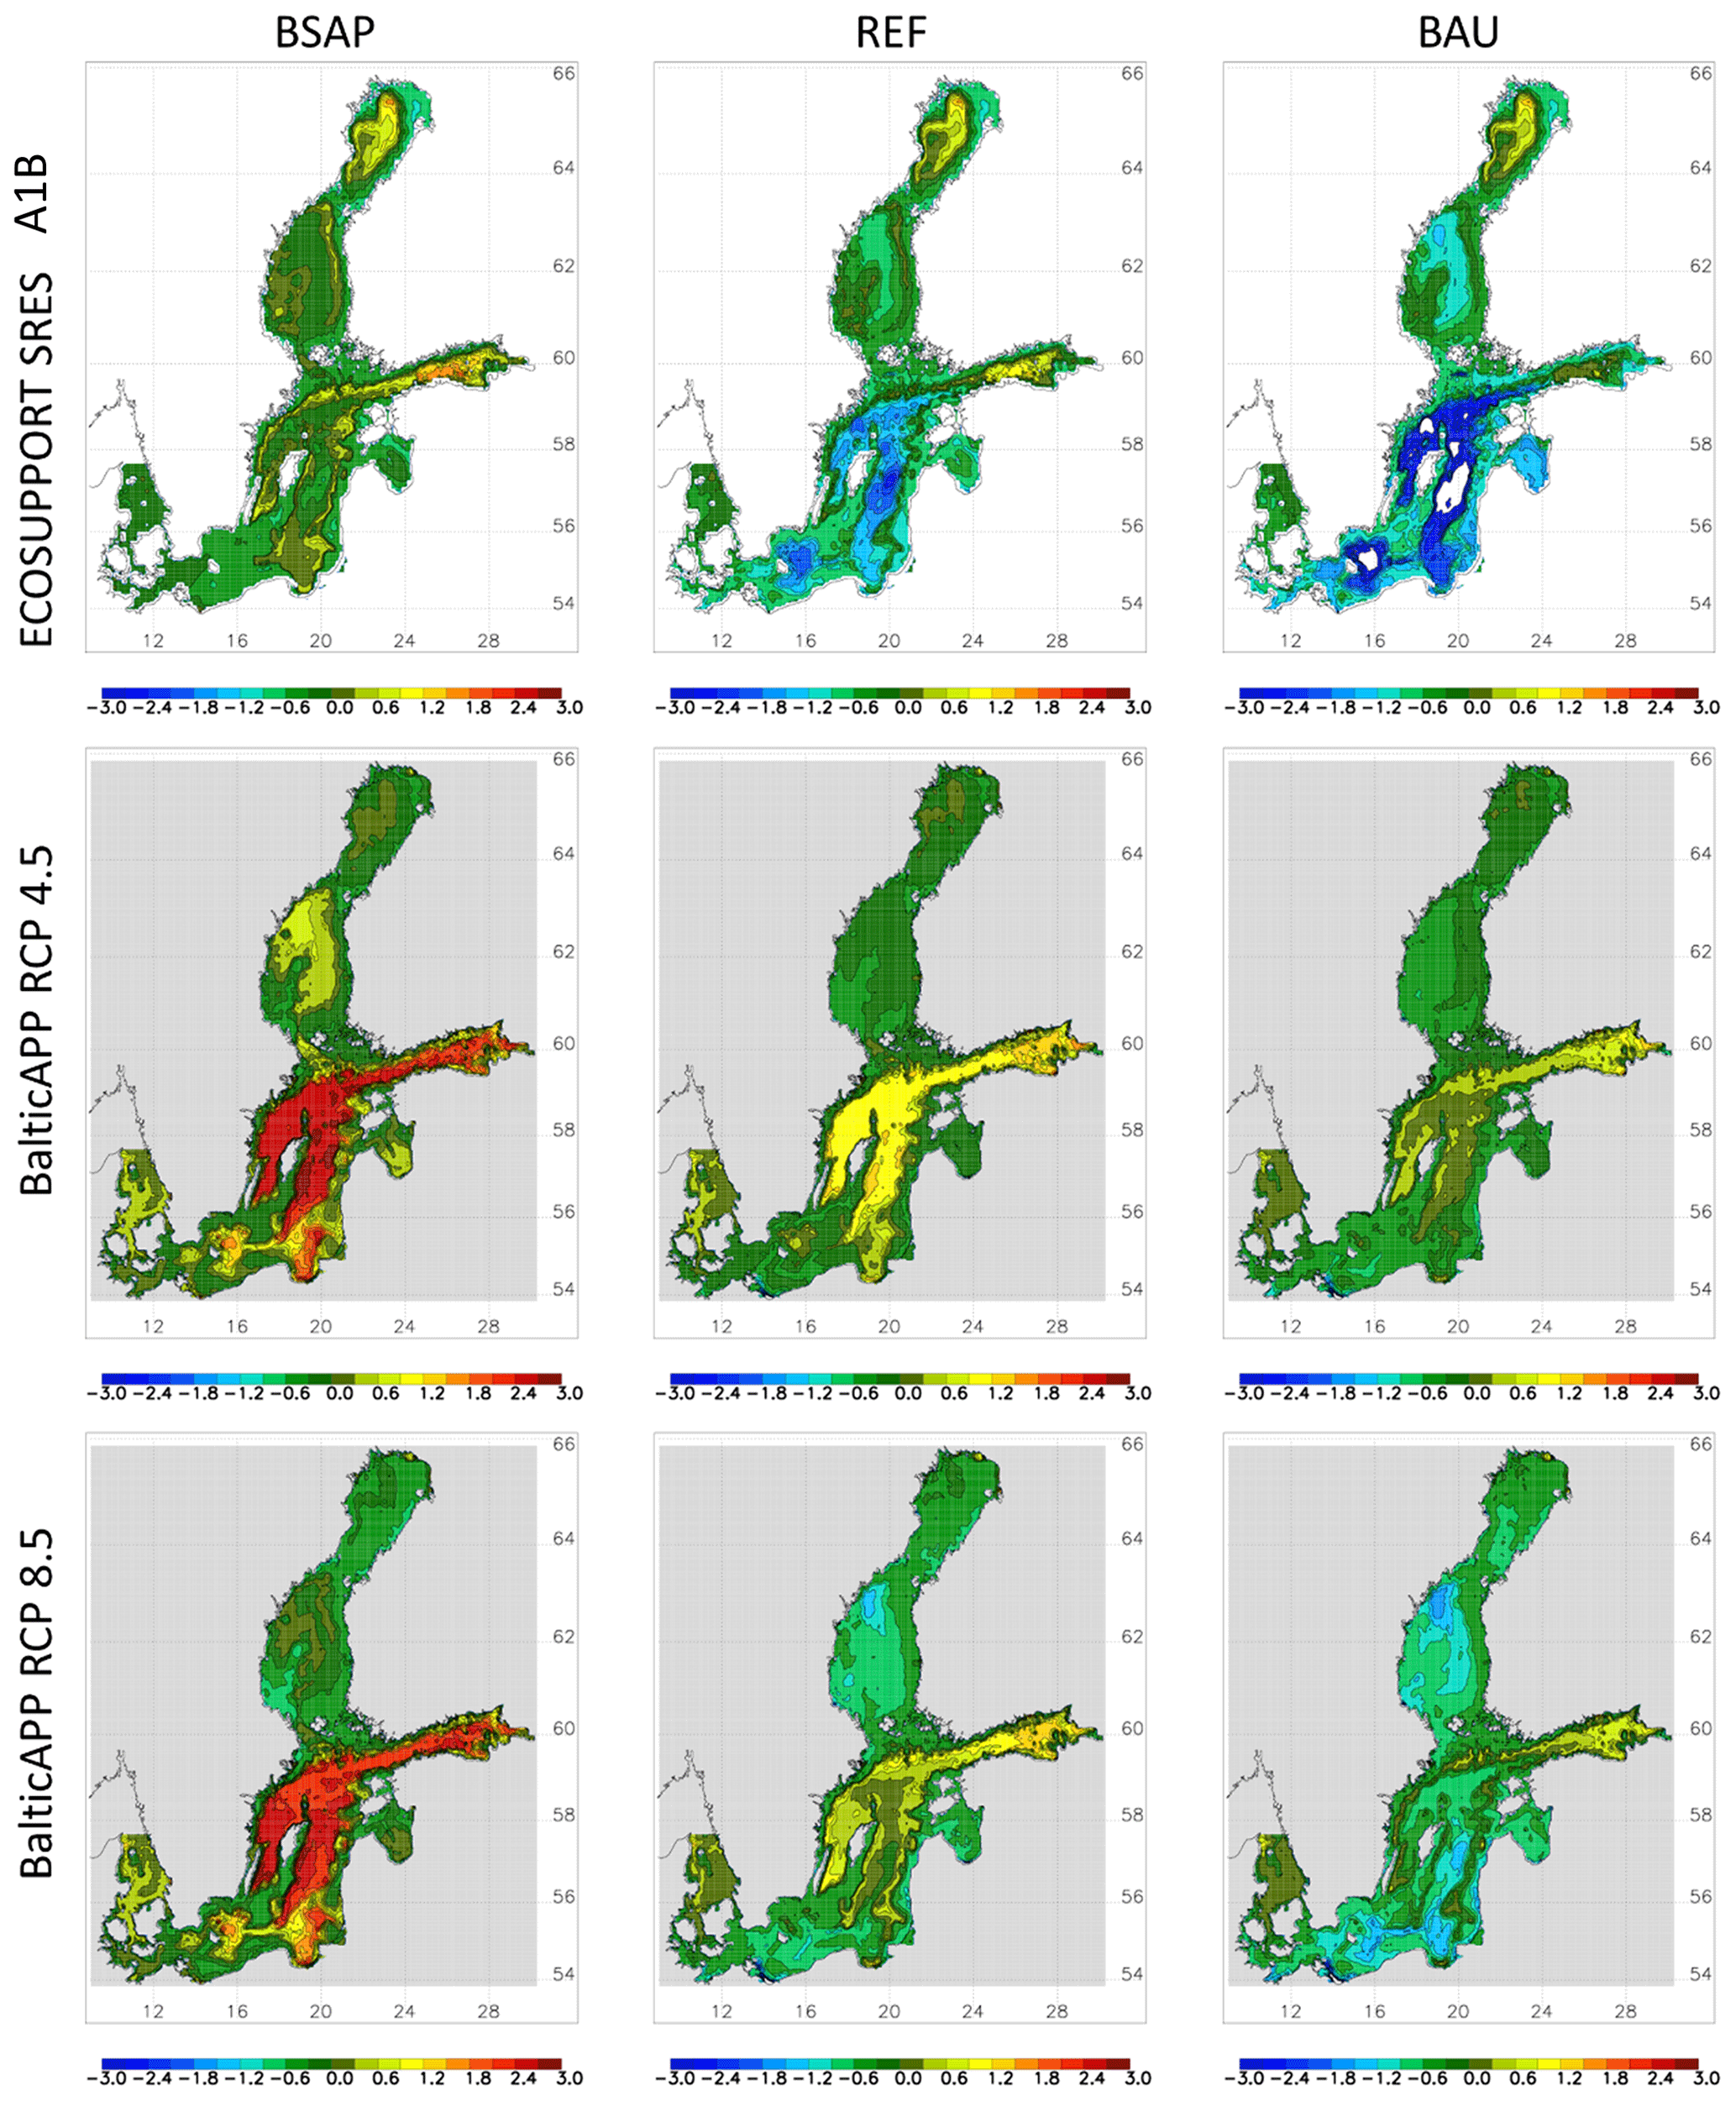
Figure 32Ensemble mean summer (June to August) bottom dissolved oxygen concentration changes (millilitres per litre; hereafter mL L−1) between 1978–2007 and 2069–2098. From left to right, the results of the nutrient load scenarios Baltic Sea Action Plan (BSAP), reference (REF), and business as usual (BAU) are shown. From top to bottom, the results of the ensembles by Meier et al. (2011a; ECOSUPPORT), under the A1B/A2 greenhouse gas emission scenario (white background), and by Saraiva et al. (2019b; BalticAPP), under RCP4.5 (grey background) and RCP8.5 (grey background), are depicted. Source: Meier et al., 2022.
By the end of the century (2069–2098), the ensemble mean hypoxic area is projected to change only slightly under reference (− 14 % for RCP4.5 and − 5 % for RCP8.5) and high (− 2 % for RCP4.5 and + 5 % for RCP8.5) nutrient load scenarios, compared to 1976–2005 (Saraiva et al., 2019b). Nutrient loads in the reference scenario are the average loads in 2010–2012. The high, or worst, scenario assumes changes caused by a fossil-fuelled development, coupled to increasing river runoff (Saraiva et al., 2019a). Changes in nitrogen and phosphorus loads were estimated from assumptions on regional population growth, changes in agricultural practices, such as land and fertiliser use, and developments in sewage treatment (Zandersen et al., 2019; Pihlainen et al., 2020). Under the BSAP scenario, the ensemble mean hypoxic area will be reduced by 50 %–60 % at the end of the century, in comparison with 1976–2005 (Saraiva et al., 2019a). The relative reductions in hypoxic area may decrease with increasing sea level (Meier et al., 2021a).
In the same model ensemble (Saraiva et al., 2019a), BSAP implementation is projected to reduce the water column phosphate pool in the Baltic Sea by 59 % (RCP4.5) and 56 % (RCP8.5) by the end of the century, and even the reference loads would lead to a decline by 24 % (RCP4.5) and 18 % (RCP8.5). Also, a larger ensemble (Meier et al., 2018a) of eight biogeochemical models forced by outputs of seven ESMs downscaled by four different RCMs projected that the BSAP reduced phosphate concentrations in the Baltic proper, Gulf of Finland, and Bothnian Sea despite climate change, with the largest reductions in surface concentrations by approximately 3 mmol m−3 in the Gulf of Finland. Present-day nutrient loads led to small increases in surface phosphate concentration in the Baltic proper, a small decline in the Gulf of Finland, and little change in Bothnian Sea and Bothnian Bay. Little change was predicted for DIN concentrations in the Baltic proper, whereas simulations showed an increase in the Gulf of Finland and the Bothnian Sea, regardless of whether nutrient loads were kept at the present level or whether loads were reduced.
Furthermore, future projections suggested that the sea ice decline in the northern Baltic Sea may have considerable consequences for the marine biogeochemistry because of changing underwater light conditions and wave climate (Eilola et al., 2013). Eilola et al. (2013) found that, by the end of the century, the spring bloom would start by up to 1 month earlier and winds and wave-induced resuspension would increase, causing an increased transport of nutrients from the productive coastal zone into the deeper areas.
For the Baltic proper, the internal nutrient cycling and exchanges between shallow and deeper waters were projected to be intensified, and the internal removal of phosphorus may become weaker in future climate (Eilola et al., 2012). These effects may counteract the efforts of planned nutrient input reductions.
Uncertainties in projections from Baltic Sea ecosystem models have recently been systematically assessed for the first time (Meier et al., 2018a, 2019b, 2021a; Meier and Saraiva, 2020). Larger sources of uncertainty are global and regional climate model uncertainties, in particular concerning global mean sea level rise and regional water cycling (Meier et al., 2019b). The mechanism behind the correlation between large-scale meteorological conditions in the different climate periods and oxygen conditions in the Baltic Sea is not well understood and subject to ongoing research. With respect to nutrient concentrations, uncertainties in conditions at the North Sea boundary and difficulties in simulating the long-term response of the Baltic Sea biogeochemical system to changes in nutrient inputs also play a role.
Under the BSAP scenario, mean nitrogen fixation would decrease (Meier et al., 2021a), and record-breaking cyanobacteria blooms may no longer occur in the future, but record-breaking events may reappear at the end of the century in a business-as-usual nutrient load scenario (Meier et al., 2019a).
3.3.5(7.2) Marine CO2 system
The rising atmospheric pCO2 due to anthropogenic emissions will increase the mean pCO2 of surface seawater and, thus, has the potential to lower the pH. However, the magnitude of pH changes will also depend on the development of total alkalinity concentrations (AT; Omstedt et al., 2012) Future AT changes in the Baltic Sea will be shaped by both external inputs (riverine runoff and inflows from the North Sea) and internal generation. The latter is due to the biogeochemical processes of organic matter production and remineralisation, especially under euxinic conditions. Kuznetsov and Neumann (2013), who used AT as a tracer in a model (no internal processes included) calculated that, on average, AT in surface Baltic Sea waters would decrease by about 150 µmol kg−1 by 2100, a change corresponding to an assumed decrease in salinity. Simulations by Gustafsson et al. (2019) that included most of the biogeochemical processes affecting AT (except S burial and Fe oxide availability) showed that AT in the central Baltic Sea in the business-as-usual scenario will first increase, by about 100 µmol kg−1 by 2050, and then revert to present levels by 2100. If BSAP is implemented, AT will decrease by about 150 µmol kg−1 in 2100 from present levels. Irrespective of the nutrient load scenario, pH is eventually expected to decrease in the central Baltic Sea due to anthropogenic CO2 emissions. Assuming the A1B CO2 emission scenario (pCO2 increase to 700 µ atm by 2100), pH will drop to about 7.9 and 7.8 under business-as-usual and BSAP scenarios, respectively.
All available future projections of changes in alkalinity are highly uncertain, as they address only a few out of multiple factors determining the alkalinity pool in the Baltic Sea, i.e. changes in salinity, river runoff, weathering in the catchment, organic matter production (eutrophication), remineralisation (especially at low redox conditions), and processes in sediments (including pyrite and vivianite formation; Kuliński et al., 2021).
3.3.6 Marine biosphere
3.3.6(1) Pelagic habitats
3.3.6(1.1) Microbial communities
The effects of climate change on microbes and the functioning of the microbial loop have been studied by experiments in which temperature, salinity, dissolved organic matter (DOM), and OA were manipulated. In general, microbial activity and biomass increased with increasing DOM and temperature (Ducklow et al., 2009), but effects can be mixed. For instance, an increase in DOM in the northern Gulf of Bothnia enhanced the abundance of bacteria, whereas a temperature increase (from 12 to 15 ∘C) decreased their abundance, probably due to a simultaneous increase in bacterivorous flagellates (Nydahl et al., 2013).
In the southern Baltic Sea, the impact of OA was limited, and the bacterial community responded primarily to temperature and phytoplankton succession (Bergen et al., 2016). In experiments where CO2 was increased and salinity decreased (from 6 to 3 g kg−1), heterotrophic bacteria declined (Wulff et al., 2018). In experiments with increasing temperature (from 16 to 18–20 ∘C) and reduced salinity (from 6.9 to 5.9 g kg−1), the Baltic proper microbial community also showed mixed responses, probably due to indirect food web effects (Berner et al., 2018).
3.3.6(1.2) Phytoplankton and cyanobacteria
The projected increase in precipitation is expected to increase nutrient loads, especially into the northern Baltic Sea (Huttunen et al., 2015), and together with increased internal loading of nutrients, several modelling studies project an increased phytoplankton biomass by the end of the century (Meier et al., 2012b, c; Skogen et al., 2014; Ryabchenko et al., 2016).
Several mesocosm studies have investigated the effects of warming on southern Baltic Sea phytoplankton communities. Warming accelerated the phytoplankton spring bloom and increased primary productivity (Sommer and Lewandowska, 2011; Lewandowska et al., 2012; Paul et al., 2015). The total phytoplankton biomass still decreased due to the negative effects of warming on nutrient flux (Lewandowska et al., 2012, 2014).
OA may enhance phytoplankton productivity by increasing the CO2 concentration in the water. The biomass of southern Baltic Sea autumn phytoplankton increased in mesocosms simulating OA (Sommer et al., 2015). In many experiments, OA had, however, little effect on phytoplankton community composition, fatty acid composition, or biovolume in spring or autumn (Paul et al., 2015; Bermúdez et al., 2016; Olofsson et al., 2019).
It has been suggested that climate change may increase the blooming of toxic species, such as the dinoflagellate Alexandrium ostenfeldii (Kremp et al., 2012, 2016) and the cyanobacterium Dolichospermum sp. (Brutemark et al., 2015; Wulff et al., 2018). There are also contradictory results indicating that OA and warming may decrease the biomass of Nodularia sp. and Dolichospermum sp. (Eichner et al., 2014; Berner et al., 2018). Several modelling studies projected increases in cyanobacteria in the warmer and more stratified future Baltic Sea (Meier et al., 2011b; Andersson et al., 2015; Neumann et al., 2012; Chust et al., 2014; Hense et al., 2013), but other modelling studies projected that the environmental state of the Baltic Sea will be significantly improved, and extreme cyanobacteria blooms will no longer occur if BSAP is fully implemented (Meier et al., 2018a, 2019a; Saraiva et al., 2019a; see Fig. 33).
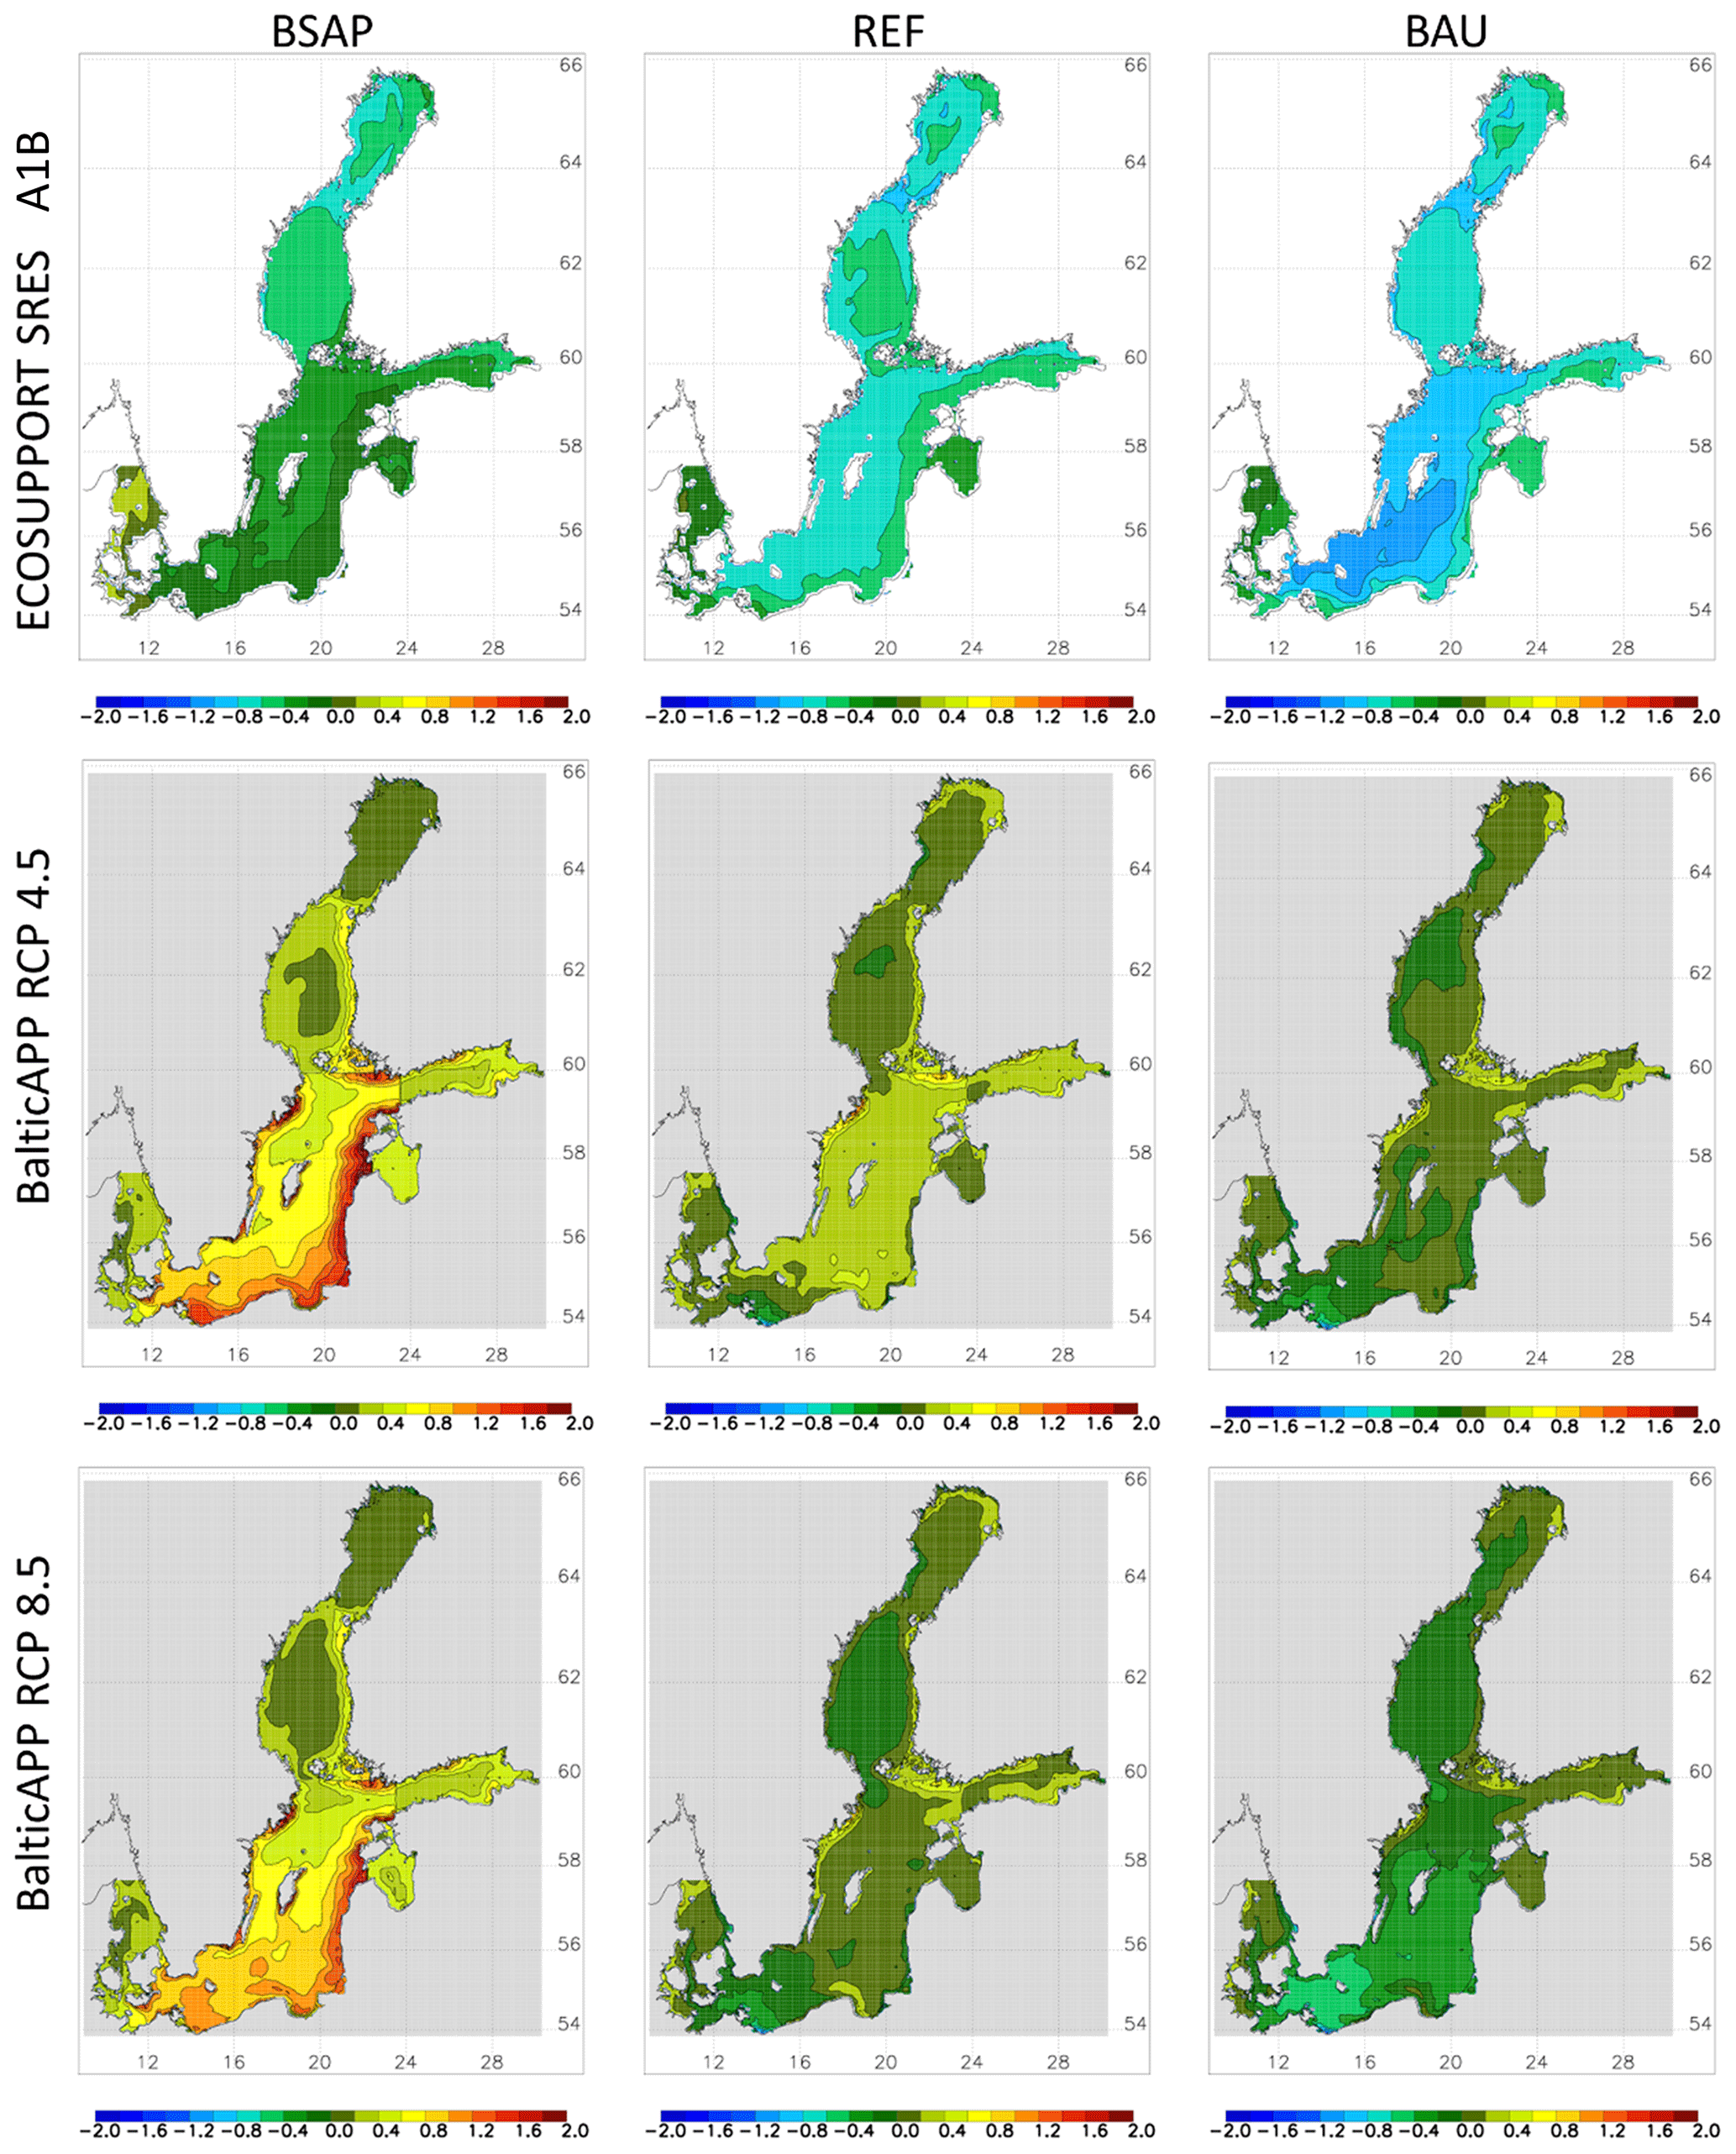
Figure 33The same as Fig. 32 but for annual mean Secchi depth changes (metres). Secchi depth changes indicate changes in water transparency caused by phytoplankton and detritus concentration changes. Source: Meier et al., 2022.
3.3.6(1.3) Zooplankton
The effects of increasing temperature and OA on zooplankton have been studied experimentally. In Acartia sp., a dominant copepod in the northern Baltic Sea, warming decreased egg viability, nauplii development, and adult survival, and both warming and OA had negative effects on adult female size (Garzke et al., 2015; Vehmaa et al., 2013, 2016).
In contrast, the effects of climate change on microzooplankton (MZP) seem to be mostly beneficial. Warming improved the growth rate of southern Baltic Sea MZP, which led to a reduced time lag between phytoplankton and MZP maxima, improving the food supply to microzooplankton in warm conditions (Horn et al., 2015). Aberle et al. (2015) showed that, while protozooplankton escaped predation by slower growing copepods at low temperatures, at warmer temperatures, small ciliates in particular became more strongly controlled by copepod predation.
3.3.6(2) Benthic habitats
3.3.6(2.1) Macroalgae and vascular plants
The effects of climate change on bladderwrack, Fucus vesiculosus, have been studied in a number of experiments. OA appears to have a relatively small effect on macroalgae (Al-Janabi et al., 2016; Wahl et al., 2020), while temperature effects can be significant. The effects of increasing temperature are not linear, however. Growth or photosynthesis is not impaired under projected temperature increase (from 15 to 17.5 ∘C), but at extreme temperatures (27 to 29 ∘C), photosynthesis declines, growth ceases, and necrosis starts (Graiff et al., 2015; Takolander et al., 2017). In very low salinity (2.5 g kg−1), sexual reproduction of F. vesiculosus ceases (Rothäusler et al., 2018).
The direct and indirect effects of changes in temperature, salinity, and pH may alter the geographic distribution of many species in the Baltic Sea. Assuming a decline in salinity, a reduced penetration of marine species, such as bladderwrack, eelgrass, and blue mussel, into the Baltic Sea has been predicted (Vuorinen et al., 2015). A large number of other species is affiliated with such keystone species, and species distribution modelling has indicated that, e.g., a decrease in bladderwrack will have large effects on the biodiversity and functioning of the shallow water communities of the northern Baltic Sea (Jonsson et al., 2018; Kotta et al., 2019). The responses of eelgrass, Zostera marina, to climate change and eutrophication mitigation have recently been modelled by Bobsien et al. (2021).
Experiments on climate change effects have also been made with other macroalgae and vascular plants. Thus, OA increased the growth of the opportunistic green alga, Ulva intestinalis, in the Gulf of Riga (Pajusalu et al., 2013, 2016). Other studies showed that charophyte photosynthesis increased under high pCO2, whereas eelgrass did not respond to the elevated pCO2 alone (Pajusalu et al., 2015). Salinity decline is projected to decrease the distribution of Z. marina and the red alga Furcellaria lumbricalis, whereas warming will probably favour charophytes (Torn et al., 2020).
3.3.6(2.2) Zoobenthos
The effects of warming on invertebrates are nonlinear. The respiration and growth of the isopod Idotea balthica increased up to 20 ∘C and then decreased at 25 ∘C (Ito et al., 2019). Many marine invertebrates, including isopods, will also directly and indirectly suffer from decreasing salinity (Kotta et al., 2019; Rugiu et al., 2017) and OA. The size and time to settlement of the pelagic larvae of the Baltic clam Limecola balthica (Macoma balthica) increased with OA, suggesting a developmental delay (Jansson et al., 2016), whereas OA had no effect on the isopod Saduria entomon (Jakubowska et al., 2013) or the larvae of the barnacle Amphibalanus improvisus (Pansch et al., 2012).
Several modelling studies have estimated the relative effects of hydrodynamics, oxygen, and food availability on Baltic Sea zoobenthos under various scenarios. As the assumptions about climate change and nutrient inputs differ, a comparison between studies is impossible, and final conclusions cannot been drawn. In previously hypoxic areas, benthic biomass was projected to increase (until 2100) by up to 200 % after re-oxygenating bottom waters, whereas in permanently oxygenated areas, macrofauna may decrease by 35 % due to lowered food supply to the benthic ecosystem (Timmermann et al., 2012). It has, however, been concluded that nutrient reductions will be a stronger driver for Baltic Sea ecosystem than climate change (Friedland et al., 2012; Niiranen et al., 2013; Ehrnsten et al., 2019). These studies suggested that benthic–pelagic coupling will weaken in a warmer and less eutrophic Baltic Sea, resulting in gradually decreasing benthic biomass (Ehrnsten et al., 2020).
3.3.6(3) Non-indigenous species
It is often suggested that climate change will favour invasions by non-indigenous species worldwide (Jones and Cheung, 2014). It has been shown that non-native benthic species typically occur in areas with reduced salinity, high temperatures, a high proportion of soft seabed, and low wave exposure, whereas most native species show an opposite pattern (Jänes et al., 2017). Modelled temperature and salinity scenarios suggested an increase in Ponto–Caspian cladocerans in the pelagic community and an increase in dreissenid bivalves, amphipods, and mysids in the benthos of coastal areas in the northern Baltic Sea by 2100 (Holopainen et al., 2016). Disentangling factors facilitating the establishment of non-native species demands long-term surveys and data from multiple environments in order to distinguish climate-related effects from other ecosystem-level drivers (Bailey et al., 2020). In addition, studies on changing connectivity are needed (e.g. Jonsson et al., 2020).
3.3.6(4) Fish
Climate change may affect Baltic Sea fish through changes in water temperature, salinity, oxygen, and pH, as well as nutrient loads, which indirectly affect food availability for fish. The responses of cod larvae to OA and warming have been studied experimentally. Some studies found no effect on the hatching, survival, or development rates of cod larvae (Frommel et al., 2013), while, in others, the mortality of cod larvae doubled when exposed to high-end OA projections (RCP8.5). Several modelling studies, however, project low abundances of cod towards the end of the century, due to continued poor oxygen conditions (Niiranen et al., 2013; Wåhlström et al., 2020).
Climate change may also be positive for fish stocks. Warmer spring and summer temperatures have been projected to increase productivity of sprat (Voss et al., 2011; MacKenzie et al., 2012; Niiranen et al., 2013). For herring, results are more varied as both an increase (Bartolino et al., 2014) and a short-term decrease (Niiranen et al., 2013) have been projected.
Multi-species modelling has also emphasised the role of climate for cod stocks. If fishing is intense but climate remains unchanged, cod declines, but not very dramatically, while if climate change proceeds as projected, cod disappeared in two models out of seven, even with the current low fishing effort (Gårdmark et al., 2013). Different scenarios yield very different outcomes, however. A medium CO2 concentration scenario (RCP4.5), low nutrients, and sustainable fisheries resulted in high numbers of cod and flounder, while high emissions (RCP8.5) and high nutrient loads resulted in high abundance of sprat (Bauer et al., 2018, 2019). All these studies assumed a more or less pronounced decrease in salinity.
3.3.6(5) Marine mammals
Ringed seal and grey seal – sea ice
Climate change is projected to drastically reduce the extent of seasonal sea ice in the Baltic Sea (Luomaranta et al., 2014; Meier, 2006, 2015; Meier et al., 2004b). At the end of the 21st century, ice will probably, in most years, be confined to the Bothnian Bay, the eastern Gulf of Finland, the Archipelago Sea, and the Moonsund (sound between the Estonian mainland and the offshore western islands of Saaremaa, Hiiumaa, Muhu, and Vormsi) and the eastern parts of the Gulf of Riga, such as Pärnu Bay (Meier et al., 2004b), with corresponding changes in the breeding and moulting distribution of ringed seals. Aside from these projections, ice cover has been even more limited in all the southern areas in recent years. Extirpation of one or more of the three southern breeding ringed seal populations is possible (Sundqvist et al., 2012; Meier et al., 2004b).
The ringed seal is an obligatory ice breeder that digs lairs in the snowdrifts on offshore ice for protection of the pup (e.g. Smith and Stirling, 1975). The Baltic grey seal prefers loose floes of drift ice (Hook et al., 1972) but can also breed on land (Jüssi et al., 2008). Overall pup survival in land-breeding grey seals is probably lower than for ice breeders (Jüssi et al., 2008). Absence or low quality of sea ice will adversely affect pup survival and quality in ice-breeding seals. The effects can be seen by the end of the breeding season and beyond (Jüssi et al., 2008). Grey and ringed seals are capital breeders, i.e. their pup quality depends on effective transfer of maternal energy (fatty milk) during a short, intensive lactation period. Timing of birth for both species is strongly adapted to the availability of the optimal breeding platform of sea ice. The height of the pupping season is around February to early March when the extent and strength of sea ice is usually greatest. The immediate breeding success can be defined as the survival and quality of the offspring at the end of the breeding season, but breeding conditions may have population consequences by affecting the survival and fitness of the pups throughout their lives (McNamara and Houston, 1996; Kauhala and Kurkilahti, 2020). A warming climate with higher air and water temperatures will decrease the extent of ice cover, the ice thickness, and the overlaying snow cover, as well as the stability and duration of the ice.
Loss of habitat is critical for the reproductive success of the ice-associated seals, especially the ringed seal, and can eventually lead to local population decreases and changes in breeding distribution, starting in the southernmost parts of its range. The ringed seal populations breeding in the Gulf of Finland, Gulf of Riga, and Archipelago Sea (SW Finland) are already small and vulnerable to any negative changes in habitat quality.
Harbour seal and grey seal – flooding of haul-outs
Harbour seals and grey seals rely on undisturbed haul-out areas for key life cycle events such as breeding, moulting, and resting (Allen et al., 1984; Thompson, 1989; Watts, 1996; Reder et al., 2003). In the southern Baltic Sea, relative sea levels have risen by 1 to 3 mm yr−1 over the interval 1970–2016 (Sect. 3.2.5(4)), and increased rates of sea level rise are expected in the future (EEA, 2019c; Grinsted, 2015). A low emission scenario for the 21st century projects an additional sea level rise of 0.29–0.59 m and a high emissions scenario an extra 0.61–1.10 m, but substantially higher values cannot be ruled out (Grinsted, 2015; IPCC, 2019a). A high emission scenario is, thus, likely to flood all current seal haul-outs in the southern Baltic Sea and many important localities in Kattegat, while under a low emission scenario, most haul-outs in the southern Baltic Sea will be flooded, while others will be reduced to small fractions of their current area. In the northern and central Baltic Sea and northeastern Kattegat archipelago areas, seals will have alternative islets and skerries and are not likely to be affected to the same degree as in the southern and in western Kattegat. In parts of the Gulf of Bothnia, relative sea levels may even fall due to postglacial rebound (EEA, 2019c).
Harbour porpoise
There are no direct studies of the effects of climate change on harbour porpoises in the Baltic Sea. Hence, the following is based mostly on informed guesswork and on a few studies in other areas. There are a multitude of ways that changes in one parameter can affect others, and we do not currently have the knowledge to predict the cumulative effects this might have on the Baltic Sea harbour porpoise population.
Harbour porpoises are present from Greenland to the African coast and the Black Sea and seem to have a rather wide thermal tolerance. Therefore, even though it is projected that we will see a 1.1–3.2∘C increase in SST in the Baltic Sea (Sect. 3.3.5(1)), it seems unlikely that this will directly affect harbour porpoise distribution, unless the Baltic Sea harbour porpoise is specifically adapted to colder temperatures. If this is the case, a northwards range shift might occur. With the expected future decrease in sea ice extent, the winter habitat available for the harbour porpoise in the northern Baltic Sea would increase.
Harbour porpoises are small cetaceans, with limited capacity to store energy, that mostly live in cold environments. Hence, they need to eat almost constantly (Read and Hohn, 1995; Wisniewska et al., 2016) and are therefore expected to be tightly dependent on their prey (Sveegaard et al., 2012). Their main prey species in the Baltic proper are cod (at least before the recent cod stock collapse), sprat, herring, gobies, and sand eel (where present). Climate-induced changes in, for example, SST, fronts, stratification, and, to some degree, currents will affect the distribution, abundance, and possibly the quality of prey species and, in turn, the harbour porpoise population. Their distribution may shift as they follow their prey, and potential food shortages might lead to starvation, with possible population effects.
It has been hypothesised that the susceptibility of marine mammals to disease may increase as temperature increases. Higher temperatures can increase pathogen development and survival rates, facilitate transmission among individuals, and increase individual susceptibility to disease. The negative effects of disease and environmental contaminants on individual fitness will obviously worsen if the animal is also under nutritional stress.
Seals and changes in the distribution of prey species
Any large alteration of the ecosystem can affect the distribution of seals if there are climate-related changes in the abundance and distribution of their main prey species, such as herring, sprat, and cod, as is possible with climate change. Such changes in top consumer distribution have been modelled in other sea areas, such as the UK continental shelf, where the current distribution of harbour seals did not match the projected future distribution of their prey well (Sadykova et al., 2020). There are large differences between Baltic Sea climate projections of future salinity (Saraiva et al., 2019b), and other factors such as temperature, eutrophication, predation, and competition also affect fish distributions. Thus, future changes in abundance and distribution of seal prey species, such as herring and cod, are difficult to project (Dippner et al., 2008, 2019; Lindegren et al., 2010; Vuorinen et al., 2015).
3.3.6(6) Waterbirds
Climate change scenarios agree in projecting a strong temperature increase in the Arctic and sub-Arctic. This will likely cause a northward expansion of species ranges, with colonisation by new breeding and wintering species, and local species declines following migration of populations to ice-free northern waters (Pavón-Jordán et al., 2019; Fox et al., 2019).
If salinity in the Baltic Sea decreases, invertebrate species serving as prey for waterbirds (e.g. blue mussels for common eiders) are likely to change in distribution, body size, and quality as food, with consequences for the distribution, reproduction, and survival of the waterbirds that eat them (Fox et al., 2015). Predicting the consequences of climate change for piscivorous seabirds is complex because the effects are not uniform among Baltic Sea fish species. For example, an expected increase in recruitment and abundance in an important prey species (sprat; MacKenzie et al., 2012; Lindegren et al., 2012) and declining numbers of large piscivorous fish (cod) may favour fish-eating birds, although management efforts to improve cod stocks may counteract the expected increase in sprat and lead to population declines of their main bird predator, the common guillemot (Kadin et al., 2019). Herring, another important prey species, is reported to be negatively affected by decreasing salinity (declining energy content; Rajasilta et al., 2018).
A rising sea level will reduce the area of salt marshes available for the breeding of waders and foraging by geese (Clausen et al., 2013), and other coastal habitats would likewise be affected (Clausen and Clausen, 2014). Sea level rise in combination with storms may cause loss by erosion of current coastal breeding habitats and flood breeding sites, thus affecting the breeding success of coastal waterbirds. Climate change can also be expected to affect waterbirds in the Baltic Sea by changing the incidence of diseases and parasites (Fox et al., 2015).
Marine food webs
Climate change and other anthropogenic environmental drivers are expected to change entire marine food webs, from coastal to offshore, from shallow to deep, and from pelagic to benthic (sedimentary) as species distributions are impacted and key nodes and linkages in the food webs are altered or lost (Lindegren et al., 2010; Niiranen et al., 2013; Leidenberger et al., 2015; Griffiths et al., 2017; Kotta et al., 2019; Gårdmark and Huss, 2020). These climate-driven changes will also, when combined with societal changes, affect aquatic ecosystem services, for instance the future primary production (a supportive ecosystem service) and fish catches (a provisioning ecosystem service; Hyytiäinen et al., 2021).
Certain marine species, e.g. cod and bladderwrack, may decline in both distribution and abundance (Gårdmark et al., 2013; Takolander et al., 2017), whereas others, e.g. sprat and certain mainly coastal freshwater fish, may increase (MacKenzie et al., 2012; Bergström et al., 2016). An increase in cyanobacteria blooms has also been projected, especially for the central Baltic Sea (Meier et al., 2011b; Funkey et al., 2014), while increased flow of DOC may reduce both primary and secondary production in the northernmost low saline areas, with pronounced brown water runoff (Wikner and Andersson, 2012; Figueroa et al., 2021). The responses also depend on human intervention, i.e. the success of nutrient reduction schemes, and are most probably nonlinear (Hyytiäinen et al., 2021; Ehrnsten et al., 2020). However, it can be summarised that – if only climate change is accounted for – most studies tend to project a decline in the overall state of the ecosystem, and a long-term decline in the provision of associated ecosystem services to humans is likely if the climate change is not significantly mitigated.
The term “driver” in this section is defined as something affecting a variable of the Earth system. A driver itself may be affected by other drivers. In this respect, climate is a force affecting other drivers, e.g. land use or shipping. On the other hand, (regional) climate may be affected by other drivers, e.g. land use or shipping. This section summarises plausible two-way dependencies that have been described in the literature. For a deeper analysis, see Reckermann et al. (2022).
Climate change affects air and water temperature, as well as precipitation, with a clear impact on land use and land cover. Growth conditions are affected by these changes but also by political or management decisions, which may in turn be influenced by climate change (Yli-Pelkonen, 2008). Agriculture is the most important land use in the southern part of the Baltic Sea basin. Climate change strongly influences the choice of crops, as crops differ in their requirements for water availability and soil type (Fronzek and Carter, 2007; Smith et al., 2008). Still, socioeconomic considerations may be even more important than climate in determining agricultural land use (Rounsevell et al., 2005; Pihlainen et al., 2020).
Land use and land cover can influence the regional climate through geophysical (e.g. albedo) and biogeochemical (e.g. carbon sequestration) effects. Bright surfaces like agricultural fields reflect more solar radiation than dark surfaces, like forests and open waters. Thus, the type of land cover may affect regional warming, but its relative contribution is disputed (Gaillard et al., 2015; Strandberg and Kjellström, 2019). Increasing droughts with lower river flow at certain times of the year may influence water management and shipping in regulated rivers, especially in the southern catchment basins. On the other hand, extreme rain events may lead to inundations (Kundzewicz et al., 2005).
Climate change will strongly affect coastal structures through sea level rise and intensified coastal erosion. Storm surges, which run up higher as sea level rises, and changed currents and sediment relocations will endanger levees, groynes, and other coastal structures and have to be handled by coastal management (Le Cozannet et al., 2017; Łabuz, 2015).
We can expect a considerable increase in offshore wind energy production worldwide, in order to counteract climate warming. Although projections of future winds are highly uncertain, the number of offshore wind farms can be expected to increase due to the politically driven shift to renewable energies and the limited space for and low acceptance of windmills on land. Offshore wind farms may, in turn, affect the regional climate by absorbing atmospheric kinetic energy on the regional scale (Akhtar et al., 2021), but the magnitude of this effect is unknown (Lundquist et al., 2019).
Shipping is affected by climate change. Perils at sea for ships are all climate sensitive, ranging from storms, waves, currents, ice conditions, visibility, and sea level affecting navigational fairways. Winter navigation will be facilitated as drastically decreasing winter sea ice cover is projected, but search and rescue missions in winter may increase because engine power may, in the future, be adapted to the lower expected ice cover. Further aspects are a potential increase in leisure boating, a potentially temperature-dependent functioning of antifouling paints, and different noise propagation through warmer water. The efficiency of SOx scrubbing depends on the temperature, salinity, and pH of the seawater. Furthermore, highly acid scrubber water may eventually end up contaminating the Baltic Sea, depending on the type of scrubber in use (Turner et al., 2018). Shipping itself affects the climate through combusting fossil fuels, although the emissions can be expected to be reduced with the expected increase in renewable energy within the European Union (European Commission, 1998, 2018a, b).
Coastal processes, e.g. erosion and the translocation of sediments through erosion, currents, and accretion, are affected by climate change through sea level rise and changes in storm frequency, severity, and tracks (Defeo et al., 2009).
Climate change affects the total amount of nutrients entering the sea in precipitation and by land runoff, which, in turn, is affected by precipitation, air temperature, and runoff pattern (e.g. Arheimer et al., 2012, and Bartosova et al., 2019). How fertilisation practices, crops grown, and land use will change in response to climate change is yet to be determined. Climate-related changes in the Baltic Sea, like warmer temperatures, changed stratification, and altered ecosystems and biogeochemical pathways may change the fate of nutrients in the sea (e.g. Kuliński et al., 2021).
There is little evidence of a direct climate influence on the quantity and quality of submarine groundwater discharge, but considering the driving forces (topography-driven flow, wave set-up, precipitation, sea level rise, and convection), it is highly plausible that an effect will occur, but its possible magnitude and relevance is unknown (e.g. Taniguchi et al., 2019).
Fisheries are strongly affected by climate change through its effect on the resources, i.e. the commercially interesting fish populations in the Baltic Sea, including mostly cod, sprat, and herring (Möllmann, 2019). Climate affects salinity and temperature in the Baltic Sea, thereby influencing the productivity of several fish species (MacKenzie and Schiedek, 2007; Köster et al., 2016) and the resources that fisheries exploit. Growth of planktivorous species or life stages is also affected by climatic conditions that regulate zooplankton dynamics (Casini et al., 2011; Köster et al., 2016).
Climatic change is a plausible driver for the migration and occurrence of non-indigenous species, although there is little direct evidence during the current climate change. Shipping has been identified as being a major vector for the introduction of new marine species into the Baltic Sea ecosystem through ballast water or attachment to hulls or the elimination of physical barriers (e.g. through the construction of canals between water bodies; Ojaveer et al., 2017). However, a northward migration of terrestrial (Smith et al., 2008) and marine species, including fish, due to increasing temperature has been documented and is expected to continue (MacKenzie and Schiedek, 2007; Holopainen et al., 2016).
Climate change affects contaminants in the Baltic Sea through an array of processes, like partitioning between environmental phase pairs such as air–water, air–aerosols, air–soil, and air–vegetation, leading to a different distribution between environmental compartments (Macdonald et al., 2003). Atmospheric transport and air–water exchange can be influenced by changes in wind fields and wind speeds (Lamon et al., 2009; Kong et al., 2014). Changing precipitation patterns influence chemical transport via atmospheric deposition (rain dissolution and scavenging of particles; Armitage et al., 2011) and runoff transporting terrestrial organic carbon (Ripszam et al., 2015). As ice cover of lakes and the sea decreases, more organic contaminants may volatilise to the atmosphere (Macdonald et al., 2003; Undeman et al., 2015).
Dumped military ammunition threaten the Baltic Sea in the future, as poisonous substances are expected to leak due to advanced corrosion of hulls and containers. This process may be affected by climate, as corrosion rates depend on temperature and oxygen, so that warming and good ventilation of dumping sites can be expected to enhance corrosion rates (Vanninen et al., 2020). This is an urgent problem since the location of the dumped military material is only partially known.
There is no evidence of the degradation of marine litter or microplastics in the marine environment and no evident direct impact of climate change on this driver (Oberbeckmann and Labrenz, 2020). Societal decisions about the use of plastics, in part influenced by efforts to decarbonise, will very likely affect future plastic pollution more than climate change.
5.1 The North Sea region
Like the Baltic Sea basin, the North Sea region is both a precious natural environment and a place for settlement and commerce for millions of people, with a rich cultural heritage. The North Sea is one of the world's richest fishing grounds and one of the busiest seas, with respect to shipping and infrastructure for oil and gas extraction, and of enormous economic value. In recent years, the area has also become a major site for wind energy, with many large offshore wind farms.
As climate change is expected to have profound effects on North Sea ecosystems and economic development, an independent, voluntary, international team of scientists from across the region compiled the North Sea Region Climate Change Assessment (NOSCCA; Quante and Colijn, 2016). The NOSCCA approach is similar to BACC in format and intention. The assessment provides a comprehensive overview of all aspects of a changing climate, discussing a wide range of topics including past, current, and future climate change and climate-related changes in marine, terrestrial, and freshwater ecosystems. It also explores the impact of climate change on some socioeconomic sectors, such as fisheries, agriculture, coastal zone management, coastal protection, urban climate, recreation/tourism, offshore activities/energy, and air pollution.
The North Sea is a semi-enclosed marginal sea of the North Atlantic Ocean, situated on the northwestern European shelf. It opens widely into the Atlantic Ocean at its northern boundary, with a smaller connection to the Atlantic Ocean via the Dover Strait and English Channel in the southwest. To the east, it connects to the Baltic Sea. The Kattegat, a transition zone between the North and Baltic seas, is located between the Skagerrak and the Danish straits. Comprehensive reviews of North Sea physical oceanography are provided by Otto et al. (1990), Rodhe (1998), and Sündermann and Pohlmann (2011). Physical–chemical–biological interaction processes within the North Sea are reviewed by Rodhe et al. (2006) and Emeis et al. (2015), and a description of the North Sea marine ecosystem was compiled by McGlade (2002).
Among the most striking differences between the North and Baltic seas is the wide, direct opening of the North Sea to the northeastern Atlantic, allowing the free exchange of matter, heat, and momentum between the two seas. As a result, the North Sea water has a much higher salinity than the Baltic Sea. The North Sea dynamics are greatly influenced by tides, while Baltic Sea tides are much weaker than in the North Sea, where tidal amplitudes vary spatially from a few decimetres to several metres. In addition to the wind-driven circulation, which dominates the mean cyclonic current system, North Sea tidal currents show non-vanishing residual currents (due to nonlinear processes) which cannot be neglected. Tidal currents cause strong mixing. Low pressure systems often travel from the Atlantic with minimum blockage and cause strong storm surges, which are the greatest potential natural hazards for coastal communities in the North Sea region.
Only selected examples from NOSCCA will be presented here. In general, the North Sea region already experiences a changing climate, and projections indicate that further, partly accelerating, changes are to be expected (warming of air and water, changing precipitation intensities and patterns, sea level rise, and seawater acidification). Changes in ecosystems (marine, coastal, and terrestrial) are observed and are projected to strengthen, with the degree depending on the scenario. Observational and modelling studies have revealed a large natural variability in the North Sea region (from annual to multidecadal timescales), making it difficult to identify regional climate change signals and impacts for some parameters. Projecting regional climate change and impacts for the North Sea region is currently limited by the small number of regional coupled model runs available and the lack of consistent downscaling approaches, both for marine and terrestrial impacts. The wide spread in results from multi-model ensembles indicates the present uncertainty in the amplitude and spatial pattern of the projected changes in sea level, temperature, salinity, and primary production. For moderate climate change, anthropogenic drivers such as changes in land use, agricultural practice, river flow management, or pollutant emissions often seem more important for impacts on ecosystems than climate change.
5.2 A few selected and highly aggregated results from NOSCCA
-
Atmosphere. Observations reveal that the near-surface atmospheric temperature has increased everywhere in the North Sea region, especially in spring and in the north. The rise was faster over land than over the sea. Linear trends in the annual mean land temperature are about + 0.39 ∘C per decade for the period 1980–2010. Generally, more warm extremes and fewer cold ones were observed. A northeastward shift in storm tracks was observed, in agreement with projections from climate models forced by increased greenhouse gas concentrations. Overall, precipitation has increased in the northern North Sea region and decreased in the south, summers have become warmer and drier, and winters have become wetter. Heavy precipitation events have become more extreme. A marked further mean warming of 1.7–3.2 ∘C is projected for the end of the 21st century (2071–2100, with respect to 1971–2000) for different scenarios (RCP4.5 and RCP8.5, respectively), with stronger warming in winter than in summer and particularly strong warming over southern Norway.
-
North Sea. There has been strong evidence of surface warming in the North Sea, especially since the 1980s (Fig. 34). Warming is greatest in the southeast, exceeding 1 ∘C since the end of the 19th century. Absolute mean sea level in the North Sea rose by about 1.6 mm yr−1 over the past 100–120 years, in agreement with the global rise. The North Sea is a sink for atmospheric carbon dioxide (CO2); this uptake declined over the last decade due to lower pH and warmer water. Models consistently project the surface water to warm further by the end of the century (by about 1–3 ∘C; A1B scenario). Exact numbers are not given due to differences in spatial averaging and reference periods from published studies. Coherent findings from published climate change studies include an overall rise in sea level, an increase in OA, and a decrease in primary production. Uncertainties are large for projected changes in extreme sea level and waves, as well as for decreases in net primary production, which range from 1 % to 36 %.
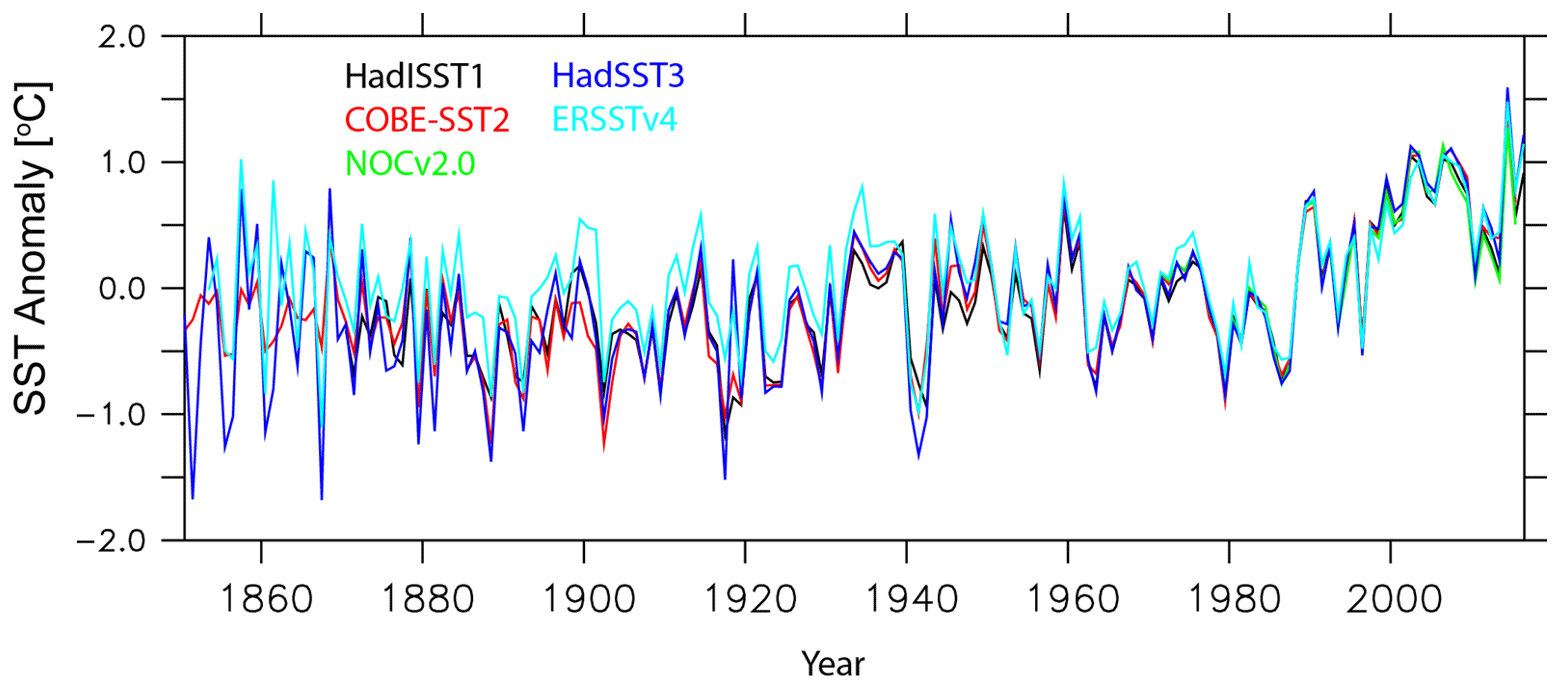
Figure 34Sea surface temperature anomaly in the greater North Sea region from 1870 to 2016 (relative to the mean 1971 to 2000), according to different datasets. Data source: Huthnance et al., 2016; updated by Elizabeth Kent, Southampton, UK.
-
Rivers. To date, no significant trends in response to climate change are apparent for most individual rivers discharging into the North Sea. Nevertheless, climate models project increased socioeconomically important risks for the region, due to more intense hydrological extremes in the North Sea region, such as flooding along rivers, droughts, and water scarcity. The exposure and vulnerability of cities in the North Sea region to changes in extreme hydrometeorological and hydrological conditions are expected to increase due to greater urban land use and rising urban populations.
-
Ecosystems. Long-term knowledge from exploitation of the North Sea indicates that climate affects marine biota in complex ways. Climate change influences the distribution of all taxa, but other factors (fishing and biological interactions) are also important. The distribution and abundance of many species have changed. Warm-water species have become more common, and species richness has increased. Among coastal ecosystems, estuaries and most mainland marshes will survive sea level rise, while back-barrier salt marshes with lower suspended sediment concentrations and tidal ranges are probably more vulnerable. Plant and animal communities can suffer habitat loss in dunes and salt marshes through high wave energy and are affected by changes in temperature and precipitation and by atmospheric deposition of nitrogen. Lakes in the North Sea region have experienced a range of physical, chemical, and biological changes due to climatic drivers over past decades. Lake temperatures have increased, and ice cover duration has decreased. For terrestrial ecosystems, there is strong empirical evidence of changes in phenology in many plant and animal taxa and northward range expansions of mobile heat-loving animals. Climate change projections and effect studies suggested a northward shift of vegetation zones, with terrestrial net primary production likely to increase in the North Sea region due to warmer conditions and longer growing seasons.
-
Socioeconomic effects. The assessments of climate change effects on the different socioeconomic sectors in the North Sea region find that adaptation measures are essential for all of them, e.g. for coastal protection and in agriculture. For North Sea fisheries, the rapid temperature rise is already being felt in terms of shifts in species distribution and variability in stock recruitment. In agriculture, an increased risk of summer drought and associated effects will be a challenge, particularly in the south. In general, extreme weather events are likely to more often severely disrupt crop production. Offshore and onshore activities in the North Sea energy sector (dominated by oil, gas, and wind) are highly vulnerable to extreme weather events in terms of extreme wave heights, storms, and storm surges. All coastal countries around the North Sea with areas vulnerable to flooding by storm surges are preparing for the challenges expected due to climate change, but coastal protection strategies differ widely from country to country. Due to inadequate knowledge about the extent and timing of climate-driven impacts, current coastal zone adaptation plans focus on no-regret measures.
5.3 Some differences in climate change effects between the North Sea and Baltic Sea
Many of the climate change signals in the Baltic and North Seas show similar behaviours and trends. But there are also some notable differences between the two regions, which are listed below. They are based on findings reported in the appropriate chapters of the recent assessments BACC II (BACC II Author Team, 2015) and NOSCCA (Quante and Colijn, 2016).
-
In recent decades, the surface air temperature in the Baltic Sea and North Sea regions rose in a similar way (of the order of 1 ∘C in the past century). Projections of the surface air temperature, as obtained by EURO-CORDEX downscaling for a moderate scenario (RCP4.5), indicate a stronger winter and spring warming (>1 ∘C) at the end of the century (2071–2100) relative to present day (1971–2000) for most parts of the Baltic Sea region than for the western part of the North Sea region. In the summer and autumn months, the projected warming is at the same level.
-
The North Sea is vigorously ventilated by the Atlantic (overturning time ∼1 to 4 years). Therefore, climate change signals from the Atlantic are rapidly transferred to the North Sea, while climate change in the North Sea can be expected to be damped by the large thermal inertia of the Atlantic Ocean. By contrast, the Baltic Sea is more prone to changes in mean meteorological conditions as its connection to the World Ocean is very narrow.
-
Projected changes in seasonal mean precipitation show a distinctive difference between the two sea regions for the summer (JJA) and autumn months (SON). In the Baltic Sea region, the mean precipitation for a RCP4.5 scenario is projected to increase for most land areas (5 % to 25 %), whereas no noticeable change (5 % to −5 %) is projected along the western and southern shores of the North Sea region. However, most recent scenario simulations do not suggest an increase in summer precipitation over the southern Baltic Sea region anymore (Sect. 3.3.1(4); Christensen et al., 2022).
-
SST is currently rising and projected to rise further for both sea areas, but the spatial pattern of the SST increase is different. In the southern North Sea, SST rises more than in the northern North Sea, while SST warming trends are higher in the northeastern part of the Baltic Sea (Bothnian Sea and Gulf of Finland) than in the southern part. These spatial differences are explained by water depth (North Sea) and the ice albedo feedback (Baltic Sea). In addition, the northern North Sea is affected by Atlantic water inflow at the western side of the Norwegian trench.
-
The coastal regions of the North Sea experience increases in both mean sea level (MSL; as measured by satellites) and relative mean sea level (RMSL; as measured by tide gauges). Trends in RMSL vary significantly across the North Sea region due to the influence of vertical land movement (uplift in northern Scotland, Norway, and Denmark and subsidence elsewhere). But the trend of RMSL is still positive everywhere along the North Sea coasts. In contrast, sea levels relative to land along the northern Baltic Sea coast are sinking because land levels continue to rise due to postglacial rebound since the last Ice Age. The northern Baltic Sea will also experience considerable land rise in future. As a result, the sea level will probably continue to decrease relative to land in this region. As positive trends in RMSL are more relevant for coastal protection, all countries around the North Sea with coastal areas vulnerable to flooding due to storm surges face similar challenges, while in the Baltic Sea region, coastal protection is of greater concern for the countries in the south.
-
The frequency of sea ice occurrence in the North Sea has decreased since about 1961, with a similar development in the western Baltic Sea. In contrast, ice still forms in the northern Baltic Sea, where it will remain a prominent feature for many years, covering about 50 to 200×103 km2, with high interannual variability, even though, for the 21st century, a linear trend of 2 % decrease per decade was reported.
Knowledge gaps and research needs have been intensively discussed within the grand challenge working groups of Baltic Earth and are summarised by the BEARs (Lehmann et al., 2022; Kuliński et al., 2021; Rutgersson et al., 2022; Weisse et al., 2021; Christensen et al., 2022; Gröger et al., 2021a; Meier et al., 2022; Viitasalo and Bonsdorff, 2021; Reckermann et al., 2022).
In summary, we conclude that the processes that control the variability in salinity in the Baltic Sea and its entire water and energy cycles are still not fully understood (Lehmann et al., 2022). The time dependence of the saline stratification and its links to climate change are in special need of further study. Salinity dynamics are important for their dominant role in stratification, concerning both mixing conditions and ecosystem composition and functioning. The environmental and biological factors favouring certain biogeochemical pathways through complex interactions, the pools of dissolved organic matter, and sediment biogeochemical processes are poorly understood (Kuliński et al., 2021). Although initial studies on the coastal filter capacity have been made, coastal zone models for the entire Baltic Sea and an overall estimate of bioavailable nutrients and carbon loads from land to the open sea do not exist (Kuliński et al., 2021). Considering the large internal variability, investigations of changes in extremes are limited because high-resolution observational time series are too short and model ensembles too small (Rutgersson et al., 2022). Global mean sea level rise, land uplift, and wind field changes control sea level of the Baltic. However, the future evolution of these drivers, which are needed for projections, is rather uncertain (Weisse et al., 2021). Furthermore, databases for coastline changes and erosion and basin-scale models of coastal change under sea level rise do not exist (Weisse et al., 2021).
Fully coupled regional ESMs for the Baltic Sea, including the various compartments of the Earth system, atmosphere, land, ocean, sea ice, waves, terrestrial, and marine ecosystems, are under development but are not yet available for dynamical downscaling (Gröger et al., 2021a). The numerical estimation of water and energy cycles suffers from both model deficiencies and natural variability. For climate projections, even if large ensembles of high-resolution regional atmosphere models are becoming increasingly available, the coverage of the underlying global climate model ensembles is still small, implying that detailed conclusions on uncertainty and/or robustness in details of future climate change and its impacts cannot easily be drawn. In addition, only one ensemble with 22 members utilised a coupled atmosphere–ice–ocean regional model (Christensen et al., 2022). Also, Baltic Sea ecosystem model ensembles have had too few members to address the spread related to the large multidecadal variability in the ocean well (Meier et al., 2022). Furthermore, the global sea level rise needs to be considered when making salinity projections, which is rather uncertain (Meier et al., 2021a).
The large inherent uncertainty in future projections of salinity fundamentally affects the projections of the marine ecosystem (Viitasalo and Bonsdorff, 2021). The response of food web interactions to climate change is largely unknown. The uncertainties of scenario simulations with coupled physical–biogeochemical ocean models were discussed by Meier et al. (2018a, 2019b, 2021a). They found that, in addition to natural variability, the largest uncertainties are caused by (i) poorly known current bioavailable nutrient inputs from land and atmosphere and yet-to-be-determined future inputs, (ii) uncertainties of models, including global sea level rise, and (iii) poorly known long-term future greenhouse gas emissions.
Finally, the regional Earth system is driven by multiple drivers, of which climate change is just one. Multi-driver studies are just beginning to be made, and only a few have yet been published (Reckermann et al., 2022).
In the following, we list a few selected knowledge gaps related to the variables addressed by this study.
6.1 Large-scale atmospheric circulation
The interactions between atmospheric modes of variability that are of importance for the Baltic Sea region are still not well known. For instance, while climate models are able to simulate the main features of the NAO, the frequency of blocking over the Euro-Atlantic sector is still underestimated (IPCC, 2014b). Since observational records are relatively short, our understanding of the AMO and its possible changes depends largely on models, and these cannot be reliably evaluated for timescales longer than the AMO period (Knight, 2009). However, while possible changes in these climate phenomena do contribute to the inherent uncertainty in near-term climate projections, they are not the main driver of the projected warming over Europe by the end of the century (Cattiaux et al., 2013; IPCC, 2014b).
6.2 Air temperature
Air temperature and its extremes are, to a large extent, determined by the large-scale atmospheric circulation patterns. There is limited knowledge primarily concerning changes in these circulation patterns in a changing climate, as mirrored by climate model discrepancies.
Furthermore, the strong dependence of even local temperature changes on the evolution of greenhouse gas emissions and the feedbacks that determine the global climate sensitivity deserve attention. Another uncertainty, of unknown importance, is the extent to which larger-than-expected decreases in the AMOC could potentially counteract the effects of global warming in northern Europe. As shown by the IPCC (2014b, their Fig. 12.9), there was, in fact, one model with a cooling of northern Europe in the CMIP5 ensemble. The recent suggestion that the AMOC may be more sensitive to anthropogenic climate change than current climate models indicate may also be relevant for the Baltic Sea region (Boers, 2021).
Nevertheless, the heat cycle of the Baltic Sea region is probably better understood than the water cycle.
6.3 Solar radiation and cloudiness
Multidecadal variations in surface solar radiation (SSR) are generally not well captured by current climate model simulations (Allen et al., 2013; Storelvmo et al., 2018). The extent to which the observed variations in SSR are caused by the natural variation in cloudiness induced by atmospheric dynamic variability (Stanhill et al., 2014; Parding et al., 2014), by anthropogenic aerosol emissions (Wild, 2012; Ruckstuhl et al., 2008; Philipona et al., 2009; Storelvmo et al., 2018), or perhaps by additional causes is not understood. Future cloudiness trends in global and regional models differ in their sign (Bartók et al., 2017). Most RCM scenario simulations lack time-varying aerosol forcing (Boé et al., 2020b).
6.4 Precipitation
Even if climate scenarios are becoming more frequent, and there is now a growing ensemble of relatively high-resolution regional climate scenarios for Europe, they still represent only a subset of the global climate model projections assessed by the IPCC. This means that the uncertainties of future climate change in the Baltic Sea region are not fully captured at the horizontal resolution needed for detailed studies of climate change effects in the region (Christensen et al., 2022). Very high-resolution so-called convective permitting climate models operating at grid spacings of 1–3 km are lacking for the Baltic Sea region. In other regions, such models have better agreed with the observations of precipitation extremes and are sometimes also given a larger climate change signal than the more traditional high-resolution models operating at ca. 10 km grid spacing (Christensen et al., 2022). Land use change and cover, including changes in forests, can induce both local and downwind precipitation change (Meier et al., 2021b) and need to be included in projections.
6.5 Wind
Historical wind measurements suffer from inhomogeneity and records that are too short for detecting changes when considering the large internal variability in the Baltic Sea region. Projected changes are not robust among the few available downscaled ESMs.
6.6 Air pollution
The spatially and time-resolved air quality status of a region is often assessed by means of model systems, typically with emission, meteorological, and chemistry transport submodels. These model systems, used for the calculation of atmospheric concentrations and deposition of pollutants, need further developments and validation. Uncertainties are often connected to the emission segment of the modelling chain. Improvements in the implemented time profiles for the different emission sectors are especially necessary (Matthias et al., 2018). For projections of air quality with climate change models, more work is needed to establish a set of emission scenarios for air pollutants consistent with regional socioeconomic pathways, like those developed by Zandersen et al. (2019). The shipping sector is currently a considerable source of air pollution in the Baltic Sea region. More research and development is needed on new fuel types and emission factors for air pollutants, which is relevant for politically and technologically driven abatement measures. To better address exposure to and health impacts of shipping emissions, more studies like those of Ramacher et al. (2019) and Barregard et al. (2019) are required, especially at the harbour and city scale. Better knowledge and reduced uncertainties will improve quantification of air pollution as part of the environmental imprint of shipping in the Baltic Sea region, as developed by Moldanová et al. (2021).
6.7 River discharge
Precipitation from regional atmosphere models is biased, and the bias correction methods applied for hydrological modelling affect the sensitivity of hydrological models to climate change (Donnelly et al., 2014). Natural variability and model uncertainties may explain the large spread in current river discharge projections (Roudier et al., 2016; Donnelly et al., 2017). The values of the parameters of a hydrological model are normally found through calibration against historical data and are always associated with inaccuracies. These inaccuracies will translate into uncertainty in the projected changes.
6.8 Nutrient inputs from land
The timescales for the exchange of the nutrient pools in soils are not well known (McCrackin et al., 2018). Long-term observations do not exist. Future projections of river discharge and nutrient inputs in the Baltic Sea drainage basin agree on key aspects (e.g. increased annual discharge) but also highlight the uncertainty of the projections. To improve assessments, studies should be designed to allow explicit semi-quantitative comparisons of the effects of the incorporated change factors, e.g. climate, land management, and policy. In the case of nitrogen inputs, the effect of changes in anthropogenic atmospheric deposition should also be included in future projections.
6.9 Terrestrial biosphere
Terrestrial ecosystems in the Baltic Sea region are governed by human activities, both changes in climate due to anthropogenic climate forcing and anthropogenic changes in land use and land cover. In return, terrestrial ecosystems affect climate by altering the composition and the energy and water cycles of the atmosphere. Biophysical interactions between the land surface and the atmosphere have been incorporated into regional ESMs in order to assess the impacts of changes in land use and land cover on regional climate and terrestrial ecosystems. Still, biogeochemical processes related to the carbon cycle are lacking, as are explicit forest management actions (Lindeskog et al., 2021), while explicit descriptions of some disturbances (e.g. wildfires, major storms, and insect attacks) are under development in ESMs. Only when all these interactions are incorporated can the effects of national or international (e.g. in the European Union) climate policies on regional climate and terrestrial ecosystems be fully assessed for compliance with the goals of the Paris Agreement.
6.10 Snow
A general decrease in snow cover duration in the Baltic Sea region is well documented, especially for the southern part. Changes in snow depth due to climate warming are much more unclear. Some evidence of increasing snow depth in recent decades has been reported from the northern part of the study region and from mountainous areas. However, these increases are not projected to continue, according to climate model projections. Whether there is a discrepancy between the observed and projected trends is not known.
Changes in sea effect snowfall events during the present climate are unknown.
6.11 Glaciers
It is presently not known how glacier-fed lakes react to competing environmental drivers, such as the general Arctic warming, and the simultaneous warming-triggered lake cooling caused by increased inflow of cold glacier meltwater potentially carrying high sediment, nutrient, and organic matter loads. Understanding changing lake thermal regimes and vertical mixing dynamics and the timing and duration of seasonal ice cover is important because ecological, biological, and chemical processes, including carbon-cycling, will be affected (Lundin et al., 2015; Smol et al., 2005; Jansen et al., 2019). Since Scandinavian glaciers are predicted to decline by 80 % in volume by 2100 under RCP8.5, Scandinavian glacier-fed lakes could be used as natural observatories where changes in processes, timescales, and effects in response to competing drivers can be studied before they occur at other glacial lake sites where glaciers melt more slowly (Kirchner et al., 2021).
6.12 Permafrost
Thawing permafrost peatlands may potentially release large amounts of organic matter, nutrients, and greenhouse gases to aquatic systems locally, but the timing and magnitude of such releases remain highly uncertain.
6.13 Sea ice
While the extent of the sea ice cover is well observed, observations of ice thickness are scarce. Ice thickness is regularly monitored only at a few coastal sites with fast ice. Long records of the various ice classes, such as ridged ice, do not exist. Sea ice models do not represent sea ice classes correctly. Since the last assessment by the BACC II Author Team (2015), only two new scenario simulation studies on sea ice were published (Luomaranta et al., 2014; Höglund et al., 2017).
6.14 Lake ice
Research is required to better understand the reasons for the regional and temporal differences in the patterns of change in lake ice phenology and its relationship to large-scale climatic forcing. There is a need to better understand how loss of lake ice cover modifies the gas exchange between the lake and atmosphere, mixing of the water column, biogeochemical cycling, and ecosystem structure and function. The socioeconomic and cultural importance of winter ice also deserves further research.
6.15 Water temperature
The causes of the pronounced natural variability in Baltic Sea temperature and its connection to large-scale patterns of climate variability are not well known. The occurrence of marine heatwaves is projected to increase. However, only a few studies of their impacts on the marine ecosystem exist. Furthermore, SST trends also depend on coastal upwelling, which affects large areas of the Baltic Sea surface (Lehmann et al., 2012; Dutheil et al., 2021). Projected changes in upwelling are, however, very uncertain (Meier et al., 2022).
6.16 Salinity and saltwater inflows
Salinity change depends on wind, river discharge, net precipitation over the sea, and global sea level rise. Due to considerable uncertainty in all drivers and the different signs in the response of salinity to these drivers, the relative uncertainty in salinity projections is large, and larger ensembles of scenario simulations are needed (Meier et al., 2021a). This knowledge gap is also associated with the uncertainty of whether saltwater inflows from the North Sea will change (Schimanke et al., 2014). As salinity is a very important variable for the circulation in the Baltic Sea and for the marine ecosystem, projections for the Baltic Sea salinity are a priority.
6.17 Stratification and overturning circulation
Stratification depends on mixing and on gradients in water temperature and salinity, making changes in stratification highly uncertain. Mixing processes such as thermal and saline convection, entrainment, double diffusive convection, or boundary mixing are not fully understood (Holtermann et al., 2012, 2017; Umlauf et al., 2018). Initial results on the sensitivity of the vertical overturning circulation rely on model studies only (Placke et al., 2021). Hence, more measurements on the fine structure of horizontal and vertical turbulence are needed (Reissmann et al., 2009).
6.18 Sea level
The regional variability in processes which drive sea level changes, along with their uncertainties and relative importance over different timescales, display long-term developments that still require an explanation and are a challenge to planning by coastal communities (Hamlington et al., 2020). For instance, the annual cycle in Baltic Sea mean sea level (winter maxima minus spring minima) shows a basin-wide widening in the period 1800–2000 (Hünicke and Zorita, 2008). The precise mechanisms responsible for this effect are not yet completely understood, although it seems strongly controlled by atmospheric forcing (Barbosa and Donner, 2016). Furthermore, at the longer timescales relevant for anthropogenic climate change, the Baltic Sea and North Atlantic sea levels are strongly affected by whether warming is allowed to proceed to the point of destabilising the Antarctic ice sheets. Current estimates are mostly based on heuristic expert knowledge, as models are still under development. This is probably the largest knowledge gap affecting projections of future Baltic sea level rise (Bamber et al., 2019). Finally, long-term relative sea level trends are strongly affected by the vertical land movement due to glacial isostatic adjustment. This can be as large as, or even larger than, the global sea level rise. Currently, it is estimated from relatively short GPS measurements and from geo-elastic models. Both are inaccurate, as point GPS measurements are strongly affected by other geological and anthropogenic effects on vertical land velocities, and results from model geo-elastic models are often revised (Weisse et al., 2021). In addition, the glacial isostatic adjustment may affect the flow intensity of river runoff into the northern Baltic Sea (coastal regions rising relative to inland regions), the effects of which on salinity and water levels, for example, have not been explored.
6.19 Waves
The lack of long-term instrumental wave measurements and gaps in the data due to the ice season complicate the analysis of extreme values. Although wave hindcasts provide a good alternative, the accuracy naturally does not match that of measured data. Furthermore, Björkqvist et al. (2020) showed that the calculation of return periods of extreme events may depend on the sampling frequency. Adding sampling variability typical for in situ measurements to simulated hindcast data will result in consistently longer estimates of return periods for high significant wave heights than using the original hindcast data.
6.20 Sedimentation and coastal erosion
We lack a comprehensive understanding of alongshore sediment transport and its associated spatial and temporal variability along the Baltic Sea coast. In general, an eastward transport dominates along most of the southern Baltic Sea coast due to the prevailing westerly winds. However, the intensity of secondary transport induced by easterly and northerly winds is much less understood. Its combination with storm surges will expose sand dunes and cliffs to the greatest erosional impact, further complicating understanding (Musielak et al., 2017). Due to the orientation of the coastline, transport along some parts of the Baltic Sea coastline is very sensitive to the angle of incidence of the waves. For example, the incidence angle of westerly wind waves at the western part of the Wolin island in Poland (Dudzińska-Nowak, 2017) and the coast of Lithuania and Latvia (Soomere et al., 2017) is very small, and even a slight change in the wind direction (e.g. by 10∘) could lead to a reversal of the direction of alongshore transport. Coastline changes at these sections vary greatly and will, hence, be extremely sensitive to future changes in wind–wave climate (Viška and Soomere, 2013). Another knowledge gap in understanding coastal erosion in response to future climate change concerns the impact of water levels and the submergence of the beach. Water level plays a key role in dune toe erosion and also limits aeolian sand transport on the beach. The relationship between the intensity of the forcing (wave energy and run-up) and the morphological response (erosion at the beach and dunes) during storms is not straightforward (Dudzińska-Nowak, 2017; Zhang et al., 2017). At some sites (e.g. Miȩdzyzdroje in Poland), dune erosion is well correlated with maximum storm surge level and storm frequency, but at others (e.g. Świnoujście), the beach morphology is more important in determining the effect of erosion than the storm surge level.
6.21 Oxygen and nutrients
There are significant knowledge gaps related to the identification and quantification of oxygen sinks and sources in the Baltic Sea. In particular, more understanding is required on the dynamics of seawater inflows from the North Sea, the role of mixing processes in the ventilation of the deepwater, rates of oxygen consumption in water column and sediments, and how they depend on climate change (Kulinski et al., 2021). Knowledge gaps also exist concerning the transport and transformations of DOM (including terrestrial DOM) and better quantification of the processes occurring in the microbial loop is needed to understand the nutrient (but also C and O) dynamics in the Baltic Sea.
The direct effects of climate change are likely to be detectable first in the coastal zone, e.g. indicated by increasing seasonal hypoxia due to warming. However, long-term records from the coastal zone are rare. More important could be the intensification of the proposed hypoxia-related vicious circle in the Baltic proper due to the warming of both surface and deepwater layers in the Baltic proper (Savchuk, 2018; Meier et al., 2018b). The consequent expansion of cyanobacteria blooms and increased nitrogen fixation in the Baltic proper and neighbouring basins could further counteract nitrogen load reductions and maintain hypoxia, with all its detrimental effects. However, there are still no biogeochemical and ecosystem models capable of producing reliable long-term scenario simulations of these processes with sufficient confidence and precision (see Meier et al., 2018a; Meier et al., 2019b).
6.22 Marine CO2 system
Due to the high spatial and temporal variability in air–sea carbon fluxes, it is not known whether the Baltic Sea as a whole is a net sink or a net source of CO2. The source of the alkalinity increase observed in the Baltic Sea is still unclear. Plausible hypotheses indicate increased weathering in the catchment and processes related to anoxic remineralisation of organic matter. There is high uncertainty in quantifying sediment/water fluxes of C, N, and P, which are important bottlenecks for understanding the dynamics of the marine CO2 system and the C, N, P, and O2 cycling generally, especially in the deepwater layers. The lack of system understanding is particularly evident in the Bothnian Sea and Bothnian Bay. Fransner et al. (2018) suggested that non-Redfieldian stoichiometry in phytoplankton production could explain pCO2 fields in these subbasins, but confirmation by observations is still lacking.
6.23 Marine biosphere
6.23.1 Lower trophic levels
The summer cyanobacteria bloom in the Baltic proper, and increasingly in recent years in the Bothnian Sea, is considered as one of the main problems of Baltic Sea eutrophication, and the nitrogen fixation it carries out is an important process in Baltic ecosystem models (Munkes et al., 2021). It has long been considered limited by the availability of phosphorus (Larsson et al., 1985; Granéli et al., 1990). It is, therefore, remarkable that it is not possible to predict interannual variations in cyanobacteria blooms observed by satellites from water chemistry (Kahru et al., 2020; Hieronymus et al., 2021).
There are significant knowledge gaps related to the quantification of nitrogen fixation and the fate of the fixed nitrogen in the Baltic Sea pelagic zone. Direct nitrogen fixation measurements were, until recently, dogged by method problems, and even if these are now hopefully largely resolved (Klawonn et al., 2015), the enormous patchiness of cyanobacteria blooms remains a huge problem. The alternative approach of directly measuring the increase in total combined nitrogen during the bloom (Larsson et al., 2001) requires very high precision, also suffers from patchiness problems (Rolff et al., 2007), and has not been used much. Finally, the amount of nitrogen fixed can be estimated by modelling, based on uptake of CO2 or phosphorus and assuming a Redfield N : P or C : N ratio. This theoretically highly attractive approach (Eggert and Schneider, 2015) is hampered by the possibility of non-Redfieldian ratios and has made some biologists sceptical by predicting high nitrogen fixation in spring when there are not sufficient known nitrogen-fixing autotrophs in the water to carry out this nitrogen fixation.
While total nitrogen in the water column clearly increases during the summer cyanobacterial bloom, just a couple of months later this increase seems largely to have disappeared, even though sediment traps find little evidence that nitrogen has settled out of the upper mixed layer. Sediment trap measurements might be gross underestimates, or there are unidentified sites of denitrification or other overlooked nitrogen sinks in the water column. Nitrogen fixation is a central process in Baltic ecosystem models, and better observationally based estimates of processes in the nitrogen cycle are required for assessing their credibility (Munkes et al., 2021).
6.23.2 Marine mammals
There is a great need for further research on the effects of climate change on marine mammals, especially on the critically endangered Baltic proper harbour porpoise and the Baltic ringed seal, given the multiple threats and cumulative impacts on these populations. Seal and porpoise foraging distribution and the relation of seals to haul-out sites is not well known. The requirement of sea ice for the successful breeding of ringed seals has not been sufficiently assessed. Land breeding of grey seals is not monitored regularly in most Baltic states. The effects of interspecific competition on distributions are not known. Range contraction can be conceptualised as having three stages (Bates et al., 2014), i.e. performance decline, population decrease, and local extinction, all of which should be studied. For example, studies on performance decline, such as physiological conditions that reduce reproductive potential (Helle, 1980; Jüssi et al., 2008; Kauhala et al., 2017, 2019) are important (Bates et al., 2014). Breeding success of Baltic Sea ringed seals in normal winters is poorly known, as the lairs in pack ice snowdrifts are rarely found. Likewise, observations of the effects of poor ice conditions on the breeding success of ringed seals in mild winters are very limited, but the lack of protection from breeding lairs against harsh weather and predators is assumed to be highly negative.
6.23.3 Waterbirds
The complex interaction between many primary parameters affected by climate change makes it hard to identify which environmental changes are actually causing changes in waterbird populations. It is currently not known in detail how shifts in distribution and timing of migration match the availability and quality of food, and thus, the importance of potential temporal mismatches between food availability and requirements is unknown. In addition, changes in waterbird distribution are likely to alter inter- and intraspecific competition. Resolving these issues requires investigation of effects at other levels of the food web (e.g. loss of bivalves from areas of reduced salinity, species, and size–class composition of fish communities) and their consequences for waterbirds. So far, knowledge of climate change effects on waterbirds in the Baltic Sea are mostly restricted to ducks (including diving and dabbling ducks), with much less known for other quantitatively important components of the waterbird community, i.e. divers, grebes, waders, gulls, and auks. Interactions between fish and piscivorous waterbirds in particular need more attention. Responses to climate change are likely to vary between waterbird species and groups. There is still little information on which species are mostly affected (negatively or positively) by changes in climatic conditions, and the uncertainty is, therefore, large in terms of how species in future waterbird assemblages will interact and the consequences for the functioning of the Baltic Sea. To gain a better understanding on how single species (or groups with similar ecology that are often closely related) will respond to climate change is critical for projecting effects of climate change on waterbirds around the Baltic Sea.
6.23.4 Marine food webs
Some changes observed in marine food webs have been partly attributed to warming, brightening, and sea ice decline on long timescales. Other drivers, such as eutrophication or fisheries, may, however, predominate, and many records are too short to allow the attribution of the observed changes to climate change. Although effects of warming, OA, and dissolved organic matter on some ecosystem functions have been identified in mesocosm experiments, changing food web interactions are still impossible to project. It is, however, important to include the marine biosphere in management strategies for tackling the complex interactive aspects of climate-change-related effects on the marine ecosystem and human adaptations to them (Andersson et al., 2015; Stenseth et al., 2020).
6.24 Summary
The following gaps in the knowledge are rated as the most serious. Overall, changes in the heat cycle of the Baltic Sea region are better understood than changes in the water, momentum, or carbon cycles. Effects of climate-change-induced warming on the latter three cycles are less clear than the effect on the terrestrial and marine heat cycles, including the cryosphere (Fig. 35). The uncertainty in salinity projections substantially limits our understanding of the marine ecosystem response to anthropogenic climate change. Furthermore, detected trends in observational records are often caused by internal variability, e.g. in storms and extreme sea level, rather than anthropogenic climate change because many records are too short. The response of the biosphere to climate change is highly uncertain because of unknown food web interactions.
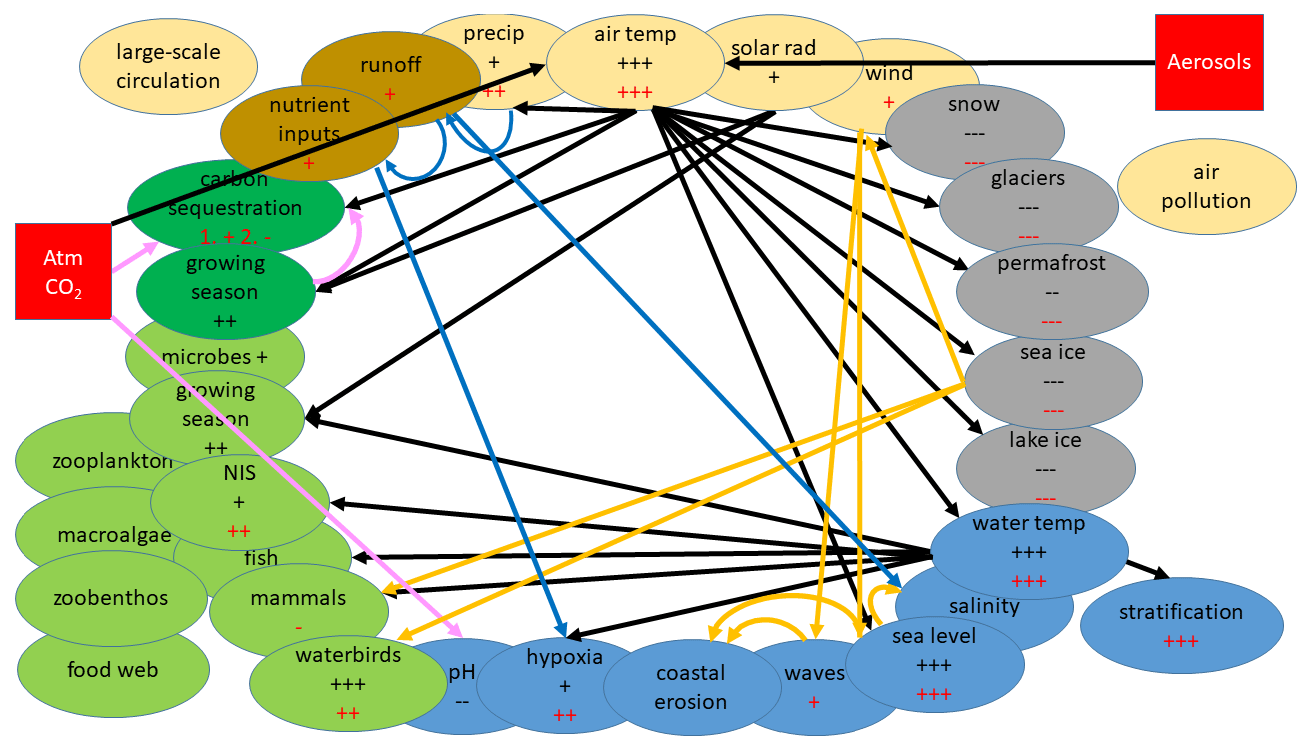
Figure 35Synthesis of the knowledge on present and future climate changes. Shown are the anthropogenic climate changes in 33 Earth system variables (bubbles) of the atmosphere (yellow), land surface (brown), terrestrial biosphere (dark green), cryosphere (grey), ocean and sediment (blue), and marine biosphere (light green). The abbreviation NIS stands for non-indigenous species. The sign of a change (+/−; plus/minus) is shown together with the level of confidence denoted by the number of signs, i.e. one to three signs corresponding to low, medium, and high confidence levels, as the result of the literature assessment reflecting consensus and evidence following the IPCC definitions (Sect. 2.3). Sign colours indicate the direction of past (black) and future (red) changes, following Table 15. Uncertain changes (+/−) are not displayed. Investigated external anthropogenic drivers of the Earth system are shown as red squares, i.e. greenhouse gases, in particular CO2, and aerosol emissions. The prevailing climate change attribution relationships with sufficiently high confidence are shown by arrows (black is the heat cycle, blue is the water cycle, orange is the momentum cycle, including sea level changes, and pink is the carbon cycle). Projections of carbon sequestration of Arctic terrestrial ecosystems for the 21st century first showed increased uptake and later a carbon source (Sect. 3.3.3), which is denoted by “1. + 2. −”. Future changes in mean sea level will be dominated by the thermal expansion of the global ocean and melting of ice sheets outside the Baltic Sea region. The impact of regional changes are probably small.
The following lists selected key messages from this assessment that either confirm the conclusions of previous assessments or are novel (marked with “NEW” in parenthesis). The estimated level of confidence based upon agreement and evidence (see Sect. 2.3) of each key message refers to whether a systematic change in the considered variable was detected and attributed to climate change. Climate change is here defined as the change in climate due to human impact only (BACC II Author Team, 2015; see Sect. 2.1). Key messages referring to observed or simulated changes in the Baltic Sea region caused by drivers other than climate change (afforestation, eutrophication, fisheries, etc.) are not classified by a confidence level. A summary of all key messages related to climate change is presented in Table 15 and Fig. 35.
Table 15Summary of the key messages about the impact of global warming on selected variables. The sign of a change (plus or minus) is listed together with the level of confidence denoted by the number of signs, i.e. one to three signs corresponding to low, medium, and high confidence levels. The plus/minus signs mean no detected or projected change due to climate change. The key messages of this assessment that are new, compared to the previous assessment by the BACC II Author Team (2015), are marked, and a brief explanation is provided in the neighbouring column. Note: NA is North Atlantic.

d Ribeiro et al. (2014). e Marcos and Woodworth (2017). f Vousdoukas et al. (2016). g Vousdoukas et al. (2017).
7.1 Past climate changes
-
Large-scale circulation. The AMO has undergone frequency changes, but its influence on climate variability in the Baltic Sea region remained similar, independent of the dominant frequency (NEW).
-
Air temperature. During the Holocene, the Baltic Sea region experienced periods as warm as the 20th century, such as the Mid-Holocene Optimum and the Medieval Warm Period. The implied rate of change was, however, much slower than the present. The past warming signal was regionally markedly heterogeneous, mostly along an west–east gradient (NEW).
-
Oxygen. The previous warm periods were accompanied by oxygen deficiency in the deeper waters of the Baltic Sea, which cannot be attributed to eutrophication, and was likely a result of climate forcing (NEW).
7.2 Present climate changes
-
Large-scale atmospheric circulation. Systematic changes in large-scale atmospheric circulation related to climate change could not be detected (low confidence). The AMO is an important driver of climate variability in the Baltic Sea region, affecting, inter alia, the correlation of regional climate variables with the NAO.
-
Air temperature. Linear trends of the annual mean temperature anomalies during 1878–2020 were + 0.10 ∘C per decade in the Baltic Sea region (high confidence). This is larger than the global mean temperature trend and slightly larger than estimated in the earlier BACC reports (NEW). The warm spell duration index has increased during 1950–2018 (medium confidence). Statistically significant decreases in winter cold spell duration index across the period 1979–2013 have been widespread in Norway and Sweden, but less prevalent in eastern Finland, while changes in summer cold spells have been small in general (medium confidence).
-
Solar radiation and cloudiness. Various satellite data products suggest a small but robust decline in cloudiness over the Baltic Sea region since the 1980s (low confidence; NEW). However, whether this signal is an indicator of a changing climate or due to internal variability is unknown.
-
Precipitation. Since 1950, annual mean precipitation has generally increased in the northern part of the Baltic Sea region. There is some evidence of a long-term trend during 1950–2018 (low confidence). However, long-term records suffer from inhomogeneity due to the increasing number of rain gauges. The frequency and intensity of heavy precipitation events have increased (medium confidence). Drought frequency has increased across southern Europe and most of central Europe since 1950 but decreased in many parts of northern Europe (low confidence).
-
Wind. Owing to the large internal variability, it is unclear whether there is an overall trend in mean wind speed. There has been an increase in the number of deep cyclones over central and northern Europe since the late 1950s, but no evidence for a long-term trend (low confidence).
-
Air pollution. The influence of climate change on air pollution is small and undetectable, given the dominance of other human activities (low confidence). Land-based emissions are declining due to emission control measures, but some emissions from the shipping sector may be increasing.
-
River discharge. For the period 1900–2008, no trend in total river discharge was found, but there was a pronounced 30-year variability. Data for some rivers in the northern Baltic Sea catchment indicate a long-term positive trend during 1921–2004, but the confidence in these reconstructions is low. Since the 1970s, the total river winter discharge has increased, perhaps due to warming or river regulations (low confidence). Due to earlier snowmelt, driven by temperature increases in the region and a decreasing frequency of arctic air mass advection, high-flow events in the Baltic Sea region occurred about a month earlier. In Sweden, trends in the magnitude of high-flow events over the past 100 years are not statistically significant (low confidence; NEW).
-
Riverine nutrient loads. The effect of changing climate on riverine nutrient loads is small and not detectable (low confidence).
-
Terrestrial biosphere. Combining all vegetation types in the entire Baltic Sea region, satellite observations suggest an advancement of the growing season by 0.30 d yr−1 over the period 2000–2016. The most important driver of the advancement of the growing season is spring mean temperature, with an advancement rate of 2.47 d ∘C−1 of spring warming (medium confidence; NEW). Observations and model results suggest cooling trends in daily minimum and warming trends in daily maximum temperatures in response to deforestation, and the opposite tendencies for afforestation (NEW).
-
Snow. The decrease in snow cover has accelerated in recent decades, except in the mountain areas and the northeastern part of the Baltic Sea region (high confidence; NEW). On average, the number of days with snow cover has declined by 3–5 per decade (high confidence). Mean and maximum snow depth has also decreased, most clearly in the southern and central part of the region (high confidence). Whether sea effect snowfall events have changed is unknown (low confidence).
-
Glaciers. Inventories of all Scandinavian glaciers, available only since 2006, show that they have lost 20 Gt of ice (∼8 % of their total mass) during 2006–2015. Atmospheric warming is very likely the primary driver of glacier mass loss (high confidence; NEW).
-
Permafrost. Recent warming has caused losses of over 20 % of the original 6200 km2 of permafrost in the Baltic Sea catchment area during 1997–2018 (medium confidence; NEW).
-
Sea ice. Long-term decreases in sea ice in the Baltic Sea have exceeded the large natural climatological variability and can only be attributed to global climate change (high confidence). In addition, unprecedented mild ice seasons have occurred in the last 10 years, and 100-year trends in sea ice cover showed an accelerated decline in 1921–2020 compared to 1910–2011 (high confidence; NEW).
-
Lake ice. Warming in the Baltic Sea catchment during recent decades has resulted in earlier ice break-up, later freeze-up, and, hence, shorter ice cover duration on the lakes in the region (high confidence; NEW).
-
Water temperature. Monitoring data, satellite data, and model-based historical reconstructions indicate an increase in annual mean SST averaged over the Baltic Sea of 0.4–0.6∘C per decade or ∼ 1–2∘C since the 1980s (high confidence). During 1856–2005, reconstructed SSTs increased by 0.03 and 0.06∘C per decade in northeastern and southwestern areas, respectively. Hence, without excluding internal variability, recent warming trends have accelerated 10-fold (NEW). Long-term measurements at Tvärminne, at the northern coast of the Gulf of Finland, indicate that marine heatwaves have increased since 1926 (low confidence).
-
Salinity and saltwater inflows. The record of Major Baltic Inflows (MBIs) has been revised, and the earlier-reported decreasing trend is now seen as artefactual. On centennial timescales, there are no statistically significant trends in salinity averaged over the Baltic Sea (1920–2008) or in MBIs (1887–2017) but pronounced multidecadal variability, with a period of about 30 years. Model results suggested that a decade of decreasing salinity, like the 1983–1992 stagnation, happens about once a century due to natural variability. Due to increased river runoff in the northern catchment, the north–south gradient in sea surface salinity likely increased in 1920–2004 (low confidence; NEW).
-
Stratification and overturning circulation. No long-term trend in stratification was detected, but during 1982–2016 stratification increased in most of the Baltic Sea, with the seasonal thermocline and the perennial halocline strengthening by 0.33–0.39 and 0.70–0.88 kg m−3, respectively (low confidence; NEW).
-
Sea level. Since 1886, the mean sea level in the Baltic Sea relative to the geoid has increased by about 1–2 mm yr−1, similar to the global mean rate (high confidence). However, in the northern Baltic Sea rapid land uplift causes a relative sea level decrease (high confidence). Although an acceleration of the mean sea level rise at individual stations could not yet be detected, the all-station-average record showed an almost statistically significant acceleration (medium confidence; NEW). Basin-wide, no statistically significant, long-term changes in extreme sea levels relative to the mean sea level of the Baltic Sea could be documented (low confidence; NEW).
-
Waves. Wave hindcasts and observations are too short for studies of climate-relevant trends (low confidence).
-
Sedimentation and coastal erosion. The dominance of mobile sediments makes the southern and eastern coasts more vulnerable to wind–wave-induced transport than other Baltic Sea coasts. Prevailing westerly winds lead to mainly west–east sediment transport and an alternation of glacial till cliffs (sources), sandy beaches, and spits (sinks). No statistically significant, long-term changes were found (low confidence; NEW).
-
Oxygen and nutrients. Reconstructions of oxygen conditions in the Baltic Sea for the period 1898–2012 suggest a 10-fold increase in the hypoxic area, with current values of up to 70 000 km2. This increase was attributed mainly to increased nutrient loads, with a minor contribution from climate warming (low confidence; NEW). Furthermore, recently estimated oxygen consumption rates in the Baltic Sea are higher than observed before, reducing the duration of improved oxygen conditions after natural ventilation events by oxygen-enriched saltwater inflows.
-
Marine CO2 system – air–sea exchange. In the period 1980–2005, subbasins affected by high riverine runoff and related high loads of terrestrial organic matter (e.g. Gulf of Bothnia) were found to be, on average, a source of CO2 to the atmosphere. This outgassing was more than compensated by the high CO2 uptake by the open waters of the Baltic proper (medium confidence; NEW).
-
Marine CO2 system – alkalinity. During 1900–2015, a long-term trend in alkalinity was observed, with the largest increases in the Gulf of Bothnia, where it almost entirely cancelled the pH decrease expected from rising atmospheric pCO2. The smaller alkalinity increase in the southern Baltic Sea compensated ocean acidification by about 50 %. Due to the high seasonal variability in pH, large interannual variability in productivity, and the identified alkalinity trend, no acidification was measurable in the central and northern Baltic Sea (medium confidence; NEW).
-
Microbial communities. Long-term time series from 1994 to 2006 show that increased riverine dissolved organic matter suppresses phytoplankton biomass production and shifts the carbon flow towards heterotrophic microbes (low confidence; NEW).
-
Phytoplankton and cyanobacteria. The growing season for phytoplankton and cyanobacteria has lengthened significantly in the past few decades (medium confidence), and the ratio between diatom and dinoflagellate biomasses declined during the past century, probably due to warmer winters (low confidence; NEW). The annual chlorophyll maximum, in the 1980s associated with the spring diatom bloom, has shifted to coincide with the summer cyanobacteria bloom (low confidence; NEW). Although interannually oscillating, surface cyanobacteria accumulations became a recurrent summer feature of the southern Bothnian Sea in the 2010s (medium confidence; NEW).
-
Macroalgae. Long-term changes in Baltic Sea macroalgae and charophytes have been attributed to changes in salinity, wind exposure, nutrient availability, and water transparency, as well as biotic interactions (low confidence; NEW). However, the role of climate change is unclear.
-
Zoobenthos. Increasing near-bottom temperature may partially explain the spreading of non-indigenous species, such as polychaetes of the genus Marenzelleria. The effects on zoobenthos are primarily synergistic, through, for example, eutrophication and hypoxia (low confidence; NEW).
-
Non-indigenous species. No invasion of the recorded non-indigenous species can be confidently attributed to climate change as a main driver (low confidence).
-
Fish. Changes in temperature, salinity, and species interactions can affect the stocks of cod, sprat, and herring. However, the dominant driver is the fishery. For coastal fish, the distribution of pikeperch expanded northwards along the coasts of the Bothnian Sea, apparently due to the warming waters. For many coastal fish species, eutrophication is, however, equally or more important than climate change (low confidence; NEW).
-
Marine mammals. Populations of ice-breeding seals, especially southern populations of the ringed seal, have likely suffered from the sea ice decline (low confidence). However, this is based on occasional ringed seal moult counts that indicate no population growth, while monitoring data on reproductive success are missing.
-
Waterbirds. Many waterbird species have shifted their wintering range northwards (high confidence). They now migrate earlier in spring (medium confidence). Effects of warming sea temperature are inconsistent because both positive and negative effects on foraging conditions and food quality have been found (low confidence). Most migrating Baltic Sea waterbirds are also affected by climate change outside the Baltic Sea (medium confidence).
-
Marine food webs. Significant alterations in food web structure and functioning such as the shift from early diatom to later dinoflagellate dominated blooms have been observed. However, the causes of these changes are unknown (low confidence).
7.3 Future climate changes
-
Large-scale circulation. Some projections suggest a more zonal flow over northern Europe and a northward shift in the mean summer position of the westerlies at the end of the century (low confidence).
-
Air temperature. Coupled atmosphere–ocean regional climate models project an increase in annual mean air temperature by between 1.5 and 4.3∘C over the Baltic Sea catchment area at the end of the century. The range indicates ensemble mean values for RCP2.6 and RCP8.5 scenarios. On average, air over surrounding land will warm about 0.1 to 0.4∘C more than the air over the Baltic Sea (high confidence; NEW). A bias-adjusted median estimate of increase in warm spell duration index in Scandinavia for the period 2071–2100, compared to 1981–2010, was about 15 days under RCP8.5, with an uncertainty range of about 5–20 d (medium confidence). The cold spell duration index in northern Europe is projected to decrease in the future, with a likely range of from −5 to −8 d yr−1 by 2071–2100, compared to 1971–2000 (medium confidence).
-
Solar radiation and cloudiness. Projections for solar radiation and cloudiness differ systematically in sign between global and regional climate models, indicating high uncertainty (low confidence; NEW).
-
Precipitation. Annual mean precipitation is projected to increase over the entire Baltic Sea catchment at the end of the century (medium confidence). The signal is robust for winter among the various regional climate models but is highly uncertain for summer in the south. The intensity and frequency of heavy rainfall events are projected to increase. These increases are even larger for convection-resolving models (high confidence; NEW). Projections show that the number of dry days in the southern and central parts of the Baltic Sea basin increases mainly in summer (low confidence).
-
Wind. Changes in wind over the Baltic Sea region are highly uncertain (low confidence). Over sea areas where the average ice cover is projected to diminish, such as the Bothnian Sea and the eastern Gulf of Finland, the mean wind is projected to increase because of a warmer sea surface and reduced stability of the planetary boundary layer (low confidence).
-
Air pollution. The impact of climate change on air quality and atmospheric deposition is smaller than the assumed impact of future changes in emissions (low confidence).
-
River discharge. River runoff is projected to increase up to about 20 %. River discharge is projected to increase to the northern and decrease to the southern subbasins (low confidence). High flows are projected to decrease in spring and increase in autumn and winter due to earlier snowmelt and more winter rain. Over much of continental Europe, an increase in intensity of high-flow events is projected with increasing temperature (low confidence).
-
Land nutrient inputs. The impact of climate change on land nutrient inputs is smaller than the impact of changes in land management, populations, and nutrient point source releases. In any given river, larger runoff would lead to larger nutrient inputs (low confidence).
-
Terrestrial growing season. Projections suggested that decreasing surface albedo in the Arctic region in winter and spring will notably amplify the future warming in spring (positive feedback), while the increased evapotranspiration will lead to a marked cooling during summer (negative feedback). These feedbacks will stimulate vegetation growth, due to an earlier start of the growing season, leading to compositional changes in woody plants and the distribution of vegetation. Arctic terrestrial ecosystems could continue to sequester carbon until the 2060–2070s, after which the terrestrial ecosystems are projected to turn into weak sources of carbon due to increased soil respiration and biomass burning (low confidence; NEW).
-
Terrestrial carbon sequestration. Mitigation scenarios that decrease the fraction of coniferous forest in favour of deciduous forest, and increase the area of deciduous forest in northern Europe from 130 000 to 480 000 km2, were projected to reduce near-surface temperatures and give maximum carbon sequestration (NEW).
-
Snow. Projections under RCP8.5 suggest a reduction in the average snow amount between 1981–2010 and 2071–2100 by more than 70 % for most areas, with the exception of the high Scandinavian mountains, where the warming temperature does not reach the freezing point as often as in lower-lying regions (high confidence). Sea effect snowfall events in future climate have not been investigated yet.
-
Glaciers. Scandinavian glaciers will lose more than 80 % of their current mass by 2100 under RCP8.5, and many are projected to disappear, regardless of future emission scenarios (high confidence; NEW). Furthermore, river runoff from glaciers is also projected to change, regardless of the emission scenario, and to result in increased average winter runoff and in earlier spring peaks (high confidence; NEW).
-
Permafrost. In the future climate, the ongoing loss of permafrost in the Baltic Sea catchment will very likely accelerate (high confidence).
-
Sea ice. Regional climate projections consistently project shrinking and thinning of Baltic Sea ice cover (high confidence) but still estimate that some ice will be formed even in mildest future winters. However, those estimates are based on a limited number of ensemble members and may not represent future climate variability correctly.
-
Lake ice. The observed trends of earlier ice break-up, later freeze-up, and shorter ice cover duration on lakes in the region are projected to continue with future warming, and lakes with intermittent winter ice will consequently become increasingly abundant (high confidence; NEW).
-
Water temperature. Coupled atmosphere–ocean regional climate models project an increase in annual mean SST of between 1.1 and 3.2∘C, averaged for the Baltic Sea at the end of the century. The range indicates ensemble mean values for RCP2.6 and RCP8.5 scenarios. Warming will be largest in summer in the northern Baltic Sea (high confidence). Under both RCP4.5 and RCP8.5, record-breaking summer mean SSTs were projected to increase at the end of the century (medium confidence; NEW). However, due to the pronounced internal variability, there might be decades in the near future without record-breaking events.
-
Salinity and saltwater inflows. An increase in river runoff or westerly winds will tend to decrease salinity, but a global sea level rise will tend to increase it because an enlarged cross-sectional area of the Danish straits will increase the saltwater imports from the Kattegat. Due to the large uncertainty in projected river runoff, wind, and global sea level rise, salinity projections show a wide spread, from increasing to decreasing salinities, and no robust changes were identified (low confidence; NEW).
-
Stratification and overturning circulation. Considering all potential drivers of changes in salinity in the Baltic Sea (wind, river runoff, net precipitation, and global sea level rise), neither the saline-induced stratification nor the overturning circulation is projected to change (low confidence; NEW). Projections consistently show that the seasonal thermocline during summer will intensify across nearly the whole Baltic Sea (high confidence; NEW).
-
Sea level. The future absolute sea level in the Baltic Sea will continue to rise with the global mean sea level (high confidence). Its regional manifestation is, however, modulated by the future melting of Antarctica, which affects the Baltic Sea more strongly than the melting of Greenland (low confidence). Using current estimates, the regional mean sea level is projected to rise by about 87 % of the global mean sea level. Land uplift is roughly known but difficult to estimate accurately in practice, as many regional geological factors blur the signature of the glacial isostatic adjustment. Trends in sea level extremes will be determined by the changing mean sea level and possible future changes in storminess. The uncertainty in the latter driver is very large (low confidence).
-
Waves. The projected decrease in seasonal sea ice cover will have considerable effects on the wave climate in the northernmost Baltic Sea (high confidence; NEW). Otherwise, there are no conclusive results on possible changes in the wave climate and wave extremes because of the uncertainty about changes in wind fields (low confidence).
-
Sedimentation and coastal erosion. Changes in sea level, wind, waves, and sea ice all affect sediment transport and coastal erosion. Hence, available projections are highly uncertain (low confidence; NEW).
-
Oxygen and nutrients. The future response of deepwater oxygen conditions will mainly depend on future nutrient inputs from land (medium confidence). However, coastal hypoxia might increase due to warming of the water in shallow areas (medium confidence). Implementation of the BSAP will lead to declining phosphorus concentrations (medium confidence; NEW).
-
Marine CO2 system. Due to anthropogenic emissions, atmospheric pCO2 and, consequently, also the mean pCO2 of Baltic surface seawater will rise, which has the potential to lower pH (high confidence). However, the magnitude of the pH change also depends on alkalinity trends, which are highly uncertain (low confidence). Hence, projections for the Baltic Sea are different from the global ocean.
-
Microbial communities. The impact of climate change on microbes and the functioning of the microbial loop have been studied experimentally. In the northern Gulf of Bothnia, adding DOM increased the abundance of bacteria, whereas a temperature increase (from 12 to 15 ∘C) reduced their abundance (low confidence; NEW).
-
Phytoplankton and cyanobacteria. The effect of climate change on phytoplankton and cyanobacteria blooms is larger under high nutrient concentrations, but nutrient loads are the dominant driver. If the BSAP is fully implemented, the projected environmental status of the Baltic Sea will be significantly improved, and extreme cyanobacteria blooms will be rare or absent (low confidence; NEW).
-
Zooplankton. Experimental studies suggested improved conditions for microzooplankton due to warming but negative effects on some larger zooplankton species (low confidence; NEW).
-
Macroalgae and vascular plants. The direct and indirect effects of changes in temperature, salinity, and pH are likely to change the geographic distribution of Baltic Sea macrophytes. However, neither experimental studies nor past observed changes provide conclusive projections for the effects of climate change (low confidence; NEW).
-
Zoobenthos. In a warmer and less eutrophic Baltic Sea, benthic–pelagic coupling will be weaker, resulting in decreasing benthic biomass (low confidence; NEW).
-
Non-indigenous species. Climate change may favour invasions of non-indigenous species (medium confidence). However, it is impossible to project which species may enter the Baltic Sea in future.
-
Fish. Projected changes in temperature and salinity will affect the stocks of cod, sprat, and herring. However, nutrient loads and especially fishing mortality are also important drivers. Although multi-driver modelling studies have been performed, the impact of climate change is unknown (low confidence; NEW).
-
Marine mammals. Mild winters are known to negatively affect Baltic ringed seals (Phoca hispida botnica) because, without their sea ice lair, the pups are more vulnerable to weather and predators, and it has been projected that the growth rates of ringed seal populations will decline in the next 90 years. Also, for grey seals (Halichoerus grypus), it has been suggested that reduced ice cover in combination with (partly climate-driven) changes in the food web, may affect their body condition and birth rate (low confidence).
-
Waterbirds. The northward distributional shifts of waterbirds are expected to continue (medium confidence). Effects on waterbird food will be manifold, but consequences are difficult to predict (low confidence). The rising sea level and erosion are expected to reduce the availability of breeding habitats (low confidence).
-
Marine food webs. Significant alterations in food web structure and functioning can be expected, since species distributions and abundances are expected to change with warming seawater. The consequences are difficult to project, as research into the long-term dynamics of food webs is still scarce (low confidence).
We found the following:
-
The overall conclusions of the BACC I and BACC II assessments remain valid.
-
However, new coupled models (atmosphere–ice–ocean and atmosphere–land), larger ensembles of scenario simulations (CORDEX), new mesocosm experiments (warming, ocean acidification, and dissolved organic matter), extended monitoring (glaciers and satellite data), and homogenised records of observations (MBIs) have led to new insights into past and future climate variability.
-
Improved palaeoclimate simulations of the Holocene, new dendroclimatological reconstructions of the past 1000 years, and new climate regionalisation have added regional details (east–west gradients over the Baltic Sea region) and improved our understanding of internal variability (sea level extremes and stagnation periods) and the remote impact of low-frequency North Atlantic variability on the Baltic Sea region (AMO and Baltic Sea salinity). New sediment cores suggest that hypoxia during the Medieval Climate Anomaly was caused by climate variability rather than by human influence, as claimed earlier.
-
Natural variability in many variables of the Earth system is larger than previously realised, requiring larger model ensembles for convincing future projections. Although the first relatively large ensemble of scenario simulations utilising a regional coupled atmosphere–ice–ocean model has become available, uncertainty estimates are still incomplete.
-
New regional ESMs including additional components of the Earth system are under development. However, the simulated water cycle is still biased.
-
The first complex multiple-driver study with a focus on present and future climates addressing for instance eutrophication of the Baltic Sea, fisheries, and climate change has become available, and an overall assessment of the various drivers in the Baltic Sea region is part of the BEARs. However, further research on the interplay between drivers is needed.
-
More research on changing extremes was performed, acknowledging that the impact of changing extremes may be more important than that of changing means. However, most observational records are either too short or too heterogeneous for statistical studies of extremes.
-
The climate change signal is still confined to increases in observed air and water temperatures, to decreases in sea and lake ice, snow cover, permafrost, and glacier mass, to the rise in mean sea level, and to variables directly related to temperature and the cryosphere, such as ringed seal habitats. Compared to the previous BACC report, changes in air temperature, sea ice, snow cover, and sea level were shown to have accelerated.
-
Intensive research on the land–sea interface, focussing on the coastal filter, has been performed, and nutrient retention in the coastal zone was estimated for the first time. The unknown bioavailability of nutrient inputs was identified as one of the foremost challenges for marine biogeochemistry. However, a model for the entire Baltic Sea coastal zone is still missing, and the effect of climate change on the coastal filter capacity is still unknown.
-
In contradiction to earlier results, observed MBIs have no declining trend. Due to the uncertainties in projections of the regional wind, regional precipitation and evaporation, river discharge, and global mean sea level rise, projections of salinity in the Baltic Sea are inherently uncertain, and it remains unknown whether the Baltic Sea will become less or more salty. As salinity is a crucial variable for the marine ecosystem and for Baltic circulation, projections for the Baltic Sea as a whole are regarded as highly uncertain.
-
The Baltic Sea may become more acidic in the future, but the decrease in pH may partly be compensated by an alkalinity increase, as in the past. Hence, past changes in Baltic carbonate chemistry were different from the global ocean acidification, and pH changes may differ also in future.
-
Large marine food web changes were observed, which could partly be attributed to warming, brightening, and sea ice decline. However other factors also play important roles, and many records are too short for attribution studies.
In this study, new code was not developed.
All datasets presented here have previously been published and are publicly available. Figures 1, 15, 28, 29, 31, 32, and 33 are adopted from Meier et al. (2014, 2022), Ronkainen et al. (2018), Hock et al. (2019), and Luomaranta et al. (2019). Data are available from Seifert and Kayser (1995) for Fig. 2, Laskar et al. (2004) and Mauri et al. (2015) for Fig. 3, Luterbacher et al. (2016) for Fig. 4, https://crudata.uea.ac.uk/cru/data/nao/nao.dat (NAO, 2022) for Fig. 5, https://climexp.knmi.nl/data/iamo_hadsst_ts.dat (AMO, 2022) for Fig. 6, CRUTEM4v dataset (Jones et al., 2012) for Fig. 7 and Table 9, https://bolin.su.se/data/stockholm-historical-temps-monthly (Moberg, 2022) for Fig. 8, http://surfobs.climate.copernicus.eu/dataaccess/access_eobs.php#datafiles (E-OBS, 2022) for Fig. 9, https://www.smhi.se (SMHI, 2022) for Figs. 10, 23, and 25, https://www.researchgate.net/publication/358726567_Long-term_times-series_of_the_annual_N_and_P_pools_in_the_major_basins_of_the_Baltic_Sea_1970-2020 (Savchuk, 2022) for Fig. 11 and Table 10, https://data.fieldsites.se/portal/ (SITES, 2022) for Fig. 12 and Table 11, Obu et al. (2020) (https://doi.org/10.5285/28e889210f884b469d7168fde4b4e54f) and Hannerz and Destouni (2006) for Fig. 13, https://www.eea.europa.eu/data-and-maps/daviz/maximum-extent-of-ice-cover-3#tab-chart_1 (EEA, 2022) or https://en.ilmatieteenlaitos.fi/ice-season-in-the-baltic-sea (MIB, 2022) for Fig. 14, https://en.ilmatieteenlaitos.fi/ice-conditions (FMI, 2022) for Figs. 16 and 17, https://www.ices.dk/data/data-portals/Pages/ocean.aspx (ICES, 2022) for Figs. 18, 19, 21, and 22, Oceanographic Data Center at the Federal Maritime and Hydrographic Agency (dod@bsh.de) for Fig. 20, Ekman (1988, 2003) and https://www.smhi.se (SMHI, 2022) for Fig. 24, Gröger et al. (2021b) for Fig. 26, http://esgf-data.dkrz.de (EURO-CORDEX, 2022) for Fig. 27, Gröger et al. (2019) for Fig. 30, Huthnance et al. (2016) for Fig. 34, https://interactive-atlas.ipcc.ch/ (IPCC, 2021b) for Tables 6–8, and Gröger et al. (2021b) for Tables 12–14.
HEMM coordinated the assessment and writing of the review article and edited the paper. All co-authors contributed with either text, figures, tables, or comments as detailed in Table 1.
The contact author has declared that neither they nor their co-authors have any competing interests.
Publisher's note: Copernicus Publications remains neutral with regard to jurisdictional claims in published maps and institutional affiliations.
This article is part of the special issue “The Baltic Earth Assessment Reports (BEAR)”. It is not associated with a conference.
During the time in which this paper was prepared, shortly before its submission, Christian Dieterich passed away (1964–2021). This sad event marked the end of the life of a distinguished oceanographer and climate scientist, who made important contributions to the climate modelling of the Baltic Sea, North Sea, and North Atlantic regions. This paper is dedicated to him.
The research presented in this study is part of the Baltic Earth Assessment Reports project of the Baltic Earth programme (Earth System Science for the Baltic Sea region; see http://www.baltic.earth, last access: 17 February 2022). We thank Berit Recklebe for the technical support and preparation of the reference list, and Jouni Räisänen and Donald Boesch for their excellent comments that helped to improve an earlier version of the manuscript.
This paper was edited by Joakim Langner and reviewed by Jouni Räisänen and Donald Boesch.
Aalto, J., Pirinen, P., and Jylhä, K.: New gridded daily climatology of Finland: Permutation-based uncertainty estimates and temporal trends in climate, J. Geophys. Res-Atmos., 121, 3807–3823, https://doi.org/10.1002/2015JD024651, 2016.
Aarvak, T., Jostein ØIen, I., Krasnov, Y. V., Gavrilo, M. V., and Shavykin, A. A.: The European wintering population of Steller's Eider Polysticta stelleri reassessed, Bird Conserv. Int., 23, 337–343, https://doi.org/10.1017/S0959270912000251, 2013.
Aberle, N., Malzahn, A. M., Lewandowska, A. M., and Sommer, U.: Some like it hot: the protozooplankton-copepod link in a warming ocean, Mar. Ecol. Prog. Ser., 519, 103–113, https://doi.org/10.3354/meps11081 2015.
Adam, J. C., Haddeland, I., Su, F., and Lettenmaier, D. P.: Simulation of reservoir influences on annual and seasonal streamflow changes for the Lena, Yenisei, and Ob' rivers, J. Geophys. Res.-Atmos., 112, D24114, https://doi.org/10.1029/2007JD008525, 2007.
Adam, J. C. and Lettenmaier, D. P.: Application of New Precipitation and Reconstructed Streamflow Products to Streamflow Trend Attribution in Northern Eurasia, J. Climate, 21, 1807–1828, https://doi.org/10.1175/2007jcli1535.1, 2008.
Ahlgren, J., Grimvall, A., Omstedt, A., Rolff, C., and Wikner, J.: Temperature, DOC level and basin interactions explain the declining oxygen concentrations in the Bothnian Sea, J. Marine Syst., 170, 22–30, https://doi.org/10.1016/j.jmarsys.2016.12.010, 2017.
Åkerman, H. J. and Johansson, M.: Thawing permafrost and thicker active layers in sub-arctic Sweden, Permafrost Periglac., 19, 279–292, https://doi.org/10.1002/ppp.626, 2008.
Akhtar, N., Geyer, B., Rockel, B., Sommer, P. S., and Schrum, C.: Accelerating deployment of offshore wind energy alter wind climate and reduce future power generation potentials, Sci. Rep.-UK, 11, 11826, https://doi.org/10.1038/s41598-021-91283-3, 2021.
Al-Janabi, B., Kruse, I., Graiff, A., Karsten, U., and Wahl, M.: Genotypic variation influences tolerance to warming and acidification of early life-stage Fucus vesiculosus L. (Phaeophyceae) in a seasonally fluctuating environment, Mar. Biol., 163, 14, https://doi.org/10.1007/s00227-015-2804-8, 2016.
Alkama, R. and Cescatti, A.: Biophysical climate impacts of recent changes in global forest cover, Science, 351, 600–604, https://doi.org/10.1126/science.aac8083, 2016.
Allen, M. R., Dube, O. P., Solecki, W., Aragón-Durand, F., Cramer, W., Humphreys, S., Kainuma, M., Kala, J., Mahowald, N., Mulugetta, Y., Perez, R., Wairiu, M., and Zickfeld, K.: Framing and Context, in: Global Warming of 1.5 ∘C. An IPCC Special Report on the impacts of global warming of 1.5 ∘C above pre-industrial levels and related global greenhouse gas emission pathways, in the context of strengthening the global response to the threat of climate change, sustainable development, and efforts to eradicate poverty, edited by: Masson-Delmotte, V., Zhai, P., Pörtner, H.-O., Roberts, D., Skea, J., Shukla, P. R., Pirani, A., Moufouma-Okia, W., Péan, C., Pidcock, R., Connors, S., Matthews, J. B. R., Chen, Y., Zhou, X., Gomis, M. I., Lonnoy, E., Maycock, T., Tignor, M., and Waterfield, T., https://www.ipcc.ch/sr15/chapter/chapter-1/ (last access: 17 February 2022), 2018.
Allen, R. J., Norris, J. R., and Wild, M.: Evaluation of multidecadal variability in CMIP5 surface solar radiation and inferred underestimation of aerosol direct effects over Europe, China, Japan, and India, J. Geophys. Res.-Atmos., 118, 6311–6336, https://doi.org/10.1002/jgrd.50426, 2013.
Allen, S. G., Ainley, D. G., Page, G. W., and Ribic, C. A.: The effect on distribution on harbor seal haul out patterns at Bolinas Lagoon, California, in: Fish. Bull., edited by: Richards, W. J., Collette, B. B., Houde, E. D., Ingham, M. C., Lasker, R., Malins, D. C., Pella, J. J., Quast, J. C., Sindermann, C. J., and Fukuyama, M. S., National Marine Fisheries Service, NOAA, Seattle, WA, USA, 82, 493–500, 1984.
Almroth-Rosell, E., Edman, M., Eilola, K., Meier, H. E. M., and Sahlberg, J.: Modelling nutrient retention in the coastal zone of an eutrophic sea, Biogeosciences, 13, 5753–5769, https://doi.org/10.5194/bg-13-5753-2016, 2016.
Ambaum, M. H., Hoskins, B. J., and Stephenson, D. B.: Arctic oscillation or North Atlantic oscillation?, J. Climate, 14, 3495–3507, https://doi.org/10.1175/1520-0442(2001)014<3495:AOONAO>2.0.CO;2, 2001.
AMO: KNMI Climate Explorer and Met Office, Atlantic Multidecadal Variability index, AMO [data set], https://climexp.knmi.nl/data/iamo_hadsst_ts.dat, last access: 17 February 2022.
Andersen, J. H., Carstensen, J., Conley, D. J., Dromph, K., Fleming-Lehtinen, V., Gustafsson, B. G., Josefson, A. B., Norkko, A., Villnäs, A., and Murray, C.: Long-term temporal and spatial trends in eutrophication status of the Baltic Sea, Biol. Rev., 92, 135–149, https://doi.org/10.1111/brv.12221, 2017.
Andersson, A., Meier, H. E. M., Ripszam, M., Rowe, O., Wikner, J., Haglund, P., Eilola, K., Legrand, C., Figueroa, D., Paczkowska, J., Lindehoff, E., Tysklind, M., and Elmgren, R.: Projected future climate change and Baltic Sea ecosystem management, Ambio, 44, 345–356, https://doi.org/10.1007/s13280-015-0654-8, 2015.
Andersson, H. C.: Influence of long-term regional and large-scale atmospheric circulation on the Baltic sea level, Tellus A, 54, 76–88, https://doi.org/10.3402/tellusa.v54i1.12125, 2002.
Arheimer, B., Dahné, J., and Donnelly, C.: Climate change impact on riverine nutrient load and land-based remedial measures of the Baltic Sea Action Plan, Ambio, 41, 600–612, https://doi.org/10.1007/s13280-012-0323-0, 2012.
Arheimer, B. and Lindström, G.: Climate impact on floods: changes in high flows in Sweden in the past and the future (1911–2100), Hydrol. Earth Syst. Sci., 19, 771–784, https://doi.org/10.5194/hess-19-771-2015, 2015.
Arheimer, B., Donnelly, C., and Lindström, G.: Regulation of snow-fed rivers affects flow regimes more than climate change, Nat. Commun., 8, 62, https://doi.org/10.1038/s41467-017-00092-8, 2017.
Arias, P. A., Bellouin, N., Coppola, E., Jones, R. G., Krinner, G., Marotzke, J., Naik, V., Palmer, M. D., Plattner, G.-K., Rogelj, J., Rojas, M., Sillmann, J., Storelvmo, T., Thorne, P. W., Trewin, B., Achuta Rao, K., Adhikary, B., Allan, R. P., Armour, K., Bala, G., Barimalala, R., Berger, S., Canadell, J. G., Cassou, C., Cherchi, A., Collins, W., Collins, W. D., Connors, S. L., Corti, S., Cruz, F., Dentener, F. J., Dereczynski, C., Di Luca, A., Diongue Niang, A., Doblas-Reyes, F. J., Dosio, A., Douville, H., Engelbrecht, F., Eyring, V., Fischer, E., Forster, P., Fox-Kemper, B., Fuglestvedt, J. S., Fyfe, J. C., Gillett, N. P., Goldfarb, L., Gorodetskaya, I., Gutierrez, J. M., Hamdi, R., Hawkins, E., Hewitt, H. T., Hope, P., Islam, A. S., Jones, C., Kaufman, D. S., Kopp, R. E., Kosaka, Y., Kossin, J., Krakovska, S., Lee, J.-Y., Li, J., Mauritsen, T., Maycock, T. K., Meinshausen, M., Min, S.-K., Monteiro, P. M. S., Ngo-Duc, T., Otto, F., Pinto, I., Pirani, A., Raghavan, K., Ranasinghe, R., Ruane, A. C., Ruiz, L., Sallée, J.-B., Samset, B. H., Sathyendranath, S., Seneviratne, S. I., Sörensson, A. A., Szopa, S., Takayabu, I., Tréguier, A.-M., van den Hurk, B., Vautard, R., von Schuckmann, K., Zaehle, S., Zhang, X., and Zickfeld, K.: Technical Summary, in: Climate Change 2021: The Physical Science Basis. Contribution of Working Group I to the Sixth Assessment Report of the Intergovernmental Panel on Climate Change, edited by: Masson-Delmotte, V., Zhai, P., Pirani, A., Connors, S. L., Péan, C., Berger, S., Caud, N., Chen, Y., Goldfarb, L., Gomis, M. I., Huang, M., Leitzell, K., Lonnoy, E., Matthews, J. B. R., Maycock, T. K., Waterfield, T., Yelekçi, O., Yu, R., and Zhou, B., Cambridge University Press, Cambridge, in press, 2021.
Armitage, J. M., Quinn, C. L., and Wania, F.: Global climate change and contaminants – an overview of opportunities and priorities for modelling the potential implications for long-term human exposure to organic compounds in the Arctic, J. Environ. Monitor., 13, 1532–1546, https://doi.org/10.1039/C1EM10131E, 2011.
Arneborg, L.: Comment on “Influence of sea level rise on the dynamics of salt inflows in the Baltic Sea” by Hordoir, R., Axell, L., Löptien, U., Dietze, H., and Kuznetsov, I. , J. Geophys. Res.-Oceans, 121, 2035–2040, https://doi.org/10.1002/2015JC011451, 2016.
Asmala, E., Carstensen, J., Conley, D. J., Slomp, C. P., Stadmark, J., and Voss, M.: Efficiency of the coastal filter: Nitrogen and phosphorus removal in the Baltic Sea, Limnol. Oceanogr., 62, S222–S238, https://doi.org/10.1002/lno.10644, 2017.
Athanasiadis, P. J., Yeager, S., Kwon, Y.-O., Bellucci, A., Smith, D. W., and Tibaldi, S.: Decadal predictability of North Atlantic blocking and the NAO, npj Clim. Atmos. Sci., 3, 20, https://doi.org/10.1038/s41612-020-0120-6, 2020.
Averkiev, A. S. and Klevannyy, K. A.: A case study of the impact of cyclonic trajectories on sea-level extremes in the Gulf of Finland, Cont. Shelf Res., 30, 707–714, https://doi.org/10.1016/j.csr.2009.10.010, 2010.
Axell, L., Liu, Y., Jandt, S., Lorkowski, I., Lindenthal, A., Verjovkina, S., and Schwichtenberg, F.: Baltic Sea Production Centre BALTICSEA_REANALYSIS_BIO_003_012, COPERNICUS Marine Environment Monitoring Service, Issue 2.5, 51 pp., https://doi.org/10.48670/moi-00012, 2019.
BACC Author Team: Assessment of Climate Change for the Baltic Sea Basin, Regional Climate Studies, Springer Science & Business Media, Berlin, Heidelberg, 473 pp., https://doi.org/10.1007/978-3-540-72786-6, 2008.
BACC II Author Team: Second Assessment of Climate Change for the Baltic Sea Basin, Regional Climate Studies, Springer International Publishing, Cham, https://doi.org/10.1007/978-3-319-16006-1, 2015.
Bailey, S. A., Brown, L., Campbell, M. L., Canning-Clode, J., Carlton, J. T., Castro, N., Chainho, P., Chan, F. T., Creed, J. C., Curd, A., Darling, J., Fofonoff, P., Galil, B. S., Hewitt, C. L., Inglis, G. J., Keith, I., Mandrak, N. E., Marchini, A., McKenzie, C. H., Occhipinti-Ambrogi, A., Ojaveer, H., Pires-Teixeira, L. M., Robinson, T. B., Ruiz, G. M., Seaward, K., Schwindt, E., Son, M. O., Therriault, T. W., and Zhan, A.: Trends in the detection of aquatic non-indigenous species across global marine, estuarine and freshwater ecosystems: A 50-year perspective, Divers. Distrib., 26, 1780–1797, https://doi.org/10.1111/ddi.13167, 2020.
BALTEX: Minutes of 17th Meeting of the BALTEX Science Steering Group held at Institute of Meteorology and Water Management (IMGW), Poznan, Poland, 24–26 November 2004, International BALTEX Secretariat Publication No. 32, 100 pp., https://www.baltex-research.eu/publications/SSG_minutes_diverse/BSSG17_minutes05.pdf (last access: 15 February 2022), 2005.
Baltic Earth: Baltic Earth Science Plan 2017, International Baltic Earth Secretariat Publication No. 11, Helmholtz-Zentrum Geesthacht GmbH, Germany, 34 pp., https://www.baltic.earth/imperia/md/assets/baltic_earth/baltic_earth/baltic_earth/ibesp_no11_feb2017_be_science_plan.pdf (last access: 17 February 2022), 2017.
Bamber, J. L., Oppenheimer, M., Kopp, R. E., Aspinall, W. P., and Cooke, R. M.: Ice sheet contributions to future sea-level rise from structured expert judgment, P. Natl. Acad. Sci. USA, 116, 11195, https://doi.org/10.1073/pnas.1817205116, 2019.
Barbosa, S. M. and Donner, R. V.: Long-term changes in the seasonality of Baltic sea level, Tellus A, 68, 30540, https://doi.org/10.3402/tellusa.v68.30540, 2016.
Barnes, E. A.: Revisiting the evidence linking Arctic amplification to extreme weather in midlatitudes, Geophys. Res. Lett., 40, 4734–4739, https://doi.org/10.1002/grl.50880, 2013.
Barregard, L., Molnàr, P., Jonson, J. E., and Stockfelt, L.: Impact on Population Health of Baltic Shipping Emissions, Int. J. Environ. Res. Public Health, 16, 1954, https://doi.org/10.3390/ijerph16111954, 2019.
Bartók, B., Wild, M., Folini, D., Lüthi, D., Kotlarski, S., Schär, C., Vautard, R., Jerez, S., and Imecs, Z.: Projected changes in surface solar radiation in CMIP5 global climate models and in EURO-CORDEX regional climate models for Europe, Clim. Dyn., 49, 2665–2683, https://doi.org/10.1007/s00382-016-3471-2, 2017.
Bartolino, V., Margonski, P., Lindegren, M., Linderholm, H. W., Cardinale, M., Rayner, D., Wennhage, H., and Casini, M.: Forecasting fish stock dynamics under climate change: Baltic herring (Clupea harengus) as a case study, Fish. Oceanogr., 23, 258–269, https://doi.org/10.1111/fog.12060, 2014.
Bartosova, A., Capell, R., Olesen, J. E., Jabloun, M., Refsgaard, J. C., Donnelly, C., Hyytiäinen, K., Pihlainen, S., Zandersen, M., and Arheimer, B.: Future socioeconomic conditions may have a larger impact than climate change on nutrient loads to the Baltic Sea, Ambio, 48, 1325–1336, https://doi.org/10.1007/s13280-019-01243-5, 2019.
Bates, A. E., Pecl, G. T., Frusher, S., Hobday, A. J., Wernberg, T., Smale, D. A., Sunday, J. M., Hill, N. A., Dulvy, N. K., Colwell, R. K., Holbrook, N. J., Fulton, E. A., Slawinski, D., Feng, M., Edgar, G. J., Radford, B. T., Thompson, P. A., and Watson, R. A.: Defining and observing stages of climate-mediated range shifts in marine systems, Glob. Environ. Change, 26, 27–38, https://doi.org/10.1016/j.gloenvcha.2014.03.009, 2014.
Bauer, B., Meier, H. E. M., Casini, M., Hoff, A., Margoński, P., Orio, A., Saraiva, S., Steenbeek, J., and Tomczak, M. T.: Reducing eutrophication increases spatial extent of communities supporting commercial fisheries: a model case study, ICES J. Mar. Sci., 75, 1306–1317, https://doi.org/10.1093/icesjms/fsy023, 2018.
Bauer, B., Gustafsson, B. G., Hyytiäinen, K., Meier, H. E. M., Müller-Karulis, B., Saraiva, S., and Tomczak, M. T.: Food web and fisheries in the future Baltic Sea, Ambio, 48, 1337–1349, https://doi.org/10.1007/s13280-019-01229-3, 2019.
Belkin, I. M.: Rapid warming of large marine ecosystems, Prog. Oceanogr., 81, 207–213, https://doi.org/10.1016/j.pocean.2009.04.011, 2009.
Bengtsson, L., Hodges, K. I., and Keenlyside, N.: Will Extratropical Storms Intensify in a Warmer Climate?, J. Climate, 22, 2276–2301, https://doi.org/10.1175/2008jcli2678.1, 2009.
Bergen, B., Endres, S., Engel, A., Zark, M., Dittmar, T., Sommer, U., and Jürgens, K.: Acidification and warming affect prominent bacteria in two seasonal phytoplankton bloom mesocosms, Environ. Microbiol., 18, 4579–4595, https://doi.org/10.1111/1462-2920.13549, 2016.
Bergström, L., Heikinheimo, O., Svirgsden, R., Kruze, E., Ložys, L., Lappalainen, A., Saks, L., Minde, A., Dainys, J., Jakubavičiūtė, E., Ådjers, K., and Olsson, J.: Long term changes in the status of coastal fish in the Baltic Sea, Estuar. Coast. Shelf Sci., 169, 74–84, https://doi.org/10.1016/j.ecss.2015.12.013, 2016.
Bergström, S. and Carlsson, B.: River runoff to the Baltic Sea – 1950–1990, Ambio, 23, 280–287, 1994.
Bermúdez, R., Winder, M., Stuhr, A., Almén, A.-K., Engström-Öst, J., and Riebesell, U.: Effect of ocean acidification on the structure and fatty acid composition of a natural plankton community in the Baltic Sea, Biogeosciences, 13, 6625–6635, https://doi.org/10.5194/bg-13-6625-2016, 2016.
Berner, C., Bertos-Fortis, M., Pinhassi, J., and Legrand, C.: Response of Microbial Communities to Changing Climate Conditions During Summer Cyanobacterial Blooms in the Baltic Sea, Front. Microbiol., 9, 1562, https://doi.org/10.3389/fmicb.2018.01562, 2018.
Bierstedt, S. E., Hünicke, B., and Zorita, E.: Variability of wind direction statistics of mean and extreme wind events over the Baltic Sea region, Tellus A, 67, 29073, https://doi.org/10.3402/tellusa.v67.29073, 2015.
Bingham, R. J. and Hughes, C. W.: Local diagnostics to estimate density-induced sea level variations over topography and along coastlines, J. Geophys. Res.-Oceans, 117, C01013, https://doi.org/10.1029/2011jc007276, 2012.
Biskaborn, B. K., Smith, S. L., Noetzli, J., Matthes, H., Vieira, G., Streletskiy, D. A., Schoeneich, P., Romanovsky, V. E., Lewkowicz, A. G., Abramov, A., Allard, M., Boike, J., Cable, W. L., Christiansen, H. H., Delaloye, R., Diekmann, B., Drozdov, D., Etzelmüller, B., Grosse, G., Guglielmin, M., Ingeman-Nielsen, T., Isaksen, K., Ishikawa, M., Johansson, M., Johannsson, H., Joo, A., Kaverin, D., Kholodov, A., Konstantinov, P., Kröger, T., Lambiel, C., Lanckman, J.-P., Luo, D., Malkova, G., Meiklejohn, I., Moskalenko, N., Oliva, M., Phillips, M., Ramos, M., Sannel, A. B. K., Sergeev, D., Seybold, C., Skryabin, P., Vasiliev, A., Wu, Q., Yoshikawa, K., Zheleznyak, M., and Lantuit, H.: Permafrost is warming at a global scale, Nat. Commun., 10, 264, https://doi.org/10.1038/s41467-018-08240-4, 2019.
Björkqvist, J.-V., Lukas, I., Alari, V., van Vledder, G. P., Hulst, S., Pettersson, H., Behrens, A., and Männik, A.: Comparing a 41-year model hindcast with decades of wave measurements from the Baltic Sea, Ocean Eng., 152, 57–71, https://doi.org/10.1016/j.oceaneng.2018.01.048, 2018.
Björkqvist, J.-V., Rikka, S., Alari, V., Männik, A., Tuomi, L., and Pettersson, H.: Wave height return periods from combined measurement–model data: a Baltic Sea case study, Nat. Hazards Earth Syst. Sci., 20, 3593–3609, https://doi.org/10.5194/nhess-20-3593-2020, 2020.
Blackport, R. and Screen, J. A.: Insignificant effect of Arctic amplification on the amplitude of midlatitude atmospheric waves, Sci. Adv., 6, eaay2880, https://doi.org/10.1126/sciadv.aay2880, 2020.
Blenckner, T., Österblom, H., Larsson, P., Andersson, A., and Elmgren, R.: Baltic Sea ecosystem-based management under climate change: Synthesis and future challenges, Ambio, 44, 507–515, https://doi.org/10.1007/s13280-015-0661-9, 2015.
Blindow, I., Dahlke, S., Dewart, A., Flügge, S., Hendreschke, M., Kerkow, A., and Meyer, J.: Long-term and interannual changes of submerged macrophytes and their associated diaspore reservoir in a shallow southern Baltic Sea bay: influence of eutrophication and climate, Hydrobiologia, 778, 121–136, https://doi.org/10.1007/s10750-016-2655-4, 2016.
Blöschl, G., Hall, J., Parajka, J., Perdigão, R. A. P., Merz, B., Arheimer, B., Aronica, G. T., Bilibashi, A., Bonacci, O., Borga, M., Čanjevac, I., Castellarin, A., Chirico, G. B., Claps, P., Fiala, K., Frolova, N., Gorbachova, L., Gül, A., Hannaford, J., Harrigan, S., Kireeva, M., Kiss, A., Kjeldsen, T. R., Kohnová, S., Koskela, J. J., Ledvinka, O., Macdonald, N., Mavrova-Guirguinova, M., Mediero, L., Merz, R., Molnar, P., Montanari, A., Murphy, C., Osuch, M., Ovcharuk, V., Radevski, I., Rogger, M., Salinas, J. L., Sauquet, E., Šraj, M., Szolgay, J., Viglione, A., Volpi, E., Wilson, D., Zaimi, K., and Živković, N.: Changing climate shifts timing of European floods, Science, 357, 588, https://doi.org/10.1126/science.aan2506, 2017.
Blunden, J. and Arndt, D. S.: State of the Climate in 2014, B. Am. Meteorol Soc., 96, ES1–ES32, https://doi.org/10.1175/2015BAMSStateoftheClimate.1, 2015.
Bobsien, I. C., Hukriede, W., Schlamkow, C., Friedland, R., Dreier, N., Schubert, P. R., Karez, R., and Reusch, T. B. H.: Modeling eelgrass spatial response to nutrient abatement measures in a changing climate, Ambio, 50, 400–412, https://doi.org/10.1007/s13280-020-01364-2, 2021.
Boé, J., Somot, S., Corre, L., and Nabat, P.: Large discrepancies in summer climate change over Europe as projected by global and regional climate models: causes and consequences, Clim. Dyn., 54, 2981–3002, https://doi.org/10.1007/s00382-020-05153-1, 2020a.
Boé, J., Terray, L., Moine, M.-P., Valcke, S., Bellucci, A., Drijfhout, S., Haarsma, R., Lohmann, K., Putrasahan, D. A., Roberts, C., Roberts, M., Scoccimarro, E., Seddon, J., Senan, R., and Wyser, K.: Past long-term summer warming over western Europe in new generation climate models: role of large-scale atmospheric circulation, Environ. Res. Lett., 15, 084038, https://doi.org/10.1088/1748-9326/ab8a89, 2020b.
Boers, N.: Observation-based early-warning signals for a collapse of the Atlantic Meridional Overturning Circulation, Nat. Clim. Change, 11, 680–688, https://doi.org/10.1038/s41558-021-01097-4, 2021.
Boland, E. J. D., Bracegirdle, T. J., and Shuckburgh, E. F.: Assessment of sea ice-atmosphere links in CMIP5 models, Clim. Dyn., 49, 683–702, https://doi.org/10.1007/s00382-016-3367-1, 2017.
Bonaduce, A., Staneva, J., Behrens, A., Bidlot, J.-R., and Wilcke, R. A. I.: Wave Climate Change in the North Sea and Baltic Sea, J. Mar. Sci. Eng., 7, 166, https://doi.org/10.3390/jmse7060166, 2019.
Bonan, G. B.: Forests, Climate, and Public Policy: A 500-Year Interdisciplinary Odyssey, Annu. Rev. Ecol. Evol. S, 47, 97–121, https://doi.org/10.1146/annurev-ecolsys-121415-032359, 2016.
Bonsdorff, E.: Eutrophication: Early warning signals, ecosystem-level and societal responses, and ways forward, Ambio, 50, 753–758, https://doi.org/10.1007/s1328050, 2021.
Borchert, L. F., Menary, M. B., Swingedouw, D., Sgubin, G., Hermanson, L., and Mignot, J.: Improved Decadal Predictions of North Atlantic Subpolar Gyre SST in CMIP6, Geophys. Res. Lett., 48, e2020GL091307, https://doi.org/10.1029/2020GL091307, 2021.
Börgel, F., Frauen, C., Neumann, T., Schimanke, S., and Meier, H. E. M.: Impact of the Atlantic Multidecadal Oscillation on Baltic Sea Variability, Geophys. Res. Lett., 45, 9880–9888, https://doi.org/10.1029/2018GL078943, 2018.
Börgel, F., Frauen, C., Neumann, T., and Meier, H. E. M.: The Atlantic Multidecadal Oscillation controls the impact of the North Atlantic Oscillation on North European climate, Environ. Res. Lett., 15, 104025, https://doi.org/10.1088/1748-9326/aba925, 2020.
Bouwman, L., Goldewijk, K. K., Van Der Hoek, K. W., Beusen, A. H. W., Van Vuuren, D. P., Willems, J., Rufino, M. C., and Stehfest, E.: Exploring global changes in nitrogen and phosphorus cycles in agriculture induced by livestock production over the 1900–2050 period, P. Natl. Acad. Sci. USA, 110, 20882, https://doi.org/10.1073/pnas.1012878108, 2013.
Brandt, J., Silver, J. D., Christensen, J. H., Andersen, M. S., Bønløkke, J. H., Sigsgaard, T., Geels, C., Gross, A., Hansen, A. B., Hansen, K. M., Hedegaard, G. B., Kaas, E., and Frohn, L. M.: Assessment of past, present and future health-cost externalities of air pollution in Europe and the contribution from international ship traffic using the EVA model system, Atmos. Chem. Phys., 13, 7747–7764, https://doi.org/10.5194/acp-13-7747-2013, 2013.
Broman, B., Hammarklint, T., Rannat, K., Soomere, T., and Valdmann, A.: Trends and extremes of wave fields in the north-eastern part of the Baltic Proper, Oceanologia, 48, 165–184, 2006.
Brown, J., Ferrians Jr., O. J., Heginbottom, J. A., and Melnikov, E. S.: Circum-Arctic map of permafrost and ground-ice conditions, U.S. Geological Survey, U.S.A., Report 45, https://doi.org/10.3133/cp45, 1997.
Brugger, K. A. and Pankratz, L.: Changes in the geometry and volume of rabots glaciär, sweden, 2003–2011: recent accelerated volume loss linked to more negative summer balances, Geogr. Ann. A, 97, 265–278, https://doi.org/10.1111/geoa.12062, 2015.
Brunner, L., Pendergrass, A. G., Lehner, F., Merrifield, A. L., Lorenz, R., and Knutti, R.: Reduced global warming from CMIP6 projections when weighting models by performance and independence, Earth Syst. Dynam., 11, 995–1012, https://doi.org/10.5194/esd-11-995-2020, 2020.
Brutemark, A., Engström-Öst, J., Vehmaa, A., and Gorokhova, E.: Growth, toxicity and oxidative stress of a cultured cyanobacterium (Dolichospermum sp.) under different CO2 pH and temperature conditions, Phycol. Res., 63, 56–63, https://doi.org/10.1111/pre.12075, 2015.
Buckley, M. W. and Marshall, J.: Observations, inferences, and mechanisms of the Atlantic Meridional Overturning Circulation: A review, Rev. Geophys., 54.1, 5–63, 2016.
Bülow, K., Dietrich, C., Elizalde, A., Gröger, M., Heinrich, H., Hüttl-Kabos, S., Klein, B., Mayer, B., Meier, H. E. M., and Mikolajewicz, U.: Comparison of three regional coupled ocean atmosphere models for the North Sea under today's and future climate conditions (KLIWAS Schriftenreihe; KLIWAS-27/2014), Bundesanstalt für Gewässerkunde, Koblenz, 265 pp., https://epic.awi.de/id/eprint/36453/ (last access: 15 February 2022), 2014.
Burchard, H., Bolding, K., Feistel, R., Gräwe, U., Klingbeil, K., MacCready, P., Mohrholz, V., Umlauf, L., and van der Lee, E. M.: The Knudsen theorem and the Total Exchange Flow analysis framework applied to the Baltic Sea, Prog. Oceanogr., 165, 268–286, https://doi.org/10.1016/j.pocean.2018.04.004, 2018.
Byrne, M. P. and O'Gorman, P. A.: Trends in continental temperature and humidity directly linked to ocean warming, P. Natl. Acad. Sci. USA, 115, 4863, https://doi.org/10.1073/pnas.1722312115, 2018.
Caballero-Alfonso, A. M., Carstensen, J., and Conley, D. J.: Biogeochemical and environmental drivers of coastal hypoxia, J. Marine Syst., 141, 190–199, https://doi.org/10.1016/j.jmarsys.2014.04.008, 2015.
Cardell, M. F., Amengual, A., Romero, R., and Ramis, C.: Future extremes of temperature and precipitation in Europe derived from a combination of dynamical and statistical approaches, Int. J. Climatol., 40, 4800–4827, https://doi.org/10.1002/joc.6490, 2020.
Carstensen, J., Andersen, J. H., Gustafsson, B. G., and Conley, D. J.: Deoxygenation of the Baltic Sea during the last century, P. Natl. Acad. Sci. USA, 111, 5628–5633, https://doi.org/10.1073/pnas.1323156111, 2014a.
Carstensen, J., Conley, D. J., Bonsdorff, E., Gustafsson, B. G., Hietanen, S., Janas, U., Jilbert, T., Maximov, A., Norkko, A., Norkko, J., Reed, D. C., Slomp, C. P., Timmermann, K., and Voss, M.: Hypoxia in the Baltic Sea: Biogeochemical cycles, benthic fauna, and management, Ambio, 43, 26–36, https://doi.org/10.1007/s13280-013-0474-7, 2014b.
Carstensen, J., Chierici, M., Gustafsson, B. G., and Gustafsson, E.: Long-Term and Seasonal Trends in Estuarine and Coastal Carbonate Systems, Global Biogeochem. Cy., 32, 497–513, https://doi.org/10.1002/2017gb005781, 2018.
Carstensen, J. and Conley, D. J.: Baltic Sea Hypoxia Takes Many Shapes and Sizes, Limnol. Oceanogr. Bull., 28, 125–129, https://doi.org/10.1002/lob.10350, 2019.
Carstensen, J. and Duarte, C. M.: Drivers of pH Variability in Coastal Ecosystems, Environ. Sci. Technol., 53, 4020–4029, https://doi.org/10.1021/acs.est.8b03655, 2019.
Carstensen, J., Conley, D. J., Almroth-Rosell, E., Asmala, E., Bonsdorff, E., Fleming-Lehtinen, V., Gustafsson, B. G., Gustafsson, C., Heiskanen, A.-S., Janas, U., Norkko, A., Slomp, C., Villnäs, A., Voss, M., and Zilius, M.: Factors regulating the coastal nutrient filter in the Baltic Sea, Ambio, 49, 1194–1210, https://doi.org/10.1007/s13280-019-01282-y, 2020.
Casanueva, A., Rodríguez-Puebla, C., Frías, M. D., and González-Reviriego, N.: Variability of extreme precipitation over Europe and its relationships with teleconnection patterns, Hydrol. Earth Syst. Sci., 18, 709–725, https://doi.org/10.5194/hess-18-709-2014, 2014.
Casini, M., Lövgren, J., Hjelm, J., Cardinale, M., Molinero, J.-C., and Kornilovs, G.: Multi-level trophic cascades in a heavily exploited open marine ecosystem, P. Roy. Soc. B-Biol. Sci., 275, 1793–1801, https://doi.org/10.1098/rspb.2007.1752 2008.
Casini, M., Kornilovs, G., Cardinale, M., Möllmann, C., Grygiel, W., Jonsson, P., Raid, T., Flinkman, J., and Feldman, V.: Spatial and temporal density dependence regulates the condition of central Baltic Sea clupeids: compelling evidence using an extensive international acoustic survey, Popul. Ecol., 53, 511–523, https://doi.org/10.1007/s10144-011-0269-2, 2011.
Casini, M., Käll, F., Hansson, M., Plikshs, M., Baranova, T., Karlsson, O., Lundström, K., Neuenfeldt, S., Gårdmark, A., and Hjelm, J.: Hypoxic areas, density-dependence and food limitation drive the body condition of a heavily exploited marine fish predator, Roy. Soc. Open Sci., 3, 160416, https://doi.org/10.1098/rsos.160416, 2016.
Cattiaux, J. and Cassou, C.: Opposite CMIP3/CMIP5 trends in the wintertime Northern Annular Mode explained by combined local sea ice and remote tropical influences, Geophys. Res. Lett., 40, 3682–3687, https://doi.org/10.1002/grl.50643, 2013.
Cattiaux, J., Douville, H., and Peings, Y.: European temperatures in CMIP5: origins of present-day biases and future uncertainties, Clim. Dyn., 41, 2889–2907, https://doi.org/10.1007/s00382-013-1731-y, 2013.
Ceppi, P. and Hartmann, D. L.: Connections Between Clouds, Radiation, and Midlatitude Dynamics: a Review, Curr. Clim. Chang. Rep., 1, 94–102, https://doi.org/10.1007/s40641-015-0010-x, 2015.
Chadburn, S. E., Burke, E. J., Cox, P. M., Friedlingstein, P., Hugelius, G., and Westermann, S.: An observation-based constraint on permafrost loss as a function of global warming, Nat. Clim. Change, 7, 340–344, https://doi.org/10.1038/nclimate3262, 2017.
Chang, E. K. M., Guo, Y., and Xia, X.: CMIP5 multimodel ensemble projection of storm track change under global warming, J. Geophys. Res.-Atmos., 117, D23118, https://doi.org/10.1029/2012JD018578, 2012.
Chang, E. K. M., Ma, C.-G., Zheng, C., and Yau, A. M. W.: Observed and projected decrease in Northern Hemisphere extratropical cyclone activity in summer and its impacts on maximum temperature, Geophys. Res. Lett., 43, 2200–2208, https://doi.org/10.1002/2016GL068172, 2016.
Chang, E. K. M. and Yau, A. M. W.: Northern Hemisphere winter storm track trends since 1959 derived from multiple reanalysis datasets, Clim. Dyn., 47, 1435–1454, https://doi.org/10.1007/s00382-015-2911-8, 2016.
Chen, D., Zhang, P., Seftigen, K., Ou, T., Giese, M., and Barthel, R.: Hydroclimate changes over Sweden in the twentieth and twenty-first centuries: a millennium perspective, Geogr. Ann. A, 1–29, https://doi.org/10.1080/04353676.2020.1841410, 2020.
Christensen, J. H., Larsen, M. A. D., Christensen, O. B., Drews, M., and Stendel, M.: Robustness of European climate projections from dynamical downscaling, Clim. Dyn., 53, 4857–4869, https://doi.org/10.1007/s00382-019-04831-z, 2019.
Christensen, O. B. and Kjellström, E.: Projections for Temperature, Precipitation, Wind, and Snow in the Baltic Sea Region until 2100, Oxford Research Encyclopedia of Climate Science, Oxford University Press, https://doi.org/10.1093/acrefore/9780190228620.013.695, 2018.
Christensen, O. B., Kjellström, E., Dieterich, C., Gröger, M., and Meier, H. E. M.: Atmospheric regional climate projections for the Baltic Sea region until 2100, Earth Syst. Dynam., 13, 133–157, https://doi.org/10.5194/esd-13-133-2022, 2022.
Chust, G., Allen, J. I., Bopp, L., Schrum, C., Holt, J., Tsiaras, K., Zavatarelli, M., Chifflet, M., Cannaby, H., Dadou, I., Daewel, U., Wakelin, S. L., Machu, E., Pushpadas, D., Butenschon, M., Artioli, Y., Petihakis, G., Smith, C., Garçon, V., Goubanova, K., Le Vu, B., Fach, B. A., Salihoglu, B., Clementi, E., and Irigoien, X.: Biomass changes and trophic amplification of plankton in a warmer ocean, Global Change Biol., 20, 2124–2139, https://doi.org/10.1111/gcb.12562, 2014.
Ciasto, L. M., Li, C., Wettstein, J. J., and Kvamstø, N. G.: North Atlantic Storm-Track Sensitivity to Projected Sea Surface Temperature: Local versus Remote Influences, J. Climate, 29, 6973–6991, https://doi.org/10.1175/jcli-d-15-0860.1, 2016.
Claremar, B., Haglund, K., and Rutgersson, A.: Ship emissions and the use of current air cleaning technology: contributions to air pollution and acidification in the Baltic Sea, Earth Syst. Dynam., 8, 901–919, https://doi.org/10.5194/esd-8-901-2017, 2017.
Clausen, K. K., Stjernholm, M., and Clausen, P.: Grazing management can counteract the impacts of climate change-induced sea level rise on salt marsh-dependent waterbirds, J. Appl. Ecol., 50, 528–537, https://doi.org/10.1111/1365-2664.12043, 2013.
Clausen, K. K. and Clausen, P.: Forecasting future drowning of coastal waterbird habitats reveals a major conservation concern, Biol. Conserv., 171, 177–185, https://doi.org/10.1016/j.biocon.2014.01.033, 2014.
Colette, A., Bessagnet, B., Vautard, R., Szopa, S., Rao, S., Schucht, S., Klimont, Z., Menut, L., Clain, G., Meleux, F., Curci, G., and Rouïl, L.: European atmosphere in 2050, a regional air quality and climate perspective under CMIP5 scenarios, Atmos. Chem. Phys., 13, 7451–7471, https://doi.org/10.5194/acp-13-7451-2013, 2013.
Colette, A., Andersson, C., Baklanov, A., Bessagnet, B., Brandt, J., Christensen, J. H., Doherty, R., Engardt, M., Geels, C., Giannakopoulos, C., Hedegaard, G. B., Katragkou, E., Langner, J., Lei, H., Manders, A., Melas, D., Meleux, F., Rouïl, L., Sofiev, M., Soares, J., Stevenson, D. S., Tombrou-Tzella, M., Varotsos, K. V., and Young, P.: Is the ozone climate penalty robust in Europe?, Environ. Res. Lett., 10, 084015, https://doi.org/10.1088/1748-9326/10/8/084015, 2015.
Colette, A. and Rouïl, L.: Air Quality Trends in Europe: 2000–2017, Assessment for surface SO2, NO2, Ozone, PM10 and PM2.5, European Topic Centre on Air pollution, transport, noise and industrial pollution, Kjeller, Norway, Eionet Report – ETC/ATNI 2019/16, 36 pp., 2020.
Collins, M., Knutti, R., Arblaster, J., Dufresne, J.-L., Fichefet, T., Friedlingstein, P., Gao, X., Gutowski, W. J., Johns, T., Krinner, G., Shongwe, M., Tebaldi, C., Weaver, A. J., Wehner, M. F., Allen, M. R., Andrews, T., Beyerle, U., Bitz, C. M., Bony, S., and Booth, B. B. B.: Long-term climate change: projections, commitments and irreversibility, in: IPCC Chapter 12, Climate Change 2013: The Physical Science Basis, IPCC Working Group I Contribution to IPCC AR5, Cambridge University Press, Cambridge, UK and New York, USA, 1029–1136, https://www.ipcc.ch/report/ar5/wg1/ (last access: 15 February 2022), 2013.
Conley, D. J., Humborg, C., Rahm, L., Savchuk, O. P., and Wulff, F.: Hypoxia in the Baltic Sea and basin-scale changes in phosphorus biogeochemistry, Environ. Sci. Technol., 36, 5315–5320, https://doi.org/10.1021/es025763w, 2002.
Conley, D. J., Carstensen, J., Aigars, J., Axe, P., Bonsdorff, E., Eremina, T., Haahti, B.-M., Humborg, C., Jonsson, P., Kotta, J., Lännegren, C., Larsson, U., Maximov, A., Medina, M. R., Lysiak-Pastuszak, E., Remeikaitė-Nikienė, N., Walve, J., Wilhelms, S., and Zillén, L.: Hypoxia Is Increasing in the Coastal Zone of the Baltic Sea, Environ. Sci. Technol., 45, 6777–6783, https://doi.org/10.1021/es201212r, 2011.
Cornes, R. C., van der Schrier, G., and Squintu, A. A.: A reappraisal of the thermal growing season length across Europe, Int. J. Climatol., 39, 1787–1795, https://doi.org/10.1002/joc.5913, 2019.
Coppola, E., Nogherotto, R., Ciarlo', J. M., Giorgi, F., van Meijgaard, E., Kadygrov, N., Iles, C., Corre, L., Sandstad, M., Somot, S., Nabat, P., Vautard, R., Levavasseur, G., Schwingshackl, C., Sillmann, J., Kjellström, E., Nikulin, G., Aalbers, E., Lenderink, G., Christensen, O. B., Boberg, F., Sørland, S. L., Demory, M.-E., Bülow, K., Teichmann, C., Warrach-Sagi, K., and Wulfmeyer, V.: Assessment of the European Climate Projections as Simulated by the Large EURO-CORDEX Regional and Global Climate Model Ensemble, J. Geophys. Res.-Atmos., 126, e2019JD032356, https://doi.org/10.1029/2019JD032356, 2021.
Coumou, D., Lehmann, J., and Beckmann, J.: The weakening summer circulation in the Northern Hemisphere mid-latitudes, Science, 348, 324, https://doi.org/10.1126/science.1261768, 2015.
Cyberski, J., Wróblewski, A., and Stewart, J.: Riverine water inflows and the Baltic Sea water volume 1901–1990, Hydrol. Earth Syst. Sci., 4, 1–11, https://doi.org/10.5194/hess-4-1-2000, 2000.
Defeo, O., McLachlan, A., Schoeman, D. S., Schlacher, T. A., Dugan, J., Jones, A., Lastra, M., and Scapini, F.: Threats to sandy beach ecosystems: A review, Estuar. Coast. Shelf Sci., 81, 1–12, https://doi.org/10.1016/j.ecss.2008.09.022, 2009.
Deng, J., Zhang, W., Harff, J., Schneider, R., Dudzinska-Nowak, J., Terefenko, P., Giza, A., and Furmanczyk, K.: A numerical approach for approximating the historical morphology of wave-dominated coasts – A case study of the Pomeranian Bight, southern Baltic Sea, Geomorphology, 204, 425–443, https://doi.org/10.1016/j.geomorph.2013.08.023, 2014.
Deng, J., Harff, J., Schimanke, S., and Meier, H. E. M.: A method for assessing the coastline recession due to the sea level rise by assuming stationary wind-wave climate, Oceanol. Hydrobiol. Stud., 44, 362–380, https://doi.org/10.1515/ohs-2015-0035, 2015.
Deng, J., Wu, J., Zhang, W., Dudzinska-Nowak, J., and Harff, J.: Characterising the relaxation distance of nearshore submarine morphology: A southern Baltic Sea case study, Geomorphology, 327, 365–376, https://doi.org/10.1016/j.geomorph.2018.11.018, 2019.
Deser, C.: On the teleconnectivity of the “Arctic Oscillation”. Geophys. Res. Lett., 27, 779–782, https://doi.org/10.1029/1999GL010945, 2000.
Deser, C., Hurrell, J. W., and Phillips, A. S.: The role of the North Atlantic Oscillation in European climate projections, Clim. Dyn., 49, 3141–3157, https://doi.org/10.1007/s00382-016-3502-z, 2017.
Dethloff, K., Rinke, A., Benkel, A., Køltzow, M., Sokolova, E., Kumar Saha, S., Handorf, D., Dorn, W., Rockel, B., von Storch, H., Haugen, J. E., Røed, L. P., Roeckner, E., Christensen, J. H., and Stendel, M.: A dynamical link between the Arctic and the global climate system, Geophys. Res. Lett., 33, L03703, https://doi.org/10.1029/2005GL025245, 2006.
Devictor, V., van Swaay, C., Brereton, T., Brotons, L., Chamberlain, D., Heliölä, J., Herrando, S., Julliard, R., Kuussaari, M., Lindström, Å., Reif, J., Roy, D. B., Schweiger, O., Settele, J., Stefanescu, C., Van Strien, A., Van Turnhout, C., Vermouzek, Z., WallisDeVries, M., Wynhoff, I., and Jiguet, F.: Differences in the climatic debts of birds and butterflies at a continental scale, Nat. Clim. Change, 2, 121–124, https://doi.org/10.1038/nclimate1347, 2012.
Dieterich, C., Schimanke, S., Wang, S., Väli, G., Liu, Y., Hordoir, R., Höglund, A., and Meier, H. E. M.: Evaluation of the SMHI coupled atmosphere-ice-ocean model RCA4-NEMO, Oceanografi Nr. 47, SMHI, Norrköping, Sweden, 80 pp., 2013.
Dieterich, C., Wang, S., Schimanke, S., Gröger, M., Klein, B., Hordoir, R., Samuelsson, P., Liu, Y., Axell, L., and Höglund, A.: Surface heat budget over the North Sea in climate change simulations, Atmosphere, 10, 272, https://doi.org/10.3390/atmos10050272, 2019.
Dippner, J. W., Vuorinen, I., Daunys, D., Flinkman, J., Halkka, A., Köster, F. W., Lehikoinen, E., MacKenzie, B. R., Möllmann, C., Møhlenberg, F., Olenin, S., Schiedek, D., Skov, H., and Wasmund, N.: Climate-related Marine Ecosystem Change, in: Assessment of Climate Change for the Baltic Sea Basin, Springer Berlin Heidelberg, Berlin, Heidelberg, 309–377, https://doi.org/10.1007/978-3-540-72786-6_5, 2008.
Dippner, J. W., Fründt, B., and Hammer, C.: Lake or Sea? The Unknown Future of Central Baltic Sea Herring, Front. Ecol. Evol., 7, 143, https://doi.org/10.3389/fevo.2019.00143, 2019.
Doherty, R. M., Heal, M. R., and O'Connor, F. M.: Climate change impacts on human health over Europe through its effect on air quality, Environ. Health-Glob., 16, 118, https://doi.org/10.1186/s12940-017-0325-2, 2017.
Doney, S. C., Fabry, V. J., Feely, R. A., and Kleypas, J. A.: Ocean acidification: the other CO2 problem, Annu. Rev. Mar. Sci., 1, 169–192, https://doi.org/10.1146/annurev.marine.010908.163834, 2009.
Dong, B., Sutton, R. T., and Shaffrey, L.: Understanding the rapid summer warming and changes in temperature extremes since the mid-1990s over Western Europe, Clim. Dyn., 48, 1537–1554, https://doi.org/10.1007/s00382-016-3158-8, 2017.
Donnelly, C., Yang, W., and Dahné, J.: River discharge to the Baltic Sea in a future climate, Clim. Change, 122, 157–170, https://doi.org/10.1007/s10584-013-0941-y, 2014.
Donnelly, C., Greuell, W., Andersson, J., Gerten, D., Pisacane, G., Roudier, P., and Ludwig, F.: Impacts of climate change on European hydrology at 1.5, 2 and 3 degrees mean global warming above preindustrial level, Clim. Change, 143, 13–26, https://doi.org/10.1007/s10584-017-1971-7, 2017.
Dreier, N., Nehlsen, E., Fröhle, P., Rechid, D., Bouwer, L. M., and Pfeifer, S.: Future Changes in Wave Conditions at the German Baltic Sea Coast Based on a Hybrid Approach Using an Ensemble of Regional Climate Change Projections, Water, 13, 167, https://doi.org/10.3390/w13020167, 2021.
Du, J., Shen, J., Park, K., Wang, Y. P., and Yu, X.: Worsened physical condition due to climate change contributes to the increasing hypoxia in Chesapeake Bay, Sci. Total Environ., 630, 707–717, https://doi.org/10.1016/j.scitotenv.2018.02.265, 2018.
Duarte, C. M., Hendriks, I. E., Moore, T. S., Olsen, Y. S., Steckbauer, A., Ramajo, L., Carstensen, J., Trotter, J. A., and McCulloch, M.: Is Ocean Acidification an Open-Ocean Syndrome? Understanding Anthropogenic Impacts on Seawater pH, Estuar. Coast., 36, 221–236, https://doi.org/10.1007/s12237-013-9594-3, 2013.
Ducklow, H. W., Morán, X. A. G., and Murray, A. E.: Bacteria in the Greenhouse: Marine Microbes and Climate Change, in: Environ. Microbiol., edited by: Mitchell, R. and Gu, J. D., Wiley-Blackwell, Hoboken, N. J., USA, 1–31, https://doi.org/10.1002/9780470495117.ch1, 2009.
Dudzińska-Nowak, J.: Morphodynamic Processes of the Swina Gate Coastal Zone Development (Southern Baltic Sea), in: Coastline Changes of the Baltic Sea from South to East: Past and Future Projection, edited by: Harff, J., Furmańczyk, K., and von Storch, H., Springer International Publishing, Cham, 219–255, https://doi.org/10.1007/978-3-319-49894-2_11, 2017.
Dutheil, C., Meier, H. E. M., Gröger, M., and Börgel, F.: Understanding past and future sea surface temperature trends in the Baltic Sea, Clim. Dyn., https://doi.org/10.1007/s00382-021-06084-1, in press, 2021.
Dyrrdal, A. V., Saloranta, T., Skaugen, T., and Stranden, H. B.: Changes in snow depth in Norway during the period 1961–2010, Hydrol. Res., 44, 169–179, https://doi.org/10.2166/nh.2012.064, 2012.
Easterling, D. R., Kunkel, K. E., Wehner, M. F., and Sun, L.: Detection and attribution of climate extremes in the observed record, Weather. Clim. Extremes, 11, 17–27, https://doi.org/10.1016/j.wace.2016.01.001, 2016.
EEA: European Environment Agency, maximum annual extent of ice cover in the Baltic Sea since 1720 provided by Finnish Meteorological Institute, EEA [data set], https://www.eea.europa.eu/data-and-maps/daviz/maximum-extent-of-ice-cover-3#tab-chart_1, last access: 17 February 2022.
Eero, M., Andersson, H. C., Almroth-Rosell, E., and MacKenzie, B. R.: Has eutrophication promoted forage fish production in the Baltic Sea?, Ambio, 45, 649–660, https://doi.org/10.1007/s13280-016-0788-3, 2016.
Efremova, T., Palshin, N., and Zdorovennov, R.: Long-term characteristics of ice phenology in Karelian lakes, Est. J. Earth Sci., 62, 33–41, https://doi.org/10.3176/earth.2013.04, 2013.
Eggert, A. and Schneider, B.: A nitrogen source in spring in the surface mixed-layer of the Baltic Sea: evidence from total nitrogen and total phosphorus data, J. Marine Syst., 148, 39–47, https://doi.org/10.1016/j.jmarsys.2015.01.005, 2015.
Ehrnsten, E., Bauer, B., and Gustafsson, B. G.: Combined Effects of Environmental Drivers on Marine Trophic Groups – A Systematic Model Comparison, Front. Mar. Sci., 6, 492, https://doi.org/10.3389/fmars.2019.00492, 2019.
Ehrnsten, E., Norkko, A., Müller-Karulis, B., Gustafsson, E., and Gustafsson, B. G.: The meagre future of benthic fauna in a coastal sea – Benthic responses to recovery from eutrophication in a changing climate, Global Change Biol., 26, 2235–2250, https://doi.org/10.1111/gcb.15014, 2020.
Eichner, M., Rost, B., and Kranz, S. A.: Diversity of ocean acidification effects on marine N2 fixers, J. Exp. Mar. Biol. Ecol., 457, 199–207, https://doi.org/10.1016/j.jembe.2014.04.015, 2014.
Eilola, K., Rosell, E. A., Dieterich, C., Fransner, F., Höglund, A., and Meier, H. E. M.: Modeling Nutrient Transports and Exchanges of Nutrients Between Shallow Regions and the Open Baltic Sea in Present and Future Climate, Ambio, 41, 586–599, https://doi.org/10.1007/s13280-012-0322-1, 2012.
Eilola, K., Mårtensson, S., and Meier, H. E. M.: Modeling the impact of reduced sea ice cover in future climate on the Baltic Sea biogeochemistry, Geophys. Res. Lett., 40, 149–154, https://doi.org/10.1029/2012GL054375, 2013.
Eilola, K., Almroth-Rosell, E., and Meier, H. E. M.: Impact of saltwater inflows on phosphorus cycling and eutrophication in the Baltic Sea: a 3D model study, Tellus A, 66, 23985, https://doi.org/10.3402/tellusa.v66.23985, 2014.
Ekman, M.: The world's longest continuous series of sea level observations, Pure Appl. Geophys., 127, 73–77, 1988.
Ekman, M.: The world's longest sea level series and a winter oscillation index for Northern Europe, 1774–2000, Summer Institute for Historical Geophysics, Åland Islands, 31 pp., https://www.historicalgeophysics.ax/sp/12.pdf (last access: 13 August 2021), 2003.
Emeis, K.-C., van Beusekom, J., Callies, U., Ebinghaus, R., Kannen, A., Kraus, G., Kröncke, I., Lenhart, H., Lorkowski, I., Matthias, V., Möllmann, C., Pätsch, J., Scharfe, M., Thomas, H., Weisse, R., and Zorita, E.: The North Sea – A shelf sea in the Anthropocene, J. Marine Syst., 141, 18–33, https://doi.org/10.1016/j.jmarsys.2014.03.012, 2015.
Emeis, K., Christiansen, C., Edelvang, K., Jähmlich, S., Kozuch, J., Laima, M., Leipe, T., Löffler, A., Lund-Hansen, L. C., Miltner, A., Pazdro, K., Pempkowiak, J., Pollehne, F., Shimmield, T., Voss, M., and Witt, G.: Material transport from the near shore to the basinal environment in the southern Baltic Sea: II: Synthesis of data on origin and properties of material, J. Marine Syst., 35, 151–168, https://doi.org/10.1016/S0924-7963(02)00127-6, 2002.
Enfield, D. B., Mestas-Nuñez, A. M., and Trimble, P. J.: The Atlantic Multidecadal Oscillation and its relation to rainfall and river flows in the continental U.S, Geophys. Res. Lett., 28, 2077–2080, https://doi.org/10.1029/2000gl012745, 2001.
E-OBS: Copernicus Climate Change Service, precipitation data, E-OBS [data set], http://surfobs.climate.copernicus.eu/dataaccess/access_eobs.php#datafiles, last access: 17 February 2022.
Estilow, T. W., Young, A. H., and Robinson, D. A.: A long-term Northern Hemisphere snow cover extent data record for climate studies and monitoring, Earth Syst. Sci. Data, 7, 137–142, https://doi.org/10.5194/essd-7-137-2015, 2015.
EURO-CORDEX: EURO-CORDEX data archive available through the Earth System Grid Federation (ESGF) network at Deutsche Klimarechenzentrum (DKRZ), http://esgf-data.dkrz.de, last access: 14 January 2022.
European Commission: DIRECTIVE 98/70/EC OF THE EUROPEAN PARLIAMENT AND OF THE COUNCIL of 13 October 1998 relating to the quality of petrol and diesel fuels and amending Council Directive 93/12/EEC, 1998.
European Commission: DIRECTIVE (EU) 2018/2001 OF THE EUROPEAN PARLIAMENT AND OF THE COUNCIL of 11 December 2018 on the promotion of the use of energy from renewable sources (recast) (Text with EEA relevance), https://eur-lex.europa.eu/legal-content/EN/TXT/?uri=uriserv:OJ.L_.2018.328.01.0082.01.ENG (last access: 16 February 2022), 2018a.
European Commission: REGULATION (EU) 2018/1999 OF THE EUROPEAN PARLIAMENT AND OF THE COUNCIL of 11 December 2018 on the Governance of the Energy Union and Climate Action, amending Regulations (EC) No. 663/2009 and (EC) No. 715/2009 of the European Parliament and of the Council, Directives 94/22/EC, 98/70/EC, 2009/31/EC, 2009/73/EC, 2010/31/EU, 2012/27/EU and 2013/30/EU of the European Parliament and of the Council, Council Directives 2009/119/EC and (EU) 2015/652 and repealing Regulation (EU) No. 525/2013 of the European Parliament and of the Council (Text with EEA relevance), https://eur-lex.europa.eu/legal-content/EN/TXT/?toc=OJ:L:2018:328:TOC&uri=uriserv:OJ.L_.2018.328.01.0001.01.ENG (last access: 16 February 2022), 2018b.
European Environment Agency: Air quality in Europe – 2019 report, Publications Office of the European Union, Luxemburg, EEA Report No. 10/2019, 99 pp., https://doi.org/10.2800/822355, 2019a.
European Environment Agency: Heavy precipitation in Europe, Indicator Assessment CLIM 004, IND-92-en, https://www.eea.europa.eu/ds_resolveuid/998fbe113cc84e9a978becd87079f874 (last access: 24 March 2021), 2019b.
European Environment Agency: Global and European sea-level rise, https://www.eea.europa.eu/data-and-maps/indicators/sea-level-rise-6/assessment (last access: 8 December 2020), 2019c.
Eyring, V., Bony, S., Meehl, G. A., Senior, C. A., Stevens, B., Stouffer, R. J., and Taylor, K. E.: Overview of the Coupled Model Intercomparison Project Phase 6 (CMIP6) experimental design and organization, Geosci. Model Dev., 9, 1937–1958, https://doi.org/10.5194/gmd-9-1937-2016, 2016.
Fagerli, H., Tsyro, S., Jonson, J. E., Nyíri, Á., Gauss, M., Simpson, D., Wind, P., Benedictow, A., Valdebenito, A., Klein, H., Schulz, M., Mortier, A., Aas, W., Hjellbrekke, A.-G., Solberg, S., Platt, S. M., Yttri, K. E., Rud, R. O., Tørseth, K., Mareckova, K., Matthews, B., Tista, M., Wankmüller, R., Posch, M., Bergström, R., Lazzeri, P., Pandolfi, M., Luoma, K., Aurela, M., Lenartz, F., Bergmans, B., Pittavino, S., and Tombolato, I.: Transboundary particulate matter, photo-oxidants, acidifying and eutrophying components, Norwegian Meteorological Institute, Oslo, Norway, EMEP Status Report 1/2018, 204 pp., http://emep.int/publ/reports/2018/EMEP_Status_Report_1_2018.pdf (last access: 16 FEbruary 2022), 2018.
Farinotti, D., Huss, M., Fürst, J. J., Landmann, J., Machguth, H., Maussion, F., and Pandit, A.: A consensus estimate for the ice thickness distribution of all glaciers on Earth, Nat. Geosci., 12, 168–173, https://doi.org/10.1038/s41561-019-0300-3, 2019.
Feistel, R., Nausch, G., and Wasmund, N.: State and evolution of the Baltic Sea, 1952–2005: a detailed 50-year survey of meteorology and climate, physics, chemistry, biology, and marine environment, John Wiley & Sons, Hoboken, NJ, https://doi.org/10.1002/9780470283134, 2008.
Feldstein, S. B.: The Recent Trend and Variance Increase of the Annular Mode, J. Climate, 15, 88–94, https://doi.org/10.1175/1520-0442(2002)015<0088:Trtavi>2.0.Co;2, 2002.
Ferreira, J. A. and Soares, C. G.: Modelling distributions of significant wave height, Coast. Eng., 40, 361–374, 2000.
Feser, F., Rockel, B., von Storch, H., Winterfeldt, J., and Zahn, M.: Regional Climate Models Add Value to Global Model Data: A Review and Selected Examples, B. Am. Meteorol. Soc., 92, 1181–1192, https://doi.org/10.1175/2011BAMS3061.1, 2011.
Feser, F., Barcikowska, M., Krueger, O., Schenk, F., Weisse, R., and Xia, L.: Storminess over the North Atlantic and northwestern Europe – A review, Q. J. Roy. Meteor. Soc., 141, 350–382, https://doi.org/10.1002/qj.2364, 2015.
Figueroa, D., Capo, E., Lindh, M. V., Rowe, O. F., Paczkowska, J., Pinhassi, J., and Andersson, A.: Terrestrial dissolved organic matter inflow drives temporal dynamics of the bacterial community of a subarctic estuary (northern Baltic Sea), Environ. Microbiol., 23, 4200–4213, https://doi.org/10.1111/1462-2920.15597, 2021.
Filazzola, A., Blagrave, K., Imrit, M. A., and Sharma, S.: Climate Change Drives Increases in Extreme Events for Lake Ice in the Northern Hemisphere, Geophys. Res. Lett., 47, e2020GL089608, https://doi.org/10.1029/2020GL089608, 2020.
Fischer-Bruns, I., Storch, H. v., González-Rouco, J. F., and Zorita, E.: Modelling the variability of midlatitude storm activity on decadal to century time scales, Clim. Dyn., 25, 461–476, https://doi.org/10.1007/s00382-005-0036-1, 2005.
Fleming, Z. L., Doherty, R. M., von Schneidemesser, E., Malley, C. S., Cooper, O. R., Pinto, J. P., Colette, A., Xu, X., Simpson, D., Schultz, M. G., Lefohn, A. S., Hamad, S., Moolla, R., Solberg, S., and Feng, Z.: Tropospheric Ozone Assessment Report: Present-day ozone distribution and trends relevant to human health, Elementa-Sci. Anthrop., 6, 12, https://doi.org/10.1525/elementa.273, 2018.
FMI: Finnish Meteorological Institute (FMI), level ice thickness and length of the ice season data available from the ice service at FMI upon request, Finnish Meteorological Institute [data set], https://en.ilmatieteenlaitos.fi/ice-conditions, last access: 6 March 2022.
Fontrodona Bach, A., van der Schrier, G., Melsen, L. A., Klein Tank, A. M. G., and Teuling, A. J.: Widespread and Accelerated Decrease of Observed Mean and Extreme Snow Depth Over Europe, Geophys. Res. Lett., 45, 12312–12319, https://doi.org/10.1029/2018GL079799, 2018.
Forster, P. M., Maycock, A. C., McKenna, C. M., and Smith, C. J.: Latest climate models confirm need for urgent mitigation, Nat. Clim. Change, 10, 7–10, https://doi.org/10.1038/s41558-019-0660-0, 2020.
Fox, A. D., Jónsson, J. E., Aarvak, T., Bregnballe, T., Christensen, T. K., Clausen, K. K., Clausen, P., Dalby, L., Holm, T. E., Pavón-Jordan, D., Laursen, K., Lehikoinen, A., Lorentsen, S.-H., Møller, A. P., Nordström, M., Öst, M., Söderquist, P., and Roland Therkildsen, O.: Current and Potential Threats to Nordic Duck Populations – A Horizon Scanning Exercise, Annal. Zool., 52, 193–220, 2015.
Fox, A. D., Nielsen, R. D., and Petersen, I. K.: Climate-change not only threatens bird populations but also challenges our ability to monitor them, Ibis, 161, 467–474, https://doi.org/10.1111/ibi.12675, 2019.
Frajka-Williams, E., Beaulieu, C., and Duchez, A.: Emerging negative Atlantic Multidecadal Oscillation index in spite of warm subtropics, Sci. Rep.-UK, 7, 11224, https://doi.org/10.1038/s41598-017-11046-x, 2017.
Francis, J. A.,and Vavrus, S. J.: Evidence linking Arctic amplification to extreme weather in mid-latitudes, Geophys. Res. Lett., 39, L06801, https://doi.org/10.1029/2012GL051000, 2012.
Francis, J. A. and Vavrus, S. J.: Evidence for a wavier jet stream in response to rapid Arctic warming, Environ. Res. Lett., 10, 014005, https://doi.org/10.1088/1748-9326/10/1/014005, 2015.
Fransner, F., Gustafsson, E., Tedesco, L., Vichi, M., Hordoir, R., Roquet, F., Spilling, K., Kuznetsov, I., Eilola, K., Mörth, C.-M., Humborg, C., and Nycander, J.: Non-Redfieldian Dynamics Explain Seasonal pCO2 Drawdown in the Gulf of Bothnia, J. Geophys. Res.-Oceans, 123, 166–188, https://doi.org/10.1002/2017JC013019, 2018.
Friedland, R., Neumann, T., and Schernewski, G.: Climate change and the Baltic Sea action plan: model simulations on the future of the western Baltic Sea, J. Mar. Syst., 105–108, 175–186, https://doi.org/10.1016/j.jmarsys.2012.08.002, 2012.
Friedlingstein, P., O'Sullivan, M., Jones, M. W., Andrew, R. M., Hauck, J., Olsen, A., Peters, G. P., Peters, W., Pongratz, J., Sitch, S., Le Quéré, C., Canadell, J. G., Ciais, P., Jackson, R. B., Alin, S., Aragão, L. E. O. C., Arneth, A., Arora, V., Bates, N. R., Becker, M., Benoit-Cattin, A., Bittig, H. C., Bopp, L., Bultan, S., Chandra, N., Chevallier, F., Chini, L. P., Evans, W., Florentie, L., Forster, P. M., Gasser, T., Gehlen, M., Gilfillan, D., Gkritzalis, T., Gregor, L., Gruber, N., Harris, I., Hartung, K., Haverd, V., Houghton, R. A., Ilyina, T., Jain, A. K., Joetzjer, E., Kadono, K., Kato, E., Kitidis, V., Korsbakken, J. I., Landschützer, P., Lefèvre, N., Lenton, A., Lienert, S., Liu, Z., Lombardozzi, D., Marland, G., Metzl, N., Munro, D. R., Nabel, J. E. M. S., Nakaoka, S.-I., Niwa, Y., O'Brien, K., Ono, T., Palmer, P. I., Pierrot, D., Poulter, B., Resplandy, L., Robertson, E., Rödenbeck, C., Schwinger, J., Séférian, R., Skjelvan, I., Smith, A. J. P., Sutton, A. J., Tanhua, T., Tans, P. P., Tian, H., Tilbrook, B., van der Werf, G., Vuichard, N., Walker, A. P., Wanninkhof, R., Watson, A. J., Willis, D., Wiltshire, A. J., Yuan, W., Yue, X., and Zaehle, S.: Global Carbon Budget 2020, Earth Syst. Sci. Data, 12, 3269–3340, https://doi.org/10.5194/essd-12-3269-2020, 2020.
Frommel, A. Y., Schubert, A., Piatkowski, U., and Clemmesen, C.: Egg and early larval stages of Baltic cod, Gadus morhua, are robust to high levels of ocean acidification, Mar. Biol., 160, 1825–1834, https://doi.org/10.1007/s00227-011-1876-3, 2013.
Fronzek, S., Luoto, M., and Carter, T. R.: Potential effect of climate change on the distribution of palsa mires in subarctic Fennoscandia, Clim. Res., 32, 1–12, https://doi.org/10.3354/cr032001, 2006.
Fronzek, S. and Carter, T. R.: Assessing uncertainties in climate change impacts on resource potential for Europe based on projections from RCMs and GCMs, Clim. Change, 81, 357–371, https://doi.org/10.1007/s10584-006-9214-3, 2007.
Fuchs, M., Kuhry, P., and Hugelius, G.: Low below-ground organic carbon storage in a subarctic Alpine permafrost environment, The Cryosphere, 9, 427–438, https://doi.org/10.5194/tc-9-427-2015, 2015.
Funkey, C. P., Conley, D. J., Reuss, N. S., Humborg, C., Jilbert, T., and Slomp, C. P.: Hypoxia Sustains Cyanobacteria Blooms in the Baltic Sea, Environ. Sci. Technol., 48, 2598–2602, https://doi.org/10.1021/es404395a, 2014.
Gaget, E., Pavón-Jordán, D., Johnston, A., Lehikoinen, A., Hochachka, W. M., Sandercock, B. K., Soultan, A., Azafzaf, H., Bendjedda, N., Bino, T., Božič, L., Clausen, P., Dakki, M., Devos, K., Domsa, C., Encarnação, V., Erciyas-Yavuz, K., Faragó, S., Frost, T., Gaudard, C., Gosztonyi, L., Haas, F., Hornman, M., Langendoen, T., Ieronymidou, C., Kostyushin, V. A., Lewis, L. J., Lorentsen, S.-H., Luiujoe, L., Meissner, W., Mikuska, T., Molina, B., Musilová, Z., Natykanets, V., Paquet, J.-Y., Petkov, N., Portolou, D., Ridzoň, J., Sayoud, S., Šćiban, M., Sniauksta, L., Stīpniece, A., Strebel, N., Teufelbauer, N., Topić, G., Uzunova, D., Vizi, A., Wahl, J., Zenatello, M., and Brommer, J. E.: Benefits of protected areas for nonbreeding waterbirds adjusting their distributions under climate warming, Conserv. Biol., 35, 834–845, https://doi.org/10.1111/cobi.13648, 2021.
Gailiušis, B., Kriaučiūnienė, J., Jakimavičius, D., and Šarauskienė, D.: The variability of long-term runoff series in the Baltic Sea drainage basin, Baltica, 24, 45–54, 2011.
Gaillard, M.-J., Kleinen, T., Samuelsson, P., Nielsen, A. B., Bergh, J., Kaplan, J., Poska, A., Sandström, C., Strandberg, G., Trondman, A.-K., and Wramneby, A.: Causes of Regional Change – Land Cover, in: Second Assessment of Climate Change for the Baltic Sea Basin, edited by: BACC II Author Team, Springer International Publishing, Cham, 453–477, https://doi.org/10.1007/978-3-319-16006-1_25, 2015.
Galatius, A., Kinze, C. C., and Teilmann, J.: Population structure of harbour porpoises in the Baltic region: evidence of separation based on geometric morphometric comparisons, J. Mar. Biol. Assoc. UK, 92, 1669–1676, https://doi.org/10.1017/S0025315412000513, 2012.
Gálos, B., Hagemann, S., Hänsler, A., Kindermann, G., Rechid, D., Sieck, K., Teichmann, C., and Jacob, D.: Case study for the assessment of the biogeophysical effects of a potential afforestation in Europe, Carbon Bal. Manage., 8, 3, https://doi.org/10.1186/1750-0680-8-3, 2013.
Gao, Y., Markkanen, T., Backman, L., Henttonen, H. M., Pietikäinen, J.-P., Mäkelä, H. M., and Laaksonen, A.: Biogeophysical impacts of peatland forestation on regional climate changes in Finland, Biogeosciences, 11, 7251–7267, https://doi.org/10.5194/bg-11-7251-2014, 2014.
Gårdmark, A., Lindegren, M., Neuenfeldt, S., Blenckner, T., Heikinheimo, O., Müller-Karulis, B., Niiranen, S., Tomczak, M. T., Aro, E., Wikström, A., and Möllmann, C.: Biological ensemble modeling to evaluate potential futures of living marine resources, Ecol. Appl., 23, 742–754, https://doi.org/10.1890/12-0267.1, 2013.
Gårdmark, A. and Huss, M.: Individual variation and interactions explain food web responses to global warming, Philos. T. Roy. Soc. B., 375, 20190449, https://doi.org/10.1098/rstb.2019.0449, 2020.
Garzke, J., Ismar, S. M. H., and Sommer, U.: Climate change affects low trophic level marine consumers: warming decreases copepod size and abundance, Oecologia, 177, 849–860, https://doi.org/10.1007/s00442-014-3130-4, 2015.
Gauss, M., Jonson, J. E., and Nyíri, Á.: Emissions from international shipping, EMEP Status Report 1/2017, The Norwegian Meteorological Institute, Oslo, Norway, 129–133, https://emep.int/publ/reports/2017/EMEP_Status_Report_1_2017.pdf (last access: 17 Feburary 2022), 2017.
Gauss, M., Bartnicki, J., Jalkanen, J.-P., Nyiri, A., Klein, H., Fagerli, H., and Klimont, Z.: Airborne nitrogen deposition to the Baltic Sea: Past trends, source allocation and future projections, Atmos. Environ., 253, 118377, https://doi.org/10.1016/j.atmosenv.2021.118377, 2021.
Geels, C., Andersson, C., Hänninen, O., Lansø, A. S., Schwarze, P. E., Skjøth, C. A., and Brandt, J.: Future Premature Mortality Due to O3, Secondary Inorganic Aerosols and Primary PM in Europe – Sensitivity to Changes in Climate, Anthropogenic Emissions, Population and Building Stock, Int. J. Env. Res. Pub. He., 12, 2837–2869, 2015.
Gillett, N. P., Arora, V. K., Matthews, D., and Allen, M. R.: Constraining the Ratio of Global Warming to Cumulative CO2 Emissions Using CMIP5 Simulations, J. Climate, 26, 6844–6858, https://doi.org/10.1175/jcli-d-12-00476.1, 2013.
Giorgi, F.: Simulation of Regional Climate Using a Limited Area Model Nested in a General Circulation Model, J. Climate, 3, 941–963, https://doi.org/10.1175/1520-0442(1990)003<0941:Sorcua>2.0.Co;2, 1990.
Giorgi, F. and Gao, X.-J.: Regional earth system modeling: review and future directions, Atmos. Ocean. Sci. Lett., 11, 189–197, https://doi.org/10.1080/16742834.2018.1452520, 2018.
Girjatowicz, J. P.: Ice thrusts and piles on the shores of the Southern Baltic Sea coast (Poland) lagoons, Baltic Coastal Zone, Journal of Ecology and Protection of the Coastline, 8, 5–22, 2004.
Girjatowicz, J. P. and Łabuz, T. A.: Forms of piled ice at the southern coast of the Baltic Sea, Estuar. Coast. Shelf Sci., 239, 106746, https://doi.org/10.1016/j.ecss.2020.106746, 2020.
Gisnås, K., Etzelmüller, B., Lussana, C., Hjort, J., Sannel, A. B. K., Isaksen, K., Westermann, S., Kuhry, P., Christiansen, H. H., Frampton, A., and Åkerman, J.: Permafrost Map for Norway, Sweden and Finland, Permafrost Periglac., 28, 359–378, https://doi.org/10.1002/ppp.1922, 2017.
Glantz, P., Freud, E., Johansson, C., Noone, K. J., and Tesche, M.: Trends in MODIS and AERONET derived aerosol optical thickness over Northern Europe, Tellus B, 71, 1554414, https://doi.org/10.1080/16000889.2018.1554414, 2019.
Graf, A., Klosterhalfen, A., Arriga, N., Bernhofer, C., Bogena, H., Bornet, F., Brüggemann, N., Brümmer, C., Buchmann, N., Chi, J., Chipeaux, C., Cremonese, E., Cuntz, M., Dušek, J., El-Madany, T. S., Fares, S., Fischer, M., Foltýnová, L., Gharun, M., Ghiasi, S., Gielen, B., Gottschalk, P., Grünwald, T., Heinemann, G., Heinesch, B., Heliasz, M., Holst, J., Hörtnagl, L., Ibrom, A., Ingwersen, J., Jurasinski, G., Klatt, J., Knohl, A., Koebsch, F., Konopka, J., Korkiakoski, M., Kowalska, N., Kremer, P., Kruijt, B., Lafont, S., Léonard, J., Ligne, A. D., Longdoz, B., Loustau, D., Magliulo, V., Mammarella, I., Manca, G., Mauder, M., Migliavacca, M., Mölder, M., Neirynck, J., Ney, P., Nilsson, M., Paul-Limoges, E., Peichl, M., Pitacco, A., Poyda, A., Rebmann, C., Roland, M., Sachs, T., Schmidt, M., Schrader, F., Siebicke, L., Šigut, L., Tuittila, E.-S., Varlagin, A., Vendrame, N., Vincke, C., Völksch, I., Weber, S., Wille, C., Wizemann, H.-D., Zeeman, M., and Vereecken, H.: Altered energy partitioning across terrestrial ecosystems in the European drought year 2018, Philos. T. Roy. Soc. B., 375, 20190524, https://doi.org/10.1098/rstb.2019.0524, 2020.
Graham, L. P.: Climate Change Effects on River Flow to the Baltic Sea, Ambio, 33, 235–241, 237, https://doi.org/10.1579/0044-7447-33.4.235, 2004.
Graham, P.: Modeling runoff to the Baltic Sea, Ambio, 28, 328–334, 1999.
Graiff, A., Liesner, D., Karsten, U., and Bartsch, I.: Temperature tolerance of western Baltic Sea Fucus vesiculosus – growth, photosynthesis and survival, J. Exp. Mar. Biol. Ecol., 471, 8–16, https://doi.org/10.1016/j.jembe.2015.05.009, 2015.
Granéli, E., Kerstin, W., Larsson, U., Granéli, W., and Elmgren, R.: Nutrient Limitation of Primary Production in the Baltic Sea Area, Ambio, 19, 142–151, 1990.
Gräwe, U. and Burchard, H.: Storm surges in the Western Baltic Sea: the present and a possible future, Clim. Dyn., 39, 165–183, https://doi.org/10.1007/s00382-011-1185-z, 2012.
Gräwe, U., Naumann, M., Mohrholz, V., and Burchard, H.: Anatomizing one of the largest saltwater inflows into the Baltic Sea in December 2014, J. Geophys. Res.-Oceans, 120, 7676–7697, https://doi.org/10.1002/2015JC011269, 2015.
Griffiths, J. R., Kadin, M., Nascimento, F. J. A., Tamelander, T., Törnroos, A., Bonaglia, S., Bonsdorff, E., Brüchert, V., Gårdmark, A., Järnström, M., Kotta, J., Lindegren, M., Nordström, M. C., Norkko, A., Olsson, J., Weigel, B., Žydelis, R., Blenckner, T., Niiranen, S., and Winder, M.: The importance of benthic–pelagic coupling for marine ecosystem functioning in a changing world, Global Change Biol., 23, 2179–2196, https://doi.org/10.1111/gcb.13642, 2017.
Griffiths, J. R., Lehtinen, S., Suikkanen, S., and Winder, M.: Limited evidence for common interannual trends in Baltic Sea summer phytoplankton biomass, PLoS ONE, 15, e0231690, https://doi.org/10.1371/journal.pone.0231690, 2020.
Grinsted, A.: Projected Change – Sea Level, in: Second Assessment of Climate Change for the Baltic Sea Basin, edited by: BACC II Author Team, Regional Climate Studies, Springer International Publishing, Cham, 253–263, https://doi.org/10.1007/978-3-319-16006-1_14, 2015.
Grinsted, A., Jevrejeva, S., Riva, R. E. M., and Dahl-Jensen, D.: Sea level rise projections for northern Europe under RCP8.5, Clim. Res., 64, 15–23, https://doi.org/10.3354/cr01309 2015.
Grise, K. M. and Polvani, L. M.: The response of midlatitude jets to increased CO2: Distinguishing the roles of sea surface temperature and direct radiative forcing, Geophys. Res. Lett., 41, 6863–6871, https://doi.org/10.1002/2014GL061638, 2014.
Groetsch, P. M. M., Simis, S. G. H., Eleveld, M. A., and Peters, S. W. M.: Spring blooms in the Baltic Sea have weakened but lengthened from 2000 to 2014, Biogeosciences, 13, 4959–4973, https://doi.org/10.5194/bg-13-4959-2016, 2016.
Gröger, M., Dieterich, C., Meier, H. E. M., and Schimanke, S.: Thermal air-sea coupling in hindcast simulations for the North Sea and Baltic Sea on the NW European shelf, Tellus A, 67, 26911, https://doi.org/10.3402/tellusa.v67.26911, 2015.
Gröger, M., Arneborg, L., Dieterich, C., Höglund, A., and Meier, H. E. M.: Summer hydrographic changes in the Baltic Sea, Kattegat and Skagerrak projected in an ensemble of climate scenarios downscaled with a coupled regional ocean–sea ice–atmosphere model, Clim. Dynam., 53, 5945–5966, https://doi.org/10.1007/s00382-019-04908-9, 2019.
Gröger, M., Dieterich, C., Haapala, J., Ho-Hagemann, H. T. M., Hagemann, S., Jakacki, J., May, W., Meier, H. E. M., Miller, P. A., Rutgersson, A., and Wu, L.: Coupled regional Earth system modeling in the Baltic Sea region, Earth Syst. Dynam., 12, 939–973, https://doi.org/10.5194/esd-12-939-2021, 2021a.
Gröger, M., Dieterich, C., and Meier, H. E. M.: Is interactive air sea coupling relevant for simulating the future climate of Europe?, Clim. Dyn., 56, 491–514, https://doi.org/10.1007/s00382-020-05489-8, 2021b.
Groh, A., Richter, A., and Dietrich, R.: Recent Baltic Sea Level Changes Induced by Past and Present Ice Masses, in: Coastline Changes of the Baltic Sea from South to East: Past and Future Projection, edited by: Harff, J., Furmańczyk, K. and von Storch, H., Springer International Publishing, Cham, 55–68, https://doi.org/10.1007/978-3-319-49894-2_4, 2017.
Groll, N., Grabemann, I., Hünicke, B., and Meese, M.: Baltic Sea wave conditions under climate change scenarios, Boreal Environ. Res., 22, 1–12, 2017.
Groß, D., Zander, A., Boethius, A., Dreibrodt, S., Grøn, O., Hansson, A., Jessen, C., Koivisto, S., Larsson, L., Lübke, H., and Nilsson, B.: People, lakes and seashores: Studies from the Baltic Sea basin and adjacent areas in the early and Mid-Holocene, Quaternary Sci. Rev., 185, 27–40, https://doi.org/10.1016/j.quascirev.2018.01.021, 2018.
Gubelit, Y. I.: Climatic impact on community of filamentous macroalgae in the Neva estuary (eastern Baltic Sea), Mar. Pollut. Bull., 91, 166–172, https://doi.org/10.1016/j.marpolbul.2014.12.009, 2015.
Gunnarsson, G., Waldenström, J., and Fransson, T.: Direct and indirect effects of winter harshness on the survival of Mallards Anas platyrhynchos in northwest Europe, Ibis, 154, 307–317, https://doi.org/10.1111/j.1474-919X.2011.01206.x, 2012.
Gustafsson, B. G., Schenk, F., Blenckner, T., Eilola, K., Meier, H. E. M., Müller-Karulis, B., Neumann, T., Ruoho-Airola, T., Savchuk, O. P., and Zorita, E.: Reconstructing the development of Baltic Sea eutrophication 1850–2006, Ambio, 41, 534–548, https://doi.org/10.1007/s13280-012-0318-x, 2012.
Gustafsson, E., Deutsch, B., Gustafsson, B. G., Humborg, C., and Mörth, C. M.: Carbon cycling in the Baltic Sea – The fate of allochthonous organic carbon and its impact on air–sea CO2 exchange, J. Mar. Syst., 129, 289–302, https://doi.org/10.1016/j.jmarsys.2013.07.005, 2014.
Gustafsson, E., Savchuk, O. P., Gustafsson, B. G., and Müller-Karulis, B.: Key processes in the coupled carbon, nitrogen, and phosphorus cycling of the Baltic Sea, Biogeochemistry, 134, 301–317, https://doi.org/10.1007/s10533-017-0361-6, 2017.
Gustafsson, E., Hagens, M., Sun, X., Reed, D. C., Humborg, C., Slomp, C. P., and Gustafsson, B. G.: Sedimentary alkalinity generation and long-term alkalinity development in the Baltic Sea, Biogeosciences, 16, 437–456, https://doi.org/10.5194/bg-16-437-2019, 2019.
Gutiérrez, J. M., Jones, R. G., Narisma, G. T., Alves, L. M., Amjad, M., Gorodetskaya, I. V., Grose, M., Klutse, N. A. B., Krakovska, S., Li, J., Martínez-Castro, D., Mearns, L. O., Mernild, S. H., Ngo-Duc, T., van den Hurk, B., and Yoon, J.-H.: Atlas, in: Climate Change 2021: The Physical Science Basis. Contribution of Working Group I to the Sixth Assessment Report of the Intergovernmental Panel on Climate Change, edited by: Masson-Delmotte, V., Zhai, P., Pirani, A., Connors, S. L., Péan, C., Berger, S., Caud, N., Chen, Y., Goldfarb, L., Gomis, M. I., Huang, M., Leitzell, K., Lonnoy, E., Matthews, J. B. R., Maycock, T. K., Waterfield, T., Yelekçi, O., Yu, R., and Zhou, B., http://interactive-atlas.ipcc.ch/, last access: 25 November 2021.
Haapala, J., Meier, H. E. M., and Rinne, J.: Numerical investigations of future ice conditions in the Baltic Sea, Ambio, 30, 237–244, https://doi.org/10.1579/0044-7447-30.4.237, 2001.
Haarsma, R. J., Selten, F. M., and Drijfhout, S. S.: Decelerating Atlantic meridional overturning circulation main cause of future west European summer atmospheric circulation changes, Environ. Res. Lett., 10, 094007, https://doi.org/10.1088/1748-9326/10/9/094007, 2015.
Haavisto, F. and Jormalainen, V.: Seasonality elicits herbivores' escape from trophic control and favors induced resistance in a temperate macroalga, Ecology, 95, 3035–3045, https://doi.org/10.1890/13-2387.1, 2014.
Hägg, H. E., Lyon, S. W., Wällstedt, T., Mörth, C.-M., Claremar, B., and Humborg, C.: Future Nutrient Load Scenarios for the Baltic Sea Due to Climate and Lifestyle Changes, Ambio, 43, 337–351, https://doi.org/10.1007/s13280-013-0416-4, 2014.
Halkka, A.: Changing climate and the Baltic region biota, Doctoral dissertation, Faculty of Biological and Environmental Sciences, University of Helsinki, Helsinki, Finland, 52 pp., http://urn.fi/URN:ISBN:978-951-51-6021-8 (last access: 16 February 2022), 2020.
Hallett, C. S., Hobday, A. J., Tweedley, J. R., Thompson, P. A., McMahon, K., and Valesini, F. J.: Observed and predicted impacts of climate change on the estuaries of south-western Australia, a Mediterranean climate region, Reg. Environ. Change, 18, 1357–1373, https://doi.org/10.1007/s10113-017-1264-8, 2018.
Hällfors, H., Backer, H., Leppänen, J.-M., Hällfors, S., Hällfors, G., and Kuosa, H.: The northern Baltic Sea phytoplankton communities in 1903–1911 and 1993–2005: a comparison of historical and modern species data, Hydrobiologia, 707, 109–133, https://doi.org/10.1007/s10750-012-1414-4, 2013.
Hamlington, B. D., Gardner, A. S., Ivins, E., Lenaerts, J. T. M., Reager, J. T., Trossman, D. S., Zaron, E. D., Adhikari, S., Arendt, A., Aschwanden, A., Beckley, B. D., Bekaert, D. P. S., Blewitt, G., Caron, L., Chambers, D. P., Chandanpurkar, H. A., Christianson, K., Csatho, B., Cullather, R. I., DeConto, R. M., Fasullo, J. T., Frederikse, T., Freymueller, J. T., Gilford, D. M., Girotto, M., Hammond, W. C., Hock, R., Holschuh, N., Kopp, R. E., Landerer, F., Larour, E., Menemenlis, D., Merrifield, M., Mitrovica, J. X., Nerem, R. S., Nias, I. J., Nieves, V., Nowicki, S., Pangaluru, K., Piecuch, C. G., Ray, R. D., Rounce, D. R., Schlegel, N.-J., Seroussi, H., Shirzaei, M., Sweet, W. V., Velicogna, I., Vinogradova, N., Wahl, T., Wiese, D. N., and Willis, M. J.: Understanding of Contemporary Regional Sea-Level Change and the Implications for the Future, Rev. Geophys., 58, e2019RG000672, https://doi.org/10.1029/2019RG000672, 2020.
Hammer, K., Schneider, B., Kuliński, K., and Schulz-Bull, D. E.: Acid-base properties of Baltic Sea dissolved organic matter, J. Mar. Syst., 173, 114–121, https://doi.org/10.1016/j.jmarsys.2017.04.007, 2017.
Hammond, P., Bearzi, G., Bjørge, A., Forney, K., Karczmarski, L., Kasuya, T., Perrin, W., Scott, M., Wang, J., Wells, R., and Wilson, B.: Phocoena phocoena (Baltic Sea subpopulation), errata version published in 2016, The IUCN Red List of Threatened Species: e. T17031A98831650, https://doi.org/10.2305/IUCN.UK.2008.RLTS.T17031A6739565.en, 2008.
Hannerz, F. and Destouni, G.: Spatial Characterization of the Baltic Sea Drainage Basin and Its Unmonitored Catchments, Ambio, 35, 214–219, 216, https://doi.org/10.1579/05-A-022R.1, 2006.
Hänninen, J., Vuorinen, I., Rajasilta, M., and Reid, P. C.: Response of the Baltic and North Seas to river runoff from the Baltic watershed – Physical and biological changes, Prog. Oceanogr., 138, 91–104, https://doi.org/10.1016/j.pocean.2015.09.001, 2015.
Hansson, D., Eriksson, C., Omstedt, A., and Chen, D.: Reconstruction of river runoff to the Baltic Sea, AD 1500–1995, Int. J. Climatol., 31, 696–703, https://doi.org/10.1002/joc.2097, 2011.
Harff, J., Deng, J., Dudzińska-Nowak, J., Fröhle, P., Groh, A., Hünicke, B., Soomere, T., and Zhang, W.: What Determines the Change of Coastlines in the Baltic Sea?, in: Coastline Changes of the Baltic Sea from South to East: Past and Future Projection, edited by: Harff, J., Furmańczyk, K., and von Storch, H., Springer International Publishing, Cham, 15–35, https://doi.org/10.1007/978-3-319-49894-2_2, 2017.
Härkönen, T., Galatius, A., Olsen, M. T., Ahola, M., Hårding, K., Karlsson, O., Kunnasranta, M., Avellan, L., Kääriä, P., Pyhälä, M., and Rowe, O.: Population trends and abundance of seals, HELCOM core indicator report, edited by: Secretariat, H., 34 pp., https://www.helcom.fi/wp-content/uploads/2019/08/Population-trends-and-abundance-of-seals-HELCOM-core (last access: 16 February 2022), 2018.
Hartfield, G., Blunden, J., and Arndt, D. S.: State of the Climate in 2017, B. Am. Meteorol. Soc., 99, Si-S310, https://doi.org/10.1175/2018BAMSStateoftheClimate.1, 2018.
Harvey, B. J., Shaffrey, L. C., Woollings, T. J., Zappa, G., and Hodges, K. I.: How large are projected 21st century storm track changes?, Geophys. Res. Lett., 39, 18707, https://doi.org/10.1029/2012GL052873, 2012.
Harvey, B. J., Cook, P., Shaffrey, L. C., and Schiemann, R.: The Response of the Northern Hemisphere Storm Tracks and Jet Streams to Climate Change in the CMIP3, CMIP5, and CMIP6 Climate Models, J. Geophys. Res.-Atmos., 125, e2020JD032701, https://doi.org/10.1029/2020JD032701, 2020.
Hattich, G. S. I., Listmann, L., Govaert, L., Pansch, C., Reusch, T. B. H., and Matthiessen, B.: Experimentally decomposing phytoplankton community change into ecological and evolutionary contributions, Funct. Ecol., 36, 120–132, https://doi.org/10.1111/1365-2435.13923, 2022.
Hausfather, Z. and Peters, G. P.: Emissions – the “business as usual” story is misleading, Nature, 577, 618–620, https://doi.org/10.1038/d41586-020-00177-3, 2020.
Havenhand, J. N.: How will ocean acidification affect Baltic Sea ecosystems? An assessment of plausible impacts on key functional groups, Ambio, 41, 637–644, 2012.
Heavens, N. G., Ward, D. S., and Natalie, M.: Studying and projecting climate change with earth system models, Nat. Educ. Knowledge, 4, 4, 2013.
Hedegaard, G. B., Christensen, J. H., and Brandt, J.: The relative importance of impacts from climate change vs. emissions change on air pollution levels in the 21st century, Atmos. Chem. Phys., 13, 3569–3585, https://doi.org/10.5194/acp-13-3569-2013, 2013.
Hegerl, G. C., Crowley, T. J., Baum, S. K., Kim, K.-Y., and Hyde, W. T.: Detection of volcanic, solar and greenhouse gas signals in paleo-reconstructions of Northern Hemispheric temperature, Geophys. Res. Lett., 30, 1242, https://doi.org/10.1029/2002GL016635, 2003.
HELCOM: Climate Change in the Baltic Sea Area - HELCOM Thematic Assessment in 2007, Helsinki, Finland, Baltic Sea Environment Proceedings No. 111, 54 pp., https://helcom.fi/media/publications/BSEP111.pdf (last access: 16 February 2022), 2007.
HELCOM: HELCOM Copenhagen Ministerial Declaration – Taking Further Action to Implement the Baltic Sea Action Plan – Reaching Good Environmental Statusfor a healthyBaltic Sea, Copenhagen, Denmark, HELCOM Ministrial Meeting, https://helcom.fi/media/documents/2013-Copenhagen-Ministerial-Declaration-w-cover-1.pdf (last access: 16 February 2022), 2013a.
HELCOM: Climate Change in the Baltic Sea Area – HELCOM Thematic Assessment in 2013, Helsinki, Finland, Baltic Sea Environment Proceedings No. 137, 70 pp., https://www.helcom.fi/wp-content/uploads/2019/10/BSEP137.pdf (last access: 16 February 2022), 2013b.
HELCOM: Updated Fifth Baltic Sea Pollution Load Compilation (PLC-5.5), Helsinki, Finland, Baltic Sea Environment Proceedings No. 145, 143 pp., https://www.helcom.fi/wp-content/uploads/2019/08/BSEP145_Lowres-1.pdf (last access: 16 February 2022), 2015.
HELCOM: HELCOM thematic assessment of eutrophication 2011–2016, Helsinki, Finland, Baltic Sea Environment Proceedings No. 156, 83 pp., http://stateofthebalticsea.helcom.fi/wp-content/uploads/2019/09/BSEP156-Eutrophication.pdf (last access: 16 February 2022), 2018a.
Helle, E.: Reproduction, size and structure of the Baltic ringed seal population of the Bothnian Bay, PhD, Acta Universitatis Ouluensis series A Scientiae rerum naturalium No. 106 Biologica No. 11, 47 pp., 1980.
Hendriks, C., Forsell, N., Kiesewetter, G., Schaap, M., and Schöpp, W.: Ozone concentrations and damage for realistic future European climate and air quality scenarios, Atmos. Environ., 144, 208–219, https://doi.org/10.1016/j.atmosenv.2016.08.026, 2016.
Hense, I., Meier, H. E. M., and Sonntag, S.: Projected climate change impact on Baltic Sea cyanobacteria, Clim. Change, 119, 391–406, https://doi.org/10.1007/s10584-013-0702-y, 2013.
Hesse, C., Krysanova, V., Stefanova, A., Bielecka, M., and Domnin, D. A.: Assessment of climate change impacts on water quantity and quality of the multi-river Vistula Lagoon catchment, Hydrol. Sci. J., 60, 890–911, https://doi.org/10.1080/02626667.2014.967247, 2015.
Hieronymus, J., Eilola, K., Hieronymus, M., Meier, H. E. M., Saraiva, S., and Karlson, B.: Causes of simulated long-term changes in phytoplankton biomass in the Baltic proper: a wavelet analysis, Biogeosciences, 15, 5113–5129, https://doi.org/10.5194/bg-15-5113-2018, 2018.
Hieronymus, M., and Kalén, O.: Sea-level rise projections for Sweden based on the new IPCC special report: The ocean and cryosphere in a changing climate, Ambio, 49, 1587–1600, https://doi.org/10.1007/s13280-019-01313-8, 2020.
Hieronymus, J., Eilola, K., Olofsson, M., Hense, I., Meier, H. E. M., and Almroth-Rosell, E.: Modeling cyanobacteria life cycle dynamics and historical nitrogen fixation in the Baltic Proper, Biogeosciences, 18, 6213–6227, https://doi.org/10.5194/bg-18-6213-2021, 2021.
Hinrichsen, H.-H., Huwer, B., Makarchouk, A., Petereit, C., Schaber, M., and Voss, R.: Climate-driven long-term trends in Baltic Sea oxygen concentrations and the potential consequences for eastern Baltic cod (Gadus morhua), ICES J. Mar. Sci., 68, 2019–2028, https://doi.org/10.1093/icesjms/fsr145, 2011.
Hisdal, H., Holmqvist, E., Jonsdottir, J. F., Jonsson, P., Kuusisto, E., Lindstroem, G., and Roald, L. A.: Has streamflow changed in the Nordic countries?, NVE-1/2010, Norwegian Water Resources and Energy Directorate (NVE), Oslo, Norway, 28 pp., https://publikasjoner.nve.no/report/2010/report2010_01.pdf (last access: 16 February 2022), 2010.
Hjerne, O., Hajdu, S., Larsson, U., Downing, A. S., and Winder, M.: Climate Driven Changes in Timing, Composition and Magnitude of the Baltic Sea Phytoplankton Spring Bloom, Front. Mar. Sci., 6, 482, https://doi.org/10.3389/fmars.2019.00482, 2019.
Hock, R., Rasul, G., Adler, C., Cáceres, B., Gruber, S., Hirabayashi, Y., Jackson, M., Kääb, A., Kang, S., Kutuzov, S., Milner, A., Molau, U., Morin, S., Orlove, B., and Steltzer, H.: High Mountain Areas, in: IPCC Special Report on the Ocean and Cryosphere in a Changing Climate, edited by: Pörtner, H.-O., Roberts, D. C., Masson-Delmotte, V., Zhai, P., Tignor, M., Poloczanska, E., Mintenbeck, K., Alegría, A., Nicolai, M., Okem, A., Petzold, J., Rama, B., and Weyer, N. M., https://www.ipcc.ch/srocc/chapter/chapter-2/ (last access: 16 February 2022), 2019.
Höglund, A., Pemberton, P., Hordoir, R., and Schimanke, S.: Ice conditions for maritime traffic in the Baltic Sea in future climate, Boreal Environ. Res., 22, 245–265, 2017.
Hoikkala, L., Kortelainen, P., Soinne, H., and Kuosa, H.: Dissolved organic matter in the Baltic Sea, J. Mar. Syst., 142, 47–61, https://doi.org/10.1016/j.jmarsys.2014.10.005, 2015.
Holmlund, E. S. and Holmlund, P.: Constraining 135 years of mass balance with historic structure-from-motion photogrammetry on Storglaciären, Sweden, Geogr. Ann. A, 101, 195–210, https://doi.org/10.1080/04353676.2019.1588543, 2019.
Holopainen, R., Lehtiniemi, M., Meier, H. E. M., Albertsson, J., Gorokhova, E., Kotta, J., and Viitasalo, M.: Impacts of changing climate on the non-indigenous invertebrates in the northern Baltic Sea by end of the twenty-first century, Biol. Invasions, 18, 3015–3032, https://doi.org/10.1007/s10530-016-1197-z, 2016.
Holtermann, P. L. and Umlauf, L.: The Baltic Sea Tracer Release Experiment: 2. Mixing processes, J. Geophys. Res.-Oceans, 117, C01022, https://doi.org/10.1029/2011JC007445, 2012.
Holtermann, P. L., Umlauf, L., Tanhua, T., Schmale, O., Rehder, G., and Waniek, J. J.: The Baltic Sea Tracer Release Experiment: 1. Mixing rates, J. Geophys. Res.-Oceans, 117, C01021, https://doi.org/10.1029/2011JC007439, 2012.
Holtermann, P. L., Prien, R., Naumann, M., Mohrholz, V., and Umlauf, L.: Deepwater dynamics and mixing processes during a major inflow event in the central Baltic Sea, J. Geophys. Res.-Oceans, 122, 6648–6667, https://doi.org/10.1002/2017JC013050, 2017.
Hong, B., Swaney, D. P., McCrackin, M., Svanbäck, A., Humborg, C., Gustafsson, B., Yershova, A., and Pakhomau, A.: Advances in NANI and NAPI accounting for the Baltic drainage basin: spatial and temporal trends and relationships to watershed TN and TP fluxes, Biogeochemistry, 133, 245–261, https://doi.org/10.1007/s10533-017-0330-0, 2017.
Hook, O., Johnels, A. G., and Matthews, L. H.: The breeding and distribution of the grey seal (Halichoerus grypus Fab.) in the Baltic Sea, with observations on other seals of the area, P. Roy. Soc. B-Biol. Sci., 182, 37–58, https://doi.org/10.1098/rspb.1972.0065, 1972.
Hordoir, R., Axell, L., Löptien, U., Dietze, H., and Kuznetsov, I.: Influence of sea level rise on the dynamics of salt inflows in the Baltic Sea, J. Geophys. Res.-Oceans, 120, 6653–6668, https://doi.org/10.1002/2014JC010642, 2015.
Hordoir, R., Axell, L., Höglund, A., Dieterich, C., Fransner, F., Gröger, M., Liu, Y., Pemberton, P., Schimanke, S., Andersson, H., Ljungemyr, P., Nygren, P., Falahat, S., Nord, A., Jönsson, A., Lake, I., Döös, K., Hieronymus, M., Dietze, H., Löptien, U., Kuznetsov, I., Westerlund, A., Tuomi, L., and Haapala, J.: Nemo-Nordic 1.0: a NEMO-based ocean model for the Baltic and North seas – research and operational applications, Geosci. Model Dev., 12, 363–386, https://doi.org/10.5194/gmd-12-363-2019, 2019.
Horn, H. G., Boersma, M., Garzke, J., Löder, M. G. J., Sommer, U., and Aberle, N.: Effects of high CO2 and warming on a Baltic Sea microzooplankton community, ICES J. Mar. Sci., 73, 772–782, https://doi.org/10.1093/icesjms/fsv198, 2015.
Høyer, J. L. and Karagali, I.: Sea Surface Temperature Climate Data Record for the North Sea and Baltic Sea, J. Climate, 29, 2529–2541, https://doi.org/10.1175/jcli-d-15-0663.1, 2016.
Hugelius, G., Loisel, J., Chadburn, S., Jackson, R. B., Jones, M., MacDonald, G., Marushchak, M., Olefeldt, D., Packalen, M., Siewert, M. B., Treat, C., Turetsky, M., Voigt, C., and Yu, Z.: Large stocks of peatland carbon and nitrogen are vulnerable to permafrost thaw, P. Natl. Acad. Sci. USA, 117, 20438–20446, https://doi.org/10.1073/pnas.1916387117, 2020.
Humborg, C., Geibel, M. C., Sun, X., McCrackin, M., Mörth, C.-M., Stranne, C., Jakobsson, M., Gustafsson, B., Sokolov, A., Norkko, A., and Norkko, J.: High Emissions of Carbon Dioxide and Methane From the Coastal Baltic Sea at the End of a Summer Heat Wave, Front. Mar. Sci., 6, 493, https://doi.org/10.3389/fmars.2019.00493, 2019.
Hünicke, B. and Zorita, E.: Trends in the amplitude of Baltic Sea level annual cycle, Tellus A, 60, 154–164, https://doi.org/10.1111/j.1600-0870.2007.00277.x, 2008.
Hünicke, B., Zorita, E., Soomere, T., Madsen, K. S., Johansson, M., and Suursaar, Ü.: Recent Change – Sea Level and Wind Waves, in: Second Assessment of Climate Change for the Baltic Sea Basin, edited by: BACC II Author Team, Springer International Publishing, Cham, 155–185, https://doi.org/10.1007/978-3-319-16006-1_9, 2015.
Hünicke, B. and Zorita, E.: Statistical Analysis of the Acceleration of Baltic Mean Sea-Level Rise, 1900–2012, Front. Mar. Sci., 3, 125, https://doi.org/10.3389/fmars.2016.00125, 2016.
Hurrell, J. W.: Decadal trends in the North Atlantic Oscillation: regional temperatures and precipitation, Science-AAAS-Weekly Paper Edition, 269, 676–679, https://doi.org/10.1126/science.269.5224.676 1995.
Hurrell, J. W., Kushnir, Y., Ottersen, G., and Visbeck, M.: An overview of the North Atlantic oscillation, Geophys. Monogr. Ser., 134, 1–36, 2003.
Huthnance, J., Weisse, R., Wahl, T., Thomas, H., Pietrzak, J., Souza, A. J., van Heteren, S., Schmelzer, N., van Beusekom, J., Colijn, F., Haigh, I., Hjøllo, S., Holfort, J., Kent, E. C., Kühn, W., Loewe, P., Lorkowski, I., Mork, K. A., Pätsch, J., Quante, M., Salt, L., Siddorn, J., Smyth, T., Sterl, A., and Woodworth, P.: Recent Change – North Sea, in: North Sea Region Climate Change Assessment, edited by: Quante, M. and Colijn, F., Springer International Publishing, Cham, 85–136, https://doi.org/10.1007/978-3-319-39745-0_3, 2016.
Huttunen, I., Lehtonen, H., Huttunen, M., Piirainen, V., Korppoo, M., Veijalainen, N., Viitasalo, M., and Vehviläinen, B.: Effects of climate change and agricultural adaptation on nutrient loading from Finnish catchments to the Baltic Sea, Sci. Total Environ., 529, 168–181, https://doi.org/10.1016/j.scitotenv.2015.05.055, 2015.
Hyytiäinen, K., Bauer, B., Bly Joyce, K., Ehrnsten, E., Eilola, K., Gustafsson, B. G., Meier, H. E. M., Norkko, A., Saraiva, S., Tomczak, M., and Zandersen, M.: Provision of aquatic ecosystem services as a consequence of societal changes: The case of the Baltic Sea, Popul. Ecol., 63, 61–74, https://doi.org/10.1002/1438-390X.12033, 2021.
ICES: International Council for the Exploration of the Sea (ICES), oceanographic database, ICES [data set], https://www.ices.dk/data/data-portals/Pages/ocean.aspx, last access: 21 February 2022.
Ilmatieteen laitos: Jäätalvi Itämerellä: The ice cover of the Baltic 1961–2018, Public record of Finnish Meterological Institute, https://www.ilmatieteenlaitos.fi/jaatalvi-itamerella, last access: 10 December 2020.
IPCC: Climate Change 2007: The Physical Science Basis, in: Contribution of Working Group I to the Fourth Assessment Report of the Intergovernmental Panel on Climate Change, edited by: Solomon, S., Qin, D., Manning, M., Chen, Z., Marquis, M., Averyt, K. B., Tigno, M., and Miller, H. L., Cambridge University Press, United Kingdom and New York, NY, USA, Cambridge, https://www.ipcc.ch/report/ar4/wg1/ (last access: 16 February 2022), 2007.
IPCC: Climate Change 2014: Synthesis Report, in: Contribution of Working Groups I, II and III to the Fifth Assessment Report of the Intergovernmental Panel on Climate Change, edited by: Team, C. W., Pachauri, R. K., and Meyer, L. A., Intergovernmental Panel on Climate Change, Geneva, Switzerland, 151 pp., https://www.ipcc.ch/report/ar5/syr/ (last access: 16 February 2022), 2014a.
IPCC: Climate Change 2013: The Physical Science Basis: Working Group I Contribution to the Fifth Assessment Report of the Intergovernmental Panel on Climate Change, edited by: Stocker, T. F., Qin, D., Plattner, G.-K., Tignor, M., Allen, S. K., Boschung, J., Nauels, A., Xia, Y., Bex, V., and Midgley, P. M., Cambridge University Press, Cambridge, https://doi.org/10.1017/CBO9781107415324, 2014b.
IPCC: IPCC Special Report on the Ocean and Cryosphere in a Changing Climate, edited by: Pörtner, H.-O., Roberts, D. C., Masson-Delmotte, V., Zhai, P., Tignor, M., Poloczanska, E., Mintenbeck, K., Alegría, A., Nicolai, M., Okem, A., Petzold, J., Rama, B., and Weyer, N. M., https://www.ipcc.ch/srocc/ (last access: 16 February 2022), 2019a.
IPCC: Climate Change and Land: an IPCC special report on climate change, desertification, land degradation, sustainable land management, food security, and greenhouse gas fluxes in terrestrial ecosystems, edited by: Shukla, P. R., Skea, J., Buendia, E. C., Masson-Delmotte, V., Pörtner, H.-O., Roberts, D. C., Zhai, P., Slade, R., Connors, S., v. Diemen, R., Ferrat, M., Haughey, E., Luz, S., Neogi, S., Pathak, M., Petzold, J., Pereira, J. P., Vyas, P., Huntley, E., Kissick, K., Belkacemi, M., and Malley, J., 906 pp., https://www.ipcc.ch/srccl/ (last access: 16 February 2022), 2019b.
IPCC: Climate Change 2021: The Physical Science Basis, in: Contribution of Working Group I to the Sixth Assessment Report of the Intergovernmental Panel on Climate Change, edited by: Masson-Delmotte, V., Zhai, P., Pirani, A., Connors, S. L., Péan, C., Berger, S., Caud, N., Chen, Y., Goldfarb, L., Gomis, M. I., Huang, M., Leitzell, K., Lonnoy, E., Matthews, J. B. R., Maycock, T. K., Waterfield, T., Yelekçi, O., Yu, R., and Zhou, B., Cambridge University Press, Cambridge, https://www.ipcc.ch/report/ar6/wg1/ (last access: 16 February 2022), 2021a.
IPCC: AR6 Interactive Atlas, data, https://interactive-atlas.ipcc.ch/ (last access: 25 November 2021), 2021b.
Irannezhad, M., Ronkanen, A.-K., and Kløve, B.: Wintertime climate factors controlling snow resource decline in Finland, Int. J. Climatol., 36, 110–131, https://doi.org/10.1002/joc.4332, 2016.
Ito, M., Scotti, M., Franz, M., Barboza, F. R., Buchholz, B., Zimmer, M., Guy-Haim, T., and Wahl, M.: Effects of temperature on carbon circulation in macroalgal food webs are mediated by herbivores, Mar. Biol., 166, 158, https://doi.org/10.1007/s00227-019-3596-z, 2019.
Iturbide, M., Fernández, J., Gutiérrez, J. M., Bedia, J., Cimadevilla, E., Díez-Sierra, J., Manzanas, R., Casanueva, A., Baño-Medina, J., Milovac, J., Herrera, S., Cofiño, A.S., San Martín, D., García-Díez, M., Hauser, M., Huard, D., Yelekci, Ö: Repository supporting the implementation of FAIR principles in the IPCC-WG1 Atlas, Zenodo [data set], https://doi.org/10.5281/zenodo.3691645, https://github.com/IPCC-WG1/Atlas, last access: 25 November 2021.
Ivanov, V. A., and Belokopytov, V. N.: Oceanography of the Black Sea, National Academy of Sciences of Ukraine, Marine Hydrophysical Institute, ECOSY-Gidrofizika, Sevastopol, Ukraine, 210 pp., ISBN 978-966-022-6165-5, 2013.
Jaagus, J., Briede, A., Rimkus, E., and Remm, K.: Variability and trends in daily minimum and maximum temperatures and in the diurnal temperature range in Lithuania, Latvia and Estonia in 1951–2010, Theor. Appl. Climatol., 118, 57–68, https://doi.org/10.1007/s00704-013-1041-7, 2014.
Jaagus, J., Sepp, M., Tamm, T., Järvet, A., and Mõisja, K.: Trends and regime shifts in climatic conditions and river runoff in Estonia during 1951–2015, Earth Syst. Dynam., 8, 963–976, https://doi.org/10.5194/esd-8-963-2017, 2017.
Jaagus, J., Briede, A., Rimkus, E., and Sepp, M.: Changes in precipitation regime in the Baltic countries in 1966–2015, Theor. Appl. Climatol., 131, 433–443, https://doi.org/10.1007/s00704-016-1990-8, 2018.
Jackson, L. C., Kahana, R., Graham, T., Ringer, M. A., Woollings, T., Mecking, J. V., and Wood, R. A.: Global and European climate impacts of a slowdown of the AMOC in a high resolution GCM, Clim. Dyn., 45, 3299–3316, https://doi.org/10.1007/s00382-015-2540-2, 2015.
Jacob, D., Petersen, J., Eggert, B., Alias, A., Christensen, O. B., Bouwer, L. M., Braun, A., Colette, A., Déqué, M., Georgievski, G., Georgopoulou, E., Gobiet, A., Menut, L., Nikulin, G., Haensler, A., Hempelmann, N., Jones, C., Keuler, K., Kovats, S., Kröner, N., Kotlarski, S., Kriegsmann, A., Martin, E., van Meijgaard, E., Moseley, C., Pfeifer, S., Preuschmann, S., Radermacher, C., Radtke, K., Rechid, D., Rounsevell, M., Samuelsson, P., Somot, S., Soussana, J.-F., Teichmann, C., Valentini, R., Vautard, R., Weber, B., and Yiou, P.: EURO-CORDEX: new high-resolution climate change projections for European impact research, Reg. Environ. Change, 14, 563–578, https://doi.org/10.1007/s10113-013-0499-2, 2014.
Jacob, D., Kotova, L., Teichmann, C., Sobolowski, S. P., Vautard, R., Donnelly, C., Koutroulis, A. G., Grillakis, M. G., Tsanis, I. K., Damm, A., Sakalli, A., and van Vliet, M. T. H.: Climate Impacts in Europe Under + 1.5 ∘C Global Warming, Earths Future, 6, 264–285, https://doi.org/10.1002/2017ef000710, 2018.
Jacob, D. J. and Winner, D. A.: Effect of climate change on air quality, Atmos. Environ., 43, 51–63, https://doi.org/10.1016/j.atmosenv.2008.09.051, 2009.
Jakimavičius, D., Kriaučiūnienė, J., and Šarauskienė, D.: Impact of climate change on the Curonian Lagoon water balance components, salinity and water temperature in the 21st century, Oceanologia, 60, 378–389, https://doi.org/10.1016/j.oceano.2018.02.003, 2018.
Jakobsson, M., Long, A., Ingólfsson, Ó., Kjær, K. H., and Spielhagen, R. F.: New insights on Arctic Quaternary climate variability from palaeo-records and numerical modelling, Quaternary Sci. Rev., 29, 3349–3358, https://doi.org/10.1016/j.quascirev.2010.08.016, 2010.
Jakubowska, M., Jerzak, M., Normant, M., Burska, D., and Drzazgowski, J.: Effect of Carbon Dioxide-Induced Water Acidification on the Physiological Processes of the Baltic Isopod Saduria entomon, J. Shellfish Res., 32, 825–834, https://doi.org/10.2983/035.032.0326, 2013.
Jänes, H., Herkül, K., and Kotta, J.: Environmental niche separation between native and non-native benthic invertebrate species: Case study of the northern Baltic Sea, Mar. Environ. Res., 131, 123–133, https://doi.org/10.1016/j.marenvres.2017.08.001, 2017.
Jansen, J., Thornton, B. F., Jammet, M. M., Wik, M., Cortés, A., Friborg, T., MacIntyre, S., and Crill, P. M.: Climate-Sensitive Controls on Large Spring Emissions of CH4 and CO2 From Northern Lakes, J. Geophys. Res.-Biogeo, 124, 2379–2399, https://doi.org/10.1029/2019JG005094, 2019.
Jansson, A., Lischka, S., Boxhammer, T., Schulz, K. G., and Norkko, J.: Survival and settling of larval Macoma balthica in a large-scale mesocosm experiment at different fCO2 levels, Biogeosciences, 13, 3377–3385, https://doi.org/10.5194/bg-13-3377-2016, 2016.
Jin, H., Jönsson, A. M., Olsson, C., Lindström, J., Jönsson, P., and Eklundh, L.: New satellite-based estimates show significant trends in spring phenology and complex sensitivities to temperature and precipitation at northern European latitudes, Int. J. Biometeorol., 63, 763–775, https://doi.org/10.1007/s00484-019-01690-5, 2019.
Johansson, L., Ytreberg, E., Jalkanen, J.-P., Fridell, E., Eriksson, K. M., Lagerström, M., Maljutenko, I., Raudsepp, U., Fischer, V., and Roth, E.: Model for leisure boat activities and emissions – implementation for the Baltic Sea, Ocean Sci., 16, 1143–1163, https://doi.org/10.5194/os-16-1143-2020, 2020.
Johansson, M. M., Pellikka, H., Kahma, K. K., and Ruosteenoja, K.: Global sea level rise scenarios adapted to the Finnish coast, J. Mar. Syst., 129, 35–46, https://doi.org/10.1016/j.jmarsys.2012.08.007, 2014.
Jones, M. C. and Cheung, W. W. L.: Multi-model ensemble projections of climate change effects on global marine biodiversity, ICES J. Mar. Sci., 72, 741–752, https://doi.org/10.1093/icesjms/fsu172, 2014.
Jones, P. D., Lister, D. H., Osborn, T. J., Harpham, C., Salmon, M., and Morice, C. P.: Hemispheric and large-scale land-surface air temperature variations: An extensive revision and an update to 2010, J. Geophys. Res.-Atmos., 117, D05127, https://doi.org/10.1029/2011jd017139, 2012.
Jonson, J. E., Jalkanen, J. P., Johansson, L., Gauss, M., and Denier van der Gon, H. A. C.: Model calculations of the effects of present and future emissions of air pollutants from shipping in the Baltic Sea and the North Sea, Atmos. Chem. Phys., 15, 783–798, https://doi.org/10.5194/acp-15-783-2015, 2015.
Jonson, J. E., Gauss, M., Jalkanen, J.-P., and Johansson, L.: Effects of strengthening the Baltic Sea ECA regulations, Atmos. Chem. Phys., 19, 13469–13487, https://doi.org/10.5194/acp-19-13469-2019, 2019.
Jonsson, P. R., Kotta, J., Andersson, H. C., Herkül, K., Virtanen, E., Sandman, A. N., and Johannesson, K.: High climate velocity and population fragmentation may constrain climate-driven range shift of the key habitat former Fucus vesiculosus, Divers. Distrib., 24, 892–905, https://doi.org/10.1111/ddi.12733, 2018.
Jonsson, P. R., Moksnes, P.-O., Corell, H., Bonsdorff, E., and Nilsson Jacobi, M.: Ecological coherence of Marine Protected Areas: New tools applied to the Baltic Sea network, Aquat. Conserv., 30, 743–760, https://doi.org/10.1002/aqc.3286, 2020.
Josefsson, W.: Long-term global radiation in Stockholm, 1922–2018, SMHI (Swedish Meteorological and Hydrological Institute), Norrköping, Sweden, 92 pp., ISSN 0283-7730, 2019.
Joshi, M. M., Gregory, J. M., Webb, M. J., Sexton, D. M. H., and Johns, T. C.: Mechanisms for the land/sea warming contrast exhibited by simulations of climate change, Clim. Dyn., 30, 455–465, https://doi.org/10.1007/s00382-007-0306-1, 2008.
Jüssi, M., Härkönen, T., Helle, E., and Jüssi, I.: Decreasing Ice Coverage Will Reduce the Breeding Success of Baltic Grey Seal (Halichoerus grypu) Females, Ambio, 37, 80–85, 86, 2008.
Jüssi, M.: Living on an edge: land-locked seals in changing climate, Dissertation at: Department of Zoology, Institute of Ecology and Earth Sciences, Faculty of Science and Technology, University of Tartu, Estonia, 69 pp., http://hdl.handle.net/10062/28038 (last access: 16 February 2022), 2012.
Jylhä, K., Laapas, M., Ruosteenoja, K., Arvola, L., Drebs, A., Kersalo, J., Saku, S., Gregow, H., Hannula, H.-R., and Pirinen, P. J. B. E. R.: Climate variability and trends in the Valkea-Kotinen region, southern Finland: comparisons between the past, current and projected climates, Boreal Environ. Res., 19, 4–30, 2014.
Kadin, M., Frederiksen, M., Niiranen, S., and Converse, S. J.: Linking demographic and food-web models to understand management trade-offs, Ecol. Evol., 9, 8587–8600, https://doi.org/10.1002/ece3.5385, 2019.
Kahru, M. and Elmgren, R.: Multidecadal time series of satellite-detected accumulations of cyanobacteria in the Baltic Sea, Biogeosciences, 11, 3619–3633, https://doi.org/10.5194/bg-11-3619-2014, 2014.
Kahru, M., Elmgren, R., and Savchuk, O. P.: Changing seasonality of the Baltic Sea, Biogeosciences, 13, 1009–1018, https://doi.org/10.5194/bg-13-1009-2016, 2016.
Kahru, M., Elmgren, R., Di Lorenzo, E., and Savchuk, O.: Unexplained interannual oscillations of cyanobacterial blooms in the Baltic Sea, Sci. Rep.-UK, 8, 6365, https://doi.org/10.1038/s41598-018-24829-7, 2018.
Kahru, M., Elmgren, R., Kaiser, J., Wasmund, N., and Savchuk, O.: Cyanobacterial blooms in the Baltic Sea: Correlations with environmental factors, Harmful Algae, 92, 101739, https://doi.org/10.1016/j.hal.2019.101739, 2020.
Kanakidou, M., Myriokefalitakis, S., and Tsigaridis, K.: Aerosols in atmospheric chemistry and biogeochemical cycles of nutrients, Environ. Res. Lett., 13, 063004, https://doi.org/10.1088/1748-9326/aabcdb, 2018.
Karl, M., Bieser, J., Geyer, B., Matthias, V., Jalkanen, J.-P., Johansson, L., and Fridell, E.: Impact of a nitrogen emission control area (NECA) on the future air quality and nitrogen deposition to seawater in the Baltic Sea region, Atmos. Chem. Phys., 19, 1721–1752, https://doi.org/10.5194/acp-19-1721-2019, 2019a.
Karl, M., Jonson, J. E., Uppstu, A., Aulinger, A., Prank, M., Sofiev, M., Jalkanen, J.-P., Johansson, L., Quante, M., and Matthias, V.: Effects of ship emissions on air quality in the Baltic Sea region simulated with three different chemistry transport models, Atmos. Chem. Phys., 19, 7019–7053, https://doi.org/10.5194/acp-19-7019-2019, 2019b.
Karlsson, K.-G. and Devasthale, A.: Inter-comparison and evaluation of the four longest satellite-derived cloud climate data records: CLARA-A2, ESA Cloud CCI V3, ISCCP-HGM, and PATMOS-x, Remote Sens.-Basel, 10, 1567, https://doi.org/10.3390/rs10101567, 2018.
Kauhala, K., Bäcklin, B.-M., Raitaniemi, J., and Harding, K. C.: The effect of prey quality and ice conditions on the nutritional status of Baltic gray seals of different age groups, Mammal Res., 62, 351–362, https://doi.org/10.1007/s13364-017-0329-x, 2017.
Kauhala, K., Bergenius, M., Isomursu, M., and Raitaniemi, J.: Reproductive rate and nutritional status of Baltic ringed seals, Mammal Res., 64, 109–120, 2019.
Kauhala, K. and Kurkilahti, M.: Delayed effects of prey fish quality and winter temperature during the birth year on adult size and reproductive rate of Baltic grey seals, Mammal Res., 65, 117–126, https://doi.org/10.1007/s13364-019-00454-1, 2020.
Kauker, F. and Meier, H. E. M.: Modeling decadal variability of the Baltic Sea: 1. Reconstructing atmospheric surface data for the period 1902–1998, J. Geophys. Res.-Oceans, 108, 3268, https://doi.org/10.1029/2003JC001797, 2003.
Kiani, S., Irannezhad, M., Ronkanen, A.-K., Moradkhani, H., and Kløve, B.: Effects of recent temperature variability and warming on the Oulu-Hailuoto ice road season in the northern Baltic Sea, Cold Reg. Sci. Technol., 151, 1–8, https://doi.org/10.1016/j.coldregions.2018.02.010, 2018.
Kim, B.-M., Son, S.-W., Min, S.-K., Jeong, J.-H., Kim, S.-J., Zhang, X., Shim, T., and Yoon, J.-H.: Weakening of the stratospheric polar vortex by Arctic sea-ice loss, Nat. Commun., 5, 4646, https://doi.org/10.1038/ncomms5646, 2014.
Kirchner, N., Noormets, R., Kuttenkeuler, J., Erstorp, E. S., Holmlund, E. S., Rosqvist, G., Holmlund, P., Wennbom, M., and Karlin, T.: High-resolution bathymetric mapping reveals subaqueous glacial landforms in the Arctic alpine lake Tarfala, Sweden, J. Quat. Sci., 34, 452–462, https://doi.org/10.1002/jqs.3112, 2019.
Kirchner, N., Kuttenkeuler, J., Rosqvist, G., Hancke, M., Granebeck, A., Weckström, J., Weckström, K., Schenk, F., Korhola, A., and Eriksson, P.: A first continuous three-year temperature record from the dimictic arctic–alpine Lake Tarfala, northern Sweden, Arct. Antarct. Alp. Res., 53, 69–79, https://doi.org/10.1080/15230430.2021.1886577, 2021.
Kjellström, E., Bärring, L., Nikulin, G., Nilsson, C., Persson, G., and Strandberg, G.: Production and use of regional climate model projections – A Swedish perspective on building climate services, Clim. Serv., 2–3, 15–29, https://doi.org/10.1016/j.cliser.2016.06.004, 2016.
Kjellström, E., Nikulin, G., Strandberg, G., Christensen, O. B., Jacob, D., Keuler, K., Lenderink, G., van Meijgaard, E., Schär, C., and Somot, S.: European climate change at global mean temperature increases of 1.5 and 2 ∘C above pre-industrial conditions as simulated by the EURO-CORDEX regional climate models, Earth Syst. Dynam., 9, 459–478, https://doi.org/10.5194/esd-9-459-2018, 2018.
Kjerfve, B.: Oceanography of Chesapeake Bay, in: Hydrodynamics of Estuaries, edited by: Kjerfve, B., Taylor & Francis group, CRC Press, Boca Raton, USA, 16 pp., https://doi.org/10.1201/9781351073264, 1988.
Klais, R., Tamminen, T., Kremp, A., Spilling, K., and Olli, K.: Decadal-scale changes of dinoflagellates and diatoms in the anomalous Baltic Sea spring bloom, PLOS ONE, 6, e21567, https://doi.org/10.1371/journal.pone.0021567, 2011.
Klais, R., Tamminen, T., Kremp, A., Spilling, K., An, B. W., Hajdu, S., and Olli, K.: Spring phytoplankton communities shaped by interannual weather variability and dispersal limitation: Mechanisms of climate change effects on key coastal primary producers, Limnol. Oceanogr., 58, 753–762, https://doi.org/10.4319/lo.2013.58.2.0753, 2013.
Kïaviòš, M., Avotniece, Z., and Rodinovs, V.: Dynamics and Impacting Factors of Ice Regimes in Latvia Inland and Coastal Waters, Proceedings of the Latvian Academy of Sciences. Sect. B. Natural, Exact, and Applied Sciences., 70, 400–408, https://doi.org/10.1515/prolas-2016-0059, 2016.
Klawonn, I., Lavik, G., Böning, P., Marchant, H., Dekaezemacker, J., Mohr, W., and Ploug, H.: Simple approach for the preparation of 15−15N2-enriched water for nitrogen fixation assessments: evaluation, application and recommendations, Front. Microbiol., 6, 769, https://doi.org/10.3389/fmicb.2015.00769, 2015.
Kniebusch, M., Meier, H. E. M., Neumann, T., and Börgel, F.: Temperature Variability of the Baltic Sea Since 1850 and Attribution to Atmospheric Forcing Variables, J. Geophys. Res.-Oceans, 124, 4168–4187, https://doi.org/10.1029/2018jc013948, 2019a.
Kniebusch, M., Meier, H. E. M., and Radtke, H.: Changing Salinity Gradients in the Baltic Sea As a Consequence of Altered Freshwater Budgets, Geophys. Res. Lett., 46, 9739–9747, https://doi.org/10.1029/2019GL083902, 2019b.
Knight, J. R., Folland, C. K., and Scaife, A. A.: Climate impacts of the Atlantic Multidecadal Oscillation, Geophys. Res. Lett., 33, L17706, https://doi.org/10.1029/2006gl026242, 2006.
Knight, J. R., Allan, R. J., Folland, C. K., Vellinga, M., and Mann, M. E.: A signature of persistent natural thermohaline circulation cycles in observed climate, Geophys. Res. Lett., 32, L20708, https://doi.org/10.1029/2005GL024233, 2005.
Knight, J. R.: The Atlantic Multidecadal Oscillation Inferred from the Forced Climate Response in Coupled General Circulation Models, J. Climate, 22, 1610–1625, https://doi.org/10.1175/2008jcli2628.1, 2009.
Knoll, L. B., Sharma, S., Denfeld, B. A., Flaim, G., Hori, Y., Magnuson, J. J., Straile, D., and Weyhenmeyer, G. A.: Consequences of lake and river ice loss on cultural ecosystem services, Limnol. Oceanogr. Lett., 4, 119–131, https://doi.org/10.1002/lol2.10116, 2019.
Knudsen, M.: Ein hydrographischer Lehrsatz, Ann. Hydr. u. mar. Meteor., 28, 316–320, 1900.
Knudsen, M. F., Seidenkrantz, M.-S., Jacobsen, B. H., and Kuijpers, A.: Tracking the Atlantic Multidecadal Oscillation through the last 8,000 years, Nat. Commun., 2, 178, https://doi.org/10.1038/ncomms1186, 2011.
Kong, D., MacLeod, M., and Cousins, I. T.: Modelling the influence of climate change on the chemical concentrations in the Baltic Sea region with the POPCYCLING-Baltic model, Chemosphere, 110, 31–40, https://doi.org/10.1016/j.chemosphere.2014.02.044, 2014.
Kopp, R. E., Horton, R. M., Little, C. M., Mitrovica, J. X., Oppenheimer, M., Rasmussen, D. J., Strauss, B. H., and Tebaldi, C.: Probabilistic 21st and 22nd century sea-level projections at a global network of tide-gauge sites, Earths Future, 2, 383–406, https://doi.org/10.1002/2014EF000239, 2014.
Korhonen, J.: Long-term changes and variability of the winter and spring season hydrological regime in Finland, Faculty of Science, Institute for Atmospheric and Earth System Research, University of Helsinki, Finland, http://urn.fi/URN:ISBN:978-951-51-2800-3 (last access: 16 February 2022), 2019.
Korpinen, S., Honkanen, T., Vesakoski, O., Hemmi, A., Koivikko, R., Loponen, J., and Jormalainen, V.: Macroalgal Communities Face the Challenge of Changing Biotic Interactions: Review with Focus on the Baltic Sea, Ambio, 36, 203–211, https://doi.org/10.1579/0044-7447(2007)36[203:MCFTCO]2.0.CO;2, 2007.
Kortsch, S., Frelat, R., Pecuchet, L., Olivier, P., Putnis, I., Bonsdorff, E., Ojaveer, H., Jurgensone, I., Strāíe, S., Rubene, G., Krūze, Ē., and Nordström, M. C.: Disentangling temporal food web dynamics facilitates understanding of ecosystem functioning, J. Anim. Ecol., 90, 1205–1216, https://doi.org/10.1111/1365-2656.13447, 2021.
Köster, F. W., Huwer, B., Hinrichsen, H.-H., Neumann, V., Makarchouk, A., Eero, M., Dewitz, B. V., Hüssy, K., Tomkiewicz, J., Margonski, P., Temming, A., Hermann, J.-P., Oesterwind, D., Dierking, J., Kotterba, P., and Plikshs, M.: Eastern Baltic cod recruitment revisited–dynamics and impacting factors, ICES J. Mar. Sci., 74, 3–19, https://doi.org/10.1093/icesjms/fsw172, 2016.
Kotta, J., Vanhatalo, J., Jänes, H., Orav-Kotta, H., Rugiu, L., Jormalainen, V., Bobsien, I., Viitasalo, M., Virtanen, E., Sandman, A. N., Isaeus, M., Leidenberger, S., Jonsson, P. R., and Johannesson, K.: Integrating experimental and distribution data to predict future species patterns, Sci. Rep.-UK, 9, 1821, https://doi.org/10.1038/s41598-018-38416-3, 2019.
Kreienkamp, F., Lorenz, P., and Geiger, T.: Statistically downscaled CMIP6 projections show stronger warming for Germany, Atmosphere, 11, 1245, https://doi.org/10.3390/atmos11111245, 2020.
Kremp, A., Godhe, A., Egardt, J., Dupont, S., Suikkanen, S., Casabianca, S., and Penna, A.: Intraspecific variability in the response of bloom-forming marine microalgae to changed climate conditions, Ecol. Evol., 2, 1195–1207, https://doi.org/10.1002/ece3.245, 2012.
Kremp, A., Oja, J., LeTortorec, A. H., Hakanen, P., Tahvanainen, P., Tuimala, J., and Suikkanen, S.: Diverse seed banks favour adaptation of microalgal populations to future climate conditions, Environ. Microbiol., 18, 679–691, https://doi.org/10.1111/1462-2920.13070, 2016.
Krug, J., Eriksson, H., Heidecke, C., Kellomäki, S., Köhl, M., Lindner, M., and Saikkonen, K.: Socio-economic Impacts–Forestry and Agriculture, in: Second Assessment of Climate Change for the Baltic Sea Basin, edited by: BACC II Author Team, Springer International Publishing, Cham, 399–409, https://doi.org/10.1007/978-3-319-16006-1_21, 2015.
Kudryavtseva, N. and Soomere, T.: Satellite altimetry reveals spatial patterns of variations in the Baltic Sea wave climate, Earth Syst. Dynam., 8, 697–706, https://doi.org/10.5194/esd-8-697-2017, 2017.
Kühl, N., Gebhardt, C., Litt, T., and Hense, A.: Probability Density Functions as Botanical-Climatological Transfer Functions for Climate Reconstruction, Quat. Res., 58, 381–392, https://doi.org/10.1006/qres.2002.2380, 2002.
Kuliński, K., Schneider, B., Hammer, K., Machulik, U., and Schulz-Bull, D.: The influence of dissolved organic matter on the acid–base system of the Baltic Sea, J. Mar. Syst., 132, 106–115, https://doi.org/10.1016/j.jmarsys.2014.01.011, 2014.
Kuliński, K., Hammer, K., Schneider, B., and Schulz-Bull, D.: Remineralization of terrestrial dissolved organic carbon in the Baltic Sea, Mar. Chem., 181, 10–17, https://doi.org/10.1016/j.marchem.2016.03.002, 2016.
Kuliński, K., Schneider, B., Szymczycha, B., and Stokowski, M.: Structure and functioning of the acid–base system in the Baltic Sea, Earth Syst. Dynam., 8, 1107–1120, https://doi.org/10.5194/esd-8-1107-2017, 2017.
Kuliński, K., Szymczycha, B., Koziorowska, K., Hammer, K., and Schneider, B.: Anomaly of total boron concentration in the brackish waters of the Baltic Sea and its consequence for the CO2 system calculations, Mar. Chem., 204, 11–19, https://doi.org/10.1016/j.marchem.2018.05.007, 2018.
Kuliński, K., Rehder, G., Asmala, E., Bartosova, A., Carstensen, J., Gustafsson, B., Hall, P. O. J., Humborg, C., Jilbert, T., Jürgens, K., Meier, M., Müller-Karulis, B., Naumann, M., Olesen, J. E., Savchuk, O., Schramm, A., Slomp, C. P., Sofiev, M., Sobek, A., Szymczycha, B., and Undeman, E.: Baltic Earth Assessment Report on the biogeochemistry of the Baltic Sea, Earth Syst. Dynam. Discuss. [preprint], https://doi.org/10.5194/esd-2021-33, in review, 2021.
Kundzewicz, Z. W., Ulbrich, U., brücher, T., Graczyk, D., Krüger, A., Leckebusch, G. C., Menzel, L., Pińskwar, I., Radziejewski, M., and Szwed, M.: Summer Floods in Central Europe – Climate Change Track?, Nat. Hazards, 36, 165–189, https://doi.org/10.1007/s11069-004-4547-6, 2005.
Kuosa, H., Fleming-Lehtinen, V., Lehtinen, S., Lehtiniemi, M., Nygård, H., Raateoja, M., Raitaniemi, J., Tuimala, J., Uusitalo, L., and Suikkanen, S.: A retrospective view of the development of the Gulf of Bothnia ecosystem, J. Mar. Syst., 167, 78–92, https://doi.org/10.1016/j.jmarsys.2016.11.020, 2017.
Kuznetsov, I. and Neumann, T.: Simulation of carbon dynamics in the Baltic Sea with a 3D model, J. Mar. Syst., 111–112, 167–174, https://doi.org/10.1016/j.jmarsys.2012.10.011, 2013.
Kwiatkowski, L., Torres, O., Bopp, L., Aumont, O., Chamberlain, M., Christian, J. R., Dunne, J. P., Gehlen, M., Ilyina, T., John, J. G., Lenton, A., Li, H., Lovenduski, N. S., Orr, J. C., Palmieri, J., Santana-Falcón, Y., Schwinger, J., Séférian, R., Stock, C. A., Tagliabue, A., Takano, Y., Tjiputra, J., Toyama, K., Tsujino, H., Watanabe, M., Yamamoto, A., Yool, A., and Ziehn, T.: Twenty-first century ocean warming, acidification, deoxygenation, and upper-ocean nutrient and primary production decline from CMIP6 model projections, Biogeosciences, 17, 3439–3470, https://doi.org/10.5194/bg-17-3439-2020, 2020.
Laakso, L., Mikkonen, S., Drebs, A., Karjalainen, A., Pirinen, P., and Alenius, P.: 100 years of atmospheric and marine observations at the Finnish Utö Island in the Baltic Sea, Ocean Sci., 14, 617–632, https://doi.org/10.5194/os-14-617-2018, 2018.
Łabuz, T. A.: Environmental Impacts – Coastal Erosion and Coastline Changes, in: Second Assessment of Climate Change for the Baltic Sea Basin, edited by: BACC II Author Team, Springer International Publishing, Cham, 381–396, https://doi.org/10.1007/978-3-319-16006-1_20, 2015.
Łabuz, T. A., Grunewald, R., Bobykina, V., Chubarenko, B., Česnulevičius, A., Bautrėnas, A., Morkūnaitė, R., and Tõnisson, H.: Coastal Dunes of the Baltic Sea Shores: A Review, Quaest. Geogr., 37, 47–71, https://doi.org/10.2478/quageo-2018-0005, 2018.
Lah, L., Trense, D., Benke, H., Berggren, P., Gunnlaugsson, Þ., Lockyer, C., Öztürk, A., Öztürk, B., Pawliczka, I., Roos, A., Siebert, U., Skóra, K., Víkingsson, G., and Tiedemann, R.: Spatially Explicit Analysis of Genome-Wide SNPs Detects Subtle Population Structure in a Mobile Marine Mammal, the Harbor Porpoise, PLoS ONE, 11, e0162792, https://doi.org/10.1371/journal.pone.0162792, 2016.
Lamon, L., von Waldow, H., MacLeod, M., Scheringer, M., Marcomini, A., and Hungerbühler, K.: Modeling the Global Levels and Distribution of Polychlorinated Biphenyls in Air under a Climate Change Scenario, Environ. Sci. Technol., 43, 5818–5824, https://doi.org/10.1021/es900438j, 2009.
Lampe, M. and Lampe, R.: Evolution of a large Baltic beach ridge plain (Neudarss, NE Germany): A continuous record of sea-level and wind-field variation since the Homeric Minimum, Earth Surf. Process. Landf., 43, 3042–3056, https://doi.org/10.1002/esp.4468, 2018.
Landerer, F. W., Jungclaus, J. H., and Marotzke, J.: Regional dynamic and steric sea level change in response to the IPCC-A1B scenario, J. Phys. Oceanogr., 37, 296–312, https://doi.org/10.1175/JPO3013.1, 2007.
Lang, A. and Mikolajewicz, U.: The long-term variability of extreme sea levels in the German Bight, Ocean Sci., 15, 651–668, https://doi.org/10.5194/os-15-651-2019, 2019.
Langner, J., Engardt, M., Baklanov, A., Christensen, J. H., Gauss, M., Geels, C., Hedegaard, G. B., Nuterman, R., Simpson, D., Soares, J., Sofiev, M., Wind, P., and Zakey, A.: A multi-model study of impacts of climate change on surface ozone in Europe, Atmos. Chem. Phys., 12, 10423–10440, https://doi.org/10.5194/acp-12-10423-2012, 2012.
Lappe, C. and Umlauf, L.: Efficient boundary mixing due to near-inertial waves in a nontidal basin: Observations from the Baltic Sea, J. Geophys. Res.-Oceans, 121, 8287–8304, https://doi.org/10.1002/2016JC011985, 2016.
Larsson, K., Hajdu, S., Kilpi, M., Larsson, R., Leito, A., and Lyngs, P.: Effects of an extensive Prymnesium polylepis bloom on breeding eiders in the Baltic Sea, J. Sea Res., 88, 21–28, https://doi.org/10.1016/j.seares.2013.12.017, 2014.
Larsson, U., Elmgren, R., and Wulff, F.: Eutrophication and the Baltic Sea: causes and consequences, Ambio, 14, 9–14, 1985.
Larsson, U., Hajdu, S., Walve, J., and Elmgren, R.: Baltic Sea nitrogen fixation estimated from the summer increase in upper mixed layer total nitrogen, Limnol. Oceanogr., 46, 811–820, https://doi.org/10.4319/lo.2001.46.4.0811, 2001.
Laskar, J., Robutel, P., Joutel, F., Gastineau, M., Correia, A. C. M., and Levrard, B.: A long-term numerical solution for the insolation quantities of the Earth, Astron. Astrophys., 428, 261–285, https://doi.org/10.1051/0004-6361:20041335, 2004.
Lass, H. U. and Matthäus, W.: On temporal wind variations forcing salt water inflows into the Baltic Sea, Tellus A, 48, 663–671, https://doi.org/10.1034/j.1600-0870.1996.t01-4-00005.x, 1996.
Le Cozannet, G., Nicholls, R. J., Hinkel, J., Sweet, W. V., McInnes, K. L., Van de Wal, R. S. W., Slangen, A. B. A., Lowe, J. A., and White, K. D.: Sea Level Change and Coastal Climate Services: The Way Forward, J. Mar. Sci. Eng., 5, 49, https://doi.org/10.3390/jmse5040049, 2017.
Leckebusch, G. C. and Ulbrich, U.: On the relationship between cyclones and extreme windstorm events over Europe under climate change, Global Planet. Change, 44, 181–193, https://doi.org/10.1016/j.gloplacha.2004.06.011, 2004.
Lee, X., Goulden, M. L., Hollinger, D. Y., Barr, A., Black, T. A., Bohrer, G., Bracho, R., Drake, B., Goldstein, A., Gu, L., Katul, G., Kolb, T., Law, B. E., Margolis, H., Meyers, T., Monson, R., Munger, W., Oren, R., Paw U, K. T., Richardson, A. D., Schmid, H. P., Staebler, R., Wofsy, S., and Zhao, L.: Observed increase in local cooling effect of deforestation at higher latitudes, Nature, 479, 384–387, https://doi.org/10.1038/nature10588, 2011.
Lehikoinen, A., Kilpi, M., and Öst, M.: Winter climate affects subsequent breeding success of common eiders, Global Change Biol., 12, 1355–1365, https://doi.org/10.1111/j.1365-2486.2006.01162.x, 2006.
Lehikoinen, A. and Jaatinen, K.: Delayed autumn migration in northern European waterfowl, J. Ornithol., 153, 563–570, 2012.
Lehikoinen, A., Jaatinen, K., Vähätalo, A. V., Clausen, P., Crowe, O., Deceuninck, B., Hearn, R., Holt, C. A., Hornman, M., Keller, V., Nilsson, L., Langendoen, T., Tománková, I., Wahl, J., and Fox, A. D.: Rapid climate driven shifts in wintering distributions of three common waterbird species, Global Change Biol., 19, 2071–2081, https://doi.org/10.1111/gcb.12200, 2013.
Lehmann, A., Krauß, W., and Hinrichsen, H.-H.: Effects of remote and local atmospheric forcing on circulation and upwelling in the Baltic Sea, Tellus A, 54, 299–316, https://doi.org/10.3402/tellusa.v54i3.12138, 2002.
Lehmann, A., Getzlaff, K., and Harlaß, J.: Detailed assessment of climate variability in the Baltic Sea area for the period 1958 to 2009, Clim. Res., 46, 185–196, https://doi.org/10.3354/cr00876, 2011.
Lehmann, A., Myrberg, K., and Höflich, K.: A statistical approach to coastal upwelling in the Baltic Sea based on the analysis of satellite data for 1990–2009, Oceanologia, 54, 369–393, https://doi.org/10.5697/oc.54-3.369, 2012.
Lehmann, A. and Post, P.: Variability of atmospheric circulation patterns associated with large volume changes of the Baltic Sea, Adv. Sci. Res., 12, 219–225, https://doi.org/10.5194/asr-12-219-2015, 2015.
Lehmann, A., Höflich, K., Post, P., and Myrberg, K.: Pathways of deep cyclones associated with large volume changes (LVCs) and major Baltic inflows (MBIs), J. Mar. Syst., 167, 11–18, https://doi.org/10.1016/j.jmarsys.2016.10.014, 2017.
Lehmann, A., Myrberg, K., Post, P., Chubarenko, I., Dailidiene, I., Hinrichsen, H. H., Hüssy, K., Liblik, T., Meier, H. E. M., Lips, U., and Bukanova, T.: Salinity dynamics of the Baltic Sea, Earth Syst. Dynam., 13, 373–392,https://doi.org/10.5194/esd-13-373-2022, 2022.
Lehtonen, I.: Four consecutive snow-rich winters in Southern Finland: 2009/2010–2012/2013, Weather 70, 3–8, https://doi.org/10.1002/wea.2360, 2015.
Lehtoranta, J., Savchuk, O. P., Elken, J., Dahlbo, K., Kuosa, H., Raateoja, M., Kauppila, P., Räike, A., and Pitkänen, H.: Atmospheric forcing controlling inter-annual nutrient dynamics in the open Gulf of Finland, J. Mar. Syst., 171, 4–20, https://doi.org/10.1016/j.jmarsys.2017.02.001, 2017.
Leidenberger, S., De Giovanni, R., Kulawik, R., Williams, A. R., and Bourlat, S. J.: Mapping present and future potential distribution patterns for a meso-grazer guild in the Baltic Sea, J. Biogeogr., 42, 241–254, https://doi.org/10.1111/jbi.12395, 2015.
Lenggenhager, S. and Martius, O.: Atmospheric blocks modulate the odds of heavy precipitation events in Europe, Clim. Dyn., 53, 4155–4171, https://doi.org/10.1007/s00382-019-04779-0, 2019.
Leppäranta, M.: Land-ice interaction in the Baltic Sea, Est. J. Earth Sci., 62, 2–14, https://doi.org/10.3176/earth.2013.01, 2013.
Leppäranta, M. and Myrberg, K.: Physical oceanography of the Baltic Sea, Springer Praxis Books, Springer, Berlin, Heidelberg, 378 pp., https://doi.org/10.1007/978-3-540-79703-6, 2009.
Leppäranta, M., Oikkonen, A., Shirasawa, K., and Fukamachi, Y.: A treatise on frequency spectrum of drift ice velocity, Cold Reg. Sci. Technol., 76, 83–91, https://doi.org/10.1016/j.coldregions.2011.12.005, 2012.
Lépy, É. and Pasanen, L.: Observed Regional Climate Variability during the Last 50 Years in Reindeer Herding Cooperatives of Finnish Fell Lapland, Climate, 5, 81, https://doi.org/10.3390/cli5040081, 2017.
Lewandowska, A. M., Breithaupt, P., Hillebrand, H., Hoppe, H.-G., Jürgens, K., and Sommer, U.: Responses of primary productivity to increased temperature and phytoplankton diversity, J. Sea Res., 72, 87–93, https://doi.org/10.1016/j.seares.2011.10.003, 2012.
Lewandowska, A. M., Boyce, D. G., Hofmann, M., Matthiessen, B., Sommer, U., and Worm, B.: Effects of sea surface warming on marine plankton, Ecol. Lett., 17, 614–623, https://doi.org/10.1111/ele.12265, 2014.
Li, J., Huo, R., Chen, H., Zhao, Y., and Zhao, T.: Comparative Assessment and Future Prediction Using CMIP6 and CMIP5 for Annual Precipitation and Extreme Precipitation Simulation, Atmos. Sci., 9, https://doi.org/10.3389/feart.2021.687976, 2021.
Liblik, T. and Lips, U.: Stratification Has Strengthened in the Baltic Sea – An Analysis of 35 Years of Observational Data, Front. Earth Sci., 7, 174, https://doi.org/10.3389/feart.2019.00174, 2019.
Lindegren, M., Möllmann, C., Nielsen, A., Brander, K., MacKenzie, B. R., and Stenseth, N. C.: Ecological forecasting under climate change: the case of Baltic cod, P. Roy. Soc. B-Biol. Sci., 277, 2121–2130, https://doi.org/10.1098/rspb.2010.0353, 2010.
Lindegren, M., Blenckner, T., and Stenseth, N. C.: Nutrient reduction and climate change cause a potential shift from pelagic to benthic pathways in a eutrophic marine ecosystem, Global Change Biol., 18, 3491–3503, https://doi.org/10.1111/j.1365-2486.2012.02799.x, 2012.
Lindeskog, M., Smith, B., Lagergren, F., Sycheva, E., Ficko, A., Pretzsch, H., and Rammig, A.: Accounting for forest management in the estimation of forest carbon balance using the dynamic vegetation model LPJ-GUESS (v4.0, r9710): implementation and evaluation of simulations for Europe, Geosci. Model Dev., 14, 6071–6112, https://doi.org/10.5194/gmd-14-6071-2021, 2021.
Lindroth, A., Holst, J., Linderson, M.-L., Aurela, M., Biermann, T., Heliasz, M., Chi, J., Ibrom, A., Kolari, P., Klemedtsson, L., Krasnova, A., Laurila, T., Lehner, I., Lohila, A., Mammarella, I., Mölder, M., Löfvenius, M. O., Peichl, M., Pilegaard, K., Soosaar, K., Vesala, T., Vestin, P., Weslien, P., and Nilsson, M.: Effects of drought and meteorological forcing on carbon and water fluxes in Nordic forests during the dry summer of 2018, Philos. T. Roy. Soc. B., 375, 20190516, https://doi.org/10.1098/rstb.2019.0516, 2020.
Lindström, G.: Hydrologiska aspekter på åtgärder mot vattenbrist och torka inom avrinningsområden, Hydrologi No. 122, SMHI, Norrköping, Sweden, 60 pp., ISSN 02837722), https://www.smhi.se/publikationer/hydrologiska-aspekter-pa-atgarder-mot-vattenbrist-och-torka (last access: 16 February 2022), 2019.
Lindvall, J. and Svensson, G.: The diurnal temperature range in the CMIP5 models, Clim. Dyn., 44, 405–421, https://doi.org/10.1007/s00382-014-2144-2, 2015.
Lips, I. and Lips, U.: Abiotic factors influencing cyanobacterial bloom development in the Gulf of Finland (Baltic Sea), Hydrobiologia, 614, 133–140, https://doi.org/10.1007/s10750-008-9449-2, 2008.
Liu, Y., Meier, H. E. M., and Eilola, K.: Nutrient transports in the Baltic Sea – results from a 30-year physical–biogeochemical reanalysis, Biogeosciences, 14, 2113–2131, https://doi.org/10.5194/bg-14-2113-2017, 2017.
Liu, Y., Axell, L., Jandt, S., Lorkowski, I., Lindenthal, A., Verjovkina, S., and Schwichtenberg, F.: Baltic Sea Production Centre BALTICSEA_REANALYSIS_PHY_003_011, COPERNICUS Marine Environment Monitoring Service, 35 pp., https://doi.org/10.48670/moi-00013, 2019.
Liu, Z., Zhu, J., Rosenthal, Y., Zhang, X., Otto-Bliesner, B. L., Timmermann, A., Smith, R. S., Lohmann, G., Zheng, W., and Elison Timm, O.: The Holocene temperature conundrum, P. Natl. Acad. Sci. USA, 111, E3501, https://doi.org/10.1073/pnas.1407229111, 2014.
Lopez, L. S., Hewitt, B. A., and Sharma, S.: Reaching a breaking point: How is climate change influencing the timing of ice breakup in lakes across the northern hemisphere?, Limnol. Oceanogr., 64, 2621–2631, https://doi.org/10.1002/lno.11239, 2019.
Löptien, U. and Meier, H. E. M.: The influence of increasing water turbidity on the sea surface temperature in the Baltic Sea: a model sensitivity study, J. Mar. Syst., 88, 323–331, https://doi.org/10.1016/j.jmarsys.2011.06.001, 2011.
Ludwig, J.: Climate Signals in Coastal Deposits, Doctoral Dissertation, Geowissenschaften, Universität Hamburg, 104 pp., https://ediss.sub.uni-hamburg.de/handle/ediss/7009 (last access: 16 February 2022), 2016.
Łukawska-Matuszewska, K. and Graca, B.: Pore water alkalinity below the permanent halocline in the Gdańsk Deep (Baltic Sea) – Concentration variability and benthic fluxes, Mar. Chem., 204, 49–61, https://doi.org/10.1016/j.marchem.2018.05.011, 2018.
Lundin, E. J., Klaminder, J., Bastviken, D., Olid, C., Hansson, S. V., and Karlsson, J.: Large difference in carbon emission – burial balances between boreal and arctic lakes, Sci. Rep.-UK, 5, 14248, https://doi.org/10.1038/srep14248, 2015.
Lundquist, J. K., DuVivier, K. K., Kaffine, D., and Tomaszewski, J. M.: Costs and consequences of wind turbine wake effects arising from uncoordinated wind energy development, Nat. Energy, 4, 26–34, https://doi.org/10.1038/s41560-018-0281-2, 2019.
Luomaranta, A., Ruosteenoja, K., Jylhä, K., Gregow, H., Haapala, J., and Laaksonen, A.: Multimodel estimates of the changes in the Baltic Sea ice cover during the present century, Tellus A, 66, 22617, https://doi.org/10.3402/tellusa.v66.22617, 2014.
Luomaranta, A., Aalto, J., and Jylhä, K.: Snow cover trends in Finland over 1961–2014 based on gridded snow depth observations, Int. J. Climatol., 39, 3147–3159, https://doi.org/10.1002/joc.6007, 2019.
Luoto, M., Fronzek, S., and Zuidhoff, F. S.: Spatial modelling of palsa mires in relation to climate in northern Europe, Earth Surface Processes and Landforms: The Journal of the British Geomorphological Research Group, 29, 1373–1387, https://doi.org/10.1002/esp.1099, 2004.
Luterbacher, J., Werner, J. P., Smerdon, J. E., Fernández-Donado, L., González-Rouco, F. J., Barriopedro, D., Ljungqvist, F. C., Büntgen, U., Zorita, E., Wagner, S., Esper, J., McCarroll, D., Toreti, A., Frank, D., Jungclaus, J. H., Barriendos, M., Bertolin, C., Bothe, O., Brázdil, R., Camuffo, D., Dobrovolný, P., Gagen, M., García-Bustamante, E., Ge, Q., Gómez-Navarro, J. J., Guiot, J., Hao, Z., Hegerl, G. C., Holmgren, K., Klimenko, V. V., Martín-Chivelet, J., Pfister, C., Roberts, N., Schindler, A., Schurer, A., Solomina, O., von Gunten, L., Wahl, E., Wanner, H., Wetter, O., Xoplaki, E., Yuan, N., Zanchettin, D., Zhang, H., and Zerefos, C.: European summer temperatures since Roman times, Environ. Res. Lett., 11, 024001, https://doi.org/10.1088/1748-9326/11/2/024001, 2016.
Luyssaert, S., Marie, G., Valade, A., Chen, Y.-Y., Njakou Djomo, S., Ryder, J., Otto, J., Naudts, K., Lansø, A. S., Ghattas, J., and McGrath, M. J.: Trade-offs in using European forests to meet climate objectives, Nature, 562, 259–262, https://doi.org/10.1038/s41586-018-0577-1, 2018.
Lyon, S. W., Destouni, G., Giesler, R., Humborg, C., Mörth, M., Seibert, J., Karlsson, J., and Troch, P. A.: Estimation of permafrost thawing rates in a sub-arctic catchment using recession flow analysis, Hydrol. Earth Syst. Sci., 13, 595–604, https://doi.org/10.5194/hess-13-595-2009, 2009.
Maberly, S. C., O'Donnell, R. A., Woolway, R. I., Cutler, M. E. J., Gong, M., Jones, I. D., Merchant, C. J., Miller, C. A., Politi, E., Scott, E. M., Thackeray, S. J., and Tyler, A. N.: Global lake thermal regions shift under climate change, Nat. Commun., 11, 1232, https://doi.org/10.1038/s41467-020-15108-z, 2020.
Macdonald, R. W., Mackay, D., Li, Y. F., and Hickie, B.: How Will Global Climate Change Affect Risks from Long-Range Transport of Persistent Organic Pollutants?, Hum. Ecol. Risk Assess., 9, 643–660, https://doi.org/10.1080/713609959, 2003.
MacKenzie, B. R. and Schiedek, D.: Daily ocean monitoring since the 1860s shows record warming of northern European seas, Global Change Biol., 13, 1335–1347, https://doi.org/10.1111/j.1365-2486.2007.01360.x, 2007.
MacKenzie, B. R., Meier, H. E. M., Lindegren, M., Neuenfeldt, S., Eero, M., Blenckner, T., Tomczak, M. T., and Niiranen, S.: Impact of Climate Change on Fish Population Dynamics in the Baltic Sea: A Dynamical Downscaling Investigation, Ambio, 41, 626–636, https://doi.org/10.1007/s13280-012-0325-y, 2012.
MacLean, I. M. D., Austin, G. E., Rehfisch, M. M., Blew, J., Crowe, O., Delany, S., Devos, K., Deceuninck, B., Günther, K., Laursen, K., von Roomen, M., and Wahl, J.: Climate change causes rapid changes in the distribution and site abundance of birds in winter, Global Change Biol., 14, 2489–2500, https://doi.org/10.1111/j.1365-2486.2008.01666.x, 2008.
Madsen, K. S., Høyer, J. L., Suursaar, Ü., She, J., and Knudsen, P.: Sea Level Trends and Variability of the Baltic Sea From 2D Statistical Reconstruction and Altimetry, Front. Earth Sci., 7, 243, https://doi.org/10.3389/feart.2019.00243, 2019.
Magaard, L. and Rheinheimer, G.: Meereskunde der Ostsee, Springer-Verlag, New York, Heidelberg, Berlin, 269 pp., ISBN 9783540068976, 1974.
Mäkinen, K., Vuorinen, I., and Hänninen, J.: Climate-induced hydrography change favours small-bodied zooplankton in a coastal ecosystem, Hydrobiologia, 792, 83–96, https://doi.org/10.1007/s10750-016-3046-6, 2017.
Mäll, M., Nakamura, R., Suursaar, Ü., and Shibayama, T.: Pseudo-climate modelling study on projected changes in extreme extratropical cyclones, storm waves and surges under CMIP5 multi-model ensemble: Baltic Sea perspective, Nat. Hazards, 102, 67–99, https://doi.org/10.1007/s11069-020-03911-2, 2020.
Mann, M. E., Steinman, B. A., and Miller, S. K.: Absence of internal multidecadal and interdecadal oscillations in climate model simulations, Nat. Commun., 11, 49, https://doi.org/10.1038/s41467-019-13823-w, 2020.
Mann, M. E., Steinman, B. A., Brouillette, D. J., and Miller, S. K.: Multidecadal climate oscillations during the past millennium driven by volcanic forcing, Science, 371, 1014, https://doi.org/10.1126/science.abc5810, 2021.
Männikus, R., Soomere, T., and Viška, M.: Variations in the mean, seasonal and extreme water level on the Latvian coast, the eastern Baltic Sea, during 1961–2018, Estuar. Coast. Shelf Sci., 245, 106827, https://doi.org/10.1016/j.ecss.2020.106827, 2020.
Marchowski, D., Jankowiak, Ł., Wysocki, D., Ławicki, Ł., and Girjatowicz, J.: Ducks change wintering patterns due to changing climate in the important wintering waters of the Odra River Estuary, PeerJ, 5, e3604, https://doi.org/10.7717/peerj.3604, 2017.
Marcos, M., Calafat, F. M., Berihuete, Á., and Dangendorf, S.: Long-term variations in global sea level extremes, J. Geophys. Res.-Oceans, 120, 8115–8134, https://doi.org/10.1002/2015jc011173, 2015.
Marcos, M. and Woodworth, P. L.: Spatiotemporal changes in extreme sea levels along the coasts of the North Atlantic and the Gulf of Mexico, J. Geophys. Res.-Oceans, 122, 7031–7048, https://doi.org/10.1002/2017JC013065, 2017.
Markowicz, K. M. and Uscka-Kowalkowska, J.: Long-term and seasonal variability of the aerosol optical depth at Mount Kasprowy Wierch (Poland), J. Geophys. Res.-Atmos., 120, 1865–1879, https://doi.org/10.1002/2014JD022580, 2015.
Marshall, G. J., Jylhä, K., Kivinen, S., Laapas, M., and Dyrrdal, A. V.: The role of atmospheric circulation patterns in driving recent changes in indices of extreme seasonal precipitation across Arctic Fennoscandia, Clim. Change, 162, 741–759, https://doi.org/10.1007/s10584-020-02747-w, 2020.
Marshall, J., Johnson, H., and Goodman, J.: A Study of the Interaction of the North Atlantic Oscillation with Ocean Circulation, J. Climate, 14, 1399–1421, https://doi.org/10.1175/1520-0442(2001)014<1399:ASOTIO>2.0.CO;2, 2001.
Mastrandrea, M. D., Field, C. B., Stocker, T. F., Edenhofer, O., Ebi, K. L., Frame, D. J., Held, H., Kriegler, E., Mach, K. J., Matschoss, P. R., Plattne, G.-K., Yohe, G. W., and Zwiers, F. W.: Guidance Note for Lead Authors of the IPCC Fifth Assessment Report on Consistent Treatment of Uncertainties, Intergovernmental Panel on Climate Change (IPCC), http://www.ipcc.ch (last access: 16 February 2022), 2010.
Matthäus, W. and Franck, H.: Characteristics of major Baltic inflows – a statistical analysis, Cont. Shelf Res., 12, 1375–1400, https://doi.org/10.1016/0278-4343(92)90060-W, 1992.
Matthews, T., Murphy, C., Wilby, R. L., and Harrigan, S.: A cyclone climatology of the British-Irish Isles 1871–2012, Int. J. Climatol., 36, 1299–1312, https://doi.org/10.1002/joc.4425, 2016.
Matthias, V., Arndt, J. A., Aulinger, A., Bieser, J., Denier van der Gon, H., Kranenburg, R., Kuenen, J., Neumann, D., Pouliot, G., and Quante, M.: Modeling emissions for three-dimensional atmospheric chemistry transport models, J. Air Waste Manag., 68, 763–800, https://doi.org/10.1080/10962247.2018.1424057, 2018.
Mauri, A., Davis, B. A. S., Collins, P. M., and Kaplan, J. O.: The influence of atmospheric circulation on the mid-Holocene climate of Europe: a data–model comparison, Clim. Past, 10, 1925–1938, https://doi.org/10.5194/cp-10-1925-2014, 2014.
Mauri, A., Davis, B. A. S., Collins, P. M., and Kaplan, J. O.: The climate of Europe during the Holocene: a gridded pollen-based reconstruction and its multi-proxy evaluation, Quaternary Sci. Rev., 112, 109–127, https://doi.org/10.1016/j.quascirev.2015.01.013, 2015.
McClelland, J. W., Holmes, R. M., Peterson, B. J., and Stieglitz, M.: Increasing river discharge in the Eurasian Arctic: Consideration of dams, permafrost thaw, and fires as potential agents of change, J. Geophys. Res.-Atmos., 109, D18102, https://doi.org/10.1029/2004JD004583, 2004.
McCrackin, M. L., Muller-Karulis, B., Gustafsson, B. G., Howarth, R. W., Humborg, C., Svanbäck, A., and Swaney, D. P.: A Century of Legacy Phosphorus Dynamics in a Large Drainage Basin, Global Biogeochem. Cy., 32, 1107–1122, https://doi.org/10.1029/2018GB005914, 2018.
McGlade, J. M.: 12 The North Sea Large Marine Ecosystem, in: Large Marine Ecosystems, edited by: Sherman, K. and Skjoldal, H. R., Elsevier, 339–412, https://doi.org/10.1016/S1570-0461(02)80064-7, 2002.
McNamara, J. M. and Houston, A. I.: State-dependent life histories, Nature, 380, 215–221, https://doi.org/10.1038/380215a0, 1996.
Meehl, G. A., Washington, W. M., Ammann, C. M., Arblaster, J. M., Wigley, T. M. L., and Tebaldi, C.: Combinations of Natural and Anthropogenic Forcings in Twentieth-Century Climate, J. Climate, 17, 3721–3727, https://doi.org/10.1175/1520-0442(2004)017<3721:conaaf>2.0.co;2, 2004.
Meehl, G. A., Senior, C. A., Eyring, V., Flato, G., Lamarque, J.-F., Stouffer, R. J., Taylor, K. E., and Schlund, M.: Context for interpreting equilibrium climate sensitivity and transient climate response from the CMIP6 Earth system models, Sci. Adv., 6, eaba1981, https://doi.org/10.1126/sciadv.aba1981, 2020.
Meier, H. E. M.: Regional ocean climate simulations with a 3D ice–ocean model for the Baltic Sea. Part 2: results for sea ice, Clim. Dyn., 19, 255–266, https://doi.org/10.1007/s00382-001-0225-5, 2002.
Meier, H. E. M. and Döscher, R.: Simulated water and heat cycles of the Baltic Sea using a 3D coupled atmosphere-ice-ocean model, Boreal Environ. Res., 7, 327–334, 2002.
Meier, H. E. M. and Kauker, F.: Modeling decadal variability of the Baltic Sea: 2. Role of freshwater inflow and large-scale atmospheric circulation for salinity, J. Geophys. Res.-Oceans, 108, 3368, https://doi.org/10.1029/2003JC001799, 2003.
Meier, H. E. M., Broman, B., and Kjellström, E.: Simulated sea level in past and future climates of the Baltic Sea, Clim. Res., 27, 59–75, https://doi.org/10.3354/cr027059, 2004a.
Meier, H. E. M., Döscher, R., and Halkka, A.: Simulated distributions of Baltic Sea-ice in warming climate and consequences for the winter habitat of the Baltic ringed seal, Ambio, 33, 249–256, https://doi.org/10.1579/0044-7447-33.4.249, 2004b.
Meier, H. E. M.: Baltic Sea climate in the late twenty-first century: a dynamical downscaling approach using two global models and two emission scenarios, Clim. Dyn., 27, 39–68, https://doi.org/10.1007/s00382-006-0124-x, 2006.
Meier, H. E. M., Kjellström, E., and Graham, L. P.: Estimating uncertainties of projected Baltic Sea salinity in the late 21st century, Geophys. Res. Lett., 33, L15705, https://doi.org/10.1029/2006GL026488, 2006.
Meier, H. E. M., Andersson, H. C., Eilola, K., Gustafsson, B. G., Kuznetsov, I., Müller-Karulis, B., Neumann, T., and Savchuk, O. P.: Hypoxia in future climates: A model ensemble study for the Baltic Sea, Geophys. Res. Lett., 38, L24608, https://doi.org/10.1029/2011GL049929, 2011a.
Meier, H. E. M., Eilola, K., and Almroth, E.: Climate-related changes in marine ecosystems simulated with a 3-dimensional coupled physical-biogeochemical model of the Baltic Sea, Clim. Res., 48, 31–55, https://doi.org/10.3354/cr00968 2011b.
Meier, H. E. M., Höglund, A., Döscher, R., Andersson, H., Löptien, U., and Kjellström, E.: Quality assessment of atmospheric surface fields over the Baltic Sea from an ensemble of regional climate model simulations with respect to ocean dynamics, Oceanologia, 53, 193–227, https://doi.org/10.5697/oc.53-1-TI.193, 2011c.
Meier, H. E. M., Andersson, H. C., Arheimer, B., Blenckner, T., Chubarenko, B., Donnelly, C., Eilola, K., Gustafsson, B. G., Hansson, A., Havenhand, J., and others: Comparing reconstructed past variations and future projections of the Baltic Sea ecosystem – first results from multi-model ensemble simulations, Environ. Res. Lett., 7, 34005, https://doi.org/10.1088/1748-9326/7/3/034005, 2012a.
Meier, H. E. M., Hordoir, R., Andersson, H. C., Dieterich, C., Eilola, K., Gustafsson, B. G., Höglund, A., and Schimanke, S.: Modeling the combined impact of changing climate and changing nutrient loads on the Baltic Sea environment in an ensemble of transient simulations for 1961–2099, Clim. Dyn., 39, 2421–2441, https://doi.org/10.1007/s00382-012-1339-7, 2012b.
Meier, H. E. M., Müller-Karulis, B., Andersson, H. C., Dieterich, C., Eilola, K., Gustafsson, B. G., Höglund, A., Hordoir, R., Kuznetsov, I., Neumann, T., Ranjbar, Z., Savchuk, O. P., and Schimanke, S.: Impact of climate change on ecological quality indicators and biogeochemical fluxes in the Baltic Sea: a multi-model ensemble study, Ambio, 41, 558–573, https://doi.org/10.1007/s13280-012-0320-3, 2012c.
Meier, H. E. M., Rutgersson, A., and Reckermann, M.: An Earth System Science Program for the Baltic Sea Region, Eos Trans. AGU, 95, 109–110, https://doi.org/10.1002/2014EO130001, 2014.
Meier, H. E. M.: Projected Change–Marine Physics, in: Second Assessment of Climate Change for the Baltic Sea Basin, edited by: BACC II Author Team, Springer International Publishing, Cham, 243–252, https://doi.org/10.1007/978-3-319-16006-1_13, 2015.
Meier, H. E. M., Höglund, A., Eilola, K., and Almroth-Rosell, E.: Impact of accelerated future global mean sea level rise on hypoxia in the Baltic Sea, Clim. Dyn., 49, 163–172, https://doi.org/10.1007/s00382-016-3333-y, 2017.
Meier, H. E. M., Edman, M. K., Eilola, K. J., Placke, M., Neumann, T., Andersson, H. C., Brunnabend, S.-E., Dieterich, C., Frauen, C., Friedland, R., Gröger, M., Gustafsson, B. G., Gustafsson, E., Isaev, A., Kniebusch, M., Kuznetsov, I., Müller-Karulis, B., Omstedt, A., Ryabchenko, V., Saraiva, S., and Savchuk, O. P.: Assessment of Eutrophication Abatement Scenarios for the Baltic Sea by Multi-Model Ensemble Simulations, Front. Mar. Sci., 5, 440, https://doi.org/10.3389/fmars.2018.00440, 2018a.
Meier, H. E. M., Väli, G., Naumann, M., Eilola, K., and Frauen, C.: Recently accelerated oxygen consumption rates amplify deoxygenation in the Baltic Sea, J. Geophys. Res.-Oceans, 123, 3227–3240, https://doi.org/10.1029/2017JC013686, 2018b.
Meier, H. E. M., Dieterich, C., Eilola, K., Gröger, M., Höglund, A., Radtke, H., Saraiva, S., and Wåhlström, I.: Future projections of record-breaking sea surface temperature and cyanobacteria bloom events in the Baltic Sea, Ambio, 48, 1362–1376, https://doi.org/10.1007/s13280-019-01235-5, 2019a.
Meier, H. E. M., Edman, M., Eilola, K., Placke, M., Neumann, T., Andersson, H. C., Brunnabend, S.-E., Dieterich, C., Frauen, C., Friedland, R., Gröger, M., Gustafsson, B. G., Gustafsson, E., Isaev, A., Kniebusch, M., Kuznetsov, I., Müller-Karulis, B., Naumann, M., Omstedt, A., Ryabchenko, V., Saraiva, S., and Savchuk, O. P.: Assessment of Uncertainties in Scenario Simulations of Biogeochemical Cycles in the Baltic Sea, Front. Mar. Sci., 6, 46, https://doi.org/10.3389/fmars.2019.00046, 2019b.
Meier, H. E. M., Eilola, K., Almroth-Rosell, E., Schimanke, S., Kniebusch, M., Höglund, A., Pemberton, P., Liu, Y., Väli, G., and Saraiva, S.: Correction to: Disentangling the impact of nutrient load and climate changes on Baltic Sea hypoxia and eutrophication since 1850, Clim. Dyn., 53, 1167–1169, https://doi.org/10.1007/s00382-018-4483-x, 2019c.
Meier, H. E. M., Eilola, K., Almroth-Rosell, E., Schimanke, S., Kniebusch, M., Höglund, A., Pemberton, P., Liu, Y., Väli, G., and Saraiva, S.: Disentangling the impact of nutrient load and climate changes on Baltic Sea hypoxia and eutrophication since 1850, Clim. Dyn., 53, 1145–1166, https://doi.org/10.1007/s00382-018-4296-y, 2019d.
Meier, H. E. M. and Saraiva, S.: Projected Oceanographical Changes in the Baltic Sea until 2100, Oxford Research Encyclopedia of Climate Science, https://doi.org/10.1093/acrefore/9780190228620.013.699, 2020.
Meier, H. E. M., Dieterich, C., and Gröger, M.: Natural variability is a large source of uncertainty in future projections of hypoxia in the Baltic Sea, Commun. Earth Environ., 2, 50, https://doi.org/10.1038/s43247-021-00115-9, 2021a.
Meier, R., Schwaab, J., Seneviratne, S. I., Sprenger, M., Lewis, E., and Davin, E. L.: Empirical estimate of forestation-induced precipitation changes in Europe, Nat. Geosci., 14, 473–478, https://doi.org/10.1038/s41561-021-00773-6, 2021b.
Meier, H. E. M., Dieterich, C., Gröger, M., Dutheil, C., Börgel, F., Safonova, K., Christensen, O. B., and Kjellström, E.: Oceanographic regional climate projections for the Baltic Sea until 2100, Earth Syst. Dynam., 13, 159–199, https://doi.org/10.5194/esd-13-159-2022, 2022.
Menary, M. B., Robson, J., Allan, R. P., Booth, B. B. B., Cassou, C., Gastineau, G., Gregory, J., Hodson, D., Jones, C., Mignot, J., Ringer, M., Sutton, R., Wilcox, L., and Zhang, R.: Aerosol-Forced AMOC Changes in CMIP6 Historical Simulations, Geophys. Res. Lett., 47, e2020GL088166, https://doi.org/10.1029/2020GL088166, 2020.
Mercer, A.: A DEM of the 2010 surface topography of Storglaciären, Sweden, J. Maps, 12, 1112–1118, https://doi.org/10.1080/17445647.2015.1131754, 2016.
Mercer, J. H.: West Antarctic ice sheet and CO2 greenhouse effect: a threat of disaster, Nature, 271, 321–325, 1978.
Merkouriadi, I. and Leppäranta, M.: Long-term analysis of hydrography and sea-ice data in Tvärminne, Gulf of Finland, Baltic Sea, Clim. Change, 124, 849–859, https://doi.org/10.1007/s10584-014-1130-3, 2014.
Merkouriadi, I., Leppäranta, M., and Järvinen, O.: Interannual variability and trends in winter weather and snow conditions in Finnish Lapland, Est. J. Earth Sci., 66, 47–57, https://doi.org/10.3176/earth.2017.03, 2017.
MIB: Finnish Meteorological Institute, annual maximum ice extent of the Baltic Sea (MIB), Finnish Meteorological Institute [data set], https://en.ilmatieteenlaitos.fi/ice-season-in-the-baltic-sea, last access: 17 February 2022.
Mikulski, Z.: Inflow from drainage basin, Water Balance of the Baltic Sea, No. 16, Baltic Sea Environment Proceedings, Baltic Marine Environment Protection Commission, Helsinki, Finland, 24–34, 1986.
Mitrovica, J. X., Hay, C. C., Kopp, R. E., Harig, C., and Latychev, K.: Quantifying the Sensitivity of Sea Level Change in Coastal Localities to the Geometry of Polar Ice Mass Flux, J. Climate, 31, 3701–3709, https://doi.org/10.1175/jcli-d-17-0465.1, 2018.
Moberg, A.: Stockholm Historical Weather Observations – Monthly mean air temperatures since 1756, Dataset version 1, Bolin Centre Database [data set], https://bolin.su.se/data/stockholm-historical-temps-monthly, last access: 17 February 2022.
Mohrholz, V., Naumann, M., Nausch, G., Krüger, S., and Gräwe, U.: Fresh oxygen for the Baltic Sea – An exceptional saline inflow after a decade of stagnation, J. Mar. Syst., 148, 152–166, https://doi.org/10.1016/j.jmarsys.2015.03.005, 2015.
Mohrholz, V.: Major Baltic Inflow Statistics – Revised, Front. Mar. Sci., 5, 384, https://doi.org/10.3389/fmars.2018.00384, 2018.
Moldanová, J., Hassellöv, I.-M., Matthias, V., Fridell, E., Jalkanen, J.-P., Ytreberg, E., Quante, M., Tröltzsch, J., Maljutenko, I., Raudsepp, U., and Eriksson, K. M.: Framework for the environmental impact assessment of operational shipping, Ambio, 51, 754–769, https://doi.org/10.1007/s13280-021-01597-9, 202.
Möller, K. O., Schmidt, J. O., St.John, M., Temming, A., Diekmann, R., Peters, J., Floeter, J., Sell, A. F., Herrmann, J.-P., and Möllmann, C.: Effects of climate-induced habitat changes on a key zooplankton species, J. Plankton Res., 37, 530–541, https://doi.org/10.1093/plankt/fbv033, 2015.
Möllmann, C.: Effects of Climate Change and Fisheries on the Marine Ecosystem of the Baltic Sea, Oxford Research Encyclopedia of Climate Science, https://doi.org/10.1093/acrefore/9780190228620.013.682, 2019.
Moreno-Chamarro, E., Caron, L. P., Ortega, P., Loosveldt Tomas, S., and Roberts, M. J.: Can we trust CMIP5/6 future projections of European winter precipitation?, Environ. Res. Lett., 16, 054063, https://doi.org/10.1088/1748-9326/abf28a, 2021.
Moss, R. H., Edmonds, J. A., Hibbard, K. A., Manning, M. R., Rose, S. K., v. Vuuren, D. P., Carter, T. R., Emori, S., Kainuma, M., Kram, T., Meehl, G. A., Mitchell, J. F. B., Nakicenovic, N., Riahi, K., Smith, S. J., Stouffer, R. J., Thomson, A. M., Weyant, J. P., and Wilbanks, T. J.: The next generation of scenarios for climate change research and assessment, Nature, 463, 747–756, https://doi.org/10.1038/nature08823, 2010.
Müller, J., Folini, D., Wild, M., and Pfenninger, S.: CMIP-5 models project photovoltaics are a no-regrets investment in Europe irrespective of climate change, Energy, 171, 135–148, https://doi.org/10.1016/j.energy.2018.12.139, 2019.
Müller, J. D., Schneider, B., and Rehder, G.: Long-term alkalinity trends in the Baltic Sea and their implications for CO2-induced acidification, Limnol. Oceanogr., 61, 1984–2002, https://doi.org/10.1002/lno.10349, 2016.
Munkes, B., Löptien, U., and Dietze, H.: Cyanobacteria blooms in the Baltic Sea: a review of models and facts, Biogeosciences, 18, 2347–2378, https://doi.org/10.5194/bg-18-2347-2021, 2021.
Musielak, S., Furmańczyk, K., and Bugajny, N.: Factors and Processes Forming the Polish Southern Baltic Sea Coast on Various Temporal and Spatial Scales, in: Coastline Changes of the Baltic Sea from South to East: Past and Future Projection, edited by: Harff, J., Furmańczyk, K., and von Storch, H., Springer International Publishing, Cham, 69–85, https://doi.org/10.1007/978-3-319-49894-2_5, 2017.
Myrberg, K., Korpinen, S., and Uusitalo, L.: Physical oceanography sets the scene for the Marine Strategy Framework Directive implementation in the Baltic Sea, Mar. Policy, 107, 103591, https://doi.org/10.1016/j.marpol.2019.103591, 2019.
Nakamura, T., Yamazaki, K., Iwamoto, K., Honda, M., Miyoshi, Y., Ogawa, Y., and Ukita, J.: A negative phase shift of the winter AO/NAO due to the recent Arctic sea-ice reduction in late autumn, J. Geophys. Res.-Atmos., 120, 3209–3227, https://doi.org/10.1002/2014JD022848, 2015.
Nakićenović, N., Alcamo, J., Grubler, A., Riahi, K., Roehrl, R. A., Rogner, H.-H., and Victor, N.: Special report on emissions scenarios (SRES), a special report of Working Group III of the intergovernmental panel on climate change, IPCC Special Report, 2000.
NAO: Climatic Research Unit at the University of East Anglia, North Atlantic Oscillation (NAO), NAO [data set], https://crudata.uea.ac.uk/cru/data/nao/nao.dat, last access: 17 February 2022.
Naumann, M., Gräwe, U., Mohrholz, V., Kuss, J., Siegel, H., Waniek, J. J., and Schulz-Bull, D. E.: Hydrographic-hydrochemical assessment of the Baltic Sea 2018, Meereswiss. Ber., Warnemünde, 110, https://doi.org/10.12754/msr-2019-0110, 2019.
Nerem, R. S., Beckley, B. D., Fasullo, J. T., Hamlington, B. D., Masters, D., and Mitchum, G. T.: Climate-change–driven accelerated sea-level rise detected in the altimeter era, P. Natl. Acad. Sci. USA, 115, 2022, https://doi.org/10.1073/pnas.1717312115, 2018.
Neumann, G.: Eigenschwingungen der Ostsee, Archiv der Deutschen Seewarte und des Marineobservatoriums, Bd. 61, Nro. 4, Hamburg, 1941.
Neumann, T., Eilola, K., Gustafsson, B., Müller-Karulis, B., Kuznetsov, I., Meier, H. E. M., and Savchuk, O. P.: Extremes of temperature, oxygen and blooms in the Baltic Sea in a changing climate, Ambio, 41, 574–585, https://doi.org/10.1007/s13280-012-0321-2, 2012.
Neumann, T., Radtke, H., and Seifert, T.: On the importance of Major Baltic Inflows for oxygenation of the central Baltic Sea, J. Geophys. Res.-Oceans, 122, 1090–1101, https://doi.org/10.1002/2016JC012525, 2017.
Nie, Y., Li, L., Tang, Y., and Wang, B.: Impacts of Changes of External Forcings from CMIP5 to CMIP6 on Surface Temperature in FGOALS-g2, SOLA, 15, 211–215, https://doi.org/10.2151/sola.2019-038, 2019.
Niemelä, P., Tolvanen, H., Rönkä, M., Kellomäki, S., Krug, J., Schurgers, G., Lehikoinen, E., and Kalliola, R.: Environmental Impacts – Coastal Ecosystems, Birds and Forests, in: Second Assessment of Climate Change for the Baltic Sea Basin, edited by: BACC II Author Team, Springer International Publishing, Cham, 291–306, https://doi.org/10.1007/978-3-319-16006-1_16, 2015.
Niiranen, S., Yletyinen, J., Tomczak, M. T., Blenckner, T., Hjerne, O., MacKenzie, B. R., Müller-Karulis, B., Neumann, T., and Meier, H. E. M.: Combined effects of global climate change and regional ecosystem drivers on an exploited marine food web, Global Change Biol., 19, 3327–3342, https://doi.org/10.1111/gcb.12309, 2013.
Nijsse, F. J. M. M., Cox, P. M., Huntingford, C., and Williamson, M. S.: Decadal global temperature variability increases strongly with climate sensitivity, Nat. Clim. Change, 9, 598–601, https://doi.org/10.1038/s41558-019-0527-4, 2019.
Nilsson, J. and Grennfelt, P.: Critical loads for sulphur and nitrogen, Report from Skokloster Workshop, Skokloster, Sweden, 1988.
Nilsson, L. and Haas, F.: Distribution and numbers of wintering waterbirds in Sweden in 2015 and changes during the last fifty years, Ornis Svecica, 26, 3–54-53–54, 2016.
Ning, W., Nielsen, A. B., Ivarsson, L. N., Jilbert, T., Åkesson, C. M., Slomp, C. P., Andrén, E., Broström, A., and Filipsson, H. L.: Anthropogenic and climatic impacts on a coastal environment in the Baltic Sea over the last 1000 years, Anthropocene, 21, 66–79, https://doi.org/10.1016/j.ancene.2018.02.003, 2018.
Niskanen, T., Vainio, J., Eriksson, P., and Heiler, I.: Maximum extent of the Baltic sea ice recalculated for the period 1971–2008, Report Series in Geophysics, 164, 2009.
Nõges, P., and Nõges, T.: Weak trends in ice phenology of Estonian large lakes despite significant warming trends, Hydrobiologia, 731, 5–18, https://doi.org/10.1007/s10750-013-1572-z, 2014.
Norbäck Ivarsson, L., Andrén, T., Moros, M., Andersen, T. J., Lönn, M., and Andrén, E.: Baltic Sea Coastal Eutrophication in a Thousand Year Perspective, Front. Environ. Sci., 7, 88, https://doi.org/10.3389/fenvs.2019.00088, 2019.
Nydahl, A., Panigrahi, S., and Wikner, J.: Increased microbial activity in a warmer and wetter climate enhances the risk of coastal hypoxia, FEMS Microbiol. Ecol., 85, 338–347, https://doi.org/10.1111/1574-6941.12123, 2013.
O'Reilly, C. M., Sharma, S., Gray, D. K., Hampton, S. E., Read, J. S., Rowley, R. J., Schneider, P., Lenters, J. D., McIntyre, P. B., Kraemer, B. M., Weyhenmeyer, G. A., Straile, D., Dong, B., Adrian, R., Allan, M. G., Anneville, O., Arvola, L., Austin, J., Bailey, J. L., Baron, J. S., Brookes, J. D., de Eyto, E., Dokulil, M. T., Hamilton, D. P., Havens, K., Hetherington, A. L., Higgins, S. N., Hook, S., Izmest'eva, L. R., Joehnk, K. D., Kangur, K., Kasprzak, P., Kumagai, M., Kuusisto, E., Leshkevich, G., Livingstone, D. M., MacIntyre, S., May, L., Melack, J. M., Mueller-Navarra, D. C., Naumenko, M., Noges, P., Noges, T., North, R. P., Plisnier, P.-D., Rigosi, A., Rimmer, A., Rogora, M., Rudstam, L. G., Rusak, J. A., Salmaso, N., Samal, N. R., Schindler, D. E., Schladow, S. G., Schmid, M., Schmidt, S. R., Silow, E., Soylu, M. E., Teubner, K., Verburg, P., Voutilainen, A., Watkinson, A., Williamson, C. E., and Zhang, G.: Rapid and highly variable warming of lake surface waters around the globe, Geophys. Res. Lett., 42, 10773–10781, https://doi.org/10.1002/2015GL066235, 2015.
Oberbeckmann, S., and Labrenz, M.: Marine Microbial Assemblages on Microplastics: Diversity, Adaptation, and Role in Degradation, Annu. Rev. Mar. Sci., 12, 209–232, https://doi.org/10.1146/annurev-marine-010419-010633, 2020.
Obu, J., Westermann, S., Bartsch, A., Berdnikov, N., Christiansen, H. H., Dashtseren, A., Delaloye, R., Elberling, B., Etzelmüller, B., Kholodov, A., Khomutov, A., Kääb, A., Leibman, M. O., Lewkowicz, A. G., Panda, S. K., Romanovsky, V., Way, R. G., Westergaard-Nielsen, A., Wu, T., Yamkhin, J., and Zou, D.: Northern Hemisphere permafrost map based on TTOP modelling for 2000–2016 at 1 km2 scale, Earth Sci. Rev., 193, 299–316, https://doi.org/10.1016/j.earscirev.2019.04.023, 2019.
Obu, J., Westermann, S., Barboux, C., Bartsch, A., Delaloye, R., Grosse, G., Heim, B., Hugelius, G., Irrgang, A., Kääb, A. M., Kroisleitner, C., Matthes, H., Nitze, I., Pellet, C., Seifert, F. M., Strozzi, T., Wegmüller, U., Wieczorek, M., and Wiesmann, A.: ESA Permafrost Climate Change Initiative (Permafrost_cci): Permafrost extent for the Northern Hemisphere, v2.0., Centre for Environmental Data Analysis [data set], https://doi.org/10.5285/28e889210f884b469d7168fde4b4e54f, 2020.
Ojaveer, H., Olenin, S., Narščius, A., Florin, A.-B., Ezhova, E., Gollasch, S., Jensen, K. R., Lehtiniemi, M., Minchin, D., Normant-Saremba, M., and Strāke, S.: Dynamics of biological invasions and pathways over time: a case study of a temperate coastal sea, Biol. Invasions, 19, 799–813, https://doi.org/10.1007/s10530-016-1316-x, 2017.
Olli, K., Klais, R., Tamminen, T., Ptacnik, R., and Andersen, T.: Long term changes in the Baltic Sea phytoplankton community, Boreal Environ. Res., 16 (Suppl. A), 3–14, 2011.
Olofsson, M., Torstensson, A., Karlberg, M., Steinhoff, F. S., Dinasquet, J., Riemann, L., Chierici, M., and Wulff, A.: Limited response of a spring bloom community inoculated with filamentous cyanobacteria to elevated temperature and pCO2, Bot. Mar., 62, 3–16, https://doi.org/10.1515/bot-2018-0005, 2019.
Olofsson, M., Suikkanen, S., Kobos, J., Wasmund, N., and Karlson, B.: Basin-specific changes in filamentous cyanobacteria community composition across four decades in the Baltic Sea, Harmful Algae, 91, 101685, https://doi.org/10.1016/j.hal.2019.101685, 2020.
Omstedt, A. and Chen, D.: Influence of atmospheric circulation on the maximum ice extent in the Baltic Sea, J. Geophys. Res.-Oceans, 106, 4493–4500, https://doi.org/10.1029/1999JC000173, 2001.
Omstedt, A., Edman, M., Claremar, B., Frodin, P., Gustafsson, E., Humborg, C., Hägg, H., Mörth, M., Rutgersson, A., Schurgers, G., and others: Future changes in the Baltic Sea acid–base (pH) and oxygen balances, Tellus B, 64, 19586, https://doi.org/10.3402/tellusb.v64i0.19586, 2012.
Omstedt, A., Elken, J., Lehmann, A., Leppäranta, M., Meier, H. E. M., Myrberg, K., and Rutgersson, A.: Progress in physical oceanography of the Baltic Sea during the 2003–2014 period, Prog. Oceanogr., 128, 139–171, https://doi.org/10.1016/j.pocean.2014.08.010, 2014.
O'Neill, B. C., Kriegler, E., Riahi, K., Ebi, K. L., Hallegatte, S., Carter, T. R., Mathur, R., and van Vuuren, D. P.: A new scenario framework for climate change research: the concept of shared socioeconomic pathways, Climatic Change, 122, 387–400, https://doi.org/10.1007/s10584-013-0905-2, 2014.
Oppenheimer, M., Glavovic, B. C., Hinkel, J., Wal, R. v. d., Magnan, A. K., Abd-Elgawad, A., Cai, R., Cifuentes-Jara, M., DeConto, R. M., Ghosh, T., Hay, J., Isla, F., Marzeion, B., Meyssignac, B., and Sebesvari, Z.: Sea Level Rise and Implications for Low-Lying Islands, Coasts and Communities, in: IPCC Special Report on the Ocean and Cryosphere in a Changing Climate, edited by: Pörtner, H.-O., Roberts, D. C., Masson-Delmotte, V., Zhai, P., Tignor, M., Poloczanska, E., Mintenbeck, K., Alegriìa, A., Nicolai, M., Okem, A., Petzold, J., Rama, B., and Weyer, N. M., 2019.
Orru, H., Andersson, C., Ebi, K. L., Langner, J., Åström, C., and Forsberg, B.: Impact of climate change on ozone-related mortality and morbidity in Europe, Eur. Respir. J., 41, 285–294, https://doi.org/10.1183/09031936.00210411, 2013.
Orru, H., Åström, C., Andersson, C., Tamm, T., Ebi, K. L., and Forsberg, B.: Ozone and heat-related mortality in Europe in 2050 significantly affected by changes in climate, population and greenhouse gas emission, Environ. Res. Lett., 14, 074013, https://doi.org/10.1088/1748-9326/ab1cd9, 2019.
Orviku, K., Jaagus, J., and Tõnisson, H.: Sea ice shaping the shores, Journal of Coastal Research, Special Issue 64, Coastal Education & Research Foundation, Inc., 681–685, 2011.
Osterkamp, T. and Romanovsky, V.: Evidence for warming and thawing of discontinuous permafrost in Alaska, Permafrost Periglac., 10, 17–37, https://doi.org/10.1002/(SICI)1099-1530(199901/03)10:1<17::AID-PPP303>3.0.CO;2-4, 1999.
Otto, L., Zimmerman, J. T. F., Furnes, G. K., Mork, M., Saetre, R., and Becker, G.: Review of the physical oceanography of the North Sea, Neth. J. Sea Res., 26, 161–238, https://doi.org/10.1016/0077-7579(90)90091-T, 1990.
Øygarden, L., Deelstra, J., Lagzdins, A., Bechmann, M., Greipsland, I., Kyllmar, K., Povilaitis, A., and Iital, A.: Climate change and the potential effects on runoff and nitrogen losses in the Nordic–Baltic region, Agric. Ecosyst. Environ., 198, 114–126, https://doi.org/10.1016/j.agee.2014.06.025, 2014.
Paczkowska, J., Brugel, S., Rowe, O., Lefébure, R., Brutemark, A., and Andersson, A.: Response of Coastal Phytoplankton to High Inflows of Terrestrial Matter, Front. Mar. Sci., 7, 80, https://doi.org/10.3389/fmars.2020.00080, 2020.
Pajusalu, L., Martin, G., Põllumäe, A., and Paalme, T.: Results of laboratory and field experiments of the direct effect of increasing CO2 on net primary production of macroalgal species in brackish-water ecosystems, P. Est. Acad. Sci., 62, 148, https://doi.org/10.3176/proc.2013.2.09, 2013.
Pajusalu, L., Martin, G., Põllumäe, A., Torn, K., and Paalme, T.: Direct effects of increased CO2 concentrations in seawater on the net primary production of charophytes in a shallow, coastal, brackish-water ecosystem, Boreal Environ. Res., 20, 413–422, 2015.
Pajusalu, L., Martin, G., Paalme, T., and Põllumäe, A.: The effect of CO2 enrichment on net photosynthesis of the red alga Furcellaria lumbricalis in a brackish water environment, PeerJ, 4, e2505, https://doi.org/10.7717/peerj.2505, 2016.
Pansch, C., Nasrolahi, A., Appelhans, Y. S., and Wahl, M.: Impacts of ocean warming and acidification on the larval development of the barnacle Amphibalanus improvisus, J. Exp. Mar. Biol. Ecol., 420–421, 48–55, https://doi.org/10.1016/j.jembe.2012.03.023, 2012.
Parding, K., Olseth, J. A., Dagestad, K. F., and Liepert, B. G.: Decadal variability of clouds, solar radiation and temperature at a high-latitude coastal site in Norway, Tellus B, 66, 25897, https://doi.org/10.3402/tellusb.v66.25897, 2014.
Passaro, M., Müller, F. L., Oelsmann, J., Rautiainen, L., Dettmering, D., Hart-Davis, M. G., Abulaitijiang, A., Andersen, O. B., Høyer, J. L., Madsen, K. S., Ringgaard, I. M., Särkkä, J., Scarrott, R., Schwatke, C., Seitz, F., Tuomi, L., Restano, M., and Benveniste, J.: Absolute Baltic Sea Level Trends in the Satellite Altimetry Era: A Revisit, Front. Mar. Sci., 8, 647607, https://doi.org/10.3389/fmars.2021.647607, 2021.
Paul, C., Matthiessen, B., and Sommer, U.: Warming, but not enhanced CO2 concentration, quantitatively and qualitatively affects phytoplankton biomass, Mar. Ecol. Prog. Ser., 528, 39–51, https://doi.org/10.3354/meps11264 2015.
Pavón-Jordán, D., Fox, A. D., Clausen, P., Dagys, M., Deceuninck, B., Devos, K., Hearn, R. D., Holt, C. A., Hornman, M., Keller, V., Langendoen, T., Ławicki, Ł., Lorentsen, S. H., Luigujõe, L., Meissner, W., Musil, P., Nilsson, L., Paquet, J.-Y., Stipniece, A., Stroud, D. A., Wahl, J., Zenatello, M., and Lehikoinen, A.: Climate-driven changes in winter abundance of a migratory waterbird in relation to EU protected areas, Divers. Distrib., 21, 571–582, https://doi.org/10.1111/ddi.12300, 2015.
Pavón-Jordán, D., Clausen, P., Dagys, M., Devos, K., Encarnaçao, V., Fox, A. D., Frost, T., Gaudard, C., Hornman, M., Keller, V., Langendoen, T., Ławicki, Ł., Lewis, L. J., Lorentsen, S.-H., Luigujoe, L., Meissner, W., Molina, B., Musil, P., Musilova, Z., Nilsson, L., Paquet, J.-Y., Ridzon, J., Stipniece, A., Teufelbauer, N., Wahl, J., Zenatello, M., and Lehikoinen, A.: Habitat- and species-mediated short- and long-term distributional changes in waterbird abundance linked to variation in European winter weather, Divers. Distrib., 25, 225–239, https://doi.org/10.1111/ddi.12855, 2019.
Pecuchet, L., Lindegren, M., Kortsch, S., Całkiewicz, J., Jurgensone, I., Margonski, P., Otto, S. A., Putnis, I., Strāíe, S., and Nordström, M. C.: Spatio-temporal dynamics of multi-trophic communities reveal ecosystem-wide functional reorganization, Ecography, 43, 197–208, https://doi.org/10.1111/ecog.04643, 2020.
Peings, Y., and Magnusdottir, G.: Forcing of the wintertime atmospheric circulation by the multidecadal fluctuations of the North Atlantic ocean, Environ. Res. Lett., 9, 034018, https://doi.org/10.1088/1748-9326/9/3/034018, 2014.
Peings, Y. and Magnusdottir, G.: Wintertime atmospheric response to Atlantic multidecadal variability: effect of stratospheric representation and ocean–atmosphere coupling, Clim. Dyn., 47, 1029–1047, https://doi.org/10.1007/s00382-015-2887-4, 2016.
Pekcan-Hekim, Z., Urho, L., Auvinen, H., Heikinheimo, O., Lappalainen, J., Raitaniemi, J., and Söderkultalahti, P.: Climate Warming and Pikeperch Year-Class Catches in the Baltic Sea, Ambio, 40, 447–456, https://doi.org/10.1007/s13280-011-0143-7, 2011.
Pellikka, H., Särkkä, J., Johansson, M., and Pettersson, H.: Probability distributions for mean sea level and storm contribution up to 2100 AD at Forsmark, Technical Report TR-19-23, Swedish Nuclear Fuel and Waste Management Company (SKB), 49 pp., https://www.skb.com/publication/2494748/TR-19-23.pdf (last access: 17 February 2022), 2020.
Pemberton, P., Löptien, U., Hordoir, R., Höglund, A., Schimanke, S., Axell, L., and Haapala, J.: Sea-ice evaluation of NEMO-Nordic 1.0: a NEMO–LIM3.6-based ocean–sea-ice model setup for the North Sea and Baltic Sea, Geosci. Model Dev., 10, 3105–3123, https://doi.org/10.5194/gmd-10-3105-2017, 2017.
Peng, S., Piao, S., Ciais, P., Friedlingstein, P., Zhou, L., and Wang, T.: Change in snow phenology and its potential feedback to temperature in the Northern Hemisphere over the last three decades, Environ. Res. Lett., 8, 014008, https://doi.org/10.1088/1748-9326/8/1/014008, 2013.
Perry, D., Staveley, T., Deyanova, D., Baden, S., Dupont, S., Hernroth, B., Wood, H., Björk, M., and Gullström, M.: Global environmental changes negatively impact temperate seagrass ecosystems, Ecosphere, 10, e02986, https://doi.org/10.1002/ecs2.2986, 2019.
Persson, T.: Solar radiation climate in Sweden, Physics and Chemistry of the Earth, Part B: Hydrology, Oceans and Atmosphere, 24, 275–279, https://doi.org/10.1016/S1464-1909(98)00050-1, 1999.
Peters, W., Bastos, A., Ciais, P., and Vermeulen, A.: A historical, geographical and ecological perspective on the 2018 European summer drought, Philos. T. Roy. Soc. B., 375, 20190505, https://doi.org/10.1098/rstb.2019.0505, 2020.
Pfeffer, W. T., Arendt, A. A., Bliss, A., Bolch, T., Cogley, J. G., Gardner, A. S., Hagen, J.-O., Hock, R., Kaser, G., Kienholz, C., Miles, E. S., Moholdt, G., Mölg, N., Paul, F., Radić, V., Rastner, P., Raup, B. H., Rich, J., and Sharp, M. J.: The Randolph Glacier Inventory: a globally complete inventory of glaciers, J. Glaciol., 60, 537–552, https://doi.org/10.3189/2014JoG13J176, 2014.
Pfeifroth, U., Sanchez-Lorenzo, A., Manara, V., Trentmann, J., and Hollmann, R.: Trends and Variability of Surface Solar Radiation in Europe Based On Surface- and Satellite-Based Data Records, J. Geophys. Res.-Atmos., 123, 1735–1754, https://doi.org/10.1002/2017JD027418, 2018.
Philipona, R., Behrens, K., and Ruckstuhl, C.: How declining aerosols and rising greenhouse gases forced rapid warming in Europe since the 1980s, Geophys. Res. Lett., 36, L02806, https://doi.org/10.1029/2008GL036350, 2009.
Pihlainen, S., Zandersen, M., Hyytiäinen, K., Andersen, H. E., Bartosova, A., Gustafsson, B., Jabloun, M., McCrackin, M., Meier, H. E. M., Olesen, J. E., Saraiva, S., Swaney, D., and Thodsen, H.: Impacts of changing society and climate on nutrient loading to the Baltic Sea, Sci. Total Environ., 731, 138935, https://doi.org/10.1016/j.scitotenv.2020.138935, 2020.
Pindsoo, K. and Soomere, T.: Basin-wide variations in trends in water level maxima in the Baltic Sea, Cont. Shelf Res., 193, 104029, https://doi.org/10.1016/j.csr.2019.104029, 2020.
Placke, M., Meier, H. E. M., Gräwe, U., Neumann, T., Frauen, C., and Liu, Y.: Long-Term Mean Circulation of the Baltic Sea as Represented by Various Ocean Circulation Models, Front. Mar. Sci., 5, 287, https://doi.org/10.3389/fmars.2018.00287, 2018.
Placke, M., Meier, H. E. M., and Neumann, T.: Sensitivity of the Baltic Sea Overturning Circulation to Long-Term Atmospheric and Hydrological Changes, J. Geophys. Res.-Oceans, 126, e2020JC016079, https://doi.org/10.1029/2020JC016079, 2021.
Porz, L., Zhang, W., and Schrum, C.: Density-driven bottom currents control development of muddy basins in the southwestern Baltic Sea, Mar. Geol., 438, 106523, https://doi.org/10.1016/j.margeo.2021.106523, 2021.
Proietti, C., Fornasier, M. F., Sicard, P., Anav, A., Paoletti, E., and De Marco, A.: Trends in tropospheric ozone concentrations and forest impact metrics in Europe over the time period 2000–2014, J. For. Res., 32, 543–551, https://doi.org/10.1007/s11676-020-01226-3, 2021.
Ptak, M., Sojka, M., and Nowak, B.: Effect of climate warming on a change in thermal and ice conditions in the largest lake in Poland – Lake Śniardwy, J. Hydrol. Hydromech., 68, 260–270, https://doi.org/10.2478/johh-2020-0024, 2020.
Pugh, T. A. M., Lindeskog, M., Smith, B., Poulter, B., Arneth, A., Haverd, V., and Calle, L.: Role of forest regrowth in global carbon sink dynamics, P. Natl. Acad. Sci. USA, 116, 4382, https://doi.org/10.1073/pnas.1810512116, 2019.
Qixiang, W., Wang, M., and Fan, X.: Seasonal patterns of warming amplification of high-elevation stations across the globe, Int. J. Climatol., 38, 3466–3473, https://doi.org/10.1002/joc.5509, 2018.
Quante, M. and Colijn, F.: North Sea Region Climate Change Assessment, in: Regional Climate Studies, Springer, Cham, https://doi.org/10.1007/978-3-319-39745-0, 2016.
Quante, M., Karl, M., Matthias, V., Moldanova, J., and Ramacher, M.: Shipping in the Baltic Sea: Assessment of Current and Future Air Quality Implications, The Magazine for Environmental Managers, A&WMA, 2021.
Räämet, A. and Soomere, T.: The wave climate and its seasonal variability in the northeastern Baltic Sea, Est. J. Earth Sci., 59, 100–113, https://doi.org/10.3176/earth.2010.1.08, 2010.
Rädler, A. T., Groenemeijer, P. H., Faust, E., Sausen, R., and Púčik, T.: Frequency of severe thunderstorms across Europe expected to increase in the 21st century due to rising instability, npj Clim. Atmos. Sci., 2, 30, https://doi.org/10.1038/s41612-019-0083-7, 2019.
Radtke, H., Brunnabend, S.-E., Gräwe, U., and Meier, H. E. M.: Investigating interdecadal salinity changes in the Baltic Sea in a 1850–2008 hindcast simulation, Clim. Past, 16, 1617–1642, https://doi.org/10.5194/cp-16-1617-2020, 2020.
Rainio, K., Laaksonen, T., Ahola, M., Vähätalo, A. V., and Lehikoinen, E.: Climatic responses in spring migration of boreal and arctic birds in relation to wintering area and taxonomy, J. Avian Biol., 37, 507–515, https://doi.org/10.1111/j.0908-8857.2006.03740.x, 2006.
Räisänen, J.: Twenty-first century changes in snowfall climate in Northern Europe in ENSEMBLES regional climate models, Clim. Dyn., 46, 339–353, https://doi.org/10.1007/s00382-015-2587-0, 2016.
Räisänen, J.: Future Climate Change in the Baltic Sea Region and Environmental Impacts, Oxford University Press, 38 pp., https://doi.org/10.1093/acrefore/9780190228620.013.634, 2017.
Räisänen, J.: Effect of atmospheric circulation on recent temperature changes in Finland, Clim. Dyn., 53, 5675–5687, https://doi.org/10.1007/s00382-019-04890-2, 2019.
Räisänen, J.: Snow conditions in northern Europe: the dynamics of interannual variability versus projected long-term change, The Cryosphere, 15, 1677–1696, https://doi.org/10.5194/tc-15-1677-2021, 2021.
Rajasilta, M., Hänninen, J., Laaksonen, L., Laine, P., Suomela, J.-P., Vuorinen, I., and Mäkinen, K.: Influence of environmental conditions, population density, and prey type on the lipid content in Baltic herring (Clupea harengus membras) from the northern Baltic Sea, Can. J. Fish. Aquat. Sci., 76, 576–585, https://doi.org/10.1139/cjfas-2017-0504, 2018.
Rajczak, J. and Schär, C.: Projections of Future Precipitation Extremes Over Europe: A Multimodel Assessment of Climate Simulations, J. Geophys. Res.-Atmos., 122, 10773–10800, https://doi.org/10.1002/2017JD027176, 2017.
Ramacher, M. O. P., Karl, M., Bieser, J., Jalkanen, J.-P., and Johansson, L.: Urban population exposure to NOx emissions from local shipping in three Baltic Sea harbour cities – a generic approach, Atmos. Chem. Phys., 19, 9153–9179, https://doi.org/10.5194/acp-19-9153-2019, 2019.
Ravestein, P., van der Schrier, G., Haarsma, R., Scheele, R., and van den Broek, M.: Vulnerability of European intermittent renewable energy supply to climate change and climate variability, Renew. Sust. Energ. Rev., 97, 497–508, https://doi.org/10.1016/j.rser.2018.08.057, 2018.
Read, A. J. and Hohn, A. A.: Life in the fast lane: the life history of harbor porpoises from the gulf of maine, Mar. Mammal Sci., 11, 423–440, https://doi.org/10.1111/j.1748-7692.1995.tb00667.x, 1995.
Reckermann, M., Langner, J., Omstedt, A., von Storch, H., Keevallik, S., Schneider, B., Arheimer, B., Meier, H. E. M., and Hünicke, B.: BALTEX – an interdisciplinary research network for the Baltic Sea region, Environ. Res. Lett., 6, 045205, https://doi.org/10.1088/1748-9326/6/4/045205, 2011.
Reckermann, M., Omstedt, A., Soomere, T., Aigars, J., Akhtar, N., Bełdowska, M., Bełdowski, J., Cronin, T., Czub, M., Eero, M., Hyytiäinen, K. P., Jalkanen, J.-P., Kiessling, A., Kjellström, E., Kuliński, K., Larsén, X. G., McCrackin, M., Meier, H. E. M., Oberbeckmann, S., Parnell, K., Pons-Seres de Brauwer, C., Poska, A., Saarinen, J., Szymczycha, B., Undeman, E., Wörman, A., and Zorita, E.: Human impacts and their interactions in the Baltic Sea region, Earth Syst. Dynam., 13, 1–80, https://doi.org/10.5194/esd-13-1-2022, 2022.
Reder, S., Lydersen, C., Arnold, W., and Kovacs, K. M.: Haulout behaviour of High Arctic harbour seals (Phoca vitulina vitulina) in Svalbard, Norway, Polar Biol., 27, 6–16, https://doi.org/10.1007/s00300-003-0557-1, 2003.
Refsgaard, J. C., Hansen, A. L., Højberg, A. L., Olesen, J. E., Hashemi, F., Wachniew, P., Wörman, A., Bartosova, A., Stelljes, N., and Chubarenko, B.: Spatially differentiated regulation: Can it save the Baltic Sea from excessive N-loads?, Ambio, 48, 1278–1289, https://doi.org/10.1007/s13280-019-01195-w, 2019.
Reihan, A., Koltsova, T., Kriauciuniene, J., Lizuma, L., and Meilutyte-Barauskiene, D.: Changes in water discharges of the Baltic states rivers in the 20th century and its relation to climate change, Hydrol. Res., 38, 401–412, https://doi.org/10.2166/nh.2007.020, 2007.
Reissmann, J. H., Burchard, H., Feistel, R., Hagen, E., Lass, H. U., Mohrholz, V., Nausch, G., Umlauf, L., and Wieczorek, G.: Vertical mixing in the Baltic Sea and consequences for eutrophication – A review, Prog. Oceanogr., 82, 47–80, https://doi.org/10.1016/j.pocean.2007.10.004, 2009.
Rennert, K. J. and Wallace, J. M.: Cross-Frequency Coupling, Skewness, and Blocking in the Northern Hemisphere Winter Circulation, J. Climate, 22, 5650–5666, https://doi.org/10.1175/2009jcli2669.1, 2009.
Reusch, T. B. H., Dierking, J., Andersson, H. C., Bonsdorff, E., Carstensen, J., Casini, M., Czajkowski, M., Hasler, B., Hinsby, K., Hyytiäinen, K., Johannesson, K., Jomaa, S., Jormalainen, V., Kuosa, H., Kurland, S., Laikre, L., MacKenzie, B. R., Margonski, P., Melzner, F., Oesterwind, D., Ojaveer, H., Refsgaard, J. C., Sandström, A., Schwarz, G., Tonderski, K., Winder, M., and Zandersen, M.: The Baltic Sea as a time machine for the future coastal ocean, Sci. Adv., 4, eaar8195, https://doi.org/10.1126/sciadv.aar8195 2018.
RGI Consortium: Randolph Glacier Inventory – A Dataset of Global Glacier Outlines: Version 6.0: Technical Report, Global Land Ice Measurements from Space, Digital Media, Colorado, USA, https://doi.org/10.7265/N5-RGI-60, 2017.
Riahi, K., Rao, S., Krey, V., Cho, C., Chirkov, V., Fischer, G., Kindermann, G., Nakićenović, N., and Rafaj, P.: RCP 8.5 – A scenario of comparatively high greenhouse gas emissions, Clim. Change, 109, 33, https://doi.org/10.1007/s10584-011-0149-y, 2011.
Ribeiro, A., Barbosa, S. M., Scotto, M. G., and Donner, R. V.: Changes in extreme sea-levels in the Baltic Sea, Tellus A, 66, 20921, https://doi.org/10.3402/tellusa.v66.20921, 2014.
Ridefelt, H., Etzelmüller, B., Boelhouwers, J., and Jonasson, C.: Statistic-empirical modelling of mountain permafrost distribution in the Abisko region, sub-Arctic northern Sweden, Norsk Geogr. Tidsskr., 62, 278–289, https://doi.org/10.1080/00291950802517890, 2008.
Riihelä, A., Carlund, T., Trentmann, J., Müller, R., and Lindfors, A. V.: Validation of CM SAF Surface Solar Radiation Datasets over Finland and Sweden, Remote Sens.-Basel, 7, 6663–6682, https://doi.org/10.3390/rs70606663, 2015.
Rimkus, E., Kažys, J., Valiukas, D., and Stankūnavičius, G.: The atmospheric circulation patterns during dry periods in Lithuania, Oceanologia, 56, 223–239, https://doi.org/10.5697/oc.56-2.223, 2014.
Rimkus, E., Briede, A., Jaagus, J., Stonevicius, E., Kilpys, J., and Viru, B.: Snow-cover regime in Lithuania, Latvia and Estonia and its relationship to climatic and geographical factors in 1961–2015, Boreal Environ. Res., 23, 193–208, 2018.
Rinne, H. and Salovius-Laurén, S.: The status of brown macroalgae Fucus spp. and its relation to environmental variation in the Finnish marine area, northern Baltic Sea, Ambio, 49, 118–129, https://doi.org/10.1007/s13280-019-01175-0, 2020.
Rinne, J., Tuovinen, J.-P., Klemedtsson, L., Aurela, M., Holst, J., Lohila, A., Weslien, P., Vestin, P., Łakomiec, P., Peichl, M., Tuittila, E.-S., Heiskanen, L., Laurila, T., Li, X., Alekseychik, P., Mammarella, I., Ström, L., Crill, P., and Nilsson, M. B.: Effect of the 2018 European drought on methane and carbon dioxide exchange of northern mire ecosystems, Philos. T. Roy. Soc. B., 375, 20190517, https://doi.org/10.1098/rstb.2019.0517, 2020.
Ripszam, M., Paczkowska, J., Figueira, J., Veenaas, C., and Haglund, P.: Dissolved Organic Carbon Quality and Sorption of Organic Pollutants in the Baltic Sea in Light of Future Climate Change, Environ. Sci. Technol., 49, 1445–1452, https://doi.org/10.1021/es504437s, 2015.
Rizzi, J., Nilsen, I. B., Stagge, J. H., Gisnås, K., and Tallaksen, L. M.: Five decades of warming: impacts on snow cover in Norway, Hydrol. Res., 49, 670–688, https://doi.org/10.2166/nh.2017.051, 2017.
Rjazin, J. and Pärn, O.: Determining the Regime Shift of the Baltic Sea Ice Seasons during 1982–2016, NAŠE MORE: znanstveni časopis za more i pomorstvo, 67, 53–59, 2020.
Rockel, B.: The regional downscaling approach: a brief history and recent advances, Curr. Clim. Change Rep., 1, 22–29, https://doi.org/10.1007/s40641-014-0001-3, 2015.
Rodhe, J.: The Baltic and North Seas: A process-oriented review of the physical oceanography. Coastal segment , in: The Sea, Volume 11: The Global Coastal Ocean: Regional Studies and Syntheses, edited by: Robinson, A. R., and Brink, K. H., John Wiley & Sons, Inc., 699–732, 1998.
Rodhe, J., Tett, P., and Wulff, F.: The Baltic and North Seas: A Regional Review of some important Physical-Chemical-Biological Interaction Processes, in: The Sea, Volume 14B: The Global Coastal Ocean, edited by: Robinson, A. R., and Brink, K. H., Harvard University Press, Cambridge, MA, USA, 1033–1075, 2006.
Rodwell, M. J., Rowell, D. P., and Folland, C. K.: Oceanic forcing of the wintertime North Atlantic Oscillation and European climate, Nature, 398, 320–323, https://doi.org/10.1038/18648, 1999.
Roff, J. C. and Legendre, L.: Chapter 14 Physico-Chemical and Biological Oceanography of Hudson Bay, in: Elsevier Oceanography Series, edited by: Martini, I. P., Elsevier, 265–292, https://doi.org/10.1016/S0422-9894(08)70907-3, 1986.
Röhr, M. E., Boström, C., Canal-Vergés, P., and Holmer, M.: Blue carbon stocks in Baltic Sea eelgrass (Zostera marina) meadows, Biogeosciences, 13, 6139–6153, https://doi.org/10.5194/bg-13-6139-2016, 2016.
Rolff, C., Almesjö, L., and Elmgren, R.: Nitrogen fixation and abundance of the diazotrophic cyanobacterium Aphanizomenon sp. in the Baltic Proper, Mar. Ecol. Prog. Ser., 332, 107–118, https://doi.org/10.3354/meps332107, 2007.
Rolff, C. and Elfwing, T.: Increasing nitrogen limitation in the Bothnian Sea, potentially caused by inflow of phosphate-rich water from the Baltic Proper, Ambio, 44, 601–611, https://doi.org/10.1007/s13280-015-0675-3, 2015.
Ronkainen, I., Lehtiranta, J., Lensu, M., Rinne, E., Haapala, J., and Haas, C.: Interannual sea ice thickness variability in the Bay of Bothnia, The Cryosphere, 12, 3459–3476, https://doi.org/10.5194/tc-12-3459-2018, 2018.
Rothäusler, E., Rugiu, L., and Jormalainen, V.: Forecast climate change conditions sustain growth and physiology but hamper reproduction in range-margin populations of a foundation rockweed species, Mar. Environ. Res., 141, 205–213, https://doi.org/10.1016/j.marenvres.2018.09.014, 2018.
Roudier, P., Andersson, J. C. M., Donnelly, C., Feyen, L., Greuell, W., and Ludwig, F.: Projections of future floods and hydrological droughts in Europe under a +2 ∘C global warming, Clim. Change, 135, 341–355, https://doi.org/10.1007/s10584-015-1570-4, 2016.
Rounsevell, M. D. A., Ewert, F., Reginster, I., Leemans, R., and Carter, T. R.: Future scenarios of European agricultural land use: II. Projecting changes in cropland and grassland, Agric. Ecosyst. Environ., 107, 117–135, https://doi.org/10.1016/j.agee.2004.12.002, 2005.
Rousi, H., Laine, A. O., Peltonen, H., Kangas, P., Andersin, A.-B., Rissanen, J., Sandberg-Kilpi, E., and Bonsdorff, E.: Long-term changes in coastal zoobenthos in the northern Baltic Sea: the role of abiotic environmental factors, ICES J. Mar. Sci., 70, 440–451, https://doi.org/10.1093/icesjms/fss197, 2013.
Rousi, H., Korpinen, S., and Bonsdorff, E.: Brackish-Water Benthic Fauna Under Fluctuating Environmental Conditions: The Role of Eutrophication, Hypoxia, and Global Change, Front. Mar. Sci., 6, 464, https://doi.org/10.3389/fmars.2019.00464, 2019.
Ruckstuhl, C., Philipona, R., Behrens, K., Collaud Coen, M., Dürr, B., Heimo, A., Mätzler, C., Nyeki, S., Ohmura, A., Vuilleumier, L., Weller, M., Wehrli, C., and Zelenka, A.: Aerosol and cloud effects on solar brightening and the recent rapid warming, Geophys. Res. Lett., 35, L12708, https://doi.org/10.1029/2008GL034228, 2008.
Rugiu, L., Manninen, I., Sjöroos, J., and Jormalainen, V.: Variations in tolerance to climate change in a key littoral herbivore, Mar. Biol., 165, 18, https://doi.org/10.1007/s00227-017-3275-x, 2017.
Rummukainen, M.: State-of-the-art with regional climate models, Wires Clim. Change, 1, 82–96, https://doi.org/10.1002/wcc.8, 2010.
Rummukainen, M.: Added value in regional climate modeling, Wires Clim. Change, 7, 145–159, https://doi.org/10.1002/wcc.378, 2016.
Rummukainen, M., Rockel, B., Bärring, L., Christensen, J. H., and Reckermann, M.: Twenty-first-century challenges in regional climate modeling, B. Am. Meteorol. Soc., 96, ES135–ES138, https://doi.org/10.1175/BAMS-D-14-00214.1, 2015.
Ruoho-Airola, T., Eilola, K., Savchuk, O. P., Parviainen, M., and Tarvainen, V.: Atmospheric Nutrient Input to the Baltic Sea from 1850 to 2006: A Reconstruction from Modeling Results and Historical Data, Ambio, 41, 549–557, https://doi.org/10.1007/s13280-012-0319-9, 2012.
Ruosteenoja, K., Vihma, T., and Venäläinen, A.: Projected Changes in European and North Atlantic Seasonal Wind Climate Derived from CMIP5 Simulations, J. Climate, 32, 6467–6490, https://doi.org/10.1175/JCLI-D-19-0023.1, 2019.
Ruosteenoja, K., Markkanen, T., and Räisänen, J.: Thermal seasons in northern Europe in projected future climate, Int. J. Climatol., 40, 4444–4462, https://doi.org/10.1002/joc.6466, 2020.
Ruprich-Robert, Y., Msadek, R., Castruccio, F., Yeager, S., Delworth, T., and Danabasoglu, G.: Assessing the Climate Impacts of the Observed Atlantic Multidecadal Variability Using the GFDL CM2.1 and NCAR CESM1 Global Coupled Models, J. Climate, 30, 2785–2810, https://doi.org/10.1175/jcli-d-16-0127.1, 2017.
Russak, V.: Changes in solar radiation and their influence on temperature trend in Estonia (1955–2007), J. Geophys. Res.-Atmos., 114, D00D01, https://doi.org/10.1029/2008JD010613, 2009.
Rutgersson, A., Jaagus, J., Schenk, F., and Stendel, M.: Observed changes and variability of atmospheric parameters in the Baltic Sea region during the last 200 years, Clim. Res., 61, 177–190, https://doi.org/10.3354/cr01244, 2014.
Rutgersson, A., Kjellström, E., Haapala, J., Stendel, M., Danilovich, I., Drews, M., Jylhä, K., Kujala, P., Larsén, X. G., Halsnæs, K., Lehtonen, I., Luomaranta, A., Nilsson, E., Olsson, T., Särkkä, J., Tuomi, L., and Wasmund, N.: Natural hazards and extreme events in the Baltic Sea region, Earth Syst. Dynam., 13, 251–301, https://doi.org/10.5194/esd-13-251-2022, 2022.
Ryabchenko, V. A., Karlin, L. N., Isaev, A. V., Vankevich, R. E., Eremina, T. R., Molchanov, M. S., and Savchuk, O. P.: Model estimates of the eutrophication of the Baltic Sea in the contemporary and future climate, Oceanology, 56, 36–45, https://doi.org/10.1134/S0001437016010161, 2016.
Ryabchuk, D., Kolesov, A., Chubarenko, B., Spiridonov, M., Kurennoy, D., and Soomere, T.: Coastal erosion processes in the eastern Gulf of Finland and their links with geological and hydrometeorological factors, Boreal Environ. Res., 16 (Suppl. A), 117–137, 2011.
Sadykova, D., Scott, B. E., De Dominicis, M., Wakelin, S. L., Wolf, J., and Sadykov, A.: Ecological costs of climate change on marine predator–prey population distributions by 2050, Ecol. Evol., 10, 1069–1086, https://doi.org/10.1002/ece3.5973, 2020.
Sahla, M., Tolvanen, H., Ruuskanen, A., and Kurvinen, L.: Assessing long term change of Fucus spp. communities in the northern Baltic Sea using monitoring data and spatial modeling, Estuar. Coast. Shelf Sci., 245, 107023, https://doi.org/10.1016/j.ecss.2020.107023, 2020.
Salo, T., Mattila, J., and Eklöf, J.: Long-term warming affects ecosystem functioning through species turnover and intraspecific trait variation, Oikos, 129, 283–295, https://doi.org/10.1111/oik.06698, 2020.
Sannel, A. B. K., Hugelius, G., Jansson, P., and Kuhry, P.: Permafrost Warming in a Subarctic Peatland – Which Meteorological Controls are Most Important?, Permafrost Periglac., 27, 177–188, https://doi.org/10.1002/ppp.1862, 2016.
Saraiva, S., Meier, H. E. M., Andersson, H., Höglund, A., Dieterich, C., Gröger, M., Hordoir, R., and Eilola, K.: Baltic Sea ecosystem response to various nutrient load scenarios in present and future climates, Clim. Dyn., 52, 3369–3387, https://doi.org/10.1007/s00382-018-4330-0, 2019a.
Saraiva, S., Meier, H. E. M., Andersson, H., Höglund, A., Dieterich, C., Gröger, M., Hordoir, R., and Eilola, K.: Uncertainties in Projections of the Baltic Sea Ecosystem Driven by an Ensemble of Global Climate Models, Front. Earth Sci., 6, 244, https://doi.org/10.3389/feart.2018.00244, 2019b.
Sarauskiene, D., Kriauciuniene, J., Reihan, A., and Klavins, M.: Flood pattern changes in the rivers of the Baltic countries, J. Environ. Eng. Landsc. Manag., 23, 28–38, https://doi.org/10.3846/16486897.2014.937438, 2015.
Šarauskienė, D., Akstinas, V., Kriaučiūnienė, J., Jakimavičius, D., Bukantis, A., Kažys, J., Povilaitis, A., Ložys, L., Kesminas, V., Virbickas, T., and Pliuraitė, V.: Projection of Lithuanian river runoff, temperature and their extremes under climate change, Hydrol. Res., 49, 344–362, https://doi.org/10.2166/nh.2017.007, 2017.
Savchuk, O. P.: Large-Scale Dynamics of Hypoxia in the Baltic Sea, in: Chemical Structure of Pelagic Redox Interfaces: Observation and Modeling, edited by: Yakushev, E. V., Springer, Berlin, Heidelberg, 137–160, https://doi.org/10.1007/698_2010_53, 2013.
Savchuk, O. P.: Large-Scale Nutrient Dynamics in the Baltic Sea, 1970–2016, Front. Mar. Sci., 5, 95, https://doi.org/10.3389/fmars.2018.00095, 2018.
Savchuk, O. P.: Long-term times-series of the annual N and P pools in the major basins of the Baltic Sea: 1970–2020, ResearchGate [data set], https://www.researchgate.net/publication/358726567_Long-term_times-series_of_the_annual_N_and_P_pools_in_the_major_basins_of_the_Baltic_Sea_1970-2020, last access: 6 March 2022.
Savchuk, O. P., Wulff, F., Hille, S., Humborg, C., and Pollehne, F.: The Baltic Sea a century ago – a reconstruction from model simulations, verified by observations, J. Mar. Syst., 74, 485–494, https://doi.org/10.1016/j.jmarsys.2008.03.008, 2008.
Savchuk, O. P., Gustafsson, B. G., Rodriguez Medina, M., Sokolov, A. V., and Wulff, F.: External nutrient loads to the Baltic Sea, 1970–2006, Baltic Nest Institute Techn. Rep., 22, 2012.
Scaife, A. A. and Smith, D.: A signal-to-noise paradox in climate science, npj Clim. Atmos. Sci., 1, 28, https://doi.org/10.1038/s41612-018-0038-4, 2018.
Scheff, J. and Frierson, D. M. W.: Robust future precipitation declines in CMIP5 largely reflect the poleward expansion of model subtropical dry zones, Geophys. Res. Lett., 39, L18704, https://doi.org/10.1029/2012GL052910, 2012.
Schenk, F. and Zorita, E.: Reconstruction of high resolution atmospheric fields for Northern Europe using analog-upscaling, Clim. Past, 8, 1681–1703, https://doi.org/10.5194/cp-8-1681-2012, 2012.
Schenk, F.: The analog-method as statistical upscaling tool for meteorological field reconstructions over Northern Europe since 1850, Doctoral Dissertation, University of Hamburg, Hamburg, https://ediss.sub.uni-hamburg.de/handle/ediss/6346 (last access: 17 February 2022), 2015.
Schiemann, R., Athanasiadis, P., Barriopedro, D., Doblas-Reyes, F., Lohmann, K., Roberts, M. J., Sein, D. V., Roberts, C. D., Terray, L., and Vidale, P. L.: Northern Hemisphere blocking simulation in current climate models: evaluating progress from the Climate Model Intercomparison Project Phase 5 to 6 and sensitivity to resolution, Weather Clim. Dynam., 1, 277–292, https://doi.org/10.5194/wcd-1-277-2020, 2020.
Schimanke, S., Meier, H. E. M., Kjellström, E., Strandberg, G., and Hordoir, R.: The climate in the Baltic Sea region during the last millennium simulated with a regional climate model, Clim. Past, 8, 1419–1433, https://doi.org/10.5194/cp-8-1419-2012, 2012.
Schimanke, S., Dieterich, C., and Meier, H. E. M.: An algorithm based on sea-level pressure fluctuations to identify major Baltic inflow events, Tellus A, 66, 23452, https://doi.org/10.3402/tellusa.v66.23452, 2014.
Schimanke, S., and Meier, H. E. M.: Decadal-to-Centennial Variability of Salinity in the Baltic Sea, J. Climate, 29, 7173–7188, https://doi.org/10.1175/JCLI-D-15-0443.1, 2016.
Schinke, H., and Matthäus, W.: On the causes of major Baltic inflows – an analysis of long time series, Cont. Shelf Res., 18, 67–97, https://doi.org/10.1016/S0278-4343(97)00071-X, 1998.
Schmidt, G. A., Jungclaus, J. H., Ammann, C. M., Bard, E., Braconnot, P., Crowley, T. J., Delaygue, G., Joos, F., Krivova, N. A., Muscheler, R., Otto-Bliesner, B. L., Pongratz, J., Shindell, D. T., Solanki, S. K., Steinhilber, F., and Vieira, L. E. A.: Climate forcing reconstructions for use in PMIP simulations of the last millennium (v1.0), Geosci. Model Dev., 4, 33–45, https://doi.org/10.5194/gmd-4-33-2011, 2011.
Schmidt, K., Birchill, A. J., Atkinson, A., Brewin, R. J. W., Clark, J. R., Hickman, A. E., Johns, D. G., Lohan, M. C., Milne, A., Pardo, S., Polimene, L., Smyth, T. J., Tarran, G. A., Widdicombe, C. E., Woodward, E. M. S., and Ussher, S. J.: Increasing picocyanobacteria success in shelf waters contributes to long-term food web degradation, Global Change Biol., 26, 5574–5587, https://doi.org/10.1111/gcb.15161, 2020.
Schneider, B. and Müller, J. D.: Biogeochemical Transformations in the Baltic Sea. Observations Through Carbon Dioxide Glasses, Springer Oceanography, Springer International Publishing AG, Cham, 110 pp., https://doi.org/10.1007/978-3-319-61699-5, 2018.
Schönhofer, J. and Dudkowska, A.: Rip currents in the southern Baltic Sea multi-bar nearshore zone, Cont. Shelf Res., 212, 104324, https://doi.org/10.1016/j.csr.2020.104324, 2021.
Schröder, W., Nickel, S., Schönrock, S., Meyer, M., Wosniok, W., Harmens, H., Frontasyeva, M. V., Alber, R., Aleksiayenak, J., Barandovski, L., Carballeira, A., Danielsson, H., de Temmermann, L., Godzik, B., Jeran, Z., Karlsson, G. P., Lazo, P., Leblond, S., Lindroos, A.-J., Liiv, S., Magnússon, S. H., Mankovska, B., Martínez-Abaigar, J., Piispanen, J., Poikolainen, J., Popescu, I. V., Qarri, F., Santamaria, J. M., Skudnik, M., Špirić, Z., Stafilov, T., Steinnes, E., Stihi, C., Thöni, L., Uggerud, H. T., and Zechmeister, H. G.: Spatially valid data of atmospheric deposition of heavy metals and nitrogen derived by moss surveys for pollution risk assessments of ecosystems, Environ. Sci. Pollut. Res., 23, 10457–10476, https://doi.org/10.1007/s11356-016-6577-5, 2016.
Schrum, C.: Regional Climate Modeling and Air-Sea Coupling, Oxford Research Encyclopedia of Climate Science, Oxford University Press, 33 pp., https://doi.org/10.1093/acrefore/9780190228620.013.3, 2017.
Schubert, S. D., Wang, H., Koster, R. D., Suarez, M. J., and Groisman, P. Y.: Northern Eurasian Heat Waves and Droughts, J. Climate, 27, 3169–3207, https://doi.org/10.1175/jcli-d-13-00360.1, 2014.
Schuster, P. F., Schaefer, K. M., Aiken, G. R., Antweiler, R. C., Dewild, J. F., Gryziec, J. D., Gusmeroli, A., Hugelius, G., Jafarov, E., Krabbenhoft, D. P., Liu, L., Herman-Mercer, N., Mu, C., Roth, D. A., Schaefer, T., Striegl, R. G., Wickland, K. P., and Zhang, T.: Permafrost Stores a Globally Significant Amount of Mercury, Geophys. Res. Lett., 45, 1463–1471, https://doi.org/10.1002/2017GL075571, 2018.
Screen, J. A., Simmonds, I., Deser, C., and Tomas, R.: The Atmospheric Response to Three Decades of Observed Arctic Sea Ice Loss, J. Climate, 26, 1230–1248, https://doi.org/10.1175/jcli-d-12-00063.1, 2013.
Seager, R., Naik, N., and Vecchi, G. A.: Thermodynamic and Dynamic Mechanisms for Large-Scale Changes in the Hydrological Cycle in Response to Global Warming*, J. Climate, 23, 4651–4668, https://doi.org/10.1175/2010JCLI3655.1, 2010.
Seifert, T. and Kayser, B.: A high resolution spherical grid topography of the Baltic Sea, Meereswiss. Ber. Warnemünde, 9, 73–88, 1995.
Seinä, A. and Palosuo, E.: The classification of the maximum annual extent of ice cover in the Baltic Sea 1720–1995, Meri, 27, 79–91, 1996.
Seneviratne, S. I., Wilhelm, M., Stanelle, T., van den Hurk, B., Hagemann, S., Berg, A., Cheruy, F., Higgins, M. E., Meier, A., Brovkin, V., Claussen, M., Ducharne, A., Dufresne, J.-L., Findell, K. L., Ghattas, J., Lawrence, D. M., Malyshev, S., Rummukainen, M., and Smith, B.: Impact of soil moisture-climate feedbacks on CMIP5 projections: First results from the GLACE-CMIP5 experiment, Geophys. Res. Lett., 40, 5212–5217, https://doi.org/10.1002/grl.50956, 2013.
Seneviratne, S. I. and Hauser, M.: Regional Climate Sensitivity of Climate Extremes in CMIP6 Versus CMIP5 Multimodel Ensembles, 8, e2019EF001474, https://doi.org/10.1029/2019EF001474, 2020.
Seppälä, M.: The origin of palsas, Geogr. Ann. A, 68, 141–147, https://doi.org/10.2307/521453, 1986.
Sharma, S., Magnuson, J. J., Batt, R. D., Winslow, L. A., Korhonen, J., and Aono, Y.: Direct observations of ice seasonality reveal changes in climate over the past 320–570 years, Sci. Rep.-UK, 6, 25061, https://doi.org/10.1038/srep25061, 2016.
Sharma, S., Blagrave, K., Magnuson, J. J., O'Reilly, C. M., Oliver, S., Batt, R. D., Magee, M. R., Straile, D., Weyhenmeyer, G. A., Winslow, L., and Woolway, R. I.: Widespread loss of lake ice around the Northern Hemisphere in a warming world, Nat. Clim. Change, 9, 227–231, https://doi.org/10.1038/s41558-018-0393-5, 2019.
Sharma, S., Meyer, M. F., Culpepper, J., Yang, X., Hampton, S., Berger, S. A., Brousil, M. R., Fradkin, S. C., Higgins, S. N., Jankowski, K. J., Kirillin, G., Smits, A. P., Whitaker, E. C., Yousef, F., and Zhang, S.: Integrating Perspectives to Understand Lake Ice Dynamics in a Changing World, J. Geophys. Res.-Biogeo, 125, e2020JG005799, https://doi.org/10.1029/2020JG005799, 2020.
Sharma, S., Blagrave, K., Filazzola, A., Imrit, M. A., and Hendricks Franssen, H.-J.: Forecasting the Permanent Loss of Lake Ice in the Northern Hemisphere Within the 21st Century, Geophys. Res. Lett., 48, e2020GL091108, https://doi.org/10.1029/2020GL091108, 2021.
Shatwell, T., Thiery, W., and Kirillin, G.: Future projections of temperature and mixing regime of European temperate lakes, Hydrol. Earth Syst. Sci., 23, 1533–1551, https://doi.org/10.5194/hess-23-1533-2019, 2019.
Shaw, T. A., Baldwin, M., Barnes, E. A., Caballero, R., Garfinkel, C. I., Hwang, Y. T., Li, C., O'Gorman, P. A., Rivière, G., Simpson, I. R., and Voigt, A.: Storm track processes and the opposing influences of climate change, Nat. Geosci., 9, 656–664, https://doi.org/10.1038/ngeo2783, 2016.
Shepherd, T. G., Boyd, E., Calel, R. A., Chapman, S. C., Dessai, S., Dima-West, I. M., Fowler, H. J., James, R., Maraun, D., Martius, O., Senior, C. A., Sobel, A. H., Stainforth, D. A., Tett, S. F. B., Trenberth, K. E., van den Hurk, B. J. J. M., Watkins, N. W., Wilby, R. L., and Zenghelis, D. A.: Storylines: an alternative approach to representing uncertainty in physical aspects of climate change, Clim. Change, 151, 555–571, https://doi.org/10.1007/s10584-018-2317-9, 2018.
Sherwood, S. C., Webb, M. J., Annan, J. D., Armour, K. C., Forster, P. M., Hargreaves, J. C., Hegerl, G., Klein, S. A., Marvel, K. D., Rohling, E. J., Watanabe, M., Andrews, T., Braconnot, P., Bretherton, C. S., Foster, G. L., Hausfather, Z., von der Heydt, A. S., Knutti, R., Mauritsen, T., Norris, J. R., Proistosescu, C., Rugenstein, M., Schmidt, G. A., Tokarska, K. B., and Zelinka, M. D.: An Assessment of Earth's Climate Sensitivity Using Multiple Lines of Evidence, Rev. Geophys., 58, e2019RG000678, https://doi.org/10.1029/2019RG000678, 2020.
Siegel, H. and Gerth, M.: Sea Surface Temperature in the Baltic Sea 2018, HELCOM Baltic Sea Environment Fact Sheets 2019, 7 pp., https://helcom.fi/wp-content/uploads/2020/07/BSEFS-Sea-Surface-Temperature-in-the-Baltic-Sea-2018.pdf (last access: 17 February 2022), 2019.
Sillmann, J., Kharin, V. V., Zwiers, F. W., Zhang, X., and Bronaugh, D.: Climate extremes indices in the CMIP5 multimodel ensemble: Part 2. Future climate projections, J. Geophys. Res.-Atmos., 118, 2473–2493, https://doi.org/10.1002/jgrd.50188, 2013.
Sinclair, V. A., Rantanen, M., Haapanala, P., Räisänen, J., and Järvinen, H.: The characteristics and structure of extra-tropical cyclones in a warmer climate, Weather Clim. Dynam., 1, 1–25, https://doi.org/10.5194/wcd-1-1-2020, 2020.
Sinha, E., Michalak, A. M., and Balaji, V.: Eutrophication will increase during the 21st century as a result of precipitation changes, Science, 357, 405, https://doi.org/10.1126/science.aan2409, 2017.
Skogen, M. D., Eilola, K., Hansen, J. L. S., Meier, H. E. M., Molchanov, M. S., and Ryabchenko, V. A.: Eutrophication status of the North Sea, Skagerrak, Kattegat and the Baltic Sea in present and future climates: A model study, J. Mar. Syst., 132, 174–184, https://doi.org/10.1016/j.jmarsys.2014.02.004, 2014.
Skov, H., S, H., Žydelis, R., Bellebaum, J., Bzoma, S., Dagys, M., Durinck, J., Garthe, S., Grishanov, G., Hario, M., Kieckbusch, J., Kube, J., Kuresoo, A., Larsson, K., Luigujoe, L., Meissner, W., Nehls, H., Nilsson, L., Petersen, I., Roos, M., Pihl, S., Sonntag, N., Stock, A., and Stipniece, A.: Waterbird populations and pressures in the Baltic Sea, Nordic Council of Ministers, Copenhagen, TemaNord 2011, Vol. 550, 201 pp., 2011.
SMHI: Swedish Meteorological and Hydrological Institute databases, https://www.smhi.se, last access: 6 March 2022.
SITES: Swedish Infrastructure for Ecosystem Science data portal, https://data.fieldsites.se/portal/, last access: 10 February 2022.
Smith, B., Prentice, I. C., and Sykes, M. T.: Representation of Vegetation Dynamics in the Modelling of Terrestrial Ecosystems: Comparing Two Contrasting Approaches within European Climate Space, Global Ecol. Biogeogr., 10, 621–637, 2001.
Smith, B., Aasa, A., Ahas, R., Blenckner, T., Callaghan, T. V., de Chazal, J., Humborg, C., Jönsson, A. M., Kellomäki, S., Kull, A., Lehikoinen, E., Mander, Ü., Nõges, P., Nõges, T., Rounsevell, M., Sofiev, M., Tryjanowski, P., and Wolf, A.: Climate-related Change in Terrestrial and Freshwater Ecosystems, in: Assessment of Climate Change for the Baltic Sea Basin, edited by: BACC Author Team, Springer Berlin Heidelberg, Berlin, Heidelberg, 221–308, https://doi.org/10.1007/978-3-540-72786-6_4, 2008.
Smith, B., Samuelsson, P., Wramneby, A., and Rummukainen, M.: A model of the coupled dynamics of climate, vegetation and terrestrial ecosystem biogeochemistry for regional applications, Tellus A, 63, 87–106, https://doi.org/10.1111/j.1600-0870.2010.00477.x, 2011.
Smith, T. G. and Stirling, I.: The breeding habitat of the ringed seal (Phoca hispida). The birth lair and associated structures, Can. J. Zool., 53, 1297–1305, https://doi.org/10.1139/z75-155, 1975.
Smol, J. P., Wolfe, A. P., Birks, H. J. B., Douglas, M. S. V., Jones, V. J., Korhola, A., Pienitz, R., Rühland, K., Sorvari, S., Antoniades, D., Brooks, S. J., Fallu, M.-A., Hughes, M., Keatley, B. E., Laing, T. E., Michelutti, N., Nazarova, L., Nyman, M., Paterson, A. M., Perren, B., Quinlan, R., Rautio, M., Saulnier-Talbot, É., Siitonen, S., Solovieva, N., and Weckström, J.: Climate-driven regime shifts in the biological communities of arctic lakes, P. Natl. Acad. Sci. USA, 102, 4397, https://doi.org/10.1073/pnas.0500245102, 2005.
Snickars, M., Weigel, B., and Bonsdorff, E.: Impact of eutrophication and climate change on fish and zoobenthos in coastal waters of the Baltic Sea, Mar. Biol., 162, 141–151, https://doi.org/10.1007/s00227-014-2579-3, 2015.
Sommer, U. and Lewandowska, A.: Climate change and the phytoplankton spring bloom: warming and overwintering zooplankton have similar effects on phytoplankton, Global Change Biol., 17, 154–162, https://doi.org/10.1111/j.1365-2486.2010.02182.x, 2011.
Sommer, U., Aberle, N., Lengfellner, K., and Lewandowska, A.: The Baltic Sea spring phytoplankton bloom in a changing climate: an experimental approach, Mar. Biol., 159, 2479–2490, https://doi.org/10.1007/s00227-012-1897-6, 2012.
Sommer, U., Paul, C., and Moustaka-Gouni, M.: Warming and Ocean Acidification Effects on Phytoplankton – From Species Shifts to Size Shifts within Species in a Mesocosm Experiment, PLoS ONE, 10, e0125239, https://doi.org/10.1371/journal.pone.0125239, 2015.
Sonesten, L., Frank-Kamenetsky, D., Gustafsson, B., Knuuttila, S., Räike, A., and Svendsen, L. M.: The Sixth Pollution Load Compilation (PLC-6), edited by: HELCOM, Helsinki, Finland, 15 pp., https://helcom.fi/media/publications/PLC-6-Executive-Summary.pdf (last access: 15 February 2022), 2018.
Soomere, T., Behrens, A., Tuomi, L., and Nielsen, J. W.: Wave conditions in the Baltic Proper and in the Gulf of Finland during windstorm Gudrun, Nat. Hazards Earth Syst. Sci., 8, 37–46, https://doi.org/10.5194/nhess-8-37-2008, 2008.
Soomere, T. and Pindsoo, K.: Spatial variability in the trends in extreme storm surges and weekly-scale high water levels in the eastern Baltic Sea, Cont. Shelf Res., 115, 53–64, https://doi.org/10.1016/j.csr.2015.12.016, 2016.
Soomere, T. and Räämet, A.: Spatial patterns of the wave climate in the Baltic Proper and the Gulf of Finland, Oceanologia, 53, 335–371, https://doi.org/10.5697/oc.53-1-TI.335, 2011.
Soomere, T., Viška, M., and Pindsoo, K.: Retrieving the Signal of Climate Change from Numerically Simulated Sediment Transport Along the Eastern Baltic Sea Coast, in: Coastline Changes of the Baltic Sea from South to East: Past and Future Projection, edited by: Harff, J., Furmańczyk, K., and von Storch, H., Springer International Publishing, Cham, 327–361, https://doi.org/10.1007/978-3-319-49894-2_15, 2017.
Sørland, S. L., Schär, C., Lüthi, D., and Kjellström, E.: Bias patterns and climate change signals in GCM-RCM model chains, Environ. Res. Lett., 13, 074017, https://doi.org/10.1088/1748-9326/aacc77, 2018.
Sousa, P. M., Trigo, R. M., Barriopedro, D., Soares, P. M. M., Ramos, A. M., and Liberato, M. L. R.: Responses of European precipitation distributions and regimes to different blocking locations, Clim. Dyn., 48, 1141–1160, https://doi.org/10.1007/s00382-016-3132-5, 2017.
Stahl, K., Hisdal, H., Hannaford, J., Tallaksen, L. M., van Lanen, H. A. J., Sauquet, E., Demuth, S., Fendekova, M., and Jódar, J.: Streamflow trends in Europe: evidence from a dataset of near-natural catchments, Hydrol. Earth Syst. Sci., 14, 2367–2382, https://doi.org/10.5194/hess-14-2367-2010, 2010.
Stålnacke, P., Grimvall, A., Sundblad, K., and Tonderski, A.: Estimation of riverine loads of nitrogen and phosphorus to the Baltic Sea, 1970–1993, Environ. Monit. Assess., 58, 173–200, https://doi.org/10.1023/a:1006073015871, 1999.
Stanhill, G., Achiman, O., Rosa, R., and Cohen, S.: The cause of solar dimming and brightening at the Earth's surface during the last half century: Evidence from measurements of sunshine duration, J. Geophys. Res.-Atmos., 119, 10902–10911, https://doi.org/10.1002/2013JD021308, 2014.
Stendel, M., Francis, J., White, R., Williams, P. D., and Woollings, T.: Chapter 15 – The jet stream and climate change, in: Climate Change (Third Edition), edited by: Letcher, T. M., Elsevier, 327–357, https://doi.org/10.1016/B978-0-12-821575-3.00015-3, 2021.
Stenseth, N. C., Payne, M. R., Bonsdorff, E., Dankel, D. J., Durant, J. M., Anderson, L. G., Armstrong, C. W., Blenckner, T., Brakstad, A., Dupont, S., Eikeset, A. M., Goksøyr, A., Jónsson, S., Kuparinen, A., Våge, K., Österblom, H., and Paasche, Ø.: Attuning to a changing ocean, P. Natl. Acad. Sci. USA, 117, 20363, https://doi.org/10.1073/pnas.1915352117, 2020.
Stephenson, D. B., Pavan, V., and Bojariu, R.: Is the North Atlantic Oscillation a random walk?, Int. J. Climatol., 20, 1–18, https://doi.org/10.1002/(SICI)1097-0088(200001)20:1<1::AID-JOC456>3.0.CO;2-P, 2000.
Stjern, C. W., Kristjánsson, J. E., and Hansen, A. W.: Global dimming and global brightening – an analysis of surface radiation and cloud cover data in northern Europe, Int. J. Climatol., 29, 643–653, https://doi.org/10.1002/joc.1735, 2009.
Stockholm University – Department of Physical Geography: Kebnekaise's south peak still highest in Sweden: https://www.su.se/english/research/kebnekaise-s-south-peak-still-highest-in-sweden-1.343483 (last access: 14 December 2020), 2017.
Stockholm University – Department of Physical Geography: Southern peak of Kebnekaise, lowest height ever measured: https://www.natgeo.su.se/english/research/resarch-news/southern-peak-of-kebnekaise-lowest-height-ever-measured-1.452263 (last access: 14 December 2020), 2019.
Stockholm University – Department of Physical Geography: Tarfala Research Station: https://www.natgeo.su.se/english/tarfala-research-station, last access: 14 December 2020.
Stokowski, M., Winogradow, A., Szymczycha, B., Carstensen, J., and Kuliński, K.: The CO2 system dynamics in the vicinity of the Vistula River mouth (the southern Baltic Sea): A baseline investigation, Estuar. Coast. Shelf Sci., 258, 107444, https://doi.org/10.1016/j.ecss.2021.107444, 2021.
Stonevičius, E., Rimkus, E., Štaras, A., Kažys, J., and Valiuškevičius, G.: Climate change impact on the Nemunas River basin hydrology in the 21st century, Boreal Environ. Res., 22, 49–65, 2017.
Storelvmo, T., Heede, U. K., Leirvik, T., Phillips, P. C. B., Arndt, P., and Wild, M.: Lethargic Response to Aerosol Emissions in Current Climate Models, Geophys. Res. Lett., 45, 9814–9823, https://doi.org/10.1029/2018GL078298, 2018.
Stramska, M. and Białogrodzka, J.: Spatial and temporal variability of sea surface temperature in the Baltic Sea based on 32-years (1982–2013) of satellite data, Oceanologia, 57, 223–235, https://doi.org/10.1016/j.oceano.2015.04.004, 2015.
Stramska, M. and Chudziak, N.: Recent multiyear trends in the Baltic Sea level, Oceanologia, 55, 319–337, https://doi.org/10.5697/oc.55-2.319, 2013.
Strandberg, G. and Kjellström, E.: Climate Impacts from Afforestation and Deforestation in Europe, Earth Interact., 23, 1–27, https://doi.org/10.1175/ei-d-17-0033.1, 2019.
Strong, C. and Magnusdottir, G.: Dependence of NAO variability on coupling with sea ice, Clim. Dyn., 36, 1681–1689, https://doi.org/10.1007/s00382-010-0752-z, 2011.
Suikkanen, S., Pulina, S., Engström-Öst, J., Lehtiniemi, M., Lehtinen, S., and Brutemark, A.: Climate Change and Eutrophication Induced Shifts in Northern Summer Plankton Communities, PLoS ONE, 8, e66475, https://doi.org/10.1371/journal.pone.0066475, 2013.
Sun, L., Perlwitz, J., and Hoerling, M.: What caused the recent “Warm Arctic, Cold Continents” trend pattern in winter temperatures?, Geophys. Res. Lett., 43, 5345-5352, https://doi.org/10.1002/2016GL069024, 2016.
Sündermann, J. and Pohlmann, T.: A brief analysis of North Sea physics, Oceanologia, 53, 663–689, https://doi.org/10.5697/oc.53-3.663, 2011.
Sundqvist, L., Harkonen, T., Svensson, C. J., and Harding, K. C.: Linking Climate Trends to Population Dynamics in the Baltic Ringed Seal: Impacts of Historical and Future Winter Temperatures, Ambio, 41, 865–872, https://doi.org/10.1007/s13280-012-0334-x, 2012.
Sutton, R. T. and Hodson, D. L. R.: Atlantic Ocean Forcing of North American and European Summer Climate, Science, 309, 115–118, https://doi.org/10.1126/science.1109496, 2005.
Suursaar, Ü. and Sooäär, J.: Decadal variations in mean and extreme sea level values along the Estonian coast of the Baltic Sea, Tellus A, 59, 249–260, https://doi.org/10.1111/j.1600-0870.2006.00220.x, 2007.
Suursaar, Ü., Tõnisson, H., Alari, V., Raudsepp, U., Rästas, H., and Anderson, A.: Projected Changes in Wave Conditions in the Baltic Sea by the end of 21st Century and the Corresponding Shoreline Changes, J. Coastal Res., 75, 1012–1016, https://doi.org/10.2112/si75-203.1, 2016.
Sveegaard, S., Andreasen, H., Mouritsen, K. N., Jeppesen, J. P., Teilmann, J., and Kinze, C. C.: Correlation between the seasonal distribution of harbour porpoises and their prey in the Sound, Baltic Sea, Mar. Biol., 159, 1029–1037, https://doi.org/10.1007/s00227-012-1883-z, 2012.
Svendsen, L. M. and Gustafsson, B.: Waterborne nitrogen and phosphorus inputs and water flow to the Baltic Sea 1995–2018, HELCOM Baltic Sea Environmental Fact Sheet, 25 pp., https://helcom.fi/media/documents/BSEFS-Waterborne-nitrogen-and-phosphorus-inputs-and-water (last access: 17 February 2022), 2020.
Swedish Infrastructure for Ecosystem Science: Meteorological data from Tarfala Research Station: https://data.fieldsites.se/portal/, last access: 14 December 2020.
Swedish Infrastructure for Ecosystem Science: Glacier data – surface mass balance from Rabots Glaciär, 1982–2020, https://meta.fieldsites.se/objects/Kl06fLDs-YUzlbvq2GmVkTNg (last access: 17 February 2022), 2021a.
Swedish Infrastructure for Ecosystem Science: Glacier data – surface mass balance from Mårmaglaciären, 1986–2020, https://meta.fieldsites.se/objects/EXzEgEOQbn9ofJJJrTX2fMHH (last access: 17 February 2022), 2021b.
Swedish Infrastructure for Ecosystem Science: Glacier data – surface mass balance from Riukojietna, 1986–2020, https://meta.fieldsites.se/objects/BZvbLykTx4cnEVaEuMSFVQeK, 2021c.
SMHI – Swedish Meteorological and Hydrological Institute: Climate scenarios: http://www.smhi.se/en/climate/future-climate/climate-scenarios/, last access: 14 December 2020.
SMHI – Swedish Meteorological and Hydrological Institute: Klimatindikator – Globalstrålning: https://www.smhi.se/klimat/klimatet-da-och-nu/klimatindikatorer/stralning-1.17841, last access: 12 February 2021.
Sweet, W., Kopp, R. E., Weaver, C. P., Obeysekera, J. T. B., Horton, R. M., Thieler, E. R., and Zervas, C. E.: Global and regional sea level rise scenarios for the United States, NOAA technical report NOS CO-OPS: 83, Silver Spring, Maryland, USA, 75 pp., https://doi.org/10.7289/v5/tr-nos-coops-083, 2017.
Szwed, M., Pińskwar, I., Kundzewicz, Z. W., Graczyk, D., and Mezghani, A.: Changes of snow cover in Poland, Acta Geophys., 65, 65–76, https://doi.org/10.1007/s11600-017-0007-z, 2017.
Szwed, M., Dobler, A., Mezghani, A., and Saloranta, T. M.: Change of maximum snow cover depth in Poland – Trends and projections, Időjárás, 123, 487–500, https://doi.org/10.28974/idojaras.2019.4.5, 2019.
Takolander, A., Cabeza, M., and Leskinen, E.: Climate change can cause complex responses in Baltic Sea macroalgae: A systematic review, J. Sea Res., 123, 16–29, https://doi.org/10.1016/j.seares.2017.03.007, 2017.
Tamarin-Brodsky, T. and Kaspi, Y.: Enhanced poleward propagation of storms under climate change, Nat. Geosci., 10, 908–913, https://doi.org/10.1038/s41561-017-0001-8, 2017.
Tamarin, T. and Kaspi, Y.: The poleward shift of storm tracks under global warming: A Lagrangian perspective, Geophys. Res. Lett., 44, 10666–10674, https://doi.org/10.1002/2017GL073633, 2017.
Tang, J., Yurova, A. Y., Schurgers, G., Miller, P. A., Olin, S., Smith, B., Siewert, M. B., Olefeldt, D., Pilesjö, P., and Poska, A.: Drivers of dissolved organic carbon export in a subarctic catchment: Importance of microbial decomposition, sorption-desorption, peatland and lateral flow, Sci. Total Environ., 622–623, 260–274, https://doi.org/10.1016/j.scitotenv.2017.11.252, 2018.
Tang, L., Ramacher, M. O. P., Moldanová, J., Matthias, V., Karl, M., Johansson, L., Jalkanen, J.-P., Yaramenka, K., Aulinger, A., and Gustafsson, M.: The impact of ship emissions on air quality and human health in the Gothenburg area – Part 1: 2012 emissions, Atmos. Chem. Phys., 20, 7509–7530, https://doi.org/10.5194/acp-20-7509-2020, 2020.
Taniguchi, M., Dulai, H., Burnett, K. M., Santos, I. R., Sugimoto, R., Stieglitz, T., Kim, G., Moosdorf, N., and Burnett, W. C.: Submarine Groundwater Discharge: Updates on Its Measurement Techniques, Geophysical Drivers, Magnitudes, and Effects, Front. Environ. Sci., 7, 141, https://doi.org/10.3389/fenvs.2019.00141, 2019.
Teichmann, C., Bülow, K., Otto, J., Pfeifer, S., Rechid, D., Sieck, K., and Jacob, D.: Avoiding Extremes: Benefits of Staying below +1.5 ∘C Compared to +2.0 ∘C and +3.0 ∘C Global Warming, Atmosphere, 9, 115, https://doi.org/10.3390/atmos9040115, 2018.
Teuling, A. J.: A hot future for European droughts, Nat. Clim. Change, 8, 364–365, https://doi.org/10.1038/s41558-018-0154-5, 2018.
Thompson, P. M.: Seasonal changes in the distribution and composition of common seal (Phoca vitulina) haul-out groups, J. Zool., 217, 281–294, https://doi.org/10.1111/j.1469-7998.1989.tb02488.x, 1989.
Thomson, A. M., Calvin, K. V., Smith, S. J., Kyle, G. P., Volke, A., Patel, P., Delgado-Arias, S., Bond-Lamberty, B., Wise, M. A., Clarke, L. E., and Edmonds, J. A.: RCP4.5: a pathway for stabilization of radiative forcing by 2100, Clim. Change, 109, 77, https://doi.org/10.1007/s10584-011-0151-4, 2011.
Tikkanen, M. and Oksanen, J.: Late Weichselian and Holocene shore displacement history of the Baltic Sea in Finland, Fennia – Int. J. Geogr., 180, 9–20, 2002.
Tilinina, N., Gulev, S. K., Rudeva, I., and Koltermann, P.: Comparing Cyclone Life Cycle Characteristics and Their Interannual Variability in Different Reanalyses, J. Climate, 26, 6419–6438, https://doi.org/10.1175/jcli-d-12-00777.1, 2013.
Timmermann, K., Norkko, J., Janas, U., Norkko, A., Gustafsson, B. G., and Bonsdorff, E.: Modelling macrofaunal biomass in relation to hypoxia and nutrient loading, J. Mar. Syst., 105–108, 60–69, https://doi.org/10.1016/j.jmarsys.2012.06.001, 2012.
Ting, M., Kushnir, Y., Seager, R., and Li, C.: Robust features of Atlantic multi-decadal variability and its climate impacts, Geophys. Res. Lett., 38, L17705, https://doi.org/10.1029/2011GL048712, 2011.
Tinz, B.: On the relation between annual maximum extent of ice cover in the Baltic Sea and sea level pressure as well as air temperature field, Geophysica, 32, 319–341, 1996.
Tokarska, K. B., Stolpe, M. B., Sippel, S., Fischer, E. M., Smith, C. J., Lehner, F., and Knutti, R.: Past warming trend constrains future warming in CMIP6 models, Sci. Adv., 6, eaaz9549, https://doi.org/10.1126/sciadv.aaz9549, 2020.
Tomczyk, A. M., Bednorz, E., and Szyga-Pluta, K.: Changes in Air Temperature and Snow Cover in Winter in Poland, Atmosphere, 12, 68, https://doi.org/10.3390/atmos12010068, 2021.
Torn, K., Peterson, A., and Herkül, K.: Predicting the Impact of Climate Change on the Distribution of the Key Habitat-Forming Species in the Ne Baltic Sea, J. Coastal Res., 95, 177–181, https://doi.org/10.2112/SI95-035.1, 2020.
Törnroos, A., Pecuchet, L., Olsson, J., Gårdmark, A., Blomqvist, M., Lindegren, M., and Bonsdorff, E.: Four decades of functional community change reveals gradual trends and low interlinkage across trophic groups in a large marine ecosystem, Global Change Biol., 25, 1235–1246, https://doi.org/10.1111/gcb.14552, 2019.
Tuomi, L., Kahma, K. K., and Pettersson, H.: Wave hindcast statistics in the seasonally ice-covered Baltic Sea, Boreal Environ. Res., 16, 451–472, 2011.
Turner, D. R., Hassellöv, I.-M., Ytreberg, E., and Rutgersson, A.: Shipping and the environment: Smokestack emissions, scrubbers and unregulated oceanic consequences, Elementa-Sci. Anthrop., 5, 45, https://doi.org/10.1525/elementa.167, 2017.
Turner, D. R., Edman, M., Gallego-Urrea, J. A., Claremar, B., Hassellöv, I.-M., Omstedt, A., and Rutgersson, A.: The potential future contribution of shipping to acidification of the Baltic Sea, Ambio, 47, 368–378, https://doi.org/10.1007/s13280-017-0950-6, 2018.
Ukkonen, P., Aaris-Sørensen, K., Arppe, L., Daugnora, L., Halkka, A., Lõugas, L., Oinonen, M. J., Pilot, M., and Storå, J.: An Arctic seal in temperate waters: History of the ringed seal (Pusa hispida) in the Baltic Sea and its adaptation to the changing environment, Holocene, 24, 1694–1706, https://doi.org/10.1177/0959683614551226, 2014.
Ulbrich, U., Pinto, J. G., Kupfer, H., Leckebusch, G. C., Spangehl, T., and Reyers, M.: Changing Northern Hemisphere Storm Tracks in an Ensemble of IPCC Climate Change Simulations, J. Climate, 21, 1669–1679, https://doi.org/10.1175/2007jcli1992.1, 2008.
Ulfsbo, A., Kuliński, K., Anderson, L. G., and Turner, D. R.: Modelling organic alkalinity in the Baltic Sea using a Humic-Pitzer approach, Mar. Chem., 168, 18–26, https://doi.org/10.1016/j.marchem.2014.10.013, 2015.
Umlauf, L., Holtermann, P. L., Gillner, C. A., Prien, R. D., Merckelbach, L., and Carpenter, J. R.: Diffusive Convection under Rapidly Varying Conditions, J. Phys. Oceanogr., 48, 1731–1747, https://doi.org/10.1175/jpo-d-18-0018.1, 2018.
Undeman, E., Gustafsson, B. G., Humborg, C., and McLachlan, M. S.: Application of a novel modeling tool with multistressor functionality to support management of organic contaminants in the Baltic Sea, Ambio, 44, 498–506, https://doi.org/10.1007/s13280-015-0668-2, 2015.
United Nations Climate Change: Paris Agreement, 27 pp., https://unfccc.int/documents/37107 (last access: 17 February 2022), 2015.
Uotila, P., Vihma, T., and Haapala, J.: Atmospheric and oceanic conditions and the extremely low Bothnian Bay sea ice extent in 2014/2015, Geophys. Res. Lett., 42, 7740–7749, https://doi.org/10.1002/2015GL064901, 2015.
Urraca, R., Gracia-Amillo, A. M., Koubli, E., Huld, T., Trentmann, J., Riihelä, A., Lindfors, A. V., Palmer, D., Gottschalg, R., and Antonanzas-Torres, F.: Extensive validation of CM SAF surface radiation products over Europe, Remote Sens. Environ., 199, 171–186, https://doi.org/10.1016/j.rse.2017.07.013, 2017.
Vähätalo, A. V., Rainio, K., Lehikoinen, A., and Lehikoinen, E.: Spring arrival of birds depends on the North Atlantic Oscillation, J. Avian Biol., 35, 210–216, https://doi.org/10.1111/j.0908-8857.2004.03199.x, 2004.
Vahtera, E., Conley, D. J., Gustafsson, B. G., Kuosa, H., Pitkänen, H., Savchuk, O. P., Tamminen, T., Viitasalo, M., Voss, M., Wasmund, N., and others: Internal ecosystem feedbacks enhance nitrogen-fixing cyanobacteria blooms and complicate management in the Baltic Sea, Ambio, 36, 186–194, https://doi.org/10.1579/0044-7447(2007)36[186:IEFENC]2.0.CO;2, 2007.
Väli, G., Meier, H. E. M., and Elken, J.: Simulated halocline variability in the Baltic Sea and its impact on hypoxia during 1961–2007, J. Geophys. Res.-Oceans, 118, 6982–7000, https://doi.org/10.1002/2013JC009192, 2013.
van der Jeugd, H. P., Eichhorn, G., Litvin, K. E., Stahl, J., Larsson, K., van der Graaf, A. J., and Drent, R. H.: Keeping up with early springs: rapid range expansion in an avian herbivore incurs a mismatch between reproductive timing and food supply, Global Change Biol., 15, 1057–1071, https://doi.org/10.1111/j.1365-2486.2008.01804.x, 2009.
van Helmond, N. A. G. M., Jilbert, T., and Slomp, C. P.: Hypoxia in the Holocene Baltic Sea: Comparing modern versus past intervals using sedimentary trace metals, Chem. Geol., 493, 478–490, https://doi.org/10.1016/j.chemgeo.2018.06.028, 2018.
van Vuuren, D. P., Stehfest, E., den Elzen, M. G. J., Kram, T., van Vliet, J., Deetman, S., Isaac, M., Klein Goldewijk, K., Hof, A., Mendoza Beltran, A., Oostenrijk, R., and van Ruijven, B.: RCP2.6: exploring the possibility to keep global mean temperature increase below 2 ∘C, Clim. Change, 109, 95, https://doi.org/10.1007/s10584-011-0152-3, 2011.
Vanninen, P., Östin, A., Bełdowski, J., Pedersen, E. A., Söderström, M., Szubska, M., Grabowski, M., Siedlewicz, G., Czub, M., Popiel, S., Nawała, J., Dziedzic, D., Jakacki, J., and Pączek, B.: Exposure status of sea-dumped chemical warfare agents in the Baltic Sea, Mar. Environ. Res., 161, 105112, https://doi.org/10.1016/j.marenvres.2020.105112, 2020.
Varotsos, K. V., Giannakopoulos, C., and Tombrou, M.: Assessment of the Impacts of Climate Change on European Ozone Levels, Water Air Soil Poll., 224, 1596, https://doi.org/10.1007/s11270-013-1596-z, 2013.
Vaughan, D. G., Comiso, J. C., Allison, I., Carrasco, J., Kaser, G., Kwok, R., Mote, P., Murray, T., Paul, F., Ren, J., Rignot, E., Solomina, O., Steffen, K., and Zhang, T.: Observations: Cryosphere, in: Climate Change 2013 – The Physical Science Basis: Working Group I Contribution to the Fifth Assessment Report of the Intergovernmental Panel on Climate Change, edited by: Intergovernmental Panel on Climate Change, Cambridge University Press, Cambridge, 317–382, https://doi.org/10.1017/CBO9781107415324.012, 2014.
Vehmaa, A., Hogfors, H., Gorokhova, E., Brutemark, A., Holmborn, T., and Engström-Öst, J.: Projected marine climate change: effects on copepod oxidative status and reproduction, Ecol. Evol., 3, 4548–4557, https://doi.org/10.1002/ece3.839, 2013.
Vehmaa, A., Almén, A.-K., Brutemark, A., Paul, A., Riebesell, U., Furuhagen, S., and Engström-Öst, J.: Ocean acidification challenges copepod phenotypic plasticity, Biogeosciences, 13, 6171–6182, https://doi.org/10.5194/bg-13-6171-2016, 2016.
Veijalainen, N., Lotsari, E., Vehviläinen, B., Alho, P., and Käyhkö, J.: Changes in floods in Finland due to climate change: General assessment on national scale, in: 6th Alexander von Humboldt International Conference on Climate Change, Natural Hazards, and Societies, 14–19 March 2010, Merida, Mexico, 2010.
Vihma, T. and Haapala, J.: Geophysics of sea ice in the Baltic Sea: A review, Prog. Oceanogr., 80, 129–148, https://doi.org/10.1016/j.pocean.2009.02.002, 2009.
Vihma, T.: Weather Extremes Linked to Interaction of the Arctic and Midlatitudes, in: Climate Extremes, edited by: Wang, S. Y. S., Yoon, J. H., Funk, C. C., and Gillies, R. R., Geophysical Monograph Series, American Geophysical Union and John Wiley and Sons, Inc., 39–50, https://doi.org/10.1002/9781119068020.ch2, 2017.
Viitasalo, M. and Bonsdorff, E.: Global climate change and the Baltic Sea ecosystem: direct and indirect effects on species, communities and ecosystem functioning, Earth Syst. Dynam. Discuss. [preprint], https://doi.org/10.5194/esd-2021-73, in review, 2021.
Viru, B. and Jaagus, J.: Spatio-temporal variability and seasonal dynamics of snow cover regime in Estonia, Theor. Appl. Climatol., 139, 759–771, https://doi.org/10.1007/s00704-019-03013-5, 2020.
Viška, M. and Soomere, T.: Simulated and observed reversals of wave-driven alongshore sediment transport at the eastern Baltic Sea coast, Baltica, 26, 145–156, 2013.
Vogt, J., Soille, P., Jager, A. d., Rimaviciute, E., Mehl, W., Foisneau, S., Bódis, K., Dusart, J., Paracchini, M. L., Haastrup, P., and Bamps, C.: A pan-European River and Catchment Database, European Commission – Joint Research Centre – Institute for Environment and Sustainability, Ispra, Italy, 124 pp., https://doi.org/10.2788/35907, 2007.
Vogt, J., Rimaviciute, E., and Jager, A. d.: CCM2 River and Catchment Database for Europe Version 2.1 Release Notes, European Commission - Joint Research Centre – Institute for Environment and Sustainability, Ispra, Italy, 5pp, 2008.
Voipio, A.: The Baltic Sea, in: Elsevier Oceanographic Series, Vol. 30, 1st Edn., Amsterdam, 417 pp., ISBN 9780080870687, 1981.
Volkov, V. A., Johannessen, O. M., Borodachev, V. E., Voinov, G. N., Pettersson, L. H., Bobylev, L. P., and Kouraev, A. V.: Polar seas oceanography: an integrated case study of the Kara Sea, 1st Edn., Springer Praxis Books, Springer, Berlin, Heidelberg, 450 pp., ISBN 978-3-540-42969-2, 2002.
Vonk, J. E., Tank, S. E., Bowden, W. B., Laurion, I., Vincent, W. F., Alekseychik, P., Amyot, M., Billet, M. F., Canário, J., Cory, R. M., Deshpande, B. N., Helbig, M., Jammet, M., Karlsson, J., Larouche, J., MacMillan, G., Rautio, M., Walter Anthony, K. M., and Wickland, K. P.: Reviews and syntheses: Effects of permafrost thaw on Arctic aquatic ecosystems, Biogeosciences, 12, 7129–7167, https://doi.org/10.5194/bg-12-7129-2015, 2015.
Voss, R., Hinrichsen, H.-H., Quaas, M. F., Schmidt, J. O., and Tahvonen, O.: Temperature change and Baltic sprat: from observations to ecological–economic modelling, ICES J. Mar. Sci., 68, 1244–1256, https://doi.org/10.1093/icesjms/fsr063, 2011.
Vousdoukas, M. I., Voukouvalas, E., Annunziato, A., Giardino, A., and Feyen, L.: Projections of extreme storm surge levels along Europe, Clim. Dyn., 47, 3171–3190, https://doi.org/10.1007/s00382-016-3019-5, 2016.
Vousdoukas, M. I., Mentaschi, L., Voukouvalas, E., Verlaan, M., and Feyen, L.: Extreme sea levels on the rise along Europe's coasts, Earths Future, 5, 304–323, https://doi.org/10.1002/2016EF000505, 2017.
Vuorinen, I., Hänninen, J., Rajasilta, M., Laine, P., Eklund, J., Montesino-Pouzols, F., Corona, F., Junker, K., Meier, H. E. M., and Dippner, J. W.: Scenario simulations of future salinity and ecological consequences in the Baltic Sea and adjacent North Sea areas–implications for environmental monitoring, Ecol. Indic., 50, 196–205, https://doi.org/10.1016/j.ecolind.2014.10.019, 2015.
Wahl, M., Werner, F. J., Buchholz, B., Raddatz, S., Graiff, A., Matthiessen, B., Karsten, U., Hiebenthal, C., Hamer, J., Ito, M., Gülzow, E., Rilov, G., and Guy-Haim, T.: Season affects strength and direction of the interactive impacts of ocean warming and biotic stress in a coastal seaweed ecosystem, Limnol. Oceanogr., 65, 807–827, https://doi.org/10.1002/lno.11350, 2020.
Wahl, T. and Chambers, D. P.: Climate controls multidecadal variability in U. S. extreme sea level records, J. Geophys. Res.-Oceans, 121, 1274–1290, https://doi.org/10.1002/2015JC011057, 2016.
Wåhlström, I., Höglund, A., Almroth-Rosell, E., MacKenzie, B. R., Gröger, M., Eilola, K., Plikshs, M., and Andersson, H. C.: Combined climate change and nutrient load impacts on future habitats and eutrophication indicators in a eutrophic coastal sea, Limnol. Oceanogr., 65, 2170–2187, https://doi.org/10.1002/lno.11446, 2020.
Waldeck, P. and Larsson, K.: Effects of winter water temperature on mass loss in Baltic blue mussels: Implications for foraging sea ducks, J. Exp. Mar. Biol. Ecol., 444, 24–30, https://doi.org/10.1016/j.jembe.2013.03.007, 2013.
Wang, J., Yang, B., Ljungqvist, F. C., Luterbacher, J., Osborn, Timothy J., Briffa, K. R., and Zorita, E.: Internal and external forcing of multidecadal Atlantic climate variability over the past 1200 years, Nat. Geosci., 10, 512–517, https://doi.org/10.1038/ngeo2962, 2017.
Wang, Q., Fan, X., and Wang, M.: Evidence of high-elevation amplification versus Arctic amplification, Sci. Rep.-UK, 6, 19219, https://doi.org/10.1038/srep19219, 2016.
Wang, S., Dieterich, C., Döscher, R., Höglund, A., Hordoir, R., Meier, H. E. M., Samuelsson, P., and Schimanke, S.: Development and evaluation of a new regional coupled atmosphere–ocean model in the North Sea and Baltic Sea, Tellus A, 67, 24284, https://doi.org/10.3402/tellusa.v67.24284, 2015.
Warwick, R. M., Tweedley, J. R., and Potter, I. C.: Microtidal estuaries warrant special management measures that recognise their critical vulnerability to pollution and climate change, Mar. Pollut. Bull., 135, 41–46, https://doi.org/10.1016/j.marpolbul.2018.06.062, 2018.
Wasmund, N., Tuimala, J., Suikkanen, S., Vandepitte, L., and Kraberg, A.: Long-term trends in phytoplankton composition in the western and central Baltic Sea, J. Mar. Syst., 87, 145–159, https://doi.org/10.1016/j.jmarsys.2011.03.010, 2011.
Wasmund, N.: The Diatom/Dinoflagellate Index as an Indicator of Ecosystem Changes in the Baltic Sea. 2. Historical Data for Use in Determination of Good Environmental Status, Front. Mar. Sci., 4, 153, https://doi.org/10.3389/fmars.2017.00153, 2017.
Wasmund, N., Nausch, G., Gerth, M., Busch, S., Burmeister, C., Hansen, R., and Sadkowiak, B.: Extension of the growing season of phytoplankton in the western Baltic Sea in response to climate change, Mar. Ecol. Prog. Ser., 622, 1–16, https://doi.org/10.3354/meps12994, 2019.
Watanabe, M., and Tatebe, H.: Reconciling roles of sulphate aerosol forcing and internal variability in Atlantic multidecadal climate changes, Clim. Dyn., 53, 4651–4665, https://doi.org/10.1007/s00382-019-04811-3, 2019.
Watson, L., Lacressonnière, G., Gauss, M., Engardt, M., Andersson, C., Josse, B., Marécal, V., Nyiri, A., Sobolowski, S., Siour, G., Szopa, S., and Vautard, R.: Impact of emissions and +2 ∘C climate change upon future ozone and nitrogen dioxide over Europe, Atmos. Environ., 142, 271–285, https://doi.org/10.1016/j.atmosenv.2016.07.051, 2016.
Watts, P.: The diel hauling-out cycle of harbour seals in an open marine environment: correlates and constraints, J. Zool., 240, 175–200, https://doi.org/10.1111/j.1469-7998.1996.tb05494.x, 1996.
Weigel, B., Andersson, H. C., Meier, H. E. M., Blenckner, T., Snickars, M., and Bonsdorff, E.: Long-term progression and drivers of coastal zoobenthos in a changing system, Mar. Ecol. Prog. Ser., 528, 141–159, https://doi.org/10.3354/meps11279, 2015.
Weisse, R. and Weidemann, H.: Baltic Sea extreme sea levels 1948–2011: Contributions from atmospheric forcing, Proc. IUTAM, 25, 65–69, https://doi.org/10.1016/j.piutam.2017.09.010, 2017.
Weisse, R., Dailidienė, I., Hünicke, B., Kahma, K., Madsen, K., Omstedt, A., Parnell, K., Schöne, T., Soomere, T., Zhang, W., and Zorita, E.: Sea level dynamics and coastal erosion in the Baltic Sea region, Earth Syst. Dynam., 12, 871–898, https://doi.org/10.5194/esd-12-871-2021, 2021.
Whan, K., Zscheischler, J., Orth, R., Shongwe, M., Rahimi, M., Asare, E. O., and Seneviratne, S. I.: Impact of soil moisture on extreme maximum temperatures in Europe, Weather. Clim. Extremes, 9, 57–67, https://doi.org/10.1016/j.wace.2015.05.001, 2015.
Wikner, J. and Andersson, A.: Increased freshwater discharge shifts the trophic balance in the coastal zone of the northern Baltic Sea, Global Change Biol., 18, 2509–2519, https://doi.org/10.1111/j.1365-2486.2012.02718.x, 2012.
Wild, M., Gilgen, H., Roesch, A., Ohmura, A., Long, C. N., Dutton, E. G., Forgan, B., Kallis, A., Russak, V., and Tsvetkov, A.: From Dimming to Brightening: Decadal Changes in Solar Radiation at Earth's Surface, Science, 308, 847, https://doi.org/10.1126/science.1103215, 2005.
Wild, M.: Enlightening Global Dimming and Brightening, B. Amer. Meteor. Soc., 93, 27–37, https://doi.org/10.1175/bams-d-11-00074.1, 2012.
Wild, M.: Decadal changes in radiative fluxes at land and ocean surfaces and their relevance for global warming, Wires. Clim. Change, 7, 91–107, https://doi.org/10.1002/wcc.372, 2016.
Wild, M., Ohmura, A., Schär, C., Müller, G., Folini, D., Schwarz, M., Hakuba, M. Z., and Sanchez-Lorenzo, A.: The Global Energy Balance Archive (GEBA) version 2017: a database for worldwide measured surface energy fluxes, Earth Syst. Sci. Data, 9, 601–613, https://doi.org/10.5194/essd-9-601-2017, 2017.
Wild, M., Wacker, S., Yang, S., and Sanchez-Lorenzo, A.: Evidence for Clear-sky Dimming and Brightening in Central Europe, Geophys. Res. Lett., 48, e2020GL092216, https://doi.org/10.1029/2020GL092216, 2021.
Williams, C. N., Carrivick, J. L., Evans, A. J., and Rippin, D. M.: Quantifying uncertainty in using multiple datasets to determine spatiotemporal ice mass loss over 101 years at kårsaglaciären, sub-arctic sweden, Geogr. Ann. A, 98, 61–79, https://doi.org/10.1111/geoa.12123, 2016.
Willison, J., Robinson, W. A., and Lackmann, G. M.: North Atlantic Storm-Track Sensitivity to Warming Increases with Model Resolution, J. Climate, 28, 4513–4524, https://doi.org/10.1175/jcli-d-14-00715.1, 2015.
Wills, R. C. J., Armour, K. C., Battisti, D. S., and Hartmann, D. L.: Ocean–Atmosphere Dynamical Coupling Fundamental to the Atlantic Multidecadal Oscillation, J. Climate, 32, 251–272, https://doi.org/10.1175/jcli-d-18-0269.1, 2018.
Wills, R. C. J., White, R. H., and Levine, X. J.: Northern Hemisphere Stationary Waves in a Changing Climate, Curr. Clim. Chang. Rep., 5, 372–389, https://doi.org/10.1007/s40641-019-00147-6, 2019.
Wilson, D., Hisdal, H., and Lawrence, D.: Has streamflow changed in the Nordic countries? – Recent trends and comparisons to hydrological projections, J. Hydrol., 394, 334–346, https://doi.org/10.1016/j.jhydrol.2010.09.010, 2010.
Wisniewska, Danuta M., Johnson, M., Teilmann, J., Rojano-Doñate, L., Shearer, J., Sveegaard, S., Miller, Lee A., Siebert, U., and Madsen, Peter T.: Ultra-High Foraging Rates of Harbor Porpoises Make Them Vulnerable to Anthropogenic Disturbance, Curr. Biol., 26, 1441–1446, https://doi.org/10.1016/j.cub.2016.03.069, 2016.
Wohland, J., Brayshaw, D., Bloomfield, H., and Wild, M.: European multidecadal solar variability badly captured in all centennial reanalyses except CERA20C, Environ. Res. Lett., 15, 104021, https://doi.org/10.1088/1748-9326/aba7e6, 2020.
Wolski, T. and Wiśniewski, B.: Geographical diversity in the occurrence of extreme sea levels on the coasts of the Baltic Sea, J. Sea Res., 159, 101890, https://doi.org/10.1016/j.seares.2020.101890, 2020.
Wolski, T., Wiśniewski, B., Giza, A., Kowalewska-Kalkowska, H., Boman, H., Grabbi-Kaiv, S., Hammarklint, T., Holfort, J., and Lydeikaitė, Ž.: Extreme sea levels at selected stations on the Baltic Sea coast, Oceanologia, 56, 259–290, https://doi.org/10.5697/oc.56-2.259, 2014.
Woodruff, S. D., Worley, S. J., Lubker, S. J., Ji, Z., Eric Freeman, J., Berry, D. I., Brohan, P., Kent, E. C., Reynolds, R. W., Smith, S. R., and Wilkinson, C.: ICOADS Release 2.5: extensions and enhancements to the surface marine meteorological archive, Int. J. Climatol., 31, 951–967, https://doi.org/10.1002/joc.2103, 2011.
Woollings, T., Barriopedro, D., Methven, J., Son, S.-W., Martius, O., Harvey, B., Sillmann, J., Lupo, A. R., and Seneviratne, S.: Blocking and its Response to Climate Change, Curr. Clim. Chang. Rep., 4, 287–300, https://doi.org/10.1007/s40641-018-0108-z, 2018.
World Glacier Monitoring Service: Global Glacier Change Bulletin No. 3 (2016–2017), edited by: Zemp, M., Gärtner-Roer, I., Nussbaumer, S. U., Bannwart, J., Rastner, P., Paul, F., and Hoelzle, M., WGMS, Zurich, Switzerland, 289 pp., https://doi.org/10.5167/uzh-191797, 2020.
World Glacier Monitoring Service: Fluctuations of Glaciers (FoG) Database: https://wgms.ch/data_databaseversions/, last access: 22 November 2021, 2021.
World Meteorological Organization: State of the Global Climate 2020, WMO-No. 1264, WMO, Geneva, Switzerland, 38 pp., https://library.wmo.int/index.php?lvl=notice_display&id=21880#.Yg4u8d8xlaS (last access: 17 February 2022), 2020.
Wrzesiński, D., Choiński, A., Ptak, M., and Skowron, R.: Effect of the North Atlantic Oscillation on the Pattern of Lake Ice Phenology in Poland, Acta Geophys., 63, 1664–1684, https://doi.org/10.1515/acgeo-2015-0055, 2015.
Wu, S., Liu, Z.-Y., Cheng, J., and Li, C.: Response of North Pacific and North Atlantic decadal variability to weak global warming, Adv. Clim. Chang. Res., 9, 95–101, https://doi.org/10.1016/j.accre.2018.03.001, 2018.
Wu, S. and Liu, Z.-Y.: Decadal Variability in the North Pacific and North Atlantic under Global Warming: The Weakening Response and Its Mechanism, J. Climate, 33, 9181–9193, https://doi.org/10.1175/jcli-d-19-1012.1, 2020.
Wübber, C. and Krauss, W.: The two dimensional seiches of the Baltic Sea, Oceanol. Acta, 2, 435–446, 1979.
Wulff, A., Karlberg, M., Olofsson, M., Torstensson, A., Riemann, L., Steinhoff, F. S., Mohlin, M., Ekstrand, N., and Chierici, M.: Ocean acidification and desalination: climate-driven change in a Baltic Sea summer microplanktonic community, Mar. Biol., 165, 63, https://doi.org/10.1007/s00227-018-3321-3, 2018.
Wyser, K., van Noije, T., Yang, S., von Hardenberg, J., O'Donnell, D., and Döscher, R.: On the increased climate sensitivity in the EC-Earth model from CMIP5 to CMIP6, Geosci. Model Dev., 13, 3465–3474, https://doi.org/10.5194/gmd-13-3465-2020, 2020.
Ye, K. and Lau, N.-C.: Influences of surface air temperature and atmospheric circulation on winter snow cover variability over Europe, Int. J. Climatol., 37, 2606–2619, https://doi.org/10.1002/joc.4868, 2017.
Yin, J. H.: A consistent poleward shift of the storm tracks in simulations of 21st century climate, Geophys. Res. Lett., 32, L18701, https://doi.org/10.1029/2005GL023684, 2005.
Yli-Pelkonen, V.: Ecological information in the political decision making of urban land-use planning, J. Environ. Plan. Manag., 51, 345–362, https://doi.org/10.1080/09640560801977224, 2008.
Zandersen, M., Hyytiäinen, K., Meier, H. E. M., Tomczak, M. T., Bauer, B., Haapasaari, P. E., Olesen, J. E., Gustafsson, B. G., Refsgaard, J. C., Fridell, E., Pihlainen, S., Le Tissier, M. D. A., Kosenius, A.-K., and Van Vuuren, D. P.: Shared socio-economic pathways extended for the Baltic Sea: exploring long-term environmental problems, Reg. Environ. Change, 19, 1073–1086, https://doi.org/10.1007/s10113-018-1453-0, 2019.
Zappa, G., Shaffrey, L. C., Hodges, K. I., Sansom, P. G., and Stephenson, D. B.: A Multimodel Assessment of Future Projections of North Atlantic and European Extratropical Cyclones in the CMIP5 Climate Models, J. Climate, 26, 5846–5862, https://doi.org/10.1175/jcli-d-12-00573.1, 2013.
Zappa, G. and Shepherd, T. G.: Storylines of Atmospheric Circulation Change for European Regional Climate Impact Assessment, J. Climate, 30, 6561–6577, https://doi.org/10.1175/jcli-d-16-0807.1, 2017.
Zappa, G., Pithan, F., and Shepherd, T. G.: Multimodel Evidence for an Atmospheric Circulation Response to Arctic Sea Ice Loss in the CMIP5 Future Projections, Geophys. Res. Lett., 45, 1011–1019, https://doi.org/10.1002/2017GL076096, 2018.
Zemp, M., Huss, M., Thibert, E., Eckert, N., McNabb, R., Huber, J., Barandun, M., Machguth, H., Nussbaumer, S. U., Gärtner-Roer, I., Thomson, L., Paul, F., Maussion, F., Kutuzov, S., and Cogley, J. G.: Global glacier mass changes and their contributions to sea-level rise from 1961 to 2016, Nature, 568, 382–386, https://doi.org/10.1038/s41586-019-1071-0, 2019.
Zhang, M., Lee, X., Yu, G., Han, S., Wang, H., Yan, J., Zhang, Y., Li, Y., Ohta, T., Hirano, T., Kim, J., Yoshifuji, N., and Wang, W.: Response of surface air temperature to small-scale land clearing across latitudes, Environ. Res. Lett., 9, 034002, https://doi.org/10.1088/1748-9326/9/3/034002, 2014.
Zhang, W., Harff, J., and Schneider, R.: Analysis of 50-year wind data of the southern Baltic Sea for modelling coastal morphological evolution – a case study from the Darss-Zingst Peninsula, Oceanologia, 53, 489–518, https://doi.org/10.5697/oc.53-1-TI.489, 2011.
Zhang, W., Miller, P. A., Smith, B., Wania, R., Koenigk, T., and Döscher, R.: Tundra shrubification and tree-line advance amplify arctic climate warming: results from an individual-based dynamic vegetation model, Environ. Res. Lett., 8, 034023, https://doi.org/10.1088/1748-9326/8/3/034023, 2013.
Zhang, W., Jansson, C., Miller, P. A., Smith, B., and Samuelsson, P.: Biogeophysical feedbacks enhance the Arctic terrestrial carbon sink in regional Earth system dynamics, Biogeosciences, 11, 5503–5519, https://doi.org/10.5194/bg-11-5503-2014, 2014.
Zhang, W., Schneider, R., Kolb, J., Teichmann, T., Dudzinska-Nowak, J., Harff, J., and Hanebuth, T. J. J.: Land–sea interaction and morphogenesis of coastal foredunes – A modeling case study from the southern Baltic Sea coast, Coast. Eng., 99, 148–166, https://doi.org/10.1016/j.coastaleng.2015.03.005, 2015.
Zhang, W., Schneider, R., Harff, J., Hünicke, B., and Fröhle, P.: Modelling of Medium-Term (Decadal) Coastal Foredune Morphodynamics- Historical Hindcast and Future Scenarios of the Świna Gate Barrier Coast (Southern Baltic Sea), in: Coastline Changes of the Baltic Sea from South to East: Past and Future Projection, edited by: Harff, J., Furmańczyk, K., and von Storch, H., Springer International Publishing, Cham, 107–135, https://doi.org/10.1007/978-3-319-49894-2_7, 2017.
Zhang, W., Miller, P. A., Jansson, C., Samuelsson, P., Mao, J., and Smith, B.: Self-Amplifying Feedbacks Accelerate Greening and Warming of the Arctic, Geophys. Res. Lett., 45, 7102–7111, https://doi.org/10.1029/2018GL077830, 2018.
Zhong, X., Zhang, T., and Wang, K.: Snow density climatology across the former USSR, The Cryosphere, 8, 785–799, https://doi.org/10.5194/tc-8-785-2014, 2014.
Zhu, X., Lee, S.-Y., Wen, X., Wei, Z., Ji, Z., Zheng, Z., and Dong, W.: Historical evolution and future trend of Northern Hemisphere snow cover in CMIP5 and CMIP6 models, Environ. Res. Lett., 16, 065013, https://doi.org/10.1088/1748-9326/ac0662, 2021.
Zillén, L. and Conley, D. J.: Hypoxia and cyanobacteria blooms – are they really natural features of the late Holocene history of the Baltic Sea?, Biogeosciences, 7, 2567–2580, https://doi.org/10.5194/bg-7-2567-2010, 2010.
Zorita, E. and Laine, A.: Dependence of salinity and oxygen concentrations in the Baltic Sea on large-scale atmospheric circulation, Clim. Res., 14, 25–41, https://doi.org/10.3354/cr014025, 2000.
- Abstract
- Introduction
- Methods
- Current state of knowledge
- Interactions of climate with other anthropogenic drivers
- Comparison with the North Sea region
- Knowledge gaps and research needs
- Key messages
- Concluding remarks
- Code availability
- Data availability
- Author contributions
- Competing interests
- Disclaimer
- Special issue statement
- Acknowledgements
- Review statement
- References