the Creative Commons Attribution 4.0 License.
the Creative Commons Attribution 4.0 License.
 | 02 Feb 2022
Natural hazards and extreme events in the Baltic Sea region
Anna Rutgersson
Erik Kjellström
Jari Haapala
Martin Stendel
Irina Danilovich
Martin Drews
Kirsti Jylhä
Pentti Kujala
Xiaoli Guo Larsén
Kirsten Halsnæs
Ilari Lehtonen
Anna Luomaranta
Erik Nilsson
Taru Olsson
Jani Särkkä
Laura Tuomi
Norbert Wasmund
A natural hazard is a naturally occurring extreme event that has a negative effect on people and society or the environment. Natural hazards may have severe implications for human life and can potentially generate economic losses and damage ecosystems. A better understanding of their major causes, probability of occurrence, and consequences enables society to be better prepared to save human lives as well as to invest in adaptation options. Natural hazards related to climate change are identified as one of the Grand Challenges in the Baltic Sea region. Here, we summarize existing knowledge about extreme events in the Baltic Sea region with a focus on the past 200 years as well as on future climate scenarios. The events considered here are the major hydro-meteorological events in the region and include wind storms, extreme waves, high and low sea levels, ice ridging, heavy precipitation, sea-effect snowfall, river floods, heat waves, ice seasons, and drought. We also address some ecological extremes and the implications of extreme events for society (phytoplankton blooms, forest fires, coastal flooding, offshore infrastructure, and shipping). Significant knowledge gaps are identified, including the response of large-scale atmospheric circulation to climate change and also concerning specific events, for example, the occurrence of marine heat waves and small-scale variability in precipitation. Suggestions for future research include the further development of high-resolution Earth system models and the potential use of methodologies for data analysis (statistical methods and machine learning). With respect to the expected impacts of climate change, changes are expected for sea level, extreme precipitation, heat waves and phytoplankton blooms (increase), and cold spells and severe ice winters (decrease). For some extremes (drying, river flooding, and extreme waves), the change depends on the area and time period studied.
Please read the corrigendum first before continuing.
-
Notice on corrigendum
The requested paper has a corresponding corrigendum published. Please read the corrigendum first before downloading the article.
-
Article
(11990 KB)
-
The requested paper has a corresponding corrigendum published. Please read the corrigendum first before downloading the article.
- Article
(11990 KB) - Full-text XML
- Corrigendum
- BibTeX
- EndNote


Natural hazards and extreme events may have severe implications for society, including threats to human life, economic losses, and damage to ecosystems. A better understanding of their major causes and implications enables society to be better prepared, to save human lives, and to mitigate economic losses. Many natural hazards are of hydro-meteorological origin (e.g. storms, storm surges, flooding, and droughts), and impacts can sometimes be due to a mixture of several factors (e.g. a storm surge in combination with heavy precipitation and river discharge).
In Europe in 2018, four severe storms caused almost USD 8 billion in losses (Munich Re, 2018), while a heat wave and drought caused roughly USD 3.9 billion in losses. According to the European Environment Agency (EEA), increases in the frequency and/or magnitude of extreme events such as floods, droughts, wind storms, or heat waves will be among the most important consequences of climate change (EEA, 2010). Although climate change has received considerable scientific attention, knowledge about changing extremes and their impacts is still somewhat fragmented, in particular when it comes to compound events (Zscheischler et al., 2018). While confidence in knowledge about the relation between global warming and hot extremes is high, there is only medium confidence in the knowledge on global warming's relation to heavy precipitation/drought (IPCC, 2018). Furthermore, the confidence level decreases when approaching the local scale (IPCC, 2014). Significant advances have occurred, but the understanding of mechanistic drivers of extremes and how they may change under anthropogenic forcing is still incomplete.
Whether or not an event is defined as “extreme” depends on the parameter and its application in relation to thresholds of the extreme to generate extreme consequences in society or on ecosystems. A large amount of the available scientific literature is based on extreme indices, which are either based on the probability of occurrence of given quantities or on threshold exceedances. Typical indices include the number, percentage, or fraction of days of occurrence below the 1st, 5th, or 10th percentile, or above the 90th, 95th, or 99th percentile, generally defined for given time frames (e.g. days, month, season, or year) with respect to the 1961–1990 reference time period (Seneviratne et al., 2012). Using predefined extreme indices allows for comparability across modelling and observational studies and across regions. Peterson and Manton (2008) discuss collaborative international monitoring efforts employing extreme indices. Extreme indices often reflect relatively moderate extremes, for example, events occurring during 5 % or 10 % of the time. For more rare extremes, extreme value theory (EVT) is often used due to sampling issues. EVT (e.g. Coles, 2001) aims at deriving a probability distribution of events from the upper or lower tail of a probability distribution (typically occurring less frequently than once per year or per period of interest). Some literature has used other approaches for evaluating characteristics of extremes or changes in extremes, for instance, analysing trends in record events or investigating whether records in observed time series are being set more or less frequently than would be expected in an unperturbed climate (Benestad, 2003, 2006; Zorita et al., 2008; Meehl et al., 2009; Trewin and Vermont, 2010). Besides the actual magnitude of extremes (quantified in terms of probability/return frequency or absolute threshold), other relevant aspects from an impact perspective include the duration, the spatial area affected, timing, frequency, onset date, and continuity (i.e. whether there are “breaks” within a spell). Thus, there is no precise definition of an extreme (e.g. Stephenson et al., 2008). In particular, there are limitations on the definition of both probability-based and threshold-based extremes as well as their relations to impacts. In the reviewed literature, a variety of definitions are used.
The Baltic Sea watershed drains nearly 20 % of European land areas (see Fig. 1). It ranges from the highly populated south, with a temperate climate and intensive agriculture and industry, to the north, where the landscape is boreal and rural. Changes in the recent climate as well as probable future climate change of mean parameters in the Baltic Sea region are relatively well described (e.g. BACC I, 2008; BACC II 2015; Rutgersson et al., 2014), but the uncertainty is greater for extreme events due to larger statistical uncertainties for rare events. Natural hazards and extreme events have been identified as one of the grand scientific challenges for the Baltic Sea research community (Meier et al., 2014).

Figure 1The Baltic Sea drainage basin, showing the spatial variability in annual mean water discharge (Q) calculated with the HYdrological Predictions for the Environment (HYPE) model and the annual mean sea surface salinity in the Baltic Sea. This salinity diagram shows the gradient from high (red) to low (green) salinities, calculated with the Rossby Centre Ocean model. The figure is sourced from Meier et al. (2014).
Changes in extreme events can be caused by a combination of changes in local/regional conditions and changes of a larger scale; thus, atmospheric circulation patterns are of crucial importance. Extreme events occur over a wide range of scales in time and space: short-term events range from sub-daily to a few days (basically mesoscale and synoptic-scale events), whereas long-lasting events range from a few days to several months. There is no clear separation between short-term and long-term events, and sometimes the presence of a long-term event may intensify the impact of a short-term one. Here, we summarize existing knowledge of extreme events in the Baltic Sea region. We focus on past and present states as well as future climate scenarios and expected changes when possible.
The events considered here include wind storms, high and low sea levels, heat waves, drought, ice seasons, heavy precipitation, sea-effect snowfall, river floods, ice ridging, and extreme waves. We also address some ecological extremes and some implications of extreme events for society (phytoplankton blooms, forest fires, coastal flooding, offshore infrastructure, and shipping). It should be noted that this is not a comprehensive summary but a selected number of aspects with implications for society. The text focuses on the current base of knowledge but also identifies knowledge gaps and research needs.
For almost 3 decades, knowledge about the Baltic Sea ecosystem has been systematically assessed, initially by BALTEX (the Baltic Sea Experiment) and, since 2013, by its successor, Baltic Earth. As a result, two comprehensive assessment reports have been released: BACC I (2008) and BACC II (2015). The present study is one of the thematic Baltic Earth Assessment Reports (BEAR), which comprises a series of review papers that summarize and assess the available published scientific knowledge on climatic, environmental, and human-induced changes in the Baltic Sea region (including its catchment). As such, the series of BEAR publications constitutes a follow-up of the previous BACC assessments. BEAR papers are constructed around the Grand Challenges and scientific topics of Baltic Earth (baltic.earth/grandchallenges), with a general summary given in Meier et al. (2021).
1.1 Methods: past and present conditions
For the past and present conditions, we focus on time periods covering up to the last 200 years in order to rely on robust in situ measurements only (not proxy data). The Baltic Sea area is relatively unique in terms of long-term data, with a dense observational network (compared with most regions) covering an extended time period, although many national (sub-) daily observations still await digitization and homogenization. The network of stations, which provides continuous and relatively accurate measurements, has been developed since the middle of the 19th century (although a few stations were established in the middle of the 18th century). The period since about 1950 is relatively well covered by observational data. For some applications (e.g. heavy precipitation), the relatively low frequency of sampling is a limitation; this was improved with the establishment of automatic stations at the end of the 20th century. In spite of the relatively good observational coverage over a long period of time, the lack of observations is a major obstacle for assessing long-term trends and past extreme events as well as for climate model evaluation. The density of the observational network is high compared with many regions, but it is still low compared with the resolution required for evaluation of today's most fine-scale climate models. Despite shortcomings, a number of high-resolution gridded data sets derived from point-based observations exist at resolutions as high as a few kilometres for parts of the Baltic Sea region.
The inclusion of satellite data since 1979 added to the spatial information, particularly over data-sparse regions. However, data that span extended periods cannot be expected to be homogeneous in time. This is particularly important for the increasing number of reanalysis products that are available for the region. In a reanalysis, all available observations are integrated as increments into a numerical model by means of data assimilation in space and time. This works well if the overall structure of the observing system does not change dramatically over time; however, when completely new observing systems (for example, observations from satellites) are introduced, this structure changes. Making use of all available observations, a frozen scheme for the data assimilation of observations into state-of-the-art climate models is used to minimize inhomogeneities caused by changes in the observational record over time. However, studies indicate that these inhomogeneities cannot be fully eliminated (e.g. Stendel et al., 2016). In addition, systematic differences between the underlying forecast models, such as due to their different spatial resolutions (Trigo, 2006; Raible et al., 2008) and differences in detection and tracking algorithms (Xia et al., 2012), may affect parameters such as cyclone statistics (for example, changes in their intensity, number, and position). Reanalysis products include NCEP/NCAR (from 1948 onwards; Kalnay et al., 1996; Kistler et al., 2001), ERA-Interim, starting in 1979 (Dee et al., 2011), and more recently, CERRA (Schimanke et al., 2019) and ERA5 (Hersbach et al., 2020). Other reanalyses use a limited data assimilation scheme to go further back in time, such as the Twentieth Century Reanalysis (20CR; from 1871 onwards; Compo et al., 2011). On the regional scale, detailed regional reanalysis products with higher-resolution models and more observations have been developed (e.g. Dahlgren et al., 2016; Kaspar et al., 2020).
1.2 Methods: future scenarios
The development of general circulation models (GCMs) has created a useful tool for projecting how climate may change in the future. Such models describe the climate at a set of grid points, regularly distributed in space and time. In some cases, dynamical downscaling with regional models or empirical-statistical downscaling using statistical models are also used. A large multi-model co-ordinated climate model experiment, the Coupled Model Intercomparison Project (CMIP), was initiated; currently version 5 (CMIP5; Taylor et al., 2012) is the main source of information, although the next phase, CMIP6 (Eyring et al., 2016), is increasingly being used. Co-ordinated downscaling activities including regional climate models (RCMs) include those of the European research projects PRUDENCE (Déqué et al., 2007) and ENSEMBLES (Kjellström et al., 2013) as well as the WCRP-supported international CORDEX project with its European branch EURO-CORDEX (Jacob et al., 2014).
Projections of climate change depend inherently on scenario assumptions of future human activities. Widely used are the Representative Concentration Pathway (RCP) scenarios (van Vuuren et al., 2011). An RCP represents a climate-forcing scenario trajectory (e.g. including changes in greenhouse gas emissions, aerosols, and land use, among other things) adopted by the Intergovernmental Panel on Climate Change (IPCC) for its Fifth Assessment Report (AR5) in 2014. RCPs describe different climate futures, all of which are considered possible depending on how strong the forcing of the climate system is. The four RCPs used for AR5, namely RCP2.6, RCP4.5, RCP6, and RCP8.5, are labelled after their associated radiative forcing values in the year 2100, 2.6, 4.5, 6.0, and 8.5 W m−2 respectively (Moss et al., 2008; Weyant et al., 2009), relative to that in pre-industrial times (e.g. 1750). RCP4.5 is used in many studies assuming increasing carbon dioxide emissions until 2040 and decreasing emissions after that point. RCP8.5 assumes rapidly increasing carbon dioxide and methane emissions and is increasingly seen as an unlikely worst-case scenario (Hausfather and Peters, 2020). Prior to the RCPs, scenarios from the Special Report on Emission Scenarios (SRES; Nakicenovic et al., 2000) were widely used. The main scenario families included were A1, representing an integrated world with rapid economic growth; A2, representing a more divided world with regional and local focus; B1, representing an integrated and more ecologically friendly world; and B2, representing a divided but more ecologically friendly world.
2.1 Changes in circulation patterns
The atmospheric circulation in the Atlantic–European sector plays an important role for the regional climate of the Baltic Sea basin and the surrounding areas (e.g. Hurrell, 1995; Slonosky et al., 2000, 2001). Large-scale flow characteristics are among the main drivers of the connection between local processes and global variability and change. Thus, it is essential to investigate the changes in large-scale flow. The main driver is the North Atlantic oscillation (NAO; Hurrell et al., 2003); with quasi-stationary centres of action, the Icelandic Low and the Azores High, it is a measure of the zonality of the atmospheric flow. The dominant flow is westerly, but due to the large variability, other wind directions are also frequently observed.
The strength of the westerlies is controlled by the pressure difference between the Azores High and the Icelandic Low (Wanner et al., 2001; Hurrell et al., 2003; Budikova, 2009) and is expressed by the NAO index, which is the normalized pressure difference between these two regions. The NAO index varies from days to decades. The long-term (1899–2018) temporal behaviour of the NAO (Fig. 2) is essentially irregular, and there is large inter-annual to inter-decadal variability, reflecting interactions with and changes in surface properties, including sea surface temperature (SST) and sea ice content (SIC). While it is not clear whether there is a trend in the NAO, for the past 5 decades, specific periods are apparent. Beginning in the mid-1960s, a positive trend towards more zonal circulation with mild and wet winters and increased storminess in central and northern Europe, including the Baltic Sea area, has been observed (Hurrell et al., 2003; Gillett et al., 2013). After the mid-1990s, however, there was a tendency towards more negative NAO indices, in other words, a more meridional circulation and more cold spells in winter, which can only occur with winds from an easterly or a northerly direction (see Sect. 2.2.3). Other studies (e.g. Deser et al., 2017; Marshall et al., 2020) have not found a significant long-term trend. It has been speculated that NAO changes are due to a shift of the Atlantic multidecadal oscillation (AMO) into the warm phase (Gastineau and Frankignoul, 2015).
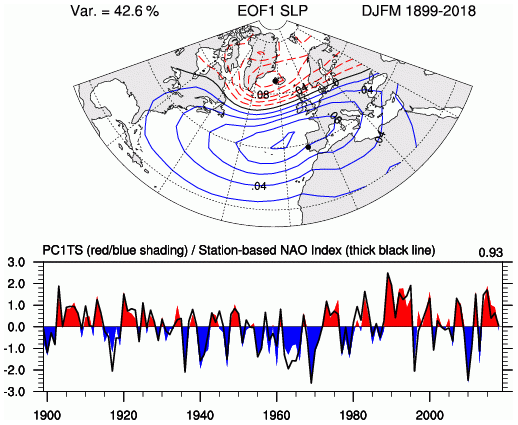
Figure 2The top panel shows the principal component (PC) time series of the leading EOF (empirical orthogonal function) of seasonal (December–January–February–March) SLP (sea level pressure) anomalies over the Atlantic sector (20–80∘ N, 90∘ W–40∘ E) for 1899–2018 (colours), and the bottom panel shows the station-based (Lisbon and Stykkishólmur) index (black line, see points on map). The correlation is 0.93 over the 1899–2018 period. The figure is sourced from Hurrell (2021).
Most of the state-of-the-art climate models reproduce the structure and magnitude of the NAO reasonably well (e.g. Davini and Cagnazzo, 2014; Ning and Bradley, 2016; Deser et al., 2017; Gong et al., 2017).
There is no consensus on what fraction of the inter-annual NAO variability is forced externally (Stephenson et al., 2000; Feldstein, 2002; Rennert and Wallace, 2009). Several such external forcing mechanisms have been proposed, including SST (Rodwell et al., 1999; Marshall et al., 2001), volcanoes (Fischer et al., 2007), solar activity (Shindell et al., 2001; Spangehl et al., 2010; Ineson et al., 2011), and stratospheric influences (Blessing et al., 2005; Scaife et al., 2005), including the quasi-biennial oscillation (Marshall and Scaife, 2009) and stratospheric water vapour trends (Joshi et al., 2006). Remote SST forcing of the NAO originating from as far as the Indian Ocean was proposed by Hoerling et al. (2001) and Kucharski et al. (2006), while Cassou (2008) proposed an influence of the Madden–Julian oscillation. In addition, Blackport and Screen (2020) showed that recent observations suggest that the observed correlation between surface temperature gradients and circulation anomalies in the middle troposphere have changed in recent years.
Regarding sea ice, many authors have found an effect of sea ice decline on the NAO (Strong and Magnusdottir, 2011; Peings and Magnusdottir, 2016; Kim et al., 2014; Nakamura et al., 2015), whereas others (Screen et al., 2013; Sun et al., 2016; Boland et al., 2017) do not identify any dependence on changing sea ice extent. Furthermore, the interaction of changes in the Arctic on mid-latitude dynamics is still under debate (Dethloff et al., 2006; Francis and Vavrus, 2012; Barnes, 2013; Cattiaux and Cassou, 2013; Vihma, 2017).
Atmospheric blocking refers to persistent, quasi-stationary weather patterns characterized by a high-pressure (anticyclonic) anomaly that interrupts the westerly flow in the mid-latitudes. By redirecting the pathways of mid-latitude cyclones, blocking situations lead to negative precipitation anomalies in the region of the blocking anticyclone and positive anomalies in the surrounding areas (Sousa et al., 2017). In this way, blocking situations can also be associated with extreme events such as heavy precipitation (Lenggenhager et al., 2019) and drought (Schubert et al., 2014).
A weakening of the zonal wind, eddy kinetic energy, and amplitude of Rossby waves in summer (Coumou et al., 2015) as well as increased waviness of the jet stream associated with Arctic warming (Francis and Vavrus, 2015) in winter have been identified, which may be linked to an increase in blocking frequencies. Blackport and Screen (2020) argue that observed correlations between surface temperature gradients and the amplitude of Rossby waves have broken in recent years. Therefore, previously observed correlations may simply have been internal variability. On the other hand, it has been shown that observed trends in blocking are sensitive to the choice of the blocking index and that there is a huge natural variability that complicates the detection of forced trends (Woollings et al., 2018), compromising the robustness of observed changes in blocking. A review by Overland et al. (2015) concluded that mechanisms remain uncertain, as there are many dynamical processes involved and considerable internal variability masks any signals in the observation record. There is weak evidence that stationary wave amplitude has increased over the North Atlantic region (Overland et al., 2015), possibly as a result of weakening of the North Atlantic storm track and transfer of energy to the mean flow and stationary waves (Wang et al., 2017).
The decrease in the poleward temperature gradient will lead to a weakening of westerlies and increase the likelihood of blocking situations. On the other hand, maximum warming (compared with other tropospheric levels) will occur just below the tropical tropopause due to the enhanced release of latent heat, which tends to increase the poleward gradient, strengthen upper-level westerlies, and affect the vertical stability, thereby altering the vertical shear in mid-latitudes. It is not clear which of these two factors has the largest effect on the jet streams (Stendel et al., 2021).
State-of-the-art models are generally able to capture the general characteristics of extratropical cyclones and storm tracks, although many of them underestimate cyclone intensity and still exhibit comparatively large biases in the Atlantic–European sector (Davini and d'Andrea, 2016; Mitchell et al., 2017). The IPCC has already stated that this is resolution related (IPCC, 2013; Zappa et al., 2013). In addition, there is evidence for a correlation between the quality of simulations of cyclones and of blocking situations (Zappa et al., 2014).
There is significant natural variability in the atmospheric circulation over Europe on decadal timescales (Dong et al., 2017; Ravestein et al., 2018). Drivers of circulation changes have been proposed, including polar and tropical amplification, stratospheric dynamics, and the Atlantic meridional overturning circulation (AMOC; Haarsma et al., 2015; Shepherd et al., 2018; Zappa and Shepherd, 2017). For more local changes, the attribution is more straightforward, where one example is the soil moisture feedback, for which an enhancement of heat waves due to a lack of soil moisture has been demonstrated (Seneviratne et al., 2013; Teuling, 2018; Whan et al., 2015).
Räisänen (2019) found only a small impact of circulation changes on the observed annual mean temperature trends in Finland, but circulation changes have considerably modified the trends in individual months. In particular, changes in circulation explain the lack of observed warming in June, the very modest warming in October in southern Finland, and about a half of the very significant warming in December.
On a more global scale, CMIP5 simulations suggest enhanced drying and, consequently, an increase in summer temperatures due to more meridional circulation which would result in extra drying, particularly in spring. If that is the case, the summer soil moisture feedback would be enhanced (van der Linden et al., 2019; van Haren et al., 2015). Soil drying, for example, under extended blocking situations, would lead to non-linear interactions between the atmosphere and land, resulting in further temperature increase (Douville et al., 2016; Douville and Plazzotta, 2017; Seneviratne et al., 2013; Teuling, 2018; van den Hurk et al., 2016).
2.2 Extreme conditions (current knowledge and potential future change)
2.2.1 Wind storms
In situ observations allow the direct analysis of winds, in particular over sea (e.g. Woodruff et al., 2011). However, in situ information, especially over land, is often locally influenced, and inhomogeneities make the straightforward use of these data difficult, even for recent decades. Examples include an increase in roughness length over time due to growing vegetation or building activities, inhomogeneous wind data over the German Bight from 1952 onwards (Lindenberg et al., 2012), and “atmospheric stilling” in continental surface wind speeds due to widespread changes in land use (Vautard et al., 2010). Many studies turn down direct wind observations and instead rely on reanalysis products (see Sect. 1.1). However, analysis of storm track activity for longer periods using reanalysis data suffers from uncertainties associated with changing data assimilation and observations before and after the introduction of satellites, resulting in large variations across assessments of storm track changes (Chang and Yau, 2016; Wang et al., 2016).
Owing to the large climate variability in the Baltic Sea region, it is unclear whether there is a trend in wind speed. Thus, results regarding changes or trends in the wind climate are strongly dependent on the period and region considered (Feser et al., 2015a, b). Through the strong link to large-scale atmospheric variability over the North Atlantic, conclusions about changes over the Baltic Sea region are best understood in a wider spatial context, considering the NAO. The positioning of the jet stream and storm tracks and the strength of the north–south pressure gradient in the North Atlantic can largely explain the decadal changes in 10 m wind speeds in northern Europe, with low windiness in winters of the 1980s and 2010s and high windiness in the 1990s (Laurila et al., 2021).
Recent trend estimates of the total number of cyclones over the Northern Hemisphere extratropical region during 1979–2010 reveal a large spread across the reanalysis product, strong seasonal differences, and decadal-scale variability (Tilinina et al., 2013; Wang et al., 2016; Chang et al., 2016; Matthews et al., 2016; Gregow et al., 2020). Common to all reanalysis data sets is a weak upward trend in the number of moderately deep and shallow cyclones (7 % to 11 % per decade for both winter and summer), but a decrease in the number of deep cyclones in particular for the 1989–2010 period. Chang et al. (2016) have reported a minor reduction in cyclone activity in the Northern Hemisphere summer due to a decrease in baroclinic instability as a consequence of Arctic temperatures rising faster than at low latitudes. Chang and Yau et al. (2016) also notice that state-of-the art models (CMIP5) generally underestimate this trend. In Northern Hemisphere winter, recent studies claim an increase in storm track activity related to Arctic warming. Recent research (Feser et al., 2021) reveals no clear trend but reports an increasing similarity over time in reanalyses, observations, and dynamically downscaled model data.
Despite large decadal variations, there is still a positive trend in the number of deep cyclones over the last 6 decades, which is consistent with results based on the National Centers for Environmental Prediction (NCEP) reanalyses between 1958 and 2009 over the northern North Atlantic Ocean (Lehmann et al., 2011). Using an analogue-based field reconstruction of daily pressure fields over central to northern Europe (Schenk and Zorita, 2012), the increase in deep lows over the region might be unprecedented since 1850 (Schenk, 2015). For limited areas, the conclusions are rather uncertain. Past trends in homogenized wind speed time series (1959–2015), in both mean and maximum, have been generally negative in Finland (Laapas and Venäläinen, 2017).
The role of differential temperature trends on storm tracks has been recently addressed, both in terms of upper-tropospheric tropical warming (Zappa and Shepherd, 2017) and lower-tropospheric Arctic amplification (Wang et al., 2017), including the direct role of Arctic sea ice loss (Zappa et al., 2018), and a possible interaction of these factors (Shaw et al., 2016). The remote and local SST influence has been further examined by Ciasto et al. (2016), who also confirmed sensitivity of the storm tracks to the SST trends generated by the models and suggested that the primary greenhouse gas influence on storm track changes was indirect, acting through the greenhouse gas influence on SSTs. The importance of the stratospheric polar vortex in storm track changes has received more attention (Zappa and Shepherd, 2017). In an aqua-planet simulation, Sinclair et al. (2020) found a decrease in the number of extratropical cyclones and a poleward and downstream displacement due to an increase in diabatic heating.
A projection of the future behaviour of extratropical cyclones is impeded by the fact that several drivers of change interact in opposing ways. With global warming, the temperature gradient between low and high latitudes in the lower troposphere is decreasing due to polar amplification. Near the tropopause and in the lower stratosphere, the opposite is true, implying changes in baroclinicity (Grise and Polvani, 2014; Shaw et al., 2016; Stendel et al., 2021). An increase in water vapour enhances diabatic heating and tends to increase the intensity of extratropical cyclones (Willison et al., 2015; Shaw et al., 2016) and contribute to a propagation further poleward (Tamarin and Kaspi, 2017). The opposite is also true in parts of the North Atlantic region, for example, south of Greenland. For this region, the north–south gradient is increasing, as the weakest warming in the entire Northern Hemisphere is over ocean areas south of Greenland. North of this local minima, the opposite is true. The increase in the north–south gradient over the North Atlantic may be responsible for some GCMs showing an intensification of the low-pressure activity and, thus, high wind speed over a region from the British Isles and through parts of northern central Europe (Leckebusch and Ulbrich, 2004).
Thus, in summary, there is no clear consensus in climate change projections regarding the extent to which changes in frequency and/or intensity of extratropical cyclones have an effect on the Baltic Sea region.
Wind storms can also be accompanied by wind gusts (downbursts), potentially causing severe damage. Wind gusts driven by convective downdraughts or turbulent mixing can also occur during larger-scale wind storms, like storm Mauri in 1982 (Laurila et al., 2020). There is limited information on past or future trends concerning the occurrence of wind gusts.
2.2.2 Extreme sea level
The rising global mean sea level poses a major hazard for the population living in the vicinity of the coast and will compound the risk of coastal floods. The effects of climate change on wind climate and tidal extremes may lead to further increases in the frequency and intensity of extreme sea levels on top of the mean sea level rise. Even if the sea level extremes only last a limited time, they are capable of causing severe damage to the coastal infrastructure and endangering human lives. Likewise, extreme sea levels are a major threat to coastal areas along the Baltic Sea coast due to flooding and erosion. Hence, sand dunes may experience large deformations during a single storm.
In the Baltic Sea, extreme sea levels are caused by wind, air pressure (inverse barometric effect), and seiches. The Danish straits prevent the entrance of tidal waves into the Baltic Sea, and the amplitude of the internal tides is only a few centimetres. The only exceptions are the south-western Baltic Sea and the eastern Gulf of Finland, where tides can reach 20 cm (Medvedev et al., 2016). The water exchange between the North Sea and the Baltic Sea causes about a maximum 1 m variation in monthly mean sea levels (Leppäranta and Myrberg, 2009). Due to the shape of the Baltic Sea, the highest and lowest sea levels are found at the ends of the bays, as in the eastern end of the Gulf of Finland, the northern end of the Gulf of Bothnia, and in the Gulf of Riga, whereas the amplitude of variation is smallest in the central Baltic Sea. The Baltic Sea areas with the largest sea level variations, based on tide gauge data from the 1960–2010 period, are shown in Fig. 4 (from Wolski et al., 2014).
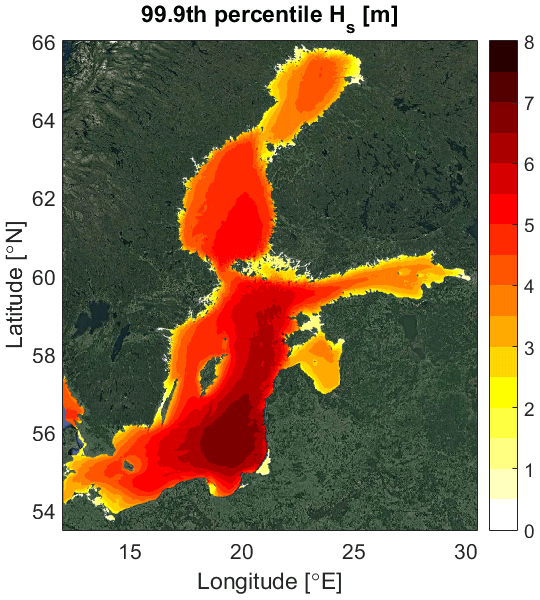
Figure 3Ice-free statistics (Type F in Tuomi et al., 2011) for the 99.9th percentile significant wave height (Hs) using a high-resolution wave hindcast for the years 1998–2013 (Nilsson et al., 2019).
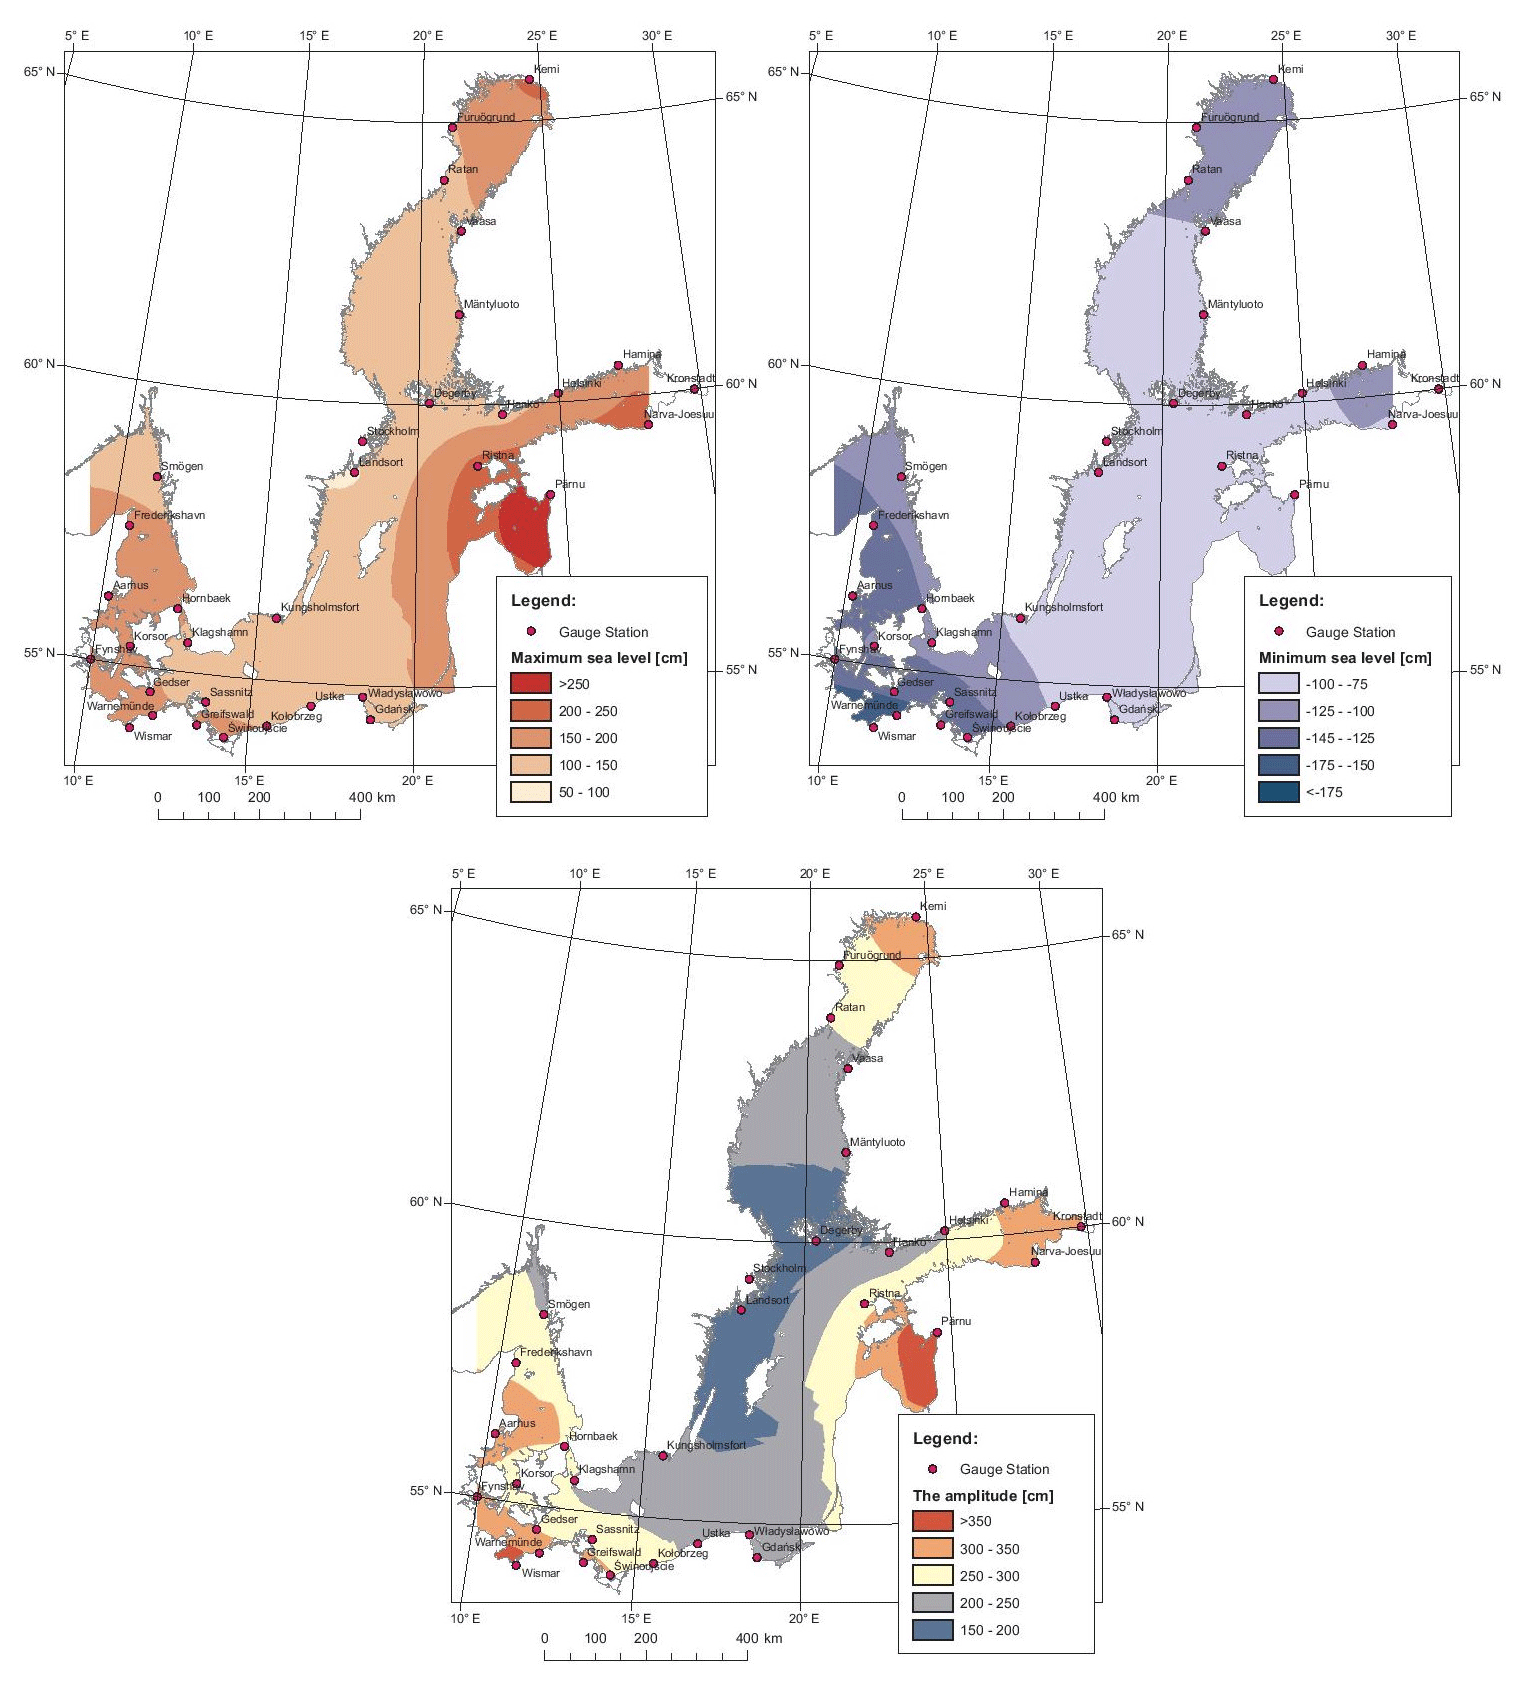
Figure 4Surface water topography of the Baltic Sea for maximum levels (a), minimum levels (b), and the amplitude of variations (c) from the 1960–2010 period (Wolski et al., 2014).
In the studies of observed extreme sea levels, no significant trends in extremes exceeding mean sea level rise have been found, excepting the Gulf of Bothnia. The frequency of extremes has been observed to increase for some locations. The observed maxima and minima on the Baltic Sea coast along with 100-year return levels based on interpolated coastal tide gauge observations from the 1960–2010 period were studied by Wolski et al. (2014). They observed an increase in the yearly number of storm surges (defined as sea levels 70 cm above zero level of the European Vertical Reference Frame or local mean sea level in Finland and Sweden). The increase was largest in the Gulf of Finland (Hamina and Narva) and in the Gulf of Riga (Pärnu). Ribeiro et al. (2014) investigated the changes in extreme sea levels in 1916–2005 from daily tide gauge records of seven stations in Denmark and Sweden on the Baltic Sea coast, using generalized extreme value (GEV) and quantile regression methods. The mean sea level rise was removed from the observations. They observed a statistically significant trend in annual sea level maxima in the Gulf of Bothnia (1.9 mm yr−1 for Ratan and 2.6 mm yr−1 for Furuögrund). For other locations, the maxima could be considered stationary. Marcos and Woodworth (2017) studied the tide gauge data, concluding that the changes in the 100-year return levels after 1960 in the Baltic Sea were explained by the mean sea level rise.
There are only few published projections of extreme sea levels in the Baltic Sea. As they are based on a limited set of climate projections, the extreme values can only be considered preliminary estimates which will be complemented by other sea level projections in the future. Projected extreme sea levels for the Baltic Sea coast in 2100 were calculated by Vousdoukas et al. (2016) considering only the effect of the atmosphere on the sea level (storm surges) while omitting global mean sea level rise and land uplift. The Delft3D sea level model was forced with eight global climate models from the CMIP5 database, and the projected changes were calculated from ensemble means of model simulations. In 2100, the present-day 100-year storm surge was projected to take place every 72 years under RCP4.5 and every 44 years under RCP8.5. The ensemble means of storm surges (return periods from 5 to 100 years) increase along the northern Baltic Sea coast with time for both RCPs. The increase is largest in Bothnian Bay and in the Gulf of Finland, reaching about 0.5 m. Along the southern Baltic Sea coast, there is a smaller increase or no increase in most scenarios. When the storm surges are averaged over the Baltic Sea coast, the increase in the storm surges with return periods from 5 to 500 years is only 10–20 cm for different scenarios. By 2100, the inter-annual variation in the seasonal maxima, indicated by the standard deviation, increased by 6 % in RCP4.5 and by 15 % in RCP 8.5. This indicated that the variations in the maxima might increase more than the 30-year mean, suggesting that the maxima could have a higher increasing trend than that of the mean sea level. The extreme sea levels along Europe's coasts, caused by the combined effect of mean sea level, tides, waves, and storm surges, were studied by Vousdoukas et al. (2017). In the Baltic Sea, the 100-year sea level due to waves and storm surges was projected to rise 35 cm (average over the Baltic coast) by 2100 in RCP8.5. The rise is largest on the eastern coast of the Baltic Sea, and the intra-model variation of the 100-year level increases up to 0.6 m in 2100. To increase the confidence in the future projections of storm surges in the Baltic Sea, we must rely on future research where a larger set of regional and global climate models is used with refined sea level models. The dependence between extreme sea levels and wind waves has to be assessed when the joint effect of storm surge and wave set-up on the coast is studied. For the Baltic Sea, this dependence should be included when joint probabilities of compound events of high sea levels and waves are calculated, as is done in Kudryavtseva et al. (2020). Sea levels are discussed extensively by Weisse et al. (2021).
2.2.3 Warm and cold spells in the atmosphere
Extreme events related to climate change include extended periods with high (or low) temperatures. The Baltic Sea area is generally less exposed to severe heat spells compared with regions such as the southern parts of Europe. During the last decade, however, record-breaking heat waves have hit the region, namely, those in 2010, 2014, and 2018 (Sinclair et al., 2019; Liu et al., 2020; Baker-Austin et al., 2016; Wilcke et al., 2020). Because people living in the Baltic Sea region are adapted to a relatively cool climate, high summertime temperatures pose a significant risk to health in the current climate (e.g. Kollanus et al., 2021; Åström et al., 2016; Ruuhela et al., 2018, 2021), highlighting the need for measures against overheating of residential buildings (Velashjerdi Farahani et al., 2021).
The inter-annual variability and trends in the magnitude, temporal and spatial extent, and frequency of heat waves in the Baltic Sea drainage basin are mainly driven by large-scale fluctuations in atmospheric circulation (Sect. 2.1), anthropogenic climate change, and associated regional increases in mean temperature that exceed the global average warming (BACC I, 2008; BACC II, 2015; Rutgersson et al., 2014; Jaagus et al., 2014, 2017; Irannezhad et al., 2015; Owczarek and Filipiak, 2016; Aalto et al., 2016; Räisänen, 2017; SMHI, 2019; Meier et al., 2021). While fluctuations in the occurrence of blocking situations and other circulation patterns are of particular importance (Horton et al., 2015; Brunner et al., 2017), other factors such as local soil moisture feedbacks (Brulebois et al., 2015; Miralles et al., 2014; Whan et al., 2015; Cahynová and Huth, 2014; see also Sect. 2.2.5) and solar radiation also play a role. For example, Tomczyk and Bednorz (2014) showed a clear link between heat waves along the southern coast of the Baltic Sea and circulation patterns. Furthermore, the 2018 heat wave in Finland was strongly affected by abundant incoming short-wave radiation due to unusually clear skies (Sinclair et al., 2019; Liu et al., 2020). Regarding the local/regional amplitude of a heat wave, land cover use may also play a role. For example, several factors besides the very warm air mass likely contributed to the record high temperature (37.2 ∘C) in Finland in 2010 (Saku et al., 2011); moreover, a recent simulation study found that replacing a dense urban layout with a suburban type of land use resulted in small but systematic decreases in air temperatures in July (Saranko et al., 2020).
A widely used heat wave indicator is the warm spell duration index (WSDI), defined as the annual (or seasonal) count of days which are part of a spell of at least 6 consecutive days when the daily maximum temperature exceeds the corresponding 90th percentile. If using the 1961–1990 period as a baseline when calculating the 90th percentiles, as done in Fig. 8a, a statistically highly significant increasing trend across the 1950–2018 period can be found in the annual WSDI, when averaged over land areas of the Baltic Sea region (with a Theil–Sen slope of 1.7 d yr−1 per decade). In southern Sweden, the Baltic states, and southern and western Finland, 30-year averages of the annual WSDI were about 14 d yr−1 or more during a recent time span (1989–2018) (Fig. 8c), while during the baseline period the annual count there had been about 6–8 d yr−1 on average. Similar results have been obtained by Irannezhad et al. (2019) and Matthes et al. (2015). The former detected statistically significant increases in the annual WSDI near the western coast of Finland for the 1961–2011 period, changes of both positive and negative signs in northern and eastern parts of the country, and statistically non-significant increases elsewhere. The latter considered the WSDI in 1979–2013 in winter and summer respectively and reported statistically significant increases in summer at several Swedish and Norwegian weather stations and, in winter, also at Finnish stations.
In the future, heat waves are projected to occur more often and to become longer and more intense. Today's warm spells tend to be increasingly frequent but also increasingly “normal” from a statistical point of view (Rey et al., 2020). Accordingly, quantitative estimates of the rates of future changes strongly depend on the selected definition of “heat wave” (Jacob et al., 2014). The mean length and number of heat waves where the 20 ∘C daily mean temperature is exceeded have been projected to increase by about 1.5 times in southern Finland under RCP4.5 between the 1900–2005 and 2006–2100 periods (Kim et al., 2018). A bias-adjusted median estimate for changes in the WSDI in Scandinavia for the 2071–2100 period, with respect to 1981–2010, is about 15 d under RCP8.5, with an uncertainty range of about 5–20 d (Dosio, 2016).
Accompanying more frequent and longer warm spells are decreases in the frequency, duration, and severity of cold spells, based on both observations (Easterling et al., 2016) and model projections (Sillmann et al., 2013; Jacob et al., 2014). Cold winter weather in the Baltic Sea region is closely associated with a negative phase of the NAO and warm conditions in the Greenland region, and this statistical relationship has strengthened during the recent period of rapid Arctic warming (1998–2015), suggesting that Arctic influences might intensify in the future, perhaps leading to more unusual and persistent weather events (Vihma et al., 2020). On the other hand, northerly winds from the Arctic are milder than before (Screen, 2014). A cold winter, with unusually low temperatures like those in southern parts of the Baltic Sea area in the winter of 2009–2010, has become less likely because of anthropogenic changes (Christiansen et al., 2018). The role of changes in circulation remains remarkable; they explain about half of the very significant warming in Finland in December during the 1979–2018 period (Räisänen, 2019).
Analogous to the WSDI, the cold spell duration index (CSDI) is defined as the annual (or seasonal) count of days with at least 6 consecutive days during which the daily minimum temperature is below the corresponding 10th percentile. Because of statistically significant decreases in the spatially averaged CSDI over land areas of the Baltic Sea region during the 1950–2018 period (with a Theil–Sen slope of −0.4 d yr−1 per decade), the CSDI is nowadays typically clearly smaller than the WSDI (Fig. 8b, d). However, there are regional and seasonal differences. Statistically significant decreases in the winter CSDI across the 1979–2013 period have been widespread in Norway and Sweden, but less prevalent in eastern Finland, while changes in summer have been small in general (Matthes et al., 2015). It is also worth noting that because of extremely cold weather in January–February 1985, particularly cold weather in January 1987 (Twardosz et al., 2016), and more recent cold winters, results from trend analyses for the occurrence of cold spells can be strongly affected by the study period which has been selected.
The CSDI in the northern subregion of Europe is projected to decrease in the future with a likely range of from 5 to 8 d fewer per year by 2071–2100 with respect to 1971–2000 (Jacob et al., 2014).
2.2.4 Marine heat waves
Marine heat waves are becoming globally more common (Frölicher et al. 2018), and their intensity and occurrence are projected to increase further in the near future (Oliver et al., 2019). A first documented marine heat wave event in the Baltic Sea occurred in the summer of 2018, when the surface mixed layer became extraordinarily warm in many locations. Due to this and an accompanying atmospheric heat wave in the summer of 2018, large parts of the Baltic Sea were anomalously warm from mid-June to August. According to the satellite data, SSTs at the warming peak were up to 27 ∘C from the Bornholm Sea to the central eastern and western Gotland Sea, 22–25 ∘C in the Gulf of Bothnia, and 23–25 ∘C in the western parts of Bothnian Bay (Naumann et al., 2018). For the entire Baltic Sea, May to August showed a positive SST anomaly of 4–5 ∘C.
In the coastal regions, the exceptional warming extended down to the bottom layer and had a significant impact on marine biogeochemistry (Humborg et al., 2019). According to the long-term measurement at the coastal region of the Gulf of Finland, the temperature at the bottom (31 m) was higher than 20 ∘C. This was the all-time record since 1926. Humborg et al. (2019) also showed that the warming considerably elevated the CO2 and CH4 concentration at the bottom. After the actual heat wave event, bottom greenhouse-gas-rich waters were exposed to the surface due to storm-induced upwelling and, as a final consequence, CO2 and CH4 fluxes from sea to atmosphere were enhanced.
Knowledge about the occurrence and impact of marine heat waves in the Baltic in the future is limited. Instead of directly analysing changes in marine heat waves, Meier et al. (2019) used climate projections to estimate how the number of warm SST days and the record-breaking anomalies of summer will change SSTs in the future. According to their study, both of these indicators will become more common in the future; however, more important findings are that SST extremes exhibit large variability on timescales of decades, and the changes are manifested in a more pronounced way in open-sea areas than in coastal regions.
2.2.5 Drought
The Baltic Sea basin is a region that generally has sufficient water resources to support natural ecosystems and societal needs. Despite this, dry conditions occur from time to time in different parts of the region and cause meteorological, soil moisture, and hydrological droughts. The main driver of any kind of drought is a long-term precipitation deficit that might be strengthened by high temperatures, winds, low humidity, and intense water consumption. In the Baltic Sea basin, droughts are strongly connected with blocking processes in the atmospheric circulation over the Atlantic–European sector (see Sect. 2.1). Drying conditions frequently connected with extreme temperatures are referred to in Sect. 2.2.3. Change in precipitation during the 20th century in the Baltic Sea basin has been variable and characterized by an increase in its extreme characters, also reflected in the river flow regime (see Sect. 2.2.7 and 2.2.9).
There are some tendencies characterizing changes in dry conditions in recent decades. Drought frequency has increased since 1950 across southern Europe and most parts of central Europe with a corresponding decrease in low runoff. In many parts of northern Europe, drought frequency has decreased, with an increase in winter minimum runoff, while in spring and summer months, strong negative trends were found (decreasing streamflow and a shift towards drier conditions) (Stahl et al., 2010, 2012; Poljanšek et al., 2017; Gudmundsson et al., 2017). There are local and regional studies generally supporting this broader picture (Valiukas 2011; Przybylak et al., 2007; Stonevičius et al., 2018; Danilovich et al., 2019). However, Bordi et al. (2009) describe a negative trend in droughts since 2000.
Future projections show that the number of dry days in the southern and central parts of the Baltic Sea basin will increase in summer (Lehtonen et al., 2014a). The time-averaged near-surface soil moisture in the Baltic Sea basin during March–May under the RCP8.5 scenario for the 2070–2099 period, relative to 1971–2000, averaged over 26 GCMs will decrease by up to 8 % in the north and up to 4 % in the south of the basin (Ruosteenoja et al., 2018). According to Spinoni et al. (2018), meteorological droughts are projected to become more frequent and severe by 2041–2070 and 2071–2100 in summer and autumn in the Mediterranean area, western Europe, and northern Scandinavia according to RCP4.5, and over the whole European continent (except Iceland) under the RCP8.5 scenario.
Studies of soil moisture droughts showed drought projections ranging between strong drying and wetting conditions in central Europe (Orlowsky and Seneviratne, 2013).
In hydrological regime streamflow, droughts will become more severe and persistent in many parts of Europe due to climate change, except for the northern and north-eastern parts of Europe. In north-eastern Europe, including the Baltic countries, flow deficits in the non-frost season show a declining trend, with reductions in deficit volumes of up to 60 % and more by the end of current century (Forzieri et al., 2014). The decrease in drought magnitude and duration is expected for central and northern Europe (except southern Sweden) according to Roudier et al. (2016). This reduction in low-flow duration and magnitude is mainly caused by less snowfall and more precipitation for areas with low flows in winter and by a general increase in rainfall for areas with low flows in summer (Vautard et al., 2014).
On the other hand, Prudhomme et al. (2014), using several climate and hydrological models, found a general increase in hydrological droughts over Europe, but they focus on less extreme droughts, using RCP 8.5, at the end of the century. The runoff in late spring and summer is likely to decrease (thereby increasing the probability of hydrological droughts) in most of the basin, due to earlier snowmelt, increased evapotranspiration, and possibly, particularly in the southern parts, reduced summer precipitation (Räisänen, 2017). Increasingly severe river flow droughts are projected for most European regions, except central-eastern and north-eastern Europe (Cammalleri et al., 2020). Climate change scenarios project on average a small decrease in the lowest water levels during droughts in Finland (Veijalainen et al., 2019).
2.2.6 Sea ice seasons
Maximum ice extent of the Baltic Sea (MIB) is one of the essential variables describing climate change and variability in the Baltic Sea. In an average winter, the maximum annual ice extent is 165 000 km2, indicating that Bothnian Bay, the coastal areas of the Bothnian Sea, the Archipelago Sea, the eastern Gulf of Finland, and the Gulf of Riga are ice covered (BACC II, 2015; Meier et al., 2021). During extreme cold conditions, all of the Baltic Sea sub-basins can be partly ice covered, and during the mildest winter, only Bothnian Bay is ice covered. Based on the MIB time series, which dates back to 1720, Seinä and Palosuo (1996) classified ice winters according to ice extent. Years with an MIB of less than 81 000 km2 were classified as extremely mild ice winters, and years with an MIB larger than 383 000 km2 were classified as extremely severe ice winters. Here, we discuss the drivers of ice winter extremes and their observed and expected changes. In the parallel BEAR publication by Meier et al. (2021), a broader analysis of observed and projected sea ice changes is provided.
Annual maximum ice extent is a cumulative indicator of the severity of a winter. It is largely driven by the large-scale atmospheric circulation, and its inter-annual variability is well correlated with the NAO index (Omstedt and Chen, 2001; Vihma and Haapala, 2009). During winters with an NAO index , the average MIB is 121 000 km2, with a range from 45 000 to 337 000 km2, while during winters with an NAO index , the average MIB is 259 000 km2, with a range from 150 000 to 405 000 km2. Extremely mild ice winters (MIB < 60 000 km2) occurred in 1930, 1961, 1989, 2008, 2015, and 2020. According to Uotila et al. (2015), the winter of 2015 was the first winter when Bothnian Bay was definitely only partly ice covered. That winter was dominated by strong south-westerlies associated with a record high NAO index. This enhanced the atmospheric large-scale transport of warm Atlantic air masses to the Baltic Sea region. In addition, an anomalous low ice extent was partly due to higher-than-average downward long-wave radiation because of increased cloudiness which decreased heat loss and cooling of the ocean surface layer. Also, episodes of warm Föhn winds due to cyclones passing over the Scandinavian mountains were observed in that winter. Uotila et al. (2015) concluded that extremely mild winters were more common during the 1985–2015 period than in any other 30-year period since 1720. After 2015, only one winter has been average in terms of MIB. The others have been classified as mild or extremely mild ice winters. The winter of 2020 was an all-time record low ice winter. In that winter, central parts of Bothnian Bay were again ice-free and the MIB was only 37 000 km2. Extremely severe winters (MIB > 383 000 km2) have not been observed since 1987. During the last 30 years, the most severe winter occurred in 2011, which caused major problems and economic losses for marine traffic (see Sect. 2.3.4).
Ongoing changes towards a milder climate demand a revision of the Seinä and Palosuo (1996) definition of extremely mild and severe ice winters. They choose to classify 11 % of the lowest MIBs as extremely mild winters. Correspondingly, 11 % of the largest MIBs were counted as an extremely severe winter. If we are utilizing the same thresholds for the last 30 years' data, limits for the extremely mild and severe winters would be ∼50 000 and ∼240 000 km2 respectively.
According to climate projections, the Baltic Sea ice will experience considerable shrinking and thinning on average in the future (BACC I, 2008; BACC II, 2015). This is particularly clear for the Bothnian Sea, Bothnian Bay, and Gulf of Finland. Changes in mean sea ice conditions will also reflect on sea ice extremes. In general, present severe ice seasons will become rare and present extreme mild ice season more common, but changes in sea ice extremes have not been examined in detail yet.
2.2.7 Precipitation
Precipitation extremes in the Baltic Sea region are mainly related to (i) synoptic-scale mid-latitude low-pressure systems and (ii) convective precipitation events associated with mesoscale convective systems or resulting from single intense cloudbursts. Additionally, sea-effect snowfall events can generate large amounts of snow in coastal areas downstream from the Baltic Sea (Sect. 2.2.8). Climatologically, summer is the season with the strongest convective activity, and this is also the season with the strongest cloudbursts. Precipitation extremes associated with low-pressure systems are most frequent in autumn and winter when the large-scale atmospheric circulation is favourable for bringing low-pressure systems towards northern Europe.
High-resolution gridded data sets that may be used for the evaluation of climate model performance for precipitation include the following: PTHBV, covering Sweden with a 4 km grid resolution (Johansson and Chen, 2005); the Finnish data set, available at a 1 and 10 km grid resolution (Aalto et al., 2016); the REGNIE data set, with a 1 km grid resolution covering Germany (Rauthe et al., 2013); CPLFD-GDPT5, covering Poland at a 5 km resolution (Berezowski et al., 2016); and seNorge2, covering Norway at a 1 km grid resolution (Lussana et al., 2019). Another recent data set is the joint product consisting of PTHBV data in combination with precipitation estimates from radar data over Sweden resulting in the 4 km×4 km, 1 h resolution HIPRAD (HIgh-resolution Precipitation from gauge-adjusted weather RADar) data set covering 2009–2014 (Berg et al., 2016). Finally, it is noted that these national data sets are derived using slightly different methods, implying that they cannot be directly compiled and used as one high-resolution data set for the entire Baltic Sea region.
Representing the strong spatial and temporal variability of precipitation constitutes a true challenge for climate models, and careful evaluation against observations is key before the models can be applied. Typically, large-scale features such as the total precipitation volume over the Baltic Sea region are relatively well captured by climate models even at coarser resolution, as shown for an RCM at 50 km resolution by Lind and Kjellström (2009). However, such coarse-scale climate models are limited in their ability to reproduce fine-scale details of the observed precipitation climate. Higher resolution, for instance in the EURO-CORDEX ensemble (12.5 km grid spacing), improves this (e.g. Prein et al., 2016), but spatial details are still too coarsely represented to adequately address precipitation over complex topography (e.g. Pontoppidan et al., 2017). In addition to spatial details, the simulation of the diurnal cycle is also often flawed in coarse-scale models (e.g. Walther et al., 2013). With even higher horizontal resolution, so-called convection-permitting models with grid spacing of a few kilometres are found to improve the simulation of both spatial and temporal features of precipitation (e.g. Belušić et al., 2020). Importantly, this also involves the representation of extreme events, as these models are much more capable of representing high-intensity rainfall than their coarser-scale counterparts (e.g. Kendon et al., 2012; Lenderink et al., 2019; Lind et al., 2020). An example of this is given in Fig. 5, which shows how a convection-permitting model improves the representation of precipitation over Sweden.
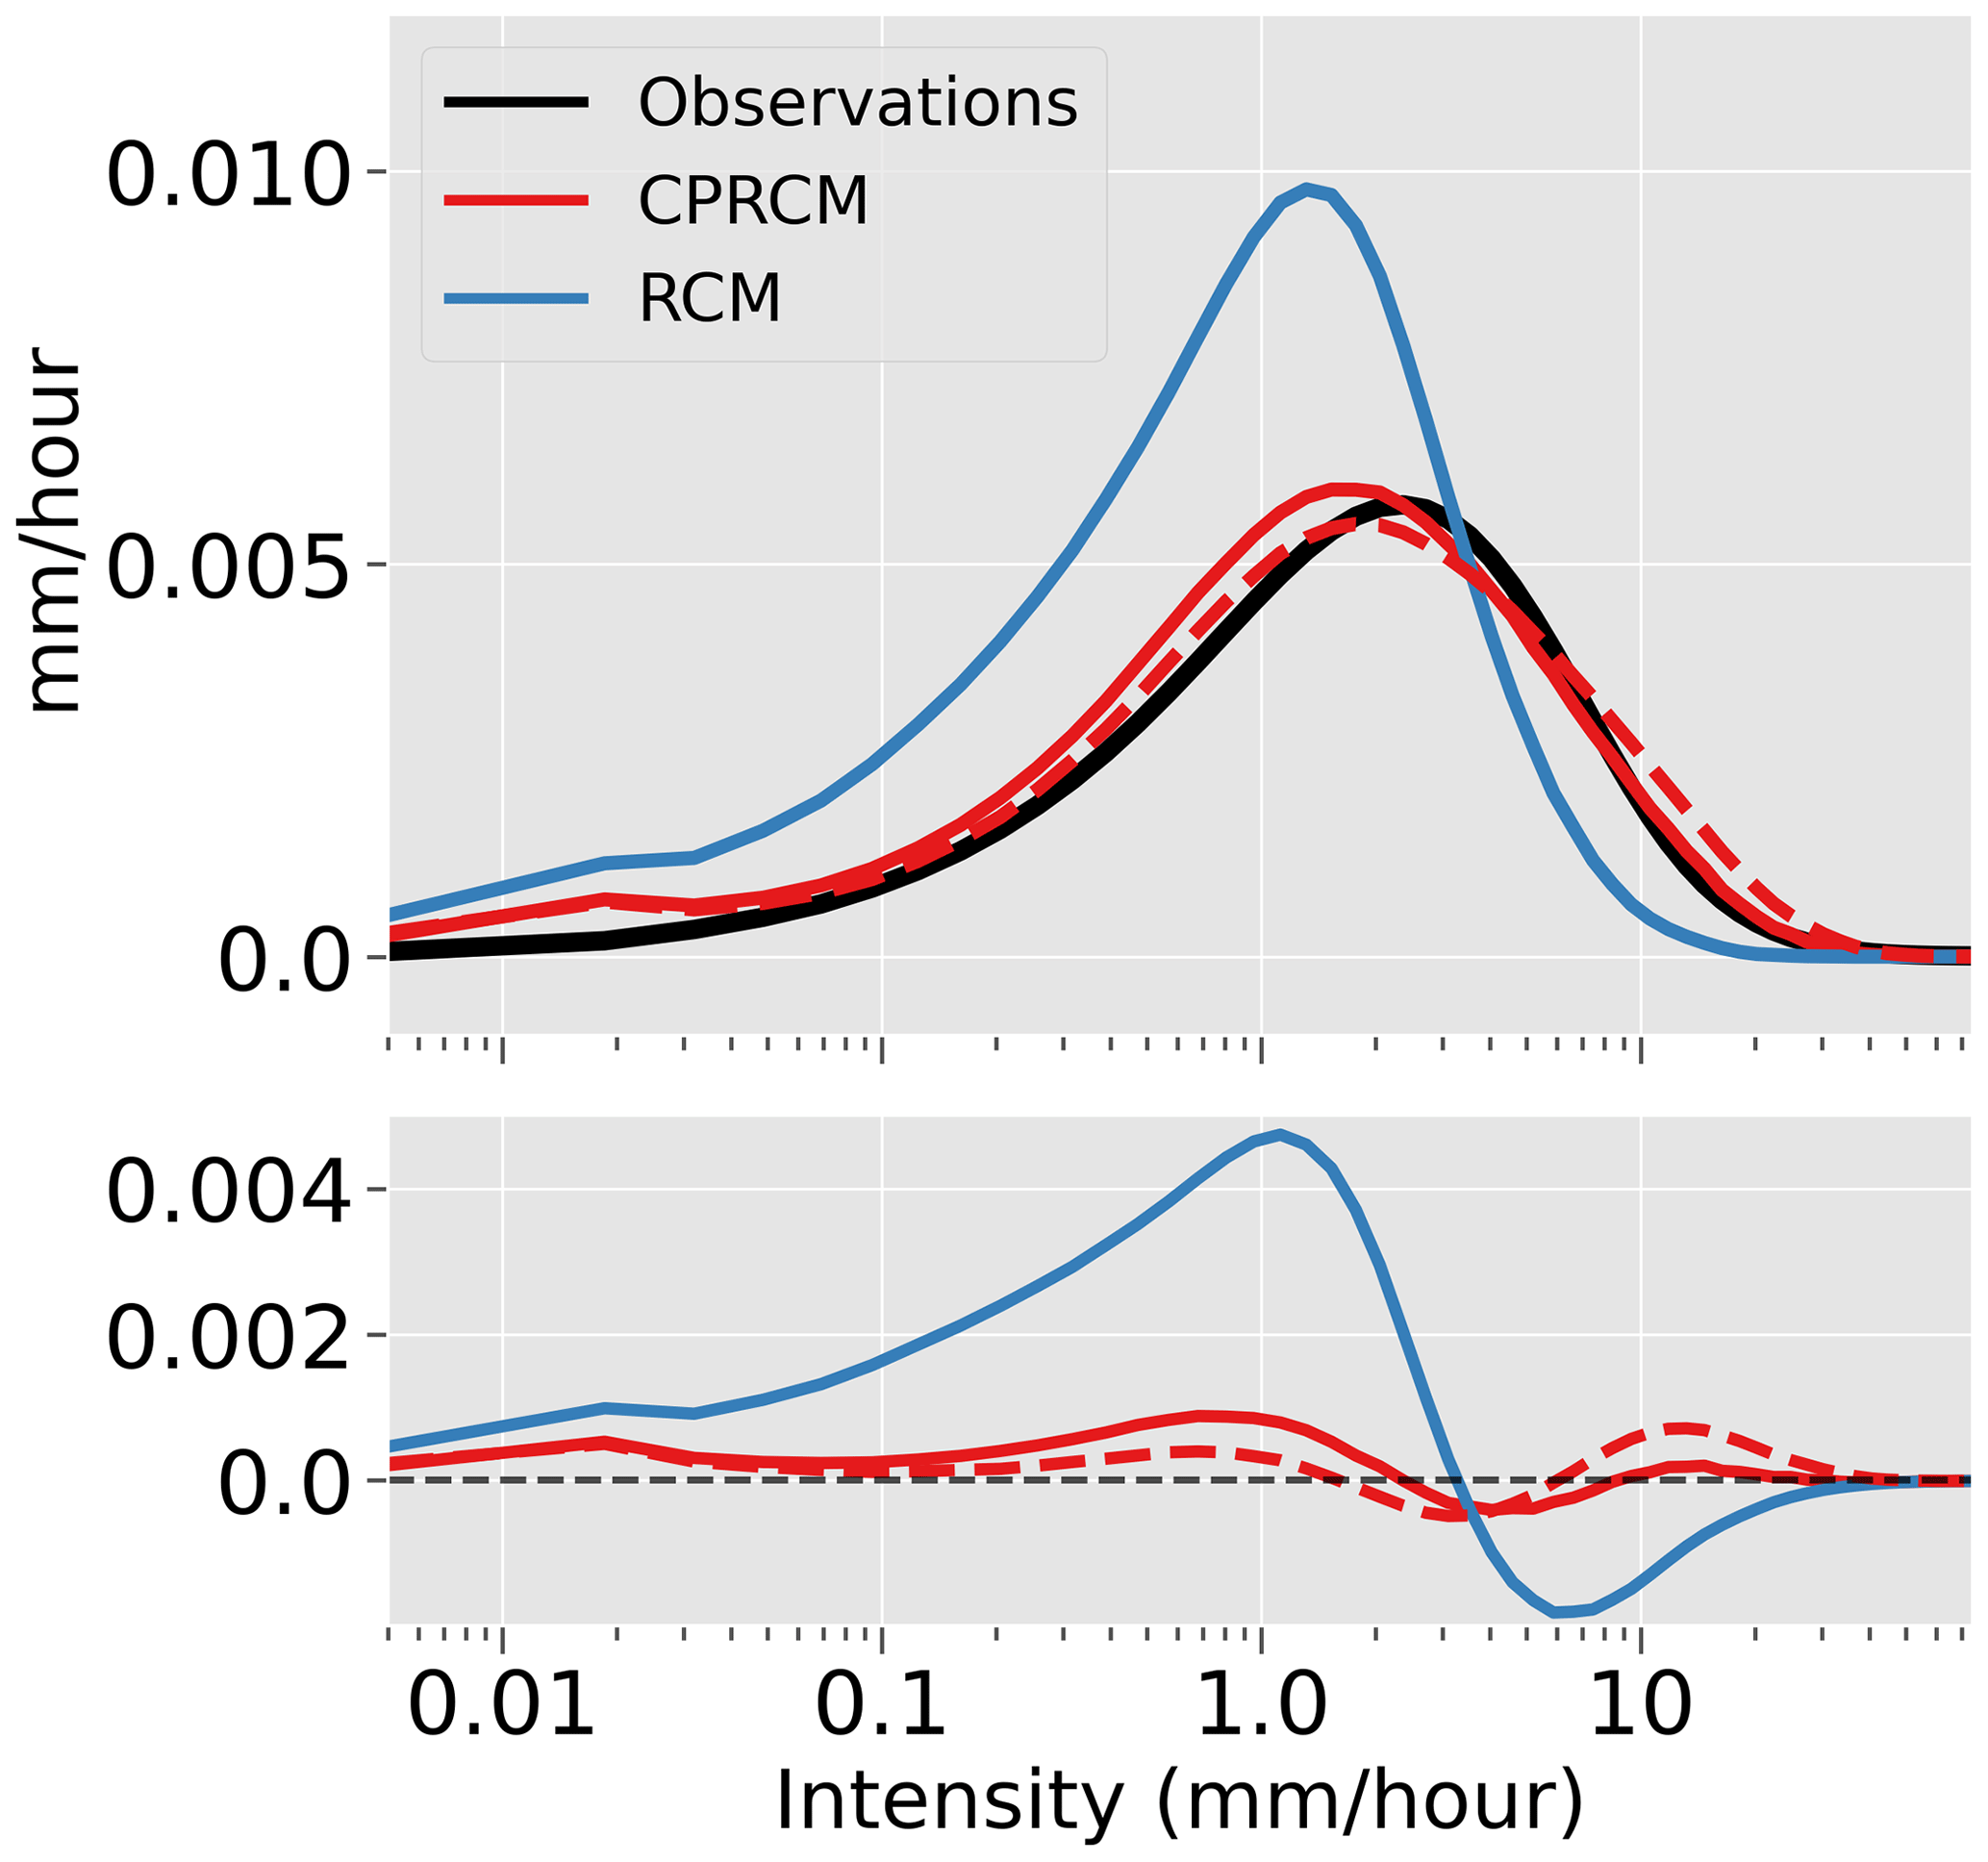
Figure 5The top panel shows the contributions per intensity bin to the total June–August mean precipitation over Sweden, in millimetres per hour. The observations are from a combined radar–rain gauge data set. The lower panel shows the differences with respect to the observations. The coarse-scale RCM is operated at a 12 km horizontal resolution, whereas the convection-permitting RCM (CPRCM) runs at 3 km. The CPRCM data are shown at both the native resolution (dashed) and remapped to the RCM grid (solid). The figure has been modified from Lind et al. (2020).
According to BACC I (2008) and BACC II (2015), precipitation trends in the Baltic Sea basin over the past 100 years have varied in time and space. Examples exist of both increasing and decreasing trends in different areas for different periods and seasons. Positive trends were detected for the cold part of the year for Fennoscandia by Benestad et al. (2007), and Estonia, Latvia, and Lithuania by Jaagus et al. (2018). Along with warming, it is also noted that the fraction of snowfall in relation to total precipitation is decreasing with time (Hynčica and Huth, 2019; Luomaranta et al., 2019).
Increasing intensity of precipitation events resulting from the larger water-holding capacity of a warmer atmosphere is an expected impact of climate change (Bengtsson, 2010). Based on European E-OBS data, Fischer and Knutti (2016) demonstrate that heavy daily precipitation, defined as the 99.9th percentile, which roughly corresponds to an event that occurs once every 3 years, has become 45 % more frequent when comparing the last 30 years with the preceding 30 years. For even more extreme precipitation events, such as events that occur once every 10, 20, or even 50 years, the large variability makes it difficult to draw any firm conclusions about changes, especially for small areas with only a few observation stations. For example, J. Olsson et al. (2017) found no significant trend in annual maxima based on Swedish gauge data from 1880 to 2017, even when data from gauges across the whole country were used. For less intense events, such as the 90th, 95th, and 99th percentiles of daily precipitation or the total number of days with more than 10 mm of precipitation, a number of studies have reported increasing trends in Europe (e.g. Donat et al., 2016) or parts of the Baltic Sea region for different seasons (e.g. BACC I, 2008; BACC II, 2015; and references therein).
Projections of future climate show increasing precipitation in northern Europe, including the Baltic Sea region (IPCC, 2013; BACC I; BACC II, 2015). Southern Europe, on the other hand, is projected to receive less precipitation, and as the borderline between increasing and decreasing precipitation moves from the south in winter to the north in summer, there are some models that project less precipitation in parts of the Baltic Sea region in summer (Christensen and Kjellström, 2018). In addition to changes in mean precipitation, projections show a similar north–south pattern of changes in wet-day frequency, with increases in the north and decreases in the south (Rajczak et al., 2013). Regardless of the sign of change in seasonal mean precipitation, heavy rainfall is projected to increase in intensity for most of Europe, including the Baltic Sea region (Nikulin et al., 2011; Rajczak et al., 2013; Christensen and Kjellström, 2018), as illustrated in Fig. 6. Snowfall is projected to decrease on an annual mean basis, but in winter, daily snowfall amounts and extreme events may increase (Danco et al., 2016). Precipitation intensities are projected to increase at durations ranging from sub-daily to weekly. Martel et al. (2020), based on three large ensembles, including one with a high-resolution RCM, concluded that increases in 100-year return values of annual maximum precipitation are stronger at sub-daily timescales than for 1 or 5 d events. Newly developed convection-permitting RCMs have been shown to sometimes yield different climate change signals for extreme precipitation events compared with coarser-scale models (>10 km grid spacing). For instance, Kendon et al. (2012) showed stronger increases in summertime intense precipitation in a 1.5 km model compared with a 12 km model for the southern UK. Similarly, Lenderink et al. (2019) showed a stronger increase for intense precipitation in a number of summer months when applying a synthetic warming signal of 2 ∘C to the large-scale boundary conditions. Until now, such models have not been applied for climate change studies of the Baltic Sea region, and it is not clear what the response to warming would be.
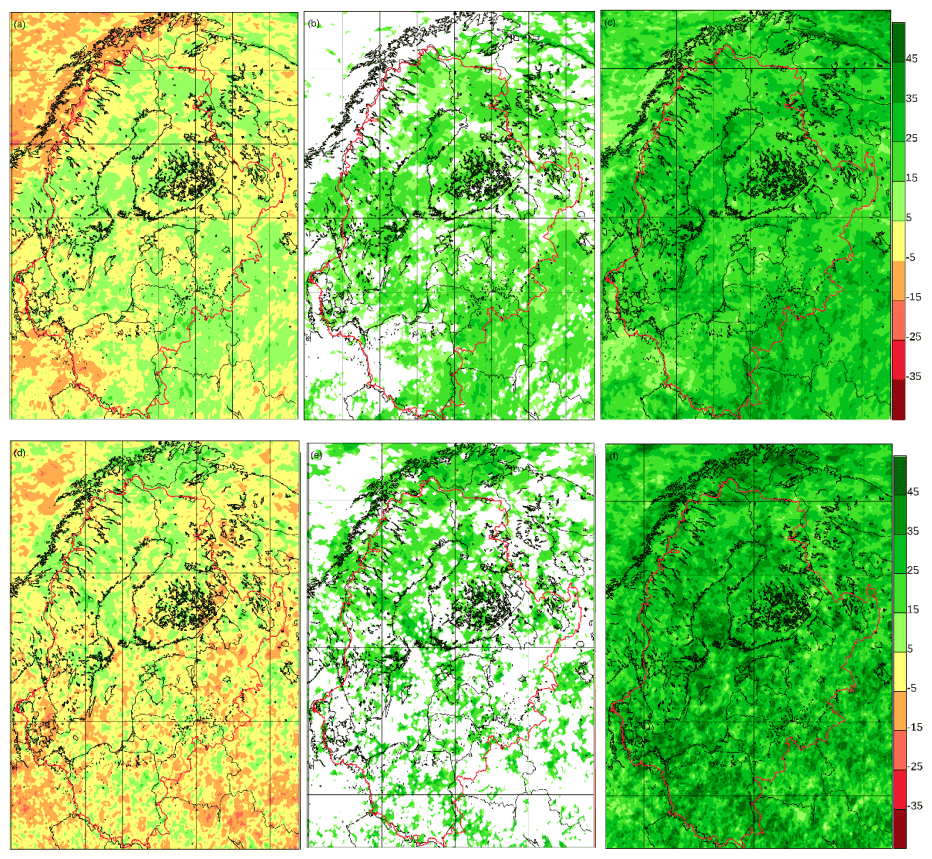
Figure 6Change in the 10-year return value of daily precipitation change (%) between 1971 and 2000 and between 2071 and 2100 for 15 simulations from EURO-CORDEX according to the RCP8.5 scenario. The top row (a, b, c) shows winter, whereas the bottom row (d, e, f) shows summer. The left column is the lowest quartile (a, d), the middle column is the median value (b, e), and the right column is the higher quartile (c, f). For the medians, only points where 75 % of models agree on the sign are shown. This figure is based on data that are also discussed in Christensen and Kjellström (2018) and Christensen et al. (2021).
Stronger precipitation extremes associated with a warmer climate can have major impacts on society. Large amounts of precipitation are closely associated with flooding, which is common in the Baltic Sea region. More intense cloudbursts are closely associated with urban flooding but also with adverse effects on agriculture and infrastructure in rural areas. Stronger climate change signals in recently developed convection-permitting models, compared with previous state-of-the-art models, can have major impacts on the provision of climate services and advice in the context of climate change adaptation.
2.2.8 Sea-effect snowfall
The sea-effect snowfall is typically generated in the early winter when thick cold air masses flow over the relatively warm open-water basin. The warm water heats the cold air above the water and acts as a constant source of heat and moisture, leading to convection. The rising air generates bands of clouds, which quickly grow into snow clouds. Snowfall is enhanced when the moving air mass is uplifted by the orographic effect on the shores or by the convergence of air near the coast as it packs air and forces it to rise, inflating convection (Savijärvi, 2012). The highest precipitation levels occur over the sea close to the coast (Andersson and Nilsson, 1990). With suitable wind direction, these snow bands can bring heavy snowfalls to the coastal land area.
The sea-effect snowfall is very sensitive to the wind direction because a long fetch over the waterbody is required (Laird et al., 2003). On the Baltic Sea, the most favourable wind directions vary from north to north-east (Jeworrek et al., 2017) due to the cold air outbreaks from the north-eastern continent. Nevertheless, for the two major bays (the Gulf of Bothnia and the Gulf of Finland), the sea-effect snowfall can occur on any coast with cold air outbreaks. Favourable conditions for the development of convective snow bands include an optimum strong wind, large air–sea temperature difference, low vertical wind shear, high atmospheric boundary layer height, and favourable wind directions (Jeworrek et al., 2017; Olsson et al., 2020).
Sea-effect (lake- or bay-effect) snowstorms may disrupt several sectors of society and can cause damage costing millions of euros (Juga et al., 2014). Intense and prolonged sea-effect snow events can produce tens of centimetres of snow accumulation and last for days. In northern Europe, the transport systems are most impacted by winter extremes, such as snowfall, cold spells, and winter storms, increasing the number of vehicle accidents, injuries, and other damage as well as greatly increasing travel times (Vajda et al., 2014; Groenemeijer et al., 2016). Critical infrastructure is affected by disturbances in the emergency and rescue services as well as roof and tree damage and failures in power transmission due to heavy snow loading. Road maintenance and transportation of snow to disposal sites if there is not enough space for snow storage along the streets can be costly (Keskinen, 2012).
The impacts of a sea-effect snowfall event depend on its intensity and duration as well as on the location. In Stockholm (November 2016, ∼40 cm of snow accumulation) and Gävle (December 1998, ∼100 cm) in Sweden, public transport was affected; buses, trains, and flights were late or cancelled and cars were trapped on roads. Furthermore, the Danish island of Bornholm was overwhelmed by ∼140 cm deep snowdrifts in December 2010. As the snowfall lasted for several days, the island ran out of places to move the snow. A sea-effect snowfall in the Helsinki metropolitan area in Finland in February 2012 (∼5–10 cm, Juga et al., 2014) caused severe pile-ups on the main roads, with hundreds of car accidents and dozens of injuries. On the other hand, no damage or accidents were reported due to a much larger snowfall accumulation, 73 cm of new snow in less than 24 h, in a small municipality of Merikarvia, on the western coast of Finland, in January 2016 (Fig. 7, T. Olsson et al., 2017, 2018).
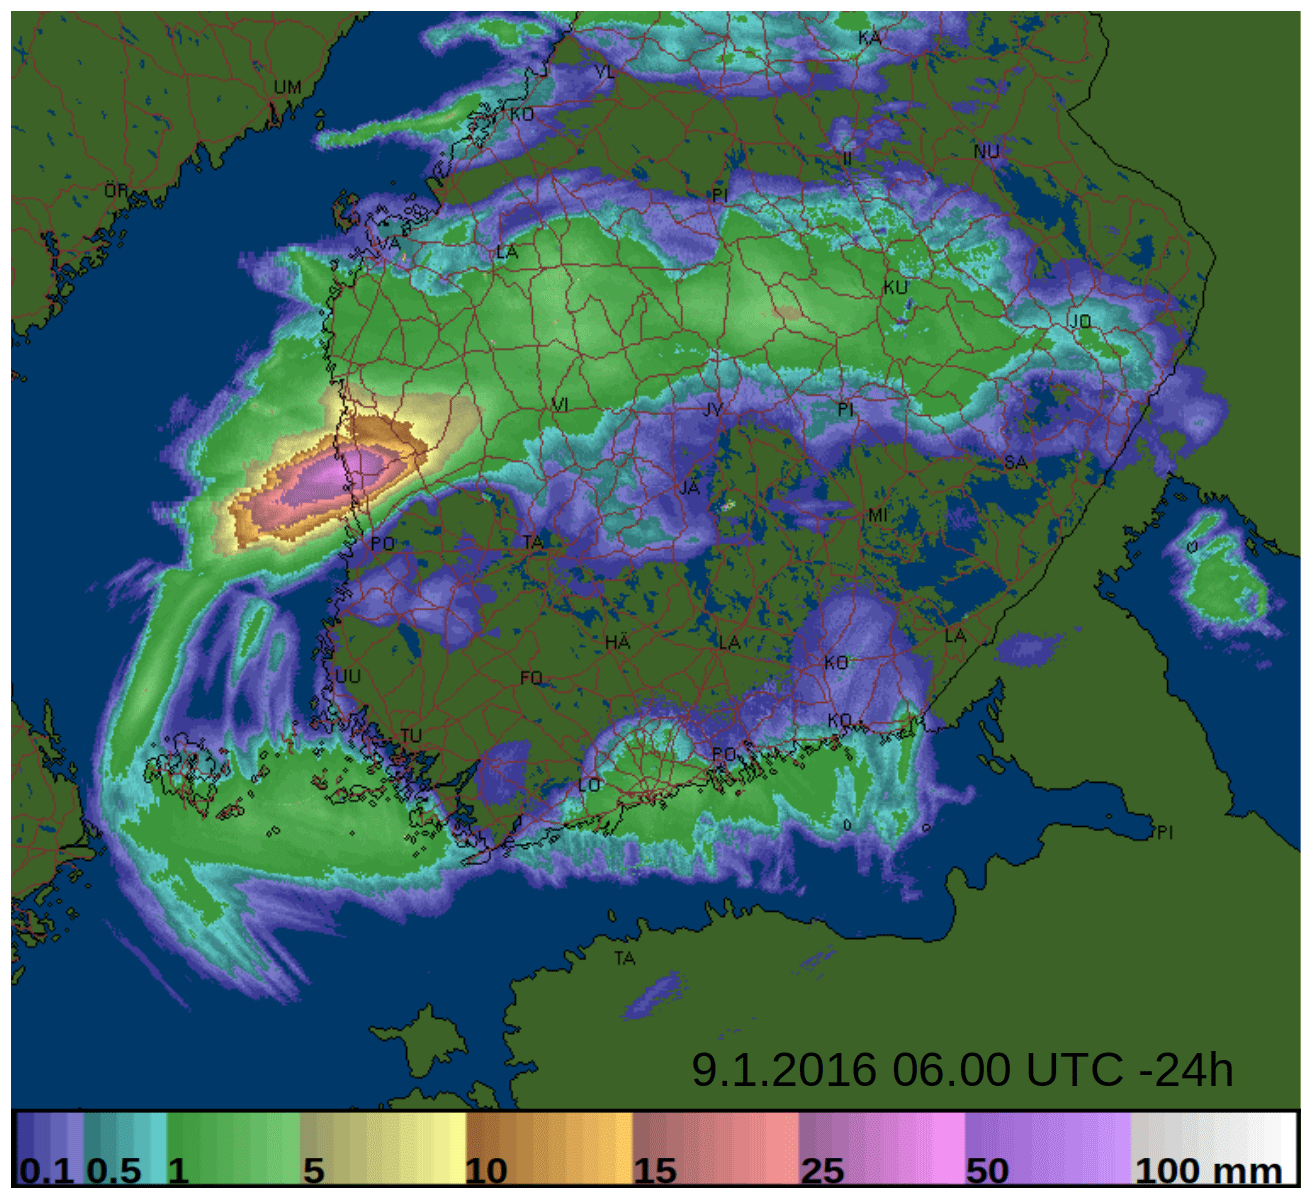
Figure 7Radar image of precipitation accumulation (mm d−1) between 8 January at 06:00 UTC and 9 January 06:00 UTC in 2016, at the time when the national Finnish record of 73 cm of new snow in less than a day was measured in Merikarvia. The figure is sourced from the radar service of the FMI intranet.

Figure 8Annual warm spell duration index (WSDI; a) and annual cold spell duration index (CSDI; b). (a, b) Time series of the spatial averages over the area from 53 to 67∘ N and from 12 to 31∘ E in 1950–2018. A fitted curve and a linear fit are also shown. (c, d) Spatial distributions of the 30-year means during the 1989–2018 period. The baseline period in the calculations is 1961–1990. The figure is based on wsdiETCCDI and csdiETCCDI data (Cornes et al., 2018) that were generated by climind 1.0.0 on 19 November 2019.
Our current knowledge is mainly based on studies from the Great Lakes in North America (Wright et al., 2013; Cordeira and Laird, 2008; Laird et al., 2009, 2003; Niziol et al., 1995; Hjelmfelt, 1990). For the Baltic Sea, there is an increasing number of studies concerning the formation (T. Olsson et al., 2017; Mazon et al., 2015; Savijärvi, 2015; Savijärvi, 2012; Andersson and Nilsson, 1990; Gustafsson et al., 1998) and statistical analysis (Jeworrek et al., 2017; Olsson et al., 2020) of sea-effect snowfalls, as well as the effects of excess snowfall on society (Juga et al., 2014; Vajda et al., 2014).
Using simulations conducted with the RCA4 RCM for the 2000–2010 period, 4–7 d each year showed favourable conditions for snow band formation in the western Baltic Sea area, and 3 d each year showed favourable conditions in the eastern Baltic Sea area (Jeworrek et al., 2017; Olsson et al., 2020). A good physical understanding is essential if we want to assess potential changes in frequency and intensity in the future. Based on simple physical reasoning, the probability of the events might increase or decrease due to climate change. The ice cover season is becoming shorter in different parts of the Baltic Sea, and the annual maximum ice extent is projected to decrease (BACC II, 2015; Luomaranta et al., 2014; Höglund et al., 2017; see also Sect. 2.2.6), extending the time period during which convective snow bands can form. In addition, wintertime precipitation amounts are increasing (Sect. 2.2.7). On the other hand, on an annual mean basis, conditions might become less favourable for sea-effect snowfall due to a shorter thermal winter (Ruosteenoja et al., 2020) and a smaller share of snowfall compared with rain in the warming climate (Sect. 2.2.7).
The sea-effect snowfall events typically have smaller temporal and spatial scales than what is covered by the observational network and resolved by climate models. The high-resolution ERA5 data were used in a case study for January 2016. The preliminary results were promising towards the use of reanalysis data over sea, but the data cannot produce intensive enough convective snowfall over land (Olsson et al., 2018). Newly developed convection-permitting regional climate models (see Sect. 2.2.7), in turn, open up new possibilities to assess the future evolution of the probability of the occurrence.
2.2.9 River floods
River flooding affects more people worldwide than any other natural hazard. River floods often result in inundations, which means that the water level in the river exceeds the safe line and water floods to the adjacent territories. The flood risks are affected by global warming and large-scale and regional changes in the water cycle. In the Baltic Sea basin, the scale of spring floods is affected by precipitation, snow-water accumulation prior to freshet, depth of frozen soil, soil wetness since the previous autumn, the presence of ice crust before flooding, and the combination of flood waves, among other things.
A detailed assessment of climate change of river floods for northern Europe was provided in BACC I (2008) and BACC II (2015). Estimates of annual streamflow in the Baltic Sea basin showed trends towards increase (Hisdal et al., 2010; Wilson et al., 2010). This has been confirmed for Latvian rivers: the trend was statistically significant for many rivers, including the Western Dvina River (Kļaviņš et al., 2008; Kļaviņš and Rodinov, 2008). However, some studies show a tendency toward a decrease in annual discharge, particularly in the southern catchments (Hansson et al., 2011; Gailiuš et al., 2011).
Most studies have detected positive trends with increasing streamflow in winter months in most catchments of the Baltic Sea basin (Stahl et al., 2010; Hisdal et al., 2010; Reihan et al., 2007). A tendency toward decreasing spring streamflow has been reported for the east Baltic states (excluding Russia and Belarus) by Reihan et al. (2007). Trends in the annual maximum and minimum discharges for the major rivers (the Western Dvina, Lielupe, Venta, Gauja, and Salaca) indicate a statistically significant decrease in maximum discharge (Kļaviņš et al., 2008; Kļaviņš and Rodinov, 2008). The same tendencies were found for the Western Dvina and Neman rivers in the Belarusian part of the Baltic Sea basin (Danilovich et al., 2007).
Since the last BACC publication in 2015, there have only been a few studies devoted to the past hydrological regime changes. Arheimer and Lindström (2015) concluded that the observed anomalies in annual maximum daily flow for Sweden were normally within 30 % deviation from the mean of the reference period. There were no obvious trends in the magnitude of high-flow events over the past 100 years. There was a slight decrease in flood frequency, although in a shorter perspective, it seems that autumn floods have increased over the last 30 years. The flood decrease is connected with seasonality change in the study region. Changes in flood time occurrence in Europe were also established by Blöschl et al. (2017). In the Baltic Sea region, they detected floods shifting from late March to February due to the earlier snowmelt, driven by temperature increases in the region and a decreasing frequency of Arctic air mass advection (see Sect. 2.1).
The number of severe floods has increased significantly since the 1980s in the Neman River delta. The floods occur often in spring and winter, but the lifetime of individual floods has become shorter (Valiuškevičius et al., 2018). No significant long-term trends in annual streamflow have been found in north-west Russia (Nasonova et al., 2018; Frolova et al., 2017) or Belarus (Partasenok, 2014). Meanwhile, the intra-annual distribution of runoff has changed significantly during the last decades. In particular, runoff during winter low-flow periods has increased significantly, whereas spring runoff and floods during snowmelt have been decreasing due to the exhausted water supply in snow before spring. However, the general pattern of described changes in water regime varies from year to year due to the increasing and decreasing frequency of extreme-flow events.
For future climate, a decrease in annual mean (Latvia, Lithuania, and Poland) and seasonal streamflow according to the A1B, A2, and B2 SRES scenarios was projected for the rivers in Norway and Finland (Beldring et al., 2008; Veijalainen et al., 2010; Apsīte et al., 2011; Kriaučiūnienė et al., 2008; Szwed et al., 2010), and an annual streamflow increase of 9 %–34 % has been projected for Denmark (Thodsen et al., 2008; Jeppesen et al., 2009). Large uncertainties in the future hydrological regime have been reported for Sweden (Yang et al., 2010; Olsson et al., 2011). Alfieri et al. (2015) showed positive changes in mean flow in northern and eastern Europe.
Significant negative changes in maximum flow are mainly located in north-eastern Europe, including the Baltic countries, Scandinavia, and north-western Russia. According to Thober et al. (2018), in northern Europe, floods will decrease by up to 5 % under 3 ∘C global warming and high flows will increase by up to 12 %. A decrease in floods in this region has been projected in several studies (Arheimer and Lindström, 2015; Alfieri et al., 2015; Roudier et al., 2016).
According to Olsson et al. (2015), moderate changes in annual mean flow and a significant decrease in early-spring discharge peaks by 2051–2090 are expected in Finland. A significant decrease in the magnitude of spring floods and a significant increase in autumn floods are shown for Sweden (Arheimer and Lindström, 2015). For spring floods, the trend obtained using two climate projections indicates a 10 %–20 % reduction by the end of the century compared with the 1970s. For autumn floods, the trend was in the opposite direction, with 10 %–20 % higher magnitudes by the end of the century. Roudier et al. (2016) established the relatively strong decrease in flood magnitude in parts of Finland, north-western Russia, and northern Sweden, whereas in southern Sweden and some coastal areas in Norway, increases in floods are projected. Northern streams in Finland are predicted to lose much of the seasonality of their flow regimes by 2070 to 2100, which is explained by projected air temperature increase and maximal flow decrease (Mustonen et al., 2018). The increase in winter and decrease in spring streamflow has been projected for four main river basins in Belarus (the Western Dvina, the Neman, the Dnieper, and the Pripyat rivers) by Volchek et al. (2017). The streamflow in the east of the Baltic Sea basin (the Western Dvina River within Russia and Belarus) will be characterized mostly by a decrease in mean streamflow in the upper stream and an increase in the lower part of the river basin. The projected maximal streamflow is expected to decrease, with the largest changes in the lower part of the river basin up to 25 % (Danilovich et al., 2019).
However, there are studies opposing this finding. There are slight increases of floods in some parts of Sweden and Norway and in north-eastern Europe, according to Donnelly et al. (2017). High runoff levels are found to increase over large parts of continental Europe, increasing in intensity, robustness, and spatial extent with increasing warming.
The increase in winter runoff and peak discharges was projected by Kasvi et al. (2019); the most significant changes are expected in wintertime – 20 %–40 % by 2050–2079 in south-western Finland. The increases in floods are projected by Roudier et al. (2016) in southern Sweden and some coastal areas in Norway. Almost everywhere, the increase in 100-year floods (QRP100) is stronger than the 10-year floods (QPR10).
2.2.10 Extreme waves
It is important to better understand extreme ocean waves as a natural hazard in the Baltic Sea so that society can adapt and implement safety measures. Vertical motions on the ocean surface consist of an extensive spectrum of frequencies and periods (Munk, 1950; Holthuijsen, 2007). Here, we focus on the wind-generated waves and mainly on the significant wave height representing the average height of the highest third of the waves. Significant wave height serves as an indicator when discussing extreme waves; however, the highest individual wave in a wave record is 1.6–2.0 times higher than significant wave height (Björkqvist et al., 2018; Pettersson et al., 2018). Some ambiguity exists when it comes to which sea states can be called extreme (Hansom et al., 2015) because locally higher wave heights under not particularly stormy conditions can lead to damage and fatalities and may become labelled in the media as extreme, giant, freak, monster, or rogue waves. Rogue waves are typically defined as a maximum wave height of more than twice the significant wave height.
The main drivers of extreme wave conditions are high-wind-speed events and circulation patterns leading to sustained wind direction over a fetch of water that varies depending on the location. On 12 January 2017, an intensive low-pressure system generated a wave in the northern Baltic Sea, referred to in the media as a “monster wave”, more than 14 m high, equalling or exceeding the previous record from 22 December 2004 (EUMETSAT, 2017; Björkqvist et al., 2018). Significant wave heights measured around 8 m according to the Finnish Meteorological Institute (FMI). Even higher waves with significant wave heights up to 9.5 m have been estimated to occur in the northern Baltic Proper during Cyclone Gudrun in January 2005 (Soomere et al., 2008; Björkqvist et al., 2018). A high-resolution numerical model study for the time period from 1965 to 2005 (Björkqvist et al., 2018) showed a 99.9th percentile for significant wave height in the Baltic Sea of 6.9 m. They found 45 unique extreme wave events with a modelled significant wave height above 7 m during the 41-year simulation. Twelve of these events had a maximum above 8 m, six exceeded 9 m, and one showed a significant wave height of over 10 m. Extreme waves in the Baltic Sea can have a significant impact on sea level dynamics and coastal erosion, which is also discussed further in Weisse et al. (2021).
Many studies have been conducted to characterize the present-day variations in the wave fields using measurements (e.g. Kahma et al., 2003; Pettersson and Jönsson, 2005; Broman et al., 2006) and using modelling (e.g. Jönsson et al., 2003; Räämet and Soomere, 2010; Björkqvist et al., 2018) also describing the seasonal dependence (e.g. Soomere, 2008; Räämet and Soomere, 2010). Björkqvist et al. (2018) showed that 84 % of wave events with significant wave heights above 7 m occurred during November through January. The areas of highest significant wave heights are found in the southern and eastern Baltic Proper (Björkqvist et al., 2018). This is consistent with the typical synoptic weather pattern of middle latitudes but modulated by bathymetry and fetch conditions, as well as mesoscale weather effects (Soomere, 2003; Nilsson et al., 2019). The pattern of 100-year return-value estimates of significant wave height, based on 10 km resolution simulations for 1958–2009, is represented here by the 99.9th percentile significant wave height in Fig. 3 (in agreement with Aarnes et al., 2012; Björkqvist et al., 2018; and Nilsson et al., 2020). The northern basins typically experience reduced wave heights, both due to the shorter fetch conditions and to the occurrence of sea ice limiting the wave growth during the season when the highest waves can otherwise be expected to occur (e.g. Tuomi et al., 2019; Nilsson et al., 2019).
Only a few studies have also been conducted on near-shore extreme waves; for example, Gayer et al. (1995), Paprota et al. (2003), and Sulisz et al. (2016) discussed the formation of extreme waves and wave events along Polish and German coasts and reported a large number of freak-type waves. Although significant progress has been made in understanding and predicting ocean extremes and freak waves (e.g. Cavaleri et al., 2017; Janssen et al., 2019), a practical definition using usually more well-predicted parameters, such as significant wave height, is presently used in warnings (Björkqvist et al., 2018) based on high-resolution wave modelling. The horizontal resolution of wave modelling hindcast studies for the Baltic Sea has varied from about 1.1–1.85 km to about 22 km (Nilsson et al., 2019; Björkqvist et al., 2018; Jönsson et al., 2003). The small-scale spatial and time variations are often missed by the models, and coarse resolution (6–11 km) may not provide sufficient accuracy to study extremes (Larsén et al., 2015; Björkqvist et al., 2018).
Present-day trends from long-term in situ observations and wave modelling are inconclusive and possibly site-specific (e.g. Soomere and Räämet, 2011b). From reviewing multiple studies discussing changes and trends in significant wave heights at Baltic Sea sites across time periods of more than 30 years, there is often no clear trend in severe wave heights, or the trends are small and explained by the large natural variability in the wind climate (Sects. 2.1 and 2.2.1) (e.g. Räämet et al., 2010; Soomere et al., 2012; Soomere and Räämet, 2011a). Trends in mean wave height are small but statistically significant (0.005 m yr−1 for 1993–2015) from satellite altimetry (Kudryatseva and Soomere, 2017), but higher quantiles behaved less predictably. A spatial pattern with an increase in the central and western parts of the sea and a decrease in the east was observed.
Future changes to the Baltic Sea extreme wave characteristics are found to be uncertain, and only a few studies exist. For the wave field in a future climate, Mentaschi et al. (2017) reported an increase in extreme wave energy flux (on average 20 %, with maxima up to 30 %). They used a global wave model (approximately 1.5∘ resolution) driven by an ensemble of global coupled models from the CMIP5 under the high-emission RCP scenario 8.5. They suggest that the changes are caused by changes in the NAO index. Groll et al. (2017) analysed wave conditions under two IPCC AR4 emission scenarios (A1B and B1) by running a higher-resolution wave model and implementing the effects of sea ice through ice-covered grid cells if ice thickness was larger than 5 cm. They found higher significant wave height in the future for most regions and simulations. Median wave results showed temporally and spatially consistent changes (sometimes larger than 5 % and 10 %), whereas extreme waves (99th percentile) showed more variability in space and among the simulations, and these changes were smaller (mostly less than 5 % or 10 %) and more uncertain. The changes reported were attributed to higher wind speeds and also to a shift to more westerly winds. The sea ice was clearly reduced in the Bothnian Sea, Bothnian Bay, and the Gulf of Finland in the simulations, but changes in the 30-year mean of the annual wind speed maximum showed a decrease in the northern Baltic Sea. Multi-decadal and the inter-simulation variability illustrated the uncertainty in the estimation of a climate change signal (Dreier et al., 2015; Groll et al., 2017).
Simulations of sea ice variations in a warmer climate may be one of the most important factors determining the future wave field. If a significant reduction in ice in the northern Baltic Sea basin occurs, changes to the wave field are likely unless compensated for by changing wind patterns (Groll et al., 2017). Zaitseva-Pärnaste and Soomere (2013) showed a significant correlation between energy flux and ice season. Comparing ice-free and ice-time-included statistics, ice-free conditions increased significant wave heights on the order of about 0.3 m for both mean values and 99th percentile values (Tuomi et al., 2011; Björkqvist et al., 2018). Fairly small anthropogenic effects for the wave fields are expected for the next century, but results are uncertain and depend on changes in both wind climate (Sects. 2.1 and 2.2.1) and ice conditions (Sect. 2.2.6 and 2.2.11).
2.2.11 Ice ridging
Sea ice extremes depend on the temporal and spatial scale under consideration and, more importantly, on the geographical location and climate conditions – 5 m thick pressure ridges are common off Hailuoto island in Bothnian Bay every winter but are rarely present in the southern Baltic Sea. Society's capacity to manage sea-ice-related hazards also depends on the likelihood of the occurrence of sea ice. In some regions, even a thin ice cover can cause large economic losses to society if the sea ice freezing occurs in a region where marine traffic is operated by non-ice-class vessels. On a local scale, the predominant feature of drift ice is its large variation in thickness. Due to the differential ice motion, pack ice experiences opening, closing, rafting, and ridging. In the Baltic Sea, the thickest ice, that is, pressure ridges, can be 30 m thick, although they are typically 2–5 m thick (Leppäranta and Myrberg, 2009; Ronkainen et al., 2018). After the initial formation of ridges, they remain in the pack ice as obstacles for shipping. Ridges are formed when pack ice experiences convergent motion. In the Baltic Sea, this is common when pack ice is drifting against fast ice. In these coastal boundary zones (Oikkonen et al., 2016), the mean ice thickness can be 0.5 m thicker than in the pure thermodynamically grown level ice in the fast-ice zone (Ronkainen et al., 2018).
During convergent motion, pack ice experiences compression and its internal stress increases. Internal stress, also called ice pressure or ice compression, depends on the strength of wind and currents but also on ice thickness, floe geometry, and the cumulative area of the coherent ice region in motion (Leppäranta, 2011). The ice motion, concentration, thickness, and internal stress of pack ice are strongly coupled. The internal stress of pack ice, which reduces ice motion, increases non-linearly with ice concentration and thickness. In an ultimate situation, very thick ice can be stationary even under strong winds.
For shipping, ridges are well-observed obstacles using radar and visual methods. They mainly impact the duration of time at sea, but sea ice compression is more difficult to observe and can cause total stoppage or even damage to ships and vessels. Sea ice compression can be directly observed by in situ sea ice stress measurements, but those measurements are rare in the Baltic Sea (Lensu et al., 2013). Implicitly, ice compression events have been observed by ships navigating in ice.
The most severe ice winters during the last 10 years occurred in 2010 and 2011 due to a negative NAO (Cattiaux et al., 2010). In the winter of 2011, 14 ship accidents occurred due to harsh ice conditions (Hänninen, 2018). For a comparison, during the average winters there are only one to five accidents. Several compression events were also reported during the winter of 2011. The most hazardous one occurred at the end of February, when marine traffic was totally halted for a few days. Below, we provide an anatomy of this extreme event.
January and February 2011 were characterized by cold and calm weather in the northern Baltic Sea. Consequently, the Gulf of Bothnia became totally ice covered by early February. Because of the weak winds, the Bothnian Sea was mainly covered by 15–30 cm thick undeformed ice (Fig. 9). This situation created favourable preconditions for an intensive ice compression and ridging event. After a cold and calm period, a change in weather pattern occurred on 24 February, when a cyclone arrived in the Bothnian Sea region. The wind speed increased up to 18 m s−1, and strong south-westerly winds prevailed for the following 5 d. Consequently, pack ice drifted towards the north-eastern sector of the Bothnian Sea. The ice field experienced compression and strong deformations, and the undeformed level ice field was redistributed to a heavily deformed ice field. In the south-west area of the Bothnian Sea, a coastal lead was generated due to divergent ice motion (Fig. 9). According to helicopter electromagnetic measurements (Ronkainen et al., 2018), the mean sea ice thickness along ∼100 km transects in the heavily deformed areas increased up to 1.6 m. The thickness of individual ridges was 4–8 m (Fig. 9). Sea ice compression, or internal stress of ice, has not been regularly measured in the Baltic Sea, but icebreaker (IB) and merchant vessel crews have been reporting observations of ice pressure from their bridges. Indications of the ice pressure include closing of ship channels, reduction of ship speed, besetting in ice, and compression of ice against ships' hulls. During the period from 24 February to 7 March 2011, 142 ice compression cases were reported in the Gulf of Bothnia. Of these, 25 reported severe compressions, or 3–4 on a scale of 4 (FMI ice service; Lensu et al., 2013). Compression and thick ice caused a total shutdown of marine traffic for several days. Even the largest merchant vessels needed assistance from IBs. In many cases, the IB needed to assist the merchant vessels one at a time, as traditional assistance in convoys was not possible.
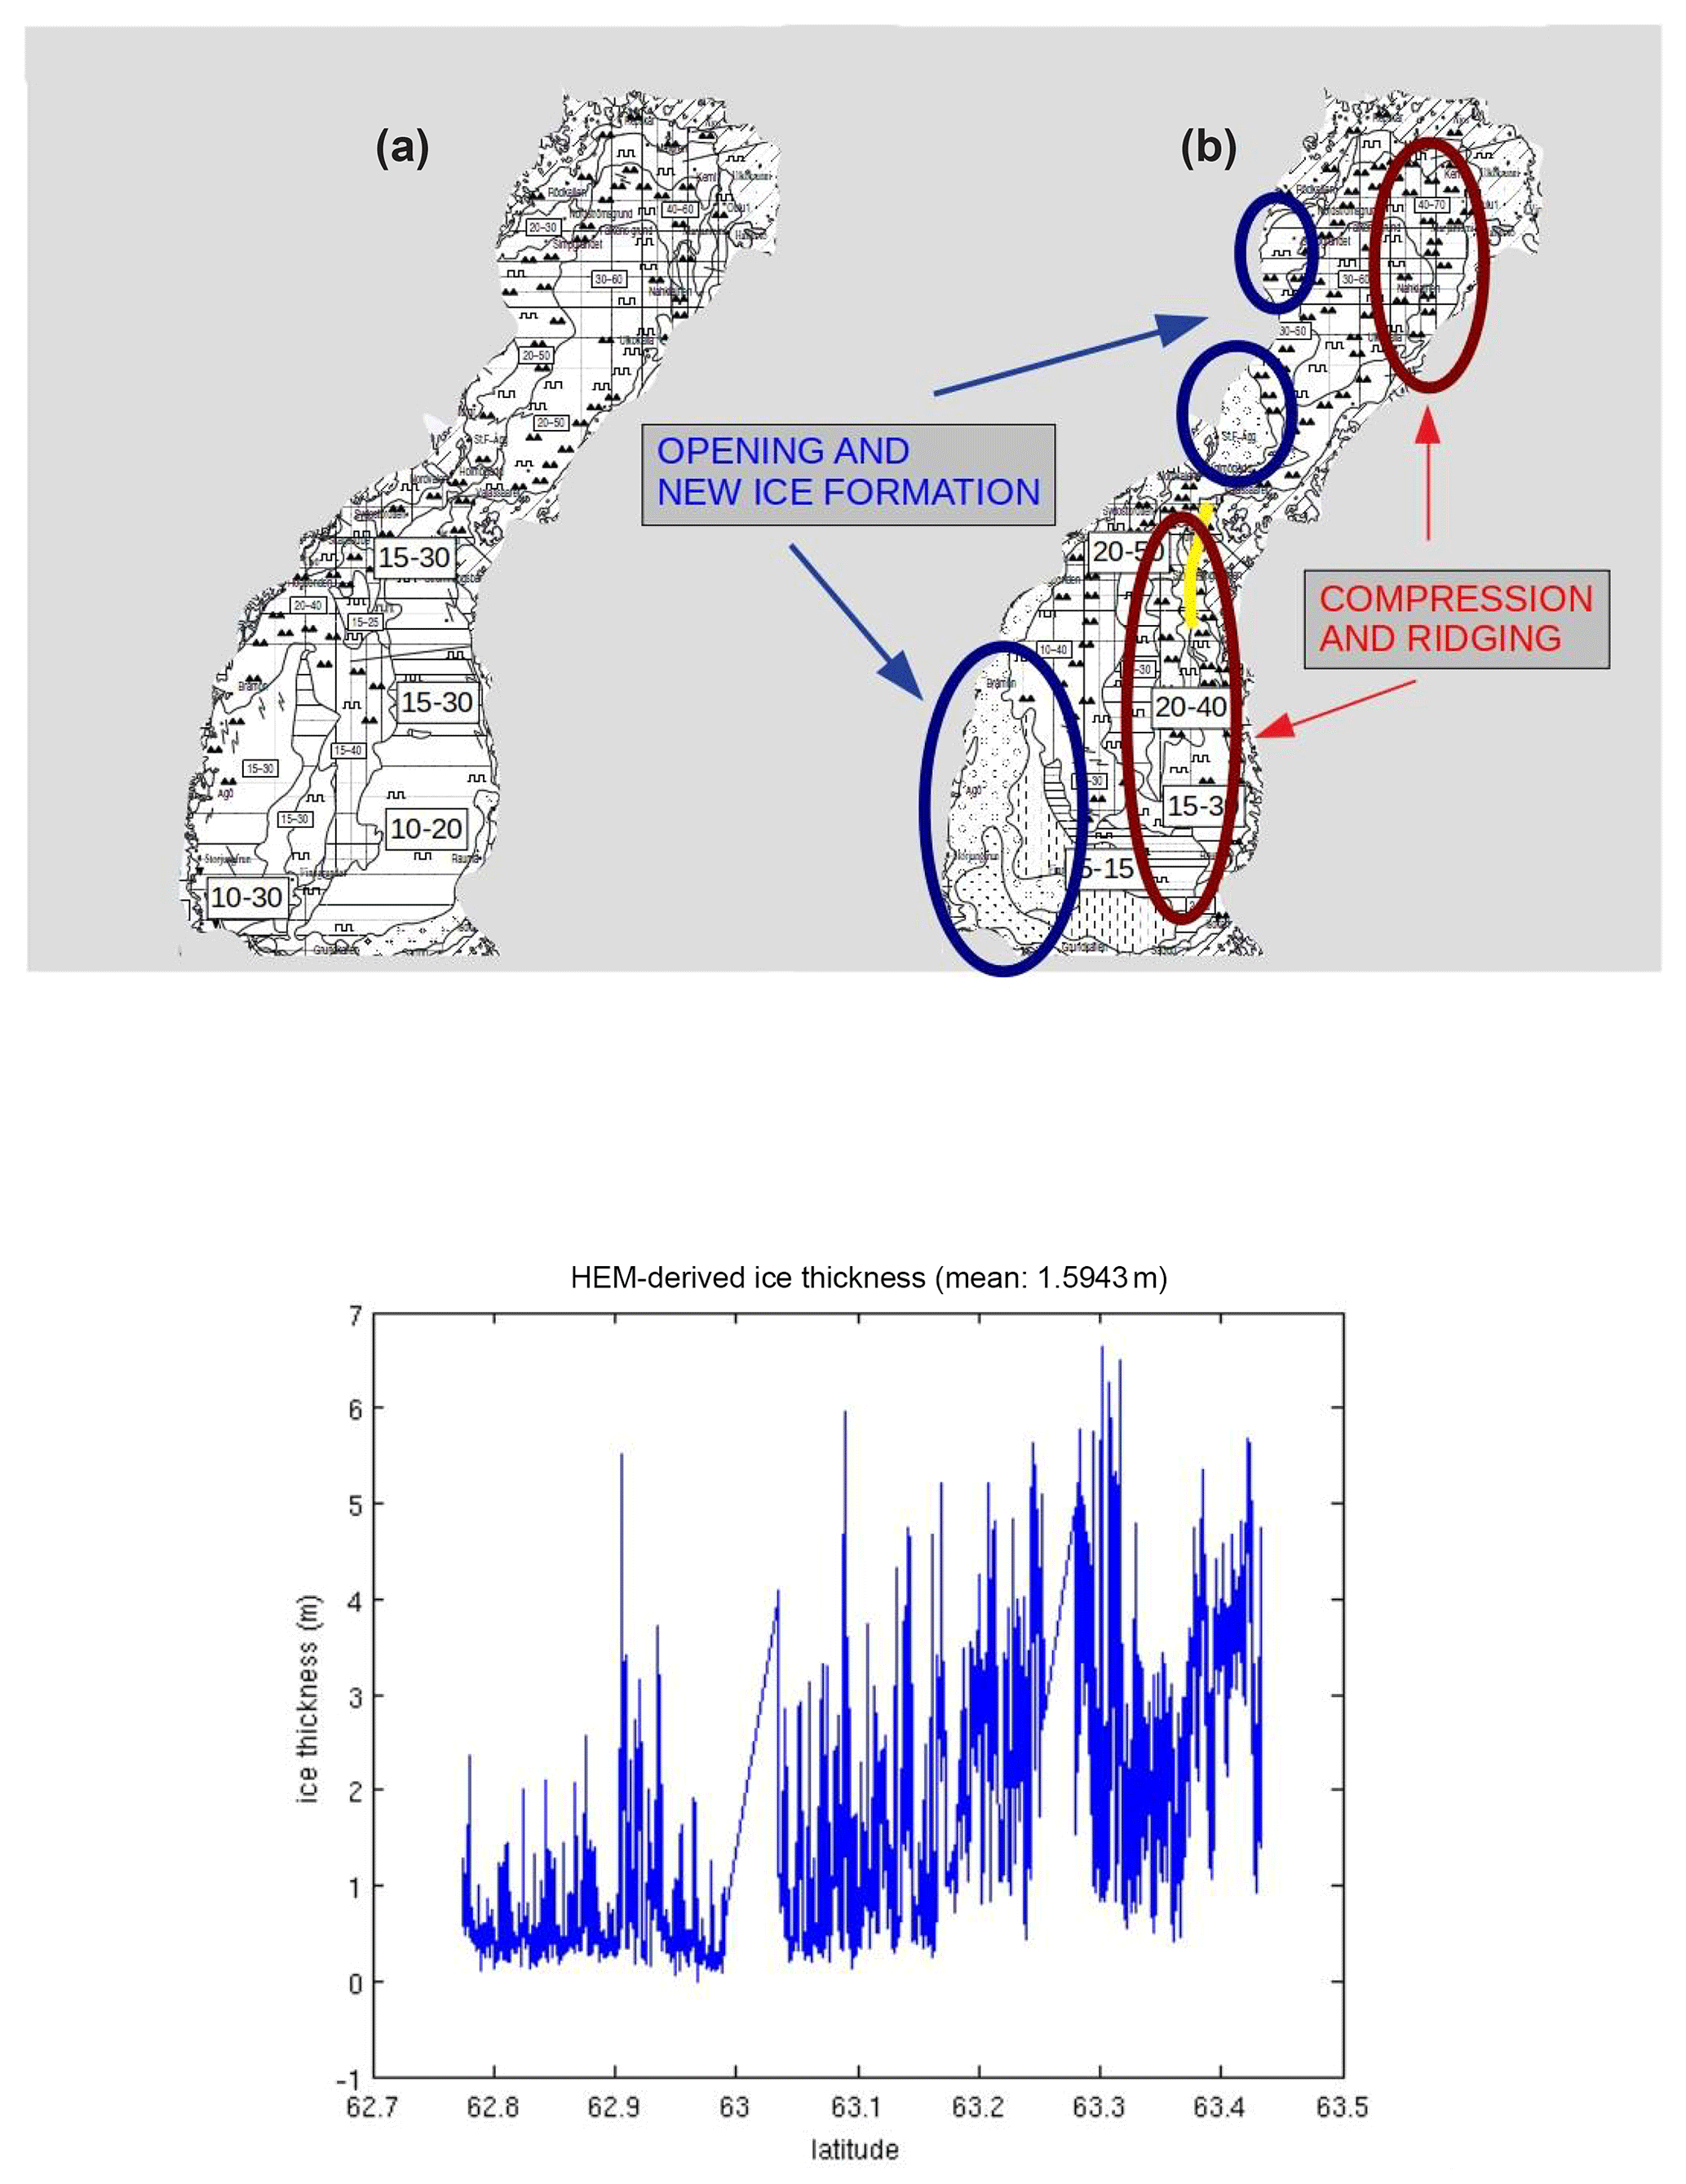
Figure 9Ice charts before and after the major compression event in February 2011. Regions experienced opening and compression/ridging are indicated using blue and red circles respectively. The lower panel depicts ice thickness along the yellow transect shown in the ice chart above.
Sea ice extent and thickness are projected to decrease markedly in the Baltic (Meier et al., 2021). It is also expected that the occurrence of severe ice winters will decrease and, consequently, heavy ice ridging and compression events will become rare if wind conditions remain the same in the future.
2.2.12 Phytoplankton blooms
One component of the marine ecosystem considered here as an extreme event is phytoplankton blooms (for the marine ecosystem in general, see Viitasalo and Bonsdorff, 2021). Blooms are visible mass occurrences of phytoplankton after excessive growth. They become visible with increased water turbidity, sometimes even discolouration (red tides) or surface scums. The mass occurrence of toxic species (harmful algal blooms) may have a detrimental impact on the environmental components, lead to toxic incidents, and may also cause economic harm, for example, by constraining the touristic use of the coastal waters (Wasmund, 2002). Phytoplankton (algae and cyanobacteria) undergoes typical annual successions, induced by the regular changes in abiotic (e.g. solar radiation, temperature, and nutrient concentrations) and biotic (e.g. feeding, infections, competition, and allelopathy) factors. Under favourable conditions, including sufficient nutrient (e.g. N, P, and Si) concentrations and solar radiation as well as low wind that allows stratification in the upper water layers, massive phytoplankton growth may occur, leading to blooms. Phytoplankton forms the basis of the pelagic food web and, after sedimentation, also feeds the benthos. Its blooms are natural phenomena and a vital component of the ecosystem. Only the excessive blooms caused by anthropogenic eutrophication may be considered a nuisance, and phytoplankton blooms should be reduced to natural occurrences (HELCOM, 2007). The natural level of occurrence has not yet been achieved in most areas of the Baltic Sea (HELCOM, 2018).
Eutrophication was identified as a major problem in the Baltic Sea in the 1960s and 1970s, leading to the founding of the Helsinki Commission (HELCOM) in 1974 and the induction of complex monitoring in the Baltic Sea since 1979. Meanwhile, the concentrations of growth-limiting macronutrients, dissolved inorganic nitrogen (DIN), and dissolved inorganic phosphorus (DIP) are decreasing (Andersen et al., 2017). Major Baltic inflows (MBI) are rare events which lead to the reoxygenation of deep waters and the fixation of phosphorus in the sediment. The latest MBI occurred in December 2014 (Mohrholz et al., 2015). Its effect on oxygen concentrations in deep waters was only of short duration, and DIP concentrations were increasing again by 2015, both in deep and surface waters of the Gotland Deep (Naumann et al., 2018). It had no clear effect on phytoplankton biomass, and it did not introduce new phytoplankton species into the Baltic Sea. The originally dominating diatoms in the spring blooms have decreased since the end of the 1980s in the Baltic Proper (Wasmund et al., 2013) and have been replaced by dinoflagellates (Klais et al., 2011). The ratio of diatoms to dinoflagellates may be a sensitive indicator for changes in the ecosystem, including the food web. It was used to develop the Dia / Dino index as an indicator for the implementation of the Marine Strategy Framework Directive (Wasmund et al., 2017).
The summer blooms of cyanobacteria are the most massive ones in the Baltic Proper and the Finland, Riga, and Gdańsk gulfs. Long-term analyses including historical data revealed that cyanobacterial blooms became a common phenomenon as of the 1960s (Finni et al., 2001). Cyanobacteria seem to increase on a worldwide scale due to global warming (Karlberg and Wulff, 2013). Cyanobacterial species tend to have higher growth rates at high temperatures than other phytoplankton species, and they are favoured in thermally stratified waters (O'Neil et al., 2012). Moreover, increased freshwater inflow, as projected mainly in the north of the Baltic area (BACC II, 2015), will intensify stratification and support cyanobacteria blooms. However, wind-induced upwelling in early summer may induce blooms, which is primarily an effect of phosphorus input into the surface water (Wasmund et al., 2012). If stratification is disrupted by wind, established cyanobacteria blooms may collapse (Wasmund, 1997). As the bloom-forming buoyant cyanobacteria have a patchy occurrence, representative sampling is difficult and the amount of data may be insufficient for a reliable trend analysis. The development of cyanobacteria blooms has been reported annually in HELCOM environment fact sheets since 1990 (Öberg, 2017; Kownacka et al., 2020), but general trends could not be identified in these 3 decades. However, in specific regions, trends may occur which may even be in opposite directions (Olofsson et al., 2020). A few recent extreme blooms are mentioned here.
On 20 July 2017, cyanobacteria warnings were issued for eight beaches in the area of the Gulf of Gdańsk, and on 22–24 July 2017, three bathing sites were closed due to decreased water transparency. In 2018, all the bathing sites in the Gulf of Gdańsk and Puck Bay were closed for 12 d owing to the formation of toxic scums. In the Gulf of Finland, the exceptionally warm summer of 2018 (see also Sect. 2.2.4) caused the strongest cyanobacterial bloom of the 2010s (SYKE, 2018). Remarkably, the typical cyanobacteria genus of the summer blooms was also abundant in winter under the ice on the western and eastern Finnish coasts, as identified, for example, on 7 January 2019 (SYKE, 2019).
In the past decade, blooms of toxic dinoflagellates have increasingly been observed in shallow coastal waters of the Baltic Sea. Neurotoxic Alexandrium ostenfeldii now regularly forms dense bioluminescent summer blooms in the Åland archipelago and the Gulf of Gdańsk (Hakanen et al., 2012). The highest cell concentrations so far recorded for this species were measured in the Åland area in August 2015 (Savela et al., 2016). In July 2015, a dense bloom of Karlodinium veneficum, killing fish in a shallow bay at the south-west coast of Finland, captured the attention of regional authorities (SYKE, 2016).
Global warming is generally becoming a threat that may influence the phytoplankton strongly (Cloern et al., 2016; Reusch et al., 2018). Future changes in eutrophication as well as a changing climate will influence the occurrence of harmful algal blooms. If the Baltic Sea Action Plan is implemented successfully, it is suggested that record-breaking cyanobacteria blooms will not occur in the Baltic Sea in the future (Meier et al., 2019).
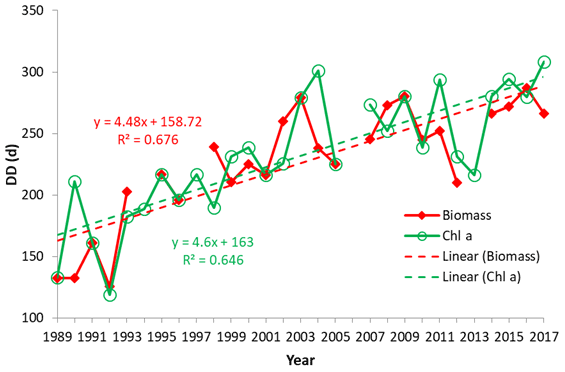
Figure 10Trends in the duration of the vegetation period (DD), based on phytoplankton biomass and Chl a data, showing the regression lines and corresponding formulas (Wasmund et al., 2019).
A phenomenon worth mentioning is the extension of the growing season of phytoplankton in the oceans (Gobler et al., 2017), as well as in the Baltic Sea (Groetsch et al., 2016). The period with satellite-estimated chlorophyll a (Chl a) concentrations of at least 3 mg m−3 has doubled from approximately 110 d in 1998 to 220 d in 2013 in the central Baltic Sea (Kahru et al., 2016). Based on weekly measurements of phytoplankton biomass and Chl a concentrations at a coastal station in the Bay of Mecklenburg from 1988 to 2017, Wasmund et al. (2019) found an earlier start of the spring bloom, with a rate of 1.4 d yr−1, and a later end of the autumn bloom, with a rate of 3.1 d yr−1, as well as a corresponding extension of the growing season (Fig. 10). The earlier start of the growing season was correlated with a slight increase in the sunshine duration during spring, whereas the later end of the growing season was correlated with a strong increase in water temperature in autumn. As the growing season has extended recently from February to December at the investigated site, a further extension is practically not possible. However, this process may still be ongoing in other regions of the Baltic Sea.
2.3 Possible implications for society
Extreme events and projected changes caused by global warming or changes in the atmospheric circulation could have significant and potentially disastrous consequences for Baltic societies. This section examines the potential implications of extremes and changes in extremes on forest fires, coastal flooding, offshore wind activities, and shipping in the Baltic Sea area, all of which are linked to key economic sectors. These are also linked to the multiple drivers of the Baltic Sea systems (Reckerman et al., 2021).
2.3.1 Forest fires
Fires play a key role in the natural succession and maintain biological diversity in boreal forests. They also pose a threat to property, infrastructure, and people's lives (e.g. Rowe and Scotter, 1973; Zackrisson, 1977; Esseen et al., 1997; Virkkala and Toivonen, 1999; Ruokolainen and Salo, 2006). Moreover, fires have a deteriorating impact on air quality (Konovalov et al., 2011; R'Honi et al., 2013; Popovicheva et al., 2014), in extreme cases even in regions hundreds of kilometres away from the actual fire (Mei et al., 2011; Mielonen et al., 2012; Vinogradova et al., 2016). The emissions of gases and aerosols through fires as well as changes in surface albedo also have impacts on climate. Due to increasing fire activity, boreal forests may even shift from a carbon sink to a net source of carbon to the atmosphere, resulting in a positive climate feedback (Oris et al., 2014; Walker et al., 2019). The impact of aerosols is more complex, although it is generally short-lived. However, heat-trapping soot from large conflagrations can enter into the stratosphere and persist there for months (Ditas et al., 2018; Yu et al., 2019). Changes in surface albedo due to fires tend to decrease radiative forcing in the long term (e.g. Randerson et al., 2006; Lyons et al., 2008).
Large forest fires are often associated with long-lasting drought and heat waves. Recently, during the exceptionally warm and dry summer of 2018, numerous large fires burned a total of more than 20 000 ha of forest in Sweden (Sjöström and Granström, 2020; Krikken et al., 2021). According to an analysis performed by Krikken et al. (2021), climate change has increased the probability of such events roughly by 10 % to date. Furthermore, during the heat wave of 2014, a single conflagration in Västmanland burned nearly 15 000 ha. In Russia, the persistent heat wave of 2010 resulted in devastating forest fires (Bondur, 2011; Witte et al., 2011; Vinogradova et al., 2016).
The natural source of fire in boreal forests is lightning. Nowadays, lightning strikes ignite about 10 % of fires in Sweden and Finland (Granström, 1993; Larjavaara et al., 2005b). In northern Europe, the distribution of lightning-ignited fires approximately follows the thunderstorm climatology with fewer ignitions in the north (Granström, 1993; Larjavaara et al., 2005a). In recent years, many of the largest fires have been caused by forest machinery operations (Sjöström et al., 2019).
Irrespective of the ignition source, weather influences the conditions for the spreading of fires. In northern European boreal forests, climate (particularly precipitation variability) has been an important decadal-scale driver of fires even during recent centuries with strong human influence on fire occurrence (Aakala et al., 2018). In boreal forests in general, inter-annual variability in burned area can largely be explained by fluctuations in lightning activity (Veraverbeke et al., 2017) and also by variations in large-scale atmospheric circulation patterns (Milenković et al., 2019). Usually, only a few years with large forest fires account for the majority of burned area from decadal to centennial timescales (Stocks et al., 2002).
In recent decades, burned area in northern European forests has mainly remained low (Lindberg et al., 2021). This is because fires in the area tend to be small compared with other boreal regions, mainly thanks to effective fire suppression. There are still some distinct differences in the fire activity between different countries in the area. Most noteworthy, in recent years relatively large fires have been much more common in Sweden than in Finland, although large fires are still much more common in Russia, Canada, and Alaska (e.g. Stocks et al., 2002; Vivchar, 2011; Smirnov et al., 2015). However, large fires were not uncommon in Fennoscandia before the cultural transition to modern agriculture and forestry led to a steep decline in the annual burned area by the end of the 19th century (Parviainen, 1996; Wallenius, 2011). In response to global warming, the forest-fire danger is generally projected to increase across the circumboreal region (e.g. Flannigan et al., 2009; Wotton et al., 2010; Shvidenko and Schepaschenko, 2013; Sherstyukov and Sherstyukov, 2014). This is particularly due to enhanced evaporation in a warmer climate. Already, within recent decades, long-lasting drought events have become more intense throughout Europe (see Sect. 2.2.9), and increasing temperatures having been the main driver of the change (Manning et al., 2019). According to the most extreme warming scenarios, summer months with anomalously low soil moisture that occurred recently in northern Europe once in a decade may occur more often than twice in a decade in the late 21st century (Ruosteenoja et al., 2018). However, fire regimes in northern and mid-boreal forests have appeared to be more sensitive to climate variations compared with fire regimes in southern boreal forests (Drobyshev et al., 2014). Hence, Drobyshev et al. (2014) concluded that fire regimes across Scandinavia might even show an asynchronous response to future climate changes. Moreover, years with large forest fires in northern Scandinavia have historically tended to occur more frequently during cooler rather than warmer climate periods (Drobyshev et al., 2016), yet these large-fire years have mainly occurred in association with individual warm and dry summers. In Finland, the climate change impact on forest-fire risk has been evaluated in several studies (Kilpeläinen et al., 2010; Mäkelä et al., 2014; Lehtonen et al., 2014b, 2016). In these studies, the projected decrease in soil moisture content has been reflected as a projected increase in fire risk. Assuming the current relationship between weather and the occurrence of forest fires, Lehtonen et al. (2016) estimated that the number of fires larger than 10 ha may double or even triple in Finland during the present century. Nevertheless, there is considerable uncertainty regarding the rate of change, largely due to the uncertainty in precipitation projections. Yang et al. (2015) predicted that the fire risk in northern Sweden could even decrease in the future, whereas considering a projected decrease in population density, Backman et al. (2021) predicted that the number of fires in the Republic of Karelia would decrease in the future and that it is uncertain whether the burned area would increase or decrease.
In addition to meteorological conditions, fire potential is largely determined by the availability of flammable fuels in forests. In southern Europe, the biomass availability may become a limiting factor for increasing fire activity (Migliavacca et al., 2013). However, in northern Europe this is unlikely, as forest productivity and biomass stock are projected to increase under a warming climate (Kellomäki et al., 2008; Dury et al., 2011).
2.3.2 Coastal flooding
The projected regional sea level rise (e.g. Grinsted et al., 2015) coupled with the expected intensification of sea level extremes (e.g. Vousdoukas et al., 2018) discussed in Sect. 2.2.2 will widely affect both natural and human systems along the Baltic Sea.
In the past, several major floods have occurred on the Baltic Sea coast. While there are few surviving sea level measurements or other historical records dated before the 19th century, traces of extreme floods are found from sand layers. Studies of coastal sediments, compared with historical records, imply that the 1497 flood, which damaged cities on the southern Baltic coast, was the largest storm surge on the Polish coast in 2000 years (Piotrowski et al., 2017). St. Petersburg has also proved vulnerable to coastal and fluvial flooding, and the highest documented surge occurred in 1824, when the water level rose to 367 cm (over local mean sea level) at Kronstadt and possibly even to 410 cm at St. Petersburg (Bogdanov and Malova, 2009). In the era of tide gauges, the most severe flood along the southern Baltic coast happened in 1872. This storm caused severe damage along the German and Danish coasts, and 271 lives were reported lost (Rosenhagen and Bork, 2008). At Travemünde, Germany, the sea level rose to 340 cm (Jensen and Müller-Navarra, 2008); at Skanör, along the southern Swedish coast, the sea level reached approximately 240 cm (Fredriksson et al., 2016). For the Gulf of Finland and the Gulf of Riga, the most severe flooding on record was caused by Cyclone Gudrun in 2005, when the observed sea level reached 197 cm in Hamina (Finland), 230 cm in St. Petersburg (Russia), 207 cm in Ristna (Estonia), and 275 cm in Pärnu (Estonia) (Suursaar et al., 2006).
From a European perspective, the uncertain influence of climate change on the frequency and intensity of waves and wind as a predictor of future damage costs due to coastal flooding is of limited importance relative to the observed and projected influence of sea level rise on storm surge heights. Hence, Vousdoukas et al. (2018) found that the indirect effect of mean sea level rise, uplifting high sea levels under extreme weather conditions, serves as the main driver of the increased coastal flood damage in the future and accounts for 88 %–98 % of the total damage. Interestingly, the highest relative contribution from changes in cyclones is projected along the Baltic Sea coast. Based on the projections used by Vousdoukas et al. (2017), this stems from a combination of low relative sea level rise along the Baltic Sea catchment that is due to the land uplift and intensifying waves and storm surges owing to climate change. In general, there is no consensus on whether wind storms are expected to become more frequent (Sect. 2.2.1). For Finland and Sweden in particular, due to land uplift, the physical footprint of sea level rise in future damage estimates is weakened. Conversely, socio-economic development along the coast is likely to be a main driver and to modulate the intensification of coastal hazards amongst Baltic Sea countries.
In the absence of improved coastal management practices and coastal adaptation, the expected population exposed to coastal flooding along the Baltic Sea coastline annually as well as the expected annual damage (EAD) due to coastal flooding are both likely to increase by orders of magnitude (e.g. Forzieri et al., 2016; Vousdoukas et al., 2018; Mokrech et al., 2014; Brown et al., 2018). While the impacts on managed as well as natural coastal and near-coastal terrestrial ecosystems may be significant, Baltic coastal cities are likely to be mainly responsible for future coastal flood losses due to their high concentration of people, infrastructure, and valuable assets. To keep future coastal flood losses low, climate change adaptation measures urgently need to be installed or reinforced (Vousdoukas et al., 2020; Abadie et al., 2019) to withstand extreme sea levels (see Sect. 2.2.2).
Apart from recent work by Paprotny and Terefenko (2017) for Poland, environmental and economic impact assessments from the regional to the national level generally belong to the grey literature. Similarly, impact assessments at the local (city) level have so far been mainly carried out by engineering consultancies to facilitate the development of local adaptation strategies (Thorarinsdottir et al., 2017). Due to local constraints and a lack of best practices, the methodologies behind such detailed assessments often vary greatly and are not comparable.
Figure 11 shows different damage estimates related to coastal flooding, including those for some of the most exposed cities along the Baltic Sea. Prahl et al. (2018) calculated a set of macroscale damage cost curves (Fig. 11, right side), that is, damage cost as a function of flood height, for the 600 largest cities in Europe, including all of the major cities along the Baltic Sea. Land use information is being used rather than population coupled with gross domestic product per capita as the basis for approximating the location of assets; this ensures that flooded assets are inherently co-located with the city. For the hydrological modelling, a high-resolution digital elevation model for Europe is used together with a simple static-inundation model that only accounts for hydraulic connectivity. While this approach readily allows for the estimation of the damage costs associated with flooding for any European coastal city, the “coarseness” of the methodology (including the underlying empirical and categorical information on land use and flood defences, which goes into the calculations) can lead to an overestimation of the damage cost curves, especially for low-lying urban and high-value areas. This is particularly found to be the case for (but not restricted to) Copenhagen (Fig. 11, right side).
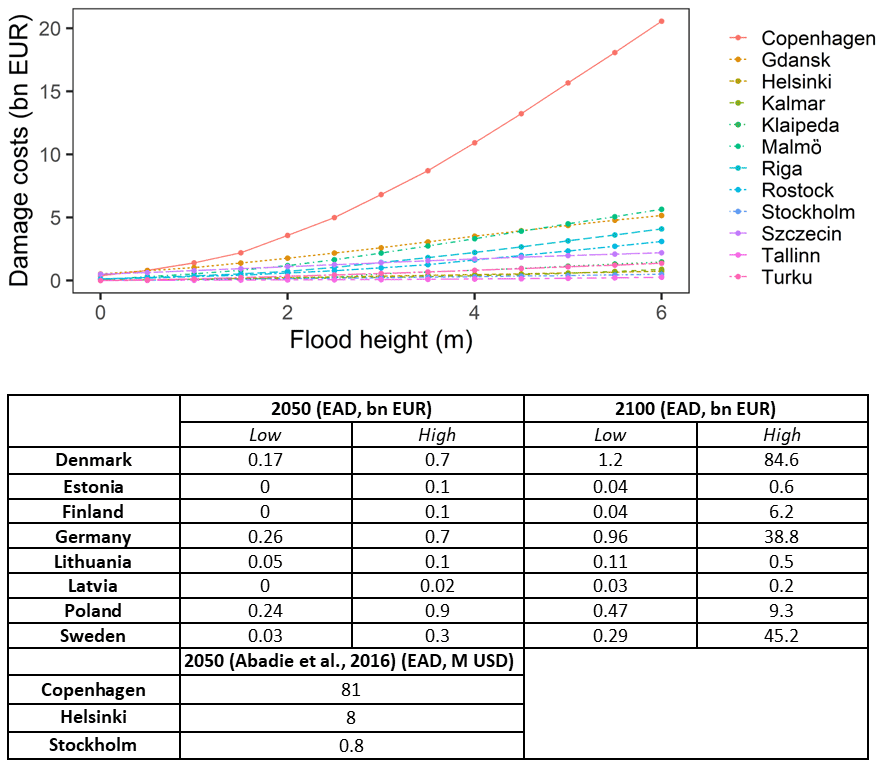
Figure 11Estimated damage cost curves for a coastal flood event for select cities along the Baltic Sea based on Prahl et al. (2018). The insert shows high and low estimates of the cost of expected annual damage (EAD) to Baltic countries from extreme water levels by Vousdoukas et al. (2018, 2019, 2020) as well as specific estimates for major Baltic cities in 2050 by Abadie et al. (2016). Note that the former is in billions of EUR, whereas the latter was estimated in millions of USD.
For comparison, Abadie et al. (2016) carried out a set of economic impact assessments for Copenhagen, Helsinki, and Stockholm in 2050 based on a similar large-scale modelling framework (cf. left side of Fig. 11, lower rows). Using the same general methodology as Prahl et al. (2018), Abadie et al. (2016) developed a European-scale assessment framework, where a continuous stochastic diffusion model is used to describe local sea level rise, and Monte Carlo simulations yield estimates of the (risk) damage caused by the modelled sea level rise. This is paired with an economic damage function developed for each city and point in time. The results found by Abadie et al. (2016) for the RCP8.5 scenario are shown in Fig. 11. For Copenhagen and Stockholm, the damage cost estimates of Prahl et al. (2018) are largely consistent with those of Abadie et al. (2016).
Vousdoukas et al. (2018, 2019, 2020) estimated the EAD from coastal flooding for all countries in Europe (excluding adaptation) by combining future climate model projections with a set of gridded projections of gross domestic product, population dynamics, and exposed assets based on selected Shared Socioeconomic Pathway scenarios. Flood defences are considered to be recorded in the FLOPROS database (Scussolini et al., 2016). As seen on the left side of Fig. 11 (upper rows), at the end of the century, Denmark is expected to suffer the most severe damage from increased coastal flooding resulting from climate change due to its long coastline, followed by Germany, Poland, and Sweden.
The large observed variation in cost estimates related to future coastal flooding in the Baltic Sea may easily be ascribed to the different approaches, data, and scales used for impact modelling, including key assumptions, in particular relating to economics. To improve confidence in impact assessments, a comparable assessment of methods, models, and assumptions is needed in order to establish more solid evidence within the area. Likewise, impacts due to compound events where, for example, extreme coastal water levels are (locally) exacerbated by associated high water levels in nearby rivers or high-intensity rainfall (Bevacqua et al., 2019) are largely unaccounted for in most damage cost assessments.
2.3.3 Offshore wind energy activities
Offshore wind farms are growing rapidly in the Baltic Sea. Figure 12 shows the expansion of wind farm clusters in the southern parts of the Baltic Sea and in the North Sea. According to recent reports, offshore wind power in the Baltic Sea is far from fully exploited and could reach 83 GW (Cecchinato, 2019; Freeman et al., 2019).

Figure 12Overview of wind farms in different development states in parts of the Baltic Sea and the North Sea (http://www.4coffshore.com, last access: 9 March 2021, courtesy of 4COffshore.com).
Compared with onshore situations, offshore wind energy benefits from richer wind resources. It is also greatly challenged by the harsher offshore environmental conditions, which makes the so-called “levelized cost of energy” (LCOE) significantly higher. The LCOE accounts for, among other things, the transportation of energy from sea to land, the trips to the farms for maintenance, and the water depth where the turbines will be installed. Maintenance and construction become more challenging when storms are present, as storms cause rougher conditions for the turbines and farms at sea than over land. There are no land obstacles to effectively consume the atmospheric momentum; instead, waves are generated, swells develop and propagate, and waves break. This can put tremendous loads on the construction of fixed and floating turbines. At the same time, breaking waves release water drops and sea salt into the air. This, along with severe precipitation at sea during storms, has a significant impact on the erosion process on turbine blades and, hence, affects the turbine performance (e.g. Mishnaevsky, 2019). At sea, the role of icing on blades has been considered to be generally small (e.g. Bredesen et al., 2017), whereas over the Baltic Sea, ice cannot be ignored (Heinonen et al., 2019). The storm winds at sea typically reach the cut-off speed of 25 m s−1 at hub height more frequently, causing more fluctuation in power production and, accordingly, significant challenges with respect to the power integration system (e.g. Sørensen et al., 2008; Cutululis et al., 2013). At the same time, strong winds and large waves directly affect activities such as installation and operation and maintenance (O&M; see Diamond et al., 2012; Leiding et al., 2014; Dangendorf et al., 2016; and Kettle, 2018, 2019).
Several sections in this report have summarized studies on the climatological changes of a number of relevant parameters including storms, waves, temperatures, icing, precipitation, and water levels. Effort is needed to co-ordinate the analysis and to implement these changes in the environmental parameters in offshore wind energy planning. Design parameters need to be calculated to avoid placing turbines in a dangerous wind environment and to identify the suitable turbine design class. Turbulence and the 10 min value of the 50-year wind at hub height are two key design parameters (IEC 61400-1) requiring improved estimation.
With the presence of storms over the sea, special organized atmospheric features develop, contributing to turbulence over a broader frequency/wave number range than under typical stationary surface layer conditions. These features include gravity waves, low-level jets, open cells, and boundary layer rolls. Over the Baltic Sea, gravity waves and boundary layer rolls are present (e.g. Larsén et al., 2012a; Svensson et al., 2017; Smedman, 1991). Over the North Sea, it has been found that open cells can add an extra 20 %–50 % to the turbulence intensity (Larsén et al., 2019b).
For the studies of extreme winds for wind energy applications over Scandinavia, groups in Sweden and Denmark pioneered the use of long-term wind measurements (e.g. Abild, 1991; Bergström, 1992; Kristensen et al., 2000). Later, long-term global reanalysis products were used, including in the Baltic Sea area (e.g. Frank, 2001; Larsén and Mann, 2009). At early stages of wind energy development, the reference height of 10 m was most relevant for engineering applications. Today, the turbines are much bigger, and the largest (offshore) turbine has a 220 m rotor and 107 m blade. At the same time, wind energy is developing to give greater global coverage over various land/sea conditions. This makes the use of mesoscale models an attractive option. A three-dimensional mesoscale numerical model, the MIUU (Meteorological Institute Uppsala University) model, was used for the 50-year wind speed to calculate both the 10 min mean and 3 s gust values, with a grid space of 1 km (Bergström and Söderberg, 2008). In addition, a variety of mesoscale models have been used for wind resource assessment as well as extreme wind calculations, such as the HIRHAM model (a regional climate model based on a subset of the HIRLAM – High Resolution Limited Area Model – and ECHAM models; e.g. Clausen et al., 2012; Pryor et al., 2012), the KAMM (Karlsruhe Atmospheric Mesoscale Model; e.g. Hofherr and Kunz, 2010; Larsén and Badger, 2012), the REMO (REgional Model), the CCLM (Climate Limited-area Model; Kunz et al., 2010), and the WRF (Weather Research and Forecasting) model (Bastine et al., 2018). For long-term data, the models are run covering time periods up to decades. To compensate for the computational cost, most of these models have been run at a spatial resolution of tens of kilometres. The effect of the spatial and temporal resolution of these mesoscale modelled winds was investigated in Larsén et al. (2012b) using modelled data from WRF, REMO, and HIRHAM. Larsén et al. (2012b) developed a so-called spectral correction method to fill in the missing variability in the modelled time series, thereby reducing the underestimation of the extreme wind. To calculate the extreme wind, Larsén et al. (2013, 2019a) also developed a selective dynamical downscaling method to efficiently allocate modelling resources to storms at high resolution (i.e. 2 km). The southern part of the Baltic Sea was included in these calculations.
The development of approaches for calculating design parameters over the Baltic Sea has provided different estimations through time. The difference in these estimations (more than 10 %) is bigger than the effect from climate change calculated from different climate scenarios (a few percentage points). Climate modelling describes future scenarios and provides a coherent calculation of the whole set of environmental parameters, including wind, temperature, icing, and precipitation. One such output is from the Climate and Energy Systems (CES) research project supported by the Nordic Research Council (Thorsteinsson, 2011). This study features both opportunities and risks within the energy sector associated with climate change up to the mid-21st century. Fifteen combinations of regional and global climate models were used. The results, however, did not portray a consensus on the change in storms and extreme winds in the future over the Scandinavian seas (see also Sect. 2.2.1 and Belusic et al., 2019).
2.3.4 Shipping
There are several aspects where changes in extreme events and natural disasters have the potential to influence shipping; one relates to ice conditions. As stated above (Sect. 2.2.6 and 2.2.11), winters on the Baltic Sea can be different with highly variable ice conditions. This has been observed when the ice loads encountered by ships have been measured in full scale by instrumenting ship hulls for ice load measurements – see the example in Fig. 13 (Kujala, 2017). Typically, the highest loads occur when ships are moving through heavily ridged areas or are stuck in moving, compressive ice. The highest measured loads occurred in severe ice winters, such as in 1985 and 1987. Extreme events can also cause significant damage to the ship shell structures, as shown in Fig. 13 (Kujala, 1991). Typically, ice-induced damage is in the form of local dents on the shell structures, to a depth of about 50–100 mm and to a width and height of about 0.5 m. The figure shows an example of the extensive damage outside Luleå (upper photograph), when a ship left the harbour without ice breaker (IB) assistance and got stuck in compressive ice. The whole shell structure was permanently damaged to a depth of about 0.5 m and to a length and height of several metres. Ice-strengthened ships are not designed for this type of situation, as the design principle is that IBs will prevent ships from getting stuck in ice.
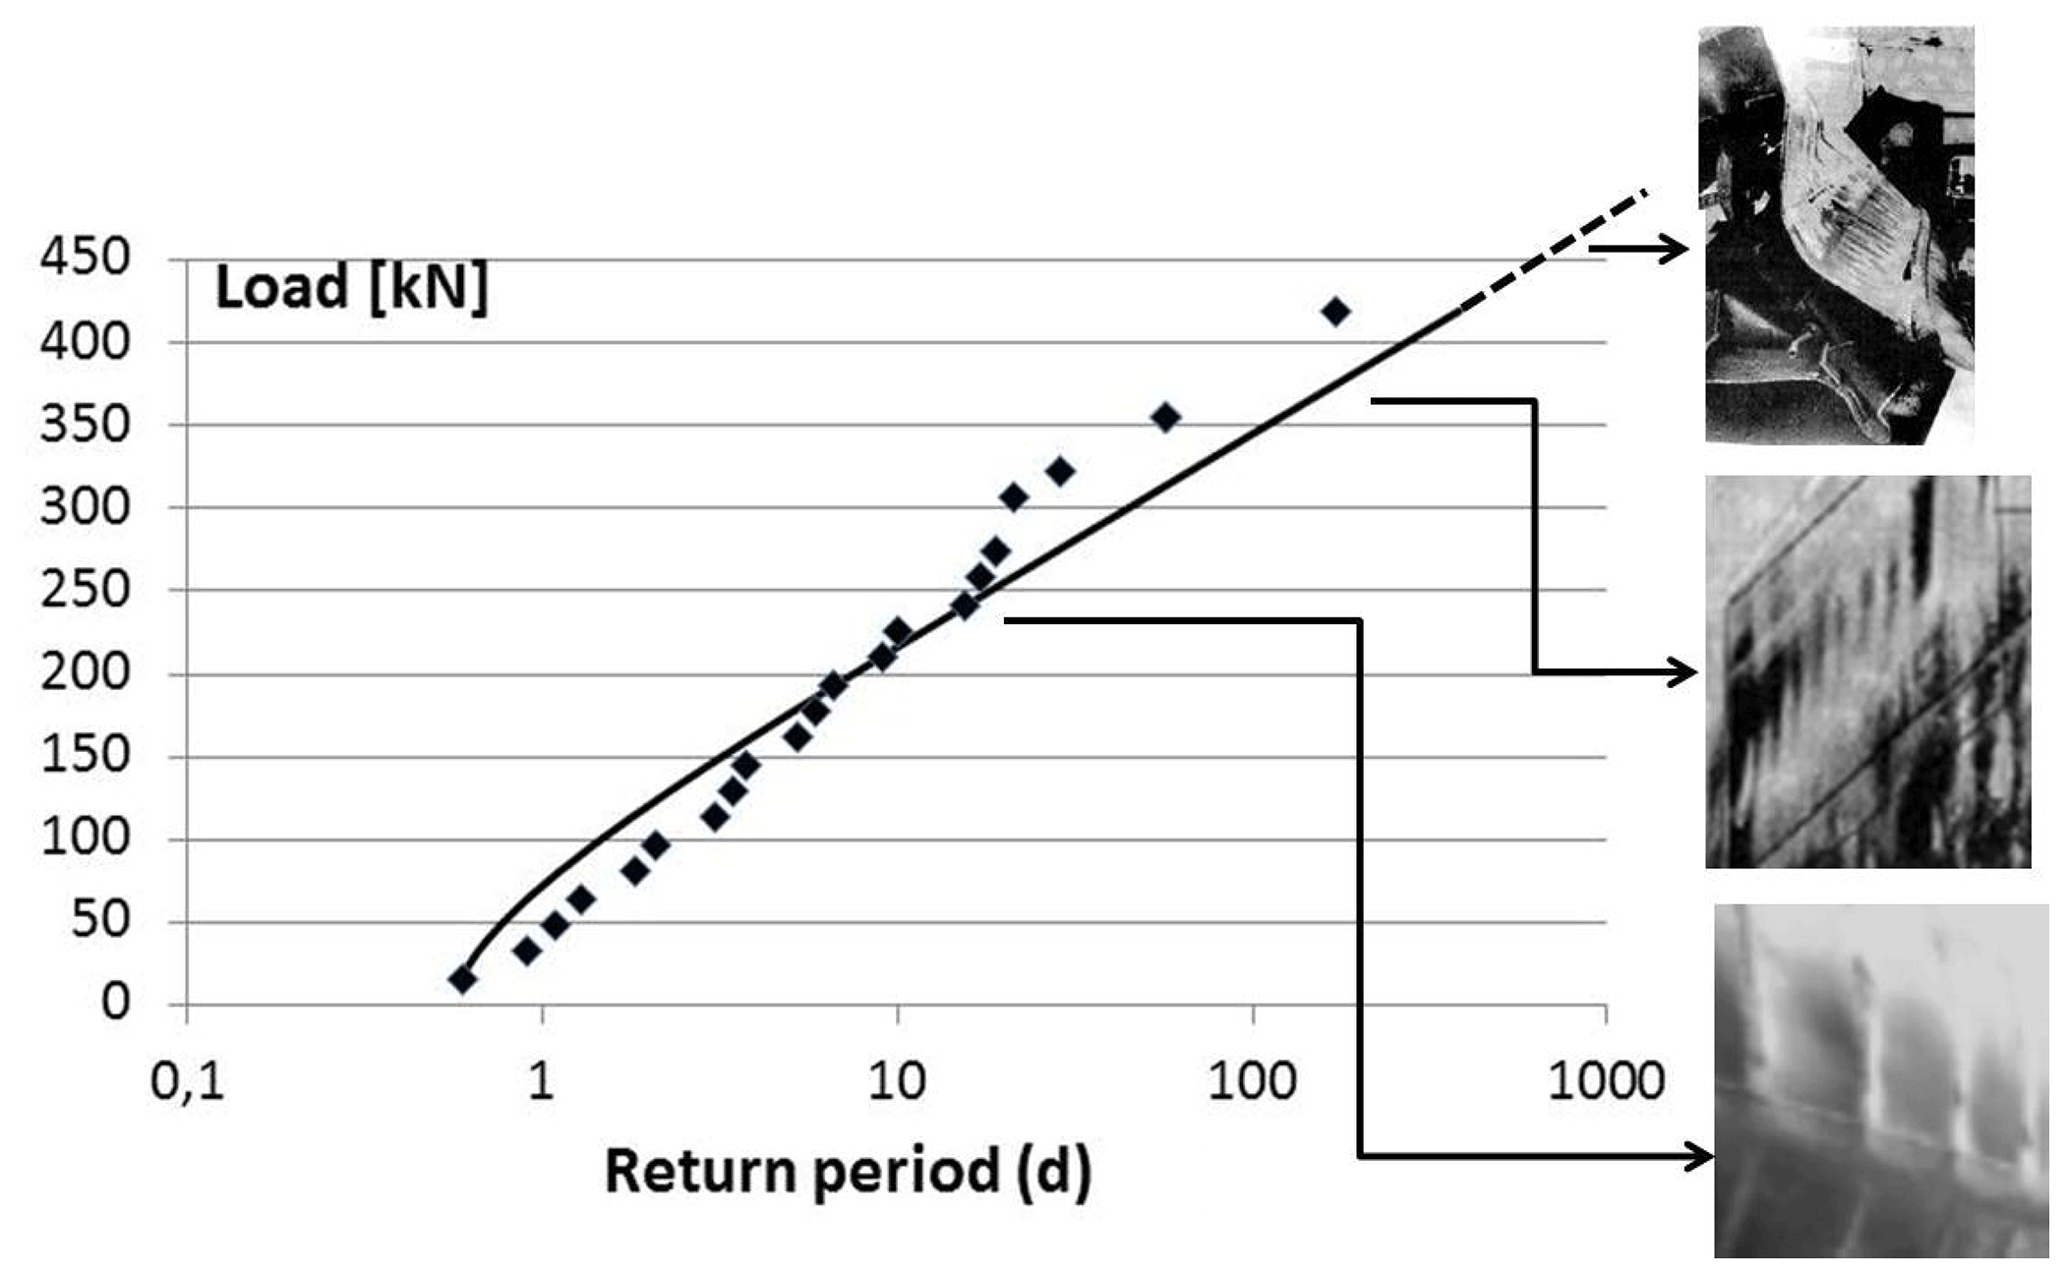
Figure 13Measured load on one frame at the bow of MS Kemira obtained during the 1985–1991 period (Kujala, 2017), also showing the possible effect of the increasing load on damage to the ship shell structures.
Increasing maritime traffic in areas where IB assistance is needed will increase the demand for such assistance. The workload of an IB in its operational area, at a specific time, is strongly dependent on the area-specific ice conditions and ship traffic. This leads to large area- and time-specific variations in the demand for IB assistance. Even under constant ice conditions, it is hard to estimate local demand for assistance solely from the estimated increase or decrease in local maritime traffic. There are a number of studies related to the development of transit simulation models for ships navigating in ice (e.g. Patey and Riska, 1999; Kamesaki et al., 1999; Montewka et al., 2015; Kuuliala et al., 2017 and Bergström et al., 2017). Typically, all of these models simulate the speed variation of a single ship when it is travelling in various ice conditions such as level ice, ridged ice, and ice channel. In addition, the real-time data from the vessels' automatic identification systems (AISs) have been used to study the convoy speed when IBs assist merchant ships (see Goerlandt et al., 2017). Monte Carlo random simulation can also be used to study the uncertainties and variations in ice conditions and in the calculation methods used to evaluate ship speed in various ice conditions (Bergström et al., 2017).
The newest development includes simulation tools built around a deterministic IB-movement model (Lindeberg et al., 2015, 2018). The new approach is that the simulation model also includes the decision principles of IBs to determine which ships will be assisted and when. The model also includes the possible assistance and towing principles of merchant ships behind an IB. The tool can be used for predicting local demand for IB assistance under changing ice and traffic conditions. It can also be used to predict how the traffic flow will react to changes in the IB operational areas of the modelled system by adding/removing IBs from the system and/or by modifying the boundaries of IB operational areas.
Typically, during a normal winter starting in December and ending in April, there are about 10 000 ship visits to ice-bound harbours in the Baltic Sea, and the traffic is assisted by five to nine IBs. The developed model can be used to study the effect of winter hardness on IB activities as well as waiting time for merchant vessels (Lindeberg et al., 2018). The new environmental requirements will cause a decrease in the engine power used by ships, which might mean that the need for IB assistance will increase. As studied by Lindeberg et al. (2018), the new so-called “energy efficiency design index” (EEDI) for ships will increase the merchant vessel waiting time by 100 % when 50 % of the new ships fulfil the EEDI requirements; thus, in the future, more IBs might be required to guarantee smooth marine traffic. EEDI is a new energy-efficient requirement that will decrease the engine power on typical merchant ships. The EEDI requires a minimum energy efficiency level per capacity mile (e.g. tonne mile) for different ship types and size segments, as established by the International Maritime Organization (IMO). Since 1 January 2013, following an initial 2-year phase-zero, new ship designs need to meet the reference level for their ship type.
The model can also be used to study the effect of winter hardness on the amount of IB assistance needed. For example, during the hard winter of 2010–2011, the total number of IBs assisting was nine with the total amount of assisting miles equal to 77 056 nmi, and during the mild winter of 2016–2017, it was eight IBs and 29 502 nmi assisted.
In addition to ice conditions, maritime shipping in the Baltic Sea is affected by wind and wave conditions and icing due to sea spray. Although the mean wind and wave conditions are relatively low in the Baltic Sea, some of the high-wind events and especially the severest storms affect the maritime traffic (see Sect. 2.2.10 for extreme wave events). In the severest storms, smaller vessels need to find shelter or alternative routes, and large vessels need to reduce speed or increase engine power. Increasing the vessels' engine power during these events will also increase the ship emissions (Jalkanen et al., 2009). Furthermore, getting safely in and out of harbours is an issue during high-wind and high-wave events.
In the changing climate, ice winters are estimated to get shorter and the ice extent smaller (Sect. 2.2.6). In the present climate, the time of the year that has ice cover partly coincides with the windiest time of the year. This means that the wave climate in Bothnian Bay and the eastern part of the Gulf of Finland, where there is still ice every winter in the present climate, is estimated to get more severe, and this can cause increasing dynamics of the ice, making navigation in ice more demanding.
However, the occurrence of extreme wave events is not only dependent on changes in the ice conditions but also on changes in the wind conditions. Moreover, the Baltic Sea sub-basins are relatively small and high-wind events are often fetch-limited; thus, the wind direction plays a large role in the generation of the high-wave events. As the frequency of strong westerly winds is projected to increase (see Sect. 2.2.1), this will most likely lead to an increase in high-wave conditions from this sector.
Icing due to sea spray causes problems for maritime traffic in the Baltic Sea. In a future climate, this can happen more often as the ice winters get milder and the sea is open during the time of the year when sea surface temperatures are close to the freezing point; therefore, the probability of getting freezing water on the ship deck will potentially increase.
As extreme events are, by definition, rare, long time series of data and/or large-ensemble model simulations with high spatial coverage are a necessity for a full understanding of return periods and for mapping expected changes in intensities of extreme events. When also adding the impact of climate change and to some extent an unknown response of the climate system to partly unknown changes in forcing, the uncertainty increases further, especially locally. This is particularly true for compound events (i.e. the interaction of multiple hazard drivers) and freak events (i.e. events that have very low probabilities but which can potentially have disastrous impacts). These kinds of events are largely unexplored in the scientific literature.
As previously discussed, many extreme events in the Baltic Sea region are related to the large-scale atmospheric dynamics, including storms originating from the North Atlantic region. Knowledge gaps concerning the response of large-scale atmospheric circulation in a warming climate include the dynamic response of reduced Arctic sea ice and changing oceanic conditions as well as the possibility of changes in the jet stream patterns and/or changing blocking frequencies over Europe.
Besides storms that are related to extratropical cyclones, strong winds can also be induced by extreme convective weather, including downbursts, tornadoes, detached thunderclouds, derechos, and other mesoscale convective systems (Rauhala et al., 2012; Punkka, 2015). Furthermore, wind gusts driven by convective downdraughts or turbulent mixing can also occur during larger-scale windstorms (Laurila et al., 2020). Other severe small-scale extreme events include, for example, meteo-tsunamis, long waves created by air–sea interaction occurring in shallow seas during warm summers, which are amplified when arriving at the coasts and can reach several metres (Pellikka et al., 2020). All of these phenomena may be harmful to infrastructure, with the severity of the impacts depending on the intensity and location of occurrence of the events. New convection-permitting climate models with grid spacing of a few kilometres (Sect. 2.2.7), as well as an increasing observation density owing to the use of weather radars, satellites, and lightning-location sensors, open new possibilities to assess their probabilities of occurrence in the recent past and in the projected future climate.
A local characteristic is the uncertainty in local responses to large-scale variability and global change. One particular feature is soil water response to heat waves, as well as features such as changes in the frequency of major Baltic inflows (Lehman et al., 2021; Meier et al., 2021). In the Baltic Sea region, the state of the cryosphere has already changed remarkably. Past mean changes in frost, snow, icing, lake, and sea ice conditions have been rather well estimated by regional models, but their future variability and change, ranging from synoptic to centennial timescales, are uncertain. Moreover, the impact of extreme cryosphere changes on forestry, reindeer herding, spring floods, extreme wave heights, and shipping is largely unknown. Concerning flood assessments, the majority of the studies are devoted to high flood extremes. The low-flow periods are less well described due to the absence of remarkable changes in flow regime, especially in northern Europe because of the large model uncertainty in precipitation during the summer (or the warm period) when low flow usually occurs.
The prolongation of the growing season of phytoplankton is identified, but it may not be caused solely by a simple direct influence of increased radiation and temperature. The temperature may also act via stronger stratification, shifts in grazing pressure, infections, or other factors which still have to be identified in detail. Earlier phytoplankton spring blooms, a longer summer minimum, and a later autumn bloom may have decisive impacts on the food web and need to be investigated. The first major marine heat wave recorded occurred in the Baltic Sea in 2018. Further research is needed to estimate the probability of marine heat waves in the future but also to deepen our understanding about how biogeochemical processes are altered under those conditions.
The simulation of storm tracks and their associated precipitation generally improves with increasing resolution beyond that used in most current climate models (Michaelis et al., 2017; Barcikowska et al., 2018). Higher resolution results in more sensitivity to warming (Willison et al., 2015). Understanding of high-intensity extremes requires improved reanalysis products and carefully homogenized long time series data as well as higher-resolution climate models. Here, the better use of new tools might lead to an increased understanding. The new tools include remote sensing data and new types of in situ or remote sensor systems in combination with traditional observational networks. Combining new data with higher-resolution models as well as new methodologies (e.g. machine learning and neural networks) has great potential.
The following aspects are the most important to address in future research:
-
coupled high-resolution process and Earth system models for detailed understanding of extremes and feedback mechanisms between different processes (see also Gröger et al., 2021);
-
addressing natural variability by assessing long-term observational time series and large samples of simulated states of the climate system;
-
further development of statistical methods (including machine learning) for improved understanding of risks and return periods of rare events, including compound and freak events;
-
increase process-level understanding of the impact of the physical extremes on biogeochemical cycles and fluxes such as an enhanced flux of matter from land to sea during extreme mild and wet winters or enhanced greenhouse emissions from sea bottom to atmosphere during marine heat wave events;
-
interaction of multiple hazard drivers, as compound events are potentially very damaging for society;
-
further quantification of economic costs of extreme events as well as impacts on health, ecosystem, and environment;
-
dynamics of the larger scale, in particular addressing regional and local responses. While the local effects of large-scale circulation changes are reasonably understood, it is not clear which factors control or change the dynamics of the larger scale itself. This is particularly true for changes in velocity and meandering of the jet stream and effects on blocking frequencies.
In this review, we have focused on extreme events and natural hazards in the Baltic Sea region. The temporal and spatial scales of the events that are causing these hazards range over many orders of magnitude. Typical short-term phenomena are dynamical events such as storms or heavy precipitation that are causing severe economic and human losses regionally and locally. In contrast, heat waves and cold spells are gradually developing events that prevail for weeks to months. Their impact on society and nature can cover the entire Baltic Sea catchment region.
In Fig. 14, we summarize how the hazards are related to the atmospheric, oceanic, and hydrological conditions. The weather in the Baltic Sea region is largely determined by the state of the large-scale atmospheric circulation. In winter, the variability is largely governed by the NAO, with dominating strong westerlies and cyclones in its positive phase while more stable continental weather dominates in its negative phase. Moreover, in summer there are large differences between more cyclone-dominated weather with relatively mild air from the Atlantic and blocking-dominated weather with high-pressure systems and warm continental air. Large-scale atmospheric circulation is the main source of inter-annual variability of seasons, and the extreme states are manifested in, for example, the extent of the seasonal ice cover.

Figure 14Simplified diagram to illustrate the relationship between atmospheric, hydrological, and marine processes as well as their impact on society in winter and summer.
Table 1A selected event and the estimated frequency of occurrence. The scale for changes is as follows: major decrease, minor decrease, no change, minor increase, and major increase. The confidence scale is displayed as follows: low – italic, medium – roman font, and high – bold font.
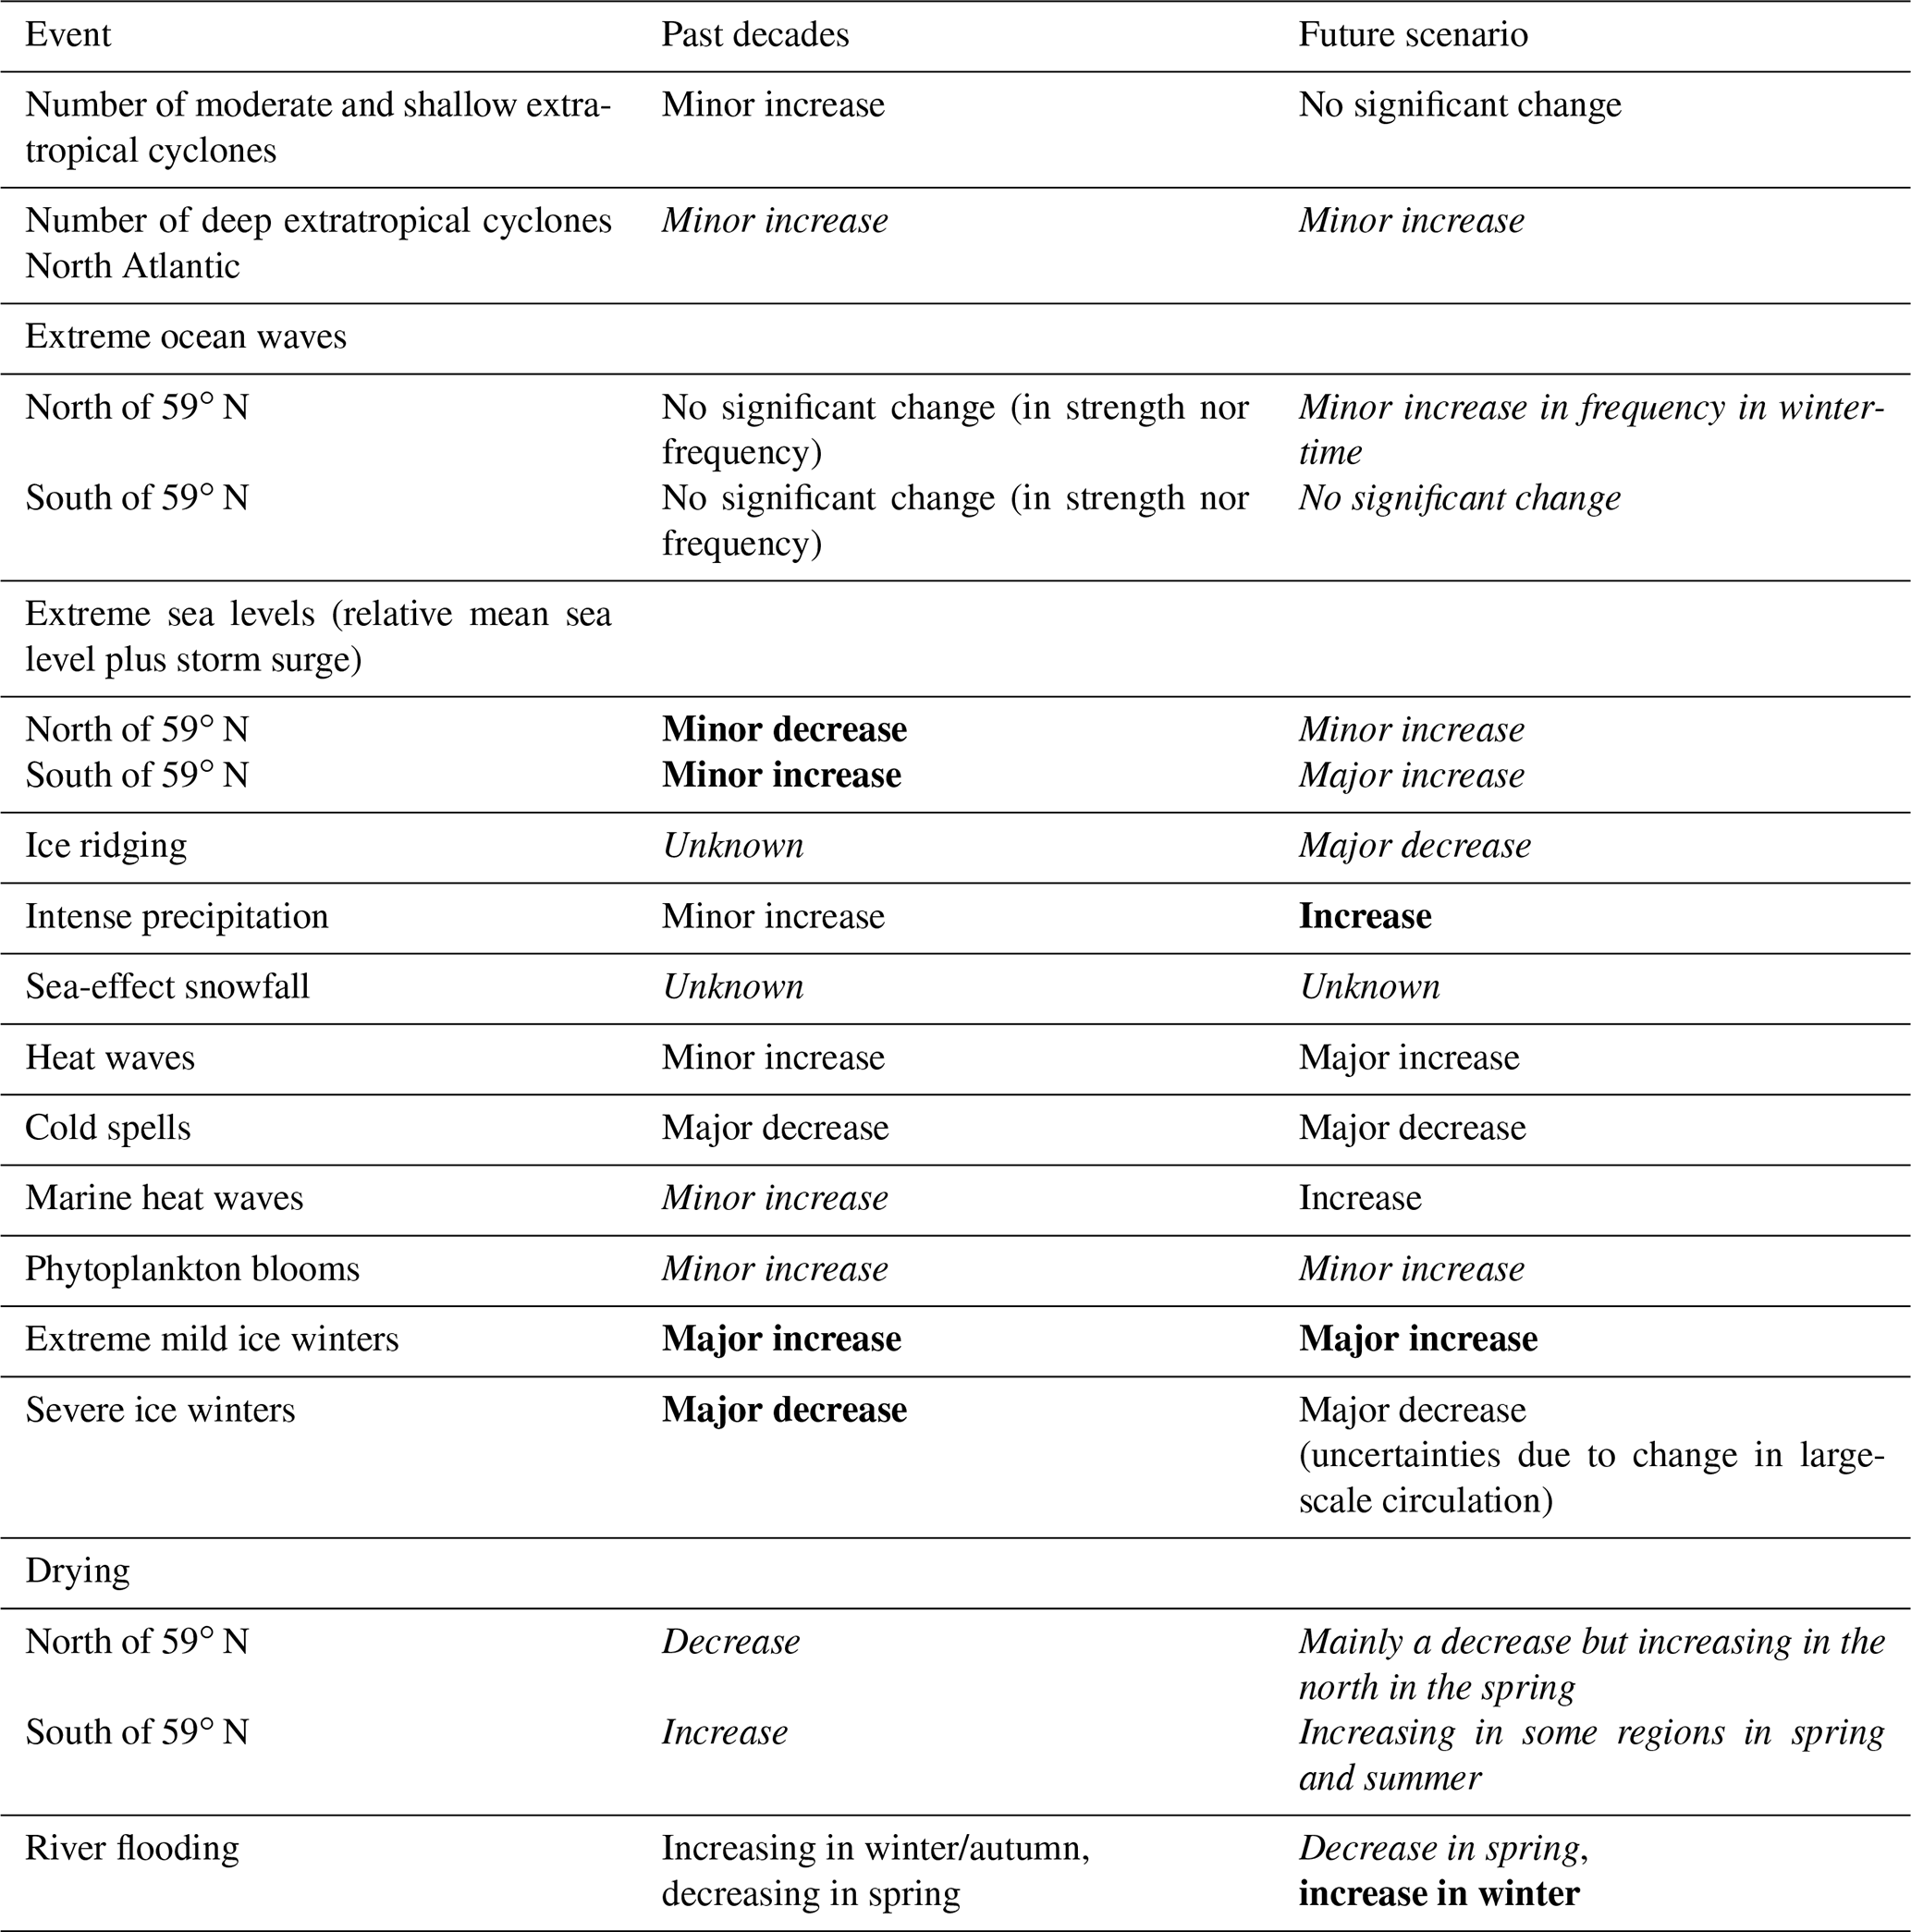
Regional atmospheric events, cyclones, and blocking directly cause storm damage or trigger heat waves and forest fires respectively. Cyclones also generate storm surges and hazardous coastal flooding and ocean waves. Summertime blocking situations frequently cause heat waves, while they are connected to cold spells in winter. For long-lasting situations, the impacts of blocking are not restricted to land, as marine heat waves are also generated and, consequently, massive algal blooms are formed, as in 2018.
An important aspect is that the most hazardous events are often combinations of several factors (i.e. compound events). For example, every cyclone can generate a storm surge, but the level of coastal flooding depends on the total water volume in the Baltic Sea. Positive water volume, which is caused by persistent westerlies, can provide an additional 50 cm (Leppäranta and Myrberg, 2009) to the maximum sea level. Moreover, a single storm always causes a seiche oscillation, and a sequence of storms can produce combined sea level changes due to the storm surge and seiche oscillation. In cities located at a river mouth, a sea flood can be further amplified by the river flood.
Trends in circulation patterns are difficult to detect; the long-term temporal behaviour of NAO is essentially irregular. There is, however, weak evidence that the stationary wave amplitude has increased over the North Atlantic region, possibly as a result of weakening and/or a north-eastward shift of the North Atlantic storm track. There is an upward trend in the number of shallow and moderate cyclones, whereas there is no clear change, although there is possibly a small decrease, in the number of deep cyclones during the past decades. Sea level extremes are expected to increase in a changing climate and are directly related to changes in the mean sea level, wind climate, storm tracks, and circulation patterns.
European summers have become warmer over the last 3 decades, which can be partly explained by changes in blocking patterns (see Sect. 2.1). There is a clear link between warmer summers and an increased risk of drying (particularly in spring) and heat waves in most of the area. Floods have decreased in a large part of the Baltic Sea in spring, but streamflow has increased in winter and autumn during the last decades while the mean flow has shown insignificant changes. Stronger precipitation extremes associated with a warmer climate can have strong impacts on society, particularly in urban regions, and are strongly associated with flooding and more intense cloudbursts. Results from new, high-resolution convection-permitting climate models indicate that increases in heavy rainfall associated with cloudbursts may increase even more than has previously been found in coarser-scale regional climate models.
Sea-effect snowfall events can be a serious threat to the coastal infrastructure and should also be considered in the future, although likely with an overall lower risk on an annual basis. More research is still needed to deepen the understanding of sea-effect snowfall and to develop a reliable way to assess the occurrence of such events under changing conditions. Another wintertime phenomenon of potentially hazardous consequences is ice ridging, as it is one of the sea ice extremes with the greatest impact potential on coastal infrastructure and shipping.
Phytoplankton blooms are extreme but natural biological events. However, eutrophication/de-eutrophication, pollution, and changes in irradiation, temperature, salinity, and carbon dioxide, among other things, may change their magnitude, timing, and composition. Examples of extreme and mostly potentially toxic blooms are given but reasons for these blooms can hardly be identified. Their sudden and sporadic appearance complicates trend analyses and modelling. One trend that seems to be prominent is the prolongation of the phytoplankton growing season. Climate change is the most probable reason for this.
Table 1 summarizes the changes in some extreme events over the past decades and, using scenarios, for the upcoming decades. Here, a positive trend means increasing probability of occurrence and a negative trend means a decreasing probability of occurrence.
For the selected societal elements discussed here, a combination of extremes and their changes are controlling the development and potential future damage, in addition to numerous other factors. For forest fires, drought, and heat waves, the risk might double during the present century in some areas; however, in other areas, the risk might decrease due to increased precipitation. The frequency of coastal flooding responds mainly to sea level but also to wind, wave, and precipitation features. The number of people exposed to coastal flooding in terms of annual damage is expected to increase by orders of magnitude. Baltic coastal cities are expected to be the main source of future coastal flood losses. The offshore wind energy sector responds mainly to extreme wind and wave conditions. Here, loads and damage are important, but conditions for operation and management activities imposing limitations on the potential use of this offshore technology are also of interest. Shipping in the Baltic Sea is affected by wind and wave conditions, icing due to sea spray, and ice conditions; although mean wind and wave conditions are relatively low, the most severe storms affect maritime traffic. As ice winters are projected to get shorter, the wave climate is expected to get more severe (particularly in the eastern part of Bothnian Bay and the Gulf of Finland).
ECA&D data and FMI intranet radar service data were utilized in this work.
The review was organized by a team (AR, EK, JH, and MS) lead by AR. All authors contributed to the general text and conclusions. Different authors were responsible for different sections: AR drafted the introduction, knowledge gaps, and conclusions; MS chaired the sections on circulation patterns and wind storms; JS was responsible for the section on sea level; KJ contributed the section on warm and cold spells; ID drafted the sections on drought and river floods; JH compiled the sections on marine heat waves, sea ice seasons, and ice ridging; the section on precipitation was chaired by EK; TO, AL, and KJ were responsible for the section on sea effect snowfall; EN contributed the section on extreme waves; NW was responsible for the section on phytoplankton blooms; IL contributed the section on forest fires; MD and KH wrote the section on coastal flooding; XGL drafted the section on offshore wind energy; and LT and PK compiled the section on shipping.
The contact author has declared that neither they nor their co-authors have any competing interests.
Publisher's note: Copernicus Publications remains neutral with regard to jurisdictional claims in published maps and institutional affiliations.
This article is part of the special issue “The Baltic Earth Assessment Reports (BEAR)”. It is not associated with a conference.
Ole Bøssing Christensen is acknowledged for providing material for Fig. 6.
The contributions of Jari Haapala, Laura Tuomi, and Jani Särkkä have been supported by the Strategic Research Council at the Academy of Finland (SmartSea project; grant no. 292 985). Anna Rutgersson and Erik Nilsson have been supported by FORMAS (grant no. 2018-01784). Xiaoli Guo-Larsen has been supported by the Danish ForskEL/EUDP OffshoreWake project (grant no. PSO-5012521/64017-0017). Irina Danilovich's studies were conducted as part of the “The Nature Resources and Ecological Safety” sub-programme within the framework of the “The Nature Management and Ecology” state research programme during 2016–2020. The contributions of Taru Olsson and Anna Luomaranta have been supported by the National Nuclear Waste Management Fund in Finland, Kirsti Jylhä has been supported by the Academy of Finland HEATCLIM project (grant no. 329307), and Taru Olsson has been supported by the Finnish Cultural Foundation (Satakunta Regional Fund).
This paper was edited by Ira Didenkulova and reviewed by two anonymous referees.
Aakala, T., Pasanen, L., Helama, S., Vakkari, V., Drobyshev, I., Seppä, H., Kuuluvainen, T., Stivrins, N., Wallenius, T., Vasander, H., and Holmström, L.: Multiscale variation in drought controlled historical forest fire activity in the boreal forests of eastern Fennoscandia, Ecol. Monogr., 88, 74–91, 2018.
Aalto, J., Pirinen, P., and Jylhä, K.: New gridded daily climatology of Finland: permutation-based uncertainty estimates and temporal trends in climate, J. Geophys. Res.-Atmos., 121, 3807–3823, https://doi.org/10.1002/2015JD024651, 2016.
Aarnes, O. J., Breivik, Ø., and Reistad, M.: Wave extremes in the northeast Atlantic, J. Climate, 25, 1529–1543, https://doi.org/10.1175/jcli-d-11-00132.1, 2012.
Abadie, L. M., Sainz de Murieta, E., and Galarraga, I.: Climate risk assessment under uncertainty: an application to main European coastal cities, Frontiers in Marine Science, 3, 265, https://doi.org/10.3389/fmars.2016.00265, 2016.
Abadie, L. M., Galarraga, I., Markandya, A., and Sainz de Murieta, E.: Risk measures and the distribution of damage curves for 600 European coastal cities, Environ. Res. Lett., 14, 064021, https://doi.org/10.1088/1748-9326/ab185c, 2019.
Abild, J. and Nielsen, B.: Extreme values of wind speeds in Denmark, Technical Report M-2842, Risø National Laboratory, Roskilde, Denmark, 1991.
Alfieri, L., Burek, P., Feyen, L., and Forzieri, G.: Global warming increases the frequency of river floods in Europe, Hydrol. Earth Syst. Sci., 19, 2247–2260, https://doi.org/10.5194/hess-19-2247-2015, 2015.
Andersen, J. H., Carstensen, J., Conley, D. J., Dromph, K., Fleming-Lehtinen, V., Gustafsson, B. G., Josefson, A. B., Norokko, A., Villnäs, A., and Murray, C.: Long-term temporal and spatial trends in eutrophication status of the Baltic Sea, Biol. Rev., 92, 135–149, https://doi.org/10.1111/brv.12221, 2017.
Andersson, T. and Nilsson, S.: Topographically induced convective snowbands over the Baltic Sea and their precipitation distribution, Weather Forecast., 5, 299–312, 1990.
Apsīte, E., Bakute, A., Elferts, D., Kurpniece, L., and Pallo, I.: Climate change impacts on river runoff in Latvia, Clim. Res., 48, 57–71, 2011.
Arheimer, B. and Lindström, G.: Climate impact on floods: changes in high flows in Sweden in the past and the future (1911–2100), Hydrol. Earth Syst. Sci., 19, 771–784, https://doi.org/10.5194/hess-19-771-2015, 2015.
Åström, D. O., Tornevi, A., Ebi, K. L., Rocklöv, J., and Forsberg, B.: Evolution of minimum mortality temperature in Stockholm, Sweden, 1901–2009, Environ. Health Persp., 124, 740–744, https://doi.org/10.1289/ehp.1509692, 2016.
BACC Author Team:. Assessment of Climate Change for the Baltic Sea Basin, Springer, Berlin, Heidelberg, 474 pp., 2008.
BACC Author Team: Second Assessment of Climate Change for the Baltic Sea Basin, Springer, Cham, 501 pp., https://doi.org/10.1007/978-3-319-16006-1, 2015.
Backman, L., Aalto, T., Lehtonen, I., Thölix, L., Vanha-Majamaa, I., and Venäläinen, A.: Climate change increases the risk of forest fires, in: Climate Change and Forest Management Affect Forest Fire Risk in Fennoscandia, edited by: Aalto, J. and Venäläinen, A., Finnish Meteorological Institute Reports 2021:3, Finnish Meteorological Institute, Helsinki, 66–91, 2021.
Baker-Austin, C., Trinanes, J. A., Salmenlinna, S., Löfdahl, M., Siitonen, A., Taylor, N. G., and Martinez-Urtaza, J.: Heat wave-associated vibriosis, Sweden and Finland, 2014, Emerg. Infect. Dis., 22, 1216–1220, https://doi.org/10.3201/eid2207.151996, 2016.
Barcikowska, M. J., Weaver, S. J., Feser, F., Russo, S., Schenk, F., Stone, D. A., Wehner, M. F., and Zahn, M.: Euro-Atlantic winter storminess and precipitation extremes under 1.5 ∘C vs. 2 ∘C warming scenarios, Earth Syst. Dynam., 9, 679–699, https://doi.org/10.5194/esd-9-679-2018, 2018.
Barnes, E. A.: Revisiting the evidence linking Arctic amplification to extreme weather in midlatitudes, Geophys. Res. Lett., 40, 1–6, https://doi.org/10.1002/grl.50880, 2013.
Bastine, D., Larsén, X. G., Witha, B., Dörenkämper, M., and Gottschall, J.: Extreme winds in the New European Wind Atlas, J. Phys. Conf. Ser., 1102, 012006, https://doi.org/10.1088/1742-6596/1102/1/012006, 2018.
Beldring, S., Engen-Skaugen, T., Forland, E. J., and Roald, L. A.: Climate change impacts on hydrological processes in Norway based on two methods for transferring regional climate model results to meteorological station sites, Tellus A, 60, 439–450, 2008.
Belusic, D., Berg, P., Bozhinova, D., Bärring, L., Döscher, R., Eronn, A., Kjellström, E., Klehmet, K., Martins, H., Nilsson, C., Olsson, J., Photiadou, C., Segersson, D., and Strandberg, G.: Climate Extremes for Sweden, edited by: Döscher, R., SMHI, https://doi.org/10.17200/Climate_Extremes_Sweden, 2019.
Belušić, D., de Vries, H., Dobler, A., Landgren, O., Lind, P., Lindstedt, D., Pedersen, R. A., Sánchez-Perrino, J. C., Toivonen, E., van Ulft, B., Wang, F., Andrae, U., Batrak, Y., Kjellström, E., Lenderink, G., Nikulin, G., Pietikäinen, J.-P., Rodríguez-Camino, E., Samuelsson, P., van Meijgaard, E., and Wu, M.: HCLIM38: a flexible regional climate model applicable for different climate zones from coarse to convection-permitting scales, Geosci. Model Dev., 13, 1311–1333, https://doi.org/10.5194/gmd-13-1311-2020, 2020.
Benestad, R. E.: How often can we expect a record event? Clim. Res., 25, 3–13, 2003.
Benestad, R. E.: Can we expect more extreme precipitation on the monthly time scale? J. Climate, 19, 630–637, 2006.
Benestad, R. E., Hanssen-Bauer, I., and Førland, E. J.: An evaluation of statistical models for downscaling precipitation and their ability to capture long-term trends, Int. J. Climatol., 27, 649–665, 2007.
Bengtsson, L.: The global atmospheric water cycle, Environ. Res. Lett., 5, 025002, https://doi.org/10.1088/1748-9326/5/2/025002, 2010.
Berezowski, T., Szcześniak, M., Kardel, I., Michałowski, R., Okruszko, T., Mezghani, A., and Piniewski, M.: CPLFD-GDPT5: High-resolution gridded daily precipitation and temperature data set for two largest Polish river basins, Earth Syst. Sci. Data, 8, 127–139, https://doi.org/10.5194/essd-8-127-2016, 2016.
Berg, P., Norin, L., and Olsson, J.: Creation of a high resolution precipitation data set by merging gridded gauge data and radar observations for Sweden, J. Hydrol., 541, 6–13, https://doi.org/10.1016/j.jhydrol.2015.11.031, 2016.
Bergström, H.: Distribution of extreme wind speed, Wind Energy Report WE 92:2, Technical report, Department of Meteorology, Uppsala University, Sweden, 1992.
Bergström, H. and Söderberg, S.: Wind Mapping of Sweden, Elforsk Report 09:04, 2008, available at: http://space.hgo.se/wpcvi/wp-content/uploads/import/pdf/Kunskapsdatabas vindresurser/Vindmatning/09_04_rapport.pdf (last access: 17 December 2021), 2018.
Bergström, M., Erikstad. S., and Ehlers, S.: The influence of model fidelity and uncertainties in the conceptual design of Arctic maritime transport systems, Ship Technology Research, Schiffstechnik, 64, 40–64, 2017.
Bevacqua, E., Maraun, D., Vousdoukas, M. I., Voukouvalas, E., Vrac, M., Mentaschi, L., and Widmann, M.: Higher potential compound flood risk in Northern Europe under anthropogenic climate change, Science Advances, 18, 5, eaaw5531, https://doi.org/10.1126/sciadv.aaw5531, 2019.
Björkqvist, J.-V., Lukas, I., Alari, V., van Vledder, G. P., Hulst, S., Pettersson, H., Behrens, A., and Männik, A.: Comparing a 41-year model hindcast with decades of wave measurements from the Baltic Sea, Ocean Eng., 152, 57–71, https://doi.org/10.1016/j.oceaneng.2018.01.048, 2018.
Blackport, R. and Screen, J. A.: Insignificant effect of Arctic amplification on the amplitude of midlatitude atmospheric waves, Science Advances, 6, eaay2880, https://doi.org/10.1126/sciadv.aay2880, 2020.
Blessing, S., Fraedrich, K., Junge, M., Kunz, T., and Linkheit, F.: Daily North Atlantic Oscillation (NAO) index: statistics and its stratospheric polar vortex dependence, Meteorol. Z, 14, 763–769, 2005.
Blöschl, G.,Hall, J.,Parajka, J., Perdigão, R. A. P., Merz, B., Arheimer, B., Aronica, G., T., Bilibashi, A., Bonacci, O., Borga, M., Čanjevac, I., Castellarin, A., Chirico, G., B., Claps, P., Fiala, K., Frolova, N., Gorbachova, L., Hannaford, A. G., Harrigan, S., Kireeva, M., Kiss, A., Kjeldsen, T. R., Kohnová, S., Koskela, J., Ledvinka, O., Macdonald, N., Mavrova-Guirguinova, M., Mediero, L., Merz, R., Molnar, P., Montanari, A., Murphy, C., Osuch, M., Ovcharuk, V., Radevski, I., Rogger, M., Salinas, J. L., Sauquet, E., Šraj, M., Szolgay, J., Viglione, A., Volpi, E., Wilson, D., Zaimi, K., and Živković, N.: Changing climate shifts timing of European floods, Science, 357, 588–590, 2017.
Bogdanov, V. I. and Malova, T. I.: On assessments of the height of the largest catastrophic flood that occurred in St. Petersburg in the Neva River mouth on November 7 (19), 1824, Dokl. Earth Sci., 424, 123–126, 2009.
Boland, E. J. D., Bracegirdle, J., and Shuckburgh, E. F.: Assessment of sea ice-atmosphere links in CMIP5 models, Clim. Dynam., 49, 683–702, https://doi.org/10.1007/s00382-016-3367-1, 2017.
Bondur, V. G.: Satellite monitoring of wildfires during the anomalous heat wave of 2010 in Russia, Izv. Atmos. Ocean. Phy., 47, 1039–1048, https://doi.org/10.1134/S0001433811090040, 2011.
Bordi, I., Fraedrich, K., and Sutera, A.: Observed drought and wetness trends in Europe: an update, Hydrol. Earth Syst. Sci., 13, 1519–1530, https://doi.org/10.5194/hess-13-1519-2009, 2009.
Bredesen, R. E., Cattin, R., Clausen, N., Davis, N., Jordaens, P., Khadiri-Yazami, Z., Klintström, R., Krenn, A., Lehtomäki, V., Ronsten, G., Wadham-Gagnon, M., and Wickman, H.: Wind Energy Projects in Cold Climates, IEA Wind TCP Recommended Practice 13, 2nd edn., Wind Energy in Cold Climates, International Energy Agency, available at: https://euagenda.eu/upload/publications/untitled-102011-ea.pdf (last access: 20 December 2021), 2017.
Broman, B., Hammarklint, T., Rannat, K., Soomere, T., and Valdmann, A.: Trends and extremes of wave fields in the north-eastern part of the Baltic Proper, Oceanologia, 48, 165–184, 2006.
Brown, S., Nicholls, R. J., Goodwin, P., Haigh, I. D., Lincke, D., Vafeidis, A. T., and Hinkel, J.: Quantifying land and people exposed to sea-level rise with no mitigation and 1.5 ∘C and 2.0 ∘C rise in global temperatures to year 2300, Earths Future, 6, 583–600, 2018.
Brulebois, E., Castel, T., Richard, Y., Chateau-Smith, C., and Amiotte-Suchet, P.: Hydrological response to an abrupt shift in surface air temperature over France in 1987/88, J. Hydrol., 531, 892–901, https://doi.org/10.1016/j.jhydrol.2015.10.026, 2015.
Brunner, L., Hegerl, G. C., and Steiner, A. K.: Connecting atmospheric blocking to European temperature extremes in spring, J. Climate, 30, 585–594, https://doi.org/10.1175/JCLI-D-16-0518.1, 2017.
Budikova, D.: Role of Arctic sea ice in global atmospheric circulation: a review, Global Planet. Change, 68, 149–163, 2009.
Cahynová, M. and Huth, R.: Atmospheric circulation influence on climatic trends in Europe: an analysis of circulation type classifications from the COST733 catalogue, Int. J. Climatol., 36, 2743–2760, https://doi.org/10.1002/joc.4003, 2014.
Cammalleri, C., Naumann, G., Mentaschi, L., Bisselink, B., Gelati, E., De Roo, A., and Feyen, L.: Diverging hydrological drought traits over Europe with global warming, Hydrol. Earth Syst. Sci., 24, 5919–5935, https://doi.org/10.5194/hess-24-5919-2020, 2020.
Cassou, C.: Intraseasonal interaction between the Madden–Julian Oscillation and the North Atlantic Oscillation, Nature, 455, 523–527, 2008.
Cattiaux, J. and Cassou, C.: Opposite CMIP3/CMIP5 trends in the wintertime northern annular mode explained by combined local sea ice and remote tropical influences, Geophys. Res. Lett., 40, 3682–3687, https://doi.org/10.1002/grl.50643, 2013.
Cattiaux, J., Vautard, R., Cassou, C., Yiou, P., Masson-Delmotte, V., and Codron, F.: Winter 2010 in Europe: a cold extreme in a warming climate, Geophys. Res. Lett., 37, L20704, https://doi.org/10.1029/2010GL044613, 2010.
Cavaleri, L., Benetazzo, A., Barbariol, F., Bidlot, J., and Janssen, P.: The Draupner event: the large wave and the emerging view, B. Am. Meteorol. Soc., 98, 729–735, https://doi.org/10.1175/BAMS-D-15-00300.1, 2017.
Cecchinato, M.: Boosting offshore wind energy in the Baltic Sea, in: WindEurope Taskforce Baltic, edited by: Puneda, I. and Fraile, D., WindEurope Taskforce Baltic, available at: https://windeurope.org/wp-content/uploads/files/about-wind/reports/WindEurope-Boosting-offshore-wind.pdf (last access: 20 December 2021), 2019.
Chang, E. K. M. and Yau, A. M. W.: Northern hemisphere winter storm track trends since 1959 derived from multiple reanalysis datasets, Clim. Dynam., 47, 1435–1454, https://doi.org/10.1007/s00382-015-2911-8, 2016.
Chang, E. K. M., Ma, C. G., Zheng, C., and Yau, A. M. W.: Observed and projected decrease in northern hemisphere extratropical cyclone activity in summer and its impacts on maximum temperature, Geophys. Res. Lett., 43, 2200–2208, https://doi.org/10.1002/2016GL068172, 2016.
Christensen, O. B. and Kjellström, E.: Projections for Temperature, Precipitation, Wind, and Snow in the Baltic Sea Region until 2100, in: Oxford Research Encyclopedia of Climate Science, Oxford University Press, 645 https://doi.org/10.1093/acrefore/9780190228620.013.695, 2018.
Christensen, O. B., Kjellström, E., Dieterich, C., Gröger, M., and Meier, H. E. M.: Atmospheric regional climate projections for the Baltic Sea Region until 2100, Earth Syst. Dynam. Discuss. [preprint], https://doi.org/10.5194/esd-2021-51, in review, 2021.
Christiansen, B., Alvarez-Castro, C., Christidis, N., Ciavarella, A., Colfescu, I., Cowan, T., Eden, J., Hauser, M., Hempelmann, N., Klehmet, K., Lott, F., Nangini, C., van Oldenborgh, G. J., Orth, R., Stott, P., Tett, S., Vautard, R., Wilcox, L., and Yiou, P.: Was the cold European winter of 2009/10 modified by anthropogenic climate change? An attribution study, J. Climate, 31, 3387–3410, https://doi.org/10.1175/JCLI-D-17-0589.1, 2018.
Ciasto, L. M., Li, C., Wettstein, J. J., and Kvamstø, N. G.: North Atlantic storm-track sensitivity to projected sea surface temperature: local versus remote influences, J. Climate, 29, 6973–6991, https://doi.org/10.1175/JCLI-D-15-0860.1, 2016.
Clausen, N.-E., Larsén, X. G., Pryor, S. C., and Drews, M.: Wind power, in: Climate Change and Energy System – Impacts, Risks and Adaptation in the Nordic and Baltic Countries, ISBN: 978-92-893-2190-7, Nordic Council of Ministers, Copenhagen, 2012.
Cloern, J. E., Abreu, P. C., Carstensen, J., Chauvaud, L., Elmgren, R., Grall, Greening, H., Johansson, J. O. R., Karhu, M., Sherwood, E. T., Xu, J., and Yin, K.: Human activities and climate variability drive fast-paced change across the world's estuarine-coastal ecosystems, Glob. Change Biol., 22, 513–529, https://doi.org/10.1111/gcb.13059, 2016.
Coles, S.: An Introduction to Statistical Modeling of Extreme Values, Springer, Heidelberg, Germany, 208 pp., 2001.
Compo, G. P., Whitaker, J. S., Sardeshmukh, P. D., Matsui, N., Allan, R. J., Yin, X., Gleason, B. E., Vose, R. S., Rutledge, G., Bessemoulin, P., Brönnimann, S., Brunet, M., Crouthamel, R. I., Grant, A. N., Groisman, P. Y., Jones, P. D., Kruk, M., Kruger, A. C., Marshall, G. J., Maugeri, M., Mok, H. Y., Nordli, Ø., Ross, T. F., Trigo, R. M., Wang, X. L., Woodruff, S. D, and Worley, S. J.: The twentieth century reanalysis project, Q. J. Roy. Meteor. Soc., 137, 1–28, 2011.
Cordeira, J. M. and Laird, N. F.: The influence of ice cover on two lake-effect snow events over Lake Erie, Mon. Weather Rev., 136, 2747–2763, https://doi.org/10.1175/2007MWR2310.1, 2008.
Cornes, R. C., van der Schrier, G., van den Besselaar, E. J. M., and Jones, P. D.: An ensemble version of the E-OBS temperature and precipitation data sets, J. Geophys. Res.-Atmos., 123, 9391–9409, https://doi.org/10.1029/2017JD028200, 2018.
Coumou, D., Lehmann, J., and Beckmann, J.: The weakening summer circulation in the northern hemisphere mid-latitudes, Science, 348, 324–327, https://doi.org/10.1126/science.1261768, 2015.
Cutululis, N. A., Litong-Palima, M., Sørensen, P. E., and Detlefsen, N.: Offshore variability in critical weather conditions in large-scale wind based Danish power system, in: 2013 IEEE Power and Energy Society General Meeting: Shaping the Future Energy Industry IEEE, 2013 IEEE Power and Energy Society General Meeting – Vancouver, Canada, 21–25 July 2013, 2013.
Dahlgren, P., Landelius, T., Kållberg, P., and Gollvik, S.: A high-resolution regional reanalysis for Europe. Part 1: Three-dimensional reanalysis with the regional HIgh-Resolution Limited-Area Model (HIRLAM), Q. J. Roy. Meteor. Soc., 142, 2119–2131, 2016.
Danco, J. F., DeAngelis, A. M., Raney, B. K., and Broccoli, A. J.: Effects of a warming climate on daily snowfall events in the northern hemisphere, J. Climate, 29, 6295–6318, https://doi.org/10.1175/JCLI-D-15-0687.1, 2016.
Dangendorf, S., Arns, A., Pinto, J. G., Ludwig, P., and Jensen, J.: The exceptional influence of storm “Xaver” on design water levels in the German Bight, Environ. Res. Lett., 11, 054001, https://doi.org/10.1088/1748-9326/11/5/054001, 2016.
Danilovich, I., Wrzesiński, D., and Nekrasova, L.: Impact of the North Atlantic Oscillation on river runoff in the Belarus part of the Baltic Sea basin, Hydrol. Res., 38, 413–423, 2007.
Danilovich, I., Zhuravlev, S., Kurochkina, L., and Groisman, P.: The past and future estimates of climate and streamflow changes in the Western Dvina River basin, Front. Earth Sci., 7, 204, https://doi.org/10.3389/feart.2019.00204, 2019.
Davini, P. and Cagnazzo, C.: On the misinterpretation of the North Atlantic Oscillation in CMIP5 models, Clim. Dynam., 43, 1497–1511, https://doi.org/10.1007/s00382-013-1970-y, 2014.
Davini, P. and d'Andrea, F.: Northern hemisphere atmospheric blocking representation in global climate models: twenty years of improvements? J. Climate, 29, 8823–8840, https://doi.org/10.1175/JCLI-D-16-0242.1, 2016.
Dee, D. P., Uppala, S. M., Simmons, A. J., Berrisford, P., Poli, P., Kobayashi, S., Andrae, U., Balmaseda, M. A., Balsamo, G., Bauer, P., Bechtold, P., Beljaars, A. C. M., van de Berg, L., Bidlot, J., Bormann, N., Delsol, C., Dragani, R., Fuentes, M., Geer, A. J., Haimberger, L., Healy, S. B., Hersbach, H., Holm, E. V., Isaksen, L., Kallberg, P., Kohler, M., Matricardi, M., McNally, A. P., Monge-Sanz, B. M., Morcrette, J.-J., Park, B.-K., Peubey, C., de Rosnay, P., Tavolato, C., Thepaut, J.-N., and Vitart, F.: The ERA-Interim reanalysis: configuration and performance of the data assimilation system, Q. J. Roy. Meteor. Soc., 137, 553–597, https://doi.org/10.1002/qj.828, 2011.
Déqué, M., Rowell, D. P., Lüthi, D., Giorgi, F., Christensen, J. H., Rockel, B., Jacob, D., Kjellström, E., de Castro, M., and van den Hurk, B.: An intercomparison of regional climate simulations for Europe: assessing uncertainties in model projections, Climatic Change, 81, 53–70, https://doi.org/10.1007/s10584-006-9228-x, 2007.
Deser, C., Hurrell, J. W., and Phillips, A. S.: The role of the North Atlantic Oscillation in European climate projections, Clim. Dynam., 49, 3141–3157, https://doi.org/10.1007/s00382-016-3502-z, 2017.
Dethloff, K., Rinke, A., Benkel, A., Køltzow, M., Sokolova, E., Kumar Saha, S., Handorf, D., Dorn, W., Rockel, B., von Storch, H., Haugen, J. E., Røed, L. P., Roeckner, E., Christensen, J. H., and Stendel, M.: A dynamical link between the Arctic and the global climate system, Geophys. Res. Lett., 33, L03703, https://doi.org/10.1029/2005GL025245, 2006.
Diamond, K. E.: Extreme weather impacts on offshore wind turbines: lessons learned, American Bar Association Section of Environment, Natural Resources and Environment, 27, 39–41, 2012.
Ditas, J., Ma, N., Zhang, Y., Assmann, D., Neumaier, M., Riede, H., Karu, E., Williams, J., Scharffe, D., Wang, Q., Saturno, J., Schwarz, J. P., Katich, J. M., McMeeking, G. R., Zahn, A., Hermann, M., Brenninkmeijer, C. A. M., Andreae, M. O., Pöschl, U., Su, H., and Cheng, Y.: Strong impacts of wildfires on the abundance and aging of black carbon in the lowermost stratosphere, P. Natl. Acad. Sci. USA, 115, E11595–E11603, 2018.
Donat, M. G., Alexander, L. V., Herold, N., and Dittus, A. J.: Temperature and precipitation extremes in century-long gridded observations, reanalyses, and atmospheric model simulations, J. Geophys. Res.-Atmos., 121, 11174–11189, https://doi.org/10.1002/2016JD025480, 2016.
Dong, B., Sutton, R. T., and Shaffrey, L.: Understanding the rapid summer warming and changes in temperature extremes since the mid-1990s over Western Europe, Clim. Dynam., 48, 1537–1554, https://doi.org/10.1007/s00382-016-3158-8, 2017.
Donnelly, C., Greuell, W., Andersson, J., Gerten, D., Pisacane, G., Roudier, P., and Ludwig, F.: Impacts of climate change on European hydrology at 1.5, 2 and 3 degrees mean global warming above preindustrial level, Climatic Change, 143, 13–26, 2017.
Dosio, A.: Projections of climate change indices of temperature and precipitation from an ensemble of bias-adjusted high-resolution EURO-CORDEX regional climate models, J. Geophys. Res.-Atmos., 121, 5488–5511, https://doi.org/10.1002/2015JD024411, 2016.
Douville, H. and Plazzotta, M.: Midlatitude summer drying: an underestimated threat in CMIP5 models? Geophys. Res. Lett., 44, 9967–9975, https://doi.org/10.1002/2017GL075353, 2017.
Douville, H., Colin, J., Krug. E., Cattiaux. J., and Thao, S.: Midlatitude daily summer temperatures reshaped by soil moisture under climate change, Geophys. Res. Lett., 43, 812–818, https://doi.org/10.1002/2015GL066222, 2016.
Dreier, N., Schlamkow, C., Fröhle, P., Salecker, D., and Xu, Z.: Assessment of changes of extreme wave conditions at the German Baltic Sea coast in the basis of future climate change scenarios, J. Mar. Sci. Technol., 23, 839–845, https://doi.org/10.6119/JMST-015-0609-3, 2015.
Drobyshev, I., Granström, A., Linderholm, H. W., Hellberg, E., Bergeron, Y., and Niklasson, M.: Multi-century reconstruction of fire activity in Northern European boreal forest suggests differences in regional fire regimes and their sensitivity to climate, J. Ecol., 102, 738–748, 2014.
Drobyshev, I., Bergeron, Y., de Vernal, A., Moberg, A., Ali, A. A., and Niklasson, M.: Atlantic SSTs control regime shifts in forest fire activity of northern Scandinavia, Sci. Rep.-UK, 6, 22532, https://doi.org/10.1038/srep22532, 2016.
Dury, M., Hambuckers, A., Warnant, P., Henrot, A., Favre, E., Ouberdous, M., and François, L.: Responses of European forest ecosystems to 21st century climate: assessing changes in interannual variability and fire intensity, iForest, 4, 82–99, 2011.
Easterling, D. R., Kunkel, K. E., Wehner, M. F., and Sun, L.: Detection and attribution of climate extremes in the observed record, Weather and Climate Extremes, 11, 17–27, https://doi.org/10.1016/j.wace.2016.01.001, 2016.
EEA: Mapping the impacts of natural hazards and technological accidents in europe – An overview of the last decade, 144 pp., available at: http://www.eea.europa.eu/publications/mapping-the-impacts-of-natural (last access: 17 December 2021), 2010.
Esseen, P. A., Ehnström, B., Ericson, L., and Sjöberg, K.: Boreal forests, Ecol. Bull., 46, 16–47, 1997.
Eyring, V., Bony, S., Meehl, G. A., Senior, C. A., Stevens, B., Stouffer, R. J., and Taylor, K. E.: Overview of the Coupled Model Intercomparison Project Phase 6 (CMIP6) experimental design and organization, Geosci. Model Dev., 9, 1937–1958, https://doi.org/10.5194/gmd-9-1937-2016, 2016.
EUMETSAT: Record waves in the Baltic Sea, available at: https://www.eumetsat.int/record-waves-baltic-sea (last access: 19 December 2021), 2017.
Feldstein, S. B.: The recent trend and variance increase of the annular mode, J. Climate, 15, 88–94, 2002.
Feser, F., Barcikowska, M., Krueger, O., Schenk, F., Weisse, R., and Xia, L.: Storminess over the North Atlantic and northwestern Europe: a review, Q. J. Roy. Meteor. Soc., 141, 350–382, 2015a.
Feser, F., Barcikowska, M., Haeseler, S., Lefebvre, C., Schubert-Frisius, M., Stendel, M., von Storch, H., and Zahn, M.: Hurricane Gonzalo and its extratropical transition to a strong European storm, in: Explaining Extreme Events of 2014 from a Climate Perspective, B. Am. Meteorol. Soc., 96, S51–S55, 2015b.
Feser, F., Krueger, O., Woth, K., and van Garderen, L.: North Atlantic winter storm activity in modern reanalyses and pressure-based observations, J. Climate, 34, 2411–2428, https://doi.org/10.1175/JCLI-D-20-0529.1, 2021.
Finni, T., Kononen, K., Olsonen, R., and Wallström, K.: The history of cyanobacterial blooms in the Baltic Sea, Ambio, 30, 172–178, 2001.
Fischer, E. M. and Knutti, R.: Observed heavy precipitation increase confirms theory and early models, Nat. Clim. Change, 6, 986–991, https://doi.org/10.1038/nclimate3110, 2016.
Fischer, E. M., Luterbacher, J., Zorita, E., Tett, S. F. B., Casty, C., and Wanner, H.: European climate response to tropical volcanic eruptions over the last half millennium, Geophys. Res. Lett., 34, L05707, https://doi.org/10.1029/2006GL027992, 2007.
Flannigan, M., Stocks, B., Turetsky, M., and Wotton, M.: Impacts of climate change on fire activity and fire management in the circumboreal forest, Glob. Change Biol, 15, 549–560, 2009.
Forzieri, G., Feyen, L., Rojas, R., Flörke, M., Wimmer, F., and Bianchi, A.: Ensemble projections of future streamflow droughts in Europe, Hydrol. Earth Syst. Sci., 18, 85–108, https://doi.org/10.5194/hess-18-85-2014, 2014.
Forzieri, G., Feyen, L., Russo, S., Vousdoukas, M., Alfieri ,L., Outten, S., Migliavacca, M., Bianchi, A., Rojas, R., and Cid, A.: Multi-hazard assessment in Europe under climate change, Climatic Change, 137, 105–119, 2016.
Francis, J. A. and Vavrus, S. J.: Evidence linking Arctic amplification to extreme weather, Geophys. Res. Lett., 39, 1–6, https://doi.org/10.1029/2012GL051000, 2012.
Francis, J. A. and Vavrus, S. J.: Evidence for a wavier jet stream in response to rapid Arctic warming, Environ. Res. Lett., 10, 14005, https://doi.org/10.1088/1748-9326/10/1/014005, 2015.
Frank, H. P.: Extreme winds over Denmark from the NCEP/NCAR Reanalysis, Technical Report Riso-R-1238 (EN), Riso National laboratory, Roskilde, 28 pp., 2001.
Fredriksson, C., Tajvidi, N., Hanson, H., and Larson, M.: Statistical analysis of extreme sea water levels at the Falsterbo Peninsula, South Sweden, Vatten, 72, 129–142, 2016.
Freeman, K., Frost, C., Hundleby, G., Roberts, A., Valpy, B., Holttinen, H., Ramírez, L., and Pineda, I.: Our Energy, Our Future: How Offshore Wind Will Help Europe Go Carbon-Neutral, edited by: Walsh, C., WindEurope, Brussels, Belgium, 2019.
Frölicher, T. L., Fischer, E. M., and Gruber, N.: Marine heatwaves under global warming, Nature, 560, 360–364, https://doi.org/10.1038/s41586-018-0383-9, 2018.
Frolova, N. L., Belyakova, P. A., Grigoriev, V. Yu., Sazonov, A. A., Zotov, L. V., and Jarsjö, J.: Runoff fluctuations in the Selenga River basin, Reg. Environ. Change, 17, 1965–1976, https://doi.org/10.1007/s10113-017-1199-0, 2017.
Gailiušis, B., Kriaučiūnienė, J., Jakimavičius, D., and Šarauskienė, D.: The variability of long-term runoff series in the Baltic Sea drainage basin, Baltica, 24, 45–54, 2011.
Gastineau, G. and Frankignoul, C.: Influence of the North Atlantic SST variability on the atmospheric circulation during the twentieth century, J. Climate, 28, 1396–1416, https://doi.org/10.1175/JCLI-D-14-00424.1, 2015.
Gayer, G., Gunther, H., and Winkel, N.: Wave climatology and extreme value analysis for the Baltic Sea area off the Warnemunde harbour entrance, Deutsche Hydrographische Zeitschrift, 47, 109–130, 1995.
Gillett, N. P., Arora, V. K., Matthews, D., and Allen, M. R.: Constraining the ratio of global warming to cumulative CO2 emissions using CMIP5 simulations, J. Climate, 26, 6844–6858, https://doi.org/10.1175/JCLI-D-12-00476.1, 2013.
Gobler, C. J., Doherty, O. M., Hattenrath-Lehmann, T. K., Griffith, A. W., Kang, Y., and Litaker, R. W.: Ocean warming since 1982 has expanded the niche of toxic algal blooms in the North Atlantic and North Pacific oceans, P. Natl. Acad. Sci. USA, 114, 4975–4980, https://doi.org/10.1073/pnas.1619575114, 2017.
Goerlandt, F., Montewka, J., Zhang, W., and Kujala, P.: An analysis of ship escort and convoy operations in ice conditions, Safety Science, 75, 198–209, 2017.
Gong, H., Wang, L., Chen, W., Chen, X., and Nath, D.: Biases of the wintertime Arctic Oscillation in CMIP5 models, Environ. Res. Lett., 12, 14001, https://doi.org/10.1088/1748-9326/12/1/014001, 2017.
Gröger, M., Dieterich, C., Haapala, J., Ho-Hagemann, H. T. M., Hagemann, S., Jakacki, J., May, W., Meier, H. E. M., Miller, P. A., Rutgersson, A., and Wu, L.: Coupled regional Earth system modeling in the Baltic Sea region, Earth Syst. Dynam., 12, 939–973, https://doi.org/10.5194/esd-12-939-2021, 2021.
Granström, A.: Spatial and temporal variation in lightning ignitions in Sweden, J. Veg. Sci., 4, 737–744, 1993.
Gregow, H., Rantanen, M., Laurila, T. K., and Mäkelä, A: Review on winds, extratropical cyclones and their impacts in Northern Europe and Finland, Reports 2020:3, Finnish Meteorological Institute, https://doi.org/10.35614/isbn.9789523361188, 2020.
Grinsted, A., Jevrejeva, S., Riva, R. E. M., and Dahl-Jensen, D.: Sea level rise projections for northern Europe under RCP8.5, Clim. Res., 64, 15–23, 2015.
Grise, K. M. and Polvani, L. M.: The response of midlatitude jets to increased CO2: distinguishing the roles of sea surface temperature and direct radiative forcing, Geophys. Res. Lett., 41, 6863–6871, https://doi.org/10.1002/2014GL061638, 2014.
Groenemeijer, P., Vajda, A., Lehtonen, I., Kämäräinen, M., Venäläinen, R., Gregow, H., and Púcik, T.: Present and future probability of meteorological and hydrological hazards in Europe, D2.5 Report, RAIN Project, available at; http://rain-project.eu/wp-content/uploads/2016/09/D2.5_REPORT_final.pdf (last access: 8 December 2021), 2016.
Groetsch, P. M. M., Simis, S. G. H., Eleveld, M. A., and Peters, S. W. M.: Spring blooms in the Baltic Sea have weakened but lengthened from 2000 to 2014, Biogeosciences, 13, 4959–4973, https://doi.org/10.5194/bg-13-4959-2016, 2016.
Groll, N., Grabemann, I., Hünicke, B., and Meese, M.: Baltic Sea wave conditions under climate change scenarios, Boreal Environ. Res., 22, 1–12, 2017.
Gudmundsson, L., Seneviratne, S. I., and Zhang, X.: Anthropogenic climate change detected in European renewable freshwater resources, Nat. Clim. Change, 7, 813–816, https://doi.org/10.1038/nclimate3416, 2017.
Gustafsson, N., Nyberg, L., and Omstedt, A.: Coupling of a high-resolution atmospheric model and an ocean model for the Baltic Sea, Mon. Weather Rev., 126, 2822–2846, https://doi.org/10.1175/1520-0493(1998)126<2822:COAHRA>2.0.CO;2, 1998.
Haarsma, R. J., Selten, F. M., and Drijfhout, S. S.: Decelerating Atlantic meridional overturning circulation main cause of future west European summer atmospheric circulation changes, Environ. Res. Lett., 10, 094007, https://doi.org/10.1088/1748-9326/10/9/094007, 2015.
Hakanen, P., Suikkanen, S., Franzén, J., Franzén, H., Kankaanpää, H., and Kremp, A.: Bloom and toxin dynamics of Alexandrium ostenfeldii in a shallow embayment at the SW coast of Finland, northern Baltic Sea, Harmful Algae, 15, 91–99, 2012.
Hänninen, S.: Talvimerenkulun onnettomuudet 2011–2018, Trafin tutkimuksia, No. 12, Helsinki, available at: https://arkisto.trafi.fi/filebank/a/1545233991/7a154fa85f1f4078a1b0ca2fb06906aa/33305-Trafi_12_2018_Talvimerenkulun_onnettomuudet_2011-2018.pdf (last access: 18 December 2021), 2018.
Hansom, J. D., Switzer, A. D., and Pile, J.: Extreme Waves: Causes, Characteristics, and Impact on Coastal Environments and Society, chap. 11, edited by: Shroder, J. F., Ellis, J. T., and Sherman, D. J., in: Hazards and Disasters Series, Coastal and Marine Hazards, Risks, and Disasters, Elsevier, 307–334, ISBN 9780123964830, https://doi.org/10.1016/B978-0-12-396483-0.00011-X, 2015.
Hansson, D., Eriksson, C., Omstedt, A., and Chen, D.: Reconstruction of river runoff to the Baltic Sea, AD 1500–1995, Int. J. Climatol., 31, 696–703, 2011.
Hausfather, Z. and Peters, G. P.: Emissions: the “business as usual” story is misleading, Nature, 577, 618–620, https://doi.org/10.1038/d41586-020-00177-3, 2020.
Heinonen, J., Rissanen, S., Kurkela, J., Tikanmäki, M., and Jussila, V.: Ice load portal for preliminary design of offshore wind turbines in the Gulf of Bothnia: case studies, WindEurope Offshore 2019, 26–28 November 2019, Copenhagen, 2019.
HELCOM: HELCOM Baltic Sea Action Plan, available at: http://www.helcom.fi/Documents/Baltic sea action plan/BSAP_Final.pdf (last access: 18 December 2021), 2007.
HELCOM: State of the Baltic Sea: Second HELCOM holistic assessment 2011–2016, in: Baltic Sea Environment Proceedings, 155, 2018.
Hersbach, H., Bell, B., Berrisford, P., Hirahara, S., Horányi, A., Muñoz-Sabater, J., Nicolas, J., Peubey, C., Radu, R., Schepers, D., Simmons A., Soci, C., Abdalla, S., Abellan, X., Balsamo, G., Bechtold, P., Biavati, G., Bidlot, J., Bonavita, M., De Chiara, G., Dahlgren, P., Dee, D., Diamantakis, M., Dragani, R., Flemming, J., Forbes, R., Fuentes, M., Geer, A., Haimberger, L., Sean Healy, Hogan, R. J., Hólm, E., Janisková, M., Keeley, S., Laloyaux, P., Lopez, P., Lupu, C., Radnoti, G, de Rosnay, P., Rozum, I., Vamborg, F., Villaume, S., and Thépaut, J.-N.: The ERA5 global reanalysis, Q. J. Roy. Meteor. Soc., 146, 1999–2049, https://doi.org/10.1002/qj.3803, 2020.
Hisdal, H., Holmqvist, E., Jónsdóttir, J. F., Jónsson, P., Kuusisto, E., Lindström, G., and Roald, L. A.: Has streamflow changed in the Nordic countries?, Norwegian Water Resources and Energy Directorate, Oslo, 1, available at:https://publikasjoner.nve.no/report/2010/report2010_01.pdf (last access: 18 December 2021), 2010.
Hjelmfelt, M. R.: Numerical study of the influence of environmental conditions on lake-effect snowstorms over Lake Michigan, Mon. Weather Rev., 118, 138–150, 1990.
Hoerling, M. P., Hurrell, J. W., and Xu, T.: Tropical origins for recent North Atlantic climate change, Science, 292, 90–92, 2001.
Hofherr, T. and Kunz, M.: Extreme wind climatology of winter storms in Germany, Clim. Res., 41, 105–123, 2010.
Höglund, A., Pemberton, P., Hordoir, R., and Schimanke, S.: Ice conditions for maritime traffic in the Baltic Sea in future climate, Boreal Environ. Res., 22, 245–265, 2017.
Holthuijsen, L. H.: Waves in Oceanic and Coastal Waters, Cambridge University Press, New York, US, 2007.
Horton, D. E., Johnson, N. C., Singh, D., Swain, D. L., Rajaratnam, B., and Diffenbaugh, N. S.: Contribution of changes in atmospheric circulation patterns to extreme temperature trends, Nature, 522, 465–469, https://doi.org/10.1038/nature14550, 2015.
Humborg, C., Geibel, M. C., Sun, X., McCrackin, M., Mörth, C.-M., Stranne, C., Jakobsson, M., Gustafsson, B., Sokolov, A., Norkko, A., and Norkko, J.: High emissions of carbon dioxide and methane from the coastal Baltic Sea at the end of a summer heat wave, Frontiers in Marine Science, 6, 493, https://doi.org/10.3389/fmars.2019.00493, 2019.
Hurrell, J.: Hurrell North Atlantic Oscillation (NAO) Index (station-based), available at: https://climatedataguide.ucar.edu/climate-data/hurrell-north-atlantic-oscillation-nao-index-station-based, last access: 7 December 2021.
Hurrell, J. W.: Decadal trends in the North Atlantic Oscillation, regional temperatures and precipitation, Science, 269, 676–679, 1995.
Hurrell, J. W., Kushnir, Y., Ottersen, G., and Visbeck, M.: An overview of the North Atlantic Oscillation, in: The North Atlantic Oscillation: Climatic Significance and Environmental Impact, Geoph. Monog. Series, 134, 1–36, 2003.
Hynčica, M. and Huth, R.: Long-term changes in precipitation phase in Europe in cold half year, Atmos. Res., 227, 79–88, 2019.
Ineson, S., Scaife, A. A., Knight, J. R., Manners, J. C., Dunstone, N. J., Gray, L. J., Haigh, J. D.: Solar forcing of winter climate variability in the northern hemisphere, Nature Geosci., 4, 753–757, 2011.
IPCC: Climate Change 2013: The Physical Science Basis. Contribution of Working Group I to the Fifth Assessment Report of the Intergovernmental Panel on Climate Change, edited by: Stocker, T. F., Qin, D., Plattner, G.-K., Tignor, M., Allen, S. K., Boschung, J., Nauels, J., Xia, Y., Bex, V., and Midgley, P. M., Cambridge University Press, Cambridge, UK and New York, NY, USA, 2013.
IPCC: Climate Change 2014: Synthesis Report. Contribution of Working Groups I, II and III to the Fifth Assessment Report of the Intergovernmental Panel on Climate Change, edited by: Core Writing Team, Pachauri, R. K. and Meyer, L. A., IPCC, Geneva, Switzerland, 151 pp., 2014.
IPCC: Summary for Policymakers, in: Global Warming of 1.5 ∘C, An IPCC Special Report on the impacts of global warming of 1.5 ∘C above pre-industrial levels and related global greenhouse gas emission pathways, in the context of strengthening the global response to the threat of climate change, sustainable development, and efforts to eradicate poverty, edited by: Masson-Delmotte, V., Zhai, P., Pörtner, H.-O., Roberts, D., Skea, J., Shukla, P. R., Pirani, A., Moufouma-Okia, W., Péan, C., Pidcock, R., Connors, S., Matthews, J. B. R., Chen, Y., Zhou, X., Gomis, M. I., Lonnoy, E., Maycock, T., Tignor, M., and Waterfield, T., World Meteorological Organization, Geneva, Switzerland, 32 pp., 2018.
Irannezhad, M., Chen, D., and Kløve, B.: Interannual variations and trends in surface air temperature in Finland in relation to atmospheric circulation patterns, 1961–2011, Int. J. Climatol., 35, 3078–3092, https://doi.org/10.1002/joc.4193, 2015.
Irannezhad, M., Moradkhani, H., and Kløve, B.: Corrigendum to “Spatio-temporal Variability and Trends in Extreme Temperature Events in Finland over the Recent Decades: Influence of Northern Hemisphere Teleconnection Patterns”, Adv. Meteorol., 2019, 4857504, https://doi.org/10.1155/2019/4857504, 2019.
Jaagus, J., Briede, A., Rimkus, E., and Remm, K.: Variability and trends in daily minimum and maximum temperatures and in the diurnal temperature range in Lithuania, Latvia and Estonia in 1951–2010, Theor. Appl. Climatol., 118, 57–68, https://doi.org/10.1007/s00704-013-1041-7, 2014.
Jaagus, J., Sepp, M., Tamm, T., Järvet, A., and Mõisja, K.: Trends and regime shifts in climatic conditions and river runoff in Estonia during 1951–2015, Earth Syst. Dynam., 8, 963–976, https://doi.org/10.5194/esd-8-963-2017, 2017.
Jaagus, J., Briede, A., Rimkus, E., and Sepp, M.: Changes in precipitation regime in the Baltic countries in 1966–2015, Theor. Appl. Climatol., 131, 433–443, https://doi.org/10.1007/s00704-016-1990-8, 2018.
Jacob, D., Petersen, J., Eggert, B., Alias, A., Christensen, O. B., Bouwer, L. M., Braun, A., Colette, A., Déqué, M., Georgievski, G., Georgopoulou, E., Gobiet, A., Menut, L., Nikulin, G., Haensler, A., Hempelmann, N., Jones, C., Keuler, K., Kovats, S., Kröner, N., Kotlarski, S., Kriegsmann, A., Martin, E., van Meijgaard, E., Moseley, C., Pfeifer, S., Preucshmann, S., Radermacher, C., Radkte, K., Rechid, D., Rounsevell, M., Samuelsson, P., Somot, S., Soussana, J.-F., Teichmann, C., Valentini, R., Vautard, R., Weber, B., and Yiou, P.: EURO-CORDEX: new high-resolution climate change projections for European impact research, Reg. Environ. Change, 14, 563–578, https://doi.org/10.1007/s10113-013-0499-2, 2014.
Jalkanen, J.-P., Brink, A., Kalli, J., Pettersson, H., Kukkonen, J., and Stipa, T.: A modelling system for the exhaust emissions of marine traffic and its application in the Baltic Sea area, Atmos. Chem. Phys., 9, 9209–9223, https://doi.org/10.5194/acp-9-9209-2009, 2009.
Janssen, P. A. E. M. and Janssen, A. J. E. M.: Asymptotics for the long-time evolution of kurtosis of narrow-band ocean waves, J. Fluid Mech., 859, 790–818, https://doi.org/10.1017/jfm.2018.844, 2019.
Jensen, J. and Müller-Navarra, S.: Storm surges on the German coast, Die Küste, 74, 92–124, 2008.
Jeppesen, E., Kronvang, B., Meerhoff, M., Søndergaard, M., Hansen, K. M., Andersen, H. E., Lauridsen, T. L., Beklioglu, M., Özen, A., and Olesen, J. E.: Climate change effects on runoff, catchment phosphorus loading and lake ecological state, and potential adaptations, J. Envir. Qual., 38, 1930–1941, 2009.
Jeworrek, J., Wu, L., Dieterich, C., and Rutgersson, A.: Characteristics of convective snow bands along the Swedish east coast, Earth Syst. Dynam., 8, 163–175, https://doi.org/10.5194/esd-8-163-2017, 2017.
Johansson, B. and Chen, D.: Estimation of areal precipitation for runoff modelling using wind data: a case study in Sweden, Clim. Res., 29, 53–61, 2005.
Jönsson, A., Broman, B., and Rahm, L.: Variations in the Baltic Sea wave fields, Ocean Eng., 30, 107–126, https://doi.org/10.1016/S0029-8018(01)00103-2, 2003.
Joshi, M. M., Charlton, A. J., and Scaife, A. A.: On the influence of stratospheric water vapor changes on the tropospheric circulation, Geophys. Res. Lett., 33, L09806, https://doi.org/10.1029/2006GL025983, 2006.
Juga, I., Hippi, M., Nurmi, P., and Karsisto, V.: Weather factors triggering the massive car crashes on 3 February 2012 in the Helsinki metropolitan area, in: Proceedings of SIRWEC 17th International Road Weather Conference, Andorra, 30 January–1 February 2014, available at: http://sirwec.org/wp-content/uploads/Papers/2014-Andorra/D-21.pdf (last access: 3 December 2021), 2014.
Kahma, K. K., Pettersson, H., and Tuomi, L.: Scatter diagram wave statistics from the northern Baltic Sea, MERI – Rep. Ser. Fin. Inst. Mar. Res., 49, 15–32, 2003.
Kahru, M., Elmgren, R., and Savchuk, O. P.: Changing seasonality of the Baltic Sea, Biogeosciences, 13, 1009–1018, https://doi.org/10.5194/bg-13-1009-2016, 2016.
Kalnay, E., Kanamitsu, M, Kistler, R., Collins, W., Deaven, D., Gandin, L., Iredell, M., Saha, S., White, G., Woollen, J., Zhu, Y., Leetmaa, A., Reynolds, R., Chelliah, M., Ebisuzaki, W., Higgins, W., Janowiak, J., Mo, K. C., Ropelewski, C., Wang, J., Jenne, R., and Joseph, D.: The NCEP/NCAR 40-year reanalysis project, B. Am. Meteorol. Soc., 77, 437–471, 1996.
Kamesaki, K., Kishi, S., and Yamauchi, Y.: Simulation of NSR shipping based on year-round and seasonal operation scenarios, INSROP Working Paper 164-1999, INSROP, Oslo, 1999.
Karlberg, M. and Wulff, A.: Impact of temperature and species interaction on filamentous cyanobacteria may be more important than salinity and increased pCO2 levels, Mar. Biol., 160, 2063–2072, 2013.
Kaspar, F., Niermann, D., Borsche, M., Fiedler, S., Keller, J., Potthast, R., Rösch, T., Spangehl, T., and Tinz, B.: Regional atmospheric reanalysis activities at Deutscher Wetterdienst: review of evaluation results and application examples with a focus on renewable energy, Adv. Sci. Res., 17, 115–128, 2020.
Kasvi, E., Lotsar, E., Kumpumäki., Dubrovin, T., and Veijalainen, N.: Effects of climate change and flow regulation on the flow characteristics of a low-relief river within southern boreal climate area, Water, 11, 1827, https://doi.org/10.3390/w11091827, 2019.
Kļaviņš, M. and Rodinov, V.: Long-term changes of river discharge regime in Latvia, Nord Hydrol., 39, 133–141, 2008.
Kļaviņš, M., Rodinov, V., Timukhin, A., and Kokorīte, I.: Patterns of river discharge: long-term changes in Latvia and the Baltic region, Baltica, 21, 41–49, 2008.
Kellomäki, S., Peltola, H., Nuutinen, T., Korhonen, K. T., and Strandman, H.: Sensitivity of managed boreal forests in Finland to climate change, with implications for adaptive management, Philos. T. R. Soc. B, 363, 2341–2351, 2008.
Kendon, E. J., Roberts, N. M., Senior, C. A., and Roberts, M. J.: Realism of rainfall in a very high resolution regional climate model, J. Climate, 25, 5791–5806, 2012.
Keskinen, A.: Lumilogistiikan tehostaminen kaupungeissa (Enhanced snow removal logistics in suburban areas), Master thesis of Science in Technology, Aalto University, Espoo, Finland, available at: http://urn.fi/URN:NBN:fi:aalto-201211243401 (last access: 3 December 2021), 2012 (in Finnish with English abstract).
Kettle, A. J.: The North Sea surge of 31 October–1 November 2006 during Storm Britta, Adv. Geosci., 45, 273–279, https://doi.org/10.5194/adgeo-45-273-2018, 2018.
Kettle, A. J.: Storm Tilo over Europe in November 2007: storm surge and impacts on societal and energy infrastructure, Adv. Geosci., 49, 187–196, https://doi.org/10.5194/adgeo-49-187-2019, 2019.
Kilpeläinen, A., Kellomäki, S., Strandman, H., and Venäläinen, A.: Climate change impacts on forest fire potential in boreal conditions in Finland, Climatic Change, 103, 383–398, 2010.
Kim, B. M., Son, S. W., Min, S. K., Jeong, J. H., Kim, S. J., Zhang, X., Taehyoun, S., and Yoon, J.-H.: Weakening of the stratospheric polar vortex by Arctic sea-ice loss, Nat. Commun., 5, 1–8, https://doi.org/10.1038/ncomms5646, 2014.
Kim, S., Sinclair, V. A., Räisänen, J., and Ruuhela, R.: Heat waves in Finland: present and projected summertime extreme temperatures and their associated circulation patterns, Int. J. Climatol., 38, 1393–1408, https://doi.org/10.1002/joc.5253, 2018.
Kistler, R., Collins, W., Saha, S., White, G., Woollen, J., Kalnay, E., Chelliah, M., Ebisuzaki, W., Kanamitsu, M., Kousky, V., van den Dool, H., Jenne, R., and Fiorino, M.: The NCEP-NCAR 50-year reanalysis: monthly means CD-ROM and documentation, B. Am. Meteorol. Soc., 82, 247–267, 2001.
Kjellström, E., Thejll, P., Rummukainen, M., Christensen, J. H., Boberg, F., Christensen, O. B., and Fox Maule, C.: Emerging regional climate change signals for Europe under varying large-scale circulation conditions, Clim. Res., 56, 103–119, https://doi.org/10.3354/cr01146, 2013.
Klais, R., Tamminen, T., Kremp, A., Spilling, K., and Olli, K.: Decadal-scale changes of dinoflagellates and diatoms in the anomalous Baltic Sea spring bloom, PLoS ONE, 6, e21567, https://doi.org/10.1371/journal.pone.0021567, 2011.
Kollanus, V., Tiittanen, P., and Lanki, T.: Mortality risk related to heatwaves in Finland – Factors affecting vulnerability, Environ Res., 201, 111503, https://doi.org/10.1016/j.envres.2021.111503, 2021.
Konovalov, I. B., Beekmann, M., Kuznetsova, I. N., Yurova, A., and Zvyagintsev, A. M.: Atmospheric impacts of the 2010 Russian wildfires: integrating modelling and measurements of an extreme air pollution episode in the Moscow region, Atmos. Chem. Phys., 11, 10031–10056, https://doi.org/10.5194/acp-11-10031-2011, 2011.
Kownacka, J., Busch, S., Göbel, J., Gromisz, S., Hällfors, H., Höglander, H., Huseby, S., Jaanus, A., Jakobsen, H. H., Johansen, M., Johansson, M., Jurgensone, I., Liebeke, N., Kraśniewski, W., Kremp, A., Lehtinen, S., Olenina, I., v.Weber, M., and Wasmund, N.: Cyanobacteria biomass, 1990–2019, HELCOM Baltic Sea Environment Fact Sheet, available at; https://helcom.fi/wp-content/uploads/2020/09/BSEFS-Cyanobacteria-biomass-1990-2019-1.pdf (last access: 18 December 2021), 2020.
Kriaučiūnienė, J., Meilutyte-Barauskiene, D., Rimkus, E., Kazys, J., and Vincevicius, A.: Climate change impact on hydrological processes in Lithuanian Nemunas river basin, Baltica, 21, 51–61, 2008.
Krikken, F., Lehner, F., Haustein, K., Drobyshev, I., and van Oldenborgh, G. J.: Attribution of the role of climate change in the forest fires in Sweden 2018, Nat. Hazards Earth Syst. Sci., 21, 2169–2179, https://doi.org/10.5194/nhess-21-2169-2021, 2021.
Kristensen L., Rathmann O., and Hansen, S. O.: Extreme winds in Denmark, J. Wind Eng. Ind. Aerod., 87, 147–166, 2000.
Kucharski, F., Molteni, F., and Bracco, A.: Decadal interactions between the western tropical Pacific and the North Atlantic Oscillation, Clim. Dynam., 26, 79–91, 2006.
Kudryavtseva, N. and Soomere, T.: Satellite altimetry reveals spatial patterns of variations in the Baltic Sea wave climate, Earth Syst. Dynam., 8, 697–706, https://doi.org/10.5194/esd-8-697-2017, 2017.
Kudryavtseva, N., Räämet, A., and Soomere, T.: Coastal flooding: joint probability of extreme water levels and waves along the Baltic Sea coast, in: Global Coastal Issues of 2020, edited by: Malvárez, G. and Navas, F., J. Coast. Res., Special Issue No. 95, 1146–1151, 2020.
Kujala, P.: Damage Statistics of Ice-strengthened Ships in the Baltic Sea 1984–1987, Espoo, Finland: Winter Navigation Research Board, Research Report No. 47., 62 pp., 1991.
Kujala, P.: Ice Loading on Ship Hull. In Encyclopedia of Maritime and Offshore Engineering, Wiley Online Library, edited by: Carlton, J., Jukes, P., and Choo, Y. S., https://doi.org/10.1002/9781118476406.emoe012, 2017.
Kunz, M., Mohr, S., Rauthe, M., Lux, R., and Kottmeier, Ch.: Assessment of extreme wind speeds from Regional Climate Models – Part 1: Estimation of return values and their evaluation, Nat. Hazards Earth Syst. Sci., 10, 907–922, https://doi.org/10.5194/nhess-10-907-2010, 2010.
Kuuliala, L., Kujala, P., Suominen, M. and Montewka, J.: Estimating operability of ships in ridged ice fields, Cold Reg. Sci. Technol., 135, 51–61, 2017.
Laapas, M. and Venäläinen, A.: Homogenization and trend analysis of monthly mean and maximum wind speed time series in Finland, 1959–2015, Int. J. Climatol., 37, 4803–4813, https://doi.org/10.1002/joc.5124, 2017.
Laird, N. F., Kristovich, D. A. R., and Walsh, J. E.: Idealized model simulations examining the mesoscale structure of winter lake-effect circulations, Mon. Weather Rev., 131, 206–221, https://doi.org/10.1175/1520-0493(2003)131<0206:IMSETM>2.0.CO;2, 2003.
Laird, N., Sobash, R., and Hodas, N.: The frequency and characteristics of lake-effect precipitation events associated with the New York State Finger Lakes, J. Appl. Meteorol. Clim., 48, 873–886, https://doi.org/10.1175/2008JAMC2054.1, 2009.
Larjavaara, M., Kuuluvainen, T., and Rita, H.: Spatial distribution of lightning-ignited forest fires in Finland, Forest Ecol. Manag., 208, 177–188, 2005a.
Larjavaara, M., Pennanen, J., and Tuomi, T.: Lightning that ignites forest fires in Finland, Agr. Forest Meteorol., 132, 171–180, 2005b.
Larsén, X. and Mann, J.: Extreme winds from the NCEP/NCAR reanalysis data, Wind Energy, https://doi.org/10.1002/we.318, 2009.
Larsén, X. and Badger, J.: Calculation of extreme wind atlases using mesoscale modeling, Final project report DTU Wind Energy, DTU Wind Energy E, No. 0125, ISBN 978-87-93278-87-5, 2012.
Larsén, X., Badger, J., Hahmann, A. N., and Mortensen, N. G.: The selective dynamical downscaling method for extreme wind atlases, Wind Energy, 16, 1167–1182, https://doi.org/10.1002/we.1544, 2013.
Larsén, X., Larsen, S., and Hahmann, N. A.: Origin of the waves in “A case study of mesoscale spectra of wind and temperature, observed and simulated”: lee waves of the Norwegian mountains, Q. J. Roy. Meteor. Soc., 138, 274–279, https://doi.org/10.1002/qj.916, 2012a.
Larsén, X., Ott, S., Badger, J., Hahmann, A., and Mann, J.: Recipes for correcting the impact of effective mesoscale resolution on the estimation of extreme winds, J. Appl. Meteorol. Clim., 51, 521–533, 2012b.
Larsén, X., Kalogeri, C., Galanis, G., and Kallos, G.: A statistical methodology for the estimation of extreme wave conditions for offshore renewable applications, Renew. Energ., 80, 205–218, https://doi.org/10.1016/j.renene.2015.01.069, 2015.
Larsén, X., Du, J., Bolanos, R., Imberger, M., Kelly, M., Badger, M., and Larsen, S.: Estimation of offshore extreme wind from wind-wave coupled modeling, Wind Energy, 22, 1043–1057, https://doi.org/10.1002/we.2339, 2019a.
Larsén, X., Larsen, S., Petersen, E., and Mikkelsen, T.: Turbulence characteristics of wind-speed fluctuations in the presence of open cells: a case study, Bound.-Lay. Meteorol., 171, 191–212, https://doi.org/10.1007/s10546-019-00425-8, 2019b.
Laurila, T. K., Sinclair, V. A., and Gregow, H.: The extratropical transition of Hurricane Debby (1982) and the subsequent development of an intense windstorm over Finland, Mon. Weather Rev., 143, 377–401, https://doi.org/10.1175/MWR-D-19-0035.1, 2020.
Laurila, T. K., Sinclair, V. A., and Gregow, H.: Climatology, variability and trends in near-surface wind speeds over the North Atlantic and Europe during 1979–2018 based on ERA5, Int. J. Climatol., 41, 2253–2278, https://doi.org/10.1002/joc.6957, 2021.
Leckebusch, G. C. and Ulbrich, U.: On the relationship between cyclones and extreme windstorm events over Europe under climate change, Global Planet. Change, 44, 181–193, https://doi.org/10.1016/j.gloplacha.2004.06.011, 2004.
Lehmann, A., Getzlaff, K., and Harlaß, J.: Detailed assessment of climate variability in the Baltic Sea area for the period 1958 to 2009, Clim. Res., 46, 185–196, 2011.
Lehmann, A., Myrberg, K., Post, P., Chubarenko, I., Dailidiene, I., Hinrichsen, H.-H., Hüssy, K., Liblik, T., Lips, U., Meier, H. E. M., and Bukanova, T.: Salinity dynamics of the Baltic Sea, Earth Syst. Dynam. Discuss. [preprint], https://doi.org/10.5194/esd-2021-15, in review, 2021.
Lehtonen, I., Ruosteenoja, K., and Jylhä, K.: Projected changes in European extreme precipitation indices on the basis of global and regional climate model ensembles, Int. J. Climatol., 34, 1208–1222, 2014a.
Lehtonen, I., Ruosteenoja, K., Venäläinen, A., and Gregow, H.: The projected 21st century forest-fire risk in Finland under different greenhouse gas scenarios, Boreal Environ. Res., 19, 127–139, 2014b.
Lehtonen, I., Venäläinen, A., Kämäräinen, M., Peltola, H., and Gregow, H.: Risk of large-scale fires in boreal forests of Finland under changing climate, Nat. Hazards Earth Syst. Sci., 16, 239–253, https://doi.org/10.5194/nhess-16-239-2016, 2016.
Leiding, T., Tinz, B., Rosenhagen, G., Lefevre, C., Haeseler, S., Hagemann, S., Bastigkeit, I., Stein, D., Schwenk, P., Mueller, S., Outzen, O., Herklotz, K., Kinder, F., and Neumann, T.: Meteorological and oceanographic conditions at the FINO platforms during the severe storms Christian and Xaver, DEWI Magazin, 44, 16–25, 2014.
Lenderink, G., Belušić, D., Fowler, H., Kjellström, E., Lind, P., van Meijgaard, E., van Ulft, B., and de Vries, H.: Systematic increases in the thermodynamic response of hourly precipitation extremes in an idealized warming experiment with a convection-permitting climate model, Environ. Res. Lett., 14, 074012, https://doi.org/10.1088/1748-9326/ab214a, 2019.
Lenggenhager, S., Croci-Maspoli, M., Brönnimann, S., and Martius, O.: On the dynamical coupling between atmospheric blocks and heavy precipitation events: a discussion of the southern Alpine flood in October 2000, Q. J. Roy. Meteor. Soc., 145, 530–545, https://doi.org/10.1002/qj.3449, 2019.
Lensu, M., Haapala, J., Lehtiranta, J., Eriksson, P., Kujala, P., Suominen, M., Mård, A., Vedenpää, L., Kõuts, T., and Lilover, M.-J.: Forecasting of compressive ice conditions, in: Proceedings of the International Conference on Port and Ocean Engineering under Arctic Conditions (POAC'13), available at: https://www.poac.com/Papers/2013/pdf/POAC13_208.pdf (last access: 18 December 2021), 2013.
Leppäranta, M.: The drift of sea ice, 2nd edn., Springer, Heidelberg, https://doi.org/10.1007/978-3-642-04683-4, 2011
Leppäranta, M. and Myrberg, K.: Physical Oceanography of the Baltic Sea, Springer, Berlin, Heidelberg, New York, 378 pp., 2009.
Lind, P. and Kjellström, E.: Water budget in the Baltic Sea drainage basin: Evaluation of simulated fluxes in a regional climate model, Boreal Environ. Res., 14, 56–67. 2009.
Lind, P., Belušić, D., Christensen, O. B., Dobler, A., Kjellström, E., Landgren, O., Lindstedt, D., Matte, D., Pedersen, R. A., Toivonen, E., and Wang, F.: Benefits and added value of convection-permitting climate modeling over Fenno-Scandinavia, Clim. Dynam., 55, 1893–1912, https://doi.org/10.1007/s00382-020-05359-3, 2020.
Lindberg, H., Granström, A., Gromtsev, A., Levina, M., Shorohova, E., and Vanha-Majamaa, I.: The annually burnt forest area is relatively low in Fennoscandia, in: Climate change and forest management affect forest fire risk in Fennoscandia, edited by: Aalto, J., and Venäläinen, A., Finnish Meteorological Institute Reports 2021:3, Helsinki, Finland, 28–65, https://doi.org/10.35614/isbn.9789523361355, 2021.
Lindeberg, M., Kujala, P., Toivola, J., and Niemelä, H.: Real-time winter traffic simulation tool – based on a deterministic model, Online, Scientific Journals of the Maritime University of Szczecin, 42, 118–124, 2015.
Lindeberg, M., Kujala, P., Karjalainen, M., and Toivola, J.: Simulation model of the Finnish winter navigation system, In: Proceedings of the 13th International Marine Design Conference (IMDC 2018), 10–14 June 2018, Helsinki, Finland, CRC Press, London, https://doi.org/10.1201/9780429440519, 2018.
Lindenberg. J., Mengelkamp, H. T., and Rosenhagen, G.: Representativity of near surface wind measurements from coastal stations at the German Bight, Meteorol. Z, 21, 99–106, 2012.
Liu, X., He, B., Guo, L., Huang, L., and Chen, D.: Similarities and differences in the mechanisms causing the European summer heatwaves in 2003, 2010, and 2018, Earths Future, 8, e2019EF001386, https://doi.org/10.1029/2019EF001386, 2020.
Luomaranta, A., Ruosteenoja, K., Jylhä, K., Gregow, H., Haapala, J., and Laaksonen, A.: Multimodel estimates of the changes in the Baltic Sea ice cover during the present century, Tellus A, 66, 22617, https://doi.org/10.3402/tellusa.v66.22617, 2014.
Luomaranta, A., Aalto, J., and Jylhä, K.: Snow cover trends in Finland over 1961–2014 based on gridded snow depth observations, Int. J. Climatol., 7, 3147–3159, https://doi.org/10.1002/joc.6007, 2019.
Lussana, C., Tveito, O. E., Dobler, A., and Tunheim, K.: seNorge_2018, daily precipitation, and temperature datasets over Norway, Earth Syst. Sci. Data, 11, 1531–1551, https://doi.org/10.5194/essd-11-1531-2019, 2019.
Lyons, E. A., Jin, Y., and Randerson, J. T.: Changes in surface albedo after fire in boreal forest ecosystems of interior Alaska assessed using MODIS satellite observations, J. Geophys. Res., 113, G02012, https://doi.org/10.1029/2007JG000606, 2008.
Mäkelä, H. M., Venäläinen, A., Jylhä, K., Lehtonen, I., and Gregow, H.: Probabilistic projections of climatological forest fire danger in Finland, Clim. Res., 60, 73–85, 2014.
Manning, C., Widmann, M., Bevacqua, E., Van Loon, A. F., Maraun, D., and Vrac, M.: Increased probability of compound long-duration dry and hot events in Europe during summer (1950–2013), Environ. Res. Lett., 14, 094006, https://doi.org/10.1088/1748-9326/ab23bf, 2019.
Marcos, M. and Woodworth, P. L.: Spatiotemporal changes in extreme sea levels along the coasts of the North Atlantic and the Gulf of Mexico, J. Geophys. Res.-Oceans, 122, 7031–7048, https://doi.org/10.1002/2017JC013065, 2017.
Marshall, A. G. and Scaife, A. A: Impact of the QBO on surface winter climate. J. Geophys. Res., 114, D18110, https://doi.org/10.1029/2009JD011737, 2009.
Marshall, J., Johnson, H., and Goodman, J.: A study of the interaction of the North Atlantic Oscillation with the ocean circulation, J. Climate, 14, 1399–1421, 2001.
Marshall, G. J., Jylhä, K., Kivinen, S., Laapas, M., and Verpe Dyrrdal, A.: The role of atmospheric circulation patterns in driving recent changes in indices of extreme seasonal precipitation across Arctic Fennoscandia, Climatic Change, 162, 741–759, https://doi.org/10.1007/s10584-020-02747-w, 2020.
Martel, J., Mailhot, A., and Brissette, F.: Global and regional projected changes in 100-yr subdaily, daily, and multiday precipitation extremes estimated from three large ensembles of climate simulations, J. Climate, 33, 1089–1103, https://doi.org/10.1175/JCLI-D-18-0764.1, 2020.
Matthes, H. Rinke, A., and Dethloff, K.: Recent changes in Arctic temperature extremes: warm and cold spells during winter and summer, Environ. Res. Lett., 10, 114020, https://doi.org/10.1088/1748-9326/10/11/114020, 2015.
Matthews, T., Murphy, C., Wilby, R. L., and Harrigan, S.: A cyclone climatology of the British-Irish Isles 1871–2012, Int. J. Climatol., 36, 1299–1312, 2016.
Mazon, J., Niemelä, S. Pino, D., Savijärvi, H., and Vihma, T.: Snow bands over the Gulf of Finland in wintertime, Tellus A, 67, 25102, https://doi.org/10.3402/tellusa.v67.25102, 2015.
Medvedev, I. P., Rabinovich, A. B., and Kulikov, E. A.: Tides in three enclosed basins: the Baltic, Black, and Caspian seas, Frontiers in Marine Science, 3, 46, https://doi.org/10.3389/fmars.2016.00046, 2016.
Meehl, G. A., Tebaldi, C., Walton, G., Easterling, D., and McDaniel, L.: Relative increase of record high maximum temperatures compared to record low minimum temperatures in the U.S., Environ. Res. Lett., 36, L23701, https://doi.org/10.1029/2009GL040736, 2009.
Mei, L., Xue, Y., de Leeuw, G., Guang, J., Wang, Y., Li, Y., Xu, H., Yang, L., Hou, T., He, X., Wu, C., Dong, J., and Chen, Z.: Integration of remote sensing data and surface observations to estimate the impact of the Russian wildfires over Europe and Asia during August 2010, Biogeosciences, 8, 3771–3791, https://doi.org/10.5194/bg-8-3771-2011, 2011.
Meier, H. E. M., Dieterich, C., Eilola, K, Gröger, M., Höglund, A., Radtke, H., Saravia, S., and Wåhlström, I.: Future projections of record-breaking sea surface temperature and cyanobacteria bloom events in the Baltic Sea, Ambio, 48, 1362–1376, https://doi.org/10.1007/s13280-019-01235-5, 2019.
Meier, H. E. M., Kniebusch, M., Dieterich, C., Gröger, M., Zorita, E., Elmgren, R., Myrberg, K., Ahola, M., Bartosova, A., Bonsdorff, E., Börgel, F., Capell, R., Carlén, I., Carlund, T., Carstensen, J., Christensen, O. B., Dierschke, V., Frauen, C., Frederiksen, M., Gaget, E., Galatius, A., Haapala, J. J., Halkka, A., Hugelius, G., Hünicke, B., Jaagus, J., Jüssi, M., Käyhkö, J., Kirchner, N., Kjellström, E., Kulinski, K., Lehmann, A., Lindström, G., May, W., Miller, P., Mohrholz, V., Müller-Karulis, B., Pavón-Jordán, D., Quante, M., Reckermann, M., Rutgersson, A., Savchuk, O. P., Stendel, M., Tuomi, L., Viitasalo, M., Weisse, R., and Zhang, W.: Climate Change in the Baltic Sea Region: A Summary, Earth Syst. Dynam. Discuss. [preprint], https://doi.org/10.5194/esd-2021-67, in review, 2021.
Meier, M., Rutgersson, A., and Reckerman, M.: An Earth System Science Program for the Baltic Sea region, EOS T. Am. Geophys. Un., 95, 109–110, 2014.
Mentaschi, L., Vousdoukas, M. I., Voukouvalas, E., Dosio, A., and Feyen, L.: Global changes of extreme coastal wave energy fluxes triggered by intensified teleconnection patterns, Geophys. Res. Lett., 44, 2416–2426, https://doi.org/10.1002/2016GL072488, 2017.
Michaelis, A. C., Willison, J., Lackmann, G. M., and Robinson, W. A.: Changes in winter North Atlantic extratropical cyclones in high-resolution regional pseudo–global warming simulations, J. Climate, 30, 6905–6925, https://doi.org/10.1175/JCLI-D-16-0697.1, 2017.
Mielonen, T., Portin, H., Komppula, M., Leskinen, A., Tamminen, J., Ialongo, I., Hakkarainen, J., Lehtinen, K. E. J., and Arola, A.: Biomass burning aerosols observed in eastern Finland during the Russian wildfires in summer 2010 – Part 2: Remote sensing, Atmos. Environ., 47, 279–287, 2012.
Migliavacca, M., Dosio, A., Camia, A., Hobourg, R., Houston-Durrant, T., Kaiser, J. W., Khabarov, N., Krasovskii, A. A., Marcolla, B., San-Miguel-Ayanz, J., Ward, D. S., and Cescatti, A.: Modeling biomass burning and related carbon emissions during the 21st century in Europe, J. Geophys. Res.-Biogeo., 118, 1732–1747, 2013.
Milenković, M., Ducić, V., Mihajlović, J., and Babić, V.: Forest fires in Finland: the influence of atmospheric oscillations, J. Geogr. Inst. Cvijic., 69, 75–82, https://doi.org/10.2298/IJGI1901075M, 2019.
Miralles, D. G., Teuling, A. J., van Heerwaarden, C. C., and Vilà-Guerau de Arellano, J.: Mega-heatwave temperatures due to combined soil desiccation and atmospheric heat accumulation, Nat. Geosci., 7, 7345, https://doi.org/10.1038/ngeo2141, 2014.
Mitchell, D., Davini, P., Harvey, B., Massey, N., Haustein, K., Woollings, T., Jones, R., Otto, F., Guillod, B., Sparrow, S., Wallom, D., and Allen, M.: Assessing mid-latitude dynamics in extreme event attribution systems, Clim. Dynam., 48, 3889–3901, https://doi.org/10.1007/s00382-016-3308-z, 2017.
Mishnaevsky, L.: Toolbox for optimizing anti-erosion protective coatings of wind turbine blades: overview of mechanisms and technical solutions, Wind Energy, 22, 1636–1653, https://doi.org/10.1002/we.2378, 2019.
Mohrholz, V., Naumann, M., Nausch, G., Krüger, S., and Gräwe, U.: Fresh oxygen for the Baltic Sea: an exceptional saline inflow after a decade of stagnation, J. Marine Syst., 148, 152–166, https://doi.org/10.1016/j.jmarsys.2015.03.005, 2015.
Mokrech, M., Kebede, A., Nicholls, R, Wimmer, F., and Feyen, L.: An integrated approach for assessing flood impacts due to future climate and socio-economic conditions and the scope of adaptation in Europe, Climatic Change, 128, 245–260, https://doi.org/10.1007/s10584-014-1298-6, 2014.
Montewka, J., Goerlandt, F., Kujala, P., and Lensu, M.: Towards probabilistic models for the prediction of a ship performance in dynamic ice, Cold Reg. Sci. Technol., 112, 14–28, 2015.
Moss, R., Babiker, M., Brinkman, S.; Calvo, E.; Carter, T., Edmonds, J. Elgizouli, I., Emori, S., Erda, L., Hibbard, K., Jones, R., Kainuma, M., Kelleher, J., Lamarque, J. F., Manning, M., Matthews, B., Meehl, J., Meyer, L., Mitchell, J., Nakicenovic, N., O'Neill, B., Pichs, R., Riahi, K., Rose, S., Runci, P., Stouffer, S., van Vuuren, D., Weyant, J., Wilbanks, T., van Ypersele, J. P., and Zurek, M.: Towards New Scenarios for Analysis of Emissions, Climate Change, Impacts, and Response Strategies (PDF), Intergovernmental Panel on Climate Change, Geneva, 132 pp., 2008.
Munich Re: The natural disasters of 2018 in figures, available at: https://www.munichre.com/topics-online/en/climate-change-and-natural-disasters/natural-disasters/the-natural-disasters-of-2018-in-figures.html (last access: 18 December 2021), 2018.
Munk, W. H.: Origin and Generation of Waves, in: Proc. 1st Conf. Coastal Engineering (Long Beach), ASCE, New York, 95–108, 1950.
Mustonen, K.-R., Mykrä, H., Marttila. H., Sarremejane. R., Veijalainen. N., Sippel. K., Muotka. T., and Hawkins, C.: Thermal and hydrologic responses to climate change predict marked alterations in boreal stream invertebrate assemblages, Glob. Change Biol., 24, 2434–2446, https://doi.org/10.1111/gcb.14053, 2018.
Nakamura, T., Yamazaki, K., Iwamoto, K., Honda, M., Miyoshi, Y., Ogawa, Y., and Ukita, J.: A negative phase shift of the winter AO/NAO due to the recent Arctic sea-ice reduction in late autumn, J. Geophys. Res.-Atmos., 120, 3209–3227, https://doi.org/10.1002/2014JD022848, 2015.
Nakicenovic, N., Alcamo, J., Grubler, A., Riahi, K., Roehrl, R. A., Rogner, H.-H., and Victor, N.: Special Report on Emissions Scenarios (SRES), A Special Report of Working Group III of the Intergovernmental Panel on Climate Change, Cambridge University Press, Cambridge, UK, ISBN 0-521-80493-0, 2000.
Nasonova, O. N., Gusev, Y. M., Volodin, E. M., and Kovalev, E. E.: Application of the land surface model SWAP and global climate model INMCM4.0 for projecting runoff of northern Russian rivers, 1. Historical simulations, Water Resour., 45, 73–84, 2018.
Naumann, M., Umlauf, L., Mohrholz, V., Kuss, J., Siegel, H., Waniek, J. J., and Schulz-Bull, D. E.: Hydrographic-hydrochemical assessment of the Baltic Sea 2017, Meereswissenschaftliche Berichte, Warnemünde, 107, 1–97, https://doi.org/10.12754/msr-2018-0107, 2018.
Nikulin, G., Kjellström, E., Hansson, U., Jones, C., Strandberg, G., and Ullerstig, A.: Evaluation and future projections of temperature, precipitation and wind extremes over Europe in an ensemble of regional climate simulations, Tellus A, 63, 41–55, https://doi.org/10.1111/j.1600-0870.2010.00466.x, 2011.
Nilsson, E., Rutgersson, A., Dingwell, A., Björkqvist, J.-V., Pettersson, H., Axell, L., Nyberg, J., and Strömstedt, E.: Characterization of wave energy potential for the Baltic Sea with focus on the Swedish Exclusive Economic Zone, Energies, 12, 793, https://doi.org/10.3390/en12050793, 2019.
Nilsson, E., Wrang, L., Rutgersson, A., Dingwell, A., and Strömstedt, E.: Assessment of extreme and metocean conditions in the Swedish Exclusive Economic Zone for wave energy, Atmosphere, 11, 229, https://doi.org/10.3390/atmos11030229, 2020.
Ning, L. and Bradley, R. S.: NAO and PNA influences on winter temperature and precipitation over the eastern United States in CMIP5 GCMs, Clim. Dynam., 46, 1257–1276, https://doi.org/10.1007/s00382-015-2643-9, 2016.
Niziol, T. A., Snyder, W. R., and Waldstreicher, J. S.: Winter weather forecasting throughout the eastern United States, Part IV: Lake effect snow, Weather Forecast., 10, 61–77, 1995.
Öberg, J.: Cyanobacteria blooms in the Baltic Sea in 2017, HELCOM Baltic Sea Environment Fact Sheets, available at: http://helcom.fi/baltic-sea-trends/environment-fact-sheets/eutrophication/cyanobacterial-blooms-in-the-baltic-sea/, last access: 25 November 2017.
Oikkonen, A., Haapala, J., Lensu, M., and Karvonen, J.: Sea ice drift and deformation in the coastal boundary zone. Geophys. Res. Lett., 43, 10303–10310, https://doi.org/10.1002/2016GL069632, 2016.
Oliver, E. C. J., Burrows, M. T., Donat, M. G., Sen Gupta, A., Alexander, L. V., Perkins-Kirkpatrick, S. E., Benthuysen, J. A., Hobday, A. J., Holbrook, N. J., Moore, P. J., Thomsen, M. S., Wernberg, T., and Smale, D. A.: Projected marine heatwaves in the 21st century and the potential for ecological impact, Frontiers in Marine Science, 6, 734. https://doi.org/10.3389/fmars.2019.00734, 2019.
Olofsson, M., Suikkanen, S., Kobos, J., Wasmund, N., and Karlson, B.: Basin-specific changes in filamentous cyanobacteria community composition across four decades in the Baltic Sea, Harmful Algae, 91, 101685, https://doi.org/10.1016/j.hal.2019.101685, 2020.
Olsson, J., Yang, W., Graham, L. P., Rosberg, J., and Andreasson, J.: Using an ensemble of climate projections for simulating recent and near-future hydrological change to Lake Vanern in Sweden, Tellus A, 63, 126–137, 2011.
Olsson, J., Berg, P., Eronn, A., Simonsson, L., Södling, J., Wern, L., and Yang, W.: Extremregn i nuvarande och framtida klimat: analyser av observationer och framtidsscenarier, Klimatologi, 47, SMHI, Norrköping, Sweden, 70 pp., 2017 (in Swedish).
Olsson, T., Jakkila, J., Veijalainen, N., Backman, L., Kaurola, J., and Vehviläinen, B.: Impacts of climate change on temperature, precipitation and hydrology in Finland – studies using bias corrected Regional Climate Model data, Hydrol. Earth Syst. Sci., 19, 3217–3238, https://doi.org/10.5194/hess-19-3217-2015, 2015.
Olsson, T., Perttula, T., Jylhä, K., and Luomaranta, A.: Intense sea-effect snowfall case on the western coast of Finland, Adv. Sci. Res., 14, 231–239, https://doi.org/10.5194/asr-14-231-2017, 2017.
Olsson, T., Post, P., Rannat, K., Keernik, H., Perttula, T., Luomaranta, A., Jylhä, K., Kivi, R., and Voormansik, T.: Sea-effect snowfall case in the Baltic Sea region analysed by reanalysis, remote sensing data and convection-permitting mesoscale modelling, Geophysica, 53, 65–91, 2018.
Olsson, T., Luomaranta, A., Jylhä, K., Jeworrek, J., Perttula, T., Dieterich, C., Wu, L., Rutgersson, A., and Mäkelä, A.: Statistics of sea-effect snowfall along the Finnish coastline based on regional climate model data, Adv. Sci. Res., 17, 87–104, https://doi.org/10.5194/asr-17-87-2020, 2020.
Omstedt, A. and Chen, D.: Influence of atmospheric circulation on the maximum ice extent in the Baltic Sea, J. Geophys. Res., 106, 4493– 4500, https://doi.org/10.1029/1999JC000173, 2001.
O'Neil, J. M., Davis, T. W., Burford, M. A., and Gobler, C. J.: The rise of harmful cyanobacteria blooms: the potential roles of eutrophication and climate change, Harmful Algae, 14, 313–334, 2012.
Oris, F., Asselin, H., Ali, A. A., Finsinger, W., and Bergeron, Y.: Effect of increased fire activity on global warming in the boreal forest, Environ. Rev., 22, 206–219, 2014.
Orlowsky, B. and Seneviratne, S. I.: Elusive drought: uncertainty in observed trends and short- and long-term CMIP5 projections, Hydrol. Earth Syst. Sci., 17, 1765–1781, https://doi.org/10.5194/hess-17-1765-2013, 2013.
Overland, J., Francis, J. A., Hall, R., Hanna, E., Kim, S. J., and Vihma, T.: The melting Arctic and midlatitude weather patterns: are they connected?, J. Climate, 28, 7917–7932, https://doi.org/10.1175/jcli-d-14-00822.1, 2015.
Owczarek, M. and Filipiak, J.: Contemporary changes of thermal conditions in Poland, 1951–2015, Bulletin of Geography, Physical Geography Series, 10, 31–50, https://doi.org/10.1515/bgeo-2016-0003, 2016.
Paprota, M., Przewłócki, J., Sulisz, W., and Swerpel, B. E.: Extreme waves and wave events in the Baltic Sea, in: Proceedings of MAXWAVE Final Meeting, 8–10 October 2003, Geneva, Switzerland, 2003.
Paprotny, D. and Terefenko, P.: New estimates of potential impacts of sea level rise and coastal floods in Poland, Nat. Hazards, 85, 1249–1277, 2017.
Parviainen, J.: Impact of fire on Finnish forest in the past and today, Silva Fenn., 30, 353–359, https://doi.org/10.14214/sf.a9246, 1996.
Partasenok, I.: Winter cyclone frequency and following freshet streamflow formation on the rivers in Belarus, Environ. Res. Lett., 9, 095005, https://doi.org/10.1088/1748-9326/9/9/095005, 2014.
Patey, M. and Riska, K.: Simulation of ship transit through ice, INSROP, INSROP Working Paper 155-1999, 1999.
Peings, Y. and Magnusdottir, G.: Wintertime atmospheric response to Atlantic multidecadal variability: effect of stratospheric representation and ocean–atmosphere coupling, Clim. Dynam., 47, 1029–1047, https://doi.org/10.1007/s00382-015-2887-4, 2016.
Pellikka, H., Laurila, T. K., Boman, H., Karjalainen, A., Björkqvist, J.-V., and Kahma, K. K.: Meteotsunami occurrence in the Gulf of Finland over the past century, Nat. Hazards Earth Syst. Sci., 20, 2535–2546, https://doi.org/10.5194/nhess-20-2535-2020, 2020.
Peterson, T. C. and Manton, M. J.: Monitoring changes in climate extremes: a tale of international collaboration, B. Am. Meteorol. Soc., 89, 1266–1271, 2008.
Pettersson, H. and Jönsson, A.: Wave climate in the northern Baltic Sea in 2004, HELCOM Baltic Sea Environment Fact Sheets, available at: http://www.helcom.fi/baltic-sea-trends/environment-fact-sheets/ (last access: 10 September 2015), 2005.
Pettersson, H., Kalén, O., and Brüning, T.: Wave climate in the Baltic Sea in 2017, HELCOM Baltic Sea Environment Fact Sheets, available at: http://www.helcom.fi/baltic-sea-trends/environment-fact-sheets/ (last access: 26 March 2019), 2018.
Piotrowski, A., Szczucinski, W., Sydor, P., Kotrys, B., Rzodkiewicz, M., and Krzyminska, J.: Sedimentary evidence of extreme storm surge or tsunami events in the southern Baltic Sea (Rogowo area, NW Poland), Geol. Q., 61, 973–986, 2017.
Poljanšek, K., Marin Ferrer, M., De Groeve, T., and Clarke, I. (Eds.): Science for disaster risk management 2017: knowing better and losing less, EUR 28034 EN, Publications Office of the European Union, Luxembourg, 2017.
Pontoppidan, M., Reuder, J., Mayer, S., and Kolstad, E. W.: Downscaling an intense precipitation event in complex terrain: the importance of high grid resolution, Tellus A, 69, 1271561, https://doi.org/10.1080/16000870.2016.1271561, 2017.
Popovicheva, O., Kistler, M., Kireeva, E., Persiantseva, N., Timofeev, M., Kopeikin, V., and Kaspar-Giebl, A.: Physicochemical characterization of smoke aerosol during large-scale wildfires: extreme event of August 2010 in Moscow, Atmos. Environ., 96, 405–414, https://doi.org/10.1016/j.atmosenv.2014.03.026, 2014.
Prahl, B. F., Boettle, M., Costa, L., Kropp, J. P., and Rybski, D.: Damage and protection cost curves for coastal floods within the 600 largest European cities, Sci. Data, 5, 180034, https://doi.org/10.1038/sdata.2018.34, 2018.
Prein, A. F., Gobiet, A., Truehetz, H., Keuler, K., Goergen, K., Teichmann, C., Fox Maule, C., van Meijgaard, E., Déqué, M., Nikulin, G., Vautard, R., Colette, A., Kjellström, E., and Jacob, D.: Precipitation in the EURO-CORDEX 0.11∘ and 0.44∘ simulations: high resolution, high benefits?, Clim. Dynam., 46, 383–412, https://doi.org/10.1007/s00382-015-2589-y, 2016.
Prudhomme, C., Giuntoli, I., Douglas, E. K., Clark, B., Arnell, N. W., Dankers, R., Fekete, B. M., Franssen, W., Gerten, D., Gosling, S. N., Hagemann, S., Hannah, D. M., Kim, H., Masaki, Yo., Satoh, Y., Stacke, T., Wada, Y., and Wisser, D.: Hydrological droughts in the 21st century, hotspots and uncertainties from a global multimodel ensemble experiment, P. Natl. Acad. Sci. USA, 111, 3262–3267, https://doi.org/10.1073/pnas.1222473110, 2014.
Pryor, S. C., Barthelmie, R. J., Clausen, N. E., Drews, M., MacKeller, N., and Kjellström, E.: Analysis of possible changes in intense and extreme wind speeds over Northern Europe under climate change scenarios, Clim. Dynam., 38, 189–208, 2012.
Przybylak, R., Vízi, Z., Araźny, A., Kejna, M., Maszewski, R., and Uscka-Kowalkowska, J.: Poland's climate extremes index, 1951–2005, Geogr. Polonica., 80, 47–58, 2007.
Punkka, A.-J.: Mesoscale convective systems in Finland, Finnish Meteorological Institute Contributions, 116, Helsinki, Finland, available at; http://urn.fi/URN:ISBN:978-951-697-866-9 (last access: 8 December 2021), 2015.
Räämet, A. and Soomere, T.: The wave climate and its seasonal variability in the northeastern Baltic Sea, Est. J. Earth Sci., 59, 100–113, https://doi.org/10.3176/earth.2010.1.08, 2010.
Räämet, A., Soomere, T., and Zaitseva-Pärnaste, I.: Variations in extreme wave heights and wave directions in the north-eastern Baltic Sea, P. Est. Acad. Sci., 59, 182–192, 2010.
Raible, C., Della-Marta, P. M., Schwierz, C., and Blender, R.: Northern hemisphere extratropical cyclones: a comparison of detection and tracking methods and different reanalyses, Mon. Weather Rev., 136, 880–897, 2008.
Räisänen, J.: Effect of atmospheric circulation on recent temperature changes in Finland, Clim. Dynam., 53, 5675–5687, https://doi.org/10.1007/s00382-019-04890-2, 2019.
Räisänen, J. A.: Future climate change in the Baltic Sea region and environmental impacts, in Oxford Research Encyclopedias: Climate Science, edited by: Storch, H. V., Oxford University Press, Oxford, https://doi.org/10.1093/acrefore/9780190228620.013.634, 2017.
Rajczak, J., Pall, P., and Schär, C.: Projections of extreme precipitation events in regional climate simulations for Europe and the Alpine Region, J. Geophys. Res.-Atmos., 118, 3610–3626, https://doi.org/10.1002/jgrd.50297, 2013.
Randerson, J. T., Liu, H., Flanner, M. G., Chambers, S. D., Jin, Y., Hess, P. G., Pfister, G., Mack, M. C., Treseder, K. K., Welp, L. R., Chapin, F. S., Harden, J. W., Goulden, M. L., Lyons, E., Neff, J. C., Schuur, E. A. G., and Zender, C. S.: The impact of boreal forest fire on climate warming, Science, 314, 1130–1132, 2006.
Rauhala, J., Brooks, H. E., Schultz, D. M.: Tornado climatology of Finland, Mon. Weather Rev., 140, 1446–1456, https://doi.org/10.1175/MWR-D-11-00196.1, 2012.
Rauthe, M., Steiner, H., Riediger, U., Mazurkiewicz, A., and Gratzki, A.: A Central European precipitation climatology – Part I: Generation and validation of a high-resolution gridded daily data set (HYRAS), Meteorol. Z., 22, 235–256, https://doi.org/10.1127/0941-2948/2013/0436, 2013.
Ravestein, P., van der Schrier, G., Haarsma, R., Scheele, R., and van den Broek, M.: Vulnerability of European intermittent renewable energy supply to climate change and climate variability, Renew. Sust. Energ. Rev., 97, 497–508, https://doi.org/10.1016/j.rser.2018.08.057, 2018.
Reckermann, M., Omstedt, A., Soomere, T., Aigars, J., Akhtar, N., Bełdowska, M., Bełdowski, J., Cronin, T., Czub, M., Eero, M., Hyytiäinen, K. P., Jalkanen, J.-P., Kiessling, A., Kjellström, E., Kuliński, K., Larsén, X. G., McCrackin, M., Meier, H. E. M., Oberbeckmann, S., Parnell, K., Pons-Seres de Brauwer, C., Poska, A., Saarinen, J., Szymczycha, B., Undeman, E., Wörman, A., and Zorita, E.: Human impacts and their interactions in the Baltic Sea region, Earth Syst. Dynam. Discuss. [preprint], https://doi.org/10.5194/esd-2021-54, in review, 2021.
Reihan, A., Koltsova, T., Kriaučiūnienė, J., Lizuma, L., and Meilutytė-Barauskienė, D.: Changes in water discharges of the Baltic states rivers in the 20th century and its relation to climate change, Nord Hydrol., 38, 401–412, 2007.
Rennert, K. J. and Wallace, J. M.: Cross-frequency coupling, skewness, and blocking in the northern hemisphere winter circulation, J. Climate, 22, 5650–5666, 2009.
Reusch, T. B. H., Dierking, J., Andersson, H. C., Bonsdorff, E., Carstensen, J., Casini, M., Czajkowski, M., Hasler, B., Hinsby, K., Hyytiäinen, K., Johannesson, K., Jomaa, S., Jormalainen, V., Kuosa, H., Kurland, S., Laikre, L., MacKenzie, B. R., Margonski, P., Melzner, F., Oesterwind, D., Ojaveer, H., Refsgaard, J., C., Sandström, A., Schwarz, G., Tonderski, K., Winder, M., and Zandersen, M.: The Baltic Sea as a time machine for the future coastal ocean, Science Advances, 4, eaar8195, https://doi.org/10.1126/sciadv.aar8195, 2018.
Rey, J., Rohat, G., Perroud, M., Goyette, S., and Kasparian, J.: Shifting velocity of temperature extremes under climate change, Environ. Res. Lett., 15, 034027, https://doi.org/10.1088/1748-9326/ab6c6f, 2020.
R'Honi, Y., Clarisse, L., Clerbaux, C., Hurtmans, D., Duflot, V., Turquety, S., Ngadi, Y., and Coheur, P.-F.: Exceptional emissions of NH3 and HCOOH in the 2010 Russian wildfires, Atmos. Chem. Phys., 13, 4171–4181, https://doi.org/10.5194/acp-13-4171-2013, 2013.
Ribeiro, A., Barbosa, S. M., Scotto, M. G., and Donner, R. V.: Changes in extreme sea-levels in the Baltic Sea, Tellus A, 66, 20921, https://doi.org/10.3402/tellusa.v66.20921, 2014.
Rodwell, M. J., Rowell, D. P., Folland, C. K.: Oceanic forcing of the wintertime North Atlantic Oscillation and European climate, Nature, 398, 320–323, 1999.
Ronkainen, I., Lehtiranta, J., Lensu, M., Rinne, E., Haapala, J., and Haas, C.: Interannual sea ice thickness variability in the Bay of Bothnia, The Cryosphere, 12, 3459–3476, https://doi.org/10.5194/tc-12-3459-2018, 2018.
Rosenhagen, G. and Bork, I.: Rekonstruktion der Sturmflutwetterlage vom 13. November 1872, MUSTOK-Workshop 2008, Siegen, 4–5 March 2008, 2008.
Roudier, P., Andersson, J., Donnelly, C., Feyen, L., Greuell, W., and Ludwig, F.: Projections of future floods and hydrological droughts in Europe under a +2 ∘C global warming, Climatic Change, 135, 341–355, https://doi.org/10.1007/s10584-015-1570-4, 2016.
Rowe, J. S. and Scotter, G. W.: Fire in the boreal forest, Quaternary Res., 3, 444–464, 1973.
Ruokolainen, L. and Salo, K.: The succession of boreal forest vegetation during ten years after slash-burning in Koli National Park, eastern Finland, Ann. Bot. Fenn., 43, 363–378, 2006.
Ruosteenoja, K., Markkanen, T., Venäläinen, A., Räisänen, P., and Peltola, H.: Seasonal soil moisture and drought occurrence in Europe in CMIP5 projections for the 21st century, Clim. Dynam., 50, 1177–1192, 2018.
Ruosteenoja, K., Markkanen, T., and Räisänen, J.: Thermal seasons in Northern Europe in projected future climate, Int. J. Climatol., 40, 4444–4462, https://doi.org/10.1002/joc.6466, 2020.
Rutgersson, A., Jaagus, J., Schenk, F., and Stendel, M.: Observed changes and variability of atmospheric parameters in the Baltic Sea region during the last 200 years, Clim. Res., 61, 177–190, https://doi.org/10.3354/cr01244, 2014.
Ruuhela, R., Hyvärinen, O., and Jylhä, K.: Regional assessment of temperature-related mortality in Finland, Int. J. Env. Res. Pub. He., 15, 406, https://doi.org/10.3390/ijerph15030406, 2018.
Ruuhela, R., Votsis, A., Kukkonen, J., Jylhä, K., Kankaanpää, S., and Perrels, A.: Temperature-related mortality in Helsinki compared to its surrounding region over two decades, with special emphasis on intensive heatwaves, Atmosphere, 12, 46, https://doi.org/10.3390/atmos12010046, 2021.
Saku, S., Solantie, R., Jylhä, K., Venäläinen, A., and Valta, H.: Äärilämpötilojen alueellinen vaihtelu Suomessa (Spatial variations of extreme temperatures in Finland), Finnish Meteorological Institute, Reports, 2011:1, 92 pp., 2011 (in Finnish with English abstract).
Saranko, O., Fortelius, C. Jylhä, K., Ruosteenoja, K., Brattich, E., Di Sabatino, S., and Nurmi, V.: Impacts of town characteristics on the changing urban climate in Vantaa, Sci. Total Environ., 727, 38471, https://doi.org/10.1016/j.scitotenv.2020.138471, 2020.
Savela, H., Harju, K., Spoof, L., Lindehoff, E., Meriluoto, J., Vehniäinen, M., and Kremp, A.:. Quantity of the dinoflagellate sxtA4 gene and cell density correlates with paralytic shellfish toxin production in Alexandrium ostenfeldii blooms, Harmful Algae, 52, 1–10, 2016.
Savijärvi, H.: Cold air outbreaks over high-latitude sea gulfs, Tellus A, 64, 12244, https://doi.org/10.3402/tellusa.v64i0.12244, 2012.
Savijärvi, H.: Cold air outbreaks along a non-frozen sea channel: effects of wind on snow bands, Meteorol. Atmos. Phys., 127, 383–391, https://doi.org/10.1007/s00703-015-0370-8, 2015.
Scaife, A. A., Knight, J. R., Vallis, G., and Folland, C. K.: A stratospheric influence on the winter NAO and North Atlantic surface climate, Geophys. Res. Lett., 32, L18715 https://doi.org/10.1029/2005GL023226, 2005.
Schenk, F.: The analog-method as statistical upscaling tool for meteorological field reconstructions over Northern Europe since 1850, Dissertation, Univ. Hamburg, 2015.
Schenk, F. and Zorita, E.: Reconstruction of high resolution atmospheric fields for Northern Europe using analog-upscaling, Clim. Past, 8, 1681–1703, https://doi.org/10.5194/cp-8-1681-2012, 2012.
Schimanke, S., Undén, P., Isaksson, L., Edvinsson, L., Ridal, M., Olsson, E., Hopsch, S., and Andersson, S.: Copernicus regional reanalysis for Europe, European Meteorological Society Annual Meeting Abstracts, 16, EMS2019-134, available at: https://meetingorganizer.copernicus.org/EMS2019/EMS2019-134.pdf (last access: 3 July 2020), 2019.
Schubert, S. D., Wang, H., Koster, R. D., Suarez, M. J., and Groisman, P. Y.: Northern Eurasian heat waves and droughts, J. Climate, 27, 3169–3207, https://doi.org/10.1175/JCLI-D-13-00360.1, 2014.
Screen, J. A.: Arctic amplification decreases temperature variance in northern mid- to high-latitudes, Nat. Clim. Change, 4, 577–582, https://doi.org/10.1038/nclimate2268, 2014.
Screen, J. A., Simmonds, I., Deser, C., and Tomas, R.: The atmospheric response to three decades of observed Arctic sea ice loss, J. Climate, 26, 1230–1248, https://doi.org/10.1175/JCLI-D-12-00063.1, 2013.
Scussolini, P., Aerts, J. C. J. H., Jongman, B., Bouwer, L. M., Winsemius, H. C., de Moel, H., and Ward, P. J.: FLOPROS: an evolving global database of flood protection standards, Nat. Hazards Earth Syst. Sci., 16, 1049–1061, https://doi.org/10.5194/nhess-16-1049-2016, 2016.
Seinä, A. and Palosuo, E.: The classification of the maximum annual extent of ice cover in the Baltic Sea 1720–1995, MERI-Report Series of the Finnish Inst. of Marine Res., 27, 79–91, 1996.
Seneviratne, S. I., Nicholls, N., Easterling, D., Goodess, C. M., Kanae, S., Kossin, J., Luo, Y., Marengo, J., McInnes, K., Rahimi, M., Reichstein, M., Sorteberg, A., Vera, C., and Zhang, X.: Changes in climate extremes and their impacts on the natural physical environment, in: Managing the Risks of Extreme Events and Disasters to Advance Climate Change Adaptation, edited by: Field, C. B., Barros, V., Stocker, T. F., Qin, D., Dokken, D. J., Ebi, K. L., Mastrandrea, K. L., Mach, K. J., Plattner, G.-K., Allen, S. K., Tignor, M., and Midgley, P. M., A Special Report of Working Groups I and II of the Intergovernmental Panel on Climate Change (IPCC), Cambridge University Press, Cambridge, UK, and New York, NY, USA, 109–230, 2012.
Seneviratne, S. I., Wilhelm, M., Stanelle, T., van den Hurk, B., Hagemann, S., Berg, A., Cheruy, F., Higgins, M. E., Meier, A., Brovkin, V., Claussen, M., Ducharne, A., Dufresne, J.-L., Findell, K. L., Ghattas, J., Lawrence, D. M., Malyshev, S., Rummukainen, M., and Smith, B.: Impact of soil moisture-climate feedbacks on CMIP5 projections: first results from the GLACE-CMIP5 experiment, Geophys. Res. Lett., 40, 5212–5217, https://doi.org/10.1002/grl.50956, 2013.
Shaw, T. A., Baldwin, M., Barnes, E. A., Caballero, R., Garfinkel, C. I., Hwang, Y.-T., Li, C., O'Gorman, P. A., Rivière, G., Simpson, I. R., and Voigt, A.: Storm track processes and the opposing influences of climate change, Nat. Geosci., 9, 656–664, https://doi.org/10.1038/ngeo2783, 2016.
Sherstyukov, B. G. and Sherstyukov, A. B.: Assessment of increase in forest fire risk in Russia till the late 21st century based on scenario experiments with fifth-generation climate models, Russ. Meteorol. Hydrol., 39, 292–301, 2014.
Shepherd, T. G., Boyd, E., Calel, R. A., Chapman, S. C., Dessai, S., Dima-West, I. M., Fowler, H. J., James, R., Maraun, D., Martius, O., Senior, C. A., Sobel, A. H., Stainforth, D. A., Tett, S. F. B., Trenberth, K. E., van den Hurk, B. J. J. M., Watkins, N. W., Wilby, R. L., and Zenghelis, D. A.: Storylines: an alternative approach to representing uncertainty in physical aspects of climate change, Climatic Change, 151, 555–571, https://doi.org/10.1007/s10584-018-2317-9, 2018.
Shindell, D. T., Schmidt, G. A., Mann, M. E., Rind, D., and Waple, A.: Solar forcing of regional climate change during the Maunder minimum, Science, 294, 2149–2152, 2001.
Shvidenko, A. Z. and Schepaschenko, D. G.: Climate change and wildfires in Russia, Contemp. Probl. Ecol., 6, 683–692, 2013.
Sillmann, J., Kharin, V. V., Zwiers, F. W., Zhang, X., and Bronaugh, D.: Climate extremes indices in the CMIP5 multimodel ensemble: Part 2. Future climate projections, J. Geophys. Res.-Atmos., 118, 2473–2493, https://doi.org/10.1002/jgrd.50188, 2013.
Sinclair, V. A., Mikkola, J., Rantanen, M., and Räisänen, J.: The summer 2018 heatwave in Finland, Weather, 74, 403–409, 2019.
Sinclair, V. A., Rantanen, M., Haapanala, P., Räisänen, J., and Järvinen, H.: The characteristics and structure of extra-tropical cyclones in a warmer climate, Weather Clim. Dynam., 1, 1–25, https://doi.org/10.5194/wcd-1-1-2020, 2020.
Sjöström, J. and Granström, A.: Skogsbränder och gräsbränder i Sverige – Trender och mönster under senare decennier (Wildfires in Sweden – trends and patterns during recent decades), Swedish Civil Contingencies Agency, Karlstad, 104 pp., 2020 (in Swedish with English abstract)
Sjöström, J., Plather, F. V., and Granström, A.: Wildfire ignition from forestry machines in boreal Sweden, Int. J. Wildland Fire, 28, 666–677, https://doi.org/10.1071/WF18229, 2019.
Slonosky, V. C., Jones, P. D., and Davies, T. D.: Variability of the surface atmospheric circulation over Europe, 1774–1995, Int. J. Climatol., 20, 1875–1897, 2000.
Slonosky, V. C., Jones, P. D., and Davies, T. D.: Atmospheric circulation and surface temperature in Europe from the 18th century to 1995, Int. J. Climatol., 21, 63–75, 2001.
Smedman, A.-S.: Occurrence of roll circulation in a shallow boundary layer, Bound.-Lay. Meteorol., 51, 343–358, 1991.
SMHI (Swedish Meteorological and Hydrological Institute): SMHI Home page: Climate indicators – temperature, available at: https://www.smhi.se/en/climate/climate-indicators/climate-indicators-temperature-1.91472 (last access: 7 April 2020), 2019.
Smirnov, N. S., Korotkov, V. N., and Romanovskaya, A. A.: Black carbon emissions from wildfires on forest lands of the Russian Federation in 2007–2012, Russ. Meteorol. Hydrol., 40, 435–442, 2015.
Soomere, T.: Anisotropy of wind and wave regimes in the Baltic Proper, J. Sea Res., 49, 305–316, 2003.
Soomere, T.: Extremes and decadal variations of the northern Baltic Sea wave conditions, in: Extreme Ocean Waves, edited by: Pelinovsky, E. and Kharif, C., Springer, Berlin, 139–157, 2008.
Soomere, T. and Räämet, A.: Long-term spatial variations in the Baltic Sea wave fields, Ocean Sci., 7, 141–150, https://doi.org/10.5194/os-7-141-2011, 2011a.
Soomere, T. and Räämet, A.: Spatial patterns of the wave climate in the Baltic Proper and the Gulf of Finland, Oceanologia, 53, 335–371, 2011b.
Soomere, T., Behrens, A., Tuomi, L., and Nielsen, J. W.: Wave conditions in the Baltic Proper and in the Gulf of Finland during windstorm Gudrun, Nat. Hazards Earth Syst. Sci., 8, 37–46, https://doi.org/10.5194/nhess-8-37-2008, 2008.
Soomere, T., Weisse, R., and Behrens, A.: Wave climate in the Arkona Basin, the Baltic Sea, Ocean Sci., 8, 287–300, https://doi.org/10.5194/os-8-287-2012, 2012.
Sørensen, P., Cutululis, N., Vigueras-Rodriguez, A., Madsen, H., Pinson, P., Jensen, L., Hjerrild, J., and Donovan, M: Modeling of power fluctuations from large offshore wind farms, Wind Energy, 11, 29–43, 2008.
Sousa, P. M., Trigo, R. M., Barriopedro, D., Soares, P. M., Ramos, A. M., and Liberato, M. L.: Responses of European precipitation distributions and regimes to different blocking locations, Clim. Dynam., 48, 1141–1160, 2017.
Spangehl, T., Cubasch, U., Raible, C. C., Schimanke, S., Korper, J., and Hofer, D.: Transient climate simulations from the Maunder minimum to present day: role of the stratosphere, J. Geophys. Res., 115, D00110 https://doi.org/10.1029/2009JD012358, 2010.
Spinoni, J., Vogt, J., Naumann, G., Barbosa, P., and Dosio, A.: Will drought events become more frequent and severe in Europe?, Int. J. Climatol., 38, 1718–1736, https://doi.org/10.1002/joc.5291, 2018.
Stahl, K., Hisdal, H., Hannaford, J., Tallaksen, L. M., van Lanen, H. A. J., Sauquet, E., Demuth, S., Fendekova, M., and Jódar, J.: Streamflow trends in Europe: evidence from a dataset of near-natural catchments, Hydrol. Earth Syst. Sci., 14, 2367–2382, https://doi.org/10.5194/hess-14-2367-2010, 2010.
Stahl, K., Tallaksen, L. M., Hannaford, J., and van Lanen, H. A. J.: Filling the white space on maps of European runoff trends: estimates from a multi-model ensemble, Hydrol. Earth Syst. Sci., 16, 2035–2047, https://doi.org/10.5194/hess-16-2035-2012, 2012.
Stendel, M., van den Besselaar, E., Hannachi, A., Kent, E. C., Lefebvre, C., Schenk, F., van der Schrier, G., and Woollings, T.: Recent change – atmosphere, in: North Sea Region Climate Change Assessment: Regional Climate Studies, edited by: Quante, M. and Colijn, F., Springer, Cham, https://doi.org/10.1007/978-3-319-39745-0_2, 2016.
Stendel, M., Francis, J., White, R., Williams, P. D., and Woollings, T.: The jet stream and climate change, in: Climate Change: Observed Impacts on Planet Earth, 3rd edn., edited by: Letcher, T., Elsevier, 327–357, https://doi.org/10.1016/B978-0-12-821575-3.00015-3, 2021.
Stephenson, D. B., Pavan, V., and Bojariu, R.: Is the North Atlantic Oscillation a random walk?, Int. J. Climatol., 20, 1–18, 2000.
Stephenson, T. S., Goodess, C. M., Haylock, M. R., Chen, A. A., and Taylor, M. A.: Detecting inhomogeneities in Caribbean and adjacent Caribbean temperature data using sea-surface temperatures, J. Geophys. Res.-Atmos., 113, D21116, https://doi.org/10.1029/2007JD009127, 2008.
Stocks, B. J., Mason, J. A., Todd, J. B., Bosch, E. M., Wotton, B. M., Amiro, B. D., Flannigan, M. D., Hirsch, K. G., Logan, K. A., Martell, D. L., and Skinner, W. R.: Large forest fires in Canada, 1959–1997, J. Geophys. Res., 108, D8149, https://doi.org/10.1029/2001JD000484, 2002.
Stonev̧icius, E., Rimkus, E., Bukantis, A., Kriauciuniene, J., Akstinas, V., Jakimavičius, D., Povilaitis, A., Lozys, L., Kesminas, V., Virbickas, T., and Pliūraitė, V.: Recent aridity trends and future projections in the Nemunas River basin, Clim. Res., 75, 143–154, 2018.
Strong, C. and Magnusdottir, G.: Dependence of NAO variability on coupling with sea ice, Clim. Dynam., 36, 1681–1689, 2011.
Sulisz, W., Paprota, M., and Reda, A.: Extreme waves in the southern Baltic Sea, Cienc. Mar., 42, 123–137, https://doi.org/10.7773/cm.v42i2.2599, 2016.
Sun, L., Perlwitz, J., and Hoerling, M.: What caused the recent “Warm Arctic, Cold Continents” trend pattern in winter temperatures? Geophys. Res. Lett., 43, 5345–5352, https://doi.org/10.1002/2016GL069024, 2016.
Suursaar, Ü., Kullas, T., Otsmann, M., Saaremäe, I., Kuik, J., and Merilain, M.: Cyclone Gudrun in January 2005 and modelling its hydrodynamic consequences in the Estonian coastal waters, Boreal Environ. Res., 11, 143–159, 2006.
Svensson, N., Sahlée, E., Bergström, H., Nilsson, E., Badger, M., and Rutgersson, A.: A case study of offshore advection of boundary layer rolls over a stably stratified sea surface, Adv. Meteorol., 2017, 9015891, https://doi.org/10.1155/2017/9015891, 2017.
SYKE (Finnish Environment Institute): Last summer's fish kill was caused by a toxic dinoflagellate: emerging algal toxins in coastal Finnish waters [Press release], available at: https://www.syke.fi/en-US/Current/Press_releases/Last_summers_fish_kill_was_caused_by_a_t(38306) (last access: 1 August 2021), 2016.
SYKE (Finnish Environment Institute): Summary of algal bloom monitoring 2018: Sweltering summer brought exceptional cyanobacterial surface blooms to sea areas, in lakes abundant cyanobacterial blooms took place earlier [Press release], available at: https://www.syke.fi/en-US/Current/Algal_reviews/Summary_reviews/Summary_of_algal_bloom_monitoring_2018_S(47752) (last access: 1 August 2021), 2018.
SYKE (Finnish Environment Institute): Viileässäkin vedessä viihtyvää sinilevää havaittu Suomenlahdella (Blue-green algae that can thrive in cool water has been observed in the Gulf of Finland) [Press release], available at: https://www.syke.fi/fi-FI/Ajankohtaista/Tiedotteet/Viileassakin_vedessa_viihtyvaa_sinilevaa(48957) (last access: 1 August 2021), 2019.
Szwed, M., Karg, G., Pińskwar, I., Radziejewski, M., Graczyk, D., Kȩdziora, A., and Kundzewicz, Z. W.: Climate change and its effect on agriculture, water resources and human health sectors in Poland, Nat. Hazards Earth Syst. Sci., 10, 1725–1737, https://doi.org/10.5194/nhess-10-1725-2010, 2010.
Tamarin, T. and Kaspi, Y.: The poleward shift of storm tracks under global warming: a Lagrangian perspective, Geophys. Res. Lett., 44, 10666–10674, https://doi.org/10.1002/2017GL073633, 2017.
Taylor, K. E., Stouffer, R. J., and Meehl, G. A.: An overview of CMIP5 and the experiment design, B. Am. Meteorol. Soc., 93, 485–498, https://doi.org/10.1175/BAMS-D-11-00094.1, 2012.
Teuling, A. J.: A hot future for European droughts, Nat. Clim. Change, 8, 364–365, https://doi.org/10.1038/s41558-018-0154-5, 2018.
Thober, S., Kumar, R., Wanders, N., Marx, A., Pan, M., Rakovec, O., Samaniego, L., Sheffield, J., Wood, E. F., and Zink1, M.: Multi-model ensemble projections of European river floods and high flows at 1.5, 2, and 3 degrees global warming, Environ. Res. Lett., 13, https://doi.org/10.1088/1748-9326/aa9e35, 2018.
Thodsen, H., Hasholt, B., and Kjarsgaard, J. H.: The influence of climate change on suspended sediment transport in Danish rivers, Hydrol. Process., 22, 764–774, 2008.
Thorarinsdottir, T. L., Guttorp, P., Drews, M., Kaspersen, P. S., and de Bruin, K.: Sea level adaptation decisions under uncertainty, Water Resour. Res., 53, 8147–8163, 2017.
Thorsteinsson, T.: Climate Change and Energy Systems – Impacts, Risks, Adaption in the Nordic and Baltic Countries, edited by: Thorsteinsson, T. and Björnsson, H., Nordic Council of Ministers, Copenhagen, ISBN 978-92-893-2190-7, p. 220, available at: https://norden.diva-portal.org/smash/get/diva2:701000/FULLTEXT01.pdf, 2011.
Tilinina, N., Gulev, S. K., Rudeva, I., and Koltermann, P.: Comparing cyclone life cycle characteristics and their interannual variability in different reanalyses, J. Climate, 26, 6419–6438, https://doi.org/10.1175/JCLI-D-12-00777.1, 2013.
Tomczyk, A. M. and Bednorz, E.: Heat and cold waves on the southern coast of the Baltic Sea, Baltica, 27, 45–54, https://doi.org/10.5200/baltica.2014.27.05, 2014.
Trewin, B. and Vermont, H.: Changes in the frequency of record temperatures in Australia, 1957–2009, Aust. Meteorol. Ocean., 60, 113–119, 2010.
Trigo, I. F.: Climatology and interannual variability of storm-tracks in the Euro-Atlantic sector: a comparison between ERA-40 and NCEP/NCAR reanalyses, Clim. Dynam., 26, 127–143, 2006.
Tuomi, L., Kahma, K. K., and Pettersson, H.: Wave hindcast statistics in the seasonally ice-covered Baltic Sea, Boreal Environ. Res., 16, 451–472, 2011.
Tuomi, L., Kanarik, H., Björkqvist, J.-V., Marjamaa, R., Vainio, J., Hordoir, R., Höglund, A., and Kahma, K. K.: Impact of ice data quality and treatment on wave hindcast statistics in seasonally ice-covered seas, Front. Earth Sci., 7, 166, https://doi.org/10.3389/feart.2019.00166, 2019.
Twardosz, R., Kossowska-Cezak, U., and Pełech, S.: Extremely cold winter months in Europe (1951–2010), Acta Geophys., 64, 2609–2629, https://doi.org/10.1515/acgeo-2016-0083, 2016.
Uotila, P., Vihma, T., and Haapala, J.: Atmospheric and oceanic conditions and the extremely mild Baltic Sea ice winter 2014/15, Geophys. Res. Lett., 42, 7740–7749, https://doi.org/10.1002/2015GL064901, 2015.
Vajda, A., Tuomenvirta, H., Juga, I., Nurmi, P., Jokinen, P., and Rauhala, J.: Severe weather affecting European transport systems: the identification, classification and frequencies of events, Nat. Hazards, 72, 169–188, https://doi.org/10.1007/s11069-013-0895-4, 2014.
Valiukas, D.: Sausringi laikotarpiai Vilniuje 1891–2010 m (Dry periods in 1891–2010 in Vilnius), Geography, 47, 9–18, 2011 (in Lithuanian with English summary).
Valiuškevičius, G., Stonevicius, E., Stankunavicius, G., and Brastovickytė-Stankevič, J.: Severe floods in Nemunas River delta, Baltica, 31, 89–99, https://doi.org/10.5200/baltica.2018.31.09, 2018.
van den Hurk, B., Kim, H., Krinner, G., Seneviratne, S. I., Derksen, C., Oki, T., Douville, H., Colin, J., Ducharne, A., Cheruy, F., Viovy, N., Puma, M. J., Wada, Y., Li, W., Jia, B., Alessandri, A., Lawrence, D. M., Weedon, G. P., Ellis, R., Hagemann, S., Mao, J., Flanner, M. G., Zampieri, M., Materia, S., Law, R. M., and Sheffield, J.: LS3MIP (v1.0) contribution to CMIP6: the Land Surface, Snow and Soil moisture Model Intercomparison Project – aims, setup and expected outcome, Geosci. Model Dev., 9, 2809–2832, https://doi.org/10.5194/gmd-9-2809-2016, 2016.
van der Linden, E. C., Haarsma, R. J., and van der Schrier, G.: Impact of climate model resolution on soil moisture projections in central-western Europe, Hydrol. Earth Syst. Sci., 23, 191–206, https://doi.org/10.5194/hess-23-191-2019, 2019.
van Haren, R., Haarsma. R. J., de Vries, H., van Oldenborgh, G. J., and Hazeleger, W.: Resolution dependence of circulation forced future central European summer drying, Environ. Res. Lett., 10, 55002, https://doi.org/10.1088/1748-9326/10/5/055002, 2015.
van Vuuren, D. P., Edmonds, J., Kainuma, M., Riahi, K., Thomson, A., Hibbard, K., Hurtt, G. C., Kram, T., Krey, V., Lamarque, J.-F., Masui, T., Meinshausen, M., Nakićenović, N., Smith, S. J., and Rose, S. K.: The representative concentration pathways: an overview, Climatic Change, 109, 5, https://doi.org/10.1007/s10584-011-0148-z, 2011.
Velashjerdi Farahani, A., Jokisalo, J., Korhonen, N., Jylhä, K., Ruosteenoja, K., and Kosonen, R.: Overheating risk and energy demand of Nordic old and new apartment buildings during average and extreme weather conditions under a changing climate, Appl. Sci. 11, 3972, https://doi.org/10.3390/app11093972, 2021.
Vautard, R., Cattiaux, J., Yiou, P., Thépaut, J.-N., and Ciais, P.: Northern hemisphere atmospheric stilling partly attributed to an increase in surface roughness, Nat. Geosci., 3, 756–761, 2010.
Vautard, R., Gobiet, A., Sobolowski, S., Kjellström, E., Stegehuis, A., Watkiss, P., Mendlik. T., Landgren, O., Nikulin, G., Teichmann, C., and Jacob, D.: The European climate under a 2 ∘C global warming, Environ. Res. Lett., 9, 034006, https://doi.org/10.1088/1748-9326/9/3/034006, 2014.
Veijalainen, N., Lotsari, E., Alho, P., Vehvilainen, B., and Kayhko, J.: National scale assessment of climate change impacts on flooding in Finland, J. Hydrol., 391, 333–350, 2010.
Veijalainen, N., Ahopelto, L.,Marttunen, M., Jääskeläinen, J., Britschgi, R., Orvomaa, M., Belinskij, A., and Keskinen, M.: Severe drought in Finland: modeling effects on water resources and assessing climate change impacts, Sustainability, 11, 2450, https://doi.org/10.3390/su11082450, 2019.
Veraverbeke, S., Rogers, B. M., Goulden, M. L., Jandt, R. R., Miller, C. E., Wiggins, E. B., and Randerson, J. T.: Lightning as a major driver of recent large fire years in North American boreal forests, Nat. Clim. Change, 7, 529–534, 2017.
Vihma, T.: Weather extremes linked to interaction of the Arctic and midlatitudes, Clim. Extremes, 226, 39–50, 2017.
Vihma, T. and Haapala, J.: Geophysics of sea ice in the Baltic Sea: A review, Prog. Oceanogr., 80, 129–148, 2009.
Vihma, T., Graversen, R., Chen, L., Handorf, D., Skific, N., Francis, J. A., Tyrrell, N., Hall, R., Hanna, E., Uotila, P., Dethloff, K., Karpechko, A. Y., Björnsson, H., and Overland, J. E.: Effects of the tropospheric large-scale circulation on European winter temperatures during the period of amplified Arctic warming, Int. J. Climatol., 40, 509– 529, https://doi.org/10.1002/joc.6225, 2020.
Viitasalo, M. and Bonsdorff, E.: Global climate change and the Baltic Sea ecosystem: direct and indirect effects on species, communities and ecosystem functioning, Earth Syst. Dynam. Discuss. [preprint], https://doi.org/10.5194/esd-2021-73, in review, 2021.
Vinogradova, A. A., Smirnov, N. S., and Korotkov, V. N.: Anomalous wildfires in 2010 and 2012 on the territory of Russia and supply of black carbon to the Arctic, Atmospheric and Oceanic Optics, 29, 545–550, 2016.
Virkkala, R. and Toivonen, H.: Maintaining Biological Diversity in Finnish Forests, Finnish Environment Institute, Helsinki, 56 pp., 1999.
Vivchar, A.: Wildfires in Russia in 2000–2008: estimates of burnt areas using the satellite MODIS MCD45 data, Remote Sens. Lett., 2, 81–90, 2011.
Volchek, A., Korneyev, V., Parfomuk, S., and Bulak, I.: Water Resources and Their Forecast According to the Climate Change in the Territory of Belarus, Alternativa, Brest, 228 pp., 2017.
Vousdoukas, M. I., Voukouvalas, E., Annunziato, A., Giardino, A., and Feyen, L.: Projections of extreme storm surge levels along Europe, Clim. Dynam., 47, 3171–3190, https://doi.org/10.1007/s00382-016-3019-5, 2016.
Vousdoukas, M. I., Mentaschi, L., Voukouvalas, E., Verlaan, M., and Feyen, L.: Extreme sea levels on the rise along Europe's coasts, Earths Future, 5, 304–323, https://doi.org/10.1002/2016EF000505, 2017.
Vousdoukas, M. I., Mentaschi, L., Voukouvalas, E., Bianchi, A., Dottori, F., and Feyen, L.: Climatic and socioeconomic controls of future coastal flood risk in Europe, Nat. Clim. Change, 8, 776–780, 2018.
Vousdoukas, M. I., Mentaschi, L., Voukouvalas, E., and Feyen, L.: PESETA III – Task 8: Coastal Impacts, EUR 28243 EN, Publications Office of the European Union, Luxembourg, ISBN 978-92-79-63951-7, https://doi.org/10.2788/204754, JRC103909, 2019.
Vousdoukas, M. I., Mentaschi, L., Hinkel, J., Ward, P. J., Mongelli, I., Ciscar J.-C., and Feyen, L.: Economic motivation for raising coastal flood defenses in Europe, Nat. Commun., 11, 2119, https://doi.org/10.1038/s41467-020-15665-3, 2020.
Wallenius, T.: Major decline in fires in coniferous forests – reconstructing the phenomenon and seeking for the cause, Silva Fenn., 45, 139–155, 2011.
Walker, X. J., Baltzer, J. L., Cumming, S. G., Day, N. J., Ebert, C., Goetz, S., Johnstone, J. F., Potter, S., Rogers, B. M., Schuur, E. A. G., Turetsky, M. R., and Mack, M. C.: Increasing wildfires threaten historic carbon sink of boreal forest soils, Nature, 572, 520–523, 2019.
Walther, A., Jeong, J.-H., Nikulin, G., Jones, C., and Chen, D.: Evaluation of the warm season diurnal cycle of precipitation over Sweden simulated by the Rossby Centre regional climate model RCA3, Atmos. Res., 119, 131–139, https://doi.org/10.1016/j.atmosres.2011.10.012, 2013.
Wang, J., Kim, H. M., and Chang, E. K. M.: Changes in northern hemisphere winter storm tracks under the background of Arctic amplification, J. Climate, 30, 3705–3724, https://doi.org/10.1175/JCLI-D-16-0650.1, 2017.
Wang, X. L., Feng, Y., Chan, R., and Isaac, V.: Inter-comparison of extra-tropical cyclone activity in nine reanalysis datasets, Atmos. Res., 181, 133–153, https://doi.org/10.1016/j.atmosres.2016.06.010, 2016.
Wanner, H., Brönnimann, S., Casty, C., Gyalistras, D., Luterbacher, J., Schmutz, C., Stephenson, D. B., and Xoplaki, E.: North Atlantic Oscillation: concepts and studies, Surv. Geophys., 22, 321–381, 2001.
Wasmund, N.: Occurrence of cyanobacterial blooms in the Baltic Sea in relation to environmental conditions, Int. Rev. Ges. Hydrobio., 82, 169–184, 1997.
Wasmund, N.: Harmful algal blooms in coastal waters of the south-eastern Baltic Sea, in: Baltic Coastal Ecosystems, edited by: Schernewski, G. and Schiewer, U., Springer, Berlin, Heidelberg, New York, 93–116, 2002.
Wasmund, N., Nausch, G., and Voss, M.: Upwelling events may cause cyanobacteria blooms in the Baltic Sea, J. Marine Syst., 90, 67–76, 2012.
Wasmund, N., Nausch, G., and Feistel, R.: Silicate consumption: an indicator for long term trends in spring diatom development in the Baltic Sea, J. Plankton Res., 35, 393–406, https://doi.org/10.1093/plankt/fbs101, 2013.
Wasmund, N., Kownacka, J., Göbel, J., Jaanus, A., Johansen, M., Jurgensone, I., Lehtinen, S., and Powilleit, M.: The diatom/dinoflagellate index as an indicator of ecosystem changes in the Baltic Sea. 1. Principle and handling instruction, Frontiers in Marine Science, 4, 1–13, https://doi.org/10.3389/fmars.2017.00022, 2017.
Wasmund, N., Nausch, G., Gerth, M., Busch, S., Burmeister, C., Hansen, R., and Sadkowiak, B.: Extension of the growing season of phytoplankton in the western Baltic Sea in response to climate change, Mar. Ecol. Prog. Ser., 622, 1–16, 2019.
Weisse, R., Dailidienė, I., Hünicke, B., Kahma, K., Madsen, K., Omstedt, A., Parnell, K., Schöne, T., Soomere, T., Zhang, W., and Zorita, E.: Sea level dynamics and coastal erosion in the Baltic Sea region, Earth Syst. Dynam., 12, 871–898, https://doi.org/10.5194/esd-12-871-2021, 2021.
Weyant, J., Azar, C., Kainuma, M., Kejun, J., Nakicenovic, N., Shukla, P. R., La Rovere, E., and Yohe, G.: Report of 2.6 Versus 2.9 Watts/m2RCPP Evaluation Panel (PDF), IPCC Secretariat, Geneva, Switzerland, 2009.
Whan, K., Zscheischler, J., Orth, R., Shongwe, M., Rahimi, M., Asare, E. O., and Seneviratne, S. I.: Impact of soil moisture on extreme maximum temperatures in Europe, Weather and Climate Extremes, 9, 57–67, https://doi.org/10.1016/j.wace.2015.05.001, 2015.
Wilcke, R. A. I., Kjellström, E., Lin, C., Matei, D., Moberg, A., and Tyrlis, E.: The extremely warm summer of 2018 in Sweden – set in a historical context, Earth Syst. Dynam., 11, 1107–1121, https://doi.org/10.5194/esd-11-1107-2020, 2020.
Willison, J., Robinson, W. A., and Lackmann, G. M.: North Atlantic storm-track sensitivity to warming increases with model resolution, J. Climate, 2, 4513–4524, https://doi.org/10.1175/JCLI-D-14-00715.1, 2015.
Wilson, D., Hisdal, H., and Lawrence, D.: Has streamflow changed in the Nordic countries? Recent trends and comparisons to hydrological projections, J. Hydrol., 394, 334–346, 2010.
Witte, J. C., Douglass, A. R., da Silva, A., Torres, O., Levy, R., and Duncan, B. N.: NASA A-Train and Terra observations of the 2010 Russian wildfires, Atmos. Chem. Phys., 11, 9287–9301, https://doi.org/10.5194/acp-11-9287-2011, 2011.
Wolski, T., Wiśniewski, B., Giza, A., Kowalewska-Kalkowska, H., Boman, H., Grabbi-Kaiv, S., Hammarklint, T., Holfort, J., and Lydeikaitė, Z.: Extreme sea levels at selected stations on the Baltic Sea coast, Oceanologia, 56, 259–290, https://doi.org/10.5697/oc.56-2.259, 2014.
Woodruff, S. D., Worley, S. J., Lubker, S. J., Ji, Z., Freeman, J. E., Berry, D. I., Brohan, P., Kent, E. C., Reynolds, R. W., Smith, S. R., and Wilkinson, C.: ICOADS Release 2.5 and data characteristics, Int. J. Climatol., 31, 951–967, 2011.
Woollings, T., Barriopedro, D., Methven, J., Son, S. W., Martius, O., Harvey, B., Sillmann, J., Lupo, A. R., and Seneviratne, S.: Blocking and its response to climate change, Current Climate Change Reports, 4, 287–300, https://doi.org/10.1007/s40641-018-0108-z, 2018.
Wotton, B. M., Nock, C. A., and Flannigan, M. D.: Forest fire occurrence and climate change in Canada, Int. J. Wildland Fire, 19, 253–271, 2010.
Wright, D. M., Posselt, D. J., and Steiner, A. L.: Sensitivity of lake-effect snowfall to lake ice cover and temperature in the Great Lakes Region, Mon. Weather Rev., 141, 670–689, https://doi.org/10.1175/MWR-D-12-00038.1, 2013.
Xia, L., Zahn, M., Hodges, K. I., and Feser, F.: A comparison of two identification and tracking methods for polar lows, Tellus A, 64, 17196, https://doi.org/10.3402/tellusa.v64i0.17196, 2012.
Yang, W., Andreasson, J., Graham, L. P., Olsson, J., Rosberg, J., and Wetterhall, F.: Distribution-based scaling to improve usability of regional climate model projections for hydrological climate change impacts studies, Hydrol. Res., 41, 211–229, 2010.
Yang, W., Gardelin, M., Olsson, J., and Bosshard, T.: Multi-variable bias correction: application of forest fire risk in present and future climate in Sweden, Nat. Hazards Earth Syst. Sci., 15, 2037–2057, https://doi.org/10.5194/nhess-15-2037-2015, 2015.
Yu, P., Toon, O. B., Bardeen, C. G., Zhu, Y., Rosenlof, K. H., Portmann, R. W., Thornberry, T. D., Gao, R.-S., Davis, S. M., Wolf, E. T., de Gouw, J., Peterson, D. A., Fromm, M. D., and Robock, A.: Black carbon lofts wildfire smoke high into the stratosphere to form a persistent plume, Science, 365, 587–590, 2019.
Zackrisson, O.: Influence of forest fires on the north Swedish boreal forest, Oikos, 29, 22–32, 1977.
Zaitseva-Pärnaste, I. amd Soomere, T.: Interannual variations of ice cover and wave energy flux in the northeastern Baltic Sea, Ann. Glaciol., 54, 175–182, https://doi.org/10.3189/2013AoG62A228, 2013.
Zappa, G. and Shepherd, T. G.: Storylines of atmospheric circulation change for European regional climate impact assessment, J. Climate, 30, 6561–6577, https://doi.org/10.1175/JCLI-D-16-0807.1, 2017.
Zappa, G., Shaffrey, L. C., and Hodges, K. I.: The ability of CMIP5 models to simulate North Atlantic extratropical cyclones, J. Climate, 26, 5379–5396, https://doi.org/10.1175/JCLI-D-12-00501.1, 2013.
Zappa, G., Masato, G., Shaffrey, L., Woollings, T., and Hodges, K.: Linking northern hemisphere blocking and storm track biases in the CMIP5 climate models, Geophys. Res. Lett., 41, 135–139, https://doi.org/10.1002/2013GL058480, 2014.
Zappa, G., Pithan, F., and Shepherd, T. G.: Multimodel evidence for an atmospheric circulation response to Arctic sea ice loss in the CMIP5 future projections, Geophys. Res. Lett., 45, 1011–1019, https://doi.org/10.1002/2017GL076096, 2018.
Zorita, E., Stocker, T. F., and von Storch, H.: How unusual is the recent series of warm years? Geophys. Res. Lett., 35, L24706, https://doi.org/10.1029/2008GL036228, 2008.
Zscheischler, J., Westra, S., Van Den Hurk, B. J. J. M., Seneviratne, S. I., Ward, P. J., Pitman, A., AghaKouchak, A., Bresch, D. N., Leonard, M., Wahl, T., and Zhang, X: Future climate risk from compound events, Nat. Clim. Change, 8, 469–477, https://doi.org/10.1038/s41558-018-0156-3, 2018.
The requested paper has a corresponding corrigendum published. Please read the corrigendum first before downloading the article.
- Article
(11990 KB) - Full-text XML