the Creative Commons Attribution 4.0 License.
the Creative Commons Attribution 4.0 License.
 | 24 Apr 2019
Evaluation of terrestrial pan-Arctic carbon cycling using a data-assimilation system
Jean-François Exbrayat
Magnus Lund
Torben R. Christensen
Mikkel P. Tamstorf
Darren Slevin
Gustaf Hugelius
Anthony A. Bloom
There is a significant knowledge gap in the current state of the terrestrial carbon (C) budget. Recent studies have highlighted a poor understanding particularly of C pool transit times and of whether productivity or biomass dominate these biases. The Arctic, accounting for approximately 50 % of the global soil organic C stocks, has an important role in the global C cycle. Here, we use the CARbon DAta MOdel (CARDAMOM) data-assimilation system to produce pan-Arctic terrestrial C cycle analyses for 2000–2015. This approach avoids using traditional plant functional type or steady-state assumptions. We integrate a range of data (soil organic C, leaf area index, biomass, and climate) to determine the most likely state of the high-latitude C cycle at a 1∘ × 1∘ resolution and also to provide general guidance about the controlling biases in transit times. On average, CARDAMOM estimates regional mean rates of photosynthesis of 565 g C m−2 yr−1 (90 % confidence interval between the 5th and 95th percentiles: 428, 741), autotrophic respiration of 270 g C m−2 yr−1 (182, 397) and heterotrophic respiration of 219 g C m−2 yr−1 (31, 1458), suggesting a pan-Arctic sink of −67 (−287, 1160) g Cm−2 yr−1, weaker in tundra and stronger in taiga. However, our confidence intervals remain large (and so the region could be a source of C), reflecting uncertainty assigned to the regional data products. We show a clear spatial and temporal agreement between CARDAMOM analyses and different sources of assimilated and independent data at both pan-Arctic and local scales but also identify consistent biases between CARDAMOM and validation data. The assimilation process requires clearer error quantification for leaf area index (LAI) and biomass products to resolve these biases. Mapping of vegetation C stocks and change over time and soil C ages linked to soil C stocks is required for better analytical constraint. Comparing CARDAMOM analyses to global vegetation models (GVMs) for the same period, we conclude that transit times of vegetation C are inconsistently simulated in GVMs due to a combination of uncertainties from productivity and biomass calculations. Our findings highlight that GVMs need to focus on constraining both current vegetation C stocks and net primary production to improve a process-based understanding of C cycle dynamics in the Arctic.
- Article
(12786 KB) - Full-text XML
-
Supplement
(1233 KB) - BibTeX
- EndNote


Arctic ecosystems play a significant role in the global carbon (C) cycle (Hobbie et al., 2000; McGuire et al., 2012). Slow organic matter decomposition rates due to cold and poorly drained soils in combination with cryogenic soil processes have led to an accumulation of large stocks of C stored in the soils, much of which is currently held in permafrost (Tarnocai et al., 2009). The permafrost region soil organic C (SOC) stock is more than twice the size of the atmospheric C stock and accounts for approximately half of the global SOC stock (Hugelius et al., 2014; Jackson et al., 2017). High-latitude ecosystems are experiencing a temperature increase that is nearly twice the global average (AMAP, 2017). The expected future increase in temperature (IPCC, 2013) and precipitation (Bintanja and Andry, 2017) will likely have consequences for the Arctic net C balance. As high latitudes warm, C cycle dynamics may lead to an increase in carbon dioxide (CO2) emissions through ecosystem respiration (Reco) driven by, for example, larger heterotrophic respiration (Commane et al., 2017; Schuur et al., 2015; Zona et al., 2016), drought stress on plant productivity (Goetz et al., 2005), and episodic disturbances (Lund et al., 2017; Mack et al., 2011). Alternatively, temperature-induced vegetation changes (Forkel et al., 2016; Graven et al., 2013; Lucht et al., 2002) may increase gross primary productivity (GPP) due to extended growing seasons (Zeng et al., 2011), CO2 fertilisation (Zhuang et al., 2006), and shifts in vegetation cover such as greening (Myneni et al., 1997; Zhu et al., 2016) and shrub expansion (Myers-Smith et al., 2011). Consequently, ecosystem responses may feed back on climate with unclear magnitude and sign (Anav et al., 2013; Murray-Tortarolo et al., 2013; Peñuelas et al., 2009). As a result of the significant changes that are already affecting the structure and function of Arctic ecosystems, it is critical to understand and quantify the historical C dynamics of the terrestrial tundra and taiga and their sensitivity to climate (McGuire et al., 2012).
Although the land surface is estimated to offset ∼30 % of anthropogenic emissions of CO2 (Canadell et al., 2007; Le Quéré et al., 2018), the terrestrial C cycle is currently the least constrained component of the global C budget and large uncertainties remain (Bloom et al., 2016). Despite the importance of Arctic tundra and taiga biomes in the global land C cycle, our understanding of interactions between the allocation of C from net primary productivity (NPP), C stocks (Cstock), and transit times (TTs) is deficient (Carvalhais et al., 2014; Friend et al., 2014; Hobbie et al., 2000). The TT is a concept that represents the time it takes for a particle of C to persist in a specific C stock, and it is defined by the C stock and its outgoing flux, here addressed as TT = Cstock∕NPP. According to a recent study by Sierra et al. (2017), TT is an important diagnostic metric of the C cycle and a concept that is independent of model-internal structure and theoretical assumptions for its calculation. Terms such as residence time (Bloom et al., 2016; Friend et al., 2014), turnover time (Carvalhais et al., 2014), and turnover rate (Thurner et al., 2016; TT = 1∕turnover rate) are used in the literature to represent the concept of TT (Sierra et al., 2017). Studies have focused more on the spatial variability with climate of ecosystem productivity rather than C transit times (Friend et al., 2014; Nishina et al., 2015; Thurner et al., 2016, 2017). Friend et al. (2014) detailed that transit time dominates uncertainty in terrestrial vegetation responses to future climate and atmospheric CO2. They found a 30 % larger variation in modelled vegetation C change than response of NPP. Nishina et al. (2015) also suggested that long-term C dynamics within ecosystems (vegetation turnover and soil decomposition) are more critical factors than photosynthetic processes (i.e. GPP or NPP). The respective contribution of bias from biomass and NPP to biases in transit times remains unquantified. Without an appropriate understanding of the current state and dynamics of the C cycle, its feedbacks to climate change remains highly uncertain (Hobbie et al., 2000; Koven et al., 2015).
There are currently efforts to incorporate both in situ and satellite-based datasets to assess C cycle retrievals and to reduce their uncertainties. At a local scale, the net ecosystem exchange (NEE) of CO2 between the land surface and the atmosphere is usually measured using eddy covariance (EC) techniques (Baldocchi, 2003). International efforts have led to the creation of global networks such as FLUXNET (http://fluxnet.fluxdata.org/, last access: 9 April 2019) and ICOS (https://www.icos-ri.eu/, last access: 9 April 2019), to harmonise data and support the reduction of uncertainties around the C cycle and its driving mechanisms. However, upscaling field observations to estimate the regional to global C budget presents important challenges due to insufficient spatial coverage of measurements and heterogeneous landscape mosaics (McGuire et al., 2012). Furthermore, harsh environmental conditions in high-latitude ecosystems and their remoteness complicates the collection of high-quality data (Lafleur et al., 2012). Given the lack of continuous, spatially distributed in situ observations of NEE in the Arctic, it remains a challenging task to calculate with certainty whether or not the Arctic is a net C sink or a net C source and how the net C balance will evolve in the future (Fisher et al., 2014). Over the past decade, regional to global products generated from in situ networks and/or satellite observations have improved our understanding of the terrestrial C dynamics. These range from machine-learning-based upscaling of FLUXNET data (Jung et al., 2017), remotely sensed biomass products (Carvalhais et al., 2014; Thurner et al., 2014), and the creation of a global soil database (FAO/IIASA/ISRIC/ISSCAS/JRC, 2012). Due to a reliance on interpolation and upscaling with other spatial data, it is challenging to evaluate these products for inherent biases.
Global vegetation models (GVMs) have been developed to determine global terrestrial C cycling, through representing vegetation and soil processes, including vegetation dynamics (i.e. growth, competition, and turnover) and biogeochemical (i.e. water, carbon, and nutrients cycling) responses to climate variability (Koven et al., 2011; Sitch et al., 2003; Woodward et al., 1995). The advantage of using process-based models to characterise C dynamics is that processes which drive ecosystem–atmosphere interactions can be simulated and reconstructed when data are scarce. However, C cycle modelling in GVMs typically relies on parameters retrieved from literature, prescribed plant functional type (PFT), and a spin-up process ensuring C stocks (biomass and SOC) reach steady state. Further, inherent differences of model structure contribute more significantly to GVM uncertainties (Exbrayat et al., 2018; Nishina et al., 2014) than do differences in climate projections (Ahlström et al., 2012). Many model inter-comparison projects have demonstrated a lack of coherence in future projections of terrestrial C cycling (Ahlström et al., 2012; Friedlingstein et al., 2014). Recent studies have used simulations from the first phase of the Inter-Sectoral Impact Model Inter-comparison Project (ISI-MIP) (Warszawski et al., 2014) to evaluate the importance of key elements regulating vegetation C dynamics but also the estimated magnitude of their associated uncertainties (Exbrayat et al., 2018; Friend et al., 2014; Nishina et al., 2015; Thurner et al., 2017). An important insight is that TTs in GVMs are a key uncertain feature of the global C cycle simulation. Further, GVMs tend not to report uncertainties in their estimates of stocks and fluxes, which weakens their analytical value.
To address these issues we integrate model and data more formally. We apply data assimilation (DA), defined as a Bayesian calibration process for a model of a dynamic system. DA, through probabilistic parameterisation, supports robust model estimates of C stocks and fluxes consistent with multiple observations and their errors (Fox et al., 2009; Luo et al., 2009; Williams et al., 2005). By following Bayesian methods, the uncertainty in observations weights the degree of data constraint, and the outcome is a set of acceptable parameterisations for a given model structure linked to likelihoods. Overall, this approach determines whether model structure, observations, and forcing are (in)consistent and thus assesses the validity of model structure. By assimilating co-located climatic, ecological, and biogeochemical data from remote-sensing observations at a specific grid scale across landscapes and regions, DA can map parameter estimation and uncertainties.
Here, we use the CARbon DAta MOdel framework (CARDAMOM) (Bloom et al., 2016; Bloom and Williams, 2015; Smallman et al., 2017) to analyse the pan-Arctic terrestrial carbon cycle at 1∘ resolution for the 2000–2015 period. We assimilate gridded observations of leaf area index (LAI), biomass, and SOC stocks at these spatio-temporal scales into an intermediate-complexity C model (DALEC2, which is less complex than GVMs). We compare analyses of C dynamics of Arctic tundra and taiga with (a) global products of GPP (Jung et al., 2017) and heterotrophic respiration (Rh) (Hashimoto et al., 2015); (b) NEE, GPP, and Reco field observations from eight high-latitude sites included in the FLUXNET2015 dataset; and (c) six GVMs from the ISI-MIP2a comparison project (Akihiko et al., 2017). Our objectives are to (1) present and evaluate the analyses and uncertainties of the current state of the pan-Arctic terrestrial C cycling using a DA system, (2) quantify the degree of agreement between the CARDAMOM product with local- to global-scale sources of available data to assess analytical bias, and (3) use CARDAMOM as a benchmarking tool for the ISI-MIP2a models to provide general guidance towards GVM improvements in transit time simulation. Finally, we suggest future work to be done in the context of advancing pan-Arctic C cycle modelling.
2.1 Pan-Arctic region
The spatial domain we considered in this study (Fig. S1 in the Supplement) corresponds to the extent of the Northern Circumpolar Soil Carbon Database version 2 (NCSCDv2) dataset (Hugelius et al., 2013a, b), bounded by 42–80∘ N and 180∘ W–180∘ E and at a spatial resolution of 1∘ × 1∘. This area of study totals 18 000 000 km2 of land area. We used the GlobCover vegetation map product developed by the European Space Agency (Bontemps et al., 2011) to separate regions dominated by non-forested (tundra) and forested (taiga) land cover types. A complete description of the classes included in each domain can be found in Fig. S1 and caption. The differentiation between tundra and taiga grid cells is in agreement with the tree line delimitated by Brown et al. (1997) together with the tundra domain defined from the Regional Carbon Cycle Assessment and Processes Activity reported by McGuire et al. (2012). The extensive grasslands without presence of trees in some areas such as in south Russia, Mongolia, and Kazakhstan were neglected to focus on higher latitudes. This classification of tundra and taiga totals 8 100 000 and 9 900 000 km2 of land area, respectively.
2.2 The CARbon DAta MOdel framework
Here we use CARDAMOM (Bloom et al., 2016) (list of acronyms can be found in Table S1 in the Supplement) to retrieve terrestrial C cycle dynamics, including explicit confidence intervals, in the pan-Arctic region. CARDAMOM consist of two key components: (1) an ecosystem model, the Data Assimilation Linked Ecosystem Carbon version 2 (DALEC2) (Bloom and Williams, 2015; Williams et al., 2005), constrained by observations, and (2) a data-assimilation system (Bloom et al., 2016). This framework reconciles observational datasets as part of a representation of the terrestrial C cycle in agreement with ecological theory.
2.2.1 DALEC2
The DALEC2 ecosystem model simulates monthly land–atmosphere C fluxes and the evolution of six C stocks (foliage, labile, wood, roots, soil organic matter – SOM – and surface litter) and corresponding fluxes. DALEC2 includes 17 parameters controlling the processes of plant phenology, photosynthesis (GPP), allocation of primary production to respiration and vegetation carbon stocks and plant and organic matter turnover rates, all established within specific prior ranges based on ecologically viable limits (Table S2; most priors are uniform with broad ranges). DALEC2 simulates canopy-level GPP via the Aggregated Canopy Model (ACM; Williams et al., 1997), and the most sensitive ACM parameter, related to canopy photosynthetic efficiency, is included in the CARDAMOM calibration. DALEC allocates net primary production to the four plant stocks (foliage, labile, wood, and roots) and autotrophic respiration (Ra) as time-invariant fractions of GPP. Plant C decays into litter and soil stocks where microbial decomposition generates heterotrophic respiration (Rh). Turnover of litter and soil stocks is simulated using temperature-dependent first-order kinetics. For practical purposes we aggregated the different C stocks into photosynthetic (Cphoto; leaf and labile), vegetation (Cveg; leaf, labile, wood, and roots), soil (Cdom; litter and SOM), and total () C stocks. The NEE is calculated as the difference between GPP and the sum of the respiration fluxes (), while NPP is the difference between GPP and Ra. Only NEE follows the standard micrometeorological sign convection presenting the uptake of C as negative (sink) and the release of C as positive (source); both GPP and Reco are reported as positive fluxes. In this study, we addressed C turnover rates and decomposition processes as their inverse rates; this is the C transit time (TTphoto, TTveg and TTdom), represented as the ratio between the mean C stock and the mean C input into that stock during the simulation period.
2.2.2 Data-assimilation system
The intermediate complexity of the DALEC2 model compared to typical GVMs facilitates computationally intense Monte Carlo (MC) data-assimilation to optimise the initial stock conditions and the 17 process parameters that shape C dynamics. CARDAMOM is forced with climate data from the European Centre for Medium-Range Weather Forecast Reanalysis interim (ERA-interim) dataset (Dee et al., 2011) monthly for the 2000–2015 period. A Bayesian Metropolis-Hastings Markov chain MC (MHMCMC) algorithm is used to retrieve the posterior distributions of the process parameters according to observational constraints and ecological and dynamic constraints (EDCs; Bloom and Williams, 2015). EDCs ensure that DALEC2 simulations of the terrestrial carbon cycle are realistic and ecologically viable and help to reduce the uncertainty in the model parameters by rejecting estimations that do not satisfy different conditions applied to C allocation and turnover rates as well as trajectories of C stocks.
Observational constraints include monthly time series of LAI from the MOD15A2 product (Myneni et al., 2002), estimates of vegetation biomass (Carvalhais et al., 2014), and soil organic carbon content (Hugelius et al., 2013a, b) (Table S3). We aggregated ∼130 000 1 km resolution MODIS LAI data monthly within each 1∘ × 1∘ pixel. Biomass based on remotely sensed forest biomass (Thurner et al., 2014) and upscaled GPP (Jung et al., 2011) covering the pan-Arctic domain was aggregated to 1∘ resolution (Carvalhais et al., 2014). We used the NCSCD spatially explicit product (Hugelius et al., 2013a, b), which was generated from 1778 soil sample locations interpolated to a 1∘ grid.
We apply the set-up described above to 3304 1∘ × 1∘ pixels (1686 in tundra; 1618 in taiga) using a monthly time step. Each pixel is treated independently without assuming a prior land cover or plant functional type, and we assume no spatial correlation between uncertainties in all pixels. In each 1∘ × 1∘ pixel, we applied the MHMCMC algorithm to determine the probability distribution of the optimal parameter set and initial conditions (xi; Table S2) given observational constraints (Oi; LAI, SOC, and biomass; Table S3) using the same Bayesian inference approach described in Bloom et al. (2016):
First, in the expression 1, p(xi) represents the prior probability distribution of each DALEC2 parameter (xi) and is expressed as
where pEDC(xi) is the prior parameter probability according to the EDCs included in Table S2 and described in Bloom and Williams (2015). In addition, prior values for two parameters and their uncertainties (canopy efficiency, Ceff, and fraction of GPP respired, fauto) are imposed with a log-normal distribution following Bloom et al. (2016) to be consistent with the global GPP range estimated in Beer et al. (2010) and fauto ranges specified by DeLucia et al. (2007), respectively.
Second, p(O|xi) from expression 1 represents the likelihood of xi with respect to Oi, and it is calculated based on the ability of DALEC2 to reproduce (1) biomass (Carvalhais et al., 2014), (2) SOC (Hugelius et al., 2013a, b), and (3) MODIS LAI (Myneni et al., 2002). The reported uncertainty in biomass data from Thurner et al. (2014) was ±37 % at pixel scale. Because of undetermined errors related to tree cover thresholds used in the upscaling and to reflect unknown model structural error, we slightly inflate the error estimate and use a log-transform (1.5) of (i.e. spans 67 % of the expected error). We use the same proportional error for SOC. For MODIS LAI we inflate the proportional error further to log(2) based on well-reported biases in this product for evergreen forests (De Kauwe et al., 2011) and the estimated measurement and aggregation uncertainty for boreal forest LAI of 1 m2 m−2 reported by Goulden et al. (2011). The uncertainty assumptions in expression 3 are chosen due to a lack of better knowledge about the combined uncertainties arising from model representation errors and observation errors:
For each 1∘ × 1∘ pixel we run three MHMCMC chains with 107 accepted simulations each until convergence of at least two chains. We use 500 parameter sets sampled from the second half of each chain to describe the posterior distribution of parameter sets. We produce confidence intervals of terrestrial C fluxes and stocks from the selected parameter sets. In the following we report the highest confidence results (median; P50) and the uncertainty represented by the 90 % confidence interval (5th percentile to 95th percentile – P05, P95). We calculate the transit time for C pools using the approach for non-steady-state pools described in Bloom et al. (2016), Sect. S3.
2.3 Model evaluation against independent in situ and pan-Arctic datasets
At the pan-Arctic scale, we compared CARDAMOM GPP with the FLUXCOM dataset from Jung et al. (2017). We also compared our CARDAMOM Rh with the global spatio-temporal distribution of soil respiration from Hashimoto et al. (2015) calculated by a climate-driven empirical model. To assess the degree of statistical agreement we calculated linear goodness of fit (slope, intercept, R2) between CARDAMOM and the two independent datasets and determined RMSE and bias from direct comparison on model–data residuals. The mapping includes stipples representing locations where the independent datasets are within CARDAMOM's 90 % confidence interval.
At a local scale, we compare CARDAMOM NEE and its partitioned components GPP and Reco estimates with monthly aggregated values from the FLUXNET2015 sites. We selected eight sites (Belelli Marchesini et al., 2007; Bond-Lamberty et al., 2004; Goulden et al., 1996; Ikawa et al., 2015; Kutzbach et al., 2007; López-Blanco et al., 2017; Lund et al., 2012; Sari et al., 2017) located across sub- and high-Arctic latitudes, covering locations with different climatic conditions and dominating ecotypes (Table S4). For this evaluation, we compared the same years for both observations and CARDAMOM, and we selected data using the daytime method (Lasslop et al., 2010) due to the absence of a true night-time period during Arctic summers in some locations. Additionally, we selected a variable u* threshold to identify insufficient turbulence wind conditions from year to year similar to López-Blanco et al. (2017). In this data–model comparison we included the median (P50) ± the 90 % confidence interval (5th to 95th percentiles, (P05, P95)) including both random and u* filtering uncertainty following the method described in Papale et al. (2006). Some of the sites lack wintertime measurements, and we filtered out data for months with less than 10 % observations. We performed a point-to-grid-cell comparison to assess the degree of agreement between each flux magnitude and seasonality calculating the statistics of linear fit (slope, intercept, R2) per flux and site between CARDAMOM and FLUXNET2015 datasets and determined RMSE and bias from model–data residuals comparison.
2.4 Benchmark of global vegetation models from ISI-MIP2a
We compared CARDAMOM analyses of pan-Arctic NPP, vegetation biomass carbon stocks (Cveg) and vegetation transit times (TTveg) with six participating GVMs in the ISI-MIP2a comparison project (Akihiko et al., 2017). In this study we have considered DLEM (Tian et al., 2015), LPJmL (Schaphoff et al., 2013; Sitch et al., 2003), LPJ-GUESS (Smith et al., 2014), ORCHIDEE (Guimberteau et al., 2018), VEGAS (Zeng et al., 2005), and VISIT (Ito and Inatomi, 2012). The specific properties and degree of complexity of each ISI-MIP2a model are summarised in Table S5. The comparisons have been performed under the same spatial resolution as the CARDAMOM spatial resolution (1∘ × 1∘) for the 2000–2010 period. Also, the chosen GVMs from the ISI-MIP2a phase have their forcing based on ERA-Interim climate data, similar to the forcing used in CARDAMOM. We estimated the degree of agreement using the statistics of linear fit (slope, intercept, R2, RMSE, and bias) per variable and model between CARDAMOM and GVMs but also their spatial variability including stipples where the GVM datasets are within CARDAMOM's 90 % confidence interval.
To understand the sources of errors in TTveg calculations, we used CARDAMOM to calculate two hypothetical TTveg (i.e. EXPERIMENT A TTveg = ISI-MIP2a Cveg∕ CARDAMOM NPP and EXPERIMENT B TTveg = CARDAMOM Cveg∕ ISI-MIP2a NPP) and then assessed the largest difference with CARDAMOM's CONTROL TTveg. We estimated the hypothetical TTveg for each pixel in each model and derived a pixel-wise measure of the contribution of biases in NPP and Cveg to biases in TTveg by overlapping their distribution functions.
3.1 Pan-Arctic retrievals of C cycle
Overall, we found that the pan-Arctic region (Fig. 1 and Table 1) acted as a small sink of C (area-weighted P50) over the 2000–2015 period with an average of , 1159.9) g C m−2 yr−1, P50 (P05, P95), although the 90 % confidence intervals remain large (and so the region could be a source of C). Tundra region NEE was estimated at , 1116.1) g C m−2 yr−1, a weaker sink compared to taiga regions, which were established at , 1195.8) g C m−2 yr−1. The photosynthetic inputs exceeded the respiratory outputs (GPP > Reco; Table 1), although the much larger uncertainties stemming from Reco, and more specifically from Rh, compared with GPP complicate the net C sink–source estimate beyond the median's average ensembles. In the pan-Arctic region approximately half of GPP is autotrophically respired, resulting in an NPP of 290.3 (196.4, 410.7) g C m−2 yr−1. Carbon use efficiency (NPP∕GPP) averages 0.51 (0.46, 0.55), and varied marginally across tundra 0.51 (0.46, 0.54) and taiga 0.52 (0.46, 0.56). Despite these apparent small variations, tundra photosynthesised and respired (respectively, 327.2 (236.8, 463.3) and 310.0 (124.3, 1536.8) g C m−2 yr−1) approximately half as much as the Taiga region (759.8 (584.1, 967.9) and 635.3 (285.3, 2114.0) g C m−2 yr−1).
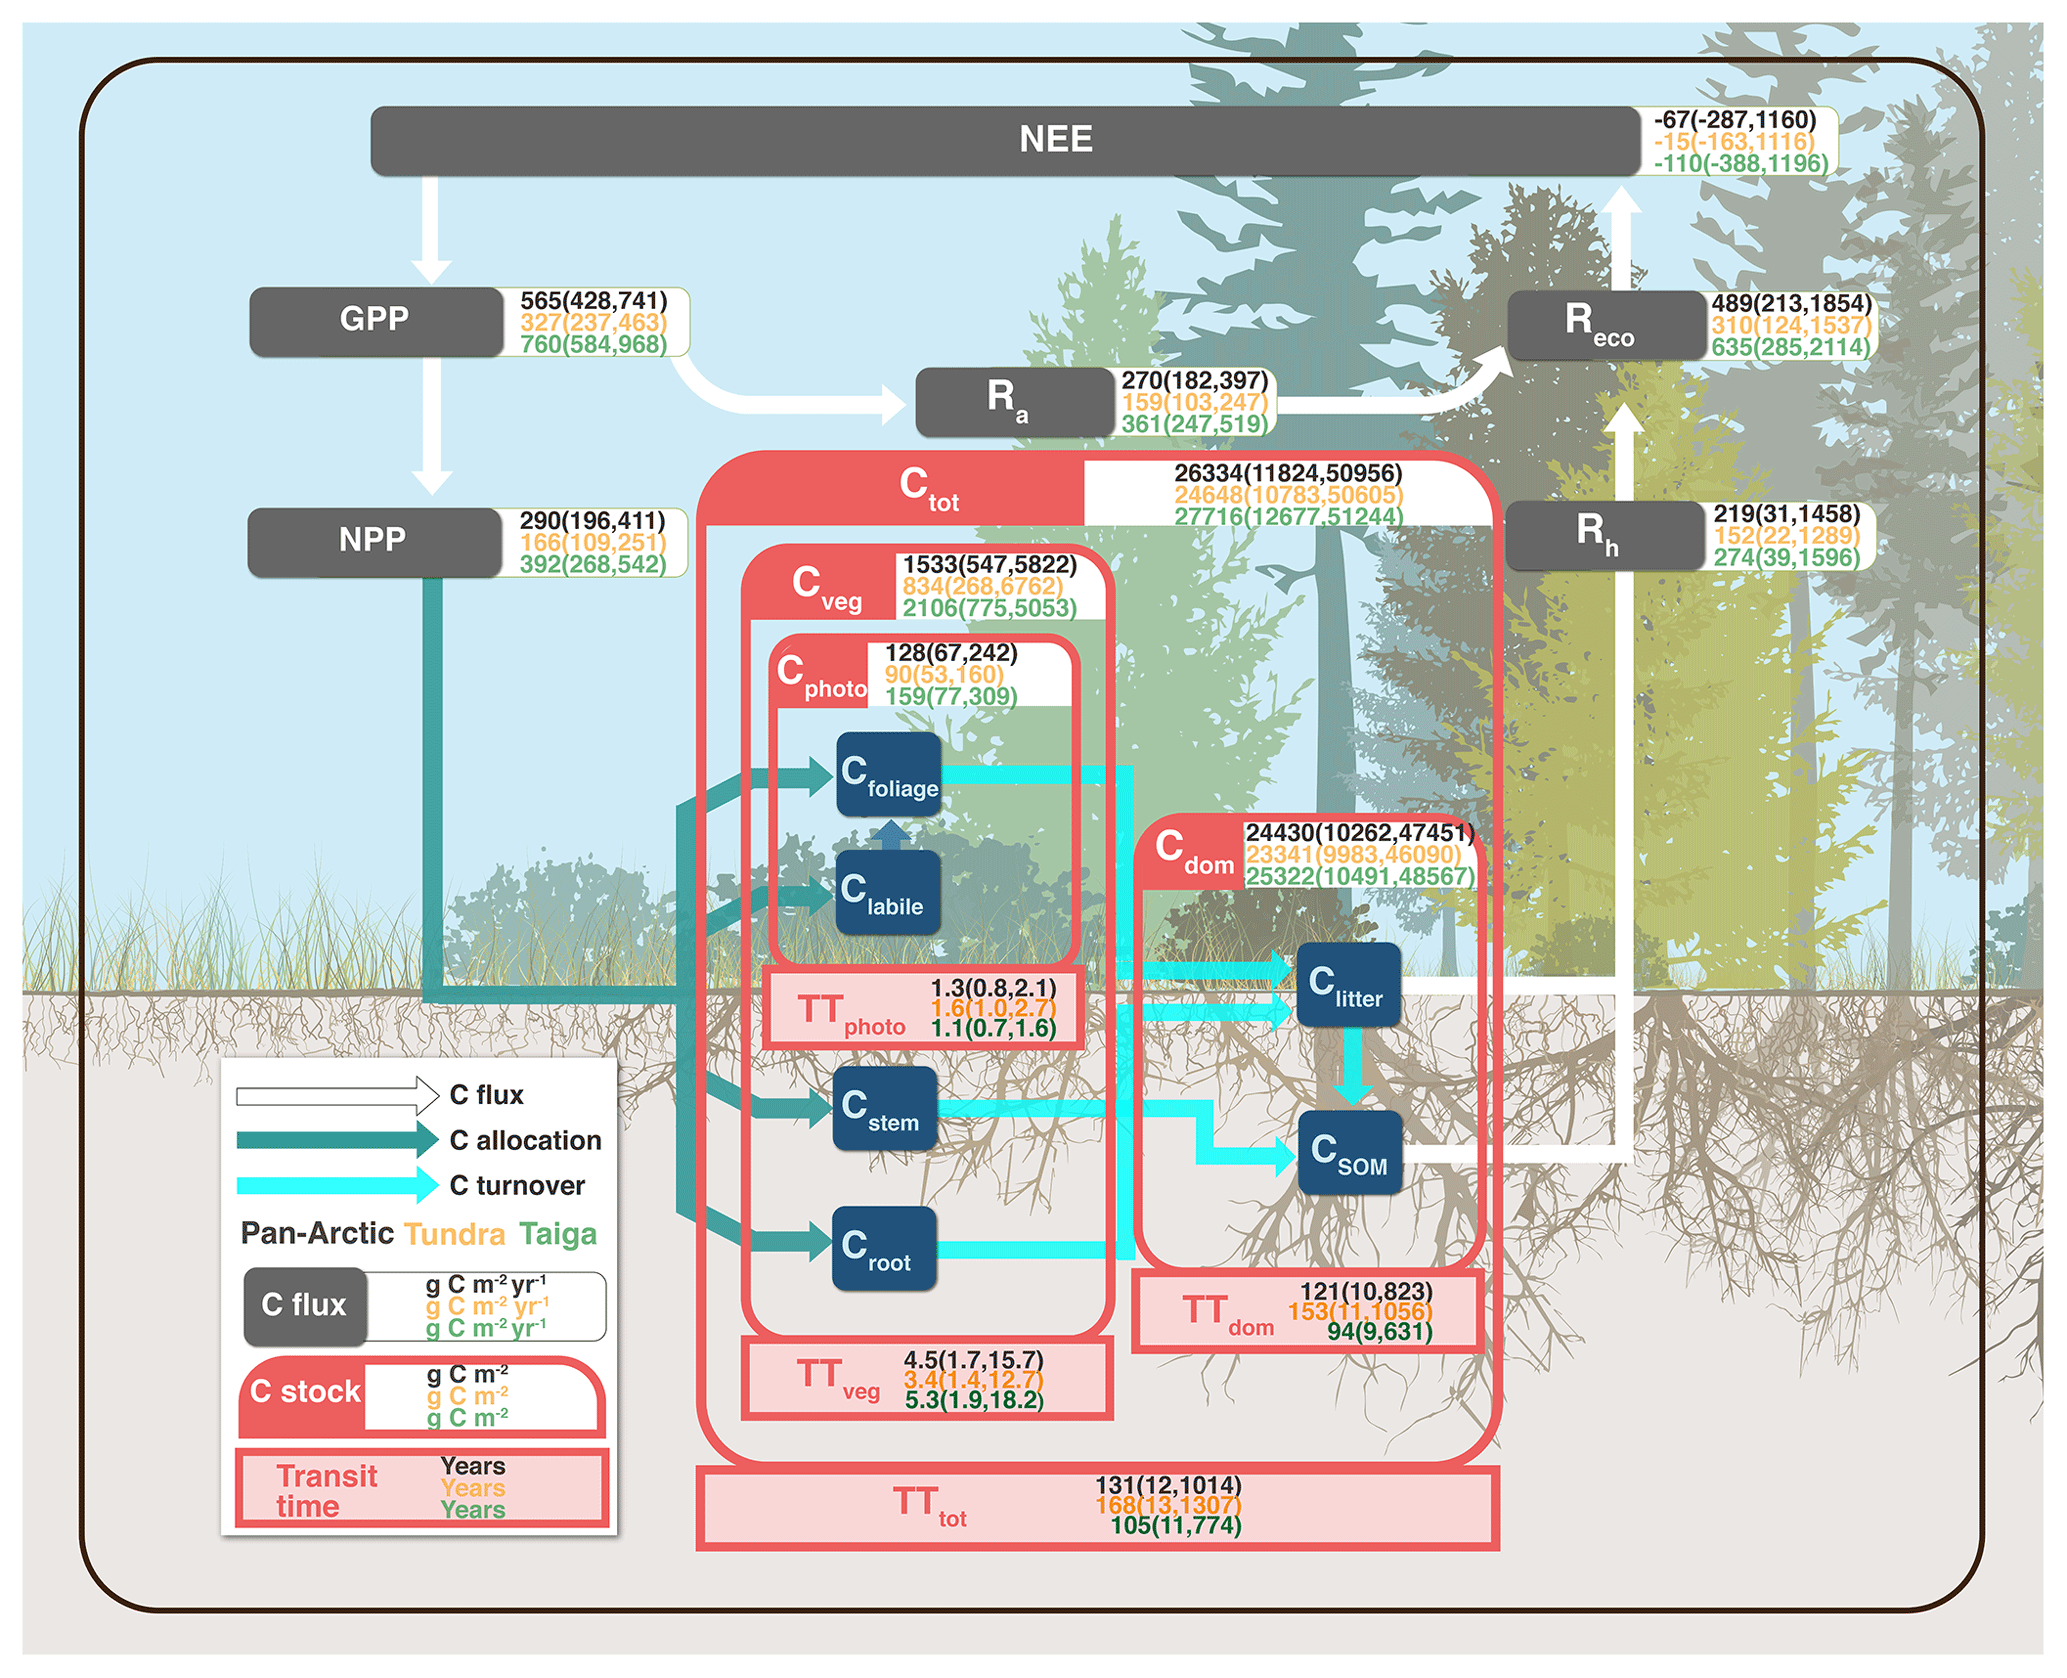
Figure 1Schematic diagram of the terrestrial C processes modelled in CARDAMOM for the pan-Arctic (black values), tundra (yellow values), and taiga (green values) domains. The values characterise the median for the 2000–2015 period and the parentheses delimit the 90 % confidence interval. C processes represented include flows for C fluxes in white (NEE, net ecosystem exchange; GPP, gross primary production; NPP, net primary production; Reco, ecosystem respiration; Ra, autotrophic respiration; Rh, heterotrophic respiration), C allocation in dark green (to labile, leaf, stem and root), and C turnover in cyan (from leaf, wood, roots, and litter). C stocks are represented in dark blue boxes (labile, leaf, stem, root, litter, and SOM, soil organic matter) and aggregated into photosynthetic (Cphoto = leaf + labile), vegetation (Cveg = leaf + labile + wood + roots), soil (Cdom = litter + SOM), and total (Ctot = Cphoto + Cveg + Cdom) C stocks in red boxes. Analogy, transit times (TT) are also aggregated into photosynthetic (TTphoto = leaf + labile), vegetation (TTveg = leaf + labile + wood + roots), soil (TTdom = litter + SOM), and total (TTtot = TTphoto + TTveg + TTdom) C transit times.
Table 1Multi-year (2000–2015) annual average of main ecosystem C fluxes (NEE, GPP, NPP, Reco, Ra, Rh; g C m−2 yr−1), C stocks (Cphoto, Cveg, Cdom, Ctot; kg C m−2) and transit times (TTphoto, TTveg, TTdom, TTtot; years) for the pan-Arctic, tundra (non-forested), and taiga (forested) domain. The averages contain the median in bold (50th percentile) and the uncertainty estimations across the 90 % confidence range between the 5th and 95th percentiles assuming no spatial correlation between uncertainties in all pixels. We assume spatial correlation between pixels: P50, P05, and P95 represent the area-weighted aggregate of all pixels' median, P05, and P95.
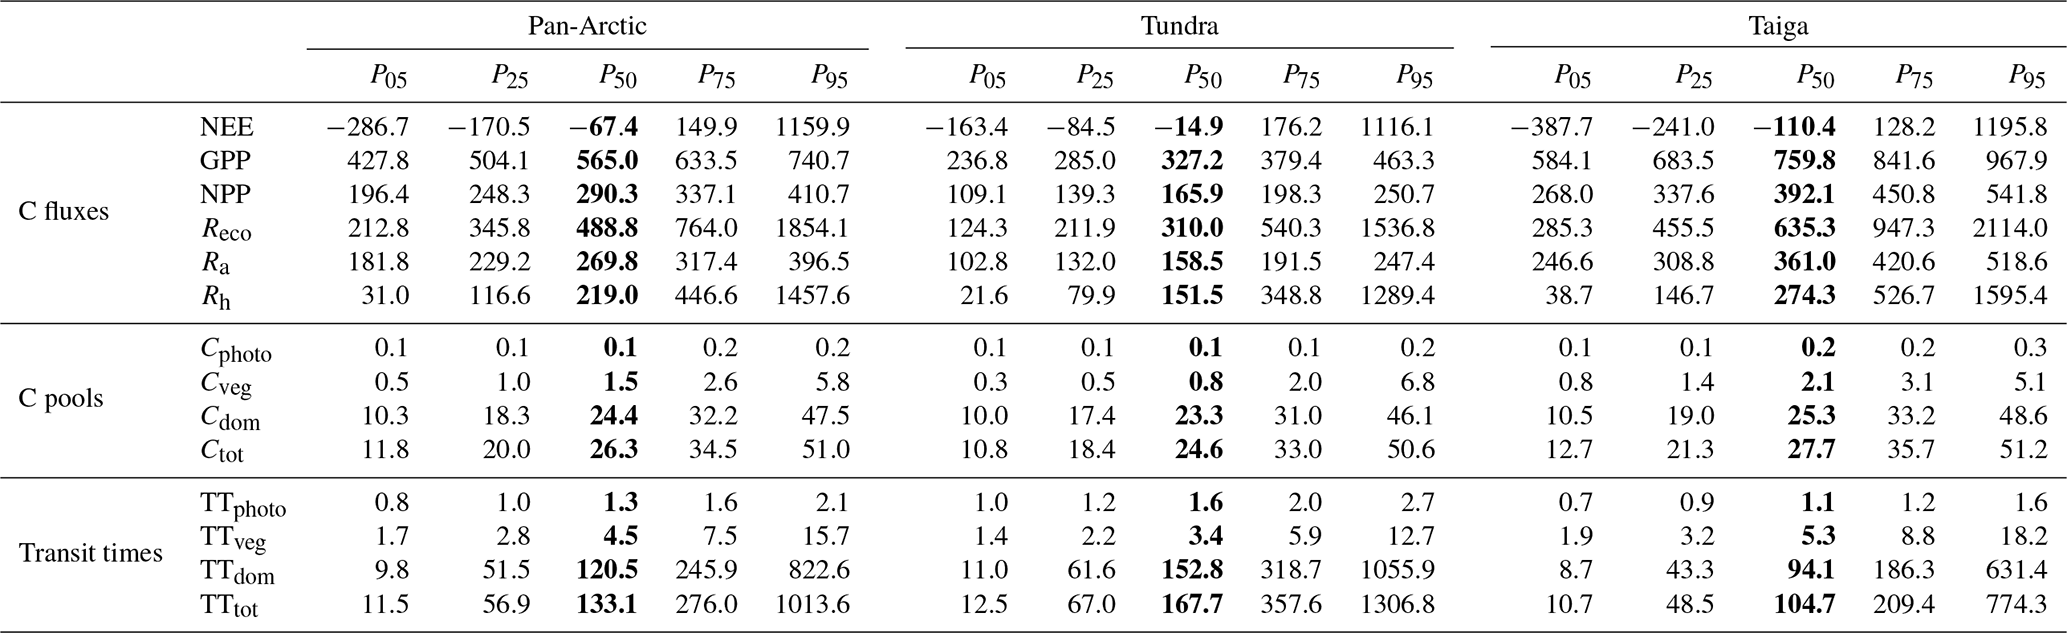
The total size of the pan-Arctic soil C stock (Cdom) averaged 24.4 (10.3, 47.5) kg C m−2, 16-fold greater than the vegetation C stock (Cveg), 1.5 (0.5, 5.8) kg C m−2. The soil C stock (fresh litter and SOM) is dominated by Csom, accounting for the 99 % which also dominates the total terrestrial C stock in the pan-Arctic. Among the living C stocks, 93 % of C (88 % in tundra and 90 % in taiga) is allocated to the structural stocks (wood and roots; 1.4 (0.4, 5.6) kg C m−2) compared to 7 % (12 % in tundra and 10 % in taiga) to the photosynthetic stock (leaves and labile; 0.1 (0.1, 0.2) kg C m−2). On average, the total ecosystem C stock is 26.3 (11.8, 51.0) kg C m−2 in the pan-Arctic region, with slightly lower stocks in tundra (24.6 (10.8, 50.6) kg C m−2) than taiga (27.7 (12.7, 51.2) kg C m−2). In general, the taiga region holds on average ∼100 % more photosynthetic tissues, ∼160 % more structural tissue, and ∼9 % more soil C stocks than tundra. In other words, taiga holds ∼12 % more total C than tundra. The greater living stock of C in taiga (2.1 (0.8, 5.1) kg C m−2) than tundra (0.8 (0.3, 6.8) kg C m−2) means that the relative size of Ra and Rh in the two regions differs. Thus in tundra Ra accounts for 51 % of total ecosystem respiration, while in taiga this fraction is 57 %. Ra is 4 % larger than Rh in tundra but 24 % greater in taiga, reflecting the greater rates of C cycling in taiga. Uncertainties in estimates of soil C stock are notably higher than for living C stocks, highlighting the lack of observational and mechanistic constraint on heterotrophic respiration.
The global mean C transit time is 1.3 (0.8, 2.1) years in leaves and labile plant tissue (TTphoto), 4.5 (1.7, 15.7) years in stems and roots (TTveg), and 120.5 (9.8, 822.6) years in litter and SOM (TTdom). The total C transit time (TTtot) (133.1 (11.5, 1013.6) years) is clearly dominated by the soil C stock, highlighting the very long periods of times that C persists in Arctic soils. CARDAMOM calculated 62 % longer TTdom in tundra compared to taiga, likely linked to lower temperatures, but uncertainties are large due to the limitations of data constraints.
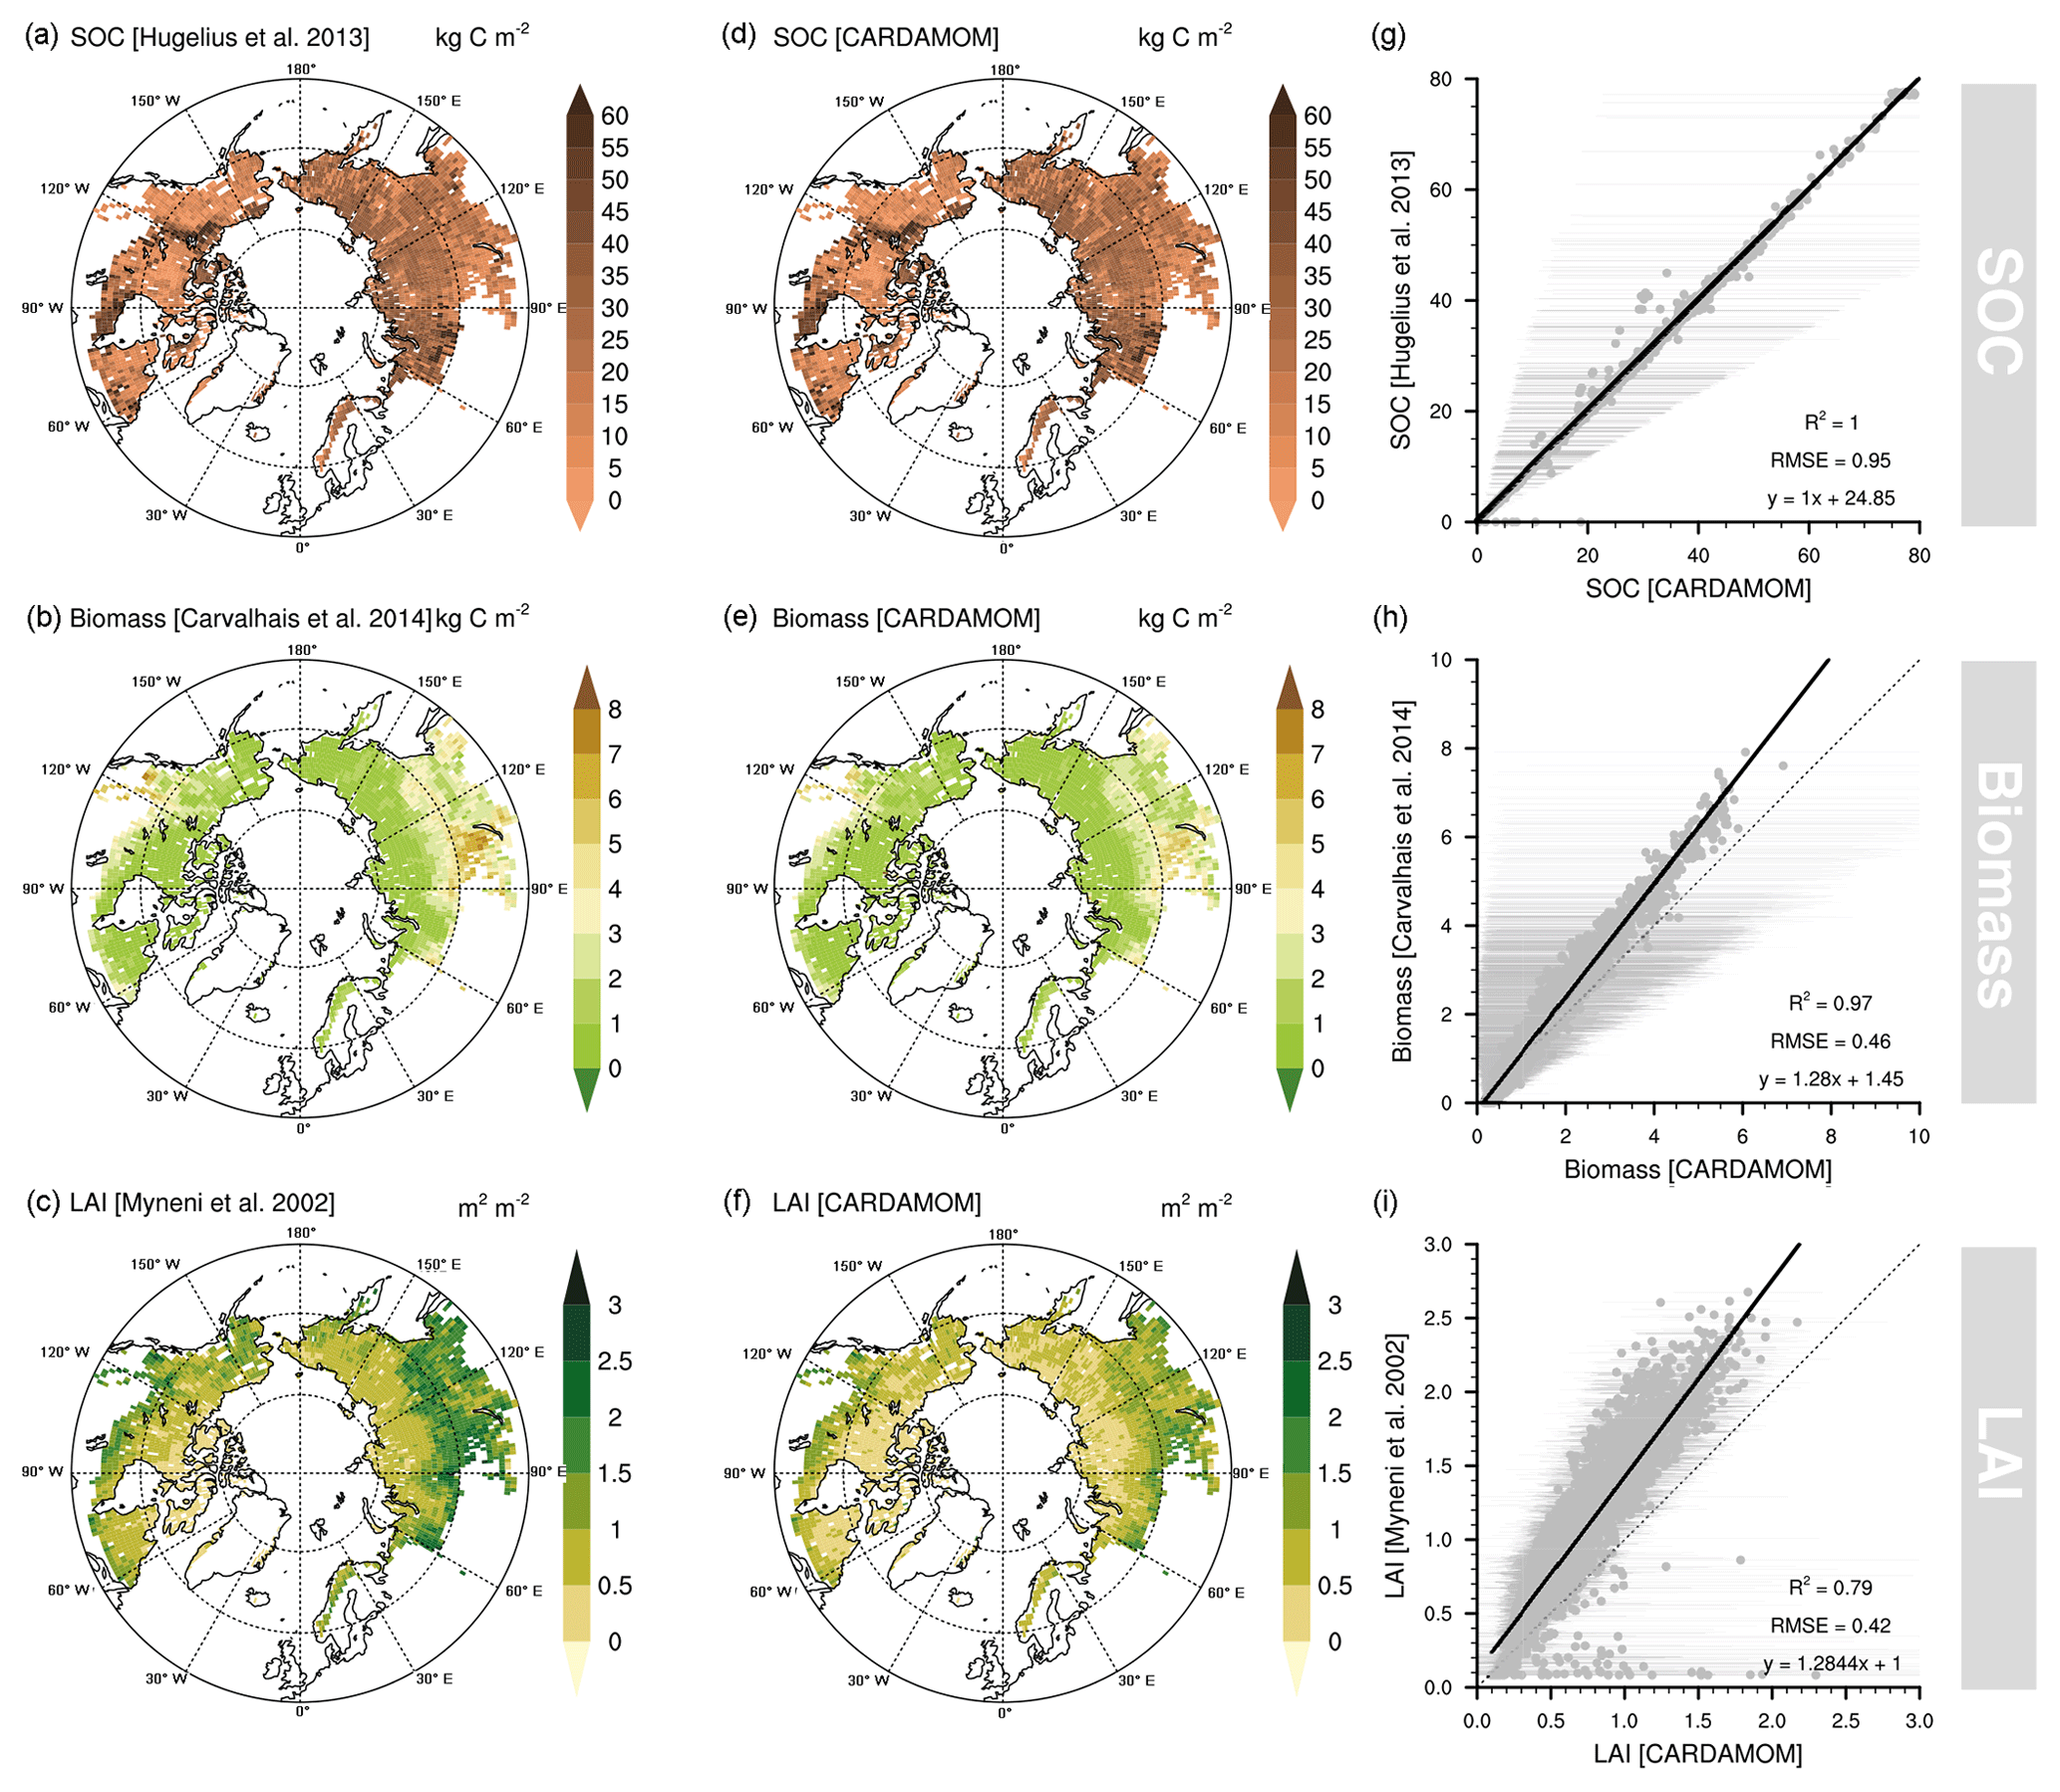
Figure 2Original soil organic carbon (SOC; Hugelius et al., 2013a), biomass (Carvalhais et al., 2014), and leaf area index (LAI; Myneni et al., 2002) datasets used in the data-assimilation process within the CARDAMOM framework (a–c), assimilated SOC, biomass, and LAI integrated into CARDAMOM (d–f) and their respective goodness-of-fit statistics between original and assimilated datasets (g–i). The error bars represent the 90 % confidence interval of the assimilated variable in CARDAMOM.
3.2 Data assimilation and uncertainty reduction
The CARDAMOM framework generated an analysis broadly consistent with the combination of SOC, biomass, and LAI in each grid cell (Fig. 2) and the errors assigned to these data products. The agreement for the SOC dataset by Hugelius et al. (2013a) is a 1:1 relationship (R2=1.0; RMSE = 0.95 kg C m−2), reflecting a straightforward model parameterisation. The biomass product from Carvalhais et al. (2014) was well correlated (R2=0.97; RMSE = 0.46 kg C m−2), but CARDAMOM was consistently biased ∼28 % low. MODIS LAI data were also well correlated ( RMSE = 0.42 kg C m−2) but ∼28 % higher than CARDAMOM analyses. These biases (Fig. 2) likely arise due to a low estimate in the photosynthesis model (ACM) used in CARDAMOM which propagates through the C cycle. CARDAMOM balances uncertainty in data products and the models (ACM photosynthesis model and DALEC2) to generate a weighted analysis typical of Bayesian approaches. The CARDAMOM analysis 90 % confidence interval (CI) includes the 1:1 line for biomass and LAI (Fig. 2), indicating that the likelihoods on C cycle analyses include the expected value of the observations.
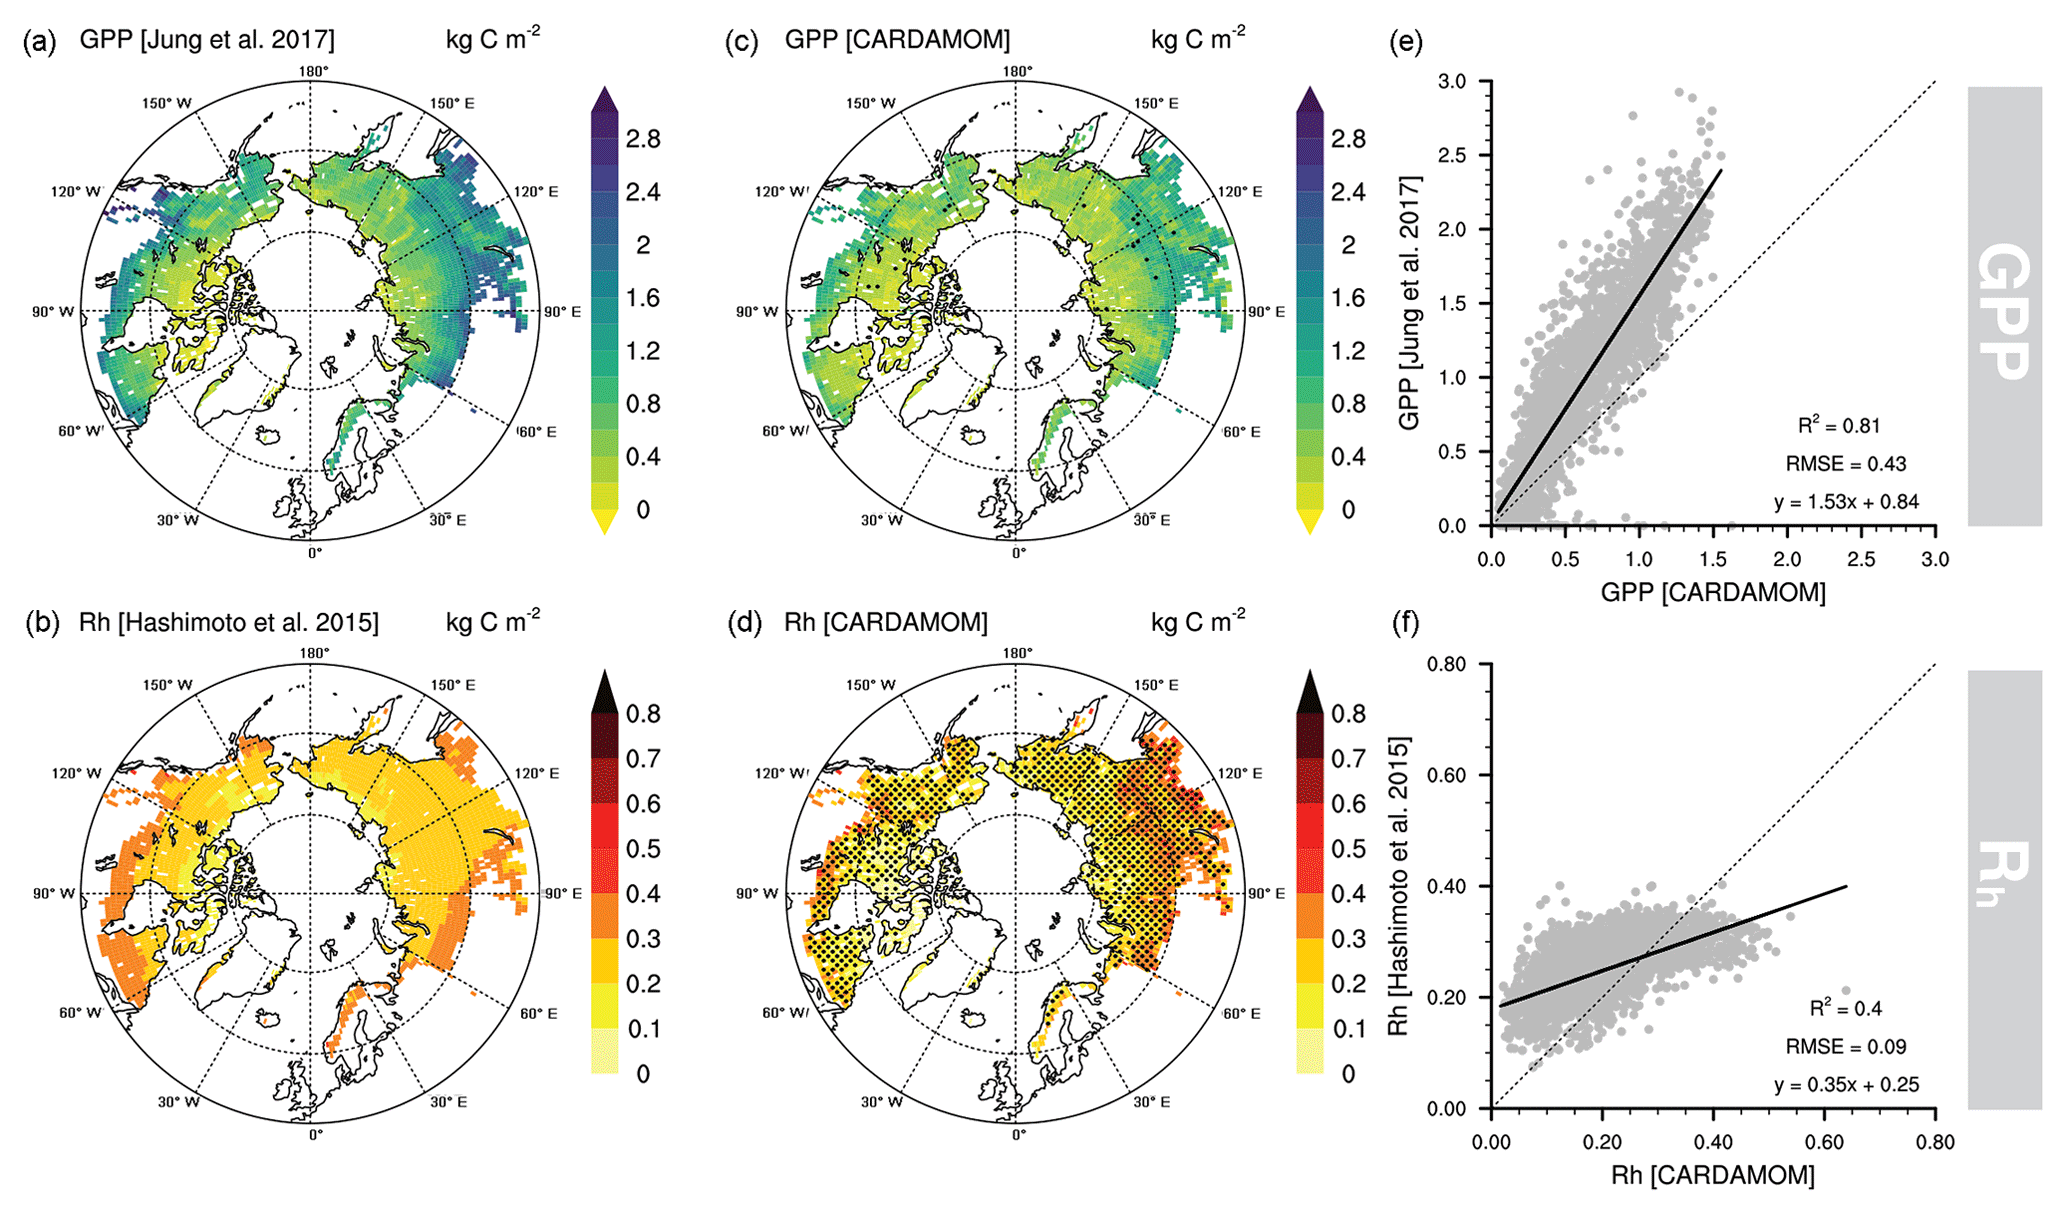
Figure 3Original gross primary productivity (GPP; Jung et al., 2017) and heterotrophic respiration (Rh; Hashimoto et al., 2015) datasets used in the data validation process (a, b), estimated GPP and Rh by CARDAMOM (c, d), and their respective goodness-of-fit statistics between original and assimilated datasets (e, f). Stippling indicates locations where the independent datasets are within CARDAMOM's 5th and 95th percentiles.
The degree to which posterior distributions were constrained from the prior distributions in each of the 17 model parameters and 6 initial stock sizes (Table S2) varied considerably depending on the parameters in question and their related processes (Table 2 and Fig. S2). The 90 % CI posterior range of foliar, wood, labile, and SOM C stocks (Cfoliar, Cwood, Clabile, and Csom) as well as parameters such as allocation to foliage (ffol) and lifespan (L) were considerably reduced (>80 % uncertainty reduction compared to priors) most likely controlled by the information on LAI, biomass, and SOC constraints. Contrarily, parameters that have not been regulated in any way in the MHMCMC algorithm, i.e. turnover processes such as litter mineralisation (MRlitter), root turnover (TORroots), wood turnover (TORwood), decomposition rates (Drate), and initial C stock such as litter (Clitter) were found to be poorly constrained (<20 % uncertainty reduction). Overall, the uncertainty reduction classified by processes and ranked from most to least constrained estimated a 71 % reduction for C stocks, a 67 % reduction for C allocation, 59 % for plant phenology, and 31 % for C turnover related parameters. Although there are no substantial differences between tundra and taiga, Croots was better constrained in tundra regions (42 %), while leaf onset day (Bday), leaf fall day (Fday), and leaf fall duration (Lf) were better constrained in taiga regions (>18 % or more).
Table 2Parameter uncertainty reduction in percentage ranked from least (red) to most (blue) constrained in the pan-Arctic, tundra, and taiga domains. The reduction percentage is calculated based on the difference between the 90 % CI prior range and the 90 % CI posterior range.

3.3 Independent evaluation: from global to local scale
We compared our estimates of GPP and Rh with independent datasets to evaluate the model performance (Fig. 3). We found GPP to be well correlated (R2=0.81; RMSE = 0.43 kg C m−2) but biased lower (∼53 %) compared to Jung et al.'s (2017) GPP estimates. There are in general very few pixels where the FLUXCOM product falls within CARDAMOM's 90 % confidence interval. Additionally, the Rh product from Hashimoto et al. (2015) is less consistent with our estimates (R2=0.40; RMSE = 0.09 kg C m−2), presenting a tendency towards lower values in tundra pixels and higher values in taiga pixels. The spatial variability of Rh is considerably smaller in Hashimoto et al. (2015) compared to our CARDAMOM estimates. Rh falls within the 90 % confidence interval of CARDAMOM in most of the pan-Arctic region due to the fact that the Rh uncertainties are significant (Fig. 3). This finding confirms the uncertainties previously noted in modelled respiratory processes (Table 1) where the upper P95 in Rh dominated NEE's uncertainties but also the soil C stocks and transit times.
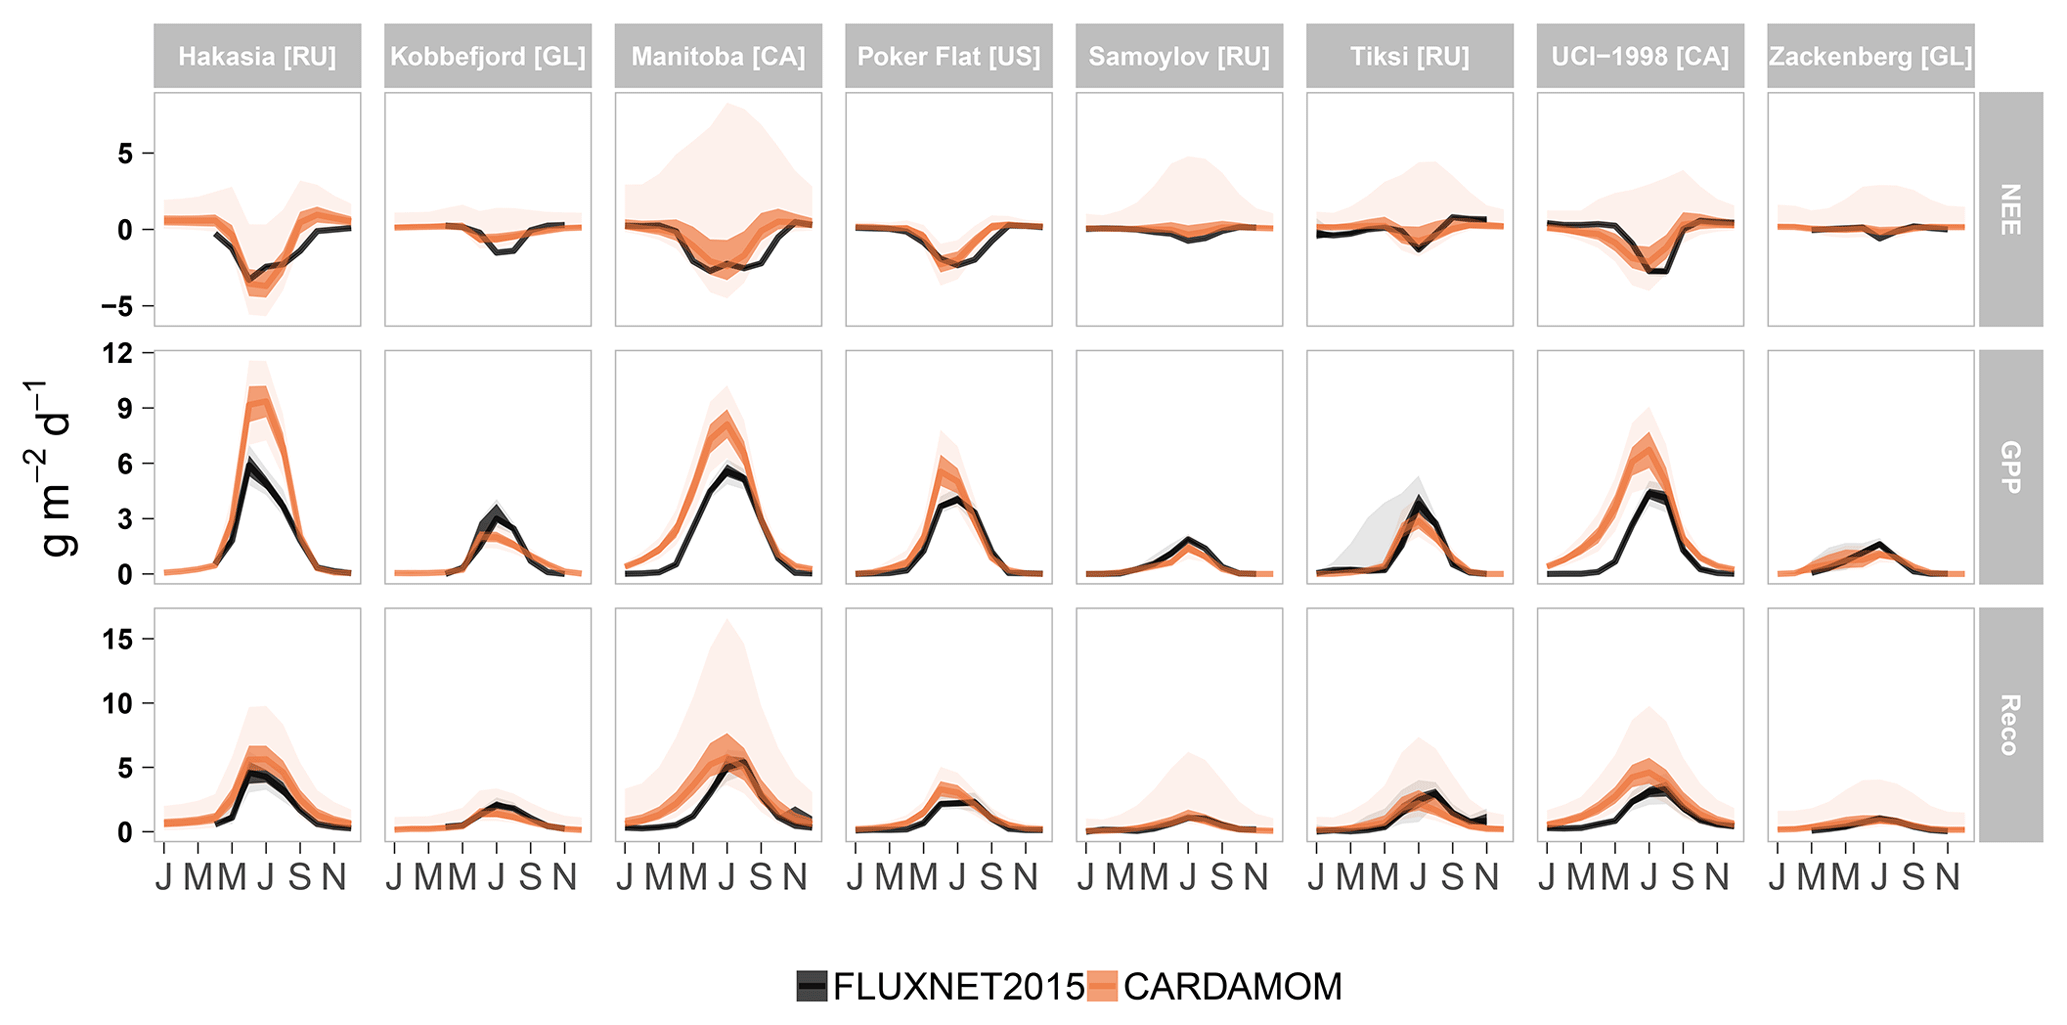
Figure 4Monthly aggregated seasonal variability of observed (FLUXNET2015) and modelled (CARDAMOM) C fluxes (NEE, net ecosystem exchange; GPP, gross primary production; Reco, ecosystem respiration) across eight low- and high-Arctic sites (Hakasia, Kobbefjord, Manitoba, Poker Flat, Samoylov, Tiksi, UCI-1998, and Zackenberg). Each of these sites, located in different countries (RU – Russia; GL – Greenland; CA – Canada; US – United States) feature different meteorological conditions and vegetation types (Table S4). Uncertainties represent the 25th and 50th percentiles (darker shade) and the 5th and 95th percentiles (lighter shade) of both field observations and the CARDAMOM framework.
For comparison with direct ground observations from the FLUXNET2015 dataset, we report here monthly aggregated estimates of NEE, GPP, and Reco to show timing and magnitudes but also to diagnose whether CARDAMOM is in general agreement with flux tower data. Overall, CARDAMOM performed well in simulating observed NEE ( RMSE = 0.51 g C m−2 per month; bias = 0.16 g C m−2 per month), GPP (R2=0.85; RMSE = 0.89 g C m−2 per month; bias = 0.5 g C m−2 per month) and Reco (R2=0.82; RMSE = 0.63 g C m−2 per month; bias = 0.35 g C m−2 per month) across eight sub-Arctic and high-Arctic sites from the FLUXNET2015 dataset (Fig. 4; Table S6). CARDAMOM NEE is ∼25 % lower than FLUXNET2015, while GPP and Reco are ∼30 % and ∼10 % higher, respectively. This mismatch is important in the context of the FLUXCOM GPP upscaling, 50 % higher than CARDAMOM GPP. At some sites such as Hakasia, Samoylov, Poker Flat, and Manitoba (NEE R2=0.73; GPP R2=0.92; Reco R2=0.88), CARDAMOM better matches the seasonality and the magnitude of the C fluxes than the rest, i.e. Tiksi, Kobbefjord, Zackenberg, and UCI-1998 (NEE R2=0.58; GPP R2=0.67; Reco R2=0.67). In general, CARDAMOM captured the beginning and the end of the growing season well (Fig. 4), although the assimilation system has some bias due to (1) a difference in timing (e.g. earlier shifts of peak of the growing season in Manitoba GPP and Reco and earlier end of the growing season in Poker Flat NEE) and (2) differences in flux magnitudes (such as in Hakasia GPP and Reco and Kobbefjord NEE).
3.4 Benchmarking ISI-MIP2a models with CARDAMOM
We used our highest confidence retrievals of NPP, Cveg, and TTveg (i.e. retrievals including assimilated LAI, biomass, and SOC) to benchmark the performance of the GVMs from the ISI-MIP2a project. In this assessment we compared not only their spatial variability across the pan-Arctic, tundra, and taiga region (Fig. 5) but also the degree of agreement between their mean model ensemble within the 90 % confidence interval of our assimilation framework (Fig. 6, Table 3). NPP estimates (RMSE = 0.1 kg C m−2 yr−1; R2=0.44) are in better agreement than Cveg (RMSE = 1.8 kg C m−2; R2=0.22) and TTveg (RMSE = 4.1 years; R2=0.12). The assessed GVMs estimated on average 8 % lower NPP, 16 % higher Cveg, and 22 % longer TTveg than CARDAMOM across the entire pan-Arctic domain (Figs. 5 and 6) on average. Thus, at regional aggregation CARDAMOM analyses agreed more closely with ISI-MIP2a models than with FLUXCOM (51 % difference) and with the Carvalhais et al. (2014) biomass data (28 % bias).
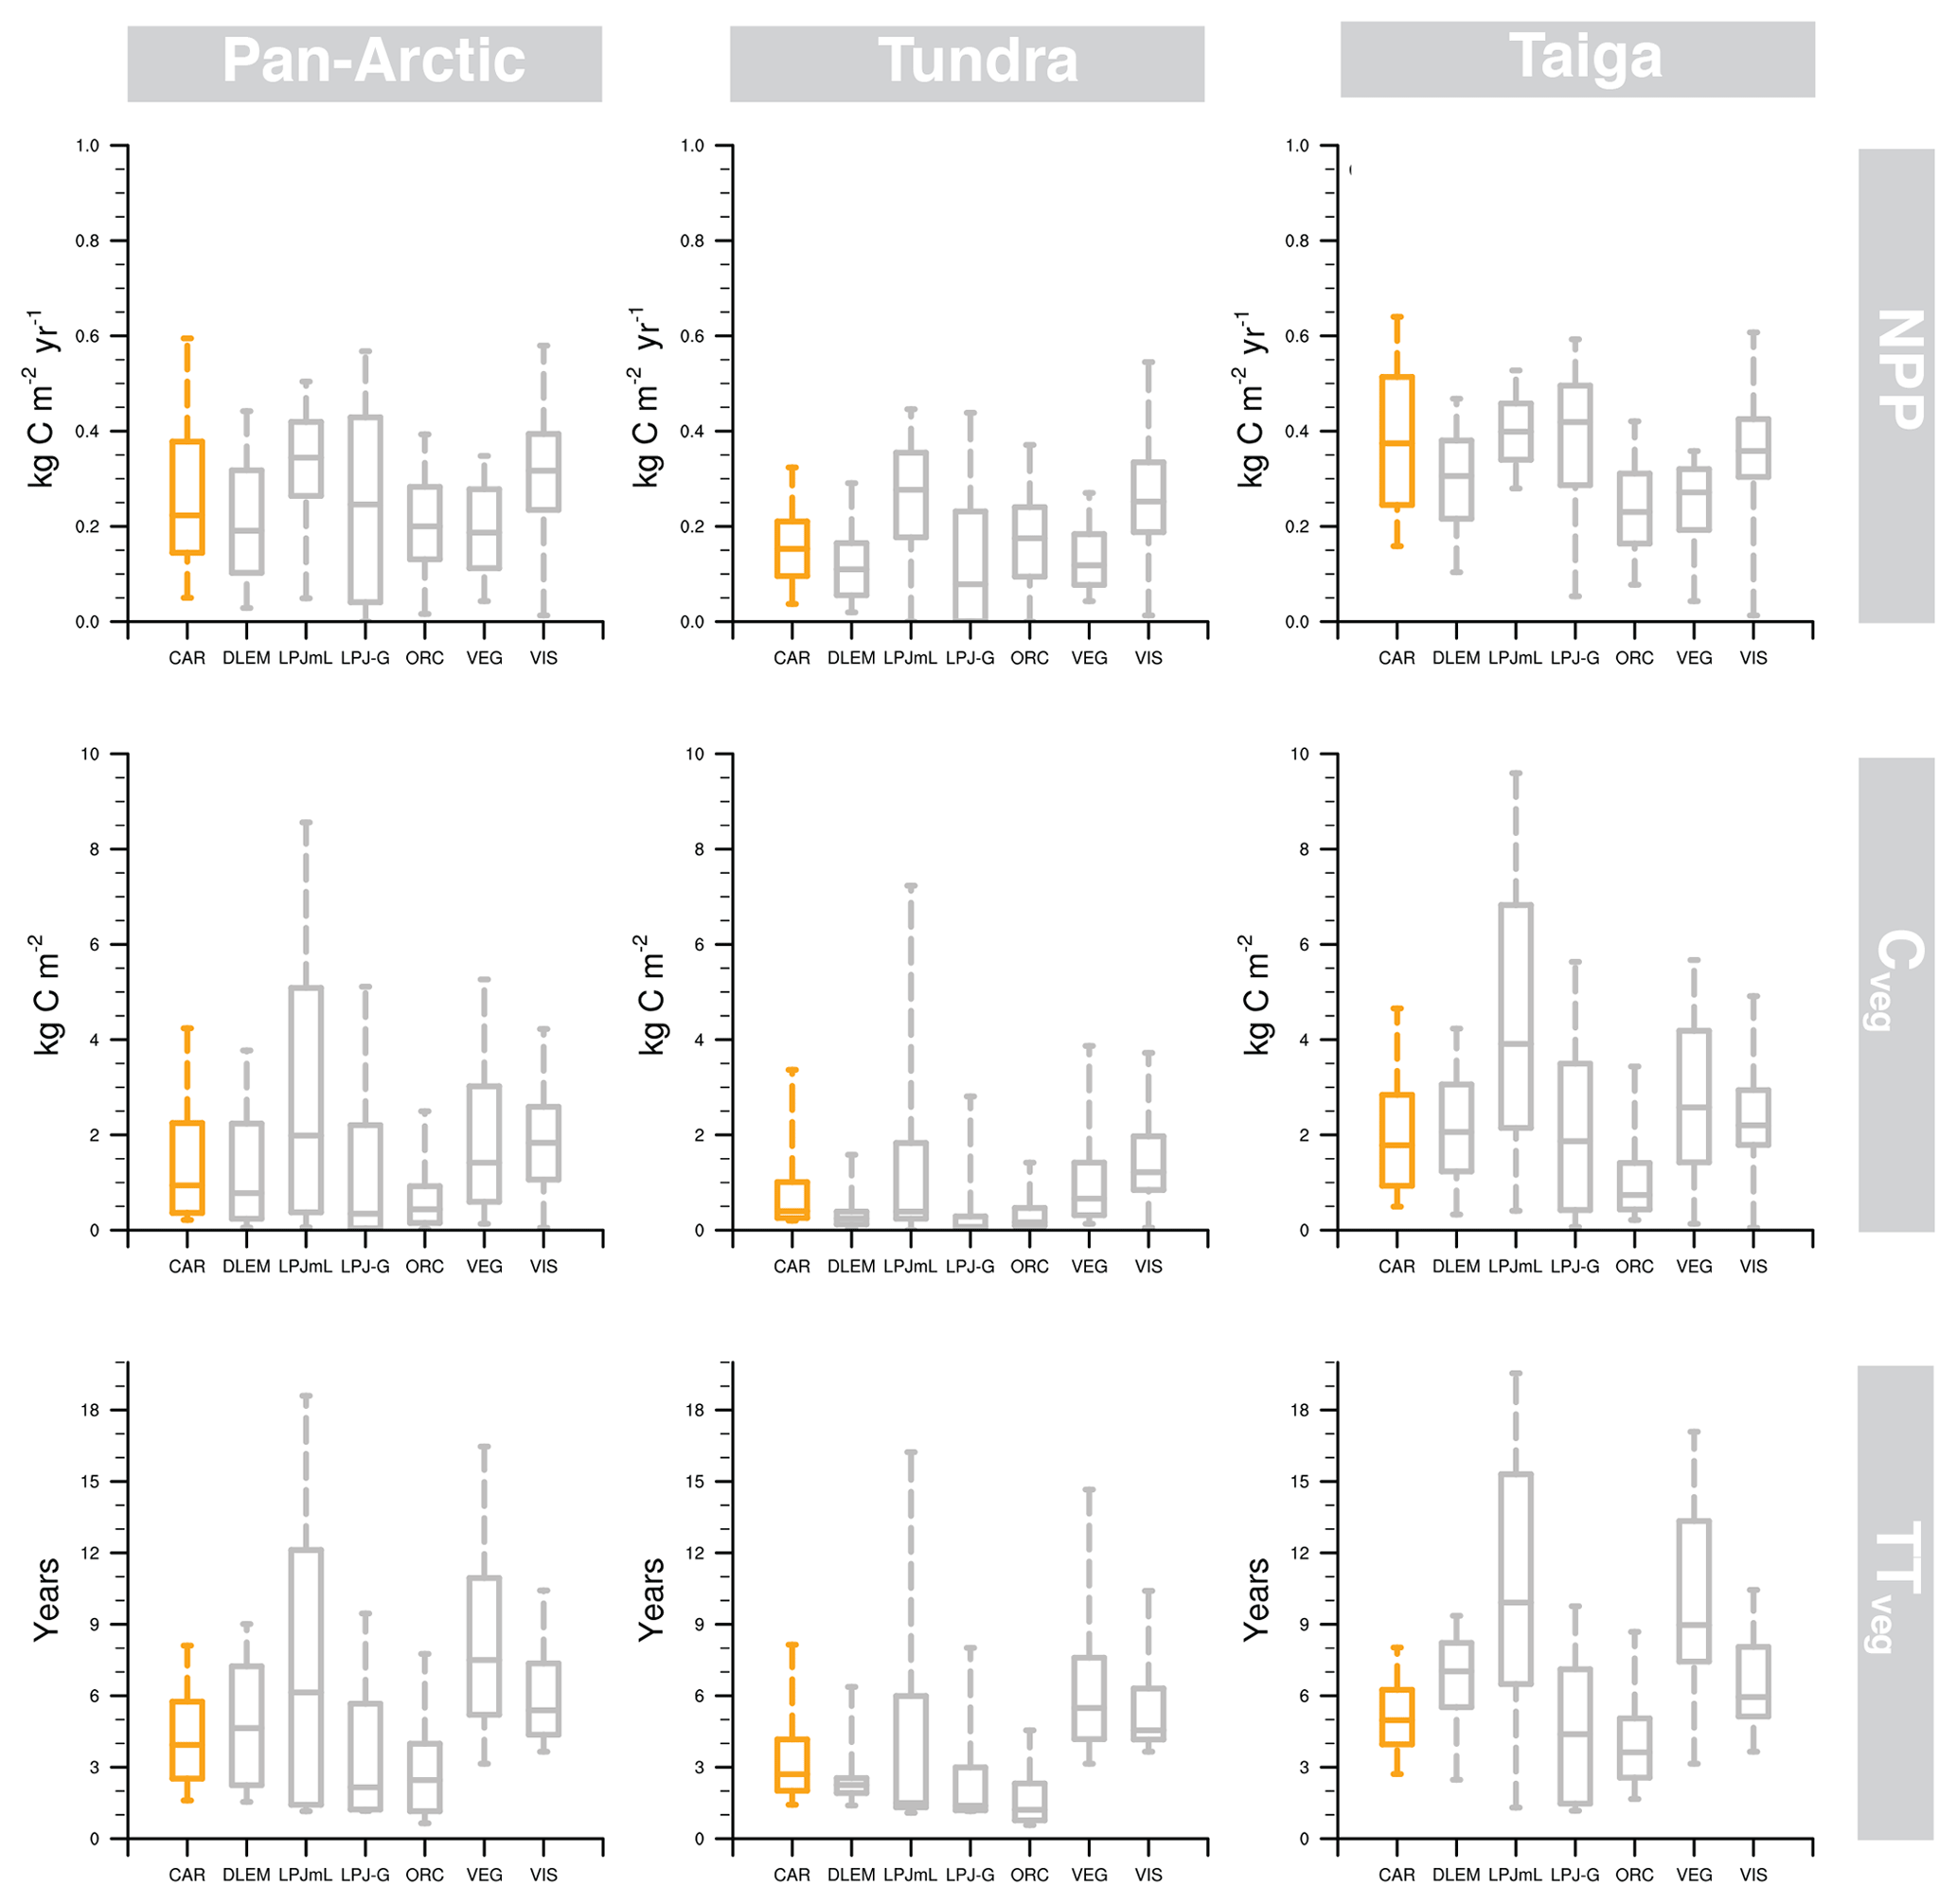
Figure 5Central tendency and variability of NPP (net primary production), Cveg (vegetation C stock), TTveg (vegetation transit time) estimated by CARDAMOM (orange), and ISI-MIP2a models (grey) in the pan-Arctic, tundra, and taiga regions. The box–whisker plots comprise the estimations between the 5th and 95th percentiles, and the box encompasses the 25th to 75th percentiles. The line in each box marks the median of studied variables in each region.

Figure 6NPP (net primary production), Cveg (vegetation C stock), and TTveg (vegetation transit time) ratios between ISI-MIP2a model ensembles (DLEM, LPJmL, LPJ-GUESS, ORCHIDEE, VEGAS, and VISIT) and CARDAMOM. Stippling indicates locations where the ISI-MIP2a model mean is within CARDAMOM's 5th and 95th percentiles.
Table 3Statistics of linear fit between the CARDAMOM framework (independent) and the ISI-MIP2a models (dependent) per individual model and per NPP (net primary production; kg C m−2 yr−1), Cveg (vegetation C stock; kg C m−2), and TTveg (vegetation transit time; years). The units for RMSE and bias are kg C m−2 yr−1 in NPP, kg C m−2 yr−1 in Cveg, and years in TTveg.

The poor spatial agreement regarding TTveg between CARDAMOM and ISI-MIP2a (Table 3) is indicative of uncertainties in the internal C dynamics of these models. For instance, the slopes in Table 3 are steep and the R2 are poor – so there is substantial disagreement in the spatial pattern, not just a large bias. For ISI-MIP2a comparison R2 values ranged from 0.03 to 0.52 for NPP, from 0.00 to 0.31 for Cveg, and from 0.00 to 0.24 for TTveg. Spatially, the stippling in Fig. 6 indicates areas where the GVMs are within the 90 % CI of CARDAMOM; agreement is best over the taiga domain rather than in tundra for TTveg. The benchmark area of consistency (stippling) is more extensive for Cveg and TTveg than for NPP. Thus, while there is a stronger spatial correlation for NPP between CARDAMOM and GVMs (Table 3), this is a clearer bias for NPP. Some models (LPJ-GUESS and ORCHIDEE) systematically calculate lower values in all the assessed variables, while others (LPJmL and VISIT) calculate higher estimates. The models in closer agreement with CARDAMOM were DLEM (5 % difference) and LPJ-GUESS (17 %), while VEGAS (44 %) and ORCHIDEE (56 %) were the models with larger discrepancies (Table 3; Figs. 5 and 6).
The attribution analysis to identify the origin of bias from ISI-MIP2a models indicated a joint split between NPP and Cveg for TTveg error simulated in GVMs (Fig. 7). The distribution of the differences relative to CARDAMOM revealed that the higher error (i.e. the lower overlapped area, and by extension the largest contributor to TTveg biases) comes from ISI-MIP2a NPP with a 69 % agreement in the distribution, while Cveg agrees to 72 %. In fact, the TTveg R2 for each model (Table 3) is very close to the product of the NPP R2 and Cveg R2 for that model, i.e. the uncertainty in the TTveg is a direct interaction of NPP and Cveg uncertainty (R2 of the correlation: 0.71). This finding supports Fig. 6, which shows TTveg error derives equally from both NPP and Cveg.
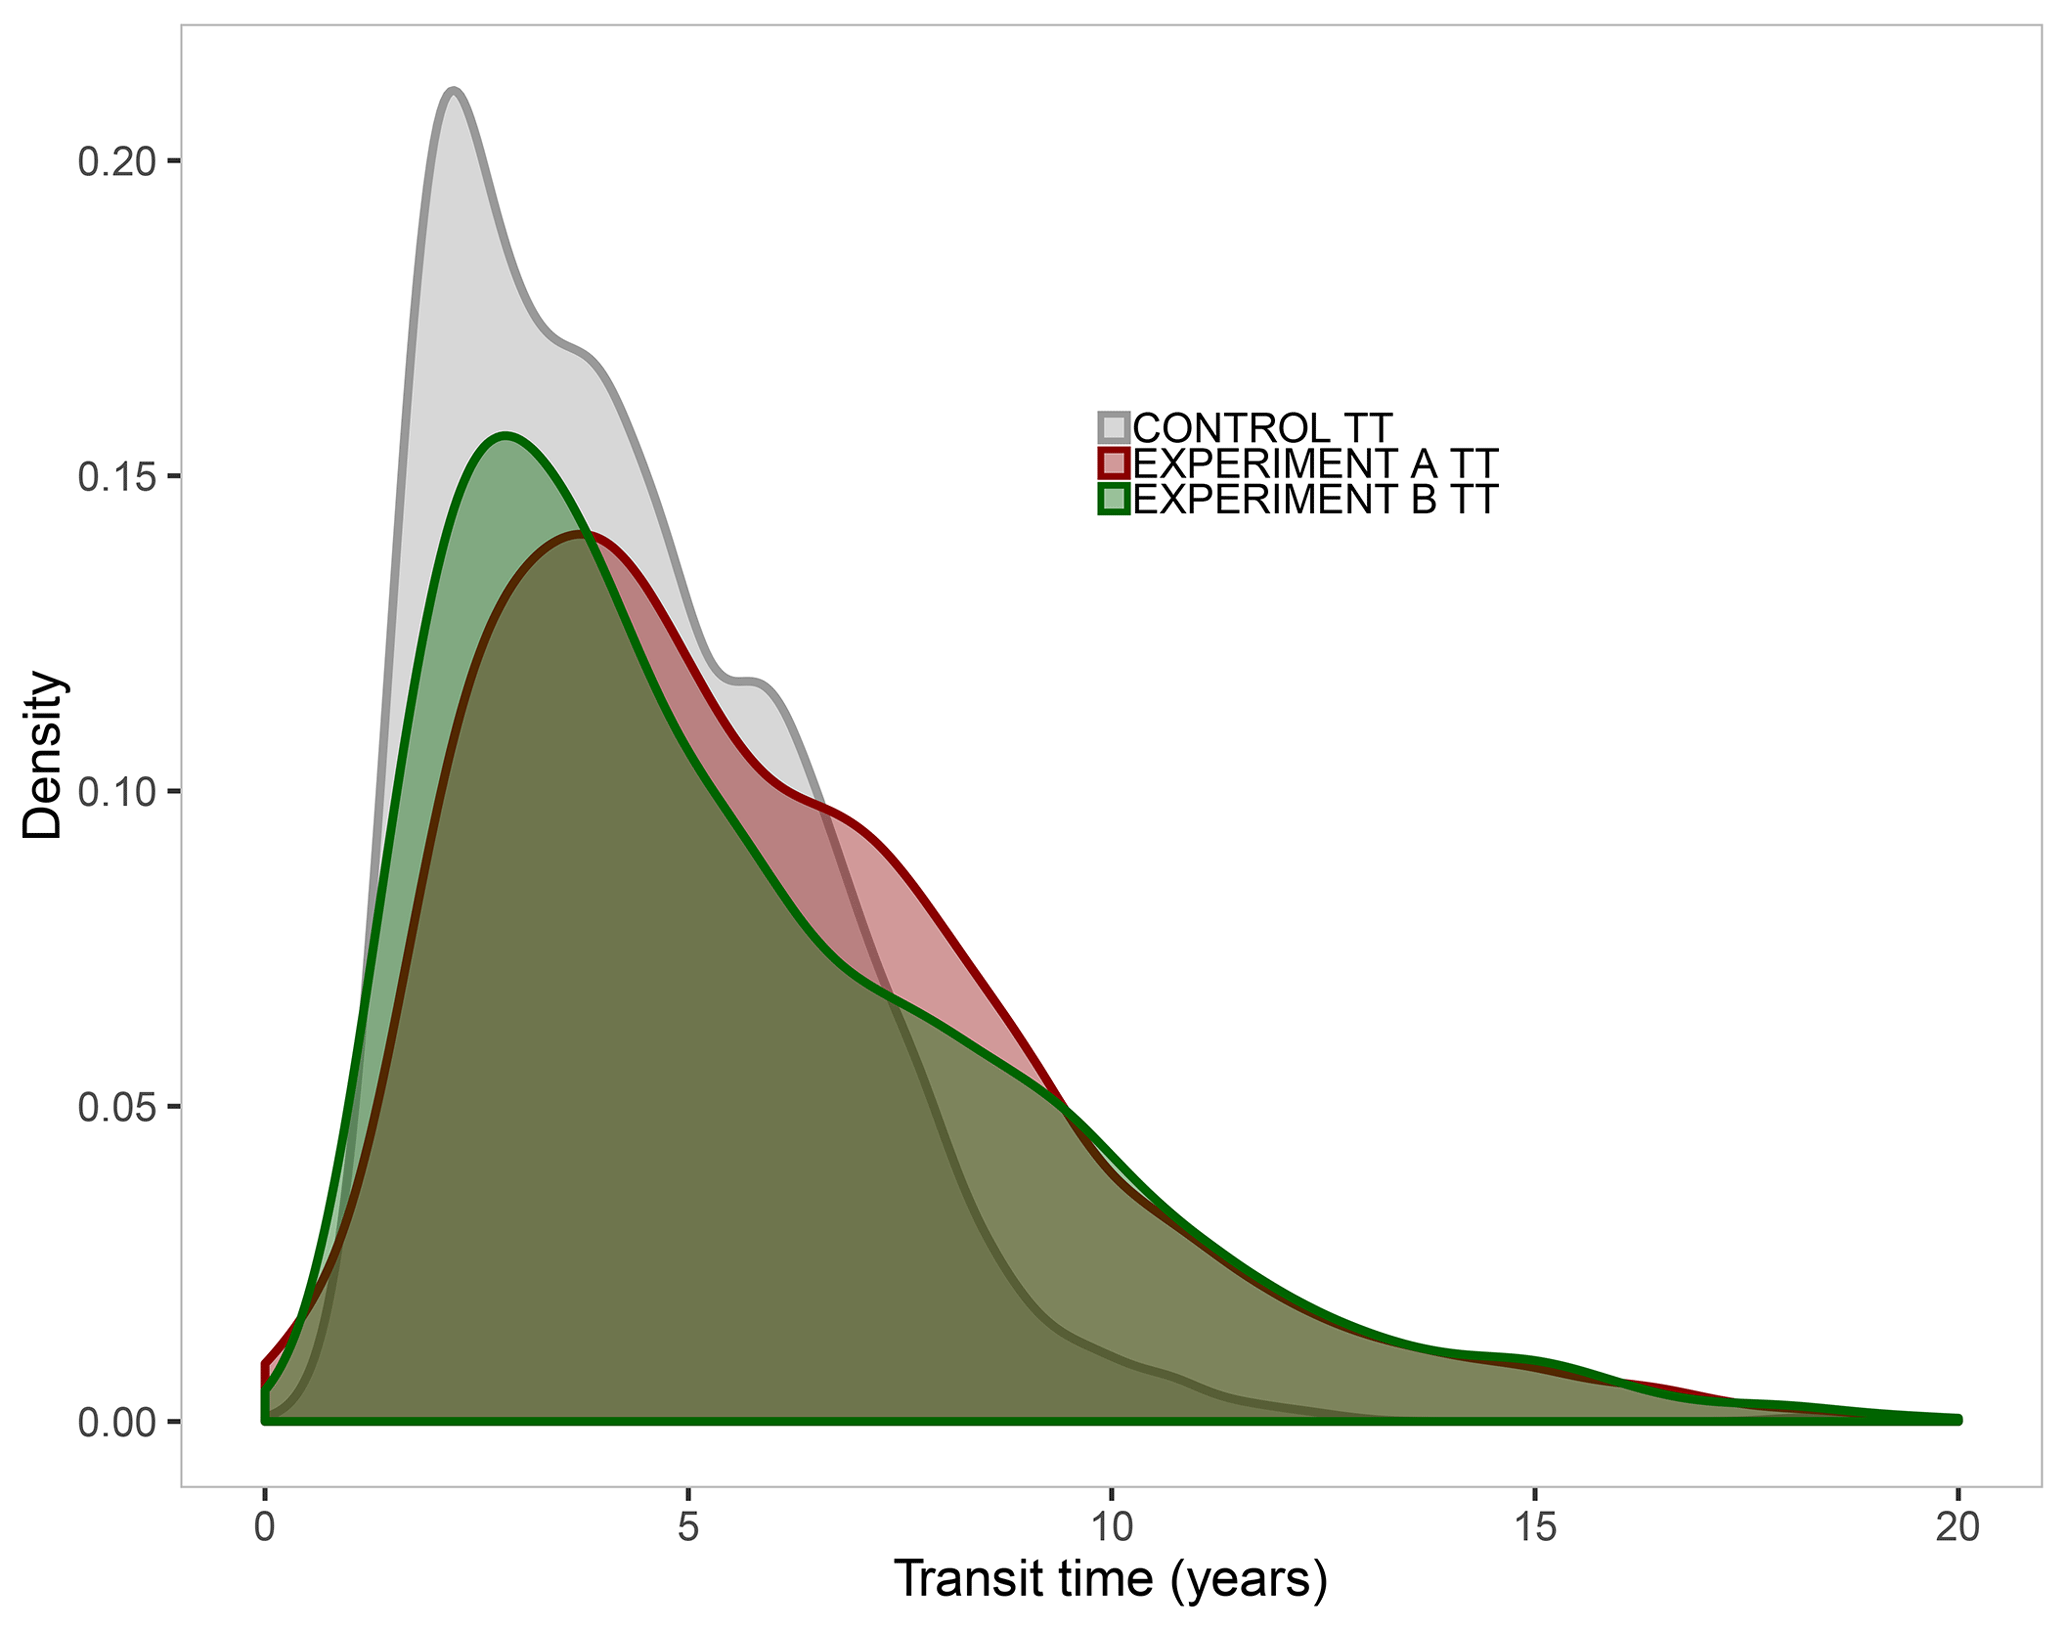
Figure 7Distribution functions derived from the attribution analysis used to estimate the origin of vegetation transit time (TTveg) bias from ISI-MIP2a models. The CONTROL TT (grey) includes both biomass (Cveg) and net primary production (NPP) estimated by CARDAMOM. EXPERIMENT A TT (dark red) incorporates Cveg from ISI-MIP2a and NPP from CARDAMOM, while EXPERIMENT B TT (dark green) includes NPP from ISI-MIP2a and Cveg from CARDAMOM. The lower the overlapped area between control and experimental TT, the larger the contribution for TT biases. For readability purposes, the scale on the x axis is limited to 20 years.
4.1 Pan-Arctic retrievals of C cycle
The CARDAMOM framework has been used to evaluate the terrestrial pan-Arctic C cycle in tundra and taiga at coarse spatio-temporal scale (at monthly and annual time steps for the 2000–2015 period and at 1∘ × 1∘ grid cells). Overall, we found that the pan-Arctic region was most likely a consistent sink of C (weaker in tundra and stronger in taiga), although the large uncertainties derived from respiratory processes (Table 1) strongly increase the 90 % confidence interval uncertainty. We estimate that tundra experienced 62 % longer transit times in litter and SOM C stocks than taiga ecosystems. Further, the contribution of Ra and Rh to total ecosystem respiration was similar in tundra (51 %, 49 %) but dominated by Ra in taiga (57 % compared to 43 %).
CARDAMOM retrievals are consistent with outcomes from relevant papers such as the (i) C flux observations and model estimates reported in McGuire et al. (2012), (ii) C stocks and transit times described by Carvalhais et al. (2014), and (iii) NPP, C stocks, and turnover rates stated in Thurner et al. (2017).
- i.
The CARDAMOM NEE estimates reported in this study for the tundra domain are inside the variability comparison of values compiled by McGuire et al. (2012) considering field observation, regional-process-based models, global-process-based models, and inversion models. The authors reported that Arctic tundra was a sink of CO2 of −150 Tg C yr−1 (SD = 45.9) across the 2000–2006 period over an area of 9.16×10⁶ m2. Here, CARDAMOM NEE estimated −129 Tg C yr−1 over an area of 8.1×10⁶ km2 for the same period. This exhaustive assessment of the C balance in Arctic tundra included approximately 250 estimates using the chamber and eddy covariance method from 120 published papers (McGuire et al., 2012; Supplement 1) with an area-weighted mean of means of −202 Tg C yr−1. The regional models, including runs from LPJ-WHyMe (Wania et al., 2009a, b), ORCHIDEE (Koven et al., 2011), TEM6 (McGuire et al., 2010), and the TCF model (Kimball et al., 2009), reported an NEE of −187 Tg C yr−1 and GPP, NPP, Ra, and Rh of 350, 199, 151, and 182 g C m−2 yr−1, respectively. GVMs applications such as CLM4C (Lawrence et al., 2011), CLM4CN (Thornton et al., 2009), Hyland (Levy et al., 2004), LPJ (Sitch et al., 2003), LPJ-GUESS (Smith et al., 2001), O-CN (Zaehle and Friend, 2010), SDGVM (Woodward et al., 1995), and TRIFFID (Cox, 2001) estimated an NEE of −93 Tg C yr−1 and GPP, NPP, Ra, and Rh of 272, 162, 83, and 144 g C m−2 yr−1. For the same period, CARDAMOM has estimated 330, 167, 160, and 154 g C m−2 yr−1, respectively, for the same gross C fluxes.
- ii.
Carvalhais et al. (2014) estimated a total ecosystem carbon (Ctot) of 20.5 (8.0, 52.5) kg C m−2 for tundra and 24.8 (15.2, 58.0) kg C m−2 for taiga, while values from CARDAMOM were 24.6 (10.8, 50.6) kg C m−2 for tundra and 27.7 (12.7, 51.2) kg C m−2 in taiga (Fig. 5; Table 1) for the same area. Thus, Carvalhais et al.'s (2014) Ctot product stored 20 % and 12 % less carbon in tundra and taiga, respectively, than CARDAMOM. Overall, CARDAMOM calculated 20 % and 6 % longer transit times for tundra and taiga, respectively, with average values of 80.8 (21.8, 195.2) years in tundra and 51.2 (22.1, 109.3) years in taiga (Table 1) compared to the 64.4 (25.7, 259.8) years in tundra and 48.2 (111.6, 24.9) years in taiga in Carvalhais et al. (2014). These numbers have been retrieved from the same biome classification and they include the 90 % confidence interval of the assessed spatial variability. Also, we applied a correction factor of TTgpp = TTnpp × (1 − fraction of GPP respired) to be comparable with Carvalhais et al. (2014) TT. Both datasets agree on the fact that at high (cold) latitudes, first tundra and secondly taiga have the longest transit times on the entire globe (Bloom et al., 2016; Carvalhais et al., 2014).
- iii.
A recent study from Thurner et al. (2017) assessed temperate and taiga-related TTs, presenting a 5-year average NPP dataset applying both MODIS (Running et al., 2004; Zhao et al., 2005) and BETHY/DLR (Tum et al., 2016) products and an innovative biomass product (Thurner et al., 2014) accounting for both forest and non-forest vegetation. Our estimate of TTveg for the exact same period is 5.3 (1.9, 18.2) years, compared to Thurner et al.'s (2017) TT, 8.2 (5.5, 11.5) years using MODIS, and 6.5 (4.2, 8.7) years using BETHY/DLR. A note of caution here: the number reported by the authors are turnover rates, which are converted to transit times by just applying the inverse of turnover rates (TTturnover rates). Additionally, their NPP estimates, 0.35 and 0.45 kg C m−2 yr−1 from both MODIS and BETHY/DLR, are only 5 % more productive on average than the CARDAMOM NPP estimate (0.4 (0.3, 0.6) kg C m−2 yr−1). The biomass derived from Thurner et al. (2014) (3.0±1.1 kg C m−2) is ∼30 % lower than CARDAMOM Cveg (2.2 (1.1, 5.0) kg C m−2), calculated for the same period and for the same taiga domain.
In general, we found a reasonable agreement between CARDAMOM and assimilated and independent data at pan-Arctic scale. CARDAMOM retrievals of assimilated data are in good agreement with the SOC (Fig. 2). The simulation of TTdom is weakly constrained (Table 1) – our analysis adjusts TT to match mapped stocks, hence the strong match of modelled to mapped SOC. So, independent data on TTdom data (e.g. 14C) are required across the pan-Arctic region to provide a stronger constraint on process parameters and reduce the very broad confidence intervals of CARDAMOM analyses. The low bias in mean estimates of LAI and biomass (Fig. 2) likely relates to the strong prior on photosynthesis estimates from the ACM model, which lacks a temperature acclimation for high latitudes in this implementation. However, the uncertainty in the biomass and LAI analyses spans the magnitude of the bias. So, CARDAMOM generates some parameters sets that are consistent with observations. CARDAMOM produces analyses that reproduce the pattern of LAI, GPP, biomass, and SOC (Figs. 2 and 3) – this demonstrates that the DALEC model structure can be calibrated to simulate the links between these variables as a function of mass balance constraints and realistic process interactions and climate sensitivities.
There are clear biases in CARDAMOM analyses compared to independent global upscaled GPP (Jung et al., 2017) and Rh products (Hashimoto et al., 2015) (Fig. 3). However, CARDAMOM resolves the spatial pattern in GPP effectively, while the spatial mismatch in Rh estimates is marked (Fig. 3), echoing the large uncertainty found in NEE (Fig. 1, Table 1). One difference with Hashimoto et al.'s (2015) Rh model is the lack of moisture limitation on respiration in CARDAMOM. Conversely, GPP is relatively well-constrained in space through the assimilation of LAI and a prior for productivity (Bloom et al., 2016), although an important mismatch has been found: CARDAMOM GPP is 50 % lower than FLUXCOM but 30 % higher than FLUXNET2015 EC data.
The agreement between CARDAMOM analyses and EC data is high given the scale difference. A direct point-to-grid cell comparison with local observations derived from the FLUXNET2015 dataset (Fig. 4, Table S6) is challenging and always difficult. CARDAMOM outputs covers 1∘ × 1∘ grid cells, whereas local eddy covariance flux measurements are of the order of 1–10 ha. Thus, for observational sites located in areas with complex terrain, such as Kobbefjord in coastal Greenland, the agreement can be expected to be low. For inland forest sites, such as Poker Flat in Alaska, there may be less differences in vegetation characteristics and local climatology between the local-scale measurement footprint and the corresponding CARDAMOM grid cell. This scaling issue is likely to have a larger impact on flux magnitudes compared with seasonal dynamics. In general, CARDAMOM captured the seasonal dynamics in NEE, GPP, and Reco well (Fig. 4, Table S6), although the monthly model time step does reduce skill in shoulder seasons. There was a consistent timing mismatch in early season flux increase, where CARDAMOM predicts earlier growing season onset compared with observations. This is likely due to the impact of snow cover, which is not explicitly included in the CARDAMOM framework.
For a further independent evaluation of CARDAMOM outputs, we compare the tundra and boreal estimates to plot scale flux and stock information. For tundra, Street et al. (2012) calculate growing season GPP estimates of 263–380 g C m−2 for Empetrum nigrum communities and 295–386 g C m−2 for Betula nana communities, which is consistent with the ranges in Fig. 1 for tundra. Biomass stocks for Arctic tundra recorded in the Arctic LTER (Long Term Ecological Research) at Toolik Lake range from 105 to 1160 g C m−2 (Hobbie and Kling, 2014), which are consistent with the estimates from CARDAMOM, albeit at the lower end of the model estimates. For boreal forests, Goulden et al. (2011) report annual GPP estimates across a chronosequence of stands, and thus a variation across canopy densities, which varied from 450 to 720 g C m−2 yr−1. These data are consistent with the span of GPP in CARDAMOM (Fig. 1), again best matching the lower end of the model estimates. For the same study, the vegetation C stock estimates varied from 100 to 5000 g C m−2, consistent with CARDAMOM and with measurements of 10 to 40-year old boreal stands best matching the CARDAMOM median estimate of ∼1500 g C m−2. We conclude from comparisons with site data that CARDAMOM analyses are broadly consistent, with some tendency for CARDAMOM to have a high bias. This comparison is similar to the FLUXNET2015 evaluation of CARDAMOM. But it conflicts with the estimation of low bias from the comparison of CARDAMOM with FLUXCOM GPP and Carvalhais et al. (2014) biomass stock maps. It is possible that the scale differences between site-level products and landscape estimates is confusing these comparisons, but there is clearly a need to understand these inconsistencies in C cycle estimates better.
4.2 CARDAMOM as a model benchmarking tool
An ideal benchmarking tool for GVMs would compare model state variables and fluxes with multiple, independent, unbiased, error-characterised measurements collected repeatedly at the same temporal and spatial resolution. Of course direct measurements of key C cycle variables like these are not available. Even at FLUXNET sites GPP and Reco must be inferred, and NEE data are often gap-filled. Satellite data can provide continuous fields but do not directly measure ecological variables like biomass or LAI, so calibrated models are required to generate ecological products. Atmospheric conditions can introduce biases and data gaps into optical data that are poorly quantified. Upscaling of FLUXNET data requires other spatial data, e.g. MODIS LAI, which challenge the characterisation of error and generates complex hybrid products. We suggest that CARDAMOM provides some of the requirements of the ideal benchmark system – an error-characterised, complete analysis of the C cycle that is based on a range of observational products. CARDAMOM includes its own C cycle model; this has the advantage of evaluating the observational data for consistency (e.g. with mass balance), propagating error across the C cycle, and generating internal model variables such as TT. Further, the model is of intermediate complexity and independent of the benchmarked models.
Using CARDAMOM as a benchmarking tool for six GVMs we found disagreements that varied among models for spatial estimates of NPP, Cveg, and TTveg across the pan-Arctic (Fig. 6) in comparison with CARDAMOM confidence intervals. GVM NPP estimates had a higher correlation than TTveg and Cveg with CARDAMOM analyses (Table 3), but because CARDAMOM confidence intervals on NPP were relatively narrow (Fig. 1), the benchmarking scores from GVM NPP were relatively poor (Fig. 6). Consequently, we used CARDAMOM to calculate the relative contribution of productivity and biomass to the transit times bias by applying a simple attribution analysis (Fig. 7). We concluded that the largest bias to transit times originated not from a deficient understanding of one single component, but from an equal combination of both productivity and biomass errors together. Therefore, this study partially agrees with previous studies (Friend et al., 2014; Nishina et al., 2014; Thurner et al., 2017) highlighting the deficient representation of transit times or turnover dynamics, but we further suggest that global vegetation and Earth system modellers need to focus on the productivity and vegetation C stocks dynamics to improve inner C dynamics. A major challenge for GVMs is the spin-up problem (Exbrayat et al., 2014). GVMs need to find a way to ensure that the spin-up process produces biomass estimates consistent with the growing availability of biomass maps from Earth observations. CARDAMOM solves this problem by avoiding spin-up. Its fast run time allows the biomass maps to act as a constraint on the probability distribution of model parameters. There may be opportunities to use CARDAMOM-style approaches to assist the GVM community address this problem.
4.3 Outlook
Although CARDAMOM estimates for pan-Arctic C cycling are in moderately good agreement with observations and data constraints, we have not included important components controlling ecosystem processes that could potentially improve our understanding on C feedbacks, with an emphasis on high-latitude ecosystems. For example, thaw and the release of permafrost C is not represented in CARDAMOM, but the influence on vegetation dynamics, permafrost degradation, and soil respiration is critical at high latitudes (Koven et al., 2015; Parazoo et al., 2018). Also, Koven et al. (2017) have shown that soil thermal regimes are key to resolving the long-term vulnerability of soil C. Moreover, we have not characterised snow dynamics nor the insulating effect of snow affecting respiratory losses across wintertime periods (López-Blanco et al., 2018). Further, methane emissions, another important contributor to total C budget (Mastepanov et al., 2008; Zona et al., 2016), were neglected from this modelling exercise since it is not easy to model due to its three complex transport mechanisms (Walter et al., 2001).
However, our approach to use an intermediate-complexity model has the strong advantage of allowing very large (107) model ensembles per pixel and thus a thorough exploration of model–parameter interactions that is not feasible with typical GVMs. Other viable options include using emulators (Fer et al., 2018) and particle filters (Arulampalam et al., 2002), but MCMC methods provide the most detailed description of error distributions. There remains a strong argument to utilise intermediate-complexity models like DALEC2 to evaluate the minimum level of detail required to represent ecosystem processes consistent with local observations and to allow testing of alternate model structures. Assimilating further data products, for instance patterns in soil hydrology and snow states across the pan-Arctic from Earth observation, could provide useful information on spatio-temporal controls on soil activity and microbial metabolism to constrain below-ground processes. This information would need to be tied to process-level information on SOM turnover generated from experimental studies and included in updated versions of DALEC. Thus, more field observations are crucial across the pan-Arctic, specifically on the decomposition and TT of SOC (He et al., 2016) and respiratory processes such as the partitioning of Reco into Ra and Rh (Hobbie et al., 2000; McGuire et al., 2000) across the growing season and also during wintertime (Commane et al., 2017; Zona et al., 2016).
Our approach has used estimated observation error and inflated this to include unknown errors associated with model process representation. We currently lack any better knowledge of the combined uncertainties arising from model representation errors and observation errors. We acknowledge that all models are an imperfect representation of C dynamics, which generates irreconcilable model–data errors due to the inherent assumptions in model structure. Future analyses should investigate model structural error, using, for example, error-explicit Bayesian approaches (Xu et al., 2017), or comparing the likelihoods of alternate model structures of varying complexity. Using multiple sources of data, we have highlighted systematic errors in the model at a landscape scale (Figs. 2 and 3) for LAI, GPP, and biomass. However, these biases are not consistent for site-scale evaluations. Thus, a next step would be to include explicitly both random and systematic process errors for C fluxes in the data assimilation. These errors could be determined from field-scale evaluation of model process representation (Table 2) using, e.g., FLUXNET2015 data. We also need to understand better the error associated with the landscape heterogeneity of C stocks and fluxes to upscale from flux tower observations or direct measurements of LAI to landscape pixel. This could be achieved by constructing robust observation error models (Dietze, 2017) from field to pixel scale for, e.g., GPP, LAI, and foliar N. The evaluation of the sensitivity of C cycling DA analyses to observation error has shown relatively low sensitivity to data gaps and random error on net ecosystem flux data (Hill et al., 2012), but further analyses of error sensitivity are required for multiple streams of stock data.
The Arctic is experiencing rapid environmental changes, which will influence the global C cycle. Using a data-assimilation framework we have evaluated the current state of key C flux, stocks, and transit times for the pan-Arctic region for 2000–2015. We found that the pan-Arctic was a likely sink of C, weaker in tundra and stronger in taiga, but uncertainties around the respiration losses are still large, and so the region could be a source of C. Comparisons with global- and local-scale datasets demonstrate the capabilities of CARDAMOM for analysing the C cycle in the Arctic domain. CARDAMOM is a data-constrained and data-integrated analysis, evaluated for internal consistency, and is therefore a good candidate to benchmark performance of global vegetation models. We conclude that a GVM bias found in transit time of vegetation C is the result of a joint combination of uncertainties from productivity processes and biomass in GVMs, and thus these are a major component of error in their forecasts. While spatial patterns in GVM predictions of NPP are reasonable, particularly in taiga, they have significant biases against the CARDAMOM benchmark. Improved mapping of vegetation and soil C stocks and change over time is required for better analytical constraint. Moreover, future work is required on assimilating data on soil hydrology, permafrost, and snow dynamics to improve accuracy and decrease uncertainties in belowground processes. This work establishes the baseline for further process-based ecological analyses using the CARDAMOM data-assimilation system as a technique to constrain the pan-Arctic C cycle.
CARDAMOM output used in this study is available from Exbrayat and Williams (2018) from the University of Edinburgh's DataShare service at https://doi.org/10.7488/ds/2334. The DALEC2 code is also available on Edinburgh DataShare at https://doi.org/10.7488/ds/2504 (Williams, 2019). Contact Mathew Williams for access to the CARDAMOM software.
The supplement related to this article is available online at: https://doi.org/10.5194/esd-10-233-2019-supplement.
ELB, FJE, TRC, ML, and MW designed the research. JFE performed the model simulations. ELB, FJE, and MW analysed the data. ELB and MW prepared the paper with contributions from all co-authors.
The authors declare that they have no conflict of interest.
This work was supported in part by a scholarship from the Aarhus-Edinburgh Excellence in European Doctoral Education Project and by the eSTICC (eScience tools for investigating Climate Change in Northern High Latitudes) project, part of the Nordic Center of Excellence. This work was also supported by the Natural Environment Research Council (NERC) through the National Center for Earth Observation. The authors would like to thank Matthias Forkel, and the anonymous reviewer and editor for their valuable comments that improved the quality of the paper. We thank Nuno Carvalhais for discussion that helped to focus our ideas. Thanks are also due to Isabel de Andrés Velasco for contributing to the artistic design in Fig. 1. Data-assimilation procedures were performed using the Edinburgh Compute and Data Facility resources. This work used eddy covariance data acquired and shared by the FLUXNET community, including the following networks: AmeriFlux, AfriFlux, AsiaFlux, CarboAfrica, CarboEuropeIP, CarboItaly, CarboMont, ChinaFlux, Fluxnet-Canada, GreenGrass, ICOS, KoFlux, LBA, NECC, OzFlux-TERN, TCOS-Siberia, and USCCC. The ERA-Interim reanalysis data are provided by ECMWF and processed by LSCE. The FLUXNET eddy covariance data processing and harmonisation was carried out by the European Fluxes Database Cluster, AmeriFlux Management Project, and Fluxdata project of FLUXNET, with the support of CDIAC and ICOS Ecosystem Thematic Center and the OzFlux, ChinaFlux, and AsiaFlux offices. We acknowledge the modelling groups and the ISI-MIP coordination team for their roles in producing and making the ISI-MIP model output available.
This paper was edited by Ning Zeng and reviewed by Matthias Forkel and one anonymous referee.
Ahlström, A., Schurgers, G., Arneth, A., and Smith, B.: Robustness and uncertainty in terrestrial ecosystem carbon response to CMIP5 climate change projections, Environ. Res. Lett., 7, 044008, https://doi.org/10.1088/1748-9326/7/4/044008, 2012.
Akihiko, I., Kazuya, N., Christopher, P. O. R., Louis, F., Alexandra-Jane, H., Guy, M., Ingrid, J., Hanqin, T., Jia, Y., Shufen, P., Catherine, M., Richard, B., Thomas, H., Jörg, S., Sebastian, O., Sibyll, S., Philippe, C., Jinfeng, C., Rashid, R., Ning, Z., and Fang, Z.: Photosynthetic productivity and its efficiencies in ISIMIP2a biome models: benchmarking for impact assessment studies, Environ. Res. Lett., 12, 085001, https://doi.org/10.1088/1748-9326/aa7a19, 2017.
AMAP: Snow, water, ice and permafrost in the Arctic (SWIPA) 2017, Arctic Monitoring and Assessment Programme (AMAP) Oslo, Norway, xiv + 269 pp., 2017.
Anav, A., Murray-Tortarolo, G., Friedlingstein, P., Sitch, S., Piao, S., and Zhu, Z.: Evaluation of Land Surface Models in Reproducing Satellite Derived Leaf Area Index over the High-Latitude Northern Hemisphere. Part II: Earth System Models, Remote Sensing, 5, 3637, https://doi.org/10.3390/rs5083637, 2013.
Arulampalam, M. S., Maskell, S., Gordon, N., and Clapp, T.: A tutorial on particle filters for online nonlinear/non-Gaussian Bayesian tracking, IEEE T. Signal Process., 50, 174-188, https://doi.org/10.1109/78.978374, 2002.
Baldocchi, D. D.: Assessing the eddy covariance technique for evaluating carbon dioxide exchange rates of ecosystems: past, present and future, Global Change Biol., 9, 479–492, https://doi.org/10.1046/j.1365-2486.2003.00629.x, 2003.
Beer, C., Reichstein, M., Tomelleri, E., Ciais, P., Jung, M., Carvalhais, N., Rödenbeck, C., Arain, M. A., Baldocchi, D., Bonan, G. B., Bondeau, A., Cescatti, A., Lasslop, G., Lindroth, A., Lomas, M., Luyssaert, S., Margolis, H., Oleson, K. W., Roupsard, O., Veenendaal, E., Viovy, N., Williams, C., Woodward, F. I., and Papale, D.: Terrestrial Gross Carbon Dioxide Uptake: Global Distribution and Covariation with Climate, Science, 329, 5993, https://doi.org/10.1126/science.1184984, 2010.
Belelli Marchesini, L., Papale, D., Reichstein, M., Vuichard, N., Tchebakova, N., and Valentini, R.: Carbon balance assessment of a natural steppe of southern Siberia by multiple constraint approach, Biogeosciences, 4, 581–595, https://doi.org/10.5194/bg-4-581-2007, 2007.
Bintanja, R. and Andry, O.: Towards a rain-dominated Arctic, Nature Clim. Change, 7, 263–267, https://doi.org/10.1038/nclimate3240, 2017.
Bloom, A. A. and Williams, M.: Constraining ecosystem carbon dynamics in a data-limited world: integrating ecological “common sense” in a model–data fusion framework, Biogeosciences, 12, 1299–1315, https://doi.org/10.5194/bg-12-1299-2015, 2015.
Bloom, A. A., Exbrayat, J.-F., van der Velde, I. R., Feng, L., and Williams, M.: The decadal state of the terrestrial carbon cycle: Global retrievals of terrestrial carbon allocation, pools, and residence times, P. Natl. Acad. Sci. USA, 113, 1285–1290, https://doi.org/10.1073/pnas.1515160113, 2016.
Bond-Lamberty, B., Wang, C., and Gower, S. T.: Net primary production and net ecosystem production of a boreal black spruce wildfire chronosequence, Global Change Biol., 10, 473–487, https://doi.org/10.1111/j.1529-8817.2003.0742.x, 2004.
Bontemps, S., Defourny, P., Bogaert, E., Arino, O., Kalogirou, V., and Perez, J.: GLOBCOVER 2009 – Products description and validation report, UCLouvain & ESA Team, 2011.
Brown, J., Ferrians Jr., O. J., Heginbottom, J. A., and Melnikov, E. S.: Circum-Arctic map of permafrost and ground-ice conditions, Report 45, US Geological Survey, 1997.
Canadell, J. G., Le Quéré, C., Raupach, M. R., Field, C. B., Buitenhuis, E. T., Ciais, P., Conway, T. J., Gillett, N. P., Houghton, R. A., and Marland, G.: Contributions to accelerating atmospheric CO2 growth from economic activity, carbon intensity, and efficiency of natural sinks, P. Natl. Acad. Sci. USA, 104, 18866–18870, https://doi.org/10.1073/pnas.0702737104, 2007.
Carvalhais, N., Forkel, M., Khomik, M., Bellarby, J., Jung, M., Migliavacca, M., Saatchi, S., Santoro, M., Thurner, M., Weber, U., Ahrens, B., Beer, C., Cescatti, A., Randerson, J. T., and Reichstein, M.: Global covariation of carbon turnover times with climate in terrestrial ecosystems, Nature, 514, 213–217, https://doi.org/10.1038/nature13731, 2014.
Commane, R., Lindaas, J., Benmergui, J., Luus, K. A., Chang, R. Y.-W., Daube, B. C., Euskirchen, E. S., Henderson, J. M., Karion, A., Miller, J. B., Miller, S. M., Parazoo, N. C., Randerson, J. T., Sweeney, C., Tans, P., Thoning, K., Veraverbeke, S., Miller, C. E., and Wofsy, S. C.: Carbon dioxide sources from Alaska driven by increasing early winter respiration from Arctic tundra, P. Natl. Acad. Sci. USA, 114, 5361–5366, https://doi.org/10.1073/pnas.1618567114, 2017.
Cox, P. M.: Description of the “TRIFFID” Dynamic Global Vegetation Model, Hadley Centre technical note 24, Met Office, UK, 2001.
Dee, D. P., Uppala, S. M., Simmons, A. J., Berrisford, P., Poli, P., Kobayashi, S., Andrae, U., Balmaseda, M. A., Balsamo, G., Bauer, P., Bechtold, P., Beljaars, A. C. M., van de Berg, L., Bidlot, J., Bormann, N., Delsol, C., Dragani, R., Fuentes, M., Geer, A. J., Haimberger, L., Healy, S. B., Hersbach, H., Hólm, E. V., Isaksen, L., Kållberg, P., Köhler, M., Matricardi, M., McNally, A. P., Monge-Sanz, B. M., Morcrette, J. J., Park, B. K., Peubey, C., de Rosnay, P., Tavolato, C., Thépaut, J. N., and Vitart, F.: The ERA-Interim reanalysis: configuration and performance of the data assimilation system, Q. J. Roy. Meteorol. Soc., 137, 553–597, https://doi.org/10.1002/qj.828, 2011.
De Kauwe, M. G., Disney, M. I., Quaife, T., Lewis, P., and Williams, M.: An assessment of the MODIS collection 5 leaf area index product for a region of mixed coniferous forest, Remote Sens. Environ., 115, 767–780, https://doi.org/10.1016/j.rse.2010.11.004, 2011.
DeLucia, E. H., Drake, J. E., Thomas, R. B., and Gonzalez-Meler, M.: Forest carbon use efficiency: is respiration a constant fraction of gross primary production?, Global Change Biol., 13, 1157–1167, https://doi.org/10.1111/j.1365-2486.2007.01365.x, 2007.
Dietze, M. C.: Ecological Forecasting, Princeton University Press, Princeton, 2017.
Exbrayat, J. F. and Williams, M.: CARDAMOM panarctic retrievals 2000–2015, 2000–2015 [Dataset], National Centre for Earth Observation and School of GeoSciences, University of Edinburgh, https://doi.org/10.7488/ds/2334, 2018.
Exbrayat, J.-F., Pitman, A. J., and Abramowitz, G.: Response of microbial decomposition to spin-up explains CMIP5 soil carbon range until 2100, Geosci. Model Dev., 7, 2683–2692, https://doi.org/10.5194/gmd-7-2683-2014, 2014.
Exbrayat, J.-F. and Williams, M.: CARDAMOM panarctic retrievals 2000–2015, National Centre for Earth Observation and School of GeoSciences, University of Edinburgh, https://doi.org/10.7488/ds/2334, 2018.
Exbrayat, J. F., Bloom, A. A., Falloon, P., Ito, A., Smallman, T. L., and Williams, M.: Reliability ensemble averaging of 21st century projections of terrestrial net primary productivity reduces global and regional uncertainties, Earth Syst. Dynam., 9, 153–165, https://doi.org/10.5194/esd-9-153-2018, 2018.
FAO/IIASA/ISRIC/ISSCAS/JRC: Harmonized World Soil Database (version 1.21), FAO, Rome, Italy and IIASA, Laxenburg, Austria, 2012.
Fer, I., Kelly, R., Moorcroft, P. R., Richardson, A. D., Cowdery, E. M., and Dietze, M. C.: Linking big models to big data: efficient ecosystem model calibration through Bayesian model emulation, Biogeosciences, 15, 5801–5830, https://doi.org/10.5194/bg-15-5801-2018, 2018.
Fisher, J. B., Sikka, M., Oechel, W. C., Huntzinger, D. N., Melton, J. R., Koven, C. D., Ahlström, A., Arain, M. A., Baker, I., Chen, J. M., Ciais, P., Davidson, C., Dietze, M., El-Masri, B., Hayes, D., Huntingford, C., Jain, A. K., Levy, P. E., Lomas, M. R., Poulter, B., Price, D., Sahoo, A. K., Schaefer, K., Tian, H., Tomelleri, E., Verbeeck, H., Viovy, N., Wania, R., Zeng, N., and Miller, C. E.: Carbon cycle uncertainty in the Alaskan Arctic, Biogeosciences, 11, 4271–4288, https://doi.org/10.5194/bg-11-4271-2014, 2014.
Forkel, M., Carvalhais, N., Rödenbeck, C., Keeling, R., Heimann, M., Thonicke, K., Zaehle, S., and Reichstein, M.: Enhanced seasonal CO2 exchange caused by amplified plant productivity in northern ecosystems, Science, 351, 696–699, https://doi.org/10.1126/science.aac4971, 2016.
Fox, A., Williams, M., Richardson, A. D., Cameron, D., Gove, J. H., Quaife, T., Ricciuto, D., Reichstein, M., Tomelleri, E., Trudinger, C. M., and Van Wijk, M. T.: The REFLEX project: Comparing different algorithms and implementations for the inversion of a terrestrial ecosystem model against eddy covariance data, Agr. Forest Meteorol., 149, 1597–1615, https://doi.org/10.1016/j.agrformet.2009.05.002, 2009.
Friedlingstein, P., Meinshausen, M., Arora, V. K., Jones, C. D., Anav, A., Liddicoat, S. K., and Knutti, R.: Uncertainties in CMIP5 Climate Projections due to Carbon Cycle Feedbacks, J. Climate, 27, 511–526, https://doi.org/10.1175/jcli-d-12-00579.1, 2014.
Friend, A. D., Lucht, W., Rademacher, T. T., Keribin, R., Betts, R., Cadule, P., Ciais, P., Clark, D. B., Dankers, R., Falloon, P. D., Ito, A., Kahana, R., Kleidon, A., Lomas, M. R., Nishina, K., Ostberg, S., Pavlick, R., Peylin, P., Schaphoff, S., Vuichard, N., Warszawski, L., Wiltshire, A., and Woodward, F. I.: Carbon residence time dominates uncertainty in terrestrial vegetation responses to future climate and atmospheric CO2, P. Natl. Acad. Sci. USA, 111, 3280–3285, https://doi.org/10.1073/pnas.1222477110, 2014.
Goetz, S. J., Bunn, A. G., Fiske, G. J., and Houghton, R. A.: Satellite-observed photosynthetic trends across boreal North America associated with climate and fire disturbance, P. Natl. Acad. Sci. USA, 102, 13521–13525, https://doi.org/10.1073/pnas.0506179102, 2005.
Goulden, M. L., Munger, J. W., Fan, S.-M., Daube, B. C., and Wofsy, S. C.: Exchange of Carbon Dioxide by a Deciduous Forest: Response to Interannual Climate Variability, Science, 271, 1576–1578, https://doi.org/10.1126/science.271.5255.1576, 1996.
Goulden, M. L., McMillan, A. M. S., Winston, G. C., Rocha, A. V., Manies, K. L., Harden, J. W., and Bond-Lamberty, B. P.: Patterns of NPP, GPP, respiration, and NEP during boreal forest succession, Global Change Biol., 17, 855–871, https://doi.org/10.1111/j.1365-2486.2010.02274.x, 2011.
Graven, H. D., Keeling, R. F., Piper, S. C., Patra, P. K., Stephens, B. B., Wofsy, S. C., Welp, L. R., Sweeney, C., Tans, P. P., Kelley, J. J., Daube, B. C., Kort, E. A., Santoni, G. W., and Bent, J. D.: Enhanced Seasonal Exchange of CO2 by Northern Ecosystems Since 1960, Science, 341, 1085–1089, https://doi.org/10.1126/science.1239207, 2013.
Guimberteau, M., Zhu, D., Maignan, F., Huang, Y., Yue, C., Dantec-Nédélec, S., Ottlé, C., Jornet-Puig, A., Bastos, A., Laurent, P., Goll, D., Bowring, S., Chang, J., Guenet, B., Tifafi, M., Peng, S., Krinner, G., Ducharne, A., Wang, F., Wang, T., Wang, X., Wang, Y., Yin, Z., Lauerwald, R., Joetzjer, E., Qiu, C., Kim, H., and Ciais, P.: ORCHIDEE-MICT (v8.4.1), a land surface model for the high latitudes: model description and validation, Geosci. Model Dev., 11, 121–163, https://doi.org/10.5194/gmd-11-121-2018, 2018.
Hashimoto, S., Carvalhais, N., Ito, A., Migliavacca, M., Nishina, K., and Reichstein, M.: Global spatiotemporal distribution of soil respiration modeled using a global database, Biogeosciences, 12, 4121–4132, https://doi.org/10.5194/bg-12-4121-2015, 2015.
He, Y., Trumbore, S. E., Torn, M. S., Harden, J. W., Vaughn, L. J. S., Allison, S. D., and Randerson, J. T.: Radiocarbon constraints imply reduced carbon uptake by soils during the 21st century, Science, 353, 1419–1424, https://doi.org/10.1126/science.aad4273, 2016.
Hill, T. C., Ryan, E., and Williams, M.: The use of CO2 flux time series for parameter and carbon stock estimation in carbon cycle research, Global Change Biol., 18, 179–193, https://doi.org/10.1111/j.1365-2486.2011.02511.x, 2012.
Hobbie, J. E. and Kling, G. W.: Alaska's changing Arctic: Ecological consequences for tundra, streams, and lakes, Oxford University Press, Oxford, 2014.
Hobbie, S. E., Schimel, J. P., Trumbore, S. E., and Randerson, J. R.: Controls over carbon storage and turnover in high-latitude soils, Global Change Biol., 6, 196–210, https://doi.org/10.1046/j.1365-2486.2000.06021.x, 2000.
Hugelius, G., Bockheim, J. G., Camill, P., Elberling, B., Grosse, G., Harden, J. W., Johnson, K., Jorgenson, T., Koven, C. D., Kuhry, P., Michaelson, G., Mishra, U., Palmtag, J., Ping, C. L., O'Donnell, J., Schirrmeister, L., Schuur, E. A. G., Sheng, Y., Smith, L. C., Strauss, J., and Yu, Z.: A new data set for estimating organic carbon storage to 3 m depth in soils of the northern circumpolar permafrost region, Earth Syst. Sci. Data, 5, 393–402, https://doi.org/10.5194/essd-5-393-2013, 2013a.
Hugelius, G., Tarnocai, C., Broll, G., Canadell, J. G., Kuhry, P., and Swanson, D. K.: The Northern Circumpolar Soil Carbon Database: spatially distributed datasets of soil coverage and soil carbon storage in the northern permafrost regions, Earth Syst. Sci. Data, 5, 3–13, https://doi.org/10.5194/essd-5-3-2013, 2013b.
Hugelius, G., Strauss, J., Zubrzycki, S., Harden, J. W., Schuur, E. A. G., Ping, C. L., Schirrmeister, L., Grosse, G., Michaelson, G. J., Koven, C. D., O'Donnell, J. A., Elberling, B., Mishra, U., Camill, P., Yu, Z., Palmtag, J., and Kuhry, P.: Estimated stocks of circumpolar permafrost carbon with quantified uncertainty ranges and identified data gaps, Biogeosciences, 11, 6573–6593, https://doi.org/10.5194/bg-11-6573-2014, 2014.
Ikawa, H., Nakai, T., Busey, R. C., Kim, Y., Kobayashi, H., Nagai, S., Ueyama, M., Saito, K., Nagano, H., Suzuki, R., and Hinzman, L.: Understory CO2, sensible heat, and latent heat fluxes in a black spruce forest in interior Alaska, Agr. Forest Meteorol., 214–215, 80–90, https://doi.org/10.1016/j.agrformet.2015.08.247, 2015.
IPCC: Climate Change 2013: The Physical Science Basis, in: Contribution of Working Group I to the Fifth Assessment Report of the Intergovernmental Panel on Climate Change, Cambridge University Press, Cambridge, UK and New York, NY, USA, 2013.
Ito, A. and Inatomi, M.: Water-Use Efficiency of the Terrestrial Biosphere: A Model Analysis Focusing on Interactions between the Global Carbon and Water Cycles, J. Hydrometeorol., 13, 681–694, https://doi.org/10.1175/jhm-d-10-05034.1, 2012.
Jackson, R. B., Lajtha, K., Crow, S. E., Hugelius, G., Kramer, M. G., and Piñeiro, G.: The Ecology of Soil Carbon: Pools, Vulnerabilities, and Biotic and Abiotic Controls, Annu. Rev. Ecol. Evol. Syst., 48, 419–445, https://doi.org/10.1146/annurev-ecolsys-112414-054234, 2017.
Jung, M., Reichstein, M., Margolis, H. A., Cescatti, A., Richardson, A. D., Arain, M. A., Arneth, A., Bernhofer, C., Bonal, D., Chen, J., Gianelle, D., Gobron, N., Kiely, G., Kutsch, W., Lasslop, G., Law, B. E., Lindroth, A., Merbold, L., Montagnani, L., Moors, E. J., Papale, D., Sottocornola, M., Vaccari, F., and Williams, C.: Global patterns of land-atmosphere fluxes of carbon dioxide, latent heat, and sensible heat derived from eddy covariance, satellite, and meteorological observations, J. Geophys. Res.-Biogeo., 116, G00J07, https://doi.org/10.1029/2010JG001566, 2011.
Jung, M., Reichstein, M., Schwalm, C. R., Huntingford, C., Sitch, S., Ahlström, A., Arneth, A., Camps-Valls, G., Ciais, P., Friedlingstein, P., Gans, F., Ichii, K., Jain, A. K., Kato, E., Papale, D., Poulter, B., Raduly, B., Rödenbeck, C., Tramontana, G., Viovy, N., Wang, Y.-P., Weber, U., Zaehle, S., and Zeng, N.: Compensatory water effects link yearly global land CO2 sink changes to temperature, Nature, 541, 516–520, https://doi.org/10.1038/nature20780, 2017.
Kimball, J. S., Jones, L. A., Zhang, K., Heinsch, F. A., McDonald, K. C., and Oechel, W.: A Satellite Approach to Estimate Land CO2 Exchange for Boreal and Arctic Biomes Using MODIS and AMSR-E, IEEE T. Geosci. Remote, 47, 569–587, https://doi.org/10.1109/TGRS.2008.2003248, 2009.
Koven, C. D., Ringeval, B., Friedlingstein, P., Ciais, P., Cadule, P., Khvorostyanov, D., Krinner, G., and Tarnocai, C.: Permafrost carbon-climate feedbacks accelerate global warming, P. Natl. Acad. Sci. USA, 108, 14769–14774, https://doi.org/10.1073/pnas.1103910108, 2011.
Koven, C. D., Schuur, E. A. G., Schädel, C., Bohn, T. J., Burke, E. J., Chen, G., Chen, X., Ciais, P., Grosse, G., Harden, J. W., Hayes, D. J., Hugelius, G., Jafarov, E. E., Krinner, G., Kuhry, P., Lawrence, D. M., MacDougall, A. H., Marchenko, S. S., McGuire, A. D., Natali, S. M., Nicolsky, D. J., Olefeldt, D., Peng, S., Romanovsky, V. E., Schaefer, K. M., Strauss, J., Treat, C. C., and Turetsky, M.: A simplified, data-constrained approach to estimate the permafrost carbon–climate feedback, Philos. T. Roy. Soc. A, 373, 20140423, https://doi.org/10.1098/rsta.2014.0423, 2015.
Koven, C. D., Hugelius, G., Lawrence, D. M., and Wieder, W. R.: Higher climatological temperature sensitivity of soil carbon in cold than warm climates, Nat. Clim. Change, 7, 817–822, https://doi.org/10.1038/nclimate3421, 2017.
Kutzbach, L., Wille, C., and Pfeiffer, E.-M.: The exchange of carbon dioxide between wet arctic tundra and the atmosphere at the Lena River Delta, Northern Siberia, Biogeosciences, 4, 869–890, https://doi.org/10.5194/bg-4-869-2007, 2007.
Lafleur, P. M., Humphreys, E. R., St. Louis, V. L., Myklebust, M. C., Papakyriakou, T., Poissant, L., Barker, J. D., Pilote, M., and Swystun, K. A.: Variation in Peak Growing Season Net Ecosystem Production Across the Canadian Arctic, Environ. Sci. Technol., 46, 7971–7977, https://doi.org/10.1021/es300500m, 2012.
Lasslop, G., Reichstein, M., Papale, D., Richardson, A. D., Arneth, A., Barr, A., Stoy, P., and Wohlfahrt, G.: Separation of net ecosystem exchange into assimilation and respiration using a light response curve approach: critical issues and global evaluation, Global Change Biol., 16, 187–208, https://doi.org/10.1111/j.1365-2486.2009.02041.x, 2010.
Lawrence, D. M., Oleson, K. W., Flanner, M. G., Thornton, P. E., Swenson, S. C., Lawrence, P. J., Zeng, X., Yang, Z. L., Levis, S., Sakaguchi, K., Bonan, G. B., and Slater, A. G.: Parameterization improvements and functional and structural advances in Version 4 of the Community Land Model, J. Adv. Model. Earth Syst., 3, M03001, https://doi.org/10.1029/2011MS00045, 2011.
Le Quéré, C., Andrew, R. M., Friedlingstein, P., Sitch, S., Pongratz, J., Manning, A. C., Korsbakken, J. I., Peters, G. P., Canadell, J. G., Jackson, R. B., Boden, T. A., Tans, P. P., Andrews, O. D., Arora, V. K., Bakker, D. C. E., Barbero, L., Becker, M., Betts, R. A., Bopp, L., Chevallier, F., Chini, L. P., Ciais, P., Cosca, C. E., Cross, J., Currie, K., Gasser, T., Harris, I., Hauck, J., Haverd, V., Houghton, R. A., Hunt, C. W., Hurtt, G., Ilyina, T., Jain, A. K., Kato, E., Kautz, M., Keeling, R. F., Klein Goldewijk, K., Körtzinger, A., Landschützer, P., Lefèvre, N., Lenton, A., Lienert, S., Lima, I., Lombardozzi, D., Metzl, N., Millero, F., Monteiro, P. M. S., Munro, D. R., Nabel, J. E. M. S., Nakaoka, S.-I., Nojiri, Y., Padin, X. A., Peregon, A., Pfeil, B., Pierrot, D., Poulter, B., Rehder, G., Reimer, J., Rödenbeck, C., Schwinger, J., Séférian, R., Skjelvan, I., Stocker, B. D., Tian, H., Tilbrook, B., Tubiello, F. N., van der Laan-Luijkx, I. T., van der Werf, G. R., van Heuven, S., Viovy, N., Vuichard, N., Walker, A. P., Watson, A. J., Wiltshire, A. J., Zaehle, S., and Zhu, D.: Global Carbon Budget 2017, Earth Syst. Sci. Data, 10, 405–448, https://doi.org/10.5194/essd-10-405-2018, 2018.
Levy, P. E., Friend, A. D., White, A., and Cannell, M. G. R.: The Influence of Land Use Change On Global-Scale Fluxes of Carbon from Terrestrial Ecosystems, Climatic Change, 67, 185–209, https://doi.org/10.1007/s10584-004-2849-z, 2004.
López-Blanco, E., Lund, M., Williams, M., Tamstorf, M. P., Westergaard-Nielsen, A., Exbrayat, J. F., Hansen, B. U., and Christensen, T. R.: Exchange of CO2 in Arctic tundra: impacts of meteorological variations and biological disturbance, Biogeosciences, 14, 4467–4483, https://doi.org/10.5194/bg-14-4467-2017, 2017.
López-Blanco, E., Lund, M., Christensen, T. R., Tamstorf, M. P., Smallman, T. L., Slevin, D., Westergaard-Nielsen, A., Hansen, B. U., Abermann, J., and Williams, M.: Plant Traits are Key Determinants in Buffering the Meteorological Sensitivity of Net Carbon Exchanges of Arctic Tundra, J. Geophys. Res.-Biogeo., 123, 2675–2694, https://doi.org/10.1029/2018JG004386, 2018.
Lucht, W., Prentice, I. C., Myneni, R. B., Sitch, S., Friedlingstein, P., Cramer, W., Bousquet, P., Buermann, W., and Smith, B.: Climatic Control of the High-Latitude Vegetation Greening Trend and Pinatubo Effect, Science, 296, 1687–1689, https://doi.org/10.1126/science.1071828, 2002.
Lund, M., Falk, J. M., Friborg, T., Mbufong, H. N., Sigsgaard, C., Soegaard, H., and Tamstorf, M. P.: Trends in CO2 exchange in a high Arctic tundra heath, 2000–2010, J. Geophys. Res.-Biogeo., 117, G02001, https://doi.org/10.1029/2011JG001901, 2012.
Lund, M., Raundrup, K., Westergaard-Nielsen, A., López-Blanco, E., Nymand, J., and Aastrup, P.: Larval outbreaks in West Greenland: Instant and subsequent effects on tundra ecosystem productivity and CO2 exchange, Ambio, 46, 26–38, https://doi.org/10.1007/s13280-016-0863-9, 2017.
Luo, Y., Weng, E., Wu, X., Gao, C., Zhou, X., and Zhang, L.: Parameter identifiability, constraint, and equifinality in data assimilation with ecosystem models, Ecol. Appl., 19, 571–574, https://doi.org/10.1890/08-0561.1, 2009.
Mack, M. C., Bret-Harte, M. S., Hollingsworth, T. N., Jandt, R. R., Schuur, E. A. G., Shaver, G. R., and Verbyla, D. L.: Carbon loss from an unprecedented Arctic tundra wildfire, Nature, 475, 489–492, https://doi.org/10.1038/nature10283, 2011.
Mastepanov, M., Sigsgaard, C., Dlugokencky, E. J., Houweling, S., Strom, L., Tamstorf, M. P., and Christensen, T. R.: Large tundra methane burst during onset of freezing, Nature, 456, 628–630, https://doi.org/10.1038/nature07464, 2008.
McGuire, A. D., Melillo, J. M., Randerson, J. T., Parton, W. J., Heimann, M., Meier, R. A., Clein, J. S., Kicklighter, D. W., and Sauf, W.: Modeling the effects of snowpack on heterotrophic respiration across northern temperate and high latitude regions: Comparison with measurements of atmospheric carbon dioxide in high latitudes, Biogeochemistry, 48, 91–114, https://doi.org/10.1023/a:1006286804351, 2000.
McGuire, A. D., Hayes, D., Kicklighter, D. W., Manizza, M., Zhuang, Q., Chen, M., Follows, M. J., Gurney, K. R., Mcclelland, J. W., Melillo, J. M., Peterson, B. J., and Prinn, R. G.: An analysis of the carbon balance of the Arctic Basin from 1997 to 2006, Tellus B, 62, 455–474, https://doi.org/10.1111/j.1600-0889.2010.00497.x, 2010.
McGuire, A. D., Christensen, T. R., Hayes, D., Heroult, A., Euskirchen, E., Kimball, J. S., Koven, C., Lafleur, P., Miller, P. A., Oechel, W., Peylin, P., Williams, M., and Yi, Y.: An assessment of the carbon balance of Arctic tundra: comparisons among observations, process models, and atmospheric inversions, Biogeosciences, 9, 3185–3204, https://doi.org/10.5194/bg-9-3185-2012, 2012.
Murray-Tortarolo, G., Anav, A., Friedlingstein, P., Sitch, S., Piao, S., Zhu, Z., Poulter, B., Zaehle, S., Ahlström, A., Lomas, M., Levis, S., Viovy, N., and Zeng, N.: Evaluation of Land Surface Models in Reproducing Satellite-Derived LAI over the High-Latitude Northern Hemisphere. Part I: Uncoupled DGVMs, Remote Sensing, 5, 4819, https://doi.org/10.3390/rs5104819, 2013.
Myers-Smith, I. H., Forbes, B. C., Wilmking, M., Hallinger, M., Lantz, T., Blok, D., Tape, K. D., Macias-Fauria, M., Sass-Klaassen, U., Lévesque, E., Boudreau, S., Ropars, P., Hermanutz, L., Trant, A., Siegwart, C. L., Weijers, S., Rozema, J., Rayback, S. A., Schmidt, N. M., Schaepman-Strub, G., Wipf, S., Rixen, C., Ménard, C. B., Venn, S., Goetz, S., Andreu-Hayles, L., Elmendorf, S., Ravolainen, V., Welker, J., Grogan, P., Epstein, H. E., and Hik, D. S.: Shrub expansion in tundra ecosystems: dynamics, impacts and research priorities, Environ. Res. Lett., 6, 045509, https://doi.org/10.1088/1748-9326/6/4/045509, 2011.
Myneni, R. B., Keeling, C. D., Tucker, C. J., Asrar, G., and Nemani, R. R.: Increased plant growth in the northern high latitudes from 1981 to 1991, Nature, 386, 698–702, https://doi.org/10.1038/386698a0, 1997.
Myneni, R. B., Hoffman, S., Knyazikhin, Y., Privette, J. L., Glassy, J., Tian, Y., Wang, Y., Song, X., Zhang, Y., Smith, G. R., Lotsch, A., Friedl, M., Morisette, J. T., Votava, P., Nemani, R. R., and Running, S. W.: Global products of vegetation leaf area and fraction absorbed PAR from year one of MODIS data, Remote Sens. Environ., 83, 214–231, https://doi.org/10.1016/S0034-4257(02)00074-3, 2002.
Nishina, K., Ito, A., Beerling, D. J., Cadule, P., Ciais, P., Clark, D. B., Falloon, P., Friend, A. D., Kahana, R., Kato, E., Keribin, R., Lucht, W., Lomas, M., Rademacher, T. T., Pavlick, R., Schaphoff, S., Vuichard, N., Warszawaski, L., and Yokohata, T.: Quantifying uncertainties in soil carbon responses to changes in global mean temperature and precipitation, Earth Syst. Dynam., 5, 197–209, https://doi.org/10.5194/esd-5-197-2014, 2014.
Nishina, K., Ito, A., Falloon, P., Friend, A. D., Beerling, D. J., Ciais, P., Clark, D. B., Kahana, R., Kato, E., Lucht, W., Lomas, M., Pavlick, R., Schaphoff, S., Warszawaski, L., and Yokohata, T.: Decomposing uncertainties in the future terrestrial carbon budget associated with emission scenarios, climate projections, and ecosystem simulations using the ISI-MIP results, Earth Syst. Dynam., 6, 435–445, https://doi.org/10.5194/esd-6-435-2015, 2015.
Papale, D., Reichstein, M., Aubinet, M., Canfora, E., Bernhofer, C., Kutsch, W., Longdoz, B., Rambal, S., Valentini, R., Vesala, T., and Yakir, D.: Towards a standardized processing of Net Ecosystem Exchange measured with eddy covariance technique: algorithms and uncertainty estimation, Biogeosciences, 3, 571–583, https://doi.org/10.5194/bg-3-571-2006, 2006.
Parazoo, N. C., Koven, C. D., Lawrence, D. M., Romanovsky, V., and Miller, C. E.: Detecting the permafrost carbon feedback: talik formation and increased cold-season respiration as precursors to sink-to-source transitions, The Cryosphere, 12, 123–144, https://doi.org/10.5194/tc-12-123-2018, 2018.
Peñuelas, J., Rutishauser, T., and Filella, I.: Phenology Feedbacks on Climate Change, Science, 324, 887–888, https://doi.org/10.1126/science.1173004, 2009.
Running, S. W., Nemani, R. R., Heinsch, F. A., Zhao, M., Reeves, M., and Hashimoto, H.: A Continuous Satellite-Derived Measure of Global Terrestrial Primary Production, BioScience, 54, 547–560, https://doi.org/10.1641/0006-3568(2004)054[0547:ACSMOG]2.0.CO;2, 2004.
Sari, J., Tarmo, V., Vladimir, K., Tuomas, L., Maiju, L., Juha, M., Johanna, N., Aleksi, R., Juha-Pekka, T., and Mika, A.: Spatial variation and seasonal dynamics of leaf-area index in the arctic tundra-implications for linking ground observations and satellite images, Environ. Res. Lett., 12, 095002, https://doi.org/10.1088/1748-9326/aa7f85, 2017.
Schaphoff, S., Heyder, U., Ostberg, S., Gerten, D., Heinke, J., and Lucht, W.: Contribution of permafrost soils to the global carbon budget, Environ. Res. Lett., 8, 014026, https://doi.org/10.1088/1748-9326/8/1/014026, 2013.
Schuur, E. A. G., McGuire, A. D., Schadel, C., Grosse, G., Harden, J. W., Hayes, D. J., Hugelius, G., Koven, C. D., Kuhry, P., Lawrence, D. M., Natali, S. M., Olefeldt, D., Romanovsky, V. E., Schaefer, K., Turetsky, M. R., Treat, C. C., and Vonk, J. E.: Climate change and the permafrost carbon feedback, Nature, 520, 171–179, https://doi.org/10.1038/nature14338, 2015.
Sierra, C. A., Müller, M., Metzler, H., Manzoni, S., and Trumbore, S. E.: The muddle of ages, turnover, transit, and residence times in the carbon cycle, Global Change Biol., 23, 1763–1773, https://doi.org/10.1111/gcb.13556, 2017.
Sitch, S., Smith, B., Prentice, I. C., Arneth, A., Bondeau, A., Cramer, W., Kaplan, J. O., Levis, S., Lucht, W., Sykes, M. T., Thonicke, K., and Venevsky, S.: Evaluation of ecosystem dynamics, plant geography and terrestrial carbon cycling in the LPJ dynamic global vegetation model, Global Change Biol., 9, 161–185, https://doi.org/10.1046/j.1365-2486.2003.00569.x, 2003.
Smallman, T. L., Exbrayat, J.-F., Mencuccini, M., Bloom, A. A., and Williams, M.: Assimilation of repeated woody biomass observations constrains decadal ecosystem carbon cycle uncertainty in aggrading forests, J. Geophys. Res.-Biogeo., 122, 528–545, https://doi.org/10.1002/2016JG003520, 2017.
Smith, B., Prentice, I. C., and Sykes, M. T.: Representation of vegetation dynamics in the modelling of terrestrial ecosystems: comparing two contrasting approaches within European climate space, Global Ecol. Biogeogr., 10, 621–637, https://doi.org/10.1046/j.1466-822X.2001.t01-1-00256.x, 2001.
Smith, B., Wårlind, D., Arneth, A., Hickler, T., Leadley, P., Siltberg, J., and Zaehle, S.: Implications of incorporating N cycling and N limitations on primary production in an individual-based dynamic vegetation model, Biogeosciences, 11, 2027–2054, https://doi.org/10.5194/bg-11-2027-2014, 2014.
Street, L. E., Stoy, P. C., Sommerkorn, M., Fletcher, B. J., Sloan, V. L., Hill, T. C., and Williams, M.: Seasonal bryophyte productivity in the sub-Arctic: a comparison with vascular plants, Funct. Ecol., 26, 365–378, https://doi.org/10.1111/j.1365-2435.2011.01954.x, 2012.
Tarnocai, C., Canadell, J. G., Schuur, E. A. G., Kuhry, P., Mazhitova, G., and Zimov, S.: Soil organic carbon pools in the northern circumpolar permafrost region, Global Biogeochem. Cy., 23, GB2023, https://doi.org/10.1029/2008GB003327, 2009.
Thornton, P. E., Doney, S. C., Lindsay, K., Moore, J. K., Mahowald, N., Randerson, J. T., Fung, I., Lamarque, J. F., Feddema, J. J., and Lee, Y. H.: Carbon-nitrogen interactions regulate climate-carbon cycle feedbacks: results from an atmosphere-ocean general circulation model, Biogeosciences, 6, 2099–2120, https://doi.org/10.5194/bg-6-2099-2009, 2009.
Thurner, M., Beer, C., Santoro, M., Carvalhais, N., Wutzler, T., Schepaschenko, D., Shvidenko, A., Kompter, E., Ahrens, B., Levick, S. R., and Schmullius, C.: Carbon stock and density of northern boreal and temperate forests, Global Ecol. Biogeogr., 23, 297–310, https://doi.org/10.1111/geb.12125, 2014.
Thurner, M., Beer, C., Carvalhais, N., Forkel, M., Santoro, M., Tum, M., and Schmullius, C.: Large-scale variation in boreal and temperate forest carbon turnover rate related to climate, Geophys. Res. Lett., 43, 4576–4585, https://doi.org/10.1002/2016GL068794, 2016.
Thurner, M., Beer, C., Ciais, P., Friend, A. D., Ito, A., Kleidon, A., Lomas, M. R., Quegan, S., Rademacher, T. T., Schaphoff, S., Tum, M., Wiltshire, A., and Carvalhais, N.: Evaluation of climate-related carbon turnover processes in global vegetation models for boreal and temperate forests, Global Change Biol., 23, 3076–3091, https://doi.org/10.1111/gcb.13660, 2017.
Tian, H., Chen, G., Lu, C., Xu, X., Hayes, D. J., Ren, W., Pan, S., Huntzinger, D. N., and Wofsy, S. C.: North American terrestrial CO2 uptake largely offset by CH4 and N2O emissions: toward a full accounting of the greenhouse gas budget, Climatic Change, 129, 413–426, https://doi.org/10.1007/s10584-014-1072-9, 2015.
Tum, M., Zeidler, J. N., Günther, K. P., and Esch, T.: Global NPP and straw bioenergy trends for 2000–2014, Biomass Bioenergy, 90, 230–236, https://doi.org/10.1016/j.biombioe.2016.03.040, 2016.
Walter, B. P., Heimann, M., and Matthews, E.: Modeling modern methane emissions from natural wetlands: 1. Model description and results, J. Geophys. Res., 106, 34189–34206, https://doi.org/10.1029/2001JD900165, 2001.
Wania, R., Ross, I., and Prentice, I. C.: Integrating peatlands and permafrost into a dynamic global vegetation model: 1. Evaluation and sensitivity of physical land surface processes, Global Biogeochem. Cy., 23, GB3014, https://doi.org/10.1029/2008GB003412, 2009a.
Wania, R., Ross, I., and Prentice, I. C.: Integrating peatlands and permafrost into a dynamic global vegetation model: 2. Evaluation and sensitivity of vegetation and carbon cycle processes, Global Biogeochem. Cy., 23, GB3015, https://doi.org/10.1029/2008GB003413, 2009b.
Warszawski, L., Frieler, K., Huber, V., Piontek, F., Serdeczny, O., and Schewe, J.: The Inter-Sectoral Impact Model Intercomparison Project (ISI–MIP): Project framework, P. Natl. Acad. Sci. USA, 111, 3228–3232, https://doi.org/10.1073/pnas.1312330110, 2014.
Williams, M.: DALEC2, software, University of Edinburgh, https://doi.org/10.7488/ds/2504, 2019.
Williams, M., Rastetter, E. B., Fernandes, D. N., Goulden, M. L., Shaver, G. R., and Johnson, L. C.: Predicting Gross Primary Productivity in Terrestrial Ecosystems, Ecol. Appl., 7, 882–894, https://doi.org/10.2307/2269440, 1997.
Williams, M., Schwarz, P. A., Law, B. E., Irvine, J., and Kurpius, M. R.: An improved analysis of forest carbon dynamics using data assimilation, Global Change Biol., 11, 89–105, https://doi.org/10.1111/j.1365-2486.2004.00891.x, 2005.
Woodward, F. I., Smith, T. M., and Emanuel, W. R.: A global land primary productivity and phytogeography model, Global Biogeochem. Cy., 9, 471–490, https://doi.org/10.1029/95GB02432, 1995.
Xu, T., Valocchi, A. J., Ye, M., and Liang, F.: Quantifying model structural error: Efficient Bayesian calibration of a regional groundwater flow model using surrogates and a data-driven error model, Water Resour. Res., 53, 4084–4105, https://doi.org/10.1002/2016WR019831, 2017.
Zaehle, S. and Friend, A. D.: Carbon and nitrogen cycle dynamics in the O-CN land surface model: 1. Model description, site-scale evaluation, and sensitivity to parameter estimates, Global Biogeochem. Cy., 24, GB1005, https://doi.org/10.1029/2009GB003521, 2010.
Zeng, H., Jia, G., and Epstein, H.: Recent changes in phenology over the northern high latitudes detected from multi-satellite data, Environ. Res. Lett., 6, 045508, https://doi.org/10.1088/1748-9326/6/4/045508, 2011.
Zeng, N., Mariotti, A., and Wetzel, P.: Terrestrial mechanisms of interannual CO2 variability, Global Biogeochem. Cy., 19, GB1016, https://doi.org/10.1029/2004GB002273, 2005.
Zhao, M., Heinsch, F. A., Nemani, R. R., and Running, S. W.: Improvements of the MODIS terrestrial gross and net primary production global data set, Remote Sens. Environ., 95, 164–176, https://doi.org/10.1016/j.rse.2004.12.011, 2005.
Zhu, Z., Piao, S., Myneni, R. B., Huang, M., Zeng, Z., Canadell, J. G., Ciais, P., Sitch, S., Friedlingstein, P., Arneth, A., Cao, C., Cheng, L., Kato, E., Koven, C., Li, Y., Lian, X., Liu, Y., Liu, R., Mao, J., Pan, Y., Peng, S., Peñuelas, J., Poulter, B., Pugh, T. A. M., Stocker, B. D., Viovy, N., Wang, X., Wang, Y., Xiao, Z., Yang, H., Zaehle, S., and Zeng, N.: Greening of the Earth and its drivers, Nat. Clim. Change, 6, 791–795, https://doi.org/10.1038/nclimate3004, 2016.
Zhuang, Q., Melillo, J. M., Sarofim, M. C., Kicklighter, D. W., McGuire, A. D., Felzer, B. S., Sokolov, A., Prinn, R. G., Steudler, P. A., and Hu, S.: CO2 and CH4 exchanges between land ecosystems and the atmosphere in northern high latitudes over the 21st century, Geophys. Res. Lett., 33, L17403, https://doi.org/10.1029/2006GL026972, 2006.
Zona, D., Gioli, B., Commane, R., Lindaas, J., Wofsy, S. C., Miller, C. E., Dinardo, S. J., Dengel, S., Sweeney, C., Karion, A., Chang, R. Y.-W., Henderson, J. M., Murphy, P. C., Goodrich, J. P., Moreaux, V., Liljedahl, A., Watts, J. D., Kimball, J. S., Lipson, D. A., and Oechel, W. C.: Cold season emissions dominate the Arctic tundra methane budget, P. Natl. Acad. Sci. USA, 113, 40–45, https://doi.org/10.1073/pnas.1516017113, 2016.