the Creative Commons Attribution 4.0 License.
the Creative Commons Attribution 4.0 License.
 | 05 Mar 2018
Quantification of the impacts of climate change and human agricultural activities on oasis water requirements in an arid region: a case study of the Heihe River basin, China
Xingran Liu
Ecological deterioration in arid regions caused by agricultural development has become a global issue. Understanding water requirements of the oasis ecosystems and the influences of human agricultural activities and climate change is important for the sustainable development of oasis ecosystems and water resource management in arid regions. In this study, water requirements of the main oasis in Heihe River basin during 1986–2013 were analyzed and the amount showed a sharp increase from 10.8 × 10⁸ m3 in 1986 to 19.0 × 10⁸ m3 in 2013. Both human agricultural activities and climate change could lead to the increase in water requirement. To quantify the contributions of agricultural activities and climate change to the increase in water requirements, partial derivative and slope method were used. Results showed that climate change and human agricultural activities, such as oasis expansion and changes in land cropping structure, has contributed to the increase in water requirement at rates of 6.9, 58.1, and 25.3 %, respectively. Overall, human agricultural activities were the dominant forces driving the increase in water requirement. In addition, the contribution of oasis expanding to the increased water requirement was significantly greater than that of other concerned variables. This reveals that controlling the oasis scale is extremely important and effective for balancing water for agriculture and ecosystems and to achieving a sustainable oasis development in arid regions.
- Article
(10463 KB) - Full-text XML
- BibTeX
- EndNote


Inland river basins take up about 11.4 % of the land area in the world and most of them are distributed over arid regions (Li et al., 2013). Water resources in arid regions are scarce and critical to ecosystems and societies. For the inland river basins in arid regions, water resources mainly originate from the precipitation and snow/glacier melting in the upstream mountainous areas, and are consumed mainly by agriculture and human society in oases of the piedmont plains in the midstream area, and then finally are discharged and dispersed in the tail lakes downstream (Kang et al., 1999; Shen and Chen, 2010). The precipitation in plain areas or in major economic centers of arid basins has nearly no significant meaning for generating runoff (Shen and Chen, 2010).
Owing to scarce water resources in arid regions, ecosystems and societies are vulnerable to hydrologic changes. With the rapid growth of population in arid regions of the world (Shen and Chen, 2010), the utilization of surface and groundwater for irrigation increased without enough consideration for ecological conservation, which caused severe deterioration of water and ecosystems in most arid river basins. For example, the Amu Darya and the Syr Darya are two main rivers in Central Asia, which flow towards the Aral Sea. More than 90 % of the water withdrawal in the region was used for agricultural irrigation (Sorg et al., 2014). With the increase in irrigated area in the past decades, irrigation withdrawals have measurably reduced inflow to the Aral Sea since 1960s, which caused significant shrinking of the water surface of the Aral Sea and land desertification, and even the fishery in the Aral Sea has almost been destroyed because of salinization (Micklin, 1988; Sorg et al., 2014; Shen and Chen, 2010; Karimov and Matthies, 2013). Similarly, the disappearance of Lop Nor in western China, the dying of the Dead Sea in the Middle East, and the shrinking of Lake Chad in Africa are all notable examples. Ecological deterioration in arid regions caused by agricultural development has become a global issue and has become the main obstacle to the sustainable development of oasis ecosystems.
Despite human exploitation, climate change can also influence the water resources in arid regions. It is reported that the climate in arid regions has become drier in the past century (Narisma et al., 2007; Dai et al., 2004), showing increasing temperature, variability of precipitation, and reduction of glaciers and snow areas (Wang and Qin, 2017) and will be more arid in the future (Bates et al., 2008). However, huge amount of studies suggested that the water and ecological degradation in arid regions was largely affected much more by irrational human exploitation than climate change (Jarsjö et al., 2008; Aus der Beek et al., 2011; Huo et al., 2008; Dong et al., 2014; Ma et al., 2014).
The ecological degradation and water shortages have heightened the importance of water allocated to the agriculture in the oasis ecosystems. Water requirement is an important parameter for irrigation scheduling and regional water allocation. Studies on water requirements are theoretically and practically indispensable for the sustainable development of oasis ecosystems in arid regions. Scientists have obtained some research results about water requirements of oasis ecosystems, including the crop water requirements (Kawy and El-Magd, 2013; Liu et al., 2010; Siebert et al., 2007; Zhao et al., 2005, 2010; De Silva et al., 2007; Kawy and Darwish, 2014), and ecological water requirements (Guo et al., 2016; Ye et al., 2010; Zhao et al., 2007). Studies have shown that the water requirement will increase if the climate becomes drier and warmer (Döll, 2002; Nkomozepi and Chung, 2012; Fu et al., 2014), and human activities have gradually become the predominant factor increasing the water requirement in the past decades (Bai et al., 2014; Coe and Foley, 2001; Zou et al., 2017). However, there are few studies that separately quantify the contributions of climate change and human agricultural activities to changes in water requirement.
Approximately one-quarter of land area in China is located in arid regions. As the second-largest inland river in China, the Heihe River basin has also suffered water conflict between agricultural development and ecological health, and was chosen as the target basin for a key national research program on ecohydrology and integrated basin water management by the Natural Scientific Foundation of China in 2012, and the program is still ongoing. Thus, the oasis in the middle Heihe River basin, where more than 90 % of the arable land is concentrated was taken as the study area. The main objectives of this study are to make clear the changes in water requirements in the oasis under climate change and human agricultural activities and identify the main factor that influences the changes in water requirement based on the clarification of the contributions of climate and human activities, including land structure and area, to the changes in water requirement. The research questions addressed were as follows: (1) how have the water requirements of the oasis changed in the past ∼ 30 years? (2) Why has the water requirement of the oasis changed? We anticipate that this study will be a valuable reference for the water resource research in arid regions around the globe.
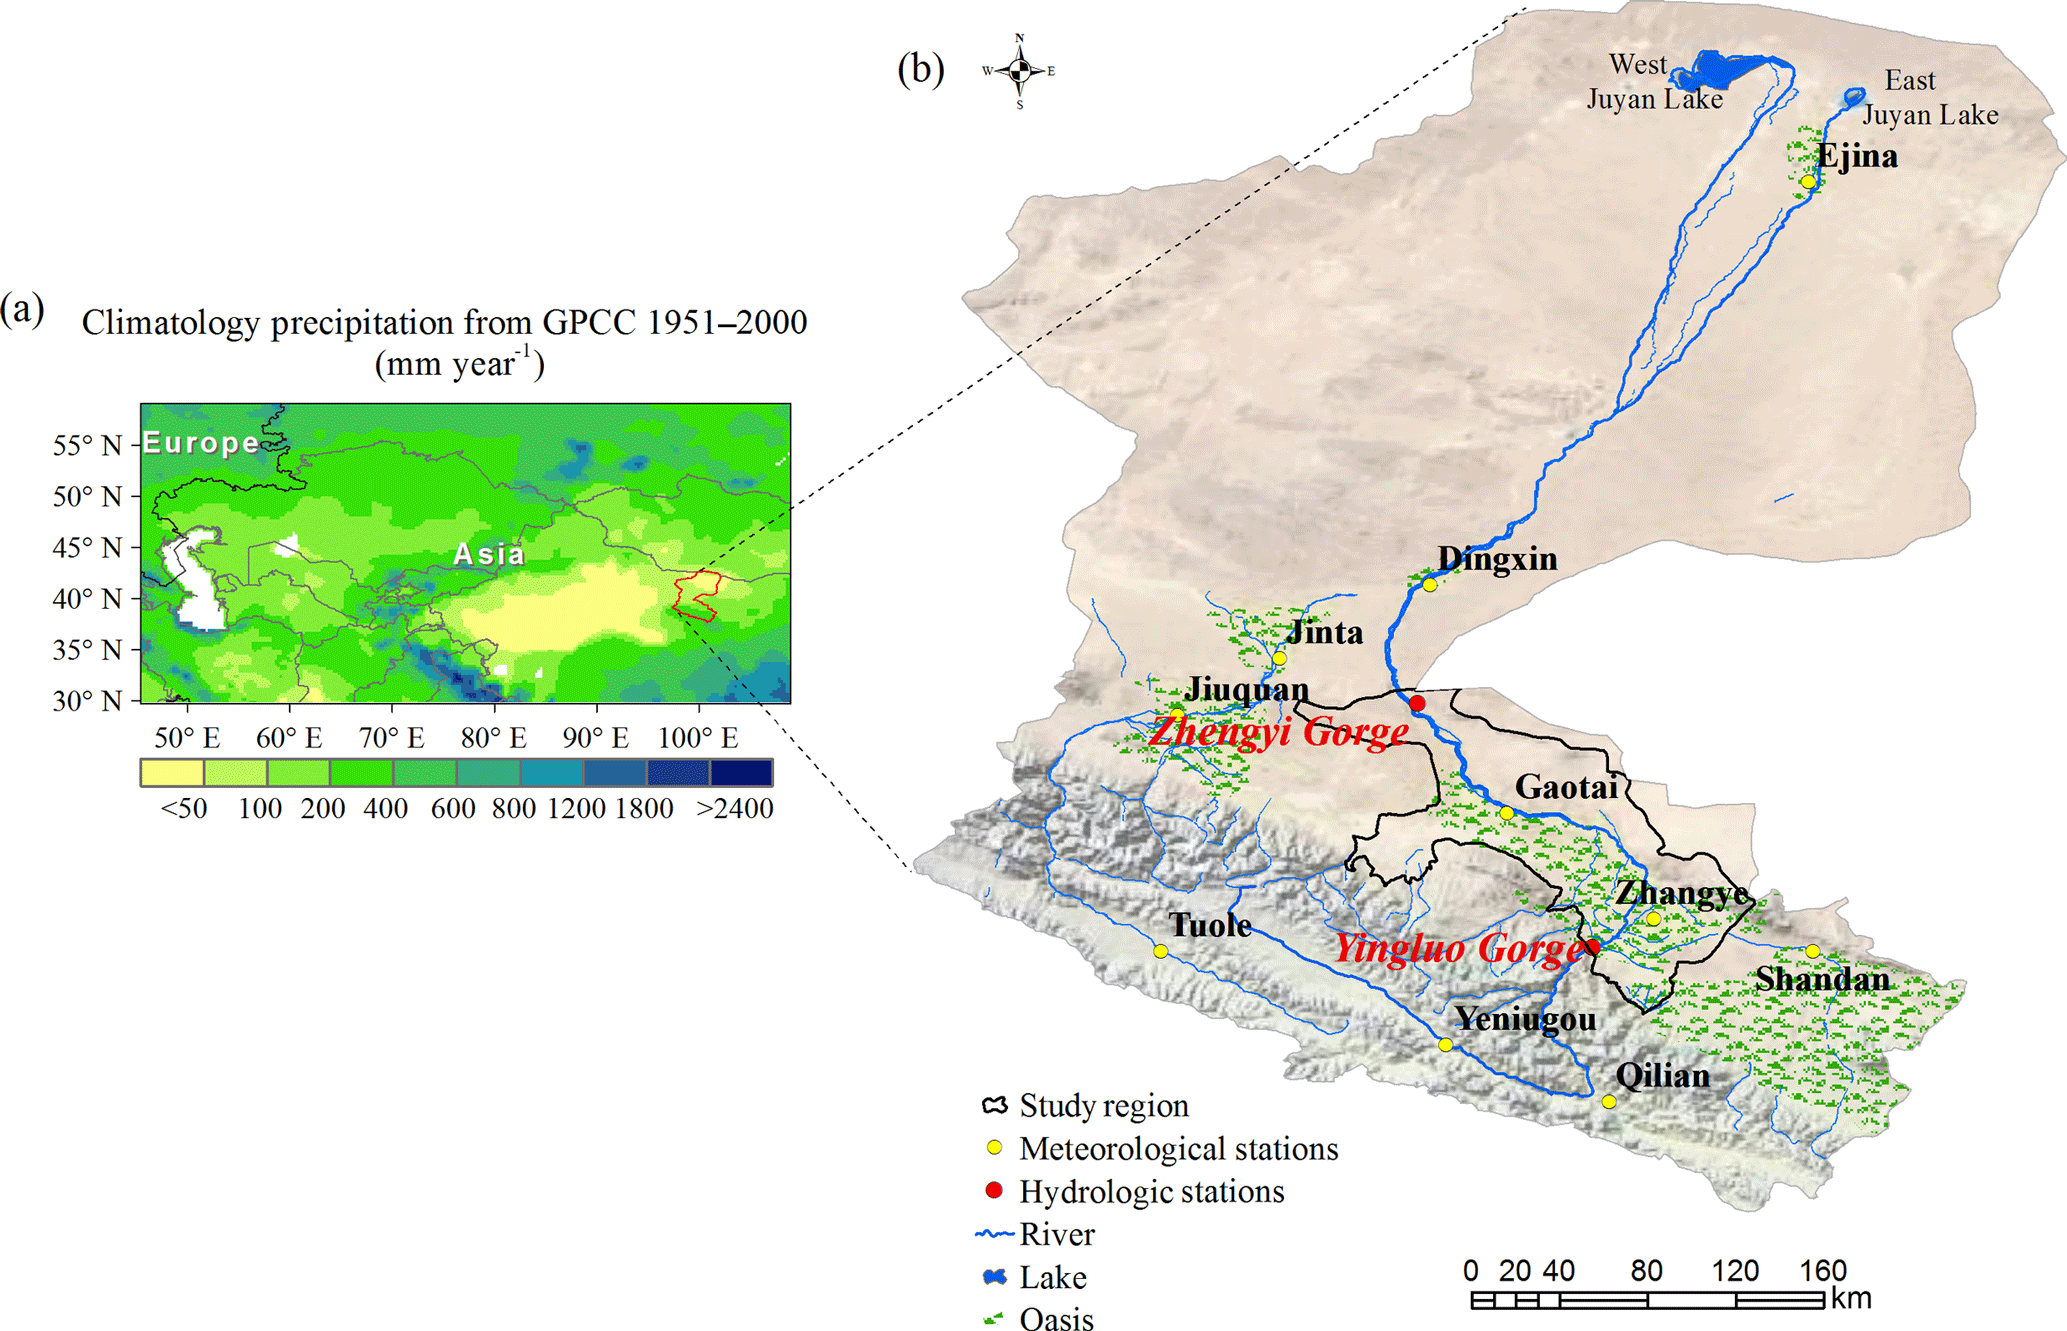
Figure 1Details of the study area. (a) The location of Heihe River basin and the mean annual precipitation (1951–2000). (b) Regional setting and the landscape of Heihe River basin with location of meteorological and hydrologic stations.
2.1 Study area
Heihe River originates in the Qilian Mountains, and flows to the oases in the piedmont plain after reaching the mountain outlet at the Yingluo Gorge, then finally terminating at the East and West Juyan lakes. It contains an ecosystem which consists of ice–snow, frozen soil, and mountain vegetation zones at the upper reach, and oasis zone and desert zone at the middle and down reaches (Ersi et al., 1999; Kang et al., 2005; Zhao et al., 2007). The study was conducted in the oasis in the middle Heihe River basin (between 38∘32′ and 39∘52′ N, and 98∘57′ and 100∘51′ E), China (Fig. 1). It covers a total area of 8.6 × 10⁹ m2, included in Ganzhou district, Linze county, and Gaotai county. More than 90 % of the population and arable land in the Heihe River basin were concentrated in this oasis (Zhang et al., 2006).
Situated in the interior of the Eurasian continent, the study area possesses a temperate continental arid climate with sufficient sunlight, wide temperature variations, and scarce precipitation. According to the observed data by Gaotai and Zhangye meteorological stations in the study region during 1953–2014, the annual average temperature is about 6.0–9.4 ∘C, with the lowest temperatures occurring in January and December, and highest temperatures occurring in July. The annual sunshine in the region is about 2800–3400 h. The mean annual precipitation is less than 130 mm (e.g., the mean annual precipitation is 107.86 and 129.10 mm at Gaotai and Zhangye meteorological stations, respectively). Over 60 % of the precipitation falls between June and August (Zhao et al., 2005). However, the annual potential evaporation reaches 1400 mm (Li et al., 2016).
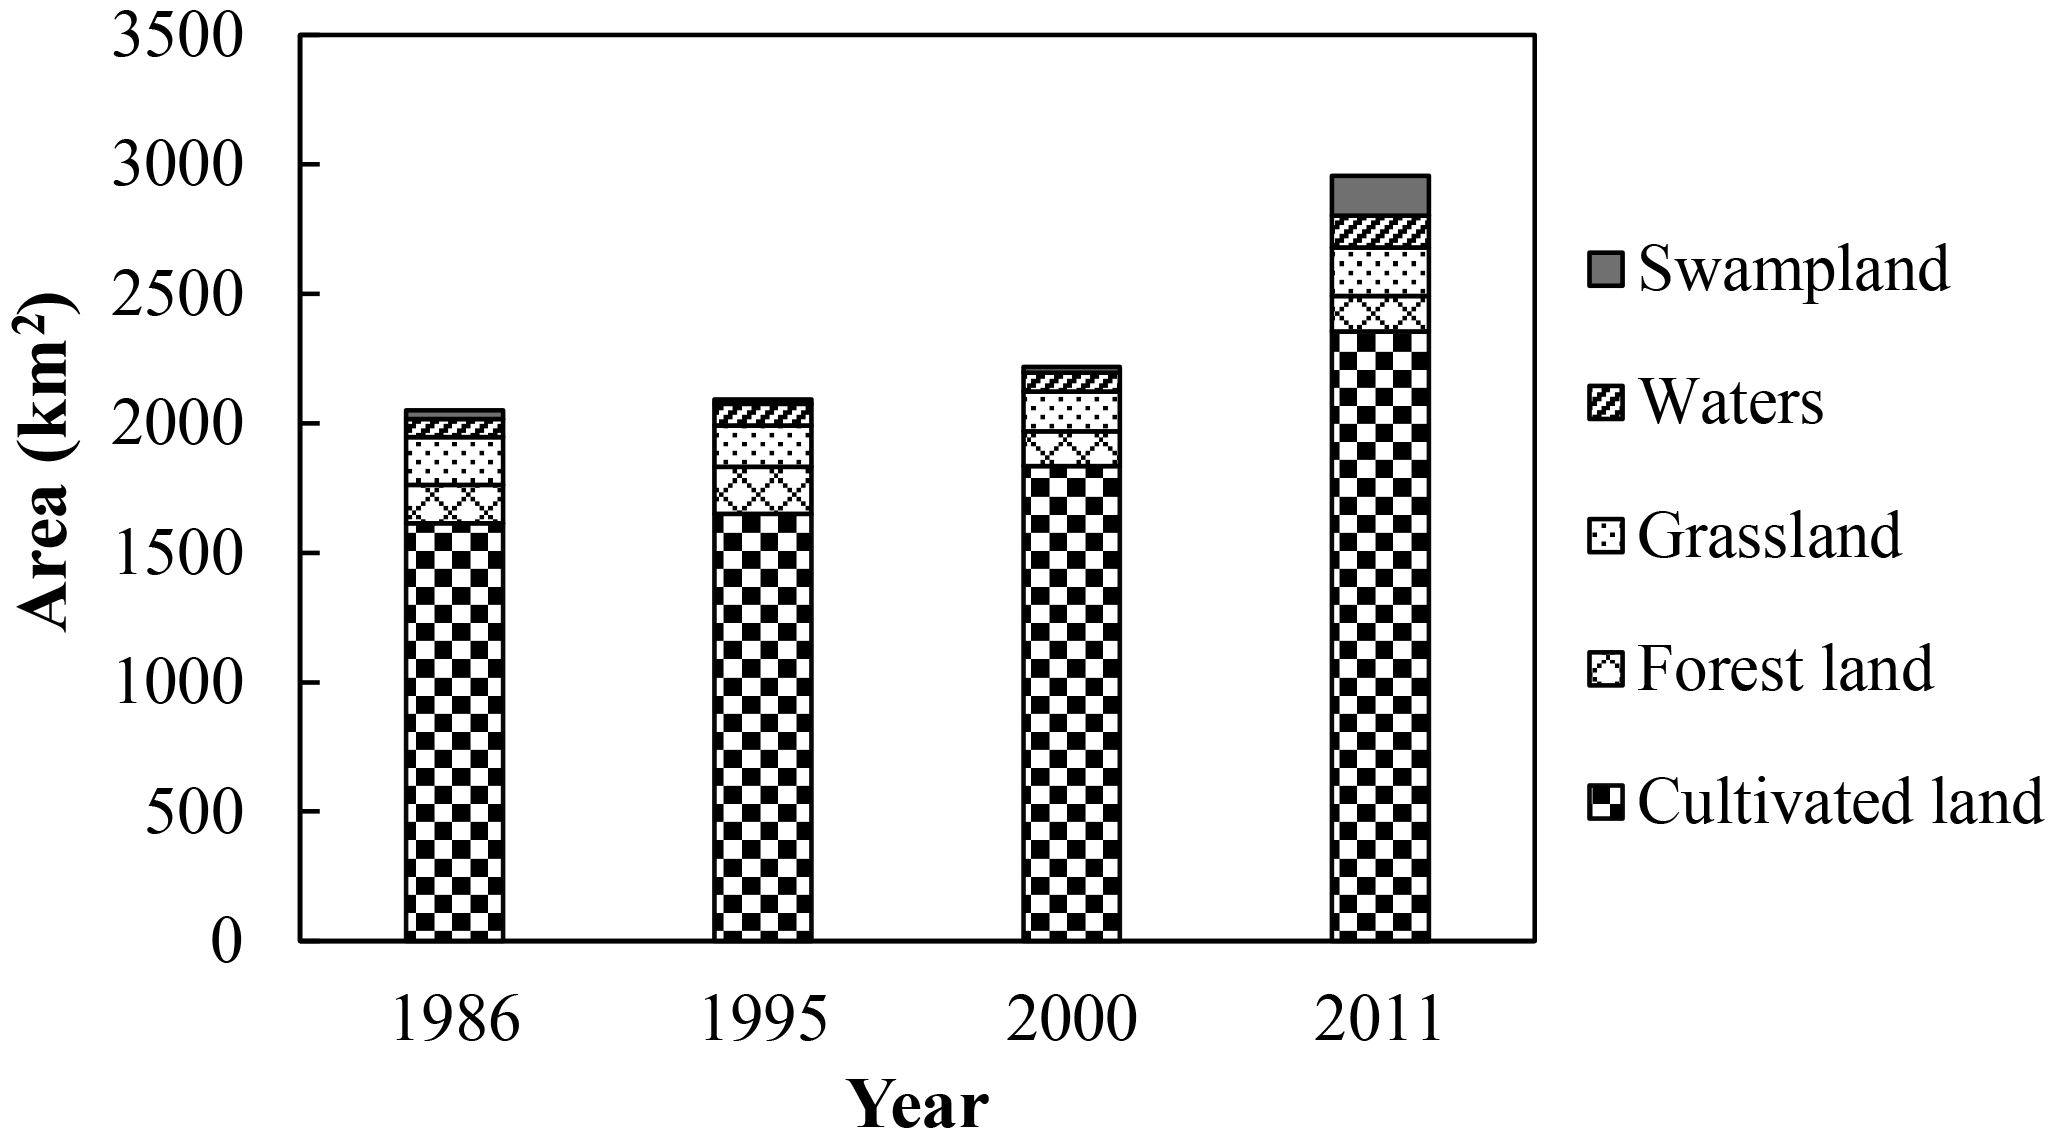
The study area has an agricultural development history of over 2000 years owing to its flat land, adequate sunlight, and convenient water resource from Qilian Mountains. The oasis in the middle Heihe River basin has thus become an important commodity grain base in China. Combined together, the cultivated land, forest, grass, swampland, and waters make up the oasis. The oasis area has been expanding in the past ∼ 30 years. According to the land use data developed by the Chinese Academy of Sciences (CAS), the oasis area increased ∼ 906 km2 during the past decades, in which the cultivated land increased about 740 km2 (Fig. 2). In addition, the cropping pattern has also changed greatly in the past ∼ 30 years (Fig. 3). The area of maize increased significantly; conversely, the wheat planting area decreased evidently. Additionally, the planting area of vegetables also increased especially in Gaotai county during the past ∼ 30 years. The cropping pattern in the study area has become more focuses only solely maize, providing more than 40 % of maize seeds in China (Xing, 2013).
Lacking in precipitation, surface runoff has become the main surface water resources for irrigation. The middle Heihe River flows from Yingluo Gorge to Zhengyi Gorge, supplying water for oasis in the middle river basin. Annual discharge observed at Yingluo Gorge increased from around 14.4 × 10⁸ m3 in the 1960s to 15.7 × 10⁸ m3 in the 1990s, while the discharge observed at Zhengyi Gorge decreased from around 10.5 × 10⁸ m3 in the 1960s to around 7.5 × 10⁸ m3 in the 1990s (Wang et al., 2014). The development of modern irrigation schemes and the growth of population and irrigation area in the middle basin took up an increasing share of water resources, endangering the hydrological conditions, ecology, and environment in the Heihe River basin (Chen et al., 2005; Jia et al., 2011). More than 30 tributaries as well as the terminal lakes have dried up, and the discharge downstream decreased significantly in the past 50 years (Wang and Cheng, 1999; Chen et al., 2005). Such hydrological changes have resulted in a marked degradation of the ecological environment, land salinization, and desertification in the entire basin. To restore the ecosystem of the downstream areas, the Ecological Water Diversion Project (EWDP) was launched by the Chinese Government around the year 2000, which stipulated that water flowing from the Zhengyi Gorge downstream should be over 9.5 × 10⁸ m3 when the annual average water supplied from the Yingluo Gorge is 15.8 × 10⁸ m3 (Zhao et al., 2016). Due to the EWDP, the discharge observed at Zhengyi Gorge has increased since 2000, which led to less available surface water for the middle Heihe River basin, and more groundwater was taken for irrigation (Ji et al., 2006). According to the groundwater withdrawal data (1990–2007) of the irrigation districts in the middle Heihe River basin (Wu et al., 2014; Zheng, 2014), which were downloaded from the Cold and Arid Regions Science Data Center at Lanzhou (http://westdc.westgis.ac.cn), only 1.13 × 10⁸ m3 of groundwater was pumped on average in 1990s, but the amount increased to 3.25 × 10⁸ m3 on average during 2000–2007.
2.2 Data handling and processing
2.2.1 Meteorological data
Daily meteorological observations were collected from China Meteorological Administration (CMA), mainly including the maximum, minimum, and average air temperatures, wind speed, relative humidity, and sunshine duration. Ten meteorological stations – which covered the Gaotai and Zhangye stations inside the study region and Dingxin, Jinta, Jiuquan, Tuole, Yeniugou, Qilian, Shandan, and Alxa Youqi stations outside the study region – were selected to get the spatial distribution of meteorological elements (Fig. 1). Observations on crop growth and phenology were collected from the agricultural meteorological stations in Gansu Province, especially from the station in Zhangye. However, the data on crop growth and phenology were only basically recorded completely for the maize (1993–2013) and spring wheat (1992–2013), so the growth and phenology data for other vegetation were obtained by references (Liu, 2014; Allen et al., 1998; Pu et al., 2004; Li et al., 2009; Zhou et al., 2015), combining practical investigation. The growth and phenology data for maize before 1993 were set as that in 1993, and for spring wheat before 1992 as that in 1992.
2.2.2 Land use data
Land use data for years 1986, 1995, 2000, and 2011 at a spatial resolution of 30 m (Wang et al., 2011a, b; Liu et al., 2003; Wang et al., 2014), which were developed by CAS, were used in this study. The same classifying system for land cover was applied to the 4 years of land use data. The land use patterns in the basin have been divided into six types: cultivated land; forest land, which includes closed forest land, sparse woodland, shrubs, and other woodland; grassland, which contains high-coverage grassland, moderate-coverage grassland, and low-coverage grassland; waters which comprise rivers, lakes, reservoirs, and beach land; construction land; and unused land, which contains sand, gobi, saline–alkali land, swampland, bare land, bare rock, and gravel. To obtain the continuous land use maps, the land use data at the spatial resolution of 30 m were transformed into the land use data at the spatial resolution of 1 km in the form of percentage. Then the spatial distribution of the land use data between the four discrete years could be obtained by linear interpolation.
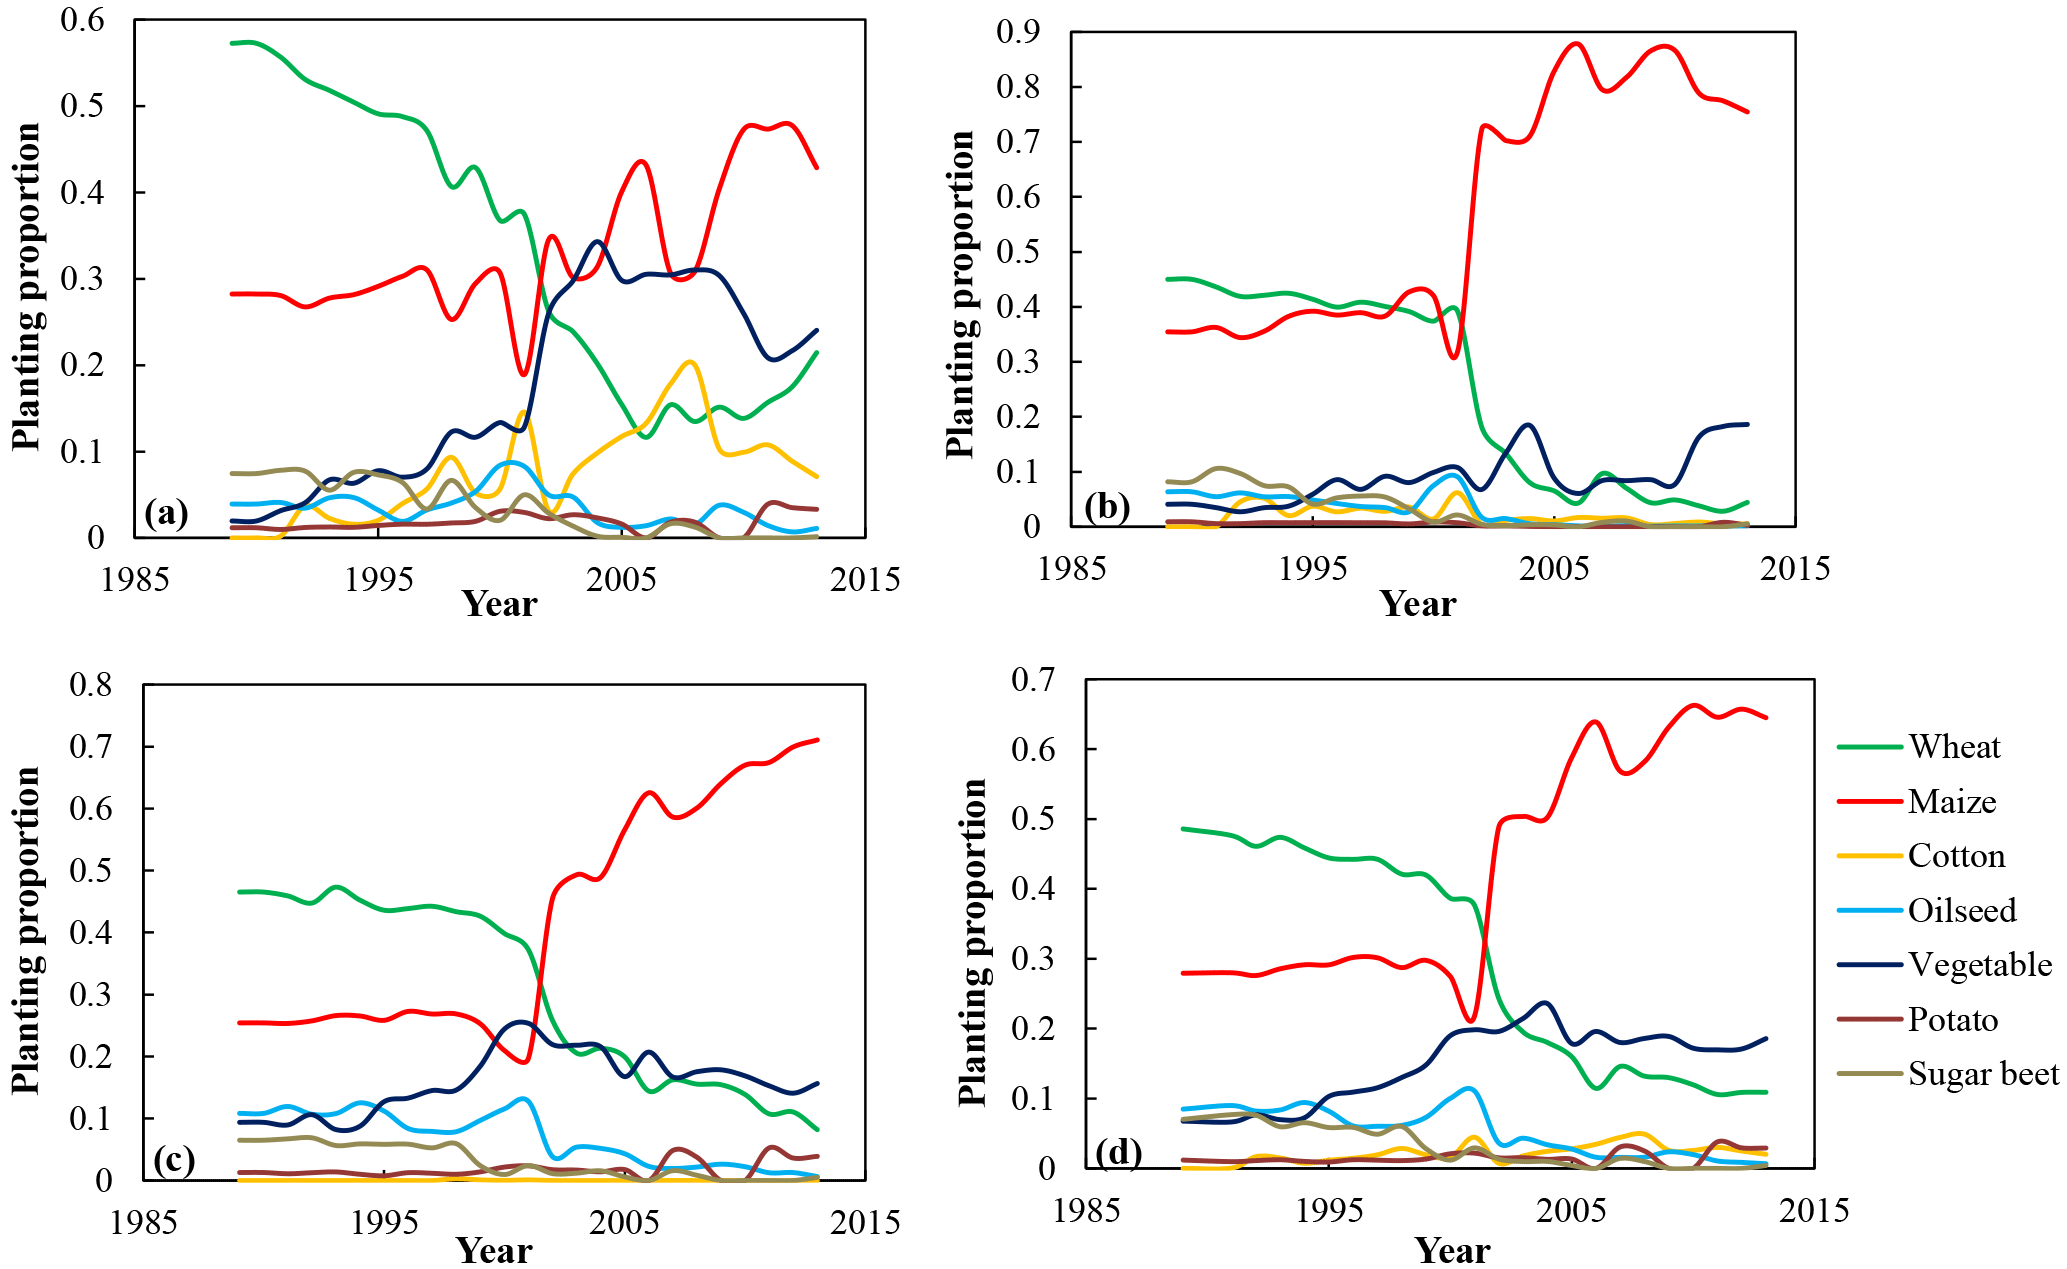
Figure 3The planting proportion of the crops in (a) Gaotai county, (b) Linze county, (c) Ganzhou district, and (d) a region including Gaotai and Linze counties, and Ganzhou district in the middle Heihe River basin.
To obtain the spatial distribution of specific crops in the cultivated land, the socioeconomic statistical data were collected from the Gansu Development Yearbook (1984–2014) and Gansu Rural Yearbook (1990–2014), including various crops sown at the county level. Based on the main crops in the Statistical Yearbooks, the cultivated land was classified into seven types: maize, spring wheat, cotton, oilseed, sugar beet, potato, and vegetables. According to the proportion of each crop in each county (Fig. 3), the spatial distribution of the seven crops were determined.
2.2.3 Validation data
The water requirements estimated in this study were compared with two evapotranspiration (ET) data sets provided by Cold and Arid Regions Science Data Center at Lanzhou (http://westdc.westgis.ac.cn). One was the monthly ET data sets (2000–2013) at 30 m spatial resolution (Wu et al., 2012; Liu et al., 2011) estimated by ETWatch developed by Wu et al. (2008) and Xiong et al. (2010) for monitoring spatial ET for operational purposes; this data set only covered part of the oasis which included Ganzhou district, Linze county, and small part of the Gaotai county in the middle Heihe River basin. The other was the daily ET data set (2009–2011) of the Heihe River basin at 1 km spatial resolution (Cui and Jia, 2014; Jia et al., 2013) estimated by ETMonitor, which is a hybrid remotely sensed actual ET estimation model developed by Hu and Jia (2015). The intersections of the ET data sets and water requirements were used for comparison.
2.3 Estimates of water requirements
In this study, the water requirements of the cultivated land, forest land, high-coverage grassland, moderate-coverage grassland, waters except the beach land, and the swampland in the unused land were considered. The water requirements of the low-coverage grassland, beach land, construction land, and unused land except the swampland were taken as zero.
2.3.1 Water requirements for the cultivated land and grassland
Water requirements of the crops and grass in the oasis refer to the evapotranspiration from disease-free, well-fertilized crops, grown in large fields, under optimum soil water conditions and achieving full production under the given climatic conditions. This can be calculated using crop coefficient approach as following:
where ETc is the water requirement; Kc is the crop coefficient; ET0 is the reference evapotranspiration.
ET0 was calculated using the modified Penman–Monteith equation recommended by United Nations Food and Agriculture Organization (FAO; Allen et al., 1998). Reference evapotranspiration is only related to meteorological factors (Shahid, 2010). It can be used in a wide range of locations and climates, and can be calculated using the following equation:
where ET0 is the reference evapotranspiration (mm); Rn is the net radiation at crop surface (MJ m−2 day−1); G is the soil heat flux density (MJ m−2 day−1); u2 is the wind speed at a height of 2 m (m s−1); T is the mean daily air temperature at a height of 2 m (∘); es is the saturation vapor pressure (kPa); ea is the actual vapor pressure (kPa); Δ is the slope of the vapor pressure-temperature curve (kPa ∘−1); and γ is the psychrometric constant (kPa ∘−1).
Table 1Crop coefficients of the different crops in different growth stages in the oasis of the middle Heihe River basin.
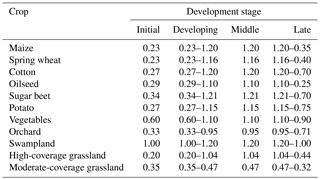
Different vegetation types have different Kc coefficients. The changing characteristics of the vegetation over the growing season also affect the Kc coefficient, so Kc for a given vegetation type will vary over the growing period, which can be divided into four distinct growth stages: initial, crop development, mid-season, and late season. In the current study, Kc for different crop species in the cultivated land during the four growth stages were determined according to Duan et al. (2004) and FAO (Allen et al., 1998). In addition, Kc for the grassland were determined according to Liu (2014). The Kc values are shown in Table 1.
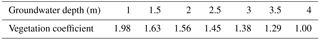
Table 2Vegetation coefficient in different depths of groundwater level.
2.3.2 Water requirements for the forest land
For the forest land, the water requirements of closed forest land, sparse woodland and shrubs were estimated by phreatic evaporation. It can be calculated as below:
where Wi is the ecological water demand of vegetation i; Si is the area of vegetation type i; Wgi is the phreatic evaporation capacity of the vegetation type i at a certain groundwater depth; kp is the vegetation coefficient, which is related to the groundwater depth (Table 2; Song et al., 2000).
Wgi is the key to calculating vegetation ecological water demand using the phreatic evaporation method, and it is usually calculated using Averyanov's phreatic evaporation equations:
where a and b are empirical coefficients (0.856 and 3.674 in the study area; Wang and Cheng, 2002); hi is the groundwater depth of vegetation type i, which is 1.5, 2, and 2.5 m for the closed forest land, sparse woodland, and shrubs, respectively; hmax is the maximum depth of phreatic evaporation, which is 5 m (Wang and Cheng, 2002); and E0 is the surface water evaporation.
The other woodland in the study area was mainly orchard, so the water requirement of other woodland was calculated by the crop coefficient approach (Table 1).
2.3.3 Water requirements for waters and the swampland
The water requirement of waters can be taken as the evaporation from water surfaces, which can be calculated according to Shuttleworth (1993):
where ETw is the water requirement of waters (mm); λ is the latent heat of vaporization (MJ kg−1).
The water requirement for the swampland was calculated by crop coefficient approach. The Kc values of the vegetation in the swampland were determined depending on the single crop coefficients suggested in FAO (Table 1).
2.4 Contribution assessment
According to the methods to estimate water requirements of the oasis in the middle Heihe River basin, the value of the water requirements (y) is mainly related to the climate (x1), total area of the oasis (x2), and area proportions of the land structure (x3). Mathematically, the function can be written as
The variation of the dependent variable y can be expressed by a differential equation as
As y varies with time t, we can rewrite Eq. (7) as
where is the slope of the linear regression for y against time t; can be taken as the slope of the linear regression for y against time t when x2 and x3 do not change with the time; can be taken as the slope of the linear regression for y against time t when x1 and x3 do not change with the time; can be taken as the slope of the linear regression for y against time t when x1 and x2 do not change with the time. Because the spatial distribution of the climate is not homogeneous, the location where a certain land use type is located can also affect the water requirement. Thus, other factors related to the water requirements were fitted into δ, combining the systemic error.
The individual proportional contribution (ρ) of related factors to the long-term trend in y can be estimated as
where xi can be the variable x1, x2, and x3.

Figure 4The water requirement (a) and water requirement per unit area (b) for different land use types in the oasis of the middle Heihe River basin from 1986 to 2013.
There are 15 specific land use types in the oasis of the middle Heihe River basin, which are cultivated land (maize, spring wheat, cotton, oilseed, sugar beet, potato, vegetables), grassland (high-coverage grassland, moderate-coverage grassland), forest land (closed forest land, sparse woodland, shrubs, other woodland), waters, and swampland. Different land use types may have different water requirements. To understand the water requirements in the oasis, the spatial and temporal variations of the total water requirement and the water requirement per unit area were analyzed. In the study, the water requirement per unit area for each land use type was calculated by dividing the total water requirement of each land use type by the corresponding land area. After validation to ensure the accuracy of the results, the water balance and determinants to the variation of the water requirement of the oasis in the middle Heihe River basin were analyzed.
3.1 Temporal and spatial variations in water requirements of the oasis in the middle Heihe River basin
The water requirement of the total oasis increased from 10.8 × 10⁸ m3 in 1986 to 19.0 × 10⁸ m3 in 2013 (Fig. 4a). According to the land use data, the area of the cultivated land accounted for ∼ 80 % of the total area of the oasis (Fig. 2). Therefore, the water requirement of the cultivated land increased from 8.4 × 10⁸ m3 in 1986 to 14.7 × 10⁸ m3 in 2013 (Fig. 4a), which occupied 76–82 % of the total oasis water requirement during 1986–2013. The mean annual water requirements of the cultivated land and the whole oasis were 10.5 × 10⁸ and 13.3 × 10⁸ m3, respectively. The water requirement of the swampland and waters from 2000 to 2013 increased greatly, as did the water requirement of the forest land from 1986 to 1995. However, the waters, swampland, forest land, and grassland needed less water, with values all smaller than 1.7 × 10⁸ m3 because their proportions in the oasis were all smaller than 9 % (Figs. 4a, 2).
The water requirement of the cultivated land per unit area increased from 519.2 to 624.9 mm during 1986–2013, while the water requirement of the oasis per unit area increased from 527.1 to 642.0 mm during 1986–2013 (Fig. 4b). The mean annual water requirements of the cultivated land and the oasis per unit area were 545.2 and 557.9 mm, respectively. Maize, spring wheat, and vegetables are the main crops in the middle Heihe River basin. The mean annual water requirements of the maize, spring wheat, and vegetables per unit area were 571.5, 413.7, and 728.8 mm, respectively. Waters required the most water per unit area, the mean annual water requirement of which reached 1323.9 mm. The swampland covered with reeds also needed a large amount of water per unit area, the mean annual water requirement of which reaching 968.6 mm. Different land surface coverage for grassland and forest land had different water requirements. The mean annual water requirements of the closed forest land, sparse woodland, shrubs, other woodland, high-coverage grassland, and moderate-coverage grassland per unit area were 477.5, 128.9, 264.0, 705.1, 663.6, and 340.0 mm, respectively.

Figure 5The spatial distribution of the water requirement in the cultivated land and oasis at the spatial resolution of 1 km in the middle Heihe River basin in 1986, 1995, 2000, 2011.
The oasis in the middle Heihe River basin was scattered along the rivers. Most of the water requirements in the oasis were below 500 mm per square kilometer in 1986 considering the mixed pixel and area weight, but with the climate change and human agricultural activities, the water requirement in large area of the oasis exceed 500 mm per square kilometer in 2011 (Fig. 5). In addition, the area of high water requirement in the oasis agreed with the location of the cultivated land (Fig. 5). Additionally, the ecological vegetation in the oasis except northwest Gaotai county did not show significant increase in water requirement (Fig. 5).
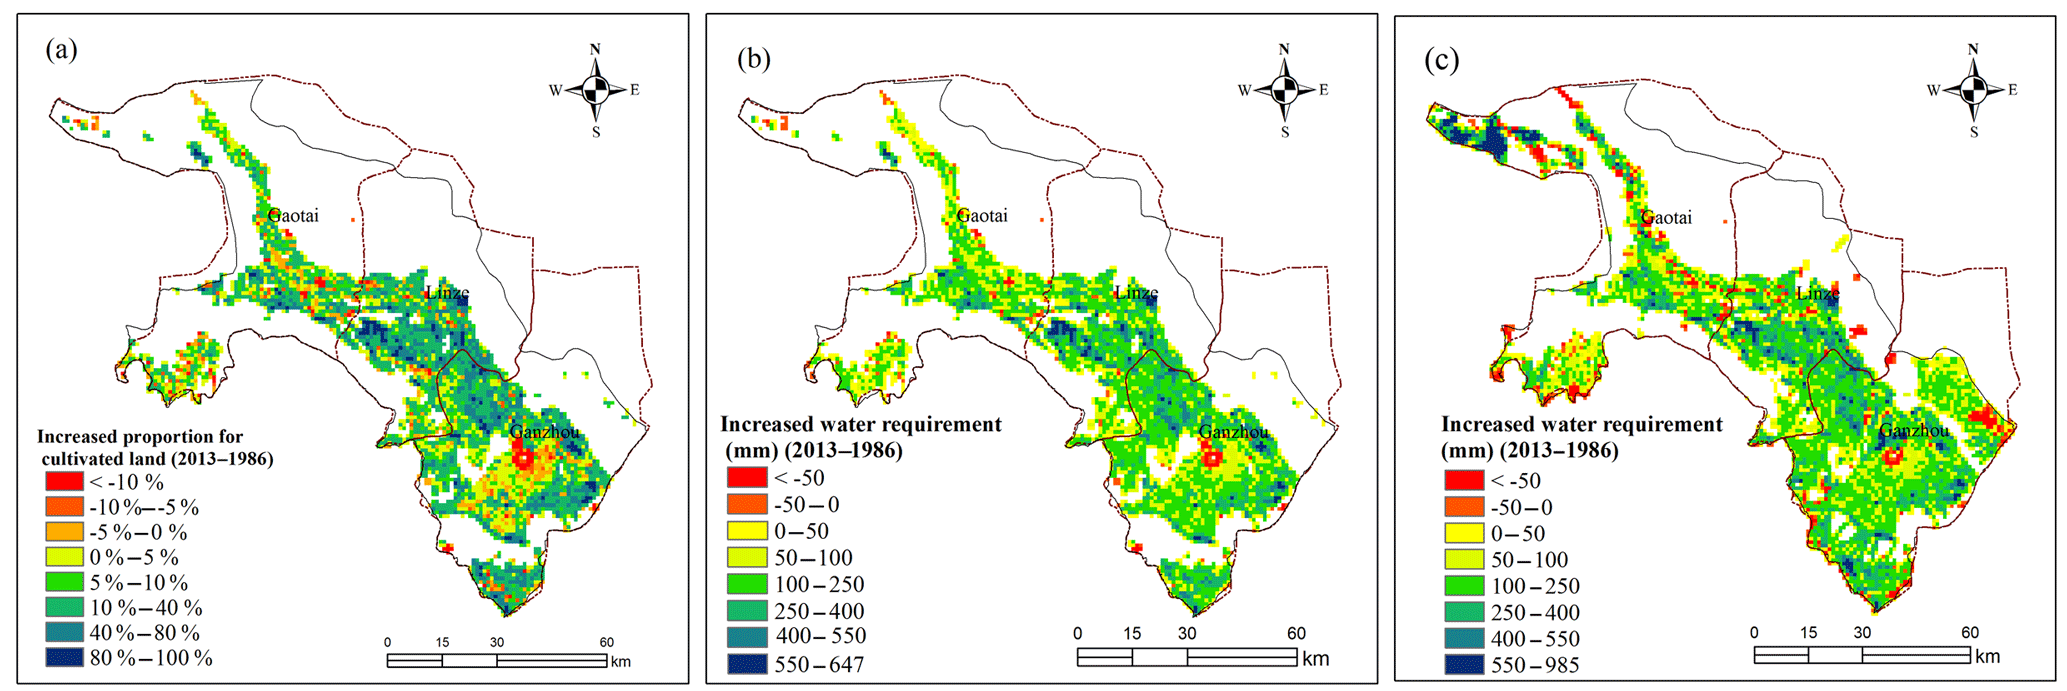
Figure 6The difference of (a) the proportion of cultivated land, (b) water requirement in the cultivated land, and (c) water requirement in the oasis, at the spatial resolution of 1 km between 1986 and 2013 in the middle Heihe River basin.
The cultivated land in most area of the oasis expanded during the past ∼ 30 years, especially in Linze county and the north of Ganzhou district (Fig. 6a). This was in accordance with the area of water requirement increased in the cultivated land and the oasis (Fig. 6). The water requirement in the cultivated land increased above 100 mm per square kilometer in Linze county and the north of Ganzhou district. The larger the area of cultivated land, the more water the cultivated land required (Fig. 6b). Only a small part of the cultivated land shrank in the oasis and caused the decrease in water requirement in the corresponding cultivated land (Fig. 6). As the dominant part affecting the water requirement in the oasis, the spatial distribution of the increased water requirement in the cultivated land was similar to that in the oasis (Fig. 6b, c). The water requirement in northwest Gaotai county increased obviously due to the increasing area of swampland after the year of 2000.
3.2 Validation of the oasis water requirements
Water requirement is defined as a theoretical value. For the crops, it can be taken as the potential crop ET. However, there were no available data observed or calculated by others for the potential crop ET, so the actual ET data were adopted to validate the water requirement in the oasis to see if the results were acceptable.
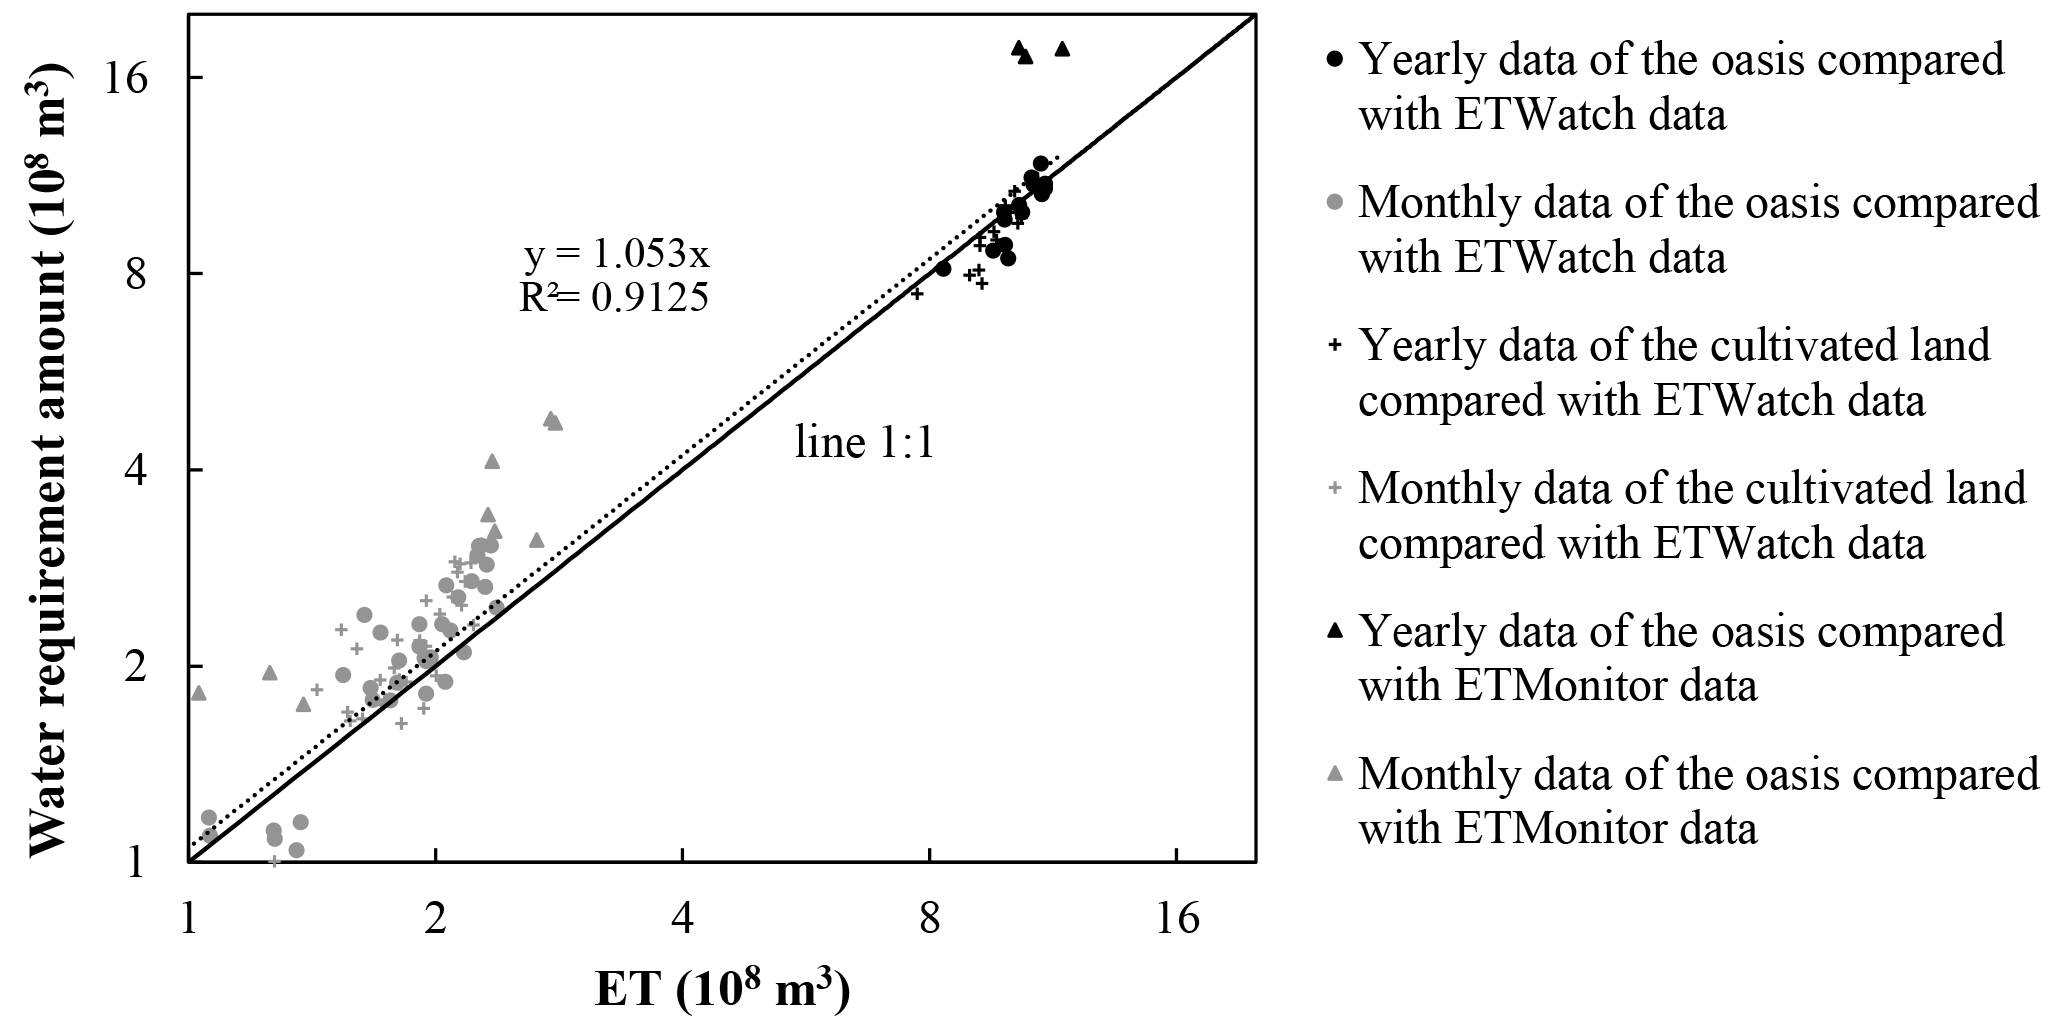
Figure 7The comparison between the yearly and monthly (May, June, July) water requirements and ET data, which included the ET data estimated by ETWatch model from 2000 to 2013 for the cultivated land and the oasis, and the ET data estimated by ETMonitor model from 2009 to 2011 for the oasis.
According to the yearly and monthly ET estimated by ETWatch and ETMonitor, the total ET was well correlated with the estimated water requirement with the determination coefficient (R2) of 0.91 (Fig. 7), and slope of the linear regression of 1.05 (Fig. 7). Compared with the yearly ET data sets (2000–2013) estimated by ETWatch with 30 m spatial resolution over part of the oasis, the root-mean-square error (RMSE) between the ET and water requirement for the cultivated land and the oasis were 0.69 × 10⁸ and 0.65 × 10⁸ m3, respectively. Because the water requirement is the potential ET, the water requirement should not be smaller than the ET. However, the yearly ET included not only the ET during crop growth period; it also included the ET from the bare land after harvesting the crops. As the estimated water requirement for the crops only included the water requirement during the crop growth period, most yearly ET data were larger than the yearly water requirements (Fig. 7). To remove the influence of the bare land, the monthly ET data sets in May, June, and July were selected to validate the water requirement because the vegetation including the crops were all in their growth period over the 3 months. It showed that the water requirement was highly correlated with the ET (Fig. 7). In addition, the RMSE for the cultivated land and the oasis were both 0.36 × 10⁸ m3, which were much smaller than the yearly RMSE. Most of the monthly water requirements were higher than the monthly ET data (Fig. 7).
Compared with the ET data sets (2009–2011) estimated by ETMonitor at 1 km spatial resolution in the middle Heihe River basin, the yearly and monthly water requirements were all larger than the corresponding ET data (Fig. 7), and the RMSE for the monthly data in May, June, and July was 1.27 × 10⁸ m3. Because the resolution of the ET data sets estimated by ETMonitor was relatively low, only the results in the oasis were validated considering the problem of mixed pixels. The yearly estimated water requirements in 2009, 2000, and 2011 were smaller than the ET data estimated by ETWatch for the oasis, which was contrary to the results compared with the ET data estimated by ETMonitor, which showed that the two ET data sets deviated from each other, and the estimated water requirements were acceptable.
3.3 Water balance in the middle Heihe River basin
Yingluo Gorge divides the upper and middle Heihe River, and Zhengyi Gorge divides the middle and lower Heihe River. The two hydrologic stations recorded the inflow and outflow of the mainstream of the middle Heihe River. Thus, the surface runoff of the mainstream of the middle Heihe River consumed in the middle Heihe River basin can be considered as the difference between Yingluo Gorge and Zhengyi Gorge. Additionally, there are some small rivers that also flow into the middle Heihe River basin, like Shandan River and Liyuan River. The mean annual runoff of the Liyuan River and Shandan River is 2.36 × 10⁸ m3 (Wu and Miao, 2015) and 0.86 × 10⁸ m3 (Guo et al., 2000), respectively. According to the runoff data (1986–2010) of Zhengyi Gorge and Yingluo Gorge, and precipitation data (1986–2010) obtained from the Cold and Arid Regions Science Data Center at Lanzhou (http://westdc.westgis.ac.cn; Yang et al., 2015), the surface water including the precipitation landing on the oasis and the river discharges of the middle Heihe River, Shandan River, and Liyuan River could meet the water requirement before the year 2004, ignoring the water conveyance loss. However, with the increasing water requirement of the oasis, the water supply from the land surface could not meet the requirement any more (Fig. 8).
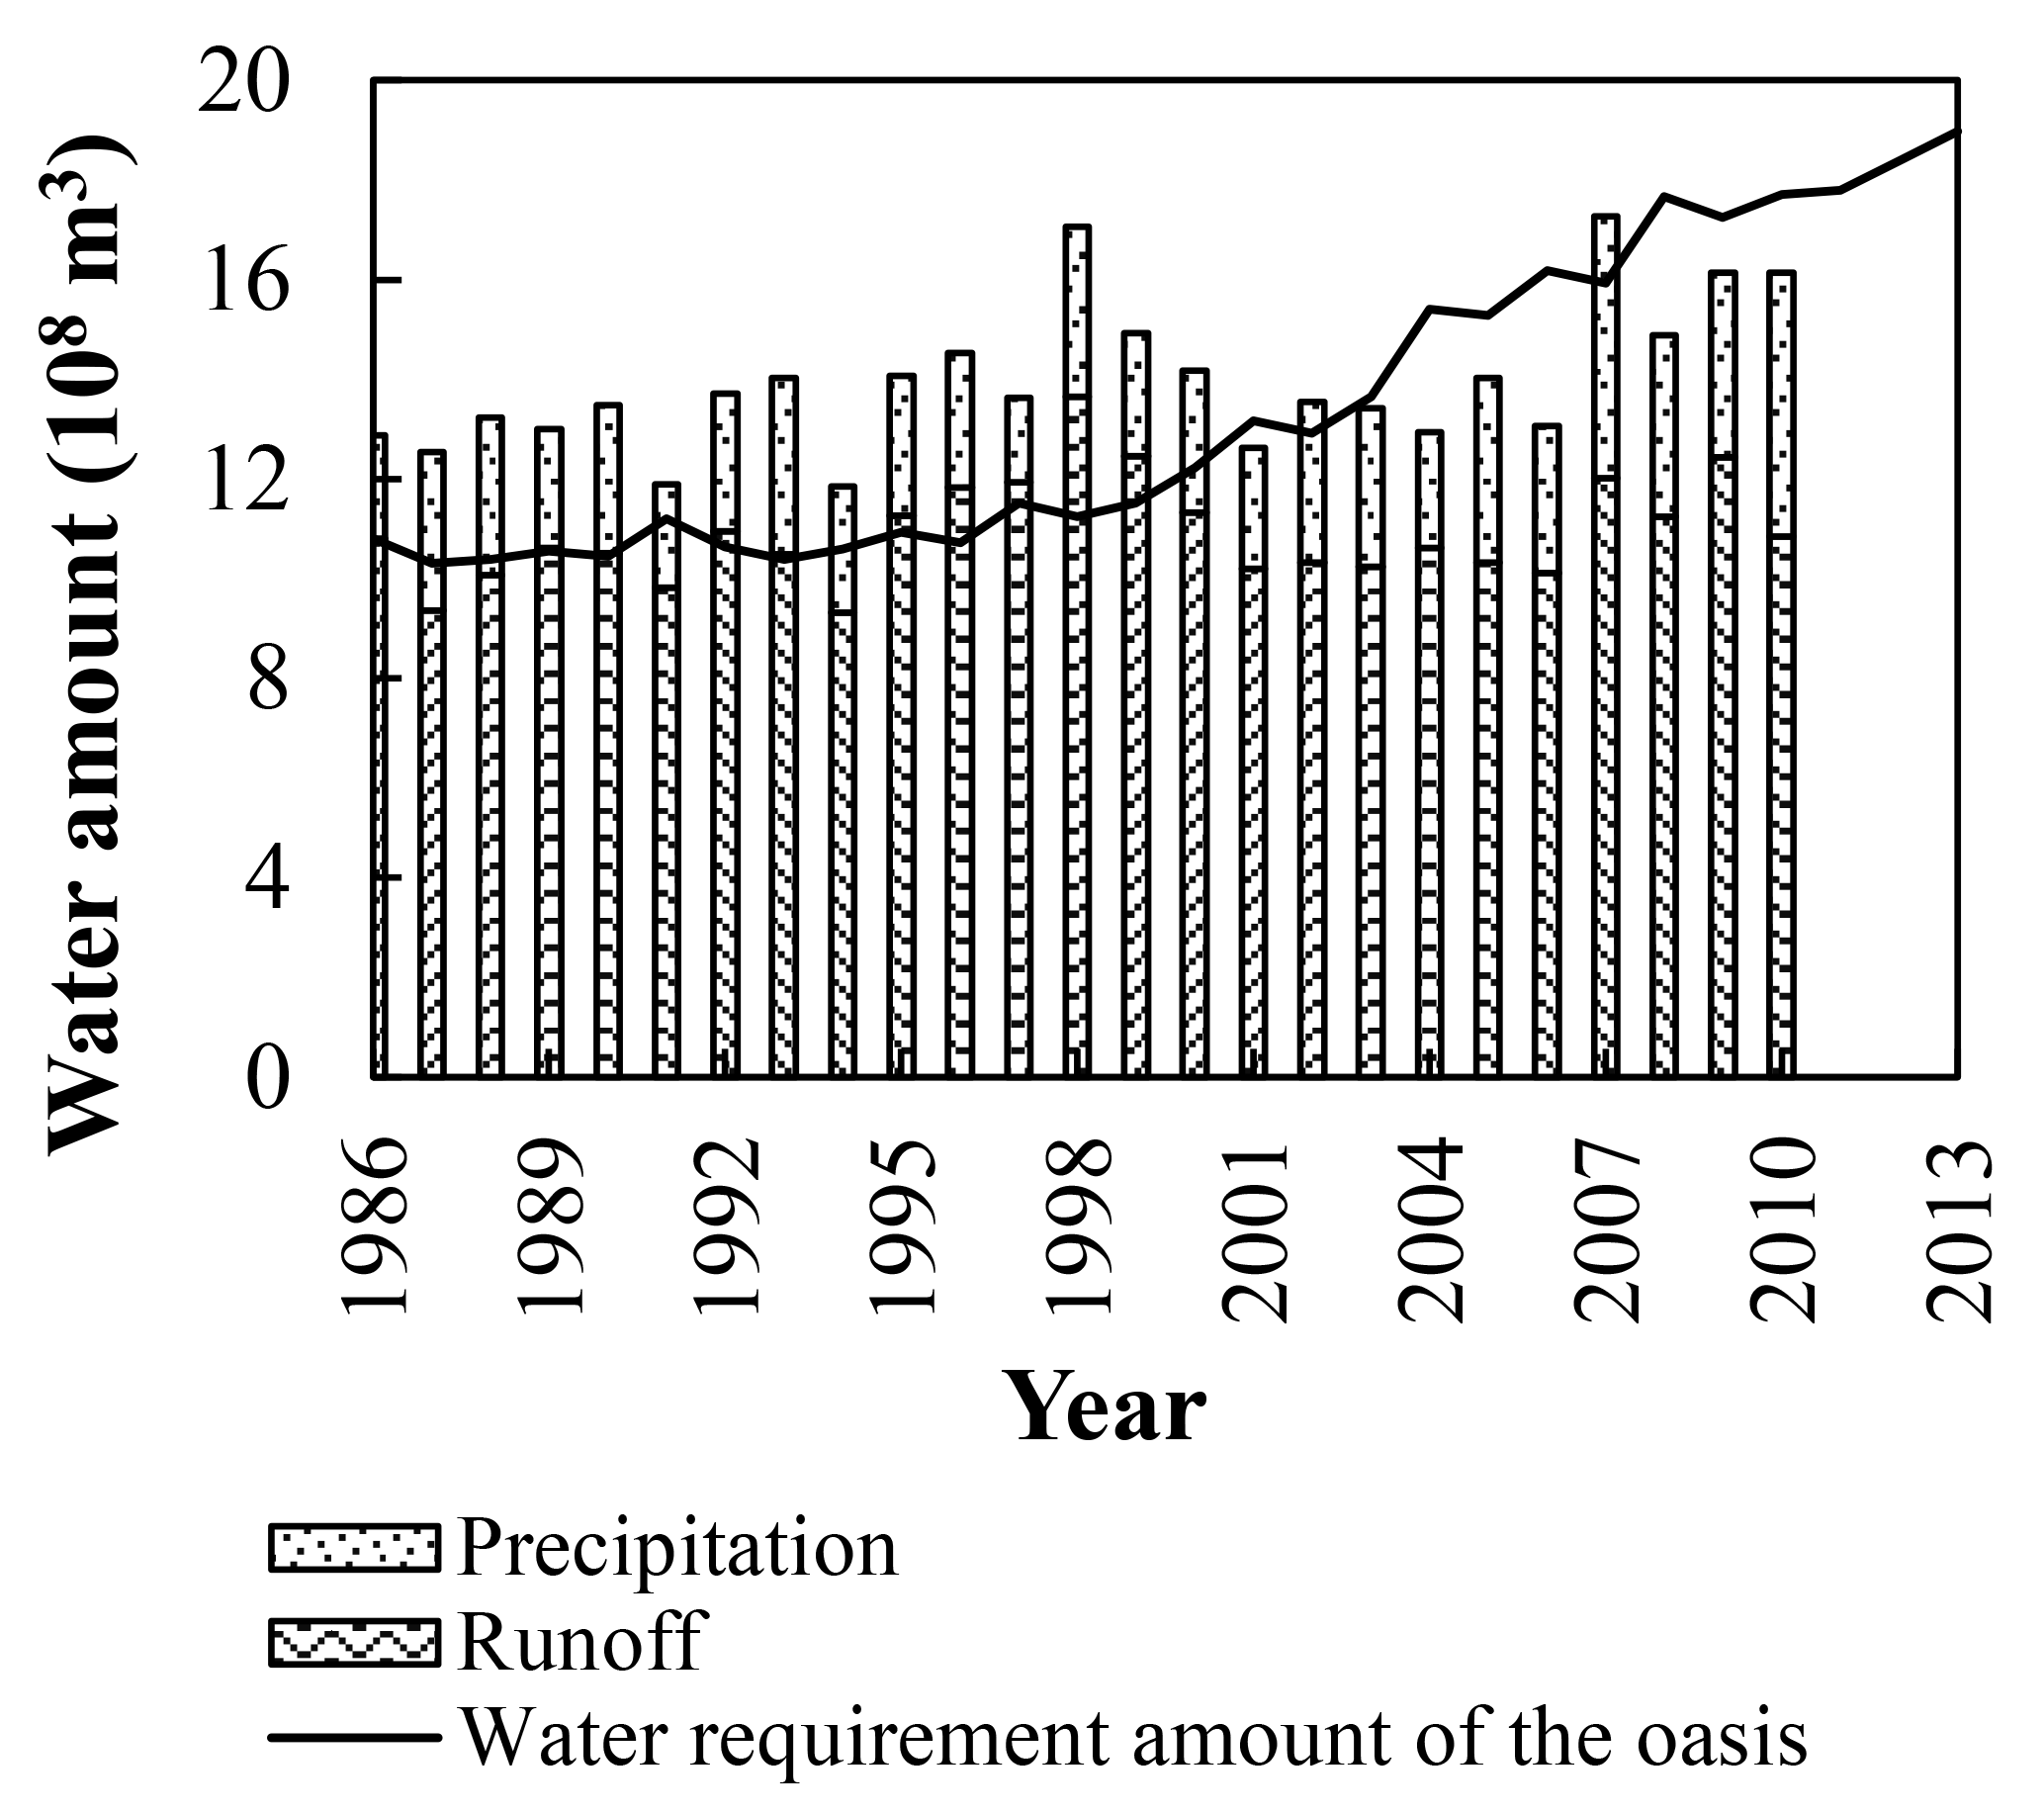
Figure 8The water requirement and the surface water supply including the precipitation and runoff data for the oasis in the middle Heihe River basin. The runoff data included the runoff from the mainstream of middle Heihe River, Shandan River, and Liyuan River.
Table 3Water balance items in the middle Heihe River basin during 1986–2013.
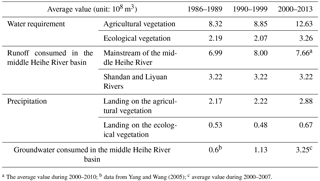
a The average value during 2000–2010; b data from Yang and Wang (2005); c average value during 2000–2007.
The vegetation in the oasis can be divided into two categories: one is agricultural vegetation, which includes the crops and orchard, and the other is the ecological vegetation. The precipitation in the middle Heihe River basin is too little to supply enough water for the ecological vegetation (Table 3). The ecological vegetation usually grows around the cultivated land, so they can absorb the water of infiltration. In addition, the shelter forest often needs irrigation, and the shrubs like Tamarix chinensis and Haloxylon ammodendron also need groundwater to maintain normal growth. Compared with the available water resources in 1980s, precipitation changed little in the 1990s. However, with the increase in water requirement in the 1990s, the runoff consumed in the middle Heihe River basin had an obvious rise and more groundwater was pumped for irrigation (Fig. 8; Table 3). Ignoring the industrial and domestic water taken from the middle Heihe River, the surface water supply seemed to be sufficient to the water requirement in the oasis in 1980s and 1990s. At the beginning of the 21st century, the area of arable land increased fast, and crops with high water demand (maize and vegetables) gradually replaced the crop requiring less water (wheat) since 2001 (Fig. 3). Therefore, the water requirement increased greatly in the 2000s. With the implementation of EWDP, the available surface water from middle Heihe River decreased in 2000s. Surface water could no longer meet the water requirements, causing more exploitation of groundwater (Table 3). The middle Heihe River basin has a severe water shortage of water resources. To reduce the contradiction of water supply and requirement, the land use including the crop structure in the middle Heihe River basin should be carefully planned.
3.4 Contributions to the water requirement trend
Both climate change and human agricultural activities can influence the water requirement of the oasis. In this study, the land expansion, which influences the total oasis area, and the land structure, which influences the area proportion of each land use type in the oasis, were considered for the human agricultural activities. Because the oasis is dominated by the cultivated land, both the contributions of the influencing factors to the changes in water requirement of the oasis and of the cultivated land were analyzed. For the cultivated land, the three influencing factors considered were climate change, the expansion of the cultivated land, and the crop structure in the cultivated land. The area of the oasis in 1986, 1995, 2000, and 2011 was 2048.96, 2091.13, 2216.97, and 2954.85 km2, respectively, which showed an obvious increase in the past ∼ 30 years. For the specific land use types, the area of cultivated land, waters, and swampland in 2011 showed an obvious increase, compared with the area in 1986. The area of the cultivated land was only 1614.32 km2 in 1986, but it increased to 2354.25 km2 in 2011. Besides the land expansion, the increased area of the land use types with high water requirements like the vegetables, maize, waters, and swampland also increased the water requirement of the oasis.
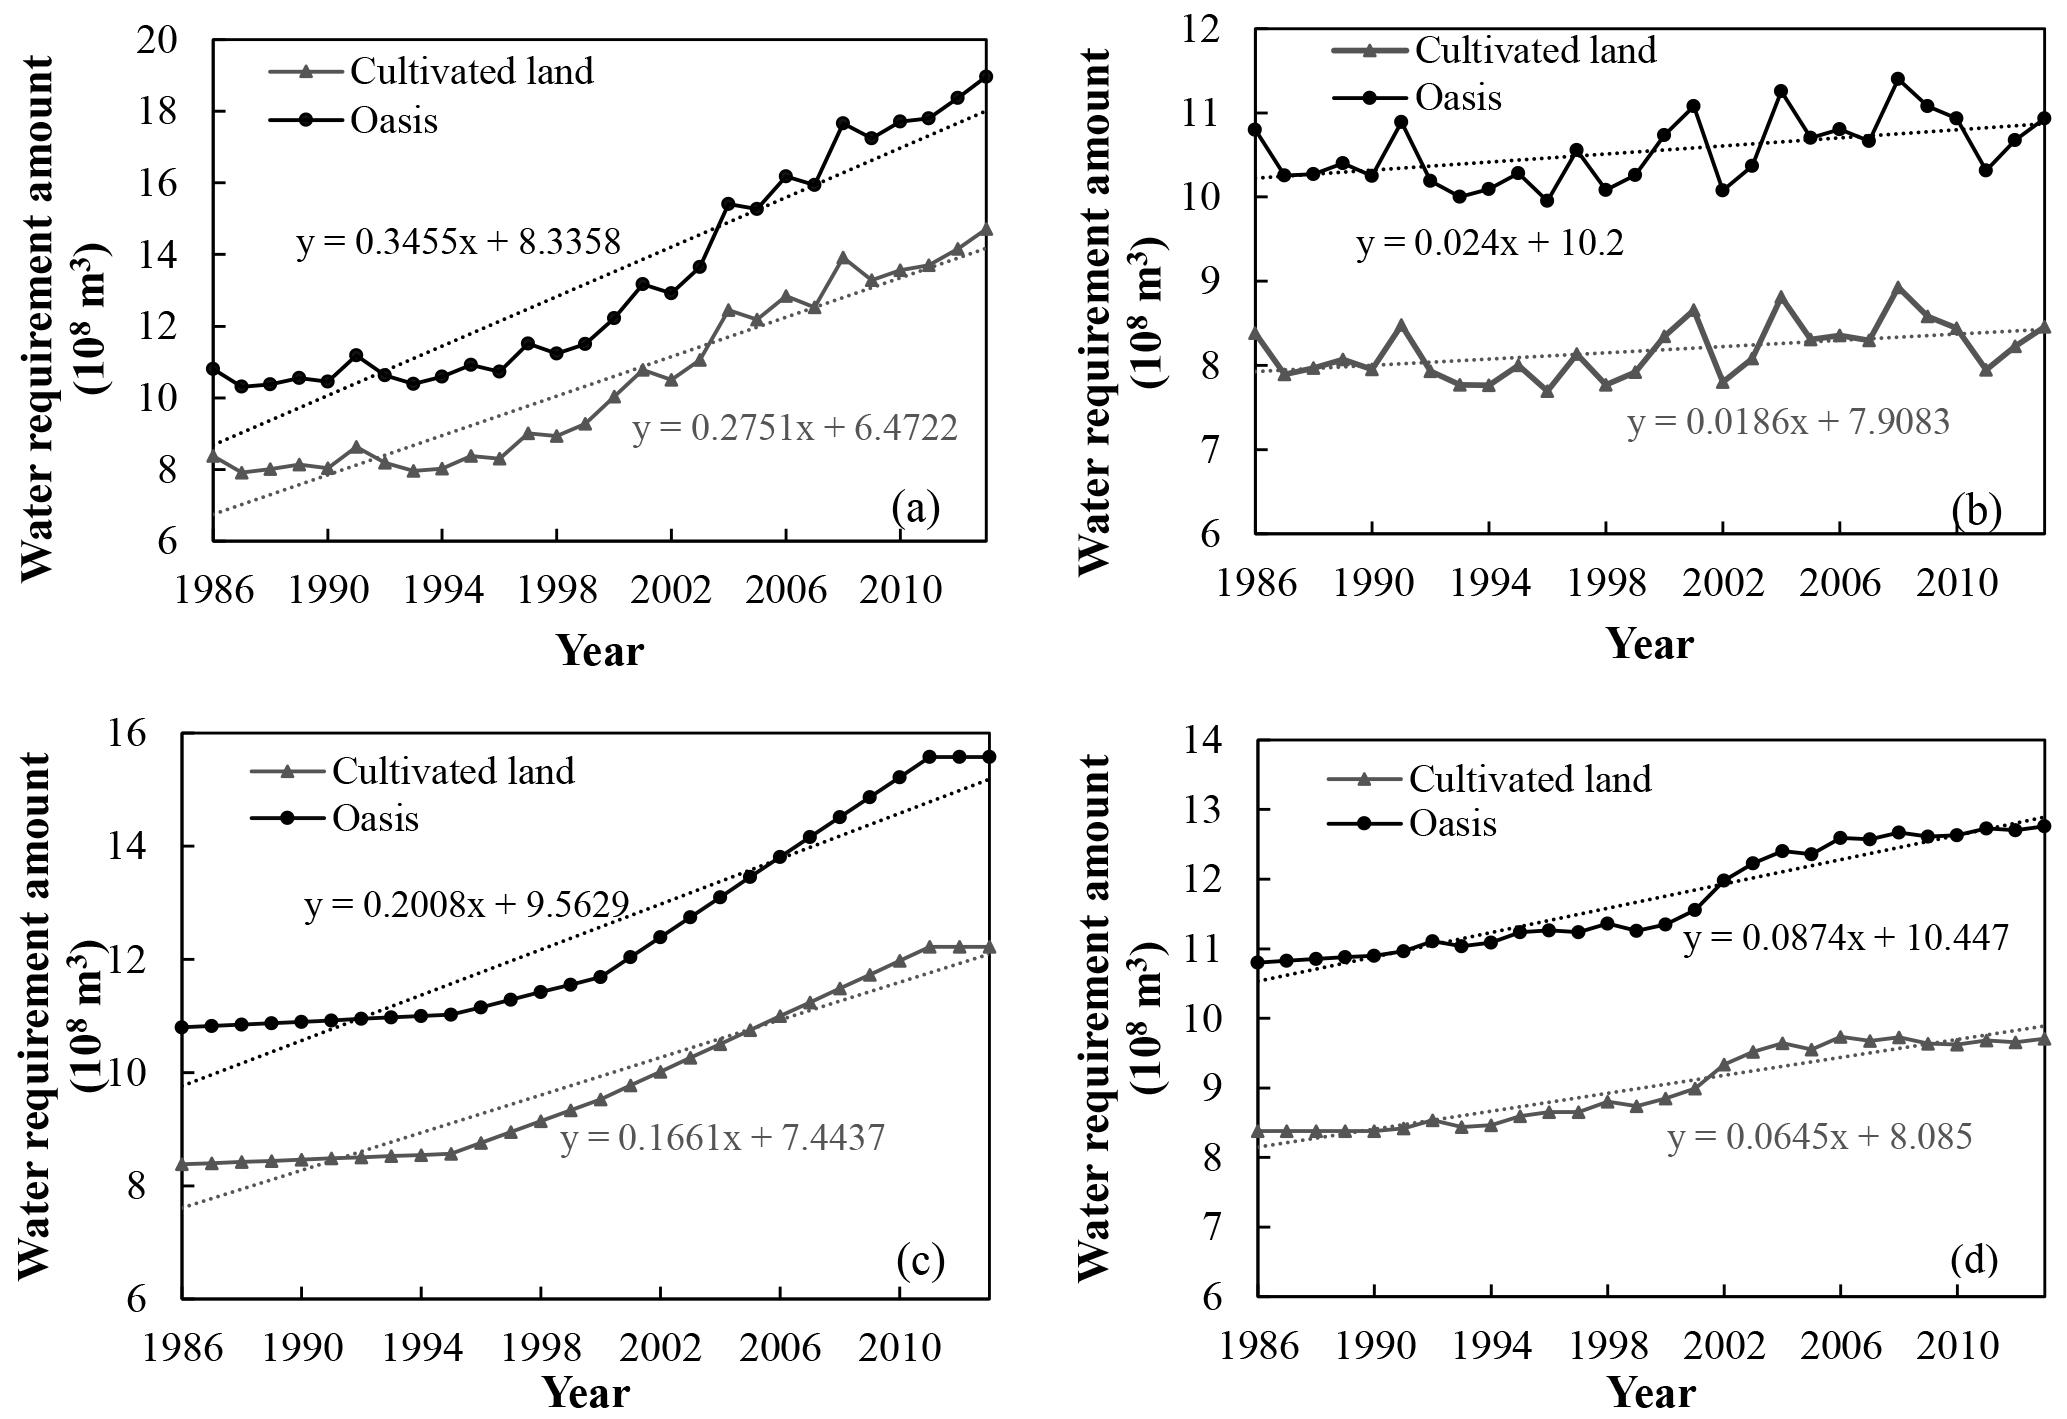
Figure 9The long-term trend of the water requirement for the cultivated land and oasis under different scenarios during 1986–2013. (a) Under a scenario of climate change and human agricultural activities; (b) under the scenario that only the climate was changing, but the total area of the oasis (cultivated land) and land structure were stable; (c) under the scenario that the total area of the oasis (cultivated land) was changing, but the climate and land structure were stable; and (d) under the scenario that the land structure was changing, but the climate and the total area of the oasis (cultivated land) were stable.
The water requirements of the oasis and cultivated land increased by 0.3455 × 10⁸ and 0.2751 × 10⁸ m3 per year during 1986–2013, respectively (Fig. 9a). Considering the impact of climate change on the water requirement, the land area and the land structure were set stable, and only the climate changed as usual during 1986–2013. In this scenario, the water requirement increased slowly at the rates of 0.0240 × 10⁸ and 0.0186 × 10⁸ m3 per year for the oasis and cultivated land, respectively (Fig. 9b), which revealed that climate change had a positive effect on the increase in water requirement. Based on Eq. (9), the contributions of the climate change to the increase in water requirement were 6.9 and 6.8 % for the oasis and cultivated land, respectively.
Considering the impact of land expansion on the water requirement, the climate and the land structure were set stable, and only the total land area changed with time during 1986–2013. In this scenario, the water requirement increased rapidly at the rates of 0.2008 × 10⁸ and 0.1661 × 10⁸ m3 per year for the oasis and cultivated land, respectively (Fig. 9c), which were nearly 9 times faster than the increasing speed caused by climate change. The contributions of land expansion to the increase in water requirement were 58.1 and 60.4 % for the oasis and cultivated land, respectively.
Considering the impact of land structure on the water requirement, the climate and total land area were set stable, and only the land structure changed as usual during 1986–2013. In this scenario, the water requirement increased at the rates of 0.0874 × 10⁸ and 0.0645 × 10⁸ m3 per year for the oasis and cultivated land, respectively (Fig. 9d), which were approximately 4 times faster than the increased speed caused by climate change. The contributions of the land structure to the water requirement changes were 25.3 and 23.4 % for the oasis and cultivated land, respectively.
The three influencing factors explained approximately 91 % of the increase in the water requirements of the oasis and cultivated land during 1986–2013. In the past ∼ 30 years, human agricultural activities including land expansion and changes in land structure constituted about 84 % of the increase in water requirement, and the climate change only constituted about 7 % of the increase. In addition, land expansion was the dominant factor contributing to the increase in water requirement of the oasis.
Based on the land use and meteorological data, the impact of climate change and human agricultural activities, including land expansion and changes in land structure, on the water requirements of the oasis and the cultivated land which is the main part of the oasis in the middle Heihe River basin were calculated and analyzed. The results suggest that both climate change and human agricultural activities can lead to an increase in water requirements, and the contribution of human agricultural activities to the increase was significantly greater than the climate change. In addition, the land expansion was the dominant factor contributing to the increase in water requirements.
Crop water requirement is the ET from disease-free, well-fertilized crops under optimum soil water conditions and achieving full production. There is no available observed crop water requirement to validate the results. Only actual ET data can be obtained. There are 18 field stations in the oasis that all located in Ganzhou district in the middle Heihe River basin for conducting meteorological observations and flux measurements from around June 2012. However, due to the incomplete daily data and short time series, we used the ET data sets provided by Cold and Arid Regions Science Data Center at Lanzhou (http://westdc.westgis.ac.cn) to validate the results. Compared with other research results, the mean annual water requirement of the main crop (maize), which was 571.5 mm in this study, basically agreed with the result by Liu et al. (2010). In addition, the mean annual water requirements of cultivated land and wheat, which were 544.6 and 413.7 mm, respectively, in this study, were consistent with the results by Liu et al. (2017).
Crop coefficient is an important parameter to estimate the water requirement, and it is related to many factors, such as the biological characters of crops, cultivation, and soil conditions, so the crop coefficients for different crop varieties of the same crop could be different. Some researchers (Nader et al., 2013; Mu et al., 2005) have studied the crop coefficients affected by different crop varieties, and found that there were differences in every growth stage between different varieties, and the differences were almost less than 0.3. However, it is difficult to get the crop coefficients for every specific crop variety because there are too many varieties. Additionally, the water requirement is not only related to the crop coefficient; it is also related to the crop growth period. Many factors influencing the crop coefficient also have an effect on the growth stages. Like the study by Nader et al. (2013), the water requirement variation was much smaller than the variation of crop coefficients for different varieties. Therefore, though we did not distinguish the crop coefficients among different varieties, the estimated water requirements in the study were still reliable.
There are many factors influencing the water requirement. This study only analyzed the major factors which influence it (climate change and human agricultural activities). Climate change (including factors for air temperature, wind speed, relative humidity, and sunshine duration) and human agricultural activities (including land expansion and changes in land structure) in all constitute about 91 % of the increase in water requirement of the oasis. Other influential factors, such as changes in location of different land types, are difficult to quantify and were not considered in the study. Additionally, some driving factors are not independent, and changes in one factor can cause changes in other factors, such as the climate change and changes in crop phenology. Thus, in the contribution analysis, when the climate was set stable, the crop phenology also kept stable, and when the climate changed, the crop phenology varied according to the statistical data.
As an oasis located in an ecologically vulnerable area and dominated by agriculture, the development of agriculture should match up with the climate and ecological capacity. The amount of water consumed in the oasis ecosystem concerns the ecological security of the whole basin. To promote harmonious development among the upper, middle, and lower reaches, the amount of water consumed in the agricultural oasis must be controlled and a series of water-saving measures should be carry on. Because the oasis area and the land structure are the main reason why the water requirement of the oasis increased so fast, additional efforts will be made to determine the appropriate oasis area and crop structure in the oasis.
Affected by the climate change and human agricultural activities, the water requirement of the oasis increased significantly during 1986–2013, from 10.8 × 10⁸ m3 in 1986 to 19.0 × 10⁸ m3 in 2013. Cultivated land is the main part of the oasis, the water requirement of which increased from 8.4 × 10⁸ m3 in 1986 to 14.7 × 10⁸ m3 in 2013. Contribution analysis identified the dominant factors influencing the water requirement as human activities, the contribution of which including the land expansion and changes in land structure to the increase in water requirement was about 84 %, and the climate change only contributed about 7 % to the increase. For the human activities, land expansion contributed most to the increase in water requirement, which contributed 58.1 and 60.4 % for the oasis and cultivated land, respectively. To reduce the water requirement and ensure sustainable development of oasis ecosystems in arid regions dominated by agriculture, it is necessary to further rationalize the scale of the oasis and cultivated land, and optimize the crop structure.
The meteorological data (CMA, 2017) and observations on crop growth and phenology (CMA, 2013) are available at
http://data.cma.cn/data/cdcdetail/dataCode/SURF_CLI_CHN_MUL_DAY_V3.0.html
and http://data.cma.cn/data/cdcdetail/dataCode/AGME_AB2_CHN_TEN.html respectively.
The land use data (Wang et al., 2011a, b, 2014; Liu et al.,2003), validation data (Jia et al., 2013; Wu et al., 2012;
Liu et al., 2011), runoff data (Heihe River Bureau, 2015),
and precipitation data (Yang et al., 2015) used in this study were
provided by the Environmental and Ecological Science Data Center for
West China, National Natural Science Foundation of China, available at
http://westdc.westgis.ac.cn/data/59a9ba33-9bb2-4d15-a3fc-590266f9c599;
http://westdc.westgis.ac.cn/data/afd70f9c-6ef9-473c-905c-83943c313235;
http://westdc.westgis.ac.cn/data/4225a0a6-972c-4c15-b6e9-5925e6c6a0d2;
http://westdc.westgis.ac.cn/data/515cdd0e-47c5-4696-bc22-28e603e6ea8e;
http://westdc.westgis.ac.cn/data/a3b5c9a4-1bd4-462f-a759-ae4bd392f84d;
http://westdc.westgis.ac.cn/data/33efefb7-398b-47ff-9913-f705ace42ee5;
http://westdc.westgis.ac.cn/data/645ffaba-b32e-41f7-9046-a868a2157c07;
http://westdc.westgis.ac.cn/data/c47c2bb5-d68f-499e-bd8a-0afa270981a4.
The authors declare that they have no conflict of interest.
This study was supported by the National Natural Science Foundation of China
(no. 91425302). We would like to extend our thanks to Yulu Zhang from Qinghai
Normal University, who helped process the wind speed data in three
meteorological stations.
Edited by: Zhenghui Xie
Reviewed by: two anonymous referees
Allen, R. G., Pereira, L. S., Raes, D., and Smith, M.: Crop evapotranspiration: Guidelines for computing crop requirements. Irrigation and Drainage Paper No. 56, FAO, Rome, Italy, 1998.
Aus der Beek, T., Voß, F., and Flörke, M.: Modelling the impact of Global Change on the hydrological system of the Aral Sea basin, Phys. Chem. Earth, 36, 684–695, 2011.
Bai, J., Chen, X., Li, L., Luo, G., Yu, and Q.: Quantifying the contributions of agricultural oasis expansion, management practices and climate change to net primary production and evapotranspiration in croplands in arid northwest China, J. Arid Environ., 100–101, 31–41, 2014.
Bates, B. C., Kundzewicz, Z. W., Wu, S., and Palutikof, J. P.: Climate Change and Water, IPCC Technical Paper VI, Intergovernmental Panel on Climate Change, 2008.
Chen, Y., Zhang, D., Sun, Y., Liu, X., Wang, N., and Savenije, H. H. G.: Water demand management: A case study of the Heihe River Basin in China, Phys. Chem. Earth, 30, 408–419, 2005.
CMA (China Meteorological Administration): Crop growth and soil moisture dataset in China, available at: http://data.cma.cn/data/cdcdetail/dataCode/AGME_AB2_CHN_TEN.html (last access: 27 December 2016), updated to 2013.
CMA (China Meteorological Administration): Surface daily meteorological dataset in China (v3.0), available at: http://data.cma.cn/data/cdcdetail/dataCode/SURF_CLI_CHN_MUL_DAY_V3.0.html (last access: 14 October 2016), updated to 2017.
Coe, M. T. and Foley, J. A.: Human and natural impacts on the water resources of the Lake Chad basin, J. Geophys. Res., 106, 3349–3356, 2001.
Cui, Y. and Jia, L.: A modified gash model for estimating rainfall interception loss of forest using remote sensing observations at regional Sscale, Water, 6, 993–1012, https://doi.org/10.3390/w6040993, 2014.
Dai, A., Lamb, P. J., Trenberth, K. E., Hulme, M., Jones, P. D., and Xie, P.: The recent sahel drought is real, Int. J. Climatol., 24, 1323–1331, 2004.
De Silva, C. S., Weatherhead, E. K., Knox, J. W., and Rodriguez-Diaz, J. A.: Predicting the impacts of climate change—A case study of paddy irrigation water requirements in Sri Lanka, Agr. Water Manage., 93, 19–29, 2007.
Döll, P.: Impact of climate change and variability on irrigation requirements: a global perspective, Climatic Change, 54, 269–293, 2002.
Dong, W., Cui, B., Liu, Z., and Zhang, K.: Relative effects of human activities and climate change on the river runoff in an arid basin in northwest china, Hydrol. Process., 28, 4854–4864, 2015.
Duan, A., Sun, J., Liu, Y., Xiao, J., Liu, Q., and Qi, X.: Irrigation quota of major crops for Northern China, China Agricultual Sci & Tech Press, Beijing, 197 pp., 2004 (in Chinese).
Ersi, K., Guodong, C., Yongchao, L., and Huijun, J.: A model for simulating the response of runoff from the mountainous watersheds of inland river basins in the arid area of northwest China to climatic changes, Sci. China Ser. D, 42, 52–63, 1999.
Fu, A., Chen, Y., and Li, W.: Impact of global warming on water requirement of main crops in oasis irrigated area in yanqi basin, Adv. Mat. Res., 955–959, 3079–3087, 2014.
Guo, F., Zhang, K., and Lv, Q.: Dictionary of Gansu, Gansu culture Press, 2000 (in Chinese).
Guo, H., Ling, H., Xu, H., and Guo, B.: Study of suitable oasis scales based on water resource availability in an arid region of China: a case study of Hotan River Basin, Environ. Earth Sci., 75, 984 pp., 2016.
Heihe River Bureau: Long time series of runoff data of Yingluo and Zhengyi Gorges in Heihe River basin, available at: http://westdc.westgis.ac.cn/data/645ffaba-b32e-41f7-9046-a868a2157c07 (last access: 12 December, 2016), 2015.
Hu, G. and Jia, L.: Monitoring of evapotranspiration in a semi-arid inland river basin by combining microwave and optical remote sensing observations, Remote Sens., 7, 3056–3087, 2015.
Huo, Z., Feng, S., Kang, S., Li, W., and Chen, S.: Effect of climate changes and water-related human activities on annual stream flows of the shiyang river basin in arid north-west china. Hydrol. Process., 22, 3155–3167, 2008.
Jarsjö, J., Asokan, S. M., Shibuo, Y., and Destouni, G.: Water scarcity in the aral sea drainage basin: contributions of agricultural irrigation and a changing climate, NATO Security through Science Series C: Environmental Security, 99–108, 2008.
Ji, X., Kang, E., Chen, R., Zhao, W., Xiao, S., and Jin, B.: Analysis of water resources supply and demand and security of water resources development in irrigation regions of the middle reaches of the Heihe river basin, Northwest China, Agr. Sci. China, 5, 130–140, 2006.
Jia, L., Shang, H., Hu, G., and Menenti, M.: Phenological response of vegetation to upstream river flow in the Heihe Rive basin by time series analysis of MODIS data, Hydrol. Earth Syst. Sci., 15, 1047–1064, https://doi.org/10.5194/hess-15-1047-2011, 2011.
Jia, L., Hu, G., and Cui, Y.: The evapotranspiration data from 2009 to 2011 in the Heihe River Basin, Heihe Plan Science Data Center, https://doi.org/10.3972/heihe.114.2013.db, 2013.
Kang, E., Cheng, G., Lan, Y., and Jin, H.: A model for simulating the response of runoff from the mountainous watersheds of inland river basins in the arid area of northwest China to climatic changes, Sci. China Ser. D, 42, 52–63, 1999.
Kang, E., Cheng, G., Song, K., Jin, B., Liu, X., and Wang, J.: Simulation of energy and water balance in Soil-Vegetation- Atmosphere Transfer system in the mountain area of Heihe River Basin at Hexi Corridor of northwest China, Sci. China Ser. D, 48, 538–548, 2005.
Karimov, B. and Matthies, M.: Impact of salinisation of surface waters caused by irrigation and diversion of drainage waters on fisheries in Amudarya and Syrdarya Rivers basins, Central Asia, SEFS 8 Symposium fir European Freshwater Sciences, 2013.
Kawy, W. A. A. and Darwish, K. M.: Assessment of optimum land use and water requirements for agricultural purpose in some soils South Paris Oasis, Western Desert, Egypt, Arab. J. Geosci., 7, 4043–4058, 2013.
Kawy, W. A. A. and El-Magd, I. H. A.: Assessing crop water requirements on the bases of land suitability of the soils South El Farafra Oasis, Western Desert, Egypt, Arab. J. Geosci., 6, 2313–2328, 2012.
Li, J., Yang, X., Cao, S., Ma, Z., Xiao, J., Chen, F., Li, Y., Qiu, J., Pang, H., and Ren, T.: Water requirement and crop coefficient of different planting patterns in Zhangye area of Gansu Province, Acta Agriculturae Jiangxi, 21, 17–20, 2009 (in Chinese).
Li, J., Zhu, T., Mao, X., and Adeloye, A. J.: Modeling crop water consumption and water productivity in the middle reaches of Heihe River Basin, Comput. Electron. Agr., 123, 242–255, 2016.
Li, X., Cheng, G., Tian, W., Zhang, Y., Zhou, J., Pan, X., Ge, Y., and Hu, X.: Hydrological cycle in the Heihe River Basin and its implication for water resource management in inland river basins (Invited), AGU Fall Meeting Abstracts, 2013.
Liu, B., Zhao, W., Chang, X., Li, S., Zhang, Z., and Du, M.: Water requirements and stability of oasis ecosystem in arid region, China, Environ. Earth Sci., 59, 1235–1244, 2010.
Liu, J.: Study on the vegetation ecological water requirement in the Heihe River Basin based on 3S technology, North West Agriculture and Forestry University, 2014 (in Chinese).
Liu, J., Liu, M., Zhuang, D., Zhang, Z., and Deng, X.: Study on spatial pattern of land-use change in China during 1995–2000, Science in China (Series D), 46, 373–384, 2003.
Liu, S., Xiong, J., and Wu, B.: ETWatch: a method of multi-resolution ET data fusion, J. Remote Sens., 15, 255–269, 2011.
Liu, Y., Song, W., and Deng, X.: Spatiotemporal patterns of crop irrigation water requirements in the heihe river basin, china, Water, 9, 616, https://doi.org/10.3390/w9080616, 2017.
Ma, L., Wu, J., Liu, W., and Abuduwaili, J.: Distinguishing between anthropogenic and climatic impacts on lake size: a modeling approach using data from ebinur lake in arid northwest china, J. Limnol., 73, 148–155, 2014.
Micklin, P. P.: Desiccation of the aral sea: a water management disaster in the soviet union, Science, 241, 1170–1176, 1988.
Mu, C., Ma, F., Zheng, Z., Li, F., and Cheng, H.: Simulation of evapotranspiration under the condition of drip irrigation with plastic film mulching in cotton field, Transactions of the Chinese Society of Agricultural Engineering, 21, 25–29, 2005 (in Chinese).
Nader, P., Fatemeh, Z., Mojtaba, R., and Vaheedeh, A.: Derivation of crop coefficients of three rice varieties based on ET0 estimation method in Rasht region, Cereal Research, 3, 95–106, 2013.
Narisma, G. T., Foley, J. A., Licker, R., and Ramankutty, N.: Abrupt changes in rainfall during the twentieth century, Geophys. Res. Lett., 34, L06710, https://doi.org/10.1029/2006GL028628, 2007.
Nkomozepi, T. and Chung, S. O.: Assessing the trends and uncertainty of maize net irrigation water requirement estimated from climate change projections for Zimbabwe, Agr. Water Manage., 111, 60–67, 2012.
Pu, J., Deng, Z., Yao, X., Wang, W., Li, Q., and Zhang, H.: An analysis of ecoclimatic factors on linseed and normal region demarcation for linseed in Gansu, Chinese journal of oil crop sciences, 26, 37–42, 2004 (in Chinese).
Shahid, S.: Impact of climate change on irrigation water demand of dry season Boro rice in northwest Bangladesh, Climatic Change, 105, 433–453, 2010.
Shen, Y. and Chen, Y.: Global perspective on hydrology, water balance, and water resources management in arid basins, Hydrol. Process., 24, 129–135, 2010.
Shuttleworth, W. J.: Evaporation, in: Handbook of hydrology, edited by: Maidment, D. R., McGraw-Hill, New York, USA, 4.1–4.53, 1993.
Siebert, S., Nagieb, M., and Buerkert, A.: Climate and irrigation water use of a mountain oasis in northern Oman, Agr. Water Manage., 89, 1–14, 2007.
Song, Y., Fan, Z., Lei, Z., and Zhang, F.: The water resources and ecological problems in the Tarim River, China, Urumqi: Xinjiang people's press, 2000 (in Chinese).
Sorg, A., Mosello, B., Shalpykova, G., Allan, A., Hill Clarvis, M., and Stoffel, M.: Coping with changing water resources: The case of the Syr Darya river basin in Central Asia, Environ. Sci. Policy, 43, 68–77, 2014.
Wang, G. and Cheng, G.: Water resource development and its influence on the environment in arid areas of China–the case of the Hei River basin, J. Arid Environ., 43, 121–131, 1999.
Wang, G. and Cheng, G.: Water demand of the eco-system and estimate method in arid inland river basins, Journal of Desert Research, 24, 129–134, 2002 (in Chinese).
Wang, J., Gai, C., Zhao, J., and Hu, X.: Land use/land coverage dataset in middle Heihe River Basin in 2011, Data Management Center of the Heihe River Project, https://doi.org/10.3972/heihe.100.2014.db, 2014.
Wang, Y. and Qin, D.: Influence of climate change and human activity on water resources in arid region of Northwest China: An overview, Advances in Climate Change Research, 8, 268–278, 2017.
Wang, Y., Roderick, M. L., Shen, Y., and Sun, F.: Attribution of satellite-observed vegetation trends in a hyper-arid region of the Heihe River basin, Western China, Hydrol. Earth Syst. Sci., 18, 3499–3509, https://doi.org/10.5194/hess-18-3499-2014, 2014.
Wang, Y., Yan, C., and Wang, J.: Land use data in Heihe River Basin, Cold and Arid Regions Environmental and Engineering Research Institute, Chinese Academy of Sciences, https://doi.org/10.3972/heihe.021.2013.db, 2011a.
Wang, Y., Yan, C., and Wang, J.: Land use data in Heihe River Basin in 2000, Cold and Arid Regions Environmental and Engineering Research Institute, Chinese Academy of Sciences, https://doi.org/10.3972/heihe.020.2013.db, 2011b.
Wu, B. F., Xiong, J., and Yan, N. N.: ETWatch: An Operational ET Monitoring System with Remote Sensing, ISPRS III Workshop, 2008.
Wu, B., Yan, N., Xiong, J., Bastiaanssen, W. G. M., Zhu, W., and Stein, A.: Validation of ETWatch using field measurements at diverse landscapes: A case study in Hai Basin of China, J. Hydrol., 436–437, 67–80, 2012.
Wu, B., Zheng, Y., Tian, Y., Wu, X., Yao, Y., Han, F., Liu, J., and Zheng, C.: Systematic assessment of the uncertainty in integrated surface water-groundwater modeling based on the probabilistic collocation method, Water Resour. Res., 50, 5848–5865, https://doi.org/10.1002/2014WR015366, 2014.
Wu, T. and Miao, J.: Small hydropower development and construction analysis in the rural of Linze county, Gansu Agriculture, 23, 61–64, 2015 (in Chinese).
Xing, Z.: Annexation and reorganization, integration and getting listed – Some thoughts on the reform of seed enterprises in zhangye city, China Seed Industry, 52–54, 2013 (in Chinese).
Xiong, J., Wu, B., Yan, N., Zeng, Y., and Liu, S.: Estimation and validation of land surface evaporation using remote sensing and meteorological data in North China, IEEE J. Sel. Top. Appl., 3, 337–344, 2010.
Yang, D., Wang, Y., Gao, B., and Qin, Y.: Spatial interpolation of gauge precipitation using Regional Climate Model simulation in the Heihe basin (1960–2014), Cold and Arid Regions Science Data Center at Lanzhou, https://doi.org/10.3972/heihe.127.2014.db, 2015.
Yang, L. and Wang, G.: Variations of groundwater in Zhangye Basin of the middle reaches of the Heihe River in recent two decades, Journal of Glaciology and Geocryology, 27, 290–296, 2005 (in Chinese).
Ye, Z., Chen, Y., and Li, W.: Ecological water demand of natural vegetation in the lower Tarim River, J. Geogr. Sci., 20, 261–272, 2010.
Zhang, K., Song, L., Han, Y., Si, J., and Wang, R.: Analysis on supply and demand of water resources and related countermeasures in the middle reaches of Heihe River, Journal of Desert Research, 26, 842–848, 2006 (in Chinese).
Zhao, C., Nan, Z., and Cheng, G.: Methods for estimating irrigation needs of spring wheat in the middle Heihe basin, China, Agr. Water Manage., 75, 54–70, 2005.
Zhao, W., Chang, X., He, Z., and Zhang, Z.: Study on vegetation ecological water requirement in Ejina Oasis, Sci. China Ser. D, 50, 121–129, 2007.
Zhao, W., Liu, B., and Zhang, Z.: Water requirements of maize in the middle Heihe River basin, China, Agr. Water Manage., 97, 215–223, 2010.
Zhao, Y., Wei, Y., Li, S., and Wu, B.: Downstream ecosystem responses to middle reach regulation of river discharge in the Heihe River Basin, China, Hydrol. Earth Syst. Sci., 20, 4469–4481, https://doi.org/10.5194/hess-20-4469-2016, 2016.
Zheng, Y.: The simulation result of the key hydrological variables of the Zhangye Basin in Heihe River Basin, Heihe Plan Science Data Center, https://doi.org/10.3972/heihe.070.2014.db, 2014.
Zhou, L., Gao, Y., Gao, Y., and Cheng, Q.: Calculation and analysis of reed transpiration climatology based on reed growth period, Journal of Shenyang Agricultural University, 46, 204–212, 2015 (in Chinese).
Zou, M., Niu, J., Kang, S., Li, X., and Lu, H.: The contribution of human agricultural activities to increasing evapotranspiration is significantly greater than climate change effect over heihe agricultural region, Scientific Reports, 7, 8805, https://doi.org/10.1038/s41598-017-08952-5, 2017.