the Creative Commons Attribution 4.0 License.
the Creative Commons Attribution 4.0 License.
 | 16 Jun 2026
Comparing the seasonal predictability of the Tropical Pacific variability in EC-Earth3 at two horizontal resolutions
Pablo Ortega
Roberto Bilbao
Carlos Delgado-Torres
Vladimir Lapin
Ferran Lopez-Marti
Markus Donat
Francisco Doblas-Reyes
Seasonal predictability is an active field of research given its strong potential to guide decision-making in many societal and economic sectors. In this study, we compare the predictive skill of the climate model EC-Earth3 at two different horizontal resolutions. The standard resolution – SR – (high resolution – HR) is of around 70 (40) km in the atmosphere and 100 (25) km in the ocean. Both forecast systems are initialised in the same way in May and cover the period 1990–2015, with a forecast period of 8 months. We focus on the Tropical Pacific, and particularly on El Niño Southern Oscillation (ENSO), the main source of predictability at seasonal timescales. Small but statistically significant improvements are found in HR with respect to SR for predicting ENSO, skill improvements that cannot be generalized to all regions and initialization times. In the May initialised predictions, skill drops quickly in the Western Equatorial Pacific (WEP) in both configurations, more pronouncedly in SR. The poor skill in the WEP is directly linked to a misrepresentation of its relationship with the ENSO region, which is ultimately associated with an overly strong westward extension of ENSO-related variability, a model error more pronounced in SR. This erroneous spatial simulation of ENSO is related to the mean cold bias of the cold tongue, which progressively extends westwards with the forecast time. An overly weak air-sea coupling, more pronounced in SR, prevents the model from simulating the correct ENSO development. We also show that a more realistic simulation of the Atlantic Niño teleconnection with the tropical Pacific in HR compared to SR leads to better ENSO prediction. Increasing model resolution can improve the predictive skill of forecast systems in certain regions and for certain seasons by improving the simulation of the mean state and atmospheric teleconnections. However, ENSO simulation errors and mean state biases need to be better understood to improve forecasts, in particular in the WEP, a region of convection particularly important for teleconnections to extratropics.
- Article
(13530 KB) - Full-text XML
-
Supplement
(1539 KB) - BibTeX
- EndNote


Seasonal prediction is an area of research attracting growing interest beyond the scientific community due to its strong potential for informing stakeholders on timescales ranging from months to seasons in many sectors e.g. agriculture and food security, health, energy production, water management, disaster risk reduction (e.g. Merryfield et al., 2020; Hermanson et al., 2022). The usability of these predictions rely on their accuracy and skill. Seasonal predictability can arise from two major sources. The first is related to the representation of the externally forced signals (such as from volcanic eruptions, solar activity or anthropogenic greenhouse gases), which have caused important climate trends in recent decades and will shape the near-term future. The second is internal variability, usually associated with oceanic, sea ice and land processes operating from monthly to multi-decadal timescales (Mariotti et al., 2018, Fig. 2). The premise of seasonal prediction is that such internal variability processes, when adequately modelled and initialized, can improve our predictive capacity by shaping the atmospheric evolution (Doblas-Reyes et al., 2013; Merryfield et al., 2020). However, seasonal prediction is still a challenging field, both in terms of meeting users' needs for reliable and accurate forecasts (Merryfield et al., 2020; Bojovic et al., 2022) and in terms of better understanding the sources of predictability in order to improve model forecasts, particularly dynamical forecasts based on General Circulation Models (GCMs) whose components are becoming increasingly complex (Merryfield et al., 2020; Meehl et al., 2021).
Seasonal predictions derive most of their predictive skill from the tropical regions, especially from El Niño Southern Oscillation (ENSO) dynamics (e.g. Weisheimer et al., 2009; Tang et al., 2018; L'Heureux et al., 2020). ENSO has significant weather impacts worldwide mediated via different atmospheric teleconnections (Lenssen et al., 2020) that could lead to economic impacts and sovereign risks (Callahan and Mankin, 2023; Damette et al., 2024). Significant progress has been made in ENSO prediction over the last decades, with current dynamical prediction systems providing skilful predictions of ENSO events up to 6–12 months ahead (Barnston et al., 2019; Johnson et al., 2019; L'Heureux et al., 2020; Sharmila et al., 2023). However, ENSO predictive skill shows important variations depending on the initial ENSO state of the prediction (Sharmila et al., 2023; Lenssen et al., 2024), on the targeted event (DiNezio et al., 2017; Ren et al., 2019), on the initialisation month due to the ENSO “spring predictability barrier” (Kumar et al., 2017; Sharmila et al., 2023), and on the phase of the equatorial Atlantic variability (Exarchou et al., 2021), among other factors. Also, ENSO skill is modulated by decadal variability (Barnston et al., 2012; Weisheimer et al., 2022; Lou et al., 2023). The ENSO phase in turn has an impact on the predictability of near-surface temperature and precipitation over remote regions like Europe and Africa, including for monsoon systems, multiple seasons to years in advance (Dunstone et al., 2020; Liu et al., 2023c).
Dynamical seasonal forecasts, based on GCMs, are affected by model and initialisation errors, which can limit their applicability. Appropriate simulation of the observed mean state is essential to correctly represent the inter-annual variability (Ham and Kug, 2012, 2015) that affects the skill of forecast systems (Ding et al., 2020; Counillon et al., 2021; Wu et al., 2022; Beverley et al., 2023). In GCMs, the ENSO mean state is affected by two common biases: (1) a basin-wide cold bias and (2) a too westward extension of the cold tongue region in the tropical Pacific compared to observations, the so-called “cold tongue bias” (Bellenger et al., 2014; Guilyardi et al., 2020). These common mean state biases are reflected in the misrepresentation of the spatial structure of El Niño events, typically characterized by positive SST anomalies that extend too far into the west and whose amplitudes are underestimated compared to observations in the cold tongue region (Vannière et al., 2013; Planton et al., 2021; Jiang et al., 2021). Furthermore, these two biases are intertwined, with the magnitude of the cold bias favouring a more westward extension of the cold tongue via oceanic zonal advection feedbacks via oceanic zonal advection feedbacks (Jiang et al., 2021). Dynamical seasonal forecasts are also hindered by these GCMs errors in the tropical Pacific (Vannière et al., 2013; Newman and Sardeshmukh, 2017; Siongco et al., 2020; Beverley et al., 2023), which alter the pattern and amplitude of ENSO events (Wu et al., 2022), but also their transition (Wu et al., 2021; Beverley et al., 2023), and the associated wintertime atmospheric teleconnections (Wu et al., 2022). Using 11 different operational seasonal forecast systems, Beverley et al. (2023) showed that these ENSO-related forecast errors develop in a few days after initialisation and are mainly driven by the seasonal cycle rather than the forecast lead time. Wu et al. (2022) argued that the strong cold bias in the cold tongue region simulated in the CESM1 seasonal forecast system emerged as a consequence of an initialisation adjustment, which produced an imbalance between the ocean subsurface and the model dynamics.
Among the various approaches being considered to improve the skill of dynamical seasonal prediction systems, increasing the horizontal resolution of the climate models they are based on is a promising avenue. Enhancing the resolution can help to explicitly represent fundamental processes, such as ocean mesoscale eddies, that are parametrized at the standard model configurations that use grid spacings of around 100 km. The better simulation of the ocean mesoscale eddies, which in the Tropics requires grid spacings in the ocean of 25 km or finer, can improve the representation of key air-sea teleconnection mechanisms (Mahajan et al., 2018, 2022), leading to reduced common mean-state biases of global models. Current high resolution modelling efforts are particularly focused on understanding the role of these oceanic mesoscale processes in the simulated climate mean state and variability (Hewitt et al., 2020; Chang et al., 2020; Moreno-Chamarro et al., 2022; Yeager et al., 2023; Patrizio et al., 2023; Moon et al., 2024). Regarding the tropical Pacific region, several recent studies using high (∼25 km in the ocean) to very-high (∼10 km in the ocean) resolution climate models showed an improved tropical Pacific mean state with a reduced cold tongue bias (Haarsma et al., 2020; Wengel et al., 2021; Liu et al., 2023a; Yeager et al., 2023; Williams et al., 2024). Focusing specifically on ENSO, Liu et al. (2022) showed that higher ocean horizontal resolution configurations in a multi-model ensemble had a reduced bias in the equatorial Pacific mean state which led to a better simulation of the spatial patterns of ENSO-related anomalies. However, increasing the atmospheric horizontal resolution alone was found to deteriorate ENSO asymmetry. From the reduction of mean-state biases with higher resolution, we can expect improved skill in predicting certain regions at seasonal scales, e.g. in tropical sea surface temperature (Prodhomme et al., 2016). Johnson et al. (2019) analysed the performance of the new European Centre of Medium-Range Weather Forecasts (ECMWF) operational seasonal forecast system, SEAS5, which in addition to upgraded versions of the atmospheric and oceanic components, also featured a finer resolution compared to the previous version SEAS4 (100 vs. 25 km in the ocean, 80 vs. 36 km in the atmosphere). They showed an improvement in the cold tongue bias in SEAS5 that led to better air and sea surface temperature predictive skill over the Tropics, although given the various upgrades between systems, it is not possible to know whether the better performance arises solely from the increase in resolution.
In this study, we explore the sensitivity of the forecasts to horizontal resolution, both in terms of skill and forecast biases, using two different seasonal prediction systems based on the climate model EC-Earth3 (Döscher et al., 2022). We use a Standard Resolution (SR) configuration based on an eddy-parametrised ocean, and a High Resolution (HR) version based on an eddy-permitting ocean, their atmospheric configurations being set up to match the respective ocean resolutions as closely as possible. Both systems are initialized following exactly the same strategy, so that forecast differences can be directly attributed to the change in resolution, which involves both changes to the grid spacing and parametrization choices. Differences between systems can be attributed to the change in process parametrization adapted for each resolution, to the tuning of the model and to the initial conditions. We focus on the Tropical Pacific region where prominent improvements are found for predicting ENSO in the HR version, trying to shed light on the reasons behind the improvements. The paper is structured as follows: Sect. 2 describes the seasonal forecast systems, the observational data used as references and the methods. In Sect. 3, we assess the prediction skill differences between the SR and HR forecast systems in the tropical Pacific and investigate two different physical mechanisms that can explain the skill differences. The main conclusions of the study and a discussion of the results are provided in Sect. 4.
2.1 EC-Earth3 climate model
We use the EC-Earth v3.3 GCM (Döscher et al., 2022) in its atmosphere-ocean-sea ice configuration. Two resolutions are considered: a SR configuration, with a mean resolution of around 70 and 100 km in the atmosphere and the ocean, respectively, and a HR configuration, with a resolution of around 40 and 25 km in the atmosphere and the ocean, respectively. The EC-Earth3.3 model includes three major components: the atmospheric model Integrated Forecasting System (IFS) cy36r4 (https://confluence.ecmwf.int/display/FCST/Implementation+of+IFS+Cycle+36r4, last access: 8 June 2026) with the associated land surface module called Hydrology Tiled ECMWF Scheme for Surface Exchanges over Land (HTESSEL) (Balsamo et al., 2009), the Nucleus for European Modelling of the Ocean (NEMO) ocean model in its version 3.6 (Madec et al., 2017) and the OASIS3-MCT module (Craig et al., 2017) that couples the main components. IFS is an operational global meteorological forecasting model developed and maintained by ECMWF. The dynamical core of IFS is hydrostatic, two-time-level, semi-implicit, semi-Lagrangian and applies spectral transformations between grid-point space and spectral space. Vertically, the model is discretized using a finite-element scheme. NEMO is a state-of-the-art modelling framework for the ocean, based on the Navier–Stokes equations, used for oceanographic research, operational oceanography, seasonal forecasting and climate research studies. The NEMO version used in EC-Earth3.3 is known as “v3.6 stable”. NEMO is composed by Océan PArallélisé (OPA), for the ocean dynamics and thermodynamics, a primitive equation model adapted to regional and global ocean circulation problems down to kilometric scale, and by Louvain-la-Neuve sea Ice Model (LIM) in its version 3 for the sea-ice dynamics and thermodynamics (Vancoppenolle et al., 2009; Rousset et al., 2015). EC-Earth3-SR uses T255L91, a spectral Gaussian grid, in the atmosphere, and ORCA1L75, a tripolar ocean grid, in the ocean. EC-Earth3-HR uses T511L91 in the atmosphere and ORCA025L75 in the ocean. ORCA1L75 has a latitudinal refinement of the grid in the tropics to ∼40 km. In comparison, the latitudinal spacing of ORCA025L75 is about 27 km in the tropics. Both ocean configurations have 75 vertical levels with thickness increasing from 1 m below surface up to 500 m in the deep ocean and uses a partial step z coordinate.
Previous studies showed the importance of using a correctly tuned climate model for prediction (Prodhomme et al., 2016). For the EC-Earth3-SR, we use the Climate Model Intercomparison Project 6 (CMIP6; Eyring et al., 2016) version which has been intensively tuned by the EC-Earth consortium prior to the production of simulations for CMIP6 (Döscher et al., 2022). EC-Earth3-HR (Karami et al., 2025) is the equivalent configuration to the SR one in terms of component versions, but with additional parameters tuned to improve more specifically process representation and mean biases in the equatorial Pacific and the North Atlantic, two key regions for near-term climate prediction skill.
One particularly interesting feature of the HR configuration is the improvement in the simulated variability of the deep convection in the Labrador Sea and the Atlantic Meridional Overturning Circulation (AMOC) compared to EC-Earth3-SR, where deep convection occurred too intermittently due to an overly strong local density stratification. The biases in the Labrador Sea caused a problem in the decadal prediction system based on EC-Earth3-SR, for which an initialization shock occurred leading to a collapse of the Labrador Sea convection (Bilbao et al., 2021), inducing a quick degradation of the predictive skill in the Subpolar North Atlantic, a source region of decadal variability and predictability (Smith et al., 2020). This problem is not present in EC-Earth3-HR, for which the Labrador Sea convection remains active and stable, with a sustained impact on the strength of the AMOC.
2.2 Seasonal prediction system protocol
The ability of climate models to make accurate predictions is evaluated by performing retrospective predictions, also referred to as hindcasts. These are ensembles of predictions with forecast horizons of several months that start from initial states in the past (or start dates) evenly distributed over the hindcast period. We performed two sets of seasonal hindcasts with each resolution configuration of EC-Earth3. The hindcast period covers 1990–2015, i.e. 26 start-dates. In this study, we focus on the hindcast initialized on the 1 May but we note that a November-initialized hindcast system has also been produced for the two resolution configurations. Each hindcast system has 20 ensemble members and has a forecast length of 8 months, which for the case of the May initialized forecast, allows us to cover boreal summer through early boreal winter.
The hindcast systems have been initialized using full-field initialisation. The initial conditions for the atmosphere and land components are taken from the ERA5 reanalysis dataset (Hersbach et al., 2020) and subsequently interpolated to the same grid as the atmospheric component for each configuration, EC-Earth3-SR and EC-Earth3-HR. The ensemble of the atmospheric initial conditions is generated by introducing random infinitesimal perturbations (to the order of 105 K) in the 3D air temperature field, that aim to represent our best estimate of the observational uncertainty. This process is repeated for all start dates. The ocean and sea ice initial conditions come from ocean-sea ice forced simulations, called hereafter ocean reconstructions, with NEMO3.6-LIM3 in stand-alone mode. The NEMO3.6-LIM3 stand-alone configurations are tuned in the same way as the corresponding coupled configuration except for the snow conductivity of the HR configuration for which we are using the default value (rn_cdsn=0.27 in the HR stand-alone configuration, rn_cdsn=0.15 in the HR coupled configuration). We introduced this change in snow conductivity to have comparable sea ice volumes in both configurations, as the ocean-sea ice stand-alone version tends to produce thicker ice than the coupled one.
The ocean reconstructions are driven by surface atmospheric fluxes of ERA5 HRES and assimilate sea surface temperature (SST) and salinity (SSS) from the ECMWF Ocean Reanalysis System 5 (ORAS5; Zuo et al., 2019) and 3D ocean temperature and salinity below the mixed layer from the EN4 v4.2.1 ocean objective analysis (Good et al., 2013, we used the version with the g10 bias correction scheme (Gouretski and Reseghetti, 2010)). The atmospheric variables used to force the ocean are air temperature at 10 m, latent and sensible heat fluxes, specific humidity at 10 m, precipitation (including rain and snow) and surface winds at 10 m. SST and SSS from ORAS5 are assimilated using relatively strong temperature and salinity restoring coefficients of −200 and −750 , respectively. The reason to assimilate EN4 v4.2.1 in the subsurface is to avoid the non-stationary bias reported in the North Atlantic for the ECMWF seasonal forecast system SEAS5 (Johnson et al., 2019) that arises from problems in the ORAS5 subsurface fields (Tietsche et al., 2020). A Newtonian relaxation term is applied to assimilate the 3D temperature and salinity of EN4 v4.2.1, with the weak relaxation timescale going from 30 d at the surface to 3650 d at the bottom, increasing monotonically and with a reduction around the coastlines. There is a 10 times weaker subsurface damping between 15° S–15° N to avoid spurious vertical velocity effects (Sanchez-Gomez et al., 2016). The methodological choices on the products to assimilate and on the strength of the restoring coefficients to apply have been tested in small ensembles of retrospective seasonal forecasts at standard resolution, and those given an overall better performance in terms of forecast biases and skill were finally used.
We produced five different members of these SR and HR historical ocean reconstructions, covering the period 1959–2021. The ensemble members have been generated by applying infinitesimal perturbations to some of the atmospheric forcings from ERA5 (10 m air temperature and sensible and latent heat fluxes) and by using five different ocean initial conditions, corresponding to the restarts on 31 December of the last five years of an ocean-only spin-up. The ocean-only spin-up has been run with constant 1959 ERA5 forcing and assimilation of 1959 ocean observations (again from ORAS5 at the surface and EN4-v4.2.1 at the subsurface), and covers a total period of 20 years to allow for the model to equilibrate.
The simulations were performed using a workflow manager developed at the Barcelona Supercomputing Center (BSC), called Autosubmit (Manubens-Gil et al., 2016), and its associated graphical interface (Uruchi et al., 2021). Autosubmit ensures an optimal use of the computing resources by handling dependencies between jobs in an automatic way and packing multiple tasks in the same job execution. It can then easily handle simulations with complex workflows with different members and start dates. The simulation's configurations have been optimized in terms of computing resources, so that simulations run using the least amount of computing resources possible, while maintaining optimum execution times (Acosta et al., 2023).
2.3 Observational data and reanalysis
As references to assess the forecast systems, we use different observational and reanalysis products covering the hindcast period 1990–2015. SST observations are taken from the ESA SST CCI v2.1 level 4 analysis (Merchant et al., 2019) to benefit from their high horizontal resolution (0.05° latitude-longitude resolution). To address the impact of observational uncertainty in the results, we also compare the forecast systems against the ECMWF ERA5 reanalysis (Hersbach et al., 2020) and the ECMWF ORAS5 reanalysis (Zuo et al., 2019). We also initially used the Hadley Centre Sea Ice and SST dataset (HadISST) in its version 1.1 (Rayner et al., 2003) as verification product, but it should be noted that while using ERA5 and ORAS5 reanalyses give similar results than ESA SST CCI, the variability of the tropical Pacific in the HadISST v1.1 product is different and changes the values of skill metrics, especially the anomaly correlation coefficient (not shown). This feature can be linked to zonal and meridional discontinuities issues documented in the technical report (Chelton and Risien, 2016). The HadISST v1.1 dataset has therefore not been included in the presentation of the results of this study. For the oceanic mixed layer depth, we use the ORAS5 reanalysis. Similar results are obtained when using the EN4 v4.2.2 dataset (Good et al., 2013) as verification product (not shown). For all atmospheric variables (winds, precipitation and velocity potential), the ERA5 reanalysis is used for verification. Similar results for winds and precipitation are obtained when using the JRA-55 reanalysis (Kobayashi et al., 2015) as verification product (not shown).
2.4 Analysis methodology
All the analysis based on spatial fields has been done by interpolating first the outputs of the models onto a regular grid at 1° resolution to compare with the observational and reanalysis reference products. The computation of the spatial SST over the different regions of interest (ENSO, Atlantic-Niño and Western Equatorial Pacific regions) has been performed as the area-weighted averaged SST in the original grids of the forecast systems and the verification products. Data post-processing, statistical analyses and the significance assessments have been performed using R4.1.2 and the startR (Manubens et al., 2024, v2.3.1), s2dv (Manubens et al., 2018; BSC-CNS et al., 2024a, v2.0.0) and ClimProjDiags (BSC-CNS et al., 2024b, v0.3.3) R-packages.
2.4.1 Drift correction
The initialized predictions cannot be compared with observed data at face value due to a phenomenon known as forecast drift, which manifests as the models transition from an observation-constrained initial state to their own attractor. It is generally assumed that the drift manifests in a consistent manner independent of the initial climate state. It is hence a standard approach to compare only the deviations of the simulations and observations from their lead-time dependent mean state, or climatology. In this study, the forecast anomalies, or drift-corrected anomalies, are computed by subtracting the lead-time dependent monthly climatology over the entire hindcast period 1990–2015.
The mean bias by lead months gives an indication of the impact that the forecast drift can have (Fig. S1 in the Supplement). Both systems exhibit certain non-stationary characteristics in the forecast anomalies for all ENSO indices, which appear to be more pronounced for the longest forecast lead-times during the first half of the hindcast period. This non-stationary behaviour introduces some spurious signals in the drift-corrected anomalies that are expected to degrade their forecast skill. However, since the non-stationary effects are similar in both systems, we can assume that they do not explain the differences in skill.
2.4.2 Anomaly correlation coefficient
Prediction skill is assessed with the Anomaly Correlation Coefficient (ACC) against the reference datasets, computed using a pointwise Pearson correlation between the ensemble mean forecast anomaly and the corresponding observed anomaly over the entire re-forecast period. The significance of the correlations is determined by a two-sided Student-t test, at the 95 % confidence level. The statistical significance of the correlation differences is computed with a two-sided test to assess whether the skill of the two forecast systems are significantly different (Siegert et al., 2017) at the 95 % confidence level. The time series autocorrelation has been taken into account when estimating the statistical significance following Storch and Zwiers (1984).
3.1 Skill assessment
The ACC maps of SST anomalies in the tropics (Fig. 1, left and middle column) show significant skill in most of the tropical Pacific and Atlantic ocean, in both EC-Earth3 forecast systems, with the exception of the most western equatorial Pacific region and, to a lesser extent, some parts of the southern tropical Atlantic Ocean. EC-Earth3 in its HR configuration shows higher predictive skill (statistically significant) than its SR configuration in the central and western equatorial Pacific for all lead times considered.
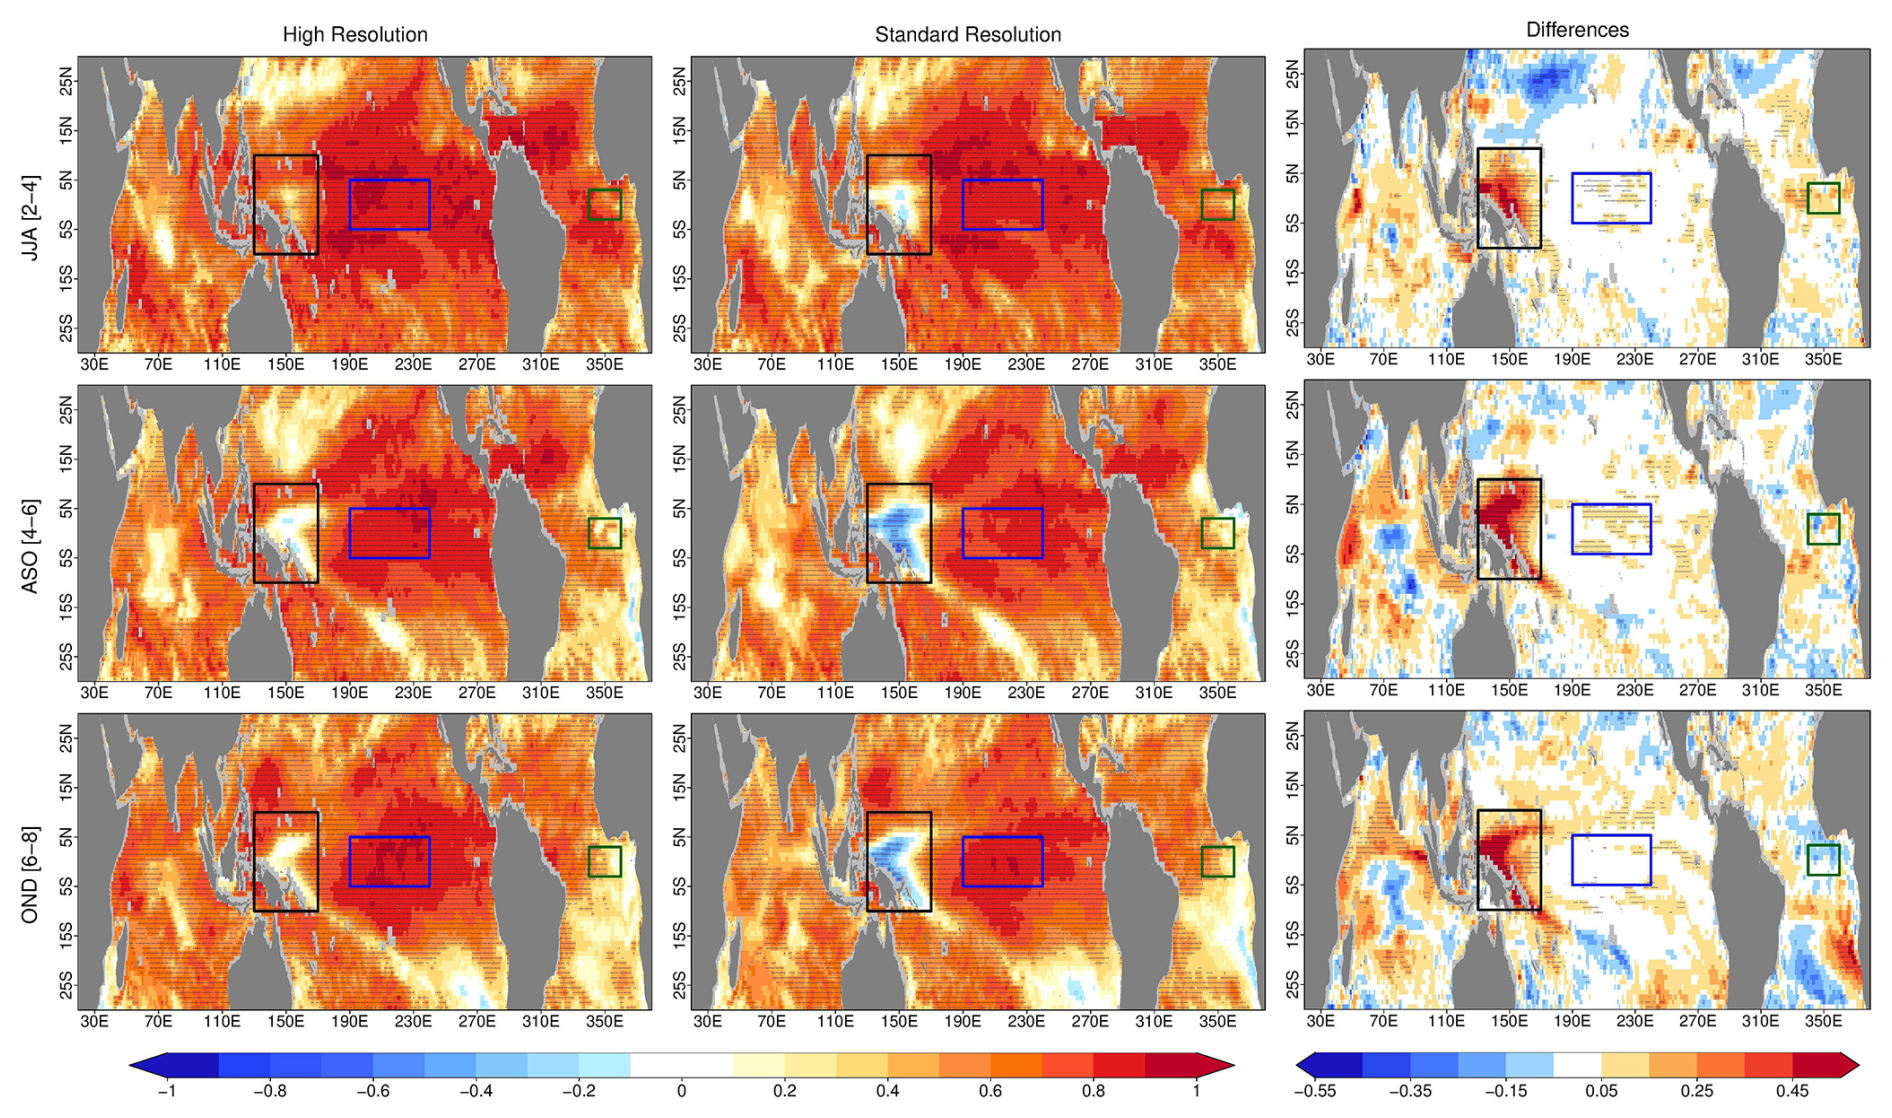
Figure 1Maps of ACC of sea surface temperatures (SST) for the forecasted season (top row) June–July–August (JJA, lead-months 2–4), (middle row) August–September–October (ASO, lead-months 4–6) and (bottom row) October–November–December (OND, lead-months 6–8) initialized in May. The left column corresponds to the HR configuration, the middle one to the SR configuration and the right column shows the difference in correlation between HR and SR. In the right column, red indicates an improvement in the skill with increased resolution, while blue indicates a degradation of the skill. The reference dataset is the ESA SST CCI dataset. The ACC has been computed over the 1990–2015 period for each individual grid point after interpolation to a regular 1° grid and using the ensemble mean of the 20 members of each system. Dashes indicate that the values are statistically significant at the 95 % level. The blue box is the Niño 3.4 region (5° S–5° N, 170–120° W), the black box is the Western Equatorial Pacific (WEP) region (10° S–10° N, 130–170° E) and the green box is the Atlantic Niño region (3° S–3° N, 20° W–0).
The higher predictive skill in EC-Earth3-HR than in EC-Earth-SR over the central tropical Pacific is confirmed by examining the ACC as a function of forecast time for the spatially averaged SST in three different ENSO regions (Fig. 2). In both the Niño3.4 (5° S–5° N, 170–120° W) and Niño3 (5° S–5° N, 150–90° W) regions, skill is higher in the HR configuration than in the SR configuration, an increase that is statistically significant for forecast months 3–5, i.e. the boreal summer (July–August–September). The increase in ENSO predictive skill in HR with respect to SR is, however, lower and not significant in its westernmost part, as shown in Fig. 2c for the Niño4 region (5° S–5° N, 160° E–150° W). Further west in the equatorial Pacific, next to the Maritime Continent, EC-Earth3-HR shows statistically significant higher predictive skill than EC-Earth3-SR, which has no predictive skill in this region (Fig. 1). However, the skill, even if substantially improved, is still not statistically significant for all lead times in EC-Earth-HR. This Western Equatorial Pacific (WEP) region is further analysed in Sect. 3.2.
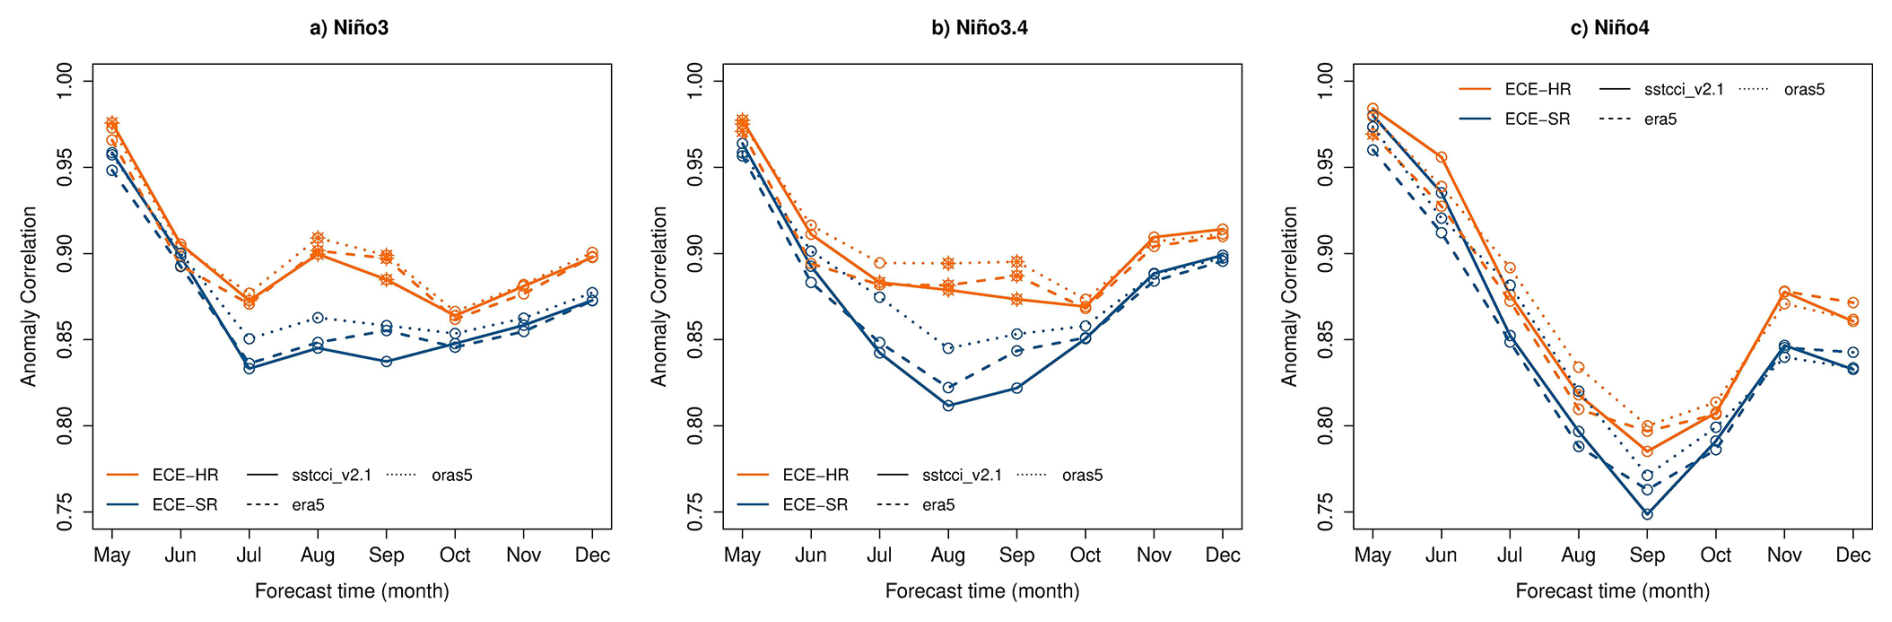
Figure 2ACC in the (a) Niño3 (5° S–5° N, 150–90° W), (b) Niño3.4 (5° S–5° N, 170–120° W), and (c) Niño4 (5° S–5° N, 160° E–150° W) regions as a function of forecasted month for (dark blue) EC-Earth3-SR and (orange) EC-Earth3-HR. The reference datasets are ESA SST CCI dataset (plain line), ERA5 dataset (dashed line) and ORAS5 dataset (dotted line). The hindcast period is 1990–2015 and the 20 members of each system are used. Open circles mean that the ACC is statistically significant at 95 % level of confidence and stars mean that the differences of correlations between the SR and HR configurations of EC-Earth are statistically significant.
The higher predictive skill in the equatorial Pacific in EC-Earth3-HR can arise for various reasons. One of these could be a better representation of the local physical processes that drive the tropical Pacific variability and in particular ENSO. This improvement could be linked to the higher horizontal resolution of the model, via for instance a more realistic simulation of intrinsic variability (Patrizio et al., 2023) or a better orographic effect on the land-atmosphere-ocean interactions over the Maritime Continent (Liu et al., 2023b). Another possible reason could be a more realistic simulation of key teleconnections that affect the region, like the influence of Atlantic El Niño/La Niña events on the Tropical Pacific, as dynamical prediction systems that represent it more accurately have been shown to have higher ENSO predictive skill (Exarchou et al., 2021).
In the next sections, we focus on processes that can explain why the predictive skill in the ENSO region is higher in the HR configuration than in the SR configuration. We first focus on the western equatorial Pacific to analyse why this region is poorly predicted in EC-Earth3-SR, the potential reasons for the enhanced skill in EC-Earth-HR, and whether the model's predictive skill in this region is linked to ENSO. Secondly, we analyse the potential link between the equatorial Atlantic variability and ENSO skill.
3.2 Exploring the prediction skill in the western equatorial Pacific
As highlighted in Fig. 1, the Western Equatorial Pacific (WEP; herein defined between 10° S–10° N and 130–170° E) shows a quick drop in predictive skill, particularly in EC-Earth3-SR. Figure 3a shows the ACC time series of the SST in this region for both forecast systems. In both configurations, the skill in predicting SST quickly drops after the second month of forecast, reaching very low skill levels between September–October. However, the skill is higher in the EC-Earth3-HR configuration and remains statistically significant for another month (until August) compared to EC-Earth3-SR. The differences in the skill between the two configurations are also statistically significant from August to November.
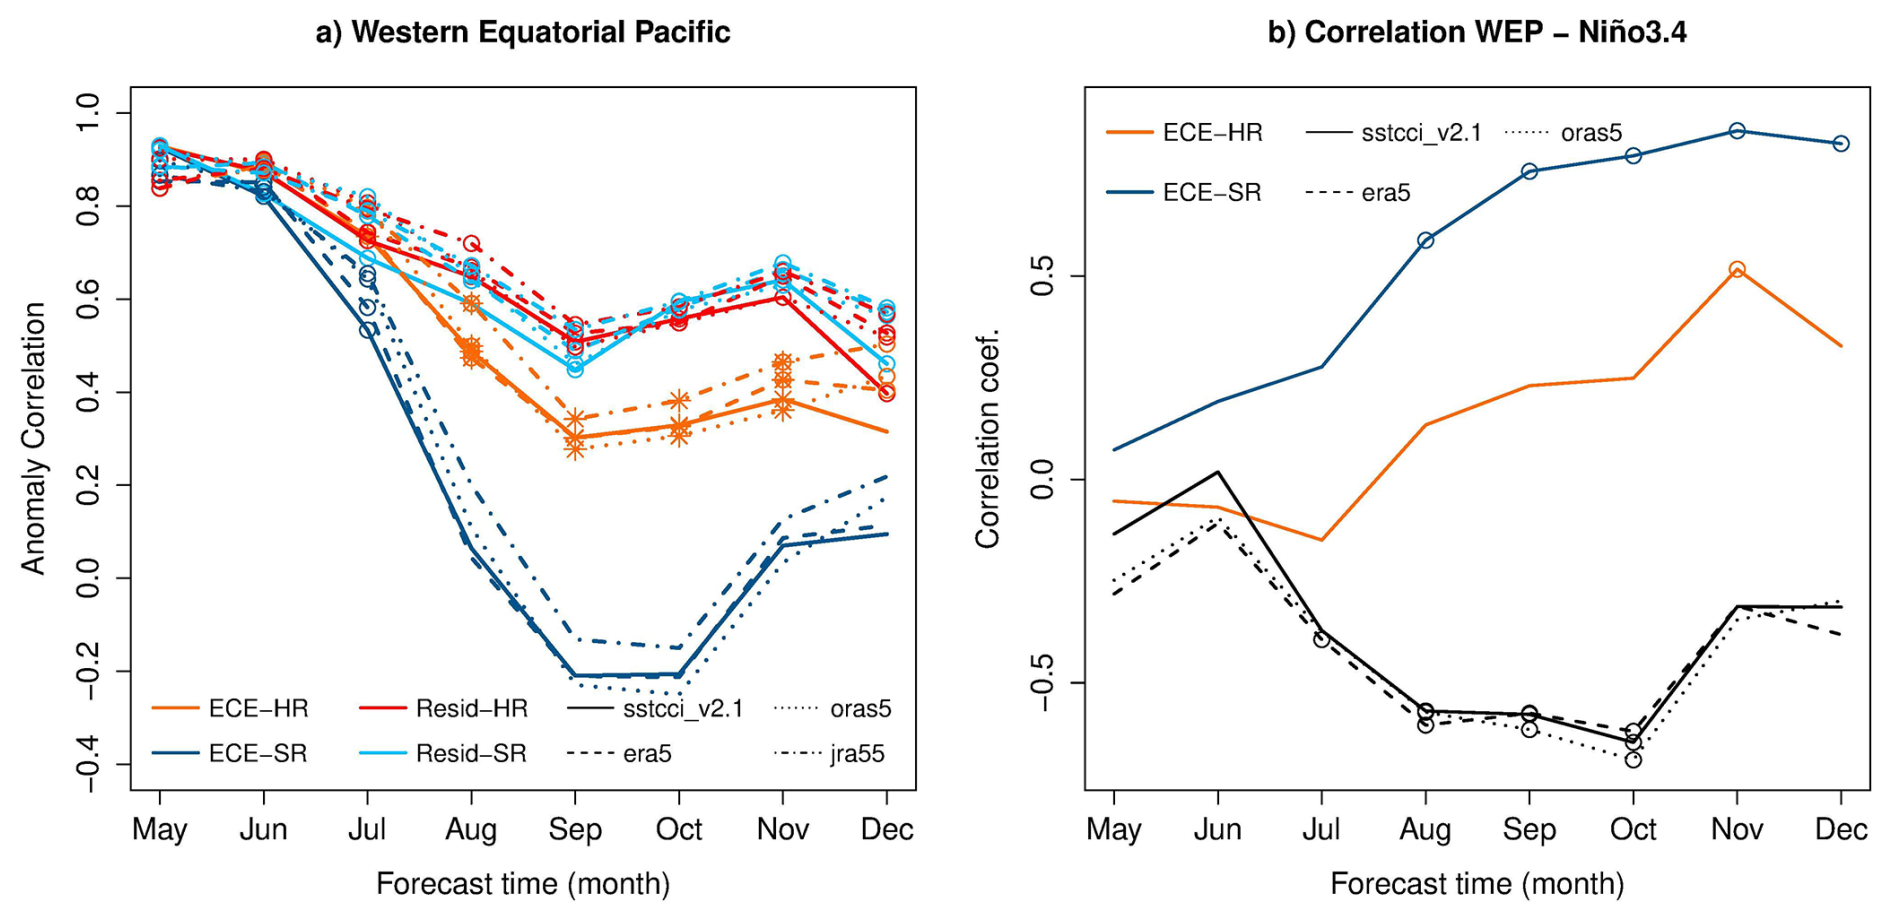
Figure 3(a) ACC in the western equatorial Pacific (WEP – 10° S–10° N, 130–170° E) SST anomalies as a function of forecasted month for EC-Earth3-SR (dark blue) and EC-Earth3-HR (orange). The reference datasets are ESA SST CCI dataset (plain line), ERA5 dataset (dashed line) and ORAS5 dataset (dotted line). The correlation coefficients, compared to these 3 reference datasets, of the residuals of the regression of the WEP SST anomalies onto Niño3.4 SST anomalies are shown for EC-Earth3-SR (light blue) and EC-Earth3-HR (red). Open circles mean that the ACC is statistically significant at 95 % level of confidence and stars mean that the differences of correlations between the SR and HR configurations of EC-Earth are statistically significant at 95 % level of confidence. (b) Correlation coefficients between SST anomalies in the western equatorial Pacific and Niño3.4 region (5° S–5° N, 170–120° W). The black lines are for the same observation products as used in Fig. 3a as references. Open circles mean that the correlation is statistically significant at 95 % level of confidence.
When estimating the link between the WEP and Niño3.4 regions, represented by the correlation coefficients between the associated SST time-series (Fig. 3b), the observations consistently show negative values for all lead times, thus indicating that both regions vary in opposite phases: when the ENSO region gets cold, the WEP region tends to get warm. However, in both initialized predictions, the WEP-Niño3.4 relationship is the opposite of that observed, displaying predominantly positive correlation coefficients. This effect is especially pronounced in EC-Earth3-SR where correlation coefficients are positive since the first month after initialisation and remain substantially higher than for EC-Earth3-HR. The poor predictive skill in the WEP region and the erroneous positive WEP-Niño3.4 relationship is also present in other forecast systems, as for instance the operational North American Multi-Model Ensemble (NMME) (Newman and Sardeshmukh, 2017, Fig. S3c in the Supplement).
We now explore whether this erroneous co-variability between ENSO and the WEP region affects the predictive skill of the WEP region. To do this, we compute the prediction skill over that region after regressing out the influence of ENSO. In practice, this is done by computing the linear regression of the WEP SST time-series onto that of Niño3.4, both for the model and for the reference datasets, retaining the residuals in each case and calculating their correlation with each other (Fig. 3a). When removing the ENSO signal from the WEP region, the correlation coefficients are higher and similar in both EC-Earth3 configurations, which indicates that the misrepresented link with ENSO is behind the poor prediction skill in the WEP region.
3.2.1 ENSO-related errors
This erroneous feature is at least partly due to the common ENSO-related SST westward extension bias, which is present in many climate models (Vannière et al., 2013; Planton et al., 2021; Jiang et al., 2021). Figure 4 shows the ENSO-related errors spatial patterns, which are diagnosed following Beverley et al. (2023) as the regression at each grid point of the forecast errors (forecast minus observation) onto the observed standardized Niño3.4 index. The ENSO-related error patterns are thus an indicator of how close the spatial representation of ENSO in the forecast is to what it should be based on observations. As a reference, we also include in contours the regression pattern of the observed SST anomalies onto their respective normalized Niño3.4 index, to compare the simulated ENSO-related errors to the observed ENSO-related variability. At the end of the forecast period (October–November–December, OND), EC-Earth3 predictions in both configurations exhibit a cold ENSO-related error in the central-to-eastern equatorial Pacific, which extends farther west in the EC-Earth3-SR (Fig. 4). This error induces ENSO events of lower amplitude in this central region, a feature that is more pronounced in EC-Earth3-SR. This tendency to underestimate the magnitude of ENSO is accompanied by a warm ENSO-related error on the westernmost part of the basin, which is due to the aforementioned common bias in climate models of extending ENSO-related SST anomalies westward. In EC-Earth3-SR in particular, the spatial pattern associated with ENSO variability is of the same sign across the entire equatorial Pacific while in observations the change of signs in SST anomalies occurs around 160° E (Fig. 4 contours for observation). This same variability phase throughout the entire equatorial Pacific in the predictions lowers the predictive skill in this WEP region and has implications on the ENSO-Western Pacific teleconnections as shown in Fig. 3.
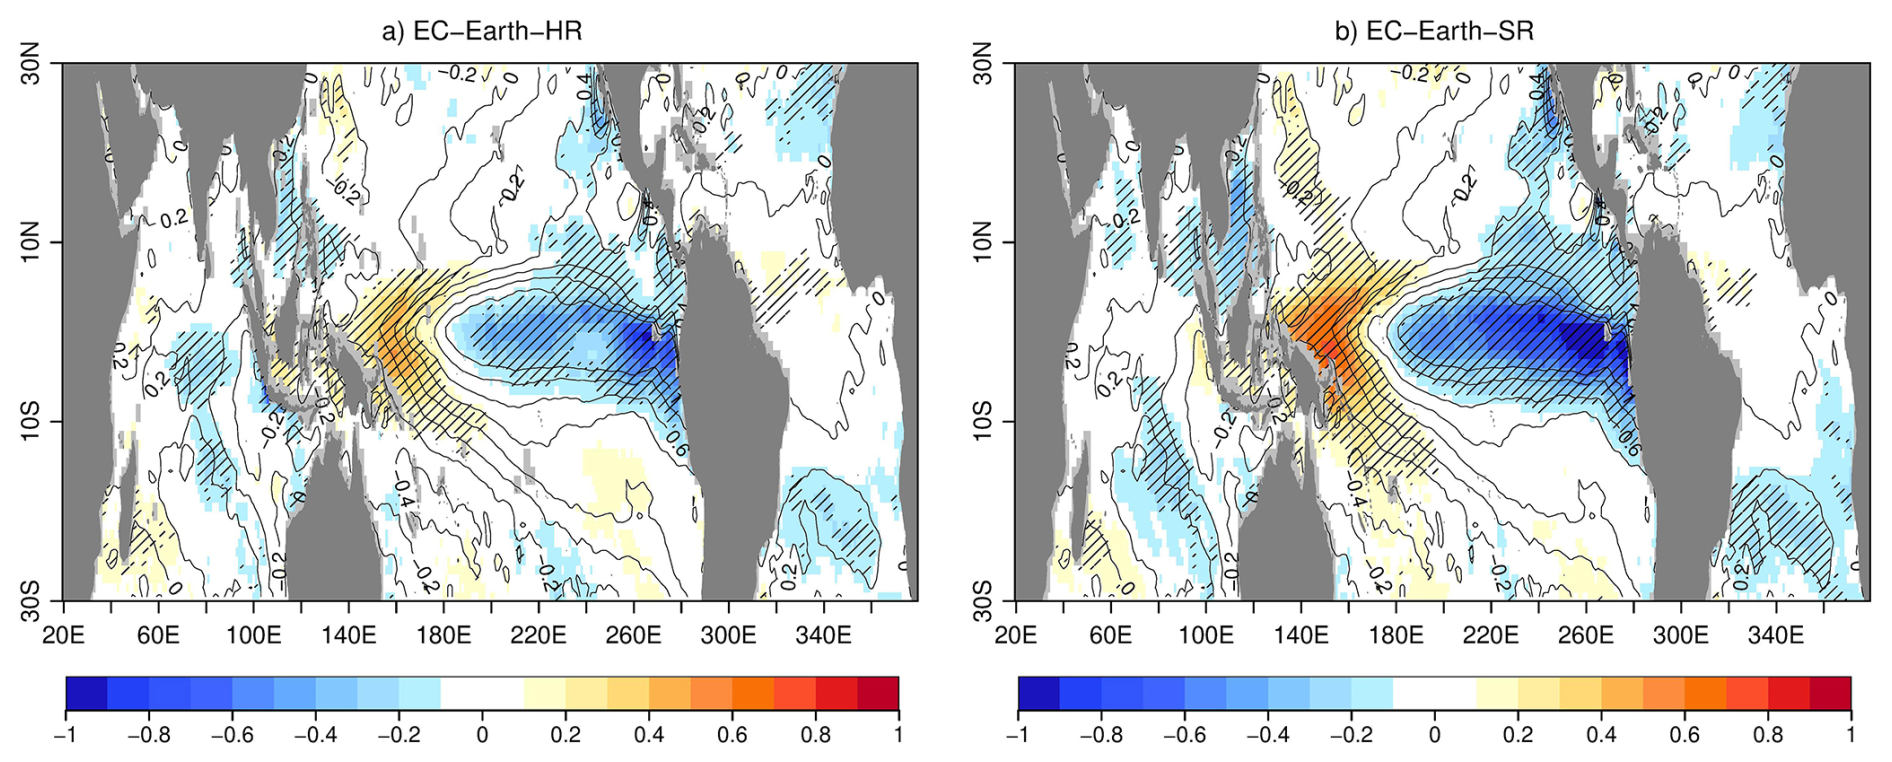
Figure 4Maps of (colours) ENSO-related SST errors as defined in Beverley et al. (2023) and (contours, every 0.2) regression coefficients of Niño 3.4 SST anomalies time-series onto SST anomalies fields in October–November–December (OND) for (a) EC-Earth-HR and (b) EC-Earth-SR. The hindcast period used is 1990–2015. The reference product is the ESA CCI v2.4 dataset. Dashes indicate that the values are statistically significant at the 95 % level.
Given the strong air-sea interactions in the tropics, these ENSO-related errors are also found in other variables, such as zonal surface winds and mixed layer depth, and develop further with lead time. Figure 5 shows the time evolution of the ENSO-related errors averaged between 5° S–5° N from the first month after initialisation (May) to the last forecast month (December) for the SST, the zonal surface winds and the mixed layer depth. In both prediction systems, the ENSO-related SST errors start in the first month after initialisation, with a small warm bias forming around 160° E (the first sign of the erroneous westward extension of ENSO) which then grows with time. While the ENSO-regressed SST anomalies in observations start to be positive from around 160° E to cover the entire central and eastern tropical Pacific, the longitude where this happens in both EC-Earth3 configurations is around 140° E. This leads to warmer ENSO-regressed SST in the models than in observations in the western Pacific, which results in the positive ENSO-related errors seen in Fig. 5a and b, with a maximum error in September–October. In the eastern part of the tropical Pacific, the negative (cold) ENSO-related errors start in the easternmost part of the equatorial Pacific and then spread to the dateline, in particular because positive SST anomalies are not high enough while El Niño events are developing. The westward overextension of ENSO-related SST anomalies is associated with ENSO-related errors in the winds, particularly during ENSO's development phase which starts in August. During the positive phase of ENSO, i.e. El Niño events, the westerly winds are too weak and too constrained around 150–160° E while the westerly winds spread between 160–200° E and at higher speed in observations (Fig. 5, arrows). Since the central equatorial Pacific is a key region for wind-mixed layer interaction processes, the ENSO-related errors are also evident in the mixed layer dynamics. During El Niño events, the mixed layer depth (MLD) anomalies change sign, between 200–220° E in observations, from positive anomalies (i.e. deepening) in the east to negative anomalies (i.e. shallowing) in the west. This transitional region of the MLD is shifted westward in the model following the errors in the wind, which induces positive ENSO-related MLD errors (Fig. 5c and d), particularly between 180–200° E.
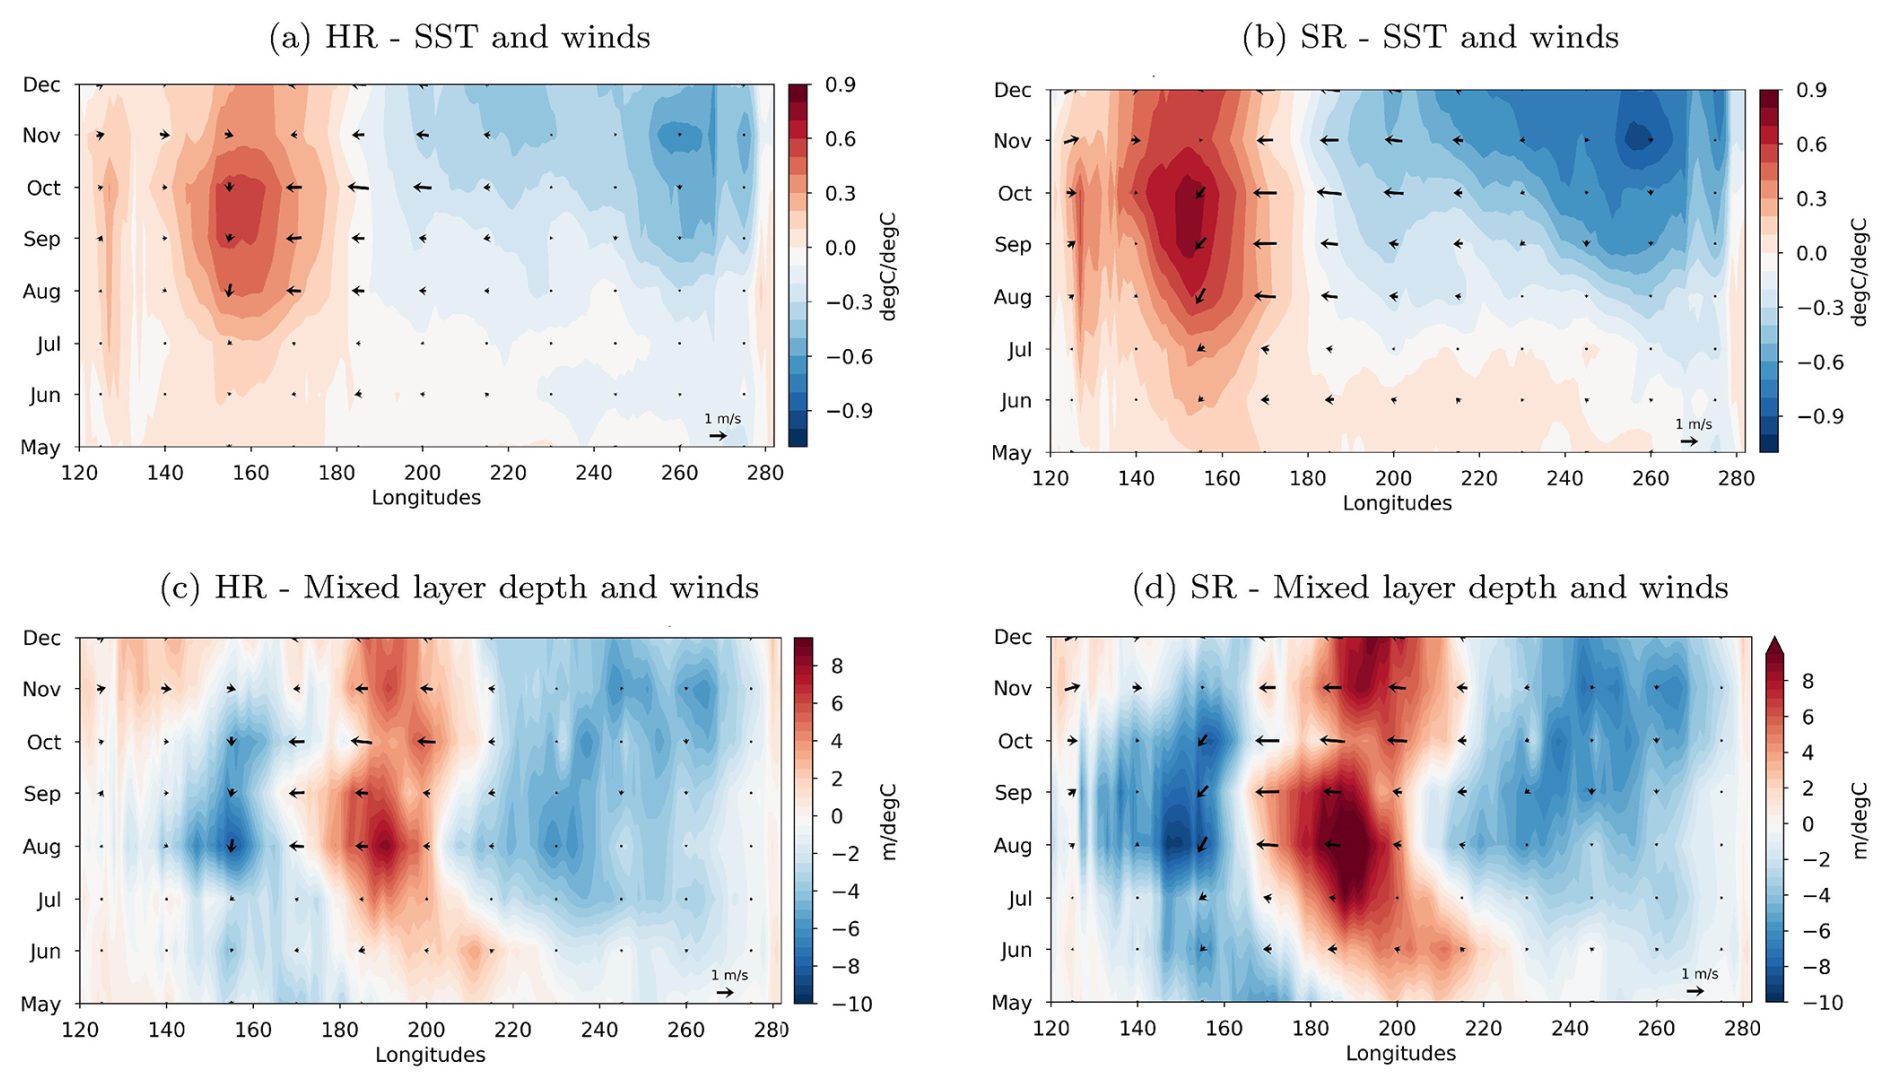
Figure 5Hovmoller from May to December of the ENSO-related errors for (a, b) SST (shaded) and surface winds (arrays) and (c, d) mixed layer depth (shaded) and surface winds (arrays) in EC-Earth3-HR (a, c) and EC-Earth3-SR (b, d) forecast systems. The mixed layer depth is defined as the depth at which there is a change of the density of 0.03 kg m−3 with respect to the density at 10 m. The reference datasets are ESA SST CCI for the SST, ERA5 for the surface winds and ORAS5 for the mixed layer depth.
3.2.2 Linking to mean state biases
The erroneous westward extension of the ENSO-related variability in the model can potentially arise from mean state biases, which appear already in the first month after initialisation (Fig. 6). In both EC-Earth3 forecast systems, the SST show the common cold bias in the central-to-eastern equatorial Pacific, particularly in the SR configuration, which worsens with forecast time as it extends westwards (Fig. 6a and b). The mixed layer depth also shows a mean state bias since the first forecast month, characterized by too deep mixing between 160–180° E, which corresponds to a westward shift in the normal deepening of the mixed layer depth (Fig. 6e and f), a shift that intensifies with time. By contrast, east of 180–200° E, the mixed layer is too shallow, which matches the SST cold bias in this region due to too intense equatorial upwelling. Associated with this westward shift in the deepening of the mean mixed layer, the mean surface zonal winds show a westward displacement of the easterly winds, peaking between 180–200° E in the model, compared to around 220° E in the observations. The intensity of the easterlies is stronger in the models and the temporality is also shifted, with the peak intensity taking place in July in the models rather than in August as in the observations, a shift in the peak that is also found in the mixed layer depth. Even if they are similar in nature, the mean state biases and the erroneous westward extension develop more rapidly and are more pronounced over time in EC-Earth3-SR than in EC-Earth3-HR (Fig. 6), which also happens for the ENSO-related errors (Fig. 5).
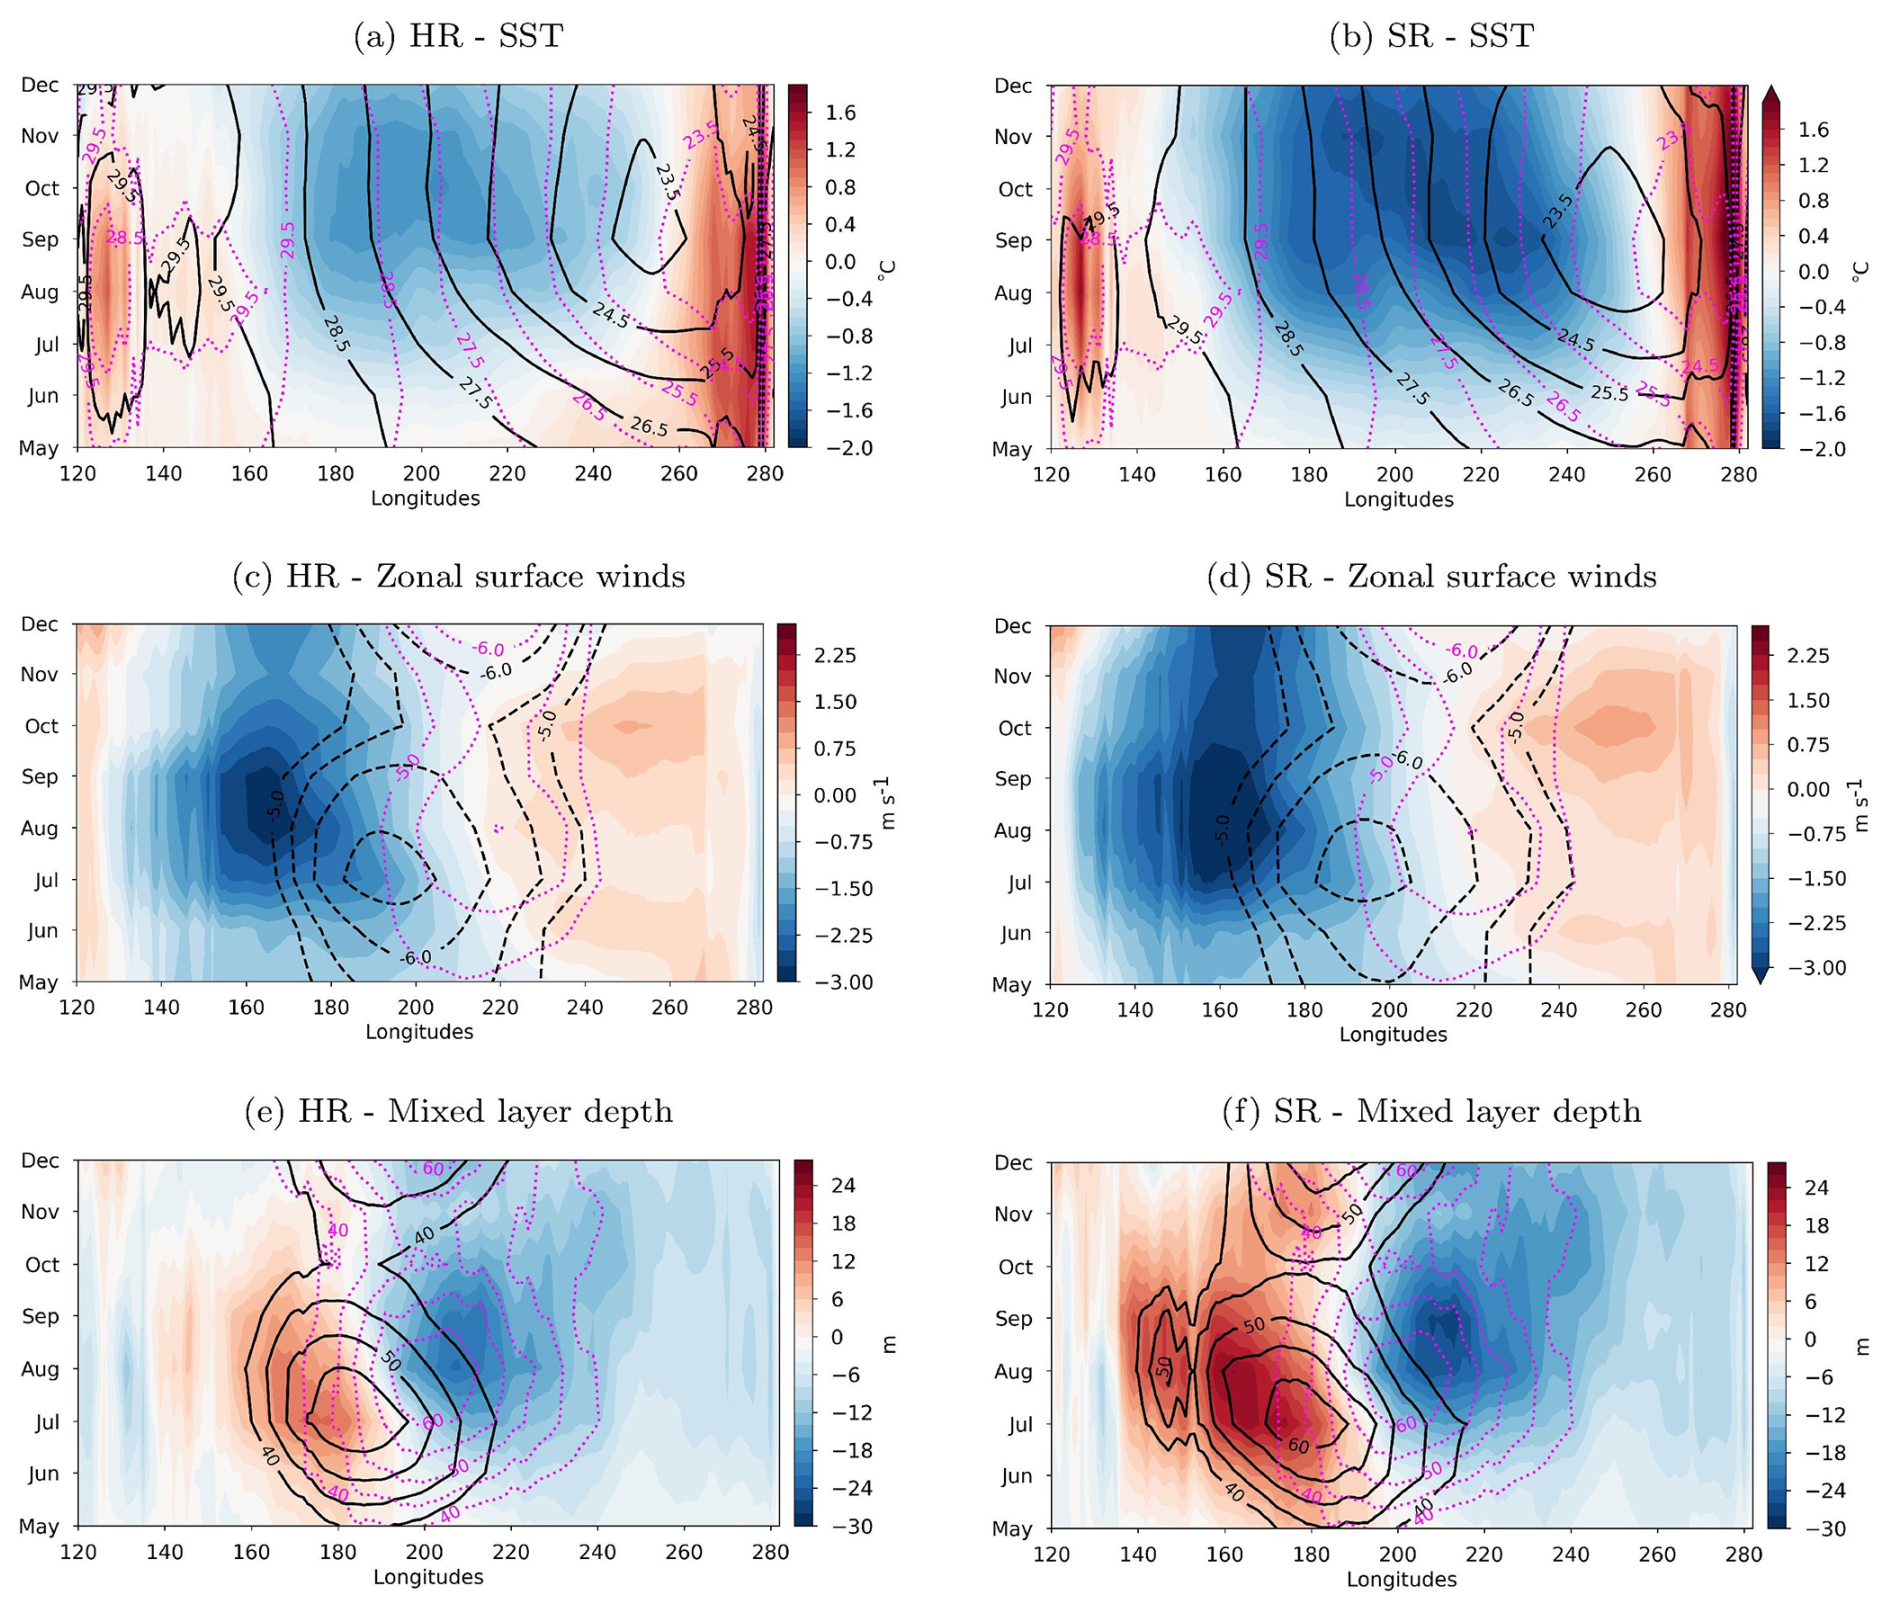
Figure 6Hovmoller from May to December of the mean state biases for (a, b) SST, (c, d) zonal surface winds and (e, f) mixed layer depth in EC-Earth3-HR (a, c, e) and EC-Earth3-SR (b, d, f) forecast systems. The black lines represent the mean state of the forecast systems, the purple lines are the mean states of the corresponding reference dataset. The reference datasets are ESA SST CCI for the SST, ERA5 for the surface winds and ORAS5 for the mixed layer depth.
3.2.3 Winds variability deficiency
The ENSO-related winds differ between EC-Earth3-SR and EC-Earth3-HR as El Niño events evolve with forecast time (Fig. 7). In EC-Earth3-SR, the westerly winds in the western Pacific are too weak and are not strengthening as El Niño events grow, reaching only around 1 in December, values which are comparable to observations at the beginning of the events development phase (May). The westerly winds in EC-Earth3-HR reach higher peak values (∼1.5 ) in December even if they remain lower than in the observations (∼2 ). The EC-Earth3-SR model deficiency to simulate strong ENSO events, linked to too low winds variability and a weak air-sea coupling in the Tropical Pacific, is documented in Yang et al. (2019) and is therefore also present in the initialized simulations. It is less pronounced in EC-Earth3-HR, which may be related to the improved mean state, which would reduce the impact of the coupled feedback bias due to the weak coupling.
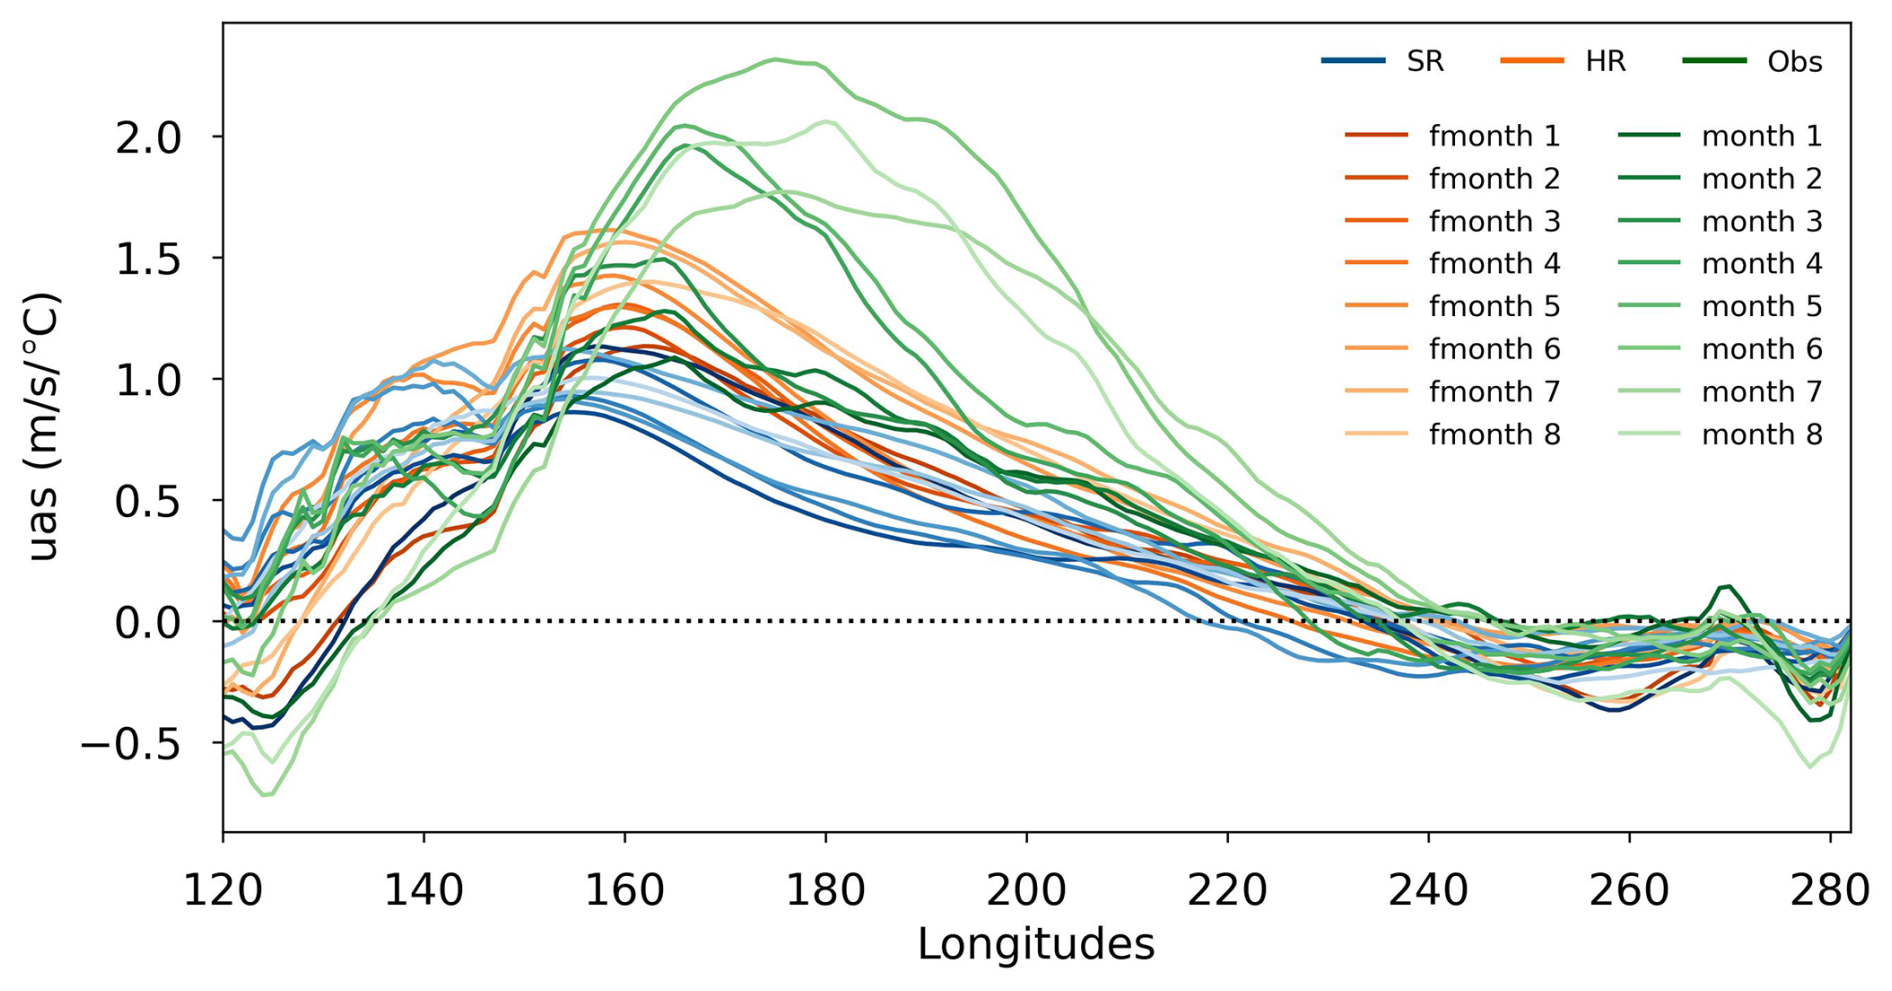
Figure 7Longitudinal profiles (5° S–5° N) of the time-evolution of the ENSO-regressed surface zonal winds for ERA5 and the EC-Earth3-SR (blue lines) and EC-Earth3-HR (orange lines) forecast systems. The different shades of colours represent each month along the forecast time, from the first forecast month, May, in dark green for the observations, in dark blue for EC-Earth3-SR and in dark orange for EC-Earth3-HR to the eighth forecast month, December, in the respective same colours, but lighter.
3.2.4 Summary of results on prediction skill in the WEP region
To summarize, ENSO variability is shifted westwards and weakened in the forecasts, these two errors developing rapidly from the first forecasted month, persisting over time and being more pronounced in EC-Earth3-SR than in EC-Earth3-HR. These ENSO-related errors, which induce low SST predictive skill in the WEP regions, are linked to the erroneous spatial simulation of ENSO, which is itself likely linked to the mean state representation. EC-Earth3-SR shows particularly poor predictive skill in the WEP region compared to EC-Earth3-HR due to higher ENSO-related errors and possibly due to the mean state bias. Overall, a weak air-sea coupling, weaker in EC-Earth3-SR, may prevent the model from simulating the correct ENSO development.
Precipitation associated with ENSO events also shows a deficiency in model simulations, as the convergence zone does not move correctly toward the centre of the equatorial Pacific during El Niño events (Fig. 8). ENSO-related precipitation is located too far west reaching the first islands of the Maritime continent, particularly in EC-Earth3-SR. The penetration of precipitation over the maritime continent (red colour) does not allow to correctly simulate the precipitation deficits that these islands, and the Philippines in particular, are likely to experience during El Niño events. At the same time, too little precipitation is simulated along the equatorial Pacific (blue colour), an error that grows with time reinforcing the separation of the Inter-tropical Convergence Zone (ITCZ) into two branches, particularly in EC-Earth-SR.
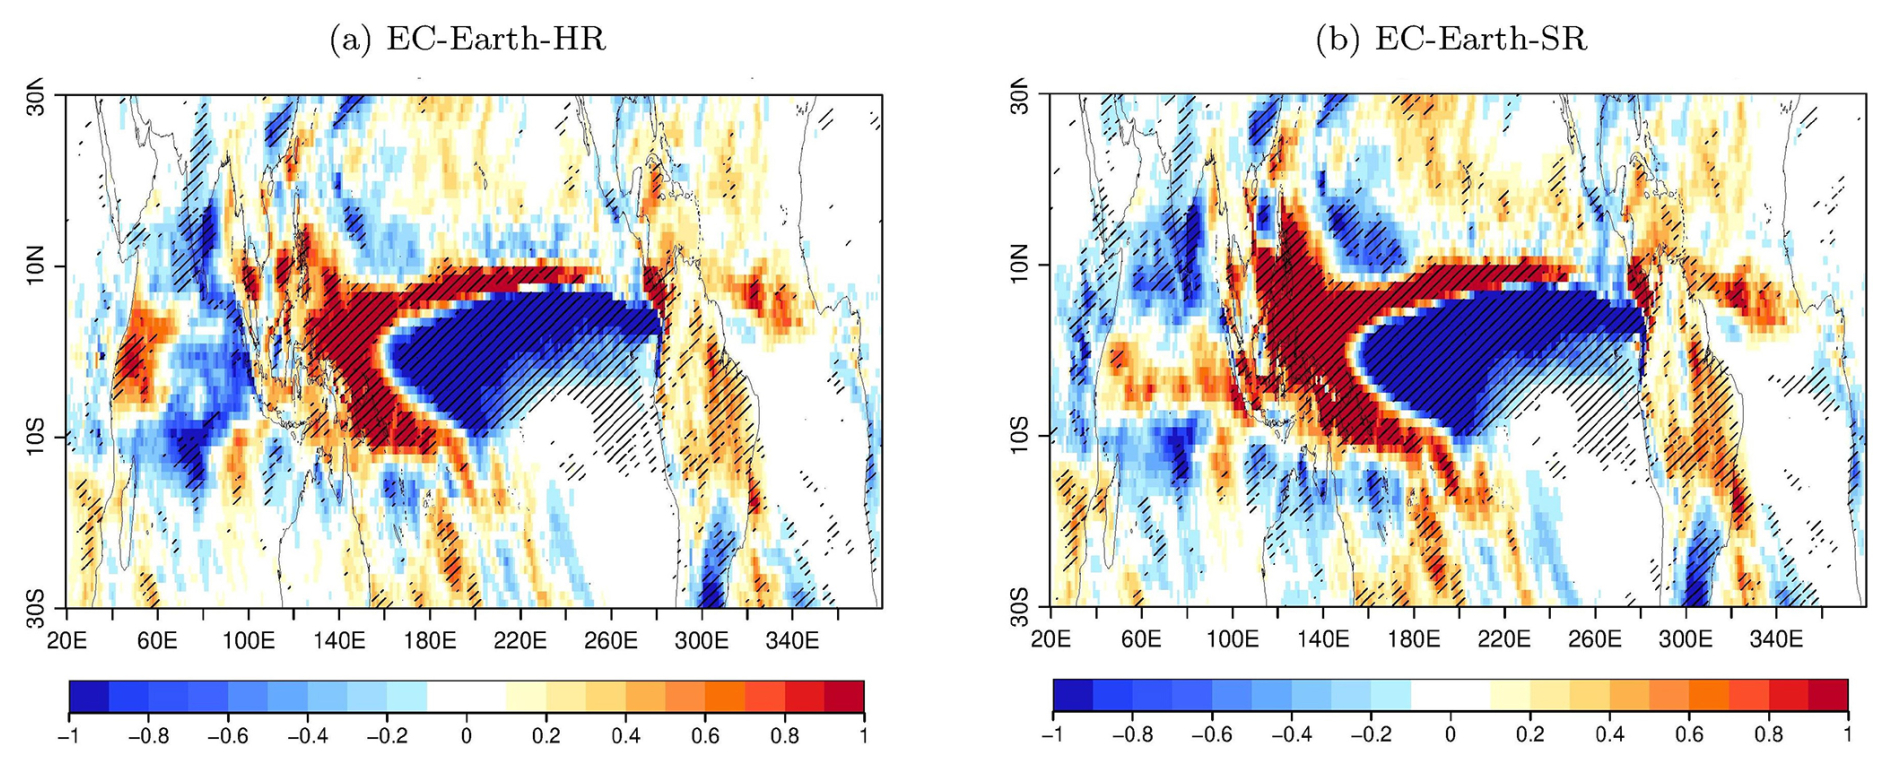
Figure 8Maps of (colours) ENSO-related precipitation errors as defined in Beverley et al. (2023) in October–November–December (OND) for (a) EC-Earth-HR and (b) EC-Earth-SR. The hindcast period used is 1990–2015. The reference product is the ERA5 reanalysis.
Improving the spatial simulation of ENSO and the tropical Pacific mean state in the model is particularly important for improving predictions of rainfall and SST in the region and over the maritime continent, a region of convection particularly important for teleconnections to extra-tropics (Liu et al., 2023a).
3.3 Influence of Atlantic teleconnections on ENSO prediction differences
One of the most prominent modes of variability in the tropical Atlantic is the Atlantic-Niño (Keenlyside and Latif, 2007; García-Serrano et al., 2008). Atlantic Niño events are usually defined by the SST anomalies in the equatorial region, west to the Gulf of Guinea (3° S–3° N, 20° W–0, see green box in Fig. 1), hereafter called the ATL3 region. The Atlantic-Niño mode of variability exhibits higher variability during the boreal summer (Keenlyside and Latif, 2007). It has been shown that summer Atlantic Niño events favour the development of Pacific La Niña events the following winter (Rodríguez-Fonseca et al., 2009; Ding et al., 2012) by modulating the Walker circulation. During an Atlantic Niño event in boreal summer, the warmer SST lead to anomalous heating, altering the Walker cell by increasing upward motions over the Atlantic ocean and anomalous subsidence over the central Pacific. The latter then enhances easterly wind anomalies over the central and western equatorial Pacific, which triggers an upwelling oceanic Kelvin wave that propagates eastward. This subsequently cools the surface, triggering the Pacific Bjerknes feedback by further enhancing equatorial easterly winds and promoting the development of a Pacific La Niña event 6 months later in boreal winter. This teleconnection has been shown to enhance the prediction skill of ENSO the following winter (Keenlyside et al., 2013; Exarchou et al., 2021), particularly during the late twentieth century, 1980–2015, which covers the hindcast period of this study, an influence that is subject to a decadal modulation via the South American low-level jet (Park et al., 2023).
We now explore whether the improvement in the predictive skill in ENSO in EC-Earth3-HR with respect to EC-Earth3-SR can be directly related to this existing teleconnection. The improvement can come either from (1) better skill in ATL3 which impacts the ENSO region without any change needed in the teleconnection itself, (2) a more realistic teleconnection that transfers the predictability from ATL3 into the ENSO region even without changes in skill in ATL3, or (3) both. Figure 9a shows the correlation coefficients between the ATL3 index in summer (JJA), when the Atlantic-Niño event peaks, and the temporal evolution of Niño3.4 from summer to early winter, to estimate how strong their co-variability is and how it evolves in time. This correlation is negative in the observations, as warm (cold) summer Atlantic Niño (La Niña) events are linked with the later occurrence of cold (warm) winter ENSO events. The teleconnection is established between JJA ATL3 and ENSO at subsequent lead times. Both models underestimate the teleconnection strength between the Atlantic Niños and ENSO, but it is only statistically significant in EC-Earth3-HR, which also has a more realistic strength.
In the ATL3 region itself, the EC-Earth3-HR forecast system does not present significantly higher predictive skill than EC-Earth3-SR (Fig. 9b). In particular, both configurations present a strong drop in the predictive skill in this region from July to September, which is consistent with other forecast systems (Ding et al., 2015; Exarchou et al., 2021).
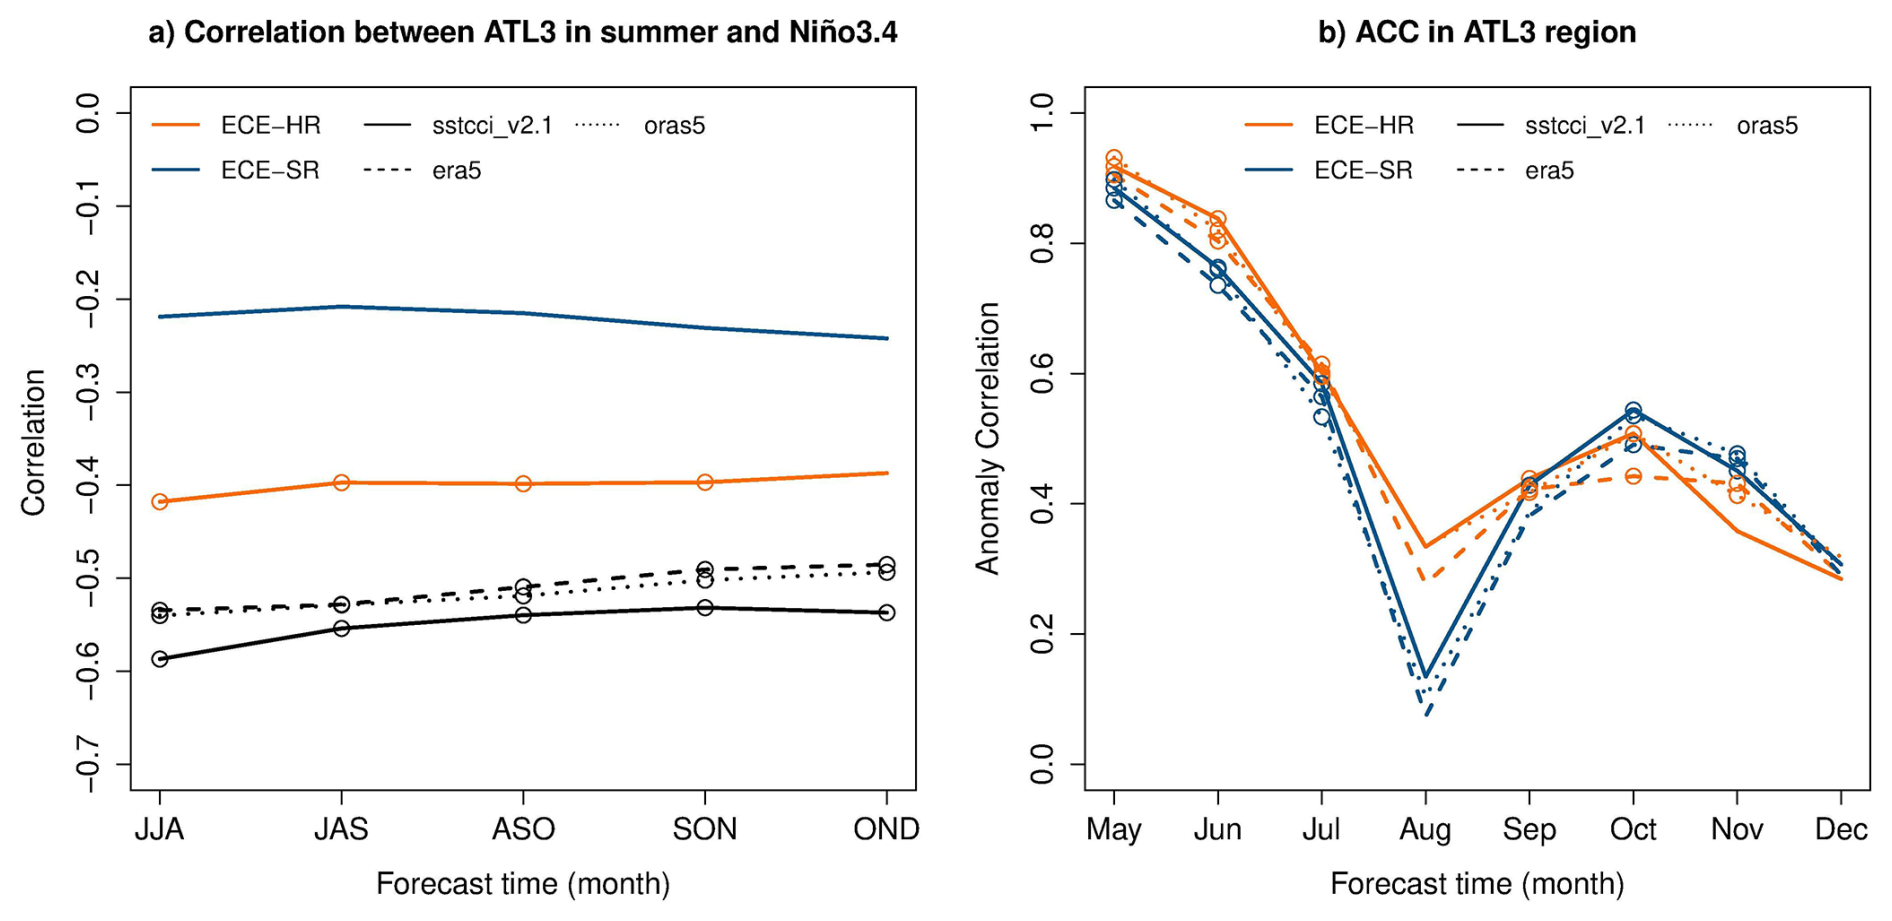
Figure 9(a) Correlation coefficients between SST anomalies in the ATL3 region (20° W–0, 3° S–3° N) in JJA and Niño3.4 region for moving 3-month means. The black lines are for reference datasets: (plain line) ESA SST CCI, (dashed line) ERA5 and (dotted line) ORAS5. (b) ACC in the ATL3 SST anomalies as a function of forecast month for (dark blue) EC-Earth3-SR, (orange) EC-Earth3-HR compared to the same reference datasets as in (a). Open circles mean that the ACC is statistically significant at 95 % level of confidence and plain circles mean that the differences of correlation between the SR and HR configurations of EC-Earth are statistically significant.
It is thus the more realistic simulation of the teleconnection between the Atlantic Niño/a and the following ENSO event in EC-Earth3-HR that can partly explain the improvement in ENSO predictive skill in this model (Exarchou et al., 2021). To investigate other aspects of the ATL3 teleconnection, we compute the correlation between the JJA ATL3 SST anomalies time-series and different atmospheric variables: precipitation and zonal winds at 850 and 200 hPa (Fig. 10). Compared to ERA5, EC-Earth3-HR shows a similar representation of convection over the tropical Atlantic and the Amazon basin, as illustrated by the significant positive correlations in precipitation and zonal winds at 850 hPa and significant negative correlations in the zonal winds at 200 hPa which correspond to a divergence zone. This convection area is a prerequisite for the connection between summer Atlantic Niño/a and ENSO (Park et al., 2023). EC-Earth3-SR also shows the same behaviour but the correlation values are clearly underestimated. The more realistic representation of the teleconnection pattern in EC-Earth3-HR is also shown in the western-to-central tropical Pacific, with a more realistic shape and statistical significance of the subsidence zone over the Maritime continent seen in the precipitation and zonal winds.
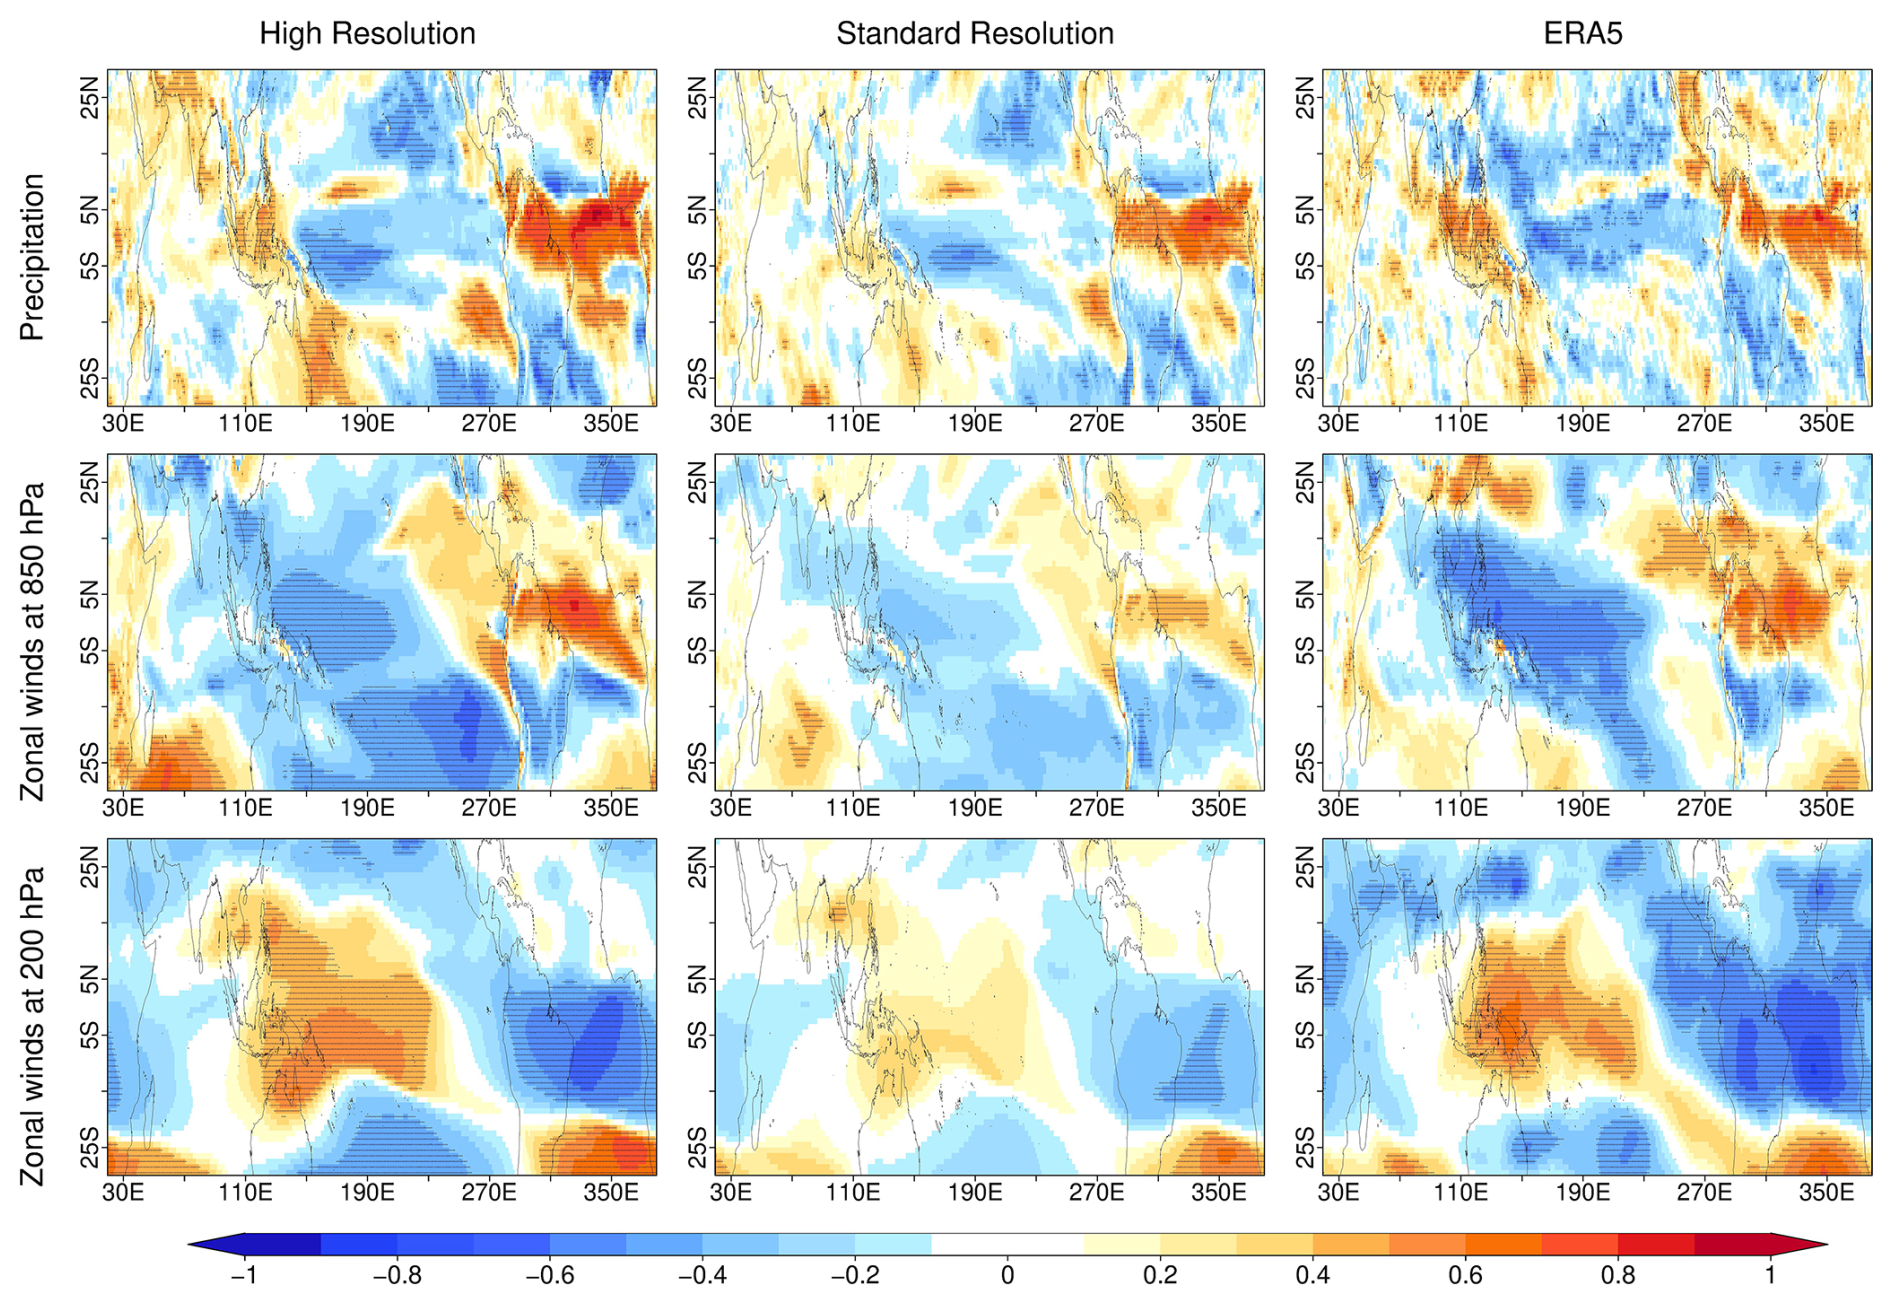
Figure 10Teleconnection between the JJA ATL3 SSTA anomalies and the JJA precipitation (first row), zonal winds at 850 hPa (middle row) and zonal winds at 200 hPa (bottom row) for EC-Earth3-HR (left), EC-Earth-SR (middle) and ERA5 (right). Dashes indicate that the values are statistically significant at the 95 % level.
This simulation closer to observations of the teleconnection between the Atlantic Niño/a and the following ENSO event in EC-Earth3-HR may be related to the higher horizontal resolution allowing orographic effect over the Maritime continent, contributing to the generation of a local Walker cell (Liu et al., 2023b). This potential effect of the horizontal resolution on the convection over the Maritime continent linked to the Atlantic-Pacific teleconnection requires further investigation and is beyond the scope of the study.
This study investigates and compares seasonal predictions with a high-resolution (HR) and a standard-resolution (SR) configuration of EC-Earth3. It focuses on the Tropics, and particularly on the predictive skill associated with ENSO, the main source of predictability at seasonal timescales. We analyze the differences in the predictive skill of the two different configurations, initialized in the same way but using two different horizontal resolutions. The SR and HR configurations are based on an atmospheric component, IFS, of ∼100 and ∼40 km of resolution, respectively, and on an ocean component, NEMO3.6, of ∼100 and ∼25 km respectively. We focus on the hindcast initialized in May of each year over the period 1990–2015 using 20 members.
The EC-Earth3-HR forecast system shows a small but statistically significant increase in predictive skill in the equatorial Pacific relative to EC-Earth3-SR. This modest improvement is consistent across regions (from the Western Equatorial Pacific to the canonical ENSO regions) and across variables (SST, zonal surface winds, precipitation, air surface temperature and mixed layer depth). We investigate in this paper several processes that can explain this higher predictive skill up to 8 months ahead. The differences between the two forecast systems can arise, among other things, from (1) the representation of physical processes that are no longer parametrized but resolved at the higher resolution, (2) differences in their initial conditions (IC) or (3) the refined orography resulting from the resolution enhancement, that can subsequently interact with atmospheric circulation and induce moisture convergence (Liu et al., 2023b). This last hypothesis cannot be investigated further, as it requires conducting sensitivity experiments in which the orography remains identical for both resolutions, which is beyond the scope of this paper. Regarding the differences in initialization, we use the same ERA5 IC for the atmosphere, but interpolated to the respective horizontal resolutions, which should have a minimum impact. The ocean IC are produced using the same ocean model but at different resolutions, nudged towards and forced by the same observation datasets but interpolated to the respective horizontal resolutions. The spread between the IC members is higher in the HR reconstructions than in the SR reconstruction and closer to the equivalent spread between members of ORAS5 (not shown), which can impact the prediction skill of the forecast systems. Finally, regarding the differences in the simulation of physical processes, certain processes that are no longer parametrized at the higher resolution can potentially improve the mean state and key atmospheric teleconnections, such as mesoscale ocean eddies and their interactions. In this perspective, we focus on two main aspects. The first one is the spatial representation of ENSO, which can be related to the mean state representation. The second one is related to atmospheric teleconnections with the Atlantic Niño/a region.
First, we show that in the WEP region, both systems lose their SST predictive skill rapidly but more drastically in EC-Earth3-SR. The poor skill in the WEP region is directly linked to a misrepresentation of ENSO influence, defined as the Niño3.4 region influence, as when its signal is removed from the WEP's SST variability, both forecast systems show significant skill levels in the region. This misrepresentation of ENSO's influence is linked to the overextended westward location of ENSO-related SST anomalies, a model error that is more pronounced in EC-Earth3-SR. Although these ENSO-related errors are present in other forecast systems and well documented (Newman and Sardeshmukh, 2017; Beverley et al., 2023), it is difficult to disentangle their ultimate cause, and in particular if it is an ocean, atmospheric or coupled systematic error of the model or just an initialisation shock response in one of the components. Beverley et al. (2023), using 11 different operational models, argued that forecast errors develop within days after initialisation and seem to develop first in the atmosphere before subsequently influencing SST and precipitation errors. In both configurations of the EC-Earth3 forecast system, the errors appear rapidly in the surface zonal winds and the mixed layer depth. Determining the origin of the errors would require further investigations using sensitivity experiments, which is beyond the scope of this study.
The poorest skill in EC-Earth3-SR compared to EC-Earth3-HR in the WEP region, associated with larger ENSO-related errors, seems linked to larger mean state biases, and in particular the “cold tongue bias”, a common bias in GCMs (Bellenger et al., 2014; Guilyardi et al., 2020). Several studies showed that using higher resolution models could reduce the cold bias of the cold tongue (Johnson et al., 2019; Wengel et al., 2021; Liu et al., 2023a; Yeager et al., 2023; Williams et al., 2024). In particular, Liu et al. (2023a) showed that the ENSO-related SST anomalies differences between SR and HR configurations are caused by differences in atmospheric convection related to surface zonal wind differences. The differences in atmospheric convection have an impact on important ENSO feedbacks, such as the Ekman feedback, the zonal advection feedback and the thermocline feedback, which play a key role in the growth rate of ENSO events (e.g. Jin and An, 1999). They suggested that these differences in ENSO-related variability, in SST, surface wind and convection, can arise from the mean state bias more pronounced in the SR models, with a westward extension of a colder bias in the tropical Pacific. In the case of the more pronounced cold mean state bias, the associated convection has to be located more to the west to react to the warm SST anomalies starting ENSO development. Indeed, the convection process requires an absolute SST threshold to happen, instead of an anomaly threshold (Johnson and Xie, 2010). The lower (higher) mean biases that improves (degrades) ENSO variability may explain the higher (lower) ENSO predictions in EC-Earth3-HR (EC-Earth3-SR). It remains to be assessed if similar improvements are consistently identified for HR versions in other forecast systems.
Finally, the stronger decrease of skill in EC-Earth3-SR is also likely related to a weaker air-sea coupling in EC-Earth3-SR than in EC-Earth3-HR, which prevents the model from simulating the correct ENSO development. Analysing the impact of the weak air-sea coupling alone in the predictions is beyond the scope of this study but is of particular importance not only for climate predictions but also for future scenario experiments.
The second studied mechanism is the Atlantic Niño teleconnection with the tropical Pacific. In EC-Earth3-HR, a more realistic simulation of the teleconnection leads to an increase in the predictive skill of ENSO compared to EC-Earth3-SR. We also note that the predictive skill in the Atlantic Niño region itself appears to be insensitive to model resolution, decreases rapidly after initialisation in both systems, and cannot explain the improved ENSO skill for EC-Earth3-HR. Improving the Atlantic variability and removing mean state biases is particularly important to improve Equatorial Atlantic (Dippe et al., 2018; Exarchou et al., 2021) and ENSO prediction (Exarchou et al., 2021). However, Jiang et al. (2023) argued that the Atlantic Niño teleconnection with ENSO could be just a statistical artifact due to ENSO's autocorrelation. The consistency and impact of the teleconnection signal require further investigation.
The low-frequency variability also impacts the predictability of different variables and regions. For instance, Lou et al. (2023) showed that, since 1950, ENSO forecast skill monotonically increased to reach high values in the late 20th century and started to decline in the last decades. San et al. (2024) showed that the central tropical Pacific is particularly sensitive to decadal internal variability linked to low-frequency oscillations such as the Tropical Pacific Decadal Variability (TPDV). The impact of these low-frequency variability features on the predictive skill cannot be evaluated in our relatively short seasonal forecasts but could be addressed in the new multi-year climate predictions that are being considered for the next phase of DCPP. These envisage substantially higher hindcast periods than the ones we considered in this study, long enough to include several phases of low frequency modes, as well as longer forecast horizons to assess if the added predictive value of high resolution persists after the first forecast year.
These new multi-annual DCPP predictions, with several start dates per year and covering a longer period than usual seasonal forecasts, will also enable a more detailed analysis of the impact of the mean state bias and its seasonal variation on the predicted development of ENSO events. Beverley et al. (2023) showed that, in the operational forecast systems they analysed, the ENSO-related errors are mainly driven by the seasonal cycle rather than the forecast lead time, a feature that can be analysed further with the proposed new-DCPP. Moreover, with the longer hindcast period, this analysis can be carried out by composites, for each type of ENSO event (El Niño, La Niña and neutral events), thanks to a larger number of samples. Indeed, one of the limitations of this study is that, through the use of linear regression, El Niño and La Niña events are considered as linearly opposed, a limitation that could be overcome by increasing the number of simulated events for each phase.
All in all, using higher resolution model components can improve the predictive capabilities of forecasting systems, as this is the case for the EC-Earth3 model for predictive skill of the tropical Pacific on a seasonal scale when initialized in May. However, the added value of resolution is less evident in other parts of the globe or when predictions are initialized in November. Indeed, for the November-initialized predictions, ENSO skill shows no statistically significant difference between the two configurations (Fig. S2 in the Supplement). The results of higher predictive skill with high resolution but depending on the season, region, and variables analysed, raises the question of the balance between benefits and challenges. Using a previous version of EC-Earth3, Haarsma et al. (2020) showed that increasing horizontal resolution does not result in a general improvement of the climate variability. However, the HR configuration of EC-Earth3 is 16–20 times more expensive in terms of computing resources than the SR configuration, to which must be added the storage and post-processing capacities of the associated heavy outputs. Conversely, standard resolution simulations are more economical to produce and store, which facilitates and accelerates the production and analysis of long and large ensembles of simulations. These can be leveraged to test model developments, refine the model tuning, produce sensitivity simulations designed to address specific scientific questions, constrain more accurately the predictable signals, and increase model complexity at a lower cost, all with the aim of improving our understanding of the climate system. The choice of modelling strategy remains dependent on the scientific question and the intended application, as all strategies are complementary (Bordoni et al., 2025; Baldissera Pacchetti et al., 2024; Katzav and Parker, 2015).
In conclusion, this study highlights the key role of model errors, both in terms of variability and mean state, in predictive skill in the equatorial Pacific of both forecast systems. Improving the relationship between ENSO and the WEP regions, whose erroneous simulation is related to the erroneous westward extension of ENSO-related variability, could improve predictive skill in the western Pacific and over the maritime continent, a key region for ENSO-related air-sea teleconnections (Liu et al., 2023a; Wu et al., 2021; Williams et al., 2024). At the same time, improving teleconnection between the Atlantic Niño and the equatorial Pacific could improve the prediction of ENSO events. A better understanding of the sources and development of the models' errors is essential to improving predictive systems, and this regardless of the horizontal resolution, since most of the biases persist in high resolution, even if some have been improved. The new multi-annual DCPP hindcasts could contribute to fill this gap.
Data from the EC-Earth3-SR and EC-Earth3-HR seasonal prediction simulations, as well as the ocean and sea-ice reconstructions used to initialise the prediction simulations, are available upon request.
ERA5 data are available via https://cds.climate.copernicus.eu/datasets/reanalysis-era5-complete (last access: 8 June 2026). ORAS5 data can be downloaded from https://cds.climate.copernicus.eu/datasets/reanalysis-oras5 (last access: 8 June 2026). EN.4.2.2 data were obtained from https://www.metoffice.gov.uk/hadobs/en4/ (last access: 8 June 2026) and are © British Crown Copyright, Met Office, 2013, provided under a Non-Commercial Government Licence http://www.nationalarchives.gov.uk/doc/non-commercial-government-licence/version/2/ (last access: 8 June 2026). ESA SST CCI v2.1 level 4 data can be downloaded via https://catalogue.ceda.ac.uk/uuid/62c0f97b1eac4e0197a674870afe1ee6/ (last access: 8 June 2026).
EC-Earth: The EC-Earth model is restricted to institutes that have signed a memorandum of understanding or letter of intent with the EC-Earth consortium and a software license agreement with the ECMWF. Confidential access to the code and to the data used to produce the simulations described in this paper can be granted for editors and reviewers; please use the contact form at http://www.ec-earth.org/about/contact (last access: 8 June 2026).
Post-processing analysis: Ocean diagnostics have been computed using Earthdiagnostics, a Python-based package developed at the BSC (https://earth.bsc.es/gitlab/es/earthdiagnostics (last access: 8 June 2026), BSC-CNS and Vegas-Regidor, 2020). For data loading, post-processing and calculation of verification metrics, the startR (https://cran.r-project.org/web/packages/startR/index.html (last access: 8 June 2026), Manubens et al., 2024, v2.3.1), s2dv (https://cran.r-project.org/web/packages/s2dv/index.html (last access: 8 June 2026), Manubens et al., 2018; BSC-CNS et al., 2024a, v2.0.0) and ClimProjDiags (https://cran.r-project.org/web/packages/ClimProjDiags/index.html (last access: 8 June 2026), BSC-CNS et al., 2024b, v0.3.3) R libraries have been used. The codes used for the results and figures are available upon request.
The supplement related to this article is available online at https://doi.org/10.5194/esd-17-717-2026-supplement.
AC led the analysis. AC, PO, RB, and FDR designed the experiments and AC carried them out. AC, VL, RB, and FLM contributed to creating the initial conditions for the seasonal forecast systems. AC, CDT, and RB developed the codes of analysis. PO, MD, and FDR contributed to the interpretation of the results. AC prepared the manuscript with contributions from all co-authors.
The contact author has declared that none of the authors has any competing interests.
Publisher's note: Copernicus Publications remains neutral with regard to jurisdictional claims made in the text, published maps, institutional affiliations, or any other geographical representation in this paper. The authors bear the ultimate responsibility for providing appropriate place names. Views expressed in the text are those of the authors and do not necessarily reflect the views of the publisher.
The authors acknowledge Eric Ferrer, Miguel Castrillo, Pierre-Antoine Bretonnière for their technical support with the model and the workflow manager; Juan Acosta-Navarro and Etienne Tourigny for their help in the development of the initialisation protocol; An-Chi Ho, Victòria Agudetse Roures and Núria Pérez-Zanon for their help and support in the use of the R packages; Eneko Martín and Alba Santos Espeso for their help in the development of the mixed layer depth script; Saskia Loosveldt-Tomas for her support in using the Earthdiagnostic tool; Margarida Samso Cabre for her help to retrieve the data; Paloma Trascasa-Castro, Yohan Ruprich-Robert, Verónica Martín Gómez and Ángel G. Muñoz for their scientific contribution to the development of this study. The EC-Earth3 simulations and data handling were performed using the internal computing resources available at MareNostrum and additional resources from the Red Española de Supercomputación (RES-AECT-2021-2-0028 and RES-AECT-2022-2-0005 projects). Acknowledgement is also made for the use of ECMWF's computing and archive facilities in this research via special projects. The authors acknowledge the technical support provided by Barcelona Supercomputing Center and the Computational Earth Sciences group of the Earth Sciences department. We also want to thank the reviewers for their constructive comments.
This research has been supported by the HORIZON EUROPE ASPECT (grant no. 101081460), the “SupercompuTing And Related applicationS Fellows Program” (STARS) programme, part of the COFUND call of the H2020 Marie Skłodowska-Curie Actions (grant no. 754433) and the Departament de Recerca i Universitats de la Generalitat de Catalunya for the Climate Variability and Change (CVC) Research Group (reference: 2021 SGR 00786).
This paper was edited by Claudia Timmreck and reviewed by two anonymous referees.
Acosta, M. C., Palomas, S., and Tourigny, E.: Balancing EC-Earth3 improving the performance of EC-Earth CMIP6 configurations by minimizing the coupling cost, Earth and Space Science, 10, e2023EA002912, https://doi.org/10.1029/2023EA002912, 2023. a
Baldissera Pacchetti, M., Jebeile, J., and Thompson, E.: For a pluralism of climate modeling strategies, B. Am. Meteorol. Soc., 105, E1350–E1364, https://doi.org/10.1175/BAMS-D-23-0169.1, 2024. a
Balsamo, G., Beljaars, A., Scipal, K., Viterbo, P., Van Den Hurk, B., Hirschi, M., and Betts, A. K.: A revised hydrology for the ECMWF model: verification from field site to terrestrial water storage and impact in the integrated forecast system, J. Hydrometeorol., 10, 623–643, https://doi.org/10.1175/2008JHM1068.1, 2009. a
Barnston, A. G., Tippett, M. K., L'Heureux, M. L., Li, S., and DeWitt, D. G.: Skill of real-time seasonal ENSO model predictions during 2002–11: is our capability increasing?, B. Am. Meteorol. Soc., 93, 631–651, https://doi.org/10.1175/BAMS-D-11-00111.1, 2012. a
Barnston, A. G., Tippett, M. K., Ranganathan, M., and L'Heureux, M. L.: Deterministic skill of ENSO predictions from the North American multimodel ensemble, Clim. Dynam., 53, 7215–7234, https://doi.org/10.1007/s00382-017-3603-3, 2019. a
Bellenger, H., Guilyardi, E., Leloup, J., Lengaigne, M., and Vialard, J.: ENSO representation in climate models: from CMIP3 to CMIP5, Clim. Dynam., 42, 1999–2018, https://doi.org/10.1007/s00382-013-1783-z, 2014. a, b
Beverley, J. D., Newman, M., and Hoell, A.: Rapid development of systematic ENSO-related seasonal forecast errors, Geophys. Res. Lett., 50, e2022GL102249, https://doi.org/10.1029/2022GL102249, 2023. a, b, c, d, e, f, g, h, i, j
Bilbao, R., Wild, S., Ortega, P., Acosta-Navarro, J., Arsouze, T., Bretonnière, P.-A., Caron, L.-P., Castrillo, M., Cruz-García, R., Cvijanovic, I., Doblas-Reyes, F. J., Donat, M., Dutra, E., Echevarría, P., Ho, A.-C., Loosveldt-Tomas, S., Moreno-Chamarro, E., Pérez-Zanon, N., Ramos, A., Ruprich-Robert, Y., Sicardi, V., Tourigny, E., and Vegas-Regidor, J.: Assessment of a full-field initialized decadal climate prediction system with the CMIP6 version of EC-Earth, Earth Syst. Dynam., 12, 173–196, https://doi.org/10.5194/esd-12-173-2021, 2021. a
Bojovic, D., Nicodemou, A., St.Clair, A. L., Christel, I., and Doblas-Reyes, F. J.: Exploring the landscape of seasonal forecast provision by global producing centres, Climatic Change, 172, 8, https://doi.org/10.1007/s10584-022-03350-x, 2022. a
Bordoni, S., Kang, S. M., Shaw, T. A., Simpson, I. R., and Zanna, L.: The futures of climate modeling, npj Clim. Atmos. Sci., 8, 99, https://doi.org/10.1038/s41612-025-00955-8, 2025. a
BSC-CNS, Ho, A.-C., and Perez-Zanon, N.: S2dv: A Set of Common Tools for Seasonal to Decadal Verification, R package version 2.0.0 [software], https://doi.org/10.32614/CRAN.package.s2dv, 2024a. a, b
BSC-CNS, Perez-Zanon, N., and Hunter, A.: ClimProjDiags: Set of Tools to Compute Various Climate Indices, BCS-CNS [software], https://doi.org/10.32614/CRAN.package.ClimProjDiags, 2024b. a, b
Callahan, C. W. and Mankin, J. S.: Persistent effect of El Niño on global economic growth, Science, 380, 1064–1069, https://doi.org/10.1126/science.adf2983, 2023. a
Chang, P., Zhang, S., Danabasoglu, G., Yeager, S. G., Fu, H., Wang, H., Castruccio, F. S., Chen, Y., Edwards, J., Fu, D., Jia, Y., Laurindo, L. C., Liu, X., Rosenbloom, N., Small, R. J., Xu, G., Zeng, Y., Zhang, Q., Bacmeister, J., Bailey, D. A., Duan, X., DuVivier, A. K., Li, D., Li, Y., Neale, R., Stössel, A., Wang, L., Zhuang, Y., Baker, A., Bates, S., Dennis, J., Diao, X., Gan, B., Gopal, A., Jia, D., Jing, Z., Ma, X., Saravanan, R., Strand, W. G., Tao, J., Yang, H., Wang, X., Wei, Z., and Wu, L.: An unprecedented set of high-resolution Earth system simulations for understanding multiscale interactions in climate variability and change, J. Adv. Model. Earth Sy., 12, e2020MS002298, https://doi.org/10.1029/2020MS002298, 2020. a
Chelton, D. B. and Risien, C. M.: Zonal and Meridional Discontinuities and Other Issues with the HadISST1.1 Dataset, ResearchGate, Tech. Rep., https://doi.org/10.13140/RG.2.1.4503.0168, 2016. a
Counillon, F., Keenlyside, N., Toniazzo, T., Koseki, S., Demissie, T., Bethke, I., and Wang, Y.: Relating model bias and prediction skill in the equatorial Atlantic, Clim. Dynam., 56, 2617–2630, https://doi.org/10.1007/s00382-020-05605-8, 2021. a
Craig, A., Valcke, S., and Coquart, L.: Development and performance of a new version of the OASIS coupler, OASIS3-MCT_3.0, Geosci. Model Dev., 10, 3297–3308, https://doi.org/10.5194/gmd-10-3297-2017, 2017. a
Damette, O., Mathonnat, C., and Thavard, J.: Climate and sovereign risk: the Latin American experience with strong ENSO events, World Dev., 178, 106590, https://doi.org/10.1016/j.worlddev.2024.106590, 2024. a
DiNezio, P. N., Deser, C., Okumura, Y., and Karspeck, A.: Predictability of 2-year La Niña events in a coupled general circulation model, Clim. Dynam., 49, 4237–4261, https://doi.org/10.1007/s00382-017-3575-3, 2017. a
Ding, H., Keenlyside, N. S., and Latif, M.: Impact of the equatorial Atlantic on the El Niño southern oscillation, Clim. Dynam., 38, 1965–1972, https://doi.org/10.1007/s00382-011-1097-y, 2012. a
Ding, H., Greatbatch, R. J., Latif, M., and Park, W.: The impact of sea surface temperature bias on equatorial Atlantic interannual variability in partially coupled model experiments, Geophys. Res. Lett., 42, 5540–5546, https://doi.org/10.1002/2015GL064799, 2015. a
Ding, H., Newman, M., Alexander, M. A., and Wittenberg, A. T.: Relating CMIP5 model biases to seasonal forecast skill in the tropical Pacific, Geophys. Res. Lett., 47, e2019GL086765, https://doi.org/10.1029/2019GL086765, 2020. a
Dippe, T., Greatbatch, R. J., and Ding, H.: On the relationship between Atlantic Niño variability and ocean dynamics, Clim. Dynam., 51, 597–612, https://doi.org/10.1007/s00382-017-3943-z, 2018. a
Doblas-Reyes, F. J., García-Serrano, J., Lienert, F., Biescas, A. P., and Rodrigues, L. R. L.: Seasonal climate predictability and forecasting: status and prospects, WIREs Clim. Change, 4, 245–268, https://doi.org/10.1002/wcc.217, 2013. a
Döscher, R., Acosta, M., Alessandri, A., Anthoni, P., Arsouze, T., Bergman, T., Bernardello, R., Boussetta, S., Caron, L.-P., Carver, G., Castrillo, M., Catalano, F., Cvijanovic, I., Davini, P., Dekker, E., Doblas-Reyes, F. J., Docquier, D., Echevarria, P., Fladrich, U., Fuentes-Franco, R., Gröger, M., v. Hardenberg, J., Hieronymus, J., Karami, M. P., Keskinen, J.-P., Koenigk, T., Makkonen, R., Massonnet, F., Ménégoz, M., Miller, P. A., Moreno-Chamarro, E., Nieradzik, L., van Noije, T., Nolan, P., O'Donnell, D., Ollinaho, P., van den Oord, G., Ortega, P., Prims, O. T., Ramos, A., Reerink, T., Rousset, C., Ruprich-Robert, Y., Le Sager, P., Schmith, T., Schrödner, R., Serva, F., Sicardi, V., Sloth Madsen, M., Smith, B., Tian, T., Tourigny, E., Uotila, P., Vancoppenolle, M., Wang, S., Wårlind, D., Willén, U., Wyser, K., Yang, S., Yepes-Arbós, X., and Zhang, Q.: The EC-Earth3 Earth system model for the Coupled Model Intercomparison Project 6, Geosci. Model Dev., 15, 2973–3020, https://doi.org/10.5194/gmd-15-2973-2022, 2022. a, b, c
Dunstone, N., Smith, D., Yeager, S., Danabasoglu, G., Monerie, P.-A., Hermanson, L., Eade, R., Ineson, S., Robson, J., Scaife, A., and Ren, H.-L.: Skilful interannual climate prediction from two large initialised model ensembles, Environ. Res. Lett., 15, 094083, https://doi.org/10.1088/1748-9326/ab9f7d, 2020. a
Exarchou, E., Ortega, P., Rodríguez-Fonseca, B., Losada, T., Polo, I., and Prodhomme, C.: Impact of equatorial Atlantic variability on ENSO predictive skill, Nat. Commun., 12, 1612, https://doi.org/10.1038/s41467-021-21857-2, 2021. a, b, c, d, e, f, g
Eyring, V., Bony, S., Meehl, G. A., Senior, C. A., Stevens, B., Stouffer, R. J., and Taylor, K. E.: Overview of the Coupled Model Intercomparison Project Phase 6 (CMIP6) experimental design and organization, Geosci. Model Dev., 9, 1937–1958, https://doi.org/10.5194/gmd-9-1937-2016, 2016. a
García-Serrano, J., Losada, T., Rodríguez-Fonseca, B., and Polo, I.: Tropical Atlantic variability modes (1979–2002). Part II: Time-evolving atmospheric circulation related to SST-forced tropical convection, J. Climate, 21, 6476–6497, https://doi.org/10.1175/2008JCLI2191.1, 2008. a
Good, S. A., Martin, M. J., and Rayner, N. A.: EN4: quality controlled ocean temperature and salinity profiles and monthly objective analyses with uncertainty estimates, JGR Oceans, 118, 6704–6716, https://doi.org/10.1002/2013JC009067, 2013. a, b
Gouretski, V. and Reseghetti, F.: On depth and temperature biases in bathythermograph data: development of a new correction scheme based on analysis of a global ocean database, Deep-Sea Res. Pt. I, 57, 812–833, https://doi.org/10.1016/j.dsr.2010.03.011, 2010. a
Guilyardi, E., Capotondi, A., Lengaigne, M., Thual, S., and Wittenberg, A. T.: ENSO modeling: history, progress, and challenges, in: Geophysical Monograph Series, edited by: McPhaden, M. J., Santoso, A., and Cai, W., Wiley, 1st edn., https://doi.org/10.1002/9781119548164.ch9, 199–226, 2020. a, b
Haarsma, R., Acosta, M., Bakhshi, R., Bretonnière, P.-A., Caron, L.-P., Castrillo, M., Corti, S., Davini, P., Exarchou, E., Fabiano, F., Fladrich, U., Fuentes Franco, R., García-Serrano, J., von Hardenberg, J., Koenigk, T., Levine, X., Meccia, V. L., van Noije, T., van den Oord, G., Palmeiro, F. M., Rodrigo, M., Ruprich-Robert, Y., Le Sager, P., Tourigny, E., Wang, S., van Weele, M., and Wyser, K.: HighResMIP versions of EC-Earth: EC-Earth3P and EC-Earth3P-HR – description, model computational performance and basic validation, Geosci. Model Dev., 13, 3507–3527, https://doi.org/10.5194/gmd-13-3507-2020, 2020. a, b
Ham, Y.-G. and Kug, J.-S.: How well do current climate models simulate two types of El Nino?, Clim. Dynam., 39, 383–398, https://doi.org/10.1007/s00382-011-1157-3, 2012. a
Ham, Y.-G. and Kug, J.-S.: Improvement of ENSO simulation based on intermodel diversity, J. Climate, 28, 998–1015, https://doi.org/10.1175/JCLI-D-14-00376.1, 2015. a
Hermanson, L., Smith, D., Seabrook, M., Bilbao, R., Doblas-Reyes, F., Tourigny, E., Lapin, V., Kharin, V. V., Merryfield, W. J., Sospedra-Alfonso, R., Athanasiadis, P., Nicoli, D., Gualdi, S., Dunstone, N., Eade, R., Scaife, A., Collier, M., O'Kane, T., Kitsios, V., Sandery, P., Pankatz, K., Früh, B., Pohlmann, H., Müller, W., Kataoka, T., Tatebe, H., Ishii, M., Imada, Y., Kruschke, T., Koenigk, T., Karami, M. P., Yang, S., Tian, T., Zhang, L., Delworth, T., Yang, X., Zeng, F., Wang, Y., Counillon, F., Keenlyside, N., Bethke, I., Lean, J., Luterbacher, J., Kolli, R. K., and Kumar, A.: WMO global annual to decadal climate update: a prediction for 2021–25, B. Am. Meteorol. Soc., 103, E1117–E1129, https://doi.org/10.1175/BAMS-D-20-0311.1, 2022. a
Hersbach, H., Bell, B., Berrisford, P., Hirahara, S., Horányi, A., Muñoz-Sabater, J., Nicolas, J., Peubey, C., Radu, R., Schepers, D., Simmons, A., Soci, C., Abdalla, S., Abellan, X., Balsamo, G., Bechtold, P., Biavati, G., Bidlot, J., Bonavita, M., De Chiara, G., Dahlgren, P., Dee, D., Diamantakis, M., Dragani, R., Flemming, J., Forbes, R., Fuentes, M., Geer, A., Haimberger, L., Healy, S., Hogan, R. J., Hólm, E., Janisková, M., Keeley, S., Laloyaux, P., Lopez, P., Lupu, C., Radnoti, G., De Rosnay, P., Rozum, I., Vamborg, F., Villaume, S., and Thépaut, J.-N.: The ERA5 global reanalysis, Q. J. Roy. Meteor. Soc., 146, 1999–2049, https://doi.org/10.1002/qj.3803, 2020. a, b
Hewitt, H. T., Roberts, M., Mathiot, P., Biastoch, A., Blockley, E., Chassignet, E. P., Fox-Kemper, B., Hyder, P., Marshall, D. P., Popova, E., Treguier, A.-M., Zanna, L., Yool, A., Yu, Y., Beadling, R., Bell, M., Kuhlbrodt, T., Arsouze, T., Bellucci, A., Castruccio, F., Gan, B., Putrasahan, D., Roberts, C. D., Van Roekel, L., and Zhang, Q.: Resolving and parameterising the ocean mesoscale in Earth system models, Curr. Clim. Change Rep., 6, 137–152, https://doi.org/10.1007/s40641-020-00164-w, 2020. a
Jiang, F., Zhang, W., Jin, F.-F., Stuecker, M. F., Timmermann, A., McPhaden, M. J., Boucharel, J., and Wittenberg, A. T.: Resolving the tropical Pacific/Atlantic interaction conundrum, Geophys. Res. Lett., 50, e2023GL103777, https://doi.org/10.1029/2023GL103777, 2023. a
Jiang, W., Huang, P., Huang, G., and Ying, J.: Origins of the excessive westward extension of ENSO SST simulated in CMIP5 and CMIP6 models, J. Climate, 34, 2839–2851, https://doi.org/10.1175/JCLI-D-20-0551.1, 2021. a, b, c
Jin, F.-F. and An, S.-I.: Thermocline and zonal advective feedbacks within the equatorial ocean recharge oscillator model for ENSO, Geophys. Res. Lett., 26, 2989–2992, https://doi.org/10.1029/1999GL002297, 1999. a
Johnson, N. C. and Xie, S.-P.: Changes in the sea surface temperature threshold for tropical convection, Nat. Geosci., 3, 842–845, https://doi.org/10.1038/ngeo1008, 2010. a
Johnson, S. J., Stockdale, T. N., Ferranti, L., Balmaseda, M. A., Molteni, F., Magnusson, L., Tietsche, S., Decremer, D., Weisheimer, A., Balsamo, G., Keeley, S. P. E., Mogensen, K., Zuo, H., and Monge-Sanz, B. M.: SEAS5: the new ECMWF seasonal forecast system, Geosci. Model Dev., 12, 1087–1117, https://doi.org/10.5194/gmd-12-1087-2019, 2019. a, b, c, d
Karami, M. P., Koenigk, T., Wang, S., Navarro Labastida, R., Kruschke, T., Carreric, A., Ortega, P., Wyser, K., Fuentes Franco, R., de Boer, A. M., Sicard, M., and Aldama Campino, A.: Historical Climate and Future Projection in the North Atlantic and Arctic: Insights from EC-Earth3 High-Resolution Simulations, EGUsphere [preprint], https://doi.org/10.5194/egusphere-2025-2653, 2025. a
Katzav, J. and Parker, W. S.: The future of climate modeling, Climatic Change, 132, 475–487, https://doi.org/10.1007/s10584-015-1435-x, 2015. a
Keenlyside, N. S. and Latif, M.: Understanding equatorial Atlantic interannual variability, J. Climate, 20, 131–142, https://doi.org/10.1175/JCLI3992.1, 2007. a, b
Keenlyside, N. S., Ding, H., and Latif, M.: Potential of equatorial Atlantic variability to enhance El Niño prediction, Geophys. Res. Lett., 40, 2278–2283, https://doi.org/10.1002/grl.50362, 2013. a
Kobayashi, S., Ota, Y., Harada, Y., Ebita, A., Moriya, M., Onoda, H., Onogi, K., Kamahori, H., Kobayashi, C., Endo, H., Miyaoka, K., and Takahashi, K.: The JRA-55 reanalysis: general specifications and basic characteristics, J. Meteorol. Soc. Jpn., 93, 5–48, https://doi.org/10.2151/jmsj.2015-001, 2015. a
Kumar, A., Hu, Z.-Z., Jha, B., and Peng, P.: Estimating ENSO predictability based on multi-model hindcasts, Clim. Dynam., 48, 39–51, https://doi.org/10.1007/s00382-016-3060-4, 2017. a
Lenssen, N., DiNezio, P., Goddard, L., Deser, C., Kushnir, Y., Mason, S. J., Newman, M., and Okumura, Y.: Strong El Niño events lead to robust multi-year ENSO predictability, Geophys. Res. Lett., 51, e2023GL106988, https://doi.org/10.1029/2023GL106988, 2024. a
Lenssen, N. J. L., Goddard, L., and Mason, S.: Seasonal forecast skill of ENSO teleconnection maps, Weather Forecast., 35, 2387–2406, https://doi.org/10.1175/WAF-D-19-0235.1, 2020. a
L'Heureux, M. L., Levine, A. F. Z., Newman, M., Ganter, C., Luo, J.-J., Tippett, M. K., and Stockdale, T. N.: ENSO prediction, in: Geophysical Monograph Series, edited by: McPhaden, M. J., Santoso, A., and Cai, W., Wiley, 1st edn., https://doi.org/10.1002/9781119548164.ch10, 227–246, 2020. a, b
Liu, B., Gan, B., Cai, W., Wu, L., Geng, T., Wang, H., Wang, S., Jing, Z., and Jia, F.: Will increasing climate model resolution be beneficial for ENSO simulation?, Geophys. Res. Lett., 49, e2021GL096932, https://doi.org/10.1029/2021GL096932, 2022. a
Liu, J., Yuan, C., and Luo, J.-J.: Impacts of model resolution on responses of western North Pacific tropical cyclones to ENSO in the HighResMIP-PRIMAVERA ensemble, Front. Earth Sci., 11, 1169885, https://doi.org/10.3389/feart.2023.1169885, 2023a. a, b, c, d, e
Liu, S., Chang, P., Wan, X., Yeager, S. G., and Richter, I.: Role of the maritime continent in the remote influence of Atlantic Niño on the Pacific, Nat. Commun., 14, 3327, https://doi.org/10.1038/s41467-023-39036-w, 2023b. a, b, c
Liu, Y., Donat, M. G., England, M. H., Alexander, L. V., Hirsch, A. L., and Delgado-Torres, C.: Enhanced multi-year predictability after El Niño and La Niña events, Nat. Commun., 14, 6387, https://doi.org/10.1038/s41467-023-42113-9, 2023c. a
Lou, J., Newman, M., and Hoell, A.: Multi-decadal variation of ENSO forecast skill since the Late 1800s, npj Clim. Atmos. Sci., 6, 89, https://doi.org/10.1038/s41612-023-00417-z, 2023. a, b
Madec, G., Bourdallé-Badie, R., Pierre-Antoine Bouttier, Bricaud, C., Bruciaferri, D., Calvert, D., Chanut, J., Clementi, E., Coward, A., Delrosso, D., Ethé, C., Flavoni, S., Graham, T., Harle, J., Iovino, D., Lea, D., Lévy, C., Lovato, T., Martin, N., Masson, S., Mocavero, S., Paul, J., Rousset, C., Storkey, D., Storto, A., and Vancoppenolle, M.: NEMO Ocean Engine, Zenodo [code], https://doi.org/10.5281/ZENODO.3248739, 2017. a
Mahajan, S., Evans, K. J., Branstetter, M. L., and Tang, Q.: Model resolution sensitivity of the simulation of North Atlantic oscillation teleconnections to precipitation extremes, JGR Atmospheres, 123, https://doi.org/10.1029/2018JD028594, 2018. a
Mahajan, S., Tang, Q., Keen, N. D., Golaz, J.-C., and Van Roekel, L. P.: Simulation of ENSO teleconnections to precipitation extremes over the United States in the high-resolution version of E3SM, J. Climate, 35, 3371–3393, https://doi.org/10.1175/JCLI-D-20-1011.1, 2022. a
Manubens, N., Caron, L.-P., Hunter, A., Bellprat, O., Exarchou, E., Fučkar, N. S., Garcia-Serrano, J., Massonnet, F., Ménégoz, M., Sicardi, V., Batté, L., Prodhomme, C., Torralba, V., Cortesi, N., Mula-Valls, O., Serradell, K., Guemas, V., and Doblas-Reyes, F. J.: An R package for climate forecast verification, Environ. Modell. Softw., 103, 29–42, https://doi.org/10.1016/j.envsoft.2018.01.018, 2018. a, b
Manubens, N., Ho, A.-C., Perez-Zanon, N., and BSC-CNS: startR: Automatically Retrieve Multidimensional Distributed Data Sets, R package version 2.3.1 [software], https://doi.org/10.32614/CRAN.package.startR, 2024. a, b
Manubens-Gil, D., Vegas-Regidor, J., Prodhomme, C., Mula-Valls, O., and Doblas-Reyes, F. J.: Seamless management of ensemble climate prediction experiments on HPC platforms, in: 2016 International Conference on High Performance Computing & Simulation (HPCS), IEEE, Innsbruck, Austria, https://doi.org/10.1109/HPCSim.2016.7568429, 895–900, 2016. a
Mariotti, A., Ruti, P. M., and Rixen, M.: Progress in subseasonal to seasonal prediction through a joint weather and climate community effort, npj Clim. Atmos. Sci., 1, 4, https://doi.org/10.1038/s41612-018-0014-z, 2018. a
Meehl, G. A., Richter, J. H., Teng, H., Capotondi, A., Cobb, K., Doblas-Reyes, F., Donat, M. G., England, M. H., Fyfe, J. C., Han, W., Kim, H., Kirtman, B. P., Kushnir, Y., Lovenduski, N. S., Mann, M. E., Merryfield, W. J., Nieves, V., Pegion, K., Rosenbloom, N., Sanchez, S. C., Scaife, A. A., Smith, D., Subramanian, A. C., Sun, L., Thompson, D., Ummenhofer, C. C., and Xie, S.-P.: Initialized Earth system prediction from subseasonal to decadal timescales, Nat. Rev. Earth Environ., 2, 340–357, https://doi.org/10.1038/s43017-021-00155-x, 2021. a
Merchant, C. J., Embury, O., Bulgin, C. E., Block, T., Corlett, G. K., Fiedler, E., Good, S. A., Mittaz, J., Rayner, N. A., Berry, D., Eastwood, S., Taylor, M., Tsushima, Y., Waterfall, A., Wilson, R., and Donlon, C.: Satellite-based time-series of sea-surface temperature since 1981 for climate applications, Sci. Data, 6, 223, https://doi.org/10.1038/s41597-019-0236-x, 2019. a
Merryfield, W. J., Baehr, J., Batté, L., Becker, E. J., Butler, A. H., Coelho, C. A. S., Danabasoglu, G., Dirmeyer, P. A., Doblas-Reyes, F. J., Domeisen, D. I. V., Ferranti, L., Ilynia, T., Kumar, A., Müller, W. A., Rixen, M., Robertson, A. W., Smith, D. M., Takaya, Y., Tuma, M., Vitart, F., White, C. J., Alvarez, M. S., Ardilouze, C., Attard, H., Baggett, C., Balmaseda, M. A., Beraki, A. F., Bhattacharjee, P. S., Bilbao, R., De Andrade, F. M., DeFlorio, M. J., Díaz, L. B., Ehsan, M. A., Fragkoulidis, G., Gonzalez, A. O., Grainger, S., Green, B. W., Hell, M. C., Infanti, J. M., Isensee, K., Kataoka, T., Kirtman, B. P., Klingaman, N. P., Lee, J.-Y., Mayer, K., McKay, R., Mecking, J. V., Miller, D. E., Neddermann, N., Justin Ng, C. H., Ossó, A., Pankatz, K., Peatman, S., Pegion, K., Perlwitz, J., Recalde-Coronel, G. C., Reintges, A., Renkl, C., Solaraju-Murali, B., Spring, A., Stan, C., Sun, Y. Q., Tozer, C. R., Vigaud, N., Woolnough, S., and Yeager, S.: Current and emerging developments in subseasonal to decadal prediction, B. Am. Meteorol. Soc., 101, E869–E896, https://doi.org/10.1175/BAMS-D-19-0037.1, 2020. a, b, c, d
Moon, J.-Y., Streffing, J., Lee, S.-S., Semmler, T., Andrés-Martínez, M., Chen, J., Cho, E.-B., Chu, J.-E., Franzke, C., Gärtner, J. P., Ghosh, R., Hegewald, J., Hong, S., Koldunov, N., Lee, J.-Y., Lin, Z., Liu, C., Loza, S., Park, W., Roh, W., Sein, D. V., Sharma, S., Sidorenko, D., Son, J.-H., Stuecker, M. F., Wang, Q., Yi, G., Zapponini, M., Jung, T., and Timmermann, A.: Earth’s future climate and its variability simulated at 9 km global resolution, EGUsphere [preprint], https://doi.org/10.5194/egusphere-2024-2491, 2024. a
Moreno-Chamarro, E., Caron, L.-P., Loosveldt Tomas, S., Vegas-Regidor, J., Gutjahr, O., Moine, M.-P., Putrasahan, D., Roberts, C. D., Roberts, M. J., Senan, R., Terray, L., Tourigny, E., and Vidale, P. L.: Impact of increased resolution on long-standing biases in HighResMIP-PRIMAVERA climate models, Geosci. Model Dev., 15, 269–289, https://doi.org/10.5194/gmd-15-269-2022, 2022. a
Newman, M. and Sardeshmukh, P. D.: Are we near the predictability limit of tropical Indo-Pacific sea surface temperatures?, Geophys. Res. Lett., 44, 8520–8529, https://doi.org/10.1002/2017GL074088, 2017. a, b, c
Park, J.-H., Kug, J.-S., Yang, Y.-M., Sung, M.-K., Kim, S., Kim, H.-J., Park, H.-J., and An, S.-I.: Distinct decadal modulation of Atlantic-Niño influence on ENSO, npj Clim. Atmos. Sci., 6, 105, https://doi.org/10.1038/s41612-023-00429-9, 2023. a, b
Patrizio, C. R., Athanasiadis, P. J., Frankignoul, C., Iovino, D., Masina, S., Famooss Paolini, L., and Gualdi, S.: Improved extratropical North Atlantic atmosphere–ocean variability with increasing ocean model resolution, J. Climate, 36, 8403–8424, https://doi.org/10.1175/JCLI-D-23-0230.1, 2023. a, b
Planton, Y. Y., Guilyardi, E., Wittenberg, A. T., Lee, J., Gleckler, P. J., Bayr, T., McGregor, S., McPhaden, M. J., Power, S., Roehrig, R., Vialard, J., and Voldoire, A.: Evaluating climate models with the CLIVAR 2020 ENSO metrics package, B. Am. Meteorol. Soc., 102, E193–E217, https://doi.org/10.1175/BAMS-D-19-0337.1, 2021. a, b
Prodhomme, C., Batté, L., Massonnet, F., Davini, P., Bellprat, O., Guemas, V., and Doblas-Reyes, F. J.: Benefits of increasing the model resolution for the seasonal forecast quality in EC-Earth, J. Climate, 29, 9141–9162, https://doi.org/10.1175/JCLI-D-16-0117.1, 2016. a, b
Rayner, N. A., Parker, D. E., Horton, E. B., Folland, C. K., Alexander, L. V., Rowell, D. P., Kent, E. C., and Kaplan, A.: Global analyses of sea surface temperature, sea ice, and night marine air temperature since the late nineteenth century, J. Geophys. Res., 108, 2002JD002670, https://doi.org/10.1029/2002JD002670, 2003. a
Ren, H.-L., Scaife, A. A., Dunstone, N., Tian, B., Liu, Y., Ineson, S., Lee, J.-Y., Smith, D., Liu, C., Thompson, V., Vellinga, M., and MacLachlan, C.: Seasonal predictability of winter ENSO types in operational dynamical model predictions, Clim. Dynam., 52, 3869–3890, https://doi.org/10.1007/s00382-018-4366-1, 2019. a
Rodríguez-Fonseca, B., Polo, I., García-Serrano, J., Losada, T., Mohino, E., Mechoso, C. R., and Kucharski, F.: Are Atlantic Niños enhancing Pacific ENSO events in recent decades?, Geophys. Res. Lett., 36, 2009GL040048, https://doi.org/10.1029/2009GL040048, 2009. a
Rousset, C., Vancoppenolle, M., Madec, G., Fichefet, T., Flavoni, S., Barthélemy, A., Benshila, R., Chanut, J., Levy, C., Masson, S., and Vivier, F.: The Louvain-La-Neuve sea ice model LIM3.6: global and regional capabilities, Geosci. Model Dev., 8, 2991–3005, https://doi.org/10.5194/gmd-8-2991-2015, 2015. a
San, S.-C., Tseng, Y.-H., Ding, R., and Di Lorenzo, E.: Why is decadal climate variability predominantly observed in the Niño4 Region?, Geophys. Res. Lett., 51, e2024GL110457, https://doi.org/10.1029/2024GL110457, 2024. a
Sanchez-Gomez, E., Cassou, C., Ruprich-Robert, Y., Fernandez, E., and Terray, L.: Drift dynamics in a coupled model initialized for decadal forecasts, Clim. Dynam., 46, 1819–1840, https://doi.org/10.1007/s00382-015-2678-y, 2016. a
Sharmila, S., Hendon, H., Alves, O., Weisheimer, A., and Balmaseda, M.: Contrasting El Niño–La Niña predictability and prediction skill in 2-year reforecasts of the twentieth century, J. Climate, 36, 1269–1285, https://doi.org/10.1175/JCLI-D-22-0028.1, 2023. a, b, c
Siegert, S., Bellprat, O., Ménégoz, M., Stephenson, D. B., and Doblas-Reyes, F. J.: Detecting improvements in forecast correlation skill: statistical testing and power analysis, Mon. Weather Rev., 145, 437–450, https://doi.org/10.1175/MWR-D-16-0037.1, 2017. a
Siongco, A. C., Ma, H.-Y., Klein, S. A., Xie, S., Karspeck, A. R., Raeder, K., and Anderson, J. L.: A hindcast approach to diagnosing the equatorial Pacific cold tongue SST bias in CESM1, J. Climate, 33, 1437–1453, https://doi.org/10.1175/JCLI-D-19-0513.1, 2020. a
Smith, D. M., Scaife, A. A., Eade, R., Athanasiadis, P., Bellucci, A., Bethke, I., Bilbao, R., Borchert, L. F., Caron, L.-P., Counillon, F., Danabasoglu, G., Delworth, T., Doblas-Reyes, F. J., Dunstone, N. J., Estella-Perez, V., Flavoni, S., Hermanson, L., Keenlyside, N., Kharin, V., Kimoto, M., Merryfield, W. J., Mignot, J., Mochizuki, T., Modali, K., Monerie, P.-A., Müller, W. A., Nicolí, D., Ortega, P., Pankatz, K., Pohlmann, H., Robson, J., Ruggieri, P., Sospedra-Alfonso, R., Swingedouw, D., Wang, Y., Wild, S., Yeager, S., Yang, X., and Zhang, L.: North Atlantic climate far more predictable than models imply, Nature, 583, 796–800, https://doi.org/10.1038/s41586-020-2525-0, 2020. a
Storch, H. V. and Zwiers, F. W.: Statistical Analysis in Climate Research, Cambridge University Press, 1st edn., https://doi.org/10.1017/CBO9780511612336, 1984. a
Tang, Y., Zhang, R.-H., Liu, T., Duan, W., Yang, D., Zheng, F., Ren, H., Lian, T., Gao, C., Chen, D., and Mu, M.: Progress in ENSO prediction and predictability study, Natl. Sci. Rev., 5, 826–839, https://doi.org/10.1093/nsr/nwy105, 2018. a
Tietsche, S., Balmaseda, M., Zuo, H., Roberts, C., Mayer, M., and Ferranti, L.: The importance of North Atlantic ocean transports for seasonal forecasts, Clim. Dynam., 55, 1995–2011, https://doi.org/10.1007/s00382-020-05364-6, 2020. a
Uruchi, W., Castrillo, M., and Beltrán, D.: Autosubmit GUI: a Javascript-based graphical user interface to monitor experiments workflow execution, JOSS, 6, 3049, https://doi.org/10.21105/joss.03049, 2021. a
Vancoppenolle, M., Fichefet, T., and Goosse, H.: Simulating the mass balance and salinity of Arctic and Antarctic sea ice. 2. Importance of sea ice salinity variations, Ocean Model., 27, 54–69, https://doi.org/10.1016/j.ocemod.2008.11.003, 2009. a
Vannière, B., Guilyardi, E., Madec, G., Doblas-Reyes, F. J., and Woolnough, S.: Using seasonal hindcasts to understand the origin of the equatorial cold tongue bias in CGCMs and its impact on ENSO, Clim. Dynam., 40, 963–981, https://doi.org/10.1007/s00382-012-1429-6, 2013. a, b, c
Weisheimer, A., Doblas-Reyes, F. J., Palmer, T. N., Alessandri, A., Arribas, A., Déqué, M., Keenlyside, N., MacVean, M., Navarra, A., and Rogel, P.: ENSEMBLES: a new multi-model ensemble for seasonal-to-annual predictions—skill and progress beyond DEMETER in forecasting tropical Pacific SSTs, Geophys. Res. Lett., 36, 2009GL040896, https://doi.org/10.1029/2009GL040896, 2009. a
Weisheimer, A., Balmaseda, M. A., Stockdale, T. N., Mayer, M., Sharmila, S., Hendon, H., and Alves, O.: Variability of ENSO forecast skill in 2-year global reforecasts over the 20th century, Geophys. Res. Lett., 49, e2022GL097885, https://doi.org/10.1029/2022GL097885, 2022. a
Wengel, C., Lee, S.-S., Stuecker, M. F., Timmermann, A., Chu, J.-E., and Schloesser, F.: Future high-resolution El Niño/Southern Oscillation dynamics, Nat. Clim. Change, 11, 758–765, https://doi.org/10.1038/s41558-021-01132-4, 2021. a, b
Williams, N. C., Scaife, A. A., and Screen, J. A.: Effect of increased ocean resolution on model errors in El Niño–Southern Oscillation and its teleconnections, Q. J. Roy. Meteor. Soc., 150, 1489–1500, https://doi.org/10.1002/qj.4655, 2024. a, b, c
Wu, X., Okumura, Y. M., Deser, C., and DiNezio, P. N.: Two-year dynamical predictions of ENSO event duration during 1954–2015, J. Climate, 34, 4069–4087, https://doi.org/10.1175/JCLI-D-20-0619.1, 2021. a, b
Wu, X., Okumura, Y. M., DiNezio, P. N., Yeager, S. G., and Deser, C.: The equatorial Pacific cold tongue bias in CESM1 and its influence on ENSO forecasts, J. Climate, 35, 3261–3277, https://doi.org/10.1175/JCLI-D-21-0470.1, 2022. a, b, c, d
Yang, C., Christensen, H. M., Corti, S., Von Hardenberg, J., and Davini, P.: The impact of stochastic physics on the El Niño Southern Oscillation in the EC-Earth coupled model, Clim. Dynam., 53, 2843–2859, https://doi.org/10.1007/s00382-019-04660-0, 2019. a
Yeager, S. G., Chang, P., Danabasoglu, G., Rosenbloom, N., Zhang, Q., Castruccio, F. S., Gopal, A., Cameron Rencurrel, M., and Simpson, I. R.: Reduced Southern Ocean warming enhances global skill and signal-to-noise in an eddy-resolving decadal prediction system, npj Clim. Atmos. Sci., 6, 107, https://doi.org/10.1038/s41612-023-00434-y, 2023. a, b, c
Zuo, H., Balmaseda, M. A., Tietsche, S., Mogensen, K., and Mayer, M.: The ECMWF operational ensemble reanalysis–analysis system for ocean and sea ice: a description of the system and assessment, Ocean Sci., 15, 779–808, https://doi.org/10.5194/os-15-779-2019, 2019. a, b